Embed Size (px)
Citation preview
1
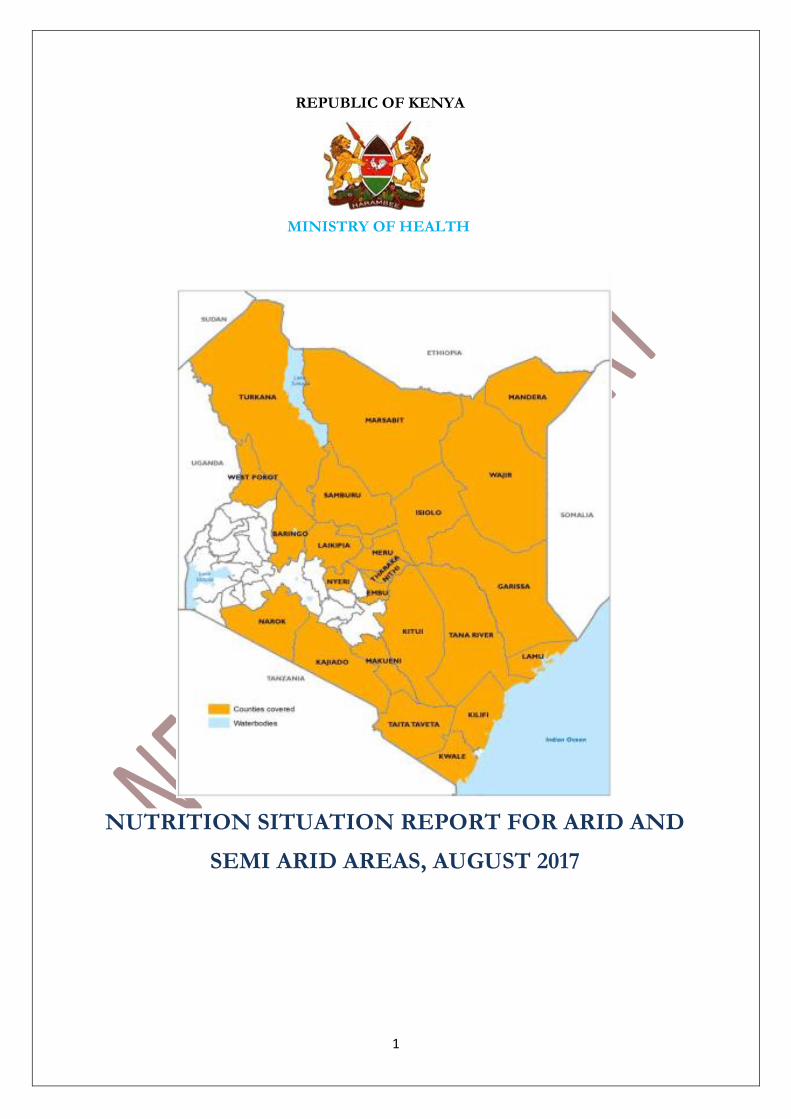
REPUBLIC OF KENYA
MINISTRY OF HEALTH
NUTRITION SITUATION REPORT FOR ARID AND
SEMI ARID AREAS, AUGUST 2017
2
Contents
CHAPTER 1: INTRODUCTION ........................................................................................................... 3
1.1 Analysis period ......................................................................................................................... 3
1.2 Scope and Unit of Analysis ............................................................................................................. 3
1.2 Analysis team ........................................................................................................................... 4
1.3 Objectives ...................................................................................................................................... 5
CHAPTER TWO: METHODS ............................................................................................................... 6
3. RESULTS ............................................................................................................................................ 8
3.1 National Nutrition Situation ........................................................................................................... 8
3.2 Nutrition Situation by Livelihood Zone Cluster ............................................................................ 14
3.2.1 Pastoral North West ............................................................................................................ 14
3.2.2 Pastoral North East Cluster Report ................................................................................... 16
3.2.3 Agro Pastoral Cluster .......................................................................................................... 19
3.2.4 South Eastern Marginal Agriculture Cluster .................................................................... 20
3.2.5 Coastal Marginal Cluster Nutrition Report ...................................................................... 23
APPENDICES .......................................................................................................................................... 26
Appendix 1: Nutrition Smart Survey Results May to July 2017 ....................................................... 26
Appendix 2: Nutrition Smart Survey Results January – February 2017 2017 ................................... 28
Appendix 3: Summary of Contributing Factors .............................................................................. 30
Appendix 4: LRA 2017 Workshop Agenda..................................................................................... 39
Appendix 5: List of participants ..................................................................................................... 45
For feedback please contact Gladys Mugambi, Head Nutrition and Dietetics Unit at
[email protected], Lucy Kinyua at [email protected], Lucy Gathigi -Maina at [email protected] and
Victoria Mwenda at [email protected]
For more information, visit us on www.nutritiohealth.or.ke
3
CHAPTER 1: INTRODUCTION
The Kenya Food Security Steering Group (KFSSG) undertakes biannual seasonal assessments i.e. Long Rains Assessment (LRA) and Short Rains Assessment (SRA) every year to assess food and nutrition security situation following the long and short rains season. The analysis also takes into account the cumulative effect of previous seasons. Recommendations for possible response options based on the situation analysis are developed. During the assessments secondary data from different sources such nutrition surveys, DHIS, NDMA early warning system is collated and reviewed.
Teams composed of Kenya Food Security Steering Group (KFSSG) members and County Steering Group (CSG) members make transect drives, carry out interviews, hold focus discussions and do market surveys in order to get a picture of the ongoing situation. Analysis is conducted using the IPCs for Food Insecurity and Acute Malnutrition. Nutrition team through the Nutrition Information Technical Working Group (NITWG) supports in the health and nutrition analysis and conducts the IPC for acute malnutrition to determine the severity of acute malnutrition, geographical areas that are most affected and the contributing factors to acute malnutrition. This helps to determine immediate, intermediate and long term response actions to address acute malnutrition.
The resulting food and nutrition security situation updates including the number of children and pregnant and lactating women requiring nutritional support informs the nutrition response plan and the integrated contingency plan in the National Drought Management Authority.
1.1 Analysis period
Integrated Phase Classification (IPC) for Acute Malnutrition was conducted from 17th July to 26th July 2017 alongside the Food Security Integrated Phase Classification during the 2017 Long Rains Assessment (LRA) Report Writing Workshop. The analysis workshop was preceded by field level visits by KFSSG and CSG members from 3rd to 15th July 2017. Integrated SMART surveys were conducted in June and July as part of the LRA.
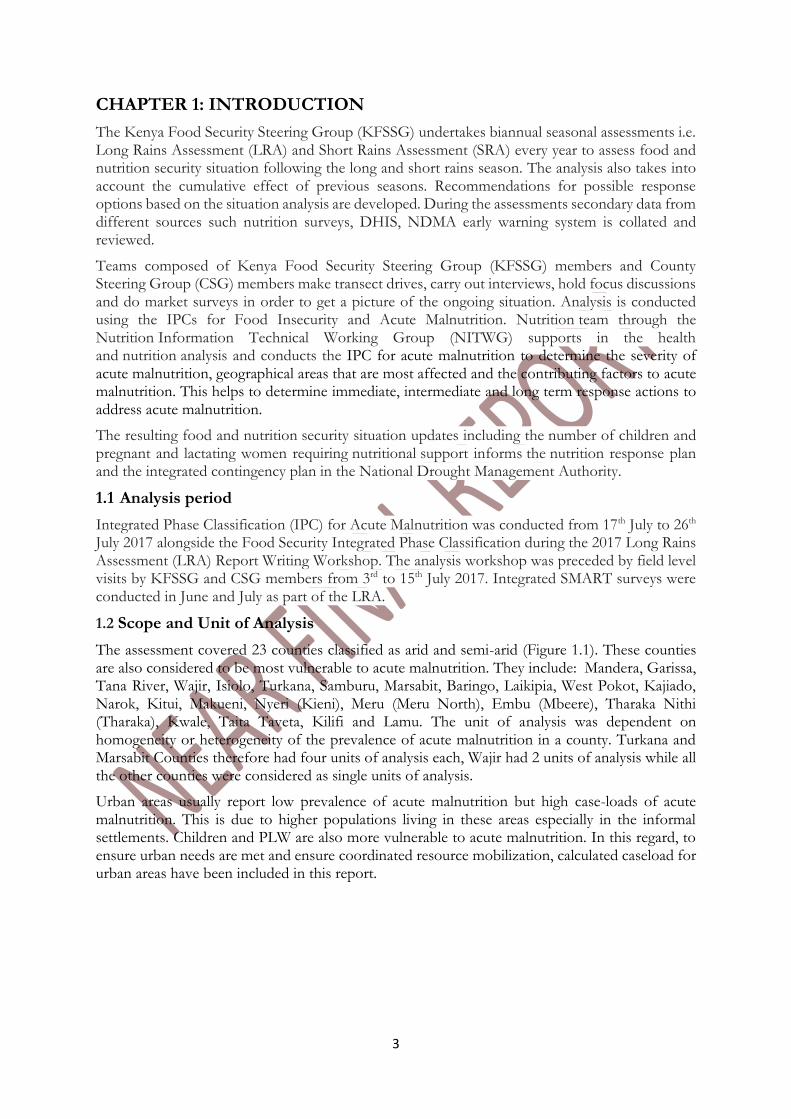
1.2 Scope and Unit of Analysis
The assessment covered 23 counties classified as arid and semi-arid (Figure 1.1). These counties are also considered to be most vulnerable to acute malnutrition. They include: Mandera, Garissa, Tana River, Wajir, Isiolo, Turkana, Samburu, Marsabit, Baringo, Laikipia, West Pokot, Kajiado, Narok, Kitui, Makueni, Nyeri (Kieni), Meru (Meru North), Embu (Mbeere), Tharaka Nithi (Tharaka), Kwale, Taita Taveta, Kilifi and Lamu. The unit of analysis was dependent on homogeneity or heterogeneity of the prevalence of acute malnutrition in a county. Turkana and Marsabit Counties therefore had four units of analysis each, Wajir had 2 units of analysis while all the other counties were considered as single units of analysis.
Urban areas usually report low prevalence of acute malnutrition but high case-loads of acute malnutrition. This is due to higher populations living in these areas especially in the informal settlements. Children and PLW are also more vulnerable to acute malnutrition. In this regard, to ensure urban needs are met and ensure coordinated resource mobilization, calculated caseload for urban areas have been included in this report.
4
1.2 Analysis team
The IPC for acute malnutrition analysis team comprised participants from the national and county governments, line ministries, UN agencies, implementing partners and academia. The analysis team was trained on IPC for acute malnutrition before analysis (See agenda and participants list in the appendix).
5
1.3 Objectives
To conduct training on IPC for acute malnutrition in order to reinforce skills of analysis team to conduct quality analysis
To assess the severity of acute malnutrition by referencing against international standards and identify areas that are most affected by acute malnutrition
Identify the main contributing factors to acute malnutrition
Determine the number (caseloads) of children and PLW in order to inform response
Identify the major priority response objectives
Develop communication materials and disseminate after the Kenya Food Security Meeting (KFSM) (updated website, updated survey dashboard, infographic, situation report)
6
CHAPTER TWO: METHODS
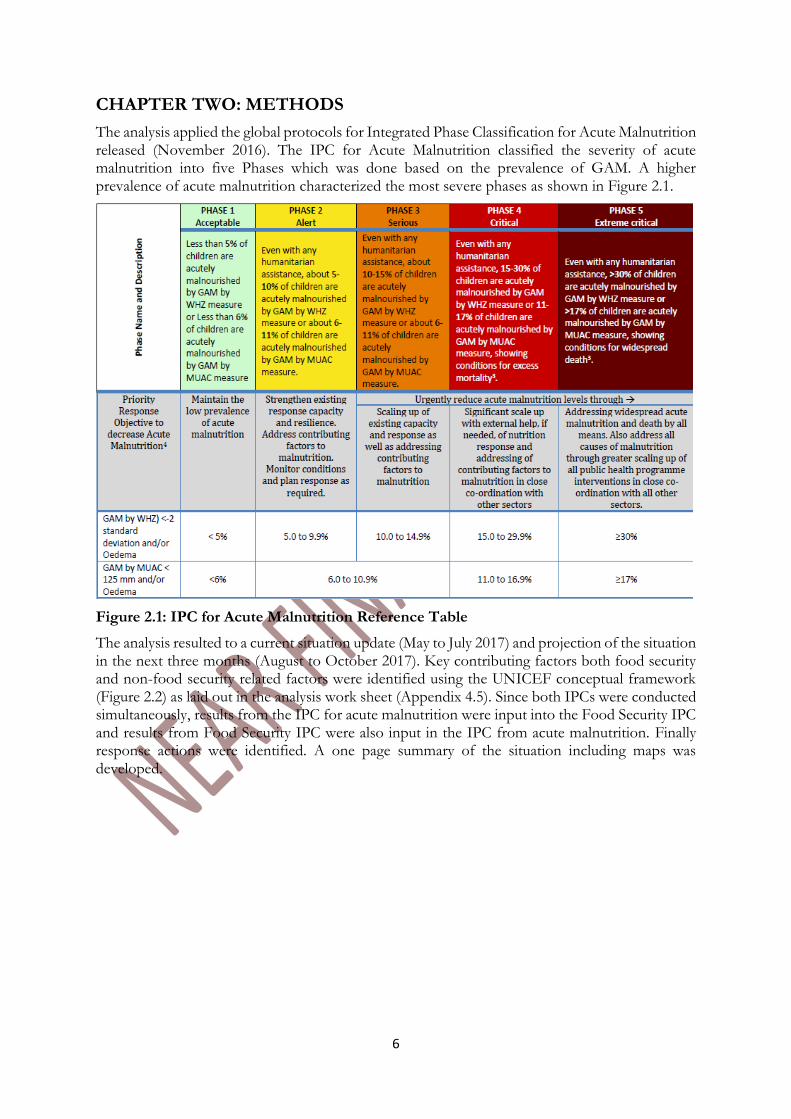
The analysis applied the global protocols for Integrated Phase Classification for Acute Malnutrition released (November 2016). The IPC for Acute Malnutrition classified the severity of acute malnutrition into five Phases which was done based on the prevalence of GAM. A higher prevalence of acute malnutrition characterized the most severe phases as shown in Figure 2.1.
Figure 2.1: IPC for Acute Malnutrition Reference Table
The analysis resulted to a current situation update (May to July 2017) and projection of the situation in the next three months (August to October 2017). Key contributing factors both food security and non-food security related factors were identified using the UNICEF conceptual framework (Figure 2.2) as laid out in the analysis work sheet (Appendix 4.5). Since both IPCs were conducted simultaneously, results from the IPC for acute malnutrition were input into the Food Security IPC and results from Food Security IPC were also input in the IPC from acute malnutrition. Finally response actions were identified. A one page summary of the situation including maps was developed.
7
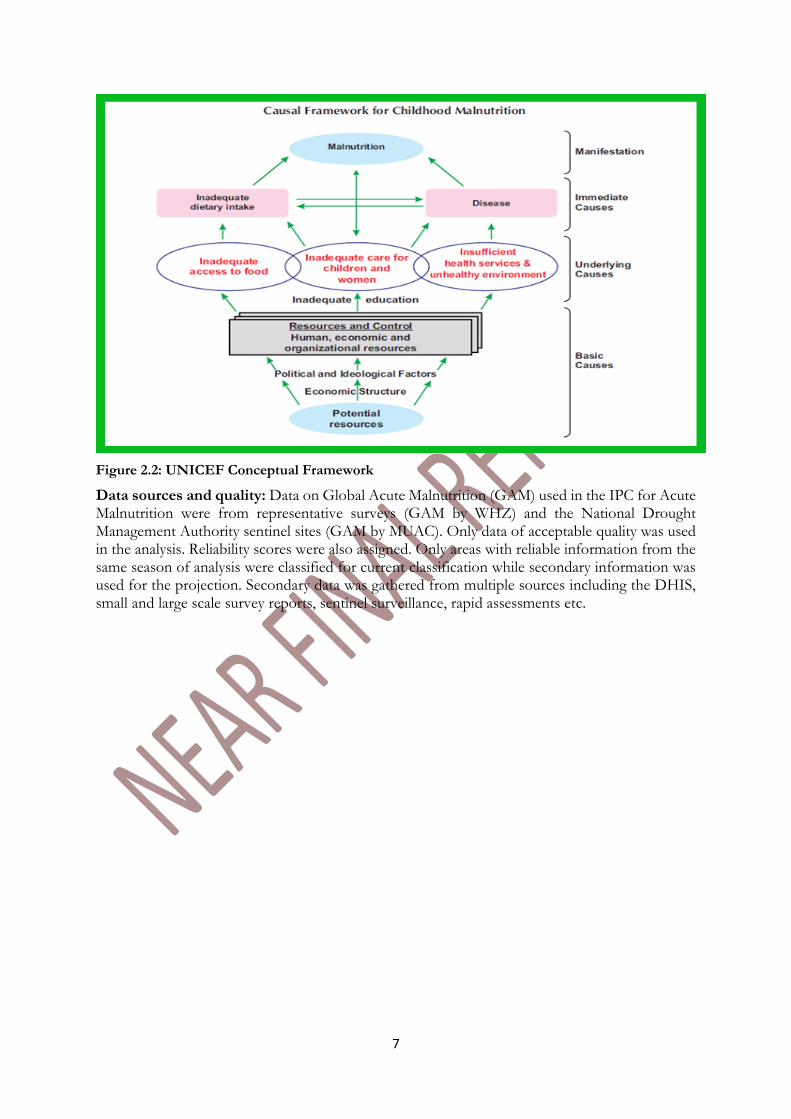
Figure 2.2: UNICEF Conceptual Framework
Data sources and quality: Data on Global Acute Malnutrition (GAM) used in the IPC for Acute Malnutrition were from representative surveys (GAM by WHZ) and the National Drought Management Authority sentinel sites (GAM by MUAC). Only data of acceptable quality was used in the analysis. Reliability scores were also assigned. Only areas with reliable information from the same season of analysis were classified for current classification while secondary information was used for the projection. Secondary data was gathered from multiple sources including the DHIS, small and large scale survey reports, sentinel surveillance, rapid assessments etc.
8
3. RESULTS
3.1 National Nutrition Situation
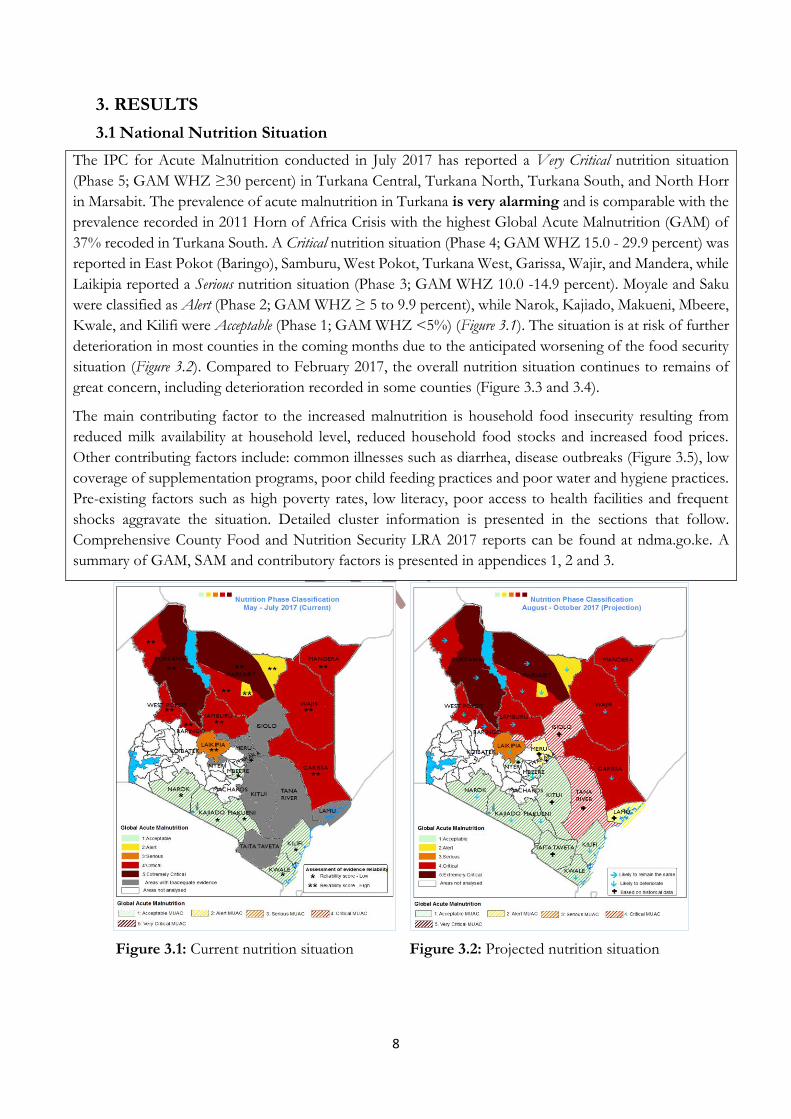
The IPC for Acute Malnutrition conducted in July 2017 has reported a Very Critical nutrition situation
(Phase 5; GAM WHZ ≥30 percent) in Turkana Central, Turkana North, Turkana South, and North Horr
in Marsabit. The prevalence of acute malnutrition in Turkana is very alarming and is comparable with the
prevalence recorded in 2011 Horn of Africa Crisis with the highest Global Acute Malnutrition (GAM) of
37% recoded in Turkana South. A Critical nutrition situation (Phase 4; GAM WHZ 15.0 - 29.9 percent) was
reported in East Pokot (Baringo), Samburu, West Pokot, Turkana West, Garissa, Wajir, and Mandera, while
Laikipia reported a Serious nutrition situation (Phase 3; GAM WHZ 10.0 -14.9 percent). Moyale and Saku
were classified as Alert (Phase 2; GAM WHZ ≥ 5 to 9.9 percent), while Narok, Kajiado, Makueni, Mbeere,
Kwale, and Kilifi were Acceptable (Phase 1; GAM WHZ <5%) (Figure 3.1). The situation is at risk of further
deterioration in most counties in the coming months due to the anticipated worsening of the food security
situation (Figure 3.2). Compared to February 2017, the overall nutrition situation continues to remains of
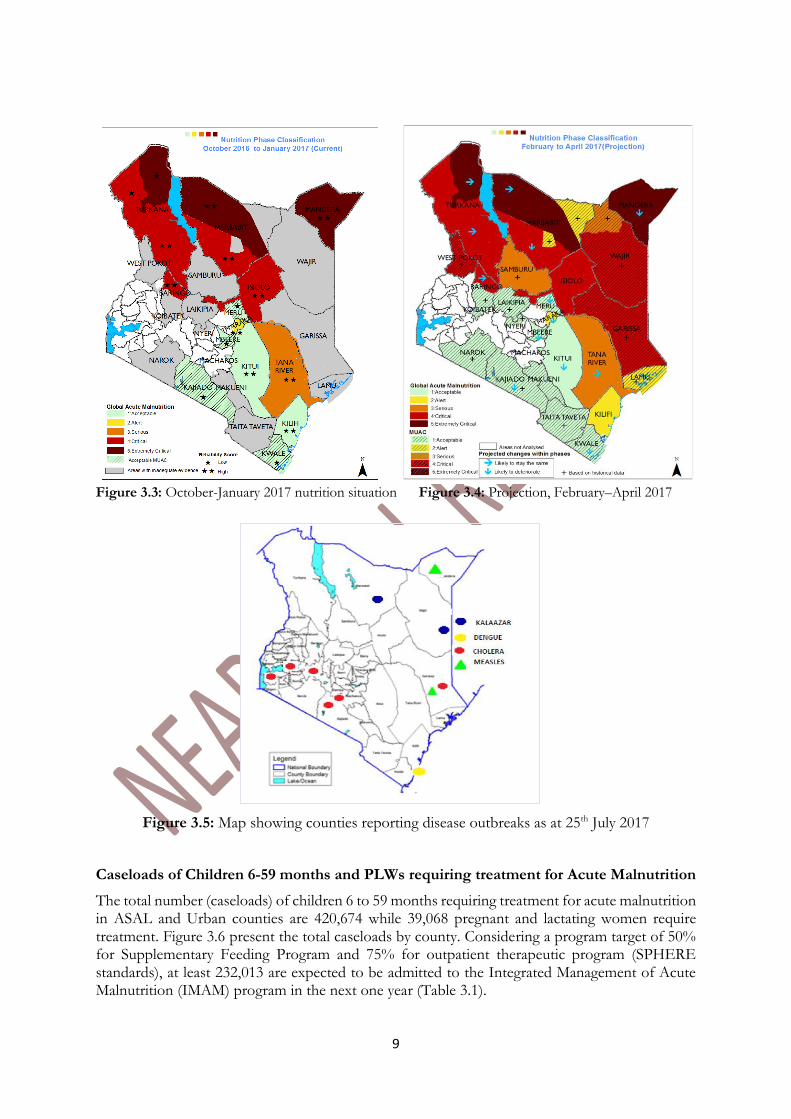
great concern, including deterioration recorded in some counties (Figure 3.3 and 3.4).
The main contributing factor to the increased malnutrition is household food insecurity resulting from
reduced milk availability at household level, reduced household food stocks and increased food prices.
Other contributing factors include: common illnesses such as diarrhea, disease outbreaks (Figure 3.5), low
coverage of supplementation programs, poor child feeding practices and poor water and hygiene practices.
Pre-existing factors such as high poverty rates, low literacy, poor access to health facilities and frequent
shocks aggravate the situation. Detailed cluster information is presented in the sections that follow.
Comprehensive County Food and Nutrition Security LRA 2017 reports can be found at ndma.go.ke. A
summary of GAM, SAM and contributory factors is presented in appendices 1, 2 and 3.
Figure 3.1: Current nutrition situation Figure 3.2: Projected nutrition situation
9
Figure 3.3: October-January 2017 nutrition situation Figure 3.4: Projection, February–April 2017
Figure 3.5: Map showing counties reporting disease outbreaks as at 25th July 2017
Caseloads of Children 6-59 months and PLWs requiring treatment for Acute Malnutrition
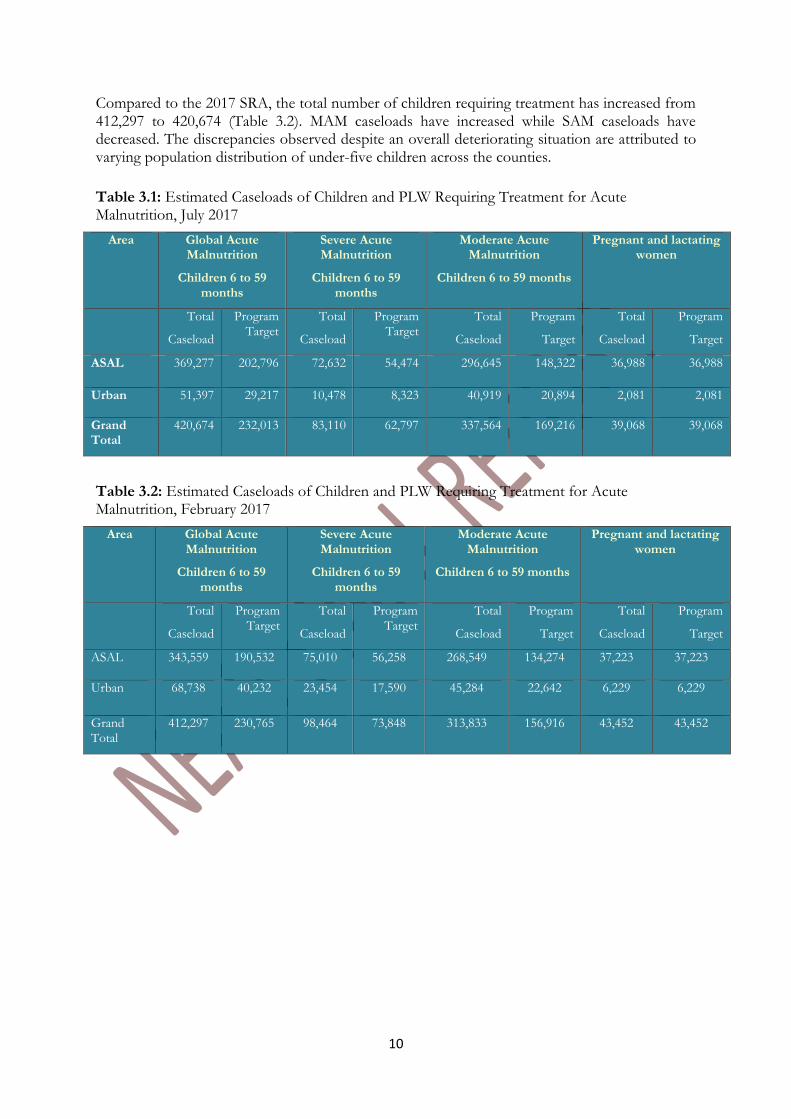
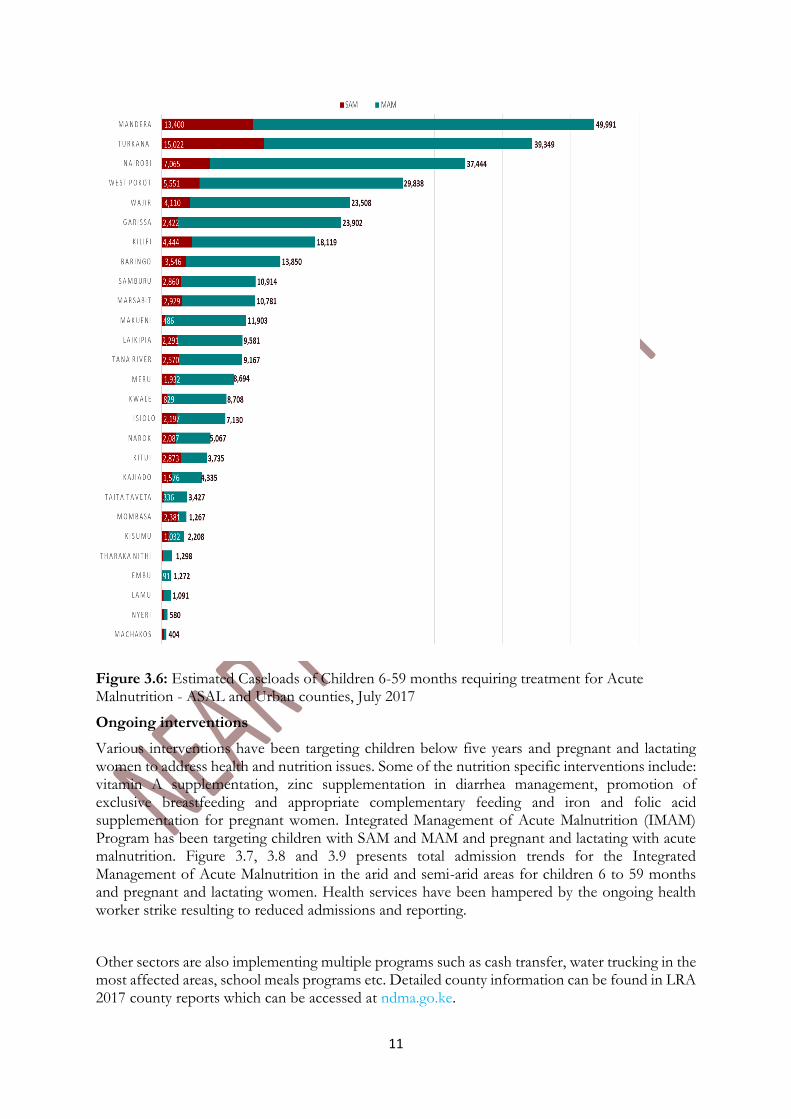
The total number (caseloads) of children 6 to 59 months requiring treatment for acute malnutrition in ASAL and Urban counties are 420,674 while 39,068 pregnant and lactating women require treatment. Figure 3.6 present the total caseloads by county. Considering a program target of 50% for Supplementary Feeding Program and 75% for outpatient therapeutic program (SPHERE standards), at least 232,013 are expected to be admitted to the Integrated Management of Acute Malnutrition (IMAM) program in the next one year (Table 3.1).
10
Compared to the 2017 SRA, the total number of children requiring treatment has increased from 412,297 to 420,674 (Table 3.2). MAM caseloads have increased while SAM caseloads have decreased. The discrepancies observed despite an overall deteriorating situation are attributed to varying population distribution of under-five children across the counties.
Table 3.1: Estimated Caseloads of Children and PLW Requiring Treatment for Acute Malnutrition, July 2017
Area Global Acute Malnutrition
Children 6 to 59 months
Severe Acute Malnutrition
Children 6 to 59 months
Moderate Acute Malnutrition
Children 6 to 59 months
Pregnant and lactating women
Total
Caseload
Program Target
Total
Caseload
Program Target
Total
Caseload
Program
Target
Total
Caseload
Program
Target
ASAL 369,277 202,796 72,632 54,474 296,645 148,322 36,988 36,988
Urban 51,397 29,217 10,478 8,323 40,919 20,894 2,081 2,081
Grand Total
420,674 232,013 83,110 62,797 337,564 169,216 39,068 39,068
Table 3.2: Estimated Caseloads of Children and PLW Requiring Treatment for Acute Malnutrition, February 2017
Area Global Acute Malnutrition
Children 6 to 59 months
Severe Acute Malnutrition
Children 6 to 59 months
Moderate Acute Malnutrition
Children 6 to 59 months
Pregnant and lactating women
Total
Caseload
Program Target
Total
Caseload
Program Target
Total
Caseload
Program
Target
Total
Caseload
Program
Target
ASAL 343,559 190,532 75,010 56,258 268,549 134,274 37,223 37,223
Urban 68,738 40,232 23,454 17,590 45,284 22,642 6,229 6,229
Grand Total
412,297 230,765 98,464 73,848 313,833 156,916 43,452 43,452
11
Figure 3.6: Estimated Caseloads of Children 6-59 months requiring treatment for Acute Malnutrition - ASAL and Urban counties, July 2017
Ongoing interventions
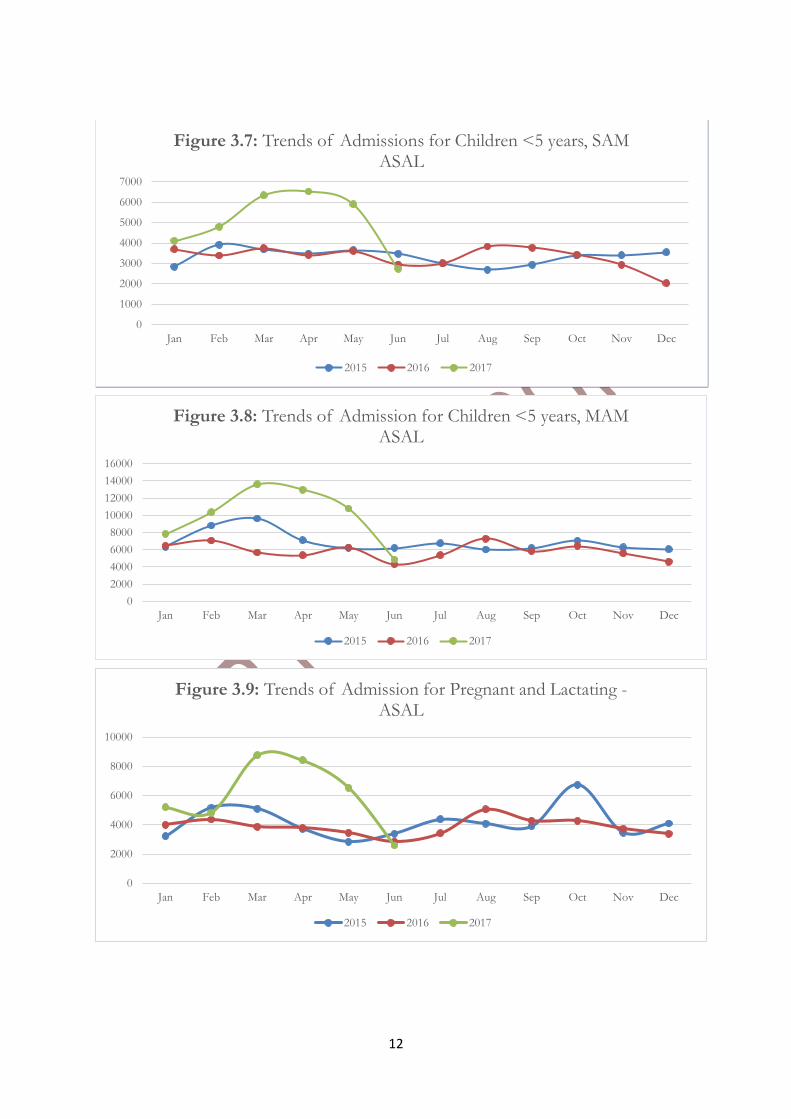
Various interventions have been targeting children below five years and pregnant and lactating women to address health and nutrition issues. Some of the nutrition specific interventions include: vitamin A supplementation, zinc supplementation in diarrhea management, promotion of exclusive breastfeeding and appropriate complementary feeding and iron and folic acid supplementation for pregnant women. Integrated Management of Acute Malnutrition (IMAM) Program has been targeting children with SAM and MAM and pregnant and lactating with acute malnutrition. Figure 3.7, 3.8 and 3.9 presents total admission trends for the Integrated Management of Acute Malnutrition in the arid and semi-arid areas for children 6 to 59 months and pregnant and lactating women. Health services have been hampered by the ongoing health worker strike resulting to reduced admissions and reporting.
Other sectors are also implementing multiple programs such as cash transfer, water trucking in the most affected areas, school meals programs etc. Detailed county information can be found in LRA 2017 county reports which can be accessed at ndma.go.ke.
12
0
1000
2000
3000
4000
5000
6000
7000
Jan Feb Mar Apr May Jun Jul Aug Sep Oct Nov Dec
Figure 3.7: Trends of Admissions for Children <5 years, SAM ASAL
2015 2016 2017
0
2000
4000
6000
8000
10000
12000
14000
16000
Jan Feb Mar Apr May Jun Jul Aug Sep Oct Nov Dec
Figure 3.8: Trends of Admission for Children <5 years, MAM ASAL
2015 2016 2017
0
2000
4000
6000
8000
10000
Jan Feb Mar Apr May Jun Jul Aug Sep Oct Nov Dec
Figure 3.9: Trends of Admission for Pregnant and Lactating -ASAL
2015 2016 2017
13
Recommendations
Immediate recommendations
Continued scale up screening and treatment of acutely malnourished children and women through integrated outreaches to the most affected areas
Enhanced mobilization and community engagement to further improve demand coverage of integrated health and nutrition programs
Scale up of WASH services in most affected areas
Scale up blanket supplementary feeding in the most affected counties
Ensure nutrition commodities are prepositioned and supply chain monitoring is routinely done to avoid stock outs
Urgent increase in household food access interventions including cash tops up and in kind to meet HH food needs in the most affected areas
Specific focus on increasing HH food access in Turkana county to reduce risk of malnutrition related mortality
Advocate for resolution of nurses strike to ensure lives are not lost due to impaired service delivery at facility level.
Increased surveillance with real time reporting and action at national and county levels
Continued support to effective coordination for monitoring of the emergency response plan
Medium term and Long term interventions
Investment in water infrastructure and WASH interventions including Community Led Total Sanitation
Develop intervention to promote behavior change to improve health seeking behavior
Social behavior change communication and nutrition education addressing improved maternal, infant and young child nutrition
Focus on resilience programming targeting basic and underlying causes
Increase investment in infrastructure to improve market access and household food security.
Increased investment in education of all children (and especially the girl child) as a long term measure
Strengthening community based family protection structures for children
Factors to monitor:
Factors to monitor closely which are likely to affect food and nutrition situation in the coming months include:
Staple food prices which have implications of household food access
Livestock health and mortality: this is likely to impact negatively on milk availability and sources of income
Resource based conflicts and insecurity
Household food stocks: the effects of failed season and army worm
2017 General Elections: o Can result to displacement in case of violence. o Can lead to delay in implementation of programs during the transition period to
the next government cycle
Impacts of programs and interventions
The performance of the upcoming 2017 short rains
14
3.2 Nutrition Situation by Livelihood Zone Cluster
3.2.1 Pastoral North West
(Marsabit, Turkana and Samburu Counties)
Morbidity and Mortality patterns
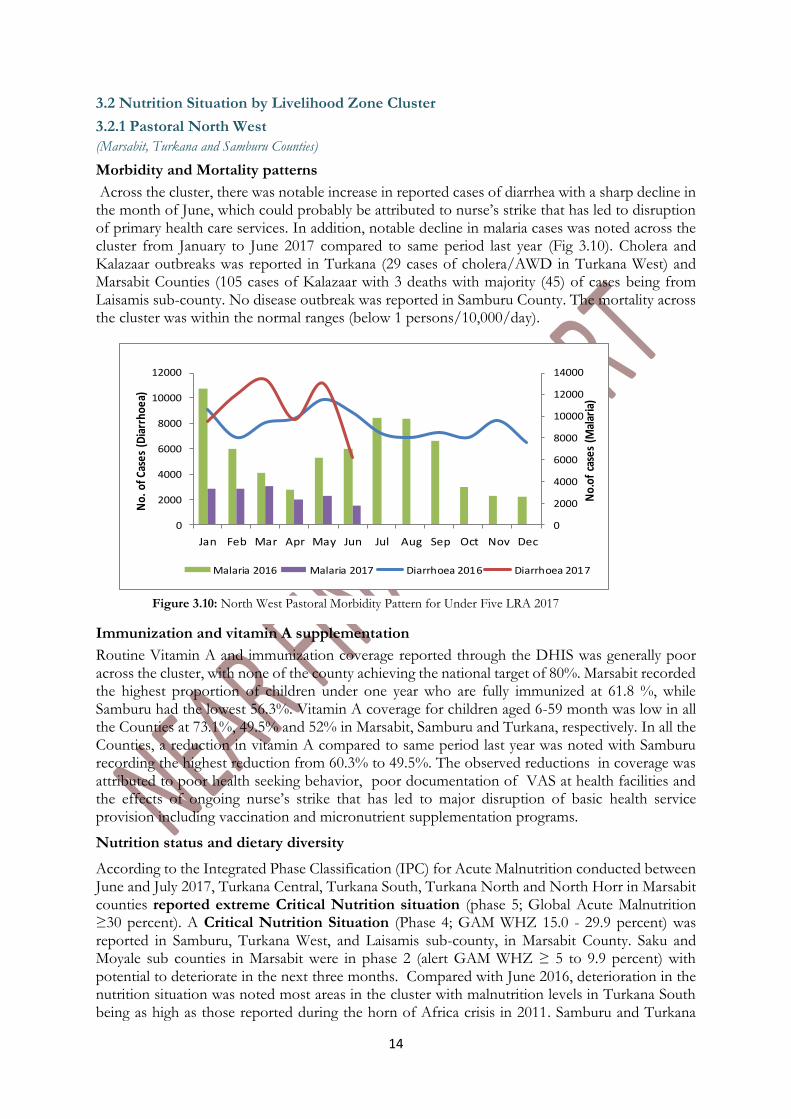
Across the cluster, there was notable increase in reported cases of diarrhea with a sharp decline in the month of June, which could probably be attributed to nurse’s strike that has led to disruption of primary health care services. In addition, notable decline in malaria cases was noted across the cluster from January to June 2017 compared to same period last year (Fig 3.10). Cholera and Kalazaar outbreaks was reported in Turkana (29 cases of cholera/AWD in Turkana West) and Marsabit Counties (105 cases of Kalazaar with 3 deaths with majority (45) of cases being from Laisamis sub-county. No disease outbreak was reported in Samburu County. The mortality across the cluster was within the normal ranges (below 1 persons/10,000/day).
Immunization and vitamin A supplementation
Routine Vitamin A and immunization coverage reported through the DHIS was generally poor across the cluster, with none of the county achieving the national target of 80%. Marsabit recorded the highest proportion of children under one year who are fully immunized at 61.8 %, while Samburu had the lowest 56.3%. Vitamin A coverage for children aged 6-59 month was low in all the Counties at 73.1%, 49.5% and 52% in Marsabit, Samburu and Turkana, respectively. In all the Counties, a reduction in vitamin A compared to same period last year was noted with Samburu recording the highest reduction from 60.3% to 49.5%. The observed reductions in coverage was attributed to poor health seeking behavior, poor documentation of VAS at health facilities and the effects of ongoing nurse’s strike that has led to major disruption of basic health service provision including vaccination and micronutrient supplementation programs.
Nutrition status and dietary diversity
According to the Integrated Phase Classification (IPC) for Acute Malnutrition conducted between June and July 2017, Turkana Central, Turkana South, Turkana North and North Horr in Marsabit counties reported extreme Critical Nutrition situation (phase 5; Global Acute Malnutrition ≥30 percent). A Critical Nutrition Situation (Phase 4; GAM WHZ 15.0 - 29.9 percent) was reported in Samburu, Turkana West, and Laisamis sub-county, in Marsabit County. Saku and Moyale sub counties in Marsabit were in phase 2 (alert GAM WHZ ≥ 5 to 9.9 percent) with potential to deteriorate in the next three months. Compared with June 2016, deterioration in the nutrition situation was noted most areas in the cluster with malnutrition levels in Turkana South being as high as those reported during the horn of Africa crisis in 2011. Samburu and Turkana
0
2000
4000
6000
8000
10000
12000
14000
0
2000
4000
6000
8000
10000
12000
Jan Feb Mar Apr May Jun Jul Aug Sep Oct Nov Dec
No.
of c
ases
(M
alar
ia)
No.
of C
ases
(D
iarr
hoea
)
Malaria 2016 Malaria 2017 Diarrhoea 2016 Diarrhoea 2017
Figure 3.10: North West Pastoral Morbidity Pattern for Under Five LRA 2017
15
West moved from Serious to Critical, Turkana North and Central moved from critical to extreme critical nutrition situation, while Turkana South remained at extreme critical. The nutrition situation is expected to deteriorate further across all the counties in the North West cluster in the coming months as the food security situation is predicted to deteriorate in the next three months.
Detailed analysis of contributory factors show that the poor nutrition status reported across all the Counties in the North West cluster is majorly due to household level food insecurity and poor dietary intake. This is further compounded by morbidities and the chronic issues prevalent in these areas such as limited access to quality health services, inappropriate child care and feeding practice which increase the vulnerability of the population, and aggravate the high malnutrition rates. Current situation is further compounded by the ongoing nationwide nurse’s strike which has led to disruption of health care service delivery.
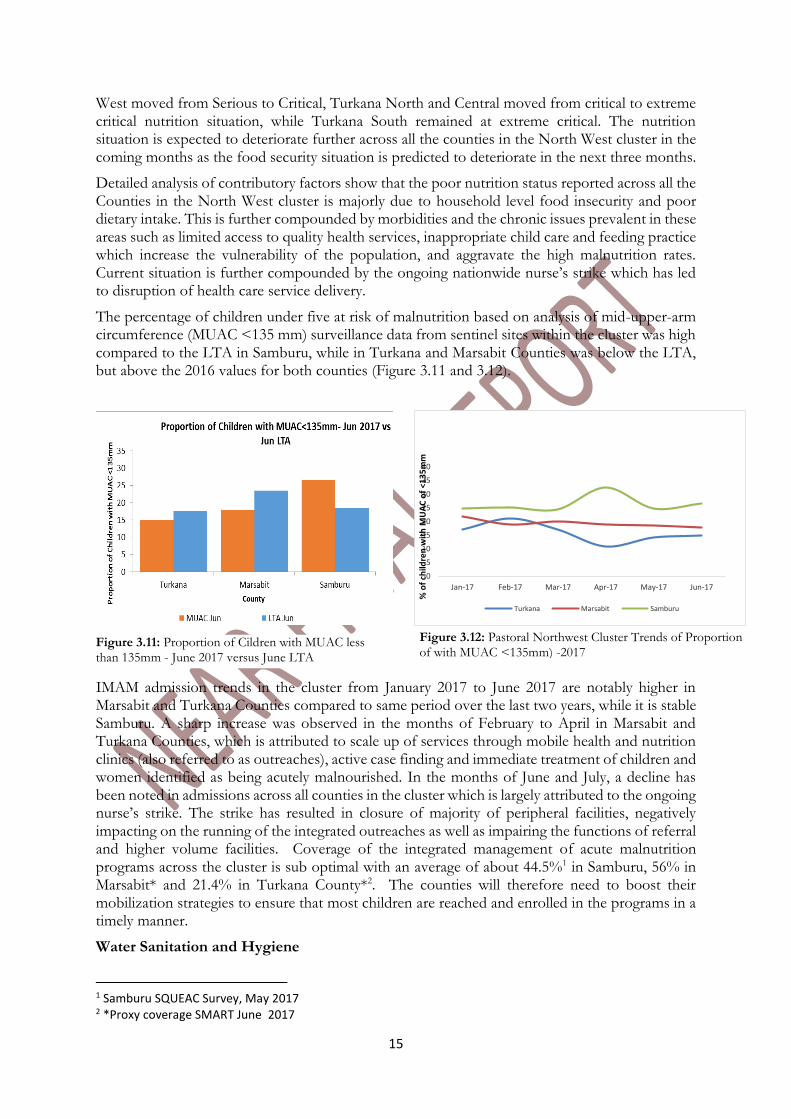
The percentage of children under five at risk of malnutrition based on analysis of mid-upper-arm circumference (MUAC <135 mm) surveillance data from sentinel sites within the cluster was high compared to the LTA in Samburu, while in Turkana and Marsabit Counties was below the LTA, but above the 2016 values for both counties (Figure 3.11 and 3.12).
IMAM admission trends in the cluster from January 2017 to June 2017 are notably higher in Marsabit and Turkana Counties compared to same period over the last two years, while it is stable Samburu. A sharp increase was observed in the months of February to April in Marsabit and Turkana Counties, which is attributed to scale up of services through mobile health and nutrition clinics (also referred to as outreaches), active case finding and immediate treatment of children and women identified as being acutely malnourished. In the months of June and July, a decline has been noted in admissions across all counties in the cluster which is largely attributed to the ongoing nurse’s strike. The strike has resulted in closure of majority of peripheral facilities, negatively impacting on the running of the integrated outreaches as well as impairing the functions of referral and higher volume facilities. Coverage of the integrated management of acute malnutrition programs across the cluster is sub optimal with an average of about 44.5%1 in Samburu, 56% in Marsabit* and 21.4% in Turkana County*2. The counties will therefore need to boost their mobilization strategies to ensure that most children are reached and enrolled in the programs in a timely manner.
Water Sanitation and Hygiene
1 Samburu SQUEAC Survey, May 2017 2 *Proxy coverage SMART June 2017
0
5
10
15
20
25
30
35
40
Jan-17 Feb-17 Mar-17 Apr-17 May-17 Jun-17
% o
f ch
ildre
n w
ith
MU
AC
of
<13
5m
m
Turkana Marsabit Samburu
Figure 3.11: Proportion of Cildren with MUAC less than 135mm - June 2017 versus June LTA
Figure 3.12: Pastoral Northwest Cluster Trends of Proportion of with MUAC <135mm) -2017
16
The main water Sources across the cluster were surface water (water pans, shallow wells) and 40 percent of water pans were reported to be dry in Marsabit. Trekking distance to water sources increased in all the Counties. Latrine coverage remains low.
Short term recommendations for the Cluster
Continue screening of malnourished children and treatment through existing health facilities and mapped outreaches.
Enhance mobilization and community engagement to further improve coverage and attendance across the health and nutrition programs
Scale up integrated outreach services to improve access to health and nutrition services in hard to reach areas.
Full roll out of Blanket supplementary feeding in all sub counties in Turkana, sustain the same in Marsabit county
Food sector to review and roll out general food distribution in the most affected sub counties in the cluster to complement the existing social safety net programs that are ongoing
Ensure nutrition commodities are prepositioned and supply chain monitoring is routinely done to avoid stock outs
Emergency food support/distribution need to target the ECDs
Scale up for HSNP emergency household to consider following the indicated hot spots.
Short term Emergency safety nets could consider using a food voucher to complement cash to cushion populations from the increase food prices and also control the proportion of the allocations that goes directly to food purchase.
Enhance surveillance through the IDSR especially Diarrhea and ARI and also the IMAM surge approach where facilities are already implementing the approach.
Due to the increased SAM, the county departments of health to procure additional routine antibiotics used in treatment and management of malnourished children.
Distribution of Water treatment chemicals and Jerricans in areas where unprotected water sources are used.
Medium to Long term Recommendations for Cluster
Investment in water infrastructure and WASH interventions including Community Led Total Sanitation
Develop intervention to promote behavior change to improve health seeking behavior
Social behavior change communication and nutrition education addressing improved maternal, infant and young child nutrition
3.2.2 Pastoral North East Cluster Report
(Wajir, Mandera, Garissa, Isiolo, Tana River)
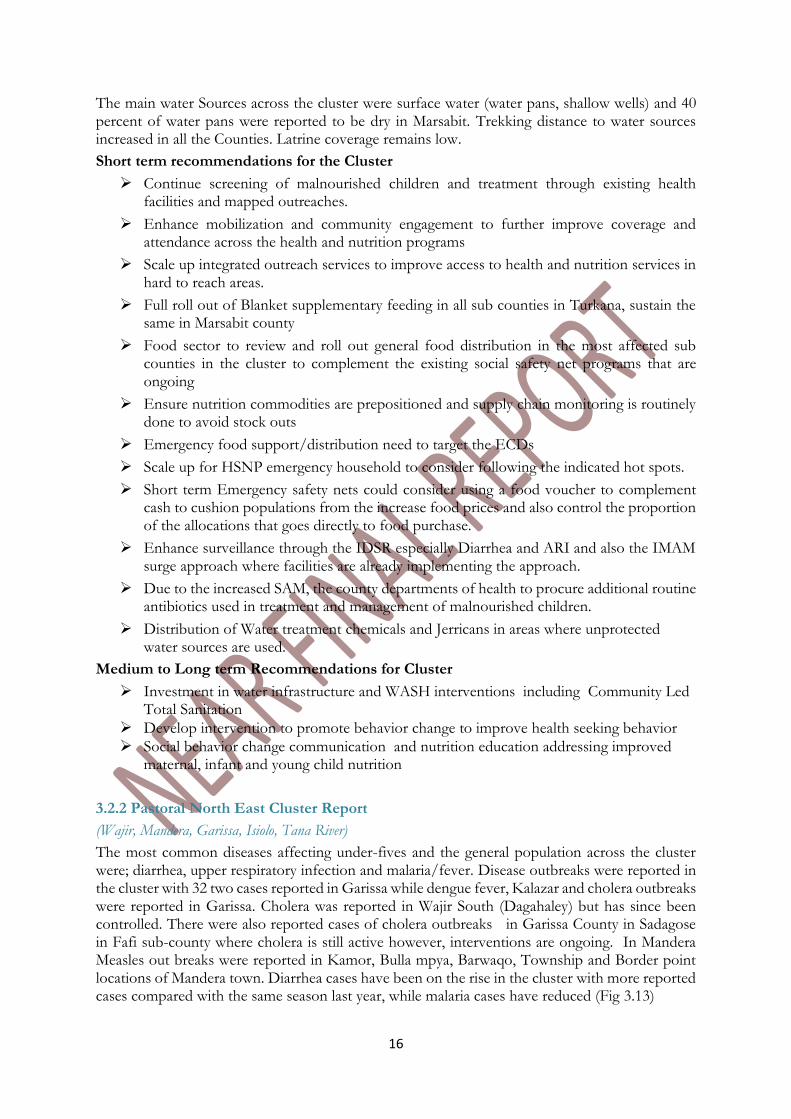
The most common diseases affecting under-fives and the general population across the cluster were; diarrhea, upper respiratory infection and malaria/fever. Disease outbreaks were reported in the cluster with 32 two cases reported in Garissa while dengue fever, Kalazar and cholera outbreaks were reported in Garissa. Cholera was reported in Wajir South (Dagahaley) but has since been controlled. There were also reported cases of cholera outbreaks in Garissa County in Sadagose in Fafi sub-county where cholera is still active however, interventions are ongoing. In Mandera Measles out breaks were reported in Kamor, Bulla mpya, Barwaqo, Township and Border point locations of Mandera town. Diarrhea cases have been on the rise in the cluster with more reported cases compared with the same season last year, while malaria cases have reduced (Fig 3.13)
17
Figure 3.13: North East Pastoral morbidity pattern for under-fives LRA 2017
Nutrition status and dietary diversity
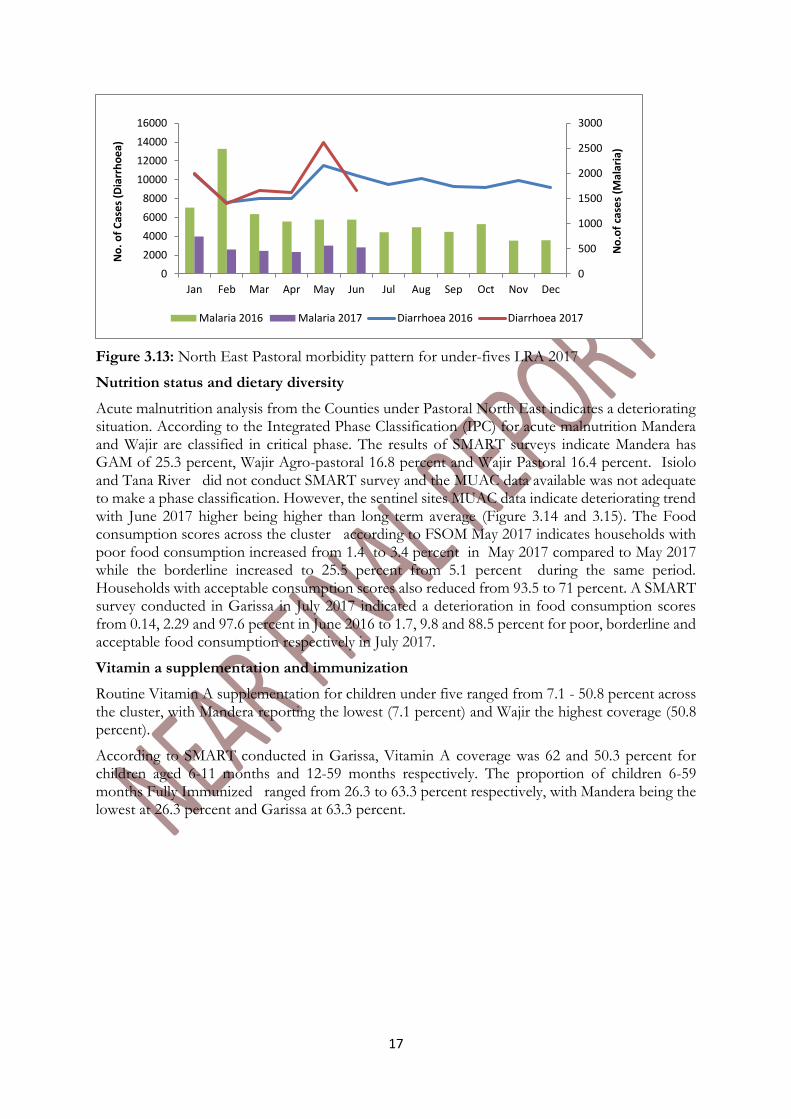
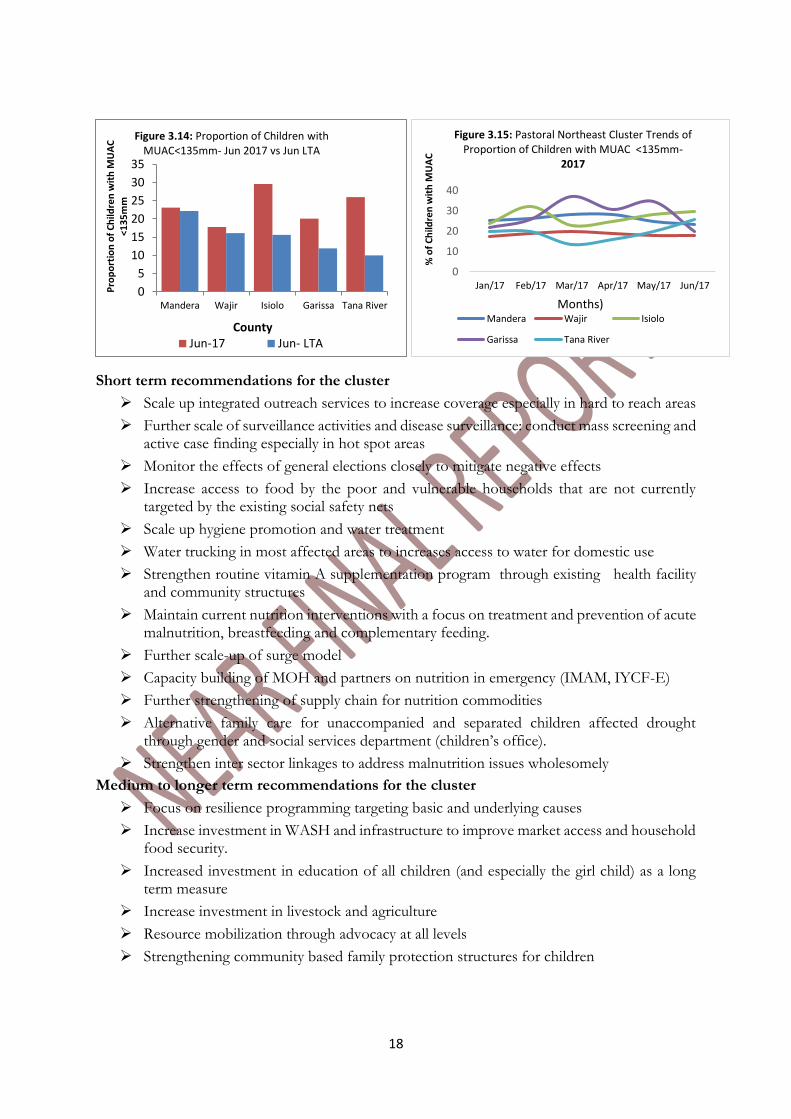
Acute malnutrition analysis from the Counties under Pastoral North East indicates a deteriorating situation. According to the Integrated Phase Classification (IPC) for acute malnutrition Mandera and Wajir are classified in critical phase. The results of SMART surveys indicate Mandera has GAM of 25.3 percent, Wajir Agro-pastoral 16.8 percent and Wajir Pastoral 16.4 percent. Isiolo and Tana River did not conduct SMART survey and the MUAC data available was not adequate to make a phase classification. However, the sentinel sites MUAC data indicate deteriorating trend with June 2017 higher being higher than long term average (Figure 3.14 and 3.15). The Food consumption scores across the cluster according to FSOM May 2017 indicates households with poor food consumption increased from 1.4 to 3.4 percent in May 2017 compared to May 2017 while the borderline increased to 25.5 percent from 5.1 percent during the same period. Households with acceptable consumption scores also reduced from 93.5 to 71 percent. A SMART survey conducted in Garissa in July 2017 indicated a deterioration in food consumption scores from 0.14, 2.29 and 97.6 percent in June 2016 to 1.7, 9.8 and 88.5 percent for poor, borderline and acceptable food consumption respectively in July 2017.
Vitamin a supplementation and immunization
Routine Vitamin A supplementation for children under five ranged from 7.1 - 50.8 percent across the cluster, with Mandera reporting the lowest (7.1 percent) and Wajir the highest coverage (50.8 percent).
According to SMART conducted in Garissa, Vitamin A coverage was 62 and 50.3 percent for children aged 6-11 months and 12-59 months respectively. The proportion of children 6-59 months Fully Immunized ranged from 26.3 to 63.3 percent respectively, with Mandera being the lowest at 26.3 percent and Garissa at 63.3 percent.
0
500
1000
1500
2000
2500
3000
0
2000
4000
6000
8000
10000
12000
14000
16000
Jan Feb Mar Apr May Jun Jul Aug Sep Oct Nov Dec
No
.of
case
s (M
alar
ia)
No
. o
f C
ase
s (D
iarr
ho
ea)
Malaria 2016 Malaria 2017 Diarrhoea 2016 Diarrhoea 2017
18
Short term recommendations for the cluster
Scale up integrated outreach services to increase coverage especially in hard to reach areas
Further scale of surveillance activities and disease surveillance: conduct mass screening and active case finding especially in hot spot areas
Monitor the effects of general elections closely to mitigate negative effects
Increase access to food by the poor and vulnerable households that are not currently targeted by the existing social safety nets
Scale up hygiene promotion and water treatment
Water trucking in most affected areas to increases access to water for domestic use
Strengthen routine vitamin A supplementation program through existing health facility and community structures
Maintain current nutrition interventions with a focus on treatment and prevention of acute malnutrition, breastfeeding and complementary feeding.
Further scale-up of surge model
Capacity building of MOH and partners on nutrition in emergency (IMAM, IYCF-E)
Further strengthening of supply chain for nutrition commodities
Alternative family care for unaccompanied and separated children affected drought through gender and social services department (children’s office).
Strengthen inter sector linkages to address malnutrition issues wholesomely
Medium to longer term recommendations for the cluster
Focus on resilience programming targeting basic and underlying causes
Increase investment in WASH and infrastructure to improve market access and household food security.
Increased investment in education of all children (and especially the girl child) as a long term measure
Increase investment in livestock and agriculture
Resource mobilization through advocacy at all levels
Strengthening community based family protection structures for children
0
10
20
30
40
Jan/17 Feb/17 Mar/17 Apr/17 May/17 Jun/17
% o
f C
hild
ren
wit
h M
UA
C
Months)
Figure 3.15: Pastoral Northeast Cluster Trends of Proportion of Children with MUAC <135mm-
2017
Mandera Wajir Isiolo
Garissa Tana River
0
5
10
15
20
25
30
35
Mandera Wajir Isiolo Garissa Tana River
Pro
po
rtio
n o
f C
hild
ren
wit
h M
UA
C
<13
5m
m
County
Figure 3.14: Proportion of Children with MUAC<135mm- Jun 2017 vs Jun LTA
Jun-17 Jun- LTA
19
3.2.3 Agro Pastoral Cluster
(West Pokot, Narok, Kajiado, East Pokot, Kieni (Nyeri), Laikipia)
Nutrition status and dietary diversity
Global Acute Malnutrition (GAM)
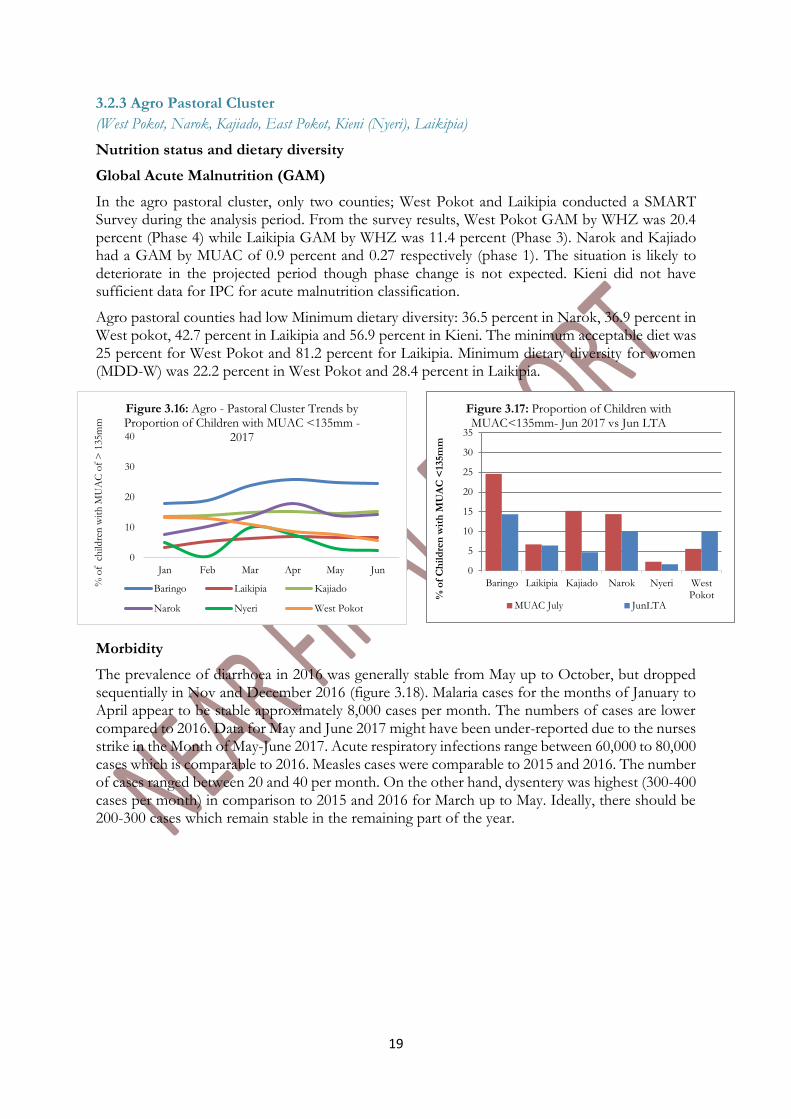
In the agro pastoral cluster, only two counties; West Pokot and Laikipia conducted a SMART Survey during the analysis period. From the survey results, West Pokot GAM by WHZ was 20.4 percent (Phase 4) while Laikipia GAM by WHZ was 11.4 percent (Phase 3). Narok and Kajiado had a GAM by MUAC of 0.9 percent and 0.27 respectively (phase 1). The situation is likely to deteriorate in the projected period though phase change is not expected. Kieni did not have sufficient data for IPC for acute malnutrition classification.
Agro pastoral counties had low Minimum dietary diversity: 36.5 percent in Narok, 36.9 percent in West pokot, 42.7 percent in Laikipia and 56.9 percent in Kieni. The minimum acceptable diet was 25 percent for West Pokot and 81.2 percent for Laikipia. Minimum dietary diversity for women (MDD-W) was 22.2 percent in West Pokot and 28.4 percent in Laikipia.
Morbidity
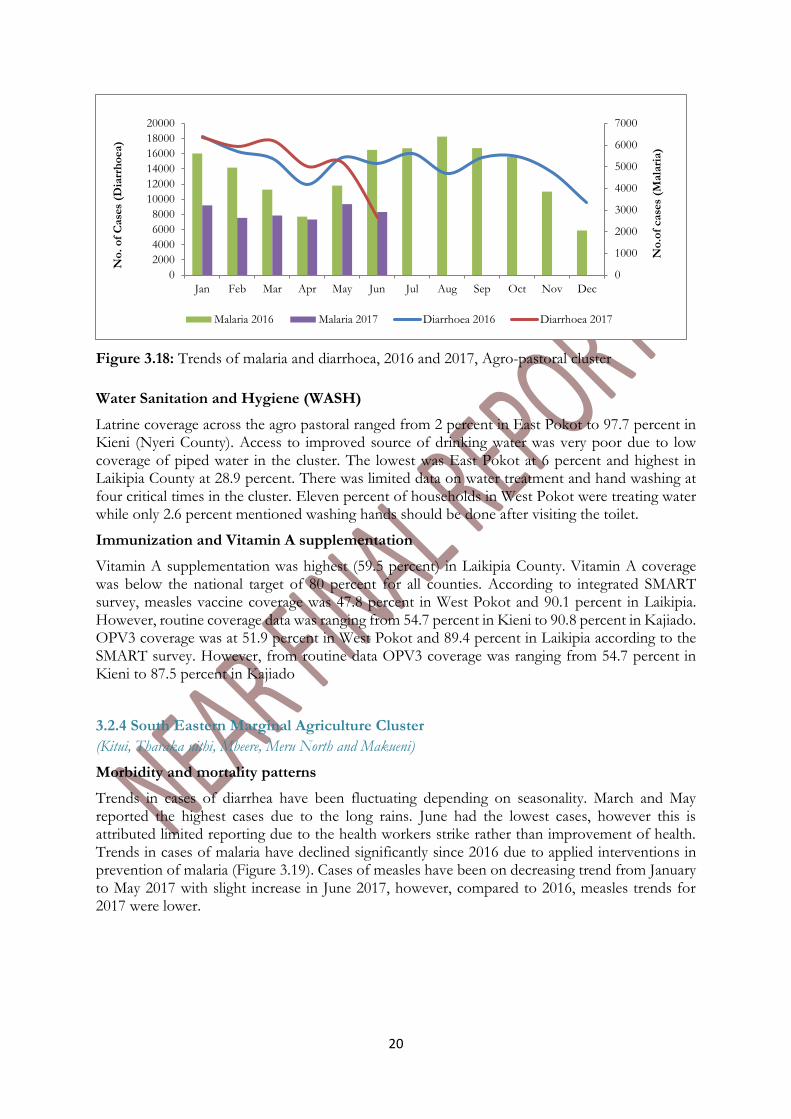
The prevalence of diarrhoea in 2016 was generally stable from May up to October, but dropped sequentially in Nov and December 2016 (figure 3.18). Malaria cases for the months of January to April appear to be stable approximately 8,000 cases per month. The numbers of cases are lower compared to 2016. Data for May and June 2017 might have been under-reported due to the nurses strike in the Month of May-June 2017. Acute respiratory infections range between 60,000 to 80,000 cases which is comparable to 2016. Measles cases were comparable to 2015 and 2016. The number of cases ranged between 20 and 40 per month. On the other hand, dysentery was highest (300-400 cases per month) in comparison to 2015 and 2016 for March up to May. Ideally, there should be 200-300 cases which remain stable in the remaining part of the year.
0
10
20
30
40
Jan Feb Mar Apr May Jun
% o
f c
hild
ren
wit
h M
UA
C o
f >
135m
m
Figure 3.16: Agro - Pastoral Cluster Trends by Proportion of Children with MUAC <135mm -
2017
Baringo Laikipia Kajiado
Narok Nyeri West Pokot
0
5
10
15
20
25
30
35
Baringo Laikipia Kajiado Narok Nyeri WestPokot%
of
Ch
ild
ren
wit
h M
UA
C <
135m
m
Figure 3.17: Proportion of Children with MUAC<135mm- Jun 2017 vs Jun LTA
MUAC July JunLTA
20
Figure 3.18: Trends of malaria and diarrhoea, 2016 and 2017, Agro-pastoral cluster
Water Sanitation and Hygiene (WASH)
Latrine coverage across the agro pastoral ranged from 2 percent in East Pokot to 97.7 percent in Kieni (Nyeri County). Access to improved source of drinking water was very poor due to low coverage of piped water in the cluster. The lowest was East Pokot at 6 percent and highest in Laikipia County at 28.9 percent. There was limited data on water treatment and hand washing at four critical times in the cluster. Eleven percent of households in West Pokot were treating water while only 2.6 percent mentioned washing hands should be done after visiting the toilet.
Immunization and Vitamin A supplementation
Vitamin A supplementation was highest (59.5 percent) in Laikipia County. Vitamin A coverage was below the national target of 80 percent for all counties. According to integrated SMART survey, measles vaccine coverage was 47.8 percent in West Pokot and 90.1 percent in Laikipia. However, routine coverage data was ranging from 54.7 percent in Kieni to 90.8 percent in Kajiado. OPV3 coverage was at 51.9 percent in West Pokot and 89.4 percent in Laikipia according to the SMART survey. However, from routine data OPV3 coverage was ranging from 54.7 percent in Kieni to 87.5 percent in Kajiado
3.2.4 South Eastern Marginal Agriculture Cluster
(Kitui, Tharaka nithi, Mbeere, Meru North and Makueni)
Morbidity and mortality patterns
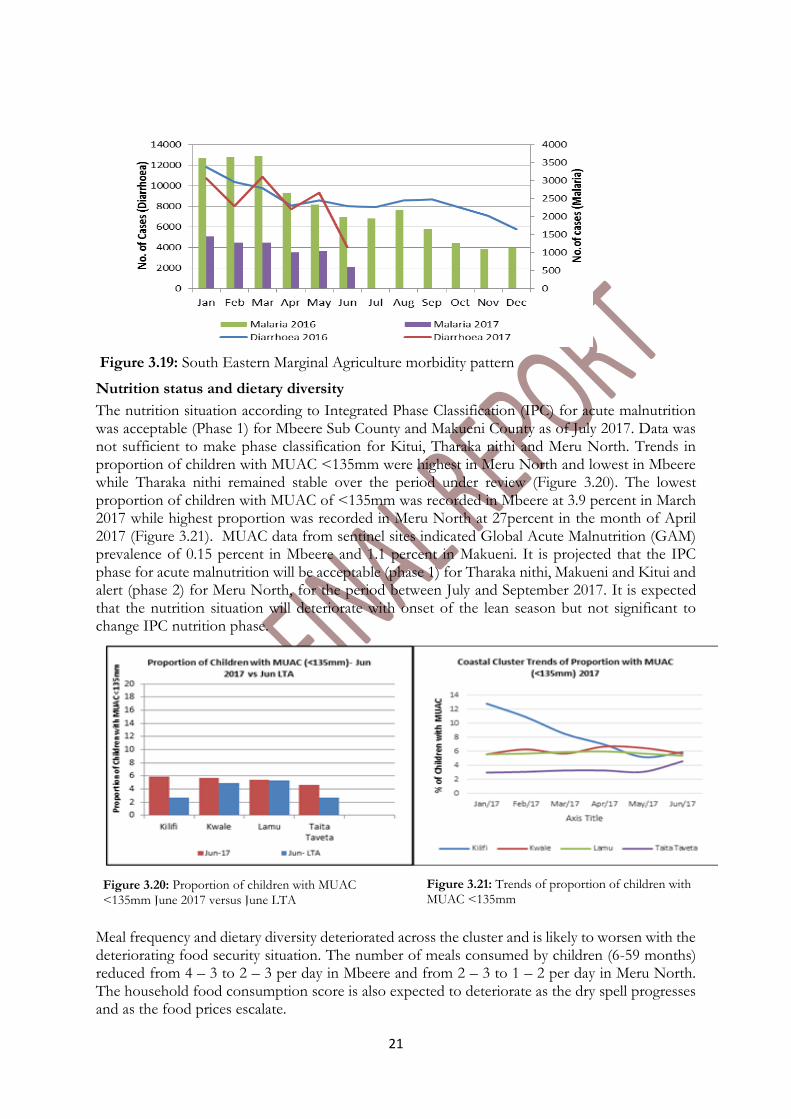
Trends in cases of diarrhea have been fluctuating depending on seasonality. March and May reported the highest cases due to the long rains. June had the lowest cases, however this is attributed limited reporting due to the health workers strike rather than improvement of health. Trends in cases of malaria have declined significantly since 2016 due to applied interventions in prevention of malaria (Figure 3.19). Cases of measles have been on decreasing trend from January to May 2017 with slight increase in June 2017, however, compared to 2016, measles trends for 2017 were lower.
0
1000
2000
3000
4000
5000
6000
7000
0
2000
4000
6000
8000
10000
12000
14000
16000
18000
20000
Jan Feb Mar Apr May Jun Jul Aug Sep Oct Nov Dec
No
.of
case
s (M
ala
ria)
No
. o
f C
ase
s (D
iarr
ho
ea)
Malaria 2016 Malaria 2017 Diarrhoea 2016 Diarrhoea 2017
21
Figure 3.19: South Eastern Marginal Agriculture morbidity pattern
Nutrition status and dietary diversity
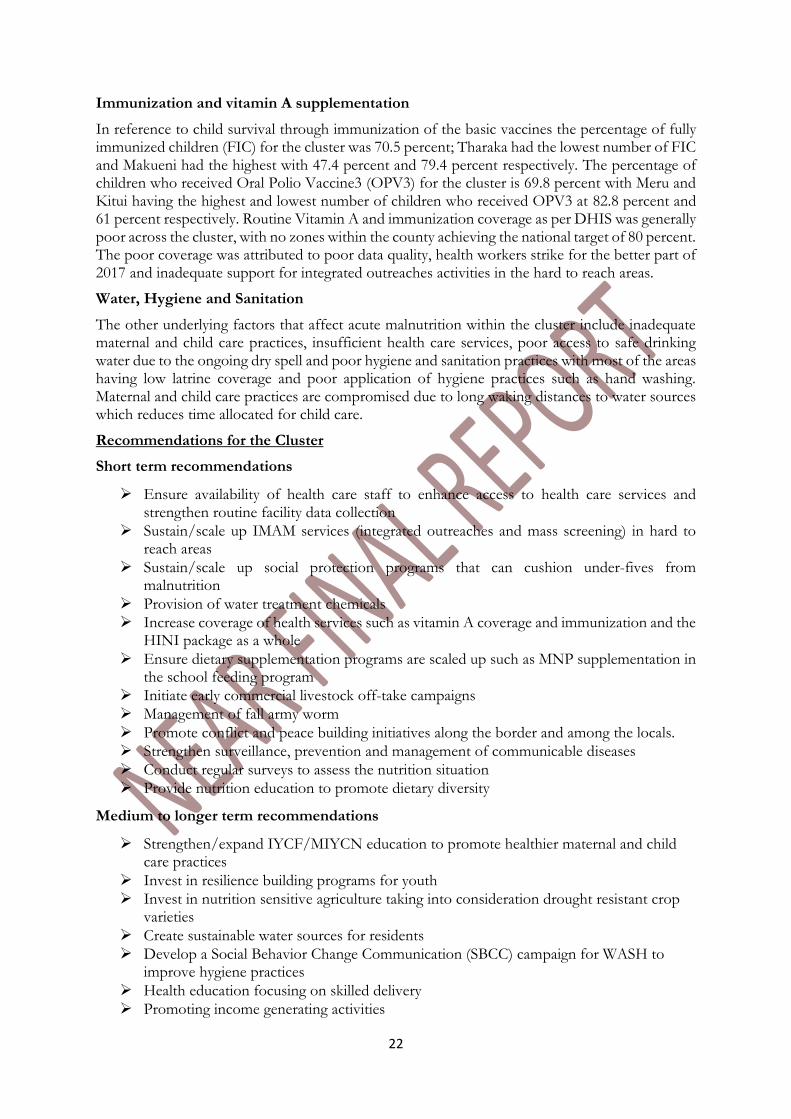
The nutrition situation according to Integrated Phase Classification (IPC) for acute malnutrition was acceptable (Phase 1) for Mbeere Sub County and Makueni County as of July 2017. Data was not sufficient to make phase classification for Kitui, Tharaka nithi and Meru North. Trends in proportion of children with MUAC <135mm were highest in Meru North and lowest in Mbeere while Tharaka nithi remained stable over the period under review (Figure 3.20). The lowest proportion of children with MUAC of <135mm was recorded in Mbeere at 3.9 percent in March 2017 while highest proportion was recorded in Meru North at 27percent in the month of April 2017 (Figure 3.21). MUAC data from sentinel sites indicated Global Acute Malnutrition (GAM) prevalence of 0.15 percent in Mbeere and 1.1 percent in Makueni. It is projected that the IPC phase for acute malnutrition will be acceptable (phase 1) for Tharaka nithi, Makueni and Kitui and alert (phase 2) for Meru North, for the period between July and September 2017. It is expected that the nutrition situation will deteriorate with onset of the lean season but not significant to change IPC nutrition phase.
Meal frequency and dietary diversity deteriorated across the cluster and is likely to worsen with the deteriorating food security situation. The number of meals consumed by children (6-59 months) reduced from 4 – 3 to 2 – 3 per day in Mbeere and from 2 – 3 to 1 – 2 per day in Meru North. The household food consumption score is also expected to deteriorate as the dry spell progresses and as the food prices escalate.
Figure 3.20: Proportion of children with MUAC <135mm June 2017 versus June LTA
Figure 3.21: Trends of proportion of children with MUAC <135mm
22
Immunization and vitamin A supplementation
In reference to child survival through immunization of the basic vaccines the percentage of fully immunized children (FIC) for the cluster was 70.5 percent; Tharaka had the lowest number of FIC and Makueni had the highest with 47.4 percent and 79.4 percent respectively. The percentage of children who received Oral Polio Vaccine3 (OPV3) for the cluster is 69.8 percent with Meru and Kitui having the highest and lowest number of children who received OPV3 at 82.8 percent and 61 percent respectively. Routine Vitamin A and immunization coverage as per DHIS was generally poor across the cluster, with no zones within the county achieving the national target of 80 percent. The poor coverage was attributed to poor data quality, health workers strike for the better part of 2017 and inadequate support for integrated outreaches activities in the hard to reach areas.
Water, Hygiene and Sanitation
The other underlying factors that affect acute malnutrition within the cluster include inadequate maternal and child care practices, insufficient health care services, poor access to safe drinking water due to the ongoing dry spell and poor hygiene and sanitation practices with most of the areas having low latrine coverage and poor application of hygiene practices such as hand washing. Maternal and child care practices are compromised due to long waking distances to water sources which reduces time allocated for child care.
Recommendations for the Cluster
Short term recommendations
Ensure availability of health care staff to enhance access to health care services and strengthen routine facility data collection
Sustain/scale up IMAM services (integrated outreaches and mass screening) in hard to reach areas
Sustain/scale up social protection programs that can cushion under-fives from malnutrition
Provision of water treatment chemicals
Increase coverage of health services such as vitamin A coverage and immunization and the HINI package as a whole
Ensure dietary supplementation programs are scaled up such as MNP supplementation in the school feeding program
Initiate early commercial livestock off-take campaigns
Management of fall army worm
Promote conflict and peace building initiatives along the border and among the locals.
Strengthen surveillance, prevention and management of communicable diseases
Conduct regular surveys to assess the nutrition situation
Provide nutrition education to promote dietary diversity
Medium to longer term recommendations
Strengthen/expand IYCF/MIYCN education to promote healthier maternal and child care practices
Invest in resilience building programs for youth
Invest in nutrition sensitive agriculture taking into consideration drought resistant crop varieties
Create sustainable water sources for residents
Develop a Social Behavior Change Communication (SBCC) campaign for WASH to improve hygiene practices
Health education focusing on skilled delivery
Promoting income generating activities
23
Promotion of food preservation and utilization of preserved foods
Advocacy, Communication and Social Mobilization to increase uptake of health services
3.2.5 Coastal Marginal Cluster Nutrition Report
(Kwale, Kilifi, Lamu and Taita Taveta Counties)
Morbidity and Mortality:
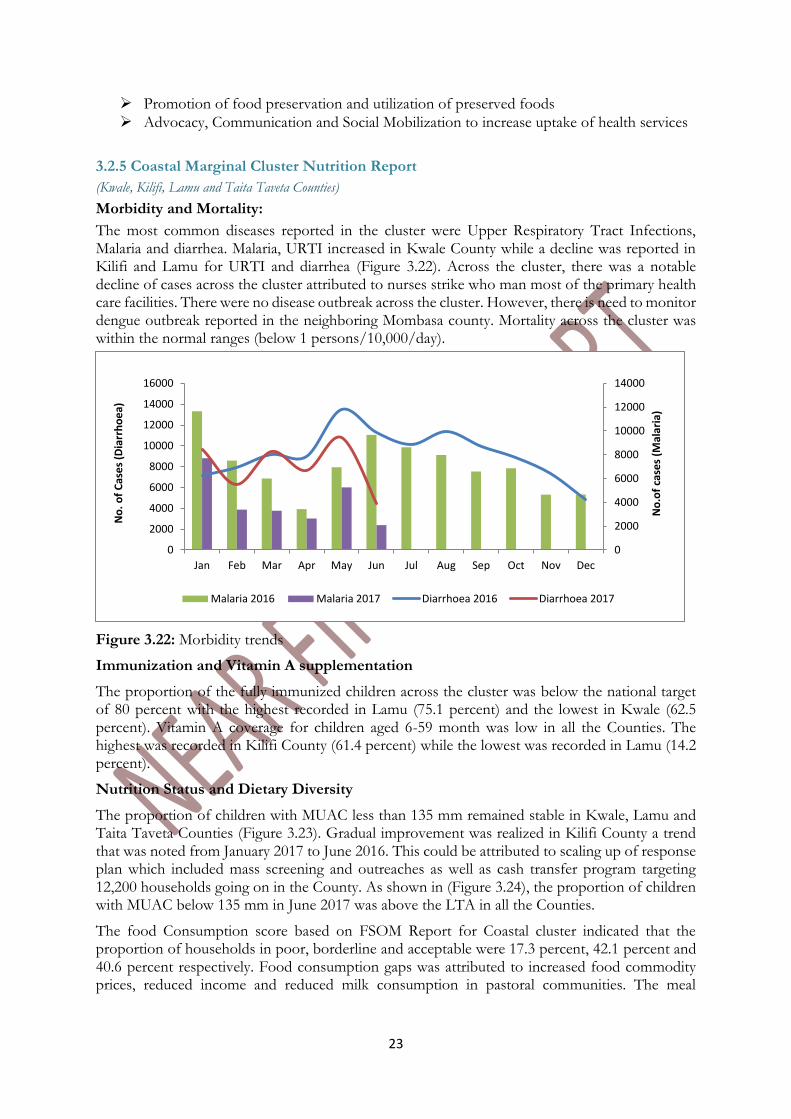
The most common diseases reported in the cluster were Upper Respiratory Tract Infections, Malaria and diarrhea. Malaria, URTI increased in Kwale County while a decline was reported in Kilifi and Lamu for URTI and diarrhea (Figure 3.22). Across the cluster, there was a notable decline of cases across the cluster attributed to nurses strike who man most of the primary health care facilities. There were no disease outbreak across the cluster. However, there is need to monitor dengue outbreak reported in the neighboring Mombasa county. Mortality across the cluster was within the normal ranges (below 1 persons/10,000/day).
Figure 3.22: Morbidity trends
Immunization and Vitamin A supplementation
The proportion of the fully immunized children across the cluster was below the national target of 80 percent with the highest recorded in Lamu (75.1 percent) and the lowest in Kwale (62.5 percent). Vitamin A coverage for children aged 6-59 month was low in all the Counties. The highest was recorded in Kilifi County (61.4 percent) while the lowest was recorded in Lamu (14.2 percent).
Nutrition Status and Dietary Diversity
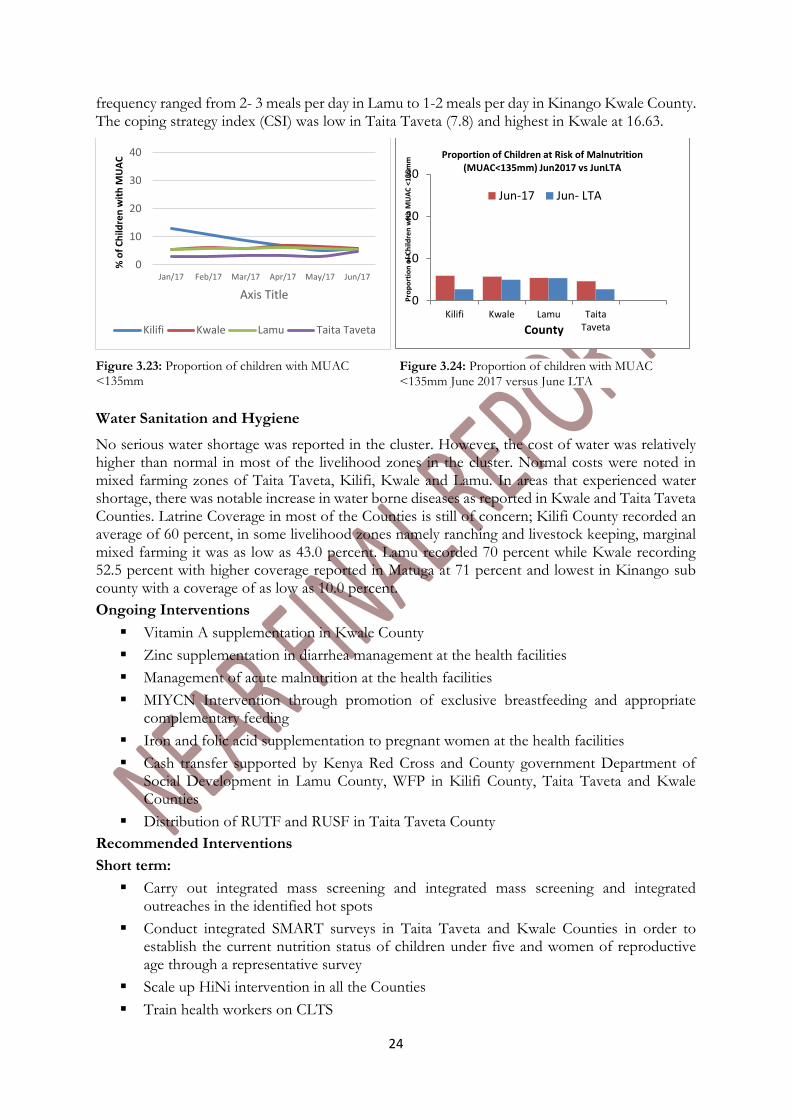
The proportion of children with MUAC less than 135 mm remained stable in Kwale, Lamu and Taita Taveta Counties (Figure 3.23). Gradual improvement was realized in Kilifi County a trend that was noted from January 2017 to June 2016. This could be attributed to scaling up of response plan which included mass screening and outreaches as well as cash transfer program targeting 12,200 households going on in the County. As shown in (Figure 3.24), the proportion of children with MUAC below 135 mm in June 2017 was above the LTA in all the Counties.
The food Consumption score based on FSOM Report for Coastal cluster indicated that the proportion of households in poor, borderline and acceptable were 17.3 percent, 42.1 percent and 40.6 percent respectively. Food consumption gaps was attributed to increased food commodity prices, reduced income and reduced milk consumption in pastoral communities. The meal
0
2000
4000
6000
8000
10000
12000
14000
0
2000
4000
6000
8000
10000
12000
14000
16000
Jan Feb Mar Apr May Jun Jul Aug Sep Oct Nov Dec
No
.of
case
s (M
alar
ia)
No
. o
f C
ase
s (D
iarr
ho
ea)
Malaria 2016 Malaria 2017 Diarrhoea 2016 Diarrhoea 2017
24
frequency ranged from 2- 3 meals per day in Lamu to 1-2 meals per day in Kinango Kwale County. The coping strategy index (CSI) was low in Taita Taveta (7.8) and highest in Kwale at 16.63.
Water Sanitation and Hygiene
No serious water shortage was reported in the cluster. However, the cost of water was relatively higher than normal in most of the livelihood zones in the cluster. Normal costs were noted in mixed farming zones of Taita Taveta, Kilifi, Kwale and Lamu. In areas that experienced water shortage, there was notable increase in water borne diseases as reported in Kwale and Taita Taveta Counties. Latrine Coverage in most of the Counties is still of concern; Kilifi County recorded an average of 60 percent, in some livelihood zones namely ranching and livestock keeping, marginal mixed farming it was as low as 43.0 percent. Lamu recorded 70 percent while Kwale recording 52.5 percent with higher coverage reported in Matuga at 71 percent and lowest in Kinango sub county with a coverage of as low as 10.0 percent.
Ongoing Interventions
Vitamin A supplementation in Kwale County
Zinc supplementation in diarrhea management at the health facilities
Management of acute malnutrition at the health facilities
MIYCN Intervention through promotion of exclusive breastfeeding and appropriate complementary feeding
Iron and folic acid supplementation to pregnant women at the health facilities
Cash transfer supported by Kenya Red Cross and County government Department of Social Development in Lamu County, WFP in Kilifi County, Taita Taveta and Kwale Counties
Distribution of RUTF and RUSF in Taita Taveta County
Recommended Interventions
Short term:
Carry out integrated mass screening and integrated mass screening and integrated outreaches in the identified hot spots
Conduct integrated SMART surveys in Taita Taveta and Kwale Counties in order to establish the current nutrition status of children under five and women of reproductive age through a representative survey
Scale up HiNi intervention in all the Counties
Train health workers on CLTS
0
10
20
30
40
Jan/17 Feb/17 Mar/17 Apr/17 May/17 Jun/17
% o
f C
hild
ren
wit
h M
UA
C
Axis Title
Kilifi Kwale Lamu Taita Taveta
0
10
20
30
Kilifi Kwale Lamu TaitaTaveta
Pro
po
rtio
n o
f C
hild
ren
wit
h M
UA
C <
135
mm
County
Proportion of Children at Risk of Malnutrition (MUAC<135mm) Jun2017 vs JunLTA
Jun-17 Jun- LTA
Figure 3.24: Proportion of children with MUAC
<135mm June 2017 versus June LTA
Figure 3.23: Proportion of children with MUAC <135mm
25
Procure and distribute water treatment chemicals
Scale up sensitization to the CHVs on community screening and referral of malnourished children
Strengthen and scale up SFP and OTP programs for treatment of acute malnutrition
Procurement and prepositioning of RUTF and RUSF
Medium and Long Term Interventions:
Establishment of more IMAM treatment sites in Kwale and Lamu Counties
Strengthen multi sectoral coordination which will include health, agriculture, Education and other sector to address nutrition issues
Conduct MIYCN Knowledge, attitude and Practice Survey in order to establish the current MIYCN KAP status
26
APPENDICES
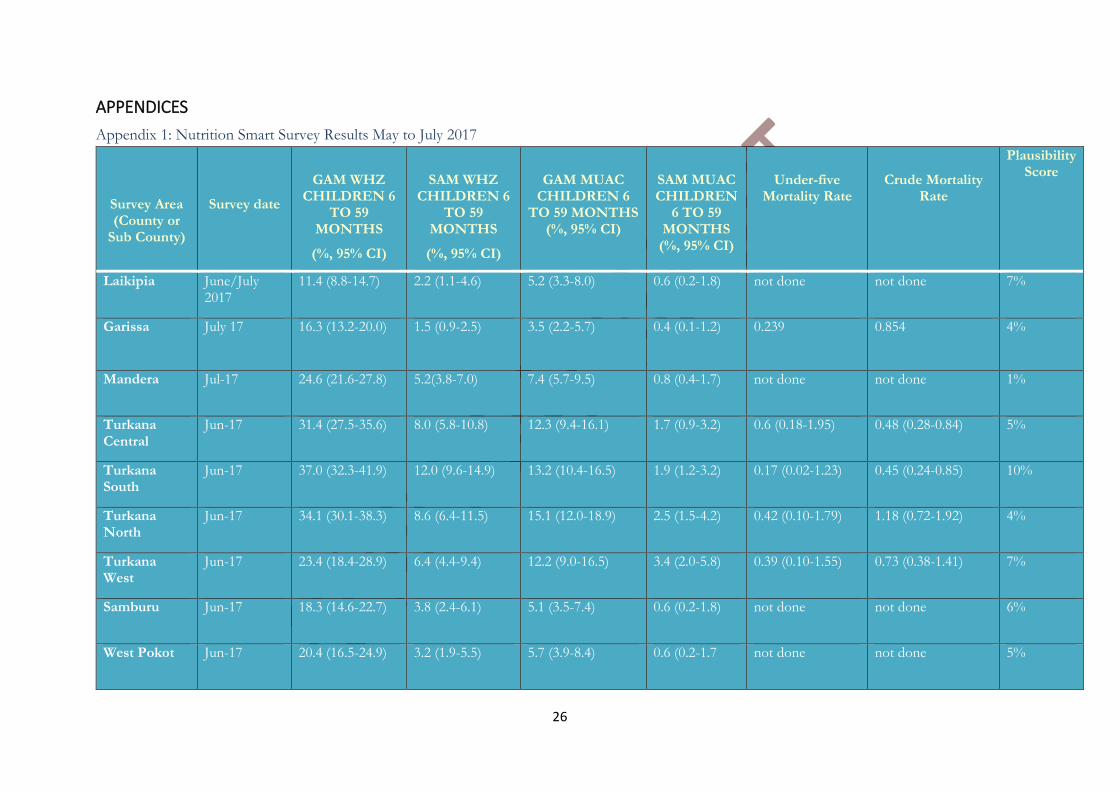
Appendix 1: Nutrition Smart Survey Results May to July 2017
Survey Area (County or
Sub County)
Survey date
GAM WHZ CHILDREN 6
TO 59 MONTHS
(%, 95% CI)
SAM WHZ CHILDREN 6
TO 59 MONTHS
(%, 95% CI)
GAM MUAC CHILDREN 6
TO 59 MONTHS (%, 95% CI)
SAM MUAC CHILDREN
6 TO 59 MONTHS
(%, 95% CI)
Under-five Mortality Rate
Crude Mortality Rate
Plausibility Score
Laikipia June/July 2017
11.4 (8.8-14.7) 2.2 (1.1-4.6) 5.2 (3.3-8.0) 0.6 (0.2-1.8) not done not done 7%
Garissa July 17 16.3 (13.2-20.0) 1.5 (0.9-2.5) 3.5 (2.2-5.7) 0.4 (0.1-1.2) 0.239 0.854 4%
Mandera Jul-17 24.6 (21.6-27.8) 5.2(3.8-7.0) 7.4 (5.7-9.5) 0.8 (0.4-1.7) not done not done 1%
Turkana Central
Jun-17 31.4 (27.5-35.6) 8.0 (5.8-10.8) 12.3 (9.4-16.1) 1.7 (0.9-3.2) 0.6 (0.18-1.95) 0.48 (0.28-0.84) 5%
Turkana South
Jun-17 37.0 (32.3-41.9) 12.0 (9.6-14.9) 13.2 (10.4-16.5) 1.9 (1.2-3.2) 0.17 (0.02-1.23) 0.45 (0.24-0.85) 10%
Turkana North
Jun-17 34.1 (30.1-38.3) 8.6 (6.4-11.5) 15.1 (12.0-18.9) 2.5 (1.5-4.2) 0.42 (0.10-1.79) 1.18 (0.72-1.92) 4%
Turkana West
Jun-17 23.4 (18.4-28.9) 6.4 (4.4-9.4) 12.2 (9.0-16.5) 3.4 (2.0-5.8) 0.39 (0.10-1.55) 0.73 (0.38-1.41) 7%
Samburu Jun-17 18.3 (14.6-22.7) 3.8 (2.4-6.1) 5.1 (3.5-7.4) 0.6 (0.2-1.8) not done not done 6%
West Pokot Jun-17 20.4 (16.5-24.9) 3.2 (1.9-5.5) 5.7 (3.9-8.4) 0.6 (0.2-1.7 not done not done 5%
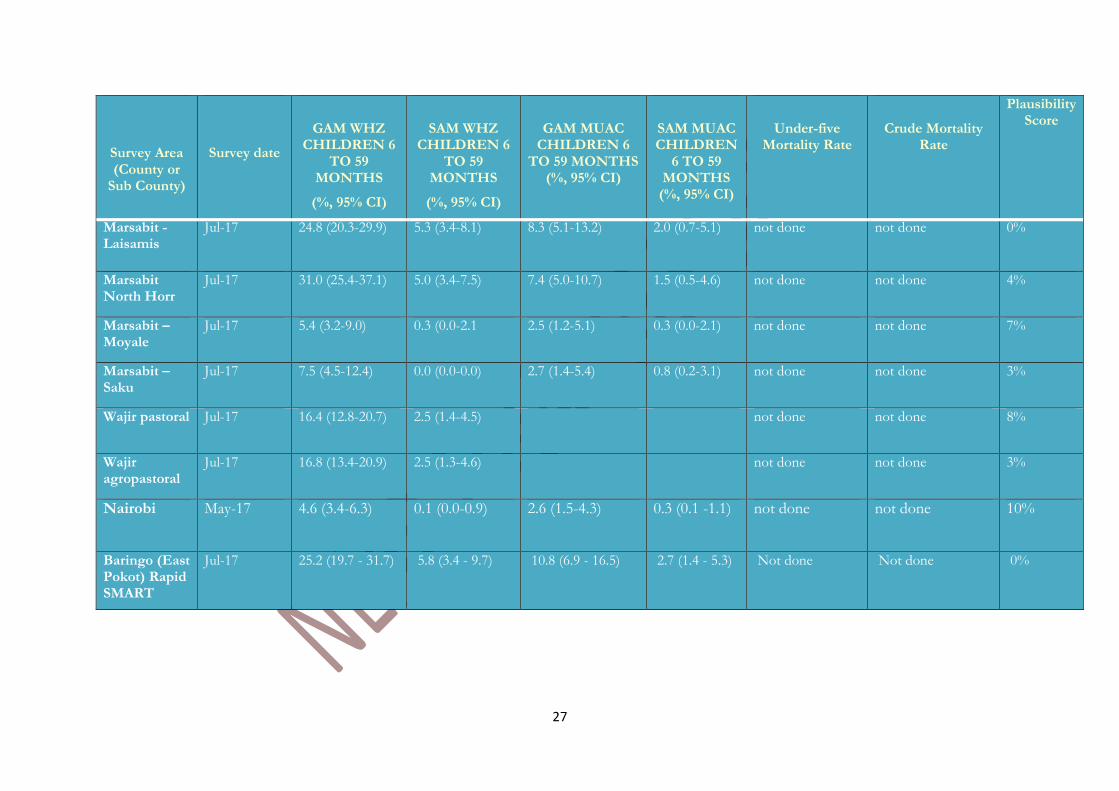
27
Survey Area (County or
Sub County)
Survey date
GAM WHZ CHILDREN 6
TO 59 MONTHS
(%, 95% CI)
SAM WHZ CHILDREN 6
TO 59 MONTHS
(%, 95% CI)
GAM MUAC CHILDREN 6
TO 59 MONTHS (%, 95% CI)
SAM MUAC CHILDREN
6 TO 59 MONTHS
(%, 95% CI)
Under-five Mortality Rate
Crude Mortality Rate
Plausibility Score
Marsabit - Laisamis
Jul-17 24.8 (20.3-29.9) 5.3 (3.4-8.1) 8.3 (5.1-13.2) 2.0 (0.7-5.1) not done not done 0%
Marsabit North Horr
Jul-17 31.0 (25.4-37.1) 5.0 (3.4-7.5) 7.4 (5.0-10.7) 1.5 (0.5-4.6) not done not done 4%
Marsabit – Moyale
Jul-17 5.4 (3.2-9.0) 0.3 (0.0-2.1 2.5 (1.2-5.1) 0.3 (0.0-2.1) not done not done 7%
Marsabit – Saku
Jul-17 7.5 (4.5-12.4) 0.0 (0.0-0.0) 2.7 (1.4-5.4) 0.8 (0.2-3.1) not done not done 3%
Wajir pastoral Jul-17 16.4 (12.8-20.7) 2.5 (1.4-4.5) not done not done 8%
Wajir agropastoral
Jul-17 16.8 (13.4-20.9) 2.5 (1.3-4.6) not done not done 3%
Nairobi May-17 4.6 (3.4-6.3) 0.1 (0.0-0.9) 2.6 (1.5-4.3) 0.3 (0.1 -1.1) not done not done 10%
Baringo (East Pokot) Rapid SMART
Jul-17 25.2 (19.7 - 31.7)
5.8 (3.4 - 9.7)
10.8 (6.9 - 16.5) 2.7 (1.4 - 5.3)
Not done Not done 0%
28
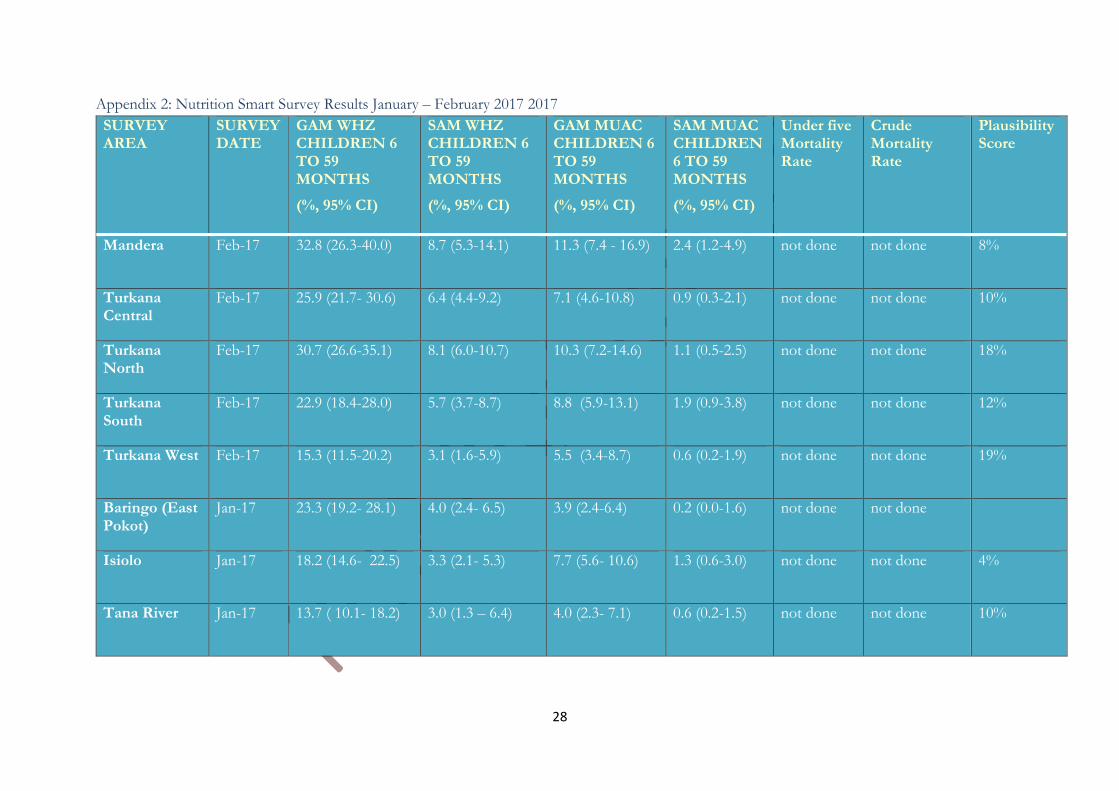
Appendix 2: Nutrition Smart Survey Results January – February 2017 2017
SURVEY AREA
SURVEY DATE
GAM WHZ CHILDREN 6 TO 59 MONTHS
(%, 95% CI)
SAM WHZ CHILDREN 6 TO 59 MONTHS
(%, 95% CI)
GAM MUAC CHILDREN 6 TO 59 MONTHS
(%, 95% CI)
SAM MUAC CHILDREN 6 TO 59 MONTHS
(%, 95% CI)
Under five Mortality Rate
Crude Mortality Rate
Plausibility Score
Mandera Feb-17 32.8 (26.3-40.0) 8.7 (5.3-14.1) 11.3 (7.4 - 16.9) 2.4 (1.2-4.9) not done not done 8%
Turkana Central
Feb-17 25.9 (21.7- 30.6) 6.4 (4.4-9.2) 7.1 (4.6-10.8) 0.9 (0.3-2.1) not done not done 10%
Turkana North
Feb-17 30.7 (26.6-35.1) 8.1 (6.0-10.7) 10.3 (7.2-14.6) 1.1 (0.5-2.5) not done not done 18%
Turkana South
Feb-17 22.9 (18.4-28.0) 5.7 (3.7-8.7) 8.8 (5.9-13.1) 1.9 (0.9-3.8) not done not done 12%
Turkana West Feb-17 15.3 (11.5-20.2) 3.1 (1.6-5.9) 5.5 (3.4-8.7) 0.6 (0.2-1.9) not done not done 19%
Baringo (East Pokot)
Jan-17 23.3 (19.2- 28.1) 4.0 (2.4- 6.5) 3.9 (2.4-6.4) 0.2 (0.0-1.6) not done not done
Isiolo Jan-17 18.2 (14.6- 22.5) 3.3 (2.1- 5.3) 7.7 (5.6- 10.6) 1.3 (0.6-3.0) not done not done 4%
Tana River Jan-17 13.7 ( 10.1- 18.2) 3.0 (1.3 – 6.4) 4.0 (2.3- 7.1) 0.6 (0.2-1.5) not done not done 10%
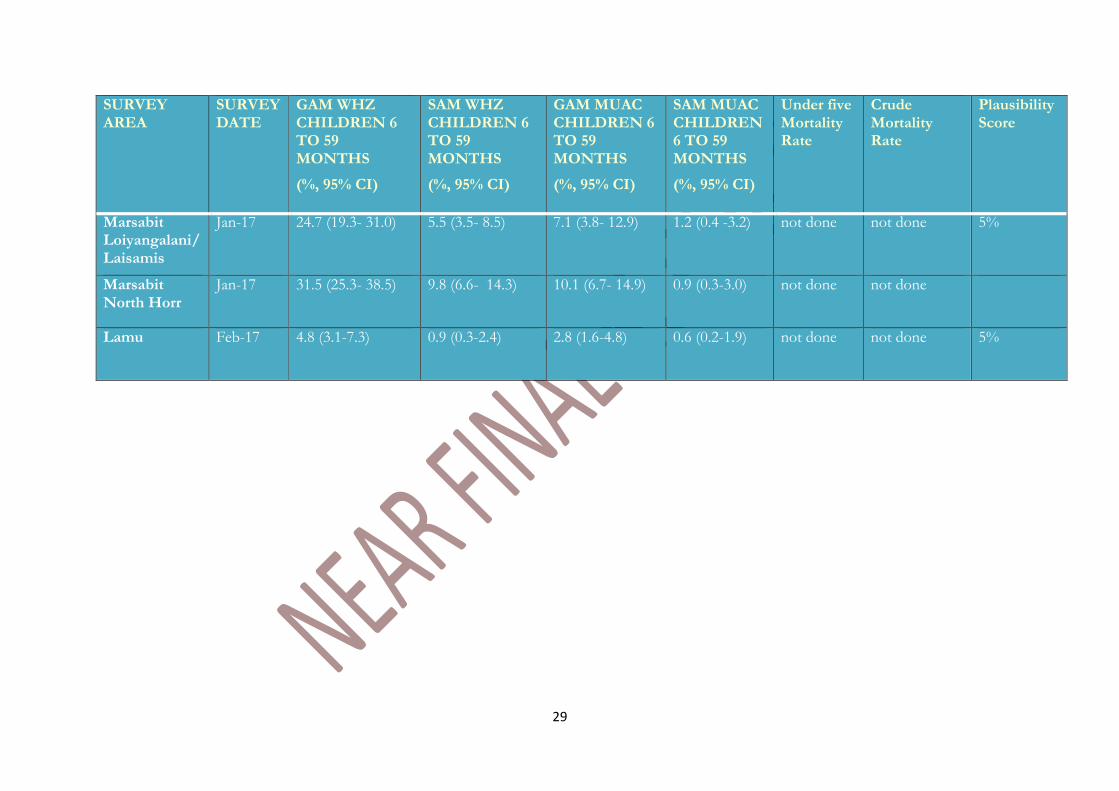
29
SURVEY AREA
SURVEY DATE
GAM WHZ CHILDREN 6 TO 59 MONTHS
(%, 95% CI)
SAM WHZ CHILDREN 6 TO 59 MONTHS
(%, 95% CI)
GAM MUAC CHILDREN 6 TO 59 MONTHS
(%, 95% CI)
SAM MUAC CHILDREN 6 TO 59 MONTHS
(%, 95% CI)
Under five Mortality Rate
Crude Mortality Rate
Plausibility Score
Marsabit Loiyangalani/ Laisamis
Jan-17 24.7 (19.3- 31.0) 5.5 (3.5- 8.5) 7.1 (3.8- 12.9) 1.2 (0.4 -3.2) not done not done 5%
Marsabit North Horr
Jan-17 31.5 (25.3- 38.5) 9.8 (6.6- 14.3) 10.1 (6.7- 14.9) 0.9 (0.3-3.0) not done not done
Lamu Feb-17 4.8 (3.1-7.3) 0.9 (0.3-2.4) 2.8 (1.6-4.8) 0.6 (0.2-1.9) not done not done 5%
30
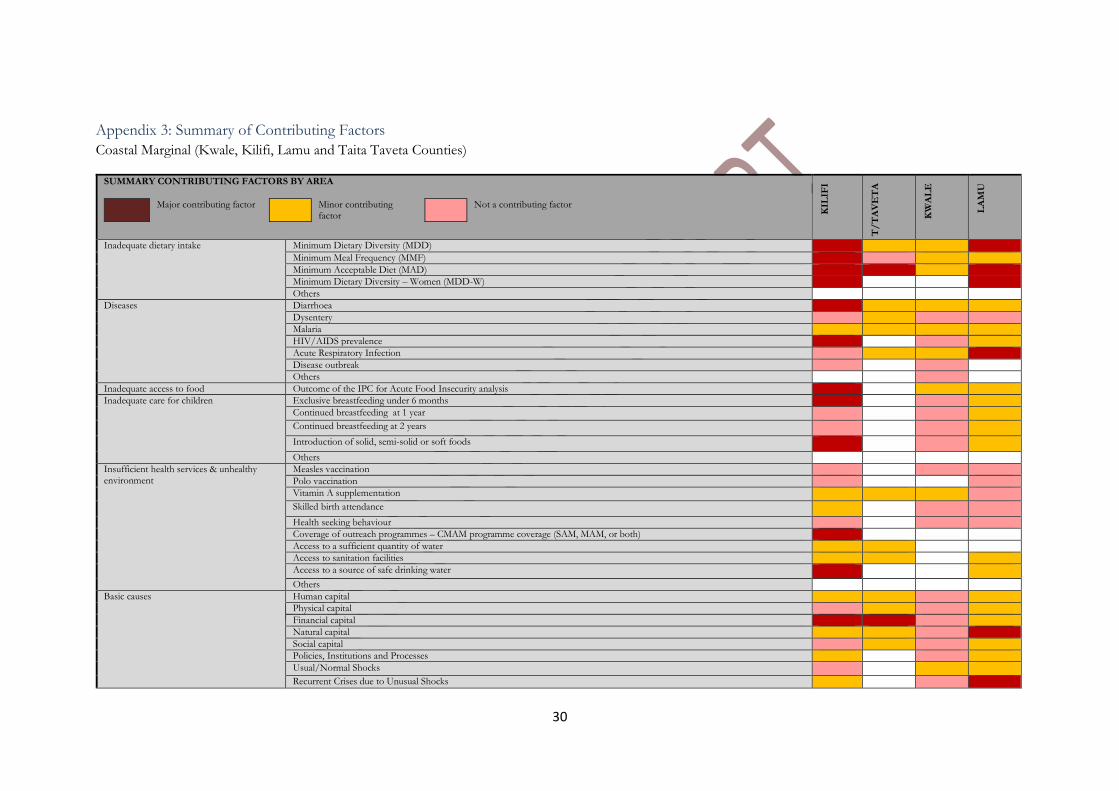
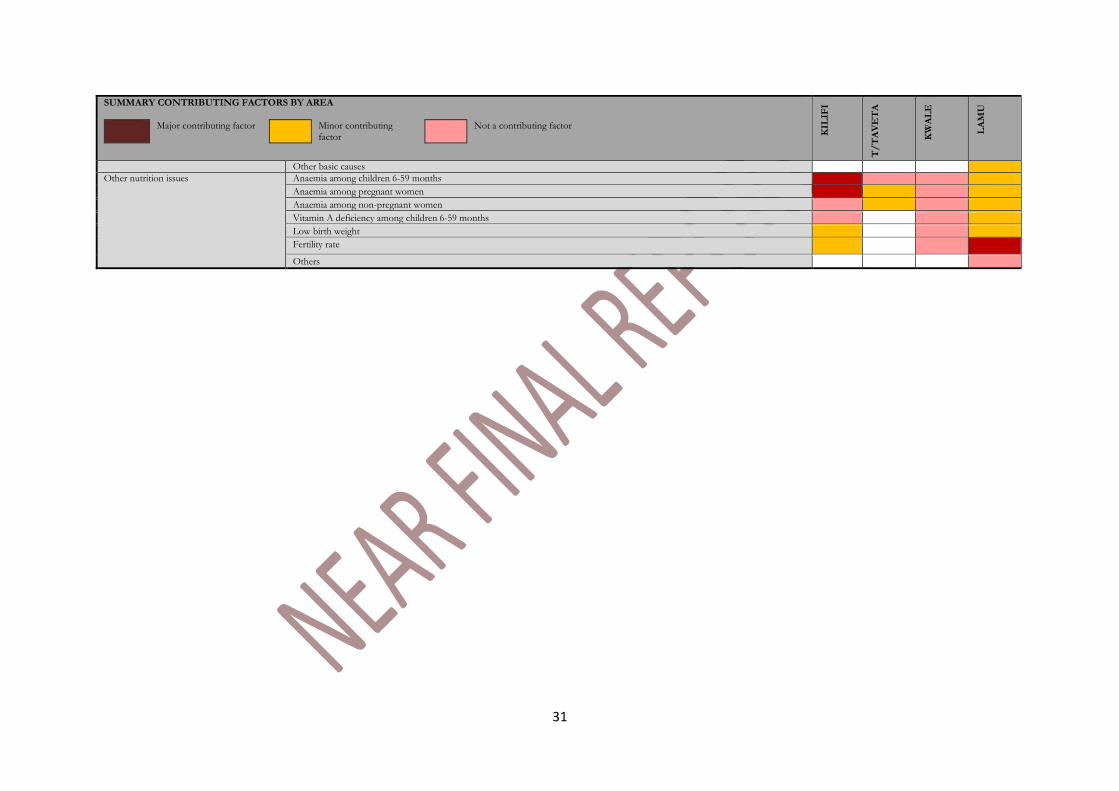
Appendix 3: Summary of Contributing Factors
Coastal Marginal (Kwale, Kilifi, Lamu and Taita Taveta Counties)
SUMMARY CONTRIBUTING FACTORS BY AREA
Major contributing factor Minor contributing factor
Not a contributing factor
KIL
IFI
T/
TA
VE
TA
KW
AL
E
LA
MU
Inadequate dietary intake
Minimum Dietary Diversity (MDD)
Minimum Meal Frequency (MMF)
Minimum Acceptable Diet (MAD)
Minimum Dietary Diversity – Women (MDD-W)
Others
Diseases
Diarrhoea
Dysentery
Malaria
HIV/AIDS prevalence
Acute Respiratory Infection
Disease outbreak
Others
Inadequate access to food Outcome of the IPC for Acute Food Insecurity analysis
Inadequate care for children Exclusive breastfeeding under 6 months
Continued breastfeeding at 1 year
Continued breastfeeding at 2 years
Introduction of solid, semi-solid or soft foods
Others
Insufficient health services & unhealthy environment
Measles vaccination
Polo vaccination
Vitamin A supplementation
Skilled birth attendance
Health seeking behaviour
Coverage of outreach programmes – CMAM programme coverage (SAM, MAM, or both)
Access to a sufficient quantity of water
Access to sanitation facilities
Access to a source of safe drinking water
Others
Basic causes
Human capital
Physical capital
Financial capital
Natural capital
Social capital
Policies, Institutions and Processes
Usual/Normal Shocks
Recurrent Crises due to Unusual Shocks
31
SUMMARY CONTRIBUTING FACTORS BY AREA
Major contributing factor Minor contributing factor
Not a contributing factor
KIL
IFI
T/
TA
VE
TA
KW
AL
E
LA
MU
Other basic causes
Other nutrition issues
Anaemia among children 6-59 months
Anaemia among pregnant women
Anaemia among non-pregnant women
Vitamin A deficiency among children 6-59 months
Low birth weight
Fertility rate
Others
32
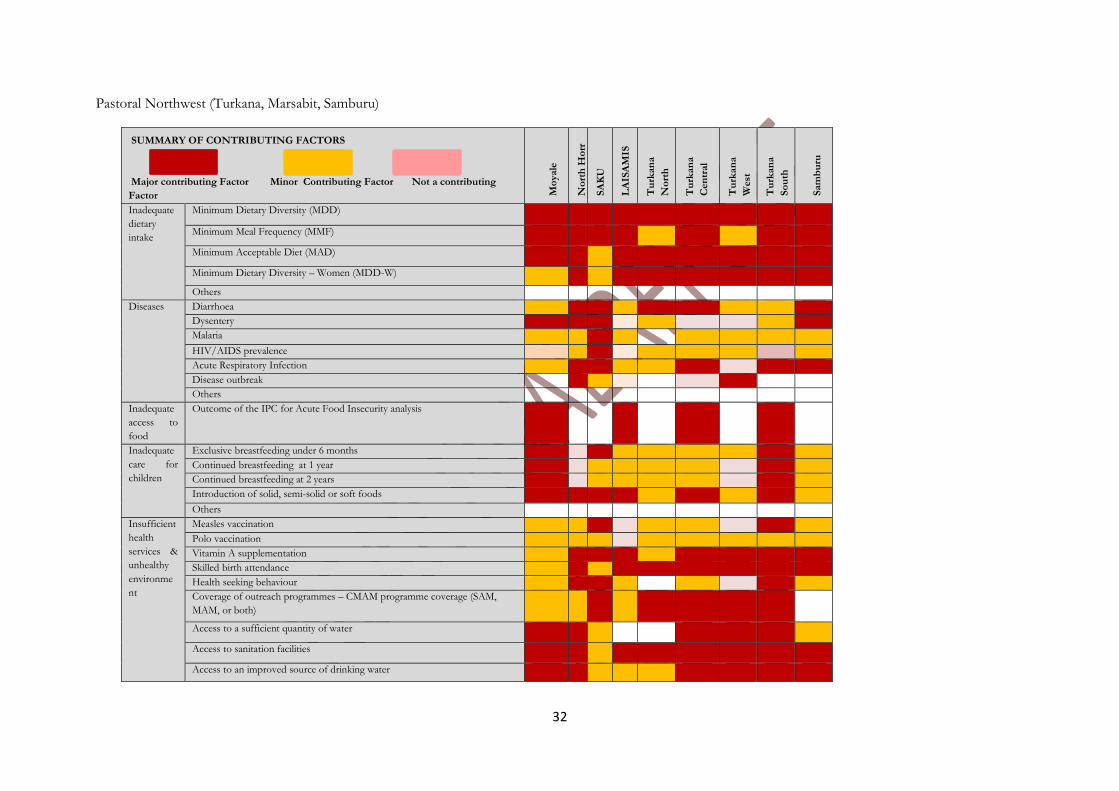
Pastoral Northwest (Turkana, Marsabit, Samburu)
SUMMARY OF CONTRIBUTING FACTORS
Major contributing Factor Minor Contributing Factor Not a contributing
Factor Mo
yale
No
rth
Ho
rr
SA
KU
LA
ISA
MIS
Tu
rkan
a
No
rth
Tu
rkan
a
Cen
tral
Tu
rkan
a
West
Tu
rkan
a
So
uth
Sam
bu
ru
Inadequate
dietary
intake
Minimum Dietary Diversity (MDD)
Minimum Meal Frequency (MMF)
Minimum Acceptable Diet (MAD)
Minimum Dietary Diversity – Women (MDD-W)
Others
Diseases Diarrhoea
Dysentery
Malaria
HIV/AIDS prevalence
Acute Respiratory Infection
Disease outbreak
Others
Inadequate
access to
food
Outcome of the IPC for Acute Food Insecurity analysis
Inadequate
care for
children
Exclusive breastfeeding under 6 months
Continued breastfeeding at 1 year
Continued breastfeeding at 2 years
Introduction of solid, semi-solid or soft foods
Others
Insufficient
health
services &
unhealthy
environme
nt
Measles vaccination
Polo vaccination
Vitamin A supplementation
Skilled birth attendance
Health seeking behaviour
Coverage of outreach programmes – CMAM programme coverage (SAM,
MAM, or both)
Access to a sufficient quantity of water
Access to sanitation facilities
Access to an improved source of drinking water
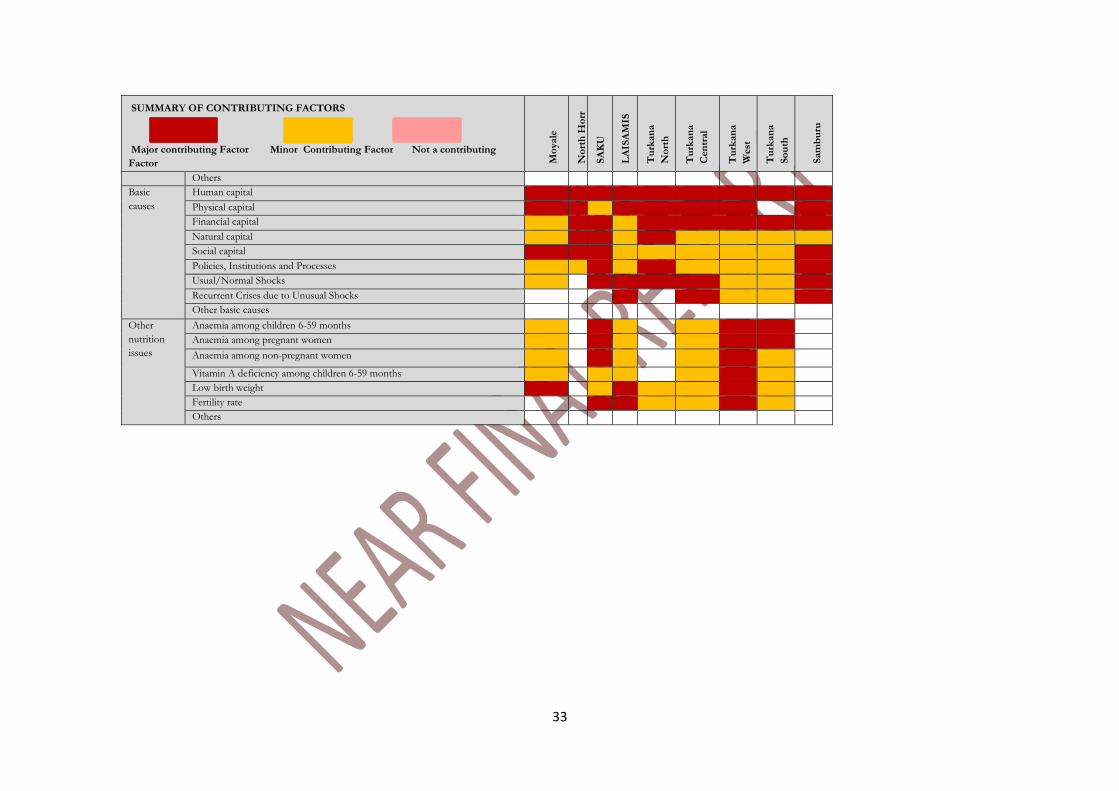
33
SUMMARY OF CONTRIBUTING FACTORS
Major contributing Factor Minor Contributing Factor Not a contributing
Factor Mo
yale
No
rth
Ho
rr
SA
KU
LA
ISA
MIS
Tu
rkan
a
No
rth
Tu
rkan
a
Cen
tral
Tu
rkan
a
West
Tu
rkan
a
So
uth
Sam
bu
ru
Others
Basic
causes
Human capital
Physical capital
Financial capital
Natural capital
Social capital
Policies, Institutions and Processes
Usual/Normal Shocks
Recurrent Crises due to Unusual Shocks
Other basic causes
Other
nutrition
issues
Anaemia among children 6-59 months
Anaemia among pregnant women
Anaemia among non-pregnant women
Vitamin A deficiency among children 6-59 months
Low birth weight
Fertility rate
Others
34
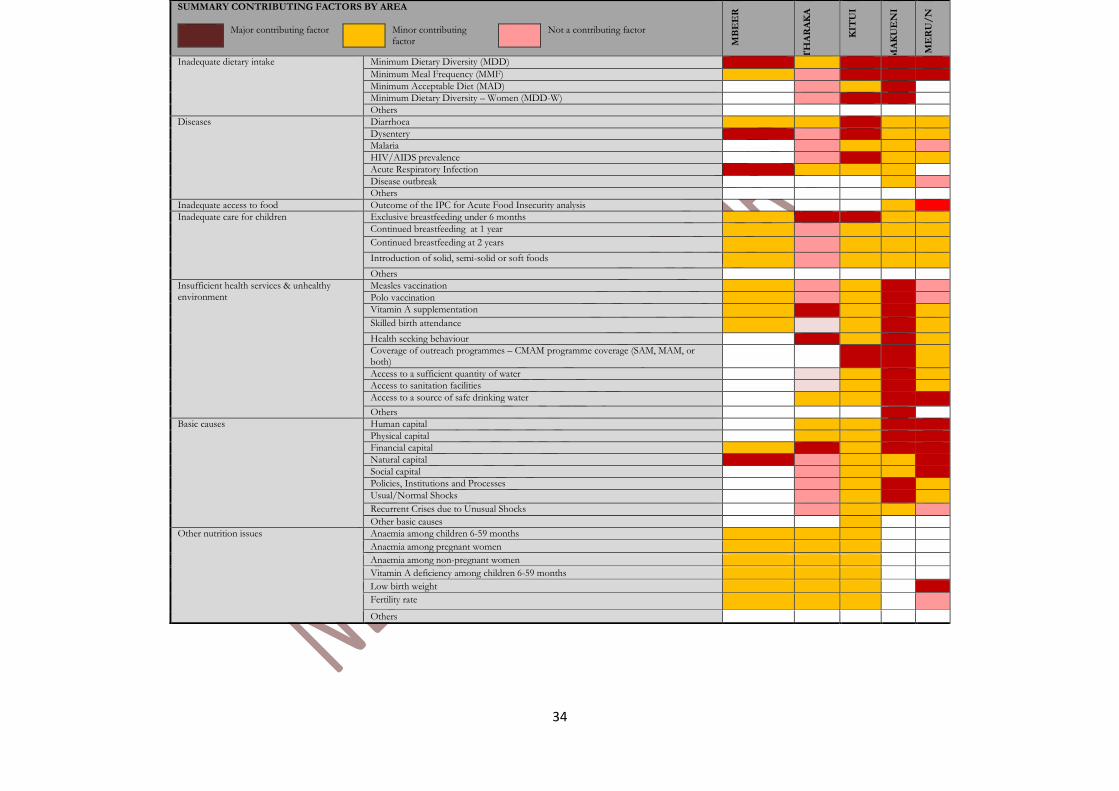
SUMMARY CONTRIBUTING FACTORS BY AREA
Major contributing factor Minor contributing factor
Not a contributing factor
MB
EE
R
TH
AR
AK
A
KIT
UI
MA
KU
EN
I
ME
RU
/N
Inadequate dietary intake
Minimum Dietary Diversity (MDD)
Minimum Meal Frequency (MMF)
Minimum Acceptable Diet (MAD)
Minimum Dietary Diversity – Women (MDD-W)
Others
Diseases
Diarrhoea
Dysentery
Malaria
HIV/AIDS prevalence
Acute Respiratory Infection
Disease outbreak
Others
Inadequate access to food Outcome of the IPC for Acute Food Insecurity analysis
Inadequate care for children Exclusive breastfeeding under 6 months
Continued breastfeeding at 1 year
Continued breastfeeding at 2 years
Introduction of solid, semi-solid or soft foods
Others
Insufficient health services & unhealthy environment
Measles vaccination
Polo vaccination
Vitamin A supplementation
Skilled birth attendance
Health seeking behaviour
Coverage of outreach programmes – CMAM programme coverage (SAM, MAM, or both)
Access to a sufficient quantity of water
Access to sanitation facilities
Access to a source of safe drinking water
Others
Basic causes
Human capital
Physical capital
Financial capital
Natural capital
Social capital
Policies, Institutions and Processes
Usual/Normal Shocks
Recurrent Crises due to Unusual Shocks
Other basic causes
Other nutrition issues
Anaemia among children 6-59 months
Anaemia among pregnant women
Anaemia among non-pregnant women
Vitamin A deficiency among children 6-59 months
Low birth weight
Fertility rate
Others
35
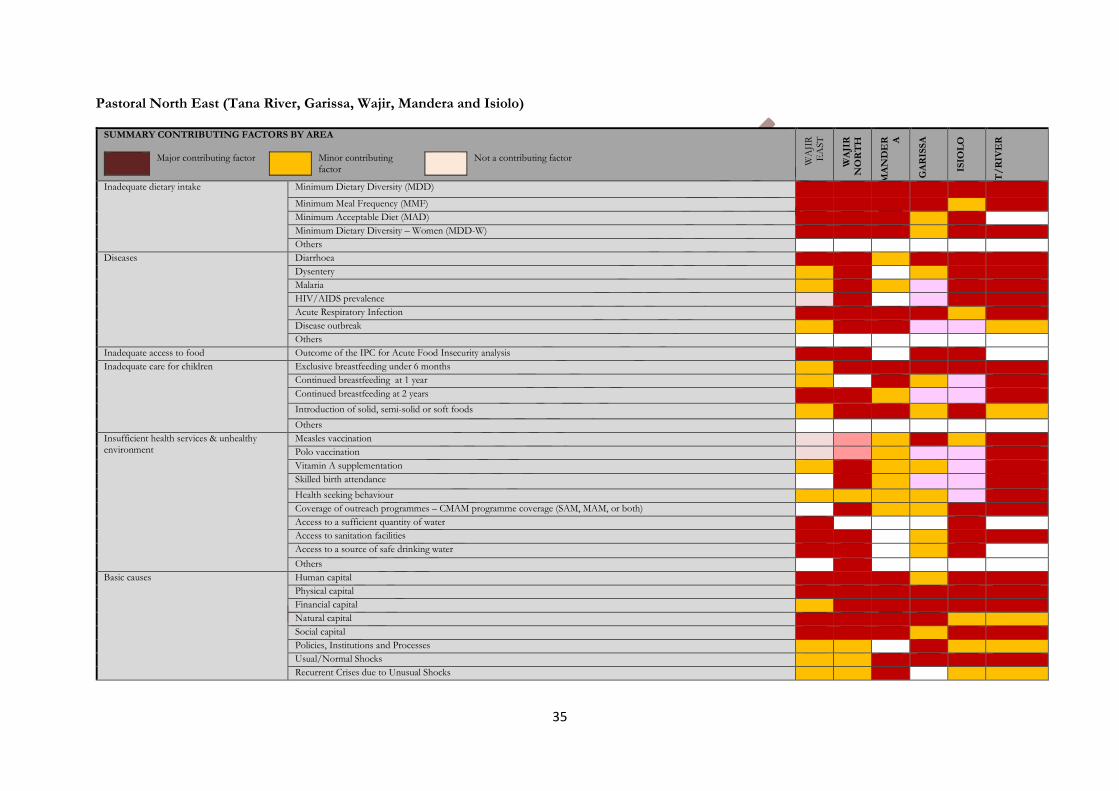
Pastoral North East (Tana River, Garissa, Wajir, Mandera and Isiolo)
SUMMARY CONTRIBUTING FACTORS BY AREA
Major contributing factor Minor contributing factor
Not a contributing factor
WA
JIR
E
AST
WA
JIR
N
OR
TH
MA
ND
ER A
GA
RIS
SA
ISIO
LO
T/
RIV
ER
Inadequate dietary intake
Minimum Dietary Diversity (MDD)
Minimum Meal Frequency (MMF)
Minimum Acceptable Diet (MAD)
Minimum Dietary Diversity – Women (MDD-W)
Others
Diseases
Diarrhoea
Dysentery
Malaria
HIV/AIDS prevalence
Acute Respiratory Infection
Disease outbreak
Others
Inadequate access to food Outcome of the IPC for Acute Food Insecurity analysis
Inadequate care for children Exclusive breastfeeding under 6 months
Continued breastfeeding at 1 year
Continued breastfeeding at 2 years
Introduction of solid, semi-solid or soft foods
Others
Insufficient health services & unhealthy environment
Measles vaccination
Polo vaccination
Vitamin A supplementation
Skilled birth attendance
Health seeking behaviour
Coverage of outreach programmes – CMAM programme coverage (SAM, MAM, or both)
Access to a sufficient quantity of water
Access to sanitation facilities
Access to a source of safe drinking water
Others
Basic causes
Human capital
Physical capital
Financial capital
Natural capital
Social capital
Policies, Institutions and Processes
Usual/Normal Shocks
Recurrent Crises due to Unusual Shocks
36
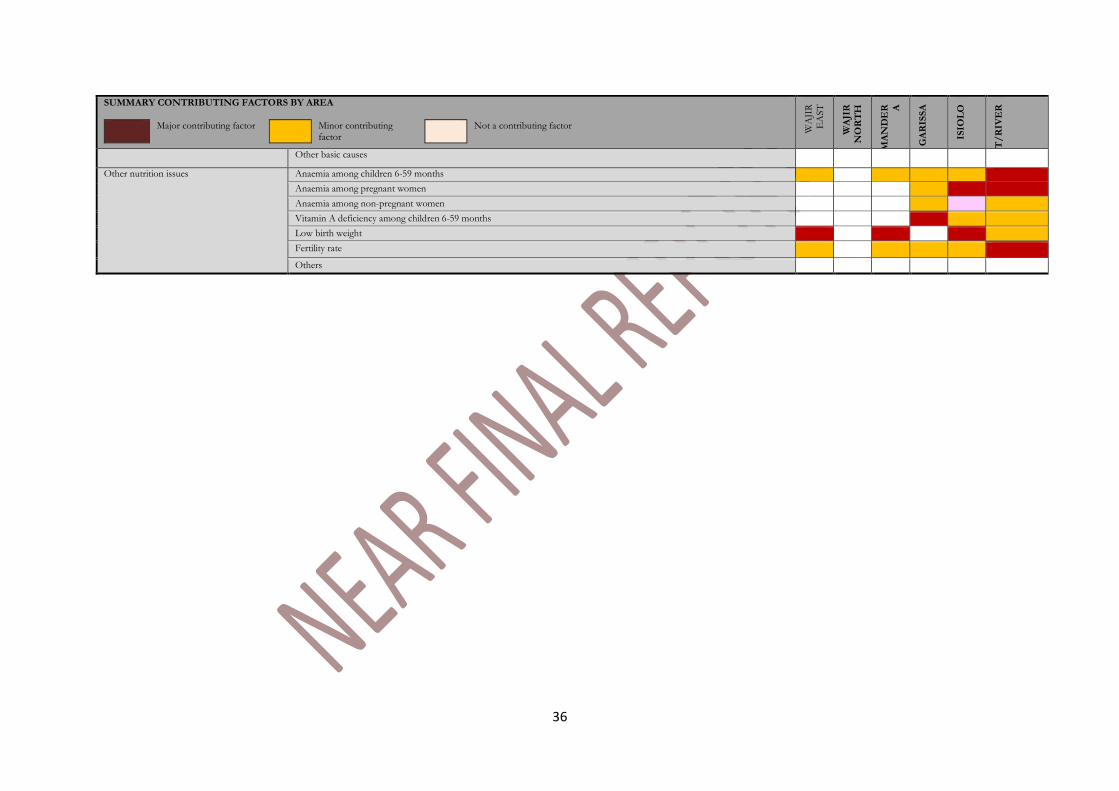
SUMMARY CONTRIBUTING FACTORS BY AREA
Major contributing factor Minor contributing factor
Not a contributing factor
WA
JIR
E
AST
WA
JIR
N
OR
TH
MA
ND
ER A
GA
RIS
SA
ISIO
LO
T/
RIV
ER
Other basic causes
Other nutrition issues
Anaemia among children 6-59 months
Anaemia among pregnant women
Anaemia among non-pregnant women
Vitamin A deficiency among children 6-59 months
Low birth weight
Fertility rate
Others
37
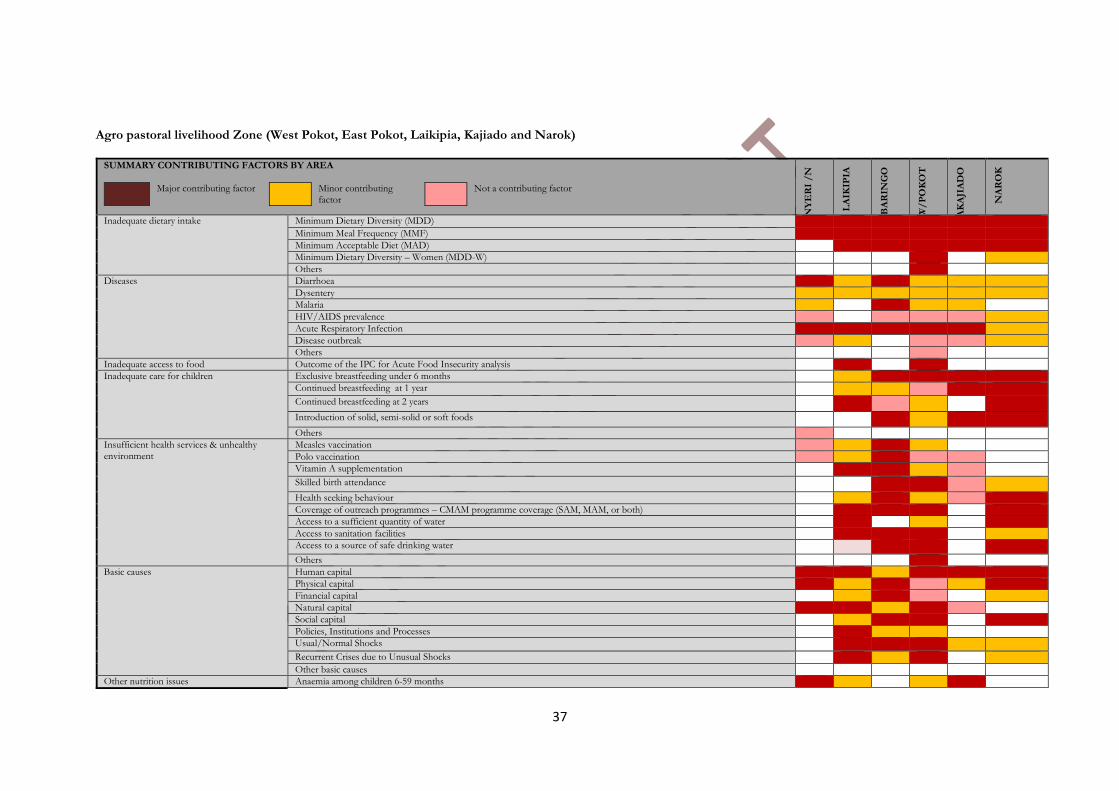
Agro pastoral livelihood Zone (West Pokot, East Pokot, Laikipia, Kajiado and Narok)
SUMMARY CONTRIBUTING FACTORS BY AREA
Major contributing factor Minor contributing factor
Not a contributing factor
NY
ER
I /
N
LA
IKIP
IA
BA
RIN
GO
W/
PO
KO
T
AK
AJI
AD
O
NA
RO
K
Inadequate dietary intake
Minimum Dietary Diversity (MDD)
Minimum Meal Frequency (MMF)
Minimum Acceptable Diet (MAD)
Minimum Dietary Diversity – Women (MDD-W)
Others
Diseases
Diarrhoea
Dysentery
Malaria
HIV/AIDS prevalence
Acute Respiratory Infection
Disease outbreak
Others
Inadequate access to food Outcome of the IPC for Acute Food Insecurity analysis
Inadequate care for children Exclusive breastfeeding under 6 months
Continued breastfeeding at 1 year
Continued breastfeeding at 2 years
Introduction of solid, semi-solid or soft foods
Others
Insufficient health services & unhealthy environment
Measles vaccination
Polo vaccination
Vitamin A supplementation
Skilled birth attendance
Health seeking behaviour
Coverage of outreach programmes – CMAM programme coverage (SAM, MAM, or both)
Access to a sufficient quantity of water
Access to sanitation facilities
Access to a source of safe drinking water
Others
Basic causes
Human capital
Physical capital
Financial capital
Natural capital
Social capital
Policies, Institutions and Processes
Usual/Normal Shocks
Recurrent Crises due to Unusual Shocks
Other basic causes
Other nutrition issues Anaemia among children 6-59 months
38
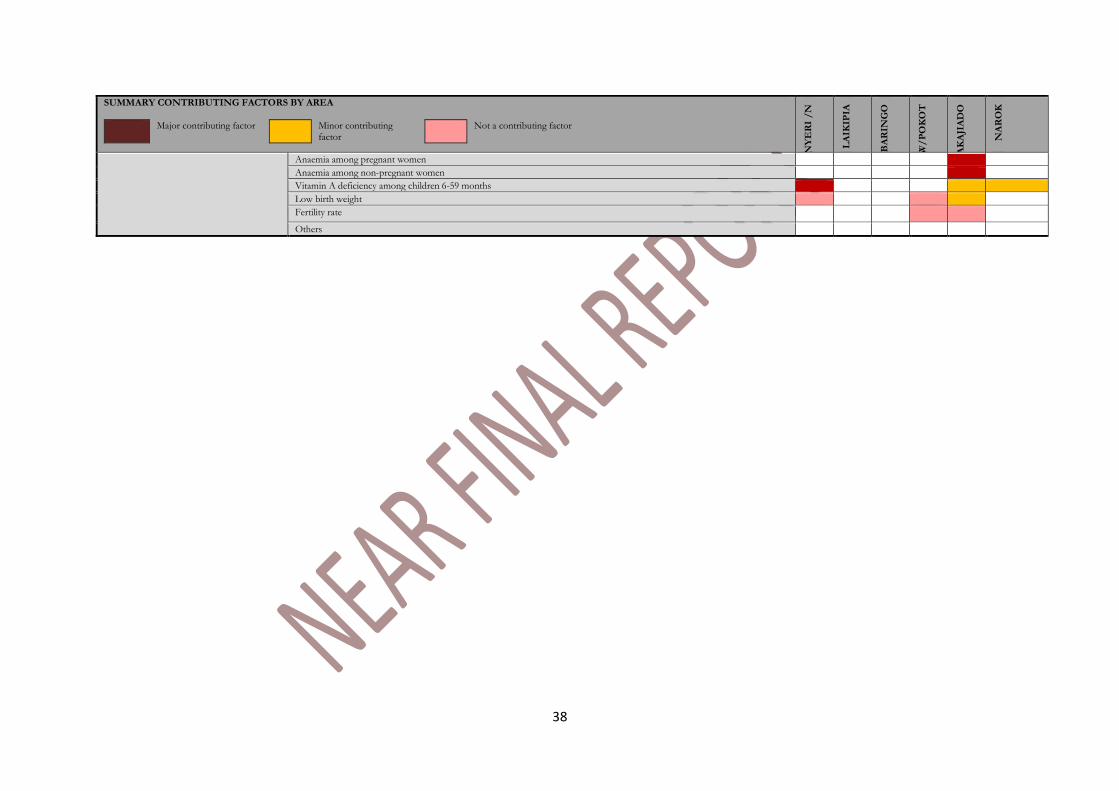
SUMMARY CONTRIBUTING FACTORS BY AREA
Major contributing factor Minor contributing factor
Not a contributing factor
NY
ER
I /
N
LA
IKIP
IA
BA
RIN
GO
W/
PO
KO
T
AK
AJI
AD
O
NA
RO
K
Anaemia among pregnant women
Anaemia among non-pregnant women
Vitamin A deficiency among children 6-59 months
Low birth weight
Fertility rate
Others

39
Appendix 4: LRA 2017 Workshop Agenda
INTEGRATED PHASE CLASSIFICATION (IPC) - NUTRITION ANALYSIS MEETING: Long Rains Assessment 17th to 26th July 2017, – Eagle Palace Hotel, Nakuru
Time Topic Facilitator
Sunday 16th July 2017 Arrival of all participants at Nakuru Travel date
Day 1 : Monday 17th July 2017
Moderator: Samuel Murage
8.00-8.15 Arrival and Registration All Participants
8.15-8.25 Introductions and climate setting Lucy K
8.25-8.40 Opening Remarks Head of Nutrition
8.40-8.50 Objectives
Lucy K 1. Introductions
Objectives June 2017.pptx
8.50-10.00 Overview of the IPC Nutrition Process
Lucy G
2. IPC for Acute
Malnutrition Overview June 2017.pptx
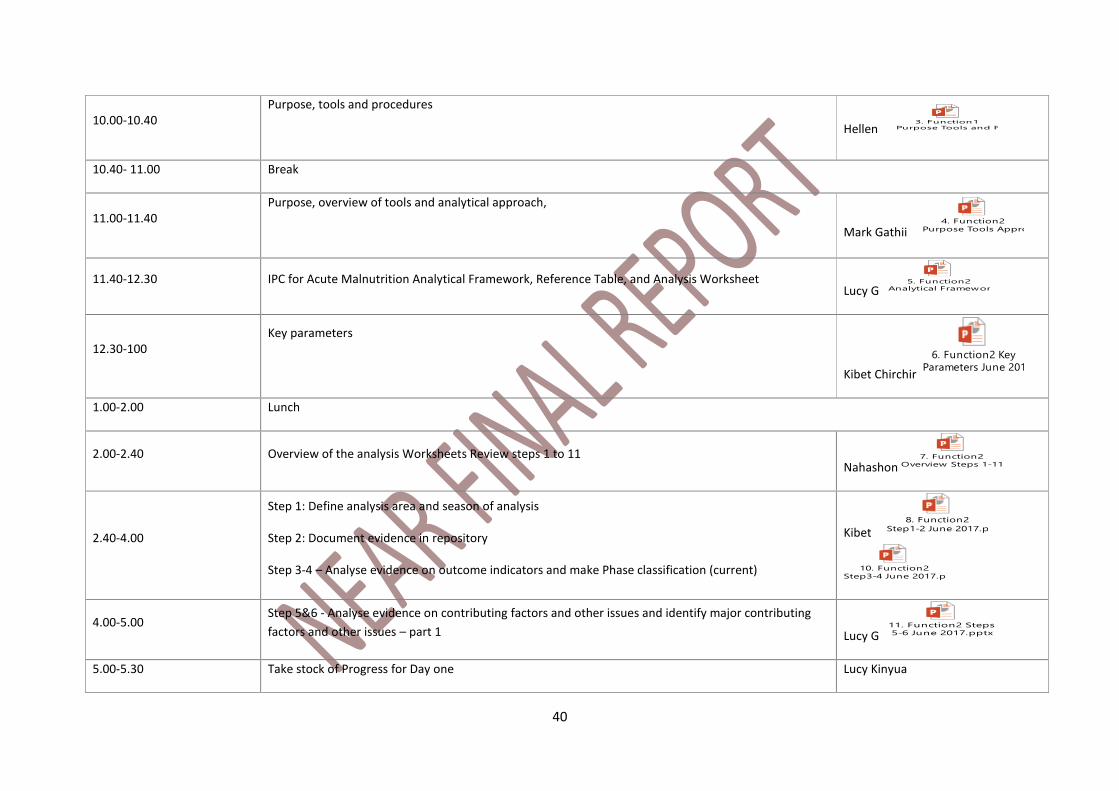
40
10.00-10.40 Purpose, tools and procedures
Hellen
3. Function1
Purpose Tools and Procedures June 2017.pptx
10.40- 11.00 Break
11.00-11.40 Purpose, overview of tools and analytical approach,
Mark Gathii 4. Function2
Purpose Tools Approach June 2017.pptx
11.40-12.30 IPC for Acute Malnutrition Analytical Framework, Reference Table, and Analysis Worksheet Lucy G
5. Function2
Analytical Framework, Reference Table and Analysis Worksheet June 2017.pptx
12.30-100 Key parameters
Kibet Chirchir
6. Function2 Key
Parameters June 2017.pptx
1.00-2.00 Lunch
2.00-2.40 Overview of the analysis Worksheets Review steps 1 to 11 Nahashon
7. Function2
Overview Steps 1-11 June 2017.pptx
2.40-4.00
Step 1: Define analysis area and season of analysis
Step 2: Document evidence in repository
Step 3-4 – Analyse evidence on outcome indicators and make Phase classification (current)
Kibet 8. Function2
Step1-2 June 2017.pptx
10. Function2
Step3-4 June 2017.pptx
4.00-5.00 Step 5&6 - Analyse evidence on contributing factors and other issues and identify major contributing
factors and other issues – part 1 Lucy G 11. Function2 Steps
5-6 June 2017.pptx
5.00-5.30 Take stock of Progress for Day one Lucy Kinyua
41
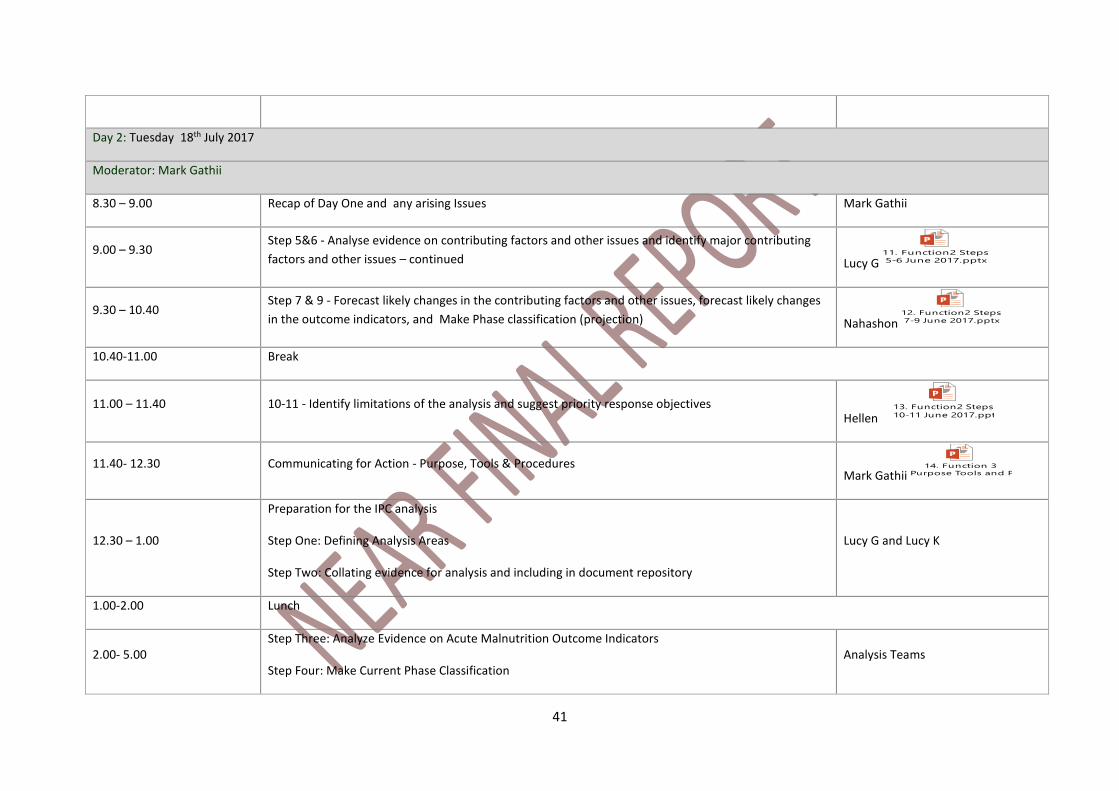
Day 2: Tuesday 18th July 2017
Moderator: Mark Gathii
8.30 – 9.00 Recap of Day One and any arising Issues Mark Gathii
9.00 – 9.30 Step 5&6 - Analyse evidence on contributing factors and other issues and identify major contributing
factors and other issues – continued Lucy G 11. Function2 Steps
5-6 June 2017.pptx
9.30 – 10.40 Step 7 & 9 - Forecast likely changes in the contributing factors and other issues, forecast likely changes
in the outcome indicators, and Make Phase classification (projection) Nahashon 12. Function2 Steps
7-9 June 2017.pptx
10.40-11.00 Break
11.00 – 11.40 10-11 - Identify limitations of the analysis and suggest priority response objectives Hellen
13. Function2 Steps
10-11 June 2017.pptx
11.40- 12.30 Communicating for Action - Purpose, Tools & Procedures Mark Gathii
14. Function 3
Purpose Tools and Procedures June 2017.pptx
12.30 – 1.00
Preparation for the IPC analysis
Step One: Defining Analysis Areas
Step Two: Collating evidence for analysis and including in document repository
Lucy G and Lucy K
1.00-2.00 Lunch
2.00- 5.00 Step Three: Analyze Evidence on Acute Malnutrition Outcome Indicators
Step Four: Make Current Phase Classification Analysis Teams
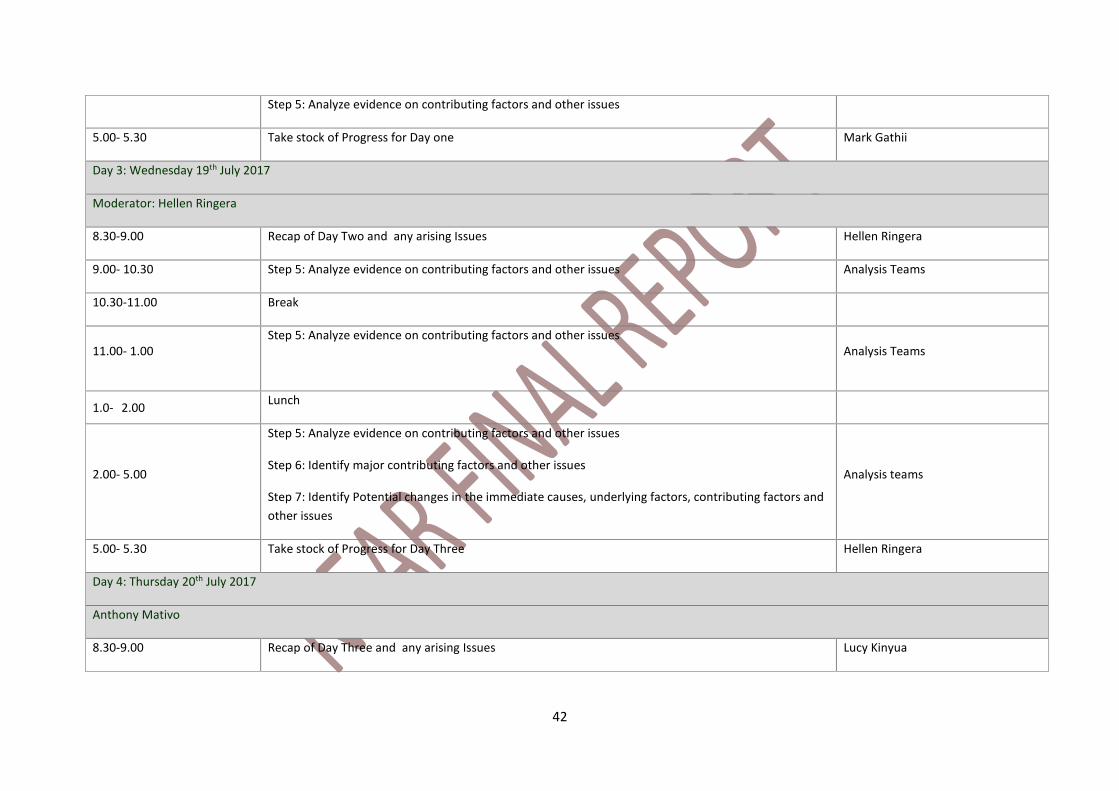
42
Step 5: Analyze evidence on contributing factors and other issues
5.00- 5.30 Take stock of Progress for Day one Mark Gathii
Day 3: Wednesday 19th July 2017
Moderator: Hellen Ringera
8.30-9.00 Recap of Day Two and any arising Issues Hellen Ringera
9.00- 10.30 Step 5: Analyze evidence on contributing factors and other issues Analysis Teams
10.30-11.00 Break
11.00- 1.00 Step 5: Analyze evidence on contributing factors and other issues
Analysis Teams
1.0- 2.00 Lunch
2.00- 5.00
Step 5: Analyze evidence on contributing factors and other issues
Step 6: Identify major contributing factors and other issues
Step 7: Identify Potential changes in the immediate causes, underlying factors, contributing factors and
other issues
Analysis teams
5.00- 5.30 Take stock of Progress for Day Three Hellen Ringera
Day 4: Thursday 20th July 2017
Anthony Mativo
8.30-9.00 Recap of Day Three and any arising Issues Lucy Kinyua
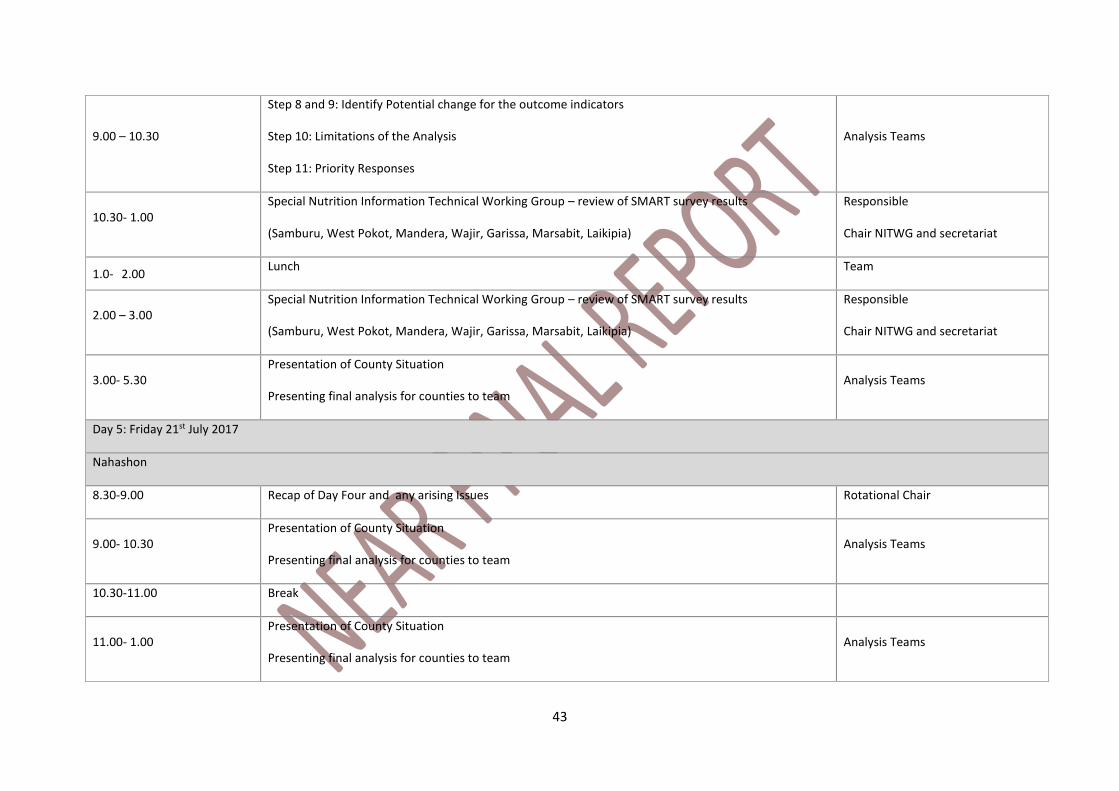
43
9.00 – 10.30
Step 8 and 9: Identify Potential change for the outcome indicators
Step 10: Limitations of the Analysis
Step 11: Priority Responses
Analysis Teams
10.30- 1.00 Special Nutrition Information Technical Working Group – review of SMART survey results
(Samburu, West Pokot, Mandera, Wajir, Garissa, Marsabit, Laikipia)
Responsible
Chair NITWG and secretariat
1.0- 2.00 Lunch Team
2.00 – 3.00 Special Nutrition Information Technical Working Group – review of SMART survey results
(Samburu, West Pokot, Mandera, Wajir, Garissa, Marsabit, Laikipia)
Responsible
Chair NITWG and secretariat
3.00- 5.30 Presentation of County Situation
Presenting final analysis for counties to team Analysis Teams
Day 5: Friday 21st July 2017
Nahashon
8.30-9.00 Recap of Day Four and any arising Issues Rotational Chair
9.00- 10.30 Presentation of County Situation
Presenting final analysis for counties to team Analysis Teams
10.30-11.00 Break
11.00- 1.00 Presentation of County Situation
Presenting final analysis for counties to team Analysis Teams
44
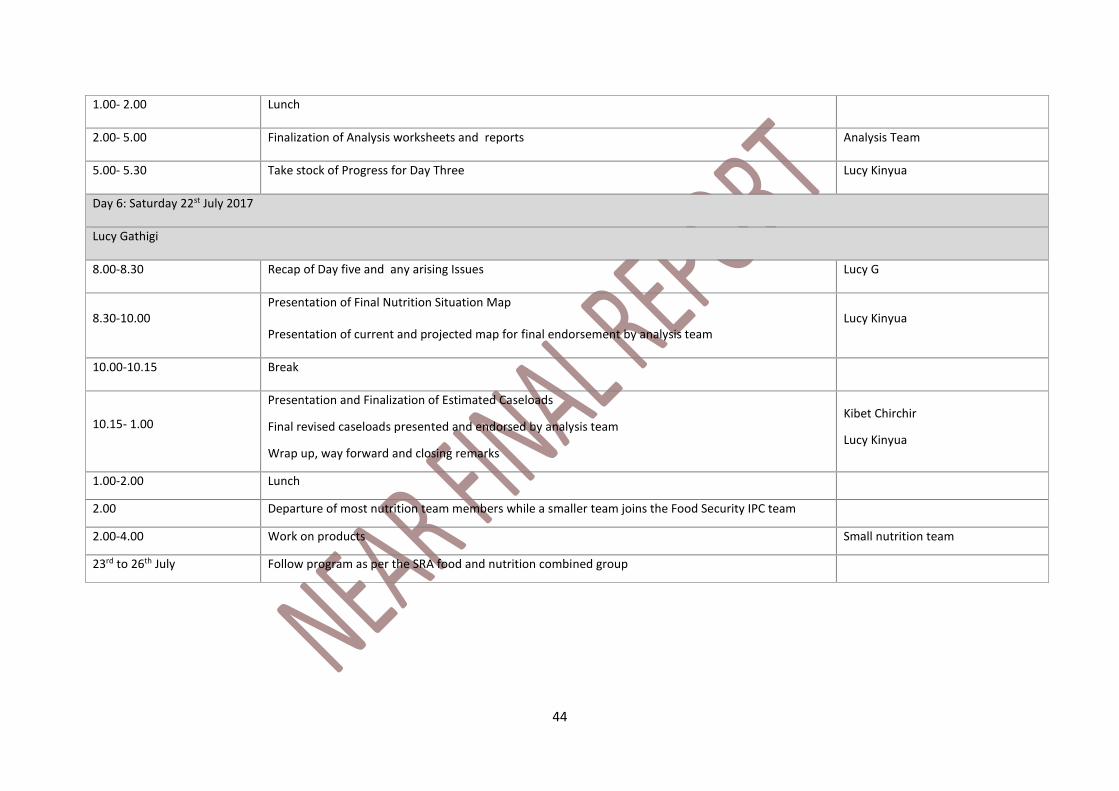
1.00- 2.00 Lunch
2.00- 5.00 Finalization of Analysis worksheets and reports Analysis Team
5.00- 5.30 Take stock of Progress for Day Three Lucy Kinyua
Day 6: Saturday 22st July 2017
Lucy Gathigi
8.00-8.30 Recap of Day five and any arising Issues Lucy G
8.30-10.00 Presentation of Final Nutrition Situation Map
Presentation of current and projected map for final endorsement by analysis team Lucy Kinyua
10.00-10.15 Break
10.15- 1.00
Presentation and Finalization of Estimated Caseloads
Final revised caseloads presented and endorsed by analysis team
Wrap up, way forward and closing remarks
Kibet Chirchir
Lucy Kinyua
1.00-2.00 Lunch
2.00 Departure of most nutrition team members while a smaller team joins the Food Security IPC team
2.00-4.00 Work on products Small nutrition team
23rd to 26th July Follow program as per the SRA food and nutrition combined group

45
Appendix 5: List of participants
NAME ORGANIZATION STATION
Lucy Kinyua Ministry of Health Nairobi
Samuel Murage Ministry of Health Nairobi
Lucy wangari Ministry of Health Nairobi
Simon Munene Ministry of Health Tharaka Nithi County
Hellen Ringera Ministry of Health Meru
Paul Migwi Ministry of Health Nyandarua
Khadija Ministry of Agriculture Nairobi
David Onchonga WASH Samburu county
Samwel Mbugua Egerton University Nakuru
Dansel Mulwa University of Nairobi Nairobi
Judith Munga Kenyatta University Nairobi
Jane Njenga University of Nairobi Nairobi
Wycliffe Machani Ministry of Health Turkana County
Saida Abdi Ministry of Health Isiolo County
Shale Abdi Ministry of Health Garissa County
Imran Madey Ministry of Health Mandela county
Pauline Mugo Ministry of Health Taita Taveta County
Lucy Maina Gathigi UNICEF Nairobi
Anthony Mativo World Vision Nairobi
Nahashon Kipruto Action Against Hunger Nairobi
Kibet Chirchir UNICEF Nairobi
Victoria mwenda UNICEF Nairobi
Shalini gudiri UNICEF Nairobi
Tom Hongo UNICEF Nairobi
Mark Gathii IMC Nairobi
Juda kimanzi TDH Nairobi
Sarah Ayodi Food for the Hungry Nairobi
Lydia Ndung’u Save the Children Nairobi
MOA (Joshua) Ministry of Agriculture Nairobi
Edward Kuto UNICEF Nairobi
Joseph waweru FEWSNET Nairobi
Dina Aburmishan WFP Nairobi
George NHPplus Nairobi
Irene Kimani FAO Nairobi
Francis Wambua UNICEF Nairobi
Michael NDMA Marsabit County