Embed Size (px)
Citation preview
Republic of India
Republic of IndiaData Collection and Confirmation Study
on Dairy Sector
Final Report
March 2018
Japan International Corporation Agency (JICA)
Kaihatsu Management Consulting, Inc.


Map of the Study Area (India)
Delhi
Gujarat
Assam
Uttar Pradesh
Madhya Pradesh
Bihar
Karnataka


i
Table of Contents
Chapter 1 Outline of the Study ..................................................................................................................... 1-1
1.1 Objective of the Study ............................................................................................................................ 1-1
1.2 Background of the Study ........................................................................................................................ 1-1
1.3 Study Area .............................................................................................................................................. 1-2
1.4 Study Implementation Plan .................................................................................................................... 1-2
1.5 Limitation of the Study .......................................................................................................................... 1-5
Chapter 2 Outline of the Dairy Sector and Related Sectors ....................................................................... 2-1
2.1 International Positioning of Indian Dairy Sector and Related Sectors ................................................... 2-1
2.2 Overview of the Dairy Sector and Related Sectors in India ................................................................... 2-5
2.3 Indian Government Policies and Principles in the Dairy Sector and Related Sectors .......................... 2-13
2.4 Value Chain in Dairy Sector and its Actors .......................................................................................... 2-28
Chapter 3 National Dairy Development Board ........................................................................................... 3-1
3.1 Organizational Structure ........................................................................................................................ 3-1
3.2 Financial Status ...................................................................................................................................... 3-5
3.3 Scheme for Supporting Cooperatives and Loan Condition .................................................................... 3-8
Chapter 4 Current Status of Dairy Cooperatives and Major Issues ......................................................... 4-1
4.1 Target Milk Unions of the Study and Selection Method ........................................................................ 4-1
4.2 Basic Descriptions of Dairy Cooperatives ............................................................................................. 4-3
4.3 Management and Financial Situation of Dairy Cooperatives ................................................................. 4-9
4.4 Sales and Marketing of Dairy Products by Cooperatives ..................................................................... 4-19
4.5 Processing ............................................................................................................................................ 4-24
4.6 Cold Chain ........................................................................................................................................... 4-30
4.7 Procurement of Milk ............................................................................................................................ 4-33
4.8 Cooperative Services to Members ........................................................................................................ 4-38
4.9 Investments and Finances of Dairy Cooperatives ................................................................................ 4-41
4.10 Summary ............................................................................................................................................. 4-45
Chapter 5 Current Status of Dairy Production and Rural Societies ......................................................... 5-1
5.1 Basic Description of Socioeconomic Situation Survey .......................................................................... 5-1
5.2 Ownership of Cattle and Buffalo and Dairy Production ........................................................................ 5-2
5.3 Rearing Management and Productivity .................................................................................................. 5-6
5.4 Household Incomes and Incomes from Livestock Activities ................................................................5-11
5.5 Sales of Milk ........................................................................................................................................ 5-14
5.6 Reasons for Becoming Dairy Cooperative Member or Not ................................................................. 5-18
5.7 Utilization of Loans and Insurance for Livestock Activities ................................................................ 5-19
5.8 Summary .............................................................................................................................................. 5-20

ii
Chapter 6 Current Food Safety Situation and Issues ................................................................................. 6-1
6.1 FSSAI and Regulatory Framework ........................................................................................................ 6-1
6.2 Current Food Safety Management Situation and Issues for Dairy Products .......................................... 6-3
6.3 Future Prospects ................................................................................................................................... 6-10
6.4 Summary ...............................................................................................................................................6-11
Chapter 7 Issues and Countermeasures in the Dairy Sector ...................................................................... 7-1
7.1 Current Situation of Dairy Sector ........................................................................................................... 7-1
7.2 Issues of Dairy Cooperatives .................................................................................................................. 7-6
7.3 Countermeasures .................................................................................................................................. 7-10
7.4 Consideration of Japanese Technologies and Experience .................................................................... 7-13

iii
List of Tables
Table 1-1 Selected state in each region for the study .................................................................................... 1-2
Table 1-2 The study team .............................................................................................................................. 1-3
Table 1-3 Overview of the field surveys ....................................................................................................... 1-4
Table 1-4 Places and Organizations visited during the field survey ............................................................. 1-4
Table 2-1 Top ten countries for milk production (cow and buffalo milk) in 2016 (Unit: 1,000 tons)........... 2-1
Table 2-2 Increase ratio of per capita milk consumption volume ................................................................. 2-2
Table 2-3 Self-sufficiency rate of dairy products .......................................................................................... 2-3
Table 2-4 Production volume, and estimation of share of cow and buffalo milk in 2016............................. 2-6
Table 2-5 Monthly per capita milk consumption (L) .................................................................................... 2-6
Table 2-6 Distribution of households and average number of cattle/buffalo holdings (2012) ...................... 2-9
Table 2-7 Livestock income by land holding ................................................................................................ 2-9
Table 2-8 Income sources of farmers by income quintile ........................................................................... 2-10
Table 2-9 Annual milk production of top 10 states (2015-16) .....................................................................2-11
Table 2-10 Milch animals per 100 households by land holding group (rural) ............................................ 2-13
Table 2-11 Financial outlay and fiscal achievement of the Operation Flood .............................................. 2-14
Table 2-12 Projection for milk production .................................................................................................. 2-16
Table 2-13 Gap analysis of dairy infrastructure under cooperative and private sectors.............................. 2-17
Table 2-14 Funding pattern of NPDD ......................................................................................................... 2-18
Table 2-15 Physical targets and achievements of NPDD ............................................................................ 2-19
Table 2-16 Outline of National Dairy Plan Phase 1 .................................................................................... 2-20
Table 2-17 Project development objective indicators of the plan ............................................................... 2-21
Table 2-18 Financial contribution of the DIDF ........................................................................................... 2-23
Table 2-19 Number of projects, project cost, and amount of grant released of the scheme ........................ 2-25
Table 2-20 Financial assistance pattern of NCDC schemes ........................................................................ 2-27
Table 2-21 Organization in charge of breeding in each state ...................................................................... 2-30
Table 2-22 Three-tier cooperative structure ................................................................................................ 2-32
Table 3-1 States covered by headquarters and each regional office .............................................................. 3-1
Table 3-2 Board of directors of the NDDB ................................................................................................... 3-2
Table 3-3 Number of officers and staff working for the NDDB as of September 2017 ................................ 3-4
Table 3-4 Groups providing supports to cooperatives and producer companies6 ......................................... 3-4
Table 3-5 Net profit after tax of the NDDB from 2010-11 to 2015-16 (in million rupees) .......................... 3-6
Table 3-6 Net profit after tax of the NDDB from 2010-11 to 2015-16 (in million rupee) ............................ 3-6
Table 3-7 Net profit after tax of the NDDB from 2010-11 to 2015-16 (in million rupees) .......................... 3-6
Table 3-8 Net profit after tax of the NDDB from 2010-11 to 2015-16 (in million rupees) .......................... 3-7
Table 3-9 Gross loan portfolio to total assets of the NDDB from 2010-11 to 2015-16 (in million rupees) .. 3-7

iv
Table 3-10 Gross loan portfolio to total asset of the NDDB from 2010-11 to 2015-16 (in million rupees) . 3-7
Table 3-11 Gross loan portfolio to total assets of the NDDB from 2010-11 to 2015-16 (in million rupees) 3-8
Table 3-12 Loan disbursements by the NDDB from 2007-08 to 2016-17 (in crore rupees) ......................... 3-8
Table 3-13 Statement of principal and interest repayments during last five years ........................................ 3-9
Table 3-14 Loan terms of short and long term loans provided by the NDDB .............................................. 3-9
Table 4-1 Target milk unions examined in the study .................................................................................... 4-1
Table 4-2 Basic facts on milk production, milk procurement, and sales by state cooperatives (2015-16) ... 4-3
Table 4-3 Historical progress of the number of organized DCS ................................................................... 4-4
Table 4-4 Basic description of MPCs............................................................................................................ 4-5
Table 4-5 Names of state federations for the target states and the brand names of the dairy products
produced by dairy cooperatives for each state .......................................................................................... 4-9
Table 4-6 Composition of the boards of directors of the state federations .................................................. 4-10
Table 4-7 Sales activities, facilities, and size of staff of state federations ...................................................4-11
Table 4-8 Profit and loss statement for GCMMF (Gujarat state federation) for 2015-16 (Rs.) .................. 4-12
Table 4-9 Profit and loss statement for MPCDF (Madhya Pradesh state federation) for 2015-16 (Rs.) ..... 4-12
Table 4-10 Net profit of PCF (Uttar Pradesh state federation) for each institution (2015-16) .................... 4-12
Table 4-11 Percentage of milk unions with accumulated deficits and profits by range of milk collection
volume (all India) in 2015/16.................................................................................................................. 4-15
Table 4-12 Financial indicators for selected milk unions and MPC (2016-2017) ...................................... 4-16
Table 4-13 Percentages of DCSs at each rank of financial performance .................................................... 4-17
Table 4-14 Number of registered and functional DCSs for the six states in 2016 ...................................... 4-17
Table 4-15 Profit and loss statement of Rahamatenagar DCS for 2015-16 ................................................ 4-18
Table 4-16 Profit and loss statement of Amarpur DCS for 2015-16 ........................................................... 4-19
Table 4-17 Sales performance of the dairy cooperatives of the six states ................................................... 4-21
Table 4-18 Major high value-added products procced by each brand of the dairy cooperatives ................ 4-22
Table 4-19 Ways of setting retail prices for products .................................................................................. 4-23
Table 4-20 Major dairy processing machinery and equipment ................................................................... 4-24
Table 4-21 Major manufacturers of machinery in India’s dairy sector ....................................................... 4-25
Table 4-22 Number of installation of major machinery .............................................................................. 4-26
Table 4-23 Approximate budget of plants (Rs. crore) ................................................................................. 4-27
Table 4-24 Existing condition of processing infrastructure of milk cooperatives ....................................... 4-28
Table 4-25 Year of installation of machinery .............................................................................................. 4-29
Table 4-26 Points to be improved by 5S in dairy plants ............................................................................. 4-30
Table 4-27 Milk cold chain ......................................................................................................................... 4-32
Table 4-28 Costs of cold chain items .......................................................................................................... 4-33
Table 4-29 Volumes of milk procurement by cooperatives and number of functional DCSs and their trends ... 4-34
Table 4-30 DCS coverage for selected states .............................................................................................. 4-36

v
Table 4-31 Ways of setting milk prices for cooperatives ............................................................................ 4-37
Table 4-32 Major member services provided by cooperatives in the five target states ............................... 4-40
Table 4-33 Examples of services provided by private dairy makers to farmers ......................................... 4-41
Table 4-34 Descriptions of major investments, their sources of finance, and future demand for credit ..... 4-43
Table 4-35 Positive and negative factors affecting the business performance of cooperatives ................... 4-48
Table 5-1 Sample size for each category of farmers and state ...................................................................... 5-1
Table 5-2 List of target villages in the socioeconomic situation survey ....................................................... 5-2
Table 5-3 Average number of cattle and buffalo holdings per household and distribution of cattle and buffalo
reared for each category of rural household .............................................................................................. 5-3
Table 5-4 Average number of bovine (cattle and buffalo) holdings per household for each category of rural
household and state ................................................................................................................................... 5-3
Table 5-5 Average number of cattle and buffalo per household .................................................................... 5-4
Table 5-6 Distribution of rural households in cattle and buffalo holdings .................................................... 5-4
Table 5-7 Average annual milk production volume per household (liter) ..................................................... 5-5
Table 5-8 Average annual milk sales volume per household (liter) .............................................................. 5-5
Table 5-9 Comparison of livestock holdings and milk production and sales ................................................ 5-6
Table 5-10 Average cow yield per day for major breeds in the target villages ............................................. 5-6
Table 5-11 Percentages of cows reared by farmers in the target villages by breed ....................................... 5-7
Table 5-12 Percentages of cows by breed for villages with and without DCSs ............................................ 5-7
Table 5-13 Average buffalo yields per day for major breeds in the target villages ....................................... 5-8
Table 5-14 Percentages of buffalos reared by farmers in the target villages by breed .................................. 5-8
Table 5-15 Percentages of farmers who use AI services to mate livestock ................................................... 5-8
Table 5-16 Percentages of institution use for AI services ............................................................................. 5-9
Table 5-17 Percentages of farmers who provide cattle feed to their livestock every day ............................. 5-9
Table 5-18 Percentages of farmers who buy cattle feed at DCS offices ..................................................... 5-10
Table 5-19 Average yields per cow and buffalo per day (liters) ...................................................................5-11
Table 5-20 Average household annual income (Rs.) ....................................................................................5-11
Table 5-21 Average household annual income from agriculture (Rs.) ........................................................ 5-12
Table 5-22 Average household annual income from livestock activities (Rs.) ........................................... 5-12
Table 5-23 Percentages of agricultural income against total income .......................................................... 5-13
Table 5-24 Percentages of livestock income against total income .............................................................. 5-13
Table 5-25 Comparison of average household annual incomes .................................................................. 5-14
Table 5-26 Percentages of dairy farmers by type of buyers for DCS members .......................................... 5-15
Table 5-27 Percentage of dairy farmers by type of buyer for non-members............................................... 5-15
Table 5-28 Percentages of dairy farmers by type of buyer for villages without DCSs ............................... 5-16
Table 5-29 Percentages of favored buyers .................................................................................................. 5-16
Table 5-30 Reasons why cooperative is the favorite buyer (number of farmers) ....................................... 5-17
vi
Table 5-31 Reasons why middleman is the favorite buyer (number of farmers) ........................................ 5-17
Table 5-32 Reasons why private dairy company is the favorite buyer (number of farmers) ...................... 5-18
Table 5-33 Reasons for becoming cooperative member ............................................................................. 5-18
Table 5-34 Reasons for not being a member of dairy cooperative .............................................................. 5-19
Table 5-35 Percentages of farmers who have used loans to purchase livestock ......................................... 5-19
Table 5-36 Percentages of insured cows and female adult buffaloes .......................................................... 5-20
Table 6-1 Amendment of milk standard in October 2017 ............................................................................. 6-1
Table 6-2 FSSAI administration ................................................................................................................... 6-2
Table 6-3 Number of issued licenses and registrations (2015-16), FSSAI staff, and laboratories ................ 6-3
Table 6-4 Results of sample survey in three states........................................................................................ 6-4
Table 6-5 Quality check of milk by milk unions ........................................................................................... 6-5
Table 6-6 Differences of food safety management of milk between organized and unorganized sector ...... 6-8
Table 6-7 Cleaning practices of farmers ....................................................................................................... 6-9
Table 6-8 Comparison on cleaning practices between village with DCS and without DCS ....................... 6-10
Table 7-1 Average yield per cow per day, ratio of high-yield breed, AI usage, and cattle feed provision .... 7-3
Table 7-2 Overall performance and factors of dairy cooperatives in the studied six states. ......................... 7-7
Table 7-3 Comparison among India, Japan and other major milk producing countries and areas .............. 7-15
Table 7-4 Major manufacturers and importers of dairy sector in Japan ...................................................... 7-18
vii
List of Figures
Figure 1-1 Implementation structure of the study ......................................................................................... 1-3
Figure 2-1 Per capita consumption volume of dairy products and global population ................................... 2-1
Figure 2-2 Per capita milk consumption volume (kg/year) ........................................................................... 2-2
Figure 2-3 Milk production volume in developed countries and developing countries (tons per year) ........ 2-2
Figure 2-4 Milk production volume in developing countries in each region (tons per year) ........................ 2-2
Figure 2-5 Price change of dairy products .................................................................................................... 2-3
Figure 2-6 Long-term trend of WMP’s international price ........................................................................... 2-3
Figure 2-7 Structural change of dairy sector in developing countries .......................................................... 2-4
Figure 2-8 Geographical distribution of livestock system ............................................................................ 2-5
Figure 2-9 Milk production volume in India................................................................................................. 2-6
Figure 2-10 Monthly per capita milk consumption in each expenditure criteria (liter) ................................ 2-6
Figure 2-11 Estimated daily per capita milk availability, population, and milk demand .............................. 2-7
Figure 2-12 Utilization pattern for milk and milk products (%) ................................................................... 2-7
Figure 2-13 Sales of milk and dairy products in 2016 and 2022 (million rupees) ........................................ 2-8
Figure 2-14 Import and export of dairy products in India............................................................................. 2-8
Figure 2-15 Number of NDP I approved projects ....................................................................................... 2-21
Figure 2-16 NDP I granted amounts (lakh rupees) ..................................................................................... 2-21
Figure 2-17 Shares of annual milk production volumes in states, NDP I grant amounts, .......................... 2-22
Figure 2-18 Outline of value chain in India ................................................................................................ 2-28
Figure 2-19 Outline of stakeholders in dairy sector in India....................................................................... 2-29
Figure 2-20 Average annual turnover and growth rates of nine major private companies .......................... 2-34
Figure 2-21 Total annual turnover and growth rates of milk unions ........................................................... 2-34
Figure 3-1 Organizational chart of the NDDB as of December 2017 ........................................................... 3-3
Figure 4-1 Locations of target unions ........................................................................................................... 4-2
Figure 4-2 Graphical representation of value chain of dairy products .......................................................... 4-7
Figure 4-3 Value chain of dairy products in Gujarat ..................................................................................... 4-7
Figure 4-4 Value chain of milk in Assam state.............................................................................................. 4-8
Figure 4-5 Relation between accumulated profit/loss and milk procurement volumes (all unions) ........... 4-14
Figure 4-6 Relation between accumulated profit/loss and milk procurement volumes (six target states) .. 4-14
Figure 4-7 Typical route of milk collection ................................................................................................ 4-32
Figure 4-8 Monthly volumes of milk procurement for Patna milk union and Varanasi milk union ........... 4-35
Figure 5-1 Proportion of each source of income to total income for large and medium farmers ............... 5-13
Figure 5-2 Proportion of each source of income to total income for small and marginal farmers .............. 5-13
Figure 5-3 Proportion of each source of income to total income for tenants and landless ......................... 5-13
Figure 6-1 “Pink Book” Do and don’t buy of milk and milk products ......................................................... 6-2

viii
Figure 6-2 FSSAI’s online systems and SNS ............................................................................................... 6-3
Figure 6-3 Organizational chart of Bhopal milk union ................................................................................. 6-6
Figure 6-4 Educational material of the NDDB ............................................................................................. 6-8
Figure 7-1 Outline of this section ................................................................................................................. 7-1
Figure 7-2 Virtuous cycle at village level ..................................................................................................... 7-4
Figure 7-3 Virtuous cycle at dairy cooperative and village level .................................................................. 7-5
Figure 7-4 Vicious cycle at dairy cooperative level ...................................................................................... 7-8
Figure 7-5 Summary of challenges and countermeasures ............................................................................7-11
Figure 7-6 Number of dairy animals per household and number of dairy farmers in Japan ....................... 7-14
Figure 7-7 The milk quality test and checks at various stage ..................................................................... 7-16

ix
Abbreviation AI Artificial Insemination A to C Assistance to Cooperatives AMCU Automatic Milk Collection Unit AMUL Anand Milk Union Ltd./ Gujarat Cooperative Milk Marketing Federation Ltd. BAMUL Bangalore Cooperative Milk Union BIS Bureau of Indian Standard BMC Bulk Milk Cooler CAMUL Cachar and Karimganj District Milk Producers Cooperative Society Limited CEO Chief Executive Officer CIP Cleaning in Process COMFED Bihar State Milk Cooperative Federation DAC Development Assistance Committee DCS Dairy Cooperative Society DD Dairy Development DEDS Dairy Entrepreneurship Development Scheme DIDF Dairy Processing and Infrastructure Development Fund DoAH Directorate of Animal Husbandry DoAHDF Department of Animal Husbandry, Dairying and Fisheries DoDD Directorate of Dairy Development DPMCU Data Processor Milk Collection Unit DPR Detailed Project Report DSCR Debt Service Coverage Ratio EAMUL East Assam Milk Producers’ Cooperative Union Ltd. EEC European Economic Community EIA End Implementing Agency ETP Effluent Treatment Plant EU European Union FAO Food and Agriculture Organization of the United Nations FBO Food Business Operator FMD Foot-and-Mouth Disease FSSAI Food Safety and Standards Authority of India FSSC Food Safety System Certification GCMMF Gujarat Cooperative Milk Marketing Federation Ltd. GDP Gross Domestic Product GoI Government of India HACCP Hazard Analysis and Critical Control Points HF Holstein-Friesian HTST High Temperature Short Time IAS Indian Administrative Service ICT Information and Communication Technology IDDP Integrated Dairy Development Program IDFA International Dairy Foods Association IDMC Indian Dairy Machinery Company IMARC International Market Analysis Research & Consulting INR Indian Rupee

x
ISO International Standard Organization IT Information Technology ITDP Integrated Tribal Development Project JICA Japan International Cooperation Agency JMF Jharkhand Milk Federation KMF Karnataka Cooperative Milk Producers’ Federation LLPD Lakh Liter Per Day MPCDF Madhya Pradesh State Cooperative Dairy Federation Ltd. MAITRI Multi-Purpose AI Technician in Rural India MoFPI Ministry of Food Processing Industries MoSPI Ministry of Statistics and Programme Implementation MPC Milk Producer Company MPCE Monthly Per Capita Expenditure MPI Milk Producers Institute MPP Milk Pooling Point MT Metric Ton MU Milk Union NABARD National Bank for Agriculture and Rural Development NAP National Action Plan NCCD National Center for Cold Chain Development NCDC National Cooperative Development Corporation NCR National Capital Region ND Non-Descriptive NDDB National Dairy Development Board NDP National Dairy Plan NDS NDDB Dairy Services NGO Non-Governmental Organization NOC No Objection Certificate NPBB National Program for Bovine Breeding NPCBB National Project for Cattle and Buffalo Breeding NPDD National Program for Dairy Development NSSO National Sample Survey Office ODA Official Development Assistance OECD Organization for Economic Cooperation and Development PCF Pradeshik Cooperative Dairy Federation Ltd. PSU Public Sector Undertaking RKVY Rashtriya Krishi Vikas Yojana ROA Return on Asset ROE Return on Equity Rs. Rupees SC Scheduled Caste SHG Self Help Group SIQ-CMP Strengthening Infrastructure for Quality and Clean Milk Production SMP Skim Milk Powder SNF Solid Non-Fat SNS Social Network Service

xi
ST Scheduled Tribe TKgPD Thousand Kilogram Per Day TLPD Thousand Liter Per Day UHT Ultra High Temperature WAMUL West Assam Milk Producers’ Cooperative Union Ltd. WFP World Food Programme WHO World Health Organization WMP Whole Milk Powder
INR 1 (Rs. 1) = JPY 1.649040
USD 1 = JPY 106.787
(As of March 2018)
1 lakh = 100,000
1 crore = 10,000,000

1-1
Chapter 1 Outline of the Study 1.1 Objective of the Study
The objectives of this study are to analyze the dairy sector in India, from both industrial organization and socioeconomic perspectives by examining the dairy sector’s socioeconomic contribution to farmers, its value chain structure, its related actors, and the movement of the private sector, to identify and analyze the problems of the sector, and in turn evaluate the validity of the effectiveness of Japanese support of the dairy sector.
1.2 Background of the Study
The volume of milk production in India has reached 156 million tons, accounting for 18% of total global production. The livestock sector’s ratio of value added to India’s GDP has been increasing, from 13.9% in 1980 to 25.6% in 2000 to 32.9% in 2014, at which time 70% of value added of the livestock sector is attributed to the dairy sector. Additionally, the ratio of expenditure on milk and dairy products to household’s total expenditure between 1977 and 2007 increased from 11.9 % to 14.9% in rural areas and from 15.9% to 18.4% in urban areas. Milk production and processing is a highly important industry in India and, as the Indian economy and urbanization are expected to expand, the demand for dairy products is forecasted to increase. The pressure to increase milk production to satisfy growing demand is, thus, a crucial issue.
In India, Operation Flood, a dairy development project, was implemented with the support of the World Bank and other development agencies between the 1970s and 1996. The institution that implemented the project was the National Dairy Development Board (NDDB), and the project attempted to increase the volume of milk production by extending the model of Anand Milk Union Ltd. (Amul). As the dairy cooperatives that modeled Amul extended to various regions, it led to an increase in milk production and the establishment of value chains extending from the production to the processing and sales of milk. On the other hand, the entries of private companies in the dairy sector have started since the Government of India adopted the economic liberalization policy in 1991. The collection volume of milk by the private companies is thought to exceed that of cooperatives now; the dairy sector in India is at a turning point.
From the aspect of milk production in India, the intensification of production has not progressed; the percentage of farmers who own more than four milking cows/buffaloes is only 8%. Furthermore, 70% of total milk production is by small farmers with fewer than 2 ha of landholdings. Compared to agricultural activities, which are significantly influenced by climate and whose harvest yields and income opportunities are limited, dairy activities, which can be undertaken for ten months in a year, can be a stable source of income. For these small farmers who have limited amounts of assets, livestock can be not only a source of cash income but also an asset which stabilizes their livelihood; thus, the importance of dairy activities is greater for poor farmers.
However, fresh milk easily deteriorates and avoiding the proliferation of bacteria requires

1-2
sterilization and disinfection followed by immediate refrigeration after milking. Thus, dairy farmers in remote areas who do not have access to refrigeration facilities have difficulties selling their milk to urban areas with high demand for milk, and the market access to the formal market is a crucial issue for dairy farmers who do not deal with cooperatives and private dairy companies. Under these circumstances, there is a high perceived need for the establishment of dairy products’ value chains through the establishment of cold chain facilities and sustaining of dairy products’ processing capacity. Additionally, there is also a need to improve productivity for the improvement of livelihoods of farmers through the development of the dairy sector. Based on these situations, the Government of India requested the Japanese government to implement the project “Dairying Through Cooperatives” as an international yen loan project. 1.3 Study Area
One state from each region was selected based on discussions among JICA, the Government of India, and the study team as shown in Table 1-1. In addition to Uttar Pradesh, Karnataka, Bihar, Madhya Pradesh, and Assam, Gujarat state, which has well-developed dairy cooperative system, is also selected as a study area.
Table 1-1 Selected state in each region for the study Region State
Norther region Uttar Pradesh Southern region Karnataka Eastern region Bihar Western region Madhya Pradesh North Eastern region Assam
Source: The study team
1.4 Study Implementation Plan 1.4.1 Technical Principles of the Study
The following four points are established as the technical principles of this study.
(1) The study will analyze the dairy sector from both industrial and socioeconomic aspects.
(2) There are some regions where the dairy sector is highly developed and, on the other hand, regions that face serious problems in developing the sector. The study includes Gujarat, which has an advanced dairy sector, and compares it with other five target states, which are not as advanced as Gujarat, and then analyzes the applicability, bottleneck and limitations of dairy cooperatives all over India.
(3) In India, the central and state governments and NDDB, a government institution, play important roles in the dairy sector. Additionally, since 2011-12, the National Dairy Plan (NDP) has been implemented with the support of the World Bank in which the NDDB is an implementing institution. Thus, the study will analyze the current conditions of central and state governments, NDDB, and NDP in order to examine the direction of future support and appropriate support approaches.
(4) Based on the results of (1), (2), and (3) above, this study will identify and analyze the problems of the dairy sector in India and then, based on the country assistance policy of JICA and applicable
1-3
Japanese technology in India, will examine the countermeasures to the problems, as well as the potential, effectiveness, and appropriateness for and effectiveness of the support extended from Japan to this sector.
1.4.2 Study Team
The study team consists of the following four members.
Table 1-2 The study team Name Field of
responsibility Contents of task
Fumiko Ikegaya
Team Leader/Value Chain and Marketing
Team management, coordination with JICA, consideration on the direction of JICA’s support, consultation with the Indian government concerning study results, value chain survey, collect information from the central government / state government, and NDDB, review of NDP and DPR (Assist the expert in charge of “Dairy/Institutional Analysis”)
Yukio Ikeda Dairy and Institutional Analysis
Survey of actual cooperatives (state level and district level) Socioeconomic situation survey (includes management of subcontractor) (Assist the expert in charge of "Team Leader/Value Chain and Marketing")
Desai Prakash Pralhadarao
Food Processing Equipment and Cold Chain
Survey on status of food processing equipment and cold chain (Assist the expert in charge of "Food Hygiene and Food Processing") Management of field survey (interview request, local logistics and others)
Tomoyuki Tajitsu
Food Hygiene and Food Processing
Survey on status of food hygiene and food processing (Assist the expert in charge of "Food Processing Equipment and Cold Chain")
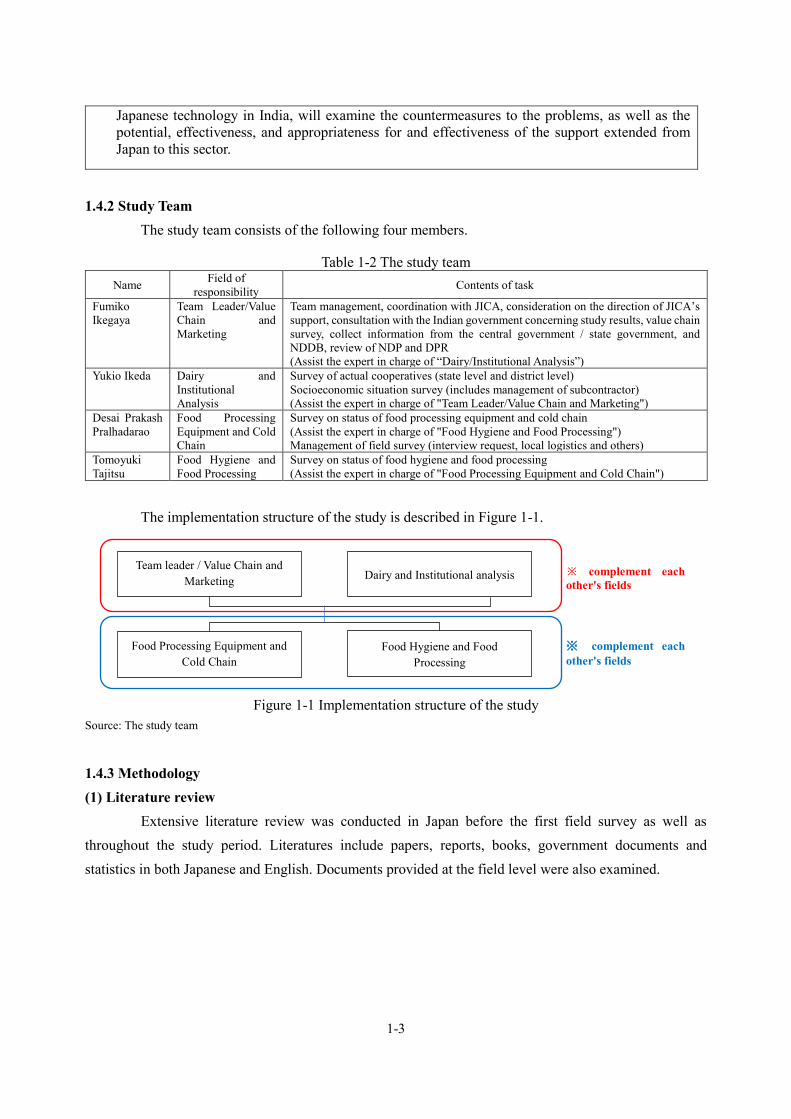
The implementation structure of the study is described in Figure 1-1.
Figure 1-1 Implementation structure of the study
Source: The study team
1.4.3 Methodology (1) Literature review
Extensive literature review was conducted in Japan before the first field survey as well as throughout the study period. Literatures include papers, reports, books, government documents and statistics in both Japanese and English. Documents provided at the field level were also examined.
Team leader / Value Chain and Marketing Dairy and Institutional analysis
Food Processing Equipment and Cold Chain
Food Hygiene and Food Processing
※ complement each other's fields
※ complement each other's fields

1-4
(2) Field Survey 1) Schedule
Three field surveys were conducted during the study period as summarized in Table 1-3
Table 1-3 Overview of the field surveys The first field survey The second field survey The third field survey
Period September 17 to October 9 November 5 to December 3 February 4 to February 11
States visited Delhi, Gujarat, Bihar Assam, Karnataka, Madhya Pradesh, Uttar
Pradesh, Delhi
Delhi, Gujarat
Note: A team member extended his stay of the first field survey in India by October 14, and came back on October 29 for the second field survey to prepare the subcontracted survey (the socioeconomic situation survey).
Source: The study team
2) Places and Organizations visited during the field survey
The study team planned to visit government departments and agencies of both the Government of India and state government, dairy cooperatives, private dairy companies, stakeholders of unorganized sector. Places and organizations visited during the field survey in each state are summarized in Table 1-4.
Table 1-4 Places and Organizations visited during the field survey
State Places and organizations Delhi Government: DoAHDF, FSSAI, MoFPI, NCCD
Private: Param Dairy Donor: World Bank
Gujarat Government: DoDD, Gujarat Livestock Development Board, Food Safety Commissioner, NDDB, IDMC Cooperative: GCMMF/Amul, Kaira MU, Banaskantha MU, Gandhinagar MU, and their DCS
Bihar Government: DoAH, Livestock Development Agency, Food Safety Office Cooperative: CONFED, Patna Dairy, Samastipur MU, their DCS Private: Natural Dairy, Anuj Dairy Loose milk market near Patna railway station
Assam Government: DoAH, DoDD, Food Safety Office, State government owned plant, Town Milk Scheme Cooperative: WAMUL, EAMUL, their DCS, Progress DCS Private: Blueberry Industry, Kamrupa Dairy, their DCS Retail shops, Large scale farmer
Karnataka Government: DoAH/Karnataka Livestock Development Agency, Food Safety Office, Cooperative: KMF, Bangalore MU, Gulbarga MU, their DCS Private: Workshop with Karnataka Dairy Association’s member (7 companies attended), Gokul Dairy, Heritage Retail shops
Madhya Pradesh
Government: DoAH, Livestock Development Agency, Food Safety Office Cooperative: MPCDF, Bhopal MU, Indore MU, Jabarpur MU, and their DCS Private: Shubham, Mahindra, Anik Retail shops/Loose milk shops
Uttar Pradesh
Government: DoAH, Uttar Pradesh Livestock Development Board, DoDD, Food Safety Office Cooperative: PCF, Lucknow MU, Kampur MU, Varanasi MU, Meerut MU, Saahaj PC, and their DCS Private: Gyan, Namaste India, Paras, Ananda Retail shops/State loose milk market
Source: The study team
1-5
(3) Sub-contracted Survey A socioeconomic situation survey was conducted to elucidate the current dairy activities and
livelihoods of dairy farmers and the social and economic contributions made by cooperatives to them. The total sample of the survey comprises 1,171 households (75 to 85 households in each village) and the survey was subcontracted to Indian research company. (4) Stakeholder Workshop
A stakeholder workshop was held during the second field survey in Karnataka as inviting member companies of the Karnataka State Dairy Association to hear opinions of private dairy companies. 1.5 Limitation of the Study The study does not cover all states and thus has limitation in terms of geographical comprehensiveness
of the finding. The study does not cover details of all milk unions in visited states because of time limitation, thus has
limitation in terms of coverage of milk unions in each state. The study mainly covers milk procurement, processing, and selling of dairy cooperatives and excludes
production. Needs and issues identified at production level were not studied in detail due to the framework of the study.


2-1
Chapter 2 Outline of the Dairy Sector and Related Sectors 2.1 International Positioning of Indian Dairy Sector and Related Sectors 2.1.1 Milk Production Volume
Milk production (cow and buffalo milk) in India is the world’s largest, totaling 155 million tons in 2016 and accounting for more than 19.2% of global production (see Table 2-1). The share of the livestock sector out of India’s agricultural GDP was 13.9% in 1980-81, which increased to 25.6% in 2000-01 and 26.9% in 2014-15 at current prices. India’s dairy sector accounts for about 70% of its livestock industry, making it an important sector in the country. 2.1.2 Increasing Demand
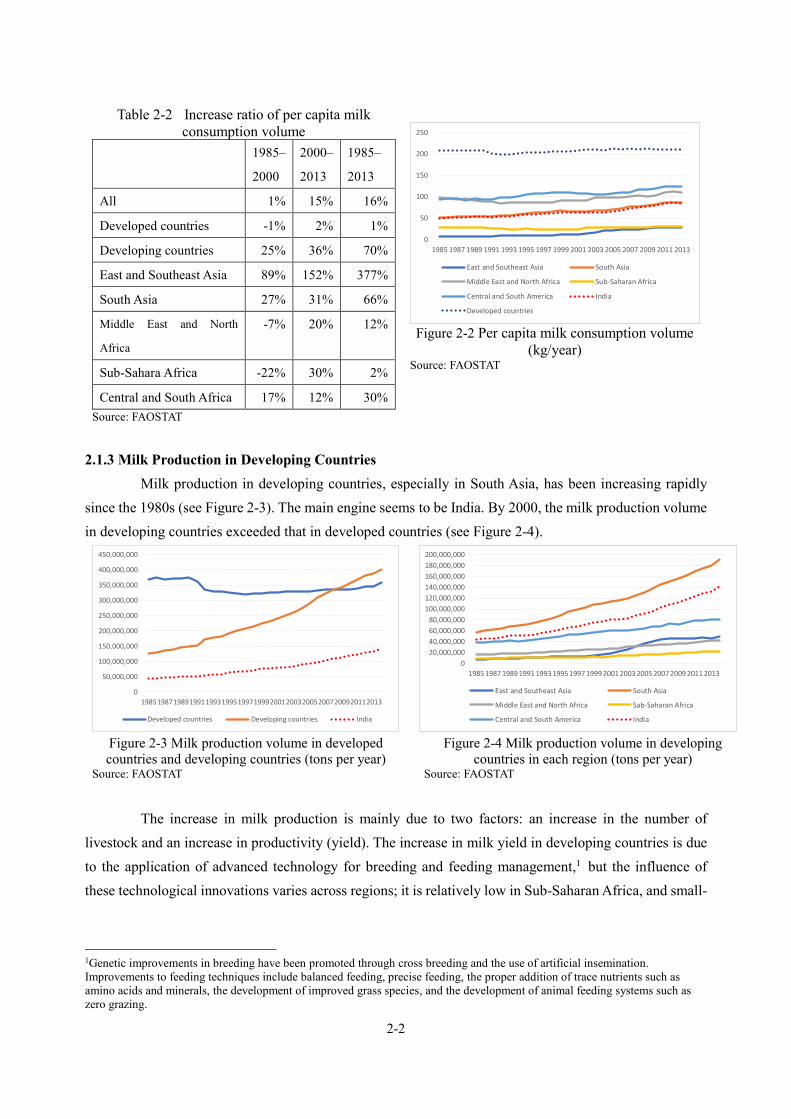
The global demand for dairy products is rapidly increasing, as both the per capita consumption of dairy products and population increase. Dairy consumption per capita is increasing worldwide, as shown in Figure 2-1. This trend is particularly strong in developing countries, where the consumption of dairy products has increased significantly in the last 30 years. Table 2-2 shows the rate of increase in the per capita consumption of milk between 1985 and 2013. During this period, per capita consumption in developed countries remained almost unchanged, while a 70% increase occurred in developing countries, especially in East and Southeast Asia and South Asia. The consumption of dairy products had been low in these regions; consumption per capita may have increased as income levels improved, and urbanization expanded.
Figure 2-2 depicts the per capita milk
consumption trends in developed and developing
countries by area. Although the increase in per capita
milk consumption volume in developing countries is higher than that in developed countries, the per capita milk
consumption volume in developing countries is smaller than that in developed countries. This indicates that the
per capita milk consumption volume in developing countries will likely keep increasing.
Table 2-1 Top ten countries for milk production (cow and buffalo milk) in 2016
(Unit: 1,000 tons)
Country Milk production
Ratio
1 India 155,416 19.2% 2 U.S. 96.359 11.9% 3 China 40,285 5.0% 4 Pakistan 38,789 4.8% 5 Brazil 32,672 4.0% 6 Germany 30,495 3.8% 7 Russia 30,495 3.8% 8 France 24,482 3.0% 9 New Zealand 21,672 2.7%
10 Turkey 16,842 2.1% Total 810,436 100%
Source: FAOSTAT
Figure 2-1 Per capita consumption volume of dairy products and global population
Source: International Dairy Foods Association (IDFA) (2016) The world dairy situation 2016
2-2
Table 2-2 Increase ratio of per capita milk consumption volume
1985–
2000
2000–
2013
1985–
2013
All 1% 15% 16%
Developed countries -1% 2% 1%
Developing countries 25% 36% 70%
East and Southeast Asia 89% 152% 377%
South Asia 27% 31% 66%
Middle East and North
Africa
-7% 20% 12%
Sub-Sahara Africa -22% 30% 2%
Central and South Africa 17% 12% 30% Source: FAOSTAT
Figure 2-2 Per capita milk consumption volume
(kg/year) Source: FAOSTAT
2.1.3 Milk Production in Developing Countries
Milk production in developing countries, especially in South Asia, has been increasing rapidly since the 1980s (see Figure 2-3). The main engine seems to be India. By 2000, the milk production volume in developing countries exceeded that in developed countries (see Figure 2-4).
Figure 2-3 Milk production volume in developed countries and developing countries (tons per year)
Source: FAOSTAT
Figure 2-4 Milk production volume in developing
countries in each region (tons per year) Source: FAOSTAT
The increase in milk production is mainly due to two factors: an increase in the number of livestock and an increase in productivity (yield). The increase in milk yield in developing countries is due to the application of advanced technology for breeding and feeding management,1 but the influence of these technological innovations varies across regions; it is relatively low in Sub-Saharan Africa, and small-
1Genetic improvements in breeding have been promoted through cross breeding and the use of artificial insemination. Improvements to feeding techniques include balanced feeding, precise feeding, the proper addition of trace nutrients such as amino acids and minerals, the development of improved grass species, and the development of animal feeding systems such as zero grazing.
0
50
100
150
200
250
1985 1987 1989 1991 1993 1995 1997 1999 2001 2003 2005 2007 2009 2011 2013
East and Southeast Asia South Asia
Middle East and North Africa Sub-Saharan Africa
Central and South America India
Developed countries
0
50,000,000
100,000,000
150,000,000
200,000,000
250,000,000
300,000,000
350,000,000
400,000,000
450,000,000
198519871989199119931995199719992001200320052007200920112013
Developed countries Developing countries India
0
20,000,000
40,000,000
60,000,000
80,000,000
100,000,000
120,000,000
140,000,000
160,000,000
180,000,000
200,000,000
1985 1987 1989 1991 1993 1995 1997 1999 2001 2003 2005 2007 2009 2011 2013
East and Southeast Asia South Asia
Middle East and North Africa Sab-Saharan Africa
Central and South America India
2-3
scale farmers find it more difficult to apply new technologies than large-scale farmers do.2 2.1.4 Self-sufficiency Rate of Dairy Products
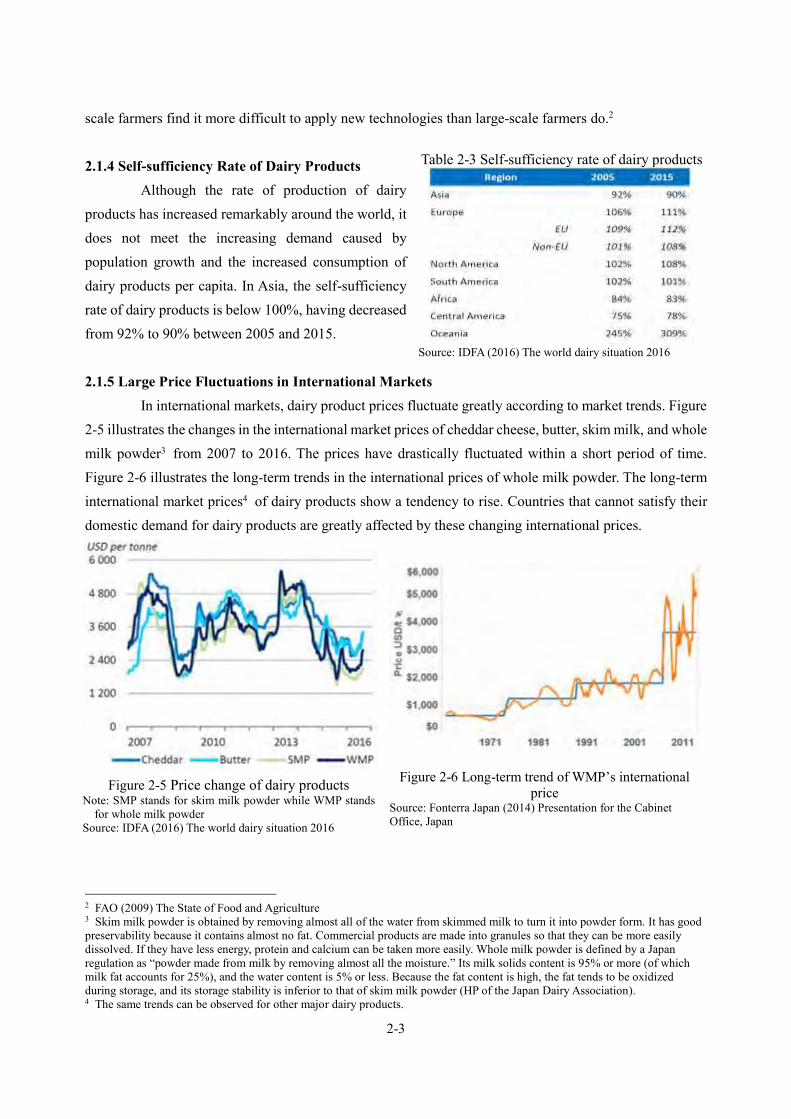
Although the rate of production of dairy products has increased remarkably around the world, it does not meet the increasing demand caused by population growth and the increased consumption of dairy products per capita. In Asia, the self-sufficiency rate of dairy products is below 100%, having decreased from 92% to 90% between 2005 and 2015. 2.1.5 Large Price Fluctuations in International Markets
In international markets, dairy product prices fluctuate greatly according to market trends. Figure 2-5 illustrates the changes in the international market prices of cheddar cheese, butter, skim milk, and whole milk powder3 from 2007 to 2016. The prices have drastically fluctuated within a short period of time. Figure 2-6 illustrates the long-term trends in the international prices of whole milk powder. The long-term international market prices4 of dairy products show a tendency to rise. Countries that cannot satisfy their domestic demand for dairy products are greatly affected by these changing international prices.
Figure 2-5 Price change of dairy products
Note: SMP stands for skim milk powder while WMP stands for whole milk powder
Source: IDFA (2016) The world dairy situation 2016
Figure 2-6 Long-term trend of WMP’s international price
Source: Fonterra Japan (2014) Presentation for the Cabinet Office, Japan
2 FAO (2009) The State of Food and Agriculture 3 Skim milk powder is obtained by removing almost all of the water from skimmed milk to turn it into powder form. It has good preservability because it contains almost no fat. Commercial products are made into granules so that they can be more easily dissolved. If they have less energy, protein and calcium can be taken more easily. Whole milk powder is defined by a Japan regulation as “powder made from milk by removing almost all the moisture.” Its milk solids content is 95% or more (of which milk fat accounts for 25%), and the water content is 5% or less. Because the fat content is high, the fat tends to be oxidized during storage, and its storage stability is inferior to that of skim milk powder (HP of the Japan Dairy Association). 4 The same trends can be observed for other major dairy products.
Table 2-3 Self-sufficiency rate of dairy products
Source: IDFA (2016) The world dairy situation 2016

2-4
2.1.6 Structure of Dairy Sector in Developing Countries Urbanization and increased incomes in
developing countries has resulted in a large demand for processed and packaged dairy products, leading to the emergence of dairy companies with sophisticated processing technology and distribution networks. The market share of top companies in the dairy industry averages 15% for milk and 17% for cheese.5 Oligopolies by a small number of dairy companies can be observed in both developed and developing countries. Along with the modernization of distribution, many developing countries have seen large-scale commercial dairy farmers emerging in urban areas.6
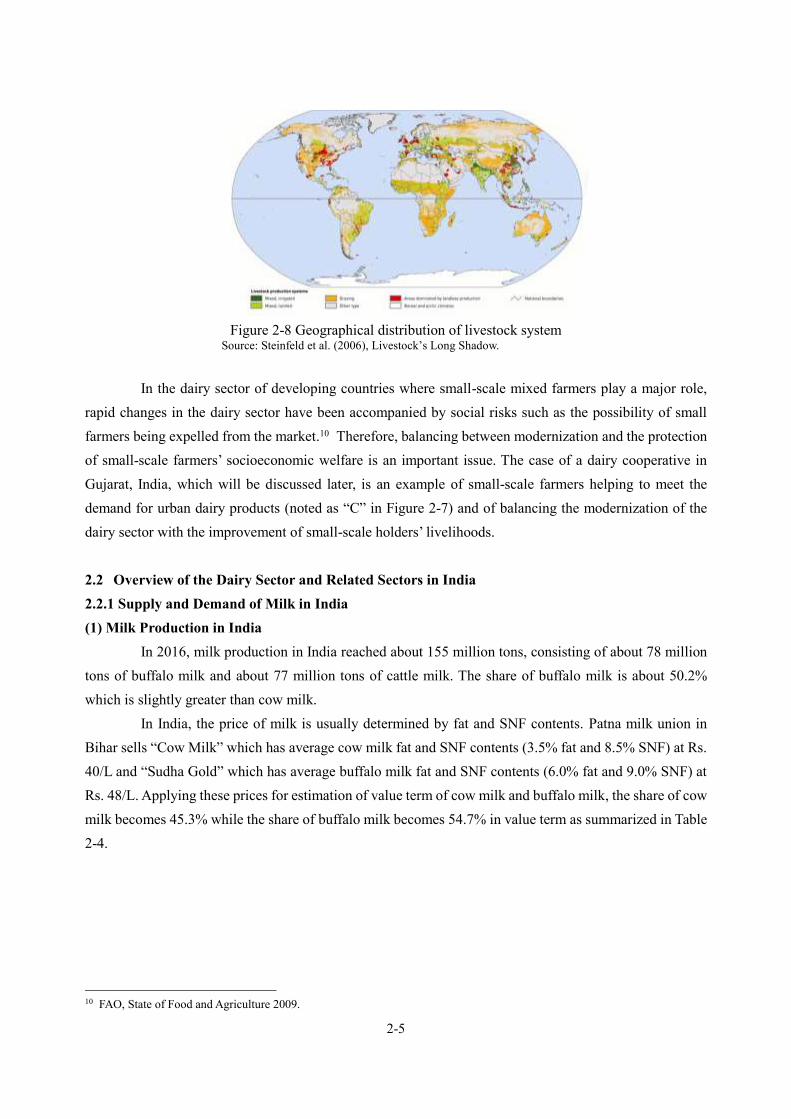
Thus, the dairy sectors of developing countries have seen a drastic structural change from a combination of small-scale mixed farming systems7 and traditional distribution to a combination of large-scale industrial production systems and modern distribution (see Figure 2-7). However, despite the trends described above, small mixed farming and traditional distribution systems continue to play a major role in the dairy sectors of many developing countries. 8 Figure 2-8 shows the geographical distribution of livestock systems. Some developing countries include areas where landless industrial production systems predominate (red colored areas); in many areas, mixed farming systems (yellow-green colored areas) predominate.9
5 Euromonitor International 2015. 6 In China, for example, 27% of dairy farms had over 100 animals in 2008, but this increased to 37% in 2012 (Chinese Livestock Yearbook). 7 There are several livestock systems. The grazing system is an extensive system with quality grassland that is excluded from crop cultivation. The mixed farming system is a combination of crop cultivation and livestock rearing, mainly involving small and marginal farmers. Industrial farming is a system in which 90% or more of fodder is purchased by others. This is often intensive farming and occurs near large cities. 8 According to Steinfeld et al. (2006), 70% of the world’s cattle and buffalo are reared in the mixed farming system (this is the average between 2001 and 2003), and 34% of the milk produced in India (excluding self-consumption in rural areas, which accounts for 59.3% of the milk circulating through traditional channels) is distributed through traditional channels. 9 The role of dairy for small-scale farmers is not limited to income and food production from livestock; it also serves as an important safety net, such as an asset or collateral for borrowing money, the production of fertilizer, and as a tiller and means of transportation for small-scale farmers engaged in mixed farming (FAO, State of Food and Agriculture 2009).
Mod
ern
dist
ribut
ion
C B
Trad
ition
aldi
strib
utio
n
A D
Small-scale mixedfarming system
Large-scale industrialproduction system
Livestock system
Dis
tribu
tion
syst
em
Figure 2-7 Structural change of dairy sector
in developing countries
2-5
Figure 2-8 Geographical distribution of livestock system
Source: Steinfeld et al. (2006), Livestock’s Long Shadow.
In the dairy sector of developing countries where small-scale mixed farmers play a major role,
rapid changes in the dairy sector have been accompanied by social risks such as the possibility of small farmers being expelled from the market.10 Therefore, balancing between modernization and the protection of small-scale farmers’ socioeconomic welfare is an important issue. The case of a dairy cooperative in Gujarat, India, which will be discussed later, is an example of small-scale farmers helping to meet the demand for urban dairy products (noted as “C” in Figure 2-7) and of balancing the modernization of the dairy sector with the improvement of small-scale holders’ livelihoods. 2.2 Overview of the Dairy Sector and Related Sectors in India 2.2.1 Supply and Demand of Milk in India (1) Milk Production in India
In 2016, milk production in India reached about 155 million tons, consisting of about 78 million tons of buffalo milk and about 77 million tons of cattle milk. The share of buffalo milk is about 50.2% which is slightly greater than cow milk.
In India, the price of milk is usually determined by fat and SNF contents. Patna milk union in Bihar sells “Cow Milk” which has average cow milk fat and SNF contents (3.5% fat and 8.5% SNF) at Rs. 40/L and “Sudha Gold” which has average buffalo milk fat and SNF contents (6.0% fat and 9.0% SNF) at Rs. 48/L. Applying these prices for estimation of value term of cow milk and buffalo milk, the share of cow milk becomes 45.3% while the share of buffalo milk becomes 54.7% in value term as summarized in Table 2-4.
10 FAO, State of Food and Agriculture 2009.

2-6
Figure 2-9 Milk production volume in India
(1961 -2016) (million ton) Source: FAOSTAT
Table 2-4 Production volume, and estimation of share
of cow and buffalo milk in 2016
Production
volume (mil. tons)
Price (Rs/kg)
Value (Rs. mil.)
% of production volume
% of value
Cow 77.4 40 3,097 49.8% 45.3%
Buffalo 78.0 48 3,744 50.2% 54.7%
Total 155.4
6,841 100.0% 100.0%
Source: FAOSTAT and the study team
(2) Increasing Consumption
As in other developing countries, the consumption of dairy products has increased in India due to factors such as population growth, income growth, and an increased per capita consumption of dairy products due to urbanization. How to satisfy the increased domestic milk demand caused by population increase, urbanization, and income improvement is a crucial issue.
Monthly milk consumption per capita in 2011-12 was 4.333 L in rural areas and 5.422 L in urban areas; milk consumption is higher in urban areas than in rural areas. Monthly milk consumption per capita has been increasing year by year. Monthly milk consumption per capita in 2011-12 increased by 12.1% in rural areas and 6.2% in urban areas over the 2004-05 rates. Milk consumption is expected to increase further in rural areas as incomes increase. Figure 2-10 depicts the relation between monthly household expenditure per capita and milk consumption volume per capita. It shows that people with higher monthly per capita expenditure (MPCE) consume more milk.
Table 2-5 Monthly per capita milk
consumption (L) Year Rural Urban
2004–05 3.866 5.107 2009–10 4.117 5.358 2011–12 4.333 5.422
Source: Ministry of Statistics and Programme Implementation (MoSPI) (2011-12) Key Indicators of Household Consumer Expenditure in India
Figure 2-10 Monthly per capita milk consumption
in each expenditure criteria (liter) Source: MoSPI (2011-12) Key Indicators of Household
Consumer Expenditure in India
020406080
100120140160
1961
1965
1969
1973
1977
1981
1985
1989
1993
1997
2001
2005
2009
2013
Cow Buffalo Total
0
2
4
6
8
10
12
Rural Urban

2-7
The Government of India has estimated that daily per capita milk availability will increase from 337 g in 2015-16 to 590 g in 2033-34.
Figure 2-11 Estimated daily per capita milk availability, population, and milk demand
Source: DoAHDF (2017) Vision 2024, National Action Plan for Dairy Development
Figure 2-12 depicts the current utilization pattern for milk and milk products. The figure shows
that about 52.10% of milk is used in liquid form, and the rest is processed into dairy products such as ghee, Khoya, and other products.
Figure 2-12 Utilization pattern for milk and milk products (%)
Source: IMARC (2017) Dairy Industry in India 2017 edition
Figure 2-13 depicts the current situation of and forecast (2022) for the milk and dairy products
market. It shows that sales of both milk and dairy products are expected to more than double by 2022.
0200400600800
1,0001,2001,4001,6001,800
g/da
y, m
illio
n, m
ilion
ton
year
Per capita demand (g/day) Populatin (million) Demand (million ton)
Liquid milk, 52.10
Ghee, 12.30
Khoa, 9.10
Dairy sweets, 7.60
Paneer, 5.80
Curd, 4.30 Butter, 3.30
Ice cream, 1.80
Dairy whitener, 1.10 others, 2.60

2-8
Figure 2-13 Sales of milk and dairy products in 2016 and 2022 (million rupees)
Source: IMARC (2017) Diary Industry in India 2017 edition
(3) Balance of Supply and Demand
As shown in Figure 2-9, milk production in India has steadily increased. Examining dairy import and export amounts (see Figure 2-14) shows that the export volume of dairy products began to increase and exceeded import volume in the 2000s. The import amount exceeded the export amounts of dairy products in 2009 and 2010. However, this was caused by government intervention to preserve strategically dairy products such as powder milk to manage temporary deficit due to adverse impact of the monsoon. Therefore, it can be said that India has been fulfilling the domestic demand of dairy products since 2000s.
However, as mentioned above, the domestic demand per capita is estimated to increase. The international market may be affected if India temporarily becomes underproduced or oversupplied and then procures or distributes from/to the international market because of the huge size of India’s market. When India turns into a milk-importing country, it not only destabilizes the Indian domestic market and the social and economic stability of India’s rural society, but it also affects other dairy-importing countries that rely on international markets11. It is thus very important that India satisfies its domestic market consistently. 2.2.2 Milk Producers
The proportion of India’s rural households consisting of small farmers (with 2 ha or less of land
holding) totals more than 90% and represents the majority of farmers (see Table2-6). The number of cattle and
buffalo reared by landless, marginal, and small farmers totals almost 80%. Marginal farmers who hold 0.002 to 11 Japan currently has been fulfilling domestic demand of milk and has been controlling milk production volume not to occur oversupply of milk. Therefore, the change in international market would not directly affect Japanese market much. However, when Japan has surplus or deficit of milk because of weather condition or spread of diseases, it needs to sell or buy milk or dairy products from international market. At the time, the fluctuation of the international market may affect to Japanese market.
Liquid milk, 7,579,482
Liquid milk, 3,154,320
UHT milk, 124,473
UHT milk, 31,466
Curd, 1,366,216
Curd, 579,152
Ghee, 3,479,920
Ghee, 1,519,113
Dairy sweets, 1,077,440
Dairy sweets, 478,138
Khoya, 1,128,488
Khoya, 531,180
Others, 1,612,232
Others, 617,406
0 5,000,000 10,000,000 15,000,000 20,000,000
2022
2016
Figure 2-14 Import and export of dairy products
in India Source: FAOSTAT
0200400600800
1,0001,2001,400
1961
1965
1969
1973
1977
1981
1985
1989
1993
1997
2001
2005
2009
2013
Qty
(Tho
usan
d to
nnes
)
Import Export

2-9
1 ha of land rear about 57.67% of the cattle and buffalo, while small farmers who hold 1 to 2 ha of land rear
20.45% of them. In addition, it is estimated that landless, marginal, and small farmers produce nearly 70% of
the milk produced in India.12
Table 2-6 Distribution of households and average number of cattle/buffalo holdings (2012) Land holding criteria Landless Marginal Small Medium Large Total
(Land holding: ha) (-0.002ha) (0.002-1ha) (1-2ha) (2-10ha) (10ha-)
Household distribution (%) 7.4 75.4 10.0 6.9 0.2 100.0
Average cow/buffalo holding (head) 1.6 1.5 2.6 3.6 4.4 1.8
Livestock holding distribution (%) 0.03 57.67 20.45 20.40 1.46 100.00
Note: “Household distribution” indicates how many percent of households are classified into each criterion and “livestock holding distribution” indicates how many percent of livestock are hold in each criterion.
Source: MoSPI (2013) Livestock Ownership in India, 2013
Table 2-7 below shows the ratio of livestock income to gross income among farmers’ households. It
shows that livestock income is an important income source, accounting for 12% of household income for all
farmers. The smaller the land size, the greater the contribution of livestock income to gross income. The landless
household have averagely Rs. 4,561 per month and 26% of income (Rs. 1,186 per month) are generated by
livestock. Assuming the average household member is 4.8, their daily income is Rs.31.7 per day per capita which
is just above the poverty line of Rs. 27.2 per day per capita. Without income from livestock (Rs. 1,186 per month
per household which is estimated to Rs. 8.2 per day per capita), they would fall down under the poverty line.
Livestock activities play a particularly important role in the livelihoods of smaller-income households.
Table 2-7 Livestock income by land holding
Percentage out of gross income Landless Marginal Small Medium Large Total
Income from wages/salary out 64% 46% 24% 13% 3% 32%
Cultivation 1% 31% 57% 72% 86% 48%
livestock income 26% 13% 11% 9% 6% 12%
Non-farm business 10% 10% 8% 5% 4% 8%
Monthly income (Rs.) 4,561 4,734 7,348 10,730 21,774 6,426
Source: MoSPI (2013) Income, Expenditure, Productive Assets and Indebtedness of Agricultural Households in India, 2013
In India, land is expensive for small, marginal and landless farmers and the price has been increasing13.
In the situation where buying land is not easy, dairy animals are important as a property for stabilizing the
livelihoods of small-scale farmers, so they have great socio-economic significance.14
12 Birthal, Linking Smallholder Livestock Producers to Markets, 2008. 13 Interviews at the villages and with dairy cooperatives 14 According to the National Sample Survey Organization (2002), the disparity in land assets holding among farmers is extremely large, but the disparity in livestock assets holdings is very low (Poverty and asset distribution inequality in rural India, 2009).
2-10
2.2.3 Contribution of Dairy Sector to Poverty Alleviation As mentioned in the above section, majority of milk producers are small, marginal, and landless
farmers. Some studies concluded that dairy plays an important poverty alleviation role in India based on the below estimation. (1) Poverty Line
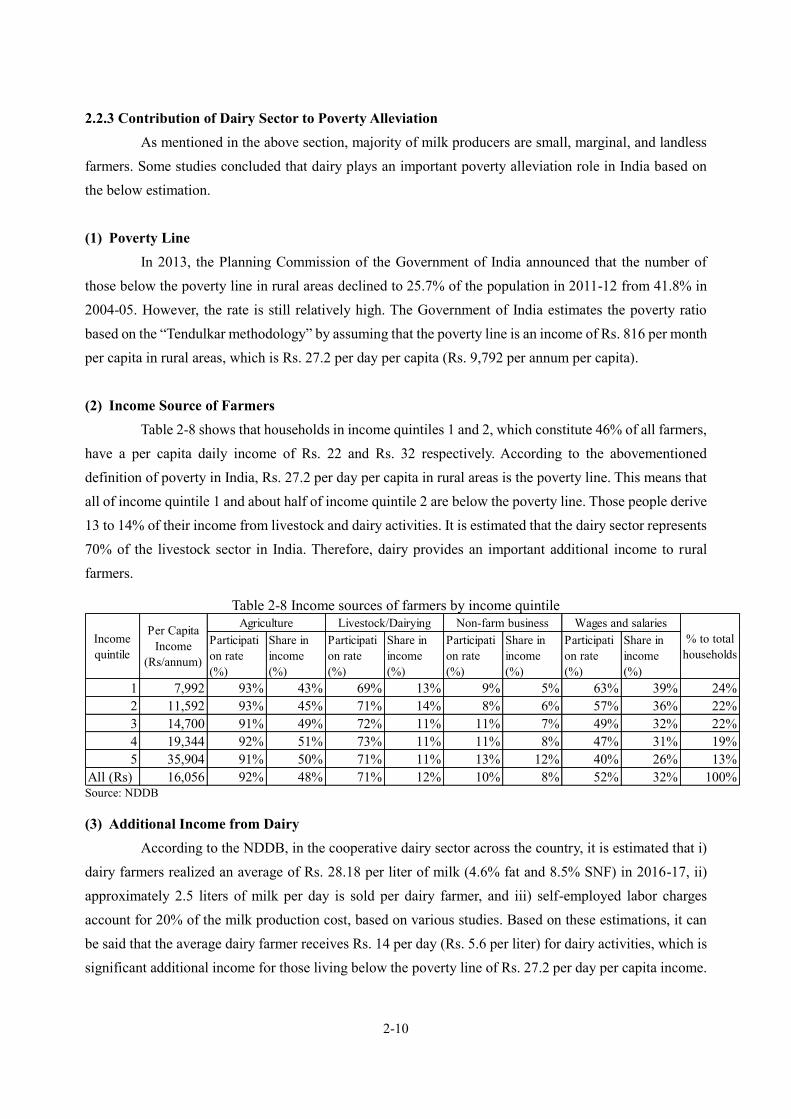
In 2013, the Planning Commission of the Government of India announced that the number of those below the poverty line in rural areas declined to 25.7% of the population in 2011-12 from 41.8% in 2004-05. However, the rate is still relatively high. The Government of India estimates the poverty ratio based on the “Tendulkar methodology” by assuming that the poverty line is an income of Rs. 816 per month per capita in rural areas, which is Rs. 27.2 per day per capita (Rs. 9,792 per annum per capita). (2) Income Source of Farmers
Table 2-8 shows that households in income quintiles 1 and 2, which constitute 46% of all farmers, have a per capita daily income of Rs. 22 and Rs. 32 respectively. According to the abovementioned definition of poverty in India, Rs. 27.2 per day per capita in rural areas is the poverty line. This means that all of income quintile 1 and about half of income quintile 2 are below the poverty line. Those people derive 13 to 14% of their income from livestock and dairy activities. It is estimated that the dairy sector represents 70% of the livestock sector in India. Therefore, dairy provides an important additional income to rural farmers.
Table 2-8 Income sources of farmers by income quintile
Participation rate(%)
Share inincome(%)
Participation rate(%)
Share inincome(%)
Participation rate(%)
Share inincome(%)
Participation rate(%)
Share inincome(%)
1 7,992 93% 43% 69% 13% 9% 5% 63% 39% 24%2 11,592 93% 45% 71% 14% 8% 6% 57% 36% 22%3 14,700 91% 49% 72% 11% 11% 7% 49% 32% 22%4 19,344 92% 51% 73% 11% 11% 8% 47% 31% 19%5 35,904 91% 50% 71% 11% 13% 12% 40% 26% 13%
All (Rs) 16,056 92% 48% 71% 12% 10% 8% 52% 32% 100%
% to totalhouseholds
Incomequintile
Per CapitaIncome
(Rs/annum)
Agriculture Livestock/Dairying Non-farm business Wages and salaries
Source: NDDB
(3) Additional Income from Dairy According to the NDDB, in the cooperative dairy sector across the country, it is estimated that i)
dairy farmers realized an average of Rs. 28.18 per liter of milk (4.6% fat and 8.5% SNF) in 2016-17, ii) approximately 2.5 liters of milk per day is sold per dairy farmer, and iii) self-employed labor charges account for 20% of the milk production cost, based on various studies. Based on these estimations, it can be said that the average dairy farmer receives Rs. 14 per day (Rs. 5.6 per liter) for dairy activities, which is significant additional income for those living below the poverty line of Rs. 27.2 per day per capita income.

2-11
(4) Reducing Disparity by Increasing Income from Dairy According to the NDDB, a study concluded that livestock and dairy incomes decrease income
inequality and that a one percent increase in the share of livestock and dairy income out of total income will reduce income inequality by 1.2%. It means that if the share of livestock and dairy income in total income increase from 12% to 13%, the income inequality reduce by 1.2%. On the other hand, the same report concluded that cultivation incomes and nonfarm business incomes increase income inequality and that a one percent increase in the share of those incomes out of total income will increase inequality by 2.7% and 1.6%, respectively. It means that if the share of cultivation income or nonfarm business incomes in total income increase by 1%, for example from 48% to 49% or from 8% to 9%, the inequality will increase by 2.7% or 1.6% respectively. Thus, growth through inclusive dairying does not worsen income disparities; rather, it helps reduce absolute poverty and income inequality among households in India. 2.2.4 Issues for the Dairy Sector in India
Because of the growing demand for dairy products in India, dairy farmers - including landless,
marginal, and small farmers - have an opportunity to improve their livelihoods through livestock, but there are
several restrictive factors, as described below.
(1) Low Productivity
In India, milk production per dairy
animal is at low level. Crossbred cattle can
produce 6.78 kg/day, while non-descript and
indigenous breeds can produce only 2.75
kg/day.15 Those productivities are extremely
low relative to productivity in developed
countries (23.3 kg/day). 16 The milk
production volume of buffalo in India totals
5.09 kg/day, which is also low compared to the
approximately 8 kg/day of Argentina's
commercial farmers.17
Milk productivity in India differs greatly from state to state18. Even in states with large milk production
volumes such as Uttar Pradesh and Madhya Pradesh, productivity remains at India’s average level.
Indian dairy farmers with annual milk production of 1,000 L (2.74 L/day) or less are the majority. The
low production of these dairy farmers is caused mainly by a lack of feed, the low genetic ability of the dairy
15 DoAHDF (2015) Basic Animal Husbandry and Fisheries Statistics 2015 16 This is calculated based on 8,511 kg per parous cow (Situation of livestock and dairy in Japan, Ministry of Agriculture, Forestry and Fisheries, Japan (2017)) 17 Agriculture and Livestock Industries Corporation (2006) Outline of buffalo milk production in Argentina. 18 The reasons of high milk productivity in Punjab can be high ratio of cross breed in total cattle (85.0% in Punjab against 20.8% of India’s average) and good access to fodder.
Table 2-9 Annual milk production of top 10 states (2015-16)
State Annual milk production (1,000 ton)
% of total production
in India
Milk production (kg/head per
day) Cow Buf
1 Uttar Pradesh 26,387 17.0% 3.80 4.34 2 Rajasthan 18,500 11.9% 4.75 5.94 3 Gujarat 12,262 7.9% 5.64 4.93 4 Madhya Pradesh 12,148 7.8% 3.07 4.15 5 Andhra Pradesh 10,817 7.0% 5.24 5.52 6 Punjab 10,774 6.9% 11.11 7.98 7 Maharashtra 10,153 6.5% 5.18 4.78 8 Haryana 8,381 5.4% 7.30 8.21 9 Bihar 8,288 5.3% 4.39 4.27
10 Tamil Nadu 7,244 4.7% 6.14 3.90 Total 124,954 80.4% 4.72 5.25
Source: DoAHDF (2016) Basic Animal Husbandry and Fisheries Statistics

2-12
animals, and the spread of animal diseases.19 While the livestock population is increasing, the gap between the
requirement and availability of feed and fodder is increasing primarily due to decreasing area under fodder
cultivation and reduced availability of crop residues as fodder. The low genetic ability of dairy animals is caused
by insufficient coverage of artificial insemination and non-availability of quality males for breeding. There is a
shortage of veterinary and para-veterinary manpower and facilities including mechanisms for diagnosis,
treatment, tracking and prevention of the diseases. Adequate infrastructure for ensuring bio-security, proper
quarantine systems and services to prevent the ingress of diseases across the states and national borders is not
available20.
As mentioned in Section 2.1.6, acquiring appropriate technologies is more difficult for small-scale
farmers than for large-scale farmers. How to improve productivity among small-scale farmers, who are important
players in milk production, has become a major issue.
(2) Low Production Volume per Farmer
Landless and marginal farmers own an average of about 1.5 heads of dairy animals, while small-scale
famers own an average of about 2.6 heads, as shown in Table 2-6. The ratio of milking bovine in all bovine is
estimated about 28.0% in India21. It means that landless/marginal and small farmers rear averagely only 0.42
heads and 0.728 heads of milking animals respectively. Considering that average milk productivity of cow and
buffalo are 4.72 L/head per day and 5.25 L/head per day respectively as shown in Table 2-9, average milk
production of landless, marginal, and small-scale farmers per day can be only 2 to 4 L/day per household. Due
to the small number of holdings and low productivity per head, the milk surplus - excluding the household
consumption of the small-scale dairy farmers - has become limited.22 Therefore, income improvement through
livestock development tends to be limited.
(3) Limited Market Access
Modern collection networks tend to be unprofitable in areas where the market surplus of milk is small.
Many areas still do not have access to modern supply chains such as dairy cooperatives and private dairy
companies. For example, in Assam state, the milk procurement rate of cooperatives is about 4% of surplus milk,
and major private dairy companies don’t exist in the area. The milk procurement rate of organized sector in Uttar
Pradesh, Madhya Pradesh, and Bihar are estimated relatively low, about 25% to 35%, 25%, and 50% to 60%
respectively. Dairy farmers in such areas are limited to sales opportunities other than traditional distribution.
Lacking the sales opportunities offered by modern supply chains, farmers risk falling into a vicious circle
whereby profits from sales are low and the motivation to invest in order to improve breeding techniques and
quality is suppressed.23 19 Report of the working group on animal husbandry and dairying 12th Five Year Plan (2012-2017). 20 Livestock Policy 2013 21 According to the livestock census in 2012, the number of bovine in milk and all bovine were estimated as 83,982 thousand heads and 299,981 thousand heads respectively. 22 According to an estimation of the Gujarat Co-operative Milk Marketing Federation (GCMMF), average annual income per
cattle is about USD 387 http://www.fwi.co.uk/business/11-amazing-facts-dairy-farming-india.htm). 23 Report of the working group on animal husbandry and dairying 12th Five-Year Plan (2012–2017).

2-13
(4) Exclusion of Landless Farmers from Dairy Farming
According to Shar and Dave (2010), the number of cattle and buffalo owners among landless farmers
is very low - about one in 100 households as of 2003 - and is declining, as landless farmers have been abandoning
dairy activities24 since dairy farming is risky and costly for them. Since a dairy animal is larger than poultry and
small ruminants, death of an animal would be large loss for them.
Table 2-10 Milch animals per 100 households by land holding group (rural)
landholding Year
Landless (-0.002ha)
Marginal (0.002-1ha)
Small (1-2ha)
Semi-medium
(2-4ha) Medium (4-10ha)
Large (10ha-)
All
1991-92 9 61 103 123 153 202 68 2002-03 1 69 108 142 210 343 62
Source: Shar and Dave (2010) A shift from crop-mixed traditional dairying to market oriented organized dairy farming
(5) Demand for Quality Improvement
Food Safety Standards Authority India (FSSAI), which is under the jurisdiction of the Ministry of Health and Family Welfare, is in charge of the hygiene management of foods, including dairy products. According to a survey conducted by the FSSAI in 2011, 70% of the milk distributed in the market did not meet the food standards prescribed by the agency. According to an FSSAI official, the results of the survey do not reflect the actual situation because they were caused by counting milk samples that were mixed with skim milk power (SMP) as non-conforming milk even though milk with SMP does not violate the rules, and it is a common practice in the dairy industry to adjust fat and SNF contents with SMP. However, it doesn’t mean that milk meets the food standard as the detail is discussed in Chapter 6. Consumer awareness of food safety is increasing, and the FSSAI has made food inspections more stringent in recent years. 2.3 Indian Government Policies and Principles in the Dairy Sector and Related Sectors 2.3.1 Brief History of Dairy Development in India Operation Flood, one of the world’s largest rural development programs, was launched in 1970 with the aim to i) increase milk production, ii) augment rural incomes, and ii) ensure reasonable prices for consumers. (1) Three Phase of Operation Flood Operation Flood was implemented in three phases: 1) Phase 1 (1970 - 1980) Phase 1 was financed through the sale of skimmed milk powder and butter oil gifted by the European Union (then the European Economic Community, EEC) through the World Food Programme (WFP). During the first phase, Operation Flood linked 18 of India’s premier milksheds with consumers in
24 Shar and Dave 2010, A shift from crop-mixed traditional dairying to market oriented organized dairy farming.
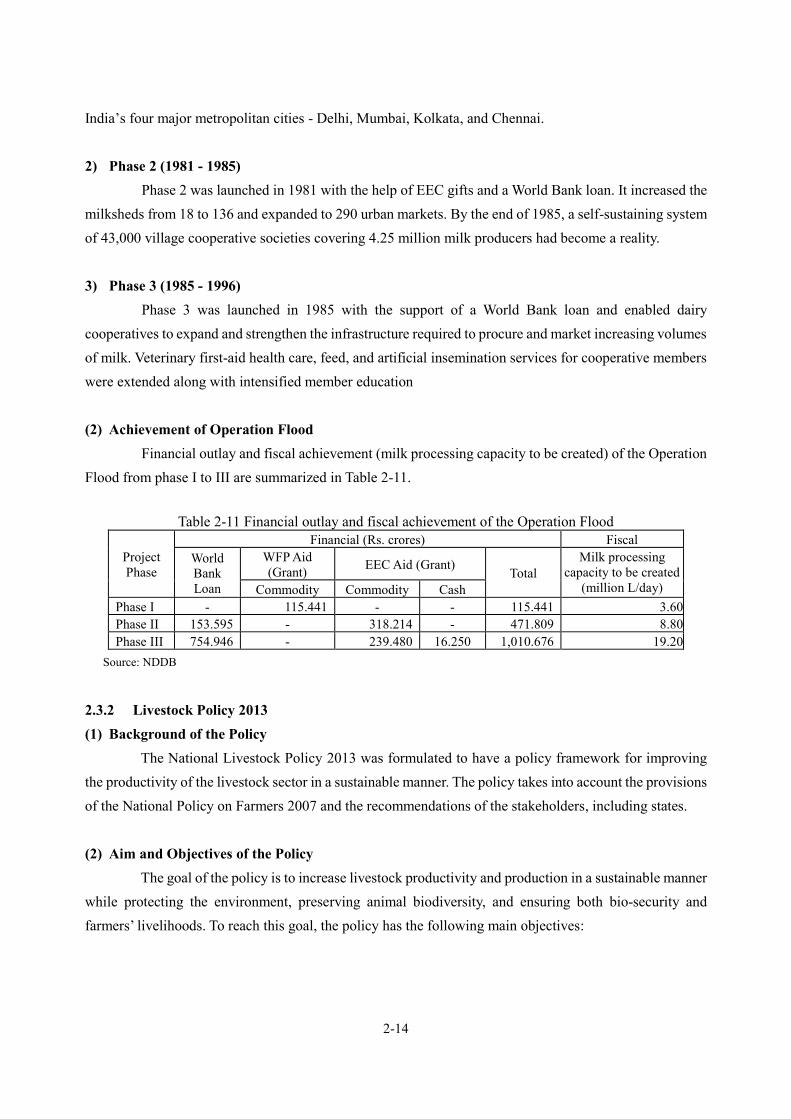
2-14
India’s four major metropolitan cities - Delhi, Mumbai, Kolkata, and Chennai. 2) Phase 2 (1981 - 1985) Phase 2 was launched in 1981 with the help of EEC gifts and a World Bank loan. It increased the milksheds from 18 to 136 and expanded to 290 urban markets. By the end of 1985, a self-sustaining system of 43,000 village cooperative societies covering 4.25 million milk producers had become a reality. 3) Phase 3 (1985 - 1996) Phase 3 was launched in 1985 with the support of a World Bank loan and enabled dairy cooperatives to expand and strengthen the infrastructure required to procure and market increasing volumes of milk. Veterinary first-aid health care, feed, and artificial insemination services for cooperative members were extended along with intensified member education (2) Achievement of Operation Flood
Financial outlay and fiscal achievement (milk processing capacity to be created) of the Operation Flood from phase I to III are summarized in Table 2-11.
Table 2-11 Financial outlay and fiscal achievement of the Operation Flood
Project Phase
Financial (Rs. crores) Fiscal World Bank Loan
WFP Aid (Grant) EEC Aid (Grant) Total
Milk processing capacity to be created
(million L/day) Commodity Commodity Cash Phase I - 115.441 - - 115.441 3.60 Phase II 153.595 - 318.214 - 471.809 8.80 Phase III 754.946 - 239.480 16.250 1,010.676 19.20
Source: NDDB
2.3.2 Livestock Policy 2013 (1) Background of the Policy
The National Livestock Policy 2013 was formulated to have a policy framework for improving the productivity of the livestock sector in a sustainable manner. The policy takes into account the provisions of the National Policy on Farmers 2007 and the recommendations of the stakeholders, including states. (2) Aim and Objectives of the Policy
The goal of the policy is to increase livestock productivity and production in a sustainable manner while protecting the environment, preserving animal biodiversity, and ensuring both bio-security and farmers’ livelihoods. To reach this goal, the policy has the following main objectives:

2-15
Objectives of the National Livestock Policy 2013 i) To support the existing low input production systems for improving productivity and income so as
to improve socio-economic status of a vast majority of the livestock producers, most of which are women and small farmers.
ii) To support research and development initiatives on issues pertaining to livestock sector for improving production and productivity, bio-security and profitability.
iii) To encourage establishment and growth of self-supporting financially viable, medium and large commercial livestock production units capable of adopting latest technology including facility for processing and value addition.
iv) To improve the productivity of livestock and poultry by promoting and disseminating the technologies developed by the research system.
v) To promote conservation of animal bio-diversity; conservation and genetic improvement of important indigenous breeds of livestock and poultry in the country.
vi) To increase availability of feed and fodder resources to meet the requirement of livestock to attain optimal productivity.
vii) To strengthen overall animal health cover through prevention, control and eradication of various disease conditions and encourage/enable the dairy cooperatives to extend veterinary services to farmers.
viii) To focus on production of quality livestock products as per the international standards for food safety.
ix) To encourage value addition of livestock products like milk and milk products, eggs, wool and meat and meat products etc.
x) To expand capacity of milk handled by organized dairy sector including cooperatives. xi) To ensure transmission and application of improved technology and management practices to the
doorstep of the farmers and the entrepreneurs. xii) To create an enabling environment to attract investment for improving infrastructure support,
livestock production, processing, value addition and marketing in the sector.
The activities mentioned in the proposal prepared by the NDDB - such as the expansion of the
organized dairy sector, value addition of milk and milk products, improved availability of feed, international standards for food safety, and value addition - are clearly mentioned in the policy. (3) Role of the Central Government and the State Government
The roles of the central and state governments are as follows: Each state government has jurisdiction over livestock development under the constitution of India. The central government supplements and complements the efforts of the state governments through
various schemes and programs in addition to creating an enabling environment for promoting

2-16
sustainable growth in the sector. 2.3.3 National Action Plan for Dairy Development (Vision 2024) In July 2017, the Department of Animal Husbandry, Dairying and Fisheries (DoAHDF) of the Ministry of Agriculture and Farmers’ Welfare Government of India published the National Action Plan for Dairy Development (Vision 2024) - Doubling Farmers Income by 2022 (NAP). The NAP has two goals:
Goal 1: To double national milk production from 155 million MT in 2015-16 to 300 million MT by 2023-24 for meeting the increasing milk demand by domestic milk production and also ensuring nutritional security at household level as well as exports of milk and milk products
Goal 2: To endeavor to double milk farmers income at farm level by 2023-24 by providing the milk farmer with greater access to the organized milk processing sector
To achieve Goal 1, the DoAHDF plans to increase the dairy bovine population and milk yield per animal per day, as summarized in Table 2-12.
Table 2-12 Projection for milk production
Year Number of in-milk bovine (in million)
Milk yield per animal per day
(L)
Milk production
(million MT)
Marketable surplus
(million MT) 2009-10 67.62 4.72 116.4 61 2010-11 69.88 4.78 121.8 63 2011-12 82.36 4.25 127.9 67 2012-13 83.15 4.36 132.4 69 2013-14 84.07 4.49 137.7 72 2014-15 85.66 4.68 146.3 76 2015-16 88.35 4.65 155.5 81 2016-17 90.49 5.11 168.8 101 2017-18 93.80 5.35 183.3 110 2018-19 97.23 5.61 198.9 119 2019-20 100.79 5.87 216.0 130 2020-21 104.48 6.15 234.5 153 2021-22 108.31 6.44 254.5 153 2022-23 112.27 6.74 276.3 166 2023-24 116.38 7.06 300.0 180
Source: DoAHDF (2017) National Action Plan for Dairy Development
Regarding Goal 2, the DoAHDF claims that the livelihoods and economic wellbeing of rural milk producers require that they need to be given greater access to the organized milk processing sector. This would require the creation of additional chilling capacity and milk processing infrastructure along with additional drying capacities and dairy product manufacturing and feed/feed supplement infrastructure. It is

2-17
assumed that 457 billion rupees and 764 billion rupees are required for the cooperative and private sectors, respectively, to meet the demand.
Table 2-13 Gap analysis of dairy infrastructure under cooperative and private sectors
Cooperative sector Private sector
2015-16 2023-24 Growth 2015-16 2023-24 Growth
Milk procurement (lakh liter per day) 440.46 1,643.90 3.73 430.00 2,465.89 5.73
Processing capacity (lakh liter per day) 662.96 2,975.42 4.49 732.52 3,082.36 4.21
Chilling capacity (lakh liter per day) 463.79 1,643.90 3.54 293.01 2,465.89 8.42
Value added products (MT per day) 3,167 8,214 2.59 3,959 10,267 2.59
Milk powder plant (MT per day) 1,496 2,086 1.39 1,465 6,165 4.21
Cattle feed plant (MT per day) 15,662 18,361 1.17 NA 2,699 NA
Source: DoAHDF (2017) National Action Plan for Dairy Development
Table 2-13 summarizes the targets of the NAP for both cooperative and the private sectors. For example, the 2023-24 milk procurement volume target requires the cooperative sector to achieve an average 18% annual increase and the private sector to achieve an average 25% annual increase. 2.3.4 Government Organization and Schemes for Dairy Development The DoAHDF plays a major role in dairy development. The National Dairy Development Board (NDDB) promotes financing for and supports producer-owned and -controlled organizations, such as dairy cooperatives and producer companies. In addition, the Ministry of Food Processing Industries and the National Cooperative Development Cooperation have schemes for promoting dairy development. Their mandate and schemes for promoting the dairy sector are summarized below. (1) Department of Animal Husbandry, Dairying and Fisheries, the Ministry of Agriculture and
Farmers Welfare25 The DoAHDF is responsible for matters relating to livestock production, preservation, disease prevention, stock improvement, and dairy development, as well as matters relating to the Delhi Milk Scheme. It also looks after all matters pertaining to fishing and fisheries, both inland and marine. The department advises state governments/union territories (UTs) regarding the formulation of policies and programs in the field of animal husbandry, dairy development, and fisheries. The main thrust areas are the development of the requisite infrastructure in states and UTs for improving productivity, the preservation and protection of livestock through the provision of health care, the strengthening of central livestock farms (cattle, sheep, and poultry) for the development of superior
25 Website of the Department of Animal Husbandry, Dairying and Fisheries: http://www.dahd.nic.in/about-us/about-department

2-18
germ plasm for distribution to states, and the expansion of aquaculture in fresh and brackish water, and the welfare of fisher-folk, etc.
The dairy development schemes being implemented by the department include the following:
1) National Program for Bovine Breeding and Dairy Development (NPBB and DD)26 a) Outline of the Scheme
The National Program for Bovine Breeding and Dairy Development (NPBB and DD) was launched in February 2014 by merging four ongoing schemes: The Integrated Dairy Development Program (IDDP), Strengthening Infrastructure for Quality and Clean Milk Production (SIQ-CMP), Assistance to Cooperatives (A to C), and the National Project for Cattle and Buffalo Breeding (NPCBB). The NPBB and DD have two components, the National Program for Bovine Breeding (NPBB) and the National Program for Dairy Development (NPDD). An amount of Rs. 1,800 crores, of which Rs. 1,200 crores have been made available for NPBB27, has been allocated for NPBB and DD for the Twelfth Five Year Plan (2012-1017).
The NPBB component focuses on extending AI networks through the Multi-Purpose AI Technician in Rural India (MAITRI) and on encouraging the conservation and development of recognized indigenous breeds in the country. The NPDD component focuses on creating and strengthening the infrastructure for the production of quality milk and the procurement, processing, and marketing of milk and dairy products by state implementing agencies such as the dairy cooperative federation (state level) and district dairy cooperatives (district level). Details on the NPDD are provided below. b) Financial Assistance
The NPDD provides grants-in-aid for i) the installation of BMC, ii) milk processing plants, iii) milk powder plants, and iv) the rehabilitation of milk unions and federations. The funding pattern of the NPDD is summarized in Table 2-14.
Table 2-14 Funding pattern of NPDD State and condition Grant %
States covered by NDP I 50%
States not covered
by NDP I28
Profit-making milk unions with accumulated profits of more than Rs.1 crore n previous year 75%
Loss-making milk unions with accumulated profits of less than Rs. 1 crore in previous year 90%
Hilly and northeastern states 90%
Milk unions assisted by the Rehabilitation Plan component 50%
Source: DoAHDF
26 DoAHDF (2017) Annual Report 2016-17 27 Rashtriya Gokul Mission has been initiated by the DoAHDF as a part of NPBB in December 2014 with the aim to conserve and develop indigenous breeds in scientific and holistic manner by setting aside Rs. 500 crores out of Rs. 1,200 crores allocated under NPBB (DoAHDF (2017) Annual Report 2016-17). 28 The NDP does not cover Delhi, Goa, Puducherry, Himachal Pradesh, Arunachal Pradesh, Assam, Meghalaya, Manipur, Mizoram, Nagaland, Sikkim, Tripura, Jammu and Kashmir, UT of Chandigarh, Daman and Diu, Lakshadweep, Andaman, or Nicobar.

2-19
In addition to pursuing infrastructure installation, the government has been helping to revitalize ailing dairy cooperatives, which have accumulated cash losses since 2000, through the Assistance to Cooperative (A to C), a component of the NPDD. It provides grants-in-aid to milk unions shared 50/50 between the central and state governments. c) Achievements According to the DoAHDF’ s annual report, 31 projects in 17 states had been approved, at a total cost of Rs. 340.77 crores by 2016-17. Against a budget provision of Rs. 110 crores, Rs. 67.81 crores had been released for 2016-17 implementation by the end of December 2016. The physical targets and current achievements are summarized in Table 2-15.
Table 2-15 Physical targets and achievements of NPDD Target Achievement % of achievement
BMC Number 207 62 30.0%
Capacity (thousand liters) 330.5 113.5 34.3%
AMCU/DPMCU (number) 1820 730 40.1%
Dairy plant capacity (thousand liters per day) * 1830 1070 58.5%
Average milk procurement (additional) ** 1239.16 979.77 79.1%
Note: * = achievement as of end of September 2017; ** = achievement as of end of June 2017 AMCU: Auto milk collection unit, DPMCU: Data processing milk collection unit Source: DoAHDF
Regarding achievements the A to C, 42 milk unions have been supported since 2000 by the receipt
of about Rs. 290 crores as of the end of November 2017. (2) National Dairy Development Board
The National Dairy Development Board (NDDB) was founded in 1965 to extend the success of the Kaira Cooperative Milk Producers’ Union (known as Anand model) to other parts of India fulfilling the vision of the then prime minister of India, the late Lal Bahadur Shastri. The major success of the mission was achieved through the World Bank-financed Operation Flood programme, which lasted for 26 years (1970 to 1996) and made India the world’s largest producer of milk. This operation was started with the objective of increasing milk production, increasing farmers’ incomes, and providing fair prices for consumers.
According to the NDDB, it provided financial and technical support after Operation Flood through the “Perspective Plan” for the 10 years from 2001 to 2010 and continued until June 2015 to strengthen cooperative businesses, enhance production, ensure quality, and create a national information network by providing loans and technical assistance and pursuing other schemes. The NDDB has been implementing NDP I since 2011-12, which is detailed in the next section. Details on the NDDB’s structure and financial status are provided in Chapter 3.
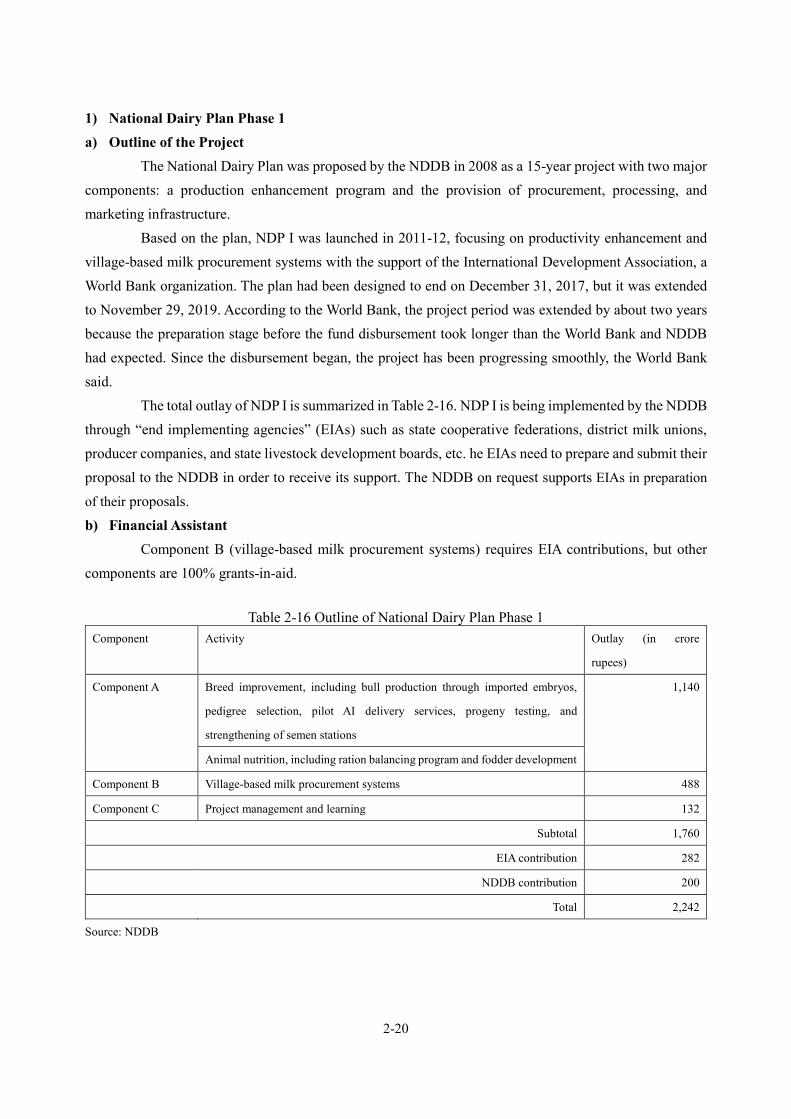
2-20
1) National Dairy Plan Phase 1 a) Outline of the Project
The National Dairy Plan was proposed by the NDDB in 2008 as a 15-year project with two major components: a production enhancement program and the provision of procurement, processing, and marketing infrastructure.
Based on the plan, NDP I was launched in 2011-12, focusing on productivity enhancement and village-based milk procurement systems with the support of the International Development Association, a World Bank organization. The plan had been designed to end on December 31, 2017, but it was extended to November 29, 2019. According to the World Bank, the project period was extended by about two years because the preparation stage before the fund disbursement took longer than the World Bank and NDDB had expected. Since the disbursement began, the project has been progressing smoothly, the World Bank said.
The total outlay of NDP I is summarized in Table 2-16. NDP I is being implemented by the NDDB through “end implementing agencies” (EIAs) such as state cooperative federations, district milk unions, producer companies, and state livestock development boards, etc. he EIAs need to prepare and submit their proposal to the NDDB in order to receive its support. The NDDB on request supports EIAs in preparation
of their proposals. b) Financial Assistant
Component B (village-based milk procurement systems) requires EIA contributions, but other components are 100% grants-in-aid.
Table 2-16 Outline of National Dairy Plan Phase 1 Component Activity Outlay (in crore
rupees)
Component A Breed improvement, including bull production through imported embryos,
pedigree selection, pilot AI delivery services, progeny testing, and
strengthening of semen stations
1,140
Animal nutrition, including ration balancing program and fodder development
Component B Village-based milk procurement systems 488
Component C Project management and learning 132
Subtotal 1,760
EIA contribution 282
NDDB contribution 200
Total 2,242
Source: NDDB

2-21
c) Achievement According to the implementation status and results report published by the World Bank, the plan
has been progressing as planned, or better. The target and progress of the project development objective indicators as of August 2017 are summarized in Table 2-17. Many indicators have already been achieved, even though the project has more than two years to go.
Table 2-17 Project development objective indicators of the plan
Target Baseline Target
(November 29, 2019)
Progress
(as of August 11, 2017)
% increase in milk production per animal 0.00 10.00 19.80
Proportion of in-milk female animals to adult female animals 63.00 66.00 66.00
Proportion of total milk sold to total production 65.00 65.00 67.00
Percent increase in share of milk sold to the organized sector 45.00 56.00 76.00
Source: The World Bank
As of September 2017, 350 projects had been approved with grants of Rs. 1,619 crores. The
figures below show the distribution of approved projects and granted amounts in the top five states. Gujarat state received the most projects and granted amounts from NDP I.
Figure 2-15 Number of NDP I approved projects Source: NDDB website
Figure 2-16 NDP I granted amounts (lakh rupees) Source: NDDB website
The EIAs in Gujarat state have received the greatest support from NDP I in terms of number of
project and granted amount. Annual milk production in Gujarat state is only 8% of India’s total milk production, but EIAs in Gujarat received 21% of all NDP I grants. However, given that the annual milk procurement volume of cooperatives in Gujarat state accounts for 41% of the country’s total procurement volume and that NDP I mainly supports cooperatives and producer companies, the 21% support to EIAs in Gujarat state might be reasonable.
47, 13%
31, 9%
24, 7%
34, 10%
22, 6%
192, 55%
Gujarat
Rajasthan
Uttar Pradesh
Karnataka
Punjab
Others
34,558, 21%
21,613, 13%
17,360, 11%
15,675, 10%
10,836, 7%
61,862, 38%
Gujarat
Rajasthan
Uttar Pradesh
Karnataka
Punjab
Others

2-22
Figure 2-17 Shares of annual milk production volumes in states, NDP I grant amounts,
and annual milk procurement volumes of cooperatives. Source: NDDB website and DoAHDF (2016) Basic Animal Husbandry and Fisheries Statistics 2016
(3) National Bank for Agriculture and Rural Development (NABARD)
The National Bank for Agriculture and Rural Development (NABARD), a government-owned bank, provides financial assistance to commercially bankable projects through loans from commercial, cooperative, urban, and rural banks and designs development schemes for the implementation of the GoI’s development programs. NABARD has been implementing the following schemes for dairy development.
1) Dairy Entrepreneurship Development Scheme a) Outline of the Scheme
The Dairy Entrepreneurship Development Scheme (DEDS) was started in September 2010 with the objective of generating self-employment opportunities in India’s dairy sector. This scheme is being implemented through NABARD in collaboration with the DoAHDF.
The scheme covers milk production, processing, and sales, including the following: the establishment of small dairy units from two to 10 milch animals; the rearing of heifers (up to 20 calves); vermi-compost; the purchase of milking machines, milk testing machines, and BMCs (up to 5,000 liter capacity); the purchase of milk-processing equipment for the manufacture of indigenous milk products; the provision of transportation and cold storage facilities; the establishment of private veterinary clinics; and the setting up of milk parlor.
Individual entrepreneurs, farmers, farmer groups, self-help groups, dairy cooperative societies, district milk unions, and the Panchayati Raj Institution are all eligible under the scheme. b) Financial Assistance
NABARD provides a back-ended capital subsidy of 25% of the project cost to the beneficiaries in the general category and 33.33% of the project cost to scheduled caste (SC) and scheduled tribe (ST) beneficiaries. c) Achievement
Rs. 1,400 crores was provided during the twelfth five-year plan (2012-2017), and NABARD had disbursed Rs. 1,021.78 crores as back-ended capital subsidy to the beneficiaries by the end of December 2016.
41%
21%
8%
6%
13%
12%
1%
11%
17%
15%
10%
4%
3%
7%
7%
34%
38%
52%
0% 20% 40% 60% 80% 100%
Annual milk procurement volume by cooperative(1,000 ton)
NDP granted amount (lakh rupee)
Annual milk production volume (1,000 ton)
Gujarat Rajasthan Uttar Pradesh Karnataka Punjab Others

2-23
2) Dairy Processing and Infrastructure Development Fund29 a) Outline of the Scheme
The Dairy Processing and Infrastructure Development Fund (DIDF), with an outlay of Rs. 10,881 crores for the 2017-18 to 2028-29 period, was approved by the Cabinet Committee on Economic Affairs chaired by Prime Minister Shri Narendra Modi in 2017. The fund will focus on building an efficient milk procurement system by setting up a chilling infrastructure, installing electronic milk adulteration testing equipment, creating, modernizing, and expanding the processing infrastructure, and setting up manufacturing faculties for the value-added product.
In this scheme, the NABARD provides loans to the NDDB and NCDC, and the NDDB and NCDC provide loans to dairy cooperatives and producer companies. Out of a total outlay of Rs. 10,881 crores, the financial contributions summarized in Table 2-18 will be made.
Table 2-18 Financial contribution of the DIDF Contribution Amount (crore rupees)
Loan from NABARD to the NDDB and NCDC 8,004
End-borrower contribution 2,001
NDDB’s and NCDC’s share 21
DoAHDF 864
Total 10,881
Source: Press Information Bureau, Government of India (website)30
b) Financial Support
The end-borrowers will receive loans at 6.5% interest rate per annum with a repayment period of 10 years including initial two-year moratorium on repayment of the principal amount. The respective state governments will be the guarantors of loan repayment. If the end borrower cannot contribute its share, the state government may offer necessary grant component to cover eligible end borrower contribution. c) Achievement
The NABARD shall disburse Rs. 2,004 crores, Rs. 3,006 crores, and Rs. 2,994 crores during the 2017-18, 2018-19, and 2019-20 periods, respectively. (4) Ministry of Food Processing Industries31
The Ministry of Food Processing Industries is concerned with the formulation and implementation
29 http://pib.nic.in/newsite/PrintRelease.aspx?relid=170712. 30 http://pib.nic.in/newsite/PrintRelease.aspx?relid=170712. 31 MoFPI (2017) Annual Report 2016-17.

2-24
of policies for food processing industries within India’s overall national priorities and objectives. The ministry acts as a catalyst for bringing greater investment into this sector, for guiding and helping the industry, and for creating an environment conducive to the healthy growth of the food processing industry. The ministry aims at creating the critical infrastructure required to fill the gaps in the supply chain from farm to consumer; providing value added for agricultural produce; minimizing wastage at all stages in the food processing chain through the development of
infrastructure for the storage, transportation, and processing of agro produce; introducing modern technology to food processing industries; encouraging food processing R&D for product and process development; providing policy support, promotional initiative, and facilities to promote value added produce for
domestic consumption and exports.
The ministry provides support to the food processing sector in general, not only the dairy sector. Almost all of the schemes provided by the ministry can be applied to the dairy sector. According to the ministry, the dairy sub-sector is one of the most important in the food processing sector, and the ministry provides support to not only private companies but also dairy cooperatives. Details on the schemes that can be applied to cold chain improvement and processing infrastructure in the dairy sector - the schemes for the cold chain, value addition, and preservation infrastructure as well as for the creation of backward and forward linkages - are described below. 1) Cold Chain, Value Addition, and Preservation Infrastructure Schemes a) Outline of the Scheme
The cold chain, value addition, and preservation infrastructure schemes aim to provide integrated cold chain and preservation infrastructure facilities, without interruption, from the farm gate to the consumer. It covers pre-cooling facilities at production sites, reefer vans, mobile cooling units, and value-addition centers, which include infrastructural facilities like processing/collection centers for horticulture, organic produce, marine, dairy, meat, and poultry. b) Financial Assistance
Financial assistance (grants-in-aid) under the scheme is limited to a maximum of Rs. 10 crores per project for technical civil works and eligible plant and machinery, as follows: For storage infrastructure, including pack houses, pre-cooling units, ripening chambers, and transport
infrastructure, grants-in-aid of 35% for general areas and 50% for northeastern states, Himalayan states, and Integrated Tribal Development Project (ITDP) Areas and Islands of the total cost of plant and machinery and technical civil works will be provided.
For value addition and processing infrastructure, including frozen storage/deep freezers integral to processing, grants-in-aid of 50% for general areas and 75% for northeastern states, Himalayan states,

2-25
ITDP Areas and Islands will be provided. c) Achievement
According to the ministry, 228 projects had been implemented under the scheme since 2009 as of
September 2017 (232 projects were listed on their website, but four were canceled), of which 56 projects are in
the dairy sector. According to the MoFPI, approximately half of the projects are being implemented by private
dairy companies, and the rest are being implemented by dairy cooperatives. However, as confirming the project
list, only six projects are for dairy cooperatives as shown in Table 2-19.
Table 2-19 Number of projects, project cost, and amount of grant released of the scheme
Number of
projects
Project cost (Rs. crore) Amount of grant released (Rs. crore)
Total Average Total Average
Cooperative 6 410.4 68.4 16.3 2.7
Private 50 1,379.9 27.6 159.6 3.2
Total 56 1,790.4 32.0 176.0 3.1
Source: Website of MoFPI
This will result in an increase in milk processing and storage of 10,799,000 L/day. In addition, 103
cases were sanctioned in March 2017, 35 in the dairy sector. This will result in an additional 5,948,000 L/day of
milk processing and storage.
The number of supported projects this year has increased because the government allocated funds for
an additional 100 projects. The number of supported projects and grant amounts depend on the budget allocation.
2) Scheme for Creation of Backward and Forward Linkages32
a) Outline of the Scheme
The objective of the scheme is to provide effective and seamless backward and forward integration for
the processed food industry by plugging supply chain gaps regarding the availability of raw material and linkages
with the market. Under the scheme, financial assistance is provided for setting up primary processing/collection
centers at the farm gate and modern retail outlets at the front end along with connectivity through
insulated/refrigerated transport.
The scheme is applicable to perishable horticulture and non-horticulture produce such as fruits,
vegetables, dairy products, meat, poultry, fish, ready-to-cook food products, honey, coconuts, spices, mushrooms,
and retails shops for perishable food products. The scheme would enable the linking of farmers to processors
and the market to ensure remunerative prices for agri products.
b) Financial Assistance
The maximum grant available per project is Rs. five crores at 35% of the eligible project cost for
general areas and 50% for northeastern states, Himalayan states, and ITDP Areas and Islands, for a maximum of
32 http://mofpi.nic.in/Schemes/scheme-creation-backward-and-forward-linkages.

2-26
Rs. five crores per project. The grant is provided only for technical civil work and eligible plant and machinery.
In the dairy sector, the scheme covers BMC, insulated tanks, refrigerator vans, and equipment at retail shops.
c) Achievement
It is a new scheme, begun in August 2017 for 50 projects. The first application was closed in October
2017.
(5) National Cooperative Development Cooperation
The National Cooperative Development Corporation (NCDC) was established by an act of parliament in 1963 as a statutory corporation under the Ministry of Agriculture and Farmers Welfare.
The NCDC finances projects in rural industrial cooperative sectors and for certain services in rural areas, like water conservation, irrigation and micro irrigation, agri-insurance, agro-credit, rural sanitation, and animal health.
Since its inception, the NCDC has been promoting and financing dairy cooperatives. However, its role has been limited to “Non-operation Flood States” due to the NDDB’s implementation of Operation Flood. After Operation Flood ended in 1996, the NCDC’s role was widened, and it now can finance dairy cooperatives in erstwhile Operation Flood areas. 1) Outline of Scheme
The NCDC provides assistance to primary, district, and state dairy cooperatives for the establishment/expansion/renovation of milk collection centers and chilling plants, the purchase of milk-collection equipment and transport vehicles, the establishment of feed mixing/manufacturing units, milk testing equipment, deep freezers, BMC and UHT packaging units, and integrated dairy development projects linking the production, procurement, processing, and marketing of milk. Working capital and margin money/share capital assistance are provided to increase business turnover. Further, as per a revision of the scheme in 2002, the NCDC also finances the purchase, rearing, and breeding of milch animals as per the existing pattern of assistance for cooperatives engaged in dairy activities.
2) Financial Assistance
Table 2-20 summarizes the financial assistance pattern of the major schemes that can be applied to the dairy sector. A higher percentage of subsidy is provided to less-developed states. State governments receive a share capita of cooperatives when these schemes are applied. For example,, if the Bihar state government applies the scheme for dairy cooperatives to invest milk processing facilities, the Bihar state government, as a least-developed state, would get loan of 70% of the total project cost and subsidy of 25% of the total project cost, and it needs to manage the rest of 5% of the total cost by itself or dairy cooperatives. The NCDC can procure fund from any financial agencies including commercial banks. Based on the interest rate of procured fund, the interest rate to borrowers of the NCDC would be determined. In case of the scheme for dairy cooperatives in Bihar, the interest rate for the dairy cooperatives became 9.2% per annual.
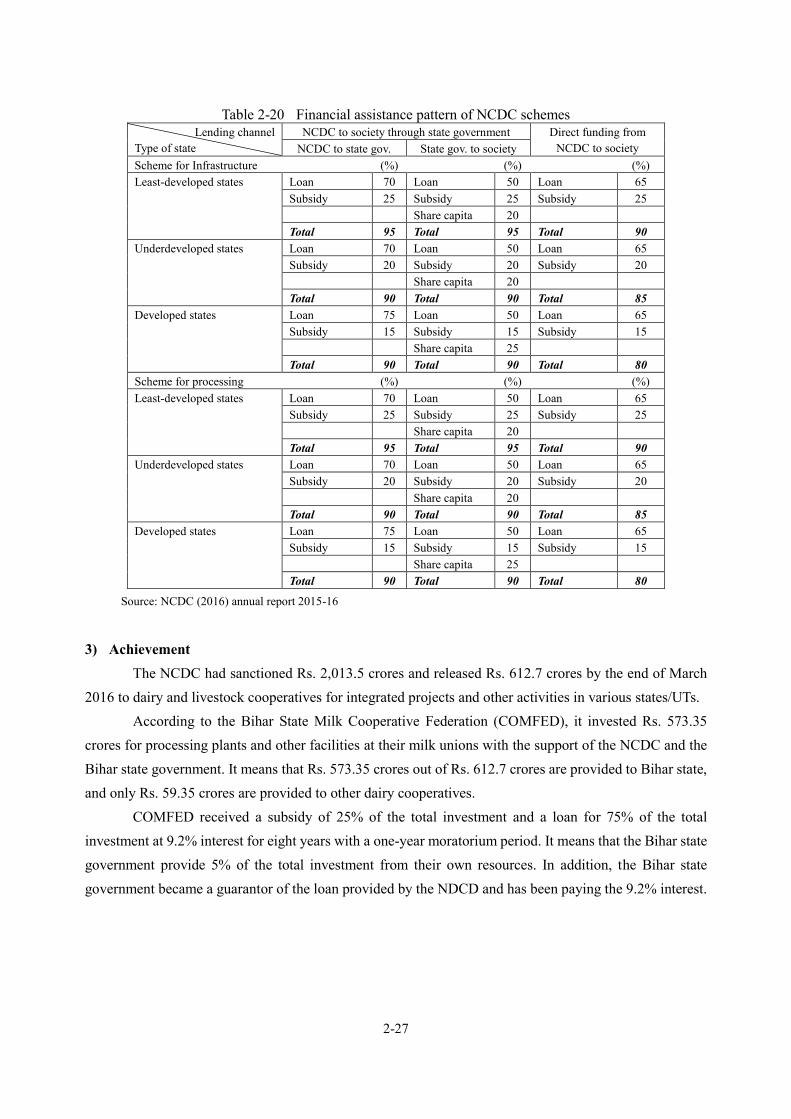
2-27
Table 2-20 Financial assistance pattern of NCDC schemes Lending channel
Type of state NCDC to society through state government Direct funding from
NCDC to society NCDC to state gov. State gov. to society Scheme for Infrastructure (%) (%) (%) Least-developed states Loan 70 Loan 50 Loan 65 Subsidy 25 Subsidy 25 Subsidy 25 Share capita 20 Total 95 Total 95 Total 90 Underdeveloped states Loan 70 Loan 50 Loan 65 Subsidy 20 Subsidy 20 Subsidy 20 Share capita 20 Total 90 Total 90 Total 85 Developed states Loan 75 Loan 50 Loan 65 Subsidy 15 Subsidy 15 Subsidy 15 Share capita 25 Total 90 Total 90 Total 80 Scheme for processing (%) (%) (%) Least-developed states Loan 70 Loan 50 Loan 65 Subsidy 25 Subsidy 25 Subsidy 25 Share capita 20 Total 95 Total 95 Total 90 Underdeveloped states Loan 70 Loan 50 Loan 65 Subsidy 20 Subsidy 20 Subsidy 20 Share capita 20 Total 90 Total 90 Total 85 Developed states Loan 75 Loan 50 Loan 65 Subsidy 15 Subsidy 15 Subsidy 15 Share capita 25 Total 90 Total 90 Total 80
Source: NCDC (2016) annual report 2015-16
3) Achievement
The NCDC had sanctioned Rs. 2,013.5 crores and released Rs. 612.7 crores by the end of March 2016 to dairy and livestock cooperatives for integrated projects and other activities in various states/UTs.
According to the Bihar State Milk Cooperative Federation (COMFED), it invested Rs. 573.35 crores for processing plants and other facilities at their milk unions with the support of the NCDC and the Bihar state government. It means that Rs. 573.35 crores out of Rs. 612.7 crores are provided to Bihar state, and only Rs. 59.35 crores are provided to other dairy cooperatives.
COMFED received a subsidy of 25% of the total investment and a loan for 75% of the total investment at 9.2% interest for eight years with a one-year moratorium period. It means that the Bihar state government provide 5% of the total investment from their own resources. In addition, the Bihar state government became a guarantor of the loan provided by the NDCD and has been paying the 9.2% interest.

2-28
2.4 Value Chain in Dairy Sector and its Actors 2.4.1 Outline of Value Chain in Dairy Sector (1) Unorganized and Organized Sector in Dairy Sector
According to the NAP, 48% of the milk produced is self-consumed or sold to non-producers in rural areas, and 52% of produced milk is available for sale to consumers in urban centers. About 40% of the milk sold is handled by the organized sector (20% by dairy cooperatives, 1% by producer companies, and 19% by private dairy companies), and the remaining 60% is handled by the unorganized sector without a cold chain, as summarized in Figure 2-18. Details on the value chain in each state are presented in Chapter 4.
Figure 2-18 Outline of value chain in India (2) Outline of Stakeholders in the Dairy Sector
The value chain structure and key actors in the dairy sector are shown in Figure 2-19. The major players in the modern distribution channel can be broadly divided into private dairy companies and dairy cooperatives. Apart from these, producers’ organizations, called “producer companies,” established under the Part IX-A of the Companies Act 1956 have been increasing in recent years through the support of the NDDB. Private dairy companies and dairy cooperatives are competing for milk collection, processing, and sales as well as dairy products. In some cases, private dairy companies and dairy cooperatives are business partners. For example, some dairy cooperatives subcontract milk powder processing to private dairy companies.
Farmer: 155.5 million MT/year (426 million kg/day)
Unorganized Sector
Private Dairy Cooperatives and MPC companies
Organized Sector
Self-consumption
48% 52% 74.6 million MT/year 31.2% (60% of sold milk) 20.8% (40% of sold milk) (204 million kg/day) 48.5 million MT/year 9.9% (19% of sold milk) 10.9% (21% of sold milk) (133 million kg/day) 15.4 million MT/year 16.9 million MT/year (42 million kg/day) (46 million kg/day)
Middleman / Loose milk shop

2-29
Figure 2-19 Outline of stakeholders in dairy sector in India
Competition between cooperatives has also begun. The Gujarat Cooperative Milk Marketing
Federation Ltd (GCMMF), a state dairy cooperative federation of Gujarat state, has expanded their business from Gujarat to Uttar Pradesh, Assam, and other states, where they collect, process, and sell milk. As a result, competition between GCMMF and local unions has begun. In other states where outside milk unions are not collecting milk, they are competing in the states’ retail market. For example, 15% of Karnataka state’s pouch milk is sold in other states such as Tamil Nadu and Maharashtra. In addition, milk unions in Maharashtra state are competing in the northern part of Karnataka, and milk unions in Bihar state sell their products in the eastern part of Uttar Pradesh state. An outline of the main actors is provided in the next section. 2.4.2 Outline of Stakeholders (1) Government of India
The Government of India supports dairy development via the DoAHDF, MoFPI, and NCDC, as explained above. (2) Food Safety and Standards Authority of India
The FSSAI was established under the Food Safety and Standards Act, 2006, which consolidates various acts and orders on food-related issues in various ministries and departments. The FSSAI was created to lay down science-based standards for food items and to regulate their manufacture, storage, distribution, sale, and import to ensure the availability of safe and wholesome food for human consumption under the
Co
nsu
me
rs
Private dairy companies (domestic and multinational)
Cooperative
Competition (partially collaboration)
Organized distribution channel
Unorganized distribution channel
Distribution of milk and dairy products
State gov.
Da
iry f
arm
ers
Donor
Federation
DC
S
UnionR
ura
l so
cie
ty
FSSAICentral gov.(e.g. DoAHDF, MoFPI, NCDC, etc)
NDDB
Producer Company
MPP Flow of milk and dairy products
DCS: Diary Cooperative SocietyMPP: Milk Pouring PointMPC: Milk Producer Company
MPC
Support for dairy development Regulate food safety
Support for dairy cooperative and producer companies

2-30
jurisdiction of the Ministry of Health and Family Welfare. The standards and regulations are mainly enforced by state governments. Traders, processors, and
sellers of food items are obligated to acquire or register licenses from the state government or the central government based on their scale of business.
According to a survey conducted by the FSSAI in 2011, 70% of the milk distributed in the market did not meet the food standards prescribed by the agency. According to this survey, the most common problem was adulteration with water, detergent and pain. According to the NDDB, consumer awareness of food safety is also increasing, and the FSSAI has made food inspections more stringent in recent years. (3) State Governments 1) Structure
Under the Constitution of India, livestock development falls within the jurisdiction of the state government pursuant to the National Livestock Policy 2013. Therefore, each state government is responsible for dairy development in its respective state. In many states, the department or directorate of animal husbandry plays a major role in the livestock sector. The name of the department or directorate differs from state to state. The responsible department or directorate implements various activities with the support of the central government and using their own resources.
The state governments’ major dairy development activities can be divided into four kinds: i) animal health and veterinary services, ii) breeding, iii) dairy development, and iv) fodder development. The Government of India helped the state governments establish livestock development boards or agencies responsible for breeding; thus, the state governments all have separate organizations for breeding.
Table 2-21 Organization in charge of breeding in each state
State Name of organization
Gujarat Gujarat Livestock Development Board
Bihar Bihar Livestock Development Agency
Assam Assam Livestock Development Agency
Karnataka Karnataka Livestock Development Agency
Madhya Pradesh Madhya Pradesh Poultry and Livestock Development Cooperation
Uttar Pradesh Uttar Pradesh Livestock Development Board
Regarding dairy development, especially after production, the dairy cooperatives play major roles
in procuring, processing, and selling milk as well as supporting farmers. However, some state governments play a role in dairy development in their state. For example, Assam state has a department of dairy development, which used to procure, process, and sell milk; those activities are now being transferred to dairy cooperatives and societies. Uttar Pradesh state has a milk commissioner, the major role of which is the registration of state cooperative federations, district milk unions, and dairy cooperative societies at the village level; the commissioner is not involved in the procurement, processing, or marketing of milk and

2-31
dairy products. The relations between dairy cooperatives and state governments differ from state to state. In
Gujarat, the dairy cooperative federation (GCMMF) is independent from the state government. However, in Bihar, Karnataka, Madhya Pradesh, and Uttar Pradesh states, Indian Administrative Service (IAS) officers - the elite public management cadre of the Government of India - are appointed at high levels of management. For example, IAS officers are appointed as managing directors of the dairy cooperative federation in Bihar (COMFED) and Uttar Pradesh (PCF). 2) Support for Dairy Cooperatives
The state governments provide support for dairy development by channeling the centrally sponsored schemes, such as the NPBB and DD and RKVY. The state government is a guarantor of financial assistance schemes, such as the DIDF. In addition to the centrally sponsored schemes, state governments also provide support through their own budgets. For example, the Karnataka state government provides a Rs.5/L incentive to milk producers when they sell their milk to cooperatives. This incentive started in 2008, with Rs.2/L, and the amount per liter gradually increased up to Rs.5/L. The Karnataka state government released about Rs. 1,004 crores during 2016/17 for this incentive. The Karnataka State Dairy Association, composed of private dairy companies in Karnataka state, claimed that the incentive has been hindering private dairy companies’ business and distorting the market. Other states such as Rajasthan state provide similar incentive to farmers who sell their milk to cooperatives33.
(4) Dairy Cooperatives
Due to the success of dairy cooperatives in Gujarat state, the Government of India has promoted a three-tier cooperative structure known as the “Anand model.” The Anand model is an integrated cooperative structure for procuring, processing, and marketing produce. It has three levels: the village dairy cooperative society (DCS) at the village level, the district milk union at the district level, and the milk federation at the state level, as summarized in Table 2-22. According to the NAP, there are 210 milk unions in India. Details on dairy cooperatives are provided in Chapter 4.
33 Source: Interview with the NDDB and private dairy companies
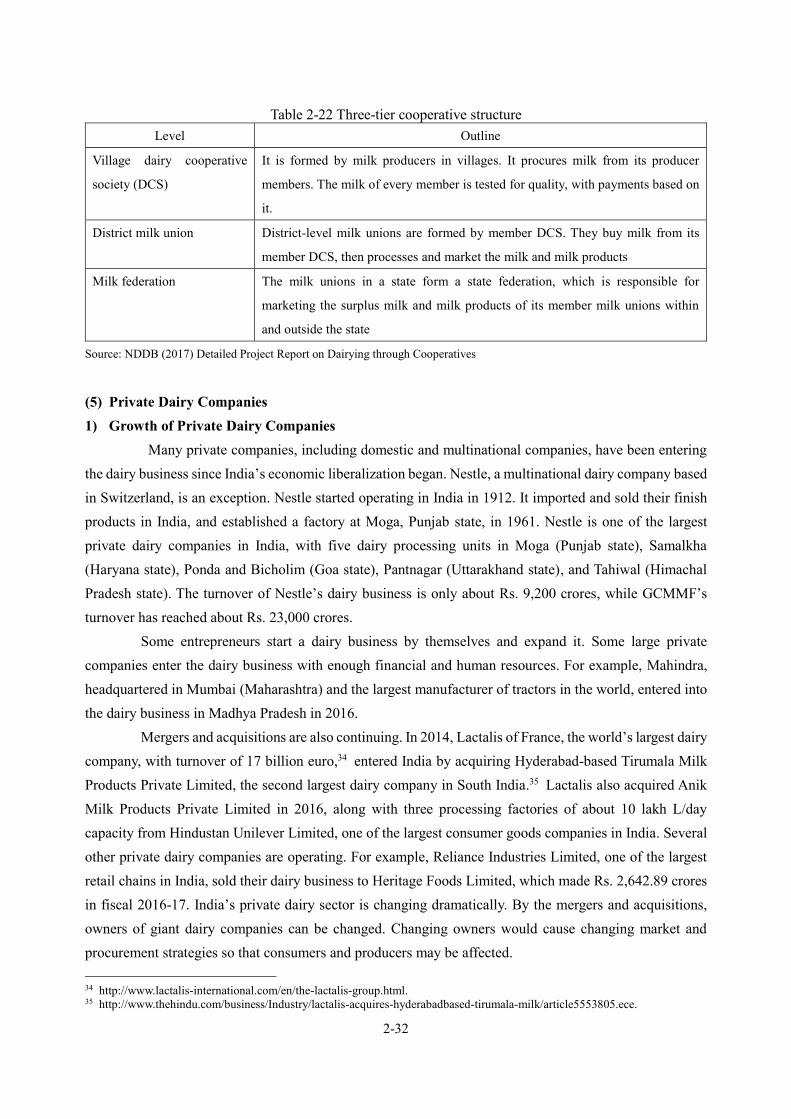
2-32
Table 2-22 Three-tier cooperative structure Level Outline
Village dairy cooperative
society (DCS)
It is formed by milk producers in villages. It procures milk from its producer
members. The milk of every member is tested for quality, with payments based on
it.
District milk union District-level milk unions are formed by member DCS. They buy milk from its
member DCS, then processes and market the milk and milk products
Milk federation The milk unions in a state form a state federation, which is responsible for
marketing the surplus milk and milk products of its member milk unions within
and outside the state
Source: NDDB (2017) Detailed Project Report on Dairying through Cooperatives
(5) Private Dairy Companies 1) Growth of Private Dairy Companies
Many private companies, including domestic and multinational companies, have been entering the dairy business since India’s economic liberalization began. Nestle, a multinational dairy company based in Switzerland, is an exception. Nestle started operating in India in 1912. It imported and sold their finish products in India, and established a factory at Moga, Punjab state, in 1961. Nestle is one of the largest private dairy companies in India, with five dairy processing units in Moga (Punjab state), Samalkha (Haryana state), Ponda and Bicholim (Goa state), Pantnagar (Uttarakhand state), and Tahiwal (Himachal Pradesh state). The turnover of Nestle’s dairy business is only about Rs. 9,200 crores, while GCMMF’s turnover has reached about Rs. 23,000 crores.
Some entrepreneurs start a dairy business by themselves and expand it. Some large private companies enter the dairy business with enough financial and human resources. For example, Mahindra, headquartered in Mumbai (Maharashtra) and the largest manufacturer of tractors in the world, entered into the dairy business in Madhya Pradesh in 2016.
Mergers and acquisitions are also continuing. In 2014, Lactalis of France, the world’s largest dairy company, with turnover of 17 billion euro,34 entered India by acquiring Hyderabad-based Tirumala Milk Products Private Limited, the second largest dairy company in South India.35 Lactalis also acquired Anik Milk Products Private Limited in 2016, along with three processing factories of about 10 lakh L/day capacity from Hindustan Unilever Limited, one of the largest consumer goods companies in India. Several other private dairy companies are operating. For example, Reliance Industries Limited, one of the largest retail chains in India, sold their dairy business to Heritage Foods Limited, which made Rs. 2,642.89 crores in fiscal 2016-17. India’s private dairy sector is changing dramatically. By the mergers and acquisitions, owners of giant dairy companies can be changed. Changing owners would cause changing market and procurement strategies so that consumers and producers may be affected. 34 http://www.lactalis-international.com/en/the-lactalis-group.html. 35 http://www.thehindu.com/business/Industry/lactalis-acquires-hyderabadbased-tirumala-milk/article5553805.ece.

2-33
2) Entry Barriers to Dairy Sector for Private Companies As mentioned, members of the Karnataka State Dairy Association claimed that the Rs.5 incentive
to dairy farmers who sell their milk to cooperative hinders their business. They also claim that private companies have to obtain a “no objection certificate” (NOC) from the cooperative federation, the Karnataka Milk Federation (KMF), before they can start a dairy business in Karnataka. Since the KMF rarely provides NOCs to private companies, newcomers cannot start a dairy business in Karnataka state. 3) Growth Rate
Figures 2-20 and 2-21 depict the average annual turnover and growth rates of nine major private dairy companies36 in India. Although annual turnover has been steadily increasing since 2010-11, average growth rates have been stagnating. According to the NDDB, major reasons behind the reduction in growth rate of annual turnover of dairy cooperatives in 2015-16 are due to decrease in sales price of SMP and procurement price of milk; SMP prices during 2015-16 were about 22% lower as compared to 2014-15, which had direct bearing on turnover of dairy cooperatives. Therefore, the growth rate of annual turnover of dairy cooperative in 2016-17 is expected to recover.
According to the NDDB and DoAHDF, support for the cooperative sector does not hinder private businesses since the share of the unorganized sector is still large. However, some private companies and public sector entities such as the MoFPI claim that support should be provided to private dairy companies for dairy development. As mentioned in Section 2.3.3, a 25% annual growth in the private dairy sector is required to achieve the NAP target. The figures of private dairy sector are calculated based on only nine private companies whose annual turnover is available. Therefore, the detail analysis needs to be conducted to capture the detail situation of private dairy companies. However, government intervention to promote the private dairy sector seems to be required to achieve the NAP target if the growth rate is lower than 25% per annual.
36 The averages of the nine major private dairy companies: Nestle India Ltd., Hatsun Agro Product Ltd., Tirumala Milk Products Pvt. Ltd., Milk Food Ltd., Heritage Foods India Ltd., VRS Foods Ltd., Kwality Ltd., Parag Milk Foods Pvt. Ltd., and SMC Foods Ltd. The total annual turnover of the nine companies in 2012-13 was about Rs. 200 billion. Considering the sale of milk and dairy products in 2016 was Rs. 6,910 billion and the sales of the GCMMF was about Rs. 380 billion, the share of the nine companies is not so large.

2-34
Figure 2-20 Average annual turnover and growth rates of nine major private companies Source: The study team based on IMARC (2017) Dairy Industry in India 2017 Edition
Figure 2-21 Total annual turnover and growth rates of milk unions Source: NDDB
(6) Funding Agency 1) World Bank
The World Bank is a major funding agency to the dairy sector in India. The World Bank supports dairy development in India through Operation Flood Phase II and III, which started in 1981 for 15 years. The National Dairy Plan (NDP) Phase I, which began in 2011-12, is being carried out through a World Bank loan37, and the NDDB is an implementing agency. The plan started in 14 states and then expanded to 18 states. The implementation period was extended from December 2017 to November 2019.
The World Bank is implementing various projects in India, including dairy sector support. For example, Assam Agribusiness and Rural Transformation Project, with a total project cost of USD 262.40 million, was approved by the World Bank in August 2017. This project aims to “add value and improve resilience of selected agriculture value chains, focusing on smallholder farmers and agro-entrepreneurs in targeted districts of Assam.” The dairy sector is a part of the project.
37 Government of India received IDA credit and passed it on to NDDDB as grant for onward disbursement to eligible end implementing agencies
0%
10%
20%
30%
0
10
20
30
2010-11 2011-12 2012-13 2013-14
%Billion IINR
YearAverage growth rate of annual turn overAverage annual turnover
0%
10%
20%
30%
0
200
400
600
800
2012-13 2013-14 2014-15 2015-16
Billion IINR
YearGrowth rate of annual turnoverTotal annual turnover

3-1
Chapter 3 National Dairy Development Board 3.1 Organizational Structure
The NDDB, initially registered as a society under the Societies Act 1860, was merged with the erstwhile Indian Dairy Corporation, a company formed and registered under the Companies Act 1956, by an Act of India’s Parliament (the NDDB Act 1987), with effect from 12 October, 1987. The new body corporate was declared an institution of national importance by the Act.
The NDDB is headquartered in Anand, Gujarat state and has four regional offices in Mumbai, Noida, Bangalore, and Kolkata. The regional offices cover in each region in western, northern, southern, and eastern India, and coordinate with governments and NDDB activities in the regions
Table 3-1 States covered by headquarters and each regional office Office Covered states
Noida Uttar Pradesh, Rajasthan, Punjab, Haryana, Himachal Pradesh, Uttarakhand, Jammu
and Kashmir
Bangalore Karnataka, Tamil Nadu, Kerala, Andhra Pradesh, Telangana
Mumbai Maharashtra, Goa, Madhya Pradesh
Kolkata West Bengal, Odisha, Bihar, Chhattisgarh, All North Eastern states except Assam
Anand (headquarters) Gujarat, Assam and Jharkhand
Source: NDDB
3.1.1 Board
The NDDB Act, 1987 stated that the general superintendence, direction, control, and management of the affairs and business of the NDDB shall be vested in a Board of Directors, which shall exercise all powers and perform all activities of the NDDB. The Board of Directors of the NDDB is determined by the NDDB Act, 1987. Its personnel as of June 9, 2017 are listed in Table 3-2. According to the NDDB Act, 1987, the Chairman and the directors are nominated by the Government of India among persons professionally qualified in one or more specialties, namely, dairying, animal husbandry, rural economics, rural development, business administration or banking. The current chairman is ex-managing director of the NDDB.

3-2
Table 3-2 Board of directors of the NDDB NDDB Act, 1987 Board of directors as of June 9, 2017
(a) Chairman Shri Dilip Rath
Chairman, National Dairy Development Board
(b) One director from amongst
the officials of the Central
Government
Joint Secretary (Dairy Development)
Department of Animal Husbandry, Dairying & Fisheries
Ministry of Agriculture & Farmers’ Welfare, Government of India, Krishi
Bhavan, New Delhi
(c) Two directors from amongst
the Chairmen of the State Co-
operative Dairy Federations
Shri Jethabhai P. Patel
Chairman, Gujarat Cooperative Milk Marketing Federation Ltd, Anand
Smt Mandakini Khadse
Chairperson, Maharashtra Rajya Sahakari Dudh Mahasangh Maryadit, Mumbai
(d) Fulltime directors, not more
than three in number, from
amongst the executives of the
highest grade of the National
Dairy Development Board38
Shri Sangram Chaudhary
Executive Director, National Dairy Development Board, Anand
Shri Y Y Patil
Executive Director, National Dairy Development Board, Anand
(e) One director, an expert, from
outside the National Dairy
Development Board
Prof. Guru Prasad Singh
Institute of Agricultural Sciences, Banaras Hindu University, Varanasi
Source: NDDB Act, 1987 and NDDB website (http://www.nddb.org/about/board).
3.1.2 Organizational Chart
Figure 3-1 depicts the organizational chart of the NDDB. A Chairman and a Managing Director are posted under the board. The NDDB has headquarters at Anand, Gujarat, and four regional offices. In addition, officers are appointed in each state to follow up on NDDB activities. The West Assam Milk Producers’ Cooperative Union (WAMUL) and Jharkhand Milk Federation (JMF) are being revitalized with the support of the NDDB, and several NDDB officers have been appointed to the WAMUL and JMF.
38 According to the NDDB, the managing director and executive directors of the NDDB are posted. Since the post of the managing director of the NDDB is currently vacant, only two executive directors are posted in this criterion.
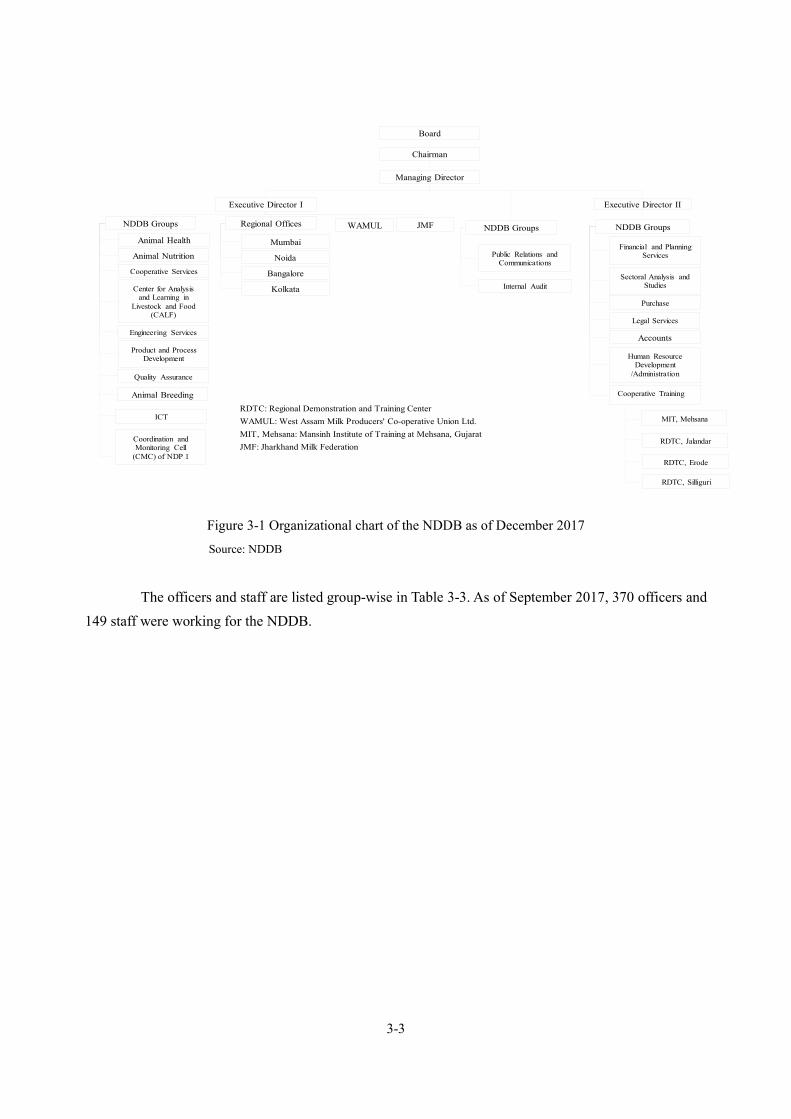
3-3
RDTC: Regional Demonstration and Training CenterWAMUL: West Assam Milk Producers' Co-operative Union Ltd.MIT, Mehsana: Mansinh Institute of Training at Mehsana, GujaratJMF: Jharkhand Milk Federation
Board
Managing Director
Executive Director I
NDDB Groups
Animal Health
Animal Nutrition
Cooperative Services
Center for Analysis and Learning in
Livestock and Food (CALF)
Engineering Services
Product and Process Development
Quality Assurance
Regional Offices
Mumbai
Noida
Bangalore
Kolkata
RDTC, Jalandar
RDTC, Erode
RDTC, Silliguri
WAMUL NDDB Groups
Animal Breeding
Accounts
Human Resource Development
/Administration
Public Relations and Communications
MIT, Mehsana
NDDB Groups
Coordination and Monitoring Cell
(CMC) of NDP 1
ICT
Financial and Planning Services
Sectoral Analysis and Studies
Purchase
Legal Services
JMF
Cooperative Training
Chairman
Internal Audit
Executive Director II
Figure 3-1 Organizational chart of the NDDB as of December 2017 Source: NDDB
The officers and staff are listed group-wise in Table 3-3. As of September 2017, 370 officers and
149 staff were working for the NDDB.

3-4
Table 3-3 Number of officers and staff working for the NDDB as of September 2017 Group Officers Staff Total Group Officers Staff Total
Animal Breeding 27 5 32 Engineering Services 75 3 78 Accounts 18 14 32 Human Resource Development 6 3 9
Administration 4 47 51 Information and Communication Technologies
17 3 20
Administration, Utility Services
6 1 7 Legal Services 2 2 4
Animal Health 11 5 16 Financial and Planning Services 17 1 18
Animal Nutrition 29 4 33 Coordination and Monitoring Cell of Project Management Unit
15 2 17
Centre for Analysis and Learning in Food and Feed (CALF)
14 16 30 Product and Process Development
6 3 9
CEO office 2 3 5 Public Relations and Communication
5 21 26
Cooperative Services 48 3 51 Purchase 14 3 17 Cooperative Training 24 8 32 Quality Assurance 9 1 10 Executive Director’s Office 2 0 2 Sectoral Analysis and Studies 19 1 20 Total 370 149 519
Note: Officers include managing director to private secretary while staff is rather assistant work (workers are not included). Source: NDDB
3.1.3 NDDB’s Role
Fundamental to NDDB's efforts are cooperative principles and cooperative strategies. The NDDB was created to promote, finance and support producer-owned and controlled organization such as dairy cooperatives and producer companies. NDDB's programs and activities seek to strengthen farmer cooperatives and support national policies that are favorable to the growth of such institutions.
For the purpose, the following groups of the NDDB provide supports to cooperatives and producer companies as summarized in Table 3-4.
Table 3-4 Groups providing supports to cooperatives and producer companies6
Group Activities
Animal breeding To provide technical assistance for improvement of animal breeding such as increase in the
percentage of breedable animals inseminated, increase in high quality disease free semen doses
production, increase in the number of bulls for semen production, and increase in percentage
of bull with progeny testing and pedigree selection program
Animal health To provide technical assistant to create awareness among dairy farmers on animal health
issues, formulate and field test disease control models for economically important diseases,
provide inputs to the DoAHDF in matters related to veterinary in matter related to international
trade of animals and animal products, provide inputs to the DoAHDF in matters related to
veterinary legislation and disease control, facilitate the DoAHDF in developing appropriate

3-5
bio-security protocols for semen stations and bull production areas to ensure disease free
semen production.
Animal nutrition To provide technical assistant and advisory services in the areas of ration balancing
programme, area specific mineral mixture, bypass protein supplement/feed, bypass fat
supplement, methane measurement from ruminants, calf nutrition, compounds cattle feed, urea
molasses mineral block licks, R&D initiatives for developing feed supplements, and green
fodder production enhancement
Cooperative
services
To assist cooperatives for institution building39, strengthening procurement system, enhancing
women involvement, legal framework of cooperatives, village based milk procurement system
under NDP I, and new generation cooperatives leading to producer companies
Cooperative
training
To provide trainings to various stakeholders in dairy sectors in collaboration with various
national and international agencies. The NDDB established five dedicated training centers
across India40.
Engineering
services
To provide technical support on consultancy basis to dairy cooperatives, such as site selection,
selection of technology, preparation of plant layout, engineering drawings, tender documents,
when dairy cooperatives set up infrastructural facilities for milk processing and manufacturing
plants of dairy products, cattle feed.
Quality assurance To facilitate cooperatives and producer companies to provide clean, safe and wholesome milk
through science based intervention.
Source: NDDB’s website
3.2 Financial Status
The financial indicators show that the NDDB makes a net profit and has a low but positive return-on-assets ratio and return-on-equity ratio, a high capital adequacy ratio, a low gross loan portfolio-to-total asset ratio, and a high cash and bank balance-to-assets ratio. The NDDB has non-performing assets and has occasionally written off bad debts, but it has sufficient assets to cover them, and its assets have not decreased for the past six years. Those indicators indicate that the NDDB has been steadily providing loans at a profit. Details on these financial indicators are provided below. 3.2.1 Financial Indicators (1) Net Profit
Net profit after tax (surplus during the year after tax) of the NDDB during the last six years is summarized in Table 3-5. The NDDB has been making a net profit for the last six years.
39 Supports for cooperative’s branding and marketing are also included. Marketing analysis is supported by Sectoral Analysis and Studies Group 40 The training are mainly provided at regional training center and headquarter of the NDDB to staff of dairy cooperatives and farmers. In case of exposure visit and some training for cooperative staff are provided in the field.

3-6
Table 3-5 Net profit after tax of the NDDB from 2010-11 to 2015-16 (in million rupees) 2010-11 2011-12 2012-13 2013-14 2014-15 2015-16
Net profit after tax 1,366.70 523.49 384.8241 969.32 734.67 1,124.38
Source: NDDB
(2) Return on Assets Although the NDDB’s return on assets and return on equity are relatively low, the NDDB has
been profitable over the past six years.
Return on Assets Ratio =𝑁𝑒𝑡 𝑝𝑟𝑜𝑓𝑖𝑡 𝑎𝑓𝑡𝑒𝑟 𝑡𝑎𝑥
𝐴𝑠𝑠𝑒𝑡𝑠
Table 3-6 Net profit after tax of the NDDB from 2010-11 to 2015-16 (in million rupee) 2010-11 2011-12 2012-13 2013-14 2014-15 2015-16
Net profit after tax 1,366.70 523.49 384.82 969.32 734.67 1,124.38
Assets 34,251.00 32,781.42 33,405.62 33,384.81 34,002.79 35,360.52
Return on Assets Ratio 4.0% 1.6% 1.2% 2.9% 2.2% 3.2%
Source: NDDB
(3) Return on Equity
Assuming “NDDB fund” on the financial report as equity (capital) of the NDDB, the return on equity ratio has been relatively low in the range of 1.5% to 5.6% but has kept positive for six years.
Return on Equity (Capital) Ratio =𝑁𝑒𝑡 𝑝𝑟𝑜𝑓𝑖𝑡 𝑎𝑓𝑡𝑒𝑟 𝑡𝑎𝑥
𝐸𝑞𝑢𝑖𝑡𝑦 (𝐶𝑎𝑝𝑖𝑡𝑎𝑙)
Table 3-7 Net profit after tax of the NDDB from 2010-11 to 2015-16 (in million rupees) 2010-11 2011-12 2012-13 2013-14 2014-15 2015-16
Net profit after tax 1,366.70 523.49 384.82 969.32 734.67 1,124.38
Equity (Capital) 24,335.26 24,804.41 25,184.46 26,153.42 26,887.73 28,032.67
Return on Equity (Capital)
Ratio
5.6% 2.1% 1.5% 3.7% 2.7% 4.0%
Source: NDDB annual report from 2010-11 to 2015-16
(4) Capital Adequacy Ratio
The capital adequacy ratio indicates financial soundness: the higher the ratio, the healthier the financial state. Taking the “NDDB fund” in the financial report as the equity (capital) of the NDDB, the capital adequacy ratio has been quite high, in the range of 71.0% to 79.3%.
Capital Adequacy Ratio =𝐶𝑎𝑝𝑖𝑡𝑎𝑙
𝐴𝑠𝑠𝑒𝑡𝑠
41 The profit in 2012-13 is low because of writing off of bad debts, lower write back of excess provision as compared to previous year, and lower interest income on investment in bonds according to the NDDB.

3-7
Table 3-8 Net profit after tax of the NDDB from 2010-11 to 2015-16 (in million rupees) 2010-11 2011-12 2012-13 2013-14 2014-15 2015-16
Capital 24,335.26 24,804.41 25,184.46 26,153.42 26,887.73 28,032.67
Assets 34,251.00 32,781.42 33,405.62 33,384.81 34,002.79 35,360.52
Capital Adequacy Ratio 71.0% 75.7% 75.4% 78.3% 79.1% 79.3%
Source: NDDB annual report from 2010-11 to 2015-16
(5) Gross Loan Portfolio to Total Assets The gross loan portfolio-to-total assets ratio indicates the effectiveness of the NDDB’s use of
assets for lending activities. Taking the “NDDB fund” in the financial report as the equity (capital) of the NDDB, the gross loan portfolio-to-total assets ratio has been relatively low, in the range of 24.7% to 43.8%.
Gross Loan Portfolio to Total Assets =𝐺𝑟𝑜𝑠𝑠 𝑙𝑜𝑎𝑛 𝑝𝑜𝑟𝑡𝑓𝑜𝑙𝑖𝑜
𝐴𝑠𝑠𝑒𝑡𝑠
Table 3-9 Gross loan portfolio to total assets of the NDDB from 2010-11 to 2015-16 (in million rupees) 2010-11 2011-12 2012-13 2013-14 2014-15 2015-16
Loans to dairy cooperatives 4,020.34 3,911.91 4,924.38 6,792.45 7,673.86 9,328.24
Loans to oil cooperatives 1,984.23 1,953.94 1,950.48 1,426.82 3,271.30 2,412.83
Loans and advances to subsidiary
companies/managed units
2,448.75 2,961.99 2,835.87 2,497.73 3,771.00 3,735.38
Total loans and advances to
cooperatives and subsidiary
companies /managed units
8,453.32 8,827.84 9,710.73 10,717.00 14,716.16 15,476.45
Assets 34,251.00 32,781.42 33,405.62 33,384.81 34,002.79 35,360.52
Gross Loan Portfolio to Total Assets 24.7% 26.9% 29.1% 32.1% 43.3% 43.8%
Source: NDDB annual report from 2010-11 to 2015-16
(6) Cash and Bank Balances to Assets In 2015-16, the NDDB had 23.8% of cash and bank balances (Rs. 8, 423 million) out of total
assets (Rs. 35,360 million), which means that its financial resources are stable because it holds a relatively large amount of cash and deposits.
Cahs and Bank Balances to Assets =𝐶𝑎𝑠ℎ 𝑎𝑛𝑑 𝐵𝑎𝑛𝑘 𝐵𝑎𝑙𝑎𝑛𝑐𝑒𝑠
𝐴𝑠𝑠𝑒𝑡𝑠
Table 3-10 Gross loan portfolio to total asset of the NDDB from 2010-11 to 2015-16 (in million rupees) 2010-11 2011-12 2012-13 2013-14 2014-15 2015-16
Cash and bank balances 1,353.85 4,597.76 6,406.76 9,391.79 7,772.71 8,422.88
Assets 34,251.00 32,781.42 33,405.62 33,384.81 34,002.79 35,360.52
Cash and bank balances to asset ratio 4.0% 14.0% 19.2% 28.1% 22.9% 23.8%
Source: NDDB annual report from 2010-11 to 2015-16

3-8
(7) Non-performing Assets The NDDB has non-performing assets and has occasionally written off bad debts, as shown in
Table 3-11. Non-performing assets were large, Rs. 2,578 million, in 2015-16, but the NDDB has sufficient assets to cover them, and its assets have not decreased. Table 3-11 Gross loan portfolio to total assets of the NDDB from 2010-11 to 2015-16 (in million rupees)42
2010-11 2011-12 2012-13 2013-14 2014-15 2015-16
Non-performing assets 5,972.25 4,444.63 4,190.87 3,492.62 3,444.30 2,578.16
Bad debts written off 20.91 0.46 119.20 422.49 - 319.92
Source: NDDB annual report from 2010-11 to 2015-16
3.3 Scheme for Supporting Cooperatives and Loan Condition 3.3.1 Loan Disbursements for Last Ten Years The NDDB has continued to provide technical and financial assistance to dairy cooperatives to augment processing facilities and implement their programs. Its financial assistance can be divided into two categories: long-term project funds and working capital (short-term loans). The NDDB’s loan disbursements over the last ten years are given below.
Table 3-12 Loan disbursements by the NDDB from 2007-08 to 2016-17 (in crore rupees)
Particulars 2007-08 2008-09 2009-10 2010-11 2011-12 2012-13 2013-14 2014-15 2015-16 2016-17
Long-term project
funds 110.61 92.77 100.33 31.62 153.52 168.82 274.25 235.92 278.56 224.28
Working capital/
Short-term loans 300.01 161.86 37.47 58.4 133.93 78.5 71.12 153.78 259.24 111.84
Total 410.62 254.63 137.8 90.02 287.45 247.32 345.37 389.71 537.8 336.12
Source: NDDB
42 This includes Rs. 2,412.82 million as loan outstanding against oil cooperatives most of which are under liquidation. Initially, these oil cooperatives were viable and making profit. However, after announcement open general license by the Government of India in early 1990s, cheaper oils were imported, which distorted the market for domestically produced oil, so that many oil cooperatives started making losses and closed their operations.

3-9
Table 3-13 Statement of principal and interest repayments during last five years Particulars 2012-13 2013-14 2014-15 2015-16 2016-17
Principal Repayment
Term Loan 82.81 108.83 86.78 197.56 162.71
WC Loan 63.82 82.35 84.35 177.59 275.24
Total 146.63 191.18 171.13 375.15 437.95
Interest Payments
Interest on Term Loan 34.23 48.17 63.44 71.02 73.48
Interest on WC Loan 12.97 12.67 15.49 22.51 14.66
Loan Interest Total 47.19 60.85 78.93 93.53 88.14 Source: NDDB
In 2015-16, while the NDDB continued to provide financial assistance to projects approved under the Perspective Plan, a new scheme for “providing financial assistance for infrastructure activities, skill development and training” was introduced. 3.3.2 Loan Term and Loan Eligibility Criteria (1) Loan Team
As mentioned above, the NDDB provides both the long term and short term loans. The loan terms of them are summarized below. As of September 2017, the loan terms of them are summarized in Table 3-14.
Table 3-14 Loan terms of short and long term loans provided by the NDDB Interest rate Tenure of the loan Security and other conditions
Short term
Changeable at a floating rate of interest (8.5% per annum as of September 2017)
Maximum 12 months First charge on entire movable assets including stock and debtors by way of hypothecation
Long term
8.25% per annum Maximum ten years including maximum two years moratorium period
Minimum borrower’s contribution is 20% of project costs.
Source: NDDB
(2) Loan Eligibility Criteria
As per the NDDB’s lending policy for new schemes (“providing financial assistance for infrastructure activities, skill development and training”), the NDDB set up the following basic eligibility criteria (please see the Annex 12 for details of these criteria).

3-10
After providing a 10% sensitivity for both liquid milk sales and milk procurement, financial assistance projects for infrastructure activities should meet the minimum viability criteria of
ROI = 12% and Debt Service Coverage Ratio (DSCR) more than 1.5 times Calculation of DSCR is as follows:
DSCR =Sum of projected (Profit after tax + Depreciation + Interest) over the repayment period
Total repayment (i. e. , Principal + Interest)
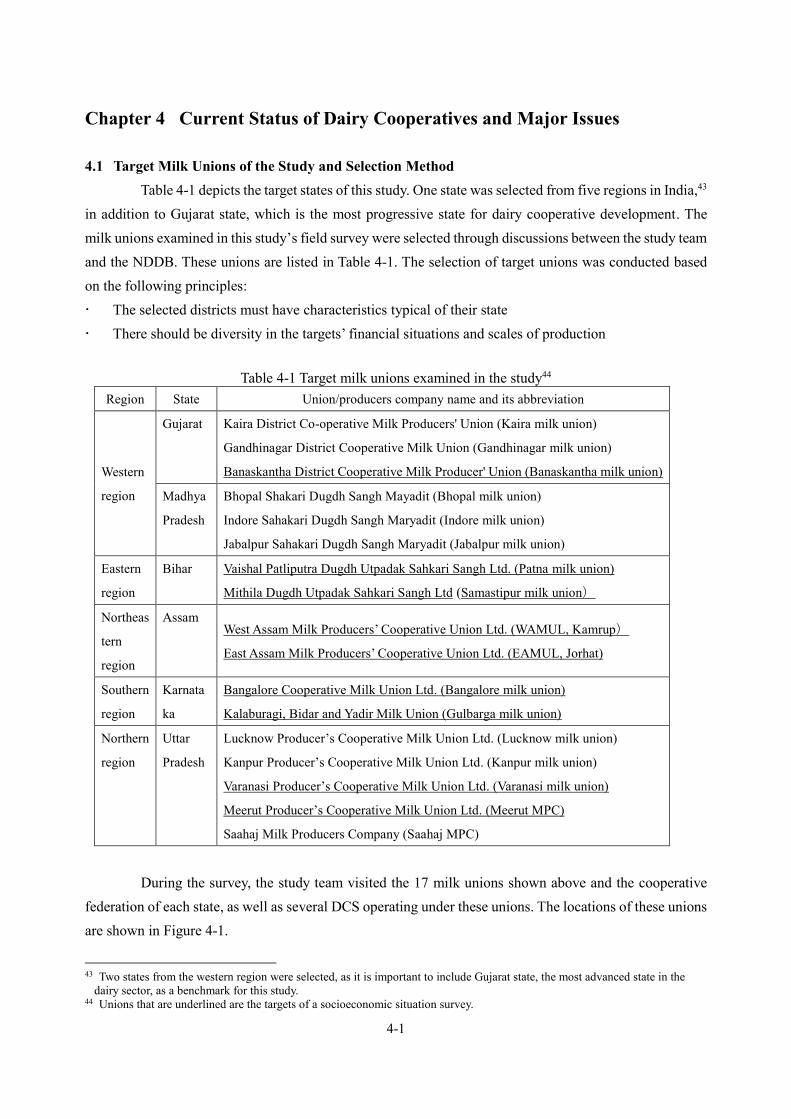
4-1
Chapter 4 Current Status of Dairy Cooperatives and Major Issues 4.1 Target Milk Unions of the Study and Selection Method
Table 4-1 depicts the target states of this study. One state was selected from five regions in India,43 in addition to Gujarat state, which is the most progressive state for dairy cooperative development. The milk unions examined in this study’s field survey were selected through discussions between the study team and the NDDB. These unions are listed in Table 4-1. The selection of target unions was conducted based on the following principles: The selected districts must have characteristics typical of their state There should be diversity in the targets’ financial situations and scales of production
Table 4-1 Target milk unions examined in the study44
Region State Union/producers company name and its abbreviation
Western
region
Gujarat Kaira District Co-operative Milk Producers' Union (Kaira milk union)
Gandhinagar District Cooperative Milk Union (Gandhinagar milk union)
Banaskantha District Cooperative Milk Producer' Union (Banaskantha milk union)
Madhya
Pradesh
Bhopal Shakari Dugdh Sangh Mayadit (Bhopal milk union)
Indore Sahakari Dugdh Sangh Maryadit (Indore milk union)
Jabalpur Sahakari Dugdh Sangh Maryadit (Jabalpur milk union)
Eastern
region
Bihar Vaishal Patliputra Dugdh Utpadak Sahkari Sangh Ltd. (Patna milk union)
Mithila Dugdh Utpadak Sahkari Sangh Ltd (Samastipur milk union)
Northeas
tern
region
Assam West Assam Milk Producers’ Cooperative Union Ltd. (WAMUL, Kamrup)
East Assam Milk Producers’ Cooperative Union Ltd. (EAMUL, Jorhat)
Southern
region
Karnata
ka
Bangalore Cooperative Milk Union Ltd. (Bangalore milk union)
Kalaburagi, Bidar and Yadir Milk Union (Gulbarga milk union)
Northern
region
Uttar
Pradesh
Lucknow Producer’s Cooperative Milk Union Ltd. (Lucknow milk union)
Kanpur Producer’s Cooperative Milk Union Ltd. (Kanpur milk union)
Varanasi Producer’s Cooperative Milk Union Ltd. (Varanasi milk union)
Meerut Producer’s Cooperative Milk Union Ltd. (Meerut MPC)
Saahaj Milk Producers Company (Saahaj MPC)
During the survey, the study team visited the 17 milk unions shown above and the cooperative
federation of each state, as well as several DCS operating under these unions. The locations of these unions are shown in Figure 4-1.
43 Two states from the western region were selected, as it is important to include Gujarat state, the most advanced state in the
dairy sector, as a benchmark for this study. 44 Unions that are underlined are the targets of a socioeconomic situation survey.

4-2
Figure 4-1 Locations of target unions
Source of the map: https://commons.wikimedia.org/wiki/File:India_states_and_union_territories_map.svg
Table 4-2 presents the basic facts on milk production, milk procurement by dairy cooperatives,
and milk sales for the cooperatives for each state. The shaded rows indicate the target states of the study. One can see the significant differences among the target states. For example, even though Uttar Pradesh has the largest milk production, the procurement volume of its cooperatives is quite small. Gujarat has the largest cooperative procurement volume and ratio to milk production, followed by Karnataka. Assam’s cooperatives have the smallest volume of milk production and procurement. Bihar and Madhya Pradesh are somewhere between Assam and Karnataka.
Lucknow
Kanpur Varanasi Patna
Samastipur
Meerut
Saahaj Kamrup
Jabalpur Bhopal
Indore
Banaskantha
Gandhinagar
Kaira
Gulbarga
Bangalore
States of and Union Territories Map of India
Jorhat
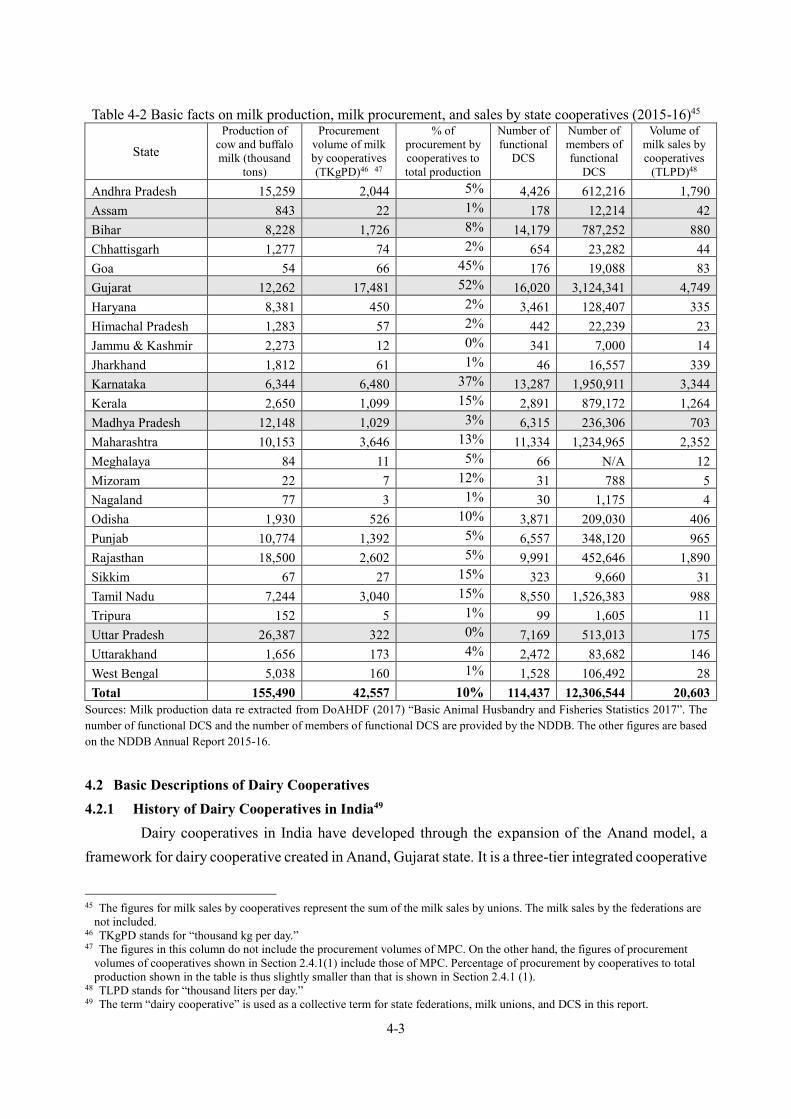
4-3
Table 4-2 Basic facts on milk production, milk procurement, and sales by state cooperatives (2015-16)45
State Production of
cow and buffalo milk (thousand
tons)
Procurement volume of milk by cooperatives (TKgPD)46 47
% of procurement by cooperatives to total production
Number of functional
DCS
Number of members of functional
DCS
Volume of milk sales by cooperatives
(TLPD)48 Andhra Pradesh 15,259 2,044 5% 4,426 612,216 1,790 Assam 843 22 1% 178 12,214 42 Bihar 8,228 1,726 8% 14,179 787,252 880 Chhattisgarh 1,277 74 2% 654 23,282 44 Goa 54 66 45% 176 19,088 83 Gujarat 12,262 17,481 52% 16,020 3,124,341 4,749 Haryana 8,381 450 2% 3,461 128,407 335 Himachal Pradesh 1,283 57 2% 442 22,239 23 Jammu & Kashmir 2,273 12 0% 341 7,000 14 Jharkhand 1,812 61 1% 46 16,557 339 Karnataka 6,344 6,480 37% 13,287 1,950,911 3,344 Kerala 2,650 1,099 15% 2,891 879,172 1,264 Madhya Pradesh 12,148 1,029 3% 6,315 236,306 703 Maharashtra 10,153 3,646 13% 11,334 1,234,965 2,352 Meghalaya 84 11 5% 66 N/A 12 Mizoram 22 7 12% 31 788 5 Nagaland 77 3 1% 30 1,175 4 Odisha 1,930 526 10% 3,871 209,030 406 Punjab 10,774 1,392 5% 6,557 348,120 965 Rajasthan 18,500 2,602 5% 9,991 452,646 1,890 Sikkim 67 27 15% 323 9,660 31 Tamil Nadu 7,244 3,040 15% 8,550 1,526,383 988 Tripura 152 5 1% 99 1,605 11 Uttar Pradesh 26,387 322 0% 7,169 513,013 175 Uttarakhand 1,656 173 4% 2,472 83,682 146 West Bengal 5,038 160 1% 1,528 106,492 28 Total 155,490 42,557 10% 114,437 12,306,544 20,603
Sources: Milk production data re extracted from DoAHDF (2017) “Basic Animal Husbandry and Fisheries Statistics 2017”. The number of functional DCS and the number of members of functional DCS are provided by the NDDB. The other figures are based on the NDDB Annual Report 2015-16.
4.2 Basic Descriptions of Dairy Cooperatives 4.2.1 History of Dairy Cooperatives in India49
Dairy cooperatives in India have developed through the expansion of the Anand model, a framework for dairy cooperative created in Anand, Gujarat state. It is a three-tier integrated cooperative
45 The figures for milk sales by cooperatives represent the sum of the milk sales by unions. The milk sales by the federations are
not included. 46 TKgPD stands for “thousand kg per day.” 47 The figures in this column do not include the procurement volumes of MPC. On the other hand, the figures of procurement
volumes of cooperatives shown in Section 2.4.1(1) include those of MPC. Percentage of procurement by cooperatives to total production shown in the table is thus slightly smaller than that is shown in Section 2.4.1 (1).
48 TLPD stands for “thousand liters per day.” 49 The term “dairy cooperative” is used as a collective term for state federations, milk unions, and DCS in this report.

4-4
structure for procuring, processing and marketing milk. The basic framework of the Anand model is composed of the following three closely related but financially independent institutions: Dairy Cooperative Society (DCS):50 This is formed by village milk producers and procures milk
from its producer members. Members’ milk is tested for quality, and payment is based on it.
Milk Union: District-level milk unions are formed by member DCSs. The union buys milk from its member DCS, then processes and markets the milk and dairy products.
State federation: The milk unions in a state form a state federation, which is responsible for marketing the surplus milk and dairy products of its member milk unions within and outside the state.
The Anand model was extended to other states of India by the NDDB through Operation
Flood programs, which helped establish 73,000 DCSs in 22 states between 1970 and 1996. When the program ended in 1996, 9 million milk-producing households had joined dairy cooperatives, and total milk production had increased from 21.2 million tons in 1968/69 to 69.1 million tons by the end of 1996/97. The table below shows the historical progress of the number of organized DCS all over India.
Table 4-3 Historical progress of the number of organized DCS Financial
Year Organised DCS
(thousand) 1971-72 1.8
1981-82 18.4
1991-92 64.4
1995-96 73.0
2001-02 1,00.8
2011-12 1,47.9
2015-16 1,73.5
Source: NDDB
4.2.2 Milk Producer Company
The formation of milk producer companies (MPCs) is a significant recent phenomenon in India’s dairy sector. MPCs are producer-owned enterprises incorporated under Part IX A of the Companies Act; DCS and milk unions fall under the Cooperative Act of each state. MPCs are expected to prosper under the liberal regulatory framework of the Company Act while maintaining the institutional strengths offered by
50 In cases of village-level dairy cooperation, a Milk Producers Institute (MPI) is often established. If the management of the
MPI becomes stable, it usually becomes a DCS. While the DCS is registered with the designated department of the state government, the MPI is not. Otherwise, there is no real difference between a DCS and MPI in terms of management or the rights of members.

4-5
mutual assistance, which is also shared with the principles of cooperative. The formation of MPCs was prompted by the following problems in the management of dairy cooperatives:
There is a widespread recognition that many dairy cooperatives have not functioned well due to
inappropriate political intervention. Examples include the fact that board member elections and the management of cooperatives are often influenced by partisan politics, and subsidies are provided inefficiently.
In many state federations, large volumes of shares are owned by the state governments, and some board members are representatives of these governments. Moreover, interventions by state governments are frequent, and affect personnel affairs and retail and procurement prices.
The speed of decision making is slower than in private companies.
Between 2012 and 2014, five MPCs were formed via the facilitation of the NDDB Dairy Services (NDS), a subsidiary of the NDDB.51 Table 4-4 provides basic descriptions of the five MPCs. Another eight MPCs have also recently been formed by the NDS.
Table 4-4 Basic description of MPCs Name of MPC State Number of
members Volume of milk
procurement (TKgPD) Turnover 2016/17 (million rupees)
Paayas Rajasthan 112,460 650 106.2
Maahi Gujarat 99,913 633 119.1
Shreeja Andhra Pradesh 67,883 270 30.2
Baani Punjab 40,805 180 26
Saahaj Uttar Pradesh 91,085 345 49.8
Source: Presentation by NDS
The important characteristics of the management of MPCs are as follows:52 While the Cooperative Act is enacted by the state governments, the Company Act is legislated by the
central government. Therefore, the scope of intervention by the state government is limited. They do not rely too much on subsidies from state governments in order to avoid interventions. Their
major source of funding is the soft loans from the NDDB. Them members of the MPCs are the shareholders of the MPC they belong and can convey direct voices
to the management of the MPC. On the other hand, the voices of members of dairy cooperatives can be only indirectly conveyed in the management of milk unions and state federations. The managements of the MPCs are thought to be more autonomous than those of dairy cooperatives.
51 These MPCs have received financial support from the NDP to build the necessary infrastructure for their procurement
activities and cold chains. 52 These points were raised during the interview with the NDS.

4-6
Where DCS are not present or have weak coverage, the formation of MPCs are generally encouraged53. Conversion from existing Cooperative to Producer company is possible as per Part IX of the Companies Act. However, it is voluntary for milk cooperatives to convert into MPC.
There is no difference between milk union and MPC for the financial or other supports they could get from public institutions.
4.2.3 Value Chains of Dairy Products
The basic characteristics of the value chains for milk production, procurement, processing, and sales differ from state to state.
Figure 4-2 depicts the value chain for milk in Bihar state, Karnataka state, Madhya Pradesh state, and Uttar Pradesh state. The left-hand side of the figure shows the value chain for milk in the unorganized sector, where the end-products are loose milk and local dairy products such as ghee, curd, and local sweets. Most of the milk in this sector is brought to loose milk and dairy product shops54, hotels, and restaurants by middlemen, who usually buy the milk at the farm gates. Some farmers who live near urban areas bring their own milk directly to the shops or hotels/restaurants themselves.
The central portion of the figure indicates the value chains for milk packed by private dairy firms. In this chain, some of the milk is brought by farmers to the collection centers of private dairy firms located in the village. The milk is delivered to the firms’ plants for processing and packing. Some private dairy firms receive milk from middlemen. The packed milk and other dairy products processed at the plants are sold through distributors (wholesalers) and retailers.
The right-hand part of the figure shows the value chains of milk cooperatives and milk producer companies (MPCs). Cooperative members bring their milk to the DCS collection point. Some of the milk is delivered to the dairy plant of the milk union through BMCs or chilling centers. If the village is located near the union’s plant, it is delivered directly to the plant. After the milk is processed and packed, liquid milk, yogurt and sweets are sold by unions and delivered to retailors and cooperative parlors through distributors. Other dairy products produced at the union plants such as ice cream are sold by the state federations. Moreover, the surplus milk, which are excess to the quantity demanded in the state, are sold to cooperatives in other states. Many state federations have their own dairy processing plants; the products manufactured at the plants of the state federations are also delivered to distributors and eventually sold at retailers and parlors. The members of MPC bring their milk to milk pooling points (MPP). As the MPC do not have their own processing plant yet, the milk is taken from MPP to the hired plants and then sold to distributors.
53 This description is written in the PIP paper of the NDP project. 54 Loose milk shops refer to the shops which sell raw milk.
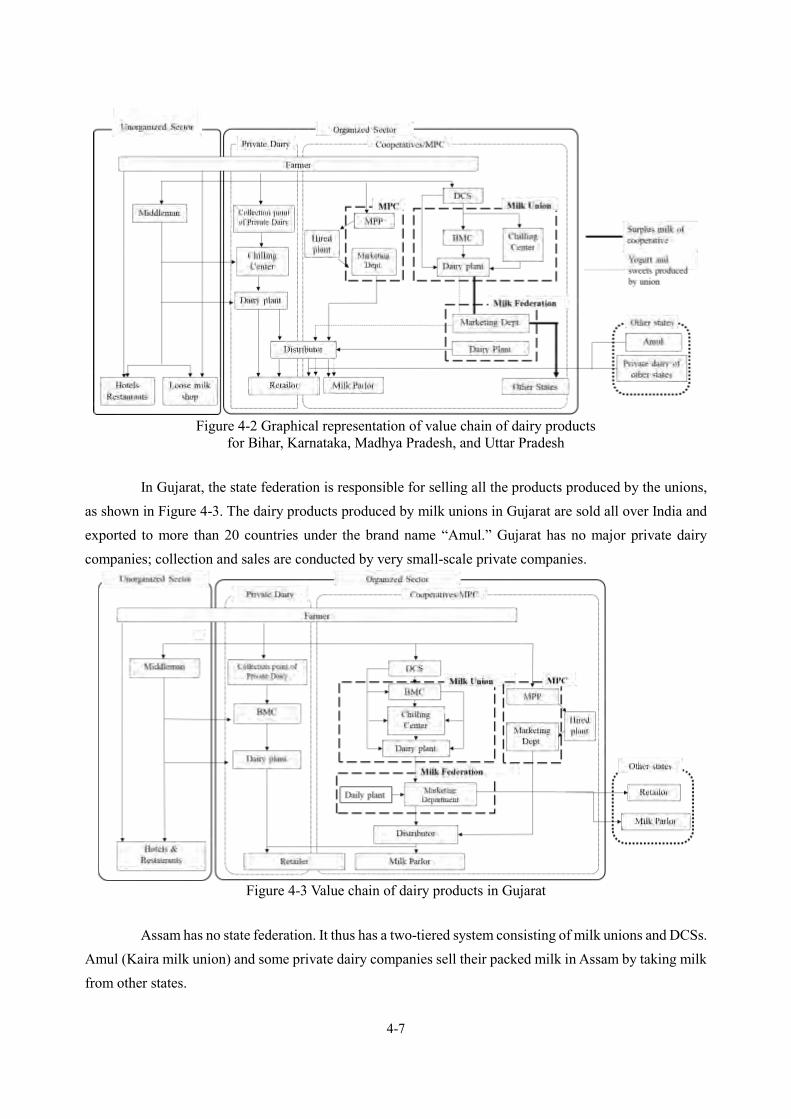
4-7
Figure 4-2 Graphical representation of value chain of dairy products
for Bihar, Karnataka, Madhya Pradesh, and Uttar Pradesh
In Gujarat, the state federation is responsible for selling all the products produced by the unions, as shown in Figure 4-3. The dairy products produced by milk unions in Gujarat are sold all over India and exported to more than 20 countries under the brand name “Amul.” Gujarat has no major private dairy companies; collection and sales are conducted by very small-scale private companies.
Figure 4-3 Value chain of dairy products in Gujarat
Assam has no state federation. It thus has a two-tiered system consisting of milk unions and DCSs. Amul (Kaira milk union) and some private dairy companies sell their packed milk in Assam by taking milk from other states.
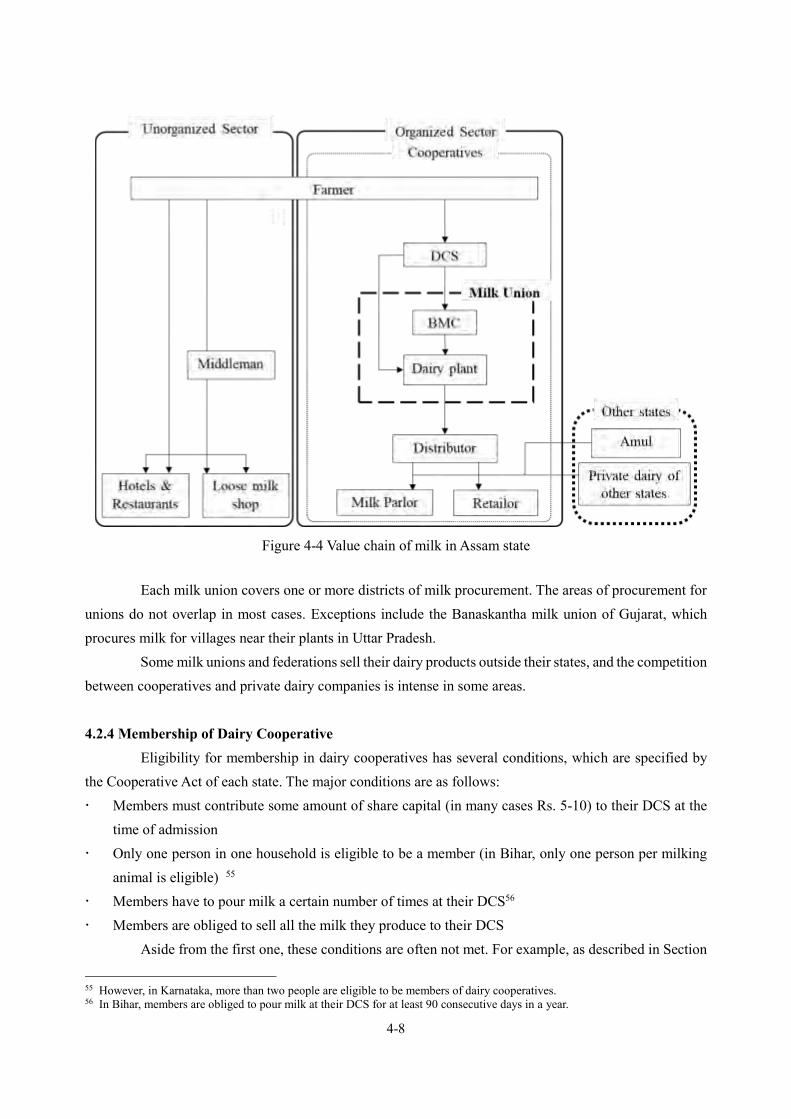
4-8
Figure 4-4 Value chain of milk in Assam state
Each milk union covers one or more districts of milk procurement. The areas of procurement for
unions do not overlap in most cases. Exceptions include the Banaskantha milk union of Gujarat, which procures milk for villages near their plants in Uttar Pradesh.
Some milk unions and federations sell their dairy products outside their states, and the competition between cooperatives and private dairy companies is intense in some areas.
4.2.4 Membership of Dairy Cooperative Eligibility for membership in dairy cooperatives has several conditions, which are specified by
the Cooperative Act of each state. The major conditions are as follows: Members must contribute some amount of share capital (in many cases Rs. 5-10) to their DCS at the
time of admission Only one person in one household is eligible to be a member (in Bihar, only one person per milking
animal is eligible) 55 Members have to pour milk a certain number of times at their DCS56 Members are obliged to sell all the milk they produce to their DCS
Aside from the first one, these conditions are often not met. For example, as described in Section
55 However, in Karnataka, more than two people are eligible to be members of dairy cooperatives. 56 In Bihar, members are obliged to pour milk at their DCS for at least 90 consecutive days in a year.

4-9
5.5.1, the socio-economic situation survey found that some of the DCS members sell their milk to middlemen or private dairy firms. This tendency is more significant when the purchase price of milk rises in the summer57.
It is actually very difficult for DCS or Milk Unions to monitor the sales behaviors of all the members. Also, DCSs cannot annul the membership of those who sell their milk to other institutions even if they found it, as the increase in the livelihood of member is a major target of the dairy cooperatives and sales of milk to other institutions is a way to do it in some cases.
4.3 Management and Financial Situation of Dairy Cooperatives 4.3.1 State federation
Table 4-5 lists the names of state federations for the target states and the brand names of the dairy products produced by the dairy cooperatives.58
Table 4-5 Names of state federations for the target states and the brand names of the dairy products
produced by dairy cooperatives for each state
State Name of state-level organization Brand
name
Procurement volume of milk by cooperatives
(TKgPD)
Gujarat Gujarat Cooperative Milk Marketing Federation Ltd.
(GCMMF) Amul 17,481
Bihar Bihar State Cooperative Milk Producers' Federation
Ltd (COMFED) Sudha 1,726
Assam N/A Purbi 22
Karnataka Karnataka Cooperative State Federation Ltd. (KMF) Nandini 6,480
Madhya Pradesh Madhya Pradesh State Cooperative Dairy Federation
Ltd. (MPCDF) Sanchi 1,029
Uttar Pradesh Pradeshik Cooperative Dairy Federation Ltd. (PCF) Parag 322
Source: NDDB
(1) Composition of Board of Directors
Table 4-6 depicts the composition of the board of directors (the decision-making body) of the state federations of the target states.59 In all these state federations, the board members consist of members elected by the cooperative members as their representatives as well as nominated members, who mostly represent various bodies of state governments and the NDDB. Except for Gujarat, large proportions of the board members are representatives of the state government, which indicates the significant influence of the
57 As a result, the procurement volumes of milk unions tend to more fluctuate if they face more competition in procuring milk.
This point will be discussed further in Section 4.7.2. 58 All the dairy products produced by the dairy cooperatives (milk unions and federations) of each state are sold under a single
brand name. 59 Assam has no state federation.

4-10
state governments in the decision making of the state federations. Many experts in the dairy sector pointed out that where the state governments have significant influences on the management of the state federation (sometimes of the milk union), the interventions of the state government often harm the sound management of the federations. The intervention of the state governments sometimes extends to the human affairs of the state federations (and sometimes milk unions) where many of the personnel are hired by the political interests which make it difficult to hire professional personnel60.
Table 4-6 Composition of the boards of directors of the state federations State Number of
elected members
Number of nominated members
List of nominated members
Gujarat 18 2 Registrar (IAS) Managing Director
Bihar 6 5 Representative of Finance Dept. of Bihar Government Registrar of Cooperatives (IAS) Representative of the NDDB Representative of Department of Animal Husbandry (Bihar
government) Managing Director (IAS)
Karnataka 14 4 Two Representative of Department of Animal Husbandry Representative of the NDDB Managing Director(IAS)
Madhya
Pradesh
5 7 Principle Secretary of Department of Animal Husbandry(IAS) Registration Commissioner of Cooperative Society (IAS) Director of Animal Husbandry (Government of MP) Representative of the NDDB Representative of Cooperative Bank Joint Secretary of Department of Animal Husbandry (GoI) (IAS) Managing Director
Uttar
Pradesh
- - Currently, there is no board. Managing Director is the Principal Secretary of Animal Husbandry
and also plays the role of chairman.
Source: Field surveys of the study team
(2) Activities of the State federations
The major activities of the state federations include the following:
• Selling and purchasing milk among the state federations, adjusting their surplus and shortages among the states
• Planning and implementation of marketing strategies for the cooperative brand61 • Supporting unions and DCS for investment and financing by linking the demands of finance to the
government subsidies and loans from government-related banks. An example is the technical assistance provided to milk unions when milk unions apply for the public grants and/or NDDB loans. Also, in case the Milk Unions provide adequate collateral security for availing loan from the NDDB, there is no need for taking permission from State federations. However, if there is any shortfall in
60 This is typically found in the cases of the state federation and milk unions in Uttar Pradesh. 61 The dairy cooperatives of each state sell their products under one brand name.

4-11
providing security for the loan, the milk union may request the respective State federation to provide additional security to meet the shortfall.
The federations of some states conduct sales activities for the products manufactured by their milk
unions. For example, all the products produced by milk unions in Gujarat are sold through the state federation, while some of the dairy products manufactured by the milk unions in Karnataka and Uttar Pradesh are sold through the state federations. Some state federations retain their own dairy plants (to process the surplus milk collected by the unions), cattle feed plants, and other facilities. Table 4-7 summarizes the target federations covered by this study. The size of the staff working for the state federations differs depending on their activities and facilities they own.
At present, NDDB representatives are nominated in the Board of 11 state federations and 89 milk unions across the country. If there is a provision in the Bye Laws of state federations for having NDDBs representatives in their Board, they request the NDDB to nominate its representatives in the Board. In addition, as per the policy of the NDDB, milk unions and federations who have availed loan from NDDB need to compulsorily appoint NDDB repetitive as nominated member in their Board.
Table 4-7 Sales activities, facilities, and size of staff of state federations State Sales of products produced by
unions Major facilities owned
Size of staff
Gujarat Sales of dairy products produced by unions of Gujarat are sold through the federation
1 dairy plant 950 (including 7 regional offices and 62 branch offices).
Bihar Sales of products other than liquid milk and yogurt (such as butter, ice cream, and sweets)
3 dairy plants in Jharkhand
180 at headquarters
Karnataka Sales of products other than liquid milk and yogurt (such as butter, ice cream, and sweets)
4 dairy plants 1 ice cream plant 5 cattle feed plant 1 pouch film plant
About 1,000 staffs (including the workers at the plants)
Madhya
Pradesh
Sales of products other than liquid milk and yogurt (such as butter, ice cream, and sweets)
None -
Uttar
Pradesh
Sales of butter and ghee 3 cattle feed plants 1 fodder seed plant 1 semen station 3 training center
46 working for the federation.
Source: Field surveys of the study team
(3) Financial Situation of State federations
The financial situations of the state federations differ significantly, as their roles and responsibilities vary from state to state. For example, as all the products made by unions in Gujarat are sold by its federation, the incomes, expenditures, and profits of that federation are considerably large (see Table 4-8). On the other hand, those of the MPCDF (Madhya Pradesh state federation) are relatively small, as it does not conduct large-scale sales or production activities (see Table 4-9).

4-12
Table 4-8 Profit and loss statement for GCMMF (Gujarat state federation) for 2015-16 (Rs.)
Source: Annual report of GCMMF 2015/16
Table 4-9 Profit and loss statement for MPCDF (Madhya Pradesh state federation) for 2015-16 (Rs.)
Source: Annual report of MPCDF 2015/2016
Among the target states of this study, only the PCF (Uttar Pradesh state federation) has been
running losses. Table 4-10 shows the net profit of each institution of the federation. It shows that the sales activities of the federation, which are reflected as the “Regional Marketing Offices” account, cannot cover the other expenses, indicating the weakness of the sales of the cooperatives of that state.
Table 4-10 Net profit of PCF (Uttar Pradesh state federation) for each institution (2015-16) Institution of PCF (number of institutions) Net profit (Rs.) Regional marketing offices (3) -16,013,727 Cooperative Dairy Training & Research Institute (3) -23,429,954 Cattle feed factory (3) 12,379,051 Frozen semen bank (1) -12,009,378 Fodder seed processing unit (1) -5,925,733 Headquarters -225,858,191 Total -270,857,932
Source: Field study of JICA study team
PCF (Uttar Pradesh state federation) is restructuring its operations; 700 employees (about one-third of the staff) chose early retirement. The federation reports the extraordinary loss of Rs. 318,518,856 for the retirement allowance of the early retirement program in 2015/2016, besides the operating losses.
% of expenditureto total sales
Milk and milk products 227,230,696,000 Purchase of traded goods 181,779,554,000 80.0%Others 2,807,566,000 Cost of materials consumed 40,072,740,000 17.6%Less excise duty -318,708,000 Manufacturing expenses 1,414,802,000 0.6%Other operating income 131,513,000 Changes in inventories -2,809,742,000 -1.2%Other income 355,137,000 Marketing, admin and other expenses 6,834,978,000 3.0%
Employee benefit expenses 1,048,509,000 0.5%Depreciation and authorization expense 871,003,000 0.4%Finance cost 327,043,000 0.1%
Total 230,206,204,000 Total 229,538,887,000Profit before tax 667,317,000Tax expenses 229,502,000Profit for the year 437,815,000
ExpenditureIncome
Income of MPCDF 72,672,441 Staff expenses 62,496,034Interest from bank/unions 3,084,444 Office and admin expenses 2,047,874Other income 1,792,641 Financial and audit expenses 9,283,764Closing stock 82,473 Marketing expenses 514,993
Repair and maintainance expenses 1,010,956Other expenses 995,649Net profit 1,282,729
Total 77,631,999 Total 77,631,999
Income Expenditure
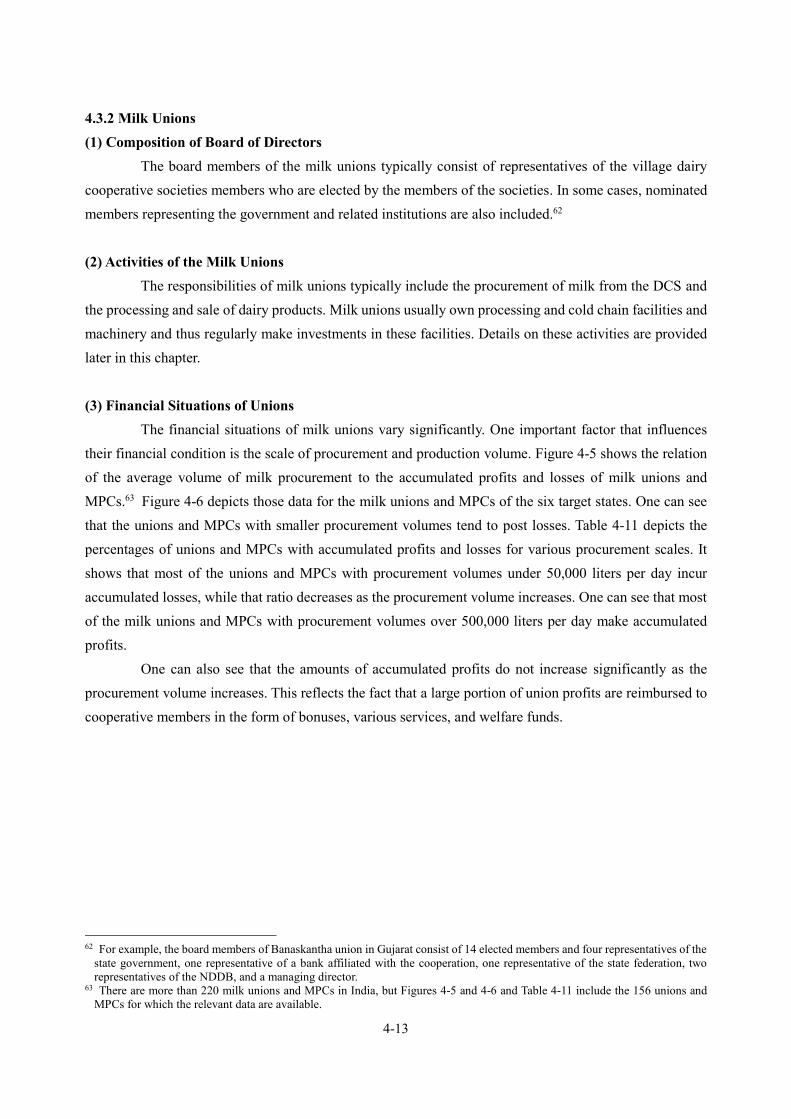
4-13
4.3.2 Milk Unions (1) Composition of Board of Directors
The board members of the milk unions typically consist of representatives of the village dairy cooperative societies members who are elected by the members of the societies. In some cases, nominated members representing the government and related institutions are also included.62 (2) Activities of the Milk Unions The responsibilities of milk unions typically include the procurement of milk from the DCS and the processing and sale of dairy products. Milk unions usually own processing and cold chain facilities and machinery and thus regularly make investments in these facilities. Details on these activities are provided later in this chapter. (3) Financial Situations of Unions The financial situations of milk unions vary significantly. One important factor that influences their financial condition is the scale of procurement and production volume. Figure 4-5 shows the relation of the average volume of milk procurement to the accumulated profits and losses of milk unions and MPCs.63 Figure 4-6 depicts those data for the milk unions and MPCs of the six target states. One can see that the unions and MPCs with smaller procurement volumes tend to post losses. Table 4-11 depicts the percentages of unions and MPCs with accumulated profits and losses for various procurement scales. It shows that most of the unions and MPCs with procurement volumes under 50,000 liters per day incur accumulated losses, while that ratio decreases as the procurement volume increases. One can see that most of the milk unions and MPCs with procurement volumes over 500,000 liters per day make accumulated profits. One can also see that the amounts of accumulated profits do not increase significantly as the procurement volume increases. This reflects the fact that a large portion of union profits are reimbursed to cooperative members in the form of bonuses, various services, and welfare funds.
62 For example, the board members of Banaskantha union in Gujarat consist of 14 elected members and four representatives of the
state government, one representative of a bank affiliated with the cooperation, one representative of the state federation, two representatives of the NDDB, and a managing director.
63 There are more than 220 milk unions and MPCs in India, but Figures 4-5 and 4-6 and Table 4-11 include the 156 unions and MPCs for which the relevant data are available.

4-14
Figure 4-5 Relation between accumulated profit/loss and milk procurement volumes (all unions)
Source: NDDB
Figure 4-6 Relation between accumulated profit/loss and milk procurement volumes (six target states)
Source: NDDB
y = 480.07ln(x) - 2544.3R² = 0.3054
-7000
-6000
-5000
-4000
-3000
-2000
-1000
0
1000
2000
3000
4000
0 500 1,000 1,500 2,000 2,500 3,000 3,500 4,000
Gjarat UP Bihar
Karnataka MP Assam
Total 対数 (Total)
Milk Procument TkgPD2015-16
Accumulatedprofit/loss
Kanpur
Meerut
Saahaj
Samastipur
IndoreBhopal
Bangalore BanaskanthaKaira
Varanasi

4-15
Table 4-11 Percentage of milk unions with accumulated deficits and profits by range of milk collection volume (all India) in 2015/16
Milk procurement (TKgPD)
% of unions and MPCs with deficits
% of unions and MPCs with profits
Total number of unions
0 - 50 69% 31% 52
51 - 100 53% 47% 30
101 - 500 23% 77% 57
500 < 6% 94% 17
Total 42% 58% 156
Source: NDDB
One reason for the close relation between procurement volume and the financial conditions of
milk unions is the large amount of investment needed for processing and cold chain facilities. A certain scale of production and sales is needed to cover the costs of these facilities. In addition, there are economies of scale in both production and procurement, whereby the unit cost of procurement and production decreases as the scale of procurement and production increases (this will be further discussed in Sections 4.5 and 4.6). Furthermore, the larger the production and sales volumes, the larger the market share of the cooperative, and hence the stronger the brand of the cooperative in that state, which benefits their business (this will be further discussed in Section 4.4).
The table below shows the various financial indicators of selected milk unions and MPC. One can see that, the Return on Asset (ROA) and Return on Equity (ROE) are not significantly high, except for Bhopal milk union. This reflects the fact that a large portion of union profits are reimbursed to cooperative members.
Still, Bangalore and Bhopal milk unions, whose sales volumes are relatively large, the net profits of the year are more than Rs.300 million, indicating that the capacity for large scale investments or repaying the loan to finance large scale investments.
Also, the net profits of Saahaj MPC and Patna milk union, whose sales volume is smaller than the Bangalore and Bhopal, are making profits even though the amounts of profits are relatively small. This indicates that the milk unions and MPC with relatively small scale can make profits and have some capacity to expand their scales by themselves, if they are properly managed.
On the other hand, Lucknow milk union are running net loss in their business, even though the scale of their business (in terms of the sales volumes) is not so different from Saahaj and Patna. The poor financial performance of Lucknow milk union is derived from various problem in internal management, sales, and procurement, which will be discussed in the later parts of this chapter.

4-16
Table 4-12 Financial indicators for selected milk unions and MPC (2016-2017)
Union Bangalore Bhopal Saahaj (MPC)
Patna Lucknow
Sales (million Rs.) 19,473 7,123 4,961 3,555 3,045
Net profit/loss (million Rs.) 303 308 18 18 -271
Assets (million Rs.) 6,736 2,423 1,886 2,116 20,183
Capital Asset Ratio 55% 39% 16% 33% 6%
ROA 4.5% 12.7% 0.9% 0.9% -1.3%
ROE 8.1% 32.5% 5.9% 2.6% -22.1% Source: Financial statements of each milk union and MPC.
4.3.3 Village-level Dairy Cooperative Societies (1) Composition of Board of Directors (known as DCS Management Committee)
The board members of DCSs consist of the representatives of members who are elected by members of the society. The term of the office of the members are 3 to 5 years for most of the DCSs in the target milk unions of this study.
(2) Activities of the DCS
The major function of the DCS is the procurement of milk within the jurisdiction of each DCS (typically a village or hamlet). Members of each DCS bring their milk to its collection point(s), which is collected by the responsible union for processing. Many DCSs also sell cattle feed bought from the milk union or federation to the society members. Furthermore, many DCSs conduct various social activities to the members of DCSs and/or the communities out of the profits they earned from the collections and sales of milk. The examples of social activities include the provision of medical services, health insurance, and loans for education.
(3) Financial Situation of DCSs
The financial conditions of DCSs vary widely. Table 4-13 shows an example of a ranking of DCSs according to their financial performance as evaluated by auditors of the State Government. “A” indicates the best financial performance.64 Many of the DCSs ranked “D” seem to be on the brink of becoming non-functional.
64 Only some DCSs are the targets of audit by the central government.
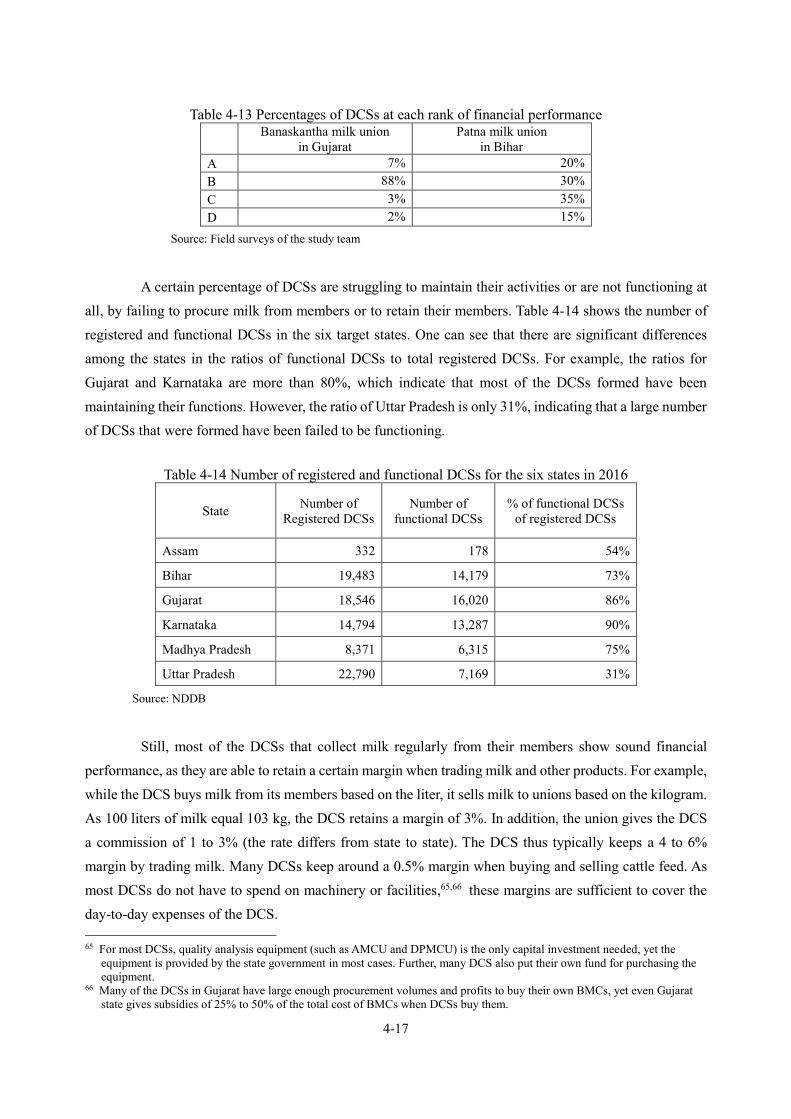
4-17
Table 4-13 Percentages of DCSs at each rank of financial performance Banaskantha milk union
in Gujarat Patna milk union
in Bihar A 7% 20% B 88% 30% C 3% 35% D 2% 15%
Source: Field surveys of the study team
A certain percentage of DCSs are struggling to maintain their activities or are not functioning at
all, by failing to procure milk from members or to retain their members. Table 4-14 shows the number of registered and functional DCSs in the six target states. One can see that there are significant differences among the states in the ratios of functional DCSs to total registered DCSs. For example, the ratios for Gujarat and Karnataka are more than 80%, which indicate that most of the DCSs formed have been maintaining their functions. However, the ratio of Uttar Pradesh is only 31%, indicating that a large number of DCSs that were formed have been failed to be functioning.
Table 4-14 Number of registered and functional DCSs for the six states in 2016
State Number of Registered DCSs
Number of functional DCSs
% of functional DCSs of registered DCSs
Assam 332 178 54%
Bihar 19,483 14,179 73%
Gujarat 18,546 16,020 86%
Karnataka 14,794 13,287 90%
Madhya Pradesh 8,371 6,315 75%
Uttar Pradesh 22,790 7,169 31%
Source: NDDB
Still, most of the DCSs that collect milk regularly from their members show sound financial
performance, as they are able to retain a certain margin when trading milk and other products. For example, while the DCS buys milk from its members based on the liter, it sells milk to unions based on the kilogram. As 100 liters of milk equal 103 kg, the DCS retains a margin of 3%. In addition, the union gives the DCS a commission of 1 to 3% (the rate differs from state to state). The DCS thus typically keeps a 4 to 6% margin by trading milk. Many DCSs keep around a 0.5% margin when buying and selling cattle feed. As most DCSs do not have to spend on machinery or facilities,65,66 these margins are sufficient to cover the day-to-day expenses of the DCS. 65 For most DCSs, quality analysis equipment (such as AMCU and DPMCU) is the only capital investment needed, yet the
equipment is provided by the state government in most cases. Further, many DCS also put their own fund for purchasing the equipment.
66 Many of the DCSs in Gujarat have large enough procurement volumes and profits to buy their own BMCs, yet even Gujarat state gives subsidies of 25% to 50% of the total cost of BMCs when DCSs buy them.
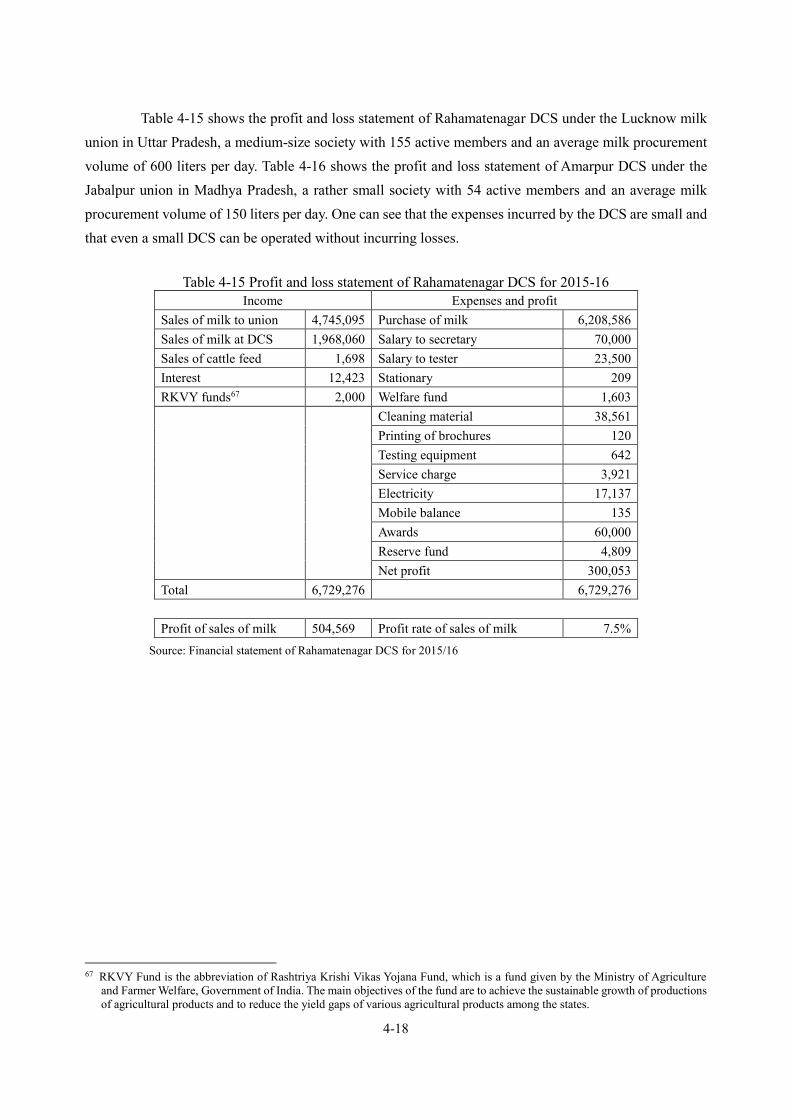
4-18
Table 4-15 shows the profit and loss statement of Rahamatenagar DCS under the Lucknow milk union in Uttar Pradesh, a medium-size society with 155 active members and an average milk procurement volume of 600 liters per day. Table 4-16 shows the profit and loss statement of Amarpur DCS under the Jabalpur union in Madhya Pradesh, a rather small society with 54 active members and an average milk procurement volume of 150 liters per day. One can see that the expenses incurred by the DCS are small and that even a small DCS can be operated without incurring losses.
Table 4-15 Profit and loss statement of Rahamatenagar DCS for 2015-16
Income Expenses and profit Sales of milk to union 4,745,095 Purchase of milk 6,208,586 Sales of milk at DCS 1,968,060 Salary to secretary 70,000 Sales of cattle feed 1,698 Salary to tester 23,500 Interest 12,423 Stationary 209 RKVY funds67 2,000 Welfare fund 1,603 Cleaning material 38,561 Printing of brochures 120 Testing equipment 642 Service charge 3,921 Electricity 17,137 Mobile balance 135 Awards 60,000 Reserve fund 4,809 Net profit 300,053 Total 6,729,276 6,729,276 Profit of sales of milk 504,569 Profit rate of sales of milk 7.5%
Source: Financial statement of Rahamatenagar DCS for 2015/16
67 RKVY Fund is the abbreviation of Rashtriya Krishi Vikas Yojana Fund, which is a fund given by the Ministry of Agriculture
and Farmer Welfare, Government of India. The main objectives of the fund are to achieve the sustainable growth of productions of agricultural products and to reduce the yield gaps of various agricultural products among the states.

4-19
Table 4-16 Profit and loss statement of Amarpur DCS for 2015-16 Income Expenses and profit
Sales of milk to union 1,446,212 Purchase of milk 1,398,718 Sales of milk at DCS 14,546 Purchase of medicine 300 Sales of ghee 8,720 Purchase of ghee 8,702 Sales of minerals 1,700 Purchase of minerals 1,700 Sales of cattle feed 58,368 Purchase of cattle feed 56,958 Sales of medicine 300 Testing charge 440 Interest 1,359 Salary 25,900 Computer charge 360 Stationery 94 Sundry expenses 2,150 Office expenses 235 CDF 1,175 RBF expenses 588 Bank commission 69 Audit fee 2,500 Travel expenses 700 Net profit 30,616 Total 1,531,205 Total 1,531,204 Profit of sales of milk 62,040 4.2%
Source: Financial statement of Amarpur DCS for 2015/16
4.4 Sales and Marketing of Dairy Products by Cooperatives 4.4.1 Sales Performance of Cooperatives
Table 4-17 shows the sales performance of the cooperatives of the six target states, indicating the significant differences between them.68 For example, the market share of Gujarat’s dairy cooperatives is quite high, and there are no major competitors in the state. The market share of Karnataka dairy cooperatives is also high, though not as high as that of Gujarat. One of the reasons for the high sales performance of Karnataka dairy cooperatives is the state government’s subsidy to producers for milk sales to cooperatives, which makes it very difficult for other private firms to procure milk. Bihar dairy cooperatives also retain a sound market share within the state.
On the other hand, the market share of Uttar Pradesh’s dairy cooperatives is very low, partly due to the existence of many competitors, including various private dairy companies and Amul (the Gujarat dairy cooperatives’ brand). The market shares of Assam and Madhya Pradesh are also very small, mainly because consumers prefer loose milk to pouched milk, and the shares of sellers in the unorganized sector are quite high in those states.
Milk sales have been increasing in the last five years for all of the cooperatives except in Uttar Pradesh. The main reason for the sales decrease of Uttar Pradesh’s dairy cooperatives is the decrease in
68 The market share data in the table are estimates by the relevant personnel at the respective dairy cooperative institutions.
Reliable data for market shares are not available.
4-20
procurement volume due to the increased competition with other private companies and dairy cooperatives and the reduction of the services provided by the cooperatives to members (this will be discussed further in Section 4.7).
As indicated in Table 4-17, the cooperatives of Gujarat, Karnataka, and Bihar sell their products outside of their states. Gujarat’s dairy cooperatives conduct sales activities all over India and are competing with other cooperatives in the markets of many states. In addition, the cooperatives in Gujarat and Karnataka have been exporting their products.
One can see that these sales performance indicators for cooperatives are correlated with the financial indicators discussed in the previous section: cooperatives with larger market shares show better financial performance.
During the field survey, the study team found that the milk unions showing poor financial performance (such as the unions in Uttar Pradesh and the Gulbarga milk union in Karnataka) had difficulty enhancing their marketing capacities due to fierce marketing competition. The study team also found that there was great demand for the support needed to strengthen marketing capabilities from these milk unions.69
69 Recognizing the need to strengthen the marketing capacity of the milk unions, the PCF (Uttar Pradesh state federation) is
going to hire a third-party marketing consultant for each dairy union in the state to support them in their marketing activities. In addition, Parag Milk Marketing Ltd., which will be responsible of the marketing of the products of the dairy cooperatives in the state, will be established under the Company Act.

4-21
Table 4-17 Sales performance of the dairy cooperatives of the six states
Gujarat Bihar Assam
(WAMUL)
Karnataka Madhya
Pradesh
Uttar
Pradesh South North
Market share of organized institutions
90% 50–60%
(depending on district)
4% 65% 40% 25% 25–35%
(depending on district)
Market share of
cooperative in the
organized sector
90% 40–75%
(depending on district)
100% 70% 30–70%
(depending on district)
30% 1–10%
(depending on district)
Share of
cooperatives
(including both
organized and
unorganized
sectors)
80% 20–40% 4% 50% 10–40%
(depending on district)
8% 0.5–4%
(depending on district)
Change in the
volume of milk
sales from 2011 to
2015
35% 69% 30% 16% 34% -50%
Sales of their products outside of the state
There are 60 sales offices all over India
Sold in 11 states in the northeastern, western, and northern regions and Nepal
15% of liquid milk is sold outside of the state. Dairy products butter, ice cream, and sweets are sold all over India through the federation
Exports
Exporting to more than 20 countries
Has exported to 22 countries so far.
Major competitors in the state
No major competitor in Gujarat state
Ganga Dairy Anuj Dairy
None. Amul is going to start sales and procurement in this state.
Hudson(AP) and private companies such as Heritage and Gokul exist.
Arogya(Tamil Nadu), Dodla (AP) , Maharastra Cooperatives
Nalanda, Amur, Reliance, Haldhaun
Amul, Sudha,
Shyan,
Ananda, Sudh,
Kothai, Ghan,
Milklay, SMC,
Namaste India
Source: Field survey of the study team
Marketing departments of state federations and milk unions are in charge of the marketing and
sales of the dairy products processed at the state federations and milk unions. The major marketing and
sales activities the department conducts include the followings.
Regular communication with the distributors and retailers on orders and deliveries of the products
Negotiation with the distributors and retailers on the prices of the products
Promotion activities such as the production and distribution of marketing material (such as board and
posters) and radio and/or TV advertisement
Design of packages of the products
Work with production department for developing new products
It is actually quite difficult to differentiate the dairy products such as milk and yogurt, so the brand

4-22
power and the publicity of the brand are important factors for the success of the sales of these products. Therefore, those dairy cooperatives whose market share is low and has low brand power70 are struggling to increase the sales volume of their products. It is also quite difficult for the dairy cooperatives to enter the new markets where their brand names are not familiar with the consumers. So far, only the dairy cooperative in Gujarat and Karnataka which have large enough supply volume and capacity to conduct large scale promotion activities are successful in expanding their sales to outside of the states they are registered.
The capability to develop new products (especially high value-added products) is also important factor to see the marketing potency of dairy cooperatives. The table below shows the major high value-added products procced by each brand of the dairy cooperatives. It indicates that only the dairy cooperatives of Gujarat have been successful in developing wide range of high value-added products. The product development capability of the state federation of Gujarat (including the capacity of finding the market and marketing these high value products as well as the development and production of new products) is a key for the expansion of the sales of its products (Amul products) all over India and the expansion of dairy cooperatives all over Gujarat.71
Table 4-18 Major high value-added products procced by each brand of the dairy cooperatives72
State Brand Major high value-added products
Gujarat Amul Ice cream, milk power, chocolates, lactose free milk, sour cream, probiotic yogurt, bread spread, flavoured milk, protein malt drinks
Bihar Sudha Ice cream, milk powder
Assam Purabi Cream
Karnataka Nandini Flavoured milk, sliced butter, milk powder, frozen dessert
Madhya Pradesh Sanchi Flavoured milk, cream, milk powder
Uttar Pradesh Parag Flavoured milk Source: Field surveys of the study team
For the dairy cooperatives which are struggling to increase the sales of their products, the enhancements of the capacity to strengthen their brands and the to develop high value-added products would be necessary to overcome their problem in sales. The capacity enhancements of the state federations in these fields, rather than milk unions, would be more important, as the sales coverages of milk unions are generally too small to effectively market the high value-added products. 4.4.2 Retail Prices of the Products
Methods of deciding the retail prices of cooperative products also differ from state to state. In
70 State federations and milk unions in Madhya Pradesh and Uttar Pradesh are the examples of this. 71 Based on the discussion with NDDB staffs as well as Gujarat state federation staffs. 72 Liquid milk, yogurt, lassi, butter, ghee, and traditional sweets are not considered as high-value added products here.

4-23
some states, each milk union sets the prices; in others, the state federation does. Table 4-19 shows the decision-making system for retail prices in the states covered by the study.
Table 4-19 Ways of setting retail prices for products
Gujarat Decided by the federation (at the board of directors meeting). Milk Unions also decide the retail price of products sold in the Unions’ operational area.
Bihar Decided by the federation (at a meeting where the managing directors of all unions participate)
Assam Decided by each union
Karnataka Decided by the federation, with the approval of the state government
Madhya Pradesh Unions can decide their retail prices, yet the maximum retail prices are set by the federation.
Uttar Pradesh Decided by the union (at the board of directors meeting)
Source: Field surveys of the study team
As milk is an important commodity for many consumers in India, some state governments have
controlled or intervened in the pricing of the cooperatives’ liquid milk. For example, in Tamil Nadu, the state government is responsible for setting the retail prices of the liquid milk made by the dairy cooperatives. In Karnataka, the dairy cooperative is required to obtain the approval of the state government in order to change the retail prices of liquid milk.
4.4.3 Effect of Competition among Cooperatives
Amul (Kaira milk union in Gujarat) started the sales of pouched milk in Assam in September 2017. Their selling prices are slightly lower (about 2%) than those of the local cooperative, WAMUL. The competition created by the entry of Amul generated downward pressure on the prices of milk sold at the markets in Assam, which benefits the consumers. The impacts of Amul’s entry on WAMUL’s business have not yet become apparent. However, WAMUL might be negatively impacted if Amul increases the scale of its business in Assam. In addition, if Amul continues to procure milk outside of the state, where milk production costs are lower, the milk producers in Assam, whose productivity is lower, will be harmed and might be driven out of the dairy business.73 Amul has extensive sales channels for their products all over India and is one of the biggest competitors for local dairy cooperatives in some states, such as Madhya Pradesh, and Uttar Pradesh. The competition with Amul (and with other private dairy firms) put pressures to the local cooperatives in these states. For example, the state federations and Unions has started a couple of measures to restructure their business and management by laying off a number of staffs, strengthening their marketing capabilities (as discussed in Section 4.4.1), and constructing a number of new processing facilities.
73 Amul is selling their products at almost the same prices as their competitors in most of the markets they entered outside of
Gujarat. One evidence is found that they sell their products at lower prices than local cooperatives other than Assam.

4-24
4.5 Processing 4.5.1 Milk Processing Machinery
Processing milk requires many types of machinery. The major machinery and equipment in the milk value chain, from collecting to selling, are listed in Table 4-20. A more detailed list is attached as Annex 11.
Table 4-20 Major dairy processing machinery and equipment
Milk collection Milk can, milk analyzer (automatic/manual), bulk milk chiller (BMC),
milk tanker, etc.
Milk processing Can conveyor, dump tank, weighing balance, silo, cream separator,
homogenizer, pasteurizer, chiller, packing machine, fridge, freezer, etc.
Dairy product processing Milk powder plant, ice cream plant, processing line of ghee, butter,
yogurt, cream, lassi, and sweets, etc.
Plant utilities
Steam generator (boiler), refrigeration system (compressor, ice bank),
cleaning in process (CIP) tanks, air conditioner, pumps, pipes, generator,
effluent treatment plant (ETP), etc.
Laboratory Chemical inspection equipment and microbiological testing equipment
Selling Insulated track, refrigerated truck, fridge, freezer, etc.
Source: The study team
In India, the high temperature short time (HTST) method is widely applied for pasteurized milk.
Since the milk processing method is commonly used, there are no major differences among the types of processing machinery used by dairy plants. Milk unions and private dairy companies have almost identical processing unit components. Depending on the scale of the organization and its plant, the capacity and types of machineries differ to produce various volumes and different types of products.
Table 4-21 summarizes the major manufacturers of machinery in India’s dairy sector. GEA74 and Tetra Pak are major manufacturers as foreign company in India. They are world-renown companies and their machinery are used by major dairy companies in Japan as well. They establish their factory in India and make the price affordable for Indian milk processors. They manufacture a series of machinery for milk processing and packing except pouch packing machinery.
74 GEA is one of the largest suppliers of process technology for the food industry and a wide range of other industries. It is listed
on the German MDAX stock index and had revenue of 4,674 million euro in 2016 (https://www.gea.com/en/index.jsp).

4-25
Table 4-21 Major manufacturers of machinery in India’s dairy sector Equipment Major Indian Company Advantage/Remarks
Milking machine
DelLaval Pvt. Ltd.
Top share (65%) in India One of Tetra Pak Group companies (Swedish capital company) The company’s major products are milking machine and milking parlor
(milking machine with pipeline)
IDMC Less than 10% share in India NDDB subsidiary company
BMC
IDMC Top share (60-70%) in India
Venture Steels Pvt. Ltd Manufacturing BMC, silo, paneer plant, ghee plant, IMCU (Instant Milk
Chilling Unit) Sold 10,000 BMC in Kerala, Maharashtra, Karnataka
ISF Industries Pvt. Ltd.
Originated in Sri Lanka Competition of BMC became intensified: BMC sales 600 in 2015 to 350 in
2017 Totally 22 UHT packing machines (for paper bag) are imported from
Finland and are sold to Amul, KMF, Vishanapatnam dairy cooperative DeLaval Pvt. Ltd. Small share in India
Milk analyzer/ Automatic Milk Collection Unit (AMCU)
Rajasthan Electronics and Instruments ltd (REIL)
Started manufacturing and selling milk tester in 1981 requested by the NDDB
Everest Instruments Pvt. Ltd
35% share in India Annual turnover: Rs. 80 crores (mostly milk tester) Established in 1997 Total sales of milk testing machine: 70,000 13,000 machines installed in Uttar Pradesh state
Homogenizer
GEA
25% share in world German capital company HQ in Vadodara, offices in Bangalore, Pune, Thane, and Delhi Advantage on powder milk processing machinery (90% of powder milk
processing machineries installed to Amul is GEA) Range from 500-80,000L/h
Tetra Pak India Pvt. Ltd - IDMC 10% share in India
GOMA Engineering Pvt. Ltd.
Annual turnover Rs. 130 crores Sold 2,500 homogenizer since 1982 of its establishment Approximately 20 to 30% share in India
Pasteurizer
GEA Range from 500 - 1 lakh L/h Tetra Pak India Pvt. Ltd - IDMC 50% share in India GOMA Engineering Pvt. Ltd. -
Cream separator
GEA Range from 500 - 60,000L/h Tetra Pak India Pvt. Ltd -
Packing machine
Tetra Pak India Pvt. Ltd 99% share of UHT milk in India No pouch packing machinery is manufactured
GEA
No pouch packing machinery is manufactured (when GEA propose for whole plant machineries, pouch packing machinery manufactured by Samarpan and Nichrome are proposed)
PET packing machine is manufactured R.M.C. Packaging System Pvt. Ltd.
60% share in India Headquarters in Hyderabad
Samarpan Fabricators Pvt. Ltd. 40% share in India
Milk analyzer (Lab. Use)
IndiFosss Analytical Pvt. Ltd.
95% share of organized sector in India MilkoScan FT1 (Rs. 70 lakhs) is major products Exporting to Nepal and Sri Lanka
Source: The study team
Among the dairy plants of the milk unions and federations, Indian machinery is widely used. This
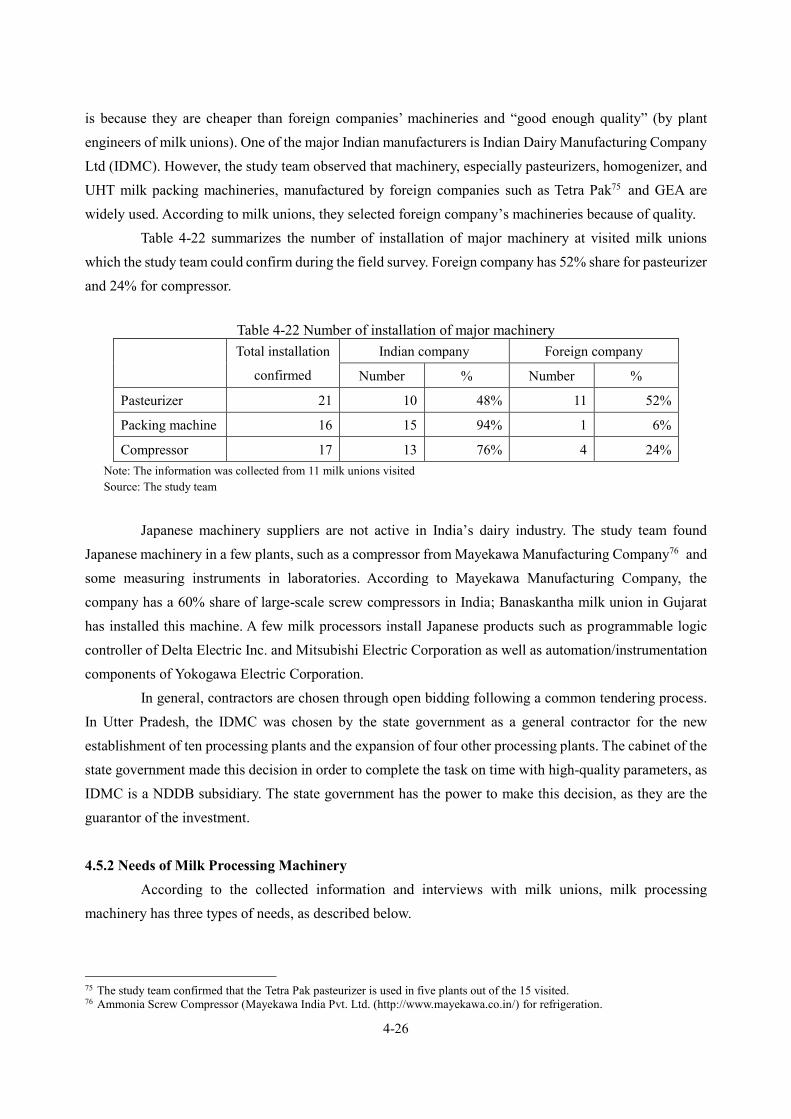
4-26
is because they are cheaper than foreign companies’ machineries and “good enough quality” (by plant engineers of milk unions). One of the major Indian manufacturers is Indian Dairy Manufacturing Company Ltd (IDMC). However, the study team observed that machinery, especially pasteurizers, homogenizer, and UHT milk packing machineries, manufactured by foreign companies such as Tetra Pak75 and GEA are widely used. According to milk unions, they selected foreign company’s machineries because of quality.
Table 4-22 summarizes the number of installation of major machinery at visited milk unions which the study team could confirm during the field survey. Foreign company has 52% share for pasteurizer and 24% for compressor.
Table 4-22 Number of installation of major machinery Total installation
confirmed
Indian company Foreign company
Number % Number %
Pasteurizer 21 10 48% 11 52%
Packing machine 16 15 94% 1 6%
Compressor 17 13 76% 4 24% Note: The information was collected from 11 milk unions visited Source: The study team
Japanese machinery suppliers are not active in India’s dairy industry. The study team found
Japanese machinery in a few plants, such as a compressor from Mayekawa Manufacturing Company76 and some measuring instruments in laboratories. According to Mayekawa Manufacturing Company, the company has a 60% share of large-scale screw compressors in India; Banaskantha milk union in Gujarat has installed this machine. A few milk processors install Japanese products such as programmable logic controller of Delta Electric Inc. and Mitsubishi Electric Corporation as well as automation/instrumentation components of Yokogawa Electric Corporation. In general, contractors are chosen through open bidding following a common tendering process. In Utter Pradesh, the IDMC was chosen by the state government as a general contractor for the new establishment of ten processing plants and the expansion of four other processing plants. The cabinet of the state government made this decision in order to complete the task on time with high-quality parameters, as IDMC is a NDDB subsidiary. The state government has the power to make this decision, as they are the guarantor of the investment. 4.5.2 Needs of Milk Processing Machinery
According to the collected information and interviews with milk unions, milk processing machinery has three types of needs, as described below.
75 The study team confirmed that the Tetra Pak pasteurizer is used in five plants out of the 15 visited. 76 Ammonia Screw Compressor (Mayekawa India Pvt. Ltd. (http://www.mayekawa.co.in/) for refrigeration.

4-27
(1) Need for Capacity Expansion It is necessary to increase procuring, processing, and selling volumes in order to meet the growing
domestic demand in India, as pointed out in the NAP. Therefore, the BMCs and milk analyzers (automatic/manual) in the villages, the processing and laboratory machinery at the dairy plants, and insulated truck and fridges are needed to expand the capacity of the milk value chain. Expanding dairy plants can happen in two main ways: If space is available in the existing plant: Install additional equipment or replace it with bigger-capacity
equipment. If the space inside the existing plant is limited: Establish a new plant at another place.
Establishing a new dairy plant requires a huge investment. For example, according to the NDDB,
the approximate cost of the establishment of a dairy plant of a one lakh liters per day capacity is Rs. 35 crores, including the cost of building and equipment and excluding the cost of land. For a plant of 10 lakh liters per day capacity, the approximate cost would be Rs. 196 crores, as shown in Table 4-23.
Table 4-23 Approximate budget of plants (Rs. crore)77
Capacity Land Building Equipment Total 1 LLPD Cost of land depends upon its
location 13.50 21.50 35.00
5 LLPD 56.78 103.22 160.00 10 LLPD 74.71 121.29 196.00
Source: NDDB The whole milk value chain must be expanded at the same time. It is not efficient to increase only
the milk collection volume or processing volume. Therefore, investments should be made in all processes, such as milk procurement, processing, and marketing. (2) Needs of Processing Plants for Dairy Products
There is a dire need of the processing plants for manufacturing dairy products such as powdered milk, butter, ghee, yogurt, cheese, UHT milk, flavored milk, and ice cream. There are two main reasons: Surplus milk is not wasted: Milk production volumes fluctuate seasonally, and do not necessarily
match with market demand of liquid milk. Dairy cooperatives commit on buying the all milk produced by the members in all seasons. Therefore, milk unions need to manufacture milk dairy products to consume surplus milk and to extend its shelf life.
There are higher profit margins: Dairy products have higher margins than liquid milk. (3) Need to Replace Machinery
Processing machinery has a long lifespan of approximately 10 to 15 years,78 but it must be
77 The budget was made based on prices at dairy plants of various capacities in 2015/16. It does not include the goods and service tax (GST) of around 10%. 78 According to the NDDB. However, a Japanese expert said it is 20 to 30 years depending on its condition and maintenance.

4-28
replaced sooner or later. The renewal of equipment is usually implemented along with the expansion of plant capacity due to increases in milk collection volume. In some cases, machinery has been replaced due to malfunction.
According to the NDDB, about 70% of 30 years old dairy plants are expanded or refurbished but about 30% are not. When it comes to 20 years old dairy plants, about 60% are expanded or refurbished but about 40% are not (See Table 4-24).
Table 4-24 Existing condition of processing infrastructure of milk cooperatives Particulars Dairy Plant (Nos) % of Total
30 years old dairy
Expanded in last 5 years 31 29.2% Expanded in last 10 years 11 10.4% Expanded in last 15 years 10 9.4% Expanded in last 20 years 23 21.7% No Expansion 31 29.2%
Total 106
20 years old dairy
Expanded in last 5 years 24 36.4% Expanded in last 10 years 10 15.2% Expanded in last 15 years 5 7.6% No Expansion 27 40.9%
Total 66
15 years old dairy
Expanded in last 5 years 8 18.2% Expanded in last 10 years 0 0.0% No Expansion 36 81.8%
Total 44
10 years old dairy Expanded in last 5 years 6 21.4% No Expansion 22 78.6%
Total 28 5 years old dairy No Expansion (Total) 53 100.0%
Grand Total 297
Source: NDDB
Table 4-25 summarizes installation year of major machinery at 11 milk unions which the study
team could confirm during the field survey. All the 11 milk unions were established more than 30 years ago; Among them, six plants were established in 1970s, four in 1980s, and one79 in 1930s. None of them, except one compressor, are using pasteurizer, packing machine, and compressor over 25 years old. It means that they have been occasionally replacing or newly installing machinery.
The study team found that some machinery apart from pasteurize, packing machine, and compressor has been used at milk unions in Uttar Pradesh since the 1970s, but those machines will be replaced along with the establishment of new plants in 2018.
79 Lucknow milk union in Uttar Pradesh was established in 1938.
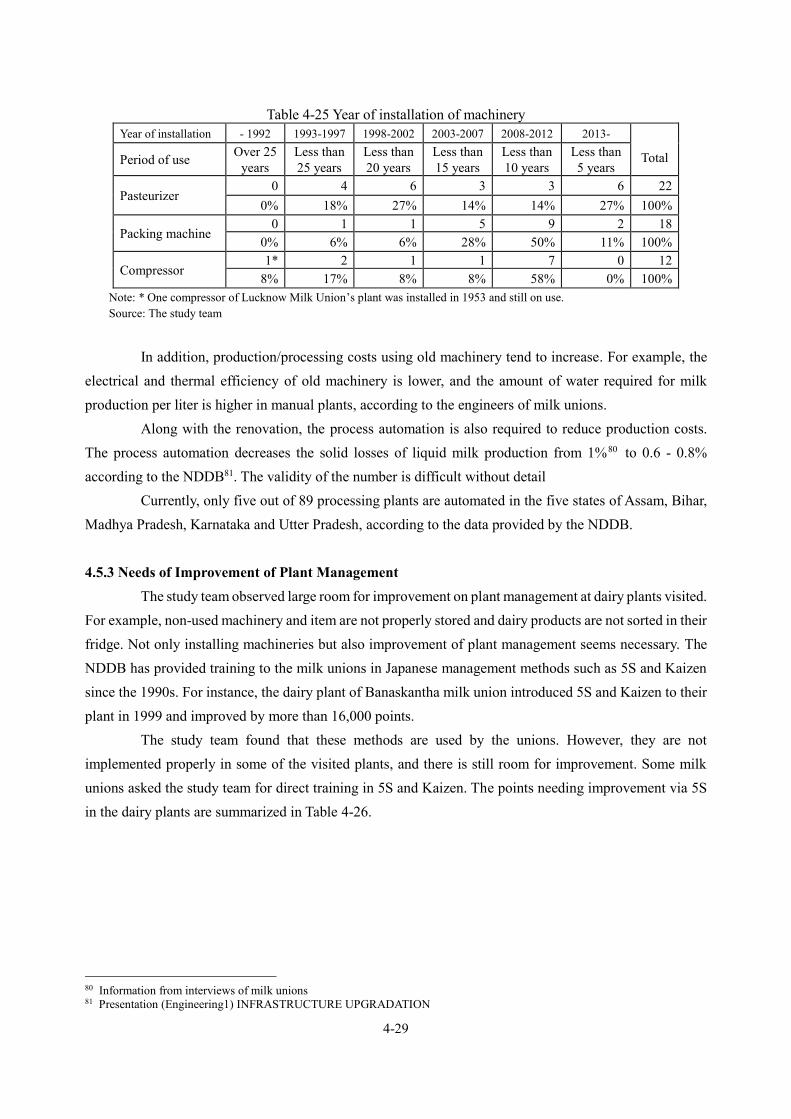
4-29
Table 4-25 Year of installation of machinery Year of installation - 1992 1993-1997 1998-2002 2003-2007 2008-2012 2013-
Total Period of use Over 25
years Less than 25 years
Less than 20 years
Less than 15 years
Less than 10 years
Less than 5 years
Pasteurizer 0 4 6 3 3 6 22
0% 18% 27% 14% 14% 27% 100%
Packing machine 0 1 1 5 9 2 18
0% 6% 6% 28% 50% 11% 100%
Compressor 1* 2 1 1 7 0 12
8% 17% 8% 8% 58% 0% 100% Note: * One compressor of Lucknow Milk Union’s plant was installed in 1953 and still on use. Source: The study team
In addition, production/processing costs using old machinery tend to increase. For example, the
electrical and thermal efficiency of old machinery is lower, and the amount of water required for milk production per liter is higher in manual plants, according to the engineers of milk unions.
Along with the renovation, the process automation is also required to reduce production costs. The process automation decreases the solid losses of liquid milk production from 1%80 to 0.6 - 0.8% according to the NDDB81. The validity of the number is difficult without detail
Currently, only five out of 89 processing plants are automated in the five states of Assam, Bihar, Madhya Pradesh, Karnataka and Utter Pradesh, according to the data provided by the NDDB. 4.5.3 Needs of Improvement of Plant Management
The study team observed large room for improvement on plant management at dairy plants visited. For example, non-used machinery and item are not properly stored and dairy products are not sorted in their fridge. Not only installing machineries but also improvement of plant management seems necessary. The NDDB has provided training to the milk unions in Japanese management methods such as 5S and Kaizen since the 1990s. For instance, the dairy plant of Banaskantha milk union introduced 5S and Kaizen to their plant in 1999 and improved by more than 16,000 points.
The study team found that these methods are used by the unions. However, they are not implemented properly in some of the visited plants, and there is still room for improvement. Some milk unions asked the study team for direct training in 5S and Kaizen. The points needing improvement via 5S in the dairy plants are summarized in Table 4-26.
80 Information from interviews of milk unions 81 Presentation (Engineering1) INFRASTRUCTURE UPGRADATION

4-30
Table 4-26 Points to be improved by 5S in dairy plants
Situation
Unused machinery and items
(Assam). Randomly placed milk cans
in plant (Gujarat).
Bugs (fly) in the processing
plant (Patna) 5S "Sorting" "Set-in-Order" "Shining"
Point to improve
Only essential items should be kept in plant and eliminate
things not required
There should be a place for everything and everything
should be in its place.
The workspace and all equipment should be kept
clean.
Situation
Disorder in fridge (Assam) Workers without cap (Karnataka)
Workers without mask
(Patna) 5S "Standardizing" "Sustaining the Discipline" "Sustaining the Discipline"
Point to improve
Maintain Sorting, Setting-in-Order, and Shining.
Set rules and procedures and ensure everyone is following
them.
Set rules and procedures and ensure everyone is following
them. Source: The study team
Apart from the unions’ need to renew and install their processing machinery, as mentioned above, plant management can be improved by implementing the improvement points described in the table. 4.6 Cold Chain
Since milk is a perishable commodity and spoils very easily, milk unions have to establish a cold chain when procuring milk from a wide area to maintain quality. Through the cold chain, the temperature of collected milk is kept low to prevent bacteria in the milk from increasing.
4.6.1 Overview of the Milk Cold Chain
The temperature of raw milk extracted from livestock is around 35 to 37℃. Manual milking is a common practice among farmers. The farmers put the extracted milk in stainless steel milk cans.82 After
82 The study team observed plastic cans in use as well in some villages, although the usage of plastic can is not recommended by the NDDB.

4-31
the milking, the milk temperature varies depending on the air temperature and the time range of transportation from farmers to collection points.
The farmers bring the milk to a collection point organized by the DSC. If the collection point has a chilling facility such as a Bulk Milk Chiller (BMC) or chilling center, which is a bigger and faster-cooling facility than the BMC, the milk is chilled and maintained at a temperature of 4 to 5 ℃. The chilling center is set up in case the volume of collected milk is large.83 To keep the milk temperature low, the chilling facility is located strategically. The BMC (in case of cluster village) and chilling center are ideally located in a range of 20 to 30 km from the villages so that the milk will be chilled within two to three hours after the milking. The collected milk is transported in an insulated milk tanker, which maintains the same temperature. If the collection point has no chilling facility, which is located near the processing plant in most cases, the collected milk is transported directly to the plant. Hence, a key condition for organizing a DCS is that the village should be accessible to the BMC or chilling center. The plant is located within 100 to 150 km from the BMC and chilling center so that the collected milk is processed within eight hours at maximum. If the farmers live near the dairy plant, they collect the milk in cans and send them directly to the plant by a lightweight truck.
At the processing plant, the milk is pasteurized at a temperature of 76 to 78℃ for 15 seconds; this common practice in India is called the “High Temperature Short Time” (HTST) method. After the pasteurization, the milk is chilled again and maintained at a temperature of 4 to 5℃. The milk is packed and dispatched to the selling points by reefer truck, with a temperature kept at 6 to 8℃.
At the selling points, such as a parlor, the milk products are kept in the refrigerator or visi-cooler (glass front refrigerator) at 4 to 10℃ to be sold.
83 A BMC has a 500 to 5,000 L capacity, while a chilling center has a 10,000 to 200,000 L capacity.
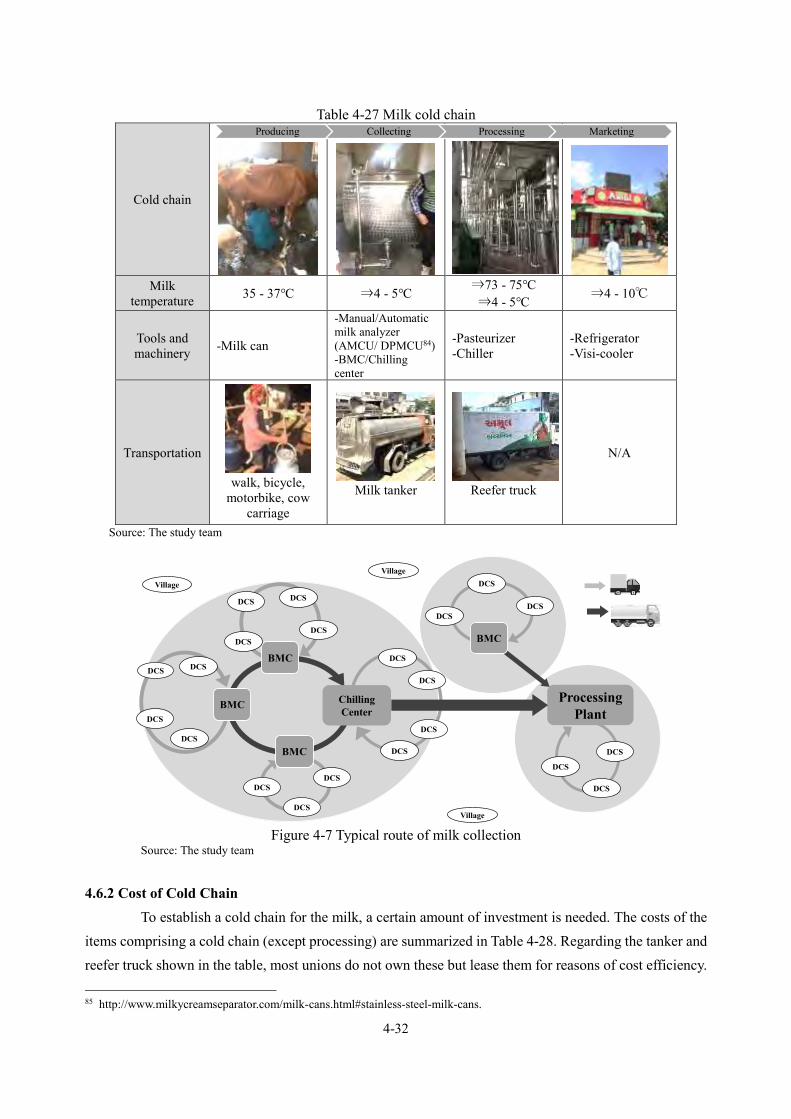
4-32
Table 4-27 Milk cold chain
Cold chain
Milk
temperature 35 - 37℃ ⇒4 - 5℃ ⇒73 - 75℃ ⇒4 - 5℃ ⇒4 - 10℃
Tools and machinery -Milk can
-Manual/Automatic milk analyzer (AMCU/ DPMCU84) -BMC/Chilling center
-Pasteurizer -Chiller
-Refrigerator -Visi-cooler
Transportation
walk, bicycle, motorbike, cow
carriage
Milk tanker
Reefer truck
N/A
Source: The study team
Figure 4-7 Typical route of milk collection
Source: The study team
4.6.2 Cost of Cold Chain
To establish a cold chain for the milk, a certain amount of investment is needed. The costs of the items comprising a cold chain (except processing) are summarized in Table 4-28. Regarding the tanker and reefer truck shown in the table, most unions do not own these but lease them for reasons of cost efficiency. 85 http://www.milkycreamseparator.com/milk-cans.html#stainless-steel-milk-cans.
ProcessingPlant
Chilling Center
BMC
DCS
DCS
DCS
DCSBMC
DCSDCS
DCSDCS
BMC
DCSDCS
DCS
BMC
DCSDCS
DCS
DCS
DCS
DCSDCS
DCS
DCS
DCS
Village
Village
Village
Producing Collecting Processing Marketing

4-33
Table 4-28 Costs of cold chain items Item Capacity Unit Cost (Rs.)
Milk can 40 L 2,50085
AMCU NA 1.5 lakhs
BMC
0.5 KL 8.5 lakhs
1 KL 9.7 lakhs
2 KL 11.3 lakhs
3 KL 13.0 lakhs
5 KL 16.4 lakhs
Chilling Center 50 KL 847.0 lakhs
100 KL 1,005.0 lakhs
Tanker 20 KL 5.5 lakhs 86
Reefer truck 4.7 KL 5.0 lakhs 87
Visi-cooler 360 L 0.25 lakhs 88 Source: NDDB and other websites listed in footnote
4.7 Procurement of Milk 4.7.1 Trend in Milk Procurement Volumes
Table 4-29 shows the milk procurement volumes of cooperatives and the number of functional DCSs and their trends for the selected states. One can see that the procurement volumes have been steadily increasing over the last five years in most of the states. Uttar Pradesh is one of the exceptions; its procurement volume has decreased by 35% in the last five years. One reason for this decrease is the increased competition with other private and cooperative dairy companies. The competition became especially intense when Amul (Gujarat dairy cooperative) started procuring milk in Uttar Pradesh after some unions in Gujarat set up their dairy plants there. The purchasing price of Amul milk was higher than that of other private companies, and private firms were forced to increase their purchasing prices. Currently, the purchasing price of Amul and some private firms is about 15% higher than that of the cooperative in Uttar Pradesh. Under these circumstances, many cooperative members started to sell their milk to other dairy companies that buy milk at higher prices. In addition, as discussed in Section 4.3, the financial performance of many of the milk unions in Uttar Pradesh has been very poor; accordingly, they were forced to cut services to members (which will be discussed in Section 4.8). The benefits to cooperative members thus decreased, and the number of functional DCSs has declined, as shown in Table 4-29.
85 http://www.milkycreamseparator.com/milk-cans.html#stainless-steel-milk-cans. 86 https://www.indiamart.com/proddetail/road-milk-tanker-20000-liter-10934725155.html. 87 https://www.indiamart.com/proddetail/chill-kart-van-17185751512.html. 88 http://www.zenethkitchenequipment.com/restaurant-kitchen-equipment.html#visi-cooler.
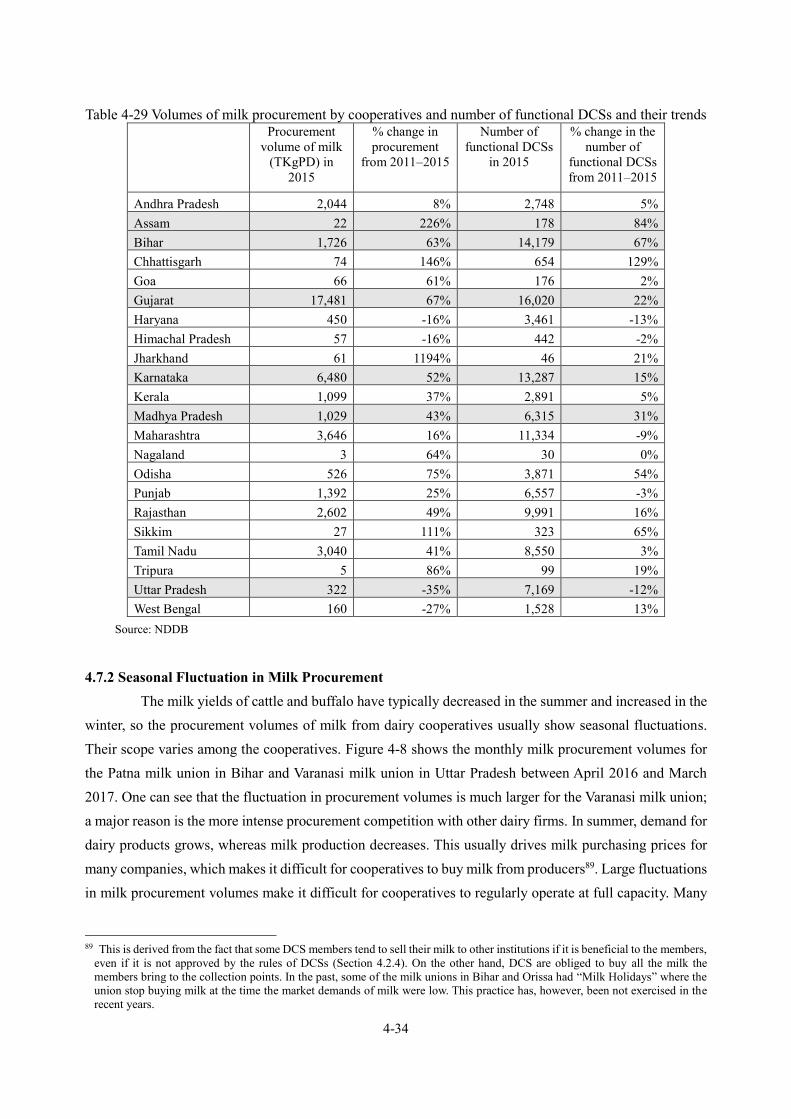
4-34
Table 4-29 Volumes of milk procurement by cooperatives and number of functional DCSs and their trends
Procurement volume of milk
(TKgPD) in 2015
% change in procurement
from 2011–2015
Number of functional DCSs
in 2015
% change in the number of
functional DCSs from 2011–2015
Andhra Pradesh 2,044 8% 2,748 5% Assam 22 226% 178 84% Bihar 1,726 63% 14,179 67% Chhattisgarh 74 146% 654 129% Goa 66 61% 176 2% Gujarat 17,481 67% 16,020 22% Haryana 450 -16% 3,461 -13% Himachal Pradesh 57 -16% 442 -2% Jharkhand 61 1194% 46 21% Karnataka 6,480 52% 13,287 15% Kerala 1,099 37% 2,891 5% Madhya Pradesh 1,029 43% 6,315 31% Maharashtra 3,646 16% 11,334 -9% Nagaland 3 64% 30 0% Odisha 526 75% 3,871 54% Punjab 1,392 25% 6,557 -3% Rajasthan 2,602 49% 9,991 16% Sikkim 27 111% 323 65% Tamil Nadu 3,040 41% 8,550 3% Tripura 5 86% 99 19% Uttar Pradesh 322 -35% 7,169 -12% West Bengal 160 -27% 1,528 13%
Source: NDDB
4.7.2 Seasonal Fluctuation in Milk Procurement
The milk yields of cattle and buffalo have typically decreased in the summer and increased in the winter, so the procurement volumes of milk from dairy cooperatives usually show seasonal fluctuations. Their scope varies among the cooperatives. Figure 4-8 shows the monthly milk procurement volumes for the Patna milk union in Bihar and Varanasi milk union in Uttar Pradesh between April 2016 and March 2017. One can see that the fluctuation in procurement volumes is much larger for the Varanasi milk union; a major reason is the more intense procurement competition with other dairy firms. In summer, demand for dairy products grows, whereas milk production decreases. This usually drives milk purchasing prices for many companies, which makes it difficult for cooperatives to buy milk from producers89. Large fluctuations in milk procurement volumes make it difficult for cooperatives to regularly operate at full capacity. Many
89 This is derived from the fact that some DCS members tend to sell their milk to other institutions if it is beneficial to the members,
even if it is not approved by the rules of DCSs (Section 4.2.4). On the other hand, DCS are obliged to buy all the milk the members bring to the collection points. In the past, some of the milk unions in Bihar and Orissa had “Milk Holidays” where the union stop buying milk at the time the market demands of milk were low. This practice has, however, been not exercised in the recent years.

4-35
unions often buy raw milk from other unions or federations in lean seasons, but the unit cost is higher, as it includes transportation costs, which adds to the costs of production.
Figure 4-8 Monthly volumes of milk procurement for Patna milk union and Varanasi milk union
(index numbers where yearly average is 1.0) Source: Field survey of the study team
4.7.3 Milk Collection Networks of Cooperatives
One significant feature of dairy cooperatives, in contrast to private dairy companies, is their extended coverage for milk collection. The milk collection networks of private dairy companies usually do not extend to remote areas or villages with a small amount of surplus milk because extending their cold chains to these areas would not be economically efficient. On the other hand, the dairy cooperatives will extend their collection networks to any village that has surplus milk by forming a DCS in the village.90 The dairy cooperatives thus provide dairy farmers in those villages with market access.
The milk collection coverage of cooperatives is limited to only 58% of the potential villages with surplus milk.91 The extent of DCS coverage to all villages and potential villages differs significantly from state to state, as depicted in Table 4-30. There are a number of hinderances for spreading the coverage of DCSs, which are often specific to particular region. For Utter Pradesh and Assam, the poor management and business performance of milk unions are a major obstacle for the expansion of the DCS coverage. For Telangana, the intense competitions with private dairy firms is one major hinderance. For Madhya Pradesh, the lack of initiatives of the state government for setting up milk unions made a limited coverage of milk unions over the state. For some parts of Assam and other north eastern states, its mountainous environment and lack of road infrastructure pose difficulties for the expansion of cold chain coverage92.
90 This evidence was verified by extensive field work at remote areas in the six target states. 91 The figure is an estimate by the NDDB. 92 Based on the interview with NDDB staffs.

4-36
Table 4-30 DCS coverage for selected states93 State % of DCS coverage of total
inhabited villages % of DCS coverage of
potential villages94 Gujarat 92% 100% Odisha 12% 96% Tamil Nadu 73% 93% Haryana 87% 90% Karnataka 59% 86% Bihar 50% 84% Punjab 76% 79% Rajasthan 55% 67% Maharashtra 34% 63% Andhra Pradesh 45% 62% Uttar Pradesh 30% 44% Kerala 19% 43% West Bengal 11% 31% Madhya Pradesh 16% 27% Telangana 20% 24% Jharkhand 2% 15% Assam 1% 14%
Source: NDDB
The prospect of the further extension of milk collection networks by cooperatives partly depends on the availability of road infrastructure because the BMCs and chilling centers have to be placed near paved roads in order for procured milk to be delivered by milk lorries. However, according to the field survey, the areas that face this kind of problem are small areas such as in southeastern Bihar, near the border of Maharashtra in northern Karnataka, and in Bundelkhand in Uttar Pradesh. Thus, the availability of road infrastructure would not be a serious hindrance to the extension of the milk collection network.
Some of the rural areas in many states have limited access to electricity. However, this would not prevent the setting up of cold chain facilities such as BMCs, as generators are attached to BMCs when dairy cooperatives set them up.
4.7.4 Purchasing Prices of Milk The purchasing prices of cooperatives’ milk are usually decided at a meeting of the board of
directors of the milk union or federation. Table 4-31 shows the different ways purchasing prices are decided in each of the six target states. What is common among all the cooperatives is that their decision is institutionalized where the voices of producers are reflected (as the representatives of members share some of the seats on the board of directories).
The milk prices paid to the members are set depending on the quality of the milk, which is
93 The figures for coverage in the table may be overestimated, as the fact that some villages have more than two DCSs is not
reflected in the estimates. 94 Potential village is defined as the one where estimated milk production is more than 200 kg per day.
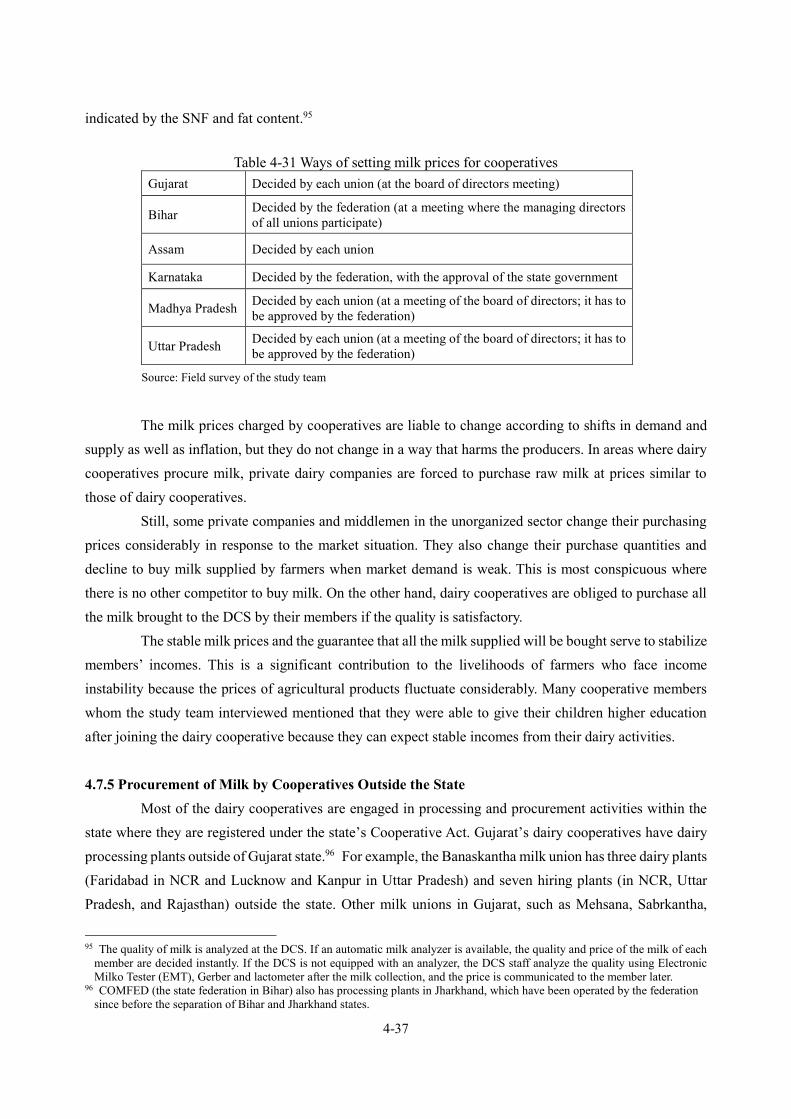
4-37
indicated by the SNF and fat content.95
Table 4-31 Ways of setting milk prices for cooperatives Gujarat Decided by each union (at the board of directors meeting)
Bihar Decided by the federation (at a meeting where the managing directors of all unions participate)
Assam Decided by each union
Karnataka Decided by the federation, with the approval of the state government
Madhya Pradesh Decided by each union (at a meeting of the board of directors; it has to be approved by the federation)
Uttar Pradesh Decided by each union (at a meeting of the board of directors; it has to be approved by the federation)
Source: Field survey of the study team
The milk prices charged by cooperatives are liable to change according to shifts in demand and
supply as well as inflation, but they do not change in a way that harms the producers. In areas where dairy cooperatives procure milk, private dairy companies are forced to purchase raw milk at prices similar to those of dairy cooperatives.
Still, some private companies and middlemen in the unorganized sector change their purchasing prices considerably in response to the market situation. They also change their purchase quantities and decline to buy milk supplied by farmers when market demand is weak. This is most conspicuous where there is no other competitor to buy milk. On the other hand, dairy cooperatives are obliged to purchase all the milk brought to the DCS by their members if the quality is satisfactory.
The stable milk prices and the guarantee that all the milk supplied will be bought serve to stabilize members’ incomes. This is a significant contribution to the livelihoods of farmers who face income instability because the prices of agricultural products fluctuate considerably. Many cooperative members whom the study team interviewed mentioned that they were able to give their children higher education after joining the dairy cooperative because they can expect stable incomes from their dairy activities.
4.7.5 Procurement of Milk by Cooperatives Outside the State Most of the dairy cooperatives are engaged in processing and procurement activities within the
state where they are registered under the state’s Cooperative Act. Gujarat’s dairy cooperatives have dairy processing plants outside of Gujarat state.96 For example, the Banaskantha milk union has three dairy plants (Faridabad in NCR and Lucknow and Kanpur in Uttar Pradesh) and seven hiring plants (in NCR, Uttar Pradesh, and Rajasthan) outside the state. Other milk unions in Gujarat, such as Mehsana, Sabrkantha,
95 The quality of milk is analyzed at the DCS. If an automatic milk analyzer is available, the quality and price of the milk of each
member are decided instantly. If the DCS is not equipped with an analyzer, the DCS staff analyze the quality using Electronic Milko Tester (EMT), Gerber and lactometer after the milk collection, and the price is communicated to the member later.
96 COMFED (the state federation in Bihar) also has processing plants in Jharkhand, which have been operated by the federation since before the separation of Bihar and Jharkhand states.
4-38
Kaira, Botad, and Surat, also have their own or hired plants outside of the state. Seven dairy processing plants are owned by the unions of Gujarat, and 32 plants are hired by them outside of the state. Some of these milk unions also procure milk in areas neighboring these plants. The volume of milk procured by the milk unions of Gujarat reached 86 million liters in 2015/16 (about 12% of the milk procured by the unions of Gujarat).97 The beginning of milk procurement by milk unions of Gujarat had significant impacts on the dairy farmers there as well as the local private dairy companies and dairy cooperatives. For example, the Banaskantha milk union (under the brand name “Amul”) started the procurement of milk in central Uttar Pradesh in 2014, supplying raw milk to their plants there. As their milk prices are higher than that of any other dairy maker (both private and dairy cooperatives in Uttar Pradesh), many dairy farmers started to sell their milk to Amul. Major private dairy companies such as NIF Private Limited (known as “Namaste India”) and Gopaljee Dairy Foods Private Ltd. (known as “Ananda”) were forced to raise their purchase prices to levels similar to Amul’s, which benefited most of the dairy farmers in these areas.
The increased competition for milk procurement caused by the entry of Amul put pressure on the dairy cooperatives of Uttar Pradesh, which had already been struggling financially. The milk unions of Uttar Pradesh are now in the process of restructuring their operations and expanding their volume of production and sales by constructing several new plants. There is, however, little or no prospect of an increase in their volume of procurement, as their milk prices are lower than Amul’s (about 15% less) and those of other major private companies, and they do not provide any major services to their members.
4.8 Cooperative Services to Members Dairy cooperatives provide various services to their members, but their scopes differ among states
and sometimes among milk unions. Table 4-32 shows the major services provided by the cooperatives in the five target states. The dairy cooperatives in Uttar Pradesh do not provide any services to their members, except for a periodic provision of medicine for livestock.
Among the services provided by cooperatives to their members, the provision of AI is the service that the majority of dairy cooperatives consider most important, as the spread of high-yield livestock is imperative for increasing productivity. AI services are available to most of the DCSs in the five states, but some milk unions, such as Gulbarga milk union in Karnataka and those in Assam, do not have enough AI technicians to cover all of their DCSs, and demand for expanded AI services is high in those areas.
The provision of cattle feed at subsidized prices is another common service offered by cooperatives. This is very popular among members, and many members purchase such feed regularly if it is available at the DCS.98
Some dairy cooperatives, such as those in Gujarat and Karnataka, hire veterinarians and provide mobile veterinary services to their members. This is highly appreciated by many members. There are many
97 Annual report of GCMMF, 2015/16. 98 Verified by the field surveys of the study team.

4-39
areas where veterinary services are not available,99 and the high death rate of livestock is a serious problem in those areas.
The provision of free vaccines is also a common service offered by dairy cooperatives, but the Department of Animal Husbandry in each state usually provides the same services. Some cooperatives collaborate or work closely with the department in this regard.
Some DCSs in Gujarat and Assam help their members obtain loans for livestock purchases. Small farmers usually have difficulty obtaining such loans, as they lack the necessary collateral. The DCSs become guarantors for the members when they apply for the loan. The quantity of livestock in some villages increased significantly after the DCS started this service.100 Many milk unions and DCSs recognize the effectiveness of this service in increasing the production of milk but cannot provide it due to a lack of resources. Some claim that the provision of funds to cooperatives for the provision of this kind of service would enhance their members’ livelihoods.
Milk unions and some DCSs give part of their profits to their members at the end of the financial year if they have operated at a profit. The amounts are usually decided at the annual meeting of the board of directors.
The scope of the services provided by milk cooperatives to their members is closely related to the performance of the cooperative. Milk unions and federations that perform well financially can provide better services to their members. This attracts new farmers, which in turn increases the procurement volumes of milk and the sales of the dairy cooperatives. This kind of cycle can be seen in Gujarat and Karnataka. On the other hand, the cooperatives in Uttar Pradesh stopped providing most of their member services due to poor business performance and financial difficulties. Many members then started to sell their milk to other private dairy companies. The procurement volumes of the state’s dairy cooperatives then decreased, further dampening their business.
99 The numbers of government veterinary stations and hospitals are usually limited, and many do not provide mobile services, so
the farmers have to bring their livestock to the hospital, which makes it difficult to use veterinary services. 100 Examples include Thavar and Sarsa villages in Gujarat and Nityananda village in Assam.
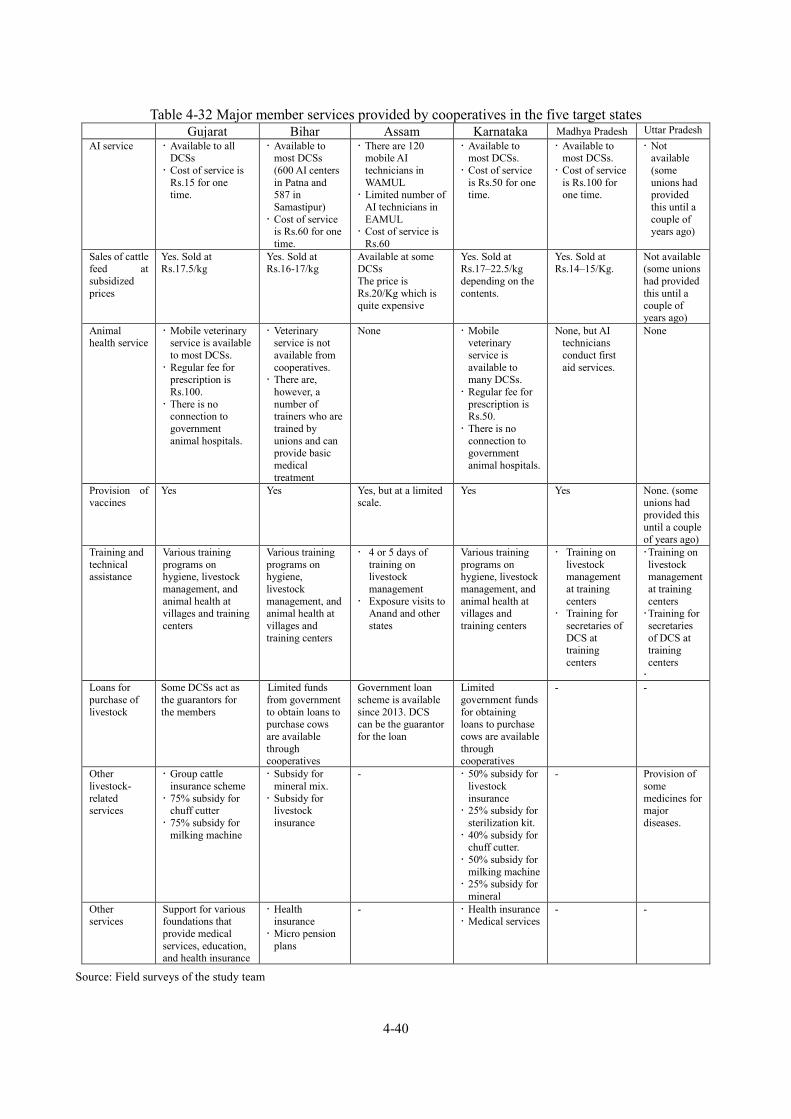
4-40
Table 4-32 Major member services provided by cooperatives in the five target states Gujarat Bihar Assam Karnataka Madhya Pradesh Uttar Pradesh AI service Available to all
DCSs Cost of service is
Rs.15 for one time.
Available to most DCSs (600 AI centers in Patna and 587 in Samastipur)
Cost of service is Rs.60 for one time.
There are 120 mobile AI technicians in WAMUL
Limited number of AI technicians in EAMUL
Cost of service is Rs.60
Available to most DCSs.
Cost of service is Rs.50 for one time.
Available to most DCSs.
Cost of service is Rs.100 for one time.
Not available (some unions had provided this until a couple of years ago)
Sales of cattle feed at subsidized prices
Yes. Sold at Rs.17.5/kg
Yes. Sold at Rs.16-17/kg
Available at some DCSs The price is Rs.20/Kg which is quite expensive
Yes. Sold at Rs.17–22.5/kg depending on the contents.
Yes. Sold at Rs.14–15/Kg.
Not available (some unions had provided this until a couple of years ago)
Animal health service
Mobile veterinary service is available to most DCSs.
Regular fee for prescription is Rs.100.
There is no connection to government animal hospitals.
Veterinary service is not available from cooperatives.
There are, however, a number of trainers who are trained by unions and can provide basic medical treatment
None
Mobile veterinary service is available to many DCSs.
Regular fee for prescription is Rs.50.
There is no connection to government animal hospitals.
None, but AI technicians conduct first aid services.
None
Provision of vaccines
Yes Yes Yes, but at a limited scale.
Yes Yes None. (some unions had provided this until a couple of years ago)
Training and technical assistance
Various training programs on hygiene, livestock management, and animal health at villages and training centers
Various training programs on hygiene, livestock management, and animal health at villages and training centers
4 or 5 days of training on livestock management
Exposure visits to Anand and other states
Various training programs on hygiene, livestock management, and animal health at villages and training centers
Training on livestock management at training centers
Training for secretaries of DCS at training centers
Training on livestock management at training centers
Training for secretaries of DCS at training centers
Loans for purchase of livestock
Some DCSs act as the guarantors for the members
Limited funds from government to obtain loans to purchase cows are available through cooperatives
Government loan scheme is available since 2013. DCS can be the guarantor for the loan
Limited government funds for obtaining loans to purchase cows are available through cooperatives
- -
Other livestock-related services
Group cattle insurance scheme
75% subsidy for chuff cutter
75% subsidy for milking machine
Subsidy for mineral mix.
Subsidy for livestock insurance
- 50% subsidy for livestock insurance
25% subsidy for sterilization kit.
40% subsidy for chuff cutter.
50% subsidy for milking machine
25% subsidy for mineral
- Provision of some medicines for major diseases.
Other services
Support for various foundations that provide medical services, education, and health insurance
Health insurance
Micro pension plans
- Health insurance Medical services
- -
Source: Field surveys of the study team

4-41
Many of the private dairy companies also provide similar kinds of services to farmers. Table 4-33 shows some examples.
Table 4-33 Examples of services provided by private dairy makers to farmers
State Name of
private firm (brand name)
Services provided to farmers
Bihar Naturals Dairy ・ Provision of foot-and-mouse disease (FMD) vaccine, AI services, and sensitization programs in collaboration with the Department of Animal Husbandry
・ Provision of medical camps to women ・ Provision of bonuses for large milk suppliers ・ Provision of education materials to local elementary schools
Karnataka Heritage Foods Limited
・ Provision of clean milk training and stainless containers ・ Setup of farmer welfare trust ・ Provision of vaccination
Madhya Pradesh
Mahindra Agri Solution Ltd.
・ Provision of veterinary, AI, and breeding services in collaboration with NGOs
・ Support for obtaining livestock loans and insurance ・ Sales of cattle feed
Uttar Pradesh
CP Milk and Food Products Pvt. Ltd (Gyan)
・ AI Service at Rs.130 for one time ・ Provision of animal insurance ・ Help line for animal health ・ Sale of cattle feed
Gopaljee Dairy Foods Pvt. Ltd. (Ananda)
・ Provision AI service by 150 AI technicians ・ Provision of veterinary services by 15 veterinarians. ・ 1,500 field staff for supporting farmers in various ways ・ Sales of cattle feed ・ Provision of vaccines (5,000 cattle heath camps per year) ・ Provision of loans to farmers for purchasing livestock
Source: Field surveys of the study team
Many dairy farmers sell their milk to middlemen in the unorganized sector, who deal with loose
milk. One major motivation for selling their milk is that the middlemen usually pay the farmers on the spot whereas dairy cooperatives and private dairy companies usually make payments every 10 to 30 days. In addition, middlemen sometimes pay the farmers in advance, which is a great help to the financial management of many small farmers.
Moreover, many middlemen also provide loans to farmers to help them buy livestock. These farmers are obliged to sell their milk to the middleman with whom they are in debt. These practices are especially common in Uttar Pradesh and Assam; this is one of the reasons why the milk and dairy products markets of the unorganized sector are relatively large in these states (this is also discussed in Chapter 5). 4.9 Investments and Finances of Dairy Cooperatives
Table 4-34 depicts the major investments, their finance sources, and future credit demand for the milk unions and federations the study team visited during the field survey. The following characteristics were found concerning investment and funding:
4-42
The state federation and some of the milk unions in Gujarat with large production capacities and sound creditworthiness have been utilizing loans from private banks.
Many milk unions and the federation use government grants to finance at least part of the large-scale investments for building dairy processing plants and other plants.
The most important source of funding for capital investments are loans from government-related financial institutions such as the NDDB, NCDC, and NABARD. The roles of the federation, and sometimes the state government, are important for milk unions’ acquisition of funding for large-scale investments.
Some of the small milk unions, such as those in Uttar Pradesh and Assam and Gulbarga union in Karnataka, do not have the capacity to obtain and repay loans. These milk unions typically rely on subsidies and grants for capital investments for processing and for procurement facilities and machinery.
Some milk unions have had difficulty repaying their loans. For example, the milk unions of Madhya Pradesh have not been able to repay the loans they received from the NDDB in the 1980s. In 2013, the Madhya Pradesh government took over the Rs.535 million of outstanding debts of these unions for a one-time repayment to the NDDB.
In the study’s target states, the facilities and machinery needed at the village level such as BMCs and AMCUs are 100% funded through grants from state governments, except for Gujarat. In Gujarat, as the procurement volume of each DCS is quite large, most of the DCSs have their own BMC. Also, some DCSs obtained supports of Dairy Development Schemes where 25 to 50% of the cost is financed through state government grants.
There is a huge demand for funding to enhance production capacities in order to meet the expected increase in the volumes of milk procurement and the expected growth in market demand.
State federations generally provide necessary technical assistances to milk unions for the application of public grants and loans.
As indicated in the column of “Future demand for credit” of the table, most of target milk unions
of the study are currently searching for the low interest loans to finance the investment they require (except for the milk unions in Bihar which has just secured a large amount of loans for the major expansion of processing facilities and those in Assam which are in the process of restructuring their business under the NDDB). The demands of the low interest loans (including the conversion of loans) look quite high for the milk unions of all over India in order to finance the investments to maintain and expand their processing capacities and cold chain networks.

4-43
Table 4-34 Descriptions of major investments, their sources of finance, and future demand for credit Federation
/Union Major investments
in recent years Source of finances for the
investment Future demand for credit
Gujarat
Federation
The federation has been the guarantor for the milk unions when they borrow funds. The production volumes of the unions in Gujarat have been increasing at 10–15% annually, and they need about US$150 million of funds per year for investments in increasing production capacity. The federation obtains the highest credit rating (AAA) from the private banks. Private banks in Japan such as SMBC are offering loans to the federation (the interest rate offered by SMBC is 7.05%) The federation is the only one that is allowed to issue commercial paper and has issued it at an interest rate of 6.75%.
Gandhinagar
Enlarged plant capacity in 2014, and production capacity was increased from 1,200 to 2,500 TLPD
The total cost for enlarging production capacity was Rs.90 million, and 30% of it was financed by subsidies such as the RKVY.
-
Plans to construct a new processing plant, which will increase the total production capacity to 5,000 TLPD.
Total cost will be Rs. 1,250 million. 40% of this is to be financed by a grant from RKVY (at application stage). 48% of it is to be financed by a loan from the NDDB (at 7–8% interest and 5-year repayment). The other 12% is to be financed by their own funds.
-
Banaskantha
Investment in the last 3 years: Dairy plant in
Palanpur -Skim milk powder
factory: Rs.1.8 billion
-Cheese factory: Rs.3.5 billion
-UHT factory: Rs.1.2 billion
Dairy plan in Faridabad (NCR): Rs.3.8 billion
Dairy plan in Lucknow (Uttar Pradesh): Rs.1.9 billion
Dairy plant in Kanpur (Uttar Pradesh): Rs.2.6 billion
70% of the total investment in the last 3 years was financed by loans and 30% of it was financed by their own funds. For the construction of Palanpur plant, they obtained a loan from the NDDB (at 6% interest). For the construction of the plants in NCR and Uttar Pradesh, they obtained loans from the NCDC (as 11% interest).
The following plans for investment were approved by the board. Dairy plan in Palanpur (capacity of 2,500
TLPD, cost of construction Rs. 3 billion) Cattle feed plant (capacity of 2,000MT
per day, cost of construction Rs.3.5–4.0 billion)
Oil refinery plant (capacity of 200 ton per day, cost of construction Rs.2.5 billion)
Dairy plant in Varanasi (capacity of 5 million liters per day, cost of construction Rs.2 billion)
Provision of milking machines to members (Rs.1.5–2.0 billion)
Bihar
Federation State federation provide technical supports to the milk unions for the application of NDDC and NDDB loans.
Patna
Cattle feed plant Total cost was Rs.870 million, and it was financed by their own funds.
All the funds for the investment needed to enhance production capacities of the unions are secured. Funds may be needed to increase the number of BMCs to keep up the increase in production.
Dairy processing plant in Hajipur
Of a total cost of Rs.500 million, 25% is financed by a subsidy from the state government, 70% by a loan from the NCDC (8% interest and 6-year repayment), and 5% is by their own funds. If the repayment of the loan is made without arrears in the first 3 years, the interest for the rest of the period will be borne by the state government.
Ice cream plant in Patna
Of a total cost of Rs. 200 million, 10% is financed by the state government, 30%

4-44
Federation /Union
Major investments in recent years
Source of finances for the investment Future demand for credit
by a loan from the NCDC, and the rests by their own funds.
Skim milk powder plant in Hajipur
Of a total cost of Rs.420 million, 25% is financed by a subsidy from the state government and 75% by a loan from the NCDC (7% interest and 6-year repayment).
Working capital They sometimes obtain short-term loans from private banks for their working capital. They can also obtain long-term loan from the NDDB.
Samastipur
Skim milk powder plant (capacity of 30MT)
Dairy plant (500 TLPD of capacity)
25% of the cost for constructing the two plants is financed by a grant from the NCDC, 70% is financed by a loan from the NCDC, and 5% is financed by their own funds. Total loan received from the DCDC is Rs. 700 million. The interest (7%) will be paid by the state government.
Karnataka
Federation
80% of the investment in the last 5 years is financed by their own funds, and 20% is financed by external funds. 70% of the external funds is a loan from the NDDB, 20% is a grant from the NDDB under NDP I, and 10% are investment funds from the unions of Karnataka. State federation provide technical supports to the milk unions for the application of the NCDC and NDDB loans.
Rs. 31.58 billion is needed to finance all the investments plans of the unions and federation in the state. They have applied for a Rs. 25.28 billion loans to the DIDF. The state government needs to be a guarantor, and 20% of the investment will be financed by their own funds to apply for the DIDF loan, as 6% interest. They expect that the proposed loan amount can be financed by soft loans from JICA.
Bangalore
Rs. 1.72 billion in investment has been made in the last 5 years. Rs. 0.13 billion is financed by a loan of the NDDB (interest rate 8%, 8-year repayment period), Rs. 0.23 billion is a grant from the NDDB under the NDP I, Rs. 50 million is a grant and loan from the NCDC, the rest is financed by their own funds.
Plans to make a capital investment of Rs. 6.72 billion. They have secured Rs. 5 billion of funds so far. Another new plant is also needed to keep up with the increase in procurement volume, which will cost Rs. 2.7 billion. So, Rs. 4.42 billion is needed for financing.
Gulbarga They have invested about Rs. 500 million for the renewal of buildings, facilities, and machinery in the last 5 years. All of them are financed by grants from the state government. They have not received any loans in the last 10 years.
They would like to obtain subsidies to increase the number of AI centers.
Assam
WAMUL EAMUL CAMUL
As the milk unions in the state have been reorganizing their management and operation through the NDDB, they have not made any major capital investment in recent years.
The APART project of the World Bank will be conducted from 2017/18 to 2023/24. Proposals to expand the capacity of the WAMUL dairy plant (from 60 to 150TLPD) and the construction of an EAMUL plant (capacity of 60TLPD) and CAMUL (capacity of 60TLPD) were made, but the proposal for the CAMUL plant was rejected.
Madhya Pradesh
Federation State federation is giving technical supports to the milk unions for applications of loans to the DIDF.
Bhopal
Expanded the production capacity of dairy plant from 1,500 TLPD to 3,000 TLPD in 2012.
Financed by NDDB loan (8.75% interest)
Bhopal and Indore milk unions plan to jointly apply to the DIDF for the loans of total Rs.3 billion in order to expand their processing capacities. If the soft loans of JICA are available, they would like to apply to it instead of applying to the DIDF.

4-45
Federation /Union
Major investments in recent years
Source of finances for the investment Future demand for credit
Jabalpur
Cattle feed plant was built in 2013 (production capacity is 50 MT per day)
The total cost was Rs. 53.7 million, financed by a 100% grant from the central government.
They are proposing investments for building a new plant (with a capacity to produce 20 MT of skim milk powder and 5 MT of paneer per day) to the federation. The estimated cost is Rs. 330 million. They wish to finance part of it by grants.
Dairy plant in Jabalpur
They renewed all the facilities and machinery of their plant by utilizing various government subsidies between 2007 and 2012.
Uttar Pradesh
Federation The federation have been providing the technical supports to milk unions for the application of NABARD loans.
Various unions
To invest in the construction of dairy plants (10 greenfield plants and the renewal of 4 plants, total production capacity are 20.5 million liters per day) and to install 750 BMCs, Rs. 10.45 billion in loans were financed from the NABARD as Rural Infrastructure Development Funds. The interest rate is 6.5%, and loan repayments will start in 2020.
As NABARD’s interest rate is high, they wish to convert the loans to soft loans, which are expected to be provided by the JICA.
Saahaj (MPC)
Set up data processor-based Milk Collection Units at all the milk pouring points. Attached GPS to all the milk lorries.
50% of the total cost was financed by the grant of NDP I.
As they do not have their own processing plant, they wish to construct their own plant in the near future.
Source: Field surveys of the study team
4.10 Summary 4.10.1 Business Performance of Dairy Cooperatives
As discussed in the previous sections, there are significant differences in the business performance of milk unions and federations. For example, Amul (dairy cooperative of Gujarat) has been expanding sales all over India as well as abroad and has become a competitor to other dairy cooperatives outside of Gujarat. On the other hand, the dairy cooperatives of Uttar Pradesh have been preforming very badly and are being forced to lay off many of their workers.
Small milk unions tend to have difficulty finding stable business conditions, as their small scale of production does not allow them to rationalize large investments for processing and cold-chain facilities and machinery. Thus, financial support is typically required for dairy cooperatives with small production scales. A few milk unions, such as Kaira and Banaskantha, have the capacity to invest and expand their business without outside support. These unions have gained this capacity by increasing their procurement, production, and sales volumes simultaneously. Other milk unions, however, face factors that hinder this virtuous cycle of business expansion, as will be discussed in Section 4.10.3.
It is thus important to note that the volume of procurement, production, and sales should increase simultaneously; when the feasibility of investment in processing facilities is assessed, the prospects for future procurement and sales volumes should also be evaluated.
4.10.2 Competition among Cooperatives
As discussed in Section 4.4, some milk cooperatives have sold their products outside of the state

4-46
where they are registered, which creates competition between the milk cooperatives operating in the market they have entered. When they enter new markets in other states, they usually set their retail prices at almost the same level as their competitors. However, when Amul entered the Assam market in September 2017, they set their price lower than that of the local dairy cooperative. Though this benefits consumers, it may negatively impact the business of the local cooperative. Moreover, if Amul continues to procure milk outside of Assam state, the milk producers in Assam, whose productivity is relatively low, will be harmed.
As discussed in Section 4.7, Amul has been procuring milk outside of the state. After they started procuring milk in central Uttar Pradesh in 2014, major private companies were forced to increase their procurement prices, as Amul’s purchase price was higher than the prices of its competitors. The milk unions in Uttar Pradesh have had difficulty in increasing their procurement volumes because of the increased competition.
In general, the increase in market competition through the entry of cooperatives from other states will benefit consumers. The increase in competition also put pressures to existing processors and farmers. The competitive pressure sometimes induces the restructuring of the management of local dairy cooperatives (as in the cases of the State federation and Unions in Uttar Pradesh). This may result in the enhancement of capabilities of the local State federation and unions, but may result in further financial difficulties of these institutions.
4.10.3 Applicability of Anand Model to India As mentioned in Section 4.1, Anand model have been introduced to all over India. The model can
be characterized as101 a three-tiered organizational system consisting of a DCS, milk union, and federation an organization whose members pursue democracy
The three-tiered system of the Anand model is an extremely suitable framework for most areas in India because most of the dairy animals are owned by small farmers, who own only one or two animals and are scattered across rural areas in India, where there is a vast and increasing demand of dairy products. The extended organizations of DCSs are necessary for mobilizing the dairy animals owned by small farmers. However, DCSs lack the production volume required for investing in processing plants or cold chains. Thus, the role of milk unions, which can process a large amount of milk procured from DCSs, is important for linking small farmers to the market. Moreover, the state federations make it possible to conduct large-scale marketing and branding activities, which are necessary if cooperatives are to run their business effectively.
As discussed in Section 4.10.1, dairy cooperatives with growing sales volumes have been increasing their members and procurement volumes. Thus, in areas where cooperative management has been good, this cooperative model has spread smoothly, showing the effectiveness of the Anand model.
101 Based on the discussions in Kyodokumiai to Nomin Sosiki edited by Yoshiki Kubota and Toshiaki Kitaide.

4-47
However, as discussed above, the performance levels of cooperatives vary, and some are poor. Their business performance is influenced by the following factors: Productivity of dairy sector at village level
When the productivity of the dairy sector in the area are lower, it is more costly for the dairy cooperatives to procure raw milk
Market condition The preference of packed milk is lower in the areas, it is more difficult and costly for dairy cooperatives to increase the sales volume
Competitiveness If there are more competitors in the areas, dairy cooperatives face more difficulty in procurement and sales
Government support As the construction of cold chain and processing facilities require a huge amount of investment, it is difficult for the dairy cooperatives to construct it without financial supports of the governments, especially when the scales of the dairy cooperatives are small
Government intervention to the management As discussed in Section 4.3.1(1), where the intervention of the state governments to the management of state federations and milk unions are high, the autonomies of their managements and their performances tend to be disrupted. This tendency is more conspicuous when the state governments have more influences in human affairs in the state federations and milk unions.
The effectiveness of the Anand model is lower in areas where the productivity of dairy sector is
lower, the preference for packed milk is lower, market competition is higher, and support from the state government is weak.
Table 4-35 shows the negative factors that affect the business performance of cooperatives (milk unions and federation) for the five target states of this study.

4-48
Table 4-35 Positive and negative factors affecting the business performance of cooperatives State Negative factors Positive factors
Bihar The market for dairy products in the state is small compared to the volume of milk production.
No major competitor in the state
Assam Productivity of dairy farmers is very low as most of the cows and buffaloes are indigenous breeds. The unit cost to procure milk is thus quite high.
Consumers prefer loose milk to pouched milk, so it is difficult to expand sales volumes
-
Karnataka Gulbarga Union Productivity of dairy farmers is very low as
most of the cows and buffaloes are indigenous breeds. The villages are dispersed. The unit cost to procure milk is thus quite high.
There is a subsidy of Rs.5/liter for sales of milk to cooperatives, which hinders the growth of other private dairy companies.
Madhya
Pradesh
Consumers prefer loose milk to pouched milk, so it is difficult to expand sales volumes
Human affairs of the state federation and milk unions are influenced by the state government to some extent.
-
Uttar
Pradesh
The scale of each union has been quite small; there is one union in each district (in 2013, they are merged into bigger unions)
There are many private dairy companies that compete with the unions for both procurement and sales. AMUL (Gujarat dairy cooperative) is the biggest competitor.
Human affairs of the state federation and milk unions are highly influenced by the state government.
Very little financial support from the state government until recently
The three-tiered system is not the only system used by dairy cooperatives. For example, there is no state federation in Assam. In addition, the formation of MPCs, which have a two-tiered system with milk pooling points at the village level, has been facilitated. It is probably desirable to adopt the Anand model flexibly by adjusting it according to the specific conditions of each area while keeping the basic principles of the model.
Regarding the second characteristic of the Anand model (the pursuit of democracy by members), even though the cooperatives in Gujarat are run in highly democratic ways, the management teams of cooperatives in many other states are influenced more by the state government. This can be seen in the composition of the boards of the state federations (see Table 4-6). Many of the board members come from the government or related institutions. Their interventions in the affairs of cooperative management teams are especially frequent concerning investment and finance, except in Gujarat, as financial support from government is necessary for infrastructure building (processing and cold-chain facilities and various support to members).
Thus, while the dairy cooperatives in Gujarat have developed while keeping their democratic institutional framework without significant government support or intervention, some of the cooperatives’ autonomous and democratic nature was lost when the Anand model was extended to other states. However,

4-49
there is no clear relation between the performance of cooperatives and government intervention, as some of the cooperatives, such as those in Karnataka, show good performance despite a strong government influence.
The principle of democratic management by members is compromised when some of the cooperatives conduct procurement activities outside of the state of registration. For example, Amul has formed DCSs in the central area of Uttar Pradesh, but the members there do not have the right to vote for board members and do not receive the services given to members in Gujarat, such as AI and animal health services (though they have the right to bonuses). The procurement activities of Amul in other states can be justified on the basis that they benefit the farmers there, as discussed in Section 4.10.1. It is more desirable for the responsible milk unions of Gujarat who manage DCSs in Uttar Pradesh to provide services that would increase dairy production and enhance the livelihoods of members outside the state.
4.10.4 Expansion of DCS Coverage As discussed in Section 4.2.1, under the Operation Flood, the Anand Model has been introduced
to all states in India. The DCSs now cover about 58% of all the potential villages, as discussed in Section 4.7.1. The next challenge for the dairy cooperative would be to expand the coverage of DCSs to all the potential villages.
The expansion of DCS coverages to all potential villages would require the investments to extend the cold chains to these villages. Moreover, as the procurement volumes of milk increases with the expansion of DCSs, the processing volumes of milk unions and state federation should increase at the same rate. Thus, the investments for processing facilities to expand the production capacities are needed. Financial scheme accessible by dairy cooperatives for the investments may be necessary for those milk unions and state federations which lack financial capacities to expand their cold chains and production capacities.
However, as discussed in Section 4.3.1(1) and 4.10.3, there are some state federations and milk unions which do not have enough capacities to manage their business due to different factors. For these unions it seems to be very hard to extend their DCSs coverage by only utilization of financial schemes. To ensure that the increased volumes of dairy products are marketed, enhancement of marketing capacities, especially on branding and product development fields are needed. In addition to financial schemes available for dairy cooperatives, technical enhancement of their marketing capabilities is required.
4.10.5 Future Prospects of Cooperative Model In some countries, such as Australia, Brazil, and China, large-scale dairy farms have been taking
over small farmers as the major suppliers of milk, eroding the importance of cooperatives. In India, however, despite the growing prominence of large-scale farmers,102 small farmers are likely to continue to be the
102 For example, in Madhya Pradesh, the state government has been facilitating an increase in large-scale dairy farms. There are
hundreds of livestock farmers who own more than 100 buffaloes in the suburbs of Jabalpur.

4-50
major suppliers of milk, for several reasons. First, households with less than two ha constitute more than 90% of the rural population, and this
ratio is not likely to significantly decrease in the near future. Moreover, livestock holding is likely to continue to be a popular way for small farmers to gain a stable income; they are thus likely to continue keeping livestock. Furthermore, improving the livelihoods of small farmers is a major goal of the Indian government, which recognizes the importance of the livestock sector for the development of small farmers. For example, the Twelfth Five-year Plan (2012–2017) claims that the viability of small farming enterprises must be a special area of focus and points out that the livestock sector is an integral sector for the improvement of the livelihoods of small farmers. The National Livestock Policy 2013 also acknowledges the importance of small farmers, who own most of the livestock in the country, and lists various policies for improving the productivity of the dairy activities of small farmers.
As small farmers are likely to continue being India’s dominant suppliers of milk, the cooperative model—which is based on small farmers—should be an effective model for the Indian dairy sector, at least for the next couple of decades. 4.10.6 Issues and Challenges Business performances of some state federations and milk unions are significantly bad due to the poor
management of their business. Part of it is caused by the improper intervention of the state governments. The levels of the profits of the milk unions are generally low even though their management are good.
This is partly caused by the fact that a large portion of union profits are reimbursed to cooperative members in the form of bonuses, various services, and welfare funds. Also, the business of milk union involves higher costs than private dairy firms as the procurement coverages and the cold chain networks are more extensive than private firms and offer stable purchase prices to the members irrespective of market demand.
The coverage of DCSs are only 58% of potential villages. There are a significant number of dairy farmers who lack the access to the services and milk purchase practice which are favorable to farmers that dairy cooperatives would provide.
Although many of the dairy plants of dairy cooperatives are certified by ISO and HACCP, there is large room to improve their hygiene management system.
Although the organized sector in India has introduced scientific analyses for milk quality such as for fat and SNF content in contrast to the unorganized sector, and few violations on FSSAI standard are observed in distribution channel of the organized sector, milk quality check system is also not sufficient comparing to international standard.
The capacity to manage a dairy business varies among dairy cooperatives. On the one hand, Amul is expanding to markets all over India and becoming a threat to local cooperatives. On the other hand, cooperatives in Uttar Pradesh are being forced to lay off staff due to their unprofitability. Some cooperatives may be run out of the business.

4-51
There are significant differences in dairy production levels between the areas, as most of the cows and buffaloes kept in some areas are indigenous breeds. In areas where productivity is low, it is sometimes more cost-effective to supply milk from other areas where productivity is higher. If this productivity gap increases, dairy producers in some areas are likely to fail.


5-1
Chapter 5 Current Status of Dairy Production and Rural Societies 5.1 Basic Description of Socioeconomic Situation Survey A socioeconomic situation survey was conducted to elucidate the current dairy activities and livelihoods of dairy farmers and the social and economic contributions made by cooperatives to them.
In order to ensure the accuracy of the analysis, the sample of the survey are extracted in the way that the comparison among the categories of farmers (large and medium103, small, and marginal farmers, and landless households) can be statistically accurately conducted for each state. Table 5-1 show the sample size of each category of farmers for each state in this survey. As, shown in the table, the sample size of each category is more than 30 for each state, which secure the accuracy in comparing among these categories (Central Limit Theorem). As surveying one village in a state is not enough to extract enough numbers of household for each category, two villages for each state are selected for the sample. The target villages are chosen by the consultation with NDDB staffs and local milk union personnel so that the villages that can represent the region are selected as sample.
The total sample of the survey comprises 1,171 households (75 to 85 households in each village). Both DCS members and non-members are included in the sample.
Table 5-1 Sample size for each category of farmers and state
Large and medium Small Marginal Landless Total
Gujarat 33 32 85 81 231
Bihar 30 36 90 81 237
Assam 43 56 70 63 232
Karnataka 64 49 64 56 233
Uttar Pradesh 75 30 60 73 238
Total 245 203 369 354 1,171
Table 5-2 lists the target villages examined in the survey. They were selected from among the
districts where the milk unions examined in this study are located. Three villages without a DCS are included (Kanfalla Bhokatgao village in Assam, Haravala village in Karnataka, and Raipura village in Uttar Pradesh) in order to compare their socioeconomic situation with that of villages with a DCS. In the analysis, south and north Karnataka are regarded as separate, as their dairy activities differ significantly.
103 As the number of large and medium size farmers are generally quite small for any village in India, these two categories are
grouped into one for sampling design of the survey.

5-2
Table 5-2 List of target villages in the socioeconomic situation survey
State District Village Union Water source for agriculture Characteristics
Gujarat
Anand Mujkuva Kaira Canal, borewell 20 km to Anand city
Banaskantha Saral Vid
Banaskantha Canal, borewell
Scheduled Castes (SCs) and Scheduled Tribes (STs) are predominant
Thavar Borewell, rainwater
Semi-arid area, but villagers hold a large number of livestock
Bihar
Patna Guai Patna Canal, borewell Close to Patna city (15 km)
Samastipur Rahmatpur
Samastipur Borewell Close to Samastipur city (7 km)
Chakhaji Borewell Remote area
Assam
Kamrup Rural
Uzankuri WAMUL
Borewell Close to river and have frequent floods
Malaybari Canal, borewell Remote area (50 km from Guwahati city)
Golaghat Kanfalla Bhokatgao
No DCS Borewell Close to small town
South Karnataka
Bangalore rural
Kammasandra Bangalore Rainwater, borewell
25 km to Bangalore city
North Karnataka
Gulbarga Kumasi Gulbarga Borewell Relatively dry area
Haravala No DCS Canal Remote area
Uttar Pradesh
Chandaulli Nadara Varanasi Canal, Borewell 45 km to Varanasi city
Raipura No DCS Canal, Borewell Bad road access
Ghaziabad Sakoorpur Meerut Borewell Close to Delhi
The analysis and discussions in this chapter are based on the results of the socioeconomic situation
survey and the findings of the field surveys by the study team. 5.2 Ownership of Cattle and Buffalo and Dairy Production 5.2.1 Scale of Cattle and Buffalo Holdings In India, small, marginal, and landless farmers play important roles in the livestock sector. Table 5-3 shows the average number of cattle and buffalo holdings per household depending on the scale of land holding and the distribution of cattle and buffalo reared for each category. The table shows that 90% of rural households have less than 2 ha (indicating small, marginal, and landless farmers) and that these farmers hold about 80% of all cattle and buffaloes.
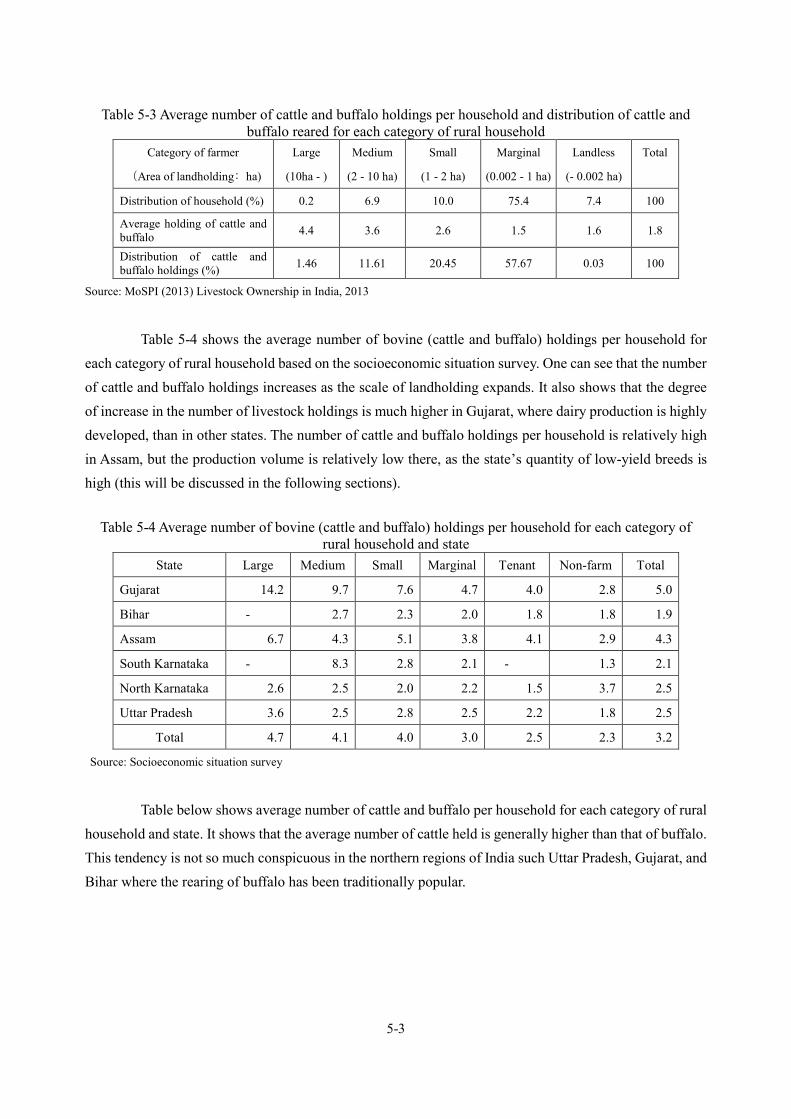
5-3
Table 5-3 Average number of cattle and buffalo holdings per household and distribution of cattle and buffalo reared for each category of rural household
Category of farmer Large Medium Small Marginal Landless Total
(Area of landholding: ha) (10ha - ) (2 - 10 ha) (1 - 2 ha) (0.002 - 1 ha) (- 0.002 ha)
Distribution of household (%) 0.2 6.9 10.0 75.4 7.4 100
Average holding of cattle and buffalo 4.4 3.6 2.6 1.5 1.6 1.8
Distribution of cattle and buffalo holdings (%) 1.46 11.61 20.45 57.67 0.03 100
Source: MoSPI (2013) Livestock Ownership in India, 2013
Table 5-4 shows the average number of bovine (cattle and buffalo) holdings per household for each category of rural household based on the socioeconomic situation survey. One can see that the number of cattle and buffalo holdings increases as the scale of landholding expands. It also shows that the degree of increase in the number of livestock holdings is much higher in Gujarat, where dairy production is highly developed, than in other states. The number of cattle and buffalo holdings per household is relatively high in Assam, but the production volume is relatively low there, as the state’s quantity of low-yield breeds is high (this will be discussed in the following sections).
Table 5-4 Average number of bovine (cattle and buffalo) holdings per household for each category of rural household and state
State Large Medium Small Marginal Tenant Non-farm Total
Gujarat 14.2 9.7 7.6 4.7 4.0 2.8 5.0
Bihar - 2.7 2.3 2.0 1.8 1.8 1.9
Assam 6.7 4.3 5.1 3.8 4.1 2.9 4.3
South Karnataka - 8.3 2.8 2.1 - 1.3 2.1
North Karnataka 2.6 2.5 2.0 2.2 1.5 3.7 2.5
Uttar Pradesh 3.6 2.5 2.8 2.5 2.2 1.8 2.5
Total 4.7 4.1 4.0 3.0 2.5 2.3 3.2
Source: Socioeconomic situation survey
Table below shows average number of cattle and buffalo per household for each category of rural household and state. It shows that the average number of cattle held is generally higher than that of buffalo. This tendency is not so much conspicuous in the northern regions of India such Uttar Pradesh, Gujarat, and Bihar where the rearing of buffalo has been traditionally popular.
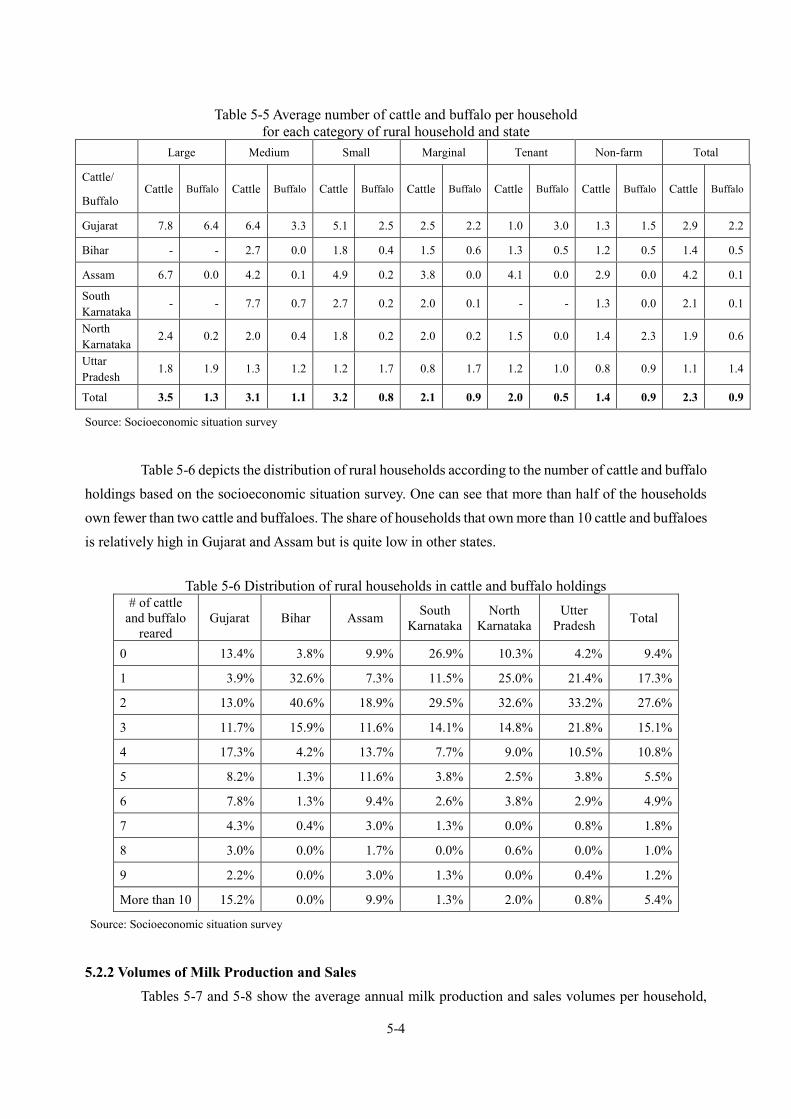
5-4
Table 5-5 Average number of cattle and buffalo per household for each category of rural household and state
Large Medium Small Marginal Tenant Non-farm Total
Cattle/
Buffalo Cattle Buffalo Cattle Buffalo Cattle Buffalo Cattle Buffalo Cattle Buffalo Cattle Buffalo Cattle Buffalo
Gujarat 7.8 6.4 6.4 3.3 5.1 2.5 2.5 2.2 1.0 3.0 1.3 1.5 2.9 2.2
Bihar - - 2.7 0.0 1.8 0.4 1.5 0.6 1.3 0.5 1.2 0.5 1.4 0.5
Assam 6.7 0.0 4.2 0.1 4.9 0.2 3.8 0.0 4.1 0.0 2.9 0.0 4.2 0.1
South Karnataka
- - 7.7 0.7 2.7 0.2 2.0 0.1 - - 1.3 0.0 2.1 0.1
North Karnataka
2.4 0.2 2.0 0.4 1.8 0.2 2.0 0.2 1.5 0.0 1.4 2.3 1.9 0.6
Uttar Pradesh
1.8 1.9 1.3 1.2 1.2 1.7 0.8 1.7 1.2 1.0 0.8 0.9 1.1 1.4
Total 3.5 1.3 3.1 1.1 3.2 0.8 2.1 0.9 2.0 0.5 1.4 0.9 2.3 0.9
Source: Socioeconomic situation survey
Table 5-6 depicts the distribution of rural households according to the number of cattle and buffalo holdings based on the socioeconomic situation survey. One can see that more than half of the households own fewer than two cattle and buffaloes. The share of households that own more than 10 cattle and buffaloes is relatively high in Gujarat and Assam but is quite low in other states.
Table 5-6 Distribution of rural households in cattle and buffalo holdings
# of cattle and buffalo
reared Gujarat Bihar Assam South
Karnataka North
Karnataka Utter
Pradesh Total
0 13.4% 3.8% 9.9% 26.9% 10.3% 4.2% 9.4%
1 3.9% 32.6% 7.3% 11.5% 25.0% 21.4% 17.3%
2 13.0% 40.6% 18.9% 29.5% 32.6% 33.2% 27.6%
3 11.7% 15.9% 11.6% 14.1% 14.8% 21.8% 15.1%
4 17.3% 4.2% 13.7% 7.7% 9.0% 10.5% 10.8%
5 8.2% 1.3% 11.6% 3.8% 2.5% 3.8% 5.5%
6 7.8% 1.3% 9.4% 2.6% 3.8% 2.9% 4.9%
7 4.3% 0.4% 3.0% 1.3% 0.0% 0.8% 1.8%
8 3.0% 0.0% 1.7% 0.0% 0.6% 0.0% 1.0%
9 2.2% 0.0% 3.0% 1.3% 0.0% 0.4% 1.2%
More than 10 15.2% 0.0% 9.9% 1.3% 2.0% 0.8% 5.4%
Source: Socioeconomic situation survey
5.2.2 Volumes of Milk Production and Sales Tables 5-7 and 5-8 show the average annual milk production and sales volumes per household,

5-5
respectively. One can see that production and sales volumes increase as the landholding scale increases. The production and sales volumes per households are much higher in the villages in Gujarat than in other states. The figures for Assam are relatively low, even though the number of livestock holdings is high, indicating the low productivity of the cows and buffaloes reared there.
Table 5-7 Average annual milk production volume per household (liter)
State Large Medium Small Marginal Tenant Non-farm Total
Gujarat 16,254 12,987 6,728 3,753 2,520 2,241 4,695
Bihar - 2,850 1,680 1,574 1,169 1,249 1,441
Assam 2,388 1,283 1,370 569 1,264 650 1,058
South Karnataka - 8,920 1,730 2,590 - 2,562 2,758
North Karnataka 732 639 432 506 135 718 597
Uttar Pradesh 3,547 2,132 3,087 1,976 1,610 1,831 2,301
Total 3,340 3,470 2,312 2,009 1,297 1,607 2,157
Source: Socioeconomic situation survey
Table 5-8 Average annual milk sales volume per household (liter)
State Large Medium Small Marginal Tenant Non-farm Total
Gujarat 14,913 11,718 5,899 3,188 2,210 1,871 4,088
Bihar - 2,486 1,216 1,244 884 1,041 1,145
Assam 1,811 954 1,071 376 961 489 791
South Karnataka - 8,198 1,580 2,290 - 2,196 2,431
North Karnataka 396 369 226 339 0 451 353
Uttar Pradesh 2,898 1,583 2,455 1,488 1,188 1,348 1,769
Total 2,749 2,927 1,889 1,637 973 1,296 1,762
Source: Socioeconomic situation survey
Table 5-9 compares livestock holdings and milk production and sales between villages with DCSs and those without. It shows that the per-household milk production volumes of Kanfalla Bhokatgao village in Assam and Haravala village in Karnataka are much lower than those of villages with DCSs, even though the number of livestock holdings is not significantly different from those of other villages. Moreover, the ratios of milk sales volumes to production volumes in these two villages are much lower than in other villages. This indicates higher productivity and more active milk sales activities among farmers in villages with DCSs, probably due to the services and other benefits provided by DCSs and milk unions. On the other hand, the per-household production and sales volumes and ratios of milk sales volumes to production volumes in Raipura village in Utter Pradesh do not differ markedly from those in villages with DCSs. As dairy production is highly developed in Uttar Pradesh and the state has many private dairy companies, livestock productivity and sales activities there seem not to be affected by the existence
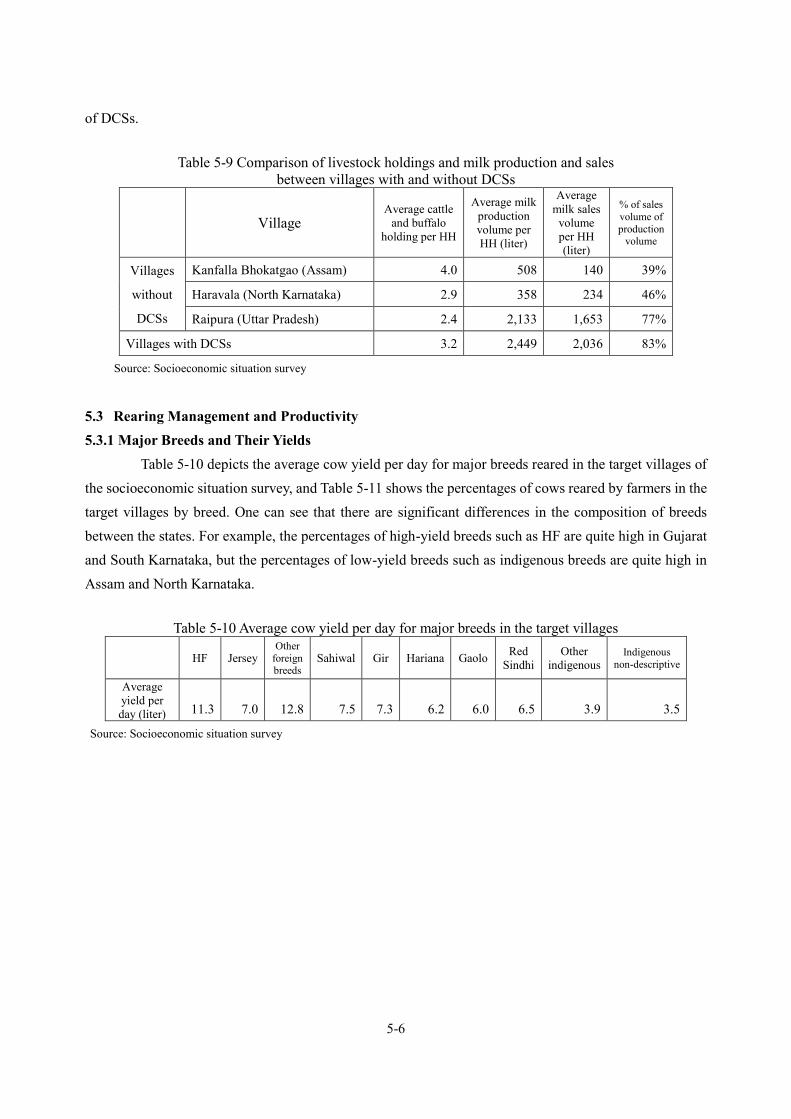
5-6
of DCSs.
Table 5-9 Comparison of livestock holdings and milk production and sales between villages with and without DCSs
Village Average cattle
and buffalo holding per HH
Average milk production volume per HH (liter)
Average milk sales
volume per HH (liter)
% of sales volume of production
volume
Villages
without
DCSs
Kanfalla Bhokatgao (Assam) 4.0 508 140 39%
Haravala (North Karnataka) 2.9 358 234 46%
Raipura (Uttar Pradesh) 2.4 2,133 1,653 77%
Villages with DCSs 3.2 2,449 2,036 83%
Source: Socioeconomic situation survey
5.3 Rearing Management and Productivity 5.3.1 Major Breeds and Their Yields Table 5-10 depicts the average cow yield per day for major breeds reared in the target villages of the socioeconomic situation survey, and Table 5-11 shows the percentages of cows reared by farmers in the target villages by breed. One can see that there are significant differences in the composition of breeds between the states. For example, the percentages of high-yield breeds such as HF are quite high in Gujarat and South Karnataka, but the percentages of low-yield breeds such as indigenous breeds are quite high in Assam and North Karnataka.
Table 5-10 Average cow yield per day for major breeds in the target villages
HF Jersey Other
foreign breeds
Sahiwal Gir Hariana Gaolo Red Sindhi
Other indigenous
Indigenous non-descriptive
Average yield per day (liter) 11.3 7.0 12.8 7.5 7.3 6.2 6.0 6.5 3.9 3.5
Source: Socioeconomic situation survey

5-7
Table 5-11 Percentages of cows reared by farmers in the target villages by breed
State HF Jersey Other
foreign breeds
Sahiwal Gir Hariana Gaolo Red
Sindhi
Other indigen
ous
Indigenous ND
Gujarat 63% 4% 0% 0% 4% 0% 0% 0% 0% 29%
Bihar 12% 61% 0% 10% 0% 1% 1% 1% 11% 3%
Assam 2% 28% 1% 0% 0% 0% 0% 0% 0% 68% South Karnataka 84% 13% 0% 0% 0% 0% 0% 0% 3% 0% North Karnataka 6% 15% 0% 0% 0% 0% 0% 0% 61% 18% Uttar Pradesh 13% 38% 2% 18% 0% 7% 0% 0% 6% 15%
Total 25% 25% 0% 3% 1% 1% 0% 0% 9% 36% Note: ND = “non-descriptive” Source: Socioeconomic situation survey
Table 5-12 compares breed compositions between villages with DCSs and without. It shows that
the ratios of low-yield cows are significantly higher in villages without DCSs.
Table 5-12 Percentages of cows by breed for villages with and without DCSs
Village HF JersyOther
foreignbreed
Sahiwal Gir Hariana GaoloRed
SindhiOther
indigenous
Indigenousnon-
descriptiveKanfalla Bhokatgao
(Assam) 0% 10% 0% 0% 0% 0% 0% 0% 0% 90%Haravala
(Karnataka) 2% 1% 0% 0% 0% 0% 0% 0% 75% 22%Raipura
(Utter Pradesh) 6% 61% 0% 19% 0% 2% 0% 0% 0% 13%
30% 28% 1% 3% 1% 1% 0% 0% 6% 29%
VillageswithoutDCS
Villages with DCS Source: Socioeconomic situation survey
Tables 5-13 and 5-14 depict the average buffalo yields per day for major breeds reared in the
target villages and the percentages of buffaloes reared by farmers in the target villages by breed, respectively. The difference in yields is not as significant among the breeds as it is for cows. The breed compositions differ across states.

5-8
Table 5-13 Average buffalo yields per day for major breeds in the target villages
Toda Mehsana Jaffrabadi Murrah Surti Bhadawari Other
Indigenous non-
descriptive
Average yield per day (liter) 9.0 8.4 7.1 7.0 6.0 4.9 5.1 6.4
Source: Socioeconomic situation survey
Table 5-14 Percentages of buffalos reared by farmers in the target villages by breed
State Toda Mehsana Jaffrabadi Murrah Surti Bhadawari Other Indigenous ND
Gujarat 0.4% 20.6% 0.6% 0.0% 0.8% 0.4% 1.2% 76.0%
Bihar 0.0% 6.9% 4.6% 35.4% 0.0% 15.4% 36.2% 1.5%
Assam 0.0% 0.0% 0.0% 53.8% 0.0% 0.0% 0.0% 46.2% South Karnataka 0.0% 0.0% 1.0% 3.8% 0.0% 0.0% 38.5% 56.7% North Karnataka 0.0% 0.0% 0.7% 1.4% 0.0% 0.0% 50.4% 47.5%
Uttar Pradesh 1.5% 1.5% 0.3% 56.9% 0.0% 4.5% 29.5% 5.7%
Total 0.6% 10.9% 1.0% 22.8% 0.4% 3.4% 17.7% 43.1% Note: ND = “non-descriptive” Source: Socioeconomic situation survey
5.3.2 Artificial Insemination (AI)
Table 5-15 shows the percentages of farmers who use AI services to mate their livestock for cooperative members and non-members in villages with DCSs and villages without. One can see that the ratio of farmers who use AI services is significantly higher for farmers in villages with DCSs. Moreover, AI use is relatively high in Gujarat and South Karnataka, where the AI services of dairy cooperatives are available in most areas.
Table 5-15 Percentages of farmers who use AI services to mate livestock
State Villages with DCSs Villages without
DCSs DCS Members Non-members
Gujarat 92% 88% -
Bihar 61% 69% -
Assam 59% 49% 13%
South Karnataka 100% 100% -
North Karnataka 76% 24% 23%
Uttar Pradesh 59% 57% 47%
Total 73% 65% 29%
Source: Socioeconomic situation survey

5-9
Table 5-16 shows the percentages of institution use for AI services. One can see that the percentages of farmers who use cooperative AI centers are higher in Gujarat and South Karnataka, where the AI services of dairy cooperatives are available in most areas. The percentages of farmers who use cooperative AI centers are lower for non-DCS members than for DCS members.
Table 5-16 Percentages of institution use for AI services
State
Villages with DCSs Villages without
DCSs DCS members Non-members
Coop. Private Gov. Coop. Private Gov. Private Gov.
Gujarat 87% 13% 0% 97% 0% 3% - -
Bihar 18% 73% 7% 5% 77% 18% - -
Assam 23% 30% 47% 9% 41% 50% 63% 38%
South Karnataka 100% 0% 0% 20% 47% 33% - -
North Karnataka 29% 9% 62% 0% 25% 75% 7% 93%
Uttar Pradesh 22% 72% 6% 4% 88% 8% 82% 18%
Total 52% 35% 13% 27% 53% 20% 60% 40%
Source: Socioeconomic situation survey
5.3.3 Utilization of Cattle Feed Table 5-17 depicts the percentages of farmers who provide cattle feed to their livestock every day. One can see that the percentage is higher for DCS members than for non-members. Moreover, it is significantly lower for farmers in villages without DCSs than for those in villages with DCSs.
Table 5-17 Percentages of farmers who provide cattle feed to their livestock every day
Village Villages with DCSs Villages
without DCSs DCS members Non-members
Gujarat 62% 33% -
Bihar 64% 54% -
Assam 29% 20% 6%
South Karnataka 52% 25% -
North Karnataka 40% 43% 16%
Uttar Pradesh 40% 47% 47%
Total 54% 38% 23%
Source: Socioeconomic situation survey
Table 5-18 shows the percentages of farmers who buy cattle feed at DCS offices. One can see that these figures are higher in Gujarat and South Karnataka, where cattle feed is sold at most DCS offices.

5-10
Table 5-18 Percentages of farmers who buy cattle feed at DCS offices
Village Villages with DCSs Villages
without DCSs DCS members Non-members
Gujarat 90% 68% -
Bihar 76% 20% -
Assam 14% 9% 0%
South Karnataka 91% 23% -
North Karnataka 38% 4% 1%
Uttar Pradesh 21% 12% 7%
Total 58% 25% 3%
Source: Socioeconomic situation survey
5.3.4 Productivity of Cows and Buffaloes Table 5-19 shows the average yields per cow and buffalo per day for various areas. One can see that the yield per livestock is higher where the ratios of high-yield breeds are higher and where AI services and cattle feed are more heavily utilized. The higher ratio of high-yield livestock may partly be caused by the high utilization of AI services. Moreover, the higher utilization of cattle feed is likely to increase the productivity of high-yield livestock. One can see that the yields of livestock in Kanfalla Bhokatgao village (Assam) and Haravala village (North Karnataka), where there are no DCSs, are significantly lower than in villages with DCSs in the same area. The existence of DCSs and their provision of various services (such as AI services, sales of cattle feed, and the guaranteed purchase of surplus milk) probably cause this difference. On the other hand, the yields of livestock in Raipura village of Uttar Pradesh, where there are no DCSs, are not significantly different from those of villages with DCSs. As the dairy sector is highly developed in Uttar Pradesh and many private dairy companies procure milk there, the DCSs seem not to have much influence on the productivity of livestock.
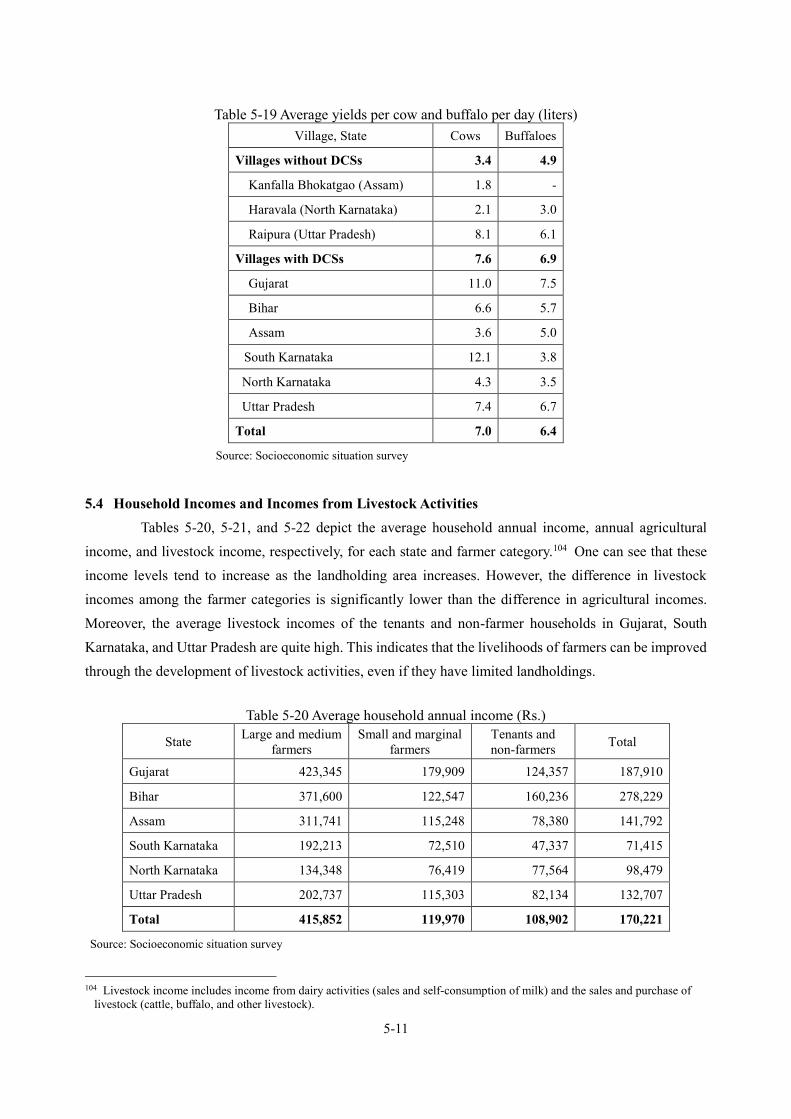
5-11
Table 5-19 Average yields per cow and buffalo per day (liters) Village, State Cows Buffaloes
Villages without DCSs 3.4 4.9
Kanfalla Bhokatgao (Assam) 1.8 -
Haravala (North Karnataka) 2.1 3.0
Raipura (Uttar Pradesh) 8.1 6.1
Villages with DCSs 7.6 6.9
Gujarat 11.0 7.5
Bihar 6.6 5.7
Assam 3.6 5.0
South Karnataka 12.1 3.8
North Karnataka 4.3 3.5
Uttar Pradesh 7.4 6.7
Total 7.0 6.4
Source: Socioeconomic situation survey
5.4 Household Incomes and Incomes from Livestock Activities
Tables 5-20, 5-21, and 5-22 depict the average household annual income, annual agricultural income, and livestock income, respectively, for each state and farmer category.104 One can see that these income levels tend to increase as the landholding area increases. However, the difference in livestock incomes among the farmer categories is significantly lower than the difference in agricultural incomes. Moreover, the average livestock incomes of the tenants and non-farmer households in Gujarat, South Karnataka, and Uttar Pradesh are quite high. This indicates that the livelihoods of farmers can be improved through the development of livestock activities, even if they have limited landholdings.
Table 5-20 Average household annual income (Rs.)
State Large and medium farmers
Small and marginal farmers
Tenants and non-farmers Total
Gujarat 423,345 179,909 124,357 187,910
Bihar 371,600 122,547 160,236 278,229
Assam 311,741 115,248 78,380 141,792
South Karnataka 192,213 72,510 47,337 71,415
North Karnataka 134,348 76,419 77,564 98,479
Uttar Pradesh 202,737 115,303 82,134 132,707
Total 415,852 119,970 108,902 170,221
Source: Socioeconomic situation survey
104 Livestock income includes income from dairy activities (sales and self-consumption of milk) and the sales and purchase of
livestock (cattle, buffalo, and other livestock).
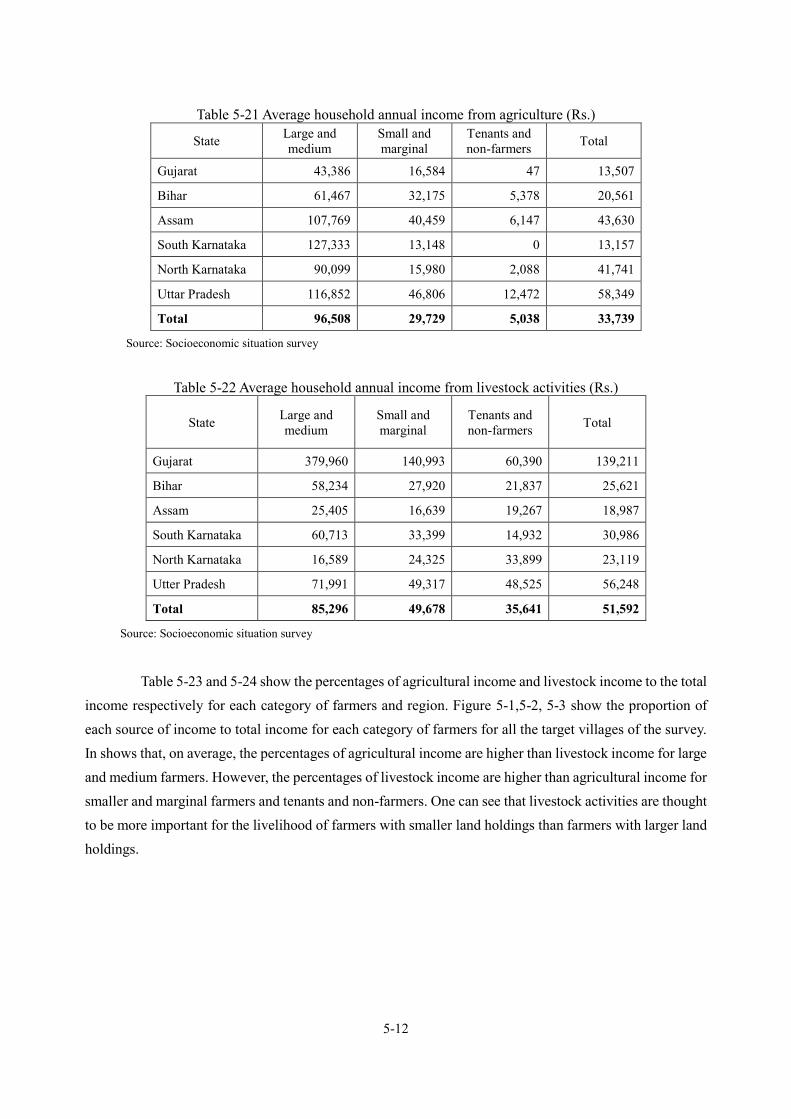
5-12
Table 5-21 Average household annual income from agriculture (Rs.)
State Large and medium
Small and marginal
Tenants and non-farmers Total
Gujarat 43,386 16,584 47 13,507
Bihar 61,467 32,175 5,378 20,561
Assam 107,769 40,459 6,147 43,630
South Karnataka 127,333 13,148 0 13,157
North Karnataka 90,099 15,980 2,088 41,741
Uttar Pradesh 116,852 46,806 12,472 58,349
Total 96,508 29,729 5,038 33,739
Source: Socioeconomic situation survey
Table 5-22 Average household annual income from livestock activities (Rs.)
State Large and medium
Small and marginal
Tenants and non-farmers Total
Gujarat 379,960 140,993 60,390 139,211
Bihar 58,234 27,920 21,837 25,621
Assam 25,405 16,639 19,267 18,987
South Karnataka 60,713 33,399 14,932 30,986
North Karnataka 16,589 24,325 33,899 23,119
Utter Pradesh 71,991 49,317 48,525 56,248
Total 85,296 49,678 35,641 51,592
Source: Socioeconomic situation survey
Table 5-23 and 5-24 show the percentages of agricultural income and livestock income to the total income respectively for each category of farmers and region. Figure 5-1,5-2, 5-3 show the proportion of each source of income to total income for each category of farmers for all the target villages of the survey. In shows that, on average, the percentages of agricultural income are higher than livestock income for large and medium farmers. However, the percentages of livestock income are higher than agricultural income for smaller and marginal farmers and tenants and non-farmers. One can see that livestock activities are thought to be more important for the livelihood of farmers with smaller land holdings than farmers with larger land holdings.
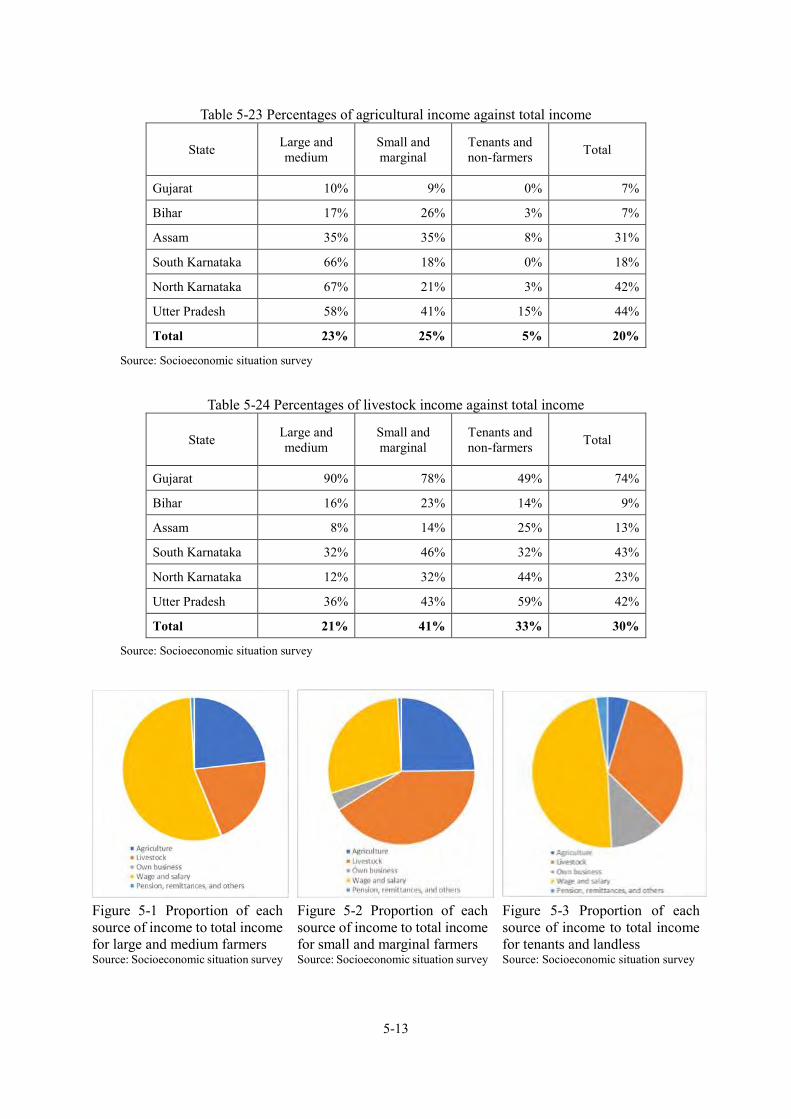
5-13
Table 5-23 Percentages of agricultural income against total income
State Large and medium
Small and marginal
Tenants and non-farmers Total
Gujarat 10% 9% 0% 7%
Bihar 17% 26% 3% 7%
Assam 35% 35% 8% 31%
South Karnataka 66% 18% 0% 18%
North Karnataka 67% 21% 3% 42%
Utter Pradesh 58% 41% 15% 44%
Total 23% 25% 5% 20%
Source: Socioeconomic situation survey
Table 5-24 Percentages of livestock income against total income
State Large and medium
Small and marginal
Tenants and non-farmers Total
Gujarat 90% 78% 49% 74%
Bihar 16% 23% 14% 9%
Assam 8% 14% 25% 13%
South Karnataka 32% 46% 32% 43%
North Karnataka 12% 32% 44% 23%
Utter Pradesh 36% 43% 59% 42%
Total 21% 41% 33% 30%
Source: Socioeconomic situation survey
Figure 5-1 Proportion of each source of income to total income for large and medium farmers
Figure 5-2 Proportion of each source of income to total income for small and marginal farmers
Figure 5-3 Proportion of each source of income to total income for tenants and landless
Source: Socioeconomic situation survey Source: Socioeconomic situation survey Source: Socioeconomic situation survey

5-14
Table 5-25 compares average household annual incomes from livestock activities between villages with and without DCSs. It shows that livestock incomes differ significantly between villages with and without DCSs in Assam and North Karnataka. This indicates that livestock incomes are likely to increase through the formation of DCSs, which is likely to improve the productivity of livestock (as discussed in the previous section). On the other hand, livestock incomes do not significantly differ between villages with and without DCSs in Uttar Pradesh. This indicates that the formation of DCSs had no significant effects on the livelihoods of the target villages in Uttar Pradesh, where the dairy sector is highly developed, and many private dairy companies are procuring milk.
Table 5-25 Comparison of average household annual incomes
from livestock activities between villages with and without DCSs
State Village With/without DCS Average household
annual livestock income (Rs.)
Assam Kanfalla Bhokatgao without DCS 8,972
Malaybari with DCS 26,001
North
Karnataka
Haravala without DCS 11,650
Kumasi with DCS 34,587
Uttar Pradesh Raipura without DCS 42,340
Nadara with DCS 47,031
Source: Socioeconomic situation survey
5.5 Sales of Milk 5.5.1 Buyers of Milk
Table 5-26 shows the percentages of DCS members in the target villages of the socioeconomic situation survey by type of buyer. As shown, almost all DCS members sell their milk to the cooperatives’ DCSs, and a very small percentage sells their milk to other buyers. It is important to note that members in some areas tend to sell their milk to other institutions when the purchase prices of other institutions are high and the procurement volume of the DCSs in these areas tend to decrease during these periods, as discussed in Section 4.7.2

5-15
Table 5-26 Percentages of dairy farmers by type of buyers for DCS members
State Dairy Cooperative Middleman Private
companies
Direct sales to shops/
restaurants
Other households
in the village
Other households outside the
village
Gujarat 100% 0% 0% 0% 0% 0%
Bihar 100% 0% 0% 0% 2% 0%
Assam 100% 3% 0% 0% 14% 0%
South Karnataka 100% 0% 0% 0% 0% 0%
North Karnataka 97% 3% 0% 0% 0% 3%
Uttar Pradesh 97% 6% 0% 0% 1% 0%
Total 99% 2% 0% 0% 2% 0% Note: Multiple answers are allowed. Source: Socioeconomic situation survey
Table 5-27 shows the same figures for non-DCS members. One can see that many non-members
sell their milk to the cooperatives’ DCSs, while some non-members sell their milk to middlemen in the unorganized sector and to private dairy companies.105
Table 5-27 Percentage of dairy farmers by type of buyer for non-members
State Dairy Cooperative Middleman Private
companies
Direct sales to shops/
restaurants
Other households
in the village
Other households
outside of the village
Gujarat 97% 0% 3% 0% 0% 0%
Bihar 39% 37% 6% 8% 29% 6%
Assam 69% 17% 0% 9% 31% 0%
South Karnataka 8% 46% 46% 0% 0% 0%
North Karnataka 0% 100% 0% 0% 0% 0%
Uttar Pradesh 50% 44% 6% 0% 0% 0%
Total 58% 27% 7% 4% 15% 2% Note: Multiple answers are allowed. Source: Socioeconomic situation survey
Table 5-28 shows the same figures for villages without DCSs. Many of them sell their milk to
middlemen in the unorganized sector. Some farmers in Raipura village in Uttar Pradesh sell their milk to private dairy companies. As no private dairy company collects milk in Kanfalla Bhokatgao village in Assam or Haravala village in North Karnataka, none of the farmers sell to private dairy companies in these villages. On the other hand, many farmers in Kanfalla Bhokatgao village bring their milk to restaurants and shops,
105 Table 4-23 shows that many of the non-members in South Karnataka sell their milk to private dairy companies. This is because
there are one small private dairy companies that actively collect milk in Kommasandra village. As the procurement scales of private dairy companies in Karnataka are relatively small, the case of this village seems unrepresentative of the situation in South Karnataka.

5-16
as the village is close to a town. In Haravala village in North Karnataka, a remote area outside of India’s milk distribution channels, many farmers sell their milk to other households.
Table 5-28 Percentages of dairy farmers by type of buyer for villages without DCSs
State, Village Dairy Cooperative Middleman Private
companies
Direct sales to shops/
restaurants
Other households
in the village
Other households outside the
village
Kanfalla_Bhokatgao (Assam) 0% 31% 0% 38% 23% 0%
Haravala (North Karnataka) 0% 13% 0% 0% 75% 38%
Raipura (Uttar Pradesh) 0% 88% 12% 0% 0% 0%
Total 0% 72% 9% 6% 10% 3% Note: Multiple answers are allowed. Source: Socioeconomic situation survey
Table 5-29 shows the percentages of answers to the question “Who is your favorite buyer?” Most
of the farmers in target villages with DCSs answered that the dairy cooperative is their favorite buyer. In Assam, a certain percentage of households’ favor middlemen, which indicates the strong presence of the loose milk markets of the unorganized sector there. Some households in Uttar Pradesh prefer private dairy companies, reflecting the strong presence of private companies there.
Table 5-29 Percentages of favored buyers
With/without DCSs
State/ village
Dairy cooperative Middleman Private
companies
Direct sales to shops/
restaurants
Direct sales to
other HHs in the village
Direct sales to
other HHs outside the
village
Other
Villages
with
DCSs
Gujarat 99% 1% 0% 0% 0% 0% 0%
Bihar 78% 1% 10% 1% 7% 2% 1%
Assam 73% 19% 0% 3% 6% 0% 0% South Karnataka 76% 10% 14% 0% 0% 0% 0% North Karnataka 94% 0% 3% 0% 0% 3% 0% Uttar Pradesh 87% 1% 12% 0% 0% 0% 0%
Total 85% 5% 6% 1% 2% 1% 0%
Villages
without
DCSs
Assam 0% 29% 0% 36% 21% 0% 14% North Karnataka 0% 0% 13% 0% 63% 25% 0% Uttar Pradesh 0% 0% 100% 0% 0% 0% 0%
Total 0% 10% 38% 12% 28% 8% 5% Note: Multiple answers are allowed. Source: Socioeconomic situation survey

5-17
5.5.2 Favorite Buyers and Reasons Table 5-30 shows, among those who chose dairy cooperatives as their favorite buyer, the reasons
why. The table indicates that purchase price stability is the major reason, followed by higher purchase prices. Many also indicated that services such as bonuses, veterinary services, and cattle feed sales were the reasons.
Table 5-30 Reasons why cooperative is the favorite buyer (number of farmers)
State
# of HHwhose
favoritebuyer is
cooperative
Purchasing priceisstable
Purchasing price is
higher
Can getsomebonus
Do notrefuse to
buyregardlessof marketdemand
Cooperative is near tothe house
Cooperative provideveterinaryservices
Cooperative provide
cattleinsurance
Cooperative providecattle feed
Can getsome other
services
Gujarat 187 138 171 68 58 13 56 9 2 1
Bihar 136 56 38 59 28 48 45 27 24 9
Assam 79 56 20 34 23 12 3 - 3 2SouthKarnataka 39 12 18 27 2 16 15 15 16 9NorthKarnataka 34 14 22 12 10 11 8 5 11 3UttarPradesh 122 43 27 64 26 35 1 - 1 2
Total 597 319 296 264 147 135 128 56 57 26 Note: Multiple answers are allowed. Source: Socioeconomic situation survey
Table 5-31 shows, among those who chose middlemen as their favorite buyer, the reasons why.
Some farmers answered that the provision of advance payment was the major reason. Others claimed that they were obliged to sell to middlemen as they were in debt due to advance payments or loans provided by middlemen to purchase livestock.
Table 5-31 Reasons why middleman is the favorite buyer (number of farmers)
State
# of HH whose
favorite buyer is
middleman
Buyers provide advance
payment for milk
Obliged to sell
Do not refuse to buy
regardless of market demand
Purchasing price is higher
Buyer comes to
house gate, so is
convenient to sell
Purchasing
price is stable
Assam 24 12 1 7 1 2 -
Bihar 2 1 - 1 2 2 -
Gujarat 1 - - - 1 - 1 North Karnataka 5 - - 3 3 - 1
Uttar Pradesh 2 - 12 1 2 1 -
Total 34 13 13 12 9 5 2 Note: Multiple answers are allowed. Source: Socioeconomic situation survey
Table 5-32 shows, among those who chose private dairy companies as their favorite buyer, the

5-18
reasons why. Many selected the closeness of milk collection points to their houses as the reason. Others cited the stable purchase price and higher purchase price as the reasons.
Table 5-32 Reasons why private dairy company is the favorite buyer (number of farmers)
State
# of HH whose
favorite buyer is private
company
Collection point is near
the house
Purchase price is higher
Purchase price is stable
Do not refuse to
buy regardless of market demand
Buyer is friend
Buyer is relative
Bihar 18 12 9 2 3 - 1
South Karnataka 7 2 7 2 1 - 2
North Karnataka 2 1 1 1 0 0 0
Uttar Pradesh 72 45 12 16 9 5 1
Total 97 59 28 20 13 5 4 Note: Multiple answers are allowed. Source: Socioeconomic situation survey
5.6 Reasons for Becoming Dairy Cooperative Member or Not
Table 5-33 shows the percentages of reasons cited for becoming dairy cooperative members (multiple answers are allowed). Most cite access to veterinary services. Stable and higher purchase prices are also major reasons.106
Table 5-33 Reasons for becoming cooperative member
Note: Multiple answers are allowed. Source: Socioeconomic situation survey
Table 5-34 shows the percentages of reasons cited for not becoming dairy cooperative members
(multiple answers are allowed) in villages with DCSs. The major reasons are “Not having enough milk production to sell” and “Not having a milking animal.” Others cite the poor management of cooperatives as a reason; this response is relatively frequent in Bihar, South Karnataka, and Uttar Pradesh.
106 Though milk unions do not provide services to members in Uttar Pradesh at present, members in the state’s sample villages
had been provided various services until a few years ago.
StateCan get
veterinaryservice
Purchasingprice isstable
Purchasingprice ishigher
Do notrefuse to
buyregardlessof marketdemand
Can getbonus
Can get AIservice
Can buycattle feedat low cost
There is noother buyer
Can gettrainings
Can getsome other
services
Gujarat 95% 75% 89% 41% 31% 23% 10% 5% 13% 33%Bihar 83% 51% 48% 40% 44% 34% 32% 11% 4% 49%Assam 80% 58% 23% 41% 27% 6% 6% 27% 5% 27%South Karnataka 86% 36% 43% 48% 60% 29% 38% 10% 7% 60%North Karnataka 91% 55% 53% 51% 21% 34% 30% 11% 6% 45%UP 65% 46% 21% 24% 43% 11% 12% 1% 12% 49%Total 83% 57% 51% 39% 37% 22% 19% 10% 8% 42%

5-19
Table 5-34 Reasons for not being a member of dairy cooperative
State Not
enough milk to
sell
Do not have
milking cow or buffalo
Management of
cooperatives is poor
Purchase price of
cooperatives is low
Prefer to sell milk to other
institution
Cannot trust the quality
test
Obliged to sell to other
buyers
Gujarat 19% 33% 6% 1% 1% 1% 0%
Bihar 51% 7% 29% 30% 16% 15% 1%
Assam 44% 26% 5% 2% 5% 0% 2%
South Karnataka 8% 56% 25% 17% 19% 14% 8%
North Karnataka 58% 42% 0% 0% 4% 0% 0%
Uttar Pradesh 43% 7% 26% 20% 13% 0% 2%
Total 37% 25% 16% 13% 10% 6% 2% Note: Multiple answers are allowed. Source: Socioeconomic situation survey
5.7 Utilization of Loans and Insurance for Livestock Activities
Table 5-35 shows the percentages of farmers who have used loans to purchase livestock. One can see that only a limited number of farmers have used loans to purchase livestock. The study team found that a number of government schemes are designed to help farmers utilize bank loans to purchase livestock, by providing a guarantor for loans or subsidies, but the utilization of loans to purchase livestock seems not to be popular.107
Table 5-35 Percentages of farmers who have used loans to purchase livestock
State, village Total Villages with DCSs Villages
without DCSs Member Non-member
Gujarat 2.2% 1.3% 4.3% -
Bihar 1.3% 1.5% 1.4% -
Assam 1.7% 2.4% 1.6% 1.1%
South Karnataka 17.9% 19.0% 16.7% -
North Karnataka 1.3% 1.9% 4.2% 0.0%
Uttar Pradesh 2.1% 4.5% 0.0% 0.0%
Total 2.8% 3.4% 3.9% 0.4%
Source: Socioeconomic situation survey
Table 5-36 shows the percentages of cows and female adult buffaloes that are insured. One can see that the figures are quite high in Karnataka. This is likely due to the 50% subsidy for insurance fees
107 In Table 4-30, the percentage of farmers who use loans to purchase livestock is quite high in South Karnataka. This is because
many of the South Karnataka farmers surveyed by the study team applied for the government-supported loan scheme as a group. Thus, this figure is likely to be much higher than in other villages in South Karnataka. However, the utilization of loans to purchase livestock seems to be relatively high in Karnataka, as many government schemes are designed to promote the utilization of loans for livestock purchases.

5-20
offered by milk unions in Karnataka (which was discussed in Section 4.8). One can see that insurance for livestock is not very common in other states.
Table 5-36 Percentages of insured cows and female adult buffaloes
State, village Total Villages with DCSs Villages
without DCSs Member Non-member
Gujarat 1% 1% 0% -
Bihar 0% 0% 0% -
Assam 1% 0% 1% 2%
South Karnataka 38% 47% 16% -
North Karnataka 3% 8% 0% 0%
Uttar Pradesh 1% - 0% 0%
Total 3% 4% 1% 1% Source: Socioeconomic situation survey
5.8 Summary 5.8.1 Major Findings
The following are the major findings of the discussion in this chapter: Most of the dairy farmers are small and own a couple of cattle and buffaloes or fewer. Large-scale
dairy farmers who own more than 10 livestock are quite rare. The number of livestock reared by each household tends to increase as the landholding area increases. However, the difference in incomes gained from livestock activities between large and
small/marginal/landless farmers is significantly less than the difference in agricultural incomes. Developing the livestock sector will be more effective in improving the livelihoods of smaller-scale and landless farmers than developing the agriculture sector would be.
There is a significant difference in milking livestock productivity levels between villages with DCSs and those without. This seems to be due to the activities and services of dairy cooperatives, such as AI services and sales of cattle feed at lower prices. Support designed to expand milk collection networks to areas where livestock productivity is low is likely to improve the livelihoods of farmers there.
Though a number of government schemes are available to support the utilization of loans for purchasing livestock, most farmers do not have access to such loans.
Livestock insurance is rarely utilized, except in Karnataka, where milk unions provide a 50% subsidy for insurance.
5.8.2 Issues and Challenges The productivities of those dairy farmers who do not have access to the supports on dairy production
such as AI and cattle feed and market access to the formal sector are typically low. There are significant differences in dairy production levels across regions. If this regional gap expands

5-21
further, it will become more economical in low-productivity areas to bring milk from other areas than to supply milk locally. This might cause farmers in low-productivity areas to be unable to continue dairy production.


6-1
Chapter 6 Current Food Safety Situation and Issues 6.1 FSSAI and Regulatory Framework
The Food Safety and Standards Authority of India (FSSAI) was established in 2006 under the Food Safety and Standards Act, 2006. The objectives of FSSAI are to establish science-based standards for articles of food and to regulate Food Business Operators (FBOs), storage, distribution, sales, and imports to ensure the availability of safe and wholesome food for human consumption.
The FSSAI consolidated various government acts and orders108 concerning food-related issues in various ministries and departments into one law in 2011, the Food Safety and Standards Rules and Regulations, 2011. The standards, rules, and regulations regarding milk and dairy products are included in this law. This regulatory framework has been amended since its establishment according to internal needs and relevant international standards, such as the Codex/FAO and WHO.
A recent amendment regarding cow milk standards concerns its fat and solid non-fat (SNF) content. The standard for minimum fat and SNF percentages for milk used to be classified into three types based on the climate and geographical condition of each state. This was unified into one standard in October 2017. The national standard is now 3.2% fat and 8.3% SNF content for all states. An inter-state trade of milk is one of the reasons for this amendment.
Buffalo milk still has two standards (5.0% or 6.0% of fat and 9.0% of SNF content), as before, but this will also be unified for all states, according to the FSSAI.
Table 6-1 Amendment of milk standard in October 2017
State Fat SNF
⇒
States Fat SNF Chandigarh, Haryana, Punjab 4.0 8.5
All 3.2 8.3
Andaman and Nicobar Islands, Andhra Pradesh, Arunachal Pradesh, Assam, Bihar, Chhattisgarh, Dadra and Nagar haveli, Delhi, Goa, Daman and Diu, Gujarat, Himachal Pradesh, Jammu and Kashmir, Jharkhand, Karnataka, Kerala, Lakshadweep, Minicoy and Admonitive Islands, Madhya Pradesh, Maharashtra, Manipur, Meghalaya, Nagaland, Puducherry, Rajasthan, Sikkim, Tamil Nadu, Tripura, Uttar Pradesh, Uttarakhand, West Bengal
3.5 8.5
Mizoram, Orissa 3.0 8.5 Source: FSSAI
The FSSAI is administered by two bodies: the FSSAI at the national level and the state food safety
commissioner’s office at the state government level. The central office of the FSSAI in Delhi frames regulations reflecting the standards and guidelines for food safety, provides advice to the state governments and governmental agencies, and creates information networks across India. The state food safety commissioners enforce those regulations, such as by monitoring and inspecting FBOs, collecting data on
108 Prevention of Food Adulteration Act, 1954, Fruit Products Order, 1955, Meat Food Products Order, 1973, Vegetable Oil Products (Control) Order, 1947, Edible Oils Packaging (Regulation) Order 1988, Solvent Extracted Oil, De- Oiled Meal and Edible Flour (Control) Order, 1967, Milk and Milk Products Order, 1992 etc.
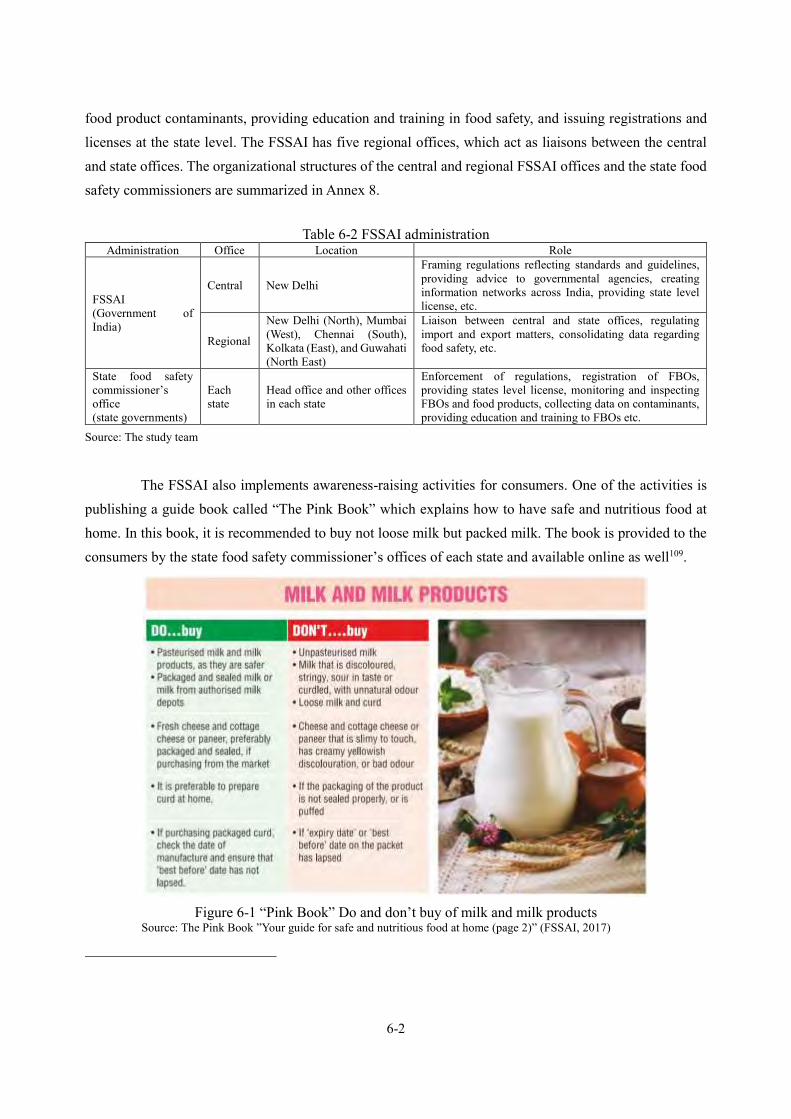
6-2
food product contaminants, providing education and training in food safety, and issuing registrations and licenses at the state level. The FSSAI has five regional offices, which act as liaisons between the central and state offices. The organizational structures of the central and regional FSSAI offices and the state food safety commissioners are summarized in Annex 8.
Table 6-2 FSSAI administration
Administration Office Location Role
FSSAI (Government of India)
Central New Delhi
Framing regulations reflecting standards and guidelines, providing advice to governmental agencies, creating information networks across India, providing state level license, etc.
Regional
New Delhi (North), Mumbai (West), Chennai (South), Kolkata (East), and Guwahati (North East)
Liaison between central and state offices, regulating import and export matters, consolidating data regarding food safety, etc.
State food safety commissioner’s office (state governments)
Each state
Head office and other offices in each state
Enforcement of regulations, registration of FBOs, providing states level license, monitoring and inspecting FBOs and food products, collecting data on contaminants, providing education and training to FBOs etc.
Source: The study team
The FSSAI also implements awareness-raising activities for consumers. One of the activities is
publishing a guide book called “The Pink Book” which explains how to have safe and nutritious food at home. In this book, it is recommended to buy not loose milk but packed milk. The book is provided to the consumers by the state food safety commissioner’s offices of each state and available online as well109.
Figure 6-1 “Pink Book” Do and don’t buy of milk and milk products
Source: The Pink Book ”Your guide for safe and nutritious food at home (page 2)” (FSSAI, 2017)
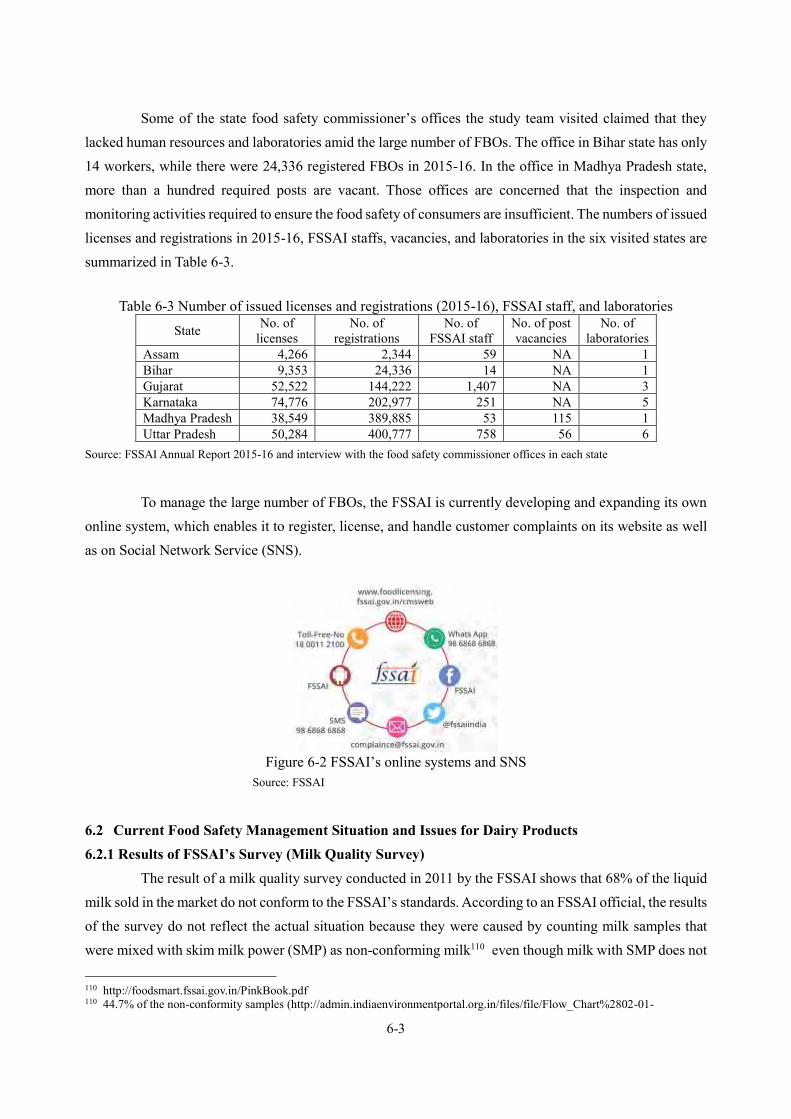
6-3
Some of the state food safety commissioner’s offices the study team visited claimed that they lacked human resources and laboratories amid the large number of FBOs. The office in Bihar state has only 14 workers, while there were 24,336 registered FBOs in 2015-16. In the office in Madhya Pradesh state, more than a hundred required posts are vacant. Those offices are concerned that the inspection and monitoring activities required to ensure the food safety of consumers are insufficient. The numbers of issued licenses and registrations in 2015-16, FSSAI staffs, vacancies, and laboratories in the six visited states are summarized in Table 6-3.
Table 6-3 Number of issued licenses and registrations (2015-16), FSSAI staff, and laboratories
State No. of licenses
No. of registrations
No. of FSSAI staff
No. of post vacancies
No. of laboratories
Assam 4,266 2,344 59 NA 1 Bihar 9,353 24,336 14 NA 1 Gujarat 52,522 144,222 1,407 NA 3 Karnataka 74,776 202,977 251 NA 5 Madhya Pradesh 38,549 389,885 53 115 1 Uttar Pradesh 50,284 400,777 758 56 6
Source: FSSAI Annual Report 2015-16 and interview with the food safety commissioner offices in each state
To manage the large number of FBOs, the FSSAI is currently developing and expanding its own online system, which enables it to register, license, and handle customer complaints on its website as well as on Social Network Service (SNS).
Figure 6-2 FSSAI’s online systems and SNS
Source: FSSAI
6.2 Current Food Safety Management Situation and Issues for Dairy Products 6.2.1 Results of FSSAI’s Survey (Milk Quality Survey)
The result of a milk quality survey conducted in 2011 by the FSSAI shows that 68% of the liquid milk sold in the market do not conform to the FSSAI’s standards. According to an FSSAI official, the results of the survey do not reflect the actual situation because they were caused by counting milk samples that were mixed with skim milk power (SMP) as non-conforming milk110 even though milk with SMP does not
110 http://foodsmart.fssai.gov.in/PinkBook.pdf 110 44.7% of the non-conformity samples (http://admin.indiaenvironmentportal.org.in/files/file/Flow_Chart%2802-01-

6-4
violate the rules, and it is a common practice in the dairy industry to adjust fat and SNF contents with SMP. However, the study team observed that a certain percent of milk in the market, especially in
unorganized sector, doesn’t meet the FSSAI’s standard. At the state level, the food safety commissioner’s office regularly takes samples at markets for inspection. In addition, they sometimes conduct surveys on specific food items once a problem is suspected. Table 6-4 summarizes the results of those survey in three states. It shows that 87 samples among 493 samples (17.6%) were found as adulterated or substandard, and most of the violations were detected in the unorganized sector. It implies that the more the organized sector expand, the less violations of FSSAI’s standard are detected. As the result, consumers can ensure safety and quality of milk and dairy products more.
Table 6-4 Results of sample survey in three states
State Adulteration/Substandard
Samples Year Organized sector Unorganized sector Bihar 0 27 124 2017
Gujarat 0 50 324 2017 Madhya Pradesh 1 9 45 2016
Total 1 86 493
Source: Based on the information collected from State Food Safety Commissioners
The FSSAI intends to conduct the milk survey regularly. The survey carried out in 2016 has not
been published yet. According to FSSAI officials, they found that the survey result seemed not to reflect actual situation because of inappropriate sampling methods, and they have been still receiving feedback from the states. Since 2011, the FSSAI has been struggling to conduct the surveys properly. The FSSAI is expected to produce more precise report. 6.2.2 Food Safety Management of Different Food Business Operators (1) Milk Unions
Milk unions are generally working hard to maintain quality and ensure the safety of their dairy products by taking practical measures. They educate farmers on how to collect quality milk and obtain certification under international standards such as the ISO for their plants to ensure quality and food safety. The general observations of the study team about the food safety management of the dairy unions are as follows: 1) At Village Level To educate farmers, milk unions provide training to them on several topics, such as basic dairy
knowledge, breeding, and hygiene management. Hence, the trained farmers are knowledgeable about them and follow a certain hygienic standard. For example, most farmers use stainless steel milk cans,
2012%29.pdf).

6-5
as is recommended. These are sometimes provided by unions, as they are more hygienic than plastic ones. Some farmers are still using plastic cans or lidless buckets as well.
At DCSs where milk unions collect raw milk, fat and SNF are mainly checked to determine the milk purchase price. At the same time, experienced DCS staff check the milk organoleptically. If there is any doubt about milk quality, they use a simple test kit to check for adulteration. This test kit is usually provided by the milk unions.
2) At Plant Level All the plants the study team visited have a FSSAI license and passed inspection for renewal. Many of
them also follow international standards for food quality and safety management, such as ISO9001, ISO14000, HACCP, ISO22000, and FSSC22000. According to the NDDB, 170 out of the 250 milk union plants have ISO certification. Among 14 milk unions visited by the study team, ten milk unions have ISO22000 certificate.
When dairy plants receive raw milk, all types of tests, such as organoleptic tests, detailed component/chemical tests, and micro-biological examinations, are conducted. In India, the HTST method is widely applied to pasteurize milk, and the shelf life of the pasteurized milk is about two days when stored below 8℃. Their products are also sampled and tested to confirm that they meet the FSSAI standards before dispatch from the plants. Table 6-5 summarizes the quality check system of the milk unions.
Table 6-5 Quality check of milk by milk unions
Particular Kinds of tests and methods Responsibility Farmers to DCS (BMC)
Fat & SNF by manual/automated machine Adulteration by adulteration kit (in case of suspect)
DCS staff
DCS (BMC) to Milk tanker
Fat & SNF by lactometer Temperature by thermometer Adulteration by adulteration kit (in case of suspect)
Driver of tanker (third party)
Milk tanker to Dairy plant
Organoleptic tests by experienced staff Temperature, fat, protein, moisture, brix, pH, salt, heavy
metals, mycotoxin, antibiotics, pesticides, food additives, radionuclide etc. by chemical inspection equipment
E. coli, coliform, s. Aureus, yeast, listeria, salmonella, somatic cell, etc. By microbiological testing equipment
Department of quality control
Dairy plant to retailers (Dispatch at plant)
Same tests as above Department of quality control
Source: The study team
The study team found that the Bangalore milk union and Saahaj Producer Company paid higher prices
for raw milk with low bacteria counts. It has been rare to see a low bacteria count recognized as higher quality. In addition, the study team couldn’t find any milk unions who examines contamination of antibiotics which is strictly controlled in developed countries.
A department of quality control ensures their product quality at milk union. The department is

6-6
positioned under the milk union’s top management such as the managing director and CEO and separated from the department of a plant operation (See Figure 6-3, organizational chart of Bhopal milk union as an example). Quality control managers at the plants are in a position to report directly to the managing director or CEO. This is important for securing and maintaining quality. If there is a problem regarding quality, they can report to their top management without interference from the person in charge of the plant.
Figure 6-3 Organizational chart of Bhopal milk union Source: Bhopal milk union
According to the milk unions visited by the study team, there is no urgent need to renew the processing
equipment in the plants from the viewpoint of food safety. Some dairy plants lack automated processing and cleaning systems, so that the milk unions must meet the hygiene and sanitization requirements manually. However, it is better to install automated processing and cleaning systems to ensure quality and a hygienic environment and to reduce accidents caused by human error in near future.
Most of the plant buildings are old since they were mainly built in the 1970s to 1980s using old designs. Their usage of water, electricity, and fuel are thus inefficient according to the plant engineers. Hence, plant reconstruction is recommended to improve the efficiency of those resources.
All milk unions have installed hygiene management systems, but they are not implemented at many dairy plants as strictly as they are in Japanese dairy plants. The study team observed the need for the following improvements: Most of the plant workers wear masks, caps, gloves, and aprons, but not all do. Most of the workers wear accessories such as bracelets and rings, which can cause
contamination. For insect deterrence, the dairy plant should be shielded from the outside, but few dairy plants
were insect-free. The study team observed many plants with flies, and some had a gecko or cat,
6-7
not only at the milk reception area but also in the processing section. Only a few plants had full handwashing facilities with soap, dryers/paper towels, and disinfectant. In
addition, few plants had soap for washing hands in the toilet. In Section 4.5.3, the study team pointed out improvement needs of plant management by applying 5S.
From hygiene point of view, the study team recommends Japanese 7S method. This 7S has two more ‘S’, “Senjou (cleaning)” and “Sakkin (disinfection)”, in addition to the 5S. This method is widely implemented in Japan and applicable especially for the food related industry such as the dairy plant.
(2) Private Dairy Company
In terms of food safety management, the study team did not identify fundamental differences between milk unions and private dairy companies111; Some have a sophisticated management system, and some don’t. The private dairy companies which the study team visited also have FSSAI licenses and international standards such as ISO 22000 and FSSC 22000. The quality check system and tools are also the same with the unions (detailed information is summarized in Annex 10). They have a department of quality control as well to ensure the quality of products. Additionally, some private dairy companies provide different types of trainings to the farmers and the food safety is one of the topics. (3) Unorganized Sector
In unorganized sector, the study team did not find any activities to ensure food safety. So-called milk-man or middleman who trade raw milk from farmers to consumers do not confirm the milk quality with scientific method, as far as the study team observed. They collect raw milk from farmers, mostly by themselves, and check the quality with its taste, smell and touching. They transport it with milk cans (stainless or plastic) at ambient temperature. The buyers (individual consumers, sweets producers, hotels and restaurants etc.) trust the middleman and check the quality only by organoleptic method112. (4) Comparisons of Food Safety Management
The differences in food safety management among the different actors in dairy sector are summarized in Table 6-6. While the organized sector (dairy cooperatives and private dairy companies) implement the different types of food safety measurements to secure the quality and follow the FSSAI standards, the unorganized sector (milk man/middleman) just transport the milk without any food safety measures. Hence, the more organized sector expands its milk collection network and volume, the more quality milk will be. Sole common aspect of all actors is that both stainless and plastic milk cans are used by the farmers although the stainless milk can is recommended from view point of hygiene management.
111 The study team visited small and large private dairy companies including “Paras Dairy (Annual turn over 2,000 crore)”, “Namaste India (Annual turnover 1,000 crore)”, “Gyan (Annual turnover 650 crore)” etc. 112 Based on the information collected by the study team. Further research is needed to confirm the detailed situation.
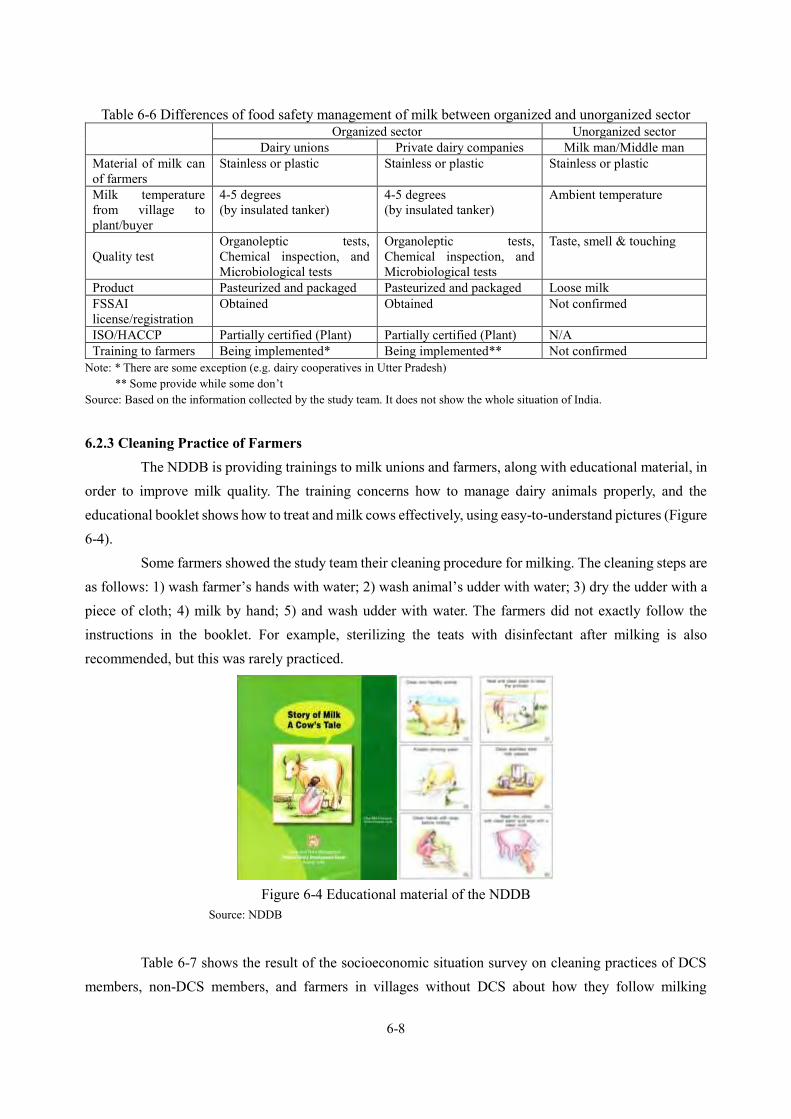
6-8
Table 6-6 Differences of food safety management of milk between organized and unorganized sector
Organized sector Unorganized sector Dairy unions Private dairy companies Milk man/Middle man
Material of milk can of farmers
Stainless or plastic Stainless or plastic Stainless or plastic
Milk temperature from village to plant/buyer
4-5 degrees (by insulated tanker)
4-5 degrees (by insulated tanker)
Ambient temperature
Quality test Organoleptic tests, Chemical inspection, and Microbiological tests
Organoleptic tests, Chemical inspection, and Microbiological tests
Taste, smell & touching
Product Pasteurized and packaged Pasteurized and packaged Loose milk FSSAI license/registration
Obtained Obtained Not confirmed
ISO/HACCP Partially certified (Plant) Partially certified (Plant) N/A Training to farmers Being implemented* Being implemented** Not confirmed
Note: * There are some exception (e.g. dairy cooperatives in Utter Pradesh) ** Some provide while some don’t Source: Based on the information collected by the study team. It does not show the whole situation of India.
6.2.3 Cleaning Practice of Farmers
The NDDB is providing trainings to milk unions and farmers, along with educational material, in order to improve milk quality. The training concerns how to manage dairy animals properly, and the educational booklet shows how to treat and milk cows effectively, using easy-to-understand pictures (Figure 6-4).
Some farmers showed the study team their cleaning procedure for milking. The cleaning steps are as follows: 1) wash farmer’s hands with water; 2) wash animal’s udder with water; 3) dry the udder with a piece of cloth; 4) milk by hand; 5) and wash udder with water. The farmers did not exactly follow the instructions in the booklet. For example, sterilizing the teats with disinfectant after milking is also recommended, but this was rarely practiced.
Figure 6-4 Educational material of the NDDB
Source: NDDB
Table 6-7 shows the result of the socioeconomic situation survey on cleaning practices of DCS
members, non-DCS members, and farmers in villages without DCS about how they follow milking
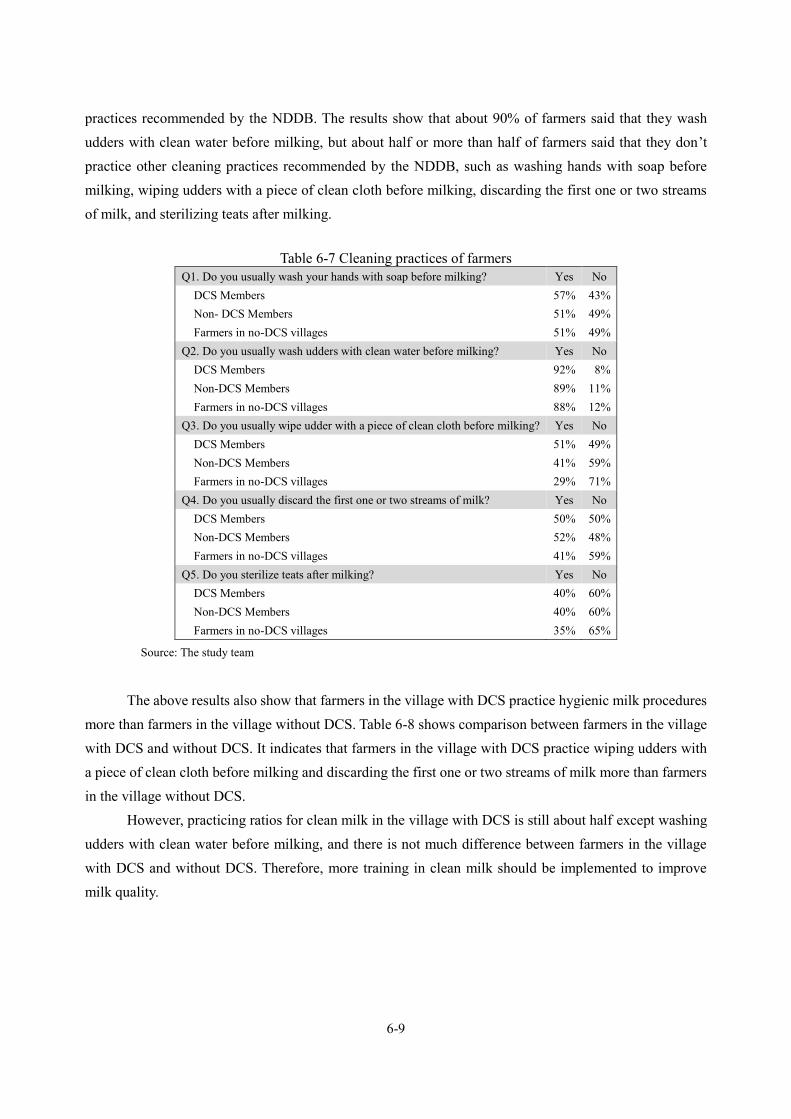
6-9
practices recommended by the NDDB. The results show that about 90% of farmers said that they wash udders with clean water before milking, but about half or more than half of farmers said that they don’t practice other cleaning practices recommended by the NDDB, such as washing hands with soap before milking, wiping udders with a piece of clean cloth before milking, discarding the first one or two streams of milk, and sterilizing teats after milking.
Table 6-7 Cleaning practices of farmers
Q1. Do you usually wash your hands with soap before milking? Yes No DCS Members 57% 43% Non- DCS Members 51% 49% Farmers in no-DCS villages 51% 49% Q2. Do you usually wash udders with clean water before milking? Yes No DCS Members 92% 8% Non-DCS Members 89% 11% Farmers in no-DCS villages 88% 12% Q3. Do you usually wipe udder with a piece of clean cloth before milking? Yes No DCS Members 51% 49% Non-DCS Members 41% 59% Farmers in no-DCS villages 29% 71% Q4. Do you usually discard the first one or two streams of milk? Yes No DCS Members 50% 50% Non-DCS Members 52% 48% Farmers in no-DCS villages 41% 59% Q5. Do you sterilize teats after milking? Yes No DCS Members 40% 60% Non-DCS Members 40% 60% Farmers in no-DCS villages 35% 65%
Source: The study team
The above results also show that farmers in the village with DCS practice hygienic milk procedures
more than farmers in the village without DCS. Table 6-8 shows comparison between farmers in the village with DCS and without DCS. It indicates that farmers in the village with DCS practice wiping udders with a piece of clean cloth before milking and discarding the first one or two streams of milk more than farmers in the village without DCS.
However, practicing ratios for clean milk in the village with DCS is still about half except washing udders with clean water before milking, and there is not much difference between farmers in the village with DCS and without DCS. Therefore, more training in clean milk should be implemented to improve milk quality.

6-10
Table 6-8 Comparison on cleaning practices between village with DCS and without DCS % of farmer who
answered “yes” in village with DCS
% of farmer who answered “yes” in village without DCS
Q1. Do you usually wash your hands with soap before milking? 55% 51%
Q2. Do you usually wash udders with clean water before milking? 91% 88%
Q3. Do you usually wipe udder with a piece of clean cloth before milking? 48% 29% *
Q4. Do you usually discard the first one or two streams of milk? 50% 41% *
Q5. Do you sterilize teats after milking? 40% 35% Note: * shows statistical significance at 5% level Source: The study team
6.3 Future Prospects
Because milk prices are mainly decided by fat and SNF content, both farmers and milk buyers pay little attention to other factors of milk quality, such as bacterium quantity. Farmers milk manually and keep the milk at ambient temperatures, which increases the number of bacteria. In addition, as mentioned above, farmers are not fully aware of the importance of hygienic milking.
The more farmers who join milk unions, the more farmers who will be educated regarding hygiene management. This would improve milk quality, including the number of bacteria. Realizing the significance of the bacteria count for the quality of milk and dairy products, the NDDB encourages cooling milk at village level. The NDDB and DoAHDF have been providing funds through the perspective plan and NDP to install BMCs at village level.
Moreover, if buyers focus on more than just fat and SNF, such as bacteria count, and are willing to pay higher prices for better quality, farmers will pay much more attention to milk quality as well. In Japan and Australia, for example, the buyers of row milk generally pay premier price on the milk with low bacteria count or penalty price on high bacteria count113. The study team found that the Bangalore milk union and Saahaj producer company paid higher prices for raw milk with low bacteria counts. It has been rare to see a low bacteria count recognized as higher quality.
In addition, the study team couldn’t find any milk processors who strictly check contamination of antibiotic in milk in India. In Japan, milk contaminated with antibiotics is rejected at the reception of plants. If the milk contaminated with antibiotics is already mixed with other milk, the farmers who provide the contaminated milk have to compensate all the milk. Antibiotics are commonly used for treatment of mastitis and other diseases. Therefore, farmers strictly record the provision of antibiotics and segregate milk produced by the treated animals. Those pricing and rejection mechanism needs to be installed to improve hygiene management in India in addition to training.
113 JICA Hokkaido International Center (Obihiro) presentation to Department of Animal Husbandry, Ministry of Agriculture, India and website of Agriculture & Livestock Industries Corporation (http://lin.alic.go.jp/alic/month/fore/1996/nov/top-sd03.htm)

6-11
6.4 Summary The FSSAI is the main body regulating food security in India, but it faces a lack of human resources.
Their activities, such as sample surveys and inspections, are not being sufficiently conducted. Milk unions are managing quality and hygienic control at their plants, but this is not implemented
strictly enough in most cases. There is still room for improvement using Japanese methodologies, such as 5S, 7S or Kaizen.
Farmers and milk buyers are little aware of milk hygiene factors such as bacteria counts. This is probably because raw milk prices are mainly determined by fat and SNF content. To improve milk quality, a mechanism for checking bacteria counts for price determination needs to be introduced.
The milk middlemen in the unorganized sector rarely implement hygiene management. Expanding milk unions would help improve hygiene management and milk quality.


7-1
Chapter 7 Issues and Countermeasures in the Dairy Sector Based on the findings confirmed and acquired through the study, this chapter intends to summarize
the current situation in India’s dairy sector, role of dairy cooperatives, issues of dairy cooperatives, its countermeasures, and consideration of Japanese technologies and experience which may contribute to India’s dairy sector. 7.1 Current Situation of Dairy Sector As mentioned in Chapter 2, India needs to fulfill increasing domestic demand. However, since the majority of milk producers are small, marginal, and landless farmers who are scattered here and there. In order to fulfil the demand, milk production needs to be increased and milk distribution channel for surplus of milk needs to be expanded. Dairy cooperatives are expected to bring a comprehensive solution. In this section, the current situation of dairy sector including dairy cooperatives are summarized.
Figure 7-1 Outline of this section
7.1.1 Importance of Fulfilling Domestic Demand
As mentioned in Chapter 2, India is the world largest milk producing country and became an exporting county of dairy products in 2000s. However, the demand for milk and dairy products in India will increase dramatically because of increase in population and increase in per capita consumption led by urbanization and increasing income. To meet the increased demand, milk production in India has to be increased and marketing channel to distribute marketable surplus of milk to consumers need to be expand. Otherwise India may become an importing country of dairy products. It would destabilize the Indian domestic market and the social and economic stability of India’s rural society, and would affect other dairy-importing countries that rely on international markets.
7.1.2 Small, Marginal, and Landless Farmers as Major Milk Producers
As mentioned Chapter 2, about 80% of milk is produced by small, marginal, and landless farmers, many of whom are under poverty line or vulnerable. The Government of India has clarified their vision such as “enabling sustainable growth of dairy sector by doubling of farmers’ income engaged in dairying,
Overall issue: Fulfilling domestic demand
Given condition: Small, marginal and landless farmers
as major milk producers
Solution for overall issue - Increase milk production - Expand milk distribution channel for
surplus of milk
Dairy cooperatives
Private companies
FSSAI
Solution/ contribution

7-2
thereby paving way for nutritional security, economic prosperity and livelihood support” as aiming doubling milk production by 2023-24115.
Balancing between the modernization and the protection of small-scale farmers’ socioeconomic welfare is important for stability of rural society. Dairy can contribute poverty alleviation as mentioned in Section 2.2.3. In addition, according to the socioeconomic situation survey, one can see that the livelihoods of farmers can be improved through the development of livestock activities, even if they have limited landholdings. The result of the socioeconomic situation survey was in line with the existing studies which concluded that dairy can contribute poverty alleviation.
Dairy development in India faces several challenges, such as i) low productivity, ii) low production volume per farmer, iii) limited market access, vi) the exclusion of landless farmers from dairy farming, and v) demand for quality improvement, as mentioned in Section 2.2.4. Small, marginal, and landless farmers tend to face higher transaction costs than large scale farmers116 so that solving those issues with small, marginal, and landless farmers is more difficult than one with large scale farmers.
To solve these problems, the public sector has been providing many kinds of support, including the projects and financial support mentioned in Section 2.3.4. To reach scattered large numbers of the farmers, dairy cooperative development is expected to bring comprehensive solutions that will help disseminate technologies and necessary services to farmers and secure milk farmers’ sales channels in India, where small-scale mixed farmers play a major role. The role of dairy cooperative is summarized in the next section.
7.1.3 Role of Dairy Cooperatives
The Government of India has been putting efforts on organizing the farmers into cooperatives at village, district, and state level duly supported by the NDDB through program like the Operation Flood. According to the Government of India, it has resulted in increased productivity of milch animals and income of farmers in addition to making available quality milk to consumers at a reasonable price117.
GCMMF became the Indian largest dairy manufacturer with Rs. 38,000 crores of annual turnover and 3.6 million farmers as their members. The Anand model with three layers structure has been applied to almost all states in India. The positive impacts of dairy cooperatives could be observed through the field survey and the socioeconomic situation survey as summarized below. (1) Positive Impacts of Dairy Cooperatives at Village Level
The positive impacts of dairy cooperatives at village level were confirmed through the field survey and the socioeconomic situation survey as mentioned in Chapter 5: The ratio of farmers who use AI services is significantly higher for farmers in villages with DCSs than
farmers in villages without DCS; The percentages of farmers who use AI services in villages with DCS
115 DoAHDF (2017) NAP 116 FAO (2009) The state of food and agriculture 117 DoAHDF (2013) The national livestock policy 2013

7-3
are 73% for DCS members and 65% for non-members, while the percentage of farmers who use AI services in villages without DCSs is only 29%.
There are significant differences in the composition of breeds between the states. For example, the percentages of high-yield breeds such as HF are quite high in Gujarat (63%) and South Karnataka (84%), but the percentages of low-yield breeds such as other indigenous breeds and indigenous non-descriptive are quite high in Assam (indigenous non-descriptive 68%) and North Karnataka (indigenous 61%).
The percentage of farmers who provide cattle feed to their livestock every day is higher for DCS members (54%) than for non-members (38%). Moreover, it is significantly lower for farmers in villages without DCSs (6%) than for those in villages with DCSs.
Except Uttar Pradesh where many private dairy companies work, the yield per livestock is higher where the ratios of high-yield breeds are higher and where AI services and cattle feed are more heavily utilized (for example, average yields per cow are 11.0 liters in Gujarat and 12.1 liters in South Karnataka while 3.6 liters in Assam and 4.3 liters in North Karnataka). The higher ratio of high-yield livestock may partly be caused by the high utilization of AI services. Moreover, the higher utilization of cattle feed is likely to increase the productivity of high-yield livestock.
Table 7-1 Average yield per cow per day, ratio of high-yield breed, AI usage, and cattle feed provision
Village, State Average yields per cow per day (liters)
Ratio of high-yield breeds
AI usage Cattle feed every day
Villages without DCSs 3.4 17% 29% 23%
Kanfalla Bhokatgao (Assam) 1.8 10% 13% 6%
Haravala (North Karnataka) 2.1 3% 23% 16%
Raipura (Uttar Pradesh) 8.1 87% 47% 47%
Villages with DCSs 7.6 65% 70% 45%
Gujarat 11.0 71% 91% 36%
Bihar 6.6 86% 64% 57%
Assam 3.6 43% 55% 24%
South Karnataka 12.1 97% 100% 37%
North Karnataka 4.3 39% 61% 41%
Uttar Pradesh 7.4 75% 58% 43%
Total 7.0 55% 62% 37% Note: Ratio of high-yield breeds is a summary of all breads except “other indigenous” and “indigenous ND” in Table 5-11.
Lowest three categories are highlighted by blue while highest three categories are highlighted by pink. Source: Socioeconomic situation survey
The per-household milk production volumes of villages without DCSs (508 liters per household in
Assam and 358 liters per household in North Karnataka), except villages in Uttar Pradesh (2,133 liters per household), are much lower than those of villages with DCSs (2,449 liters per household), even though the number of livestock holdings is not significantly different from those of other villages.
The ratios of milk sales volumes to production volumes in villages with DCSs (83%) are much higher than in other villages (39% in Assam and 46% in North Karnataka). This indicates higher productivity

7-4
and more active milk sales activities among farmers in villages with DCSs, probably due to the services and other benefits provided by DCSs and milk unions.
In the area where dairy cooperatives are functional, the dairy cooperatives are expected to purchase all milk brought from members at stable price. In the situation, the farmers can have incentive to invest on dairy activities. The dairy cooperatives are also expected to provide necessary technical assistants and inputs such as AI services, cattle feed with affordable price and others, so that farmers can increase milk productivity and milk production volume as resulting that farmers can increase income through dairy activities.
Regarding the stability of purchasing price, the study team observed that the purchasing prices and volumes of the dairy cooperatives is more stable than one of private dairy companies in general. In addition, the study team observed that the dairy cooperatives generate upward pressure on milk purchasing price and downward pressure on milk retail price in the particular area where the dairy cooperative is dominant. Through the field survey, the study team confirmed that after Amul entered to Uttar Pradesh, Amul increased purchasing price of milk and other milk processors followed it. In case of Assam, Amul determined milk retail price lower than existing products. The lower retail pricing became downward pressure on milk retail price there. (2) Virtuous Cycle at Dairy Cooperative Level
As mentioned in Section 4.3.2, the scale of procurement and production volume influence the financial condition of the milk unions: milk unions which have smaller procurement volumes tend to fall into accumulated loss. Therefore, it is important for dairy cooperatives to increase procurement and production volume at certain level. According to the result of the socioeconomic situation survey, the reason why the farmers sell their milk to cooperatives are stable and high purchasing prices, provision of bonus, followed by all amount purchases, near collection points, and provision of veterinary services. To increase milk procurement volume, dairy cooperatives need to provide attractive condition to farmers, especially if there are competition with middlemen of unorganized sector and private dairy companies. Once the dairy cooperatives can get benefit, the large portion of the profits of milk unions are reimbursed to cooperative members in the form of bonus and various services and welfare funds which can attract cooperative members. So that the virtuous cycle at dairy cooperative level can also be observed.
The dairy cooperatives are expected to procure milk from all farmers in their coverage area. The private dairy companies usually focus on their profitability and efficiency to procure milk so that they tend
More incentive and
affordability to invest
Higher
income
Higher productivity
and production
Incentive to invest
on higher yield
livestock and feedHigh and
stable sale
price and
quantity
Technical assistants and input such as AI
services and cattle feed with reasonable price
Figure 7-2 Virtuous cycle at village level
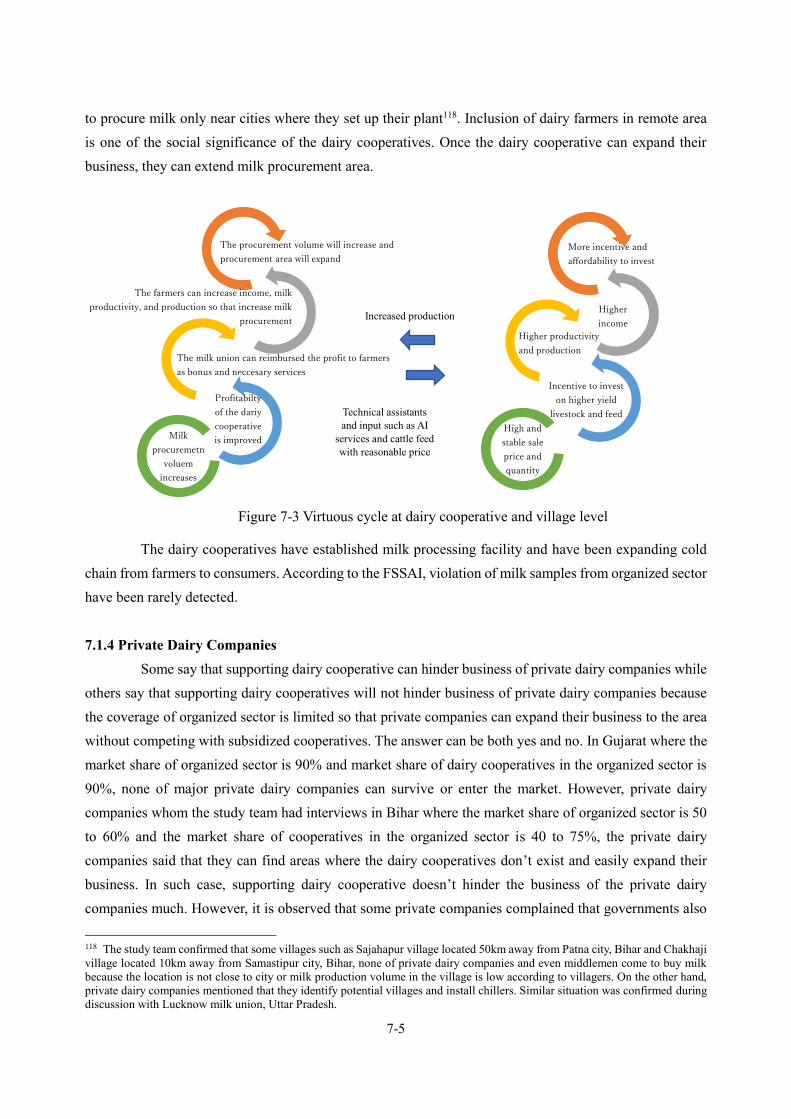
7-5
to procure milk only near cities where they set up their plant118. Inclusion of dairy farmers in remote area is one of the social significance of the dairy cooperatives. Once the dairy cooperative can expand their business, they can extend milk procurement area.
The dairy cooperatives have established milk processing facility and have been expanding cold
chain from farmers to consumers. According to the FSSAI, violation of milk samples from organized sector have been rarely detected.
7.1.4 Private Dairy Companies
Some say that supporting dairy cooperative can hinder business of private dairy companies while others say that supporting dairy cooperatives will not hinder business of private dairy companies because the coverage of organized sector is limited so that private companies can expand their business to the area without competing with subsidized cooperatives. The answer can be both yes and no. In Gujarat where the market share of organized sector is 90% and market share of dairy cooperatives in the organized sector is 90%, none of major private dairy companies can survive or enter the market. However, private dairy companies whom the study team had interviews in Bihar where the market share of organized sector is 50 to 60% and the market share of cooperatives in the organized sector is 40 to 75%, the private dairy companies said that they can find areas where the dairy cooperatives don’t exist and easily expand their business. In such case, supporting dairy cooperative doesn’t hinder the business of the private dairy companies much. However, it is observed that some private companies complained that governments also
118 The study team confirmed that some villages such as Sajahapur village located 50km away from Patna city, Bihar and Chakhaji village located 10km away from Samastipur city, Bihar, none of private dairy companies and even middlemen come to buy milk because the location is not close to city or milk production volume in the village is low according to villagers. On the other hand, private dairy companies mentioned that they identify potential villages and install chillers. Similar situation was confirmed during discussion with Lucknow milk union, Uttar Pradesh.
Figure 7-3 Virtuous cycle at dairy cooperative and village level
More incentive and
affordability to invest
Higher
income
Higher productivity
and production
Incentive to invest
on higher yield
livestock and feed
High and
stable sale
price and
quantity
Increased production
Technical assistants and input such as AI
services and cattle feed with reasonable price
The procurement volume will increase and
procurement area will expand
The farmers can increase income, milk
productivity, and production so that increase milk
procurement
The milk union can reimbursed the profit to farmers
as bonus and neccesary services
Profitabilty
of the dariy
cooperative
is improvedMilk
procuremetn
voluem
increases

7-6
need to provide any support to not only dairy cooperatives but private dairy companies. In case of Karnataka where the state government provide Rs. 5/L of subsidy to farmers who sell
their milk to dairy cooperatives, such support heavily affects to private dairy companies. According to the member of the Karnataka Dairy Association, many private dairy companies went out of business because of this distorted intervention by the state government. It is said that healthy competition can bring benefit to both producers and consumers, and healthy competition can improve dairy cooperative themselves. The government needs to try to establish such market environment. In summary, under certain conditions where dairy farmers have less options except unorganized entities, supporting cooperatives can be justified as a measure to improve market access of dairy farmers as well as make market function by generating competition. Once the market functions, as seen in the field study in Uttar Pradesh, it is observed that private dairy companies are also able to play the same role for modernization of dairy production and provision of welfare services as cooperatives. However, direct subsidies for supporting procurement price distort market and exclude private dairy companies. This side effect should be avoided in order to achieve NAP, which requires large investment in the private sector. 7.2 Issues of Dairy Cooperatives As mentioned in the previous section, the farmers can get benefit through dairy activities and increase milk production in the areas where dairy cooperatives are functional. However, the study team find the virtuous cycle doesn’t appear in some areas. The issues identified by the study team are summarized below. 7.2.1 Poor Management and Financial Situation of Some Dairy Cooperatives
Although the NDDB has been providing financial and technical assistance and the DoAHDF has been providing financial support to struggling dairy cooperatives that have accumulated cash losses, some cooperatives are still struggling. Among six states which the study team visited, the study team could observe the virtuous cycle at dairy cooperatives in Gujarat and Karnataka, but not at dairy cooperatives in Uttar Pradesh and Assam. The below table summarizes the overall performance and potential factors which may affect their overall performance of dairy cooperatives in the six states. “Overall performances” are ranked based on the market share of dairy cooperatives in all marketed milk; “◎”, “〇”, “△” and “×” means more than half, 25 to 50%, 10 to 25 %, and less than 10% of milk are sold by dairy cooperatives respectively. In the column of “milk productivity”, “〇” means that cow’s or buffalo’s milk yield per animal is more than India’s average while “×” means milk yield per animal of both cow and buffalo are less than India’s average. “Market competitiveness” are ranked based on the mark share of cooperative in the organized sector in each state; “◎”, “〇”, “△” and “×” means more than half, 25 to 50%, 10 to 25 %, and less than 10% of milk are sold by dairy cooperatives in organized sector. Consumer preference and state government intervention are described based on the interviews with dairy cooperatives and other stakeholders. As pointed out in Section 4.10.3, milk productivity, consumer preference, market

7-7
competitiveness, state government support intervention may affect dairy cooperative’s overall performance.
Table 7-2 Overall performance and factors of dairy cooperatives in the studied six states. Overall
performance Milk
productivity Consumer preference
Market competitiveness
State government intervention
Gujarat ◎ 〇 Consumers are familiar with pouch
milk
◎ Less competitors
Bihar 〇 〇 〇 The state government has been supporting necessary investment for dairy cooperatives
Assam × Under
restructuring
× Consumers don’t consume milk much and prefer loose milk
rather than pouch milk
◎ Less competitors
Dairy cooperatives in Assam used to be influenced by the state government and political situation (But now the NDDB took a charge of management and has been restructuring the cooperatives)
Karnataka 〇 〇 Consumers are familiar with pouch
milk
〇 The state government has been supporting dairy cooperatives. The state government provides Rs.5/L incentive when farmers sell their milk to dairy cooperatives.
Madhya Pradesh
△ 〇 Consumers prefer loose milk rather than pouch milk in some
areas in Madhya Pradesh
△ There is a tendency of being influenced by political situation
Uttar Pradesh
× Under
restructuring
× Consumers are familiar with pouch
milk
× High competition
There is a tendency of being influenced by political situation
Note: Negative factors are highlighted by blue. Source: The study team
The reasons why the performance of the dairy cooperatives in Uttar Pradesh is not good can be
explained by the negative impact of high market competitiveness, neglected state government support for long time, and state government disruption. On the other hand, the low performance of dairy cooperatives in Assam can be explained by the negative impact of low milk productivity, low consumer preference on milk, and state government disruption. The detail situation of Uttar Pradesh and Assam are described in later part of this section. The observation of the study team is summarized in this section. (1) Nature of Dairy Cooperatives: High Cost of Management
As a nature of dairy cooperatives, it is more difficult for dairy cooperatives to get profit through dairy business as compared with private dairy companies because the dairy cooperatives are expected to collect milk from all farmers in their area, to procure all milk brought by their member, to purchase milk at stable and higher price, to reimburse their profit to cooperative members in the form of bonuses, various services, and welfare
funds, and
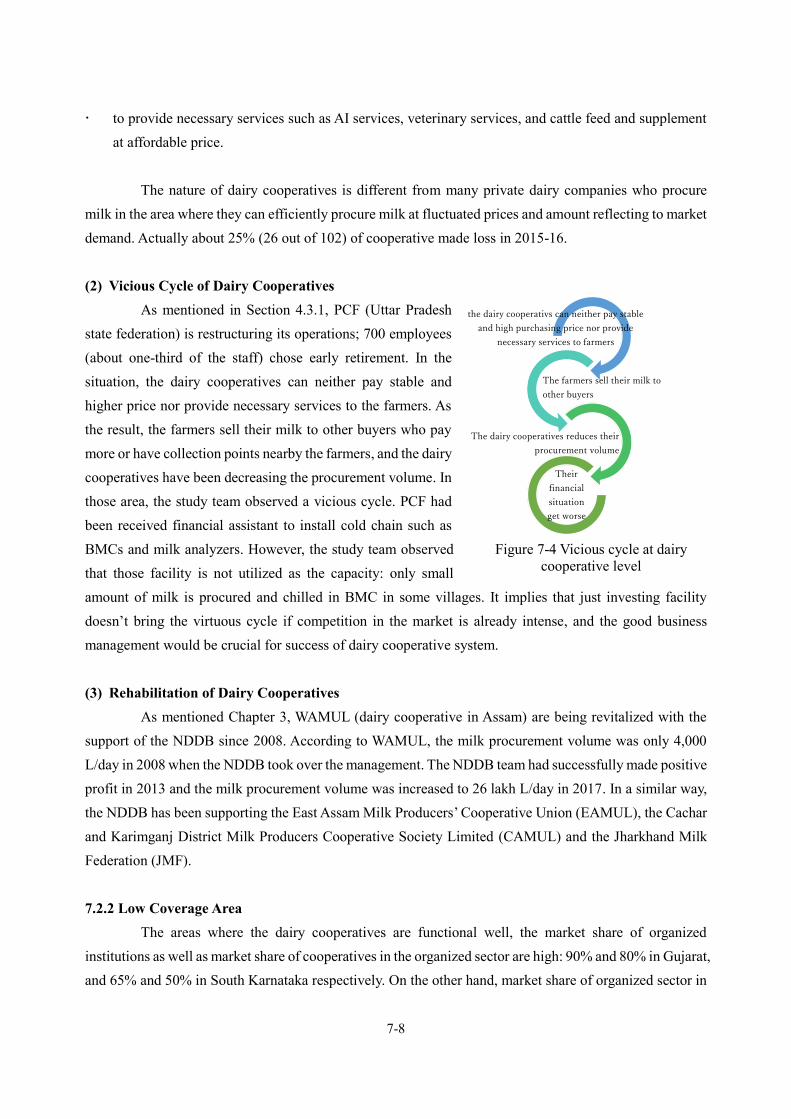
7-8
to provide necessary services such as AI services, veterinary services, and cattle feed and supplement at affordable price.
The nature of dairy cooperatives is different from many private dairy companies who procure
milk in the area where they can efficiently procure milk at fluctuated prices and amount reflecting to market demand. Actually about 25% (26 out of 102) of cooperative made loss in 2015-16.
(2) Vicious Cycle of Dairy Cooperatives
As mentioned in Section 4.3.1, PCF (Uttar Pradesh state federation) is restructuring its operations; 700 employees (about one-third of the staff) chose early retirement. In the situation, the dairy cooperatives can neither pay stable and higher price nor provide necessary services to the farmers. As the result, the farmers sell their milk to other buyers who pay more or have collection points nearby the farmers, and the dairy cooperatives have been decreasing the procurement volume. In those area, the study team observed a vicious cycle. PCF had been received financial assistant to install cold chain such as BMCs and milk analyzers. However, the study team observed that those facility is not utilized as the capacity: only small amount of milk is procured and chilled in BMC in some villages. It implies that just investing facility doesn’t bring the virtuous cycle if competition in the market is already intense, and the good business management would be crucial for success of dairy cooperative system.
(3) Rehabilitation of Dairy Cooperatives
As mentioned Chapter 3, WAMUL (dairy cooperative in Assam) are being revitalized with the support of the NDDB since 2008. According to WAMUL, the milk procurement volume was only 4,000 L/day in 2008 when the NDDB took over the management. The NDDB team had successfully made positive profit in 2013 and the milk procurement volume was increased to 26 lakh L/day in 2017. In a similar way, the NDDB has been supporting the East Assam Milk Producers’ Cooperative Union (EAMUL), the Cachar and Karimganj District Milk Producers Cooperative Society Limited (CAMUL) and the Jharkhand Milk Federation (JMF). 7.2.2 Low Coverage Area
The areas where the dairy cooperatives are functional well, the market share of organized institutions as well as market share of cooperatives in the organized sector are high: 90% and 80% in Gujarat, and 65% and 50% in South Karnataka respectively. On the other hand, market share of organized sector in
the dairy cooperativs can neither pay stable
and high purchasing price nor provide
necessary services to farmers
The farmers sell their milk to
other buyers
The dairy cooperatives reduces their
procurement volume
Their
financial
situation
get worse
Figure 7-4 Vicious cycle at dairy cooperative level

7-9
Assam, Madhya Pradesh, and Uttar Pradesh are still low: 4%, 25%, and 25% to 35% respectively as summarized in Table 4-17. The share of cooperatives in the organized sector differ from state to state. One in Assam is 100% while ones in Madhya Pradesh and Uttar Pradesh are 30% and 1 to 10% respectively. 7.2.3 Increasing Competition
Competition in the market seems to increase as more private dairy companies enter the market. In addition, competition among dairy cooperatives has been increasing. Amul has become a threat to local dairy cooperatives in some states, such as Uttar Pradesh and Assam. Generally speaking, proper competition does good for efficient allocation of resources. However, some milk unions may fail and dairy farmers in the states may lose market access as a result of competition.
7.2.4 Poor Plant Management
Although many of the dairy plants of dairy cooperatives are certified by ISO and HACCP, the study team observed large room to improve their hygiene management system. For example, their hygiene management system at their plant is not thorough, as mentioned in Section 6.2.2: some plant workers don’t properly wear masks, caps, gloves, and aprons; few dairy plants were insect-free, and the study team observed many plants with flies, and some had a gecko or cat, not only at the milk reception area but also in the processing section.
In addition, according to Japanese dairy machinery companies interviewed in this survey, the major kinds of dairy machinery can be used for more than 20 years if properly maintained. However, according to the NDDB, it is assumed that major dairy machineries can be used only ten to 15 years in India. Those management practices also need to be improved.
7.2.5 Weak Milk Quality Check System
Although the organized sector in India has introduced scientific analyses for milk quality such as for fat and SNF content in contrast to the unorganized sector, and few violations on FSSAI standard are observed in distribution channel of the organized sector, milk quality check system is also not sufficient comparing to international standard such as Japan. For example, contamination of antibiotic in milk is prohibited and controlled in Japan. However, the study team could not find any dairy cooperatives which inspect contamination of antibiotics at any level of milk value chain in India. The bacteria count which affects shelf life of milk is rarely measured at village level. The bacteria counts are generally not reflected in milk prices in India. As a result, awareness of milk hygiene, such as bacteria counts, is low among farmers. To increase the shelf life of milk, decreasing the bacteria counts of raw milk is very important. That can be done by reducing the bacteria count during milking and transport, as well as minimizing the time before the milk is cooled. To that end, the DoAHDF has been implementing SIQ-CMP, and the NDDB has been raising awareness among farmers, such as by recommending the sterilization of udders, but few farmers are complying. The NAP claims that the Government of India aims to export dairy products, but there is room
7-10
for improvement in meeting international standards in many milk unions.
7.3 Countermeasures The dairy sector in India has mainly two roles and mandates; to fulfill increasing domestic demand,
and to sustain livelihood of small scale farmers. The issues that the dairy sector faces include i) low productivity, ii) low production volume per farmer, iii) limited market access, vi) the exclusion of landless farmers from dairy farming, and v) demand for quality improvement. It is observed in the study that the dairy cooperatives can provide solutions for those issues in the dairy sector if they can function well. Once the virtuous cycle at dairy cooperative and village level can be established as illustrated in Figure 7-3, the dairy cooperative can: - Increase productivity/production volume per farmer by providing various services - Expand their procurement area and provide market access to small farmers - Improve competitiveness in markets - Enhance food safety in the country by improving milk quality check systems
However, as stated in the previous sections, there are also challenges for dairy cooperatives to play their important roles in the sector, namely, i) poor management and financial status, ii) low coverage area, iii) increasing competition, vi) poor plant management, and v) weak milk quality check system.
As countermeasures to these challenges, comprehensive and strategical establishment of supply chains is required and proposed in this section. The issues, challenges of the dairy sector and dairy cooperatives in India, and countermeasures are summarized in Figure 7-5.

7-11
Figure 7-5 Summary of challenges and countermeasures

7-12
7.3.1 Comprehensive and Strategical Establishment of Supply Chains through Diary Cooperatives (1) Comprehensive Investment for Establishment of Seamless Supply Chain
As explained in section 4.5.2, expansion of capacity of plant, expansion of procurement volume, and expansion of market should proceed hand in hand, since these factors are interrelated to one another. Expansion of procurement requires increase of productivity and/or expansion of procurement network. Expansion of market needs diversification of products. Therefore, comprehensive and strategical investment is required for seamless supply chains from farmers to consumers.
Establishment of seamless supply chains facilitates cooperatives to shift from vicious circle to virtuous circle and realizes better profitability as well as larger coverage area. “Seamless” means that cooperatives need to be prepared for large amount of investment rather than small and gradual investment. However, reality is that only top ten dairy cooperative can afford to receive loan from commercial banks. Concessional loan available for cooperatives is indispensable for establishment of seamless supply chains. (2) Capacity Development for Strategical Business Management
It is proved that only providing financial supports could not bring the virtuous cycle to cooperatives. According to the NDDB, the NDDB’s repayment rate in dairy cooperative sector is almost 100%. But there was a case that Madhya Pradesh state government agreed for lump sum repayment for bad loans of dairy cooperatives in the state. Management skills and human resource development are also required at the same time. Furthermore, as mentioned in the case of Uttar Pradesh in section 4.7.5, installment of equipment does not necessarily bring improvement of profitability of a cooperative. Strategic approach should be considered in order to materialize viable investment.
As mentioned above, about 25% of cooperative made loss in 2015-16. Those cooperatives may need capacity development for management skills prior to or in time of investment. Capacity development for strategic business management includes basic business management such as proper documentation, basic finance skill, proper decision-making system, effective and efficient production system, market analysis and strategic thinking. In case that there are competitors, the dairy cooperatives need to have analytical skill to consider their market strategy to establish better procurement and marketing system. In order to procure enough milk, confidence between dairy cooperatives and farmers need to be strengthened. For the purpose, for example, stable and high procurement price, accurate and on-time payment to farmers, provision of necessary services need to be provided to farmers. Once the dairy cooperatives procure enough milk, they need to process and sell their products. To obtain certain market share, marketing skill is required. Necessity of the technical training depends on the management level of the dairy cooperatives as well as market situation. The dairy cooperatives with low management skills as well as the dairy cooperatives in competitive market are in more need of capacity development in these fields. (3) Capacity Development for Hygiene Management
Considering increasing demand for safe food in India, dairy cooperatives are in a good position

7-13
to contribute to supplying more hygienic milk and have much potential to enhance of food safety in the country. The NDDB has been providing training on hygiene management and plant management including 5S and Kaizen, but some dairy cooperatives mentioned they need profound training. Moreover, as mentioned in Section 6.2.2, training on 7S is recommended for hygiene management.
In addition to training, there should be a system which facilitates production of hygienic milk. For the purpose, introducing the pricing system for incentivizing of producing hygienic milk based on the bacteria count can be encouraged. Exposure visits to developed countries will also bring good learning opportunity to dairy cooperatives and farmers.
7.3.2 Acceleration of Investment through Private Sector
Roles of private dairy companies also should be considered for the issues in the dairy sector. Private dairy companies are profit-oriented more than dairy cooperatives, but private dairy companies have about half share of organized sector and are able to play an important role for improvement of livelihood of farmers under appropriate competitive environment. The study team observed that some private dairy companies provide similar services to dairy farmers. In this regard, public sector can encourage private dairy companies to provide necessary services to farmers or expand their procurement area to remote area. In addition, although private dairy companies have been expanding, their growth rate has been decreasing, as mentioned in Section 2.4.2. To achieve the NAP, their growth rate needs to increase. In this regard, the public sector may be required to create enabling environment to foster and accelerate their dairy business, in addition to supporting dairy cooperatives. 7.4 Consideration of Japanese Technologies and Experience 7.4.1 Japanese Experience in Dairy Development
The situation of Japan’s dairy sector in the 1960s was similar to the current situation in India’s dairy sector in terms of its i) large percentage of small holders, ii) lack of cold chains, iii) family-centered dairy activities, and iv) intensive rearing system. Details on the similarities are summarized below.
(1) Large Percentage of Small Holders
In the 1960s, Japanese dairy farmers had an average of 3.4 heads of cattle, and they usually worked in both the dairy and agriculture sectors. As Figure 7-6 shows, within the past five decades, Japan’s major dairy producers went from being small holders to medium holders.

7-14
Figure 7-6 Number of dairy animals per household and number of dairy farmers in Japan
Source: Japan Dairy Council (2015) Japan Dairy Farming
(2) Lack of Cold Chains119
In the 1960s, cold chains had not yet been developed in Japan, and high bacteria content was an issue. Quality testing and the regulation of bacteria levels were introduced to improve milk quality by reducing bacteria content. At the same time, the government provided support for BMC installation. As a result, the number of BMCs increased from 55 in 1969 to 7,880 by1974.
As of now, Japan has developed sophisticated cold chain from farmers to consumers as well as quality check system to ensure the quality of milk.
(3) Dairy Activities as Family Business
Although Japanese dairy farmers increased the number of dairy animals per household, they still rely on family members for their dairy activities. About 80% of dairy farmers in Japan manage their dairy business using only family members as a workforce.
(4) Intensive Rearing System
Japanese dairy farmers usually rear their dairy animals on small land areas and provide intensive care to the animals. By contrast, dairy farmers in the United States and New Zealand usually use a grazing system on large tracts of land. The intensive care applied in Japan includes careful reproductive activities with pregnancy tests instead of just giving hormones to synchronize estrous cycles, as is typically done on dairy farms in the United State and New Zealand. Because of this intensive rearing system, Japan has more well-developed techniques for pregnancy tests and related tasks than other developed countries have.
119 Milk Science Vol. 55, No. 4, 2007 “Historical review of the quality control of raw milk in Japan” by Mr. Ikichi Arai.
3.4 5.9 11.218.1
25.632.5
4452.6
59.767.8
77.5
0102030405060708090
050,000
100,000150,000200,000250,000300,000350,000
19651970197519801985199019952000200520102015
# of dairy cattle per farmer
# of dairy farmer
year
The number of dairycattle per household
The number of dairyfarmer in Japan
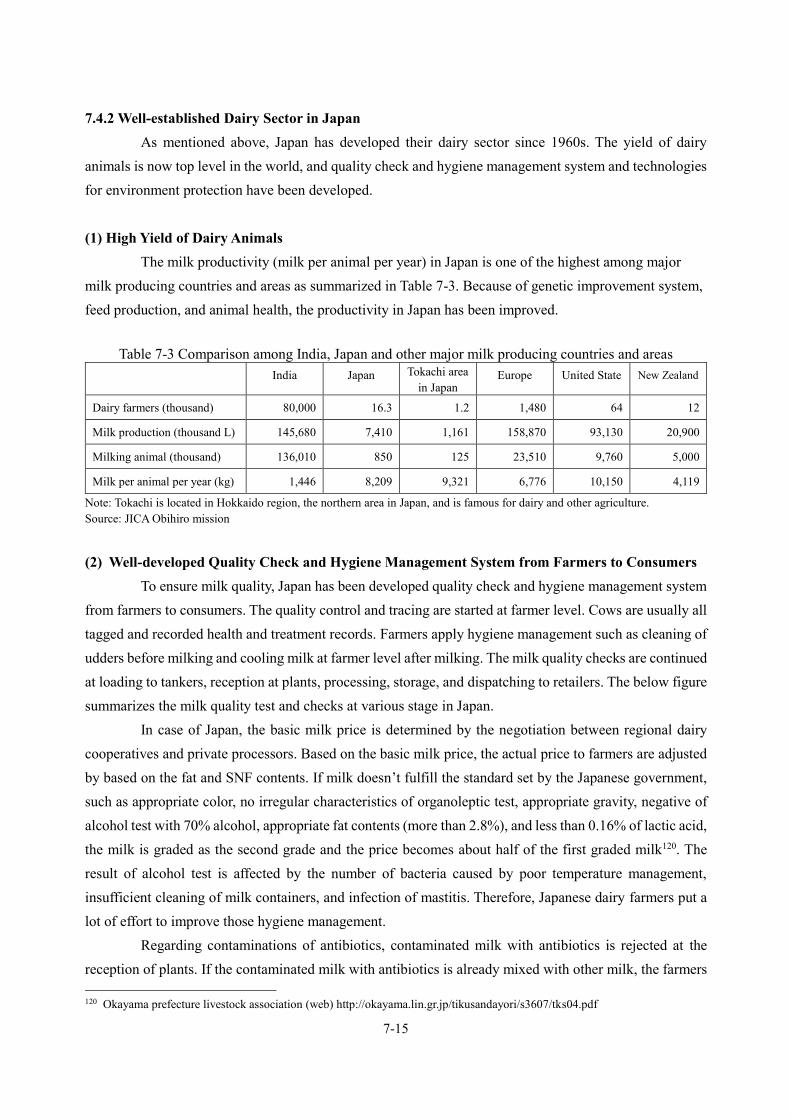
7-15
7.4.2 Well-established Dairy Sector in Japan As mentioned above, Japan has developed their dairy sector since 1960s. The yield of dairy
animals is now top level in the world, and quality check and hygiene management system and technologies for environment protection have been developed. (1) High Yield of Dairy Animals
The milk productivity (milk per animal per year) in Japan is one of the highest among major milk producing countries and areas as summarized in Table 7-3. Because of genetic improvement system, feed production, and animal health, the productivity in Japan has been improved.
Table 7-3 Comparison among India, Japan and other major milk producing countries and areas India Japan Tokachi area
in Japan Europe United State New Zealand
Dairy farmers (thousand) 80,000 16.3 1.2 1,480 64 12
Milk production (thousand L) 145,680 7,410 1,161 158,870 93,130 20,900
Milking animal (thousand) 136,010 850 125 23,510 9,760 5,000
Milk per animal per year (kg) 1,446 8,209 9,321 6,776 10,150 4,119
Note: Tokachi is located in Hokkaido region, the northern area in Japan, and is famous for dairy and other agriculture. Source: JICA Obihiro mission
(2) Well-developed Quality Check and Hygiene Management System from Farmers to Consumers
To ensure milk quality, Japan has been developed quality check and hygiene management system from farmers to consumers. The quality control and tracing are started at farmer level. Cows are usually all tagged and recorded health and treatment records. Farmers apply hygiene management such as cleaning of udders before milking and cooling milk at farmer level after milking. The milk quality checks are continued at loading to tankers, reception at plants, processing, storage, and dispatching to retailers. The below figure summarizes the milk quality test and checks at various stage in Japan.
In case of Japan, the basic milk price is determined by the negotiation between regional dairy cooperatives and private processors. Based on the basic milk price, the actual price to farmers are adjusted by based on the fat and SNF contents. If milk doesn’t fulfill the standard set by the Japanese government, such as appropriate color, no irregular characteristics of organoleptic test, appropriate gravity, negative of alcohol test with 70% alcohol, appropriate fat contents (more than 2.8%), and less than 0.16% of lactic acid, the milk is graded as the second grade and the price becomes about half of the first graded milk120. The result of alcohol test is affected by the number of bacteria caused by poor temperature management, insufficient cleaning of milk containers, and infection of mastitis. Therefore, Japanese dairy farmers put a lot of effort to improve those hygiene management.
Regarding contaminations of antibiotics, contaminated milk with antibiotics is rejected at the reception of plants. If the contaminated milk with antibiotics is already mixed with other milk, the farmers 120 Okayama prefecture livestock association (web) http://okayama.lin.gr.jp/tikusandayori/s3607/tks04.pdf

7-16
who provide the contaminated milk have to compensate all the milk. Antibiotics are commonly used for treatment of mastitis and other diseases. Therefore, farmers strictly record the provision of antibiotics and segregate milk produced by the treated animals. Those pricing and rejection mechanism needs to be installed to improve hygiene management.
Figure 7-7 The milk quality test and checks at various stage
Source: JICA Obihiro mission
(3) 5S, 7S and Kaizen Methods
“5S” and “Kaizen” are one of the Japanese management tools originally used in industrial sector like Toyota and other companies with aims of organizing a work space for efficiency and effectiveness by identifying and storing the items used, maintaining the area and items, and sustaining the new order. The method is used by wide range of manufacturers to improve efficiency of their productions or services as well as cost and quality management. Moreover, even medical institutes such as hospitals and clinics also apply the method to reduce medical mishaps and human error as well as improve efficiency by reducing searching time and dead stocks. 5S and Kaizen approach can contribute to dairy cooperatives for their effective and safety plant management.
In addition to 5S, as mentioned in Section 6.2.2, 7S which is widely applied by food processors in Japan can be also introduced to dairy cooperatives in India to improve their food safety management. 7S includes two more “S”, “Senjou (cleaning)” and “Sakkin (disinfection)” in addition to 5S.

7-17
(4) Technologies for Environment Protection Sometimes smell and excrementitious matter caused by livestock rearing have become issues
between livestock farmers and other residence in Japan. The environment requirement is generally strict in Japan so that Japanese livestock sector has been developed technologies for environment protection. Biogas plants is one of those technologies. For example, Tokachi city in Hokkaido, northern part of Japan where dairy sector is well established, has been promoting Biomass industrial city initiative, and currently more than 29 biogas plants are operating. 7.4.3 Japanese Manufacturers
There are many Japanese companies which supply necessary machineries and equipment of dairy sector in Japan. Those Japanese machineries and equipment can contribute cost efficiency, hygiene improvement, and value addition in India’s dairy sector. IDMC, a subsidiary of the NDDB, has been seeking to collaborate with those Japanese companies. In addition, following Japanese companies have potentials to contribute for India’s dairy sector as summarized in Table 7-4.
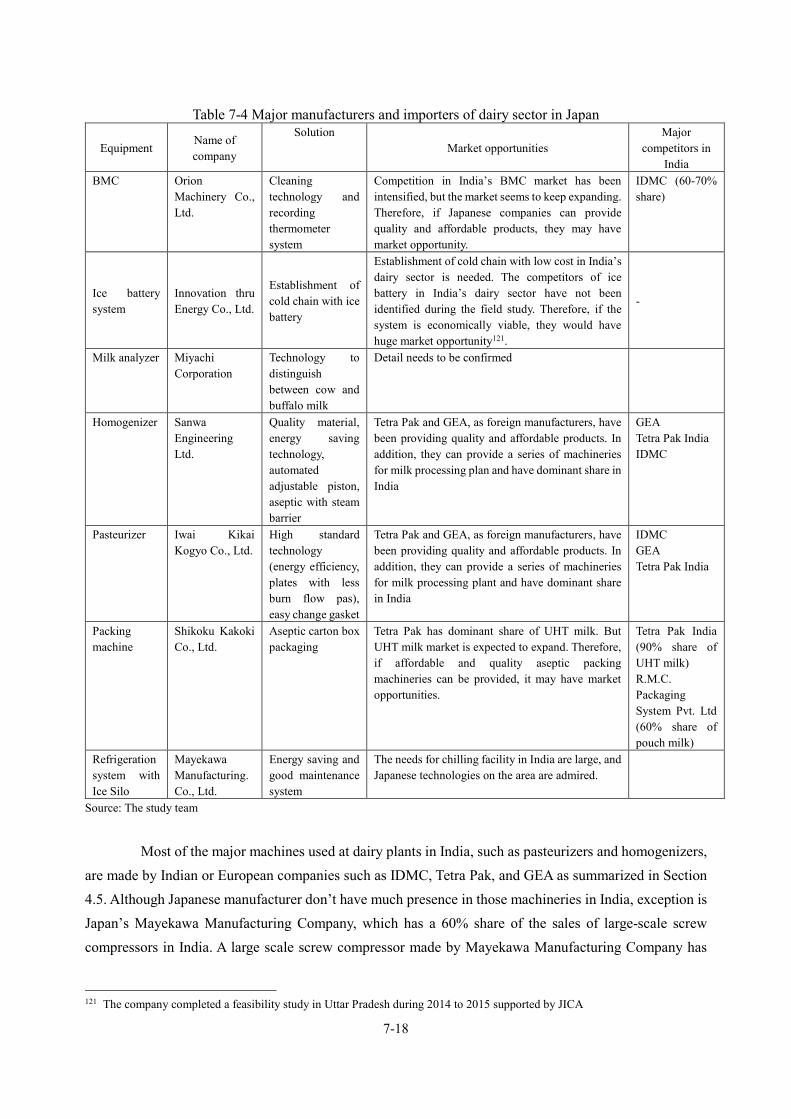
7-18
Table 7-4 Major manufacturers and importers of dairy sector in Japan
Equipment Name of company
Solution Market opportunities
Major competitors in
India BMC Orion
Machinery Co., Ltd.
Cleaning technology and recording thermometer system
Competition in India’s BMC market has been intensified, but the market seems to keep expanding. Therefore, if Japanese companies can provide quality and affordable products, they may have market opportunity.
IDMC (60-70% share)
Ice battery system
Innovation thru Energy Co., Ltd.
Establishment of cold chain with ice battery
Establishment of cold chain with low cost in India’s dairy sector is needed. The competitors of ice battery in India’s dairy sector have not been identified during the field study. Therefore, if the system is economically viable, they would have huge market opportunity121.
-
Milk analyzer Miyachi Corporation
Technology to distinguish between cow and buffalo milk
Detail needs to be confirmed
Homogenizer Sanwa Engineering Ltd.
Quality material, energy saving technology, automated adjustable piston, aseptic with steam barrier
Tetra Pak and GEA, as foreign manufacturers, have been providing quality and affordable products. In addition, they can provide a series of machineries for milk processing plan and have dominant share in India
GEA Tetra Pak India IDMC
Pasteurizer Iwai Kikai Kogyo Co., Ltd.
High standard technology (energy efficiency, plates with less burn flow pas), easy change gasket
Tetra Pak and GEA, as foreign manufacturers, have been providing quality and affordable products. In addition, they can provide a series of machineries for milk processing plant and have dominant share in India
IDMC GEA Tetra Pak India
Packing machine
Shikoku Kakoki Co., Ltd.
Aseptic carton box packaging
Tetra Pak has dominant share of UHT milk. But UHT milk market is expected to expand. Therefore, if affordable and quality aseptic packing machineries can be provided, it may have market opportunities.
Tetra Pak India (90% share of UHT milk) R.M.C. Packaging System Pvt. Ltd (60% share of pouch milk)
Refrigeration system with Ice Silo
Mayekawa Manufacturing. Co., Ltd.
Energy saving and good maintenance system
The needs for chilling facility in India are large, and Japanese technologies on the area are admired.
Source: The study team
Most of the major machines used at dairy plants in India, such as pasteurizers and homogenizers, are made by Indian or European companies such as IDMC, Tetra Pak, and GEA as summarized in Section 4.5. Although Japanese manufacturer don’t have much presence in those machineries in India, exception is Japan’s Mayekawa Manufacturing Company, which has a 60% share of the sales of large-scale screw compressors in India. A large scale screw compressor made by Mayekawa Manufacturing Company has
121 The company completed a feasibility study in Uttar Pradesh during 2014 to 2015 supported by JICA

7-19
been installed at the plant of Banaskantha milk union in Gujarat. The product is popular because of good quality with price competitiveness, high durability and good maintenance services. Orion Machinery Co., Ltd. has about 80% share of BMC in Japan, and has good auto cleaning technology for BMC and recording thermometer system which is not yet installed in India. According to the principal secretary of Uttar Pradesh, Miyachi Corporation developed a milk analyzer which can differentiate between cow and buffalo milk. Those Japanese technologies may contribute cost efficiency, hygiene improvement, and value addition in India’s dairy sector, if introduced. 7.4.3 Proposed Application of Japanese Technologies and Systems in India’s Dairy Sector
As mentioned above, there are many areas where Japan can contribute to India’s dairy sector. Among them, the following technologies and systems seem relevant to the challenges of the sector and dairy cooperatives. (1) Introduction of Quality Check and Hygiene Management System
In order to improve hygiene of milk and dairy products, it is important to provide farmers with incentives to produce hygienic milk. For that purpose, the quality check and hygiene management system from farmers to consumers as well as pricing and rejection system based on bacteria count and contamination of antibiotics can be considered to introduce to India. Various measures and equipment for quality inspection at different stage of supply chains can be also utilized for improvement of hygiene of milk. (2) Introduction of 5S, 7S and Kaizen Approach
As mentioned in Section 4.5.3, not only installing machineries but also improvement of plant management seems necessary. The NDDB has provided training to the milk unions in Japanese management methods such as 5S and Kaizen since the 1990s. The study team found that these methods are used by the unions. However, they are not implemented properly in some of the visited plants, and there is still room for improvement. Moreover, some milk unions asked the study team for direct training in 5S and Kaizen. Japan can contribute in this area as well.
In addition to 5S and Kaizen, as mentioned above, 7S also can be introduced to dairy cooperatives in India to improve their food safety management. The 7S concept seems not to be introduced to dairy cooperatives in India yet. Therefore, training for 7S as well as further 5S/Kaizen training can benefit dairy cooperatives as well as NDDB.
(3) Japanese Manufacturers
There are many Japanese companies which supply necessary machineries and equipment in Japan’s dairy sector. Those Japanese machineries and equipment can contribute to cost efficiency, hygiene improvement, and value addition in India’s dairy sector. Among others, Japanese small and medium
7-20
enterprises, such as Innovation thru Energy Co., Ltd. with ice battery system and Orion Machinery Co., Ltd. with BMC and milking machine, which have developed their own technologies in specific areas may have large opportunity in India’s dairy sector. IDMC, a subsidiary of the NDDB, has been seeking to collaborate with those Japanese companies. The study team, however, could not identify many Japanese manufactures which have started their business in India’s dairy sector or have intentions to enter India’s dairy market. Although there are a lot of opportunities for Japanese manufacturers and Indian dairy producers establish win-win relationships, lack of information hampers materialization of these opportunities. If there are platforms where Indian stakeholders and Japanese stakeholders can exchange information and discuss with their technologies and products, those opportunities can help both Indian and Japanese stakeholders.

Annex


Table of Contents
Annex 1 Member of the study team ........................................................................................................ A-2
Annex 2 Study schedule.......................................................................................................................... A-3
Annex 3 List of interviewees .................................................................................................................. A-8
Annex 4 List of collected documents and data ..................................................................................... A-19
Annex 5 Basic information of milk unions ........................................................................................... A-31
Annex 6 Basic data of states ................................................................................................................. A-46
Annex 7 Results of socioeconomic situation survey ............................................................................. A-59
Annex 8 FSSAI organization chart ....................................................................................................... A-86
Annex 9 FSSAI standard of milk and dairy products and its processing............................................... A-88
Annex 10 List of dairy plants of unions and private dairy companies visited by the study team......... A-92
Annex 11 List of machineries of dairy plants........................................................................................ A-99
Annex 12 NDDB eligibility criteria and terms and conditions of lending ......................................... A-105
A-1

Annex 1
Member of the study team
Name Area in charge
Fumiko Ikegaya (Ms) Team Leader/Value Chain and Marketing
Yukio Ikeda (Mr) Dairy and Institutional Analysis
Desai Prakash Pralhadarao (Mr) Food Processing Equipment and Cold Chain
Tomoyuki Tajitsu (Mr) Food Hygiene and Food Processing
A-2

Annex 2 Study Schedule
*I:Ikegaya, II:Ikeda, III:Desai, IV:Tajitsu N. Date/Time City Place visited Ⅰ Ⅱ Ⅲ Ⅳ
1. 9/18 10:15-11:30 Delhi National Cold Chain Development, NCCD ✓ ✓ ✓ ✓
2. 16:30-18:00 Food Safety Standard Authority India, FSSAI ✓ ✓ ✓ ✓
3. 9/19 9:30-10:20 JICA India Branch ✓ ✓ ✓ ✓
4. 17:00-17:40 World Bank ✓ ✓ ✓ ✓
5. 9/20 11:00-12:00 Department of Animal Husbandry Dairying and Fisheries
✓ ✓ ✓ ✓
6. 13:15-14:00 Ministry of Food Processing Industry ✓ ✓ ✓ ✓
7. 15:10-16:40 Param Dairy Limited ✓ ✓ ✓ ✓
8. 9/21 14:30‐18:30 Anand NDDB 1st ✓ ✓ ✓ ✓
9. 9/22 7:00‐8:00 DCS (Anand) : Mujkuva Milk Producers’ Cooperative Society
✓ ✓ ✓ ✓
10. 11:20‐14:00 NDDB 2nd ✓ ✓ ✓ ✓
11. 16:00‐17:00 IDMC ✓ ✓ ✓ ✓
12. 17:00‐18:00 Kaira District Cooperative Milk Union(Discussion, Plant)
✓ ✓ ✓ ✓
13. 9/23 10:30‐16:00 Gandhinagar Gandhinagar District Cooperative Milk Union ✓ ✓ ✓ ✓
14. 13:30‐13:50 Gandhinagar District Cooperative Milk Union (Parlor)
✓ ✓ ✓ ✓
15. 15:00‐16:00 Gandhinagar District Cooperative Milk Union(Plant)
✓ ✓ ✓ ✓
16. 9/24 18:00‐19:00 Anand Anand District, Mujkuva,Village (Farmers) ✓
17. 9/25 11:00‐12:40 Gandhinagar
Gujarat District, Directorate of Animal Husbandry
✓ ✓ ✓
18. 11:00‐12:00 DCS (Gandhinagar) : Mahadevpora Milk Producers' Cooperative Society
✓
19. 12:50‐14:20 Gujarat Livestock Development Board ✓ ✓ ✓
20. 15:00‐17:00 Gujarat States, Food and Drugs Control Administration
✓ ✓ ✓
21. 16:00‐16:30 DCS (Gandhinagar) : Adalas Women Cooperative Society
✓
22. 9/26 10:30‐12:00 Banaskantha
Banaskantha District Cooperative Milk Producer' Union(HQ)
✓ ✓ ✓ ✓
23. 16:00‐17:00 Banaskantha District Cooperative Milk Producer' Union(Plant)
✓ ✓ ✓ ✓
24. 17:29‐18:50 DCS (Banaskantha): Jalotra Milk Producers' Cooperative Society
✓ ✓ ✓ ✓
25. 9/27 10:30‐11:30 Banaskantha District Cooperative Milk Producer' Union(MD)
✓ ✓ ✓ ✓
26. 11:45‐12:40 Banaskantha District, NDDB officer( NDP Nutrition)
✓
27. 14:45‐16:15 Banas Dairy Cattle Feed Mill Factory ✓ ✓ ✓
28. 15:30‐16:00 DCS (Banaskantha):Thavar Milk Producers' Cooperative Society
✓
29. 9/28 10:15‐13:30 Anand NDDB 3rd ✓ ✓ ✓ ✓
A-3
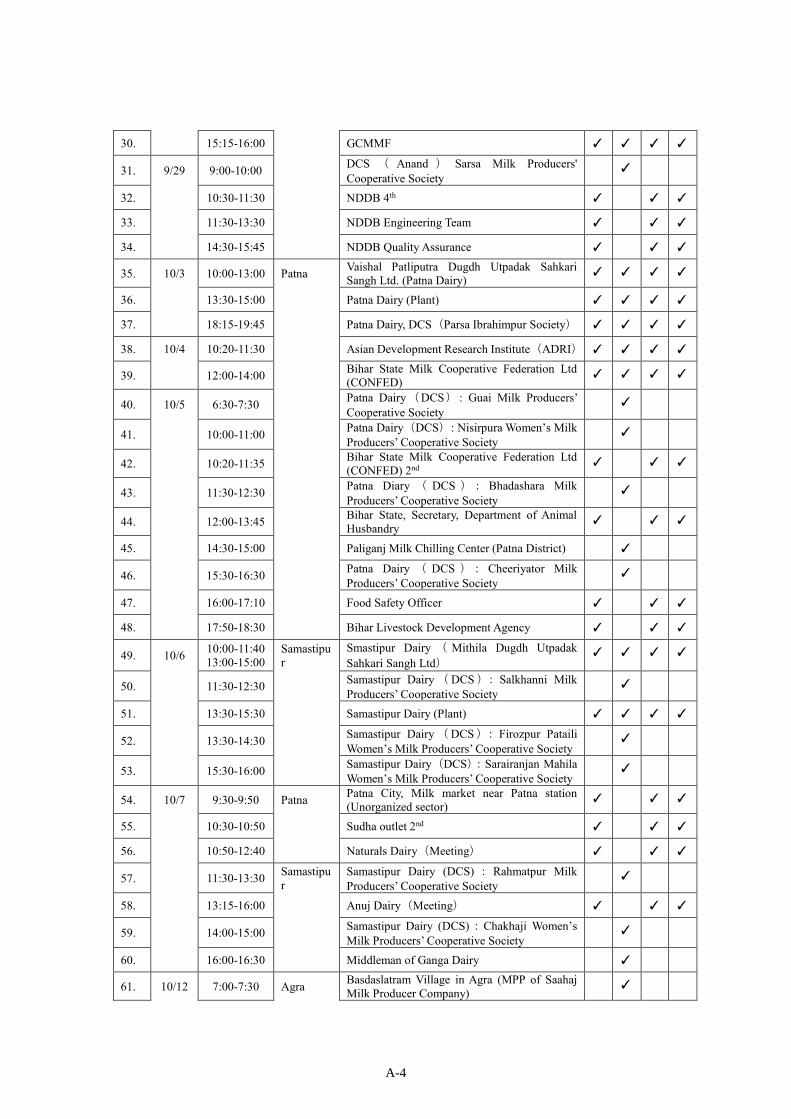
30. 15:15‐16:00 GCMMF ✓ ✓ ✓ ✓
31. 9/29 9:00‐10:00 DCS ( Anand ) Sarsa Milk Producers' Cooperative Society
✓
32. 10:30‐11:30 NDDB 4th ✓ ✓ ✓
33. 11:30‐13:30 NDDB Engineering Team ✓ ✓ ✓
34. 14:30‐15:45 NDDB Quality Assurance ✓ ✓ ✓
35. 10/3 10:00‐13:00 Patna Vaishal Patliputra Dugdh Utpadak Sahkari Sangh Ltd. (Patna Dairy)
✓ ✓ ✓ ✓
36. 13:30‐15:00 Patna Dairy (Plant) ✓ ✓ ✓ ✓
37. 18:15‐19:45 Patna Dairy, DCS(Parsa Ibrahimpur Society) ✓ ✓ ✓ ✓
38. 10/4 10:20‐11:30 Asian Development Research Institute(ADRI) ✓ ✓ ✓ ✓
39. 12:00‐14:00 Bihar State Milk Cooperative Federation Ltd (CONFED)
✓ ✓ ✓ ✓
40. 10/5 6:30‐7:30 Patna Dairy(DCS) : Guai Milk Producers’ Cooperative Society
✓
41. 10:00‐11:00 Patna Dairy(DCS): Nisirpura Women’s Milk Producers’ Cooperative Society
✓
42. 10:20‐11:35 Bihar State Milk Cooperative Federation Ltd (CONFED) 2nd
✓ ✓ ✓
43. 11:30‐12:30 Patna Diary ( DCS ): Bhadashara Milk Producers’ Cooperative Society
✓
44. 12:00‐13:45 Bihar State, Secretary, Department of Animal Husbandry
✓ ✓ ✓
45. 14:30‐15:00 Paliganj Milk Chilling Center (Patna District) ✓
46. 15:30‐16:30 Patna Dairy ( DCS ): Cheeriyator Milk Producers’ Cooperative Society
✓
47. 16:00‐17:10 Food Safety Officer ✓ ✓ ✓
48. 17:50‐18:30 Bihar Livestock Development Agency ✓ ✓ ✓
49. 10/6 10:00‐11:40 13:00‐15:00
Samastipur
Smastipur Dairy ( Mithila Dugdh Utpadak Sahkari Sangh Ltd)
✓ ✓ ✓ ✓
50. 11:30‐12:30 Samastipur Dairy(DCS): Salkhanni Milk Producers’ Cooperative Society
✓
51. 13:30‐15:30 Samastipur Dairy (Plant) ✓ ✓ ✓ ✓
52. 13:30‐14:30 Samastipur Dairy(DCS): Firozpur Pataili Women’s Milk Producers’ Cooperative Society
✓
53. 15:30‐16:00 Samastipur Dairy(DCS):Sarairanjan Mahila Women’s Milk Producers’ Cooperative Society
✓
54. 10/7 9:30‐9:50 Patna Patna City, Milk market near Patna station (Unorganized sector)
✓ ✓ ✓
55. 10:30‐10:50 Sudha outlet 2nd ✓ ✓ ✓
56. 10:50‐12:40 Naturals Dairy(Meeting) ✓ ✓ ✓
57. 11:30‐13:30 Samastipur
Samastipur Dairy (DCS): Rahmatpur Milk Producers’ Cooperative Society
✓
58. 13:15‐16:00 Anuj Dairy(Meeting) ✓ ✓ ✓
59. 14:00‐15:00 Samastipur Dairy (DCS):Chakhaji Women’s Milk Producers’ Cooperative Society
✓
60. 16:00‐16:30 Middleman of Ganga Dairy ✓
61. 10/12 7:00-7:30 Agra Basdaslatram Village in Agra (MPP of Saahaj Milk Producer Company)
✓
A-4

62. 7:30‐8:00 Milk Collection Point of Private firm (Ananda) in Basdaslatram Village ✓
63. 10:00-10:30 Nagariya MPP (Nagariya Village in Agra) ✓
64. 10/13 10:00-12:00 Saahaj (Milk Producer Company in Agra) ✓
65. 10/30 10:30-15:00 Merrut Meerut Milk Union ✓
66. 10/31 10:00-12:00 Ganeshpur Milk Producers Society (Ganeshpur village)
✓
67. 14:00-15:00 Chemrod Milk Producers Society (Chemrod village) ✓
68. 11/4 10:00-11:00 Ghaziabad Sakoorpur Milk Producers Society (Sakoorpur village, Ghaziabad Distict) ✓
69. 11/6 12:45-17:00 Guwahati West Assam Milk Producers’ Cooperative Union Ltd.(WAMUL)
✓ ✓ ✓ ✓
70. 11/7 10:00-11:00 Commissionerate of Food Safety, Assam ✓ ✓ ✓
71. 10:00-11:00 Uma Women’s DCS (Uzankuri Village in Kamrup Rural District) ✓
72. 11:30-13:30 Directorate of Animal Husbandry ✓ ✓ ✓
73. 11:30-12:00 Seguli DCS (Uzankuri Village in Kamrup Rural District) ✓
74. 15:30-16:30 Kandhenu DCS (Nityananda Village in Barpeta District) ✓
75. 15:00-16:30 Directorate of Dairy Development ✓ ✓
76. 18:00-19:00 Blueberry Industry (Private Dairy) ✓ ✓
77. 11/8 7:00-8:30 Ganesh Mandir Kali Mandir Milk Products Co-Op. Society Ltd
✓ ✓ ✓
78. 11:15-12:30 Progress Society(Sitajakala Dugadha Utpadak Samaba Samiti Ltd.)
✓ ✓ ✓
79. 11:00-12:00 Kandhenu DCS (Nityananda Village in Morigaon District) ✓
80. 12:00-12:30 Dordoloni Womens DCS (Dordononi Village in Morigaon District) ✓
81. 13:00-13:30 Maalaxmi DCS (Khanajan Village in Morigaon) ✓
82. 13:30-15:30 Directorate of Dairy Development, Assam, Naogaon Plant
✓ ✓ ✓
83. 14:40-15:00 Nagaon District Milk Producer Cooperation Union Ltd
✓ ✓ ✓
84. 15:00-15:30 Malaybari Durga DCS (Sumulutari Hamlet, Malaybari village in Kumrup) ✓
85. 11/9 11:15-12:15 Assam Livestock Development Agency ✓ ✓
86. 13:30-15:30 Kamrupa Dairy(Private Dairy) ✓ ✓
87. 17:00-17:30 Jorhat The East Assam Milk Producers’ Cooperative Union Ltd. (EAMUR)
✓ ✓
88. 11/10 10:00-11:00 Surabishi DCS (Parbatia village in Jorhat) ✓ ✓
89. 11:00-11:30 Joraguri DCS (Joraguri village in Jorhat) ✓ ✓
90. 14:10-14:40 Department of Dairy Development, Assam, Bokakhat Plant ✓ ✓
91. 11/11 10:00-11:00 Former Dhankhuli DCS (Dhankuli village in Jorhat)
✓
92. 10:00-11:25 Large farmer(M.D. Group of Industry) ✓ ✓ ✓
93. 13:45-16:00 Sundar Pukhuri Milk Cooperative Society ✓ ✓ ✓
A-5

94. 11/13 10:30-12:20 Bangalore Karnataka Cooperative Milk Producers’ Federation (KMF)
✓ ✓ ✓ ✓
95. 13:00-18:00 Bangalore Cooperative Milk Union Ltd ✓ ✓ ✓ ✓
96. 11/14 10:30-12:00 Sadahalli DCS (Sadahalli Village in Bangalore Rural) ✓
97. 10:30-12:00 Harohalli DCS (Harohalli Village in Bangalore Rural) ✓
98. 13:00-14:00 Department of Animal Husbandry and Veterinary Services
✓ ✓ ✓
99. 15:30-17:00 Food Safety Commissioner, Karnataka ✓ ✓ ✓
100. 15:30-16:00 Kammasandra DCS (Kammasandra Village in Bangalore Rural) ✓
101. 11/15 10:30-12:30 NDDB regional office ✓ ✓
102. 10:30-12:00 Sadahalli DCS (Sadahalli Village in Bangalore Rural) ✓
103. 15:00-16:00 Jalige DCS (Devanahalli Taluk in Bangalore Rural District) ✓
104. 11/16 12:30-16:30 Gulburga Gulburga Milk Producers Societies Union ✓ ✓
105. 16:00-18:30 Bangalore Karnataka State Dairy Association ✓ ✓
106. 17:30-18:30 Bidar Ghatboral DCS (Ghatboral Village in Bidar District ✓
107. 11/17 7:30-8:30 Gulburga Herapur DCS (Herapur Village in Gulbarga District)
✓
108. 10:45-13:00 Bangalore Heritage(Private company) ✓ ✓
109. 11:00-13:00 Gulburga Kalaburagi-Bihar and Yadgir Coop Milk Producers Union ✓ ✓
110. 16:30-18:30 Bangalore Gokul Dairy Products(Private company) ✓ ✓
111. 16:30-17:00 Gulburga Kaillahanga Village Gulbarga District ✓
112. 17:30-18:30 Kumasi DCS (Kumasi Village in Gulbarga District ✓
113. 19:30-20:30 Haravala Village in Gulbarga District ✓
114. 11/19 11:00-11:30 Nandini Parlor ✓ ✓
115. 11/18-19 - Bangalore Retail shop in Bangalore ✓
116. 11/20 10:40-15:30 Bhopal Madhya Pradesh State Cooperative Diary Federation(MPCDF)
✓ ✓ ✓
117. 14:45-18:00 Bhopal Sahakari Dugdha Sangah Maryadit(Bhopal Cooperative Milk Union Limited)
✓ ✓ ✓
118. 11/21 10:45-12:40 Department of Animal Husbandry, Madhya Pradesh State
✓ ✓ ✓
119. 13:00-14:30 Madhya Pradesh Poultry and Livestock Development Cooperation
✓ ✓
120. 16:30-17:30 Food Safety Commissioner, MP ✓ ✓ ✓
121. 11/22 7:30-9:00 Indore Loose milk market ✓ ✓
122. 11/23 11:15-17:30 Indore Sahakari Dugdha Sangh Mryadit (Indore Milk Union)
✓ ✓
123. 11/23 10:30-16:30 Varanasi Varanasi Milk Union ✓ ✓
124. 18:30-19:00 Indore Dr. Sudhir Bobde (Principal Secretary) ✓ ✓
125. 11/24 12:10-14:30 Shubham Foods Pvt. Ltd.(Private company) ✓ ✓
A-6

126. 11/25 11:10-13:00 Mahindra Agri Solution Ltd.(Private company) ✓ ✓
127. 15:30-17:30 Anik Milk Products Ptv Limited ( Private company)
✓ ✓
128. 11/30 14:30-17:00 Jabalpur Jabalpur Milk Union ✓
129. 11/24 12:00-13:00 Chandaulli
Padaya DCS (Padaya Village in Chandulli District)
✓ ✓
130. 14:00-15:00 Nadara DCS (NadaraVillage in Chandaulli District) ✓ ✓
131. 15:00-16:00 Feswoda Village in Chandaulli District ✓ ✓
132. 16:00-17:00 Raipura Village in Chandaulli District ✓ ✓
133. 17:00-17:30 Shyam Dairy Product Ltd. Collection Centre ✓ ✓
134. 11/27 10:10-11:00 Lucknow Video conference with Principal Secretary ✓ ✓ ✓ ✓
135. 11:25-16:30 Predesh Cooperative Dairy Federation(PCDF) ✓ ✓ ✓ ✓
136. 16:30-19:30 Lucknow Milk Union ✓ ✓ ✓ ✓
137. 11/28 10:30-12:55 Department of Animal Husbandry, UP Livestock Development Board
✓ ✓ ✓
138. 13:30-14:30 Department of Dairy Development ✓ ✓
139. 10:50-15:00 Kanpur Kanpur Milk Union ✓ ✓
140. 18:00-19:00 Jignis DCS (Jignis Village in Kanpur District) ✓ ✓
141. 20:00-20:30 Amul collection point in Jignis village ✓ ✓
142. 11/29 9:40-10:10 Lucknow Loose milk market in Lucknow ✓ ✓ ✓
143. 10:45-11:45 Food Safety and Drug Administration (FSDA) ✓ ✓ ✓
144. 11:00-12:00 Rahamatenager DCS (Rahamatenagar village in Lucknow District) ✓
145. 12:00-12:30 Bastauly DCS (Bastauly village in Lucknow District) ✓
146. 12:30-13:00 Mamta Milk(Namaste India) ✓
147. 12:40-16:30 Gyan:CP Milk and Food Products Pvt. Itd(Private company)
✓ ✓ ✓
148. 11/30 11:20-13:20 Kanpur Namaste India(NIF Private Limited)(Private company)
✓ ✓ ✓
149. 12/1 9:00-10:30 Delhi Maekawa India Pvt. Ltd ✓ ✓
150. 11:00-12:00 Jabalpur Private farm in Jabalpur ✓
151. 12:45-13:45 Delhi Department of Animal Husbandry, Dairying, and Fisheries
✓ ✓
152. 14:50-15:40 National Cooperative Development Cooperation ✓ ✓
153. 16:00-17:30 India Dairy Assocation ✓ ✓
154. 12/2 11:00-12:45 Gopaljee Dairy Foods Ptv. Ltd.(Ananda)(Private company)
✓ ✓ ✓
155. 12:55-13:15 Kisan Vikas Milk Producer Company Limited(Producer Company)
✓ ✓ ✓
156. 14:10-15:10 VRS Foods Ltd.(Paras)(Private company) ✓ ✓ ✓
A-7
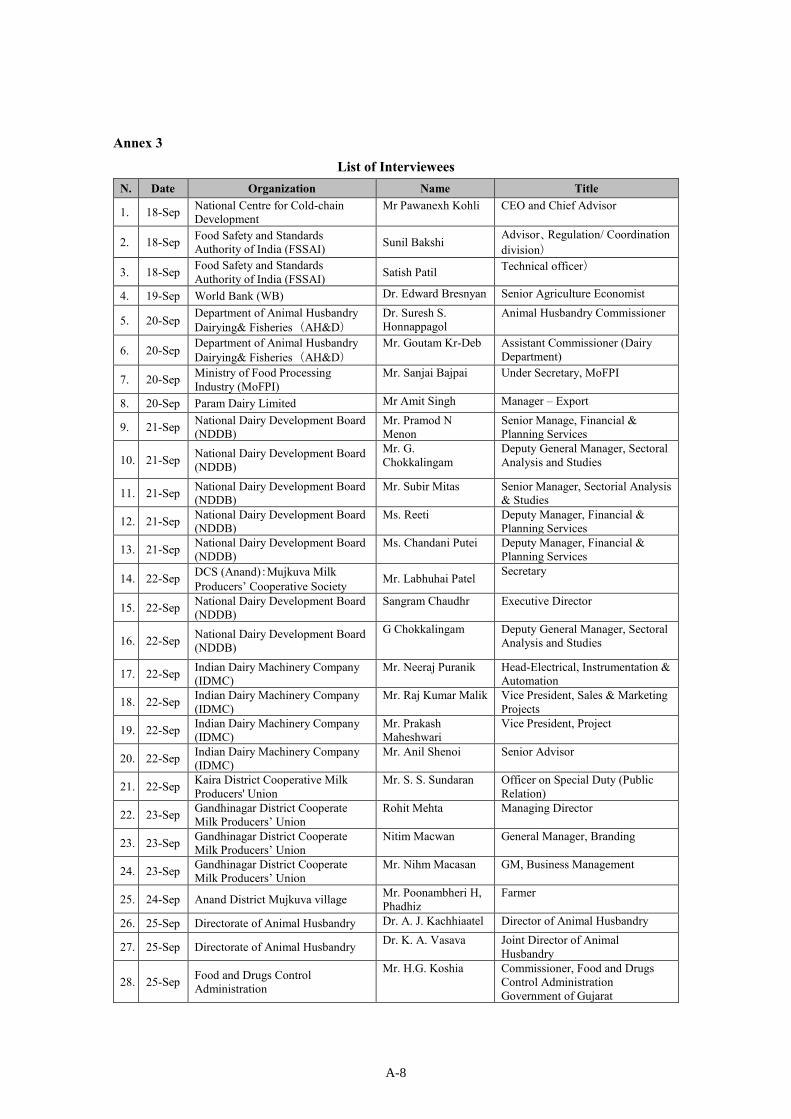
Annex 3
List of Interviewees N. Date Organization Name Title
1. 18-Sep National Centre for Cold-chain Development
Mr Pawanexh Kohli CEO and Chief Advisor
2. 18-Sep Food Safety and Standards Authority of India (FSSAI) Sunil Bakshi Advisor、Regulation/ Coordination
division)
3. 18-Sep Food Safety and Standards Authority of India (FSSAI) Satish Patil Technical officer)
4. 19-Sep World Bank (WB) Dr. Edward Bresnyan Senior Agriculture Economist
5. 20-Sep Department of Animal Husbandry Dairying& Fisheries (AH&D)
Dr. Suresh S. Honnappagol
Animal Husbandry Commissioner
6. 20-Sep Department of Animal Husbandry Dairying& Fisheries (AH&D)
Mr. Goutam Kr-Deb Assistant Commissioner (Dairy Department)
7. 20-Sep Ministry of Food Processing Industry (MoFPI)
Mr. Sanjai Bajpai Under Secretary, MoFPI
8. 20-Sep Param Dairy Limited Mr Amit Singh Manager – Export
9. 21-Sep National Dairy Development Board (NDDB)
Mr. Pramod N Menon
Senior Manage, Financial & Planning Services
10. 21-Sep National Dairy Development Board (NDDB)
Mr. G. Chokkalingam
Deputy General Manager, Sectoral Analysis and Studies
11. 21-Sep National Dairy Development Board (NDDB)
Mr. Subir Mitas Senior Manager, Sectorial Analysis & Studies
12. 21-Sep National Dairy Development Board (NDDB)
Ms. Reeti Deputy Manager, Financial & Planning Services
13. 21-Sep National Dairy Development Board (NDDB)
Ms. Chandani Putei Deputy Manager, Financial & Planning Services
14. 22-Sep DCS (Anand):Mujkuva Milk Producers’ Cooperative Society Mr. Labhuhai Patel Secretary
15. 22-Sep National Dairy Development Board (NDDB)
Sangram Chaudhr Executive Director
16. 22-Sep National Dairy Development Board (NDDB)
G Chokkalingam Deputy General Manager, Sectoral Analysis and Studies
17. 22-Sep Indian Dairy Machinery Company (IDMC)
Mr. Neeraj Puranik Head-Electrical, Instrumentation & Automation
18. 22-Sep Indian Dairy Machinery Company (IDMC)
Mr. Raj Kumar Malik Vice President, Sales & Marketing Projects
19. 22-Sep Indian Dairy Machinery Company (IDMC)
Mr. Prakash Maheshwari
Vice President, Project
20. 22-Sep Indian Dairy Machinery Company (IDMC)
Mr. Anil Shenoi Senior Advisor
21. 22-Sep Kaira District Cooperative Milk Producers' Union
Mr. S. S. Sundaran Officer on Special Duty (Public Relation)
22. 23-Sep Gandhinagar District Cooperate Milk Producers’ Union
Rohit Mehta Managing Director
23. 23-Sep Gandhinagar District Cooperate Milk Producers’ Union
Nitim Macwan General Manager, Branding
24. 23-Sep Gandhinagar District Cooperate Milk Producers’ Union
Mr. Nihm Macasan GM, Business Management
25. 24-Sep Anand District Mujkuva village Mr. Poonambheri H, Phadhiz
Farmer
26. 25-Sep Directorate of Animal Husbandry Dr. A. J. Kachhiaatel Director of Animal Husbandry
27. 25-Sep Directorate of Animal Husbandry Dr. K. A. Vasava Joint Director of Animal Husbandry
28. 25-Sep Food and Drugs Control Administration
Mr. H.G. Koshia Commissioner, Food and Drugs Control Administration Government of Gujarat
A-8

29. 25-Sep Food and Drugs Control Administration
Mrs. Dipika Chauhan Deputy Commissioner, Food and Drugs Control Administration Government of Gujarat
30. 25-Sep Gujarat Livestock Development Board
Dr. Hita Patel Chief Executive Officer
31. 25-Sep Gujarat Livestock Development Board
Dr. Raxit Patel Veterinary Officer
32. 25-Sep DCS(Gandhinagar):Mahadevpura Milk Producers’ Cooperative Society
Vinodbhai Chaudhary
Chairman
33. 25-Sep DCS(Gandhinagar):Mahadevpura Milk Producers’ Cooperative Society
Haribhai Chaudhary Secretary
34. 25-Sep DCS(Gandinagar):Adalas Women Cooperative Society
Ms. Patel Shardaben Chairman
35. 26-Sep Banaskantha District Cooperate Milk Producers’ Union
Mr. Rajeudra Saigal Assistant General Manager, Plant Operation
36. 26-Sep Banaskantha District Cooperate Milk Producers’ Union
Mr. Mausinh Chaudlay
Manager, Admin
37. 26-Sep Banaskantha District Cooperate Milk Producers’ Union
Dr. Deshmuleh Senior Manager, Dairy Husbandry
38. 26-Sep Banaskantha District Cooperate Milk Producers’ Union
Mr. Sandip Nayable Deputy Manager, Plant Operation
39. 27-Sep Banaskantha District Cooperate Milk Producers’ Union Mr. Pravin Patel Senior Manager, Engineering
40. 27-Sep Banaskantha District Cooperate Milk Producers’ Union Mr. D.T. Patel Senior Manager, Quality
Assurance
41. 27-Sep Banaskantha District Cooperate Milk Producers’ Union Dr. Prahlad Vaghela Manager, Quality Management
System
42. 26-Sep DCS (Banaskantha):Jalotra Milk Producers' Cooperative Society
Mr. Hari Secretary
43. 27-Sep Banaskantha District Cooperate Milk Producers’ Union
Mr. Sanjay Karmchandani
Managing Director
44. 27-Sep NDDB Animal Nutrition Group/NDP monitoring Officer
Mr. N. R. Gosh Manager of Animal Nutrition Group
45. 27-Sep Banaskantha Milk Union (Cattle Feed Plant)
Mr P Piliyatar Executive Manager of the Plant
46. 27-Sep DCS (Banaskantha):Thavar Milk Producers' Cooperative Society
Umabhai Patel Secretary
47. 28-Sep National Dairy Development Board (NDDB)
Mr. Y. Y. Patil Executive Director
48. 28-Sep Gujarat Co-operative Milk Marketing Federation Ltd. (GCMMF)
R.S. Sodhi General Manager
49. 28-Sep Gujarat Co-operative Milk Marketing Federation Ltd. (GCMMF)
Mr. CA Atul Kumar Agrawal General Manager (Finance)
50. 29-Sep DCS(Anand)Sarsa Milk Producers' Cooperative Society Amit N Rothod Secretary
51. 29-Sep NDDB Engineering Services Mr. J S Gandhi Group Head, Engineering Services
52. 29-Sep NDDB Engineering Services Mr. S K Goswami Deputy General Manager, Engineering Services
53. 29-Sep NDDB Engineering Services Mr. Jasbir Singh Engineering Servies 54. 29-Sep NDDB Engineering Services Mr. S K Gosham Engineering Servies 55. 29-Sep NDDB Engineering Services Mr. V E E Sundel Engineering Servies 56. 29-Sep NDDB Engineering Services Mr. Chandra Shekas Engineering Servies 57. 29-Sep NDDB Engineering Services Mr. U B Das Engineering Servies 58. 29-Sep NDDB Engineering Services Mr. V Srinivas Engineering Servies
A-9

59. 29-Sep NDDB Quality Assurance and Product & Process Development Dr. D K Sharma
General Manager, Quality Assurance and Product & Process Development
60. 29-Sep NDDB Quality Assurance and Product & Process Development
Mr. Naveenkumara A C
Deputy Manager, Quality Assurance, QualityAssurance and Product & Process Development
61. 3-Oct Patna District Cooperate Milk Producers’ Union Mr. Sudhir K. Singh Managing Director
62. 4-Oct Patna District Cooperate Milk Producers’ Union Mr. Rupesh Raj In charge product
63. 4-Oct Patna District Cooperate Milk Producers’ Union Mr. S N Thakur Manager
64. 4-Oct Asian Development Research Institute (ADRI) Mr. Prabhat P Ghosh Director
65. 4-Oct Bihar State Milk Cooperative Federation Ltd. (COMFED) Ms. Seema Tripathi Managing Director
66. 4-Oct Bihar State Milk Cooperative Federation Ltd. (COMFED) Mr. Rayen Verma General Manager
67. 4-Oct Bihar State Milk Cooperative Federation Ltd. (COMFED) Mr. R.K.Mishra Assistant General Manager
68. 4-Oct Bihar State Milk Cooperative Federation Ltd. (COMFED)
Mr. Kumar Amarandr Manager, Marketing
69. 4-Oct Bihar State Milk Cooperative Federation Ltd. (COMFED) Mr. Amit Suman Assistant Manager, Marketing
70. 4-Oct Bihar State Milk Cooperative Federation Ltd. (COMFED) Mr. Amarnadh Assistant Manager, Engineering
71. 4-Oct Bihar State Milk Cooperative Federation Ltd. (COMFED) Mr. R.K. Jha Manager, Admin
72. 4-Oct Bihar State Milk Cooperative Federation Ltd. (COMFED) Mr. B.N. Prasced Training in charge
73. 4-Oct Bihar State Milk Cooperative Federation Ltd. (COMFED) Mr. V.K. Pandry Assistant Manager, MIS
74. 4-Oct Bihar State Milk Cooperative Federation Ltd. (COMFED) Mr. Vishad Mishara Manager of NDDB
75. 5-Oct Dep. Of Animal Husbandry, Bihar state Mrs. Vijay Laxmi Secretary, Animal Husbandry and
Fishery Department
76. 5-Oct Dep. Of Animal Husbandry, Bihar state Mr. Gautam Deb
Assistant Commissioner, Dairy Development, Ministry of Agriculture, GoI
77. 5-Oct Food Safety Office in Bihar state Mukesh Kashyap Designated Food Safety Officer, Tirhut
78. 5-Oct Food Safety Office in Bihar state Sudhama Chowdy Designated Food Safety Officer, Patna
79. 5-Oct Food Safety Office in Bihar state Tapeshwari Singh Designated Food Safety Officer, Saran
80. 5-Oct Bihar Livestock Development Agency Mr. Amitabh Former Project Director of Bihar
Livestock Development Agency
81. 5-Oct Patna Dairy(DCS): Guai Milk Producers’ Cooperative Society Kundhan Kuman Secretary
82. 5-Oct
Patna Dairy(DCS):Nisirpura Women’s Milk Producers’ Cooperative Society(Women’s Society)
Ms. Chanchallideni Original Member of DCS
83. 5-Oct Patna Diary(DCS):Bhadashara Milk Producers’ Cooperative Society
Mr. Satyandur Singh Secretary
84. 5-Oct Paliganj Milk Chilling Center (Patna District)
Mr. Cramdruks P. Singh
Assistant Milk Procurement Officer
A-10

85. 6-Oct Patna Dairy(DCS):Cheeriyator Milk Producers’ Cooperative Society
Ms. Satyandur Singh Secretary
86. 6-Oct Samastipur Dairy(Mithila Milk Union) D.K. Srivastava Managing Director
87. 6-Oct Samastipur Dairy(Mithila Milk Union) Mr. Sunil Kumal In charge Engineering
88. 6-Oct Samastipur Dairy(Mithila Milk Union) Mr. Om Prakash Rai Deputy Manager, Quality Control
89. 6-Oct Samastipur Dairy(DCS):Salkhanni Milk Producers’ Cooperative Society
Mr. M. Moinuddin Secretary
90. 6-Oct Samastipur Dairy(DCS):Firozpur Pataili Women’s Milk Producers’ Cooperative Society
Ms. Vinodkumar Menber
91. 6-Oct Samastipur Dairy(DCS):Sarairanjan Mahila Women’s Milk Producers’ Cooperative Society
Ms. Sitasimha Secretary
92. 7-Oct Natural Dairy Mr. Hamant Managing Director 93. 7-Oct Natural Dairy Mr. R.K. Singh Staff 94. 7-Oct Natural Dairy Mr. Vijay Pata Staff 95. 7-Oct Anuj Dairy Mr. Sarendra Kumar Managing Director 96. 7-Oct Anuj Dairy Mr. Shrikant Kumar Staff
97. 7-Oct Samastipur Dairy(DCS):Rahmatpur Milk Producers’ Cooperative Society
Mr. Rajesh Secretary
98. 7-Oct Samastipur Dairy(DCS):Chakhaji Women’s Milk Producers’ Cooperative Society
Ms. Kamini Singha Board member
99. 7-Oct Ganga Dairy (Middleman) Mr. Manaj Kumairay Middleman
100. 12-Oct Nagariya MPP (Nagariya Village in Agra) Mr. Tahir Shagai Secretary
101. 12-Oct Saahaj (Milk Producer Company in Agra) Dr. R.R. Singh CEO
102. 12-Oct Saahaj (Milk Producer Company in Agra)
Mr. Basant Choudhary Deputy Chief Executive
103. 30-Oct Meerut Milk Union Mr. Shri SC Verma General Manager
104. 31-Oct Ganeshpur Milk Producers Society (Ganeshpur village) Mr. Surendra Kumar Secretary
105. 4-Nov Ganeshpur Milk Producers Society (Ganeshpur village) Mr. Prevash Tyegi Staff
106. 4-Nov Chemrod Milk Producers Society (Chemrod village) Mr. Sangineer Teshar Secretary
107. 4-Nov Sakoorpur Milk Producers Society (Sakoorpur village, Ghaziabad Distict)
Mr. Tahir Khadish Secretary
108. 6-Nov West Assam Milk Producers’ Cooperative Union Ltd.(WAMUL) Mr. S. B. Bose Managing Director
109. 7-Nov West Assam Milk Producers’ Cooperative Union Ltd.(WAMUL)
Mr. Saveer Kumar Parida Senior Manager, from NDDB
110. 7-Nov West Assam Milk Producers’ Cooperative Union Ltd.(WAMUL) Mr. Dipak Saikia Plant Manager
111. 7-Nov West Assam Milk Producers’ Cooperative Union Ltd.(WAMUL)
Mr. Pranjal pratim Kalita Marketing Officer
112. 7-Nov Commissionerate of Food Safety, Assam
Mr. Smt. Varnali Deka Commissioner, Food Safety
A-11
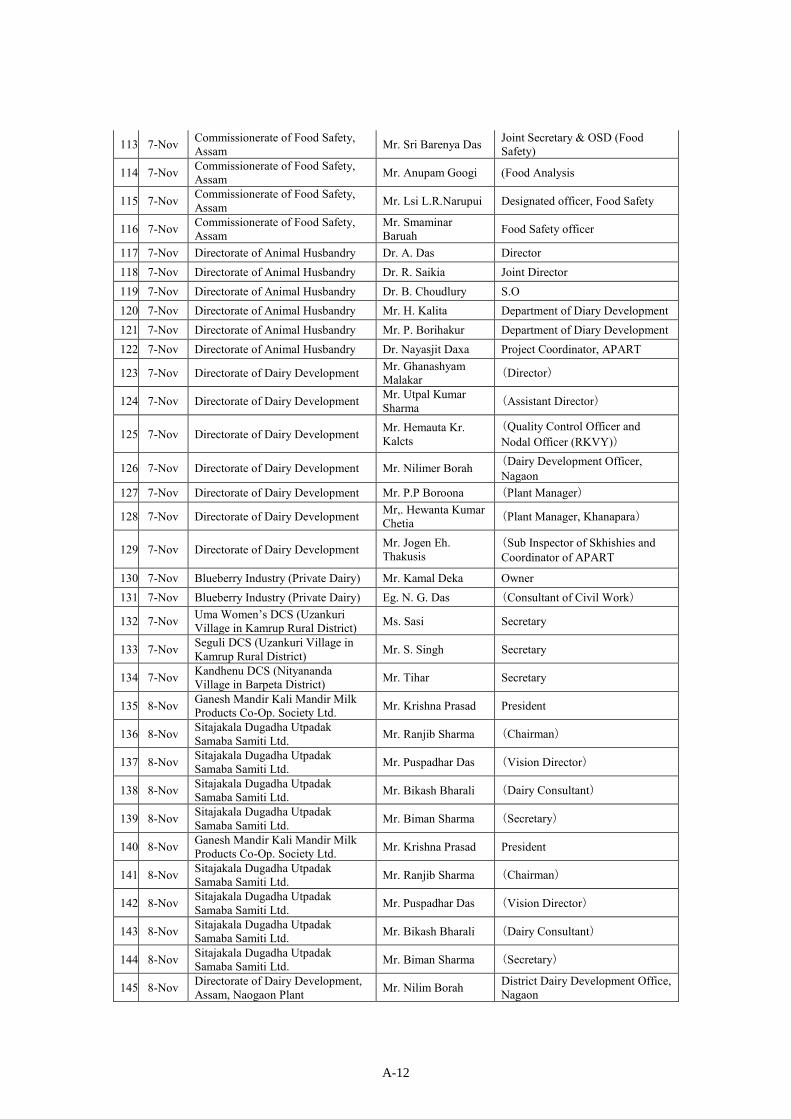
113. 7-Nov Commissionerate of Food Safety, Assam Mr. Sri Barenya Das Joint Secretary & OSD (Food
Safety)
114. 7-Nov Commissionerate of Food Safety, Assam Mr. Anupam Googi (Food Analysis
115. 7-Nov Commissionerate of Food Safety, Assam Mr. Lsi L.R.Narupui Designated officer, Food Safety
116. 7-Nov Commissionerate of Food Safety, Assam
Mr. Smaminar Baruah Food Safety officer
117. 7-Nov Directorate of Animal Husbandry Dr. A. Das Director 118. 7-Nov Directorate of Animal Husbandry Dr. R. Saikia Joint Director 119. 7-Nov Directorate of Animal Husbandry Dr. B. Choudlury S.O 120. 7-Nov Directorate of Animal Husbandry Mr. H. Kalita Department of Diary Development 121. 7-Nov Directorate of Animal Husbandry Mr. P. Borihakur Department of Diary Development 122. 7-Nov Directorate of Animal Husbandry Dr. Nayasjit Daxa Project Coordinator, APART
123. 7-Nov Directorate of Dairy Development Mr. Ghanashyam Malakar (Director)
124. 7-Nov Directorate of Dairy Development Mr. Utpal Kumar Sharma (Assistant Director)
125. 7-Nov Directorate of Dairy Development Mr. Hemauta Kr. Kalcts
(Quality Control Officer and Nodal Officer (RKVY))
126. 7-Nov Directorate of Dairy Development Mr. Nilimer Borah (Dairy Development Officer, Nagaon
127. 7-Nov Directorate of Dairy Development Mr. P.P Boroona (Plant Manager)
128. 7-Nov Directorate of Dairy Development Mr,. Hewanta Kumar Chetia (Plant Manager, Khanapara)
129. 7-Nov Directorate of Dairy Development Mr. Jogen Eh. Thakusis
(Sub Inspector of Skhishies and Coordinator of APART
130. 7-Nov Blueberry Industry (Private Dairy) Mr. Kamal Deka Owner 131. 7-Nov Blueberry Industry (Private Dairy) Eg. N. G. Das (Consultant of Civil Work)
132. 7-Nov Uma Women’s DCS (Uzankuri Village in Kamrup Rural District) Ms. Sasi Secretary
133. 7-Nov Seguli DCS (Uzankuri Village in Kamrup Rural District) Mr. S. Singh Secretary
134. 7-Nov Kandhenu DCS (Nityananda Village in Barpeta District) Mr. Tihar Secretary
135. 8-Nov Ganesh Mandir Kali Mandir Milk Products Co-Op. Society Ltd. Mr. Krishna Prasad President
136. 8-Nov Sitajakala Dugadha Utpadak Samaba Samiti Ltd. Mr. Ranjib Sharma (Chairman)
137. 8-Nov Sitajakala Dugadha Utpadak Samaba Samiti Ltd. Mr. Puspadhar Das (Vision Director)
138. 8-Nov Sitajakala Dugadha Utpadak Samaba Samiti Ltd. Mr. Bikash Bharali (Dairy Consultant)
139. 8-Nov Sitajakala Dugadha Utpadak Samaba Samiti Ltd. Mr. Biman Sharma (Secretary)
140. 8-Nov Ganesh Mandir Kali Mandir Milk Products Co-Op. Society Ltd. Mr. Krishna Prasad President
141. 8-Nov Sitajakala Dugadha Utpadak Samaba Samiti Ltd. Mr. Ranjib Sharma (Chairman)
142. 8-Nov Sitajakala Dugadha Utpadak Samaba Samiti Ltd. Mr. Puspadhar Das (Vision Director)
143. 8-Nov Sitajakala Dugadha Utpadak Samaba Samiti Ltd. Mr. Bikash Bharali (Dairy Consultant)
144. 8-Nov Sitajakala Dugadha Utpadak Samaba Samiti Ltd. Mr. Biman Sharma (Secretary)
145. 8-Nov Directorate of Dairy Development, Assam, Naogaon Plant Mr. Nilim Borah District Dairy Development Office,
Nagaon
A-12

146. 8-Nov Nagaon District Milk Producer Cooperation Union Ltd
Mr. Biri Nchi Kashyap JabialChairman
147. 8-Nov Kandhenu DCS (Nityananda Village in Morigaon District) Mr. Deepu Neupani Mobile AI technician
148. 8-Nov Dordoloni Womens DCS (Dordononi Village in Morigaon District)
Mr. Bhabani Mallik Secretary
149. 8-Nov Maalaxmi DCS (Khanajan Village in Morigaon) Mr. Ambaajdur Chtry Village head
150. 8-Nov Malaybari Durga DCS (Sumulutari Hamlet, Malaybari village in Kumrup)
Mr. Sukleswar Das Secretary
151. 9-Nov The East Assam Milk Producers’ Cooperative Union Ltd. (EAMUR)
Mr. Anish Nair Chief Operating Officer (NDDB)
152. 9-Nov Assam Livestock Development Agency Dr. Pubin Ch. Das (CEO)
153. 9-Nov Assam Livestock Development Agency Dr. Mouideep Das (Manager, A&M)
154. 9-Nov Assam Livestock Development Agency Dr. Jiten Bhuyan (Joint Director of ICDP)
155. 9-Nov Assam Livestock Development Agency Dr. Motiur Ralmar (Manager, T&C)
156. 9-Nov Kamrupa Dairy(Private Dairy) Mr. Nandini Barua (Director) 157. 9-Nov Kamrupa Dairy(Private Dairy) Ms. Ayan Barua Staff
158. 9-Nov Kamrupa Dairy(Private Dairy) Mr.Saibal Thakur Staff
159. 10-Nov Surabishi DCS (Parbatia village in Jorhat) Mr. Pabitra Bora Secretary of DCS and vice
president of Jorhat Union
160. 10-Nov Joraguri DCS (Joraguri village in Jorhat) Mr. Pabitra Bora Secretary of DCS and vice
president of Jorhat Union
161. 10-Nov Department of Dairy Development, Assam, Bokakhat Plant Mr. Anish Nair (Chief Operating Officer)
162. 11-Nov Former Dhankhuli DCS (Dhankuli village in Jorhat) Mr. Parkaj Former Chairman of the DCS
163. 11-Nov M.D. Group of Industry Mr. Murlidhar Gattani Owner
164. 11-Nov Sundar Pukhuri Milk Cooperative Society Mr. Barman Board member
165. 13-Nov Karnataka Cooperative Milk Producers’ Federation (KMF)
Dr. Koramacmandra Bmat
Director, Nandini Spam Station, Purchase, and Training
166. 13-Nov Karnataka Cooperative Milk Producers’ Federation (KMF)
Mr. Ramesh B. Kconnur Director Finance
167. 13-Nov Karnataka Cooperative Milk Producers’ Federation (KMF) Mr. B. Natoraj Director, Quality Assurance
168. 13-Nov Karnataka Cooperative Milk Producers’ Federation (KMF) Mr. M.T. Kolkarni Director, Marketing
169. 13-Nov Karnataka Cooperative Milk Producers’ Federation (KMF) Mr. Prahladd S Additional Director, Marketing
170. 13-Nov Karnataka Cooperative Milk Producers’ Federation (KMF) Dr. Baeararaja K. S. Joint Director, Marketing
171. 13-Nov Karnataka Cooperative Milk Producers’ Federation (KMF)
Mr. B. M. Suresh Kurear Director, Engineering
172. 13-Nov Karnataka Cooperative Milk Producers’ Federation (KMF) Mr. Saahash M. N. Sub Manager, Sectural Analysis
Study (NDDB)
173. 13-Nov Karnataka Cooperative Milk Producers’ Federation (KMF) Mr. T.T. Vinayogam Sub Manager, FPS (NDDB)
A-13

174. 13-Nov Karnataka Cooperative Milk Producers’ Federation (KMF) Mr. Mahash.H Additional Director, Engineering
175. 13-Nov Bangalore Cooperative Milk Union(BAMUL) Mr. D.C. Nagarajaiah Managing Director(KCS))
176. 13-Nov Bangalore Cooperative Milk Union(BAMUL) Dr. B.P. Suresa Manager, Marketing
177. 13-Nov Bangalore Cooperative Milk Union(BAMUL) Dr. S.T. Suresh General Manager, Admin
178. 13-Nov Bangalore Cooperative Milk Union(BAMUL)
Mr. N. Mohan Kumar Deputy Manager, Finance
179. 13-Nov Bangalore Cooperative Milk Union(BAMUL) Mr. N. Muni Rodly General Manager, Technical
180. 13-Nov Bangalore Cooperative Milk Union(BAMUL) Mr. Manjuatha H.K.( Manager, Engineering
181. 13-Nov Bangalore Cooperative Milk Union(BAMUL) Mr. E. Jayamma (Manager
182. 13-Nov Bangalore Cooperative Milk Union(BAMUL) Dr. B.K.Jagadeem Manager
183. 13-Nov Bangalore Cooperative Milk Union(BAMUL) Mr. Kahoku Guwela Deputy Manager
184. 13-Nov Bangalore Cooperative Milk Union(BAMUL) Mr. S.A. Pradash Manager. QA
185. 13-Nov Department of Animal Husbandry and Veterinary Services Dr. M.T. Manjunath
Director of Department / Project Director of Karnataka Livestock Development Agency
186. 13-Nov Food Safety Commissioner, Karnataka Dr. Harshavardan. B Deputy Commissioner Food Safety
(Squad
187. 13-Nov Food Safety Commissioner, Karnataka Mr. Vallas Food safety officer
188. 14-Nov Sadahalli DCS (Sadahalli Village in Bangalore Rural) Mr. Radha Krishna Chairman)
189. 14-Nov Sadahalli DCS (Sadahalli Village in Bangalore Rural) Mr. S. N. Murthy Secretary
190. 14-Nov Harohalli DCS (Harohalli Village in Bangalore Rural) Mr. Munegowda Secretary
191. 14-Nov Kammasandra DCS (Kammasandra Village in Bangalore Rural) Mr. Kempagowda Chairman)
192. 14-Nov Kammasandra DCS (Kammasandra Village in Bangalore Rural) Mr. Jayaramaiah Secretary
193. 15-Nov NDDB Regional Office Mr. Pankaj Singh Manager of Animal Husbandry
194. 15-Nov NDDB Regional Office Dr. D.G. Raghupaths Deputy General Manager of Animal Breeding
195. 15-Nov NDDB Regional Office Mr. Saltish M.N.( Senior Manager of Sectoral Analysis
196. 15-Nov Sadahalli DCS (Sadahalli Village in Bangalore Rural) Mr. Radha Krishna Chairman)
197. 15-Nov Sadahalli DCS (Sadahalli Village in Bangalore Rural) Mr. S. N. Murthy Secretary
198. 16-Nov Srikrishana Milks Private Limited Mr. Dinesh R. Pai Chairman
199. 16-Nov Heritage Foods Limited Mr. G. Hari Babu Deputy General Manager, Operations
200. 16-Nov The Nilgiri Dairy Farm Pvt. Ltd Mr. Srinivas G Dairy Head, Karnataka 201. 16-Nov The Nilgiri Dairy Farm Pvt. Ltd Mr. Prashantha M.S Senior Manager, Dairy
202. 16-Nov The Nilgiri Dairy Farm Pvt. Ltd Ms. Ashalatha, Senior Manager Merchandising of Future Consumer
203. 16-Nov Creamline Dairy Products Ltd. Mr. Girish Dixit General manager
204. 16-Nov Gokul Dairy Products Mr. K.N. Krishnamurthy Managing Director
A-14

205. 16-Nov Gokul Dairy Products Mr. R. Bache Gowda Staff
206. 16-Nov Gulburga Milk Producers Societie’s Union Dr. C. H. Kamkeri Managing Director
207. 16-Nov Ghatboral DCS (Ghatboral Village in Bidar District) Mr. Mahadev Secretary
208. 16-Nov Ghatboral DCS (Ghatboral Village in Bidar District) Mr. Banwbandeppa Union staff
209. 17-Nov Heritage Foods Limited Mr. G. Hari Babu Deputy General Manager of Operation
210. 17-Nov Heritage Foods Limited Mr. G. Nandakumar Chowdary Assistant Manager of Operation
211. 17-Nov Herapur DCS (Herapur Village in Gulbarga District) Mr. Sontoshhkumar Secretary
212. 17-Nov Kumasi DCS (Kumasi Village in Gulbarga District)
Mr. Mahadev Kabatagi Secretary
213. 20-Nov Madhya Pradesh State Cooperative Diary Federation(MPCDF)
Mr. Jitendra Singh Raje Managing Director(IAS))
214. 20-Nov Madhya Pradesh State Cooperative Diary Federation(MPCDF) Dr. R.K. Doorwar General Manager
215. 20-Nov Madhya Pradesh State Cooperative Diary Federation(MPCDF) Mr. R.P.S. Tiwari General Manger, Finance and
Admin
216. 20-Nov Madhya Pradesh State Cooperative Diary Federation(MPCDF) Mr. Soku Rao Assistant General Manager
217. 20-Nov Madhya Pradesh State Cooperative Diary Federation(MPCDF) Mr. Aseem Negam Assistant General Manager
218. 20-Nov Madhya Pradesh State Cooperative Diary Federation(MPCDF) Mr. Sht Sharda Jowri Manager)
219. 20-Nov Madhya Pradesh State Cooperative Diary Federation(MPCDF) Ms. Sharda Johni Manager, QC
220. 20-Nov Madhya Pradesh State Cooperative Diary Federation(MPCDF) Mr. Asimi Nigam Assistant General Manager,
Monitoring & Planning
221. 20-Nov Bhopal Cooperative Milk Union Limited Mr. Subhash Misher Deputy General Manager of
Marketing
222. 20-Nov Bhopal Cooperative Milk Union Limited Mr. Pramod Shawal Assistant General Manager
223. 20-Nov Bhopal Cooperative Milk Union Limited Mr. Manoj Shedhani Assistant General Manger of
MIS/EDD
224. 20-Nov Bhopal Cooperative Milk Union Limited Mr. Subodh Agraud Manager
225. 20-Nov Bhopal Cooperative Milk Union Limited
Mr. Rayesh Vigeyveyys Assistant General Manager
226. 20-Nov Bhopal Cooperative Milk Union Limited Mr. Ashok Khare Incharge of purchase
227. 20-Nov Bhopal Cooperative Milk Union Limited Ms. Uma Maluiya Manager of Finance
228. 20-Nov Bhopal Cooperative Milk Union Limited Mr. Amit Sacena Manager of Engineering
229. 20-Nov Indore Cooperative Milk Union Limited Mr. A.N.Dwivedi CEO
230. 20-Nov Indore Cooperative Milk Union Limited Mr. S.S. Ali Assistant General Manager of
Marketing
231. 20-Nov Indore Cooperative Milk Union Limited
Ms. Divya Singh Parihar
Assistant General Manager (Finance
232. 20-Nov Gwalior Cooperative Milk Union Limited
Mr. Ahurag Ling Lagar Cagu
Assistant General Manager of Marketing
233. 20-Nov Ujjan Cooperative Milk Union Limited Dr. N.L. Tyogi CEO
234. 20-Nov National Dairy Development Board (NDDB) Dr. Subhankar Nanda Deputy Manager
A-15
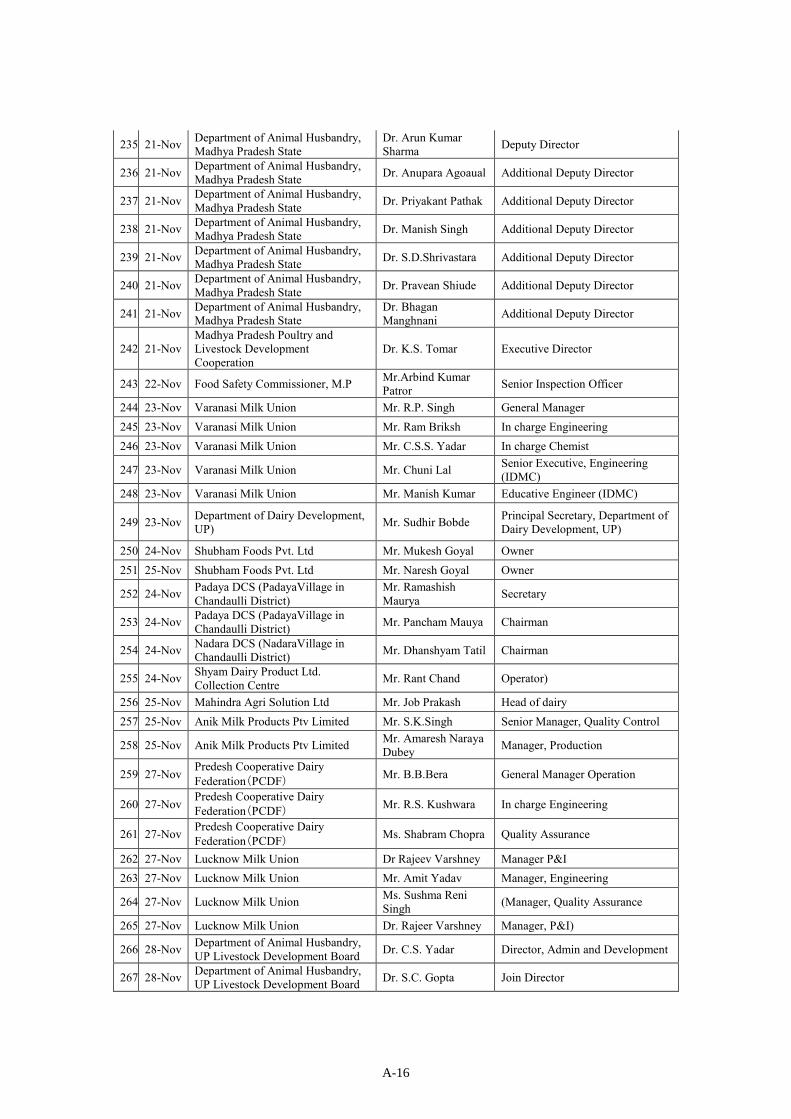
235. 21-Nov Department of Animal Husbandry, Madhya Pradesh State
Dr. Arun Kumar Sharma Deputy Director
236. 21-Nov Department of Animal Husbandry, Madhya Pradesh State Dr. Anupara Agoaual Additional Deputy Director
237. 21-Nov Department of Animal Husbandry, Madhya Pradesh State Dr. Priyakant Pathak Additional Deputy Director
238. 21-Nov Department of Animal Husbandry, Madhya Pradesh State Dr. Manish Singh Additional Deputy Director
239. 21-Nov Department of Animal Husbandry, Madhya Pradesh State Dr. S.D.Shrivastara Additional Deputy Director
240. 21-Nov Department of Animal Husbandry, Madhya Pradesh State Dr. Pravean Shiude Additional Deputy Director
241. 21-Nov Department of Animal Husbandry, Madhya Pradesh State
Dr. Bhagan Manghnani Additional Deputy Director
242. 21-Nov Madhya Pradesh Poultry and Livestock Development Cooperation
Dr. K.S. Tomar Executive Director
243. 22-Nov Food Safety Commissioner, M.P Mr.Arbind Kumar Patror Senior Inspection Officer
244. 23-Nov Varanasi Milk Union Mr. R.P. Singh General Manager 245. 23-Nov Varanasi Milk Union Mr. Ram Briksh In charge Engineering 246. 23-Nov Varanasi Milk Union Mr. C.S.S. Yadar In charge Chemist
247. 23-Nov Varanasi Milk Union Mr. Chuni Lal Senior Executive, Engineering (IDMC)
248. 23-Nov Varanasi Milk Union Mr. Manish Kumar Educative Engineer (IDMC)
249. 23-Nov Department of Dairy Development, UP) Mr. Sudhir Bobde Principal Secretary, Department of
Dairy Development, UP)
250. 24-Nov Shubham Foods Pvt. Ltd Mr. Mukesh Goyal Owner 251. 25-Nov Shubham Foods Pvt. Ltd Mr. Naresh Goyal Owner
252. 24-Nov Padaya DCS (PadayaVillage in Chandaulli District)
Mr. Ramashish Maurya Secretary
253. 24-Nov Padaya DCS (PadayaVillage in Chandaulli District) Mr. Pancham Mauya Chairman
254. 24-Nov Nadara DCS (NadaraVillage in Chandaulli District) Mr. Dhanshyam Tatil Chairman
255. 24-Nov Shyam Dairy Product Ltd. Collection Centre Mr. Rant Chand Operator)
256. 25-Nov Mahindra Agri Solution Ltd Mr. Job Prakash Head of dairy 257. 25-Nov Anik Milk Products Ptv Limited Mr. S.K.Singh Senior Manager, Quality Control
258. 25-Nov Anik Milk Products Ptv Limited Mr. Amaresh Naraya Dubey Manager, Production
259. 27-Nov Predesh Cooperative Dairy Federation(PCDF) Mr. B.B.Bera General Manager Operation
260. 27-Nov Predesh Cooperative Dairy Federation(PCDF) Mr. R.S. Kushwara In charge Engineering
261. 27-Nov Predesh Cooperative Dairy Federation(PCDF) Ms. Shabram Chopra Quality Assurance
262. 27-Nov Lucknow Milk Union Dr Rajeev Varshney Manager P&I 263. 27-Nov Lucknow Milk Union Mr. Amit Yadav Manager, Engineering
264. 27-Nov Lucknow Milk Union Ms. Sushma Reni Singh (Manager, Quality Assurance
265. 27-Nov Lucknow Milk Union Dr. Rajeer Varshney Manager, P&I)
266. 28-Nov Department of Animal Husbandry, UP Livestock Development Board Dr. C.S. Yadar Director, Admin and Development
267. 28-Nov Department of Animal Husbandry, UP Livestock Development Board Dr. S.C. Gopta Join Director
A-16

268. 28-Nov Department of Animal Husbandry, UP Livestock Development Board Dr. Keshan Kumar in charge reproduction cell and
MIS cell UPLDB
269. 28-Nov Department of Animal Husbandry, UP Livestock Development Board Dr. Veemu Pande in charge training and extension
cell, UPLDB
270. 28-Nov Department of Animal Husbandry, UP Livestock Development Board Mr. Durgish Mishea NA
271. 28-Nov Department of Animal Husbandry, UP Livestock Development Board
Mr. Pramod Kumar Pandey Accisstant, UPLDB
272. 28-Nov Department of Animal Husbandry, UP Livestock Development Board Dr. Satish Chardri Deputy Director
273. 28-Nov Department of Animal Husbandry, UP Livestock Development Board Dr. Rajara TE Animal Hub
274. 28-Nov Department of Animal Husbandry, UP Livestock Development Board Dr. Alok Yadane VO UPLDB
275. 28-Nov Department of Dairy Development Mr. Raj Kumar Srivastava
Additional Milk Commissioner, PCS
276. 28-Nov Kanpur Milk Union Dr. Ram Sagar (Regional Dairy Development Officer, Kanpur
277. 28-Nov Kanpur Milk Union Mr. Thumu Tirumal Reddy Unit Head
278. 28-Nov Kanpur Milk Union Mr. Neeraj Gupta (Manager, Finance/ In charge Marketing
279. 28-Nov Kanpur Milk Union Ms. Ratna Singh In charge Procurement 280. 28-Nov Kanpur Milk Union Mr. R.P. Gupta Quality Assurance
281. 28-Nov Jignis DCS (Jignis Village in Kanpur District) Mr. Sanjay Shukla Secretary
282. 28-Nov Amul collection point in Jignis village Mr. Rohit Secretary
283. 29-Nov Food Safety and Drug Administration (FSDA) Mr. D.K. Tiwari Designated Assistant
Commissioner, HQ
284. 29-Nov Food Safety and Drug Administration (FSDA) Mr. A.P. Varma Chief Safety Officer, HQ
285. 29-Nov Gyan:CP Milk and Food Products Pvt. Itd
Mr. Jai Kumar Agarwal Managing Director
286. 29-Nov Gyan:CP Milk and Food Products Pvt. Itd
Mr. Anuj Kumar Agarwal Managing Director
287. 29-Nov Gyan:CP Milk and Food Products Pvt. Itd Mr. M.K.Gupta GM, Quality Assurance
288. 29-Nov Rahamatenager DCS (Rahamatenagar village in Lucknow District)
Mr. Promod Kumar Secretary
289. 29-Nov Bastauly DCS (Bastauly village in Lucknow District) Mr. Mayaraw Secretary
290. 29-Nov Mamta Milk Mr. Tasil Staff
291. 30-Nov Jabalpur Cooperative Milk Union Limited Mr. Deepa Shodima CEO
292. 30-Nov Namaste India(NIF Private Limited)
Mr. Sashi Kanta Samal General Manager
293. 1-Dec Private Farm in Jabalpur Mr. Sonali Owner 294. 1-Dec Maekawa India Mr. Takeo Fujimoto Director
295. 1-Dec Department of Animal Husbandry, Dairying, and Fisheries Mr. S. S. Kandpal Director
296. 1-Dec Department of Animal Husbandry, Dairying, and Fisheries Mr. S. K. Dalal Consultant, Dairy Development
297. 1-Dec Department of Animal Husbandry, Dairying, and Fisheries Mr. C. Ser Assistant, Dairy Development
298. 1-Dec Department of Animal Husbandry, Dairying, and Fisheries Mr. S. Shebhar Technical Officer, Dairy
Development
A-17
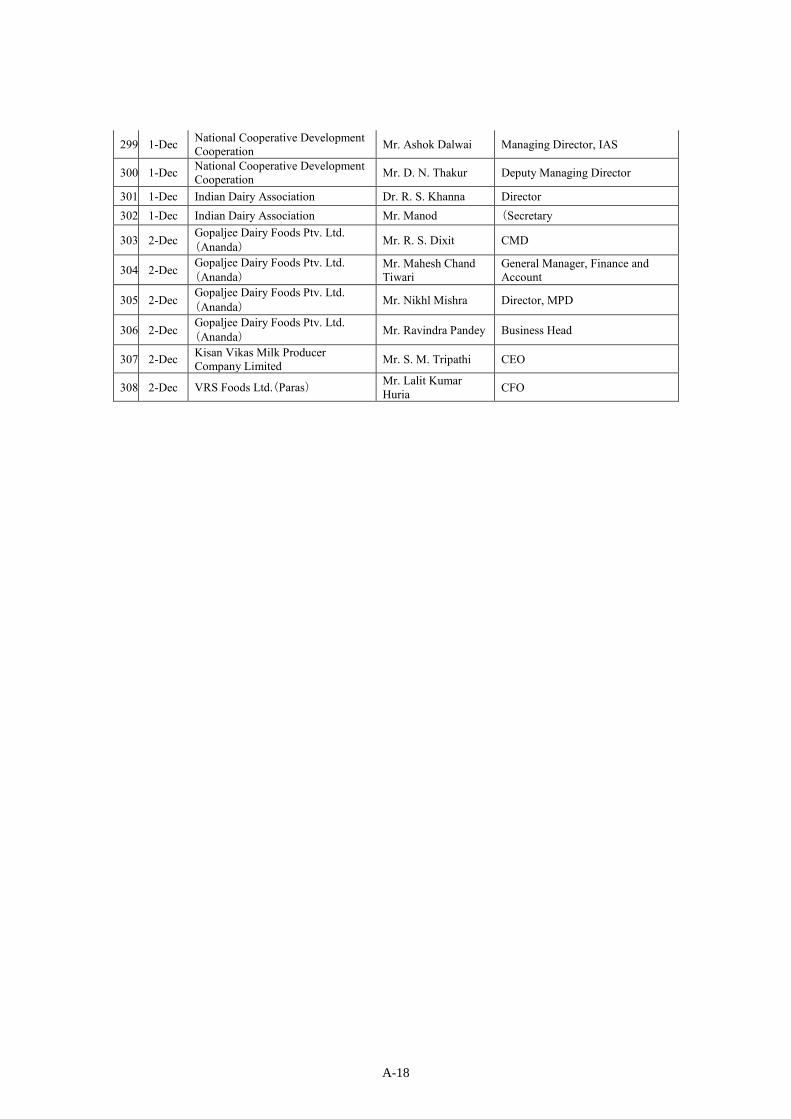
299. 1-Dec National Cooperative Development Cooperation Mr. Ashok Dalwai Managing Director, IAS
300. 1-Dec National Cooperative Development Cooperation Mr. D. N. Thakur Deputy Managing Director
301. 1-Dec Indian Dairy Association Dr. R. S. Khanna Director 302. 1-Dec Indian Dairy Association Mr. Manod (Secretary
303. 2-Dec Gopaljee Dairy Foods Ptv. Ltd.(Ananda) Mr. R. S. Dixit CMD
304. 2-Dec Gopaljee Dairy Foods Ptv. Ltd.(Ananda)
Mr. Mahesh Chand Tiwari
General Manager, Finance and Account
305. 2-Dec Gopaljee Dairy Foods Ptv. Ltd.(Ananda) Mr. Nikhl Mishra Director, MPD
306. 2-Dec Gopaljee Dairy Foods Ptv. Ltd.(Ananda) Mr. Ravindra Pandey Business Head
307. 2-Dec Kisan Vikas Milk Producer Company Limited Mr. S. M. Tripathi CEO
308. 2-Dec VRS Foods Ltd.(Paras) Mr. Lalit Kumar Huria CFO
A-18

Annex 4
Government of IndiaS/N Issued by Name of document or data Language Year Type
GI-01Department of Agriculture, Cooperation and Farmers' Welfare, Ministry of Agriculture &Farmers Welfare (DACFW)
Report of Committee on Doubling Farmers' Income vol. 1 English 2017 PDF
GI-02Department of Agriculture, Cooperation and Farmers' Welfare, Ministry of Agriculture &Farmers Welfare (DACFW)
Report of Committee on Doubling Farmers' Income vol. 2 English 2017 PDF
GI-03Department of Agriculture, Cooperation and Farmers' Welfare, Ministry of Agriculture &Farmers Welfare (DACFW)
Report of Committee on Doubling Farmers' Income vol. 3 English 2017 PDF
GI-04Department of Agriculture, Cooperation and Farmers' Welfare, Ministry of Agriculture &Farmers Welfare (DACFW)
Report of Committee on Doubling Farmers' Income vol. 4 English 2017 PDF
GI-05Department of Animal Husbandry, Dairying & Fisheries, Ministry of Agriculture &Farmers Welfare (DAHDF)
19th Livestock Census English 2012 PDF
GI-06Department of Animal Husbandry, Dairying & Fisheries, Ministry of Agriculture &Farmers Welfare (DAHDF)
Basic Animal Husbandry & Fisheries Statistics 2015 English 2015 PDF
GI-07Department of Animal Husbandry, Dairying & Fisheries, Ministry of Agriculture &Farmers Welfare (DAHDF)
Basic Animal Husbandry & Fisheries Statistics 2017 English 2017 PDF
GI-08Department of Animal Husbandry, Dairying & Fisheries, Ministry of Agriculture &Farmers Welfare (DAHDF)
Rashtriya Gokul Mission National Action Plan 2016-2020-2024 English 2017 PDF
GI-09Department of Animal Husbandry, Dairying & Fisheries, Ministry of Agriculture &Farmers Welfare (DAHDF)
Vision - 2024 Doubling Farmeres Income by 2022 English 2017 PDF
GI-10 National Centre for Cold-chain Development (NCCD) Analysing NDDB Cluster model for marketing of Vegetables English 2017 PDF
GI-11 National Cooperative Development Corporation (NCDC) Annual Report 2015-2016 English 2016 PDF
GI-12 National Cooperative Development Corporation (NCDC) Annual Report 2016-2017 English 2017 PDF
GI-13National Sample Survey Office, Ministry of Statistics and Programme Implementation(NSSO)
Income, expenditure, asset of agri households in India English 2013 PDF
GI-14National Sample Survey Office, Ministry of Statistics and Programme Implementation(NSSO)
Key Indicators of Household Consumer Expenditure in India 2011-2012 English 2012 PDF
GI-15National Sample Survey Office, Ministry of Statistics and Programme Implementation(NSSO)
Livestock Ownership in India English 2013 PDF
List of Collected Documents and Data
A-19

NDDBS/N Issued by Name of document or data Language Year Type
ND-01 National Dairy Development Board (NDDB) a. Justification of supporting Dairy Cooperatives English 2017 PDF
ND-02 National Dairy Development Board (NDDB) b. Impact of project components under proposal English 2017 PDF
ND-03 National Dairy Development Board (NDDB) c. Role of Government in development of Dairy sector in India English 2017 PDF
ND-04 National Dairy Development Board (NDDB) Agro climatic zone English 2017 PDF
ND-05 National Dairy Development Board (NDDB) Annex I_Eligibility Criteria and Terms and conditions of lending English 2017 PDF
ND-06 National Dairy Development Board (NDDB) Annex II_Eligibility Criteria English 2017 PDF
ND-07 National Dairy Development Board (NDDB) Annual Report 2010-2011 English 2011 PDF
ND-08 National Dairy Development Board (NDDB) Annual Report 2011-2012 English 2012 PDF
ND-09 National Dairy Development Board (NDDB) Annual Report 2012-2013 English 2013 PDF
ND-10 National Dairy Development Board (NDDB) Annual Report 2013-2014 English 2014 PDF
ND-11 National Dairy Development Board (NDDB) Annual Report 2014-2015 English 2015 PDF
ND-12 National Dairy Development Board (NDDB) Annual Report 2015-2016 English 2016 PDF
ND-13 National Dairy Development Board (NDDB) Cost of BMC, CC in different capacities English 2017 Excel
ND-14 National Dairy Development Board (NDDB) Dairying in India English 2017 PPT
ND-15 National Dairy Development Board (NDDB) Dairying through Cooperative English 2017 PDF
ND-16 National Dairy Development Board (NDDB) Development of model village English NA PDF
ND-17 National Dairy Development Board (NDDB) Draft DPR Infrastructure Project 11 Jan 2017 English 2017 PDF
ND-18 National Dairy Development Board (NDDB) Draft note on demand and supply forecast for milk English 2017 Word
ND-19 National Dairy Development Board (NDDB) Executive summary of project porposal 12 June 2015 English 2017 PDF
ND-20 National Dairy Development Board (NDDB) Impact of JICA project - b. Impact of project componenter proposal English 2017 Excel
ND-21 National Dairy Development Board (NDDB) Impact of JICA project - Revised Financial Economic analysis English 2017 PDF
ND-22 National Dairy Development Board (NDDB) Impact of JICA project - Savings due to refurbishment of dairy plnant English 2017 Excel
ND-23 National Dairy Development Board (NDDB) India Map Coverage of Cooperatives English 2017 PDF
ND-24 National Dairy Development Board (NDDB) Information of Dairy Plant Equipment English 2017 PDF
ND-25 National Dairy Development Board (NDDB) Information-JICA Study Team English 2017 PDF
ND-26 National Dairy Development Board (NDDB) List of Producer Company English 2017 Excel
ND-27 National Dairy Development Board (NDDB) List of Unions proposed for setting up of new & expansion of dairy plants English 2017 Excel
ND-28 National Dairy Development Board (NDDB) Milk Price Chart at DCS which JICA study team visited on September 22 English 2017 Word
ND-29 National Dairy Development Board (NDDB) National Dairy Plan 2009-2022 English 2008 PDF
ND-30 National Dairy Development Board (NDDB) NDDB act English 1987 PDF
ND-31 National Dairy Development Board (NDDB)Need for new technology in dairy sector and opportunities for technology transfer with keyJapanese partners
English 2017 PDF
ND-32 National Dairy Development Board (NDDB) Note on use of Japanese Technology in dairy sector English 2017 Word
A-20

ND-33 National Dairy Development Board (NDDB) Organogram & Group wise manpower English 2017 Excel
ND-34 National Dairy Development Board (NDDB) Poverty alleviation through dairying English 2017 PPT
ND-35 National Dairy Development Board (NDDB) Presentation on National Dairy Plan Phase1 English 2017 PDF
ND-36 National Dairy Development Board (NDDB) Presentation on NDDB English 2017 PDF
ND-37 National Dairy Development Board (NDDB) Question & Answer NDDB Project 3 June 2016 Section 1 English 2017 Word
ND-38 National Dairy Development Board (NDDB) Question & Answer NDDB Project 3 June 2016 Section 2 English 2017 Word
ND-39 National Dairy Development Board (NDDB) Question & Answer NDDB Project 3 June 2016 Section 3 English 2017 Word
ND-40 National Dairy Development Board (NDDB) Question & Answer NDDB Project 3 June 2016 Section 4 English 2017 Word
ND-41 National Dairy Development Board (NDDB) Question & Answer NDDB Project 3 June 2016 Section 5 English 2017 Word
ND-42 National Dairy Development Board (NDDB) Question & Answer NDDB Project 3 June 2016 Section 6 English 2017 Word
ND-43 National Dairy Development Board (NDDB) Question & Answer NDDB Project 3 June 2016 Section 7 English 2017 Word
ND-44 National Dairy Development Board (NDDB) RBP impact assessment by IRMA English 2017 PDF
ND-45 National Dairy Development Board (NDDB) RBP impact assessment by NDRI English 2017 PDF
ND-46 National Dairy Development Board (NDDB) Reply on Questionnaire for JICA Contact Mission_27 Feb 2017 English 2017 PDF
ND-47 National Dairy Development Board (NDDB) Reply on Questionnaire for JICA Contact Mission_Feasibilitity Analysis English 2017 Word
ND-48 National Dairy Development Board (NDDB) Reply to Query 2016-09-27 English 2017 PDF
ND-49 National Dairy Development Board (NDDB) Reply to Query 2017-12-27 English 2017 Word
ND-50 National Dairy Development Board (NDDB) Reply to Query 2018-02-06&12(1) English 2017 Word
ND-51 National Dairy Development Board (NDDB) Reply to Query 2018-02-06&12(2) English 2017 Word
ND-52 National Dairy Development Board (NDDB) State wise breakup_Impact of project components English 2017 Excel
ND-53 National Dairy Development Board (NDDB) Strengthening of Milk Processing Infrastructure English 2017 PPT
ND-54 National Dairy Development Board (NDDB) Suggested list of states for data collection survey English 2017 Word
ND-55 National Dairy Development Board (NDDB) Training Planner 2017-2018 English 2017 PDF
ND-56 National Dairy Development Board (NDDB) Union, PC, Procurement, DCS member, milk sale English 2017 PDF
ND-57 National Dairy Development Board (NDDB) Unionwise Financial Outlay English 2017 Excel
ND-58 National Dairy Development Board (NDDB) Unionwise Information_5 States English 2017 Excel
ND-59 National Dairy Development Board (NDDB) Unionwise Information_All States English 2017 Excel
ND-60 National Dairy Development Board (NDDB) Unionwise Information_Gujarat States English 2017 Excel
ND-61 National Dairy Development Board (NDDB) Unionwise information_Projected physical performance English 2017 Excel
ND-62 National Dairy Development Board (NDDB) Vision 2024-National Action Plan on Dairy Development English 2017 Excel
ND-63 National Dairy Development Board (NDDB) Working capital scheme guidelines English 2017 PDF
ND-64 National Dairy Development Board, Bangarole (NDDBB) Bypass Fat Supplement English 2017 PDF
ND-65 National Dairy Development Board, Bangarole (NDDBB) Bypass protien supplement English 2017 PDF
ND-66 National Dairy Development Board, Bangarole (NDDBB) Compound cattle feed English 2017 PDF
ND-67 National Dairy Development Board, Bangarole (NDDBB) Mineral Mixture English 2017 PDF
ND-68 National Dairy Development Board, Engineering Service (NDDBES) Infrastructure upgradation English 2017 PPT
ND-69 National Dairy Development Board, Engineering Service (NDDBES) Japanese Technology English 2017 PPT
ND-70 National Dairy Development Board, Quality Assurence (NDDBQA) Quality Assurance English 2017 PPT
A-21
Assam stateS/N Issued by Name of document or data Language Year Type
AS-01 Assam Livestock Development Agency (ALDA) Abstract of the Cattle Breeding Program of the state English 2017 PDF
AS-02 Assam Livestock Development Agency (ALDA) Breeding Policy for Cattle and Buffalo in the state of Assam English 2002 PDF
AS-03 Assam Livestock Development Agency (ALDA) Frozen Semen Bull Station English 2017 PDF
AS-04 Assam Livestock Development Agency (ALDA) Letter for fund release under NMBP, 2016-17 English 2017 PDF
AS-05 Assam Livestock Development Agency (ALDA) Physical progress and financial status of ALDA English 2017 PDF
AS-06 Assam Livestock Development Agency (ALDA) Revised Microplan, NPBB English 2017 PDF
AS-07 Commissionerate of Food Safety, Assam (CFSA) Answers for questioners English 2017 PDF
AS-08 Directorate of Animal Husbandry (DAH) Animal Husbandry and Veterinary Component under APART English NA PDF
AS-09 Directorate of Animal Husbandry (DAH) At a glance of Animal Husbandry and Veterinary Department, Assam English NA PDF
AS-10 Directorate of Animal Husbandry (DAH) District-wise Livestock and Poultry Population in Assam (copy of 1th Livestock Census) English NA PDF
AS-11 Directorate of Animal Husbandry (DAH) Integrated Sample Survey Report 2015-16 English 2016 PDF
AS-12 Directorate of Animal Husbandry (DAH) Milk Production SPAP English NA PDF
AS-13 DCS Sundar Pukhuri Milk Cooperative Society (DCS) Booklet English NA PDF
AS-14 DCS Sundar Pukhuri Milk Cooperative Society (DCS) Visit report English 2014 PDF
AS-15 Directorate of Dairy Development (DDD) Annual Report of Dairy Development 2016-17 English 2017 PDF
AS-16 Directorate of Dairy Development (DDD) APART (Assam Project on Agribusiness and Rural Transformation) English NA PPT
AS-17 Directorate of Dairy Development (DDD) Presentation English 2017 PDF
AS-18 Directorate of Dairy Development (DDD) Procurement & sale price of milk & milk products, Cost of production English 2016 PDF
AS-19 Directorate of Dairy Development (DDD) Progress report of Town milk supply scheme English 2017 PDF
AS-20 International Livestock Research Institute (ILRI) Comprehensive study of Assam dairy sector - Action plan for pro-poor dairy development English 2007 PDF
AS-21 International Livestock Research Institute (ILRI)Comprehensive study of Assam dairy sector - Assesment of success and failures of dairyplants
English 2010 PDF
AS-22 International Livestock Research Institute (ILRI) Comprehensive study of Assam dairy sector - Milk and milk products consumption English 2009 PDF
AS-23 International Livestock Research Institute (ILRI) Comprehensive study of Assam dairy sector - Milk and milk products marketing English 2008 PDF
AS-24 International Livestock Research Institute (ILRI) Comprehensive study of Assam dairy sector - Milk quality, pathdays and perceptions English 2011 PDF
AS-25 International Livestock Research Institute (ILRI) Comprehensive study of Assam dairy sector - Rural Households and Milk Production English 2007 PDF
AS-26 West Assam Milk Producers’ Cooperative Union Ltd.(WAMUL) Financial information English NA PDF
AS-27 West Assam Milk Producers’ Cooperative Union Ltd.(WAMUL) List of machineries English 2017 PDF
AS-28 West Assam Milk Producers’ Cooperative Union Ltd.(WAMUL) Milk retail price & Procurement price English 2017 PDF
AS-29 West Assam Milk Producers’ Cooperative Union Ltd.(WAMUL) Presentation file English 2017 PPT
AS-30 West Assam Milk Producers’ Cooperative Union Ltd.(WAMUL) Result of market research English 2016 PDF
A-22

Bihar stateS/N Issued by Name of document or data Language Year Type
BH-01 Bihar Livestock Development Agency (BLDA) General Information Hindhi 2017 PDF
BH-02 Bihar State Milk Cooperative Federation Ltd. (COMFED) Annual Report 2014 Hindhi 2014 PDF
BH-03 Bihar State Milk Cooperative Federation Ltd. (COMFED) Annual Report 2015 Hindhi 2015 PDF
BH-04 Bihar State Milk Cooperative Federation Ltd. (COMFED) Financial performance of COMFED and Union English 2017 Excel
BH-05 DCS Chakhaji (DCS) General Information English 2017 PDF
BH-06 DCS Rahmatpur (DCS) General Information English 2017 PDF
BH-07 Department of Dairy Dvelopment (DDD) General information English 2017 PDF
BH-08 Food Safety Officer (FSO) of Bihar Fact sheet on enforcement related issues for the state English 2017 PDF
BH-09 Government of Bihar Finance Department (GBFD) Economic Survey 2016-17 English 2017 PDF
BH-10 Samastipur Dairy(Mithila Milk Union: MMU) Annual Report 2013-14 Hindhi 2014 PDF
BH-11 Samastipur Dairy(Mithila Milk Union: MMU) Internal documents about investment with JICA English 2017 PDF
BH-12 Samastipur Dairy(Mithila Milk Union: MMU) Milk Union Provide Services to DCS Milk Producers English 2017 PDF
BH-13 Samastipur Dairy(Mithila Milk Union: MMU) Presentation English 2017 PDF
BH-14 Naturals Dairy (ND) General Information English NA PDF
BH-15 NDDB Dairy Service (NDS) Presentation English 2017 PPT
BH-16 Patna District Cooperate Milk Producers’ Union (PDCMPU) General & financial information English NA PDF
A-23

Gujarat stateS/N Issued by Name of document or data Language Year Type
GJ-01 Banaskantha District Cooperative Milk Producer' Union (BDCMPU) 48th Annual Report 2015-16 English 2016 PDF
GJ-02 Banaskantha District Cooperative Milk Producer' Union (BDCMPU) DCS F/S rank Hindhi 2016 PDF
GJ-03 Banaskantha District Cooperative Milk Producer' Union (BDCMPU) Presentation document (1000 MTPF Cattle Feed Plant, Katarva) English NA PDF
GJ-04 Directorate of Animal Husbandry (DAH)) Bulletin of animal husbandry and dairying statistics 2015-2016 English 2016 PDF
GJ-05 Directorate of Animal Husbandry (DAH)) Presentation file English 2017 PPT
GJ-06 DCS Adalaj (DCS) General information English 2017 PDF
GJ-07 Gujarat Co-operative Milk Marketing Federation Ltd. (GCMMF) 41st Annual Report 2014/2015 English 2015 PDF
GJ-08 Gujarat Co-operative Milk Marketing Federation Ltd. (GCMMF) 43rd Annual Report 2016/2017 English 2017 PDF
GJ-09 Gujarat Co-operative Milk Marketing Federation Ltd. (GCMMF) Corporate Presentation English 2017 PDF
GJ-10 Gujarat Co-operative Milk Marketing Federation Ltd. (GCMMF) General information English 2017 PDF
GJ-11 Gandhinagar District Cooperate Milk Producers’ Union (GDCMPU) 46th Annual Report & Accounts 2015-2016 English 2016 PDF
GJ-12 Gandhinagar state Food and Drugs Control Administration (GFDCA) Manual for Food Adultration kit English NA PDF
GJ-13 Gandhinagar state Food and Drugs Control Administration (GFDCA) Presentation file English 2017 PPT
GJ-14 Gujarat Livestock Dvelopment Board (GLDB) Annual Report 2015-16 English 2016 PDF
GJ-15 Kaira District Cooperative Milk Producers' Union (KDCMPU) 71st Annual Report 2016-2017 English 2017 PDF
GJ-16 Kaira District Cooperative Milk Producers' Union (KDCMPU) Amul the inspiration behind a revolution English NA PDF
GJ-17 Kaira District Cooperative Milk Producers' Union (KDCMPU) General information English NA PDF
A-24

Karnataka stateS/N Issued by Name of document or data Language Year Type
KT-01 Bangalore Cooperative Milk Union(BAMUL) A brief progress report English 2016 PDF
KT-02 Bangalore Cooperative Milk Union(BAMUL) Data submission for JICA study English 2017 PDF
KT-03 Bangalore Cooperative Milk Union(BAMUL) Documents for study JICA English 2017 PDF
KT-04 Bangalore Cooperative Milk Union(BAMUL) List of machineries English 2018 PDF
KT-05 Bangalore Cooperative Milk Union(BAMUL) Presentation English 2017 PDF
KT-06 DCS Bedwa General information English 2017 PDF
KT-07 DCS Devanahalli General information English 2017 PDF
KT-08 DCS Ghatboral Financial information English 2017 PDF
KT-09 DCS Ghatboral General information English 2017 PDF
KT-10 DCS Jalige General information English 2017 PDF
KT-11 DCS Mujkuva General information English 2017 PDF
KT-12 DCS Sandesar General information English 2017 PDF
KT-13 DCS Sarsa General information English 2017 PDF
KT-14 Food Safety Commissioner, Karnataka (FSC) DART, Detect Adulteration with Rapid Test English 2017 PDF
KT-15 Food Safety Commissioner, Karnataka (FSC) Organogram English 2016 PDF
KT-16 Food Safety Commissioner, Karnataka (FSC) The Pink Book, Your Guide for Safe and Nutritious Food at Home English 2017 PDF
KT-17Government of Karnataka, Department of Animal Husbandry and Veterinary Services(GKDAHVS)
Annual Administration Report 2016-17 English 2017 PDF
KT-18Government of Karnataka, Department of Animal Husbandry and Veterinary Services(GKDAHVS) Report on 19th Livestock Census 2012 English 2012 PDF
KT-19Government of Karnataka, Department of Animal Husbandry and Veterinary Services(GKDAHVS)
Report on Integrated Sample Survey for Estimation of Production of Milk, Egg, Wool andMeat for the year 2015-16
English 2016 PDF
KT-20 Ghatboral Milk Producers' Cooperative Society (GMPCS) General information English 2017 PDF
KT-21 Gulburga Milk Producers Societie’s Union (GMPSU) Answers for questioners English 2017 PDF
KT-22 Gulburga Milk Producers Societie’s Union (GMPSU) Financial information English 2018 PDF
KT-23 Gulburga Milk Producers Societie’s Union (GMPSU) Financial report 2016 English 2016 PDF
KT-24 Gulburga Milk Producers Societie’s Union (GMPSU) Presentation file English 2017 PPT
KT-25 Gokul Dairy Products (Gokul) General Information English 2017 PDF
KT-26 Gokul Dairy Products (Gokul) Other information English 2017 PDF
KT-27 Hangyo Ice Creams Pvt. Ltd (Hangyo) General informaiotn English NA PDF
KT-28 Heritage Ltd. Presentation English 2017 PDF
KT-29 Cleamline Dairy Products Limited (CDPL: Jersey) General information English 2017 PDF
KT-30 Karnataka Cooperative Milk Producers’ Federation (KMF) Annual Report 2016-2017 English 2017 PDF
KT-31 Karnataka Cooperative Milk Producers’ Federation (KMF) Financial Statement for 2016/17 Hindhi/English 2017 PDF
KT-32 Karnataka Cooperative Milk Producers’ Federation (KMF) Presentation English 2017 PPT
KT-33 Karnataka State Dairy Association (Srikrishna) General information English NA PDF
A-25
Madhya Pradesh stateS/N Issued by Name of document or data Language Year Type
MP-01 Bhopal Sahakari Dugdha Sangah Maryadit(Bhopal Cooperative Milk Union: BCMU) Annual Report 2017 Hindhi 2017 PDF
MP-02 Bhopal Sahakari Dugdha Sangah Maryadit(Bhopal Cooperative Milk Union: BCMU) Financial statement 2012 & 2015 English NA PDF
MP-03 Bhopal Sahakari Dugdha Sangah Maryadit(Bhopal Cooperative Milk Union: BCMU) General & Financial information English NA PDF
MP-04 Bhopal Sahakari Dugdha Sangah Maryadit(Bhopal Cooperative Milk Union: BCMU) List of machinery English 2017 PDF
MP-05 Bhopal Sahakari Dugdha Sangah Maryadit(Bhopal Cooperative Milk Union: BCMU) NDDB loan and investment English 2017 PDF
MP-06 Department of Animal Husbandry (DAH) in MP Annual Report 2016/17 Hindhi 2017 PDF
MP-07 Department of Animal Husbandry (DAH) in MP Breeding Policy 2006 English 2006 PDF
MP-08 Department of Animal Husbandry (DAH) in MP Livestock Development Policy 2011 English 2011 PDF
MP-09 Food Safety Commissioner, M.P (FSC) Number of registration to FSSAI English 2017 PDF
MP-10 Food Safety Commissioner, M.P (FSC) Number of staffs English 2017 PDF
MP-11 Indore Sahakari Dugdha Sangh Mryadit (Indore Milk Union: IMU) Annual report 2014-15 Hindhi 2015 PDF
MP-12 Indore Sahakari Dugdha Sangh Mryadit (Indore Milk Union: IMU) Annual report 2015-16 Hindhi 2016 PDF
MP-13 Indore Sahakari Dugdha Sangh Mryadit (Indore Milk Union: IMU) Annual report 2016-17 Hindhi 2017 PDF
MP-14 Indore Sahakari Dugdha Sangh Mryadit (Indore Milk Union: IMU) Answers for questioners English 2017 PDF
MP-15 Indore Sahakari Dugdha Sangh Mryadit (Indore Milk Union: IMU) Fiancial information Hindhi/English NA PDF
MP-16 Indore Sahakari Dugdha Sangh Mryadit (Indore Milk Union: IMU) Presentation file English 2017 PDF
MP-17 Jabalpur Milk Union (JMU) Answers for questioners English 2017 PDF
MP-18 Jabalpur Milk Union (JMU) Answers for questioners English 2017 PDF
MP-19 Jabalpur Milk Union (JMU) Answers for questioners2 English 2017 PDF
MP-20 Jabalpur Milk Union (JMU) Balance sheet 2013-14 English 2014 PDF
MP-21 Jabalpur Milk Union (JMU) Balance sheet 2014-15 English 2015 PDF
MP-22 Jabalpur Milk Union (JMU) Balance sheet 2015-16 English 2016 PDF
MP-23 Jabalpur Milk Union (JMU) Balance sheet 2016-17 English 2017 PDF
MP-24 Jabalpur Milk Union (JMU) Field operation and DCS information English 2017 Excel
MP-25 Jabalpur Milk Union (JMU) Organogram & HACCP English NA PDF
MP-26 Jabalpur Milk Union (JMU) Other information set English NA PDF
MP-27 Madhya Pradesh State Cooperative Diary Federation (MPCDF) Answers for questioners English 2017 PDF
MP-28 Madhya Pradesh State Cooperative Diary Federation (MPCDF) Presentation file English 2017 PDF
MP-29 Madhya Pradesh Poultry and Livestock Development Agency (MPPLDA) Annual report 2014-15 Hindhi 2015 PDF
A-26

Uttar Pradesh stateS/N Issued by Name of document or data Language Year Type
UP-01 Department of Animal Husbandry, Dairying and Fishery (DAHDF) Financial Statement of National Programme for Dairy Development English 2017 PDF
UP-02 Department of Animal Husbandry, Dairying and Fishery (DAHDF) State Action Plan of Animal Husbandry,U.P. English 2017 PDF
UP-03 DCS Amarpur (DCS) General Information English 2017 PDF
UP-04 DCS Natwara (DCS) General Information English 2017 PDF
UP-05 DCS Rahamatenagar (DCS) General Information Hindhi 2017 PDF
UP-06 Department of Dairy Development (DDD) )in UP An overview English NA PDF
UP-07 Department of Dairy Development (DDD) )in UP Answers for questioners English 2017 PDF
UP-08 Department of Dairy Development (DDD) )in UP UP Milk Act 1976 & Milk Rule 1976 English 1976 PDF
UP-09 Food Safety and Drug Administration (FSDA) in UP General Information English 2017 PDF
UP-10 Food Safety and Drug Administration (FSDA) in UP Regulation annex English 2017 PDF
UP-11 CP Milk and Food Products Pvt. Itd (Gyan) List of machineries English 2017 PDF
UP-12 Indian Institute of Management (IIM) Lucknow Strategy for revival of Milk Unions in UP English NA PDF
UP-13 Kanpur Milk Union (KMU) General & financial information English 2017 PDF
UP-14 Lucknow Milk Union (LMU) AI Report English 2017 Excel
UP-15 Lucknow Milk Union (LMU) Balance sheet 2014-2015 English 2015 PDF
UP-16 Lucknow Milk Union (LMU) Balance sheet 2015-2016 English 2016 PDF
UP-17 Lucknow Milk Union (LMU) Balance sheet 2016-2017 English 2017 PDF
UP-18 Lucknow Milk Union (LMU) General information English 2017 PDF
UP-19 Lucknow Milk Union (LMU) List of machineries English 2017 PDF
UP-20 Lucknow Milk Union (LMU) Milk Procurement English 2017 Excel
UP-21 Lucknow Milk Union (LMU) Milk Purchase rate English 2017 Excel
UP-22 Lucknow Milk Union (LMU) Presentation file English 2017 PDF
UP-23 Lucknow Milk Union (LMU) Quality Assurance System English NA PDF
UP-24 Meerut Milk Union (MMU) General & Financial information English NA PDF
UP-25 National Dairy Development Board (NDDB) Dairying in U.P A statistical Profile 2017 English 2017 PDF
UP-26 Predesh Cooperative Dairy Federation(PCDF) Answers for questioners English NA PDF
UP-27 Predesh Cooperative Dairy Federation(PCDF) Financial information set English NA PDF
UP-28 Predesh Cooperative Dairy Federation(PCDF) NPD I Monthly report achievement Sep 2017 English 2017 Excel
UP-29 Predesh Cooperative Dairy Federation(PCDF) New proposed capacities of dairy plant English 2017 PDF
UP-30 Predesh Cooperative Dairy Federation(PCDF) NPDD details English 2017 PDF
UP-31 Predesh Cooperative Dairy Federation(PCDF) Organogram English NA Excel
UP-32 Predesh Cooperative Dairy Federation(PCDF) Present processing capacity English 2017 PDF
UP-33 Predesh Cooperative Dairy Federation(PCDF) Presentation file English 2017 PPT
UP-34 Predesh Cooperative Dairy Federation(PCDF) Price list English 2017 Excel
UP-35 Predesh Cooperative Dairy Federation(PCDF) Profit & Loss statement English 2017 Excel
UP-36 Predesh Cooperative Dairy Federation(PCDF) RKVY English 2017 PDF
UP-37 Predesh Cooperative Dairy Federation(PCDF) Sales report English 2017 Excel
UP-38 Predesh Cooperative Dairy Federation(PCDF) Summary English 2017 Word
A-27

UP-39 Predesh Cooperative Dairy Federation(PCDF) Working capital requirement English 2017 Excel
UP-40 Saahaj Milk Producer Company (SMPC) Annual Report 2016-2017 English 2017 PDF
UP-41 Saahaj Milk Producer Company (SMPC) Presentation English 2017 PDF
UP-42 State Planning Institute (SPI) Statistical Diary Utter Pradesh 2016 English 2016 PDF
UP-43 Uttar Pradesh Livestock Development Board (UPLDB) Presentation English 2017 PPT
UP-44 Varanasi Milk Union (VMU) General & Financial information (1) English NA PDF
UP-45 Varanasi Milk Union (VMU) General & Financial information (2) English NA PDF
UP-46 Varanasi Milk Union (VMU) General & Financial information (3) English NA PDF
UP-47 Varanasi Milk Union (VMU) Offer for new plant English 2015 PDF
A-28
OthersS/N Issued by Name of document or data Language Year Type
OT-01 Gopaljee Dairy Foods Ptv. Ltd. (Ananda) Company Profile English NA PDF
OT-02 Food and Agriculture Organization of the United Nations (FAO) State of Food and Agriculture English 2009 PDF
OT-03 Indian Dairy Association (IDA) General Information English NA PDF
OT-04 Indian Dairy Association (IDA) Presentation file English 2017 PDF
OT-05 International Dairy Federation (IDF) The World Dairy Situation sample English 2016 PDF
OT-06 IFCN Dairy Research Network MD (IFCN) Event summery English 2017 PDF
OT-07 IFCN Dairy Research Network MD (IFCN) Presentation English 2017 PDF
OT-08 International Market Analysis Research & Consulting (IMARC) Dairy Industry in India 2017 Edition English 2017 PDF
OT-09 Indian Society of Agricultural Economics (ISAE) Shift from crop-mixed traditional dairying to market oriented English 2010 PDF
OT-10 Japan International Cooperation Agency (JICA) Presentation to DAH by JICA Obihiro English NA PPT
OT-11 Maekawa India (MYCOM) Booklet English NA PDF
OT-12 Param Dairy Limited (Param) General Information English NA PDF
OT-13 VRS Foods Ltd. (Paras) Company Profile English NA PPT
A-29
Others (Japanese)S/N Issued by Name of document or data Language Year Type
JP-01 オリオン機械株式会社 (ORION) 酪農冷却・飼養・環境機器 日本語 2017 PDF
JP-02 中央酪農会議 (JDC) 日本の酪農 日本語 NA PDF
JP-03 日本酪農科学会(JDSA) 日本における乳質改善の経過 日本語 2007 PDF
JP-04 農林水産省生産局畜産部 (MAFF) 畜産・酪農をめぐる情勢 日本語 2017 PDF
JP-05 フォンテラジャパン (Fonterra) 内閣府向けプレゼン資料「フォンテラの取り組みと日本市場への期待」 日本語 2014 PDF
JP-06 早稲田大学出版部(秋吉 恵) 貧困と女性、二重の制約は克服できるか 日本語 2011 Hard copy
A-30
Annex 5: Basic information of milk unions
West Assam Milk Producers’ Cooperative Union Ltd.
Registered name West Assam Milk Producers’ Cooperative Union Ltd. (WAMUL)
Website http://www.purabi.org/index.php
Address R. K. Jyotiprasad Agarwalla Road, Juripar, Panjabari, Guwahati-781037 Assam
Phone +91-0361-2332705 E-mail [email protected] Year of establishment 1976 Brand name Purabi Number of staffs 130 Area of milk collection Nagaon, Morigaon, Goalpara, Nalbari and Kamrup districts Number of functional DCS/MPI 176 Number of BMC 5 Total number of members 4,659 Number of dairy plants 1 in Guwahati Plant capacity (Per day in little) 60,000 Dairy milk collection (in Kg) 26,150 Sales turnover (Rs.) 8,200 Lakh (2016-17) Other facility Cattle feed plant (Closed in 2014)
Products Standard milk, Smart milk, Ghee, Standard curd, Sweet curd, Lassi, Cream, Paneer
Milk procurement price (Rs. /kg) 34.28 Milk retail price (Standard milk, Rs.)
25 in Guwahati city & 27 outside the city
Certification of plant N/A (Under preparation) Supports for farmers AI & its awareness camps, Awards N/A
Remarks Managed by the National Dairy Development Board (NDDB) since 2008 State government share is 99%.
Graphs
A-31

Vaishal Patliputra Dugdh Utpadak Sahkari Sangh Ltd. (Patna Milk Union)
Registered name Vaishal Patliputra Dugdh Utpadak Sahkari Sangh Ltd. Website http://www.patnadairy.org
Address Phulwari Galmber, Khagaul Rd & Anisabad Road & Galmber AMS Road, Sadar Colony, Phulwari Sharif, Patna, Bihar 801505
Phone +91-0612-2251154, 2252542 E-mail [email protected] Year of establishment 1972 Brand name Sudha Number of staffs 310 Area of milk collection Patna, Vaishali, Nalanda, Saran & Shekhpura districts Number of functional DCS 2,549 Number of BMC 68 Total number of members 160,318 Number of dairy plants 2 (Patna & Hajipur) Plant capacity (Per day in little) Patna 2.5 LL/day, Hajipur 1LL/day Dairy milk collection (in Kg) 1040 Lakh (2016-17) Sales turnover (Rs.) 47,482 Lakh (2016-17) Other facility Cattle feed plant 150 MT/day, By Pass protein plant 20MT
Products Liquid milk, milk powder, butter, ghee, ice cream, peda, paneer and Plain/Misti Dahi, Lassi, Matha and kulfi.
Milk procurement price (Rs.) N/A Milk retail price (standard) N/A Certification of plant ISO22000, HACCP, Quality Mark (NDDB)
Supports for farmers
AI with Frozen Semen, Veterinary First Aid (VFA), Vaccination, supply of balanced feed, supply of fodder seeds, treatment of paddy straw/wheat with Urea, supply of Urea Molasses Block (UMB) etc.
Awards “Best Productivity Performance” 2007, “ Indira Gandhi Excellence Award” 2013, “Dairy Women of the year” 2016, “Glory of India Award” 2016, etc.
Remarks
The NDDB took over the management of the infrastructure during 1981-86. 590 no. of Women Cooperative Societies exclusively managed and run by rural women
A-32

Mithila Dugdh Utpadak Sahkari Sangh Ltd. (Mithila Milk Union)
Registered name Mithila Dugdh Utpadak Sahkari Sangh Ltd. (Mithila Milk Union)
Website http://mithiladairy.com/index.php
Address Samastipur Dairy, Industrial Area, P.O. - Harpur Alloth, Samastipur – 848101
Phone +91-06274-290172, 290680 E-mail [email protected] Year of establishment 1987 Brand name Sudha Number of staffs NA Area of milk collection Samastipur, Darbhanga & Madhubani districts Number of functional DCS 2,334 (221 Women’s) Number of BMC 69 Total number of members 173,662 Number of dairy plants 1 Plant capacity (Per day in little) 250,000 Dairy milk collection (in Kg) 354,380 Sales turnover (Rs.) 47,581 Lakh (2015-16)
Other facility
Powder plant (30MT/day), Chilling center (10KL/day in Tajpur, 20KL/day in Rosera), Packing station (50KL/day in Darbhanga), Mineral mixture plant (8MT/day), Seed processing plant (2MT/hour)
Products Liquid milk, Ghee, peda, kalakand, Paneer, Rasogulla, Gulabjamun, Butter, Lassi, Misti Dahi etc.
Milk procurement price (Rs.) NA Milk retail price (standard) NA Certification of plant ISO9001, HACCP
Supports for farmers Supply of balanced cattle feed & fodder seeds, by-pass protein feed, mineral mixtures, calcium, AI, veterinary health camps, first aid, vaccination, deworming, etc.
Awards Best dairy development, Rashtriya eka purashkar etc Remarks -
A-33

Kaira District Co-operative Milk Producers Union Ltd.
Registered name Kaira District Co-operative Milk Producers Union Ltd. Address Amul Dairy Road, Anand 388001, Gujarat Phone (02692)256124 E-mail [email protected] Year of establishment 1946 Brand name Amul Number of staffs NA
Area of milk collection Kaira District (Anand, Kheda & Mahisagar) Other states (West Bengal, Maharashtra & Punjab)
Number of functional DCS 1,713 (Gujarat: 1,225, West Bengal:226, Punjab:145, Maharashtra :117)
Number of BMC NA Total number of members 694,274
Number of dairy plants
Amul dairy in Anand, Amul dairy in Pune, Tribhuvandas food factory in Mogar, Amul Cheese plant in Khatraj, Amul dairy in Mumbai, Amul dairy in Virar, Amul dairy in Siliguri, Amul dairy in Sikkim, Amul dairy in Punjab-Baatala, Amul dairy in Waterloo, USA, etc
Plant capacity (Per day in little) 5,000,000 (total) Dairy milk collection (in Kg) 2,558,904 Sales turnover (Rs.) 5,700 crores (2016-17)
Other facility Amul Research and Development Association, Semen station in Ode, Cattle feed plants (1,200MTs/day in Kanjari & 2,000MTs/day in Kapdivav)
Products Liquid milk, Butter, Cheese, Infant milk food, Milk powder, Ghee, Cocoa products, Malted milk food, Extruded food, Table margarine, Sweets, Frozen food, Bakery, Therapeutic food, etc.
Milk procurement price NA Milk retail price (standard) NA Certification of plant ISO9001, ISO22000, FSSC22000, Halal
Supports for farmers AI, veterinary health camps, first aid, vaccination, deworming, balanced cattle feed & fodder seeds, by-pass protein feed, mineral mixtures, calcium, etc.
Awards National Productivity Council Productivity Awards (1985-99), National Energy Conservation Award 2009, etc.
Remarks 1st created dairy cooperative in India
A-34

Ghandinagar District Cooperate Milk Producers’ Union
Registered name Ghandinagar District Cooperative Milk Producers’ Union Ltd. (Madhur Dairy)
Website NA Address K-Road, G.I.D.C., Sector-25, Gandhinagar-382 023 Phone +91-79-23284 E-mail [email protected] Year of establishment 1971 Brand name Amul, Madhur Number of staffs 700 Area of milk collection Ghandinagar Tehsi Number of functional DCS 116 Number of BMC 10 Total number of members 42,635 Number of dairy plants 1 Plant capacity (Per day in little) 300,000 Dairy milk collection (Ave. in Kg) 171,574 Sales turnover (Rs.) 335 Crore
Other facility Collection Center (in Rajasthan), Cattel Feed plant, Seeds, Testing,
Products Milk powder, Milk Pouches, Ice cream, Ghee, Paneer, Cheese, Sweets etc.
Milk procurement price NA Milk retail price (standard) NA Certification of plant ISO9001
Supports for farmers Seedlings of green grass, Insurance, Education support, Subsidy, Technical supports, Breeding,
Awards NA Remarks -
A-35
Banaskantha District Cooperate Milk Producers’ Union
Registered name Banaskantha District Co-operative Milk Producers’ Union Ltd.
(Banas Dairy) Website http://banasdairy.coop/home.html Address Banas Dairy, P.O. Box No 20, Palanpur- 385001 Phone +91-2742-253881 E-mail [email protected] Year of establishment 1969 Brand name AMUL, SAGAR and BANAS Number of staffs 2,200 Area of milk collection Banaskantha and Rajasthan districts Number of functional DCS 1,290 Number of BMC 1,168 Total number of members 345,862
Number of dairy plants 6 (Banas1:7LLPD, Banas2:24LLPD, Banas3:18LLPD, Faridabad, Lucknow, Kanpur)
Plant capacity (Per day in little) 50 Lac
Dairy milk collection (in Kg) 37.22 Lac (Banaskantha and Rajasthan) 3.15 Lac (UP and NCR)
Sales turnover (Rs.) 6,112 Crore
Other facility 4 Chilling centers, Paneer plant (10MT), Whey powder plant (3LL), UHT plant (10LLPD), Cattle feed plants (Katarva: 1KMTPD, Palanpur: 600MTPD)
Products Milk powder, UHT tetra pack milk, Milk Pouches, Butter milk, Ice cream, Ghee, Paneer, Cheese, Amul Kool, Lassi, Masti Dahi, Curd etc.
Milk procurement price (Rs.) Rs.668/Kg Fat Milk retail price (standard) NA Certification of plant ISO9001, ISO22000, ISO14001
Supports for farmers
Insurance, Educational Assistance, Toilet Construction, National Pension, Animal Health Services, Animal Breeding Services, Animal Husbandry and Animal Breeding Schemes for ST, Cattle Manger Assistant, Chaff Cutter Assistance, Cooling System Assistance, Milking Machine Assistance
Awards NA Remarks One of the biggest plant in Asia. Collecting milk from other states
A-36

Bangalore Urban, Rural & Ramanagara Districts Co-Operative Milk Producers Societies Union Ltd.
Registered name Bangalore Urban, Rural & Ramanagara Districts Co-Operative Milk Producers Societies Union Ltd., (BAMUL)
Website http://bamulnandini.coop
Address Bannerghatta Main Rd, Lakkasandra, Dairy Colony, Adugodi, Bengaluru, Karnataka 560030
Phone +91 80 2609 6200 E-mail [email protected] Year of establishment 1975 Brand name Nandini Number of staffs 759 Area of milk collection Bangalore urban, Bangalore rural, Ramanagara districts Number of functional DCS 2,124 Number of BMC 196 Total number of members 356,473 Number of dairy plants 2 (Bangalore & Hosakote) Plant capacity (Per day in little) Bangalore: 10L & Hosakote 2L, (+New plant: 6L in 2018) Dairy milk collection (Ave. in Kg) 1,532,000 Sales turnover (Rs.) 1,791Lakh
Other facility Chilling center (Byrapatna, Doddaballapura, Anekal, Solur, Vijayapura, Kanakapura)
Products Liquid milk, Butter, Ghee, Peda, Flavored Milk, Spiced Butter Milk, Paneer, Set Curds etc.
Milk procurement price 26/㎏(3.5%fat/8.5%SNF) Milk retail price 38/kg (HCM: 3.5%fat/8.5%SNF) Certification of plant ISO22000, ISO9001, HACCP, AGMARK
Supports for farmers Technical Input Services, Animal Health, Breeding Activities, Cattle Feed & Fodder, Cattle Insurance, Training Programs
Awards "Best Productivity Award" (NPC), 1st place in best Safety Industrial Boiler award for Boiler Maintenance in the year 2007, etc.
Remarks Started with UNICEF fund. Biggest in South India and fully computerized dairy with highest procurement and sale in Karnataka, and highest seller of curds in the country.
A-37

Kalaburagi-Bidar & Yadgir Co-Operative Milk Producers Societies Uion Ltd.
Registered name Kalaburagi-Bidar & Yadgir Co-Operative Milk Producers Societies Uion Ltd. (GUMUL)
Website http://www.gumul.org Address Humnabad Road, Gulbarga, Karnataka - 585 104 Phone +91-08472-257475/ 258193/ 258088/ 259789/ 257675 E-mail [email protected] Year of establishment 1985 Brand name Nandini Number of staffs 218 Area of milk collection Kalaburagi, Bidar & Yadgir districts Number of functional DCS 390 Number of BMC 22 Total number of members 80,108 Number of dairy plants 2 Plant capacity (Per day in little) Kalaburagi: 60,000L/day & Bidar: 30,000L/day Dairy milk collection (Ave. in Kg) 51,032 Sales turnover (Rs.) 941 Lakh (2016-17)
Other facility Chilling centres at Hulsoor (5TLPD), Thana Kushnur (5TLPD) and Mallabad (3TLPD)
Products Liquid milk, Ghee, Curd, Peda, Buttermilk, Lassi, and Paneer Milk procurement price NA Milk retail price (standard) 38/kg (HCM: 3.5%fat/8.5%SNF) Certification of plant ISO22000
Supports for farmers
Rearing milch animals and calves, providing subsidized technical inputs, balanced cattle feed to animals, fodder cultivation, organizing calf rallies & dairy related extension activities like on & off campus training programs, field visits, demonstrations, campaigns etc.
Awards NA
Remarks Union with resplendent of Self-Help Groups and women societies with four Women Directors on the Union's Board for the first time in the State
A-38
Bhopal Sahakari Dugdh Sangh Maryadit (Bhopal Milk Union)
Registered name Bhopal Sahakari Dugdh Sangh Maryadit (Bhopal Milk Union) Website http://mpcdf.nic.in (MPCDF)
Address Dairy Plot, Habibganj, Kasturba Nagar, Kasturba Nagar, Bhopal, Madhya Pradesh 462024
Phone +91 755 406 6011 E-mail NA Year of establishment 1977 Brand name Sanchi Number of staffs NA
Area of milk collection Bhopal, Sehore, Raisen, Rajgarh, Hoshangabad, Betul, Harda, Shajapur, Guna, Ashok Nagar, Sgar, Damoh, Chatarpur districts
Number of functional DCS 2,933 Number of BMC 211 Total number of members 112,998 Number of dairy plants 1 + 2 (small scale) Plant capacity (Per day in little) 300,000 + 2 (20,000) Dairy milk collection (Ave. in Kg) 376,000 Sales turnover (Rs.) 72,927 Lakh
Other facility Butter plant (5MTPD), Ghee plant (5MTPD), 26 Chilling centers, Cattle feed plant (250MT/day)
Products Liquid milk, Ghee, Butter, SMP, Paneer, Curd, Kheer, Peda, Mawa, Flavored milk, Butter milk, Lassi
Milk procurement price 24.96 (on 11.11.2017, Fat3.5%&SNF8.5%) Milk retail price (standard) NA Certification of plant ISO22000, ISO14001, ISO9001, AGMARK(Ghee)
Supports for farmers AI, Feeding practices, Animal health care and management, training on cooperative principles, Women Development Cooperative Leadership Program
Awards NA Remarks -
A-39

Indore Sahakari Dugdh Sangh Maryadit (Indore Milk Union)
Registered name Indore Sahakari Dugdh Sangh Maryadit (Indore Milk Union) Website http://mpcdf.nic.in (MPCDF)
Address Chanda Talawali, Manglia, Mangliya, Indore, Madhya Pradesh 453771
Phone +91 731 280 2554 E-mail NA Year of establishment 1982 Brand name Sanchi Number of staffs NA
Area of milk collection Indore, Dhar, Khargone, Badwani, Jhabua, Burhanpur, Khandwa, Dewas, Ujjain districts
Number of functional DCS 1,531 Number of BMC 85 Total number of members 75,000 Number of dairy plants 4
Plant capacity (Per day in little) Burhanpur (10,000LPD), Barwani (10,000LPD), Khargone (20,000LPD), Jhabua (10,000LPD)
Dairy milk collection (Ave. in Kg) 260,000 Sales turnover (Rs.) 53,776 Lakh
Other facility 11 Chilling centers, SMP plant (15MTPD), Cattle feed plant (150MTPD)
Products
Flavoured Milk, Butter Milk, Lassi, Shrikhand, Paneer, Plain Curd, Probiotic Curd, Chhaina Rabri, Cream, Mawa, Peda, Rasgulla, Gulabjamun, Ghee, SMP, Sweet SMP, WMP, Table Butter, White Butter
Milk procurement price NA Milk retail price (standard) NA Certification of plant ISO22000, ISO14000, ISO9001, HACCP Supports for farmers AI, Cattle feed, First aid, Awards NA Remarks -
A-40
Jabalpur Sahakari Dugdha Sangh Maryadit, Jabalpur (Jabalpur Milk Union)
Registered name Jabalpur Sahakari Dugdha Sangh Maryadit, Jabalpur Website http://mpcdf.nic.in (MPCDF)
Address Opposite Jabalpur Hospital, Napier Town, Jabalpur, Madhya Pradesh 482002
Phone +91 99818 10444 E-mail [email protected] Year of establishment 1980 Brand name Sanchi Number of staffs 96
Area of milk collection Jabalpur, Ktni, Satna, Rewa, Sidhi, Singroll, Shahdol, Anuppur, Umaria, Dindori, Mandla, Balaghat, Seoni, Narsinghpur, Chhindwara districts
Number of functional DCS 851 Number of BMC 22 Total number of members 27,845 Number of dairy plants 3 Plant capacity (Per day in little) Jabalpur (1LLPD), Rewa (0.1LLPD), Shadol (0.1LLPD) Dairy milk collection (Ave. in Kg) 41,296 or 70,000 Sales turnover (Rs.) 11,308 Lakh (2015-16)
Other facility 2 Chilling centers (Narsinghpur & Seone), Cattle feed plant (50MTPD), Training center
Products Liquid milk, Ghee, Paneer, Flavoured milk, Shree khand, Matta, Sweet sip, Khowa, Peda, Curd, Cream, Lassi, Chaina Kheer
Milk procurement price 24 (Rs. 200/kg T.S.) Milk retail price (standard) NA Certification of plant ISO22000
Supports for farmers AI, Cattle feed & mineral mixture in low price, training, fodder seeds, bonus etc.
Awards NA Remarks Plants for SMP & Paneer are under planning.
A-41

Lucknow Producer's Cooperative Milk Union Ltd.
Registered name Lucknow Producer's Cooperative Milk Union Ltd. Website www.paragmilkup.in (PCDF) Address 29, Park Road, Lucknow-226001 Phone +91-522-2207196 E-mail [email protected] [email protected] Year of establishment 1938 Brand name Parag Number of staffs 191
Area of milk collection Sitapur, Lakhimpur Kheeri, Hardoi, Raibareily, and Unnao districts
Number of functional DCS 961 Number of BMC 118 Total number of members 37,101 (society members) Number of dairy plants 1 Plant capacity (Per day in little) 170,000 Dairy milk collection (Ave. in little) 68,654 Sales turnover (Rs.) 16,400 Lakh Other facility 2 Chilling centers, Fodder seed plant
Products
Milk, Ghee, Table Butter, Curd, Flavored Milk, Rice Kheer, Chenna Kheer, Butter Milk, Milk Cake, Peda, Mattha, Gulab Jamun, Rasgulla, Kalakand, Chhach, Paneer, Toned Milk, Laddo
Milk procurement price NA Milk retail price (standard) Parag TAZA 1,000 ML: 39Rs. For agent, 41Rs. For consumers Certification of plant ISO22000, ISO9001, HACCP
Supports for farmers
AI, Deworming, Mastitis Control and Tick Control, Vaccination, Mini Kit and Fodder Seeds, Cattle Feed (Isi, Bypass, High Energy). Infertility and Emergency Veterinary Services. Capacity Building on Management by training, Exposure Visits in and outside the State. Regular Bonus Distribution.
Awards NA
Remarks First cooperative dairy established in India. New plant (300,000LPD) is under construction.
A-42
Kanpur Dugdh Utpadak Sahkari Sangh Ltd.
Registered name Kanpur Dugdh Utpadak Sahkari Sangh Ltd. (Kanpur Milk Union)
Website www.paragmilkup.in (PCDF)
Address 127/25/W-1, Barra Bypass Rd Opposite Parag Nagar, Barra Bypass Rd, Opposite Parag Nagar, Juhi Kalan, Juhi, Kanpur, Uttar Pradesh, 208014
Phone +91 84453 69240 E-mail NA Year of establishment 1962 Brand name Parag Number of staffs 45 Area of milk collection Kanpur, Farrukhabad, Etawah, Kannauj districts Number of functional DCS 41 Number of BMC 4 (only 6 in operation) Total number of members 10,732 (registered) Number of dairy plants 1 (Closed) Plant capacity (Per day in little) (150,000) Dairy milk collection (Ave. in little) 2,188 (2016-17) Sales turnover (Rs.) 2,665 Lakh Other facility (4 Chilling centers) Products Raw milk Milk procurement price Rs.35 (Fat 6.5% & SNF9%) Milk retail price (standard) Toned milk 1,000ml: 40Rs. For agent, 42Rs for consumers Certification of plant ISO22000, HACCP (not renewed) Supports for farmers NA Awards NA
Remarks Closed in 1981-1983 & from 2016. Only BMC operation at plant. New plants (4 lakh/ 20MT SMP) are under construction.
A-43
Varanasi Dugdh Utpadak Sahakari Sangh Ltd.
Registered name Varanasi Dugdh Utpadak Sahakari Sangh Ltd. (Varanasi Milk Union)
Website www.paragmilkup.in (PCDF)
Address Ram Nagar Industrial Area, Ram nagar Patana, Uttar Pradesh 231305
Phone +91-5412-269327 E-mail dussvns@[email protected] Year of establishment 1947 Brand name Parag Number of staffs 48 Area of milk collection Varanasi, Ghazipur, Jaunpur, Chandauli districts Number of functional DCS 369 Number of BMC 22 (9 is operating) Total number of members 14,923 Number of dairy plants 3 Plant capacity (Per day in little) Varanasi (70,000), Ghazipur (2,000), Jaunpur (2,000) Dairy milk collection (Ave. in little) 6,849 Sales turnover (Rs.) 3,331 Lakh (2015-16) Other facility 2 Chilling centers in Ghazipur & Jaunpur Products Liquid milk, Ghee, Butter Milk procurement price NA Milk retail price (standard) NA Certification of plant ISO22000 & ISO9001 (Not renewed) Supports for farmers Medical Care Awards NA Remarks New plant (400,000LPD) is under construction.
A-44

Meruut Dugdh Utpadak Sahakari Sangh Ltd.
Registered name Meruut Dugdh Utpadak Sahakari Sangh Ltd. (Meerut Milk Union)
Website www.paragmilkup.in (PCDF) Address C/o Gangol Sahkari Dudgh Utpadak Sangh,Partapur, Meerut Phone +91-0121-3262231, 7388889692 E-mail [email protected] Year of establishment 1986 Brand name Parag, Mother Dairy Number of staffs NA Area of milk collection Meerut, Ghaziabad, Noida, Bulandshahar, Baghpat districts Number of functional DCS 692 Number of BMC 17 (8 in operation) Total number of members NA Number of dairy plants 2 Plant capacity (Per day in little) Meerut (400,000), Noida (400,000) Dairy milk collection (Ave. in Kg) 840,000 Sales turnover (Rs.) 23,665 Lakh (2015-16)
Other facility SMP plant in Meerut (300,000), 2 Chilling Centers in Noida & Bulandshahar
Products Ghee, Curd, Butter milk, Lassi,SMP, Lassi, curd, Flavoured milk, TB, Peda
Milk procurement price NA Milk retail price (standard) NA Certification of plant ISO22000, HACCP Supports for farmers NA Awards NA Remarks New plant (400,000LPD) is under construction.
A-45
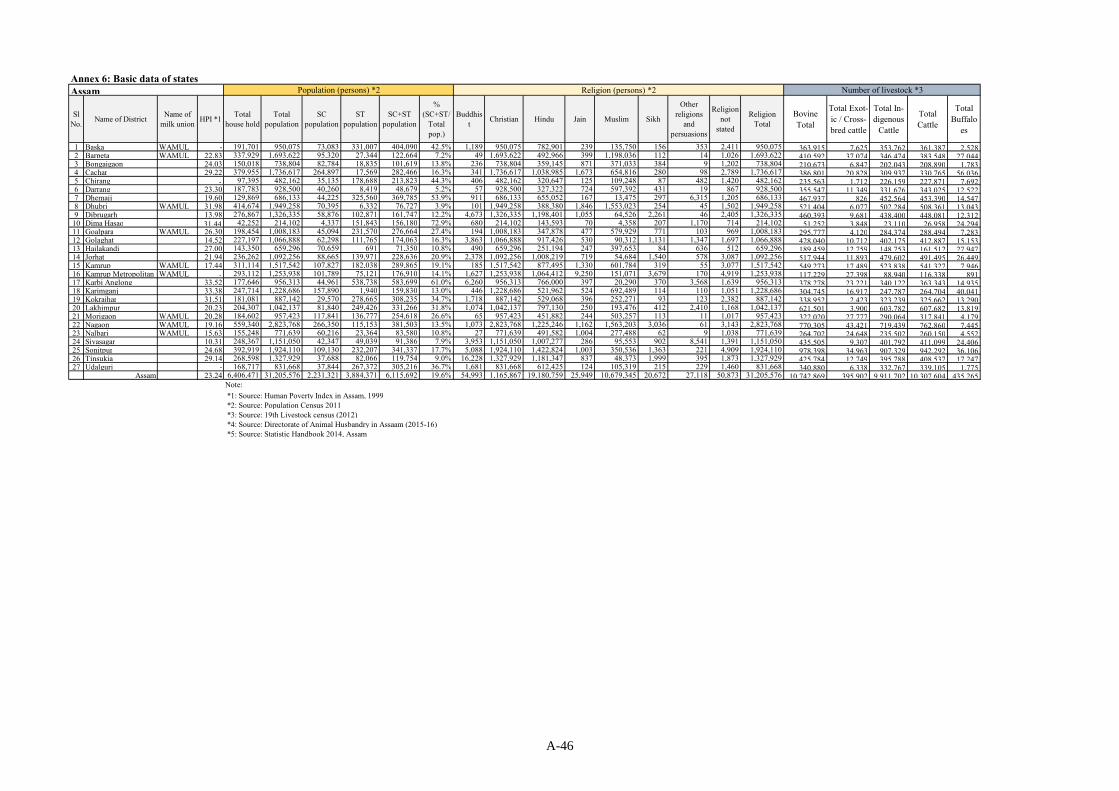
Annex 6: Basic data of states Assam
SlNo.
Name of DistrictName of
milk unionHPI *1
Totalhouse hold
Totalpopulation
SCpopulation
STpopulation
SC+STpopulation
%(SC+ST/
Totalpop.)
Buddhist
Christian Hindu Jain Muslim Sikh
Otherreligions
andpersuasions
Religionnot
stated
ReligionTotal
BovineTotal
Total Exot-ic / Cross-bred cattle
Total In-digenous
Cattle
TotalCattle
TotalBuffalo
es
1 Baska WAMUL - 191,701 950,075 73,083 331,007 404,090 42.5% 1,189 950,075 782,901 239 135,750 156 353 2,411 950,075 363,915 7,625 353,762 361,387 2,5282 Barpeta WAMUL 22.83 337,929 1,693,622 95,320 27,344 122,664 7.2% 49 1,693,622 492,966 399 1,198,036 112 14 1,026 1,693,622 410,592 37,074 346,474 383,548 27,0443 Bongaigaon 24.03 150,018 738,804 82,784 18,835 101,619 13.8% 236 738,804 359,145 871 371,033 384 9 1,202 738,804 210,673 6,847 202,043 208,890 1,7834 Cachar 29.22 379,955 1,736,617 264,897 17,569 282,466 16.3% 341 1,736,617 1,038,985 1,673 654,816 280 98 2,789 1,736,617 386,801 20,828 309,937 330,765 56,0365 Chirang - 97,395 482,162 35,135 178,688 213,823 44.3% 406 482,162 320,647 125 109,248 87 482 1,420 482,162 235,563 1,712 226,159 227,871 7,6926 Darrang 23.30 187,783 928,500 40,260 8,419 48,679 5.2% 57 928,500 327,322 724 597,392 431 19 867 928,500 355,547 11,349 331,676 343,025 12,5227 Dhemaji 19.60 129,869 686,133 44,225 325,560 369,785 53.9% 911 686,133 655,052 167 13,475 297 6,315 1,205 686,133 467,937 826 452,564 453,390 14,5478 Dhubri WAMUL 31.98 414,674 1,949,258 70,395 6,332 76,727 3.9% 101 1,949,258 388,380 1,846 1,553,023 254 45 1,502 1,949,258 521,404 6,077 502,284 508,361 13,0439 Dibrugarh 13.98 276,867 1,326,335 58,876 102,871 161,747 12.2% 4,673 1,326,335 1,198,401 1,055 64,526 2,261 46 2,405 1,326,335 460,393 9,681 438,400 448,081 12,312
10 Dima Hasao 31.44 42,252 214,102 4,337 151,843 156,180 72.9% 680 214,102 143,593 70 4,358 207 1,170 714 214,102 51,252 3,848 23,110 26,958 24,29411 Goalpara WAMUL 26.30 198,454 1,008,183 45,094 231,570 276,664 27.4% 194 1,008,183 347,878 477 579,929 771 103 969 1,008,183 295,777 4,120 284,374 288,494 7,28312 Golaghat 14.52 227,197 1,066,888 62,298 111,765 174,063 16.3% 3,863 1,066,888 917,426 530 90,312 1,131 1,347 1,697 1,066,888 428,040 10,712 402,175 412,887 15,15313 Hailakandi 27.00 143,350 659,296 70,659 691 71,350 10.8% 490 659,296 251,194 247 397,653 84 636 512 659,296 189,459 12,759 148,753 161,512 27,94714 Jorhat 21.94 236,262 1,092,256 88,665 139,971 228,636 20.9% 2,378 1,092,256 1,008,219 719 54,684 1,540 578 3,087 1,092,256 517,944 11,893 479,602 491,495 26,44915 Kamrup WAMUL 17.44 311,114 1,517,542 107,827 182,038 289,865 19.1% 185 1,517,542 877,495 1,330 601,784 319 55 3,077 1,517,542 549,273 17,489 523,838 541,327 7,94616 Kamrup Metropolitan WAMUL - 293,112 1,253,938 101,789 75,121 176,910 14.1% 1,627 1,253,938 1,064,412 9,250 151,071 3,679 170 4,919 1,253,938 117,229 27,398 88,940 116,338 89117 Karbi Anglong 33.52 177,646 956,313 44,961 538,738 583,699 61.0% 6,260 956,313 766,000 397 20,290 370 3,568 1,639 956,313 378,278 23,221 340,122 363,343 14,93518 Karimganj 33.38 247,714 1,228,686 157,890 1,940 159,830 13.0% 446 1,228,686 521,962 524 692,489 114 110 1,051 1,228,686 304,745 16,917 247,787 264,704 40,04119 Kokrajhar 31.51 181,081 887,142 29,570 278,665 308,235 34.7% 1,718 887,142 529,068 396 252,271 93 123 2,382 887,142 338,952 2,423 323,239 325,662 13,29020 Lakhimpur 20.23 204,307 1,042,137 81,840 249,426 331,266 31.8% 1,074 1,042,137 797,130 250 193,476 412 2,410 1,168 1,042,137 621,501 3,900 603,782 607,682 13,81921 Morigaon WAMUL 20.28 184,602 957,423 117,841 136,777 254,618 26.6% 65 957,423 451,882 244 503,257 113 11 1,017 957,423 322,020 27,777 290,064 317,841 4,17922 Nagaon WAMUL 19.16 559,340 2,823,768 266,350 115,153 381,503 13.5% 1,073 2,823,768 1,225,246 1,162 1,563,203 3,036 61 3,143 2,823,768 770,305 43,421 719,439 762,860 7,44523 Nalbari WAMUL 15.63 155,248 771,639 60,216 23,364 83,580 10.8% 27 771,639 491,582 1,004 277,488 62 9 1,038 771,639 264,702 24,648 235,502 260,150 4,55224 Sivasagar 10.31 248,367 1,151,050 42,347 49,039 91,386 7.9% 3,953 1,151,050 1,007,277 286 95,553 902 8,541 1,391 1,151,050 435,505 9,307 401,792 411,099 24,40625 Sonitpur 24.68 392,919 1,924,110 109,130 232,207 341,337 17.7% 5,088 1,924,110 1,422,824 1,003 350,536 1,363 221 4,909 1,924,110 978,398 34,963 907,329 942,292 36,10626 Tinsukia 29.14 268,598 1,327,929 37,688 82,066 119,754 9.0% 16,228 1,327,929 1,181,347 837 48,373 1,999 395 1,873 1,327,929 425,784 12,749 395,788 408,537 17,24727 Udalguri - 168,717 831,668 37,844 267,372 305,216 36.7% 1,681 831,668 612,425 124 105,319 215 229 1,460 831,668 340,880 6,338 332,767 339,105 1,775
Assam 23.24 6,406,471 31,205,576 2,231,321 3,884,371 6,115,692 19.6% 54,993 1,165,867 19,180,759 25,949 10,679,345 20,672 27,118 50,873 31,205,576 10,742,869 395,902 9,911,702 10,307,604 435,265Note:
*1: Source: Human Poverty Index in Assam, 1999 *2: Source: Population Census 2011 *3: Source: 19th Livestock census (2012) *4: Source: Directorate of Animal Husbandry in Assaam (2015-16) *5: Source: Statistic Handbook 2014, Assam
Population (persons) *2 Religion (persons) *2 Number of livestock *3
A-46

Annex 6: Basic data of states Assam
SlNo.
Name of DistrictName of
milk union
1 Baska WAMUL2 Barpeta WAMUL3 Bongaigaon4 Cachar5 Chirang6 Darrang7 Dhemaji8 Dhubri WAMUL9 Dibrugarh
10 Dima Hasao11 Goalpara WAMUL12 Golaghat13 Hailakandi14 Jorhat15 Kamrup WAMUL16 Kamrup Metropolitan WAMUL17 Karbi Anglong18 Karimganj19 Kokrajhar20 Lakhimpur21 Morigaon WAMUL22 Nagaon WAMUL23 Nalbari WAMUL24 Sivasagar25 Sonitpur26 Tinsukia27 Udalguri
Assam
Area of irrigation (ha)
CrossbredCow
Local Cow Total Cow BuffaloTotal
(Cow+Buf)Kharif
Rabi &Pre-
KharifTotal
MinorIrrigation
Major/MediumIrrigatio
n
Total
ThroughASMIDC
(STW/LLP)
GrandTotal
Geographical Area
Forest
Notavailable
forCultivatio
n
Otheruncultivated
landexcluding
fallow land
Fallowland
CroppedArea
7,165,959 39,576,122 46,742,081 440,459 47,182,540 12,485 1,114 13,599 18,734 28,235 46,969 46,969 208,608 99,519 32,826 10,175 3 133,83155,088,943 15,042,401 70,131,344 7,932,386 78,063,730 1,837 174 2,011 15,723 30,741 46,464 9,186 55,650 225,069 572 41,944 17,937 5,305 254,698
7,437,294 12,876,535 20,313,829 888,395 21,202,224 351 216 567 8,207 - 8,207 2,502 10,709 151,999 44 64,715 10,384 9,221 105,42123,089,825 37,574,704 60,664,529 17,839,313 78,503,842 1,130 1,766 2,896 11,761 - 11,761 - 11,761 377,610 138,409 89,148 21,745 12,922 163,057
2,184,308 7,547,316 9,731,624 1,595,655 11,327,279 5,646 1,376 7,022 14,182 - 14,182 14,182 136,926 71,978 14,961 3,099 121 88,7227,554,780 18,454,011 26,008,791 4,459,770 30,468,561 4,333 1,340 5,673 10,591 - 10,591 9,465 20,056 180,707 276 43,182 15,653 17,763 145,558
573,296 41,166,332 41,739,628 4,271,891 46,011,519 415 - 415 7,546 - 7,546 3,417 10,963 323,700 59,355 136,963 50,994 8,882 121,2278,983,837 27,380,252 36,364,089 3,390,901 39,754,990 44 263 307 17,434 - 17,434 9,198 26,632 266,601 29,155 78,125 8,949 16,023 173,0549,409,431 42,474,108 51,883,539 2,775,619 54,659,158 2,290 120 2,410 13,198 4,153 17,351 9,489 26,840 338,782 23,341 142,488 30,179 3,276 166,1071,586,798 8,180,202 9,767,000 4,639,679 14,406,679 3,875 - 3,875 7,272 - 7,272 - 7,272 488,800 67,277 393,352 B B 54,2177,229,583 24,723,609 31,953,192 1,027,858 32,981,050 2,338 647 2,985 13,071 - 13,071 2,721 15,792 184,262 29,683 62,265 11,002 559 125,242
10,442,634 22,243,678 32,686,312 3,684,617 36,370,929 163 - 163 17,198 - 17,198 8,412 25,610 354,070 156,905 51,232 22,332 4,555 182,0137,655,729 7,546,120 15,201,849 4,148,896 19,350,745 925 805 1,730 5,689 - 5,689 - 5,689 132,587 62,420 14,392 4,923 558 77,280
16,854,135 35,591,501 52,445,636 8,957,657 61,403,293 784 394 1,178 12,421 - 12,421 8,418 20,839 285,100 21,904 110,567 20,116 12,273 174,280105,458,125 39,576,122 145,034,247 2,324,414 147,358,661 290 589 879 22,779 - 22,779 22,779 308,684 70,885 31,671 27,742 1,132 186,647
- - - - - 4,821 2,992 7,813 4,550 - 4,550 11,304 15,854 115,017 22,140 30,039 18,654 867 49,97422,114,268 42,391,854 64,506,122 2,729,262 67,235,384 32,179 5,658 37,837 59,112 9,637 68,749 - 68,749 1,033,400 319,294 587,707 B B 201,71811,001,718 25,624,039 36,625,757 9,540,022 46,165,779 1,305 65 1,370 5,478 - 5,478 - 5,478 180,900 55,995 38,518 10,280 72 104,129
3,304,855 18,311,051 21,615,906 1,862,635 23,478,541 6,578 90 6,668 18,121 15,092 33,213 3,411 36,624 312,900 161,195 43,458 19,448 2,243 172,6493,793,241 21,967,948 25,761,189 6,677,134 32,438,323 505 415 920 12,197 - 12,197 6,648 18,845 235,024 29,379 94,361 7,335 3,780 223,208
10,530,024 14,793,724 25,323,748 1,226,720 26,550,468 225 818 1,043 16,943 - 16,943 9,699 26,642 158,765 13,207 31,704 13,480 8,363 127,81162,910,524 55,193,575 118,104,099 3,289,014 121,393,113 29,549 4,225 33,774 18,383 85,842 104,225 15,336 119,561 411,030 88,024 64,540 18,457 4,383 299,32213,751,883 13,474,092 27,225,975 2,012,767 29,238,742 64 62 126 7,450 - 7,450 5,184 12,634 100,483 0 26,325 3,027 3,401 120,76512,771,118 29,084,044 41,855,162 4,034,477 45,889,639 322 21 343 16,240 - 16,240 8,838 25,078 260,290 30,465 56,151 29,211 7,641 149,85726,247,458 85,924,651 112,172,109 10,887,548 123,059,657 9,185 31 9,216 29,718 32,655 62,373 17,934 80,307 532,298 147,843 194,498 18,983 5,833 270,80910,444,617 33,832,765 44,277,382 5,784,732 50,062,114 698 17 715 6,585 - 6,585 8,043 14,628 379,000 131,595 114,883 24,932 2,876 143,524
4,758,487 10,171,476 14,929,963 259,047 15,189,010 27,830 3,373 31,203 49,570 56,258 105,828 105,828 167,393 22,400 30,430 14,502 112 158,903270,109,157 470,026,307 740,135,464 123,053,809 863,189,273 150,167 26,571 176,738 440,153 262,613 702,766 149,205 851,971 7,850,005 1,853,260 2,620,445 433,539 132,164 4,174,023
Irrigation potential created up to 31st March, 2014 Land use (ha)Volume of milk production (liters/year) *4
A-47
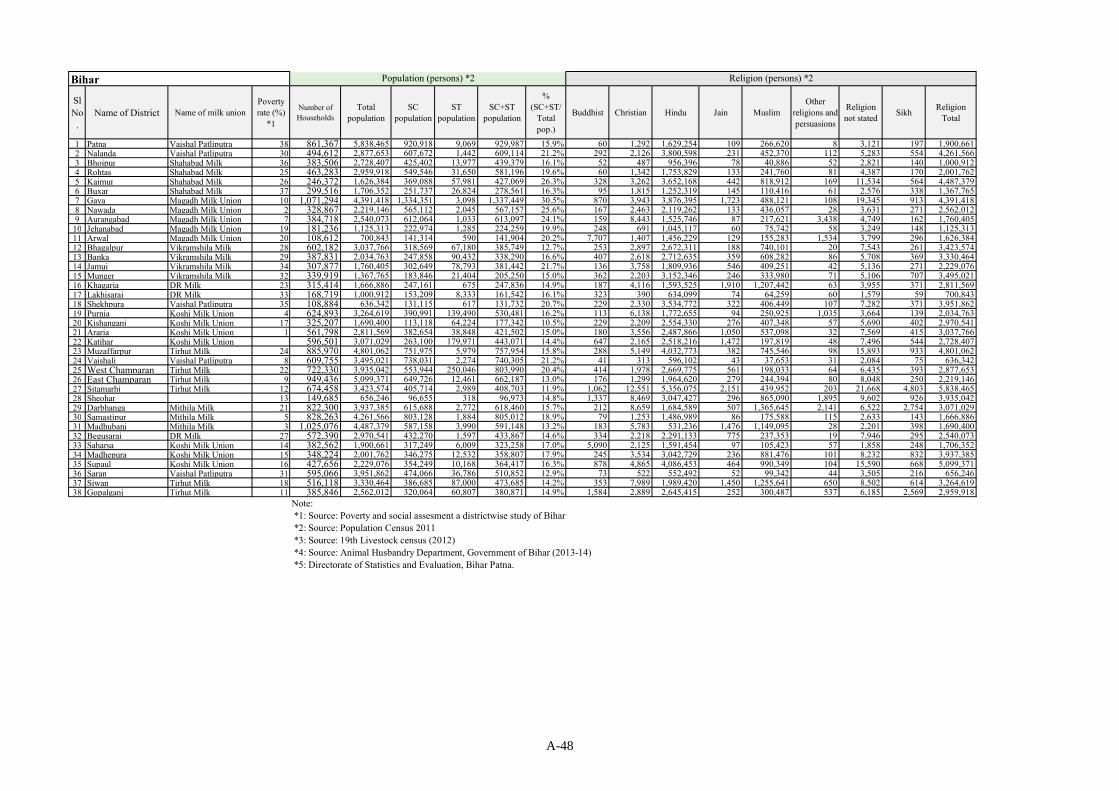
Bihar
SlNo.
Name of District Name of milk unionPovertyrate (%)
*1
Number ofHouseholds
Totalpopulation
SCpopulation
STpopulation
SC+STpopulation
%(SC+ST/
Totalpop.)
Buddhist Christian Hindu Jain MuslimOther
religions andpersuasions
Religionnot stated
SikhReligion
Total
1 Patna Vaishal Patliputra 38 861,367 5,838,465 920,918 9,069 929,987 15.9% 60 1,292 1,629,254 109 266,620 8 3,121 197 1,900,6612 Nalanda Vaishal Patliputra 30 494,612 2,877,653 607,672 1,442 609,114 21.2% 292 2,126 3,800,598 231 452,370 112 5,283 554 4,261,5663 Bhojpur Shahabad Milk 36 383,506 2,728,407 425,402 13,977 439,379 16.1% 52 487 956,396 78 40,886 52 2,821 140 1,000,9124 Rohtas Shahabad Milk 25 463,283 2,959,918 549,546 31,650 581,196 19.6% 60 1,342 1,753,829 133 241,760 81 4,387 170 2,001,7625 Kaimur Shahabad Milk 26 246,372 1,626,384 369,088 57,981 427,069 26.3% 328 3,262 3,652,168 442 818,912 169 11,534 564 4,487,3796 Buxar Shahabad Milk 37 299,516 1,706,352 251,737 26,824 278,561 16.3% 95 1,815 1,252,319 145 110,416 61 2,576 338 1,367,7657 Gaya Magadh Milk Union 10 1,071,294 4,391,418 1,334,351 3,098 1,337,449 30.5% 870 3,943 3,876,395 1,723 488,121 108 19,345 913 4,391,4188 Nawada Magadh Milk Union 2 328,867 2,219,146 565,112 2,045 567,157 25.6% 167 2,463 2,119,262 133 436,057 28 3,631 271 2,562,0129 Aurangabad Magadh Milk Union 7 384,718 2,540,073 612,064 1,033 613,097 24.1% 159 8,443 1,525,746 87 217,621 3,438 4,749 162 1,760,405
10 Jehanabad Magadh Milk Union 19 181,236 1,125,313 222,974 1,285 224,259 19.9% 248 691 1,045,117 60 75,742 58 3,249 148 1,125,31311 Arwal Magadh Milk Union 20 108,612 700,843 141,314 590 141,904 20.2% 7,707 1,407 1,456,229 129 155,283 1,534 3,799 296 1,626,38412 Bhagalpur Vikramshila Milk 28 602,182 3,037,766 318,569 67,180 385,749 12.7% 253 2,897 2,672,311 188 740,101 20 7,543 261 3,423,57413 Banka Vikramshila Milk 29 387,831 2,034,763 247,858 90,432 338,290 16.6% 407 2,618 2,712,635 359 608,282 86 5,708 369 3,330,46414 Jamui Vikramshila Milk 34 307,877 1,760,405 302,649 78,793 381,442 21.7% 136 3,758 1,809,936 546 409,251 42 5,136 271 2,229,07615 Munger Vikramshila Milk 32 339,919 1,367,765 183,846 21,404 205,250 15.0% 362 2,203 3,152,346 246 333,980 71 5,106 707 3,495,02116 Khagaria DR Milk 23 315,414 1,666,886 247,161 675 247,836 14.9% 187 4,116 1,593,525 1,910 1,207,442 63 3,955 371 2,811,56917 Lakhisarai DR Milk 33 168,719 1,000,912 153,209 8,333 161,542 16.1% 323 390 634,099 74 64,259 60 1,579 59 700,84318 Shekhpura Vaishal Patliputra 35 108,884 636,342 131,115 617 131,732 20.7% 229 2,330 3,534,772 322 406,449 107 7,282 371 3,951,86219 Purnia Koshi Milk Union 4 624,893 3,264,619 390,991 139,490 530,481 16.2% 113 6,138 1,772,655 94 250,925 1,035 3,664 139 2,034,76320 Kishanganj Koshi Milk Union 17 325,207 1,690,400 113,118 64,224 177,342 10.5% 229 2,209 2,554,330 276 407,348 57 5,690 402 2,970,54121 Araria Koshi Milk Union 1 561,798 2,811,569 382,654 38,848 421,502 15.0% 180 3,556 2,487,866 1,050 537,098 32 7,569 415 3,037,76622 Katihar Koshi Milk Union 596,501 3,071,029 263,100 179,971 443,071 14.4% 647 2,165 2,518,216 1,472 197,819 48 7,496 544 2,728,40723 Muzaffarpur Tirhut Milk 24 885,970 4,801,062 751,975 5,979 757,954 15.8% 288 5,149 4,032,773 382 745,546 98 15,893 933 4,801,06224 Vaishali Vaishal Patliputra 8 609,755 3,495,021 738,031 2,274 740,305 21.2% 41 313 596,102 43 37,653 31 2,084 75 636,34225 West Champaran Tirhut Milk 22 722,330 3,935,042 553,944 250,046 803,990 20.4% 414 1,978 2,669,775 561 198,033 64 6,435 393 2,877,65326 East Champaran Tirhut Milk 9 949,436 5,099,371 649,726 12,461 662,187 13.0% 176 1,299 1,964,620 279 244,394 80 8,048 250 2,219,14627 Sitamarhi Tirhut Milk 12 674,458 3,423,574 405,714 2,989 408,703 11.9% 1,062 12,551 5,356,075 2,151 439,952 203 21,668 4,803 5,838,46528 Sheohar 13 149,685 656,246 96,655 318 96,973 14.8% 1,337 8,469 3,047,427 296 865,090 1,895 9,602 926 3,935,04229 Darbhanga Mithila Milk 21 822,300 3,937,385 615,688 2,772 618,460 15.7% 212 8,659 1,684,589 507 1,365,645 2,141 6,522 2,754 3,071,02930 Samastipur Mithila Milk 5 828,263 4,261,566 803,128 1,884 805,012 18.9% 79 1,253 1,486,989 86 175,588 115 2,633 143 1,666,88631 Madhubani Mithila Milk 3 1,025,076 4,487,379 587,158 3,990 591,148 13.2% 183 5,783 531,236 1,476 1,149,095 28 2,201 398 1,690,40032 Begusarai DR Milk 27 572,390 2,970,541 432,270 1,597 433,867 14.6% 334 2,218 2,291,133 775 237,353 19 7,946 295 2,540,07333 Saharsa Koshi Milk Union 14 382,562 1,900,661 317,249 6,009 323,258 17.0% 5,090 2,125 1,591,454 97 105,423 57 1,858 248 1,706,35234 Madhepura Koshi Milk Union 15 348,224 2,001,762 346,275 12,532 358,807 17.9% 245 3,534 3,042,729 236 881,476 101 8,232 832 3,937,38535 Supaul Koshi Milk Union 16 427,656 2,229,076 354,249 10,168 364,417 16.3% 878 4,865 4,086,453 464 990,349 104 15,590 668 5,099,37136 Saran Vaishal Patliputra 31 595,066 3,951,862 474,066 36,786 510,852 12.9% 73 522 552,492 52 99,342 44 3,505 216 656,24637 Siwan Tirhut Milk 18 516,118 3,330,464 386,685 87,000 473,685 14.2% 353 7,989 1,989,420 1,450 1,255,641 650 8,502 614 3,264,61938 Gopalganj Tirhut Milk 11 385,846 2,562,012 320,064 60,807 380,871 14.9% 1,584 2,889 2,645,415 252 300,487 537 6,185 2,569 2,959,918
Note: *1: Source: Poverty and social assesment a districtwise study of Bihar *2: Source: Population Census 2011 *3: Source: 19th Livestock census (2012) *4: Source: Animal Husbandry Department, Government of Bihar (2013-14) *5: Directorate of Statistics and Evaluation, Bihar Patna.
Population (persons) *2 Religion (persons) *2
A-48

Bihar
SlNo.
Name of District Name of milk union
1 Patna Vaishal Patliputra2 Nalanda Vaishal Patliputra3 Bhojpur Shahabad Milk4 Rohtas Shahabad Milk5 Kaimur Shahabad Milk6 Buxar Shahabad Milk7 Gaya Magadh Milk Union8 Nawada Magadh Milk Union9 Aurangabad Magadh Milk Union
10 Jehanabad Magadh Milk Union11 Arwal Magadh Milk Union12 Bhagalpur Vikramshila Milk13 Banka Vikramshila Milk14 Jamui Vikramshila Milk15 Munger Vikramshila Milk16 Khagaria DR Milk17 Lakhisarai DR Milk18 Shekhpura Vaishal Patliputra19 Purnia Koshi Milk Union20 Kishanganj Koshi Milk Union21 Araria Koshi Milk Union22 Katihar Koshi Milk Union23 Muzaffarpur Tirhut Milk24 Vaishali Vaishal Patliputra25 West Champaran Tirhut Milk26 East Champaran Tirhut Milk27 Sitamarhi Tirhut Milk28 Sheohar29 Darbhanga Mithila Milk30 Samastipur Mithila Milk31 Madhubani Mithila Milk32 Begusarai DR Milk33 Saharsa Koshi Milk Union34 Madhepura Koshi Milk Union35 Supaul Koshi Milk Union36 Saran Vaishal Patliputra37 Siwan Tirhut Milk38 Gopalganj Tirhut Milk
Numberof animalsPer 1000Households - Cattle
Numberof animalsPer 1000Househol
ds -Buffaloes
Numberof animalsPer 1000Households - Sheep
Numberof animalsPer 1000Households - Goats
Numberof animalsPer 1000Households - Pigs
Crossbred Cow Local Cow Total Cow BuffaloTotal
(Cow+Buf)Other Total Production Canals Tank Tubewells Other wells
355 340 15 208 45 148,386,251 5,34,21,487 201,807,738 190,622,579 392,430,317 4,502,397 342,108,902 24,685 0 84,647 0356 642 17 318 46 30,529,408 40,317,433 70,846,841 128,489,290 199,336,131 3,597,862 218,391,443 15,561 3,989 118,367 0533 526 49 301 343 90,410,351 67,191,137 157,601,488 145,901,190 303,502,678 7,655,129 154,854,351 122,410 0 35,820 0854 645 30 797 23 33,756,206 68,427,378 102,183,584 152,316,879 254,500,463 6,736,183 163,809,756 214,025 8,220 11,481 1,528828 899 174 453 34 2,451,382 53,824,202 56,275,584 100,700,660 156,976,244 7,945,439 142,469,467 82,721 16,219 49,380 0540 609 52 270 28 49,660,067 48,105,116 97,765,183 106,847,261 204,612,444 7,707,541 117,380,637 46,036 0 64,600 0610 293 9 400 78 26,328,853 178,258,684 204,587,537 153,747,623 358,335,160 6,043,855 184,096,288 5,217 116 119,629 0933 394 8 682 85 7,162,817 82,114,910 89,277,727 68,219,943 157,497,670 4,139,753 118,313,756 6,383 0 81,992 0947 519 66 542 29 12,690,054 103,788,298 116,478,352 93,211,282 209,689,634 8,306,574 251,455,645 86,326 0 83,993 2,963441 728 12 406 89 7,867,789 18,001,138 25,868,927 50,259,607 76,128,534 6,659,632 210,714,762 12,721 0 40,638 31488 672 22 462 36 6,539,555 14,624,223 21,163,778 31,059,309 52,223,087 969,081 53,192,168 12,925 0 21,891 0845 316 1 966 15 59,328,504 101,756,361 161,084,865 82,064,206 243,149,071 7,015,069 203,170,266 0 2,164 47,555 0
1425 367 42 972 55 11,491,681 110,219,969 121,711,650 56,340,783 178,052,433 7,017,592 143,451,461 34,714 1,371 62,476 01491 254 35 1141 106 20,109,982 131,707,820 151,817,802 52,237,328 204,055,130 4,902,069 250,343,270 397 798 8,778 557
490 154 1 497 23 41,135,993 42,772,008 83,908,001 30,266,002 114,174,003 1,833,325 155,091,170 19,945 126 18,439 0759 279 0 724 14 92,296,989 34,485,372 126,782,361 56,572,753 183,355,114 4,083,687 203,419,818 0 0 68,675 0747 346 8 636 24 26,520,104 20,786,982 47,307,086 27,916,417 75,223,503 3,719,420 307,222,098 18,991 0 24,959 0617 418 10 589 46 5,412,030 14,852,727 20,264,757 19,467,358 39,732,115 3,127,703 276,756,562 6,245 10,446 18,125 294798 212 0 825 31 4,449,799 96,782,670 101,232,469 45,966,753 147,199,222 6,369,468 163,867,138 0 0 108,755 0
1264 138 5 1253 36 2,392,047 88,882,213 91,274,260 18,398,836 109,673,096 1,196,671 205,809,115 0 0 30,886 01207 535 6 1744 28 3,125,786 75,373,100 78,498,886 56,025,142 134,524,028 5,444,379 259,944,842 0 0 82,993 01014 169 10 973 38 4,602,343 123,319,084 127,921,427 29,152,146 157,073,573 1,027,600 158,003,844 0 0 113,573 0
388 314 2 636 6 69,501,093 61,752,394 131,253,487 111,985,375 243,238,862 10,843,986 181,960,971 16,331 22,362 70,417 0349 277 3 491 3 122,641,160 20,382,872 143,024,032 61,100,012 204,124,044 6,889,463 178,752,410 0 0 57,625 0508 360 3 820 24 11,289,860 80,968,326 92,258,186 78,858,799 171,116,985 1,481,655 28,617,353 62,251 0 52,341 0379 359 2 764 17 8,405,804 89,476,042 97,881,846 102,828,913 200,710,759 6,983,736 250,222,598 0 0 141,163 0224 276 0 543 9 11,528,830 18,450,779 29,979,609 88,229,914 118,209,523 9,442,579 210,153,338 1,759 3,062 50,247 0270 311 0 640 9 1,526,640 8,769,776 10,296,416 16,839,282 27,135,698 3,237,033 150,501,072 0 0 11,922 0316 269 1 368 11 18,469,425 81,020,658 99,490,083 115,303,498 214,793,581 3,099,742 186,454,856 0 53,628 21,178 0563 291 3 467 4 192,632,973 46,222,576 238,855,549 98,750,956 337,606,505 932,012 40,664,127 0 0 130,305 0513 371 1 390 15 9,458,474 76,936,638 86,395,112 121,630,424 208,025,536 1,172,809 76,396,312 0 0 109,577 0634 174 0 404 6 228,065,883 7,211,413 235,277,296 38,351,563 273,628,859 4,996,764 397,427,081 0 1,493 70,197 0778 425 0 907 29 15,177,036 77,720,068 92,897,104 78,965,843 171,862,947 6,110,517 215,800,151 5,180 58 43,192 0992 2355 2 1158 20 9,208,987 59,226,363 68,435,350 67,998,519 136,433,869 11,341,936 369,677,096 762 0 78,099 0
1112 731 38 1049 25 1,814,176 99,624,291 101,438,467 94,716,730 196,155,197 1,149,361 77,277,895 22,219 0 66,505 0540 315 8 315 14 86,858,500 58,909,427 145,767,927 99,673,274 245,441,201 5,212,732 213,238,268 5,667 4,652 102,200 0572 289 4 455 20 20,236,299 63,297,319 83,533,618 69,724,227 153,257,845 7,450,543 125,660,066 9,393 3,363 96,510 0487 298 1 546 16 34,199,970 39,137,352 73,337,322 73,926,717 147,264,039 5,852,269 209,976,313 54,399 0 37,185 0
Volume of milk production (kg/year) *4 Area of Irrigation (ha)Number of Livestock *3
A-49
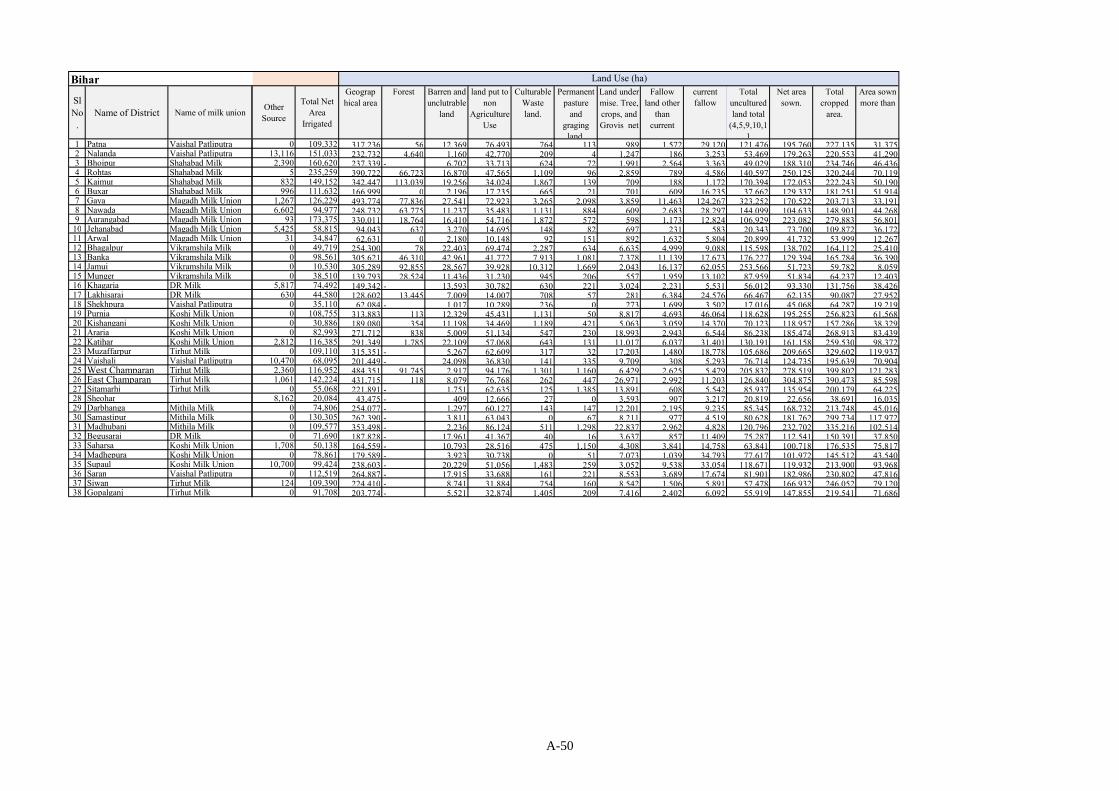
Bihar
SlNo.
Name of District Name of milk union
1 Patna Vaishal Patliputra2 Nalanda Vaishal Patliputra3 Bhojpur Shahabad Milk4 Rohtas Shahabad Milk5 Kaimur Shahabad Milk6 Buxar Shahabad Milk7 Gaya Magadh Milk Union8 Nawada Magadh Milk Union9 Aurangabad Magadh Milk Union
10 Jehanabad Magadh Milk Union11 Arwal Magadh Milk Union12 Bhagalpur Vikramshila Milk13 Banka Vikramshila Milk14 Jamui Vikramshila Milk15 Munger Vikramshila Milk16 Khagaria DR Milk17 Lakhisarai DR Milk18 Shekhpura Vaishal Patliputra19 Purnia Koshi Milk Union20 Kishanganj Koshi Milk Union21 Araria Koshi Milk Union22 Katihar Koshi Milk Union23 Muzaffarpur Tirhut Milk24 Vaishali Vaishal Patliputra25 West Champaran Tirhut Milk26 East Champaran Tirhut Milk27 Sitamarhi Tirhut Milk28 Sheohar29 Darbhanga Mithila Milk30 Samastipur Mithila Milk31 Madhubani Mithila Milk32 Begusarai DR Milk33 Saharsa Koshi Milk Union34 Madhepura Koshi Milk Union35 Supaul Koshi Milk Union36 Saran Vaishal Patliputra37 Siwan Tirhut Milk38 Gopalganj Tirhut Milk
OtherSource
Total NetArea
Irrigated
Geographical area
Forest Barren andunclutrable
land
land put tonon
AgricultureUse
CulturableWasteland.
Permanentpasture
andgraging
land.
Land undermise. Tree,crops, andGrovis net
Fallowland other
thancurrent
currentfallow
Totalunculturedland total
(4,5,9,10,11
Net areasown.
Totalcropped
area.
Area sownmore than
0 109,332 317,236 56 12,369 76,493 764 113 989 1,572 29,120 121,476 195,760 227,135 31,37513,116 151,033 232,732 4,640 1,160 42,770 209 4 1,247 186 3,253 53,469 179,263 220,553 41,290
2,390 160,620 237,339 - 6,702 33,713 624 72 1,991 2,564 3,363 49,029 188,310 234,746 46,4365 235,259 390,722 66,723 16,870 47,565 1,109 96 2,859 789 4,586 140,597 250,125 320,244 70,119
832 149,152 342,447 113,039 19,256 34,024 1,867 139 709 188 1,172 170,394 172,053 222,243 50,190996 111,632 166,999 0 2,196 17,235 665 21 701 609 16,235 37,662 129,337 181,251 51,914
1,267 126,229 493,774 77,836 27,541 72,923 3,265 2,098 3,859 11,463 124,267 323,252 170,522 203,713 33,1916,602 94,977 248,732 63,775 11,237 35,483 1,131 884 609 2,683 28,297 144,099 104,633 148,901 44,268
93 173,375 330,011 18,764 16,410 54,716 1,872 572 598 1,173 12,824 106,929 223,082 279,883 56,8015,425 58,815 94,043 637 3,270 14,695 148 82 697 231 583 20,343 73,700 109,872 36,172
31 34,847 62,631 0 2,180 10,148 92 151 892 1,632 5,804 20,899 41,732 53,999 12,2670 49,719 254,300 78 22,403 69,474 2,287 634 6,635 4,999 9,088 115,598 138,702 164,112 25,4100 98,561 305,621 46,310 42,961 41,772 7,913 1,081 7,378 11,139 17,673 176,227 129,394 165,784 36,3900 10,530 305,289 92,855 28,567 39,928 10,312 1,669 2,043 16,137 62,055 253,566 51,723 59,782 8,0590 38,510 139,793 28,524 11,436 31,230 945 206 557 1,959 13,102 87,959 51,834 64,237 12,403
5,817 74,492 149,342 - 13,593 30,782 630 221 3,024 2,231 5,531 56,012 93,330 131,756 38,426630 44,580 128,602 13,445 7,009 14,007 708 57 281 6,384 24,576 66,467 62,135 90,087 27,952
0 35,110 62,084 - 1,017 10,289 236 0 273 1,699 3,502 17,016 45,068 64,287 19,2190 108,755 313,883 113 12,329 45,431 1,131 50 8,817 4,693 46,064 118,628 195,255 256,823 61,5680 30,886 189,080 354 11,198 34,469 1,189 421 5,063 3,059 14,370 70,123 118,957 157,286 38,3290 82,993 271,712 838 5,009 51,134 547 230 18,993 2,943 6,544 86,238 185,474 268,913 83,439
2,812 116,385 291,349 1,785 22,109 57,068 643 131 11,017 6,037 31,401 130,191 161,158 259,530 98,3720 109,110 315,351 - 5,267 62,609 317 32 17,203 1,480 18,778 105,686 209,665 329,602 119,937
10,470 68,095 201,449 - 24,098 36,830 141 335 9,709 308 5,293 76,714 124,735 195,639 70,9042,360 116,952 484,351 91,745 2,917 94,176 1,301 1,160 6,429 2,625 5,479 205,832 278,519 399,802 121,2831,061 142,224 431,715 118 8,079 76,768 262 447 26,971 2,992 11,203 126,840 304,875 390,473 85,598
0 55,068 221,891 - 1,751 62,635 125 1,385 13,891 608 5,542 85,937 135,954 200,179 64,2258,162 20,084 43,475 - 409 12,666 27 0 3,593 907 3,217 20,819 22,656 38,691 16,035
0 74,806 254,077 - 1,297 60,127 143 147 12,201 2,195 9,235 85,345 168,732 213,748 45,0160 130,305 262,390 - 3,811 63,043 0 67 8,211 977 4,519 80,628 181,762 299,734 117,9720 109,577 353,498 - 2,236 86,124 511 1,298 22,837 2,962 4,828 120,796 232,702 335,216 102,5140 71,690 187,828 - 17,961 41,367 40 16 3,637 857 11,409 75,287 112,541 150,391 37,850
1,708 50,138 164,559 - 10,793 28,516 475 1,150 4,308 3,841 14,758 63,841 100,718 176,535 75,8170 78,861 179,589 - 3,923 30,738 0 51 7,073 1,039 34,793 77,617 101,972 145,512 43,540
10,700 99,424 238,603 - 20,229 51,056 1,483 259 3,052 9,538 33,054 118,671 119,932 213,900 93,9680 112,519 264,887 - 17,915 33,688 161 221 8,553 3,689 17,674 81,901 182,986 230,802 47,816
124 109,390 224,410 - 8,741 31,884 754 160 8,542 1,506 5,891 57,478 166,932 246,052 79,1200 91,708 203,774 - 5,521 32,874 1,405 209 7,416 2,402 6,092 55,919 147,855 219,541 71,686
Land Use (ha)
A-50

Gujarat
SlNo.
Name of DistrictName of milk
union
Povertyrate inRural
(%) *1
Totalhousehold
Totalpopulation
SCpopulation
STpopulation
SC+STpopulation
%(SC+ST/
Totalpop.)
Hindu Muslim Christian Sikh Buddhist Jain
Otherreligions &persuasions
(incl.Unclassified Sect.)
Religionnot stated
IndigenousCattle(‘000)
CrossbredCattle(‘000)
Buffalo(‘000)
1 Ahmadabad Ahmadabad 11.3 3,902 13,869 706 3,604 4,310 31.1% 6,042,416 883,238 50,754 14,542 4,518 209,287 2,055 7,415 200 17 3442 Amreli Amreli 0.5 626 2,962 132 917 1,049 35.4% 1,410,463 99,105 919 415 243 2,053 40 952 261 9 2013 Anand Kaira 13.6 844 3,453 27 1,151 1,178 34.1% 1,798,794 250,919 29,789 1,524 267 8,591 142 2,719 80 67 4074 Banas Kantha Banaskantha 26 710 3,555 136 178 314 8.8% 2,890,305 213,505 1,686 486 281 12,659 83 1,501 529 131 9555 Bharuch Bharuch 17.1 990 3,925 118 1,744 1,862 47.4% 1,188,204 343,511 9,494 1,733 442 4,813 342 2,480 103 19 1546 Bhavnagar Bhavnagar 1.2 582 2,153 35 87 122 5.7% 2,632,574 212,863 3,457 1,410 445 26,974 127 2,515 329 12 3347 Dohad Panch Mahals 41.4 244 1,128 31 463 494 43.8% 2,045,243 66,353 9,907 493 260 3,331 114 1,385 582 7 2848 Gandhinagar Gandhinagar 5.2 849 4,015 228 600 828 20.6% 1,319,586 57,273 3,237 1,985 497 6,405 82 2,688 80 68 3649 Jamnagar - - 1,242 5,352 215 1,313 1,528 28.6% 1,810,443 320,805 4,392 1,873 1,086 18,856 136 2,528 349 2 257
10 Junagadh Junagadh - 1,371 6,270 204 1,394 1,598 25.5% 2,397,056 334,858 2,586 1,110 1,291 3,841 77 2,263 467 14 37811 Kachchh Kachchh 20 695 2,765 278 541 819 29.6% 1,608,921 442,355 6,192 6,353 490 25,312 98 2,650 381 8 22612 Kheda Kaira 42.4 994 4,481 192 531 723 16.1% 2,000,884 264,482 26,629 1,403 300 3,479 82 2,626 147 81 62813 Mahesana Mehsana 27.3 396 1,714 53 236 289 16.9% 1,885,732 136,431 1,954 1,082 146 7,087 88 2,544 114 103 56814 Narmada Bharuch 24.5 762 2,924 97 1,410 1,507 51.5% 559,848 22,600 4,413 147 80 373 2,078 758 137 4 5915 Navsari Valsad 6.5 991 3,302 60 1,506 1,566 47.4% 1,225,087 78,669 5,733 2,459 601 13,386 2,823 914 61 96 10216 Panch Mahals Panch Mahals 38.3 349 1,584 16 211 227 14.3% 2,220,974 158,513 2,863 662 337 5,236 131 2,060 537 51 61617 Patan Mehsana 42.4 413 1,744 101 140 241 13.8% 1,194,745 142,797 916 337 66 3,602 66 1,205 123 8 36418 Porbandar Porbandar - 313 1,438 107 605 712 49.5% 549,749 33,565 500 248 91 515 38 743 81 2 10519 Rajkot Rajkot 10.4 2,173 9,640 187 2,064 2,251 23.4% 3,397,406 361,388 5,478 1,918 1,170 33,591 269 3,338 430 22 36220 Sabar Kantha Sabarkantha 20.2 1,343 7,096 110 1,330 1,440 20.3% 2,260,560 148,563 6,375 614 168 11,110 52 1,147 469 152 77521 Surat Surat 23.1 11,964 39,190 811 11,656 12,467 31.8% 5,260,193 660,772 21,052 5,703 12,902 112,835 3,920 3,945 128 99 24722 Surendranagar Surendranagar 20.5 586 2,598 42 402 444 17.1% 1,620,282 109,681 1,419 512 312 22,992 128 942 342 5 29023 Tapi Surat - 1,190 4,758 23 2,930 2,953 62.1% 725,890 22,309 52,930 239 1,476 1,828 408 1,942 169 45 17724 The Dangs Valsad 88.4 77 346 26 78 104 30.1% 203,545 3,593 20,029 69 32 39 560 424 60 10 2125 Vadodara Baroda 5.6 2,606 10,833 438 3,935 4,373 40.4% 3,713,941 384,579 23,813 9,340 2,069 27,650 1,124 3,110 458 24 46226 Valsad Valsad 3.4 713 3,211 151 1,843 1,994 62.1% 1,571,147 94,034 19,661 1,589 913 13,809 1,417 3,108 219 89 97
Note: *1: Source: http://environmentportal.in/files/Levels%20of%20living.pdf *2: Source: Population Census 2011 *3: Source: Survey Reports on estimates of Major Livestock Products (2012-13), Directorate of Animal Husbandry, Gujarat State, Gandhinagar. *4: Source: http://shodhganga.inflibnet.ac.in/bitstream/10603/7276/12/12_chapter%203.pdf (2001-2)
Population('000 persons) *2 Number of livestock *3Religion (Persons) *2
A-51
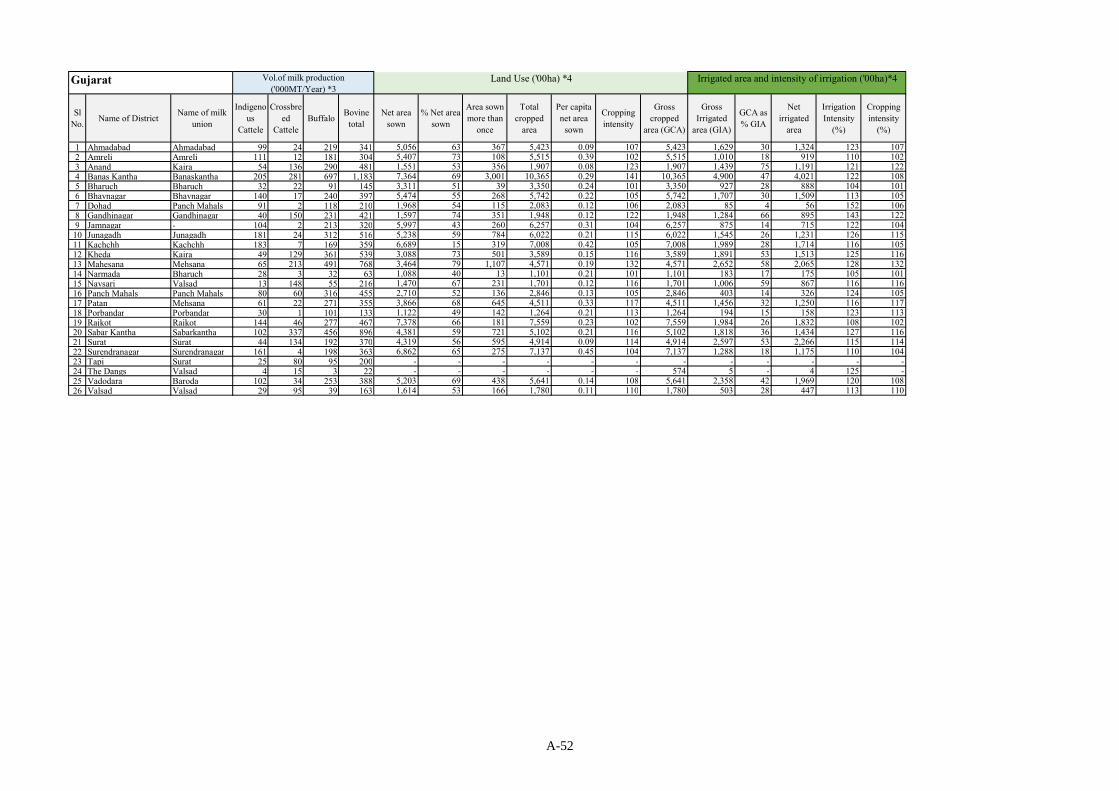
Gujarat
SlNo.
Name of DistrictName of milk
union
1 Ahmadabad Ahmadabad2 Amreli Amreli3 Anand Kaira4 Banas Kantha Banaskantha5 Bharuch Bharuch6 Bhavnagar Bhavnagar7 Dohad Panch Mahals8 Gandhinagar Gandhinagar9 Jamnagar -
10 Junagadh Junagadh11 Kachchh Kachchh12 Kheda Kaira13 Mahesana Mehsana14 Narmada Bharuch15 Navsari Valsad16 Panch Mahals Panch Mahals17 Patan Mehsana18 Porbandar Porbandar19 Rajkot Rajkot20 Sabar Kantha Sabarkantha21 Surat Surat22 Surendranagar Surendranagar23 Tapi Surat24 The Dangs Valsad25 Vadodara Baroda26 Valsad Valsad
Indigenous
Cattele
Crossbreed
CatteleBuffalo
Bovinetotal
Net areasown
% Net areasown
Area sownmore than
once
Totalcropped
area
Per capitanet area
sown
Croppingintensity
Grosscropped
area (GCA)
GrossIrrigated
area (GIA)
GCA as% GIA
Netirrigated
area
IrrigationIntensity
(%)
Croppingintensity
(%)
99 24 219 341 5,056 63 367 5,423 0.09 107 5,423 1,629 30 1,324 123 107111 12 181 304 5,407 73 108 5,515 0.39 102 5,515 1,010 18 919 110 102
54 136 290 481 1,551 53 356 1,907 0.08 123 1,907 1,439 75 1,191 121 122205 281 697 1,183 7,364 69 3,001 10,365 0.29 141 10,365 4,900 47 4,021 122 108
32 22 91 145 3,311 51 39 3,350 0.24 101 3,350 927 28 888 104 101140 17 240 397 5,474 55 268 5,742 0.22 105 5,742 1,707 30 1,509 113 105
91 2 118 210 1,968 54 115 2,083 0.12 106 2,083 85 4 56 152 10640 150 231 421 1,597 74 351 1,948 0.12 122 1,948 1,284 66 895 143 122
104 2 213 320 5,997 43 260 6,257 0.31 104 6,257 875 14 715 122 104181 24 312 516 5,238 59 784 6,022 0.21 115 6,022 1,545 26 1,231 126 115183 7 169 359 6,689 15 319 7,008 0.42 105 7,008 1,989 28 1,714 116 105
49 129 361 539 3,088 73 501 3,589 0.15 116 3,589 1,891 53 1,513 125 11665 213 491 768 3,464 79 1,107 4,571 0.19 132 4,571 2,652 58 2,065 128 13228 3 32 63 1,088 40 13 1,101 0.21 101 1,101 183 17 175 105 10113 148 55 216 1,470 67 231 1,701 0.12 116 1,701 1,006 59 867 116 11680 60 316 455 2,710 52 136 2,846 0.13 105 2,846 403 14 326 124 10561 22 271 355 3,866 68 645 4,511 0.33 117 4,511 1,456 32 1,250 116 11730 1 101 133 1,122 49 142 1,264 0.21 113 1,264 194 15 158 123 113
144 46 277 467 7,378 66 181 7,559 0.23 102 7,559 1,984 26 1,832 108 102102 337 456 896 4,381 59 721 5,102 0.21 116 5,102 1,818 36 1,434 127 116
44 134 192 370 4,319 56 595 4,914 0.09 114 4,914 2,597 53 2,266 115 114161 4 198 363 6,862 65 275 7,137 0.45 104 7,137 1,288 18 1,175 110 104
25 80 95 200 - - - - - - - - - - - -4 15 3 22 - - - - - - 574 5 - 4 125 -
102 34 253 388 5,203 69 438 5,641 0.14 108 5,641 2,358 42 1,969 120 10829 95 39 163 1,614 53 166 1,780 0.11 110 1,780 503 28 447 113 110
Irrigated area and intensity of irrigation ('00ha)*4Land Use ('00ha) *4Vol.of milk production('000MT/Year) *3
A-52
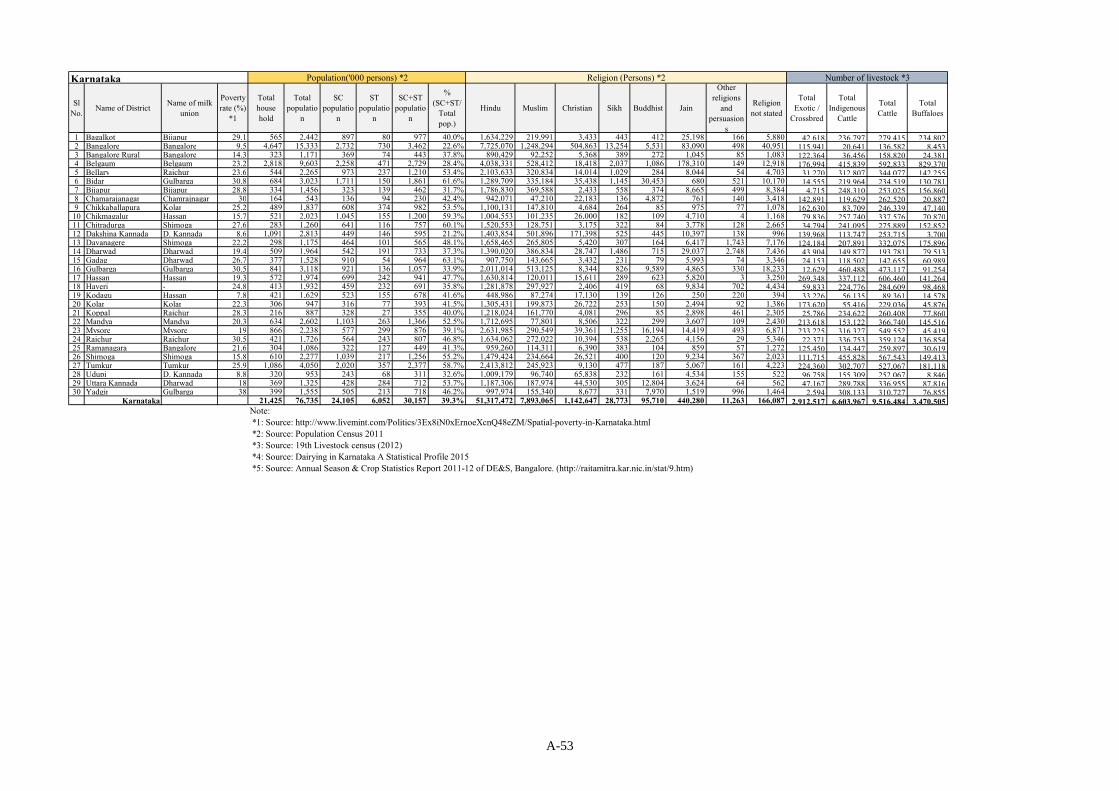
Karnataka
SlNo.
Name of DistrictName of milk
union
Povertyrate (%)
*1
Totalhousehold
Totalpopulatio
n
SCpopulatio
n
STpopulatio
n
SC+STpopulatio
n
%(SC+ST/
Totalpop.)
Hindu Muslim Christian Sikh Buddhist Jain
Otherreligions
andpersuasion
s
Religionnot stated
TotalExotic /
Crossbred
TotalIndigenous
Cattle
TotalCattle
TotalBuffaloes
1 Bagalkot Bijapur 29.1 565 2,442 897 80 977 40.0% 1,634,229 219,991 3,433 443 412 25,198 166 5,880 42,618 236,797 279,415 234,8022 Bangalore Bangalore 9.5 4,647 15,333 2,732 730 3,462 22.6% 7,725,070 1,248,294 504,863 13,254 5,531 83,090 498 40,951 115,941 20,641 136,582 8,4533 Bangalore Rural Bangalore 14.3 323 1,171 369 74 443 37.8% 890,429 92,252 5,368 389 272 1,045 85 1,083 122,364 36,456 158,820 24,3814 Belgaum Belgaum 23.2 2,818 9,603 2,258 471 2,729 28.4% 4,038,331 528,412 18,418 2,037 1,086 178,310 149 12,918 176,994 415,839 592,833 829,3705 Bellary Raichur 23.6 544 2,265 973 237 1,210 53.4% 2,103,633 320,834 14,014 1,029 284 8,044 54 4,703 31,270 312,807 344,077 142,2556 Bidar Gulbarga 30.8 684 3,023 1,711 150 1,861 61.6% 1,289,709 335,184 35,438 1,145 30,453 680 521 10,170 14,555 219,964 234,519 130,7817 Bijapur Bijapur 28.8 334 1,456 323 139 462 31.7% 1,786,830 369,588 2,433 558 374 8,665 499 8,384 4,715 248,310 253,025 156,8608 Chamarajanagar Chamrajnagar 30 164 543 136 94 230 42.4% 942,071 47,210 22,183 136 4,872 761 140 3,418 142,891 119,629 262,520 20,8879 Chikkaballapura Kolar 25.2 489 1,837 608 374 982 53.5% 1,100,131 147,810 4,684 264 85 975 77 1,078 162,630 83,709 246,339 47,140
10 Chikmagalur Hassan 15.7 521 2,023 1,045 155 1,200 59.3% 1,004,553 101,235 26,000 182 109 4,710 4 1,168 79,836 257,740 337,576 70,87011 Chitradurga Shimoga 27.6 283 1,260 641 116 757 60.1% 1,520,553 128,751 3,175 322 84 3,778 128 2,665 34,794 241,095 275,889 152,85212 Dakshina Kannada D. Kannada 8.6 1,091 2,813 449 146 595 21.2% 1,403,854 501,896 171,398 525 445 10,397 138 996 139,968 113,747 253,715 3,70013 Davanagere Shimoga 22.2 298 1,175 464 101 565 48.1% 1,658,465 265,805 5,420 307 164 6,417 1,743 7,176 124,184 207,891 332,075 175,89614 Dharwad Dharwad 19.4 509 1,964 542 191 733 37.3% 1,390,020 386,834 28,747 1,486 715 29,037 2,748 7,436 43,904 149,877 193,781 79,51315 Gadag Dharwad 26.7 377 1,528 910 54 964 63.1% 907,750 143,665 3,432 231 79 5,993 74 3,346 24,153 118,502 142,655 60,98916 Gulbarga Gulbarga 30.5 841 3,118 921 136 1,057 33.9% 2,011,014 513,125 8,344 826 9,589 4,865 330 18,233 12,629 460,488 473,117 91,25417 Hassan Hassan 19.3 572 1,974 699 242 941 47.7% 1,630,814 120,011 15,611 289 623 5,820 3 3,250 269,348 337,112 606,460 141,26418 Haveri - 24.8 413 1,932 459 232 691 35.8% 1,281,878 297,927 2,406 419 68 9,834 702 4,434 59,833 224,776 284,609 98,46819 Kodagu Hassan 7.8 421 1,629 523 155 678 41.6% 448,986 87,274 17,130 139 126 250 220 394 33,226 56,135 89,361 14,57820 Kolar Kolar 22.3 306 947 316 77 393 41.5% 1,305,431 199,873 26,722 253 150 2,494 92 1,386 173,620 55,416 229,036 45,87621 Koppal Raichur 28.3 216 887 328 27 355 40.0% 1,218,024 161,770 4,081 296 85 2,898 461 2,305 25,786 234,622 260,408 77,86022 Mandya Mandya 20.3 634 2,602 1,103 263 1,366 52.5% 1,712,695 77,801 8,506 322 299 3,607 109 2,430 213,618 153,122 366,740 145,51623 Mysore Mysore 19 866 2,238 577 299 876 39.1% 2,631,985 290,549 39,361 1,255 16,194 14,419 493 6,871 233,225 316,327 549,552 45,41924 Raichur Raichur 30.5 421 1,726 564 243 807 46.8% 1,634,062 272,022 10,394 538 2,265 4,156 29 5,346 22,371 336,753 359,124 136,85425 Ramanagara Bangalore 21.6 304 1,086 322 127 449 41.3% 959,260 114,311 6,390 383 104 859 57 1,272 125,450 134,447 259,897 30,61926 Shimoga Shimoga 15.8 610 2,277 1,039 217 1,256 55.2% 1,479,424 234,664 26,521 400 120 9,234 367 2,023 111,715 455,828 567,543 149,41327 Tumkur Tumkur 25.9 1,086 4,050 2,020 357 2,377 58.7% 2,413,812 245,923 9,130 477 187 5,067 161 4,223 224,360 302,707 527,067 181,11828 Udupi D. Kannada 8.8 320 953 243 68 311 32.6% 1,009,179 96,740 65,838 232 161 4,534 155 522 96,758 155,309 252,067 8,84629 Uttara Kannada Dharwad 18 369 1,325 428 284 712 53.7% 1,187,306 187,974 44,530 305 12,804 3,624 64 562 47,167 289,788 336,955 87,81630 Yadgir Gulbarga 38 399 1,555 505 213 718 46.2% 997,974 155,340 8,677 331 7,970 1,519 996 1,464 2,594 308,133 310,727 76,855
Karnataka 21,425 76,735 24,105 6,052 30,157 39.3% 51,317,472 7,893,065 1,142,647 28,773 95,710 440,280 11,263 166,087 2,912,517 6,603,967 9,516,484 3,470,505Note: *1: Source: http://www.livemint.com/Politics/3Ex8iN0xErnoeXcnQ48eZM/Spatial-poverty-in-Karnataka.html *2: Source: Population Census 2011 *3: Source: 19th Livestock census (2012) *4: Source: Dairying in Karnataka A Statistical Profile 2015 *5: Source: Annual Season & Crop Statistics Report 2011-12 of DE&S, Bangalore. (http://raitamitra.kar.nic.in/stat/9.htm)
Population('000 persons) *2 Religion (Persons) *2 Number of livestock *3
A-53

Karnataka
SlNo.
Name of DistrictName of milk
union
1 Bagalkot Bijapur2 Bangalore Bangalore3 Bangalore Rural Bangalore4 Belgaum Belgaum5 Bellary Raichur6 Bidar Gulbarga7 Bijapur Bijapur8 Chamarajanagar Chamrajnagar9 Chikkaballapura Kolar
10 Chikmagalur Hassan11 Chitradurga Shimoga12 Dakshina Kannada D. Kannada13 Davanagere Shimoga14 Dharwad Dharwad15 Gadag Dharwad16 Gulbarga Gulbarga17 Hassan Hassan18 Haveri -19 Kodagu Hassan20 Kolar Kolar21 Koppal Raichur22 Mandya Mandya23 Mysore Mysore24 Raichur Raichur25 Ramanagara Bangalore26 Shimoga Shimoga27 Tumkur Tumkur28 Udupi D. Kannada29 Uttara Kannada Dharwad30 Yadgir Gulbarga
Karnataka
Crossbred Cow
LocalCow
TotalCow
BuffaloTotal
(Cow+Buf)
Other(Goat
)
TotalProducti
on
Crossbred Cow
LocalCow
BuffaloCanals
(ha)(Gross)
Tanks(ha)
(Gross)
Wells(ha)
(Gross)
Tube/Borewells(ha)(Gross)
LiftIrrigatio
n(ha)(Gro
ss)
OtherSources
(ha)(Gross)
Total(ha)
(Gross)
reporting area
Forestarea
Permanent
Pastureand
grazing
Fallowland
netSownarea
35 55 90 90 180 5 185 5.78 2.36 2.53 57,775 759 11,303 107,895 2,945 125,658 306,335 659 81 3 41 478140 13 153 19 172 0 172 5.95 2.36 2.57 0 0 0 12,081 0 0 12,081 230 11 4 21 126127 6 133 6 139 0 139 5.94 2.36 2.49 0 0 0 29,719 0 0 29,719 217 5 6 23 51112 75 187 447 634 7 641 5.85 2.34 2.99 98,154 508 156,475 181,690 20,605 65,696 523,128 1,344 190 25 234 767
21 60 81 74 155 3 158 5.77 2.28 2.59 135,078 1,995 4,165 89,944 46,216 11,137 288,535 813 97 5 104 41414 54 68 75 143 3 146 5.68 2.32 2.57 7,771 1,262 26,747 28,257 736 1,474 66,247 542 28 14 78 351
3 49 52 68 120 4 124 5.69 2.30 2.57 128,098 735 94,174 105,855 0 17,819 346,681 1,053 2 10 221 74987 30 117 12 129 0 129 5.82 2.44 2.55 15,472 8,582 5,186 57,320 528 0 87,088 570 276 23 29 184
185 19 204 26 230 3 233 6.70 2.41 2.71 0 0 0 61,494 0 0 61,494 405 50 56 16 20558 61 119 46 165 0 165 5.77 2.40 2.64 9,493 11,475 624 13,586 260 12,607 48,045 722 200 89 28 29332 45 77 64 141 3 144 5.76 2.39 2.51 2,160 0 0 93,592 0 0 95,752 771 74 89 112 387
135 51 186 3 189 0 189 5.73 2.14 2.49 0 0 41,104 9,916 2,147 19,211 72,378 477 128 19 12 131108 46 154 75 229 1 230 5.80 2.43 2.48 127,264 2,149 285 107,483 18,143 351 255,675 598 90 20 26 389
42 23 65 39 104 0 104 5.70 2.34 2.56 53,886 0 0 24,622 0 0 78,508 427 35 4 70 28917 23 40 33 73 3 76 5.71 2.39 2.52 47,689 1,269 2,487 36,977 50 29,879 118,351 466 33 3 54 35315 122 137 82 219 6 225 5.78 2.30 2.56 28,429 689 37,291 28,434 3,289 1,337 99,469 1,094 35 26 53 896
168 77 245 71 316 0 316 5.94 2.44 2.48 42,307 30,747 645 36,627 1,215 891 112,432 663 59 33 81 35953 35 88 43 131 2 133 5.73 2.34 2.51 6,168 12,980 5 60,315 496 19,064 99,028 485 47 12 18 36330 13 43 7 50 0 50 5.73 1.82 2.47 1,611 275 0 88 50 360 2,384 411 135 14 8 170
237 13 250 29 279 0 279 7.15 2.33 2.90 0 0 0 36,370 0 0 36,370 375 21 39 44 18328 44 72 45 117 3 120 5.61 2.40 2.62 79,824 175 0 94,512 514 161 175,186 552 29 15 100 350
194 13 207 76 283 4 287 5.99 2.40 2.54 125,757 21,428 9,407 7,268 415 3,844 168,119 498 25 32 81 232168 69 237 27 264 2 266 5.87 2.39 2.49 119,669 18,447 25,379 34,231 240 0 197,966 676 63 47 74 345
12 67 79 49 128 4 132 5.67 2.35 2.49 206,196 1,317 7,830 15,767 7,242 0 238,352 836 18 20 275 458115 42 157 23 180 0 180 6.07 2.39 2.62 2,238 811 0 40,725 260 0 44,034 356 70 25 41 164
83 79 162 54 216 0 216 5.91 2.39 2.45 57,450 56,738 6,082 43,001 4,923 5,914 174,108 848 277 163 34 228168 74 242 97 339 3 342 6.06 2.34 2.61 4,199 13,265 896 164,781 0 0 183,141 1,065 45 76 197 510
83 62 145 2 147 0 147 5.75 2.25 2.48 0 731 25,169 554 3,084 5,742 35,280 356 100 11 9 10037 41 78 36 114 0 114 5.61 1.81 2.41 0 7,042 10,016 3,876 680 10,790 32,404 1,025 814 17 20 112
8 43 51 22 73 3 76 5.53 2.32 2.50 116,489 2,841 9,681 12,853 2,558 4,152 148,574 516 34 12 106 3042,515 1,404 3,919 1,740 5,659 59 5,718 6.03 2.32 2.65 1,473,177 196,220 474,951 1,539,833 116,596 336,087 4,136,864 19,050 3,072 908 2,210 9,941
* Includes temporary irrigation.
Land Use (ha) *4Milk yield (kg/day) *4Volume of milk production ('000MT/Year) *4 Water resource *5
A-54

Madhya Pradesh
SlNo.
Name of DistrictName of
milk union
Povertyrate
(%) *1
Totalhousehol
d
Totalpopulatio
n
SCpopulatio
n
STpopuulat
ion
SC+STpopulatio
n
%(SC+ST/
Totalpop.)
Hindu Muslim Christian Sikh Buddhist Jain
Otherreligions
andpersuasion
s
Religionnot
statedTotal
Cattle(No.)
TotalExotic /
Crossbred
Cattle(No.)Total
IndigenousCattle
Cattle(No.)Total Cattle
TotalBuffaloes
1 Agarmalwa - - - - - - - - - - - - - - - - - - - - -2 Alirajpur - - 246 1,100 75 538 613 55.7% 705,060 17,660 4,600 65 36 780 271 527 728,999 431 440,049 440,480 57,4933 Anuppur - - 231 809 67 249 316 39.1% 686,524 21,473 2,132 606 86 1,653 35,434 1,329 749,237 7,572 339,929 347,501 62,0584 Ashoknagar Bhopal - 246 1,205 163 450 613 50.9% 778,214 40,707 635 8,009 1,352 15,094 27 1,033 845,071 11,382 230,187 241,569 120,8895 Balaghat Jabalpur 50.1 375 1,360 190 474 664 48.8% 1,519,384 38,542 5,295 1,050 72,162 4,778 58,064 2,423 1,701,698 10,871 565,912 576,783 141,0346 Barwani Indore 21.6 438 1,713 293 764 1,057 61.7% 1,318,869 58,222 2,967 2,361 416 2,289 263 494 1,385,881 599 399,640 400,239 110,6637 Betul Bhopal 49.6 631 2,135 175 1,145 1,320 61.8% 1,505,745 37,590 3,271 1,078 9,651 3,759 13,048 1,220 1,575,362 22,908 503,145 526,053 120,3958 Bhind Gwalior 26.4 493 2,421 507 533 1,040 43.0% 1,595,400 66,776 973 4,047 12,215 19,950 73 3,571 1,703,005 7,530 102,030 109,560 219,1459 Bhopal Bhopal 52.0 3,066 9,281 1,403 1,945 3,348 36.1% 1,755,861 525,434 23,432 10,789 21,688 25,950 335 7,572 2,371,061 20,658 89,434 110,092 83,65510 Burhanpur Indore 60.6 431 1,887 152 774 926 49.1% 552,526 180,840 1,199 1,074 19,883 1,884 99 342 757,847 2,125 129,372 131,497 36,21111 Chhatarpur Jabalpur 26.7 416 1,611 266 541 807 50.1% 1,676,918 70,351 1,980 968 250 10,409 102 1,397 1,762,375 3,095 340,818 343,913 239,20612 Chhindwara Jabalpur - 395 1,127 62 374 436 38.7% 1,923,920 100,692 4,893 2,258 24,471 7,830 25,771 1,087 2,090,922 23,080 675,987 699,067 136,69613 Damoh Jabalpur 59.2 555 1,892 342 255 597 31.6% 1,186,420 47,966 1,681 1,096 119 25,005 82 1,850 1,264,219 4,868 553,977 558,845 106,72314 Datia Gwalior 24.8 307 1,438 304 487 791 55.0% 747,693 28,483 683 490 7,923 453 10 1,019 786,754 630 106,555 107,185 150,32415 Dewas Indore 21.8 784 3,490 600 1,153 1,753 50.2% 1,376,591 174,259 2,355 2,330 382 6,497 72 1,229 1,563,715 30,259 314,631 344,890 236,55516 Dhar Indore 19.4 1,276 5,772 402 2,674 3,076 53.3% 2,051,219 116,202 2,261 1,607 328 12,199 88 1,889 2,185,793 58,107 565,306 623,413 200,41917 Dindori Jabalpur 80.1 178 546 31 296 327 59.9% 605,435 6,736 4,238 260 61 687 84,006 3,101 704,524 506 375,053 375,559 43,20418 Guna Bhopal 32.8 289 1,316 134 401 535 40.7% 1,172,248 49,203 1,208 3,271 529 13,474 52 1,534 1,241,519 1,510 344,854 346,364 121,18419 Gwalior Gwalior 21.4 1,256 5,265 1,813 910 2,723 51.7% 1,835,299 141,735 4,119 24,790 4,361 18,058 217 3,457 2,032,036 14,824 352,976 367,800 222,42620 Harda Bhopal 35.0 439 1,588 110 854 964 60.7% 527,462 38,640 683 676 93 1,573 55 1,283 570,465 5,723 182,221 187,944 226,08921 Hoshangabad Bhopal 36.7 741 2,435 192 629 821 33.7% 1,175,203 52,269 4,453 3,127 1,550 3,888 107 753 1,241,350 2,469 139,240 141,709 72,85022 Indore Indore 15.1 3,886 16,810 1,632 8,450 10,082 60.0% 2,728,225 415,142 18,523 25,696 11,496 71,667 720 5,228 3,276,697 20,369 319,633 340,002 112,52623 Jabalpur Jabalpur 29.6 2,199 5,451 690 1,428 2,118 38.9% 2,159,065 203,652 23,142 13,256 4,320 33,728 21,010 5,116 2,463,289 81,455 96,129 177,584 155,29024 Jhabua Indore 55.9 471 2,111 197 758 955 45.2% 960,925 15,733 38,423 141 65 8,871 388 502 1,025,048 27,922 337,423 365,345 95,32425 Katni Jabalpur 52.3 400 1,636 190 433 623 38.1% 1,240,650 37,232 3,158 1,167 157 5,342 2,643 1,693 1,292,042 17,409 391,764 409,173 102,80726 Khandwa (East Indore 17.8 593 2,153 233 632 865 40.2% 1,182,330 116,277 2,800 1,726 1,425 3,856 158 1,489 1,310,061 3,497 431,864 435,361 51,86627 Khargone (West Indore 19.8 1,086 4,566 231 2,066 2,297 50.3% 1,725,441 135,085 2,075 2,896 284 6,028 89 1,148 1,873,046 7,603 386,045 393,648 54,64128 Mandla Jabalpur 75.5 393 1,158 58 576 634 54.7% 849,518 16,558 12,450 436 297 1,789 170,533 3,324 1,054,905 51,231 245,841 297,072 224,44329 Mandsaur Ujjain 16.2 615 2,775 350 784 1,134 40.9% 1,192,588 125,548 1,120 849 242 19,029 77 958 1,340,411 12,715 129,199 141,914 623,86130 Morena Gwalior 19.8 511 2,362 650 152 802 34.0% 1,875,495 76,159 1,092 557 3,234 6,681 92 2,660 1,965,970 38,080 283,033 321,113 127,23031 Narsimhapur Jabalpur 45.3 445 1,520 192 381 573 37.7% 1,038,628 39,048 914 997 262 8,125 2,873 1,007 1,091,854 21,422 226,366 247,788 138,04432 Neemuch Ujjain 7.3 1,540 6,142 658 2,822 3,480 56.7% 741,288 67,324 1,508 1,110 224 14,165 115 333 826,067 1,408 413,407 414,815 141,89533 Panna Jabalpur 48.7 223 845 103 280 383 45.3% 974,748 35,214 418 186 37 4,734 218 965 1,016,520 12,936 417,270 430,206 118,11634 Raisen Bhopal 61.6 1,477 5,625 897 2,743 3,640 64.7% 1,195,235 120,331 1,725 2,262 253 10,637 190 964 1,331,597 13,223 478,634 491,857 510,77435 Rajgarh Bhopal 15.6 454 2,046 280 197 477 23.3% 1,433,879 106,928 1,243 460 121 1,599 50 1,534 1,545,814 30,443 292,175 322,618 172,63536 Ratlam Ujjain 42.5 1,021 4,083 430 1,932 2,362 57.8% 1,267,043 151,071 3,996 1,353 175 29,353 123 1,955 1,455,069 41,391 872,814 914,205 170,80637 Rewa Jabalpur 42.0 387 1,750 506 409 915 52.3% 2,268,838 85,414 1,964 832 986 655 232 6,185 2,365,106 8,073 794,747 802,820 213,71138 Sagar Jabalpur 61.0 2,464 9,247 1,048 6,363 7,411 80.1% 2,198,297 103,480 5,580 4,146 991 62,992 168 2,804 2,378,458 23,956 829,593 853,549 196,17839 Satna - 22.7 683 2,587 343 780 1,123 43.4% 2,158,623 59,471 2,228 1,163 364 3,135 1,689 2,262 2,228,935 51,522 205,100 256,622 133,06940 Sehore Bhopal 47.4 1,267 5,304 768 2,060 2,828 53.3% 1,163,607 137,980 1,404 640 357 6,232 66 1,046 1,311,332 21,376 491,310 512,686 124,94341 Seoni Jabalpur 61.5 206 624 44 180 224 35.9% 1,145,052 79,739 1,857 360 7,288 4,982 135,315 4,538 1,379,131 6,131 500,752 506,883 86,90042 Singrauli - - 280 1,259 155 354 509 40.4% 1,118,998 46,574 2,332 1,422 338 182 6,139 2,288 1,178,273 29,690 306,744 336,434 292,14543 Shahdol Jabalpur 48.5 241 826 79 282 361 43.7% 997,073 42,426 2,372 912 268 1,737 19,448 1,827 1,066,063 560 244,573 245,133 144,96144 Shajapur Ujjain 32.3 514 2,357 587 327 914 38.8% 1,321,003 174,724 815 631 179 13,755 66 1,508 1,512,681 16,691 527,805 544,496 370,24745 Sheopur Gwalior 27.6 209 1,067 34 217 251 23.5% 638,702 41,396 230 6,387 201 379 40 526 687,861 14,314 433,067 447,381 94,03946 Shivpuri Gwalior 48.7 627 2,885 87 1,587 1,674 58.0% 1,648,749 51,200 1,117 7,151 3,421 12,171 72 2,169 1,726,050 2,850 542,021 544,871 80,16747 Sidhi Jabalpur 54.9 189 688 24 93 117 17.0% 1,077,545 34,419 511 128 92 93 12,556 1,689 1,127,033 6,407 360,563 366,970 232,23148 Tikamgarh Gwalior 49.6 220 1,030 246 312 558 54.2% 1,383,475 44,143 588 251 109 15,569 39 992 1,445,166 33,558 238,866 272,424 309,82149 Ujjain Ujjain 21.3 1,481 5,150 1,136 1,681 2,817 54.7% 1,718,204 233,133 4,659 3,241 945 24,622 211 1,849 1,986,864 974 337,852 338,826 46,33550 Umaria - 74.5 218 939 48 567 615 65.5% 620,515 15,966 667 190 70 220 6,028 1,102 644,758 13,026 351,331 364,357 152,48051 Vidisha Bhopal 50.7 729 3,048 526 870 1,396 45.8% 1,287,391 149,548 1,313 914 295 18,490 70 854 1,458,875 1,598 524,152 525,750 203,285
MP 38.39 37,822 146,435 19,703 55,162 74,865 66,007,121 4,774,695 213,282 151,412 216,052 567,028 599,594 97,625 72,626,809 840,977 18,761,389 19,602,366 8,187,989Note: *1: Source: State Planning Commission, Government of Madhya Pradesh website (2004) (http://mpplanningcommission.gov.in/international-aided-projects/pmpsu/reports_and_working_papers_08.11.10/District%20Wise%20Poverty%20Estimates.pdf) *2: Source: Population Census 2011 (Shajapur district includes Agarmalwa district in this data) *3: Source: Madya Pradesh State Livestock and Poutly Development Cooperation (http://mplivestock.com/animalhealth.html) *4: Source: Madya Pradesh State Livestock and Poutly Development Cooperation (http://mplivestock.com/stat.html) *5: Source: Department of Land Resource, Ministry of Rural Development website (2001-02) (http://dolr.nic.in/dolr/downloads/spsp/Madhya%20Pradesh_SPSP.pdf)
Population ('000 persons) *2 Religion (Persons) *2 Number of livestock *3
A-55

Madhya Pradesh
SlNo.
Name of DistrictName of
milk union
1 Agarmalwa -2 Alirajpur -3 Anuppur -4 Ashoknagar Bhopal5 Balaghat Jabalpur6 Barwani Indore7 Betul Bhopal8 Bhind Gwalior9 Bhopal Bhopal10 Burhanpur Indore11 Chhatarpur Jabalpur12 Chhindwara Jabalpur13 Damoh Jabalpur14 Datia Gwalior15 Dewas Indore16 Dhar Indore17 Dindori Jabalpur18 Guna Bhopal19 Gwalior Gwalior20 Harda Bhopal21 Hoshangabad Bhopal22 Indore Indore23 Jabalpur Jabalpur24 Jhabua Indore25 Katni Jabalpur26 Khandwa (East Indore27 Khargone (West Indore28 Mandla Jabalpur29 Mandsaur Ujjain30 Morena Gwalior31 Narsimhapur Jabalpur32 Neemuch Ujjain33 Panna Jabalpur34 Raisen Bhopal35 Rajgarh Bhopal36 Ratlam Ujjain37 Rewa Jabalpur38 Sagar Jabalpur39 Satna -40 Sehore Bhopal41 Seoni Jabalpur42 Singrauli -43 Shahdol Jabalpur44 Shajapur Ujjain45 Sheopur Gwalior46 Shivpuri Gwalior47 Sidhi Jabalpur48 Tikamgarh Gwalior49 Ujjain Ujjain50 Umaria -51 Vidisha Bhopal
MP
MilkProduction
(1,000MT)
noteNet Area
SownGross Sown
Area
NetIrrigated
Area
GrossIrrigated
Area
% of GrossIrrigatedArea toGross
Sown Area
RainfedArea
Canals TanksTubeWells
WellsOtherSource
s
GrossIrrigated Area
Geographical area
ForestBarren andunclutrable
land
land put tonon
Agriculture Use
CulturableWasteland.
Permanentpasture
andgraging
land.
Landunder
mise. Tree,crops, andGrovis net
Fallowland other
thancurrent
currentfallow
Net areasown.
Totalcropped
area.
Area sownmore than
- - - - - - - - - - - - - - - - - - - - - - - - - -- - - - - - - - - - - - - - - - - - - - - - - - - -
146.7 including Shahdol and Umaria 109,700 138,900 19,300 19,300 13.9 119,600 7 1 15 2 168 193 391,465 76,448 21,481 34,560 26,792 3,139 200 25,198 25,228 261,625 269,511 31,899187.3 including Guna 307,500 372,300 110,000 110,000 29.6 262,300 98 16 129 282 575 1,100 519,843 52,701 36,241 27,531 25,652 12,366 - 4,142 4,138 304,623 352,701 58,078
83.1 273,900 344,000 122,800 141,600 41.2 202,400 44 0 322 159 891 1,416 700,714 353,789 72,479 22,470 9,534 4,366 517 3,286 2,295 231,978 267,570 35,592181.7 including Khargeone 228,900 254,400 63,600 142,600 56.1 111,800 852 299 209 2 64 1,426 924,500 504,819 9,623 46,468 28,080 32,177 668 15,344 11,860 275,461 348,922 73,461111.3 403,500 554,800 107,200 107,200 19.3 447,600 117 1 661 95 198 1,072 1,007,800 396,280 25,939 46,798 42,325 27,641 4 35,998 31,684 401,131 529,293 128,162275.5 329,900 359,000 108,700 112,900 31.5 246,100 256 2 676 184 11 1,129 445,204 8,905 21,827 36,127 11,290 16,567 493 7,146 14,847 328,002 355,531 27,529
96.6 153,900 227,000 85,600 85,600 37.7 141,400 76 5 229 305 241 856 277,880 44,106 3,947 31,097 4,949 33,051 27 3,546 4,711 152,446 214,718 62,272116.2 including Khandwa 104,500 117,900 34,400 41,300 35.0 76,600 4 0 263 109 37 413 342,741 202,368 6,419 15,557 650 10,303 - 1,890 1,709 103,845 116,770 12,925170.5 403,800 511,300 226,600 226,600 44.3 284,700 297 50 1,468 21 430 2,266 863,036 214,215 1,609 35,798 74,394 70,513 301 42,058 36,505 397,643 485,018 97,375121.5 477,200 593,000 110,900 133,700 22.6 459,300 105 24 818 198 192 1,337 1,184,923 479,504 27,193 52,810 18,651 51,794 31 32,467 38,672 483,801 541,969 108,168
82.6 311,100 398,700 111,600 114,100 28.6 284,600 121 4 232 249 535 1,141 728,583 266,995 59,238 32,113 14,180 33,549 54 7,332 6,189 308,933 388,650 79,717102.9 197,200 278,400 133,500 136,300 49.0 142,100 306 11 767 43 236 1,363 295,874 24,798 14,564 21,607 13,537 4,472 2,814 7,483 7,267 199,332 237,243 37,911166.4 386,100 560,600 138,300 217,200 38.7 343,400 44 4 566 813 118 1,545 701,307 206,037 10,846 34,523 2,415 60,850 24 1,424 773 384,415 575,273 190,858233.1 504,500 638,800 166,000 166,000 26.0 472,800 86 77 540 1,073 396 2,172 819,541 120,755 75,653 47,401 16,274 46,881 33 3,583 2,559 506,402 696,563 190,161
92.5 including Mandia 204,900 273,700 1,500 154,500 56.5 119,200 11 32 1 1,613 3 1,660 358,935 25,311 11,219 26,979 13,493 12,255 60 31,833 32,440 205,345 271,815 66,470- 328,600 427,900 139,500 139,800 32.7 288,100 130 39 361 423 445 1,398 630,766 100,911 61,529 34,246 65,251 29,378 19 9,022 7,719 322,691 410,881 88,190
192.1 208,800 264,000 113,900 147,000 55.7 117,000 607 3 324 430 106 1,470 456,449 110,640 50,937 33,149 22,906 14,280 75 8,682 9,542 206,238 256,501 50,263145.7 including Hoshangabad 179,800 316,300 139,500 139,500 44.1 176,800 723 2 315 100 255 1,395 330,579 104,597 6,921 16,402 7,777 18,328 495 3,471 1,379 171,209 298,600 127,391
- 399,100 510,000 261,000 261,000 51.2 249,000 1,423 9 472 445 261 2,610 668,689 255,675 25,792 19,474 28,382 26,580 557 10,072 6,535 295,622 492,871 197,249171.6 258,200 370,300 93,700 145,100 39.2 225,200 31 42 81 1,151 146 1,451 383,097 52,208 6,857 24,033 14,705 21,526 75 2,973 2,109 258,611 425,814 167,203193.8 including Katni 272,700 364,600 108,500 123,600 33.9 241,000 83 1 229 654 269 1,236 519,757 77,639 36,828 31,985 24,155 40,120 53 16,984 17,517 274,476 374,533 100,057118.3 358,900 414,200 57,600 58,200 14.1 356,000 103 69 208 30 172 582 675,716 131,748 83,411 56,739 25,976 8,680 4 5,026 4,927 359,205 415,299 56,094
- 198,300 259,600 59,000 71,900 27.7 187,700 156 17 291 25 230 719 493,092 100,028 37,192 31,398 37,669 39,621 129 25,767 23,264 198,024 263,555 65,531- 304,400 381,700 113,900 113,900 29.8 267,800 45 13 749 112 220 1,139 775,616 309,300 8,595 67,855 187 54,424 40 11,961 5,988 317,266 393,711 76,445- 405,400 453,300 146,000 146,000 32.2 307,300 159 4 916 187 194 1,460 647,789 75,442 31,408 36,178 25,788 58,524 13 8,792 2,305 409,339 475,786 66,447- 219,000 280,200 19,900 19,900 7.1 260,300 127 0 26 0 46 199 965,559 592,951 10,631 42,766 19,642 19,603 66 32,656 28,914 218,330 281,048 62,718
261.1 including Neemuch 360,700 477,900 103,300 104,800 21.9 373,100 5 1 584 45 413 1,048 551,790 36,585 48,183 74,494 19,611 13,184 46 1,307 3,184 355,196 459,313 104,117384.5 includin Seopur 262,600 332,200 168,000 169,200 50.9 163,000 360 3 1,115 163 51 1,692 501,686 50,669 89,510 39,767 23,342 18,746 - 6,925 8,812 263,915 326,446 62,531
97.7 303,500 390,700 174,300 175,500 44.9 215,200 11 0 911 723 110 1,755 513,651 136,207 1,028 24,099 16,675 23,934 164 5,772 4,036 301,736 400,600 98,864- 186,700 292,900 84,100 84,200 28.8 208,700 15 0 297 140 390 842 393,553 94,487 39,058 42,656 19,962 7,706 3 971 1,584 188,126 259,009 71,883
137.6 251,500 297,600 84,400 84,400 28.4 213,200 126 88 212 46 372 844 702,924 299,533 22,839 40,598 41,814 20,302 - 15,783 15,309 246,746 282,114 35,368180.3 431,000 507,400 194,700 194,700 38.4 312,700 565 7 254 686 435 1,947 848,746 333,672 3,617 39,479 12,744 24,336 107 3,085 1,202 430,504 500,037 69,533155.2 424,500 548,400 118,900 158,400 28.9 390,000 51 49 1,021 291 172 1,584 616,300 17,636 30,173 40,692 31,435 68,586 50 5,415 2,417 419,896 584,650 164,754198.4 331,900 445,900 92,300 93,300 20.9 352,600 16 35 340 476 66 933 486,007 34,299 42,434 29,857 18,113 28,895 62 1,471 1,317 329,559 461,003 131,444170.3 369,400 502,200 88,600 97,900 19.5 404,300 148 20 289 271 251 979 628,745 85,289 34,499 59,931 5,181 27,197 1,596 23,341 20,089 371,622 503,781 132,159140.5 539,000 710,700 236,600 236,700 33.3 474,000 79 28 803 463 994 2,367 1,022,759 296,919 18,605 54,099 15,731 76,947 1,575 14,412 10,570 543,901 709,695 175,794167.3 357,000 481,400 136,800 138,400 28.8 343,000 72 16 370 632 294 1,384 742,432 203,659 14,882 61,823 46,383 19,817 3,634 16,586 15,963 359,685 475,908 116,223153.2 383,500 579,500 203,600 203,600 35.1 375,900 392 49 851 525 219 2,036 656,368 172,597 8,342 38,752 11,245 37,944 13 4,511 957 382,007 586,902 204,895
88.6 368,000 482,700 110,500 110,500 22.9 372,200 492 68 298 15 232 1,105 875,401 328,081 11,835 48,015 38,403 19,829 31 31,324 30,123 367,760 471,005 103,245- - - - - - - - - - - - - - - - - - - - - - - - -- 179,700 206,800 21,000 21,000 10.2 185,800 40 9 26 16 119 210 561,006 227,886 9,244 42,270 38,762 6,537 639 27,847 35,351 172,470 201,871 29,401
189.3 452,400 621,800 147,400 184,200 29.6 437,600 76 57 959 541 209 1,842 618,539 5,980 41,696 52,725 14,780 49,206 71 2,377 871 450,833 662,214 211,381- 159,900 199,000 115,100 120,200 60.4 78,800 458 10 64 440 230 1,202 666,650 291,187 97,164 31,440 42,563 34,457 - 8,206 6,183 156,450 194,319 38,869
170.5 405,900 545,000 193,100 199,100 36.5 345,900 317 49 917 431 277 1,991 995,392 330,111 37,966 60,496 81,309 25,887 3,886 28,093 26,912 400,732 523,352 122,620179 353,800 480,300 62,000 66,800 13.9 413,500 128 4 265 110 161 668 1,039,194 433,441 16,538 81,755 64,419 15,985 8 27,844 38,920 360,284 492,351 132,067
133.8 240,900 410,600 163,000 206,800 50.4 203,800 162 73 1,682 47 104 2,068 504,002 68,369 74,623 32,289 18,782 14,158 30 16,173 21,406 268,172 350,969 135,952188.8 489,400 674,500 143,900 205,200 30.4 469,300 3 47 459 1,289 254 2,052 609,874 3,149 5,981 57,616 10,656 40,823 138 1,991 1,248 488,272 762,481 274,209
- 161,800 195,700 4,200 18,900 9.7 176,800 28 8 44 29 80 189 450,329 236,714 8,663 29,764 15,439 16,312 172 16,565 18,166 108,534 140,479 31,945304 531,100 662,900 243,100 222,200 33.5 440,700 353 38 318 874 639 2,222 730,197 108,500 9,677 36,796 15,490 18,522 114 3,250 2,805 535,607 622,355 137,312
6289.5 15,074,000 19,711,000 5,681,400 6,370,800 13,340,200 9,905 1,352 22,945 15,348 8,251 63,708 30,825,000 8,683,140 1,424,936 1,925,477 1,177,493 1,360,298 19,091 621,385 598,501 15,078,000 19,711,000 4,842,732
*1: Source: State Planning Commission, Government of Madhya Pradesh website (2004) (http://mpplanningcommission.gov.in/international-aided-projects/pmpsu/reports_and_working_papers_08.11.10/District%20Wise%20Poverty%20Estimates.pdf)
Land Use (ha) *5Area of Irrigation (ha) *5 Source wise Irrigation Status (Area in 00hectare) *5
Volume of milk production (kg/year) *4
A-56

Uttar Pradesh
SlNo.
Name of DistrictName of milk
union
Totalhousehold
Totalpopulation
SCpopulation
STpopulation
SC+STpopulation
%(SC+ST/
Totalpop.)
Hindu Muslim Christian Sikh Buddhist Jain
Otherreligions
andpersuasion
s
Religionnot stated
Total
1 Agra Firozabad 2,420 12,565 2,332 157 2,489 19.8% 4,418,797 3,922,718 411,313 10,076 12,057 4,049 21,508 384 36,6922 Aligarh Aligarh 1,787 8,590 2,231 11 2,242 26.1% 3,673,889 2,904,140 729,283 7,635 5,875 2,582 2,805 91 21,4783 Allahabad Allahabad 5,672 22,820 7,862 532 8,394 36.8% 5,954,391 5,102,041 796,756 13,782 4,377 4,391 2,247 305 30,4924 Ambedkar Nagar Faizabad 265 1,184 247 22 269 22.7% 2,397,888 1,985,654 401,678 2,536 869 1,817 235 33 5,0665 Amethi - - - - - - - - - - - - - - - -6 Amroha Moradabad 240 1,229 253 8 261 21.2% 1,840,221 1,075,440 750,368 5,952 5,295 189 517 21 2,4397 Auraiya Kanpur 332 1,554 825 0 825 53.1% 1,379,545 1,273,546 101,963 1,004 371 332 228 444 1,6578 Azamgarh Azamgarh 665 3,128 1,060 47 1,107 35.4% 4,613,913 3,878,626 718,692 3,810 719 5,652 183 226 6,0059 Baghpat Meerut 224 1,057 154 9 163 15.4% 1,303,048 917,474 364,583 1,840 483 161 16,139 25 2,343
10 Bahraich Gonda 344 1,794 453 13 466 26.0% 3,487,731 2,291,892 1,169,330 6,400 8,212 2,793 1,177 38 7,88911 Ballia Azamgarh 420 2,115 395 98 493 23.3% 3,239,774 3,004,240 213,440 4,463 892 1,595 233 64 14,84712 Balrampur Gonda 427 1,914 436 19 455 23.8% 2,148,665 1,333,242 805,975 3,228 900 1,866 198 87 3,16913 Banda Chitrakoot 226 1,121 318 0 318 28.4% 1,799,410 1,637,549 157,612 1,367 231 168 916 50 1,51714 Barabanki Faizabad 1,264 5,742 1,754 30 1,784 31.1% 3,260,699 2,505,444 737,106 4,857 2,090 1,553 3,016 211 6,42215 Bareilly Bareilly 1,120 4,565 631 4 635 13.9% 4,448,359 2,830,768 1,536,534 14,822 28,187 4,371 931 339 32,40716 Basti Basti 451 2,025 591 14 605 29.9% 2,464,464 2,082,976 364,510 3,493 900 9,753 107 99 2,62617 Bhadohi Mirzapur 255 1,130 345 19 364 32.2% 1,578,213 1,368,291 203,887 1,365 199 1,562 161 7 2,74118 Bijnor Moradabad 493 2,510 659 21 680 27.1% 3,682,713 2,032,081 1,585,210 6,184 50,624 1,736 2,134 41 4,70319 Budaun Bareilly 540 2,786 986 0 986 35.4% 3,681,896 2,867,707 790,515 6,320 1,135 1,959 678 87 13,49520 Bulandshahar Meerut 514 2,617 558 10 568 21.7% 3,499,171 2,707,195 777,407 4,088 2,765 669 1,572 86 5,38921 Chandauli Varanasi 404 1,753 817 40 857 48.9% 1,952,756 1,727,869 215,081 2,153 1,389 340 100 1,175 4,64922 Chitrakoot Chitrakoot 125 596 254 0 254 42.6% 991,730 955,372 34,559 693 63 101 285 27 63023 Deoria Gorakhpur 843 3,959 748 160 908 22.9% 3,100,946 2,730,957 358,539 3,626 818 1,182 209 146 5,46924 Etah Aligarh 751 3,480 1,496 0 1,496 43.0% 1,774,480 1,611,126 146,346 2,464 708 2,887 5,671 18 5,26025 Etawah Kanpur 685 2,916 1,482 0 1,482 50.8% 1,581,810 1,457,892 113,961 1,362 1,045 1,733 3,917 94 1,80626 Faizabad Faizabad 595 2,492 926 5 931 37.4% 2,470,996 2,094,271 365,806 3,225 1,912 737 358 185 4,50227 Farukkhabad Kanpur 419 1,770 816 38 854 48.2% 1,885,204 1,596,278 276,846 3,137 3,160 3,161 487 100 2,03528 Fatehpur Allahabad 491 2,428 1,261 7 1,268 52.2% 2,632,733 2,274,674 350,700 2,201 402 172 199 47 4,33829 Firozabad Firozabad 708 3,574 861 49 910 25.5% 2,498,156 2,140,745 314,812 3,370 1,804 3,395 19,077 61 14,89230 Gautam Buddha Meerut 916 3,584 719 8 727 20.3% 1,648,115 1,394,025 215,500 7,366 9,261 895 4,518 91 16,45931 Ghaziabad Meerut 2,753 12,328 2,712 50 2,762 22.4% 4,681,645 3,414,427 1,186,776 19,026 23,001 3,487 16,412 265 18,25132 Ghazipur Varanasi 729 3,250 1,031 73 1,104 34.0% 3,620,268 3,233,790 368,153 4,181 810 3,145 213 184 9,79233 Gonda Gonda 739 3,352 876 24 900 26.8% 3,433,919 2,739,076 678,615 4,735 1,893 649 338 57 8,55634 Gorakhpur Gorakhpur 945 4,214 1,042 40 1,082 25.7% 4,440,895 4,009,037 403,847 9,662 2,123 2,848 460 207 12,71135 Hamirpur Chitrakoot 94 460 88 13 101 22.0% 1,104,285 1,010,014 91,269 814 196 74 41 273 1,60436 Hapur - - - - - - - - - - - - - - - -37 Hardoi Lucknow 510 2,609 1,120 1 1,121 43.0% 4,092,845 3,508,131 556,219 5,822 5,688 6,671 446 98 9,77038 Hathras Aligarh 309 1,493 469 0 469 31.4% 1,564,708 1,397,225 159,448 1,350 524 424 1,289 63 4,38539 Jalaun Jhansi 210 1,137 177 46 223 19.6% 1,689,974 1,509,708 171,581 1,148 463 2,875 256 145 3,79840 Jaunpur Varanasi 1,472 7,077 2,012 125 2,137 30.2% 4,494,204 3,981,502 483,750 4,947 1,286 7,898 349 114 14,35841 Jhansi Jhansi 575 2,272 902 111 1,013 44.6% 1,998,603 1,823,930 147,842 7,050 4,951 1,203 7,328 311 5,98842 Kannauj Kanpur 545 2,614 754 3 757 29.0% 1,656,616 1,375,788 273,967 1,263 504 2,033 606 65 2,39043 Kanpur Dehat Kanpur 555 2,820 992 67 1,059 37.6% 1,796,184 1,612,968 176,327 1,300 478 819 155 103 4,03444 Kanpur Nagar Kanpur 16,684 83,200 10,687 209 10,896 13.1% 4,581,268 3,792,174 720,660 15,751 29,676 2,733 5,710 589 13,97545 Kasganj Aligarh 297 1,465 680 9 689 47.0% 1,436,719 1,211,427 213,822 1,969 2,280 3,907 313 72 2,92946 Kaushambi Allahabad 320 1,690 497 107 604 35.7% 1,599,596 1,372,381 220,423 2,225 522 687 545 3 2,81047 Kushi Nagar Gorakhpur 480 2,331 334 72 406 17.4% 3,564,544 2,928,462 620,244 5,006 767 4,619 383 133 4,93048 Lakhimpur Kheri Lucknow 680 3,127 932 240 1,172 37.5% 4,021,243 3,078,262 807,600 7,502 94,388 18,454 487 226 14,32449 Lalitpur Jhansi 109 545 78 24 102 18.7% 1,221,592 1,163,804 33,724 1,351 1,034 69 20,390 41 1,17950 Lucknow Lucknow 5,737 18,119 3,602 264 3,866 21.3% 4,589,838 3,537,787 985,070 20,493 23,883 3,877 4,975 504 13,24951 Maharajganj Gorakhpur 567 2,985 660 7 667 22.3% 2,684,703 2,196,884 458,650 3,527 1,381 16,030 243 338 7,65052 Mahoba Chitrakoot 125 589 121 98 219 37.2% 875,958 815,142 57,454 965 389 94 234 157 1,52353 Mainpuri Firozabad 731 3,533 1,333 0 1,333 37.7% 1,868,529 1,746,649 100,723 1,729 475 8,814 4,161 38 5,94054 Mathura Firozabad 1,428 6,111 2,003 81 2,084 34.1% 2,547,184 2,310,776 216,933 3,179 2,872 883 2,056 126 10,35955 Mau Azamgarh 450 1,853 619 30 649 35.0% 2,205,968 1,769,937 428,555 2,109 340 564 155 129 4,17956 Meerut Meerut 891 4,270 725 45 770 18.0% 3,443,689 2,183,255 1,185,643 10,582 24,912 1,855 18,544 236 18,66257 Mirzapur Mirzapur 393 1,917 719 14 733 38.2% 2,496,970 2,292,534 195,765 2,373 1,133 341 701 27 4,09658 Moradabad Moradabad 707 3,432 595 20 615 17.9% 4,772,006 2,488,265 2,248,392 13,157 7,555 1,260 2,426 382 10,56959 Muzaffar Nagar Muz'Nagar 729 3,853 1,036 1 1,037 26.9% 4,143,512 2,382,914 1,711,453 6,495 18,601 1,516 16,345 60 6,12860 Pilibhit Bareilly 215 974 225 50 275 28.2% 2,031,007 1,449,007 489,686 3,510 84,787 360 138 45 3,47461 Pratapgarh Allahabad 1,214 5,319 1,455 96 1,551 29.2% 3,209,141 2,731,351 452,394 3,920 1,451 7,795 746 43 11,44162 Raebareli Lucknow 1,180 4,986 1,448 58 1,506 30.2% 3,405,559 2,975,998 413,243 3,634 2,424 722 397 602 8,53963 Rampur Moradabad 299 1,499 423 0 423 28.2% 2,335,819 1,073,890 1,181,337 9,201 65,316 384 1,307 63 4,32164 Saharanpur Muz'Nagar 423 1,668 296 0 296 17.7% 3,466,382 1,966,892 1,454,052 6,523 18,627 1,937 10,208 135 8,00865 Sambhal Moradabad - - - - - - - - - - - - - - -66 Sant Kabir Nagar Basti 178 688 195 0 195 28.3% 1,715,183 1,300,586 404,410 1,766 447 4,393 95 35 3,45167 Shahjahanpur Bareilly 533 2,577 715 7 722 28.0% 3,006,538 2,412,595 527,581 4,630 51,090 2,312 301 84 7,94568 Shamli Muz'Nagar - - - - - - - - - - - - - - -69 Shravasti Gonda 268 1,253 475 0 475 37.9% 1,117,361 768,643 343,981 1,427 407 323 68 56 2,45670 Siddharth Nagar - 352 1,475 252 27 279 18.9% 2,559,297 1,789,704 748,073 3,042 681 11,964 179 356 5,29871 Sitapur Lucknow 723 3,460 1,155 9 1,164 33.6% 4,483,992 3,555,450 893,725 6,579 11,611 2,663 1,410 79 12,47572 Sonbhadra Mirzapur 201 919 354 106 460 50.1% 1,862,559 1,738,769 103,567 3,963 1,649 1,747 487 1,907 10,47073 Sultanpur Faizabad 1,213 5,514 1,337 63 1,400 25.4% 3,797,117 3,119,590 650,261 4,453 1,629 9,989 426 336 10,43374 Unnao Lucknow 780 3,460 1,580 57 1,637 47.3% 3,108,367 2,732,016 363,453 3,574 1,204 920 240 31 6,92975 Varanasi Varanasi 1,513 5,689 1,001 118 1,119 19.7% 3,676,841 3,107,681 546,987 7,696 3,309 1,146 1,898 298 7,826
UP 72,452 329,125 79,177 3,686 82,863 199,812,341 159,312,654 38,483,967 356,448 643,500 206,285 213,267 13,598 582,622Note: *1: Source: Population Census 2011
*2: Source: NDDB (2017) Dairying InUttar Pradesh A Statistical Profile 2017 (http://dairyknowledge.in/sites/default/files/nddb-up_31-03-17.pdf)
Population (persons)*1 Religion (persons) *1
A-57

Uttar Pradesh
SlNo.
Name of DistrictName of milk
union
1 Agra Firozabad2 Aligarh Aligarh3 Allahabad Allahabad4 Ambedkar Nagar Faizabad5 Amethi -6 Amroha Moradabad7 Auraiya Kanpur8 Azamgarh Azamgarh9 Baghpat Meerut
10 Bahraich Gonda11 Ballia Azamgarh12 Balrampur Gonda13 Banda Chitrakoot14 Barabanki Faizabad15 Bareilly Bareilly16 Basti Basti17 Bhadohi Mirzapur18 Bijnor Moradabad19 Budaun Bareilly20 Bulandshahar Meerut21 Chandauli Varanasi22 Chitrakoot Chitrakoot23 Deoria Gorakhpur24 Etah Aligarh25 Etawah Kanpur26 Faizabad Faizabad27 Farukkhabad Kanpur28 Fatehpur Allahabad29 Firozabad Firozabad30 Gautam Buddha Meerut31 Ghaziabad Meerut32 Ghazipur Varanasi33 Gonda Gonda34 Gorakhpur Gorakhpur35 Hamirpur Chitrakoot36 Hapur -37 Hardoi Lucknow38 Hathras Aligarh39 Jalaun Jhansi40 Jaunpur Varanasi41 Jhansi Jhansi42 Kannauj Kanpur43 Kanpur Dehat Kanpur44 Kanpur Nagar Kanpur45 Kasganj Aligarh46 Kaushambi Allahabad47 Kushi Nagar Gorakhpur48 Lakhimpur Kheri Lucknow49 Lalitpur Jhansi50 Lucknow Lucknow51 Maharajganj Gorakhpur52 Mahoba Chitrakoot53 Mainpuri Firozabad54 Mathura Firozabad55 Mau Azamgarh56 Meerut Meerut57 Mirzapur Mirzapur58 Moradabad Moradabad59 Muzaffar Nagar Muz'Nagar60 Pilibhit Bareilly61 Pratapgarh Allahabad62 Raebareli Lucknow63 Rampur Moradabad64 Saharanpur Muz'Nagar65 Sambhal Moradabad66 Sant Kabir Nagar Basti67 Shahjahanpur Bareilly68 Shamli Muz'Nagar69 Shravasti Gonda70 Siddharth Nagar -71 Sitapur Lucknow72 Sonbhadra Mirzapur73 Sultanpur Faizabad74 Unnao Lucknow75 Varanasi Varanasi
UP
Total Exot-ic / Cross-bred cattle
Total In-digenous
Cattle
TotalCattle
TotalBuffaloes
Crossbred Cow
LocalCow
TotalCow
BuffaloTotal
(Cow+Buf)Other
TotalProductio
n
Reporting Area
ForestArea
PPGLFallowLand
Net sownarea
59 152 211 928 48 71 119 523 642 43 685 399 36 1 23 27967 136 203 1,130 34 56 90 553 643 27 670 371 3 2 9 304
149 551 700 585 93 129 222 261 483 23 506 557 21 2 104 30254 174 228 289 18 40 58 148 206 23 229 236 0 1 15 16744 298 342 270 238 1 2 33 14757 92 149 658 19 31 50 209 259 4 263 217 21 0 4 1729 94 103 254 9 30 39 158 197 13 210 206 4 1 20 146
143 397 540 438 77 142 219 259 478 36 514 424 0 1 42 30081 18 99 416 31 17 48 313 361 2 363 135 2 0 3 10811 525 536 366 5 105 110 172 282 43 325 486 68 1 20 32884 190 274 234 57 62 119 135 254 18 272 299 0 0 20 2174 269 273 166 2 63 65 78 143 13 156 325 59 0 7 2131 371 372 324 1 106 107 150 257 12 269 439 5 0 23 345
16 322 338 446 12 107 119 182 301 30 331 389 6 2 43 25929 233 262 637 15 53 68 419 487 16 503 407 0 0 10 33055 99 154 334 30 40 70 194 264 10 274 277 4 1 8 20992 118 210 145 18 16 34 65 99 3 102 437 10 1 19 35195 208 303 663 32 72 104 271 375 9 384 465 54 0 11 32624 238 262 802 15 97 112 445 557 22 579 427 7 0 8 351
138 86 224 1,244 62 43 105 1,163 1,268 17 1,285 365 8 1 5 29942 163 205 222 30 45 75 122 197 8 205 253 77 0 7 1373 419 422 183 2 100 102 80 182 12 194 339 60 0 19 173
110 90 200 211 31 41 72 162 234 31 265 249 0 0 12 19724 122 146 663 17 68 85 606 691 53 744 244 1 0 19 18615 112 127 293 11 39 50 157 207 19 226 240 36 1 17 14728 352 380 290 14 84 98 129 227 19 246 260 3 2 27 17334 79 113 291 16 37 53 139 192 10 202 220 0 1 26 14916 305 321 594 7 65 72 216 288 33 321 422 8 3 45 28916 83 99 523 11 32 43 290 333 36 369 241 9 1 12 18322 24 46 288 14 5 19 259 278 2 280 125 2 1 29 5345 17 62 295 63 20 83 574 657 6 663 93 2 0 8 5156 326 382 479 40 89 129 274 403 27 430 333 0 1 19 25453 417 470 395 26 99 125 250 375 14 389 401 13 1 30 287
103 186 289 279 100 68 168 197 365 16 381 335 6 0 24 2461 269 270 200 1 70 71 63 134 10 144 391 24 0 25 293
56 17 73 297 - - - - - - - 114 1 0 6 8740 469 509 624 30 106 136 291 427 23 450 599 12 5 57 43427 37 64 455 13 23 36 275 311 12 323 180 2 1 4 1497 217 224 256 3 72 75 132 207 30 237 454 28 0 24 351
142 330 472 464 56 159 215 299 514 21 535 400 0 1 52 2793 350 353 243 1 69 70 101 171 23 194 501 34 1 36 336
30 100 130 323 11 31 42 181 223 26 249 209 13 2 8 15318 160 178 398 47 40 87 123 210 16 226 315 6 0 35 22249 146 195 374 30 43 73 217 290 13 303 301 6 4 34 18810 88 98 793 - - - - - - - 196 2 9 14312 151 163 221 9 31 40 99 139 13 152 186 0 1 18 12884 74 158 269 30 39 69 211 280 31 311 291 1 1 5 22453 608 661 528 12 99 111 218 329 21 350 773 165 1 24 4802 481 483 235 2 92 94 89 183 18 201 510 76 3 25 305
42 238 280 275 30 59 89 179 268 10 278 252 12 3 30 13834 52 86 182 17 50 67 169 236 28 264 291 50 0 5 2010 228 228 136 0 47 47 76 123 19 142 327 16 1 15 239
11 75 86 465 9 34 43 170 213 30 243 273 2 1 27 18626 201 227 782 19 55 74 433 507 13 520 330 2 1 9 26928 132 160 175 32 56 88 112 200 20 220 172 1 0 16 122
129 36 165 648 63 34 97 632 729 5 734 273 21 0 8 19591 336 427 251 51 92 143 116 259 9 268 453 109 1 57 19183 100 183 532 30 59 89 531 620 13 633 224 0 0 4 186
166 42 208 553 94 56 150 823 973 7 980 294 24 0 7 22014 138 152 268 9 50 59 160 219 7 226 378 80 0 8 23391 287 378 356 25 60 85 178 263 18 281 362 1 1 75 18414 380 394 331 29 117 146 200 346 23 369 392 4 3 77 22434 124 158 441 23 38 61 258 319 9 328 236 7 0 3 191
147 113 260 634 32 52 84 425 509 9 518 364 33 0 5 27359 112 171 579 - - - - - - - 245 0 0 5 20130 63 93 132 11 44 55 84 139 10 149 103 0 0 13 6921 267 288 490 19 71 90 188 278 17 295 128 5 0 2 10367 20 87 305 - - - - - - - 175 4 0 12 1212 198 200 131 2 34 36 62 98 9 107 193 34 0 1 1326 266 272 167 6 102 108 191 299 24 323 298 4 1 12 236
51 438 489 479 20 137 157 340 497 27 524 574 6 1 39 44515 461 476 225 5 116 121 112 233 14 247 681 326 0 68 14644 345 389 272 52 120 172 228 400 28 428 266 1 1 29 1788 373 381 506 5 80 85 310 395 24 419 460 17 3 46 314
53 188 241 295 58 35 93 92 185 9 194 153 0 0 21 963,579 15,978 19,557 30,625 1,840 4,546 6,386 17,524 23,910 1,288 25,198 24,170 1,658 65 1,674 16,546
Land use ('000 ha) *2Volume of milk production ('000MT/Year) *2Number of livestock *2
A-58

Annex 7 Results of Socioeconomic Situation Survey
1. Basic Descriptions of Socioeconomic Situation SurveySocioeconomic Situation Survey was conducted in order to elucidate the current
situations of dairy activities and the livelihoods of dairy farmers and the social and economic contributions of cooperatives to these farmers.
1.1 Sample Villages of the Survey The table below shows the list of target villages of the Survey. The target villages were
selected from the districts where the target unions of this Study are located. As shown in the table, these villages have different characteristics in location, water source, and social characteristics. Also, three villages where DCS do not exist are included in the target villages (Kanfalla Bhokatgao in Assam, Haravala in Karnataka, Raipura in Uttar Pradesh) in order to compare the socioeconomic situations of the villages where DCS exist.
For the analysis of the following sections, south and north Karnataka are regarded as separate category as the nature of dairy activities are significantly different between them.
Table: 1-1: List of target villages of Socioeconomic Situation Survey
State District Village Union Water source for agriculture Characteristics
Gujarat
Anand Mujkuva Kaira Canal, borewell 20Km to Anand city
Banaskantha Saral Vid
Banaskantha Canal, borewell Scheduled Caste (SC) and Scheduled
Tribe (ST) are predominant
Thavar Borewell, rainwater Semi-arid area, but villagers are holding a large number of livestock
Bihar
Patna Guai Patna Canal, borewell Close to Patna city (15Km)
Samastipur Rahmatpur
Samastipur Borewell Close to Samastipur city (7Km)
Chakhaji Borewell Remote area
Assam
Kamrup Rural
Uzankuri WAMUL
Borewell Close to river and face frequent flood
Malaybari Canal, borewell Remote area (50Km from Guwahati city)
Golaghat Kanfalla Bhokatgao No DCS Borewell Close to small town
South Karnataka
Bangalore rural Kammasandra Bangalore Rainwater, borewell 25Km to Bangalore city
Gulbarga Kumasi Gulbarga Borewell Relatively dry area
A-59

North Karnataka Haravala No DCS Canal Remote area
Uttar Pradesh
Chandaulli Nadara Varanasi Canal, Borewell 45Km to Varanasi city
Raipura No DCS Canal, Borewell Bad road access
Ghaziabad Sakoorpur Meerut Borewell Close to Delhi
1.2 Characteristics of the Sample Households As shown in Table-2, the sample size of the survey is 1,171 households where there are 75-85 households for each village. The households are extracted so that both the members of the DCS and non-members are included in the sample.
Table 1-2: Number of sample household for each village
State, Village Villages with DCS Village
without DCS
Total Member Non-
member Gujarat 159 72 231
Mujkuva 53 25 78 Saral Vid 67 8 75 Thavar 39 39 78
Bihar 135 102 237 Guai 54 28 82 Rahmatpur 40 35 75 Chakhaji 41 39 80
Assam 83 70 79 232 Uzankuri 40 37 77 Malaybari 43 33 76 Kanfalla Bhokatgao 79 79
Karnataka 95 59 79 233 Kommasandra 43 35 78 Kumasi 52 24 76 Haravala 79 79
UP 112 51 75 238 Nadara 59 26 85 Raipura 75 75 Sakoorpur 53 25 78
Total 584 354 233 1,171
The sample also is diversified in terms of the social category of the households. As shown in Table 1-3, the households of general caste, other backward categories (OBC), scheduled caste (SC), and scheduled tribe (ST) are included in the sample.
Table 1-3: Number of sample households by social category Villages with DCS Total
A-60

Member Non-member
Village without
DCS Gujarat 159 72 231
General 4 9 13 OBC 68 36 104 SC 25 19 44 ST 61 8 69 Others 1 1
Bihar 135 102 237 General 40 28 68 OBC 51 42 93 SC 44 30 74 Others 2 2
Assam 83 70 79 232 General 25 21 20 66 OBC 29 27 27 83 SC 29 22 51 Others 32 32
Karnataka 95 59 79 233 General 47 22 22 91 OBC 15 9 27 51 SC 23 23 21 67 ST 10 5 9 24
UP 112 51 75 238 General 19 9 15 43 OBC 60 31 34 125 SC 33 10 26 69 ST 1 1
Total 584 354 233 1171
2. Ownership of Cattle and Buffalo and Dairy Production and Sales 2.1 Scale of Cattle and Buffalo Holdings
Table 2-1 and 2-2 show the average number of cattle and buffalo and female adult cattle and buffalo per household for each village and state respectively. One can see that the average holding of cattle and buffalo is relatively high in the sample households in Gujarat and Assam. Also, the average holding of milking animal (female adult cattle and buffalo) is only 1.7 in the whole sample.
Table 2-1: Average number of cattle and buffalo and female adult cattle and buffalo per household for each sample village
A-61

State, Village Average
number of cattle and buffalo
Average number of female adult
cattle and buffalo
Gujarat 5.0 2.8 Mujkuva 3.9 2.2 Saral Vid 4.4 2.3 Thavar 6.7 3.7
Bihar 1.9 0.8 Guai 1.9 0.9 Rahmatpur 2.3 0.8 Chakhaji 1.7 0.7
Assam 4.3 1.8 Uzankuri 3.7 1.8 Malaybari 5.1 2.3 Kanfalla Bhokatgao 4.0 1.3
South Karnataka 2.1 1.4 North Karnataka 2.5 1.2
Kumasi 2.2 0.9 Haravala 2.9 1.5
UP 2.5 1.6 Nadara 2.2 1.4 Raipura 2.4 1.6 Sakoorpur 3.0 2.0
Total 3.2 1.7
Table 2-2: Average number of cattle and buffalo and female adult cattle and buffalo per household for each state
State Average
number of cattle and buffalo
Average number of
female adult cattle and buffalo
Gujarat 5.0 2.8 Bihar 1.9 0.8 Assam 4.3 1.8 South Karnataka 2.1 1.4 North Karnataka 2.5 1.2 UP 2.5 1.6 Total 3.2 1.7
Table 2-3 and 2-4 show the average number of cattle and buffalo holding per household
for each category of rural households based on the Socioeconomic Situation Survey. One can see that the number of cattle and buffalo holdings increases as the scale of landholdings expands. It also shows that the degree of increase in the number of livestock holdings is much higher in
A-62
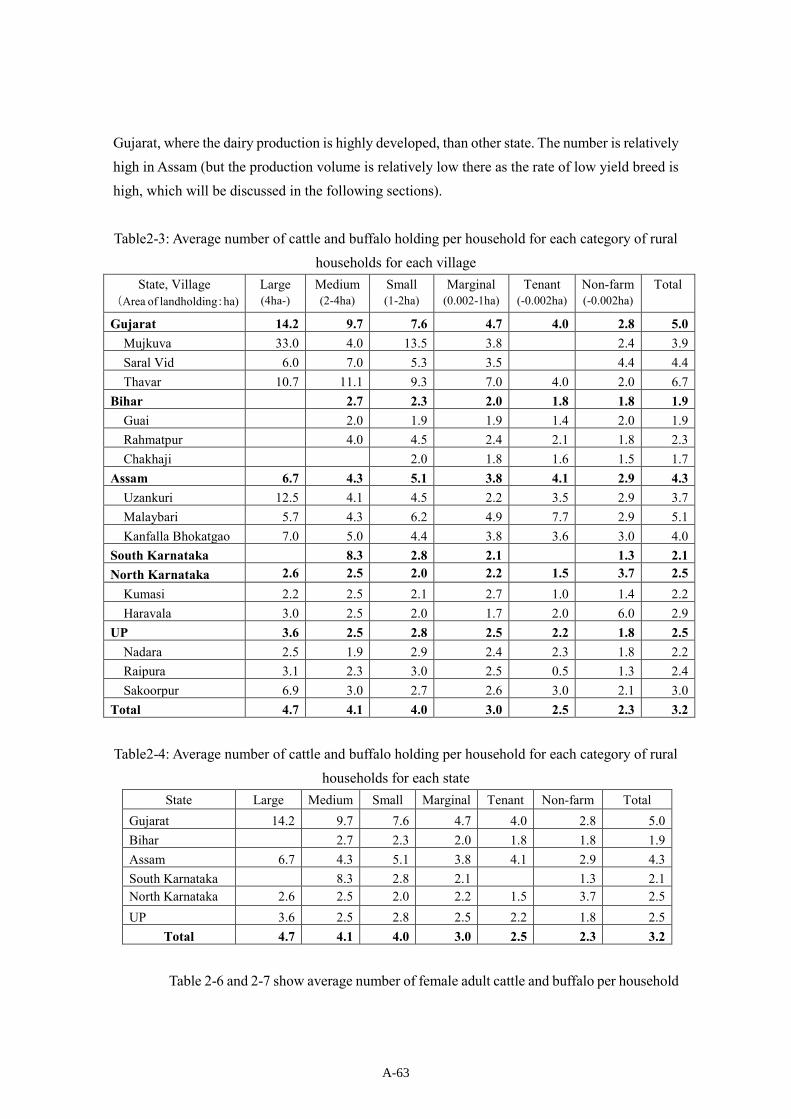
Gujarat, where the dairy production is highly developed, than other state. The number is relatively high in Assam (but the production volume is relatively low there as the rate of low yield breed is high, which will be discussed in the following sections). Table2-3: Average number of cattle and buffalo holding per household for each category of rural
households for each village State, Village Large Medium Small Marginal Tenant Non-farm Total
(Area of landholding:ha) (4ha-) (2-4ha) (1-2ha) (0.002-1ha) (-0.002ha) (-0.002ha)
Gujarat 14.2 9.7 7.6 4.7 4.0 2.8 5.0 Mujkuva 33.0 4.0 13.5 3.8 2.4 3.9 Saral Vid 6.0 7.0 5.3 3.5 4.4 4.4 Thavar 10.7 11.1 9.3 7.0 4.0 2.0 6.7
Bihar 2.7 2.3 2.0 1.8 1.8 1.9 Guai 2.0 1.9 1.9 1.4 2.0 1.9 Rahmatpur 4.0 4.5 2.4 2.1 1.8 2.3 Chakhaji 2.0 1.8 1.6 1.5 1.7
Assam 6.7 4.3 5.1 3.8 4.1 2.9 4.3 Uzankuri 12.5 4.1 4.5 2.2 3.5 2.9 3.7 Malaybari 5.7 4.3 6.2 4.9 7.7 2.9 5.1 Kanfalla Bhokatgao 7.0 5.0 4.4 3.8 3.6 3.0 4.0
South Karnataka 8.3 2.8 2.1 1.3 2.1 North Karnataka 2.6 2.5 2.0 2.2 1.5 3.7 2.5
Kumasi 2.2 2.5 2.1 2.7 1.0 1.4 2.2 Haravala 3.0 2.5 2.0 1.7 2.0 6.0 2.9
UP 3.6 2.5 2.8 2.5 2.2 1.8 2.5 Nadara 2.5 1.9 2.9 2.4 2.3 1.8 2.2 Raipura 3.1 2.3 3.0 2.5 0.5 1.3 2.4 Sakoorpur 6.9 3.0 2.7 2.6 3.0 2.1 3.0
Total 4.7 4.1 4.0 3.0 2.5 2.3 3.2
Table2-4: Average number of cattle and buffalo holding per household for each category of rural households for each state
State Large Medium Small Marginal Tenant Non-farm Total Gujarat 14.2 9.7 7.6 4.7 4.0 2.8 5.0 Bihar 2.7 2.3 2.0 1.8 1.8 1.9 Assam 6.7 4.3 5.1 3.8 4.1 2.9 4.3 South Karnataka 8.3 2.8 2.1 1.3 2.1 North Karnataka 2.6 2.5 2.0 2.2 1.5 3.7 2.5 UP 3.6 2.5 2.8 2.5 2.2 1.8 2.5
Total 4.7 4.1 4.0 3.0 2.5 2.3 3.2
Table 2-6 and 2-7 show average number of female adult cattle and buffalo per household
A-63

for each category of rural households for each sample village. Similar trends can be seen as table 2-4 and 2-5.
Table 2-6: Average number of female adult cattle and buffalo per household for each category of
rural households for each sample village
State, Village Large Medium Small Marginal Tenant Non-farm Total
Gujarat 8.0 5.3 3.6 2.5 0.0 1.9 2.8 Mujkuva 15.0 3.5 7.8 1.8 1.7 2.2 Saral Vid 4.0 2.3 2.4 1.9 2.9 2.3 Thavar 7.0 6.3 3.9 3.8 0.0 1.4 3.7
Bihar 1.0 1.1 0.8 0.6 0.8 0.8 Guai 0.5 1.2 1.0 0.6 0.9 0.9 Rahmatpur 2.0 0.5 0.9 0.7 0.7 0.8 Chakhaji 2.0 0.6 0.5 1.0 0.7
Assam 2.7 2.0 2.2 1.5 2.0 1.1 1.8 Uzankuri 5.0 1.9 2.6 1.2 1.7 1.2 1.8 Malaybari 2.6 2.2 2.6 2.1 4.7 1.0 2.3 Kanfalla Bhokatgao 2.0 2.0 1.3 1.3 1.4 0.9 1.3
South Karnataka 1.0 1.4 1.0 1.2 0.3 1.7 1.3 North Karnataka 1.0 1.1 1.0 1.0 0.3 2.3 1.2
Kumasi 1.0 1.1 0.9 1.1 0.0 0.6 0.9 Haravala 1.0 1.0 1.0 0.8 0.5 4.1 1.5
UP 2.3 1.6 1.9 1.7 1.3 1.2 1.6 Nadara 1.4 1.2 1.6 1.7 1.4 1.3 1.4 Raipura 2.3 1.6 2.0 1.5 0.5 0.9 1.6 Sakoorpur 4.0 1.8 1.9 2.0 1.5 1.4 2.0
Total 2.4 2.2 1.9 1.5 1.1 1.4 1.7 Table 2-7: Average number of female adult cattle and buffalo per household for each category of
rural households for each state
State, Village Large Medium Small Marginal Tenant Non-farm Total
Gujarat 8.0 5.3 3.6 2.5 0.0 1.9 2.8 Bihar 1.0 1.1 0.8 0.6 0.8 0.8 Assam 2.7 2.0 2.2 1.5 2.0 1.1 1.8 South Karnataka 1.0 1.4 1.0 1.2 0.3 1.7 1.3 North Karnataka 1.0 1.1 1.0 1.0 0.3 2.3 1.2 UP 2.3 1.6 1.9 1.7 1.3 1.2 1.6 Total 2.4 2.2 1.9 1.5 1.1 1.4 1.7
Table 2-8 depicts the distribution of rural households depending on the number of cattle and buffalo holdings based on the Socioeconomic Situation Survey. Figure 2-1 is the graphical
A-64

presentation of it. One can see that, for overall, more than half of the households own less than two cattle and buffaloes. The ratio of households who own more than 10 cattle and buffaloes are relatively high in Gujarat and Assam, but it is quite low in other states.
Table 2-8: Distribution of rural households for the number of cattle and buffalo holdings
Number of cattle and buffalo
holdings
Gujarat Bihar Assam South Karnataka
North Karnataka UP Total
0 13.4% 3.8% 9.9% 26.9% 10.3% 4.2% 9.4% 1 3.9% 32.6% 7.3% 11.5% 25.0% 21.4% 17.3% 2 13.0% 40.6% 18.9% 29.5% 32.6% 33.2% 27.6% 3 11.7% 15.9% 11.6% 14.1% 14.8% 21.8% 15.1% 4 17.3% 4.2% 13.7% 7.7% 9.0% 10.5% 10.8% 5 8.2% 1.3% 11.6% 3.8% 2.5% 3.8% 5.5% 6 7.8% 1.3% 9.4% 2.6% 3.8% 2.9% 4.9% 7 4.3% 0.4% 3.0% 1.3% 0.0% 0.8% 1.8% 8 3.0% 0.0% 1.7% 0.0% 0.6% 0.0% 1.0% 9 2.2% 0.0% 3.0% 1.3% 0.0% 0.4% 1.2% More than 10 15.2% 0.0% 9.9% 1.3% 2.0% 0.8% 5.4%
Figure 2-1: Distribution of rural households for the number of cattle and buffalo holdings Table 2-9 shows the comparison between DCS members and non-members in terms of the number of cattle and buffalo holdings. Figure 2-2 is the graphical representation of it. One
0%
5%
10%
15%
20%
25%
30%
35%
40%
45%
0 1 2 3 4 5 6 7 8 9 10 11 12 13 14 15 16 19 21 26 33 35 37
% o
f ho
useh
olds
Number of cattle and buffalo holdings
Assam
Bihar
Gujarat
NorthKarnatakaSouthKarnatakaUP
A-65
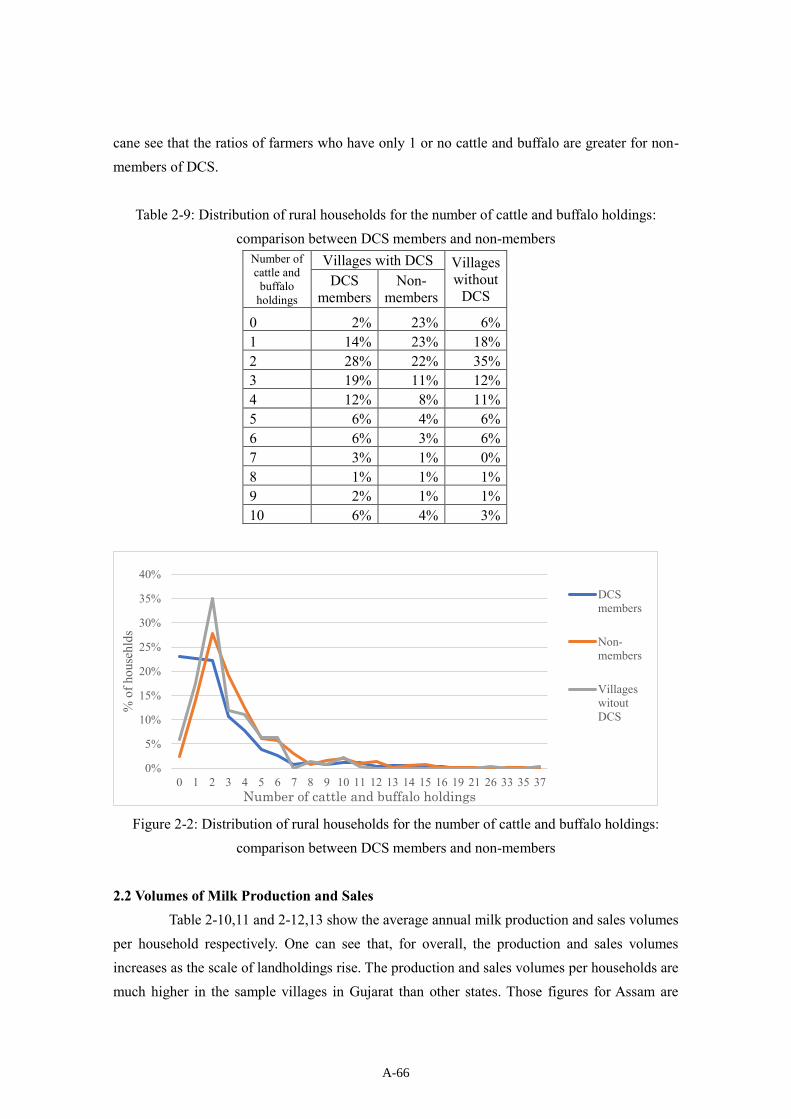
cane see that the ratios of farmers who have only 1 or no cattle and buffalo are greater for non-members of DCS.
Table 2-9: Distribution of rural households for the number of cattle and buffalo holdings: comparison between DCS members and non-members
Number of cattle and buffalo
holdings
Villages with DCS Villages without
DCS DCS
members Non-
members
0 2% 23% 6% 1 14% 23% 18% 2 28% 22% 35% 3 19% 11% 12% 4 12% 8% 11% 5 6% 4% 6% 6 6% 3% 6% 7 3% 1% 0% 8 1% 1% 1% 9 2% 1% 1% 10 6% 4% 3%
Figure 2-2: Distribution of rural households for the number of cattle and buffalo holdings:
comparison between DCS members and non-members 2.2 Volumes of Milk Production and Sales Table 2-10,11 and 2-12,13 show the average annual milk production and sales volumes per household respectively. One can see that, for overall, the production and sales volumes increases as the scale of landholdings rise. The production and sales volumes per households are much higher in the sample villages in Gujarat than other states. Those figures for Assam are
0%
5%
10%
15%
20%
25%
30%
35%
40%
0 1 2 3 4 5 6 7 8 9 10 11 12 13 14 15 16 19 21 26 33 35 37
% o
f hou
sehl
ds
Number of cattle and buffalo holdings
DCSmembers
Non-members
VillageswitoutDCS
A-66

relatively low even though the number of livestock holdings is high, indicating the low productivity of the cows and buffaloes reared there.
Table 2-10: Average annual milk production volume per household for each village (liter)
State, Village Large Medium Small Marginal Tenant Non-farm Total
Gujarat 16,254 12,987 6,728 3,753 2,520 2,241 4,695 Mujkuva 31,590 2,760 6,555 1,878 1,708 2,428 Saral Vid 6,780 5,220 4,659 2,657 3,493 3,510 Thavar 14,300 16,208 10,950 6,919 2,520 2,086 8,102
Bihar 2,850 1,680 1,574 1,169 1,249 1,441 Guai 3,150 1,846 1,496 1,050 1,393 1,512 Rahmatpur 2,250 1,554 830 972 1,203 Chakhaji 2,880 1,647 1,783 1,365 1,595
Assam 2,388 1,283 1,370 569 1,264 650 1,058 Uzankuri 6,300 1,358 2,492 347 1,355 771 1,435 Malaybari 2,311 1,384 1,264 1,350 1,235 771 1,404 Kanfalla Bhokatgao 663 270 242 255 1,131 308 358
South Karnataka 8,920 1,730 2,590 2,562 2,758 North Karnataka 732 639 432 506 135 718 597
Kumasi 1,028 930 401 864 0 304 685 Haravala 435 348 463 148 270 1,131 508
UP 3,547 2,132 3,087 1,976 1,610 1,831 2,301 Nadara 2,455 674 2,668 2,070 1,685 1,907 1,849 Raipura 2,957 2,529 2,918 1,768 630 1,661 2,133 Sakoorpur 6,754 2,903 3,424 2,269 1,875 1,885 2,956
Total 3,340 3,470 2,312 2,009 1,297 1,607 2,157
Table 2-11: Average annual milk production volume per household for each state (liter) State Large Medium Small Marginal Tenant Non-farm Total
Gujarat 16,254 12,987 6,728 3,753 2,520 2,241 4,695 Bihar 2,850 1,680 1,574 1,169 1,249 1,441 Assam 2,388 1,283 1,370 569 1,264 650 1,058 South Karnataka 8,920 1,730 2,590 2,562 2,758 North Karnataka 732 639 432 506 135 718 597 UP 3,547 2,132 3,087 1,976 1,610 1,831 2,301 Total 3,340 3,470 2,312 2,009 1,297 1,607 2,157
Table 2-12: Average annual milk sales volume per household for each village(liter)
State, Village Large Medium Small Marginal Tenant Non-farm Total
Gujarat 14,913 11,718 5,899 3,188 2,210 1,871 4,088 Mujkuva 29,765 2,000 5,745 1,492 1,445 2,060 Saral Vid 6,280 4,749 4,020 2,158 2,940 2,967
A-67

Thavar 12,840 14,675 9,734 6,097 2,210 1,684 7,195 Bihar 2,486 1,216 1,244 884 1,041 1,145
Guai 2,764 1,348 1,170 765 1,134 1,182 Rahmatpur 1,930 0 1,283 620 773 973 Chakhaji 1,925 1,268 1,386 1,199 1,270
Assam 1,811 954 1,071 376 961 489 791 Uzankuri 5,500 994 2,073 196 1,040 533 1,123 Malaybari 1,800 1,062 998 1,141 1,057 679 1,131 Kanfalla Bhokatgao 0 84 38 55 796 233 140
South Karnataka 8,198 1,580 2,290 2,196 2,431 North Karnataka 396 369 226 339 0 451 353
Kumasi 792 674 154 645 0 197 473 Haravala 0 64 298 33 0 704 234
UP 2,898 1,583 2,455 1,488 1,188 1,348 1,769 Nadara 1,964 437 2,055 1,571 1,282 1,437 1,409 Raipura 2,357 2,034 2,347 1,329 480 1,225 1,653 Sakoorpur 5,714 2,142 2,745 1,706 1,010 1,351 2,274
Total 2,749 2,927 1,889 1,637 973 1,296 1,762
Table 2-13: Average annual milk sales volume per household for each state(liter) State Large Medium Small Marginal Tenant Non-farm Total
Gujarat 14,913 11,718 5,899 3,188 2,210 1,871 4,088 Bihar 2,486 1,216 1,244 884 1,041 1,145 Assam 1,811 954 1,071 376 961 489 791 South Karnataka 8,198 1,580 2,290 2,196 2,431 North Karnataka 396 369 226 339 0 451 353 UP 2,898 1,583 2,455 1,488 1,188 1,348 1,769 Total 2,749 2,927 1,889 1,637 973 1,296 1,762
Table 2-14 depicts that comparison of livestock holdings and milk production and sales between the villages with DCS and without DCS. It shows that the per household milk production volumes in Kanfalla Bhokatgao in Assam and Haravala in Karnataka are much lower than those villages with DCS even though the number of livestock holding are not much different from other villages. Also, the ratios of milk sales volumes to production volumes in these two villages are much lower than other villages. This indicates the tendency of higher productivity and more active milk sales activities by farmers for the villages where DCS are formed, probably due to the services and other activities given by DCS and Unions. On the other hand, per household production and sales volume and the ratio of milk sales volume to production volume in Raipura village in Utter Pradesh are not much different from those villages with DCS. As the dairy production is highly developed and there are many private dairy makers exist in Uttar Pradesh, the productivity of livestock and the level of sales
A-68

activity seem not much affected by the existence of DCS.
Table 2-14 Comparison of livestock holdings and milk production and sales between the villages with DCS and without DCS
Village Average cattle
and buffalo holding per HH
Average milk production volume per HH (liter)
Average milk sales
volume per HH (liter)
% of sales volume to production
volume
Villages without
DCS
Kanfalla Bhokatgao (Assam) 4.0 508 140 39%
Haravala (North Karnataka) 2.9 358 234 46%
Raipura (UP) 2.4 2,133 1,653 77% Villages with DCS 3.2 2,449 2,036 83%
3 Rearing Management and Productivity 3.1 Major Breeds and Their Yields Table 3-1 depicts the average yield of cow per day for major breeds reared in the target villages of Socioeconomic Situation Survey, and Table 3-2 shows the percentages of cows reared by farmers in the target villages by breed. One can see that there are significant differences in the composition of breeds among the states. For example, the percentages of high yield breeds such as HF are quite high in Gujarat and South Karnataka, but the percentages of low yield breeds such as indigenous breeds are quite high in Assam and North Karnataka.
Table 3-1: Average yield of cow per day for major breeds in the target villages
HF Jersey Other
foreign breed
Sahiwal Gir Hariana Gaolo Red Sindhi
Other indigenous
Indigenous non-
descriptive Average yield per day (liter) 11.3 7.0 12.8 7.5 7.3 6.2 6.0 6.5 3.9 3.5
Source: Socioeconomic Situation Survey
Table 3-2: Percentages of cows reared by farmers in the target villages by breed
State HF Jersey
Other
foreign
breed
Sahiwal Gir Hariana Gaolo Red
Sindhi
Other
indigeno
us
Indigenous
non-
descriptive
Gujarat 63% 4% 0% 0% 4% 0% 0% 0% 0% 29%
Bihar 12% 61% 0% 10% 0% 1% 1% 1% 11% 3%
Assam 2% 28% 1% 0% 0% 0% 0% 0% 0% 68%
A-69
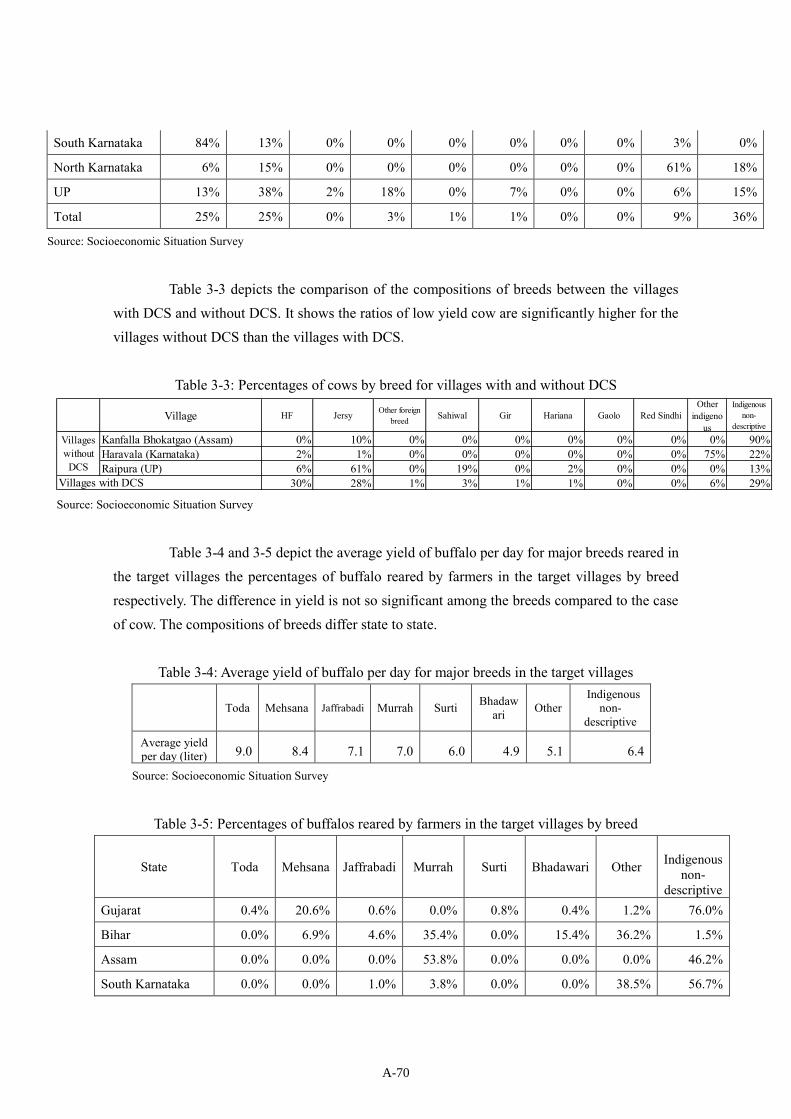
South Karnataka 84% 13% 0% 0% 0% 0% 0% 0% 3% 0%
North Karnataka 6% 15% 0% 0% 0% 0% 0% 0% 61% 18%
UP 13% 38% 2% 18% 0% 7% 0% 0% 6% 15%
Total 25% 25% 0% 3% 1% 1% 0% 0% 9% 36%
Source: Socioeconomic Situation Survey
Table 3-3 depicts the comparison of the compositions of breeds between the villages
with DCS and without DCS. It shows the ratios of low yield cow are significantly higher for the villages without DCS than the villages with DCS.
Table 3-3: Percentages of cows by breed for villages with and without DCS
Source: Socioeconomic Situation Survey
Table 3-4 and 3-5 depict the average yield of buffalo per day for major breeds reared in
the target villages the percentages of buffalo reared by farmers in the target villages by breed respectively. The difference in yield is not so significant among the breeds compared to the case of cow. The compositions of breeds differ state to state.
Table 3-4: Average yield of buffalo per day for major breeds in the target villages
Toda Mehsana Jaffrabadi Murrah Surti Bhadawari Other
Indigenous non-
descriptive
Average yield per day (liter) 9.0 8.4 7.1 7.0 6.0 4.9 5.1 6.4
Source: Socioeconomic Situation Survey
Table 3-5: Percentages of buffalos reared by farmers in the target villages by breed
State Toda Mehsana Jaffrabadi Murrah Surti Bhadawari Other
Indigenous
non-descriptive
Gujarat 0.4% 20.6% 0.6% 0.0% 0.8% 0.4% 1.2% 76.0%
Bihar 0.0% 6.9% 4.6% 35.4% 0.0% 15.4% 36.2% 1.5%
Assam 0.0% 0.0% 0.0% 53.8% 0.0% 0.0% 0.0% 46.2%
South Karnataka 0.0% 0.0% 1.0% 3.8% 0.0% 0.0% 38.5% 56.7%
Village HF Jersy Other foreignbreed Sahiwal Gir Hariana Gaolo Red Sindhi
Otherindigeno
us
Indigenousnon-
descriptive
Kanfalla Bhokatgao (Assam) 0% 10% 0% 0% 0% 0% 0% 0% 0% 90%Haravala (Karnataka) 2% 1% 0% 0% 0% 0% 0% 0% 75% 22%Raipura (UP) 6% 61% 0% 19% 0% 2% 0% 0% 0% 13%
30% 28% 1% 3% 1% 1% 0% 0% 6% 29%
VillageswithoutDCS
Villages with DCS
A-70

North Karnataka 0.0% 0.0% 0.7% 1.4% 0.0% 0.0% 50.4% 47.5%
UP 1.5% 1.5% 0.3% 56.9% 0.0% 4.5% 29.5% 5.7%
Total 0.6% 10.9% 1.0% 22.8% 0.4% 3.4% 17.7% 43.1%
3.2 Mating and Artificial Insemination (AI)
Table 3-6 shows the percentages of who usually use AI for mating of their livestock for cooperative members and non-members in the villages with DCS and the villages without DCS. One can see that the ratio of farmers use AI is significantly higher for the farmers in the villages with DCS than the villages without DCS. Also, the utilization of AI is relatively high in Gujarat and South Karnataka where the AI services of the dairy cooperatives are available in most of the areas.
Table 3-6: % of farmers who usually use AI for mating of their livestock
State, Village Member Non member
No DCS
Gujarat 92% 88% Mujkuva 90% 100% Saral Vid 89% 100% Thavar 97% 81%
Bihar 61% 69% Guai 61% 82% Rahmatpur 58% 47% Chakhaji 63% 78%
Assam 59% 49% Uzankuri 51% 59% Malaybari 65% 33% Kanfalla Bhokatgao 13%
South Karnataka 100% 100% North Karnataka 76% 24% 23%
Kumasi 76% 24% Haravala 23%
UP 59% 57% Nadara 41% 35% Raipura 47% Sakoorpur 80% 78%
Table 3-7 shows the percentage of the utilization of institutions for AI services. One can see that percentages of farmers who utilize cooperative AI centers are higher in Gujarat and South Karnataka where the AI services of the dairy cooperatives are available in most of the areas. The percentages of farmers who use cooperative AI centers are lower for non-members of DCS than DCS members.
A-71

Table 3-7: Percentage of the utilization of institutions for AI services
State, Village
Villages with DCS Villages without DCS
DCS members Non-members
Coopera tive Private Govern
ment Coopera
tive Private Govern ment Private Govern
ment Gujarat 87% 13% 0% 97% 0% 3%
Mujkuva 100% 0% 0% 100% 0% 0% Saral Vid 88% 12% 0% 100% 0% 0% Thavar 71% 29% 0% 95% 0% 5%
Bihar 18% 73% 7% 5% 77% 18% Guai 30% 64% 3% 17% 33% 50% Rahmatpur 17% 83% 0% 0% 100% 0% Chakhaji 4% 77% 19% 0% 93% 7%
Assam 23% 30% 47% 9% 41% 50% 63% 38% Uzankuri 0% 32% 68% 0% 31% 69% Malaybari 39% 29% 32% 33% 67% 0% Kanfalla
Bhokatgao 63% 38% South Karnataka 100% 0% 0% 20% 47% 33% North Karnataka 29% 9% 62% 0% 25% 75% 7% 93%
Kumasi 29% 9% 62% 0% 25% 75% Haravala 7% 93%
UP 22% 72% 6% 4% 88% 8% 82% 18% Nadara 8% 75% 17% 0% 100% 0% Raipura 82% 18% Sakoorpur 29% 71% 0% 6% 83% 11%
Total 52% 35% 13% 27% 53% 20% 60% 40%
3.3 Utilization of TMR Table 3-8 depicts the percentages of farmers who provide TMR to their livestock everyday. One can see that the percentage is higher for DCS members than non-members. Also, it is significantly lower for the farmers in the villages without DCS than villages with DCS.
Table 3-8: % of farmers who provide TMR to their livestock everyday
State, Village Villages with DCS Villages
without DCS
DCS members
Non-members
Gujarat 62% 33% Mujkuva 45% 32% Saral Vid 61% 50% Thavar 85% 31%
A-72

Bihar 64% 54% Guai 67% 57% Rahmatpur 50% 43% Chakhaji 73% 62%
Assam 29% 20% 6% Uzankuri 38% 38% Malaybari 21% 0% Kanfalla Bhokatgao 66% 36% 6%
South Karnataka 52% 25% North Karnataka 40% 43% 16%
Kumasi 40% 43% Haravala 16%
UP 40% 47% 47% Nadara 46% 42% Raipura 47% Sakoorpur 34% 44%
Total 54% 38% 23%
Table 3-9 shows the percentages of farmers who buy TMR at DCS offices. One can see that these figures are higher in Gujarat and South Karnataka where TMR is sold at most of the DCS offices.
Table 3-9: % of farmer who buy TMR at DCS office
State, Village Villages with DCS Villages
without DCS
DCS members
Non-members
Gujarat 90% 68% Mujkuva 92% 60% Saral Vid 82% 88% Thavar 100% 69%
Bihar 76% 20% Guai 80% 32% Rahmatpur 70% 17% Chakhaji 78% 13%
Assam 14% 9% 0% Uzankuri 13% 14% Malaybari 16% 3% Kanfalla Bhokatgao 0%
South Karnataka 91% 23% North Karnataka 38% 4% 1%
Kumasi 38% 4% Haravala 1%
UP 21% 12% 7%
A-73

Nadara 20% 15% Raipura 7% Sakoorpur 21% 8%
Total 58% 25% 3%
3.4 Productivity of Cow and Buffalo Table 3-10 shows the average yield per cow and buffalo per day for various areas. One can see that the yield per livestock is higher where the ratios of high-yield breed are higher and AI services and TMR are more utilized. The higher ratio of high yield livestock can be considered to be partly caused by extended utilization of AI services. Also, the higher utilization of TMR is likely to increase the productivities of high yield livestock. One can see that the yields of livestock in Kanfalla Bhokatgao (Assam) Haravala (North Karnataka), where DCS are not, formed are significantly lower than the villages with DCS in the same area. The formation of DCS and its provision of various services (such as AI service, sales of TMR, and the guaranteed purchase of surplus milk) have probably caused this difference. On the other hand, the yields of livestock in Raipura of Uttar Pradesh, where DCS is not formed, are not significantly different from those of the villages with DCS. As dairy sector is highly developed and many private dairy makers conduct procurement of milk in Uttar Pradesh, the formation of DCS seems not generate much influence on the productivity of livestock.
Table 3-10: Average yield per cow and buffalo per day (liter) Village, State Cow Buffalo
Villages without DCS 3.4 4.9 Kanfalla Bhokatgao (Assam) 1.8 -- Haravala (North Karnataka) 2.1 3.0 Raipura (UP) 8.1 6.1
Villages with DCS 7.6 6.9 Gujarat 11.0 7.5 Bihar 6.6 5.7 Assam 3.6 5.0
South Karnataka 12.1 3.8 North Karnataka 4.3 3.5
UP 7.4 6.7 Total 7.0 6.4
4 Household Incomes and Incomes from Livestock Activities
Table 4-1 to 4-6 depict the average household annual total income, annual agricultural income, livestock income, business, wages and salaries, and other incomes respectively for each
A-74
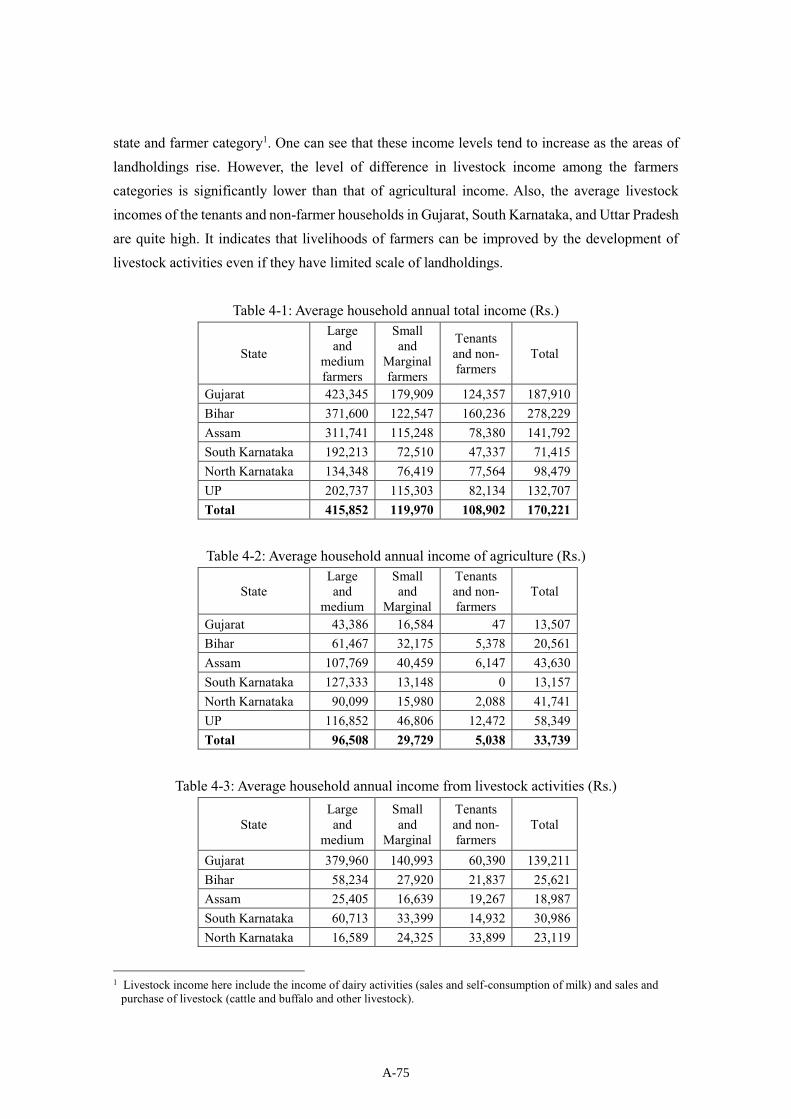
state and farmer category1. One can see that these income levels tend to increase as the areas of landholdings rise. However, the level of difference in livestock income among the farmers categories is significantly lower than that of agricultural income. Also, the average livestock incomes of the tenants and non-farmer households in Gujarat, South Karnataka, and Uttar Pradesh are quite high. It indicates that livelihoods of farmers can be improved by the development of livestock activities even if they have limited scale of landholdings.
Table 4-1: Average household annual total income (Rs.)
State
Large and
medium farmers
Small and
Marginal farmers
Tenants and non-farmers
Total
Gujarat 423,345 179,909 124,357 187,910 Bihar 371,600 122,547 160,236 278,229 Assam 311,741 115,248 78,380 141,792 South Karnataka 192,213 72,510 47,337 71,415 North Karnataka 134,348 76,419 77,564 98,479 UP 202,737 115,303 82,134 132,707 Total 415,852 119,970 108,902 170,221
Table 4-2: Average household annual income of agriculture (Rs.)
State Large and
medium
Small and
Marginal
Tenants and non-farmers
Total
Gujarat 43,386 16,584 47 13,507 Bihar 61,467 32,175 5,378 20,561 Assam 107,769 40,459 6,147 43,630 South Karnataka 127,333 13,148 0 13,157 North Karnataka 90,099 15,980 2,088 41,741 UP 116,852 46,806 12,472 58,349 Total 96,508 29,729 5,038 33,739
Table 4-3: Average household annual income from livestock activities (Rs.)
State Large and
medium
Small and
Marginal
Tenants and non-farmers
Total
Gujarat 379,960 140,993 60,390 139,211 Bihar 58,234 27,920 21,837 25,621 Assam 25,405 16,639 19,267 18,987 South Karnataka 60,713 33,399 14,932 30,986 North Karnataka 16,589 24,325 33,899 23,119
1 Livestock income here include the income of dairy activities (sales and self-consumption of milk) and sales and
purchase of livestock (cattle and buffalo and other livestock).
A-75

UP 71,991 49,317 48,525 56,248 Total 85,296 49,678 35,641 51,592
Table 4-4: Average household annual income from own business (Rs.)
State Large and
medium
Small and
Marginal
Tenants and non-farmers
Total
Gujarat -1 6,375 26,274 13,038 Bihar -293,333 1,056 12,076 2,004 Assam 15,434 9,718 14,727 12,126 South Karnataka 4,167 3,694 6,154 4,532 North Karnataka 1,974 2,598 10,743 3,900 UP 3,213 3,348 68 2,295 Total 755 4,798 12,876 6,677
Table 4-5: Average household annual income from wages and salaries (Rs.)
State Large and
medium
Small and
Marginal
Tenants and non-farmers
Total
Gujarat
15,940 35,059 21,180
Bihar 425,233 59,420 120,426 227,166
Assam 156,837 46,929 30,645 63,017
South Karnataka
21,357 25,808 22,019
North Karnataka 25,680 33,250 30,667 29,576
UP 8,813 15,270 17,521 13,920
Total 229,656 34,792 52,640 76,190
Table 4-6: Average household other incomes (Rs.)
State Large and
medium
Small and
Marginal
Tenants and non-farmers
Total
Gujarat
15,940 35,059 21,180
Bihar 425,233 59,420 120,426 227,166
Assam 156,837 46,929 30,645 63,017
South Karnataka
21,357 25,808 22,019
North Karnataka 25,680 33,250 30,667 29,576
UP 8,813 15,270 17,521 13,920
Total 229,656 34,792 52,640 76,190
A-76

Table 4-7 shows the comparison of average household annual income from livestock activities between the villages with and without DCS (Rs.). It shows that the levels of livestock incomes significantly differ between the villages with and without DCS in Assam and North Karnataka. This indicates the likelihood of the increase in livestock income by the formation of DCS which is likely to lead to the improvement of productivity of livestock (as discussed in the previous section). On the other hand, the livestock incomes between the villages with and without DCS do not differ much in the case of Uttar Pradesh. It indicates that the formation of DCS did not have significant effects on the livelihood of target villages in Uttar Pradesh where the dairy sector is highly developed and there are many private dairy makers conduct procurement of milk.
Table 4-7: Comparison of average household annual income from livestock activities between the villages with and without DCS (Rs.)
State Village With/without DCS Average
household annual livestock income
(Rs.)
Assam Kanfalla Bhokatgao without DCS 8,972
Malaybari with DCS 26,001
North
Karnataka
Haravala without DCS 11,650
Kumasi with DCS 34,587
UP Raipura without DCS 42,340
Nadara with DCS 47,031
5 Sales of Milk 5.1 Buyer of Milk
Table 5-1 shows the percentages of DCS members in the target villages of the Socioeconomic Situation Survey by type of buyer. As shown in Table 4-21, almost all of the DCS members sell their milk to cooperatives DCS and very small percentages of them sell their milk to other buyers.
Table 5-1: Percentages of dairy farmers by type of buyer (multiple answers are allowed) for DCS members
State, Village Dairy Cooperative Middleman Private
firm
Direct sales to
shop/restaurant
Other household
in the village
Other household outside of the village
Gujarat 100% 0% 0% 0% 0% 0% Mujkuva 100% 0% 0% 0% 0% 0% Saral Vid 100% 0% 0% 0% 0% 0%
A-77

Thavar 100% 0% 0% 0% 0% 0% Bihar 100% 0% 0% 0% 2% 0%
Guai 100% 0% 0% 0% 0% 0% Rahmatpur 100% 0% 0% 0% 0% 0% Chakhaji 100% 0% 0% 0% 5% 0%
Assam 100% 3% 0% 0% 14% 0% Uzankuri 100% 0% 0% 0% 23% 0% Malaybari 100% 5% 0% 0% 5% 0%
South Karnataka 100% 0% 0% 0% 0% 0% North Karnataka 97% 3% 0% 0% 0% 3% UP 97% 6% 0% 0% 1% 0%
Nadara 100% 0% 0% 0% 0% 0% Sakoorpur 94% 12% 0% 0% 2% 0%
Total 99% 2% 0% 0% 2% 0%
Table 5-2 shows the same figures for non-members of DCS. One can see that many of the non-members sell their milk to cooperative DCS. Certain percent of non-members sell their milk to middlemen of unorganized sector and private dairy firms2. Table: 5-2 Percentage of dairy farmers by type of buyer (multiple answers are allowed) for non-
members
State, Village Dairy Cooperative Middleman Private
firm
Direct sales to shop/
restaurant
Other household
in the village
Other household outside of
the village
Gujarat 97% 0% 3% 0% 0% 0% Mujkuva 100% 0% 0% 0% 0% 0% Saral Vid 100% 0% 0% 0% 0% 0% Thavar 96% 0% 4% 0% 0% 0%
Bihar 39% 37% 6% 8% 29% 6% Guai 90% 20% 0% 0% 0% 0% Rahmatpur 36% 21% 7% 14% 50% 7% Chakhaji 20% 52% 8% 8% 28% 8%
Assam 69% 17% 0% 9% 31% 0% Uzankuri 76% 4% 0% 12% 40% 0% Malaybari 50% 50% 0% 0% 10% 0%
South Karnataka 8% 46% 46% 0% 0% 0% North Karnataka 0% 100% 0% 0% 0% 0% UP 50% 44% 6% 0% 0% 0%
2 Table 5-2 shows that many of the non-members in South Karnataka sell their milk to private dairy firms. It is because
that there is one small private dairy firm is actively collect milk in the village of Kommasandra. As the procurement scales of re is no major private dairy makers in Karnataka are relatively small, the case of this village seem not be is not representing the situation of South Karnataka in this aspect.
A-78

Nadara 80% 20% 0% 0% 0% 0% Sakoorpur 24% 65% 12% 0% 0% 0%
Total 58% 27% 7% 4% 15% 2%
Table 5-3 shows the same figures for the case of villages without DCS. Many of them sell their milk to middlemen of unorganized sector. Some farmers in Raipura in Uttar Pradesh sell their milk to private dairy firms. As no private dairy firm collect milk at Kanfalla_Bhokatgao in Assam and Haravala in North Karnataka, the number of farmers who sell to private dairy firm is zero for these villages. One the other hand, many farmers in Kanfalla_Bhokatgao bring their milk to restaurants/shops as it is close to a town. For the case of Haravala in North Karnataka, which is quite a remote area and is out of any of milk distribution channel, many farmers sell their milk to other households.
Table 5-3: Percentage of dairy farmers by type of buyer (multiple answers are allowed) for villages without DCS
State, Village Dairy Cooperative Middleman Private
firm
Direct sales to shop/
restaurant
Other household
in the village
Other household outside of
the village
Kanfalla_Bhokatgao (Assam) 0% 31% 0% 38% 23% 0%
Haravala (North Karnataka) 0% 13% 0% 0% 75% 38%
Raipura (Uttar Pradesh) 0% 88% 12% 0% 0% 0%
Total 0% 72% 9% 6% 10% 3%
5.2 Favorite Buyer and the Reasons for Favoring
Table 5-4 shows the percentage of buyer for the question “Who is your favorite buyer?” for each village. Table 5-5 shows the same figures by comparing the villages with and without villages. One can see most of the farmers in the target villages where DCS are formed answered that dairy cooperative is their favorite buyers. In the cases of Assam, there are certain percentages of households who favor middlemen which indicates the high presence of the loose milk markets of unorganized sector there. Also, some households in Uttar Pradesh prefer private dairy firms which reflects the high presence of private firms there.
Table 5-4: Percentage of type of buyer for the question “Who is your favorite buyer?” for each
village
A-79
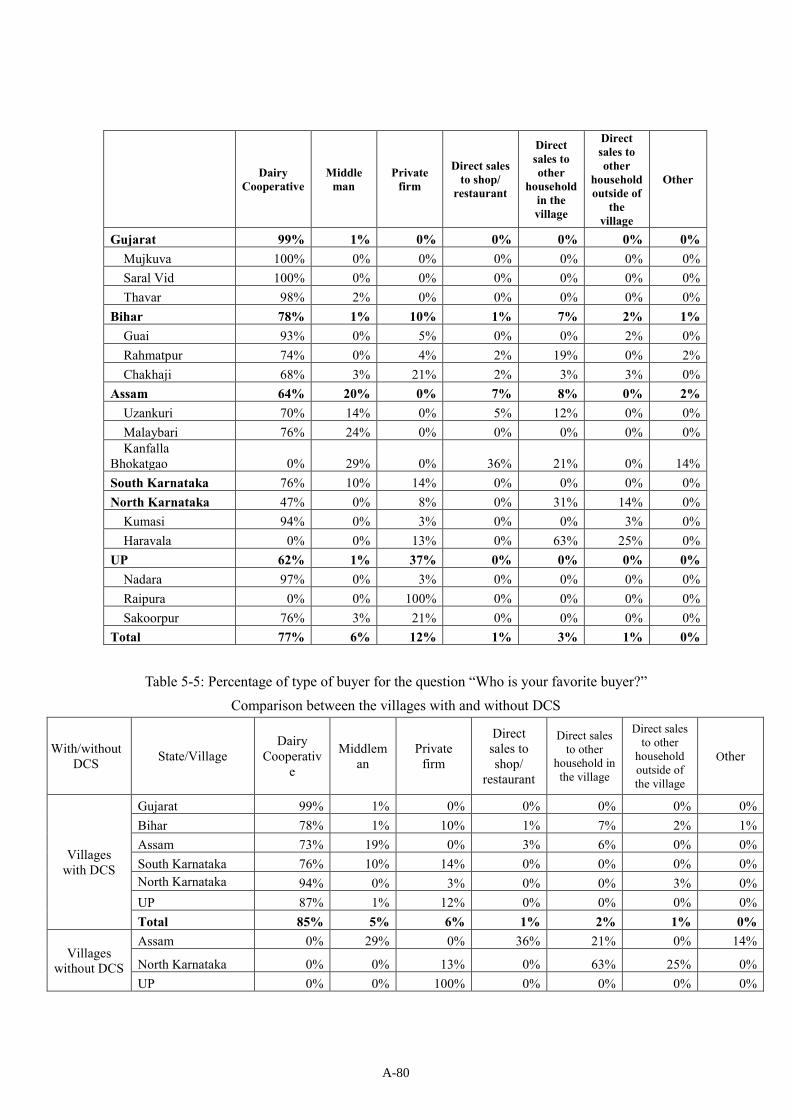
Dairy Cooperative
Middle man
Private firm
Direct sales to shop/
restaurant
Direct sales to other
household in the village
Direct sales to other
household outside of
the village
Other
Gujarat 99% 1% 0% 0% 0% 0% 0% Mujkuva 100% 0% 0% 0% 0% 0% 0% Saral Vid 100% 0% 0% 0% 0% 0% 0% Thavar 98% 2% 0% 0% 0% 0% 0%
Bihar 78% 1% 10% 1% 7% 2% 1% Guai 93% 0% 5% 0% 0% 2% 0% Rahmatpur 74% 0% 4% 2% 19% 0% 2% Chakhaji 68% 3% 21% 2% 3% 3% 0%
Assam 64% 20% 0% 7% 8% 0% 2% Uzankuri 70% 14% 0% 5% 12% 0% 0% Malaybari 76% 24% 0% 0% 0% 0% 0% Kanfalla
Bhokatgao 0% 29% 0% 36% 21% 0% 14% South Karnataka 76% 10% 14% 0% 0% 0% 0% North Karnataka 47% 0% 8% 0% 31% 14% 0%
Kumasi 94% 0% 3% 0% 0% 3% 0% Haravala 0% 0% 13% 0% 63% 25% 0%
UP 62% 1% 37% 0% 0% 0% 0% Nadara 97% 0% 3% 0% 0% 0% 0% Raipura 0% 0% 100% 0% 0% 0% 0% Sakoorpur 76% 3% 21% 0% 0% 0% 0%
Total 77% 6% 12% 1% 3% 1% 0%
Table 5-5: Percentage of type of buyer for the question “Who is your favorite buyer?” Comparison between the villages with and without DCS
With/without DCS State/Village
Dairy Cooperativ
e
Middleman
Private firm
Direct sales to shop/
restaurant
Direct sales to other
household in the village
Direct sales to other
household outside of the village
Other
Villages with DCS
Gujarat 99% 1% 0% 0% 0% 0% 0% Bihar 78% 1% 10% 1% 7% 2% 1% Assam 73% 19% 0% 3% 6% 0% 0% South Karnataka 76% 10% 14% 0% 0% 0% 0% North Karnataka 94% 0% 3% 0% 0% 3% 0% UP 87% 1% 12% 0% 0% 0% 0% Total 85% 5% 6% 1% 2% 1% 0%
Villages without DCS
Assam 0% 29% 0% 36% 21% 0% 14%
North Karnataka 0% 0% 13% 0% 63% 25% 0% UP 0% 0% 100% 0% 0% 0% 0%
A-80

Total 0% 10% 38% 12% 28% 8% 5%
Table 5-6 shows (among those who chose dairy cooperative as their favorite buyer) the
number of farmers who answered different points for the reasons why dairy cooperative is their favorite buyer. It indicates that the stability of purchasing price is the major reason for it, and higher purchasing price follows. Still, many of them answered various service such as bonus, veterinary service, and cattle feed sales as the reasons for it. Table 5-6: Reasons why cooperative is the favorite buyer (number of farmers; multiple answers
are allowed)
Table 5-7 shows (among those who chose middleman as their favorite buyer) the number of farmers who answered different points for the reasons why middleman is their favorite buyer. Some farmers answered the provision of advance payment is the major reason for it. Also, some claim that they are obliged to sell to middleman as they have debt for advance payment or for the loan provided by middleman for purchasing livestock.
Table 5-7: Reasons why middleman is the favorite buyer (number of farmers; multiple answers are allowed)
# of HHwhose
favoritebuyer is
cooperative
Purchasing priceis
stable
Purchasing priceis higher
Can getsomebonus
Do notrefuse to
buyregardles
s ofmarket
Cooperative is
near tothe house
Cooperative
provideveterinary services
Cooperat
iveprovidecattle
insurance
Cooperative
providecattlefeed
Can getsomeother
servicessuch astraining
Gujarat 187 138 171 68 58 13 56 9 2 1Mujkuva 56 40 51 23 26 4 23 6 1Saral Vid 67 48 63 24 18 4 14 1 2Thavar 64 50 57 21 14 5 19 2
Bihar 136 56 38 59 28 48 45 27 24 9Guai 54 20 17 28 10 17 22 11 8 2Rahmatpur 40 19 8 21 7 16 9 5 7 4Chakhaji 42 17 13 10 11 15 14 11 9 3
Assam 79 56 20 34 23 12 3 3 2Uzankuri 42 33 14 17 12 7 1 2Malaybari 37 23 6 17 11 5 2 1 2
South Karnataka 39 12 18 27 2 16 15 15 16 9North Karnataka 34 14 22 12 10 11 8 5 11 3UP 122 43 27 64 26 35 1 1 2
Nadara 70 30 11 24 14 17 1Sakoorpur 52 13 16 40 12 18 1 2
Total 597 319 296 264 147 135 128 56 57 26
A-81

# of HH whose
favorite buyer is
middleman
Buyer provide advance payment for milk
Do not refuse to
buy regardless of market demand
Purchasing price is higher
Buyer comes to
house gate, so
convenient to sell
Obliged to sell
Purchasing price is stable
Buyer is relative
Assam 24 12 7 1 2 1 Uzankuri 6 5 1 1 Malaybari 14 6 5 1 1 Kanfalla
Bhokatgao 4 1 1 1 Bihar 2 1 1 2 2
Chakhaji 2 1 1 2 2 Gujarat 1 1 1
Thavar 1 1 1 South Karnataka 5 3 3 2 1 2 UP 2 1 2 1
Sakoorpur 2 1 2 1 Total 34 13 12 9 5 3 2 2
Table 5-8 shows (among those who chose private dairy firm as their favorite buyer) the number of farmers who answered different points for the reasons why private dairy firm is their favorite buyer. Many point out the closeness of milk collection point to their houses as a reason. Some farmers point out the stable purchasing price and higher purchasing price as the reasons for it.
Table 5-8: Reasons why private dairy firm is the favorite buyer (number of farmers; multiple answers are allowed)
# of HH whose
favorite buyer is private
firm
Collection point is near to
the house
Purchasing price is higher
Purchasing price is stable
Do not refuse to
buy regardless of market demand
Obliged to sell
Buyer is
friend Buyer is relative
Bihar 18 12 9 2 3 1 Chakhaji 13 7 5 2 3
Guai 3 3 3 Rahmatpur 2 2 1 1
South Karnataka 7 2 7 2 1 1 2 North Karnataka 2 1 1 1
Haravala 1 1 Kumasi 1 1 1
UP 72 45 12 16 9 12 5 1
A-82

Nadara 2 1 1 Raipura 56 37 6 15 7 11 4 1 Sakoorpur 14 8 6 1 1 1
Total 99 60 29 21 13 13 5 4
6 Reasons for Becoming Dairy Cooperative Member and Not Becoming Member Table 6-1 shows the percentage of farmers who answered for different reasons
for becoming the members (multiple answers are allowed). Most of them point out the access to veterinary services is a reason for it. Stable and higher purchasing prices are also major reasons for becoming members3.
Table 6-1: Reasons for becoming the cooperative members
Source: Socioeconomic Situation Survey
Table 6-2 shows the percentage of non-members (in the villages with DCS) who answered for different reasons for not becoming the members (multiple answers are allowed). Not having enough milk production to sell and not having a milking animal are major reasons for it. Some people claim the poor management of cooperative as a reason for it, which is relatively high in Bihar, South Karnataka, and Uttar Pradesh.
Table 6-2: Reasons for not being the member of dairy coopeartives
State Not
enough milk to
sell
Do not have
milking cow or buffalo
Management of
cooperative is poor
Purchasing price by
cooperative is low
Prefer to sell milk to other
institution
Cannot trust the quality
test
Obliged to sell other
buyer
Gujarat 19% 33% 6% 1% 1% 1% 0%
Bihar 51% 7% 29% 30% 16% 15% 1%
Assam 44% 26% 5% 2% 5% 0% 2%
3 Even though the milk unions do not provide any services to members in Uttar Pradesh at present, the members in the sample villages in the state had been provided various services until a few years ago.
StateCan get
veterinaryservice
Purchasingprice isstable
Purchasingprice ishigher
Do notrefuse to
buyregardlessof marketdemand
Can getbonus
Can get AIservice
Can buycattle feedat low cost
There is noother buyer
Can gettrainings
Can getsome other
services
Gujarat 95% 75% 89% 41% 31% 23% 10% 5% 13% 33%Bihar 83% 51% 48% 40% 44% 34% 32% 11% 4% 49%Assam 80% 58% 23% 41% 27% 6% 6% 27% 5% 27%South Karnataka 86% 36% 43% 48% 60% 29% 38% 10% 7% 60%North Karnataka 91% 55% 53% 51% 21% 34% 30% 11% 6% 45%UP 65% 46% 21% 24% 43% 11% 12% 1% 12% 49%Total 83% 57% 51% 39% 37% 22% 19% 10% 8% 42%
A-83
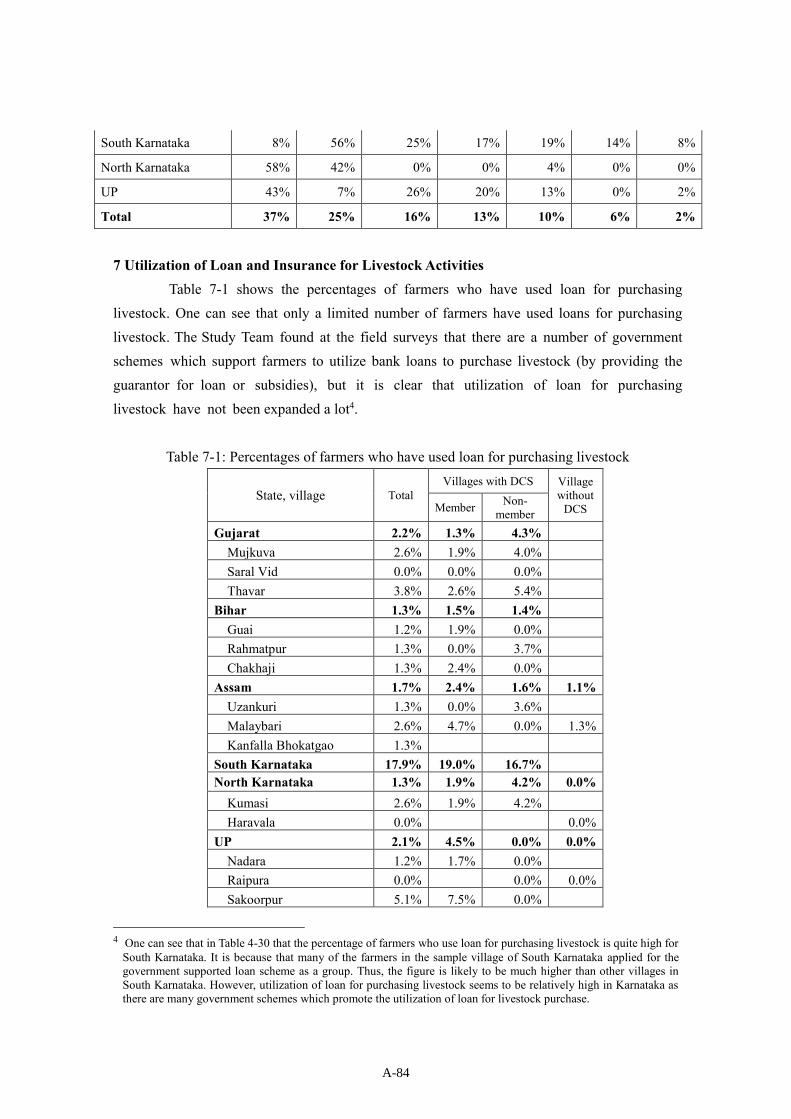
South Karnataka 8% 56% 25% 17% 19% 14% 8%
North Karnataka 58% 42% 0% 0% 4% 0% 0%
UP 43% 7% 26% 20% 13% 0% 2%
Total 37% 25% 16% 13% 10% 6% 2%
7 Utilization of Loan and Insurance for Livestock Activities Table 7-1 shows the percentages of farmers who have used loan for purchasing
livestock. One can see that only a limited number of farmers have used loans for purchasing livestock. The Study Team found at the field surveys that there are a number of government schemes which support farmers to utilize bank loans to purchase livestock (by providing the guarantor for loan or subsidies), but it is clear that utilization of loan for purchasing livestock have not been expanded a lot4.
Table 7-1: Percentages of farmers who have used loan for purchasing livestock
State, village Total Villages with DCS Village
without DCS Member Non-
member Gujarat 2.2% 1.3% 4.3%
Mujkuva 2.6% 1.9% 4.0% Saral Vid 0.0% 0.0% 0.0% Thavar 3.8% 2.6% 5.4%
Bihar 1.3% 1.5% 1.4% Guai 1.2% 1.9% 0.0% Rahmatpur 1.3% 0.0% 3.7% Chakhaji 1.3% 2.4% 0.0%
Assam 1.7% 2.4% 1.6% 1.1% Uzankuri 1.3% 0.0% 3.6% Malaybari 2.6% 4.7% 0.0% 1.3% Kanfalla Bhokatgao 1.3%
South Karnataka 17.9% 19.0% 16.7% North Karnataka 1.3% 1.9% 4.2% 0.0%
Kumasi 2.6% 1.9% 4.2% Haravala 0.0% 0.0%
UP 2.1% 4.5% 0.0% 0.0% Nadara 1.2% 1.7% 0.0% Raipura 0.0% 0.0% 0.0% Sakoorpur 5.1% 7.5% 0.0%
4 One can see that in Table 4-30 that the percentage of farmers who use loan for purchasing livestock is quite high forSouth Karnataka. It is because that many of the farmers in the sample village of South Karnataka applied for the government supported loan scheme as a group. Thus, the figure is likely to be much higher than other villages in South Karnataka. However, utilization of loan for purchasing livestock seems to be relatively high in Karnataka as there are many government schemes which promote the utilization of loan for livestock purchase.
A-84

Total 2.8% 3.4% 3.9% 0.4%
Table 7-2 shows that percentages of cow and female adult buffaloes which are insured. One can see that the figures are quite high in Karnataka. This is likely to be resulted from the 50% subsidy for insurance fees by milk unions in Karnataka (which was discussed in Chapter 3.8). One can see that the insurance for livestock is not very common in other states.
Table 7-2: Percentages of cow and female adult buffaloes which are insured
State, village Total Villages with DCS Village
without DCS Member Non-
member Gujarat 1% 1% 0%
Mujkuva 4% 5% 0% Saral Vid 0% 0% 0% Thavar 0% 0% 0%
Bihar 0% 0% 0% Guai 0% 0% 0% Rahmatpur 0% 0% 0% Chakhaji 0% 0% 0%
Assam 1% 0% 1% 2% Uzankuri_Seguli_DCS 1% 0% 1% Malaybari_Durga_DCS 1% 1% 0% Kanfalla_Bhokatgao 2% 2%
South Karnataka 38% 47% 16% North Karnataka 3% 8% 0% 0%
Kumasi 5% 8% 0% Haravala 0% 0%
UP 1% 0% 0% Nadara 2% 2% 0% Raipura 0% 3% 0% Sakoorpur 1% 1% 0% 0%
Total 3% 4% 1% 1%
A-85

Annex 8
FSSAI organization chart
1. FSSAI (Government of India)
(1) Central office
Source: FSSAI website
(2) Regional offices
Source: FSSAI website
A-86
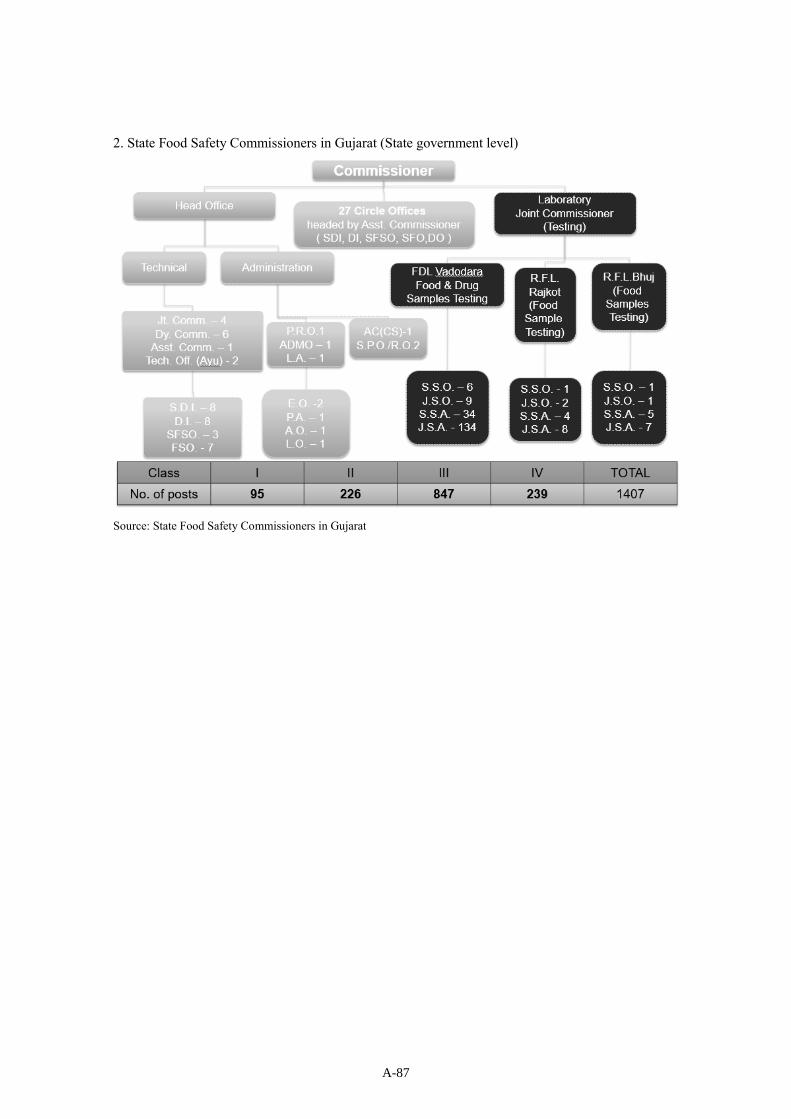
2. State Food Safety Commissioners in Gujarat (State government level)
Source: State Food Safety Commissioners in Gujarat
A-87
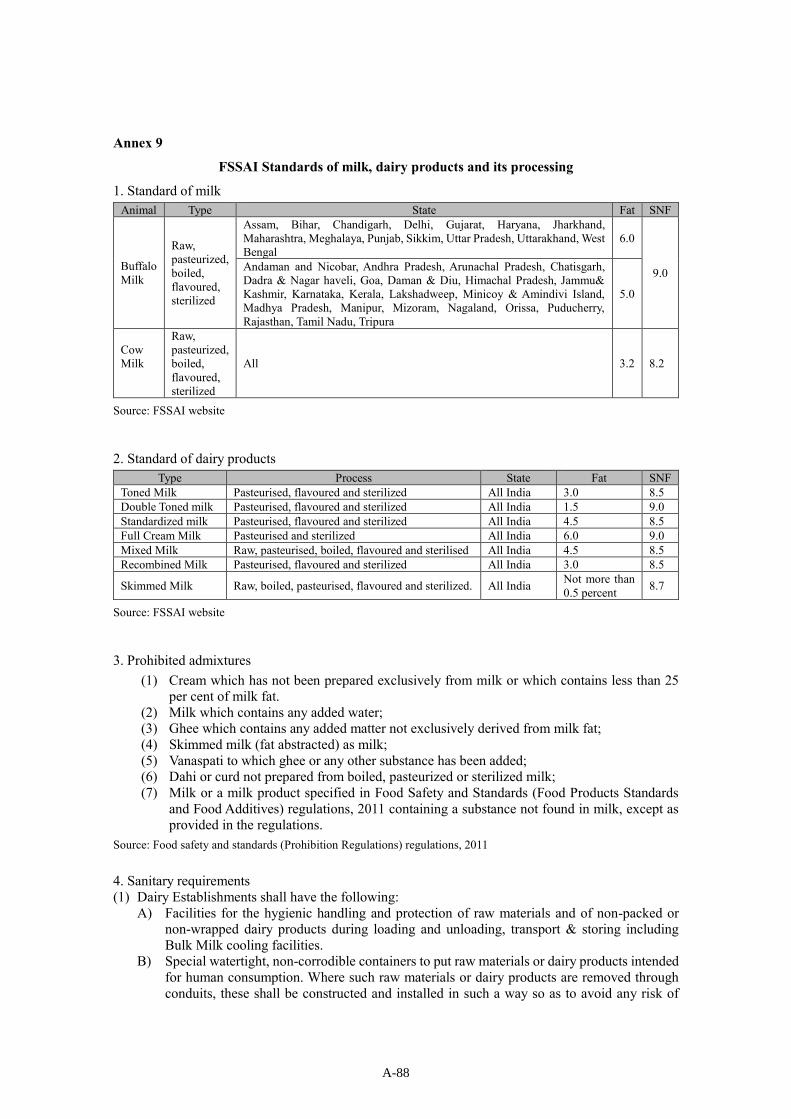
Annex 9
FSSAI Standards of milk, dairy products and its processing
1. Standard of milk Animal Type State Fat SNF
Buffalo Milk
Raw, pasteurized, boiled, flavoured, sterilized
Assam, Bihar, Chandigarh, Delhi, Gujarat, Haryana, Jharkhand, Maharashtra, Meghalaya, Punjab, Sikkim, Uttar Pradesh, Uttarakhand, West Bengal
6.0
9.0 Andaman and Nicobar, Andhra Pradesh, Arunachal Pradesh, Chatisgarh, Dadra & Nagar haveli, Goa, Daman & Diu, Himachal Pradesh, Jammu& Kashmir, Karnataka, Kerala, Lakshadweep, Minicoy & Amindivi Island, Madhya Pradesh, Manipur, Mizoram, Nagaland, Orissa, Puducherry, Rajasthan, Tamil Nadu, Tripura
5.0
Cow Milk
Raw, pasteurized, boiled, flavoured, sterilized
All 3.2 8.2
Source: FSSAI website
2. Standard of dairy products Type Process State Fat SNF
Toned Milk Pasteurised, flavoured and sterilized All India 3.0 8.5 Double Toned milk Pasteurised, flavoured and sterilized All India 1.5 9.0 Standardized milk Pasteurised, flavoured and sterilized All India 4.5 8.5 Full Cream Milk Pasteurised and sterilized All India 6.0 9.0 Mixed Milk Raw, pasteurised, boiled, flavoured and sterilised All India 4.5 8.5 Recombined Milk Pasteurised, flavoured and sterilized All India 3.0 8.5
Skimmed Milk Raw, boiled, pasteurised, flavoured and sterilized. All India Not more than 0.5 percent 8.7
Source: FSSAI website
3. Prohibited admixtures (1) Cream which has not been prepared exclusively from milk or which contains less than 25
per cent of milk fat. (2) Milk which contains any added water; (3) Ghee which contains any added matter not exclusively derived from milk fat; (4) Skimmed milk (fat abstracted) as milk; (5) Vanaspati to which ghee or any other substance has been added; (6) Dahi or curd not prepared from boiled, pasteurized or sterilized milk; (7) Milk or a milk product specified in Food Safety and Standards (Food Products Standards
and Food Additives) regulations, 2011 containing a substance not found in milk, except as provided in the regulations.
Source: Food safety and standards (Prohibition Regulations) regulations, 2011
4. Sanitary requirements (1) Dairy Establishments shall have the following:
A) Facilities for the hygienic handling and protection of raw materials and of non-packed or non-wrapped dairy products during loading and unloading, transport & storing including Bulk Milk cooling facilities.
B) Special watertight, non-corrodible containers to put raw materials or dairy products intended for human consumption. Where such raw materials or dairy products are removed through conduits, these shall be constructed and installed in such a way so as to avoid any risk of
A-88

contamination of other raw materials or dairy products; C) a waste water disposal system which is hygienic and approved; D) facilities for cleaning & disinfecting of tanks used for transporting dairy E) products and raw milk. These containers have to be cleaned after every use.
(2) The occupier of a dairy establishment shall take appropriate measures to avoid cross-contamination of dairy products in accordance with the cleaning program as specified in point 9.1 of Part II.
(3) Where a dairy establishment produces food stuffs containing dairy products together with other ingredients, which have not undergone heat treatment or any other treatment having equivalent effect, such dairy products and ingredients shall be stored separately to prevent cross-contamination.
(4) The production of heat-treated milk or the manufacture of milk-based products, which might pose a risk of contamination to other dairy products, shall be carried out in a clearly separated working area.
(5) Equipment, containers and installations which come into contact with dairy products or perishable raw materials used during production shall be cleaned and if necessary disinfected according to a verified and documented cleaning programme.
(6) Equipment, containers, instruments and installations which come in contact with microbiologically stable dairy products and the rooms in which they are stored shall be cleaned and disinfected according to a verified and documented Food Safety management programme drawn up by the owner/occupier of the dairy establishment.
(7) Disinfectants and similar substances used shall be used in such a way that they do not have any adverse effects on the machinery, equipment, raw materials and dairy products kept at the dairy establishment. They shall be in clearly identifiable containers bearing labels with instructions for their use and their use shall be followed by thorough rinsing of such instruments and working equipment with potable water, unless supplier's instructions indicate otherwise.
Source: Food Safety and Standards (Licensing and Registration of Food Businesses), regulations, 2011 5. Personal hygiene requirements (1) The Food Business Operator shall employ those persons only in such an establishment to work
directly with and handle raw materials or dairy products if those persons have proved to the occupier's satisfaction by means of a medical certificate, on recruitment, that there is no medical impediment to their employment in that capacity.
(2) Persons working directly with and handling raw materials or dairy products shall maintain the highest standards of personal cleanliness at all times. In particular they shall A) wear suitable, clean working clothes and headgear which completely encloses their hair; B) wash their hands at least each time work is resumed and whenever contamination of their
hands has occurred; e.g. after coughing / sneezing, visiting toilet, using telephone, smoking etc.
C) cover wounds to the skin with a suitable waterproof dressing. No person with injury on hand, even with dressing, shall be placed in any product making/handling section.
D) avoid certain hand habits - e.g. scratching nose, running finger through hair, rubbing eyes, ears and mouth, scratching beard, scratching parts of bodies etc. that are potentially hazardous when associated with handling dairy products, and might lead to food contamination through the transfer of bacteria from the employee to product during its preparation. When unavoidable, hands should be effectively washed before resuming work after such actions
Source: Food Safety and Standards (Licensing and Registration of Food Businesses), regulations, 2011 6. Sanitary requirements for storage (1) Immediately after procuring, raw milk shall be placed in a clean place, which is suitably equipped
so as to prevent any kind of contamination. (2) The cans/ containers made up of mild steel metal and plastic material used for storage and
transportation of milk and milk products shall not be allowed.
A-89

(3) If raw milk is brought to the dairy plant by a producer or farmer, then it shall be ensured that he brings it within four hours of milking and it shall be cooled as soon as practicable to a temperature of 4ºC or lower and maintained at that temperature until processed.
(4) Where raw milk is collected daily from a producer, it shall be cooled immediately to a temperature of 4ºC to 6ºC or lower and maintained at that temperature until processed;
(5) When the pasteurization process is completed, pasteurized milk shall be cooled immediately to a temperature of 4ºC or lower.
(6) Subject to Paragraph 7 below, any dairy product not intended to be stored at ambient (7) temperature shall be cooled as quickly as possible to the temperature established by the
manufacturer of that product as suitable to ensure its durability and thereafter stored at that temperature.
(8) Where dairy products other than raw milk are stored under cooled conditions, their storage temperatures shall be registered, and the cooling rate shall be such that the products reach the required temperature as quickly as possible.
(9) The maximum temperature at which pasteurized milk may be stored until it leaves the treatment establishment shall not exceed 5ºC.
Source: Food Safety and Standards (Licensing and Registration of Food Businesses), regulations, 2011 7. Wrapping and packaging (1) The wrapping and packaging of dairy products shall take place under satisfactory hygienic
conditions and in rooms provided for that purpose. (2) The manufacture of dairy products and packaging operations may take place in the same room if
the following conditions are satisfied: A) The room shall be sufficiently large and equipped to ensure the hygiene of the operations; B) the wrapping and packaging shall have been brought to the treatment or processing
establishment in protective cover in which they were placed immediately after manufacture and which protects the wrapping or
C) packaging from any damage during transport to the dairy establishment, and they shall have been stored there under hygienic conditions in a room intended for that purpose;
D) the rooms for storing the packaging material shall be free from vermin and from dust which could constitute an unacceptable risk of contamination of the product and shall be separated from rooms containing substances which might contaminate the products. Packaging shall not be placed directly on the floor;
E) packaging shall be assembled under hygienic conditions before being brought into the room, except in the case of automatic assembly or packaging, provided that there is no risk of contamination of the products;
F) packaging shall be done without delay. It shall be handled by separate group of staff having experience in handling and product wrapping and
G) immediately after packaging, the dairy products shall be placed in the designated rooms provided for storage under required temperature.
(3) Bottling or filling of containers with heat-treated milk and milk product shall be carried out hygienically.
(4) Wrapping or packaging may not be re-used for dairy products, except where the containers are of a type which may be re-used after thorough cleaning and disinfecting.
(5) Sealing shall be carried out in the establishment in which the last heat-treatment of milk or liquid milk-based products have been carried out, immediately after filling, by means of a sealing device which ensures that the milk is protected from any adverse effects of external origin on its characteristic. The sealing device shall be so designed that once the container has been opened, the evidence of opening remains clear and easy to check.
Source: Food Safety and Standards (Licensing and Registration of Food Businesses), regulations, 2011 8. Packaging requirements for Milk and Milk Products 1. Bottling or filling of containers with heat-treated milk and milk product shall be carried out
mechanically and the sealing of the containers shall be carried out automatically.
A-90

2. Wrapping or packaging may not be re-used for dairy products, except where the containers are of a type which may be re-used after thorough cleaning and disinfecting.
3. Sealing shall be carried out in the establishment in which the last heat-treatment of drinking milk or liquid milk-base products has been carried out, immediately after filling, by means of a sealing device which ensures that the milk is protected from any adverse effects of external origin on its characteristic. The sealing device shall be so designed that once the container has been opened, the evidence of opening remains clear and easy to check.
4. Immediately after packaging, the dairy products shall be placed in the rooms provided for storage. Source: Food Safety and Standards (Packaging and Labelling), regulations, 2011
A-91

General information
State Name of org TypePlantname
LocationPlantvisit
Products
AssamWest Assam Milk Producers’
Cooperative Union Ltd.(WAMUL)
Union Guwahati Guwahati YesStandard milk, Smart milk, Ghee, Standard curd, Sweet curd, Lassi, Cream,Paneer
GujaratKaira District Cooperative Milk
Union (AMUL)Union Anand Anand Yes
Liquid milk, Butter, Cheese, Infant milk food, Milk powder, Ghee, Cocoaproducts, Malted milk food, Extruded food, Bread spread, Table margarine,Sweets, Frozen food, Bakery, Therapeutic food.
GujaratGandhinagar District Cooperative
Milk Union(Madhur Dairy)
UnionGandhinag
arGandhina
garYes
Liquid milk, Milk powder, Milk Pouches, Ice cream, Ghee, Paneer, Cheese,Sweets etc.
GujaratBanaskantha District Cooperative
Milk Producer' Union (BanasDairy)
Union Banas 3 Palanpur YesSMP, WMP, DW, WB, TB, Cream, Paneer , Fermented Products, Babypowder
M.P.Bhopal Sahakari Dugdh Sangh
Maryadit(Bhopal Milk Union)
Union Bhopal Bhopal YesLiquid milk, Ghee, Butter, SMP, Paneer, Curd, Kheer, Peda, Mawa, Flavoredmilk, Butter milk, Lassi
M.P.Indore Sahakari Dugdh Sangh
Maryadit(Indore Milk Union)
Union Indore Indore YesFlavored Milk, Butter Milk, Lassi, Shrikhand, Paneer, Plain Curd, ProbioticCurd, Chhaina Rabri, Cream, Mawa, Peda, Rasgulla, Gulabjamun, Ghee, SMP,Sweet SMP, WMP, Table Butter, White Butter
M.P.Jabalpur Sahakari Dugdha Sangh
Maryadit, Jabalpur(Jabalpur Milk Union)
Union Jabalpur Jabalpur YesLiquid milk, Ghee, Paneer, Flavored milk, Shree khand, Matta, Sweet sip,Khowa, Peda, Curd, Cream, Lassi, Chaina Kheer
BiharVaishal Patliputra Dugdh Utpadak
Sahkari Sangh Ltd.(Patna Milk Union)
Union Patna Patna YesLiquid milk, milk powder, butter, ghee, ice cream, peda, paneer and Plain/MistiDahi, Lassi, Matha and kulfi.
BiharMithila Dugdh Utpadak Sahkari
Sangh Ltd.(Mithila Milk Union)
Union SmastipurSmastipu
rYes
Liquid milk, Ghee, peda, kalakand, Paneer, Rasogulla, Gulabjamun, Butter,Lassi, Misti Dahi etc.
Karnataka
Bangalore Urban, Rural &Ramanagara Districts Co-Operative Milk Producers
Societies Union Ltd., (BAMUL)
Union Mega dairy Bangalore YesLiquid milk, Butter, Ghee, Peda, Flavored Milk, Spiced Butter Milk, Paneer,Set Curds etc.
KarnatakaKalaburagi-Bidar & Yadgir Co-
Operative Milk ProducersSocieties Uion Ltd. (GUMUL)
Union Gulbarga Gulbarga Yes Liquid milk, Ghee, Curd, Peda, Buttermilk, Lassi, and Paneer
U.PLucknow Producer's Cooperative
Milk Union Ltd.Union Lucknow Lucknow Yes
Ghee, Paneer, curd, Lassi, Flavored milk, Butter milk Peda, Milk Cake, TB,Besan Laddu, Rice Kheer, Chena Kheer, Gulab Jamun, Rasgulla
U.PKanpur Dugdh Utpadak SahkariSangh Ltd. (Kanpur Milk Union)
Union Kanpur Kanpur Yes Raw milk
U.PVaranasi Dugdh Utpadak SahakariSangh Ltd. (Varanasi Milk Union)
Union Varanasi Varanasi Yes Liquid milk, Ghee, Butter
U.PGangol Sahkari Dugdh UtpadakSangh Ltd. Meerut (Meerut Milk
Union)Union Meerut Meerut Yes Ghee, Curd, Butter milk, Lassi, MP, Lassi, curd, Flavored milk, TB, Peda
U.P Saahaj PC NA Agra No NA
- - Private NA - Yes Liquide milk, Dahi, Curd, Ghee, Paneer, etc.
- - Private NA - No Liquid milk, Dahi, Ghee, Fresh Paneer
- - Private NA - Yes Liquid milk, Curd, Paneer, Lassi, Butter milk, Ghee, Ice-cream
- - Private NA - YesLiquid milk, curd, butter milk, lassi, ice-cream, panner, table butter, milkpowder, flavored milk, UHT milk and dairy whitener.
- - Private NA - Yes Liquid milk, Ghee, Curds, etc.
- - Private NA - Yes Ghee, Butter, SMP
- - Private NA - Yes Liquid milk, Ghee, SMP, Curd, Flavored milk, Lassi
- - Private NA - Yes Liquid milk, SMP, Ice- cream
- - Private NA - No Liquid milk, Ghee, SMP, Flavored milk etc.
- - Private NA - Yes Liquid milk, Ghee, SMP, Curd, Flavored milk etc.
- - Private NA - NoMilk, Paneer, Ghee, Rabri, Dahi, Lassi, Chaach, Yogurt, Flavored milk, Honeydrinks, Whey drinks, Butter, Cookies-rusk-matthi, Sweets, Chips
- - Private NA - Yes Liquid milk, Curd, Dahi, Butter milk, SMP, Ghee, etc.
- - Private NA - NoLiquid Milk, UHT milk, Flavored Milk, Dahi Cup, Dahi Pouch, Paneer, Ghee,Chach, Milk Shake
A-92
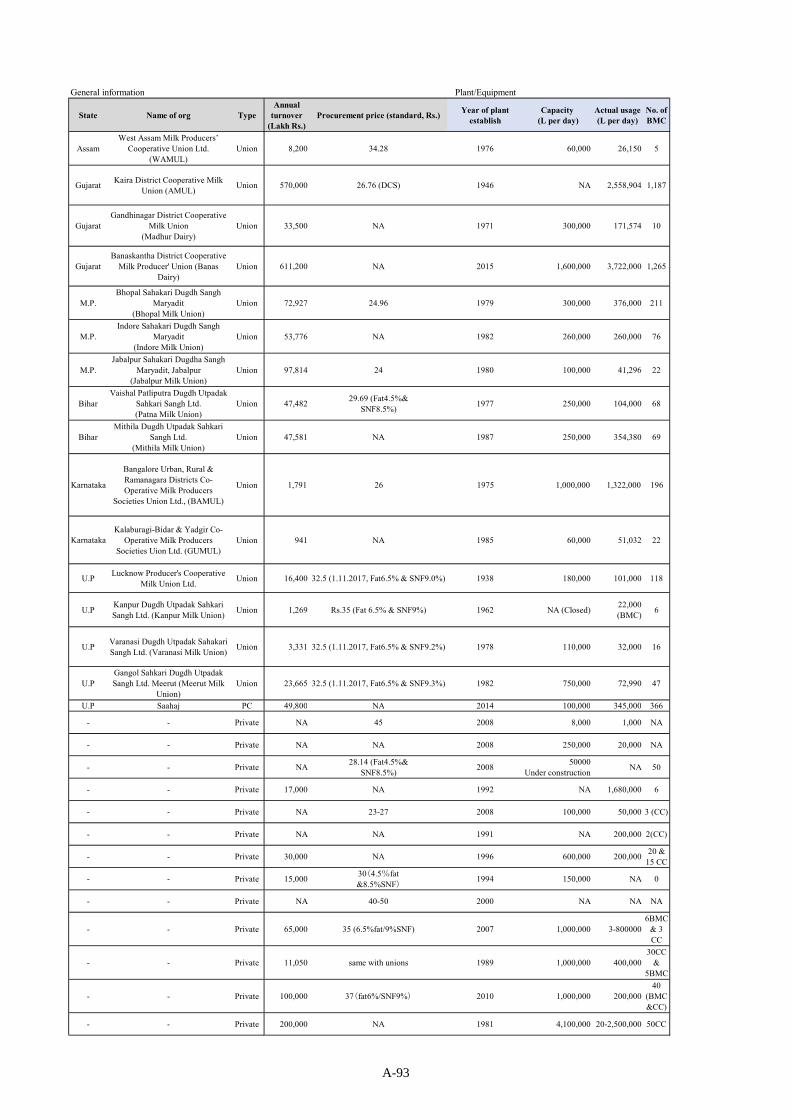
General information
State Name of org Type
AssamWest Assam Milk Producers’
Cooperative Union Ltd.(WAMUL)
Union
GujaratKaira District Cooperative Milk
Union (AMUL)Union
GujaratGandhinagar District Cooperative
Milk Union(Madhur Dairy)
Union
GujaratBanaskantha District Cooperative
Milk Producer' Union (BanasDairy)
Union
M.P.Bhopal Sahakari Dugdh Sangh
Maryadit(Bhopal Milk Union)
Union
M.P.Indore Sahakari Dugdh Sangh
Maryadit(Indore Milk Union)
Union
M.P.Jabalpur Sahakari Dugdha Sangh
Maryadit, Jabalpur(Jabalpur Milk Union)
Union
BiharVaishal Patliputra Dugdh Utpadak
Sahkari Sangh Ltd.(Patna Milk Union)
Union
BiharMithila Dugdh Utpadak Sahkari
Sangh Ltd.(Mithila Milk Union)
Union
Karnataka
Bangalore Urban, Rural &Ramanagara Districts Co-Operative Milk Producers
Societies Union Ltd., (BAMUL)
Union
KarnatakaKalaburagi-Bidar & Yadgir Co-
Operative Milk ProducersSocieties Uion Ltd. (GUMUL)
Union
U.PLucknow Producer's Cooperative
Milk Union Ltd.Union
U.PKanpur Dugdh Utpadak SahkariSangh Ltd. (Kanpur Milk Union)
Union
U.PVaranasi Dugdh Utpadak SahakariSangh Ltd. (Varanasi Milk Union)
Union
U.PGangol Sahkari Dugdh UtpadakSangh Ltd. Meerut (Meerut Milk
Union)Union
U.P Saahaj PC
- - Private
- - Private
- - Private
- - Private
- - Private
- - Private
- - Private
- - Private
- - Private
- - Private
- - Private
- - Private
- - Private
Plant/EquipmentAnnual
turnover(Lakh Rs.)
Procurement price (standard, Rs.)Year of plant
establishCapacity
(L per day)Actual usage(L per day)
No. ofBMC
8,200 34.28 1976 60,000 26,150 5
570,000 26.76 (DCS) 1946 NA 2,558,904 1,187
33,500 NA 1971 300,000 171,574 10
611,200 NA 2015 1,600,000 3,722,000 1,265
72,927 24.96 1979 300,000 376,000 211
53,776 NA 1982 260,000 260,000 76
97,814 24 1980 100,000 41,296 22
47,48229.69 (Fat4.5%&
SNF8.5%)1977 250,000 104,000 68
47,581 NA 1987 250,000 354,380 69
1,791 26 1975 1,000,000 1,322,000 196
941 NA 1985 60,000 51,032 22
16,400 32.5 (1.11.2017, Fat6.5% & SNF9.0%) 1938 180,000 101,000 118
1,269 Rs.35 (Fat 6.5% & SNF9%) 1962 NA (Closed)22,000(BMC)
6
3,331 32.5 (1.11.2017, Fat6.5% & SNF9.2%) 1978 110,000 32,000 16
23,665 32.5 (1.11.2017, Fat6.5% & SNF9.3%) 1982 750,000 72,990 47
49,800 NA 2014 100,000 345,000 366
NA 45 2008 8,000 1,000 NA
NA NA 2008 250,000 20,000 NA
NA28.14 (Fat4.5%&
SNF8.5%)2008
50000Under construction
NA 50
17,000 NA 1992 NA 1,680,000 6
NA 23-27 2008 100,000 50,000 3 (CC)
NA NA 1991 NA 200,000 2(CC)
30,000 NA 1996 600,000 200,00020 &
15 CC
15,00030(4.5%fat&8.5%SNF)
1994 150,000 NA 0
NA 40-50 2000 NA NA NA
65,000 35 (6.5%fat/9%SNF) 2007 1,000,000 3-8000006BMC
& 3CC
11,050 same with unions 1989 1,000,000 400,00030CC
&5BMC
100,000 37(fat6%/SNF9%) 2010 1,000,000 200,00040
(BMC&CC)
200,000 NA 1981 4,100,000 20-2,500,000 50CC
A-93

General information
State Name of org Type
AssamWest Assam Milk Producers’
Cooperative Union Ltd.(WAMUL)
Union
GujaratKaira District Cooperative Milk
Union (AMUL)Union
GujaratGandhinagar District Cooperative
Milk Union(Madhur Dairy)
Union
GujaratBanaskantha District Cooperative
Milk Producer' Union (BanasDairy)
Union
M.P.Bhopal Sahakari Dugdh Sangh
Maryadit(Bhopal Milk Union)
Union
M.P.Indore Sahakari Dugdh Sangh
Maryadit(Indore Milk Union)
Union
M.P.Jabalpur Sahakari Dugdha Sangh
Maryadit, Jabalpur(Jabalpur Milk Union)
Union
BiharVaishal Patliputra Dugdh Utpadak
Sahkari Sangh Ltd.(Patna Milk Union)
Union
BiharMithila Dugdh Utpadak Sahkari
Sangh Ltd.(Mithila Milk Union)
Union
Karnataka
Bangalore Urban, Rural &Ramanagara Districts Co-Operative Milk Producers
Societies Union Ltd., (BAMUL)
Union
KarnatakaKalaburagi-Bidar & Yadgir Co-
Operative Milk ProducersSocieties Uion Ltd. (GUMUL)
Union
U.PLucknow Producer's Cooperative
Milk Union Ltd.Union
U.PKanpur Dugdh Utpadak SahkariSangh Ltd. (Kanpur Milk Union)
Union
U.PVaranasi Dugdh Utpadak SahakariSangh Ltd. (Varanasi Milk Union)
Union
U.PGangol Sahkari Dugdh UtpadakSangh Ltd. Meerut (Meerut Milk
Union)Union
U.P Saahaj PC
- - Private
- - Private
- - Private
- - Private
- - Private
- - Private
- - Private
- - Private
- - Private
- - Private
- - Private
- - Private
- - Private
Recentupdate
Automation
Kinds of test atcollection
Methods of testing at collection Kinds of test at loading tanker
2008 Manual Fat & SNF Lactometer NA
2017 Automated Fat & SNF Machine & Lactometer NA
2014 Manual Fat & SNF Machine & Lactometer NA
2015 ManualFat & SNF,
WaterMachine & Lactometer NA
201790%
AutomatedFat & SNF Machine & Lactometer Fat & SNF
2013 Manual Fat & SNF Machine & LactometerOrganoleptic, Fat&SNF,
Adulteration, COB
NA Manual NA NA NA
2017 Manual Fat & SNF Lactometer NA
2016 Manual Fat & SNF Machine & Lactometer NA
2016 Automated Fat & SNF Machine & Lactometer Fat & SNF, Acidity, SG
2016 Manual Fat & SNF Machine & Lactometer NA
2015 ManualFat & SNF,
WaterNA
Organoleptic, Fat&SNF,Adulteration, COB
NA Automated Fat & SNF Machine & LactometerOrganoleptic, Fat&SNF,
Adulteration, COB
2017 ManualFat & SNF,
WaterMachine & Lactometer
Organoleptic, Fat&SNF,Adulteration, COB
2016 Manual NA NA NA
NA NA NA NA NA
NA Manual Fat & SNF Lactometer NA
2017 NA NA NA NA
2017 NA Fat & SNF Machine NA
NAPartially
automatedFat & SNF Machine
Organoleptic, Adulteration,Neutralizer, Preservative
2016 Manual Fat & SNFFat & SNF, Organoleptic,
AdulterationFat & SNF, Organoleptic,
Adulteration
2016 Manual NAOrganoleptic test、COB、fat/SNF、
Adulterant、Alcohol testNA
NA NA NA NA NA
2013 Manual Fat & SNF Machine NA
NA NA NA NA NA
NAPartiallymanual
NA NA NA
NA NA NA NA NA
2014construct
edAutomated NA NA NA
NA NA NA NA NA
A-94

General information
State Name of org Type
AssamWest Assam Milk Producers’
Cooperative Union Ltd.(WAMUL)
Union
GujaratKaira District Cooperative Milk
Union (AMUL)Union
GujaratGandhinagar District Cooperative
Milk Union(Madhur Dairy)
Union
GujaratBanaskantha District Cooperative
Milk Producer' Union (BanasDairy)
Union
M.P.Bhopal Sahakari Dugdh Sangh
Maryadit(Bhopal Milk Union)
Union
M.P.Indore Sahakari Dugdh Sangh
Maryadit(Indore Milk Union)
Union
M.P.Jabalpur Sahakari Dugdha Sangh
Maryadit, Jabalpur(Jabalpur Milk Union)
Union
BiharVaishal Patliputra Dugdh Utpadak
Sahkari Sangh Ltd.(Patna Milk Union)
Union
BiharMithila Dugdh Utpadak Sahkari
Sangh Ltd.(Mithila Milk Union)
Union
Karnataka
Bangalore Urban, Rural &Ramanagara Districts Co-Operative Milk Producers
Societies Union Ltd., (BAMUL)
Union
KarnatakaKalaburagi-Bidar & Yadgir Co-
Operative Milk ProducersSocieties Uion Ltd. (GUMUL)
Union
U.PLucknow Producer's Cooperative
Milk Union Ltd.Union
U.PKanpur Dugdh Utpadak SahkariSangh Ltd. (Kanpur Milk Union)
Union
U.PVaranasi Dugdh Utpadak SahakariSangh Ltd. (Varanasi Milk Union)
Union
U.PGangol Sahkari Dugdh UtpadakSangh Ltd. Meerut (Meerut Milk
Union)Union
U.P Saahaj PC
- - Private
- - Private
- - Private
- - Private
- - Private
- - Private
- - Private
- - Private
- - Private
- - Private
- - Private
- - Private
- - Private
Kinds of test at plant reception Rejection of milk Kinds of test at dispatch
Fat & SNF, CLR, Temp., Acidity Some times in summerAll types of quality and microbiological
tests
Organoleptic, Temperature, Adulteration, Acidity,Alcohol test, COB, MBRT, Fat&SNF
A few times in yearAll types of quality and microbiological
tests
Organoleptic, Temperature, Adulteration, Acidity,Alcohol test, COB, MBRT, Fat&SNF
Some in summer seasonAll types of quality and microbiological
tests
Organoleptic, Temperature, Adulteration, Acidity,Alcohol test, COB, MBRT, Fat&SNF
NAAll types of quality and microbiological
tests
Fat & SNF, CLR, Temp., Acidity A few times in yearAll types of quality and microbiological
tests
Organoleptic, Temperature, Adulteration, Acidity,Alcohol test, COB, MBRT, Fat&SNF
Not happened in last 5-6years
NA
NA No adulteration in 2013 NA
Organoleptic, Temperature, Adulteration, Acidity,Alcohol test, COB, MBRT, Fat&SNF
NAAll types of quality and microbiological
tests
Organoleptic, Temperature, Adulteration, Acidity,Alcohol test, COB, MBRT, Fat&SNF
A few times in yearAll types of quality and microbiological
tests
All NoneAll types of quality and microbiological
tests
Organoleptic, Temperature, Adulteration, Acidity,Alcohol test, COB, MBRT, Fat&SNF
A few times in yearAll types of quality and microbiological
tests
Organoleptic, Temperature, Adulteration, Acidity,Alcohol test, COB, MBRT, Fat&SNF
NA NA
Organoleptic, Temperature, Adulteration, Acidity,Alcohol test, COB, MBRT, Fat&SNF
3-4 times in a yearAll types of quality and microbiological
tests
Organoleptic, Temperature, Adulteration, Acidity,Alcohol test, COB, MBRT, Fat&SNF
A few times in yearAll types of quality and microbiological
tests
NA NA NA
NA NA NA
Fat & SNF, CLR, Temp., Acidity NA NA
NA NA NA
NA NA NA
Organoleptic, Adulteration, Neutralizer, Alcohol,Acidity, MBRT
≒1%when tanker delayed
NA
Fat & SNF, Organoleptic, Adulteration 2 times in summer NA
Organoleptic test、COB、fat/SNF、Adulterant、Alcohol test
NA NA
NA None NA
Fat & SNF, CLR etc. NA NA
Fat & SNF, Bacteria counts NA NA
NA NA NA
NA NA NA
NA NA NA
NA Less than 5% NA
A-95

General information
State Name of org Type
AssamWest Assam Milk Producers’
Cooperative Union Ltd.(WAMUL)
Union
GujaratKaira District Cooperative Milk
Union (AMUL)Union
GujaratGandhinagar District Cooperative
Milk Union(Madhur Dairy)
Union
GujaratBanaskantha District Cooperative
Milk Producer' Union (BanasDairy)
Union
M.P.Bhopal Sahakari Dugdh Sangh
Maryadit(Bhopal Milk Union)
Union
M.P.Indore Sahakari Dugdh Sangh
Maryadit(Indore Milk Union)
Union
M.P.Jabalpur Sahakari Dugdha Sangh
Maryadit, Jabalpur(Jabalpur Milk Union)
Union
BiharVaishal Patliputra Dugdh Utpadak
Sahkari Sangh Ltd.(Patna Milk Union)
Union
BiharMithila Dugdh Utpadak Sahkari
Sangh Ltd.(Mithila Milk Union)
Union
Karnataka
Bangalore Urban, Rural &Ramanagara Districts Co-Operative Milk Producers
Societies Union Ltd., (BAMUL)
Union
KarnatakaKalaburagi-Bidar & Yadgir Co-
Operative Milk ProducersSocieties Uion Ltd. (GUMUL)
Union
U.PLucknow Producer's Cooperative
Milk Union Ltd.Union
U.PKanpur Dugdh Utpadak SahkariSangh Ltd. (Kanpur Milk Union)
Union
U.PVaranasi Dugdh Utpadak SahakariSangh Ltd. (Varanasi Milk Union)
Union
U.PGangol Sahkari Dugdh UtpadakSangh Ltd. Meerut (Meerut Milk
Union)Union
U.P Saahaj PC
- - Private
- - Private
- - Private
- - Private
- - Private
- - Private
- - Private
- - Private
- - Private
- - Private
- - Private
- - Private
- - Private
Pasteurizer (year, Company) Packing machine (year, company)Compressor
(year, company)
2008(IDMC)
2011(RMC packing)
2008 (Kirloskar)
NA NA NA
2016, 2013 (GEA) 2012 (Atomic Engineers) 2003, Johnson Control (USA)
1998 (IDMC) TetrapackIDMC, Grasso, Mayekawa,
Kirloskar
2001 (IDMC ), 2007 (Tetra Pak)2003-2014 (RMC Packing, Accent
Pack, Samarpan)2012 (Grasso-GEA, Kirloskar)
1994(HMD),2004(VedeEngineering),2012-13(IDMC)
Deccan Packaging System and Need,RM Packing System
2012 (Frick India)
NA NA NA
1994 (Tetra Pak), 2016 (IDMC) 2005&2010 (Vijaipac) NA
1994 (Tetra Pak), 2016 (IDMC)2005&2010 R.M.C Packing Systems
Pvt. Ltd.1994, Frik India
2000&2015 2010&2012 2000
2012 IDMC 2007 1997&2012 Frik India
1995&2000 (Tetra Pac) 1995&2003 (Prepac, Smarpan, RMC) 1953 (Frick India)
NA NA NA
2001&2016 (Tetra Pak) 1998,2008,2017 (Samarpan) 2001&2008 (Kirloskar)
1999 (Alfa label), 2004 (Gea Eco Flex),2016 (IDMC)
2010, 20112010-12 (Frick India), 2012
(Kirloskar)
NA NA NA
NA NA NA
2017 NA NA
2017 (IDMC, SUNDEX) 2017 (IDMC) 2010 (Kirloskar)
Tetrapak NA Kirloskar
2016 (Aakash Enterprise) RMC packing Metlex
2005(Alfa Laval) NA 2005
1996 (TetraPak), 2011 (Alfa laval) Tetrapack, Samalpan Thermex
2013-14 (Jaya Industries)2013-14 (Shankar, Sunbeam
R.M.C Packing)Kirloskar, Thermax
NA NA NA
Tetra Pak RMC, Samarpan Kirloskar
NA NA NA
GEA Samarpan NA
NA NA NA
A-96

General information
State Name of org Type
AssamWest Assam Milk Producers’
Cooperative Union Ltd.(WAMUL)
Union
GujaratKaira District Cooperative Milk
Union (AMUL)Union
GujaratGandhinagar District Cooperative
Milk Union(Madhur Dairy)
Union
GujaratBanaskantha District Cooperative
Milk Producer' Union (BanasDairy)
Union
M.P.Bhopal Sahakari Dugdh Sangh
Maryadit(Bhopal Milk Union)
Union
M.P.Indore Sahakari Dugdh Sangh
Maryadit(Indore Milk Union)
Union
M.P.Jabalpur Sahakari Dugdha Sangh
Maryadit, Jabalpur(Jabalpur Milk Union)
Union
BiharVaishal Patliputra Dugdh Utpadak
Sahkari Sangh Ltd.(Patna Milk Union)
Union
BiharMithila Dugdh Utpadak Sahkari
Sangh Ltd.(Mithila Milk Union)
Union
Karnataka
Bangalore Urban, Rural &Ramanagara Districts Co-Operative Milk Producers
Societies Union Ltd., (BAMUL)
Union
KarnatakaKalaburagi-Bidar & Yadgir Co-
Operative Milk ProducersSocieties Uion Ltd. (GUMUL)
Union
U.PLucknow Producer's Cooperative
Milk Union Ltd.Union
U.PKanpur Dugdh Utpadak SahkariSangh Ltd. (Kanpur Milk Union)
Union
U.PVaranasi Dugdh Utpadak SahakariSangh Ltd. (Varanasi Milk Union)
Union
U.PGangol Sahkari Dugdh UtpadakSangh Ltd. Meerut (Meerut Milk
Union)Union
U.P Saahaj PC
- - Private
- - Private
- - Private
- - Private
- - Private
- - Private
- - Private
- - Private
- - Private
- - Private
- - Private
- - Private
- - Private
Food safety
ISO(22000,14000,9001)
Other (FSSC22000, QualityMark, Halal, etc.)
HACCP Cleanness of factory Cleanness of staffs
NA NA NAWell maintained,
Wet floorWell maintained,
Some do not wear caps.
22000, 9001 FSSC22000, Halal Yes Very clean Very clean
9001 NA Yes Very clean No gloves, masks for worker
22000, 14000,9001
Halal Yes Clean in general, dried floor Cap, Mask, Gloves
22000, 14000,9001
NA Yes Very clean Clean
22000, 14000,9001
NA Yes Clean but wet floor Clean
22000 NA Yes Clean but wet floor Clean
22000 Quality Mark YesGenerally clean and well
maintainedWorkers do not wear mask
9001 NA NA Old building, wet floor No gloves for worker
22000, 9001 Quality Mark, AGMARK Yes Very clean Clean
22000 NA Yes Clean but need to improve Clean
22000, 9001 NA Yes Clean but need to improve Clean
(22000) notrenewed
NA NA Dirty NA
NA NA Yes DirtyNot every workers wear
caps, and masks
22000 NA Yes NA NA
NA NA NA NA NA
No No No NA NA
No No No NA NA
Yes NA Yes NA NA
22000, 9001 NA Yes Clean and dried floor Clean
22000, 9001 NA Yes Clean Clean
22000 NA Yes Clean Workers do not wear mask
22000 FSSC22000 Yes Very clean Clean
22000, 9001 NA Yes Clean but wet floor Clean
NA NA NA NA NA
22,000 NA Yes Very clean and dried floor Clean
NA NA NA NA NA
22,000 FSSC22000, Halal Yes Very clean Clean
9,001 Halal Yes NA NA
A-97

General information
State Name of org Type
AssamWest Assam Milk Producers’
Cooperative Union Ltd.(WAMUL)
Union
GujaratKaira District Cooperative Milk
Union (AMUL)Union
GujaratGandhinagar District Cooperative
Milk Union(Madhur Dairy)
Union
GujaratBanaskantha District Cooperative
Milk Producer' Union (BanasDairy)
Union
M.P.Bhopal Sahakari Dugdh Sangh
Maryadit(Bhopal Milk Union)
Union
M.P.Indore Sahakari Dugdh Sangh
Maryadit(Indore Milk Union)
Union
M.P.Jabalpur Sahakari Dugdha Sangh
Maryadit, Jabalpur(Jabalpur Milk Union)
Union
BiharVaishal Patliputra Dugdh Utpadak
Sahkari Sangh Ltd.(Patna Milk Union)
Union
BiharMithila Dugdh Utpadak Sahkari
Sangh Ltd.(Mithila Milk Union)
Union
Karnataka
Bangalore Urban, Rural &Ramanagara Districts Co-Operative Milk Producers
Societies Union Ltd., (BAMUL)
Union
KarnatakaKalaburagi-Bidar & Yadgir Co-
Operative Milk ProducersSocieties Uion Ltd. (GUMUL)
Union
U.PLucknow Producer's Cooperative
Milk Union Ltd.Union
U.PKanpur Dugdh Utpadak SahkariSangh Ltd. (Kanpur Milk Union)
Union
U.PVaranasi Dugdh Utpadak SahakariSangh Ltd. (Varanasi Milk Union)
Union
U.PGangol Sahkari Dugdh UtpadakSangh Ltd. Meerut (Meerut Milk
Union)Union
U.P Saahaj PC
- - Private
- - Private
- - Private
- - Private
- - Private
- - Private
- - Private
- - Private
- - Private
- - Private
- - Private
- - Private
- - Private
Anti insect Remarks
Open Managed by NDDB
Closed
Almost closed New plant is under construction
Closed,Insect killer
Biggest plant in India
Partially open Actively improving the hygiene management
Almost closed
Almost closed
Partially open and foundfly
Date printing before packing paneer
OpenRe-use milk is kept in plastic case with room
temperatureNew plant is under construction
ClosedFirst union in south India to have the fully automated
processing plant. No hand soap is set in toilet likeother plants.
Partially open and foundfly
CIP system is in manual, need to be automated toimprove stability of quality
Partially open and foundfly
New plant (3 lakh) is under construction
OpenNew plants (4 lakh/ 20MT SMP) are under
construction
Open New plant (4 lakh) is under construction
Open New plant (4 lakh) is under construction
NA
Open Their dairy business is straggling
NA
NA New plant is under construction
Closed
Open
Partially open
Closed
Partially open
NA Exported Ghee to Japan in past
Closed GM is QC manager, Keep products sample every day
NA Registered in Japan to export
Closed
NA
A-98

Annex 11: List of machineries of dairy plants
1. Bangalore Co-operative Milk Union
1.1 Milk processing
A-99
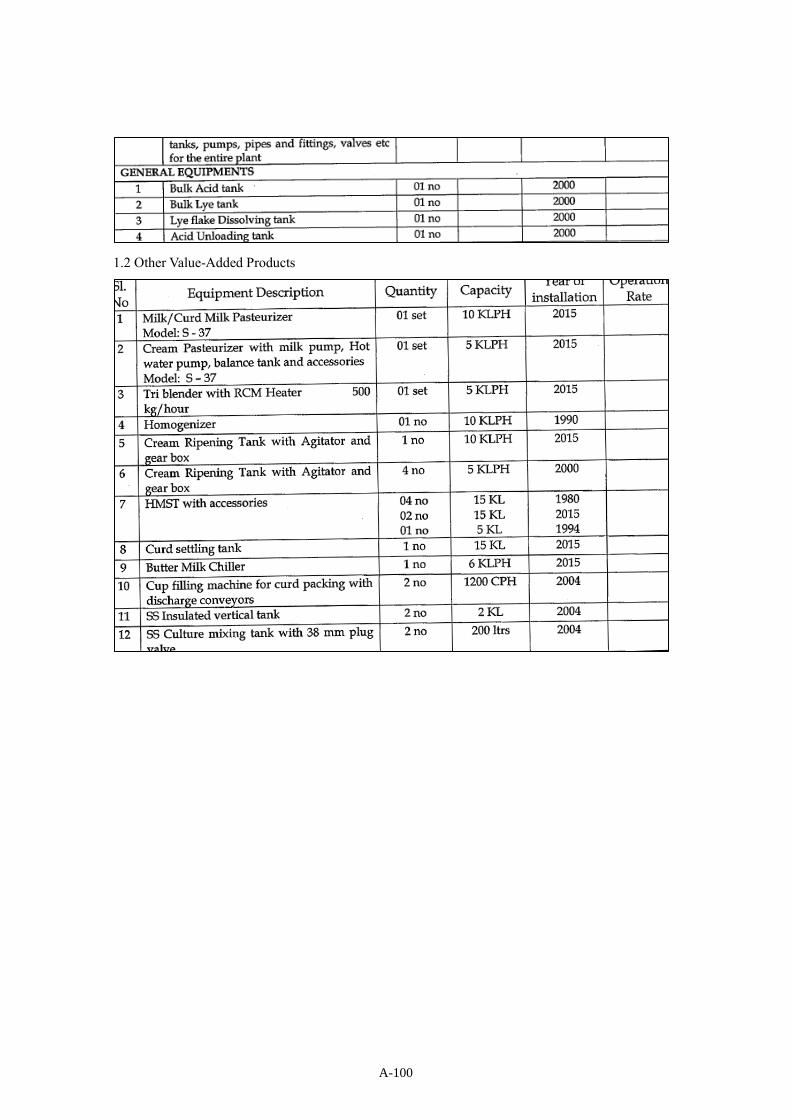
1.2 Other Value-Added Products
A-100

Source: Bangalore Co-operative Milk Union
A-101

2. Gurbulga Cooperative Milk Producers Union Ltd.
Source: Gurbulga Cooperative Milk Producers Union Ltd.
A-102
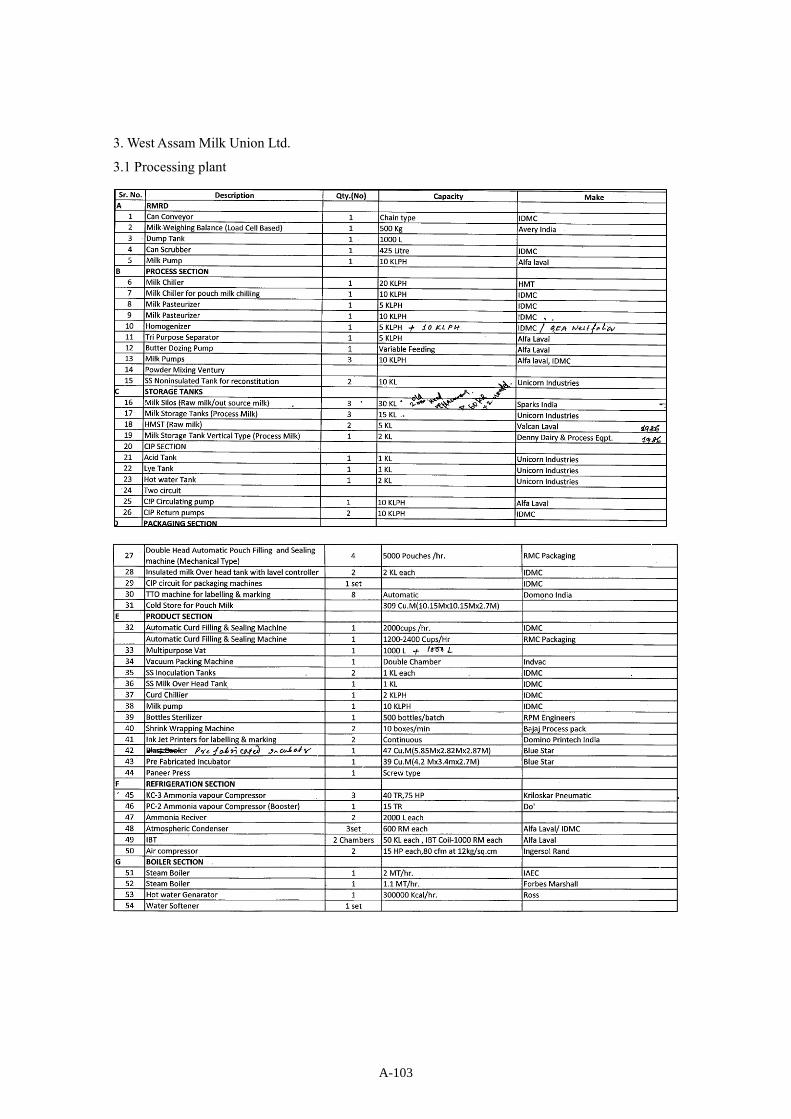
3. West Assam Milk Union Ltd.
3.1 Processing plant
A-103

3.2 Laboratory equipment
Source: West Assam Milk Union Ltd.
A-104

Annex 12 NDDB Eligibility Criteria and Terms and conditions of lending (28 Nov 2017)
A-105
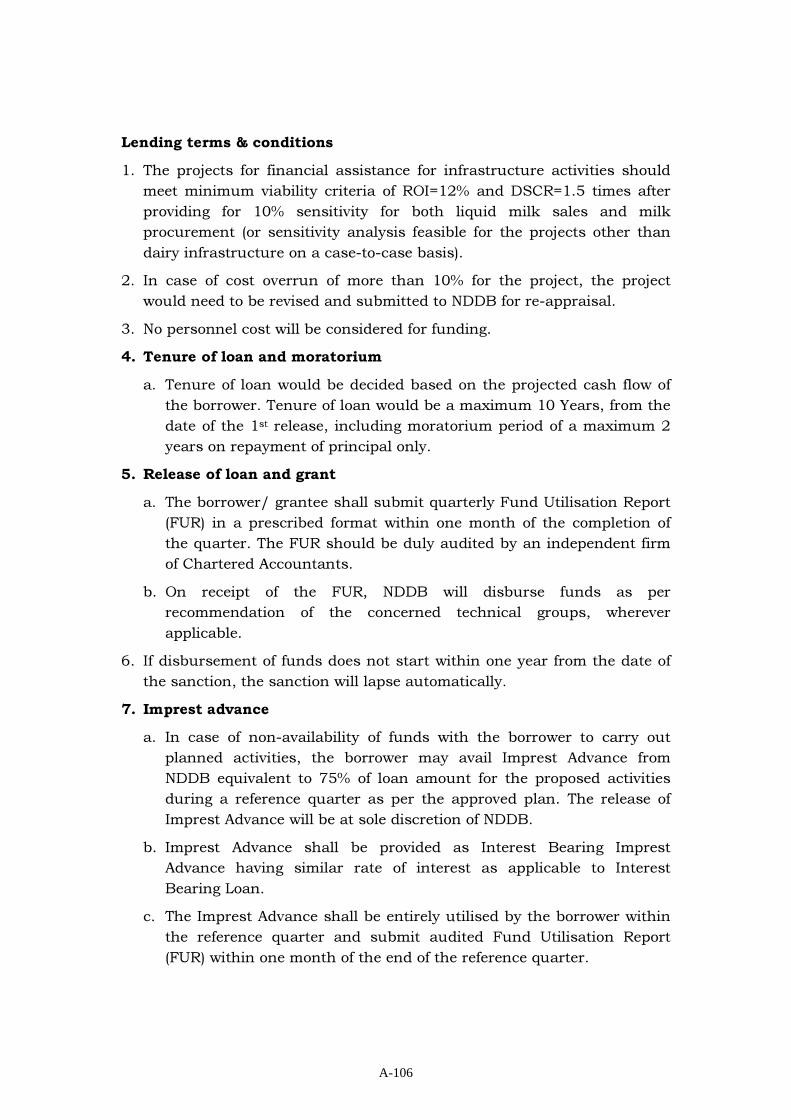
A-106
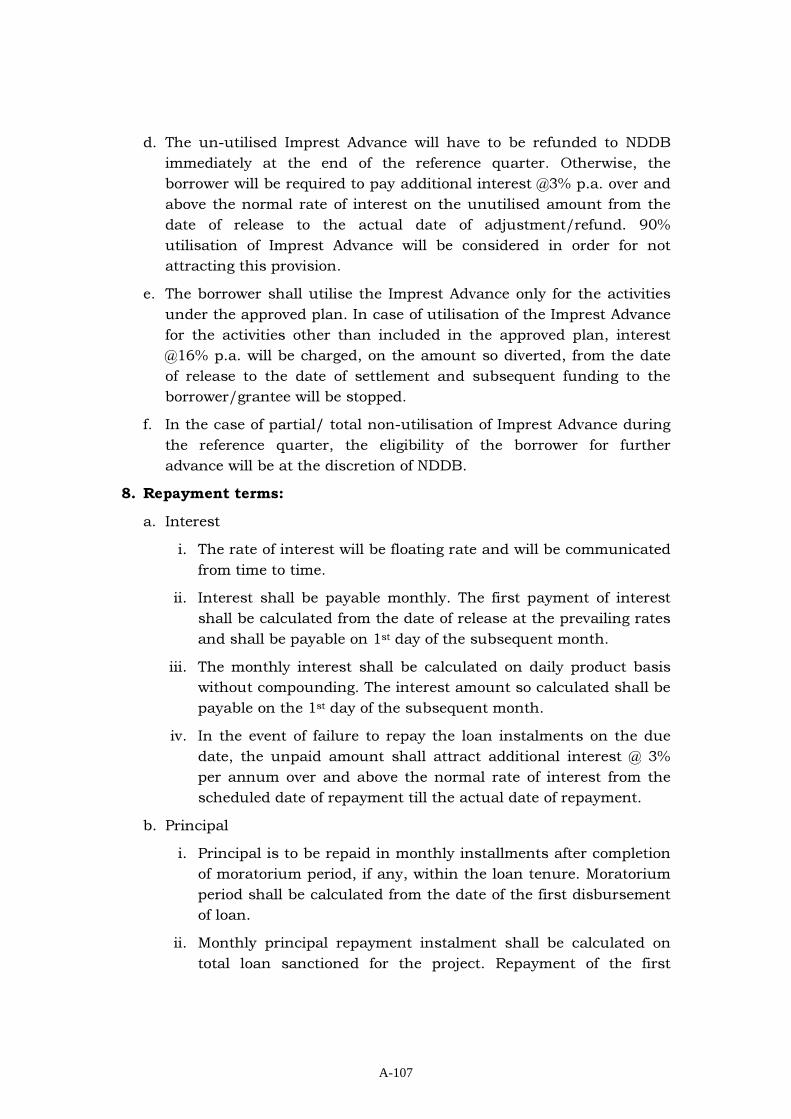
A-107
A-108

A-109

A-110

A-111


![[XLS] · Web viewBO BRA Brazil Federative Republic of Brazil ... India Republic of India Indian rupee ... LIC Low income group aggregate](https://img.pdfslide.us/doc/110x75/5b06278a7f8b9ad1768c69a3/xls-viewbo-bra-brazil-federative-republic-of-brazil-india-republic-of-india.jpg)