Embed Size (px)
Citation preview
SUPPLEMENT DATED 27 APRIL 2011 TO THE BASE PROSPECTUS DATED 25 OCTOBER 2010
REPSOL INTERNATIONAL FINANCE B.V. (A private company with limited liability incorporated under the laws of The Netherlands
and having its corporate seat (statutaire zetel) in The Hague)
EURO 10,000,000,000
Guaranteed Euro Medium Term Note Programme
Guaranteed by
REPSOL YPF, S.A. (A sociedad anónima organised under the laws of the Kingdom of Spain)
This supplement (the Supplement) to the base prospectus (the Base Prospectus) dated 25 October 2010, which comprises a base prospectus, constitutes a supplement, for the purposes of Article 16 of the Prospectus Directive as implemented by Article 13 of Chapter 1 of Part II of the Luxembourg Act dated 10 July 2005 on prospectuses for securities (the Luxembourg Law), to the Base Prospectus and is prepared in connection with the euro 10,000,000,000 Guaranteed Euro Medium Term Note Programme established by Repsol International Finance B.V. (the Issuer) and guaranteed by Repsol YPF, S.A. (the Guarantor). Terms defined in the Base Prospectus have the same meaning when used in this Supplement.
This Supplement is supplemental to, and should be read in conjunction with, the Base Prospectus issued by the Issuer and the Guarantor.
Each of the Issuer and the Guarantor accepts responsibility for the information contained in this Supplement and declares that, having taken all reasonable care to ensure that such is the case, the information contained in this Supplement is, to the best of its knowledge, in accordance with the facts and contains no omission likely to affect its import. The information incorporated by reference to the Base Prospectus by virtue of this Supplement has been translated from the original Spanish. Each such translation is a direct, complete and accurate translation of the Spanish language text and each of the Issuer and the Guarantor accepts responsibility for the accuracy of such translations.
The Dealers and the Arranger have not separately verified the information contained in the Base Prospectus, as supplemented by this Supplement. None of the Dealers or the Arranger makes any representation, express or implied, or accepts any responsibility, with respect to the accuracy or completeness of any of the information in the Base Prospectus, as supplemented by this Supplement.
On 25 February 2011, the Guarantor presented its audited consolidated annual report as of and for the year ended 31 December 2010 (the Guarantor’s Annual Report 2010) to the Spanish National Securities Market Commission (Comisión Nacional del Mercado de Valores). An English-language translation of the Guarantor’s Annual Report 2010 and the related audit report have been filed with the Luxembourg Financial Sector Surveillance Commission (Commission de Surveillance du Secteur Financier or CSSF) and, by virtue of this Supplement, are incorporated by reference in, and form part of, the Base Prospectus. This Supplement also incorporates by reference certain regulatory announcements released by the Guarantor since the date of the Base Prospectus.
On 25 February 2011, the board of directors of the Issuer approved its audited non-consolidated annual report as of and for the year ended 31 December 2010 (the Issuer’s Annual Report 2010). The Issuer’s Annual Report 2010 and the related audit report have been filed with the CSSF and, by virtue of this Supplement, are incorporated by reference in, and form part of, the Base Prospectus.
Page 2
To the extent there is any inconsistency between (a) any statement in this Supplement or any statement incorporated by reference into the Base Prospectus by this Supplement, and (b) any other statement, pre-dating this Supplement, in, or incorporated by reference in, the Base Prospectus, the statements in (a) above shall prevail.
Documents incorporated by reference
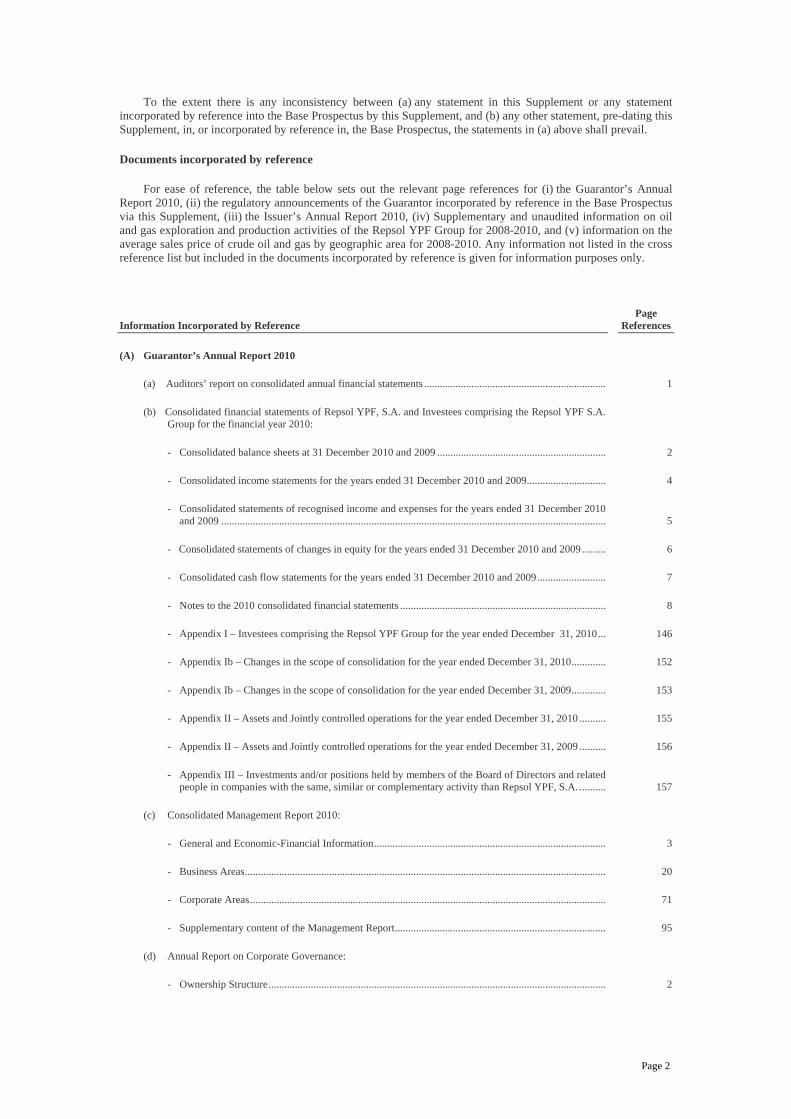
For ease of reference, the table below sets out the relevant page references for (i) the Guarantor’s Annual Report 2010, (ii) the regulatory announcements of the Guarantor incorporated by reference in the Base Prospectus via this Supplement, (iii) the Issuer’s Annual Report 2010, (iv) Supplementary and unaudited information on oil and gas exploration and production activities of the Repsol YPF Group for 2008-2010, and (v) information on the average sales price of crude oil and gas by geographic area for 2008-2010. Any information not listed in the cross reference list but included in the documents incorporated by reference is given for information purposes only.
Information Incorporated by Reference Page
References
(A) Guarantor’s Annual Report 2010
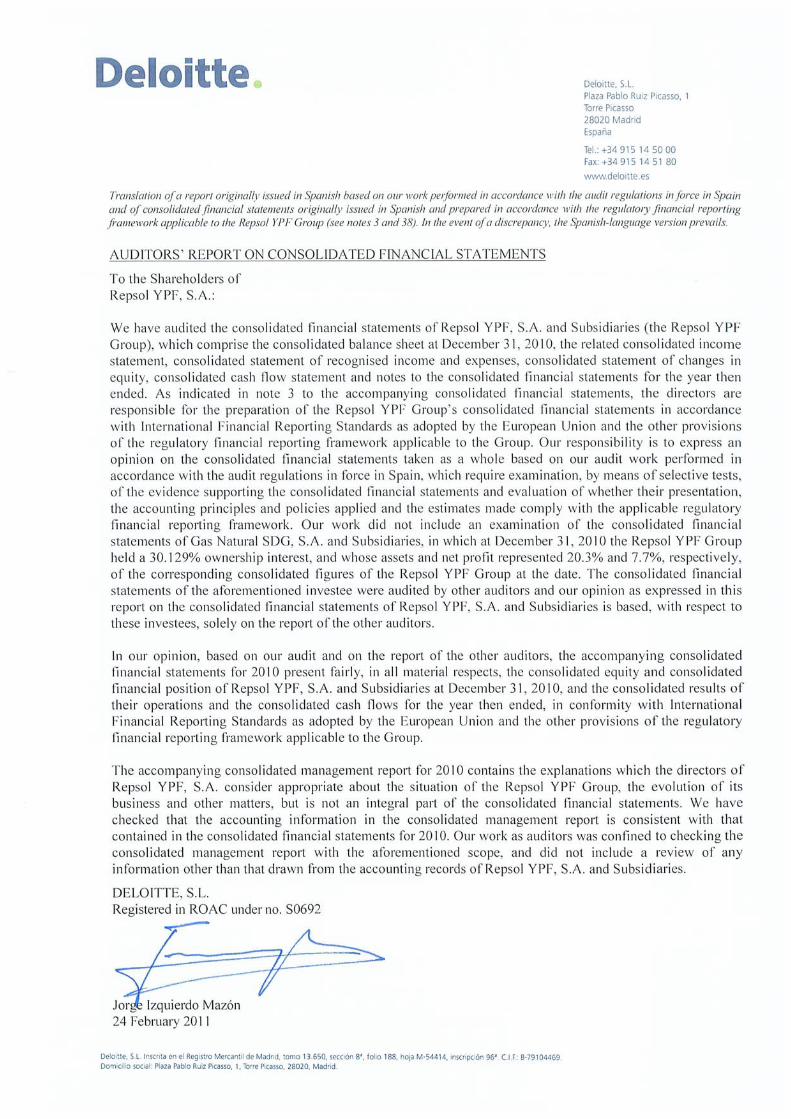
(a) Auditors’ report on consolidated annual financial statements ..................................................................... 1
(b) Consolidated financial statements of Repsol YPF, S.A. and Investees comprising the Repsol YPF S.A. Group for the financial year 2010:
- Consolidated balance sheets at 31 December 2010 and 2009 ................................................................ 2
- Consolidated income statements for the years ended 31 December 2010 and 2009.............................. 4
- Consolidated statements of recognised income and expenses for the years ended 31 December 2010 and 2009 .................................................................................................................................................. 5
- Consolidated statements of changes in equity for the years ended 31 December 2010 and 2009......... 6
- Consolidated cash flow statements for the years ended 31 December 2010 and 2009.......................... 7
- Notes to the 2010 consolidated financial statements .............................................................................. 8
- Appendix I – Investees comprising the Repsol YPF Group for the year ended December 31, 2010... 146
- Appendix Ib – Changes in the scope of consolidation for the year ended December 31, 2010............. 152
- Appendix Ib – Changes in the scope of consolidation for the year ended December 31, 2009............. 153
- Appendix II – Assets and Jointly controlled operations for the year ended December 31, 2010 .......... 155
- Appendix II – Assets and Jointly controlled operations for the year ended December 31, 2009 .......... 156
- Appendix III – Investments and/or positions held by members of the Board of Directors and related people in companies with the same, similar or complementary activity than Repsol YPF, S.A. .......... 157
(c) Consolidated Management Report 2010:
- General and Economic-Financial Information........................................................................................ 3
- Business Areas......................................................................................................................................... 20
- Corporate Areas....................................................................................................................................... 71
- Supplementary content of the Management Report................................................................................ 95
(d) Annual Report on Corporate Governance:
- Ownership Structure................................................................................................................................ 2
Page 3
- Management Structure of the Company ................................................................................................. 7
- Related Party Transactions...................................................................................................................... 38
- Risk Control Systems .............................................................................................................................. 42
- General Meeting ...................................................................................................................................... 46
- Extent of Compliance with the Corporate Governance Recommendations ........................................... 53
- Other Information of Interest .................................................................................................................. 69
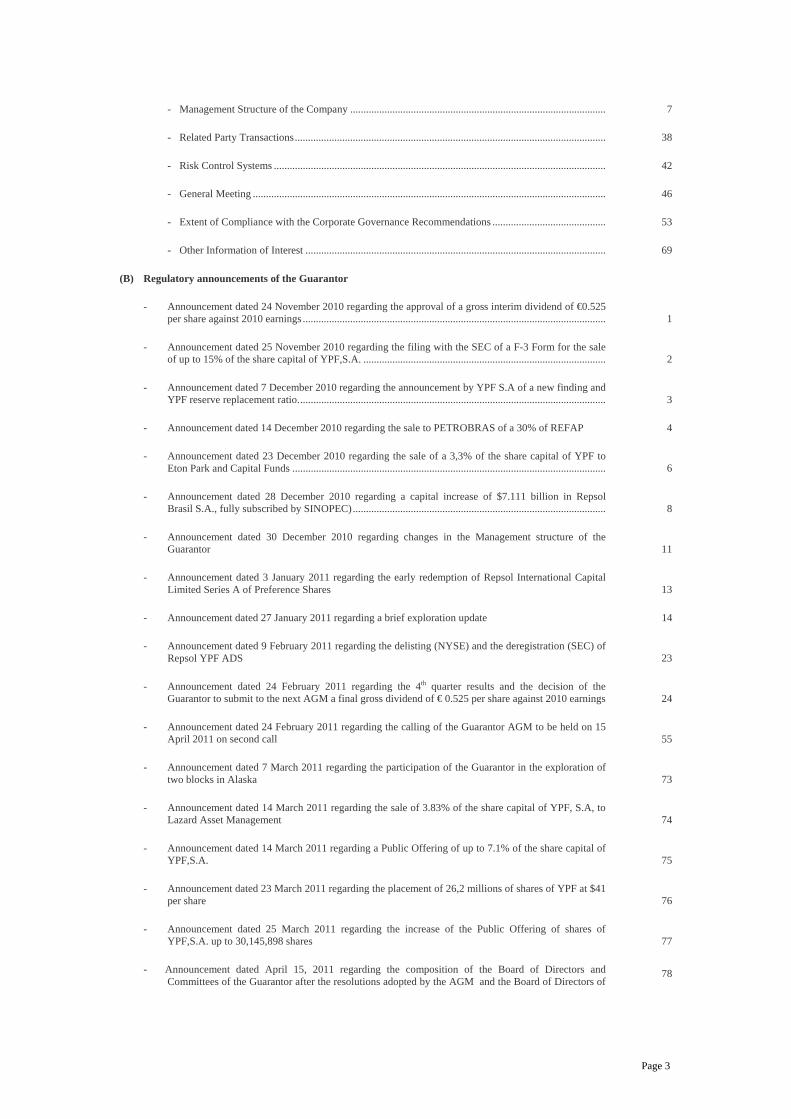
(B) Regulatory announcements of the Guarantor
- Announcement dated 24 November 2010 regarding the approval of a gross interim dividend of €0.525 per share against 2010 earnings ................................................................................................................... 1
- Announcement dated 25 November 2010 regarding the filing with the SEC of a F-3 Form for the sale of up to 15% of the share capital of YPF,S.A. ............................................................................................ 2
- Announcement dated 7 December 2010 regarding the announcement by YPF S.A of a new finding and YPF reserve replacement ratio..................................................................................................................... 3
- Announcement dated 14 December 2010 regarding the sale to PETROBRAS of a 30% of REFAP 4
- Announcement dated 23 December 2010 regarding the sale of a 3,3% of the share capital of YPF to Eton Park and Capital Funds ....................................................................................................................... 6
- Announcement dated 28 December 2010 regarding a capital increase of $7.111 billion in Repsol Brasil S.A., fully subscribed by SINOPEC)................................................................................................ 8
- Announcement dated 30 December 2010 regarding changes in the Management structure of the Guarantor 11
- Announcement dated 3 January 2011 regarding the early redemption of Repsol International Capital Limited Series A of Preference Shares 13
- Announcement dated 27 January 2011 regarding a brief exploration update 14
- Announcement dated 9 February 2011 regarding the delisting (NYSE) and the deregistration (SEC) of Repsol YPF ADS 23
- Announcement dated 24 February 2011 regarding the 4th quarter results and the decision of the Guarantor to submit to the next AGM a final gross dividend of € 0.525 per share against 2010 earnings 24
- Announcement dated 24 February 2011 regarding the calling of the Guarantor AGM to be held on 15 April 2011 on second call 55
- Announcement dated 7 March 2011 regarding the participation of the Guarantor in the exploration of two blocks in Alaska 73
- Announcement dated 14 March 2011 regarding the sale of 3.83% of the share capital of YPF, S.A, to Lazard Asset Management 74
- Announcement dated 14 March 2011 regarding a Public Offering of up to 7.1% of the share capital of YPF,S.A. 75
- Announcement dated 23 March 2011 regarding the placement of 26,2 millions of shares of YPF at $41 per share 76
- Announcement dated 25 March 2011 regarding the increase of the Public Offering of shares of YPF,S.A. up to 30,145,898 shares 77
- Announcement dated April 15, 2011 regarding the composition of the Board of Directors and Committees of the Guarantor after the resolutions adopted by the AGM and the Board of Directors of
78
Page 4
the Guarantor held on the same date
- Announcement dated April 15, 2011 regarding the AGM of the Guarantor held on the same date. 80
(C) Issuer’s Annual Report 2010
(i) Management Report 2010........................................................................................................................... 1
(ii) Balance sheet at 31 December 2010........................................................................................................... 3
(iii) Income statement for the year ended 31 December 2010 .......................................................................... 5
(iv) Notes to Financial Statements at 31 December 2010................................................................................. 6
(v) Additional information................................................................................................................................ 14
(v) Auditors’ Report ......................................................................................................................................... 15
(D) Supplementary information on oil and gas exploration and production activities (unaudited information)
(i) Capitalised costs 1
(ii) Costs incurred 2
(iii) Results of oil and gas exploration activities 3
(iv) Estimated proved net developed and undeveloped oil and gas reserves 4
(v) Standardized measure of discounted future net cash flows and changes therein relating to proved oil and gas reserves
8
(vi) Changes in Standardized measure of discounted future net cash flows relating to proved oil and gas reserves
9
(E) Average sales price of crude oil and gas by geographic area for 2010, 2009 and 2008 1
As long as any of the Notes are outstanding, this Supplement and each document incorporated by reference into the Base Prospectus via this Supplement will be available for inspection, free of charge, at the offices of the Issuer at Koningskade 30, 2596 AA The Hague, The Netherlands during normal business hours and on the website of the Luxembourg Stock Exchange at www.bourse.lu. In addition, copies of the documents incorporated by reference referred to above can be obtained from the website of the Guarantor at www.repsol.com.
The first paragraph of paragraph 3 in the “General Information” section on page 113 of the Base Prospectus shall be deleted and replaced with the following text to take account of the publication and incorporation by reference of the Issuer’s Annual Report 2010:
“There has been no material adverse change in the prospects of the Issuer since 31 December 2010 (being the date of the last published audited financial statements) nor has there been any significant change in the financial or trading position of the Issuer and its consolidated subsidiaries since 31 December 2010.”
The second paragraph of paragraph 3 in the “General Information” section on page 113 of the Base Prospectus shall be deleted and replaced with the following text to take account of the publication and incorporation by reference of the Guarantor’s Annual Report 2010:
“There has been no material adverse change in the prospects of the Guarantor since 31 December 2010 (being the date of the last published audited financial statements) nor has there been any significant change in the financial or trading position of the Group since 31 December 2010.”
Save as disclosed in this Supplement, no other significant new factor, material mistake or inaccuracy relating to information included in the Base Prospectus has been noted or, to the best of the knowledge of the Issuer and the Guarantor, has arisen, as the case may be, since the publication of the Base Prospectus.

Page 5
In accordance with paragraph 2 of Article 13 of the Luxembourg Law, investors who have already agreed to purchase or subscribe for relevant securities before this Supplement is published have the right, exercisable during the two Luxembourg working days immediately following publication of this Supplement, to withdraw their acceptances.
1
CONSOLIDATED FINANCIAL STATEMENTS OF REPSOL YPF, S.A. AND INVESTEES COMPRISING THE REPSOL YPF, S.A. GROUP
FOR THE FINANCIAL YEAR 2010
Translation of a report originally issued in Spanish. In the event of a discrepancy, the Spanish language version prevails.
2
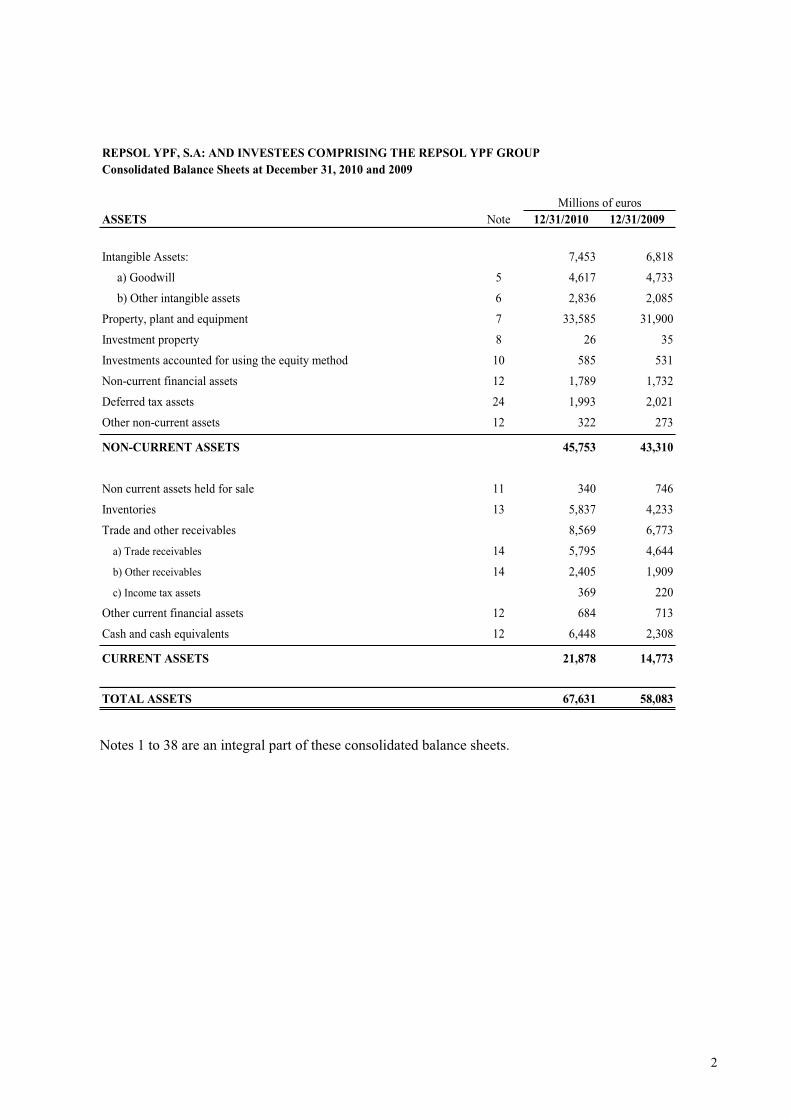
REPSOL YPF, S.A: AND INVESTEES COMPRISING THE REPSOL YPF GROUPConsolidated Balance Sheets at December 31, 2010 and 2009
ASSETS Note 12/31/2010 12/31/2009
Intangible Assets: 7,453 6,818 a) Goodwill 5 4,617 4,733 b) Other intangible assets 6 2,836 2,085Property, plant and equipment 7 33,585 31,900Investment property 8 26 35Investments accounted for using the equity method 10 585 531Non-current financial assets 12 1,789 1,732Deferred tax assets 24 1,993 2,021Other non-current assets 12 322 273
NON-CURRENT ASSETS 45,753 43,310
Non current assets held for sale 11 340 746Inventories 13 5,837 4,233Trade and other receivables 8,569 6,773
a) Trade receivables 14 5,795 4,644 b) Other receivables 14 2,405 1,909
c) Income tax assets 369 220Other current financial assets 12 684 713Cash and cash equivalents 12 6,448 2,308
CURRENT ASSETS 21,878 14,773
TOTAL ASSETS 67,631 58,083
Millions of euros
Notes 1 to 38 are an integral part of these consolidated balance sheets.
3
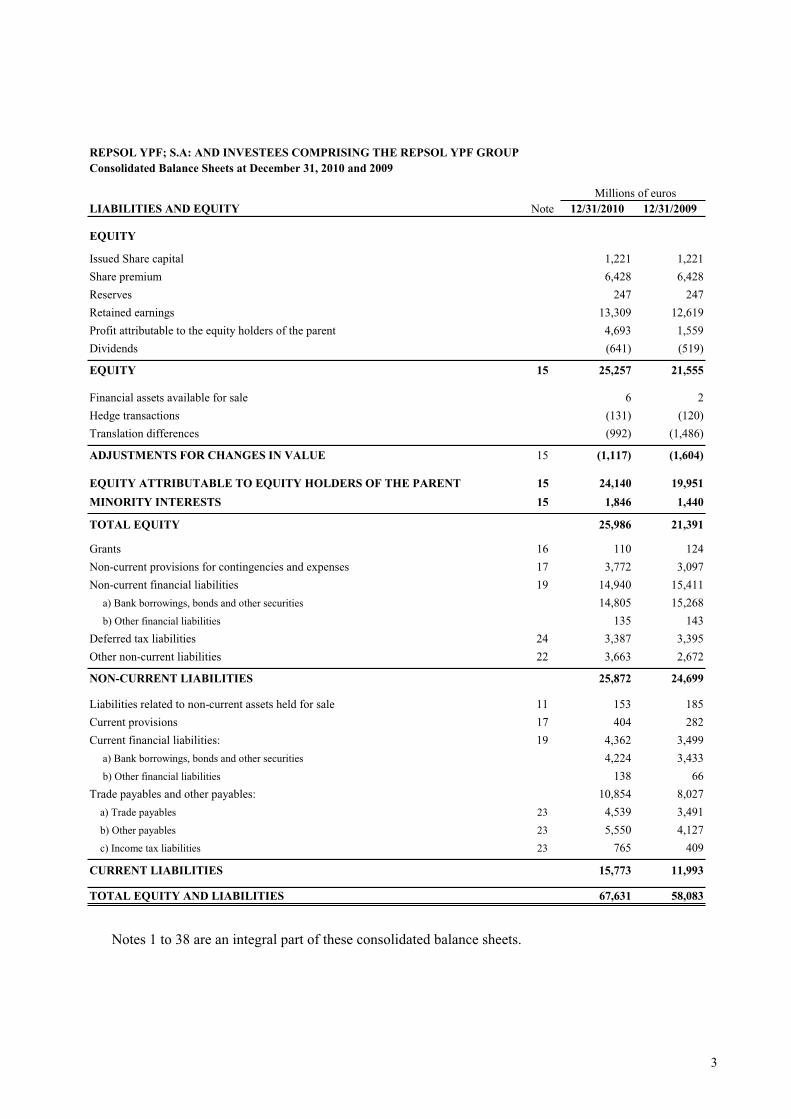
Consolidated Balance Sheets at December 31, 2010 and 2009
LIABILITIES AND EQUITY Note 12/31/2010 12/31/2009
EQUITY
Issued Share capital 1,221 1,221Share premium 6,428 6,428Reserves 247 247Retained earnings 13,309 12,619Profit attributable to the equity holders of the parent 4,693 1,559Dividends (641) (519)
EQUITY 15 25,257 21,555
Financial assets available for sale 6 2Hedge transactions (131) (120)Translation differences (992) (1,486)
ADJUSTMENTS FOR CHANGES IN VALUE 15 (1,117) (1,604)
EQUITY ATTRIBUTABLE TO EQUITY HOLDERS OF THE PARENT 15 24,140 19,951MINORITY INTERESTS 15 1,846 1,440
TOTAL EQUITY 25,986 21,391
Grants 16 110 124Non-current provisions for contingencies and expenses 17 3,772 3,097Non-current financial liabilities 19 14,940 15,411 a) Bank borrowings, bonds and other securities 14,805 15,268 b) Other financial liabilities 135 143Deferred tax liabilities 24 3,387 3,395Other non-current liabilities 22 3,663 2,672
NON-CURRENT LIABILITIES 25,872 24,699
Liabilities related to non-current assets held for sale 11 153 185Current provisions 17 404 282Current financial liabilities: 19 4,362 3,499 a) Bank borrowings, bonds and other securities 4,224 3,433 b) Other financial liabilities 138 66Trade payables and other payables: 10,854 8,027 a) Trade payables 23 4,539 3,491 b) Other payables 23 5,550 4,127 c) Income tax liabilities 23 765 409
CURRENT LIABILITIES 15,773 11,993
TOTAL EQUITY AND LIABILITIES 67,631 58,083
REPSOL YPF; S.A: AND INVESTEES COMPRISING THE REPSOL YPF GROUP
Millions of euros
Notes 1 to 38 are an integral part of these consolidated balance sheets.
4
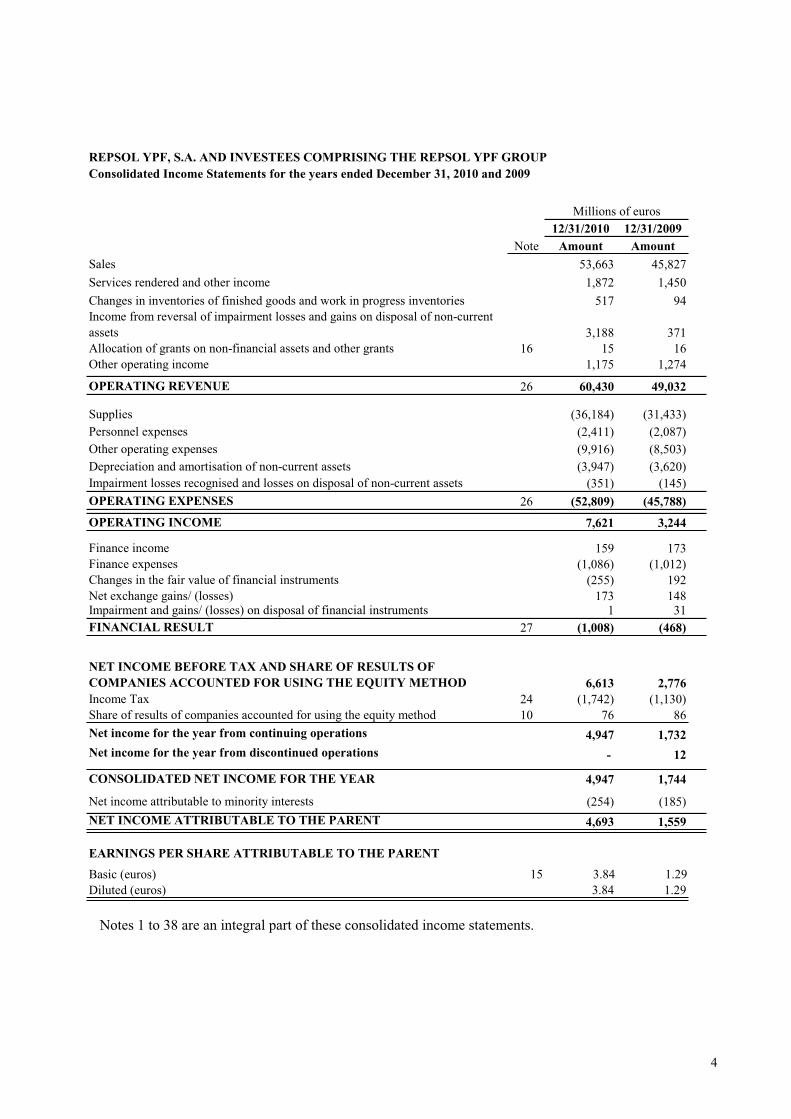
12/31/2010 12/31/2009Note Amount Amount
Sales 53,663 45,827Services rendered and other income 1,872 1,450Changes in inventories of finished goods and work in progress inventories 517 94Income from reversal of impairment losses and gains on disposal of non-current assets 3,188 371Allocation of grants on non-financial assets and other grants 16 15 16Other operating income 1,175 1,274
OPERATING REVENUE 26 60,430 49,032
Supplies (36,184) (31,433)Personnel expenses (2,411) (2,087)Other operating expenses (9,916) (8,503)Depreciation and amortisation of non-current assets (3,947) (3,620)Impairment losses recognised and losses on disposal of non-current assets (351) (145)OPERATING EXPENSES 26 (52,809) (45,788)OPERATING INCOME 7,621 3,244
Finance income 159 173Finance expenses (1,086) (1,012)Changes in the fair value of financial instruments (255) 192Net exchange gains/ (losses) 173 148Impairment and gains/ (losses) on disposal of financial instruments 1 31FINANCIAL RESULT 27 (1,008) (468)
NET INCOME BEFORE TAX AND SHARE OF RESULTS OF COMPANIES ACCOUNTED FOR USING THE EQUITY METHOD 6,613 2,776Income Tax 24 (1,742) (1,130)Share of results of companies accounted for using the equity method 10 76 86Net income for the year from continuing operations 4,947 1,732Net income for the year from discontinued operations - 12
CONSOLIDATED NET INCOME FOR THE YEAR 4,947 1,744
Net income attributable to minority interests (254) (185)NET INCOME ATTRIBUTABLE TO THE PARENT 4,693 1,559
EARNINGS PER SHARE ATTRIBUTABLE TO THE PARENT
Basic (euros) 15 3.84 1.29Diluted (euros) 3.84 1.29
REPSOL YPF, S.A. AND INVESTEES COMPRISING THE REPSOL YPF GROUP
Millions of euros
Consolidated Income Statements for the years ended December 31, 2010 and 2009
Notes 1 to 38 are an integral part of these consolidated income statements.
5
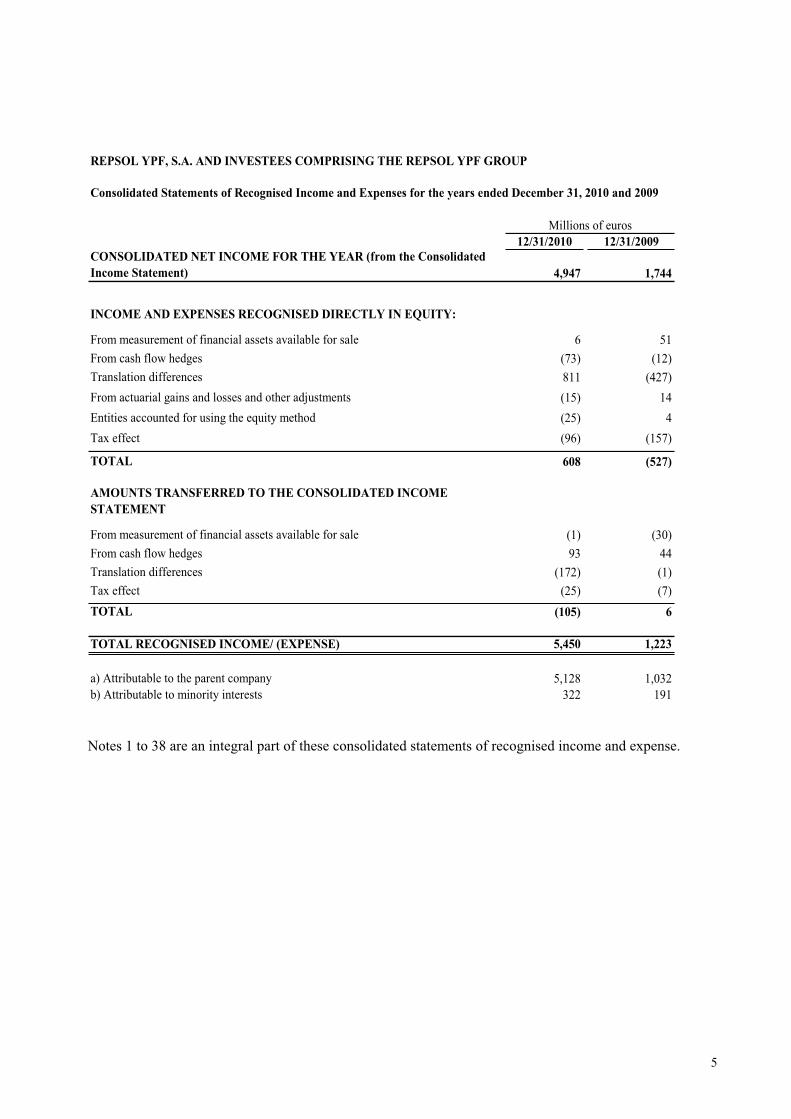
12/31/2010 12/31/2009CONSOLIDATED NET INCOME FOR THE YEAR (from the Consolidated Income Statement) 4,947 1,744
INCOME AND EXPENSES RECOGNISED DIRECTLY IN EQUITY:
From measurement of financial assets available for sale 6 51From cash flow hedges (73) (12)Translation differences 811 (427)From actuarial gains and losses and other adjustments (15) 14Entities accounted for using the equity method (25) 4Tax effect (96) (157)
TOTAL 608 (527)
AMOUNTS TRANSFERRED TO THE CONSOLIDATED INCOME STATEMENT
From measurement of financial assets available for sale (1) (30)From cash flow hedges 93 44Translation differences (172) (1)Tax effect (25) (7)TOTAL (105) 6
TOTAL RECOGNISED INCOME/ (EXPENSE) 5,450 1,223
a) Attributable to the parent company 5,128 1,032b) Attributable to minority interests 322 191
REPSOL YPF, S.A. AND INVESTEES COMPRISING THE REPSOL YPF GROUP
Millions of euros
Consolidated Statements of Recognised Income and Expenses for the years ended December 31, 2010 and 2009
Notes 1 to 38 are an integral part of these consolidated statements of recognised income and expense.
6
Millions of euros
Issued share
capital
Share premium
and reserves
Treasury shares and own equity instruments
Net income for the year
attributable to equity holders of the parent
Total equity attributable
to equity holders of the
parent
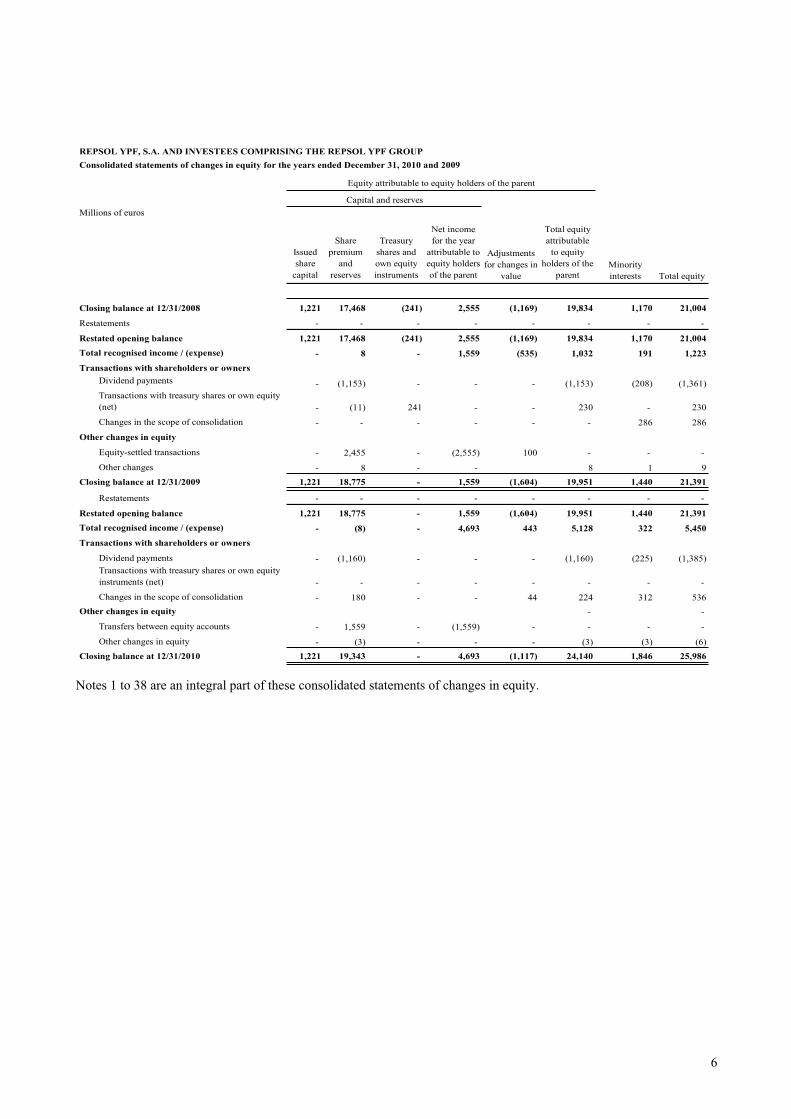
Closing balance at 12/31/2008 1,221 17,468 (241) 2,555 (1,169) 19,834 1,170 21,004
Restatements - - - - - - - -
Restated opening balance 1,221 17,468 (241) 2,555 (1,169) 19,834 1,170 21,004Total recognised income / (expense) - 8 - 1,559 (535) 1,032 191 1,223Transactions with shareholders or owners
Dividend payments - (1,153) - - - (1,153) (208) (1,361)Transactions with treasury shares or own equity (net) - (11) 241 - - 230 - 230
Changes in the scope of consolidation - - - - - - 286 286
Other changes in equity
Equity-settled transactions - 2,455 - (2,555) 100 - - -
Other changes - 8 - - 8 1 9Closing balance at 12/31/2009 1,221 18,775 - 1,559 (1,604) 19,951 1,440 21,391
Restatements - - - - - - - -
Restated opening balance 1,221 18,775 - 1,559 (1,604) 19,951 1,440 21,391Total recognised income / (expense) - (8) - 4,693 443 5,128 322 5,450Transactions with shareholders or owners
Dividend payments - (1,160) - - - (1,160) (225) (1,385)Transactions with treasury shares or own equity instruments (net) - - - - - - - -
Changes in the scope of consolidation - 180 - - 44 224 312 536Other changes in equity - -
Transfers between equity accounts - 1,559 - (1,559) - - - -
Other changes in equity - (3) - - - (3) (3) (6)Closing balance at 12/31/2010 1,221 19,343 - 4,693 (1,117) 24,140 1,846 25,986
REPSOL YPF, S.A. AND INVESTEES COMPRISING THE REPSOL YPF GROUPConsolidated statements of changes in equity for the years ended December 31, 2010 and 2009
Total equity
Adjustments for changes in
valueMinority interests
Equity attributable to equity holders of the parent
Capital and reserves
Notes 1 to 38 are an integral part of these consolidated statements of changes in equity.
7
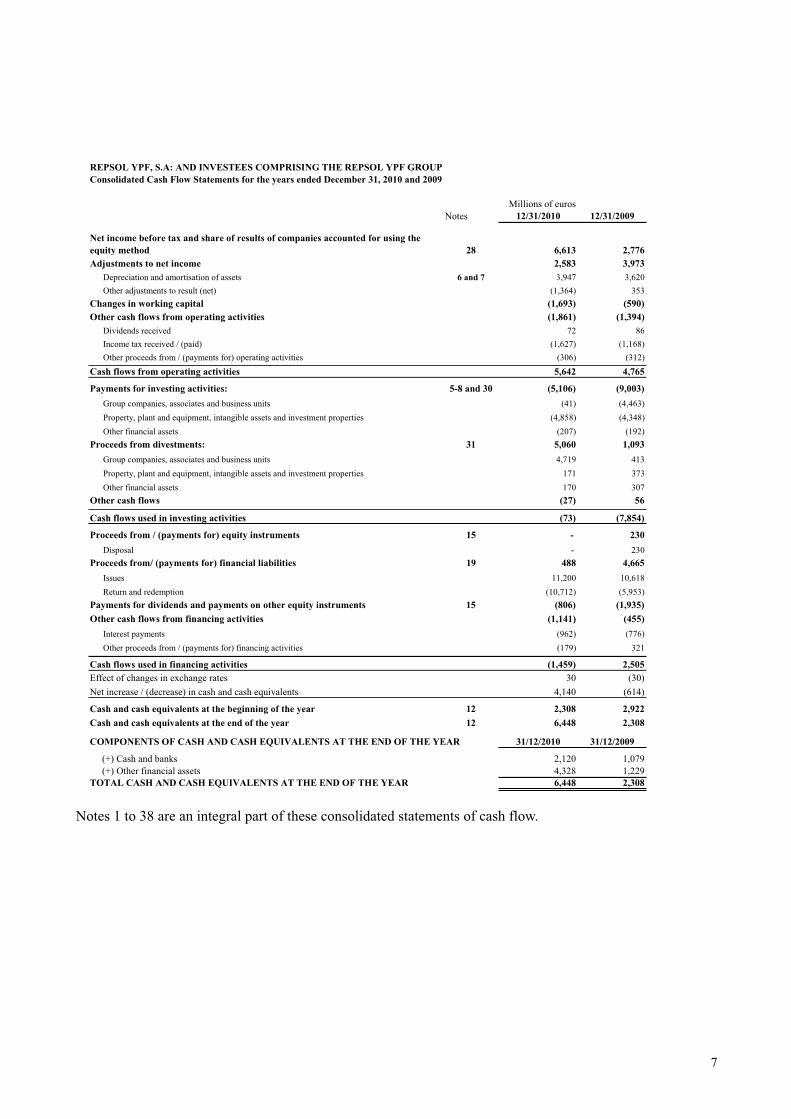
REPSOL YPF, S.A: AND INVESTEES COMPRISING THE REPSOL YPF GROUPConsolidated Cash Flow Statements for the years ended December 31, 2010 and 2009
Millions of eurosNotes 12/31/2010 12/31/2009
Net income before tax and share of results of companies accounted for using the equity method 28 6,613 2,776Adjustments to net income 2,583 3,973 Depreciation and amortisation of assets 6 and 7 3,947 3,620 Other adjustments to result (net) (1,364) 353Changes in working capital (1,693) (590)Other cash flows from operating activities (1,861) (1,394) Dividends received 72 86 Income tax received / (paid) (1,627) (1,168) Other proceeds from / (payments for) operating activities (306) (312)
Cash flows from operating activities 5,642 4,765
Payments for investing activities: 5-8 and 30 (5,106) (9,003) Group companies, associates and business units (41) (4,463) Property, plant and equipment, intangible assets and investment properties (4,858) (4,348) Other financial assets (207) (192)Proceeds from divestments: 31 5,060 1,093 Group companies, associates and business units 4,719 413 Property, plant and equipment, intangible assets and investment properties 171 373 Other financial assets 170 307Other cash flows (27) 56
Cash flows used in investing activities (73) (7,854)
Proceeds from / (payments for) equity instruments 15 - 230 Disposal - 230Proceeds from/ (payments for) financial liabilities 19 488 4,665 Issues 11,200 10,618 Return and redemption (10,712) (5,953)Payments for dividends and payments on other equity instruments 15 (806) (1,935)Other cash flows from financing activities (1,141) (455) Interest payments (962) (776) Other proceeds from / (payments for) financing activities (179) 321
Cash flows used in financing activities (1,459) 2,505Effect of changes in exchange rates 30 (30)Net increase / (decrease) in cash and cash equivalents 4,140 (614)
Cash and cash equivalents at the beginning of the year 12 2,308 2,922Cash and cash equivalents at the end of the year 12 6,448 2,308
COMPONENTS OF CASH AND CASH EQUIVALENTS AT THE END OF THE YEAR 31/12/2010 31/12/2009
(+) Cash and banks 2,120 1,079 (+) Other financial assets 4,328 1,229TOTAL CASH AND CASH EQUIVALENTS AT THE END OF THE YEAR 6,448 2,308
Notes 1 to 38 are an integral part of these consolidated statements of cash flow.
1
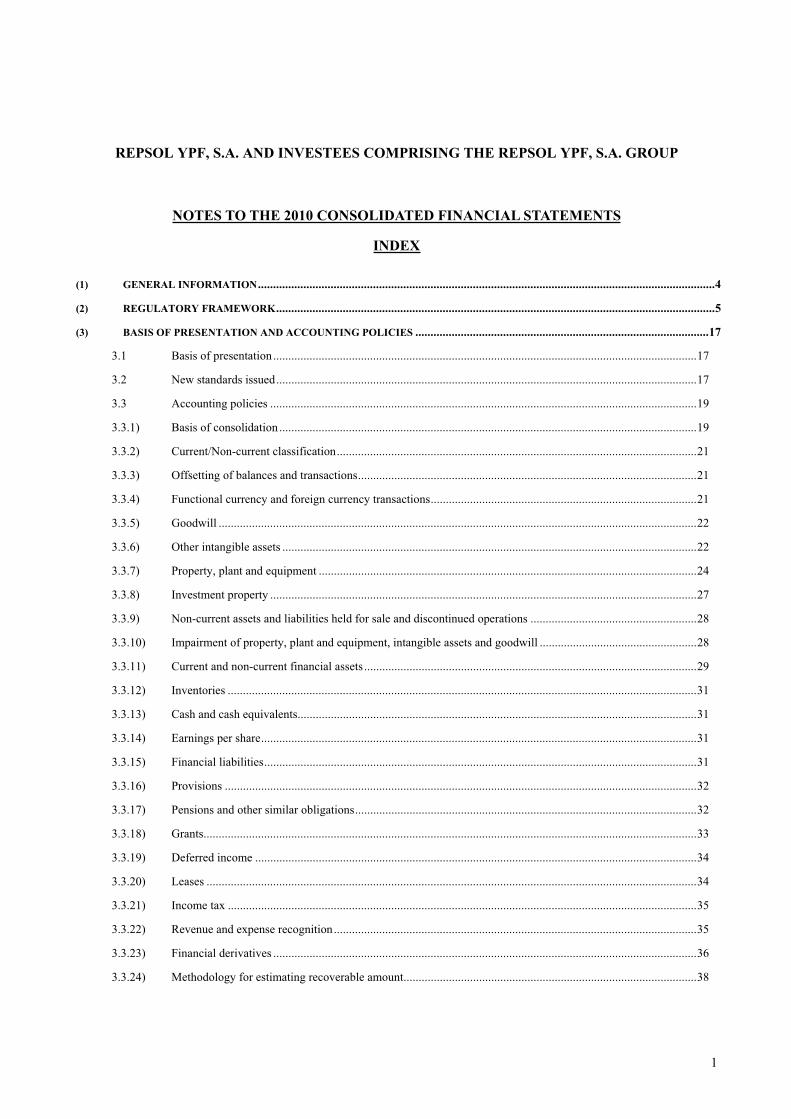
REPSOL YPF, S.A. AND INVESTEES COMPRISING THE REPSOL YPF, S.A. GROUP
NOTES TO THE 2010 CONSOLIDATED FINANCIAL STATEMENTS
INDEX
(1) GENERAL INFORMATION.......................................................................................................................................................4
(2) REGULATORY FRAMEWORK.................................................................................................................................................5
(3) BASIS OF PRESENTATION AND ACCOUNTING POLICIES .................................................................................................17
3.1 Basis of presentation ............................................................................................................................................17
3.2 New standards issued...........................................................................................................................................17
3.3 Accounting policies .............................................................................................................................................19
3.3.1) Basis of consolidation ..........................................................................................................................................19
3.3.2) Current/Non-current classification.......................................................................................................................21
3.3.3) Offsetting of balances and transactions................................................................................................................21
3.3.4) Functional currency and foreign currency transactions........................................................................................21
3.3.5) Goodwill ..............................................................................................................................................................22
3.3.6) Other intangible assets .........................................................................................................................................22
3.3.7) Property, plant and equipment .............................................................................................................................24
3.3.8) Investment property .............................................................................................................................................27
3.3.9) Non-current assets and liabilities held for sale and discontinued operations .......................................................28
3.3.10) Impairment of property, plant and equipment, intangible assets and goodwill ....................................................28
3.3.11) Current and non-current financial assets ..............................................................................................................29
3.3.12) Inventories ...........................................................................................................................................................31
3.3.13) Cash and cash equivalents....................................................................................................................................31
3.3.14) Earnings per share................................................................................................................................................31
3.3.15) Financial liabilities...............................................................................................................................................31
3.3.16) Provisions ............................................................................................................................................................32
3.3.17) Pensions and other similar obligations.................................................................................................................32
3.3.18) Grants...................................................................................................................................................................33
3.3.19) Deferred income ..................................................................................................................................................34
3.3.20) Leases ..................................................................................................................................................................34
3.3.21) Income tax ...........................................................................................................................................................35
3.3.22) Revenue and expense recognition........................................................................................................................35
3.3.23) Financial derivatives ............................................................................................................................................36
3.3.24) Methodology for estimating recoverable amount.................................................................................................38
2
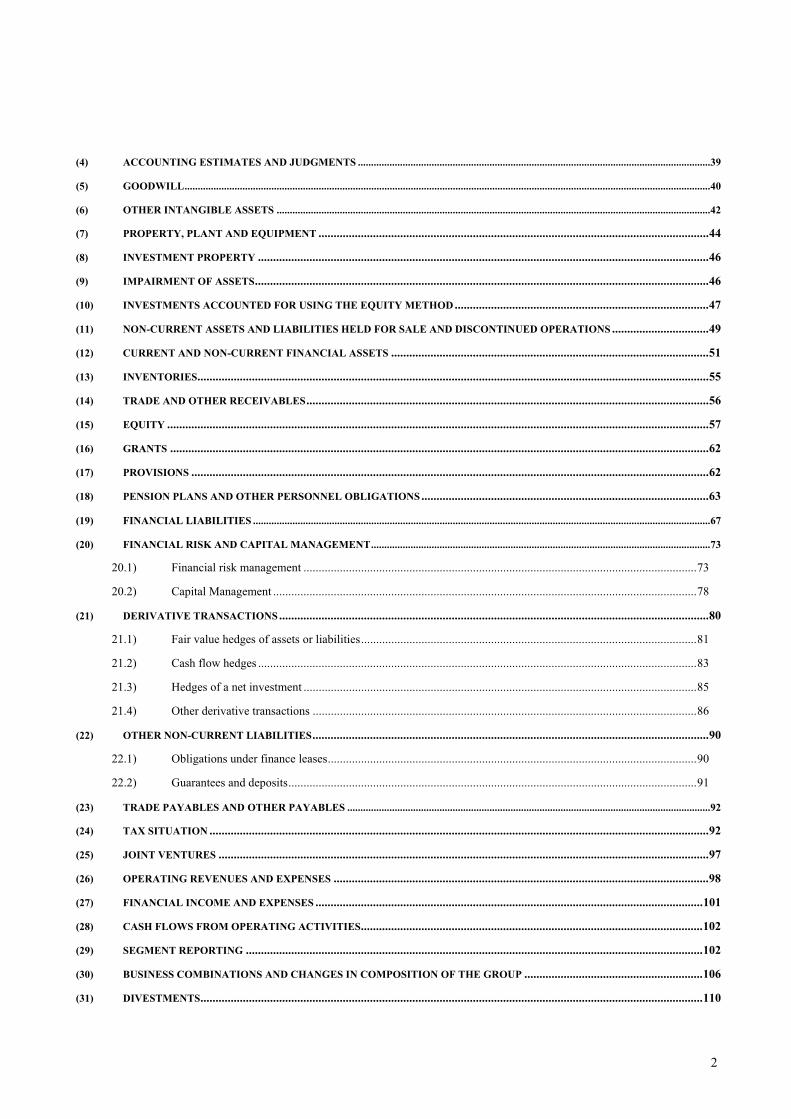
(4) ACCOUNTING ESTIMATES AND JUDGMENTS ......................................................................................................................................39
(5) GOODWILL........................................................................................................................................................................................................40
(6) OTHER INTANGIBLE ASSETS .....................................................................................................................................................................42
(7) PROPERTY, PLANT AND EQUIPMENT .................................................................................................................................44
(8) INVESTMENT PROPERTY .....................................................................................................................................................46
(9) IMPAIRMENT OF ASSETS......................................................................................................................................................46
(10) INVESTMENTS ACCOUNTED FOR USING THE EQUITY METHOD....................................................................................47
(11) NON-CURRENT ASSETS AND LIABILITIES HELD FOR SALE AND DISCONTINUED OPERATIONS ................................49
(12) CURRENT AND NON-CURRENT FINANCIAL ASSETS .........................................................................................................51
(13) INVENTORIES.........................................................................................................................................................................55
(14) TRADE AND OTHER RECEIVABLES.....................................................................................................................................56
(15) EQUITY ...................................................................................................................................................................................57
(16) GRANTS ..................................................................................................................................................................................62
(17) PROVISIONS ...........................................................................................................................................................................62
(18) PENSION PLANS AND OTHER PERSONNEL OBLIGATIONS...............................................................................................63
(19) FINANCIAL LIABILITIES ..............................................................................................................................................................................67
(20) FINANCIAL RISK AND CAPITAL MANAGEMENT.................................................................................................................................73
20.1) Financial risk management ..................................................................................................................................73
20.2) Capital Management ............................................................................................................................................78
(21) DERIVATIVE TRANSACTIONS..............................................................................................................................................80
21.1) Fair value hedges of assets or liabilities...............................................................................................................81
21.2) Cash flow hedges .................................................................................................................................................83
21.3) Hedges of a net investment ..................................................................................................................................85
21.4) Other derivative transactions ...............................................................................................................................86
(22) OTHER NON-CURRENT LIABILITIES...................................................................................................................................90
22.1) Obligations under finance leases..........................................................................................................................90
22.2) Guarantees and deposits.......................................................................................................................................91
(23) TRADE PAYABLES AND OTHER PAYABLES ..........................................................................................................................................92
(24) TAX SITUATION .....................................................................................................................................................................92
(25) JOINT VENTURES ..................................................................................................................................................................97
(26) OPERATING REVENUES AND EXPENSES ............................................................................................................................98
(27) FINANCIAL INCOME AND EXPENSES ................................................................................................................................101
(28) CASH FLOWS FROM OPERATING ACTIVITIES.................................................................................................................102
(29) SEGMENT REPORTING .......................................................................................................................................................102
(30) BUSINESS COMBINATIONS AND CHANGES IN COMPOSITION OF THE GROUP ...........................................................106
(31) DIVESTMENTS......................................................................................................................................................................110
3
(32) INFORMATION ON RELATED PARTY TRANSACTIONS ...................................................................................................................115
(33) INFORMATION ON THE MEMBERS OF THE BOARD OF DIRECTORS AND EXECUTIVES ............................................117
(34) CONTINGENT LIABILITIES AND OBLIGATIONS ..............................................................................................................122
(35) ENVIRONMENTAL INFORMATION ....................................................................................................................................138
35.1) Environmental Assets ........................................................................................................................................139
35.2) Environmental Provisions ..................................................................................................................................140
35.3) Environmental Expenses....................................................................................................................................141
35.4) Planned Initiatives..............................................................................................................................................141
35.5) CO2 Emissions ..................................................................................................................................................144
(36) FEES PAID TO THE AUDITORS ...........................................................................................................................................144
(37) SUBSEQUENT EVENTS.........................................................................................................................................................144
(38) EXPLANATION ADDED FOR TRANSLATION TO ENGLISH .............................................................................................................145
4
(1) GENERAL INFORMATION
Repsol YPF, S.A. and investees comprising the Repsol YPF Group (hereinafter “Repsol YPF,” the “Repsol YPF Group” or the “Group”) constitute an integrated group of oil and gas companies which commenced operations in 1987. The companies comprising the Group are listed in Appendix I.
The Repsol YPF Group is engaged in all the activities relating to the oil and gas industry, including exploration, development and production of crude oil and natural gas, the transportation of oil products, liquid petroleum gas (LPG) and natural gas, refining, the production of a wide range of oil products and the retailing of oil products, oil derivatives, petrochemicals, LPG and natural gas, as well as the generation, transportation, distribution and supply of electricity. The Group conducts its activities in a number of countries, primarily Spain and Argentina.
The corporate name of the parent of the Group of companies that prepares and files these Financial Statements is Repsol YPF, S.A.
Repsol YPF, S.A. is registered at the Madrid Commercial Register in volume 3893, page 175, sheet no. M-65289, entry no. 63º. Its Employer Identification Number (C.I.F.) is A-78/374725 and its National Classification of Economic Activities Number (C.N.A.E.) is 742.
Its registered office is in Madrid, at Paseo de la Castellana, 278, where the Shareholder Service Office is also located, the telephone number of which is 900.100.100.
Repsol YPF, S.A. is a private-law entity incorporated in accordance with Spanish legislation, which is subject to the Capital Companies Law (Ley de Sociedades de Capital) approved by Legislative Royal Decree 1/2010 of July 2, and all other legislation related to listed companies.
Repsol YPF, S.A.’s shares are represented by book entries and are fully admitted to trading on the Spanish stock exchanges (Madrid, Barcelona, Bilbao and Valencia), and the Buenos Aires stock exchange (“Bolsa de Comercio de Buenos Aires”). At the date of these Financial Statements, Repsol YPF, S.A.’s shares are traded in the form of American Depositary Shares (ADSs) on the New York Stock Exchange (NYSE). However, on February 22, 2011, the Company officially filed to delist its ADSs from the NYSE. The ADSs are expected to trade on the NYSE for the last time on March 4, 2011.
These consolidated Financial Statements for 2010, which were prepared by the Board of Directors of Repsol YPF, S.A. at a meeting held on February 23, 2011, and the Financial Statements of the investees will be submitted for approval by the shareholders at the respective General Shareholders´ Meetings, with no modifications expected.
The consolidated Financial Statements for 2009 were approved at the General Shareholders´ Meeting of Repsol YPF, S.A. held on April 30, 2010.
5
(2) REGULATORY FRAMEWORK
The activities of Repsol YPF S.A. and its main subsidiaries are subject to extensive regulation, whose main aspects are described below.
Spain
Spain currently has legislation which implements liberalization of the oil industry, a manifestation of which is the Hydrocarbons Sector Law 34/1998 of October 7, which has been amended by several provisions, including the Law 12/2007 of July 7, and implemented through numerous royal decrees and ministerial orders. This Law establishes the criteria for allocating powers among the Spanish Government and regional administrations.
The Spanish National Energy Commission (“Comisión Nacional de Energía”) is a public agency of the Ministry of Industry, Tourism and Commerce, with power as regulatory authority, which is in charge of ensuring effective competition, objectivity and transparency in the electricity and liquid and gaseous hydrocarbons markets, seeking the benefit of all market participants, including consumers.
Royal Decree-Law 4/2006 expanded the functions of the Spanish National Energy Commission by introducing the requirement to obtain a prior administrative authorization in relation to certain acquisitions or investments in companies that engage in regulated activities or activities that, although not regulated in the strict sense, are subject to significant oversight by administrative bodies in Spain. Notwithstanding this, on July 28, 2008, the European Court of Justice declared that the obtaining of the aforementioned administrative authorization (regarding acquisitions carried out by Community Companies) is contrary to sections 43 and 56 of the EC.
Sector regulations establish and ascribe specific treatment to the so-called “main” and “dominant” operators. Royal Decree-Law 5/2005, of March 11, obliges the Spanish National Energy Commission (CNC) to publish a list of main and dominant operators in each market or sector.
Dominant operators are defined as those commanding a share of more than 10% of the corresponding benchmark market.
A main operator, on the other hand, is any operator ranked among the top five players by market share in the following markets or sectors: (i) the generation and supply of electric power within the Iberian Electricity Market (MIBEL); (ii) the production and distribution of fuels; (iii) the production and supply of liquid petroleum gas; (iv) the production and supply of natural gas; (v) wireless telephony; and (vi) fixed telephony.
Designation as a dominant operator, as far as prevailing legislation is concerned, simply implies certain regulatory restrictions in the electricity sector, specifically in relation to the generation of primary energy, importing of electricity into the MIBEL and acting as a representative agent of the special regime in the market.
6
However, the definition of main operators is, on the other hand, significant. Article 34 of the Royal Decree-Law 6/2000, of June 23, following the amendments introduced by Law 14/2000 of December 29, establishes a series of limitations related to the acquisition of voting rights in the equity of companies qualifying as main operators and serving on their boards of directors. Specifically, article 34 stipulates that any natural or legal person holding an equity interest in two or more companies qualifying as main operators in the same market, and holding a 3% or higher equity interest, cannot exercise the voting rights in excess of this ownership threshold in more than one company. It further stipulates that such persons cannot appoint members of the governing bodies of another main operator either directly or indirectly.
Royal Decree-Law 6/2009 definitively repealed supplementary provision twenty-seven of Law 55/1999 (amended by Law 62/2003), which stipulated prior authorization by the authorities for the acquisition by public entities or entities majority-owned or controlled by public entities of shareholdings of 3% or more in energy companies (the so-called “energy golden share”). This rule had been questioned by the European Court of Justice in a ruling handed down on February 14, 2008.
Liquid hydrocarbons, oil and petroleum derivatives
In Spain, hydrocarbon deposits and underground storages existing on Spanish territory and in the territorial marine subsoil and ocean bottoms which are under Spanish sovereignty are considered public properties.
Also some of the activities falling within the scope of Law 34/1998 may be subject to authorizations, permits and/or concessions. Article 19 of Law 25/2009, of December 22, which amends several pieces of legislation for their adaption to the Law on free access to service activities and its exercise; modifies the Hydrocarbon Act, Law 34/1998 of October 7, implying, among other aspects, the elimination of the need to obtain authorization prior to acting as natural gas supplier, LPG wholesaler, bulk LPG retailer or petroleum product wholesaler, further establishing the obligation that interested parties must make a responsibility statement and issue notification prior to commencing its business operations. In addition, direct natural gas consumers are obliged to report the start of its business operations.
Construction and operation of refining, transportation and fixed storage facilities are subject to prior authorization, the granting of which requires meeting the relevant technical, financial, environmental and safety requirements.
Third parties may freely access transportation and fixed storage facilities of oil products, such as the facilities of Compañía Logística de Hidrocarburos S.A. (“CLH”), on conditions agreed on an objective and non-discriminatory basis. However, the Spanish Government has the discretion to establish access tolls for mainland territories and for those areas of the Spanish territory where alternative transport or storage facilities do not exist or are insufficient. As of the date of this annual report, the Spanish Government has not exercised this discretion.
Pursuant to Royal Decree Law 6/2000, no physical or legal person may hold, directly or indirectly, ownership of more than 25% of the capital stock of CLH. This same Royal Decree further provides that the aggregate ownership interest in CLH of entities with refining capacity in Spain may not exceed 45% of CLH’s capital.
Petroleum derivative prices have been liberalized, with the exception of LPG, which is subject, in some cases, to maximum retail prices. Prices of bulk LPG and LPG sold in bottles that are less than 8 kilograms or more than 20 kilograms have been liberalized.
7
By means of Ministerial Order ITC/2608/2009, of September 28, the Spanish Government updated the system for setting the quarterly maximum before-tax sales price for bottled LPG, affecting containers holding 8kg or more but less than 20kg, with the exception of containers of LPG blends for use as fuel, by modifying the formula for automatically setting the maximum sales prices indicated in the abovementioned order in an effort to uphold consumer interests in the face of international price volatility. Specifically, the changes introduced in the abovementioned Ministerial Order consist of introducing two new concepts to the formula: (i) a 0.25 weighting factor which means that price changes will only incorporate the 25% of the increase or decrease in international prices of reference; and (ii) a threshold of 2% for implementing the price revision mechanism so that prices are only increased or decreased if international prices increase or decrease by more than this threshold.
The retail marketing of LPG cylinders may be carried out freely by any natural or legal person.
Natural gas
Law 12/2007 of July 2, which amended Law 34/1998 on the hydrocarbon sector and incorporated into Spanish Law the European Parliament Directive 2003/55, incorporates measures for achieving a completely liberalized market which will be the basis for greater competition, price reduction and improvement in the quality of service to the end-user.
This legislation establishes the framework for eliminating the tariff system and creates the role of the supplier of last resort with ultimate liability for supplying customers lacking sufficient bargaining power. Moreover, these suppliers are subject to a price cap (“last resort tariff”), which is set by Spain’s Ministry of Industry, Tourism and Commerce. Royal Decree 104/2010, of February 5, regulates the start-up of last resort supply in the natural gas segment; while the Ministerial Order ITC/1506/2010 establishes the methodology for calculating this last resort tariff.
Business operations in the natural gas sector can be classified into: (i) regulated activities, essentially the transport (including storage, regasification and transport perse) and distribution of natural gas; and (ii) deregulated activities: production, supply and retailing of natural gas.
Prevailing legislation stipulates functional unbundling (separation) obligations which imply accounting unbundling, in order to prevent cross subsidies and increase toll and tariff calculation transparency, legal unbundling, by means of separate companies, and also separation of regulated activities by requiring them to operate independently of the other companies in their consolidated groups.
In accordance with European Union directives (Directive 2003/55/EC, of June 26, and Directive 98/30/EC, of June 22), the supply of natural gas is fully deregulated in Spain, which means that all Spanish consumers are qualified and are accordingly free to choose their natural gas provider since January 1, 2003. Sector deregulation was substantially reinforced by the elimination since July 1, 2008 of the regulated tariff supply by the distribution companies, which meant that all consumers are required to participate in the deregulated market.
The construction, operation, modification and closing of basic network and carrier network facilities require prior government authorizations.
8
Enagás, S.A., the Natural Gas System Operator, is responsible for the coordinating and ensuring that the system works properly. Law 12/2007 limits equity ownership interests in Enagás, S.A. to 5%, caps voting rights at 3% as a general rule, although this cap falls to 1% in the case of companies carrying out business activities related to the gas sector and; in any case, the aggregate ownership interest of shareholders whose business activities relate to the gas sector cannot exceed 40%.
Since January 1, 2003, no company or group of companies acting in the natural gas sector can collectively provide natural gas for consumption in Spain in an amount in excess of 70% of domestic consumption. The Spanish Government is authorized to modify that percentage based on changes in the sector and the sector’s business structure.
Minimum safety stock
Royal Decree 1766/2007, amending Royal Decree 1716/2004, regulates the obligation to maintain a minimum stock in the oil and natural gas sectors, the obligation to diversify the natural gas supply and the activities of the Corporation of Strategic Reserves of Petroleum Products (CORES). The minimum safety stock requirement imposed on wholesalers in 2009 was equivalent to 90 days of sales calculated on the prior 12-month sales; and 92 days in 2010. In both years, Repsol YPF was obliged to directly maintain a stock corresponding to 50 days of sales, while the remaining stock required to make up the difference with the abovementioned safety stock requirement are held by the CORES corporation on behalf of the various operators.
Spanish legislation does not require these reserves to be handled, measured or stored in any specific manner; indeed any products accounted for by the operators as part of their inventories in the ordinary course of their business operations qualify as strategic reserves to this end. Compliance with the safety stock rules implies regular reporting that minimum levels are held; however, the operators subject to these rules are free to use the inventories held for this purpose so long as the total balance does not fall below the minimum threshold.
Electricity sector regulation in Spain
The deregulation of the Spanish electricity sector began in 1997 with the passage of the Electricity Sector Act (Law 54/1997, of November 27), incorporating into Spanish law Directive 96/92/EC concerning common rules for the internal market of electricity, establishing the rules for sector deregulation across the European Union countries, and subsequent enacting regulations, noteworthy, among which are the Royal Decree 1955/2000, of December 1, that regulates power transmission, distribution, marketing and supply, and the procedures for authorization of electric power facilities, and Royal Decree 2019/1997, of December 26, organizing and regulating the Electricity Production Market. The Electricity Act was later amended by Law 17/2007, of July 4. Meanwhile, Royal Decree 661/2007, of May 25, amended the rules governing the production of electricity under the so-called special regime.
Business operations in the Spanish electricity sector can be classified into: (i) regulated activities – power transport and distribution; and (ii) deregulated activities – power generation and retailing.
9
The first ones require prior administrative authorization, their remuneration is regulated and are subject to specific obligations. In contrast, the second activities are not regulated and are therefore not subject to intervention by the authorities. The retail business in particular is based on the principles of freedom contracting and customer freedom to choose supplier. As a deregulated business, retail prices of electricity are established freely between the parties.
Installation of new generation facilities is deemed a deregulated activity, notwithstanding the pertinent administrative authorizations. Facilities with installed capacity of under 50 MW which fall into one of the categories itemized in the Electricity Act (co-generation installations and those producing power from a renewable primary source) are deemed Special Regime facilities. These facilities can choose between selling the power they produce to the network-owning distributor at a pre-defined feed-in tariff or selling the electricity produced freely to the market through a system managed by the market operator at the price established by this organized market (exchange mechanism) plus certain applicable incentives and/or premiums.
Companies engaged in regulated business activities according to the Law, must have as exclusive object the development of such activities and cannot develop deregulated activities. However, group companies within a consolidated group can engage in regulated and deregulated business activities so long as they are carried on by separate group companies.
The electricity system has been in deficit in recent years, a situation which has led to the accumulation of an annual tariff deficit or shortfall, which has had to be financed by the power utilities companies. To remedy this situation, Royal Decree-Law 6/2009, of April 30, established a series of measures designed to address the tariff deficit, creating a state-guaranteed securitization fund, as well as the introduction of a “social voucher” (an electricity tariff discount for household consumers meeting certain social, usage and income criteria which is to be financed by the power generators).
In Spain, the main duty of Spain’s Technical System Operator, Red Eléctrica de España, S.A., is to ensure power supply security and the correct functioning of the generation and transmission system.
Legislative regulation approved in 2010 that does not specifically affect the hydrocarbon or electricity sectors
In line with widespread international legal instruments, Organic Law 5/2010, of June 22, introduced the concept of criminal liability of companies and other legal entities into the Spanish Criminal Code. As of December 23, 2010, date on which it came into effect, companies may be held criminally liable for crimes committed in their name or on their behalf, and in their benefit, by their actual or de facto legal representatives or directors.
This list of crimes for which legal entities may be held criminally liable includes corruption in the private sector, corrupt behavior in international transactions, money laundering, computer hacking and crimes against natural resources or the environment, among others.
10
Law 12/2010, which amends the Audit Act, the Securities Markets Act and the Companies Act and, introduces a number of legislative amendments, including new Audit Committee modifications for entities whose securities are listed on official secondary exchanges, requiring that at least one member of the audit committee should be an independent Director and that this member should be appointed based on his or her knowledge and experience of accounting and audit matters, and tasking the audit Committee, among other duties, with the issuance of an annual report on the independence of the External auditor.
Legislative Royal Decree 1/2010, of July 2, which enacted a new text of the Capital Companies Law, entered into force on September 1, 2010 and incorporates former regulation of public limited companies, limited liability companies and partnerships limited by shares and, with few exceptions, the provisions contained in the Securities Market Act with respect to listed companies. In relation with listed companies, article 515 of the new legislation, entering into force on July 1, 2011, nullifies provisions of company´s bylaws with the direct or indirect effect of limiting the number of votes that can be exercise by a single shareholder or by companies belonging to a consolidated group.
Argentina
Exploration and production
The Argentine oil and gas industry is regulated by Law No. 17,319 (the “Hydrocarbons Law”). The Argentine Government, through the Secretariat of Energy, issues regulations to complement this Law. The regulatory framework of this Law was established on the assumption that the reservoirs of hydrocarbons were national properties and Yacimientos Petrolíferos Fiscales Sociedad del Estado, YPF, S.A.’s predecessor, was responsible for their operation under a different framework than private companies.
In 1992, Law No. 24,145 (referred to as the “YPF Privatization Law,”) regulated the privatization of YPF and initiated a process for the transfer of hydrocarbon reservoirs from the Argentine Government to Provinces, in whose territories they were located. The YPF Privatization Law established that the exploration licenses and exploration concessions in force at the time this Law was passed would be transferred on expiration of the corresponding legal and/or contractual terms.
The YPF Privatization Law awarded YPF 24 exploration licenses and 50 exploration concessions and other trasportation concessions. The Hydrocarbons Law limits the number and total surface area of the exploration licenses or exploration concessions which an entity may hold.
In October 2004, the Argentine Congress enacted Law No. 25,943 creating a new state-owned energy company, Energía Argentina S.A., (“ENARSA.”). The corporate purpose of ENARSA is the study, exploration and exploitation of solid, liquid or gas hydrocarbon deposits, the transport, storage, distribution and commercialization of these products and their derivatives products, as well as the transportation and distribution of natural gas, and the generation, transportation, distribution and sale of electricity. This Law granted ENARSA all exploration concessions with respect to offshore areas located beyond 12 nautical miles from the coastline up to the outer boundary of the continental shelf that were vacant at the time the Law went into effect in November 2004.
11
In accordance with the current legal system (new Article 124 of the Argentine Constitution, Decree 546/2003, Law No. 26,197) oil and gas regulation (both legislative and regulatory) falls under the jurisdiction of the National Government, whereas the application of the Hydrocarbons Law and its supplementary regulations will correspond to the Provinces or to the State, depending on where the fields are located.
In October 2006, Law No. 26,154 created an incentive regime aimed at encouraging hydrocarbons exploration and operation and which applies to new exploration permits awarded in respect of offshore areas. Interested parties must go into partnership with ENARSA in order to avail themselves of the numerous benefits of this regime.
In November 2008, by virtue of the Decree of the National Executive Power No. 2014/2008, the program “Petróleo Plus” was set up and aimed to increase the production and stocks through new prospecting and exploitation investments. To this goal, it establishes a system of tax incentives for those exploitation companies that increase their production and stocks within the provisions of the program.
Natural gas
The Natural Gas Law passed in June 1992 mandated the privatization of the company operator Gas del Estado Sociedad del Estado and established the regulatory framework governing the transport and distribution of natural gas, while also providing for the deregulation of natural gas prices. It also designated natural gas transport and distribution activities as national public services.
The regulatory framework applicable to the transport and distribution of natural gas establishes an open access system under which producers such as YPF have open access to the transport capacity available in the transport and distribution systems on a non-discriminatory basis.
Argentina has built cross-border gas pipelines to enable natural gas producers to export their output. However, in recent years, the Argentine authorities have adopted a series of measures to restrict natural gas exports from Argentina, including orders to supply the domestic market (Fuel Undersecretariat Ruling 27/04 and Resolution 265/04) that implements an export cutoff scheme of natural gas; Resolution 659/04, establishes a Program for Rationalizing Gas and the Use of Transport Capacity; and Resolution 752/05, creates a Permanent Additional Injection mechanism.
Energy Secretariat Resolution 24/2008, amended by Resolution 1031/2008, created an incentive program for the production of natural gas called "Gas Plus,” designed with the objective of stimulating the production of natural gas deriving from new reserve findings, new fields, as well as the production of tight gas, etc. The natural gas produced under this program is carved out from the 2007-2011 Agreement (described in the Market Regulation section below) and therefore the its commercial price is not subject to the price conditions provided for in the Natural Gas Producer Agreement 2007-2011.
Refining and transport
Crude oil refining activities are subject to authorization by the Argentine Government, and to compliance with national, provincial and municipal safety and environmental regulations. Oil companies must be registered in the registry of oil companies held by the Secretariat of Energy.
12
Decree 2014/2008 created the “Refino Plus” program designed to encourage the production of diesel and petrol fuels. The decree entitles refineries that undertake construction of a new refinery, add capacity at an existing refinery and/or convert existing refineries to receive export credits.
The Hydrocarbons Law authorizes the Executive National Power of the Argentine Government to grant 35-year concessions for the transport of oil, gas and derivative products, subject to presentation of the pertinent competitive tenders. Law 26,197 vested Argentina’s provincial governments with the same power. Holders of operating concessions are entitled to receive a concession for transporting their production of oil, gas and derivatives thereof. The terms of these transport concessions can be extended for an additional period of 10 years.
Liquefied Petroleum Gas (LPG)
Law No. 26,020 establishes the basic regulatory framework for the industry and marketing of LPG. The authority established the volumes and sales prices of LPG through various resolutions. In October 2008 Argentina’s Secretariat of Energy ratified the Stability Agreement of LPG prices in the local market. The validity of the pact has been extended to December 31, 2011.
Market regulation
The Hydrocarbons Law authorizes the Executive National Power of the Argentine Government to regulate the Argentine oil and gas markets and prohibits the export of crude oil during periods in which the authorities determine domestic production to be insufficient to satisfy domestic demand. In the event of restrictions on the export of crude oil and derivatives or the free circulation of natural gas, the oil deregulation decrees entitle producers, refiners and operators to receive a price at least equal to the price of similar grades of imported crude oil and derivatives in the case of oil, and no less than 35% of international price of crude Arabian Light Oil in the Case of Natural Gas, quoted in cubic meters.
A significant number of rules concerning a broad range of issues affect the various markets, for example, the Energy Secretariat Resolution 1102/04 regarding the creation of a register of fuel and hydrocarbon supply points, Energy Secretariat Resolution 1104/04 regulating creation of a bulk sales price information module and Decree 652/02 enacting a gasoil supply stability regime and, in general, other rules with different scopes.
By the enactment of several rules, the Fuels Undersecretariat restored a record system for the hydrocarbons and derivatives exports and set forth some obligations concerning supply to the local market, including the obligation to import some products as allowances for export, when necessary to meet internal demand. On October 11, 2006, the Secretariat of Internal Commerce demanded refining companies and/or wholesalers and/or retailers that they must satisfy the fuel-oil demand in the whole territory of Argentina to meet market growth.
13
Resolution No. 394/07 of November 16 increased the taxes on crude and derivative exports in Argentina. According to the new scheme when the export price is fixed over the reference price (60.9 dollars/barrel), the producer shall have the right to collect US$42 per barrel and the rest up to the reference price shall be withheld by the Argentine Government as an export tax. In the event that the export price is under the international reference price, but above US$45 per barrel, a 45% retention shall apply. In the event that the export price is under US$ 45 per barrel, the withholding percentage shall be fixed within 90 days' term. This same method shall apply to the exports of other oil products and lubricants using different reference prices, withholding percentages and prices allowed for producers, depending on the cases.
On June 14, 2007 the Resolution No. 599/07 of the Secretariat of Energy passed a proposal in agreement with the natural gas producers concerning the supply of natural gas to the domestic market for the period 2007 to 2011 (“2007-2011 Agreement”). YPF signed the agreement.
Resolution 459/07 issued by Argentina’s Ministry of Federal Planning, Public Investment and Services, created the “Energy Substitution Program” (Programa de Energía Total) in order to mitigate gas and electricity shortages by encouraging industrial users to substitute natural gas and electricity with gasoil, fuel-oil and LPG. Subsequently, regarding the implementation of this program, a number of new resolutions and rules enacted the general programs for the supply of gaseous and liquid fuels.
On February 2, 2011, the Argentine Secretary of Home Trade issued Resolution No. 13/2011 stipulating that liquid fuel sales prices should be pushed back to those prevailing on January 28, 2011. This regulation also stipulates that the nation’s refineries and oil companies must supply the internal market with specified fuel volumes calculated as a function of the amounts supplied in the preceding year adjusted by the positive correlation between growth in demand for fuel and gross domestic product.
Venezuela
Venezuela’s Basic Hydrocarbons Law (LOH) regulates the migration from the former Operating Agreements to Mixed-Ownership Enterprises. On June 20, 2006, the Popular’s Power for Energy and Petroleum Ministry (MENPET for its initials in Spanish) approved the incorporation of Mixed Enterprise Petroquiriquire, S.A., in which Repsol has a 40% ownership interest, while Corporación Venezuela del Petróleo, S.A. (CVP), a PDVSA subsidiary, holds a 60% stake. On the same date, the national executive authorized the direct grant of a Non-Associated Natural Gas Operating License to the corporation Quiriquire Gas, S.A., owned 60% by Repsol and 40% by PDVSA GAS, S.A. This Gas License was granted in March 2007.
On September 2, 2009, Venezuela’s National Assembly authorized Petroquiriquire, S.A. to pursue exploration and exploitation activities in Barúa-Motatán as part of its corporate purpose as mixed enterprise. The exploration and exploitation rights for this block were granted by the National Executive via Presidential Decree No. 7,121, published on December 15, 2009. On February 10, 2010, the incorporation of the Barúa-Motatán division in the Mixed Enterprise was approved at an Extraordinary Shareholders’ Meeting. That same day, the Amendment to the Transformation to Mixed Enterprise Agreement was signed, along with related documentation, effectively: (i) incorporating the Barúa-Motatán Geographic Division within Petroquiriquire, S.A., and (ii) authorizing amendment of the Mixed Enterprise’s Bylaws and the Hydrocarbon Sale-Purchase Agreement.
14
On February 10, 2010, the MENPET awarded the operating concession for Carabobo 1 to the consortium made up of Repsol (11%), Petronas (11%), OVL (11%) and Indoil (7%), for a combined equity interest of 40%, and CVP, with a 60% stake. The Decree creating the Mixed Enterprise Petrocarabobo, S.A. and the MENPET Resolution delimiting its geographic area were published in the Official Gazette of the Bolivarian Republic of Venezuela on May 7, 2010. The Agreement governing the Incorporation and Administration of Mixed Enterprise Petrocarabobo, S.A. was signed on May 12, 2010 and on June 25, 2010 the Enterprise was incorporated in the Companies Register. On July 29, 2010, Petrocarabobo, S.A.’s Transfer Decree was published in the Official Gazette (Note 30).
Bolivia
The Bolivian oil and gas industry is regulated by Law No. 3,058 of May 19, 2005 (the “Hydrocarbons Law”).
On May 1, 2006 Supreme Decree 28,701 (the “Nationalization Decree”) was published, which nationalized the country’s oil and gas and transferred the ownership and control thereof to the Bolivian state company Yacimientos Petrolíferos Fiscales Bolivianos (YPFB). Furthermore, the shares required to enable YPFB to control at least 50% plus one vote in different companies, among them Empresa Petrolera Andina, S.A., currently known as YPFB Andina S.A. (YPFB Andina), were nationalized.
As a result, Repsol signed a shareholders’ agreement that stipulates, among other provisions: (a) a two-year period of joint operation of YPFB Andina, during which time Repsol is entitled to appoint some executives in certain business areas; (b) mutual right of first refusal over any share sale; (c) certain “Mutually Agreed Decisions” to be taken jointly by the management and boards of Repsol and YPFB.
At the date of authorizing the accompanying consolidated Financial Statements for issue, the joint operation period had terminated, which means that the “Appointment of Executive Personnel” clause applies. This clause stipulates that as a minority shareholder, Repsol is entitled to propose the persons to be nominated by the Board to certain positions.
Operating contracts
According to the Hydrocarbons Law and the Nationalization Decree, Repsol YPF E&P Bolivia S.A. and its subsidiary YPFB Andina S.A. signed with YPFB the Operating Contracts establishing the conditions for the prospecting and production of hydrocarbons in Bolivia, effective as of May 2, 2007.
In compliance with the terms laid down in the Operating Contracts, on May 8, 2009, Repsol YPF E&P Bolivia S.A. signed the pertinent natural gas and liquid Hydrocarbon Delivery Agreements (Delivery Agreements) with YPFB for the various operating areas in which it operates, as well as the Payment Method Agreement, which regulate the terms of Operating Contract Holder Remuneration.
In relation with these Operating Contracts, significant legislation was issued in 2008 and 2009 which had the effect of: (i) setting the conditions and parameters for the recognition and approval by YPFB of the Recoverable Costs within the framework of the Operating Contracts; (ii) amending the regulations governing the settlement of royalties and investments with the Bolivian Treasury to conform with the terms of the Operating Contracts; and (iii) regulating the tendering, contracting and purchase of materials, works, goods and/or services by Operating Contract Holders.
15
Further, in compliance with what is established in Ministerial Order 101/2009, the amended Development Plan corresponding the Operating Contract governing the Caipipendi Area, and the Margarita and Huacaya Fields was presented. This Development Plan was approved by YPFB on March 8, 2010.
Lastly, in respect of the Delivery Agreements, Ministerial Order 088/2010 of March 25, which repealed Ministerial Order 291/2009 of October 29 and amended the Ministerial Order 255/2006, established that the allocation of the hydrocarbons produced to be made by YPFB will be formulated by field and market in accordance with the volumes committed to in the Delivery Agreements signed with YPFB. The order of priority for allocation of natural gas is: (1) Internal Market; (2) Export Markets, in the chronological order in which YPFB entered into the various Natural Gas Purchase Agreements; and for liquid hydrocarbons, the priority order is: (1) Internal Market; (2) Export Market.
At the date of the Financial Statements, the reconciliation of the Holder Remuneration calculation with YPFB was still pending.
New Bolivian Constitution
Bolivia enacted its new Constitution on February 7, 2009, stipulating in relation to the oil and gas sector, among other matters, that:
(i) Hydrocarbons are the inalienable and imprescriptible property of Bolivians; (ii) by virtue of belonging to the Bolivian people, securities evidencing a residual ownership interest in Bolivia’s natural resources may not be listed and traded on securities markets or used to securitize or pledge financial transactions; (iii) the state, on behalf of the Bolivian people and as their representative, exercises ownership of all the country’s oil and gas production and is the sole entity authorized to market this output; (iv) all income received from the sale of oil and gas shall be the property of the state; (v) the state shall define the oil and gas policy and shall promote its comprehensive, sustainable and equitable development and guarantee energy sovereignty; (vi) YPFB is the sole entity authorized to control and manage the oil and gas productive and commercial chain; (vii) YPFB may not transfer its rights and obligations in any form or under any regime, tacitly or expressly, directly or indirectly; YPFB is authorized to enter into service agreements with Bolivian and foreign public, mixed or private entities for the execution of certain production chain activities on YPFB’s behalf in exchange for compensation or a service fee; (viii) YPFB may incorporate mixed economy associations or companies for the execution of hydrocarbon-related activities, in which YPFB must hold a mandatory interest of no less than 51% in these entities’ total share capital.
It is management’s understanding that the new Constitution will require enactment of a series of additional laws and regulations.
Ecuador
On March 29, 2006, by Law No. 2006-42, Ecuador demanded from the contractors of all the prospecting and exploitation joint contracts of hydrocarbons the payment of at least 50% of the so-called “surpluses of crude oil,” that is, the difference between the participation value of each contractor, according to the oil price at the date of the execution of the contract (calculated on the basis of the monthly average of the sale price expressed in fixed values) and its value in accordance to the oil price at the date of sale by the contractors. Later on, Executive Decree No. 662, of October 4, 2007, increased the state’s participation to the 99%.
16
On June 9, 2008, the companies constituting the consortium of contractors of the Block 16, in disagreement with the application of this new encumbrance, filed with the ICSID an application for international arbitration pursuant to the Equity Contract (Note 34).
On March 12, 2009, Repsol YPF Ecuador S.A. (Ecuador Branch), as operator of Block 16, signed a modified Participation Agreement which extended the concession to operate Block 16 from January 31, 2012 to December 31, 2018, although the Participation Agreement would be terminated early if a Services Agreement to replace this Participation Agreement is not negotiated and executed in a period of one year.
In accordance with the provisions set down in the Amended legislation of the Hydrocarbons Law and the Internal Tax Regime Law, of July 27, 2010, the agreements for the exploration and exploitation of hydrocarbons under the various contractual forms must be modified to reflect the amended hydrocarbons exploration and exploitation services agreement model provided for in article 16 of the Hydrocarbons Law.
On November 23, 2010, the Ecuadorian state and Repsol entered into an agreement transforming the former contract into a hydrocarbons (crude oil) exploration and exploitation service agreement covering Block 16 in the Amazon Region.
In addition, on January 22, 2011, Repsol signed an agreement with the Ecuadorian state amending the services agreement covering the Tivacuno Block. The Company is currently in the process of executing the documents needed to file the new agreement with the Hydrocarbons Registry.
Lastly, in accordance with article 408 of Ecuador’s Constitution, published on October 20, 2008, the state retains a portion of the profits obtained on the sale of hydrocarbon resources; this state retention may not be less than the profit retained by the company producing the fuel.
Other countries
Repsol YPF’s operations are subject to an extensive variety of legislation and regulatory frameworks in the other countries in which it operates. All aspects of the activities performed, including, inter alia, land occupancy, production rates, royalties, price-setting, environmental protection, export rates, exchange rates, etc., are covered by such legislation and regulatory frameworks. The terms of the concessions, licenses, permits and agreements governing the Group’s interests vary from one country to another. These concessions, licenses, permits and agreements are generally awarded or jointly carried out with government bodies or state companies and occasionally with private sector organizations.
17
(3) BASIS OF PRESENTATION AND ACCOUNTING POLICIES
3.1 Basis of presentation
The accompanying consolidated Financial Statements are presented in millions of euros and were prepared from the accounting records of Repsol YPF, S.A. and of its investees. The consolidated Financial Statements are presented in accordance with the International Financial Reporting Standards (IFRSs) as endorsed by the European Union at December 31, 2010. Accordingly, they present fairly the Group’s consolidated equity and financial position at December 31, 2010, the concolidated results of operations, the changes in consolidated equity and the consolidated cash flows in the year then ended.
The preparation of the consolidated Financial Statements in accordance with IFRS, which is the responsibility of the Board of Directors of the Group’s parent company, makes it necessary to make certain accounting estimates and for the directors to use their judgment when applying the Standards. The most complex areas, the areas in which the directors' judgment is most required and the areas in which significant assumptions or estimates have to be made are detailed in Note 4 (Accounting Estimates and Judgments).
3.2 New standards issued
A) Below is a list of the standards, interpretations and amendments thereof under the International Financial Reporting Standards endorsed by the European Union that are mandatorily applicable to the Group’s consolidated Financial Statements for the first time in 2010:
- Revised IFRS 3 Business Combinations.
- Amendment to IAS 27 Consolidated and Separate Financial Statements.
- Amendment to IAS 39 Eligible Hedged Items.
- Amendments to IFRS 2 Group Cash-settled Share based Payment Transactions.
- Improvements to IFRS´s - 2007-2009.
- Revised IFRS 1 First-time Adoption of IFRS.
- Amendments to IFRS 1 Additional Exemptions for First-time Adopters.
- Amendment to IFRS 5 to incorporate the changes introduced following the Improvements to IFRS´s 2006-2008.
- IFRIC 12 Service Concession Arrangements.
- IFRIC 17 Distributions of Non-Cash Assets to Owners.
IFRS 3 Business Combinations introduces significant changes, most notably with respect to the accounting treatment of adquisition-related costs, the measurement of non-controlling interests and the accounting treatment of business combinations achieved in stages (step acquisitions). IFRS 3, as amended, applies prospectively to business combinations completed on or after January 1, 2010.
18
IAS 27 Consolidated and Separate Financial Statements introduces significant novelties with respect to changes in a parent´s ownership interests in a subsidiary, differentiating between transactions giving rise to a loss of control and those in which control is retained. These amendments apply prospectively to transactions carried out on or after January 1, 2010.
IFRIC 12 Service Concession Arrangements establishes infrastructure used in a service concession arrangement complying with the following conditions: a) the grantor controls or regulates what services the operator must provide; and b) the grantor controls any significant residual interest in the infrastucture at the end of the term of the arrangement; shall not be recognized as property, plant and equipment of the operator, and it establishes that the operator shall recognize an intangible asset or a financial asset, depending on the nature of the arrangement.
The application of the standards, interpretations and amendments listed above, has not had a material impact on the Group’s 2010 consolidated Financial Statements. Nevertheless, the first-time application of IFRIC 12 has resulted in certain reclassifications among balance sheet headings (Note 6).
B) At the date of preparation of the accompanying consolidated Financial Statements, interpretations and amendments thereof published by the IASB and endorsed by the European Union that have not been applied because the date of mandatory application is subsequent to the date of these consolidated Financial Statements date, and the Group has opted not applying early adoption, are the following:
Mandatory application in 2011:
- Revised IAS 24 Related Party Disclosures.- Amendments to IAS 32 Classification of Rights Issues.- Amendments to IFRS 1 Limited Exemption from Comparative IFRS 7
Disclosures for First-time Adopters.- Annual improvements to IFRS 2008-2010.- IFRIC 19 Extinguishing Financial Liabilities with Equity Instruments- Amendments to IFRIC 14 Prepayments of a Minimum Funding
Requirements.
At the date of preparation of the accompanying consolidated Financial Statements, the Group is assessing the impact of the application of these standards, amendments, and interpretations.
C) At the date of preparation of the accompanying consolidated Financial Statements the standars, interpretations and amendments thereof that have been issued by the IASB but not yet endorsed by the European Union are the following:
- IFRS 9 Financial Instruments. (1)- Amendments to IFRS 7 Disclosures of transfers of financial assets.- Amendments to IFRS 1 Severe Hyperinflation and Removal of Fixed Dates
for First-time Adopters.- Amendments to IAS 12 Deferred tax:Recovery of Underlying Assets.(1) This constitutes phase one of the three-phase project plan for the replacement of IAS 39: "Financial instruments - Recognition and measurement”.
19
None of these standards is applicable at the date of preparation of the accompanying consolidated Financial Statements.
3.3 Accounting policies
3.3.1) Basis of consolidation
Repsol YPF´s consolidated Financial Statements include the investments in all their subsidiaries, associates and joint ventures.
All the subsidiaries over which Repsol YPF exercises direct or indirect control were fully consolidated. Control is the power to govern the financial and operating policies of a company so as to obtain benefits from its activities. Control is, in general but not exclusively, presumed to exist when the parent owns directly or indirectly more than half of the voting power of the investee.
The share of the minority interests in the equity and profit of the Repsol YPF Group's consolidated subsidiaries is presented under “Minority interests” within Equity in the consolidated balance sheet and “Net income attributable to minority interests” in the consolidated income statement, respectively.
Joint ventures are proportionately consolidated and, accordingly, the consolidated Financial Statements include the assets, liabilities, expenses and income of these companies only in proportion to Repsol YPF Group's ownership interest in their capital. Joint ventures are those over which there is shared control and exists only when the strategic financial and operating decisions relating to the activity require the unanimous consent of the parties sharing control.
The assets, liabilities, income and expenses corresponding to the joint ventures are presented in the consolidated Balance Sheet and consolidated Income Statement in accordance with their specific nature.
In the case of either non-monetary contributions to a joint controlled entity in exchange for an equity interest, either in the case of sales of assets to a joint controlled entity, the Group only recognizes that portion of the gain or loss that is attributable to the interests of the other venturers.
Associates are accounted for using the equity method. These are companies over which the investor has significant influence but does not exercise effective or joint control. Significant influence is the power to affect financial and operating decisions of a company and is presumed to exist when the investor holds an interest of 20% or more. The equity method involves recognizing under “Investments accounted for using the equity method” in the Consolidated Balance Sheet, the net assets and goodwill, if applicable, of these companies only in proportion to the ownership interest in their capital. The net profit or loss obtained each year through these companies is reflected, only in proportion to the ownership interest in their capital, in the Consolidated Income Statement as “Share of results of companies accounted for using the equity method.”
Losses incurred by an associate attributable to the investor that exceed the latter's interest in the associate are not recognized, unless the Group is obliged to cover them.
20
Appendix I contains a list of the consolidated subsidiaries, associates and joint ventures in which Repsol YPF, S.A. has direct and indirect ownership interests, which were included in the scope of consolidation, as well as the changes in the consolidation scope in 2009 and 2010.
The balances, transactions and profits between the fully consolidated companies were eliminated on consolidation. All balances, transactions and profits derived from transactions between the proportionately consolidated companies and other Group companies were eliminated in the proportion of its effective integration. The profit or loss on transactions between Group companies and associates was eliminated in proportion to the Group's percentage of ownership of these companies.
The accounting policies and procedures used by the Group companies were standardized with those of the parent for the purpose of presenting the consolidated Financial Statements using uniform measurement bases.
The Financial Statements of the investees whose functional currency differs from the presentation currency (Note 3.3.4) are translated as follows:
- The assets and liabilities in each of the balance sheets presented are translated at the exchange rates prevailing on the balance sheet date.
- Income and expense items making up each income statement heading are translated at the exchange rate on the transaction date. For practical reasons, the Group generally applies the average exchange rate for the period in which the transactions were completed.
- Any exchange differences arising as a result of the foregoing are recognized as a separate component of “Adjustments for changes in value” of equity called “Translation Differences.”
On the disposal of a company whose functional currency is not the euro, or in the event of partial disposals resulting in loss of control, the exchange differences posted as a component of equity relating to that company are recognized in the income statement when the gain or loss on disposal is recognized. This accounting treatment also applies to partial disposals resulting in the loss of joint control or significant influence.
Since amended IAS 21 took effect on January 1, 2010, on the partial disposal of a subsidiary that includes a foreign operation that it does not result in the loss of control, the proportionate share of the cumulative amount of the exchange differences recognized in equity is re-attributed to the non-controlling interests in that foreign operation. In any other partial disposal of a foreign operation, only the proportionate share of the cumulative amount of the exchange differences recognized in equity corresponding to the reduction in the Group´s ownership interest is reclassified to profit or loss.
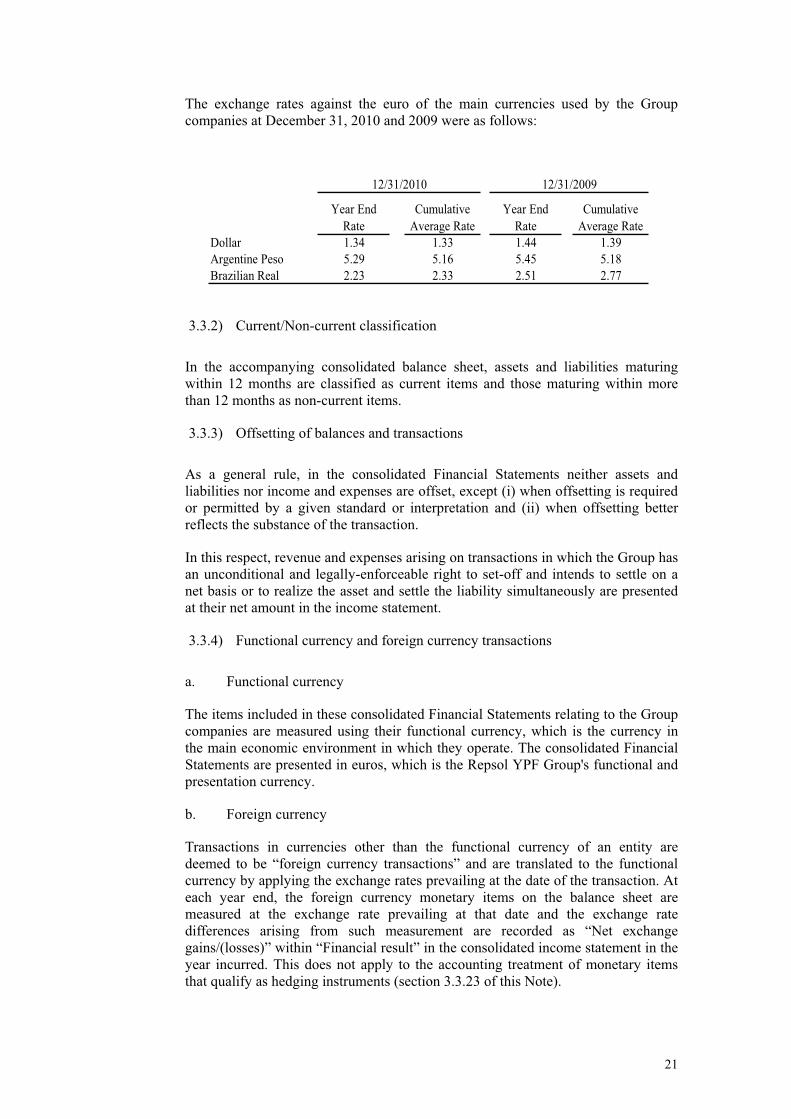
21
The exchange rates against the euro of the main currencies used by the Group companies at December 31, 2010 and 2009 were as follows:
Year End Rate
Cumulative Average Rate
Year End Rate
Cumulative Average Rate
Dollar 1.34 1.33 1.44 1.39Argentine Peso 5.29 5.16 5.45 5.18Brazilian Real 2.23 2.33 2.51 2.77
12/31/200912/31/2010
3.3.2) Current/Non-current classification
In the accompanying consolidated balance sheet, assets and liabilities maturing within 12 months are classified as current items and those maturing within more than 12 months as non-current items.
3.3.3) Offsetting of balances and transactions
As a general rule, in the consolidated Financial Statements neither assets and liabilities nor income and expenses are offset, except (i) when offsetting is required or permitted by a given standard or interpretation and (ii) when offsetting better reflects the substance of the transaction.
In this respect, revenue and expenses arising on transactions in which the Group has an unconditional and legally-enforceable right to set-off and intends to settle on a net basis or to realize the asset and settle the liability simultaneously are presented at their net amount in the income statement.
3.3.4) Functional currency and foreign currency transactions
a. Functional currency
The items included in these consolidated Financial Statements relating to the Group companies are measured using their functional currency, which is the currency in the main economic environment in which they operate. The consolidated Financial Statements are presented in euros, which is the Repsol YPF Group's functional and presentation currency.
b. Foreign currency
Transactions in currencies other than the functional currency of an entity are deemed to be “foreign currency transactions” and are translated to the functional currency by applying the exchange rates prevailing at the date of the transaction. At each year end, the foreign currency monetary items on the balance sheet are measured at the exchange rate prevailing at that date and the exchange rate differences arising from such measurement are recorded as “Net exchange gains/(losses)” within “Financial result” in the consolidated income statement in the year incurred. This does not apply to the accounting treatment of monetary items that qualify as hedging instruments (section 3.3.23 of this Note).
22
3.3.5) Goodwill
Goodwill represents the excess of the cost of a business combination over the acquirer’s interest in the net fair value of the identifiable assets, liabilities and contingent liabilities that meet the pertinent recognition criteria at the date of acquisition. Goodwill is recognized as an asset at the acquisition date.
In the event of a shortfall, the value of the assets, liabilities and contingent liabilities acquired must be re-assessed. If after this re-assessment the shortfall continues to exist, it is recognized in profit or loss under “Other operating income” in the consolidated income statement.
Goodwill is not amortized and is subsequently measured at cost less any accumulated impairment losses (section 3.3.10 below).
3.3.6) Other intangible assets
The Repsol YPF Group initially recognizes intangible assets at acquisition or production cost, except in the case of the emission allowances received for no consideration as described in section b) below. This cost is amortized on a straight-line basis over the assets’ useful lives, except for the assets with indefinite useful lives described below, which are not amortized but are tested for impairment at least annually, and whenever indicators of impairment are detected. At each balance sheet date, these assets are measured at cost less accumulated amortization and any accumulated impairment losses.
The main intangible assets of the Repsol YPF Group are as follows:
a) Leasehold assignment, surface and other rights
This heading primarily includes the costs associated with the various forms of agreements for acquiring service station association rights, reflagging rights and image rights of publicity and the associated exclusive supply agreements. This heading also includes other usufruct and surface rights. These costs are amortized over the related contract terms, which range from 5 to 50 years.
b) Emission allowances
Emission allowances are recognized as an intangible asset and are measured at acquisition cost.
Allowances received for no consideration under the National Emission Allowance Assignment Plan, are initially recognized at the market price prevailing at the beginning of the year in which they are issued, and a balancing item is recognized as a grant for the same amount under deferred income, which is charged against income as the corresponding tons of CO2 are consumed.
23
These allowances are not amortized as their carrying amount equals their residual value and, therefore, the depreciable basis is zero, as their value is constant until delivery to the authorities; the allowances may be sold anytime. Emission allowances are subject to an annual impairment test (section 3.3.10. below). The fair value of the emission allowances is measured based on the average market price on European Union Allowances Exchange for the last trading session of the year provided by the ECX-European Climate Exchange.
The Group records an expense under “Other operating expenses” in the income statement for the CO2 emissions released during the year, recognizing a provision calculated based on the tons of CO2 emitted, measured at: (i) their carrying amount in the case of the allowances of which the Group is in possession at year-end; and (ii) the closing list price in the case of allowances of which it is not in possession at year-end.
When the emissions allowances for the CO2 tons emitted are delivered to the authorities, the intangible assets as well as their corresponding provision are derecognized from the balance sheet without any effect on the income statement.
c) Other intangible assets
This heading primarily includes the following items:
i. Concessions and others: these are initially recognized at acquisition cost if they are acquired directly from a government or other public sector body, or at the fair value attributable to the concession in question if they are acquired as part of a business combination. They are subsequently measured at acquisition cost less accumulated amortization and impairment loss, if any. These concessions are amortized on a straight-line basis over the term of the concession agreements.
These concessions include contracts for the supply of public services under which the operator has the right to charge tariffs that are established directly with the service’s users, although the competent authorities regulate or control either the tariffs or the users to which service must be provided; moreover, the State retains the residual value in the assets at the end of the term of the arrangement. These concessions are initially recognized at fair value.
This heading also includes power distribution concessions in Spain which are not subject to legal or any other limits. Because these intangible assets are considered to have indefinite useful lives they are not amortized but they are tested for impairment at least annually.
24
ii. Exploration permits acquisition costs: the costs incurring to acquire stakes in exploration permits for a given period of time are capitalized under this heading at their purchase price. During the exploration and evaluation phases, these costs are not amortized, although they are tested for impairment at least once a year and whenever indications of impairment are detected, in accordance with the guidelines set forth in IFRS 6 Exploration for and Evaluation of Mineral Resources. Any impairment losses detected are recognized – or reversed - in profit or loss in accordance with the general rules established in IAS 36 Impairment of Assets. Once the exploration and evaluation phase is completed, if no reserves are found, the amounts previously capitalized are recognized as an expense in the consolidated income statement. If the exploration work yields positive results, giving rise to commercially exploitable wells, the costs are reclassified to “Investments in areas with reserves” (Note 3.3.7 c) at their carrying amount when this determination is made.
iii. Development costs are capitalized only if all the conditions stipulated in the applicable accounting standard are met. The Group research costs incurred by the Group are expensed in the Income Statement.
iv. Other costs, including those relating to software and industrial property, are amortized on a straight-line basis over their useful lives (which range between 3 and 20 years).
Trademarks and analogous intangible assets internally developed by the Group are not capitalized; and the related expenses are recognized in the consolidated income statement in the period in which they are incurred.
3.3.7) Property, plant and equipment
The Repsol YPF Group uses the cost model by which items of property, plant and equipment are measured initially at acquisition cost.
a) Cost
The cost of property, plant and equipment includes their acquisition cost, all the costs directly related to the location of assets, making them operational and the present value of the expected disbursements necessary for any costs of dismantling and removing the item or restoring the site on which it is located, when such obligations are incurred under certain conditions. Subsequent changes to the measurement of the dismantling obligations and related liabilities resulting from changes in the estimated cash flows and/or in the discount rate are added to or deducted from the asset’s carrying amount in the period in which they are incurred, except where the lower corrected value of the liability is greater than the carrying amount of the associated asset, in which case the surplus is recognized in the income statement.
Borrowing costs that are directly attributable to the acquisition or construction of assets that require more than one year to be ready for use are capitalized as part of the cost of these assets, in accordance with the limits established in the applicable accounting rules.
Personnel expenses and other operating expenses directly attributable to the construction of the asset are also capitalized.
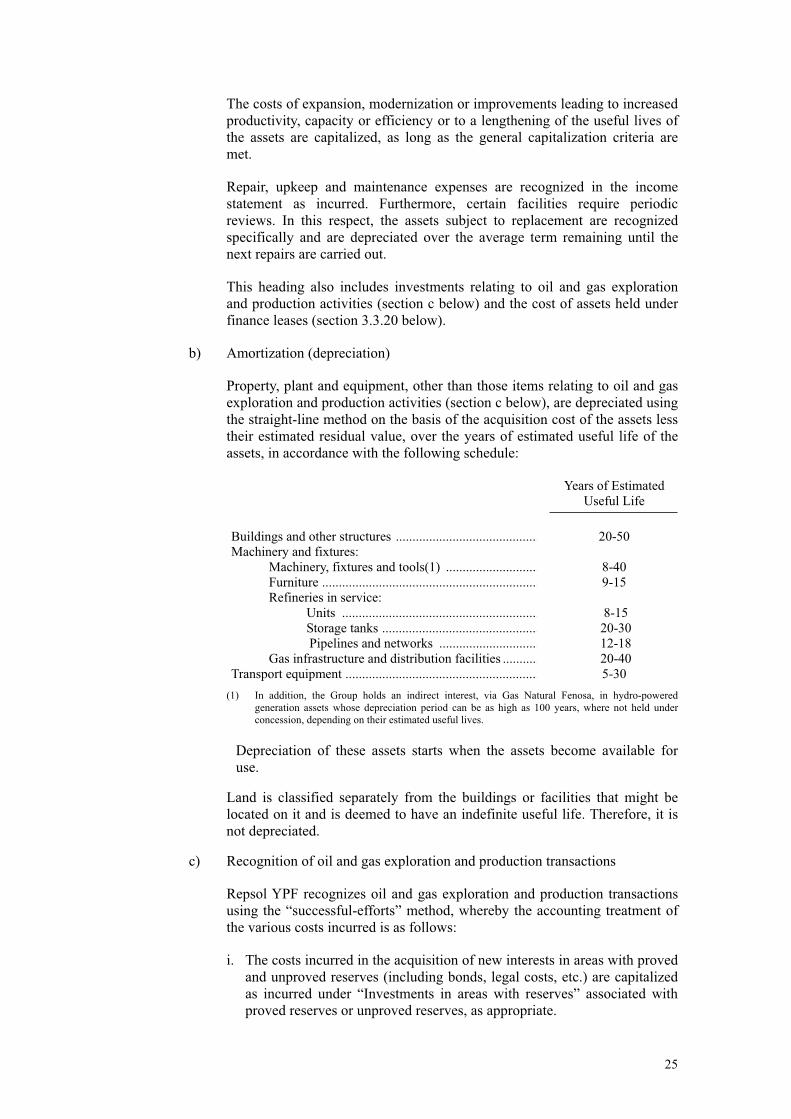
25
The costs of expansion, modernization or improvements leading to increased productivity, capacity or efficiency or to a lengthening of the useful lives of the assets are capitalized, as long as the general capitalization criteria are met.
Repair, upkeep and maintenance expenses are recognized in the income statement as incurred. Furthermore, certain facilities require periodic reviews. In this respect, the assets subject to replacement are recognized specifically and are depreciated over the average term remaining until the next repairs are carried out.
This heading also includes investments relating to oil and gas exploration and production activities (section c below) and the cost of assets held under finance leases (section 3.3.20 below).
b) Amortization (depreciation)
Property, plant and equipment, other than those items relating to oil and gas exploration and production activities (section c below), are depreciated using the straight-line method on the basis of the acquisition cost of the assets less their estimated residual value, over the years of estimated useful life of the assets, in accordance with the following schedule:
Years of Estimated Useful Life
Buildings and other structures ........................................... 20-50 Machinery and fixtures: Machinery, fixtures and tools(1) ............................ 8-40 Furniture ................................................................. 9-15 Refineries in service: Units ........................................................... 8-15 Storage tanks ............................................... 20-30 Pipelines and networks .............................. 12-18 Gas infrastructure and distribution facilities ........... 20-40 Transport equipment .......................................................... 5-30
(1) In addition, the Group holds an indirect interest, via Gas Natural Fenosa, in hydro-powered generation assets whose depreciation period can be as high as 100 years, where not held under concession, depending on their estimated useful lives.
Depreciation of these assets starts when the assets become available for use.
Land is classified separately from the buildings or facilities that might be located on it and is deemed to have an indefinite useful life. Therefore, it is not depreciated.
c) Recognition of oil and gas exploration and production transactions
Repsol YPF recognizes oil and gas exploration and production transactions using the “successful-efforts” method, whereby the accounting treatment of the various costs incurred is as follows:
i. The costs incurred in the acquisition of new interests in areas with proved and unproved reserves (including bonds, legal costs, etc.) are capitalized as incurred under “Investments in areas with reserves” associated with proved reserves or unproved reserves, as appropriate.
26
ii. Exploration costs (geological and geophysical expenditures, expenditures associated with the maintenance of unproved reserves and other expenditures relating to exploration work), excluding exploratory drilling expenditures, are expensed as incurred.
iii. Exploratory drilling costs, including those relating to stratigraphic exploration wells, are recognized as assets under the heading “Other exploration costs” until it is determined whether proved reserves justifying their commercial development have been found. If no proved reserves are found, the capitalized drilling costs are charged to income. However, if as a result of exploratory drilling, including stratigraphic exploratory wells, reserves are found that cannot be classified as proved, their recognition depends on the following:
- If the area requires additional investments before production can commence, the drilling costs remain capitalized only during the period in which the following conditions are met: (i) the amount of proved reserves found justifies the completion of a productive well if the required investment is made; and (ii) the drilling of additional exploratory or stratigraphic wells is underway or planned for the near future. If either of the aforementioned conditions is not met, the drilling costs or the cost of the stratigraphic wells are charged to income.
- In all other circumstances, the existence of reserves that can be classified as proved have to be determined within one year from the completion of the prospection work. Otherwise, the related drilling costs are charged to income.
Costs incurred in exploratory drilling work that has yielded a commercially exploitable reserve find are reclassified to “Investments in areas with reserves.” Wells are classified as “commercially exploitable” only if they are expected to generate a volume of reserves that justifies their commercial development on the basis of the conditions prevailing when recognized (e.g. prices, costs, production techniques, regulatory framework, etc.).
iv. Development expenditure incurred in lifting proved reserves and in processing and storing oil and gas (including costs incurred in drilling relating to productive wells and dry wells under development, oil rigs, recovery improvement systems, etc.) are recognized as assets under “Investments in areas with reserves.”
v. Future field abandonment and dismantling costs (environmental, safety, etc.) are estimated, on a field-by-field basis, and are capitalized at their present value when they are initially recognized under “Investments in areas with reserves” in assets in the balance sheet, within “Non-Current Provisions.” This capitalization is recorded against the corresponding provision.
27
The investments capitalized as described above are depreciated as follows:
i. Investments in the acquisition of proved reserves are depreciated over the estimated commercial life of the field on the basis of the production for the period as a proportion of the proved reserves of the field at the beginning of the depreciation period.
ii. Investments relating to unproved reserves or fields under evaluation are not depreciated. These investments are tested for impairment at least once a year and whenever indications of impairment are detected. Any impairment losses detected are recognized – or reversed - in profit or loss in accordance with the general rules established in IAS 36 Impairment of Assets.
iii. Cost incurred in drilling work and subsequent investments to develop and lift oil and gas reserves are depreciated over the estimated commercial life of the field on the basis of the production for the period as a proportion of the proved reserves of the field at the beginning of the depreciation period.
The changes in estimated reserves are considered on a prospective basis in calculating depreciation.
At each balance sheet date or whenever there are indications that the assets might have become impaired, their recoverable amount (see section 3.3.10. of this Note) is compared to their carrying amount. Any impairment loss or reversal arising as a result of this comparison is recognized under “Impairment losses and losses on disposal of non-current assets” or, if applicable, “Income from reversal of impairment losses and gains on disposal of non-current assets” on the consolidated income statement (section 3.3.10. of this Note and Notes 7, 9 and 25).
d) Environmental property, plant and equipment
Property, plant and equipment of an environmental nature, the purpose of which is to minimize environmental impact and to protect and improve the environment, are identified on the basis of the nature of the business activities carried on, based on the Group’s technical criteria, which are based on the guidelines relating to these matters issued by the American Petroleum Institute (API).
Environmental property, plant and equipment and the related accumulated depreciation are recognized in the balance sheet together with other property, plant and equipment, classified by their nature for accounting purposes.
Their cost, depreciation methods and the valuation adjustments to be performed are determined in accordance with the rules relating to these non-current asset items, as explained in sections 3.3.7.a) to 3.3.7.c) of this Note.
3.3.8) Investment property
Investment property are those assets (buildings, land) held either to earn rentals or for capital appreciation or both. These assets are not used by the Group's in the production or supply of goods or services or for administrative purposes. Repsol YPF recognizes investment property using the cost model, applying the same policies as for items of property, plant and equipment (sections 3.3.7a) and 3.3.7.b) above).
28
3.3.9) Non-current assets and liabilities held for sale and discontinued operations
The Group classifies a non-current asset (or group of assets) as held for sale if the carrying amount of the asset(s) and associated liabilities will be recovered through a sale transaction rather than through continuing use. This condition is regarded as met only when the sale is highly probable and the asset is available for immediate sale in its present condition. The sale should be expected to be completed within one year from the date of classification.
These assets or group of assets are presented at the lower of carrying amount and fair value less costs to sell and are not depreciated as long as they are classified as held for sale or form part of a group of assets classified as held for sale.
In addition, the Group classifies as discontinued operations any component (a cash-generating unit or a group of cash-generating units) that represents a separate major line of business or geographical area of operations, or has been sold or disposed of by other means, or that qualifies for classification as held for sale.
Non-current assets held for sale are presented in the consolidated balance sheet separately from other assets under the heading “Non-current assets held for sale,” while the liabilities associated with assets qualifying for this classification are presented under “Liabilities related to non-current assets held for sale” described in the previous paragraphs The after-tax profits or losses generated by discontinued operations are presented in a single heading “Net income for the year from discontinued operations”.
3.3.10) Impairment of property, plant and equipment, intangible assets and
goodwill
In order to ascertain whether its assets have become impaired, the Group compares their carrying amount with their recoverable amount at the balance sheet date (section 3.3.24 below), or more frequently if there are indications that the assets might have become impaired. For that purpose, assets are grouped into cash-generating units (CGUs), to the extent that such assets, when individually considered, do not generate cash inflows that are independent of the cash inflows from other assets or CGUs. The identification of an asset’s CGU implies the use of professional judgment.
To perform this test, goodwill acquired on a business combination is allocated among the cash-generating units or groups of cash-generating units (CGUs) that benefit from the synergies of the business combination and the recoverable amount thereof is estimated by discounting the estimated future cash flows of each unit.
Recoverable amount is the higher of fair value less costs to sell and value in use. In assessing value in use, the estimated future cash flows are discounted to their present value using a rate that reflects the weighted average cost of capital employed, which is different for each country and business.
If the recoverable amount of an asset (or a cash-generating unit) is estimated to be less than its carrying amount, the carrying amount of the asset (or the cash-generating unit) is reduced to its recoverable amount, and an impairment loss is recognized as an expense under “Impairment losses recognized and losses on disposal of non-current assets” in the consolidated income statement.
29
An impairment loss is recognized, first applied, as a reduction of the carrying amount of related goodwill allocated to the cash-generating unit. Any impairment losses in excess of the carrying amount of goodwill is then allocated to the assets comprising the CGU on a pro-rata basis of their carrying amount.
The basis for future depreciation or amortization will take into account the reduction in the value of the asset as a result of any accumulated impairment losses.
On the occurrence of new events, or changes in existing circumstances, which prove that an impairment loss recognized on a prior date could have disappeared or decreased, a new estimate of the recoverable value of the corresponding asset is developed, to determine whether it is applicable to reverse the impairment losses recognized in previous periods.
In the event of a reversal, the carrying amount of the asset (or the cash-generating unit) is increased to the revised estimate of its recoverable amount, so that the increased carrying amount does not exceed the carrying amount that would have been determined in case no impairment loss had been recognized for the asset (or the cash-generating unit) in prior years. A reversal of an impairment loss is recognized under “Income from reversal of impairment losses and gains on disposals of non-current assets” in the consolidated income statement. An impairment loss recognized for goodwill cannot be reversed in subsequent periods.
3.3.11) Current and non-current financial assets
The Group classifies its investments when they are initially recognized and reviews their classification at each balance sheet date. The assets are classified on the basis of the purpose for which they were acquired.
This category has, in turn, the following sub-categories:
a) Financial assets at fair value with changes through profit or loss
a.1) Financial assets held for trading: this category comprises derivatives not designated as hedging instruments.
a.2) Other financial assets at fair value with changes in profit and loss: this category comprises those financial assets acquired for trading or sale in the short-term which are not derivatives.
b) Financial assets available for sale
Financial assets available for sale are financial assets that have either been designated as available for sale or have not been classified in any other financial asset category.
c) Loans and receivables
There are non-derivative financial assets with fixed or determinable payments that are not quoted in an active market. They arise when the Group delivers goods or provides services or financing to a third party and are assets which it does not intend to sell immediately or in the near term.
30
d) Held to maturity investments
Held to maturity investments are financial assets with fixed or determinable payments and fixed maturity that the Group has the positive intention and ability to hold from the date of purchase to the date of maturity.
A financial asset is initially recognized at fair value (section 3.3.23 of this Note). Transaction costs that are directly attributable to the acquisition or issuance of a financial asset are capitalized upon initial recognition of the asset, except in relation to assets designated as financial assets at fair value through profit or loss.
Subsequent to initial recognition, all financial assets, except for “Loans and receivables” and “Held to maturity investments” are measured at fair value. Equity investments in unlisted companies whose fair value cannot be measured reliably are measured at cost.
In the case of “Other financial assets at fair value with changes in profit and loss,” gains and losses from changes in fair value are recognized in the net profit or loss for the year. In the case of “Financial assets available for sale,” the gains and losses from changes in fair value are recognized directly in equity until the asset is disposed of or it is determined that it has become impaired, at which time the cumulative gains or losses previously recognized in equity are recognized in the profit or loss for the year.
“Loans and receivables” and “Held to maturity investments” are measured at amortized cost, and the accrued interest income is recognized in profit or loss using the effective interest rate method.
An impairment loss on financial assets at amortized cost is recognized when there is objective evidence that the Group will not be capable of collecting all the related amounts under the original terms of the accounts receivable.
The amount of the impairment loss is recognized in the consolidated income statement as the difference between the carrying amount and the present value of the future cash flows discounted at the effective interest rate. The carrying amount of the asset is reduced through an allowance account.
If, in subsequent periods, the value of the financial asset is recovered, the previously recognized impairment loss shall be reversed. The reversal shall not exceed the carrying amount the financial asset prior to the initial recognition of the impairment loss. The amount of the reversal shall be recognized in the income statement for the period.
Finally, an account receivable is considered uncollectible when situations similar to the following occur: dissolution of a company, lack of assets with which to settle the debts or a legal ruling.
Financial assets are initially recognized at face value whenever the effect of not discounting the related cash flows is not significant. Subsequent measurement of these assets is also done at face value.
The Group derecognizes financial assets when the contractual rights to the cash flows from the financial asset expire or it transfers the financial asset and the transfer qualifies for derecognition.
31
3.3.12) Inventories
Inventories acquired for our own use are stated at the lower of cost and net realizable value. Cost (basically the average cost) includes acquisition costs (less trade discounts, rebates and other similar items), transformation and other costs which have been incurred in bringing the inventories to their present location and condition.
In the case of refinery products, the costs are allocated to income in proportion to the selling price of the related products (isomargin method) due to the existing difficulty to recognize the conversion costs of every product.
The Group assesses the net realizable value of the inventories at the end of each period and recognizes in income the appropriate valuation adjustment if the inventories are overstated. When the circumstances that previously caused the impairment no longer exist or when there is clear evidence of an increase in net realizable value because of changed economic circumstances, the amount of the write-down is reversed.
Net realizable value is the estimated selling price at year end less the estimated costs of completion and costs to be incurred in marketing, selling and distribution.
In the case of commodities and similar products, it is not necessary to write down their carrying amount below cost so long as management expects that the finished products in which they are to be incorporated will be sold above cost.
Commodities inventories acquired for trading are measured at fair value less costs to sell and changes in fair value are recognized in income. These transactions do not represent a significant volume of the Group's inventories (Note 13).
3.3.13) Cash and cash equivalents
Repsol YPF classifies under "Cash and cash equivalents" liquid financial assets, deposits or financial assets that can be converted into a known amount of cash within three months and that are subject to an insignificant risk of changes in value.
3.3.14) Earnings per share
Basic earnings per share are calculated by dividing the profit for the period attributable to equity holders of the parent by the weighted average number of ordinary shares outstanding during the period taking into account, where appropriate, any treasury shares held by the Group (Notes 15.1 and 15.4).
3.3.15) Financial liabilities
Financial liabilities are initially recognized at fair value less the transaction costs incurred. Except for derivatives, subsequent to initial recognition, the Group measures its financial liabilities at amortized cost, as none of its financial liabilities are classified as held-for-trading. Any difference between the financing received (net of transaction costs) and repayment value is recognised in the consolidated income statement over the life of the debt instrument in question, using the effective interest rate method.
32
Preference shares, which are detailed in Note 19 correspond to this liability category. They are initially recognized at fair value net of issuing costs and are subsequently measured at amortized cost, unless they form part of a hedging transaction in which case the criteria set forth in section 3.3.23. of this Note applies.
Trade payables and other payables are financial liabilities which do not bear explicit interest and which, are recognized at face value, when the effect of not discounting them is not material.
The Group derecognizes financial liabilities when the obligations are cancelled or expire.
3.3.16) Provisions
In accordance with prevailing accounting standards, the Group makes a distinction between:
a) Provisions: present obligations, either legal or assumed by the Group, arising from past events, the settlement of which is expected to give rise to an outflow of resources the amount and timing of which are uncertain; and
b) Contingent liabilities: possible obligations that arise from past events and whose existence will be confirmed only by the occurrence or non-occurrence of one or more future events not wholly within the control of the Group, or present obligations arising from past events, the amount of which cannot be measured with sufficient reliability or whose cancellation is not likely to give rise to an outflow of resources embodying future economic benefits.
These provisions are recognized when the liability or obligation giving rise to the indemnity or payment arises, to the extent that its amount can be reliably estimated and it is probable that the commitment will have to be settled.
When a contract qualifies as onerous, the related present liabilities are recognized in the consolidated financial statements as provisions.
Contingent liabilities are not recognized in the consolidated financial statements. Notwithstanding the above, whenever it is deemed possible that settlement of such a liability will give rise to an outflow of resources, the existence of these liabilities is disclosed (Note 34).
3.3.17) Pensions and other similar obligations
a) Defined contribution plans
Repsol YPF has recognized defined contribution pension plans for certain employee groups; directly or indirectly through Group subsidiary YPF and Gas Natural Fenosa (Note 18).
The annual cost of these plans is recognized under “Personnel expenses” in the consolidated income statement.
33
b) Defined benefit plans
Repsol YPF’s defined benefit plans are mostly held through Gas Natural Fenosa. The benefits to which the employees are entitled at the date of their retirement are recognized in the income statement as follows:
i. The current service cost (the increase in the present value of the defined benefit obligation resulting from employee service in the current period), under “Personnel expenses.”
ii. The interest cost (the increase during a period in the present value of a defined benefit obligation which arises because the benefits are one period closer to settlement), under “Financial costs.”
iii. The return on plan assets and changes in the value thereof, less any costs of administering the plan and less any tax payable by the plan itself, under “Financial costs.”
The liability recognized with respect to defined contribution pension plans is the present value of the obligation at the balance sheet date less the fair value of plan assets, net of adjustments for past service costs. The obligation under defined benefit plans is calculated annually by independent actuaries in accordance with the projected credit unit method.
Any actuarial gains or losses arising as a result of changes in the actuarial assumptions used are recognized directly in equity under the heading “Reserves.”
3.3.18) Government grants
a) Grants related to assets
These are grants related to non-current assets and are measured at either: (i) the amount granted or nominal value; or (ii) the fair value of the assets received, if they have been transferred for no consideration. They are classified as deferred income when it is certain that they will be received.
Among other grants, this heading includes the government grants received by Gas Natural Fenosa pursuant to the agreements in place with Spain’s Regional Governments for building power and gas infrastructure in towns and other gas and power related investments for which all the conditions established to them have been met; they are measured at the amount granted.
These grants are recognised in profit or loss on straight line basis over the useful life of the assets they are financing. The consolidated Financial Statements present the assets and the grants received separately.
b) Grants related to income
These are grants that become receivable by the entity and are recognised as income for the period in which they become receivable.
34
3.3.19) Deferred income
Deferred income relates mainly to income from the assignment of gas transmission pipeline usage rights, the income relating to the natural gas distribution network relocation to be borne by third parties and the net amounts received each year for new connections to the gas or power grids. This income is credited to income on a straight-line basis over the depreciation period of the related non-current assets, which ranges from 20 to 50 years.
This heading also includes the amounts associated with CO2 allowances received for no consideration (section 3.3.6 b) within this Note).
3.3.20) Leases
Determination of whether an arrangement is, or contains, a lease is based on the substance of the arrangement at inception date of whether the fulfillment of the arrangement is dependent on the use of a specific asset or assets or the arrangement conveys a right to use the asset.
In this category, a distinction can be drawn between:
a) Finance leases
Leases are classified as finance leases whenever the lessor transfers substantially all the risks and rewards of ownership to the lessee. The ownership of the asset may or may not be transferred at the end of the lease term.
When the consolidated companies act as the lessee in finance leases, they present the cost of the leased assets in the consolidated balance sheet, based on the nature of the leased asset, and, simultaneously, recognise a financial liability for the same amount, which will be the lower of the fair value of the leased or the fair value of non-contingent amounts and not related to the provision of services payable to the lessor including, where appropriate, the price of exercising the purchase option, when the exercise thereof is expected with certainty at the beginning of the lease. These assets are depreciated according to criteria applied to the items of property, plant and equipment that are owned or are depreciated over the lease term, whichever is lower, provided there is no reasonable certainty that the lessee shall be granted the ownership at the end of the lease term.
The finance cost derived from the discounted financial liability is allocated to the periods during the lease term through use of a constant interest rate on the remaining financial liability. The resulting finance expense is charged to the heading “Financial result” in the consolidated income statement.
b) Operating leases
Leases in which the ownership of the leased asset and substantially all the risks and rewards incidental to ownership of the leased assets remain with the lessor are classified as operating leases.
35
Lease costs are recognized under “Other operating expense” in the consolidated income statement as incurred.
When the Group acts as lessor, the resulting income is recognized under “Other operating income” in the consolidated income statement, as accrued.
3.3.21) Income tax
Repsol YPF recognizes in the income statement for the year the accrued tax on the companies’ income, which is calculated taking into account the differences between the timing of recognition for accounting purposes and tax purposes of the transactions and other events in the current year recognized in the financial statements, giving rise to temporary differences and, therefore, to the recognition of certain deferred tax assets and liabilities in the balance sheet. These amounts are recognized by applying to the temporary differences the tax rate that is expected to apply in the period when the asset is realized or the liability is settled.
Deferred tax liabilities are recognized for all taxable temporary differences, unless the temporary difference arises from the initial recognition of goodwill for which amortization is not deductible for tax purposes or unless the exception to the deferred tax liabilities is applicable in cases of taxable temporary differences related to investments in subsidiaries, branches and associates.
Deferred tax assets recognized for temporary differences and other deferred tax assets (tax losses and tax deductions carry forwards) are recognized when it is considered probable that the consolidated companies will have sufficient taxable profits in the future against which the deferred tax asset can be utilized. Additionally, deferred tax assets recognized for temporary differences can only be recorded to the extent that they will reverse in the near future.
The accrued income tax expense includes both the deferred income tax expense and the current income tax expense, which is taken to be the amount payable (or refundable) in relation to the taxable net income for the year (see Note 24).
“Income tax” in the accompanying consolidated income statement includes both the accrued income tax expense and the net provisions recognized in the year for income tax contingencies.
3.3.22) Revenue and expense recognition
Revenues are measured at the fair value of the consideration received or receivable and represents the amounts receivable for the goods and services provided in the normal course of business, net of discounts and any amounts received on account of third parties, such as the Valued Added Tax.
In sales in which the Group acts as agent, the Group does not recognize all the income and expenses associated with the transaction, recognizing as revenue only the margin received or pending to receive.
36
In order to minimize transport costs and optimize the Group's logistics chain, the Group arranges oil product swaps with other companies in a number of geographical locations. The related agreements include clauses to adjust through an amount of economic consideration the value of the products swapped on the basis of the technical specifications thereof and the delivery and receiving points for the goods. These transactions are not recognized in the income statement as separate purchases and sales.
Sales of goods are recognized when substantially all the risks and rewards have been transferred. Revenue associated with the rendering of services is also recognized by reference to the stage of completion of the transaction at the balance sheet date, provided the outcome of the transaction can be estimated reliably. Interest income is accrued on a time proportion basis, by reference to the principal outstanding and the effective interest rate applicable. Dividend income from investments is recognized when the shareholders’ rights to receive payment have been established.
An expense is recognized when there is a reduction of an asset, or an increase in a liability, which can be measured reliably.
As a result of the legislation on oil and gas retailing in force in the countries in which the Group operates, Repsol YPF reflects as both revenue and expenses the excise and analogous duties levied specifically on consumption related to the production and/or sale of oil and gas products.
Transactions between Group companies and between reportable segments are carried out on an arm's length basis. These transactions give rise to income, expenses and profits which are eliminated on consolidation.
Work relating to water management, atmospheric protection, waste management, remediation of soil and subsoil water and the development of environmental management systems are deemed to be environmental expenses and they are recognized for accounting purposes in accordance with the criteria indicated above.
3.3.23) Financial derivatives
The Group arranges derivatives to hedge its exposure to financial and commercial risks due to interest rate and exchange rate fluctuations and to changes in the prices of certain commodities. All financial derivative instruments are initially recognized at fair value at the contract date and are subsequently measured at fair value. The derivatives are recognized as an asset when their fair value is positive and as a liability when it is negative. The differences in fair value are recognized in the income statement, except for specific hedge accounting treatment, where applicable.
For the assessment of financial derivative instruments, in case these are available, quotation market prices at the close of the balance sheet are used. This is the case of the futures contracts.
37
In the absence of quotation market prices for financial derivative instruments contracted, their fair value is estimated discounting the associated future cash flows according to the interest, exchange rates, credit differentials, volatility, and forward price trends in force on the close of the balance sheet. This assessment method has been applied to the following instruments:
- Mixed currency and interest swaps
- Interest rate swaps
- Forward exchange rate contracts
- Swaps on crude oil prices and products
- Interest rate options
Although the Group applies common assessment market techniques, some changes in the measurement models or in the hypotheses applied therein could lead to different assessments of said instruments than these recognized in the balance sheet, income statement and/or equity.
The Group designates certain derivatives as:
a) Fair value hedges
These are hedges of the exposure to changes in the fair value of an asset or a liability recognized for accounting purposes, an unrecognized firm commitment or an identified portion of the aforementioned asset, liability or firm commitment that can be attributed to a particular risk and might affect the profit for the period.
The changes in the fair value of hedging derivatives that are designated as effective fair value hedges are recognized in the income statement, together with any change in the fair value of the hedged items attributable to the hedged risk.
b) Cash flow hedges
These are hedges of the exposure to changes in cash flows that: (i) are attributed to a particular risk associated with a recognized asset or liability or a highly probable forecasted transaction and that (ii) could affect profit or loss for the year.
The effective portion of changes in the fair value of hedging instruments is recognized in equity. The gain or loss relating to the ineffective portion is recognized in the income statement. The cumulative gains or losses recognized in equity are transferred to net profit or loss for the year, in the period in which the hedged items affect the income statement.
c) Hedges of net investment
These are hedges of the exposure to foreign exchange rate changes in relation to investments in the net assets of foreign operations.
38
Hedges of net investments in a foreign operation are accounted for in a similar way to cash flow hedges, although the exchange rate differences resulting from these transactions are recognized in “Translation differences” under equity in the accompanying consolidated balance sheet.
The cumulative amount of the exchange differences are derecognized from equity, and recognized in the income statement, when the foreign operation is sold or disposed of in any other way.
For the three types of hedges described above, the Group documents at the inception of the transaction the hedging relationship between the hedging instrument and the hedged items, and the risk management objective and strategy for undertaking the hedge. The Group also documents their assessment, both at the inception of the hedge and subsequently. The derivatives used in hedging transactions are highly effective.
Hedge accounting is discontinued when the hedging instrument expires, is sold or exercised, or no longer qualifies for hedge accounting. At that time, any cumulative gain or loss on the hedging instrument recognized in equity is retained in equity until the forecasted transaction occurs.
Derivatives embedded in other financial instruments or other host contracts are treated as separate derivatives when their risks and characteristics are not closely related to those of the host contracts and the host contracts are not carried at fair value with unrealized gains or losses reported in the consolidated income statement.
Long-term oil and gas sale and purchase commitments are analyzed with the aim to determine whether these are in line with the provisions or marketing needs of the normal activity of the Group or whether, on the contrary, these are derivatives and should be recognized in accordance with the criteria set forth in IAS 39.
3.3.24) Methodology for estimating recoverable amount
The recoverable amount of assets is generally estimated on the basis of their value in use, calculated on the basis of future expected cash flows derived from the use of the assets.
In the assessment of the value in use, cash flow forecasts based on the best income and expense estimates available of the CGUs using sector forecasts, past results and future expectations of business evolution and market development are utilized. Among the most sensitive aspects included in the forecasts used in all the CGUs, the purchase and sale prices of hydrocarbons, inflation, employee costs and investments are highlighted.
The cash flows from the exploration and production assets are generally projected for a period that covers the economically productive useful lives of the oil and gas fields and is limited, by the contractual expiration of the operating permits, commitments or contracts. The estimated cash flows are based on production levels, commodity prices and estimates of the future investments that will be necessary in relation to undeveloped oil and gas reserves, production costs, field decline rates, market supply and demand, contractual conditions and other factors. The unproved reserves are weighted with risk factors, on the basis of the type of each one of the exploration and production assets.
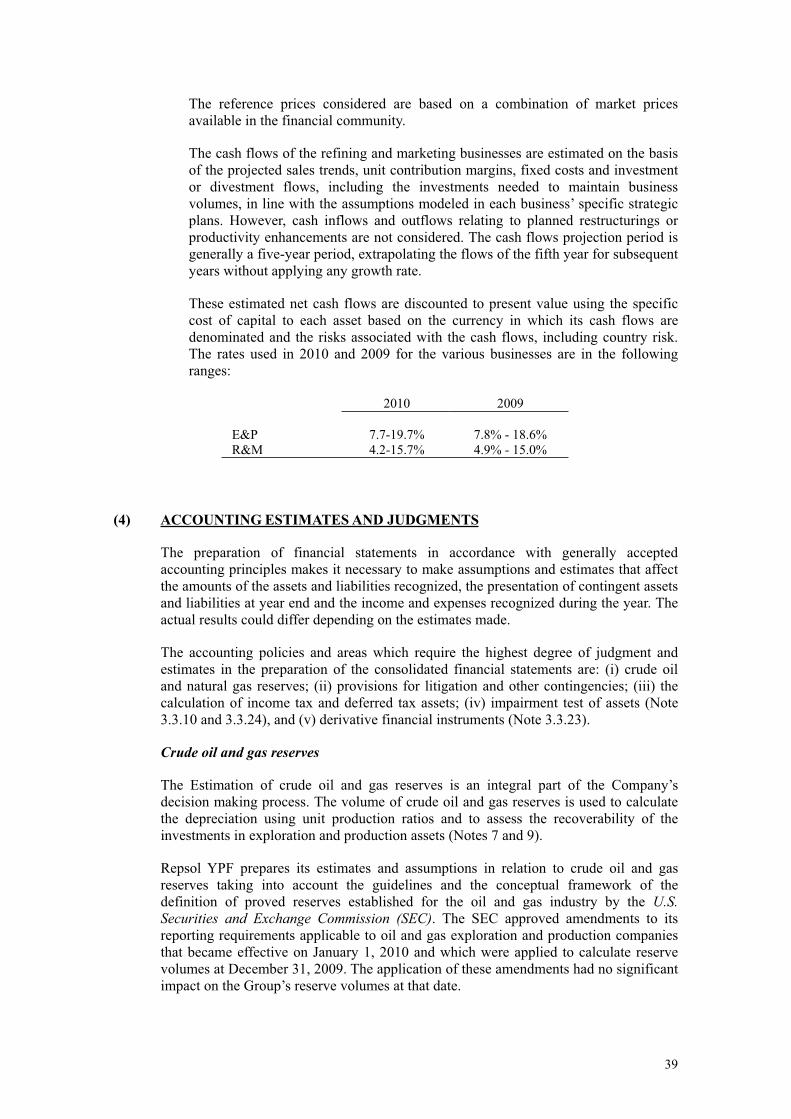
39
The reference prices considered are based on a combination of market prices available in the financial community.
The cash flows of the refining and marketing businesses are estimated on the basis of the projected sales trends, unit contribution margins, fixed costs and investment or divestment flows, including the investments needed to maintain business volumes, in line with the assumptions modeled in each business’ specific strategic plans. However, cash inflows and outflows relating to planned restructurings or productivity enhancements are not considered. The cash flows projection period is generally a five-year period, extrapolating the flows of the fifth year for subsequent years without applying any growth rate.
These estimated net cash flows are discounted to present value using the specific cost of capital to each asset based on the currency in which its cash flows are denominated and the risks associated with the cash flows, including country risk. The rates used in 2010 and 2009 for the various businesses are in the following ranges:
2010 2009
E&P 7.7-19.7% 7.8% - 18.6% R&M 4.2-15.7% 4.9% - 15.0%
(4) ACCOUNTING ESTIMATES AND JUDGMENTS
The preparation of financial statements in accordance with generally accepted accounting principles makes it necessary to make assumptions and estimates that affect the amounts of the assets and liabilities recognized, the presentation of contingent assets and liabilities at year end and the income and expenses recognized during the year. The actual results could differ depending on the estimates made.
The accounting policies and areas which require the highest degree of judgment and estimates in the preparation of the consolidated financial statements are: (i) crude oil and natural gas reserves; (ii) provisions for litigation and other contingencies; (iii) the calculation of income tax and deferred tax assets; (iv) impairment test of assets (Note 3.3.10 and 3.3.24), and (v) derivative financial instruments (Note 3.3.23).
Crude oil and gas reserves
The Estimation of crude oil and gas reserves is an integral part of the Company’s decision making process. The volume of crude oil and gas reserves is used to calculate the depreciation using unit production ratios and to assess the recoverability of the investments in exploration and production assets (Notes 7 and 9).
Repsol YPF prepares its estimates and assumptions in relation to crude oil and gas reserves taking into account the guidelines and the conceptual framework of the definition of proved reserves established for the oil and gas industry by the U.S.Securities and Exchange Commission (SEC). The SEC approved amendments to its reporting requirements applicable to oil and gas exploration and production companies that became effective on January 1, 2010 and which were applied to calculate reserve volumes at December 31, 2009. The application of these amendments had no significant impact on the Group’s reserve volumes at that date.
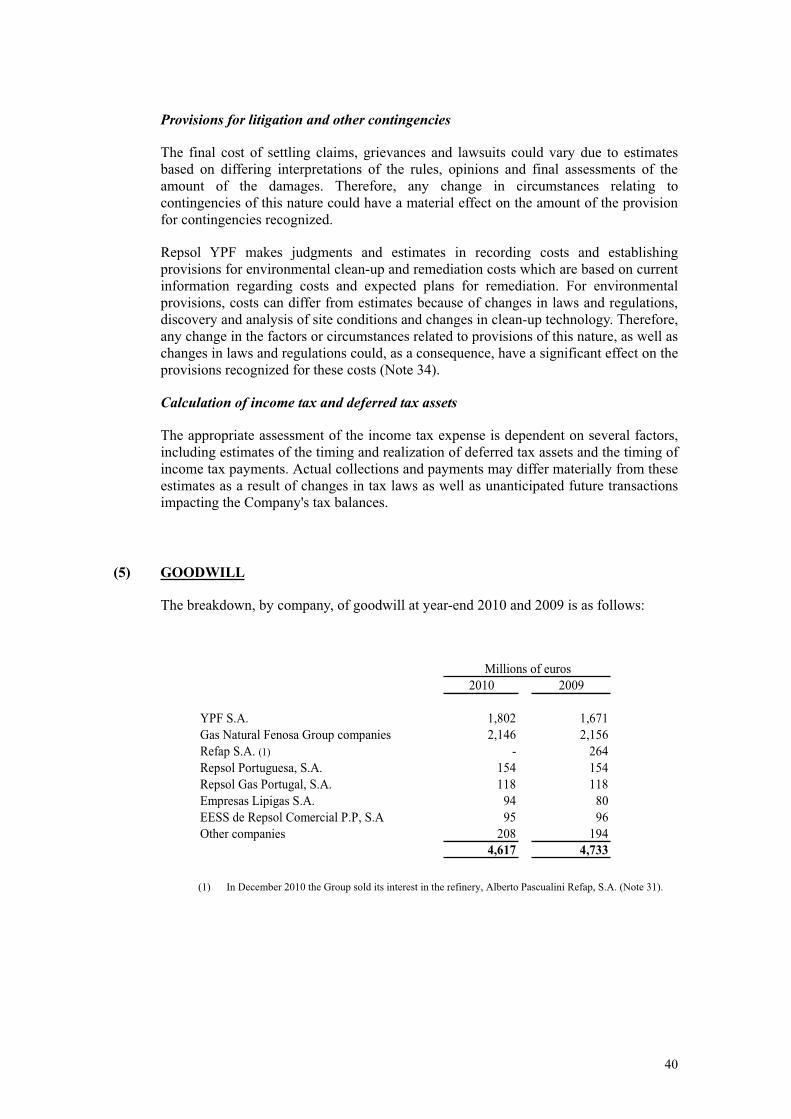
40
Provisions for litigation and other contingencies
The final cost of settling claims, grievances and lawsuits could vary due to estimates based on differing interpretations of the rules, opinions and final assessments of the amount of the damages. Therefore, any change in circumstances relating to contingencies of this nature could have a material effect on the amount of the provision for contingencies recognized.
Repsol YPF makes judgments and estimates in recording costs and establishing provisions for environmental clean-up and remediation costs which are based on current information regarding costs and expected plans for remediation. For environmental provisions, costs can differ from estimates because of changes in laws and regulations, discovery and analysis of site conditions and changes in clean-up technology. Therefore, any change in the factors or circumstances related to provisions of this nature, as well as changes in laws and regulations could, as a consequence, have a significant effect on the provisions recognized for these costs (Note 34).
Calculation of income tax and deferred tax assets
The appropriate assessment of the income tax expense is dependent on several factors, including estimates of the timing and realization of deferred tax assets and the timing of income tax payments. Actual collections and payments may differ materially from these estimates as a result of changes in tax laws as well as unanticipated future transactions impacting the Company's tax balances.
(5) GOODWILL
The breakdown, by company, of goodwill at year-end 2010 and 2009 is as follows:
Millions of euros2010 2009
YPF S.A. 1,802 1,671Gas Natural Fenosa Group companies 2,146 2,156Refap S.A. (1) - 264Repsol Portuguesa, S.A. 154 154Repsol Gas Portugal, S.A. 118 118Empresas Lipigas S.A. 94 80EESS de Repsol Comercial P.P, S.A 95 96Other companies 208 194
4,617 4,733
(1) In December 2010 the Group sold its interest in the refinery, Alberto Pascualini Refap, S.A. (Note 31).
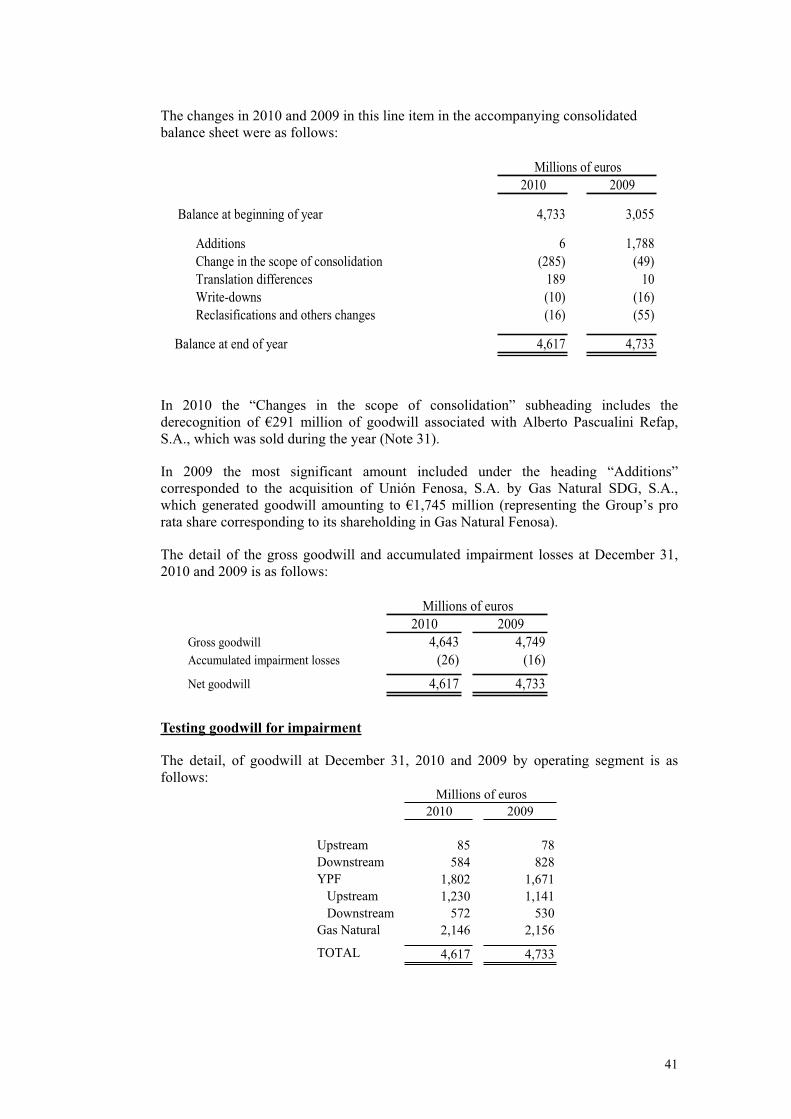
41
The changes in 2010 and 2009 in this line item in the accompanying consolidated balance sheet were as follows:
Millions of euros2010 2009
Balance at beginning of year 4,733 3,055
Additions 6 1,788Change in the scope of consolidation (285) (49)Translation differences 189 10Write-downs (10) (16)Reclasifications and others changes (16) (55)
Balance at end of year 4,617 4,733
In 2010 the “Changes in the scope of consolidation” subheading includes the derecognition of €291 million of goodwill associated with Alberto Pascualini Refap, S.A., which was sold during the year (Note 31).
In 2009 the most significant amount included under the heading “Additions” corresponded to the acquisition of Unión Fenosa, S.A. by Gas Natural SDG, S.A., which generated goodwill amounting to €1,745 million (representing the Group’s pro rata share corresponding to its shareholding in Gas Natural Fenosa).
The detail of the gross goodwill and accumulated impairment losses at December 31, 2010 and 2009 is as follows:
2010 2009Gross goodwill 4,643 4,749Accumulated impairment losses (26) (16)Net goodwill 4,617 4,733
Millions of euros
Testing goodwill for impairment
The detail, of goodwill at December 31, 2010 and 2009 by operating segment is as follows:
2010 2009
Upstream 85 78Downstream 584 828YPF 1,802 1,671 Upstream 1,230 1,141 Downstream 572 530Gas Natural 2,146 2,156
TOTAL 4,617 4,733
Millions of euros
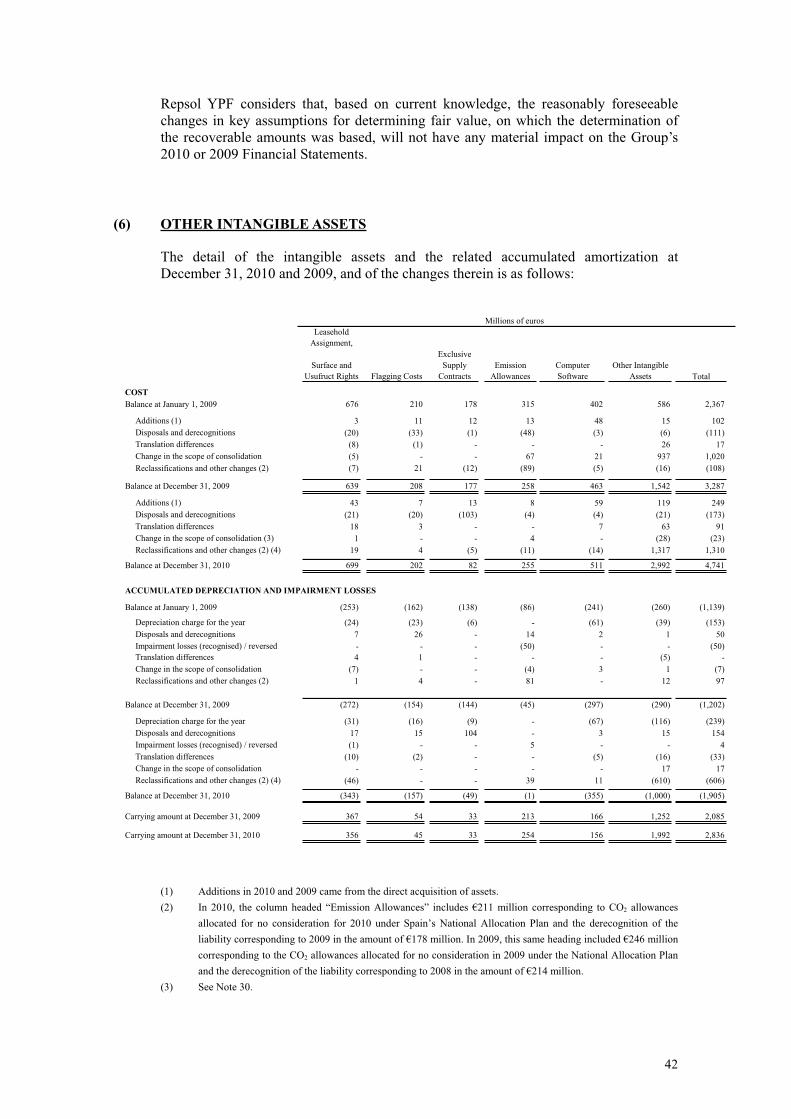
42
Repsol YPF considers that, based on current knowledge, the reasonably foreseeable changes in key assumptions for determining fair value, on which the determination of the recoverable amounts was based, will not have any material impact on the Group’s 2010 or 2009 Financial Statements.
(6) OTHER INTANGIBLE ASSETS
The detail of the intangible assets and the related accumulated amortization at December 31, 2010 and 2009, and of the changes therein is as follows:
Leasehold Assignment,
Surface and Usufruct Rights Flagging Costs
Exclusive Supply
ContractsEmission
AllowancesComputer Software
Other Intangible Assets Total
COSTBalance at January 1, 2009 676 210 178 315 402 586 2,367
Additions (1) 3 11 12 13 48 15 102Disposals and derecognitions (20) (33) (1) (48) (3) (6) (111)Translation differences (8) (1) - - - 26 17Change in the scope of consolidation (5) - - 67 21 937 1,020Reclassifications and other changes (2) (7) 21 (12) (89) (5) (16) (108)
Balance at December 31, 2009 639 208 177 258 463 1,542 3,287
Additions (1) 43 7 13 8 59 119 249Disposals and derecognitions (21) (20) (103) (4) (4) (21) (173)Translation differences 18 3 - - 7 63 91Change in the scope of consolidation (3) 1 - - 4 - (28) (23)Reclassifications and other changes (2) (4) 19 4 (5) (11) (14) 1,317 1,310
Balance at December 31, 2010 699 202 82 255 511 2,992 4,741
ACCUMULATED DEPRECIATION AND IMPAIRMENT LOSSES
Balance at January 1, 2009 (253) (162) (138) (86) (241) (260) (1,139)
Depreciation charge for the year (24) (23) (6) - (61) (39) (153)Disposals and derecognitions 7 26 - 14 2 1 50Impairment losses (recognised) / reversed - - - (50) - - (50)Translation differences 4 1 - - - (5) -Change in the scope of consolidation (7) - - (4) 3 1 (7)Reclassifications and other changes (2) 1 4 - 81 - 12 97
Balance at December 31, 2009 (272) (154) (144) (45) (297) (290) (1,202)
Depreciation charge for the year (31) (16) (9) - (67) (116) (239)Disposals and derecognitions 17 15 104 - 3 15 154Impairment losses (recognised) / reversed (1) - - 5 - - 4Translation differences (10) (2) - - (5) (16) (33)Change in the scope of consolidation - - - - - 17 17Reclassifications and other changes (2) (4) (46) - - 39 11 (610) (606)
Balance at December 31, 2010 (343) (157) (49) (1) (355) (1,000) (1,905)
Carrying amount at December 31, 2009 367 54 33 213 166 1,252 2,085
Carrying amount at December 31, 2010 356 45 33 254 156 1,992 2,836
Millions of euros
(1) Additions in 2010 and 2009 came from the direct acquisition of assets.(2) In 2010, the column headed “Emission Allowances” includes €211 million corresponding to CO2 allowances
allocated for no consideration for 2010 under Spain’s National Allocation Plan and the derecognition of the liability corresponding to 2009 in the amount of €178 million. In 2009, this same heading included €246 million corresponding to the CO2 allowances allocated for no consideration in 2009 under the National Allocation Plan and the derecognition of the liability corresponding to 2008 in the amount of €214 million.
(3) See Note 30.
43
(4) The column headed “Other Intangible Assets” primarily reflects a reclassification of assets pertaining to service concession arrangements in the net amount of €463 million (€989 million of cost net of accumulated amortization in the amount of €524 million) from “Property, plant and equipment” (€519 million) and “Grants” (€56 million).
“Other intangible assets” primarily includes:
a) Gas supply contracts and other contractual rights acquired as a result of the business combination between Gas Natural and Unión Fenosa, in the amount of €625 million in 2010 and €660 million in 2009.
b) Assets in the amount of €626 million at year-end 2010 related to service concession arrangements under which the operator has the right to charge an established tariff to the services users, although the competent authorities regulate or control either the tariffs or the users to which service must be provided; moreover, the state retains the residual interest in the assets at the end of the term of the arrangement (Note 3.3.1).
These assets correspond primarily to transport concession agreements covering oil, gas and derivative products in Argentina, obtained as a result of application of the Privatization Law (Note 2), as well as concession agreements under which Gas Natural Fenosa participates in the gas transport and distribution businesses in Argentina, Brazil and Italy and in the power generation business in Costa Rica. The terms of these concessions range from 11 to 35 years and can be extended for additional terms ranging from 10 to 30 years. At the end of the concessions terms, the assets attached to the concessions revert to the corresponding governments and do not give rise to any collection rights whatsoever on the part of YPF or Gas Natural Fenosa.
In 2010 the Group recognized income and expenses incurred during construction phase of these assets in the amount of €21 million; these amounts are recognized under “Other operating income” and “Other operating expenses.”
c) The costs of acquiring interests in exploration permits in the amount of €282 million at December 31, 2010.
d) Power distribution concessions which the Group holds through the Gas Natural Fenosa Group in the amount of €242 million at year-end 2010 and €244 million at year-end 2009.
Intangible assets include €207 million of assets with indefinite useful lives at December 31, 2010 (€205 million at year-end 2009). These assets are not amortized but they are tested at least annually for impairment and relate primarily to the power distribution concessions held by the Group in Spain through Gas Natural Fenosa, as outlined above (Note 3.3.6 c).
The leasehold assignment, surface and usufruct rights, the reflagging costs and image rights, the exclusive supply contracts, as well as the administrative concessions and the costs of acquiring interests in exploration permits are legal rights whose ownership is conditioned upon the terms of the originating contract, as described in section 3.3.6 of Note 3.
At year-end 2010, intangible assets included €97 million of assets acquired under finance leases and related specifically to service station association rights.
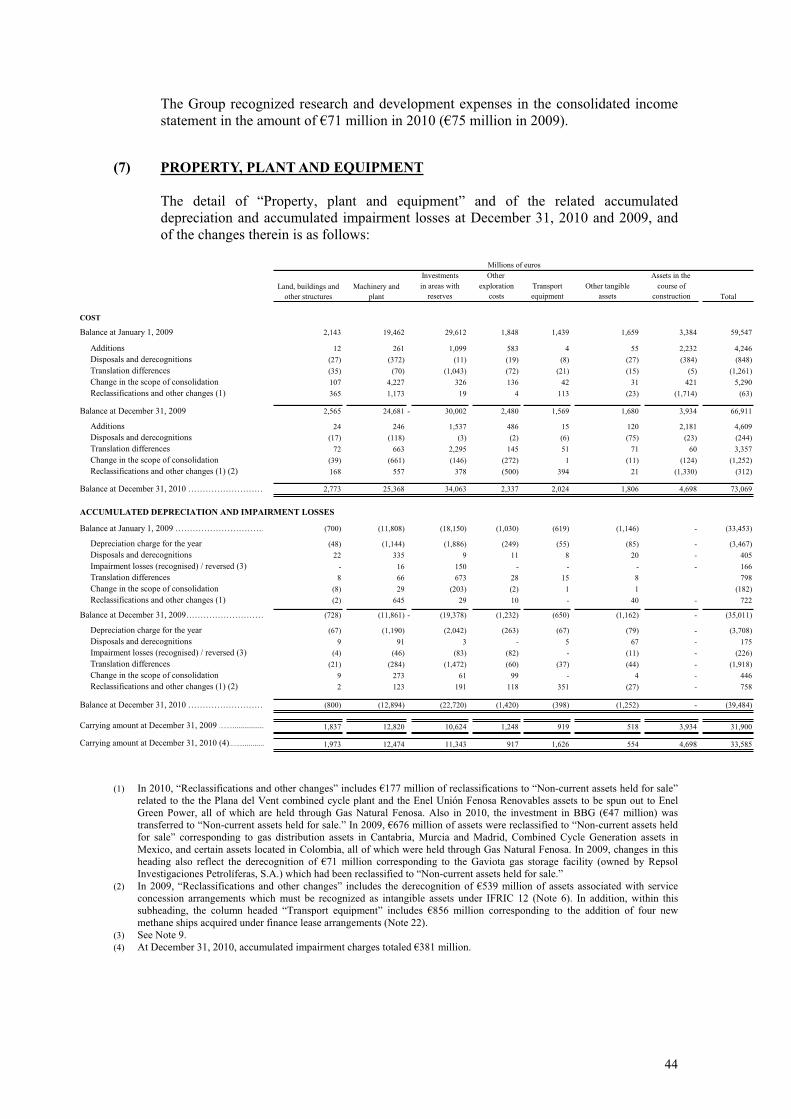
44
The Group recognized research and development expenses in the consolidated income statement in the amount of €71 million in 2010 (€75 million in 2009).
(7) PROPERTY, PLANT AND EQUIPMENT
The detail of “Property, plant and equipment” and of the related accumulated depreciation and accumulated impairment losses at December 31, 2010 and 2009, and of the changes therein is as follows:
Investments Other Assets in the in areas with
reservesexploration
costsTransport equipment
Other tangible assets
course of construction Total
COST
Balance at January 1, 2009 2,143 19,462 29,612 1,848 1,439 1,659 3,384 59,547
Additions 12 261 1,099 583 4 55 2,232 4,246Disposals and derecognitions (27) (372) (11) (19) (8) (27) (384) (848)Translation differences (35) (70) (1,043) (72) (21) (15) (5) (1,261)Change in the scope of consolidation 107 4,227 326 136 42 31 421 5,290Reclassifications and other changes (1) 365 1,173 19 4 113 (23) (1,714) (63)
Balance at December 31, 2009 2,565 24,681 - 30,002 2,480 1,569 1,680 3,934 66,911
Additions 24 246 1,537 486 15 120 2,181 4,609Disposals and derecognitions (17) (118) (3) (2) (6) (75) (23) (244)Translation differences 72 663 2,295 145 51 71 60 3,357Change in the scope of consolidation (39) (661) (146) (272) 1 (11) (124) (1,252)Reclassifications and other changes (1) (2) 168 557 378 (500) 394 21 (1,330) (312)
Balance at December 31, 2010 ……………………… 2,773 25,368 34,063 2,337 2,024 1,806 4,698 73,069
ACCUMULATED DEPRECIATION AND IMPAIRMENT LOSSES
Balance at January 1, 2009 …………………………… (700) (11,808) (18,150) (1,030) (619) (1,146) - (33,453)
Depreciation charge for the year (48) (1,144) (1,886) (249) (55) (85) - (3,467)Disposals and derecognitions 22 335 9 11 8 20 - 405Impairment losses (recognised) / reversed (3) - 16 150 - - - - 166Translation differences 8 66 673 28 15 8 798Change in the scope of consolidation (8) 29 (203) (2) 1 1 (182)Reclassifications and other changes (1) (2) 645 29 10 - 40 - 722
Balance at December 31, 2009……………………… (728) (11,861) - (19,378) (1,232) (650) (1,162) - (35,011)
Depreciation charge for the year (67) (1,190) (2,042) (263) (67) (79) - (3,708)Disposals and derecognitions 9 91 3 - 5 67 - 175Impairment losses (recognised) / reversed (3) (4) (46) (83) (82) - (11) - (226)Translation differences (21) (284) (1,472) (60) (37) (44) - (1,918)Change in the scope of consolidation 9 273 61 99 - 4 - 446Reclassifications and other changes (1) (2) 2 123 191 118 351 (27) - 758
Balance at December 31, 2010 ……………………… (800) (12,894) (22,720) (1,420) (398) (1,252) - (39,484)
Carrying amount at December 31, 2009 ......................... 1,837 12,820 10,624 1,248 919 518 3,934 31,900
Carrying amount at December 31, 2010 (4).................... 1,973 12,474 11,343 917 1,626 554 4,698 33,585
Millions of euros
Land, buildings and other structures
Machinery and plant
(1) In 2010, “Reclassifications and other changes” includes €177 million of reclassifications to “Non-current assets held for sale”related to the the Plana del Vent combined cycle plant and the Enel Unión Fenosa Renovables assets to be spun out to Enel Green Power, all of which are held through Gas Natural Fenosa. Also in 2010, the investment in BBG (€47 million) was transferred to “Non-current assets held for sale.” In 2009, €676 million of assets were reclassified to “Non-current assets heldfor sale” corresponding to gas distribution assets in Cantabria, Murcia and Madrid, Combined Cycle Generation assets in Mexico, and certain assets located in Colombia, all of which were held through Gas Natural Fenosa. In 2009, changes in this heading also reflect the derecognition of €71 million corresponding to the Gaviota gas storage facility (owned by Repsol Investigaciones Petrolíferas, S.A.) which had been reclassified to “Non-current assets held for sale.”
(2) In 2009, “Reclassifications and other changes” includes the derecognition of €539 million of assets associated with service concession arrangements which must be recognized as intangible assets under IFRIC 12 (Note 6). In addition, within this subheading, the column headed “Transport equipment” includes €856 million corresponding to the addition of four new methane ships acquired under finance lease arrangements (Note 22).
(3) See Note 9. (4) At December 31, 2010, accumulated impairment charges totaled €381 million.
45
In 2010, the main additions were made in Spain (€1,932 million), Argentina (€1,516 million), Brazil (€442 million), the rest of Central and South America (€465 million), Libya (€83 million), the United States (€63 million) and Canada (€49 million). In 2009 the main additions were made in Argentina (€896 million), the Unites States (€265 million), Brazil (€211 million), the rest of Central and South America (€226 million), Libya (€136 million), Canada (€111 million) and Spain (€2,162 million).
The amounts corresponding to non-depreciable assets, that is, land and assets in the course of construction, amount, respectively to €790 million and €4,698 million at December 31, 2010 and €763 million and €3,934 million at December 31, 2009, respectively. The amounts related to land are included within the heading ”Land, buildings and other structures” on the previous table.
Property, plant and equipment, included fully depreciated items for an amount of €11,533 million and €10,899 million at December 31, 2010 and 2009, respectively.
Repsol YPF capitalizes financial costs as part of the cost of the assets as described in section 3.3 of Note 3. In 2010 and 2009, the average capitalization cost was 3.76% and 4.52% and the amount of such financial expenses capitalized was €143 million and €122 million, respectively. Such amounts are recorded under the “Financial costs” line item in the consolidated income statement.
Within the heading “Property, plant and equipment” there are some investments carried out by the Group in public concessions, in an amount of €150 million and €122 million at December 31, 2010 and 2009, respectively; these concessions shall revert to the State within a term ranging from 2010 and 2054.
In 2010 and 2009 this heading includes €2,869 million and €2,024 million, respectively, of assets acquired under finance leases. Among the assets purchased under finance leases during these periods we highlight the methane ships purchased for the transport of the LNG in the amount of €1,561 million and €754 million in 2010 and 2009, respectively, as well as gas pipelines and other assets for the transport of natural gas in North America and Canada, which amounted to €1,287 million and €1,245 million December 31, 2010 and 2009, respectively (Note 22).
In accordance with industry practices, Repsol YPF insures its assets and operations worldwide. Among the risks insured are damages to property, plant and equipment, together with the subsequent interruptions in its business that such damages may cause. The Group believes that the current coverage level is, in general, appropriate for the risks inherent to its business.
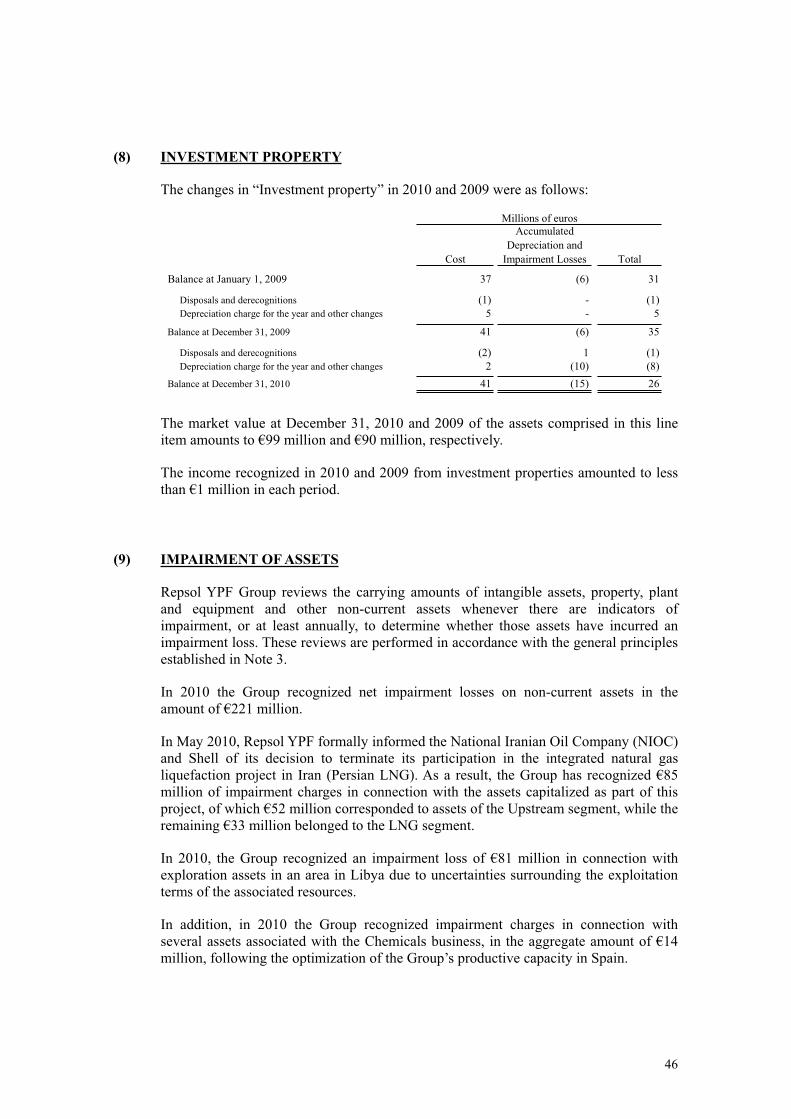
46
(8) INVESTMENT PROPERTY
The changes in “Investment property” in 2010 and 2009 were as follows:
Cost
Accumulated Depreciation and
Impairment Losses Total
Balance at January 1, 2009 37 (6) 31
Disposals and derecognitions (1) - (1)Depreciation charge for the year and other changes 5 - 5
Balance at December 31, 2009 41 (6) 35
Disposals and derecognitions (2) 1 (1)Depreciation charge for the year and other changes 2 (10) (8)
Balance at December 31, 2010 41 (15) 26
Millions of euros
The market value at December 31, 2010 and 2009 of the assets comprised in this line item amounts to €99 million and €90 million, respectively.
The income recognized in 2010 and 2009 from investment properties amounted to less than €1 million in each period.
(9) IMPAIRMENT OF ASSETS
Repsol YPF Group reviews the carrying amounts of intangible assets, property, plant and equipment and other non-current assets whenever there are indicators of impairment, or at least annually, to determine whether those assets have incurred an impairment loss. These reviews are performed in accordance with the general principles established in Note 3.
In 2010 the Group recognized net impairment losses on non-current assets in the amount of €221 million.
In May 2010, Repsol YPF formally informed the National Iranian Oil Company (NIOC) and Shell of its decision to terminate its participation in the integrated natural gas liquefaction project in Iran (Persian LNG). As a result, the Group has recognized €85 million of impairment charges in connection with the assets capitalized as part of this project, of which €52 million corresponded to assets of the Upstream segment, while the remaining €33 million belonged to the LNG segment.
In 2010, the Group recognized an impairment loss of €81 million in connection with exploration assets in an area in Libya due to uncertainties surrounding the exploitation terms of the associated resources.
In addition, in 2010 the Group recognized impairment charges in connection with several assets associated with the Chemicals business, in the aggregate amount of €14 million, following the optimization of the Group’s productive capacity in Spain.
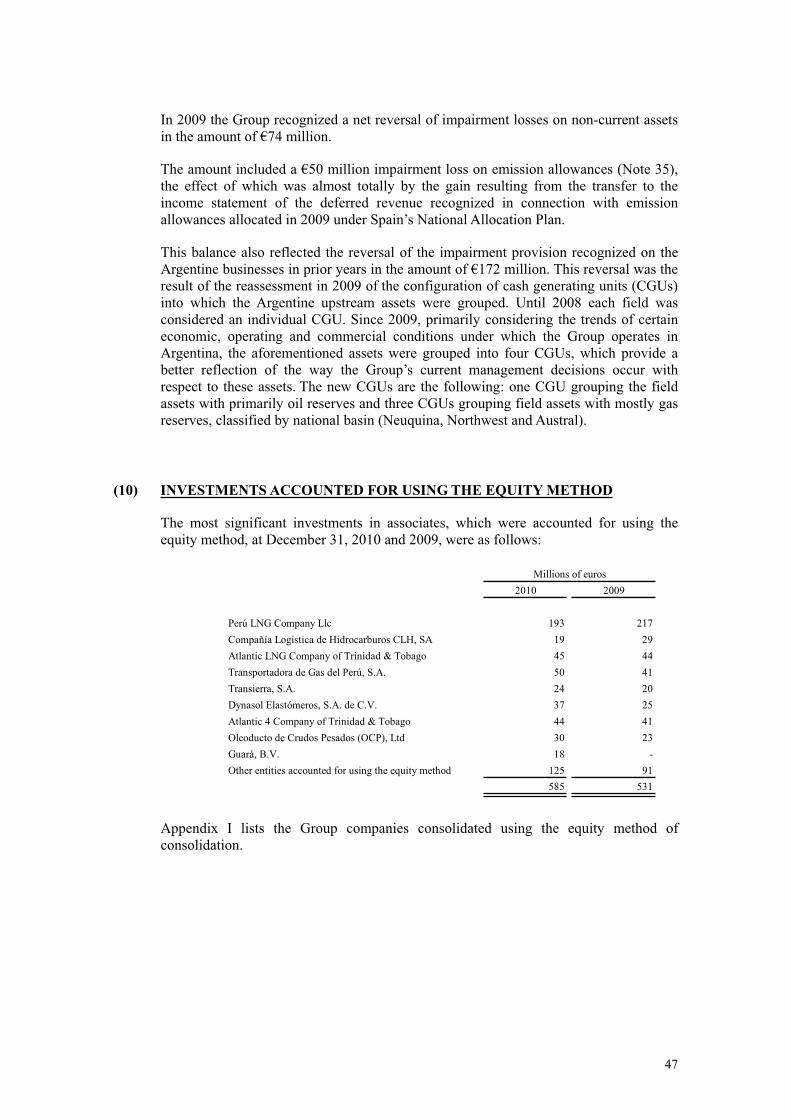
47
In 2009 the Group recognized a net reversal of impairment losses on non-current assets in the amount of €74 million.
The amount included a €50 million impairment loss on emission allowances (Note 35), the effect of which was almost totally by the gain resulting from the transfer to the income statement of the deferred revenue recognized in connection with emission allowances allocated in 2009 under Spain’s National Allocation Plan.
This balance also reflected the reversal of the impairment provision recognized on the Argentine businesses in prior years in the amount of €172 million. This reversal was the result of the reassessment in 2009 of the configuration of cash generating units (CGUs) into which the Argentine upstream assets were grouped. Until 2008 each field was considered an individual CGU. Since 2009, primarily considering the trends of certain economic, operating and commercial conditions under which the Group operates in Argentina, the aforementioned assets were grouped into four CGUs, which provide a better reflection of the way the Group’s current management decisions occur with respect to these assets. The new CGUs are the following: one CGU grouping the field assets with primarily oil reserves and three CGUs grouping field assets with mostly gas reserves, classified by national basin (Neuquina, Northwest and Austral).
(10) INVESTMENTS ACCOUNTED FOR USING THE EQUITY METHOD
The most significant investments in associates, which were accounted for using the equity method, at December 31, 2010 and 2009, were as follows:
2010 2009
Perú LNG Company Llc 193 217Compañía Logística de Hidrocarburos CLH, SA 19 29Atlantic LNG Company of Trinidad & Tobago 45 44Transportadora de Gas del Perú, S.A. 50 41Transierra, S.A. 24 20Dynasol Elastómeros, S.A. de C.V. 37 25Atlantic 4 Company of Trinidad & Tobago 44 41Oleoducto de Crudos Pesados (OCP), Ltd 30 23Guará, B.V. 18 -Other entities accounted for using the equity method 125 91
585 531
Millions of euros
Appendix I lists the Group companies consolidated using the equity method of consolidation.
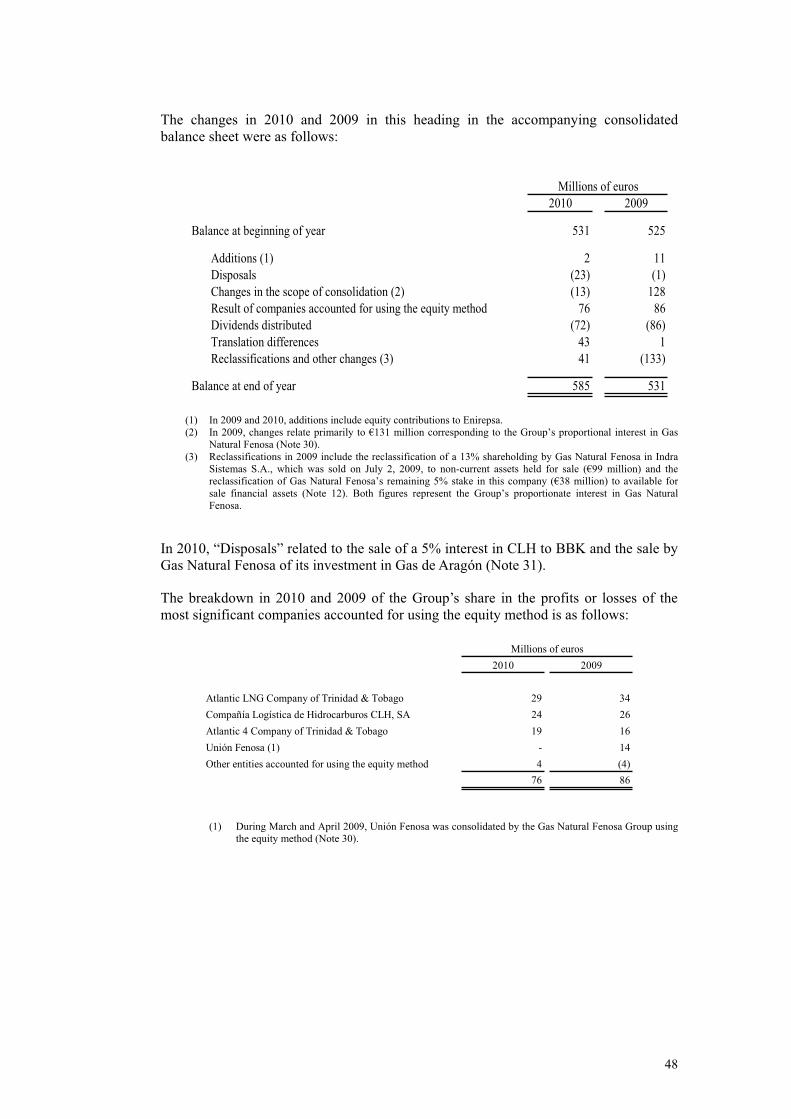
48
The changes in 2010 and 2009 in this heading in the accompanying consolidated balance sheet were as follows:
Millions of euros2010 2009
Balance at beginning of year 531 525
Additions (1) 2 11Disposals (23) (1)Changes in the scope of consolidation (2) (13) 128Result of companies accounted for using the equity method 76 86Dividends distributed (72) (86)Translation differences 43 1Reclassifications and other changes (3) 41 (133)
Balance at end of year 585 531
(1) In 2009 and 2010, additions include equity contributions to Enirepsa. (2) In 2009, changes relate primarily to €131 million corresponding to the Group’s proportional interest in Gas
Natural Fenosa (Note 30). (3) Reclassifications in 2009 include the reclassification of a 13% shareholding by Gas Natural Fenosa in Indra
Sistemas S.A., which was sold on July 2, 2009, to non-current assets held for sale (€99 million) and the reclassification of Gas Natural Fenosa’s remaining 5% stake in this company (€38 million) to available for sale financial assets (Note 12). Both figures represent the Group’s proportionate interest in Gas Natural Fenosa.
In 2010, “Disposals” related to the sale of a 5% interest in CLH to BBK and the sale by Gas Natural Fenosa of its investment in Gas de Aragón (Note 31).
The breakdown in 2010 and 2009 of the Group’s share in the profits or losses of the most significant companies accounted for using the equity method is as follows:
2010 2009
Atlantic LNG Company of Trinidad & Tobago 29 34Compañía Logística de Hidrocarburos CLH, SA 24 26Atlantic 4 Company of Trinidad & Tobago 19 16Unión Fenosa (1) - 14Other entities accounted for using the equity method 4 (4)
76 86
Millions of euros
(1) During March and April 2009, Unión Fenosa was consolidated by the Gas Natural Fenosa Group using the equity method (Note 30).
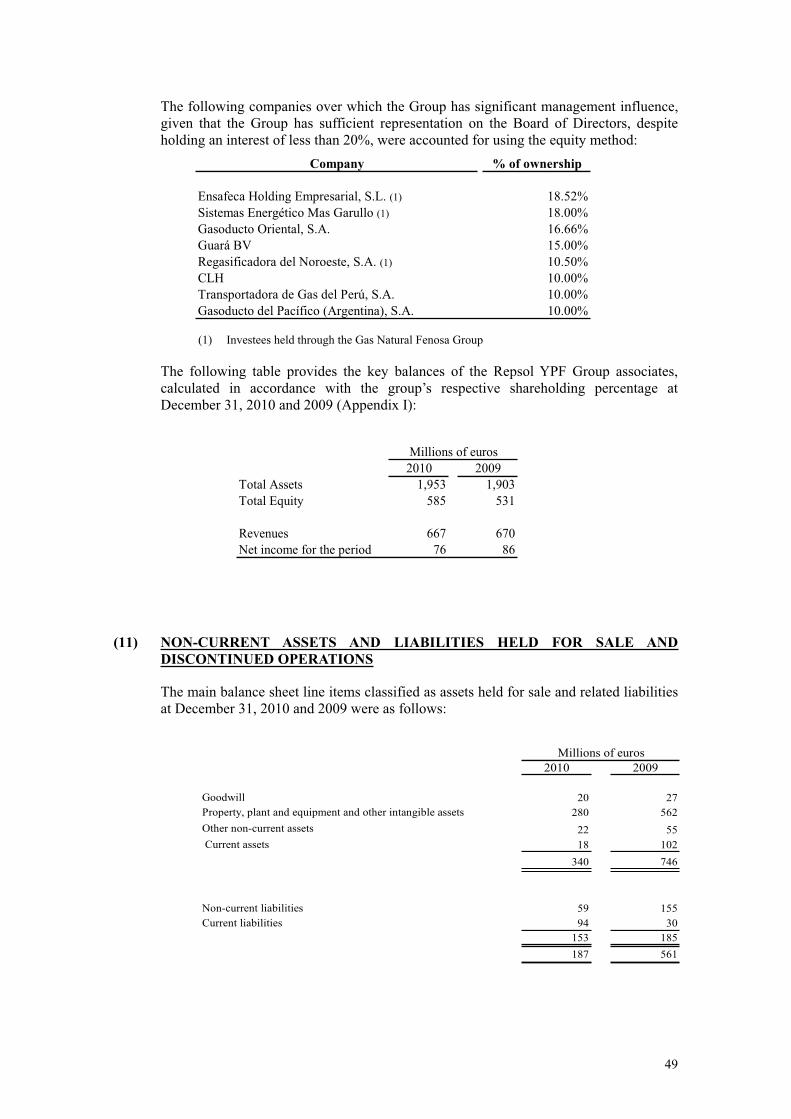
49
The following companies over which the Group has significant management influence, given that the Group has sufficient representation on the Board of Directors, despite holding an interest of less than 20%, were accounted for using the equity method:
Company % of ownership
Ensafeca Holding Empresarial, S.L. (1) 18.52%Sistemas Energético Mas Garullo (1) 18.00%Gasoducto Oriental, S.A. 16.66%Guará BV 15.00%Regasificadora del Noroeste, S.A. (1) 10.50%CLH 10.00%Transportadora de Gas del Perú, S.A. 10.00%Gasoducto del Pacífico (Argentina), S.A. 10.00%
(1) Investees held through the Gas Natural Fenosa Group
The following table provides the key balances of the Repsol YPF Group associates, calculated in accordance with the group’s respective shareholding percentage at December 31, 2010 and 2009 (Appendix I):
Millions of euros2010 2009
Total Assets 1,953 1,903Total Equity 585 531
Revenues 667 670Net income for the period 76 86
(11) NON-CURRENT ASSETS AND LIABILITIES HELD FOR SALE AND DISCONTINUED OPERATIONS
The main balance sheet line items classified as assets held for sale and related liabilities at December 31, 2010 and 2009 were as follows:
2010 2009
Goodwill 20 27Property, plant and equipment and other intangible assets 280 562Other non-current assets 22 55 Current assets 18 102
340 746
Non-current liabilities 59 155Current liabilities 94 30
153 185187 561
Millions of euros
50
In February 2010, the Group sold 100% of Termobarrancas and the exploration and exploitation license for the Barrancas area to PDVSA; at year-end 2009 the investment in this company was classified to this heading in light of the sale-purchase and cession agreements already entered into with PDVSA and PDVSA GAS, respectively. Upon closing this transaction, €132 million was derecognized from this heading.
On April 8, 2010, Repsol YPF and Enagás signed an agreement for the sale by Repsol YPF to Enagás of its 82% interest in the Gaviota underground storage facility for €87 million. Of this amount, €16 million is conditional upon ministerial approval to the facility’s capacity expansion plans. This transaction will close once all the necessary government and anti-trust authorities approvals have been secured; as a result, at December 31, 2010, this asset was classified as a non-current asset held for sale. In 2010 the Group received a €70 million advance payment on this sale; this amount was recognized under proceeds from disposals in the accompanying consolidated cash flow statement (Note 31).
In July 2010, Gas Natural Fenosa agreed to sell Grupo Alpiq the Plana de Vent 400MW combined cycle plant for a total of €60 million (adjusted for Repsol YPF’s ownership interest in Gas Natural Fenosa). In addition, Alpiq will acquire an exclusive usage and operating right over another 400 MW facility for a two-year term. At the end of this term, Alpiq will have the right to purchase the facility for a total of €59 million (adjusted for Repsol YPF’s’s ownership interest in Gas Natural Fenosa), in line with the market value of this option. This transaction falls under the scope of the commitments assumed by Gas Natural Fenosa with Spain’s anti-trust authority (CNC), when it acquired Unión Fenosa and the close is subject to obtaining the usual authorizations. Since June 30, 2010, the assets for which the sale was agreed, have classified as non-current assets held for sale.
In August 2010, Gas Natural Fenosa and Enel Green Power agreed to terminate the renewable energy venture held by both parties until that time through Enel Unión Fenosa Renovables, S.A. (EUFER), a company in which each held a 50% interest. The agreement will result in each venturer receiving roughly half of EUFER’s assets. The transaction was approved on November 10, 2010 by the anti-trust authorities, leaving only the regulatory and government authorizations pending. The portion of the assets and liabilities recognized in Gas Natural Fenosa’s consolidated balance sheet to be spun out to Enel Green Power have been considered as non-current assets and liabilities held for sale.
In December 2009, Gas Natural Fenosa agreed the sale of its dual gas and power supply business in 38 Madrid municipalities. This business supplied residential customers, retail premises and small and medium companies (SMEs) from the the shared services structure in this region. This sale was closed in April 2010 once all the necessary permits had been obtained, resulting in the derecognition from this heading of €112 million of assets and €20 million of liabilities (proporcionate to Repsol YPF Group´s interest in Gas Natural Fenosa). (Note 31).
In December 2009, Gas Natural Fenosa agreed the sale of several combined cycle power generation operators in Mexico, with combined generating capacity of 2,233 MW, and the Gasoducto del Río gas pipeline. This sale was closed in June 2010 once all the necessary permits had been obtained from the Mexican authorities, resulting in the derecognition from this heading of €397 million of assets and €125 million of liabilities (proporcionate to Repsol YPF Group´s interest in Gas Natural Fenosa) (Note 31).
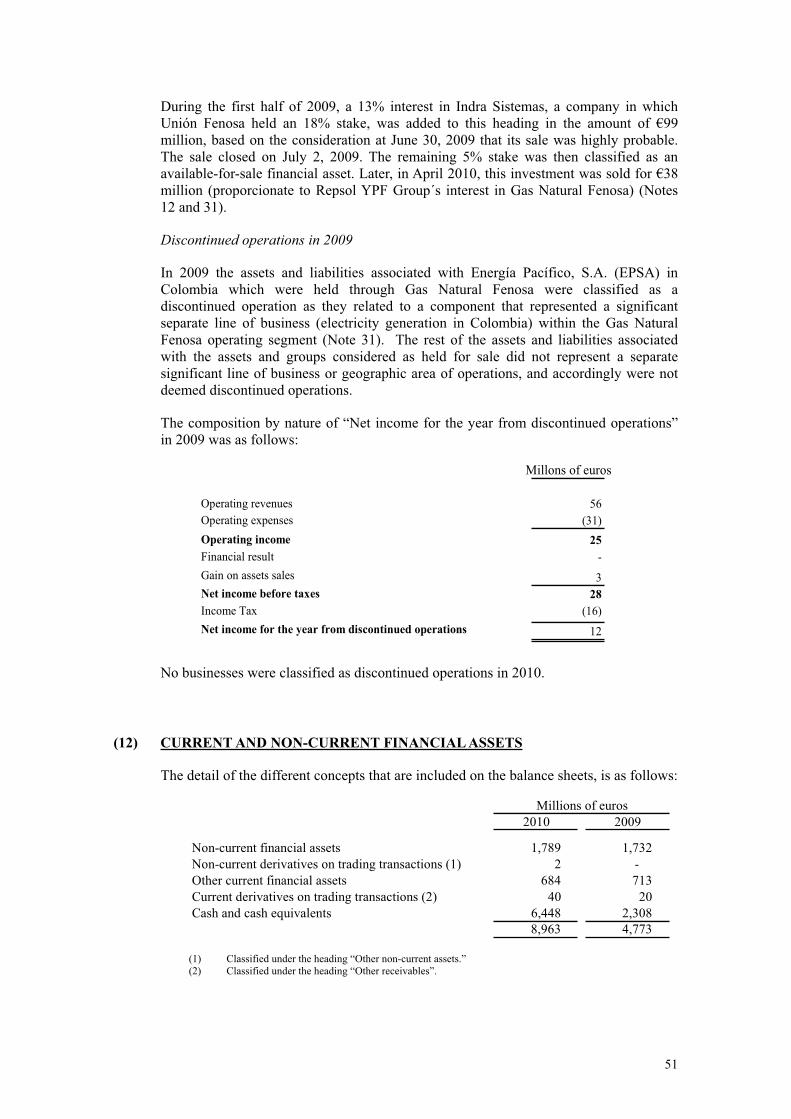
51
During the first half of 2009, a 13% interest in Indra Sistemas, a company in which Unión Fenosa held an 18% stake, was added to this heading in the amount of €99 million, based on the consideration at June 30, 2009 that its sale was highly probable. The sale closed on July 2, 2009. The remaining 5% stake was then classified as an available-for-sale financial asset. Later, in April 2010, this investment was sold for €38 million (proporcionate to Repsol YPF Group´s interest in Gas Natural Fenosa) (Notes 12 and 31).
Discontinued operations in 2009
In 2009 the assets and liabilities associated with Energía Pacífico, S.A. (EPSA) in Colombia which were held through Gas Natural Fenosa were classified as a discontinued operation as they related to a component that represented a significant separate line of business (electricity generation in Colombia) within the Gas Natural Fenosa operating segment (Note 31). The rest of the assets and liabilities associated with the assets and groups considered as held for sale did not represent a separate significant line of business or geographic area of operations, and accordingly were not deemed discontinued operations.
The composition by nature of “Net income for the year from discontinued operations” in 2009 was as follows:
Millons of euros
Operating revenues 56Operating expenses (31)Operating income 25Financial result -Gain on assets sales 3Net income before taxes 28Income Tax (16)Net income for the year from discontinued operations 12
No businesses were classified as discontinued operations in 2010.
(12) CURRENT AND NON-CURRENT FINANCIAL ASSETS
The detail of the different concepts that are included on the balance sheets, is as follows:
2010 2009
Non-current financial assets 1,789 1,732 Non-current derivatives on trading transactions (1) 2 - Other current financial assets 684 713 Current derivatives on trading transactions (2) 40 20 Cash and cash equivalents 6,448 2,308
8,963 4,773
Millions of euros
(1) Classified under the heading “Other non-current assets.” (2) Classified under the heading “Other receivables”.
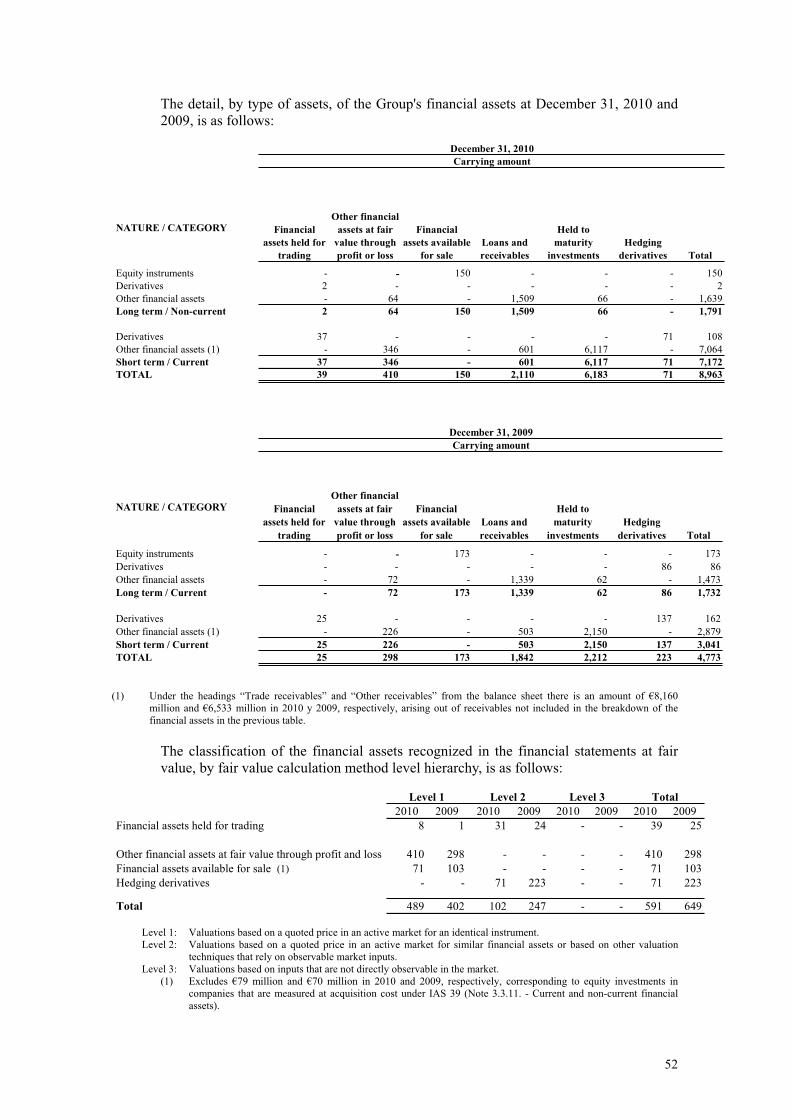
52
The detail, by type of assets, of the Group's financial assets at December 31, 2010 and 2009, is as follows:
NATURE / CATEGORY
Equity instruments - - 150 - - - 150Derivatives 2 - - - - - 2Other financial assets - 64 - 1,509 66 - 1,639Long term / Non-current 2 64 150 1,509 66 - 1,791
Derivatives 37 - - - - 71 108Other financial assets (1) - 346 - 601 6,117 - 7,064Short term / Current 37 346 - 601 6,117 71 7,172TOTAL 39 410 150 2,110 6,183 71 8,963
December 31, 2010Carrying amount
Held to maturity
investmentsHedging
derivatives Total
Financial assets held for
trading
Other financial assets at fair
value through profit or loss
Financial assets available
for saleLoans and receivables
NATURE / CATEGORY
Equity instruments - - 173 - - - 173Derivatives - - - - - 86 86Other financial assets - 72 - 1,339 62 - 1,473Long term / Current - 72 173 1,339 62 86 1,732
Derivatives 25 - - - - 137 162Other financial assets (1) - 226 - 503 2,150 - 2,879Short term / Current 25 226 - 503 2,150 137 3,041TOTAL 25 298 173 1,842 2,212 223 4,773
December 31, 2009Carrying amount
Held to maturity
investmentsHedging
derivatives Total
Financial assets held for
trading
Other financial assets at fair
value through profit or loss
Financial assets available
for saleLoans and receivables
(1) Under the headings “Trade receivables” and “Other receivables” from the balance sheet there is an amount of €8,160 million and €6,533 million in 2010 y 2009, respectively, arising out of receivables not included in the breakdown of the financial assets in the previous table.
The classification of the financial assets recognized in the financial statements at fair value, by fair value calculation method level hierarchy, is as follows:
2010 2009 2010 2009 2010 2009 2010 2009Financial assets held for trading 8 1 31 24 - - 39 25
Other financial assets at fair value through profit and loss 410 298 - - - - 410 298Financial assets available for sale (1) 71 103 - - - - 71 103Hedging derivatives - - 71 223 - - 71 223
Total 489 402 102 247 - - 591 649
Level 1 Level 2 Level 3 Total
Level 1: Valuations based on a quoted price in an active market for an identical instrument.Level 2: Valuations based on a quoted price in an active market for similar financial assets or based on other valuation
techniques that rely on observable market inputs.Level 3: Valuations based on inputs that are not directly observable in the market.
(1) Excludes €79 million and €70 million in 2010 and 2009, respectively, corresponding to equity investments in companies that are measured at acquisition cost under IAS 39 (Note 3.3.11. - Current and non-current financial assets).
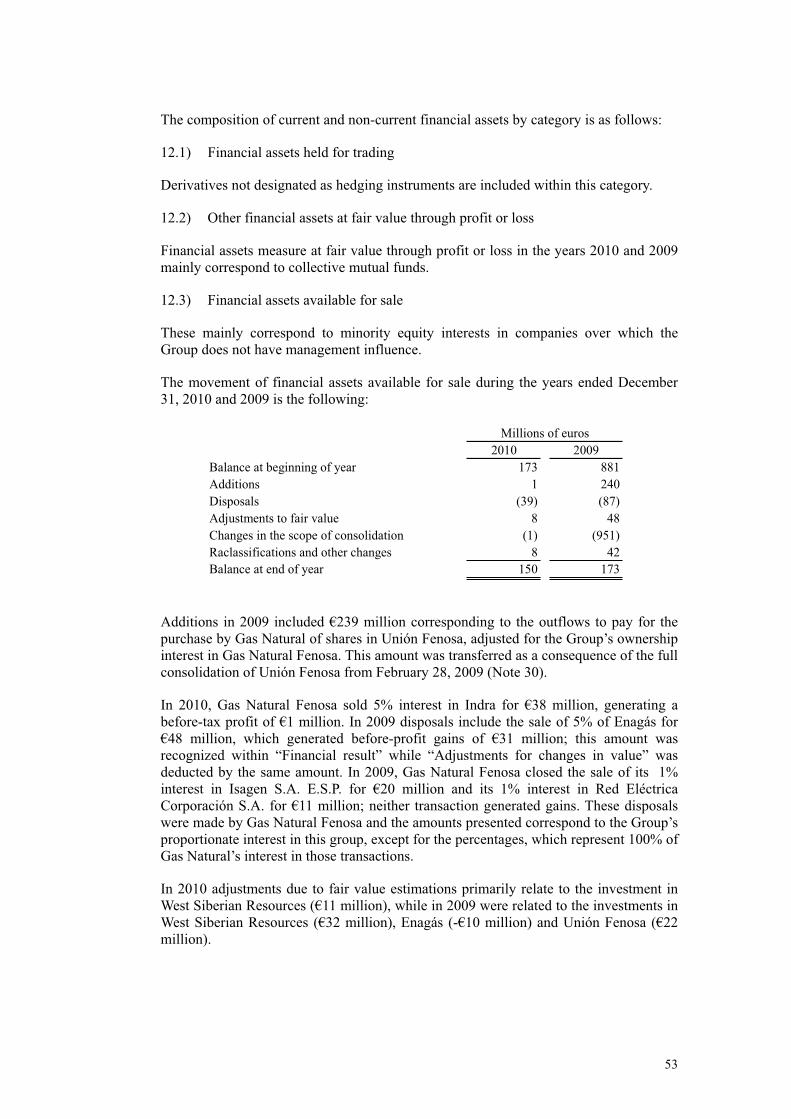
53
The composition of current and non-current financial assets by category is as follows:
12.1) Financial assets held for trading
Derivatives not designated as hedging instruments are included within this category.
12.2) Other financial assets at fair value through profit or loss
Financial assets measure at fair value through profit or loss in the years 2010 and 2009 mainly correspond to collective mutual funds.
12.3) Financial assets available for sale
These mainly correspond to minority equity interests in companies over which the Group does not have management influence.
The movement of financial assets available for sale during the years ended December 31, 2010 and 2009 is the following:
2010 2009Balance at beginning of year 173 881Additions 1 240Disposals (39) (87)Adjustments to fair value 8 48Changes in the scope of consolidation (1) (951)Raclassifications and other changes 8 42Balance at end of year 150 173
Millions of euros
Additions in 2009 included €239 million corresponding to the outflows to pay for the purchase by Gas Natural of shares in Unión Fenosa, adjusted for the Group’s ownership interest in Gas Natural Fenosa. This amount was transferred as a consequence of the full consolidation of Unión Fenosa from February 28, 2009 (Note 30).
In 2010, Gas Natural Fenosa sold 5% interest in Indra for €38 million, generating a before-tax profit of €1 million. In 2009 disposals include the sale of 5% of Enagás for €48 million, which generated before-profit gains of €31 million; this amount was recognized within “Financial result” while “Adjustments for changes in value” was deducted by the same amount. In 2009, Gas Natural Fenosa closed the sale of its 1% interest in Isagen S.A. E.S.P. for €20 million and its 1% interest in Red Eléctrica Corporación S.A. for €11 million; neither transaction generated gains. These disposals were made by Gas Natural Fenosa and the amounts presented correspond to the Group’s proportionate interest in this group, except for the percentages, which represent 100% of Gas Natural’s interest in those transactions.
In 2010 adjustments due to fair value estimations primarily relate to the investment in West Siberian Resources (€11 million), while in 2009 were related to the investments in West Siberian Resources (€32 million), Enagás (-€10 million) and Unión Fenosa (€22 million).
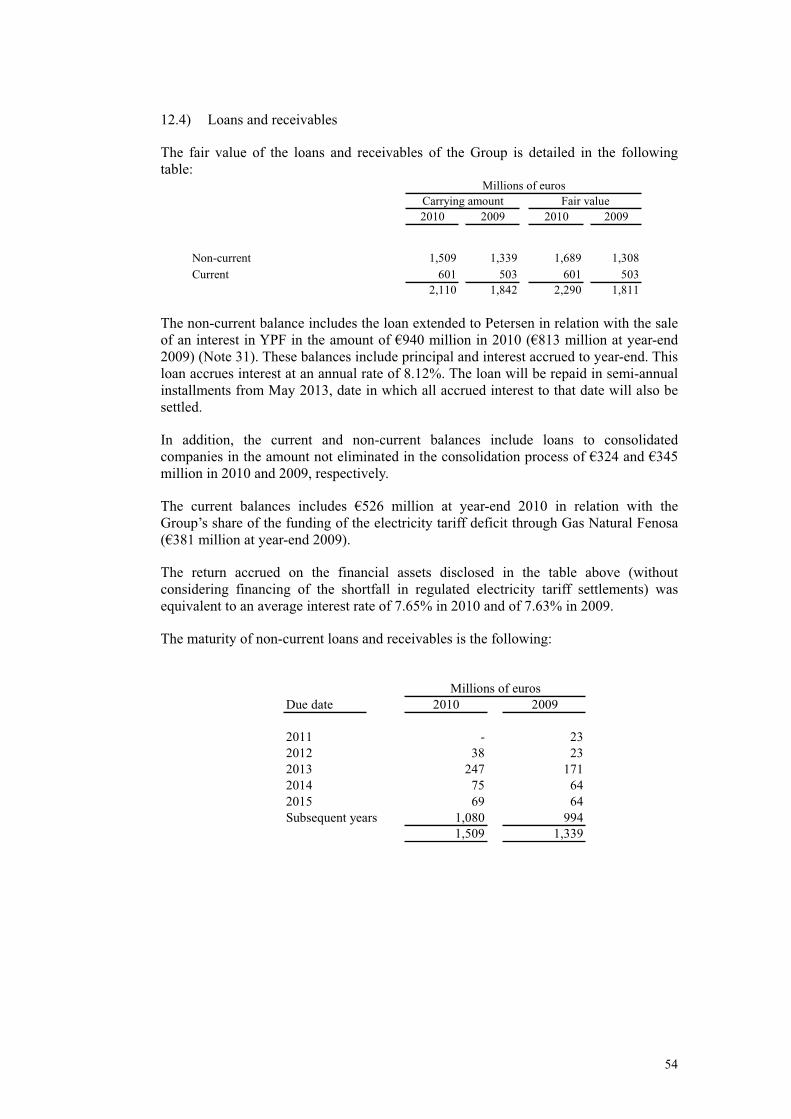
54
12.4) Loans and receivables
The fair value of the loans and receivables of the Group is detailed in the following table:
2010 2009 2010 2009
Non-current 1,509 1,339 1,689 1,308Current 601 503 601 503
2,110 1,842 2,290 1,811
Carrying amountMillions of euros
Fair value
The non-current balance includes the loan extended to Petersen in relation with the sale of an interest in YPF in the amount of €940 million in 2010 (€813 million at year-end 2009) (Note 31). These balances include principal and interest accrued to year-end. This loan accrues interest at an annual rate of 8.12%. The loan will be repaid in semi-annual installments from May 2013, date in which all accrued interest to that date will also be settled.
In addition, the current and non-current balances include loans to consolidated companies in the amount not eliminated in the consolidation process of €324 and €345 million in 2010 and 2009, respectively.
The current balances includes €526 million at year-end 2010 in relation with the Group’s share of the funding of the electricity tariff deficit through Gas Natural Fenosa (€381 million at year-end 2009).
The return accrued on the financial assets disclosed in the table above (without considering financing of the shortfall in regulated electricity tariff settlements) was equivalent to an average interest rate of 7.65% in 2010 and of 7.63% in 2009.
The maturity of non-current loans and receivables is the following:
Millions of eurosDue date 2010 2009
2011 - 232012 38 232013 247 1712014 75 642015 69 64Subsequent years 1,080 994
1,509 1,339
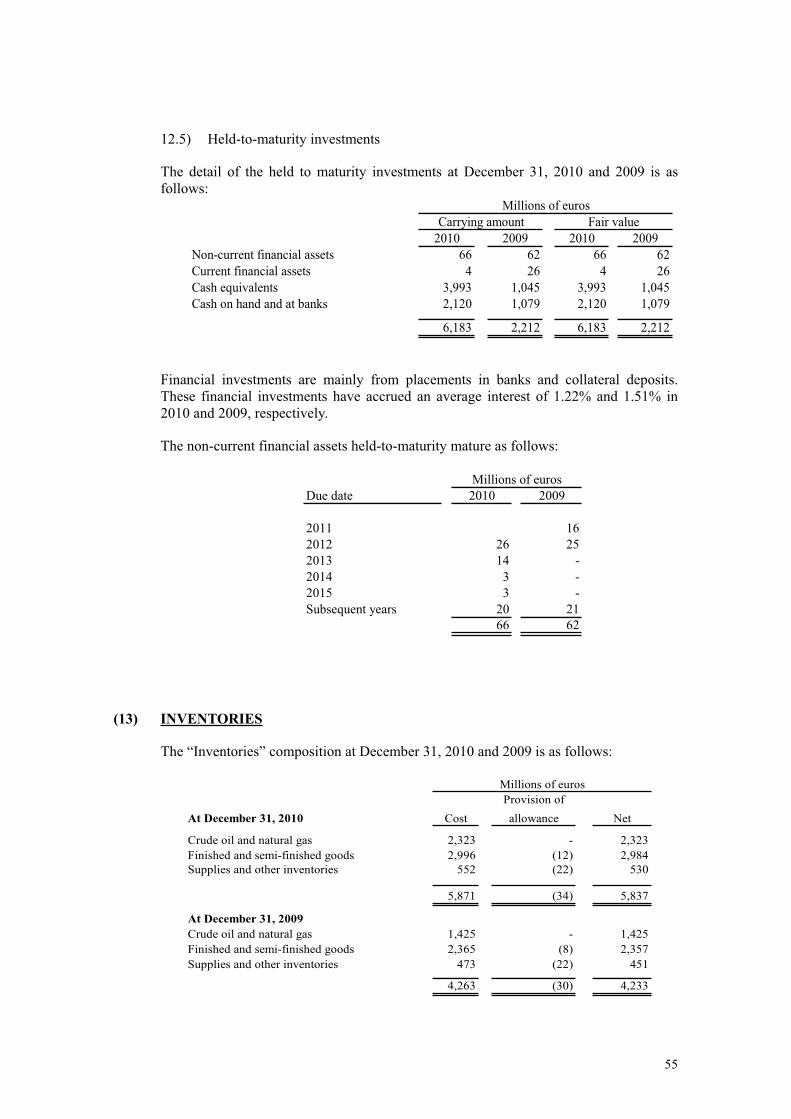
55
12.5) Held-to-maturity investments
The detail of the held to maturity investments at December 31, 2010 and 2009 is as follows:
2010 2009 2010 2009Non-current financial assets 66 62 66 62Current financial assets 4 26 4 26Cash equivalents 3,993 1,045 3,993 1,045Cash on hand and at banks 2,120 1,079 2,120 1,079
6,183 2,212 6,183 2,212
Carrying amount Fair valueMillions of euros
Financial investments are mainly from placements in banks and collateral deposits. These financial investments have accrued an average interest of 1.22% and 1.51% in 2010 and 2009, respectively.
The non-current financial assets held-to-maturity mature as follows:
Millions of eurosDue date 2010 2009
2011 162012 26 252013 14 -2014 3 -2015 3 -Subsequent years 20 21
66 62
(13) INVENTORIES
The “Inventories” composition at December 31, 2010 and 2009 is as follows:
Millions of eurosProvision of
At December 31, 2010 Cost allowance Net
Crude oil and natural gas 2,323 - 2,323 Finished and semi-finished goods 2,996 (12) 2,984
Supplies and other inventories 552 (22) 530
5,871 (34) 5,837
At December 31, 2009Crude oil and natural gas 1,425 - 1,425
Finished and semi-finished goods 2,365 (8) 2,357 Supplies and other inventories 473 (22) 451
4,263 (30) 4,233
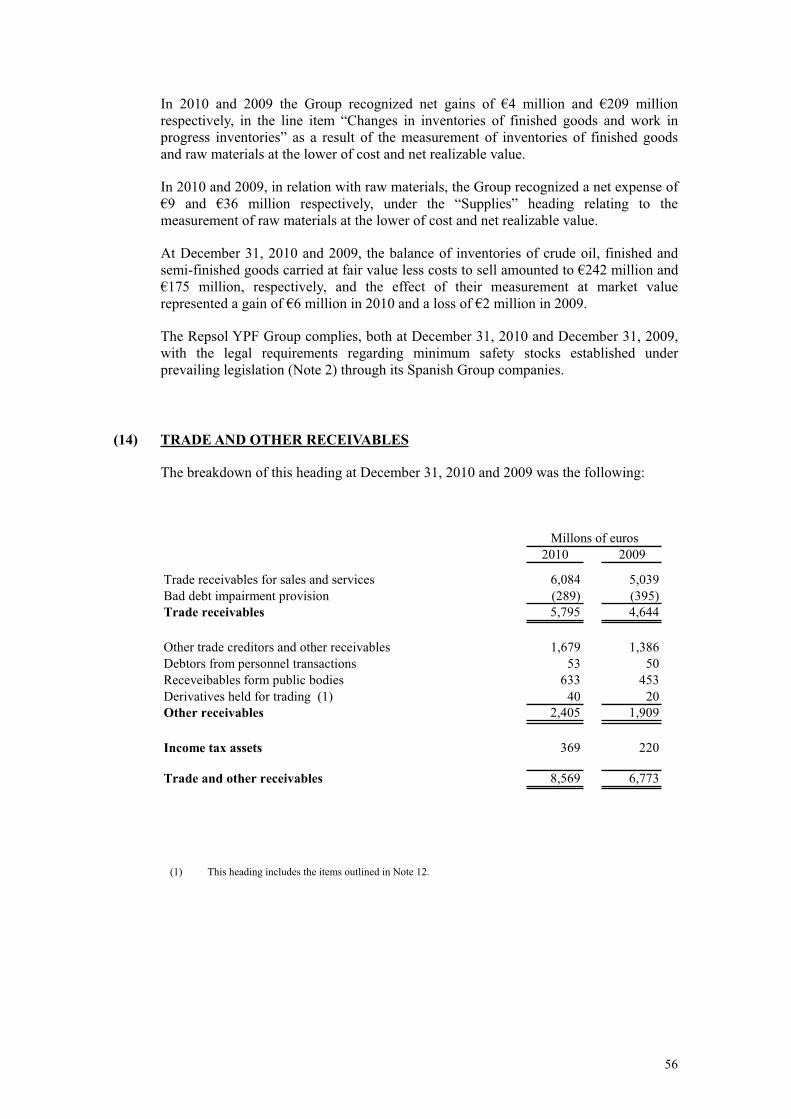
56
In 2010 and 2009 the Group recognized net gains of €4 million and €209 million respectively, in the line item “Changes in inventories of finished goods and work in progress inventories” as a result of the measurement of inventories of finished goods and raw materials at the lower of cost and net realizable value.
In 2010 and 2009, in relation with raw materials, the Group recognized a net expense of €9 and €36 million respectively, under the “Supplies” heading relating to the measurement of raw materials at the lower of cost and net realizable value.
At December 31, 2010 and 2009, the balance of inventories of crude oil, finished and semi-finished goods carried at fair value less costs to sell amounted to €242 million and €175 million, respectively, and the effect of their measurement at market value represented a gain of €6 million in 2010 and a loss of €2 million in 2009.
The Repsol YPF Group complies, both at December 31, 2010 and December 31, 2009, with the legal requirements regarding minimum safety stocks established under prevailing legislation (Note 2) through its Spanish Group companies.
(14) TRADE AND OTHER RECEIVABLES
The breakdown of this heading at December 31, 2010 and 2009 was the following:
2010 2009
Trade receivables for sales and services 6,084 5,039Bad debt impairment provision (289) (395)Trade receivables 5,795 4,644
Other trade creditors and other receivables 1,679 1,386Debtors from personnel transactions 53 50Receveibables form public bodies 633 453Derivatives held for trading (1) 40 20Other receivables 2,405 1,909
Income tax assets 369 220
Trade and other receivables 8,569 6,773
Millons of euros
(1) This heading includes the items outlined in Note 12.
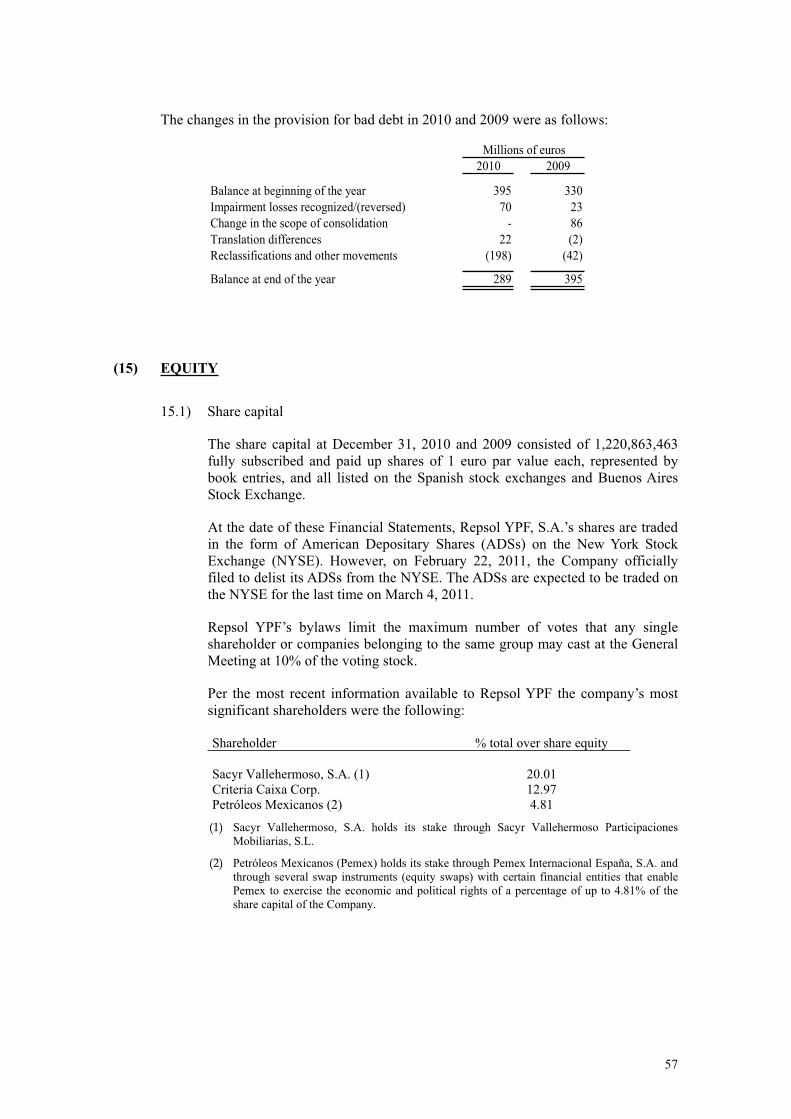
57
The changes in the provision for bad debt in 2010 and 2009 were as follows:
2010 2009
Balance at beginning of the year 395 330Impairment losses recognized/(reversed) 70 23Change in the scope of consolidation - 86Translation differences 22 (2)Reclassifications and other movements (198) (42)
Balance at end of the year 289 395
Millions of euros
(15) EQUITY
15.1) Share capital
The share capital at December 31, 2010 and 2009 consisted of 1,220,863,463 fully subscribed and paid up shares of 1 euro par value each, represented by book entries, and all listed on the Spanish stock exchanges and Buenos Aires Stock Exchange.
At the date of these Financial Statements, Repsol YPF, S.A.’s shares are traded in the form of American Depositary Shares (ADSs) on the New York Stock Exchange (NYSE). However, on February 22, 2011, the Company officially filed to delist its ADSs from the NYSE. The ADSs are expected to be traded on the NYSE for the last time on March 4, 2011.
Repsol YPF’s bylaws limit the maximum number of votes that any single shareholder or companies belonging to the same group may cast at the General Meeting at 10% of the voting stock.
Per the most recent information available to Repsol YPF the company’s most significant shareholders were the following:
Shareholder % total over share equity
Sacyr Vallehermoso, S.A. (1) 20.01 Criteria Caixa Corp. 12.97 Petróleos Mexicanos (2) 4.81
(1) Sacyr Vallehermoso, S.A. holds its stake through Sacyr Vallehermoso Participaciones Mobiliarias, S.L.
(2) Petróleos Mexicanos (Pemex) holds its stake through Pemex Internacional España, S.A. and through several swap instruments (equity swaps) with certain financial entities that enable Pemex to exercise the economic and political rights of a percentage of up to 4.81% of the share capital of the Company.
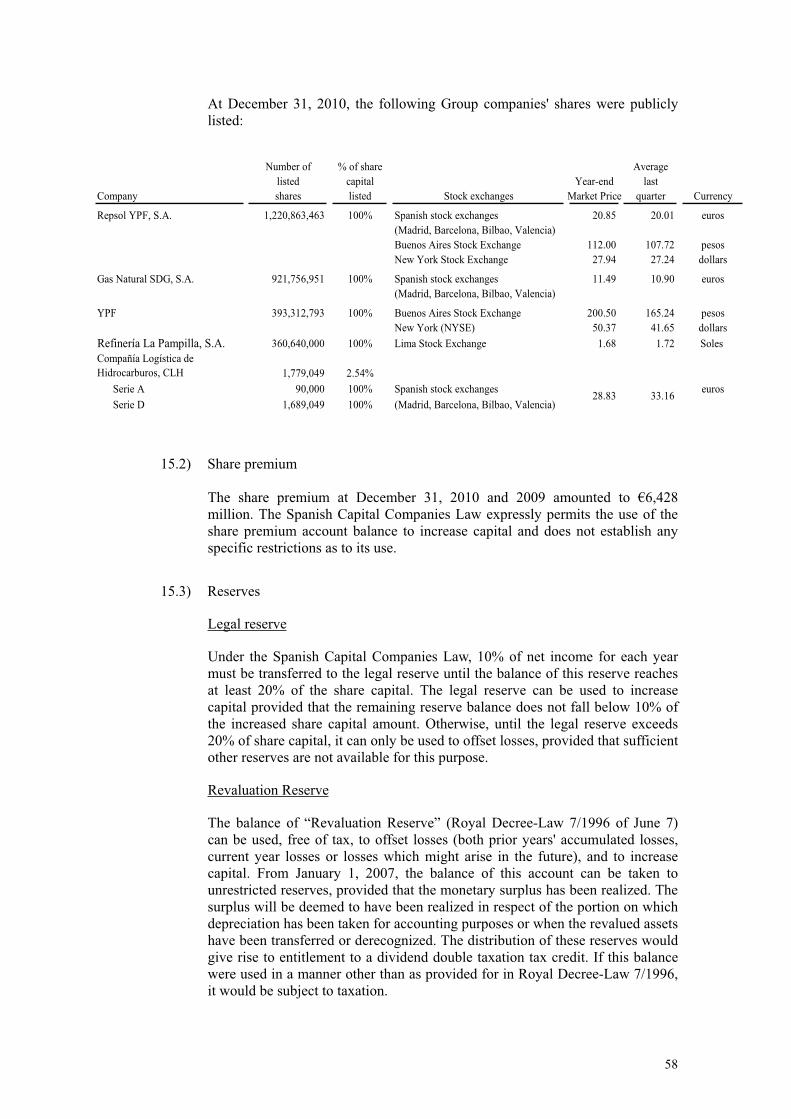
58
At December 31, 2010, the following Group companies' shares were publicly listed:
Number of % of share Averagelisted capital Year-end last
Company shares listed Stock exchanges Market Price quarter Currency
Repsol YPF, S.A. 1,220,863,463 100% Spanish stock exchanges 20.85 20.01 euros(Madrid, Barcelona, Bilbao, Valencia)Buenos Aires Stock Exchange 112.00 107.72 pesosNew York Stock Exchange 27.94 27.24 dollars
Gas Natural SDG, S.A. 921,756,951 100% Spanish stock exchanges 11.49 10.90 euros(Madrid, Barcelona, Bilbao, Valencia)
YPF 393,312,793 100% Buenos Aires Stock Exchange 200.50 165.24 pesosNew York (NYSE) 50.37 41.65 dollars
Refinería La Pampilla, S.A. 360,640,000 100% Lima Stock Exchange 1.68 1.72 Soles Compañía Logística de Hidrocarburos, CLH 1,779,049 2.54% Serie A 90,000 100% Spanish stock exchanges euros Serie D 1,689,049 100% (Madrid, Barcelona, Bilbao, Valencia)
28.83 33.16
15.2) Share premium
The share premium at December 31, 2010 and 2009 amounted to €6,428 million. The Spanish Capital Companies Law expressly permits the use of the share premium account balance to increase capital and does not establish any specific restrictions as to its use.
15.3) Reserves
Legal reserve
Under the Spanish Capital Companies Law, 10% of net income for each year must be transferred to the legal reserve until the balance of this reserve reaches at least 20% of the share capital. The legal reserve can be used to increase capital provided that the remaining reserve balance does not fall below 10% of the increased share capital amount. Otherwise, until the legal reserve exceeds 20% of share capital, it can only be used to offset losses, provided that sufficient other reserves are not available for this purpose.
Revaluation Reserve
The balance of “Revaluation Reserve” (Royal Decree-Law 7/1996 of June 7) can be used, free of tax, to offset losses (both prior years' accumulated losses, current year losses or losses which might arise in the future), and to increase capital. From January 1, 2007, the balance of this account can be taken to unrestricted reserves, provided that the monetary surplus has been realized. The surplus will be deemed to have been realized in respect of the portion on which depreciation has been taken for accounting purposes or when the revalued assets have been transferred or derecognized. The distribution of these reserves would give rise to entitlement to a dividend double taxation tax credit. If this balance were used in a manner other than as provided for in Royal Decree-Law 7/1996, it would be subject to taxation.
59
Other reserves
It includes mainly the transition to IFRS reserve, which comprises the adjustments related to the differences between the previous accounting principles and the IFRS, from events and transactions before the transition date to IFRS (January 1, 2004) and all the results created and not distributed as dividends, which had not been recognized in any of the different reserves previously mentioned.
15.4) Treasury shares
The ordinary General Shareholders’ Meeting held on April 30, 2010, authorized the Board of Directors to make the "derivative acquisition of Repsol YPF, S.A.’s shares, via sale-purchase, swap or any other onerous transaction, directly or through subsidiaries, up to a maximum number of shares so that the sum of those acquired plus treasury shares already held by Repsol YPF, S.A. and any of its subsidiaries does not exceed 10% of the parent company’s share capital, for a price or consideration that shall not be less than the par value of the shares and not more than its quoted price on the stock exchange.”
The authorization is valid for 5 years from the date of the General Shareholders’ Meeting and nullifies the equivalent resolution ratified at the ordinary General Shareholders’ Meeting held on May 14, 2009.
In 2009, Repsol YPF disposed of a total of 12,229,428 treasury shares representing 1.001% of the parent company’s share capital. These shares had a par value of €12.22 million and were sold for an aggregate gross amount of €230.47 million.
At December 31, 2010 and 2009 neither Repsol YPF, S.A. nor any of its subsidiaries held any shares of the parent company.
15.5) Adjustments for changes in value
This heading includes:
Financial assets available for sale
It comprises the profits and losses, net of the related tax effect, corresponding to changes in the fair value of non-monetary assets classified within the category of financial assets available for sale.
Hedge transactions
It comprises the effective part, net of the related tax effect, of changes in the fair value of derivative instruments defined as cash flow hedges (section 3.3.23 of Note 3 and Note 21).
60
Translation differences
This item corresponds to exchange differences recognized in equity as a result of the consolidation process described in Note 3.3.1, and the measurement at fair value of the financial instruments assigned as net investment hedges in foreign transactions in accordance to the method described under section 3.3.23 of Note 3 (Note 21).
The movement in adjustments for changes in value is presented in the consolidated statement of recognized income and expenses by item and before the corresponding tax effect. The tax effects of the changes set out in the 2010 and 2009 statements of recognized income and expense are broken out in the following table:
2010 2009 2010 2009 2010 2009Measurement of financial assets available for sale (1) (15) - 5 (1) (10)Cash flow hedges 19 3 (25) (12) (6) (9)Translation differences (120) (143) - - (120) (143)Actuarial gains and losses and other adjustments 6 (2) - - 6 (2)
(96) (157) (25) (7) (121) (164)
Millions of euros
Recognised in EquityTransferred to the Income
Statement Total
15.6) Dividends
The detail of the dividends paid by Repsol YPF, S.A. in 2010 and 2009 are as follows:
December, 31 2010 December, 31 2009 %
Nominal Euros per
shareAmount
(1) %
Nominal Euros per
shareAmount
(2) Ordinary shares 42.5% 0.425 519 147.5% 1,475 1,801 Remaining shares (without vote, recovery, etc.) - - - - - - Total dividends paid 42.5% 0.425 519 147.5% 1,475 1,801
a) Dividends charged to results 42.5% 0.425 519 147.5% 1,475 1,801 b) Dividends charges to reserves or share premium - - - - - - c) Dividends in kind - - - - - -
(1) This amount corresponds to the final dividend paid against 2009 profit. (2) This balance corresponds to the interim and final dividends against 2008 profit and the interim dividend from
2009 profit (paid on December 22, 2009) and includes €14 million corresponding to Repsol YPF, S.A. shares held by the Group at the payment date.
The interim dividends for 2010 and 2009 correspond to the before-tax per share dividends distributed by Repsol YPF, S.A. on account earnings for the year underway. In 2010 the interim dividend amounted to €641 million (€0.525 per share before tax) and €519 million (€0.425 per share before tax) in 2009.
61
The final dividend from 2009 profits, approved by Repsol YPF, S.A.’s shareholders at the General Meeting held on April 30, 2010, totaled €519 million (€0.425 per share before tax).
The proposed distribution of 2010 results, subject to ratification at the next Repsol YPF General Shareholders’ Meeting, is for the distribution of a final dividend against 2010 profits, payable from July, 7, 2011, in the amount of €641 million (€0.525 per share before tax).
15.7) Earnings per share
Earnings per share at December 31, 2010 and 2009 is detailed below:
2010 2009Net income from discontinued operations (millions of euros) - 12Net income attributable to the parent company (millions of euros) 4,693 1,559Weighted average number of shares outstanding (millions of shares) 1,221 1,211
EARNINGS PER SHARE ATTRIBUTED TO THE PARENT (euros) (1) 2010 2009Basic 3.84 1.29Diluted 3.84 1.29
(1) Earnings per share attributable to owners of the parent company in 2009 includes profit from discontinued operations equivalent to €0.01 per share.
15.8) Minority interests
The equity attributable to minority interests at year-end 2010 and 2009 relates to the following companies:
2010 2009YPF, S.A. 1,149 790Gas Natural Fenosa group companies (1) 478 449Petronor, S.A. 96 93Refinería La Pampilla, S.A. 98 84Other companies 25 24Total 1,846 1,440
Millions of euros
(1) This heading includes preference shares issued by Unión Fenosa Preferentes, S.A., part of the Gas Natural Fenosa Group, with a face value of €226 million (proporcionate to Repsol YPF Group´s interest in Gas Natural Fenosa).
62
(16) GRANTS
The grants recognized in the consolidated balance sheet in the amounts of €110 million at year-end 2010 and €124 million at year-end 2009 correspond mainly to subsidies for the construction of gas infrastructure (€80 million at year-end 2010 and €108 million at year-end 2009).
Revenues in relation to non-financial assets grants are transferred to the income statement under the heading “Allocations of grants on non-financial assets and other grants”. Meanwhile, grants related to income are recognized in the income statement under the heading “Other operating income” and amounted to €227 million in 2010 (€192 million in 2009).
(17) PROVISIONS
The breakdown of provisions at year-end and the changes in this heading in 2010 and 2009 are as follows:
ProvisionProvisions for field Provisions
for dismantling for CO2
pensions (5) costs contracts Environment Emisions Total
Balance at January 1, 2009 66 1,101 472 238 200 1,080 3,157
Period provisions charged to results (1) 34 109 79 70 163 283 738Reversals of provisions with a credit to results (2) (20) (24) (31) (2) - 7 (70)
Provisions released due to payment (19) (41) (43) (70) - (140) (313)Changes in the scope of consolidation (3) 186 30 - - 32 164 412Translation differences 7 (34) (14) (6) - (15) (62)
Reclassifications and other changes (4) (11) (3) (71) (8) (215) (175) (483)
Balance at December 31, 2009 243 1,138 392 222 180 1,204 3,379
Period provisions charged to results (1) 23 96 99 75 179 563 1,035Reversals of provisions with a credit to results (2) (2) (1) - (3) (1) (135) (142)
Provisions released due to payment (24) (29) (43) (50) - (160) (306)
Changes in the scope of consolidation (21) (8) (5) - 4 (2) (32)Translation differences 15 76 29 14 - 39 173
Reclassifications and other changes (4) 23 161 (55) (4) (180) 124 69
Balance at December 31, 2010 257 1,433 417 254 182 1,633 4,176
Other provisions
Millions of eurosCurrent and non-current provisions for contingencies and expenses
(1) Includes €199 million in relation with discounting provisions to the present value in 2010 (€233 million in 2009). (2) Includes the cancellation of provisions for certain items recognized by Group companies in several countries, due to changes
in the circumstances that had given rise to their initial recognition. (3) In 2009 this balance corresponded primarily to the business combination by virtue of which Gas Natural acquired Unión
Fenosa (Note 30). (4) “Provision for field dismantling costs” includes €178 million in 2010 corresponding to additions to property, plant and
equipment and the provision made for field dismantling charges (€33 million in 2009). (5) Note 18.
63
“Other provisions” includes the provisions recognized to cover liabilities deriving principally from tax claims and legal and arbitration proceedings. Note 34 discloses the details of ongoing third-party claims.
Provisions for contingencies and expenses detailed in the table above, include a current balance of €404 million at year-end 2010 (€282 million at year-end 2009). The settlement of non-current provisions for onerous contracts depends on the terms of the originating contract; the longest contract term is 2018. In relation with non-current provisions for field dismantling costs, €488 million falls due within 1 and 5 years from the balance sheet date, while €913 million falls due more than five years from the balance sheet date. In relation with provisions relating to tax, legal and arbitration claims, the nature of the risks provisioned implies that it is not possible to forecast a reasonable settlement timeline.
(18) PENSION PLANS AND OTHER PERSONNEL OBLIGATIONS
a) Defined contribution pension plans
Repsol YPF has defined contribution plans for certain employees in Spain, which conform to current legislation. The main features of these plans are as follows:
i. They are mixed plans to cover retirement, disability and death of the participants.
ii The sponsor (Repsol YPF) undertakes to make monthly contributions of certain percentages of serving employees' salaries to external pension funds.
YPF and other subsidiaries outside Spain also have a defined contribution pension plan for their employees and directors of its main companies, in which the company contributes basically the same amount as the participant up to a stipulated ceiling.
Also, the Gas Natural Fenosa Group has defined contribution pension plans for certain employees.
The annual cost charged to “Personnel expenses” in the consolidated income statement in relation to the defined contribution plans detailed above amounted to €52 million in 2010 (€45 million in 2009).
Executives of the Repsol Group in Spain are beneficiaries of an executive pension plan that complements the standard pension plan denominated “Plan de previsión de Directivos” (Management remuneration plan) which covers the participant retirement, disability and death. Repsol YPF makes defined contributions based on a percentage of participants’ salaries. The plan guarantees a fixed return equivalent to 125% of the prior year national consumer price index. The plan is instrumented through collective insurances that covers pension obligations, subscribed with an insurance entity. Premiums paid under these policies finance and externalize the Group’s commitments in respect of ordinary contributions, as well as the fixed return mentioned above. The officer (or his/her beneficiaries) becomes entitled to receive the plan benefits in the event of retirement, death or total permanent disability, and under certain other circumstances defined in the plan rules. The cost of this plan recognized under “Personnel expenses” in the 2010 and 2009 consolidated income statement was €4 million and €3 million, respectively.
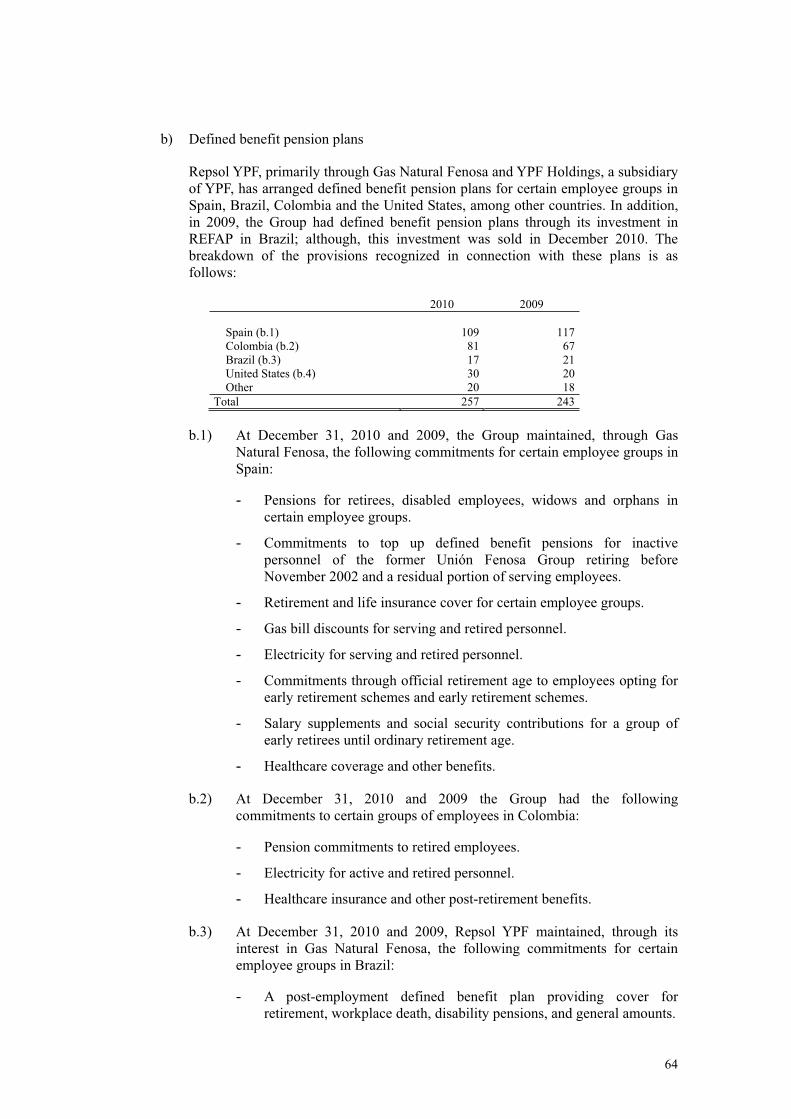
64
b) Defined benefit pension plans
Repsol YPF, primarily through Gas Natural Fenosa and YPF Holdings, a subsidiary of YPF, has arranged defined benefit pension plans for certain employee groups in Spain, Brazil, Colombia and the United States, among other countries. In addition, in 2009, the Group had defined benefit pension plans through its investment in REFAP in Brazil; although, this investment was sold in December 2010. The breakdown of the provisions recognized in connection with these plans is as follows:
2010 2009
Spain (b.1) 109 117 Colombia (b.2) 81 67 Brazil (b.3) 17 21 United States (b.4) 30 20 Other 20 18
Total 257 243
b.1) At December 31, 2010 and 2009, the Group maintained, through Gas Natural Fenosa, the following commitments for certain employee groups in Spain:
- Pensions for retirees, disabled employees, widows and orphans in certain employee groups.
- Commitments to top up defined benefit pensions for inactive personnel of the former Unión Fenosa Group retiring before November 2002 and a residual portion of serving employees.
- Retirement and life insurance cover for certain employee groups.
- Gas bill discounts for serving and retired personnel.
- Electricity for serving and retired personnel.
- Commitments through official retirement age to employees opting for early retirement schemes and early retirement schemes.
- Salary supplements and social security contributions for a group of early retirees until ordinary retirement age.
- Healthcare coverage and other benefits.
b.2) At December 31, 2010 and 2009 the Group had the following commitments to certain groups of employees in Colombia:
- Pension commitments to retired employees.
- Electricity for active and retired personnel.
- Healthcare insurance and other post-retirement benefits.
b.3) At December 31, 2010 and 2009, Repsol YPF maintained, through its interest in Gas Natural Fenosa, the following commitments for certain employee groups in Brazil:
- A post-employment defined benefit plan providing cover for retirement, workplace death, disability pensions, and general amounts.
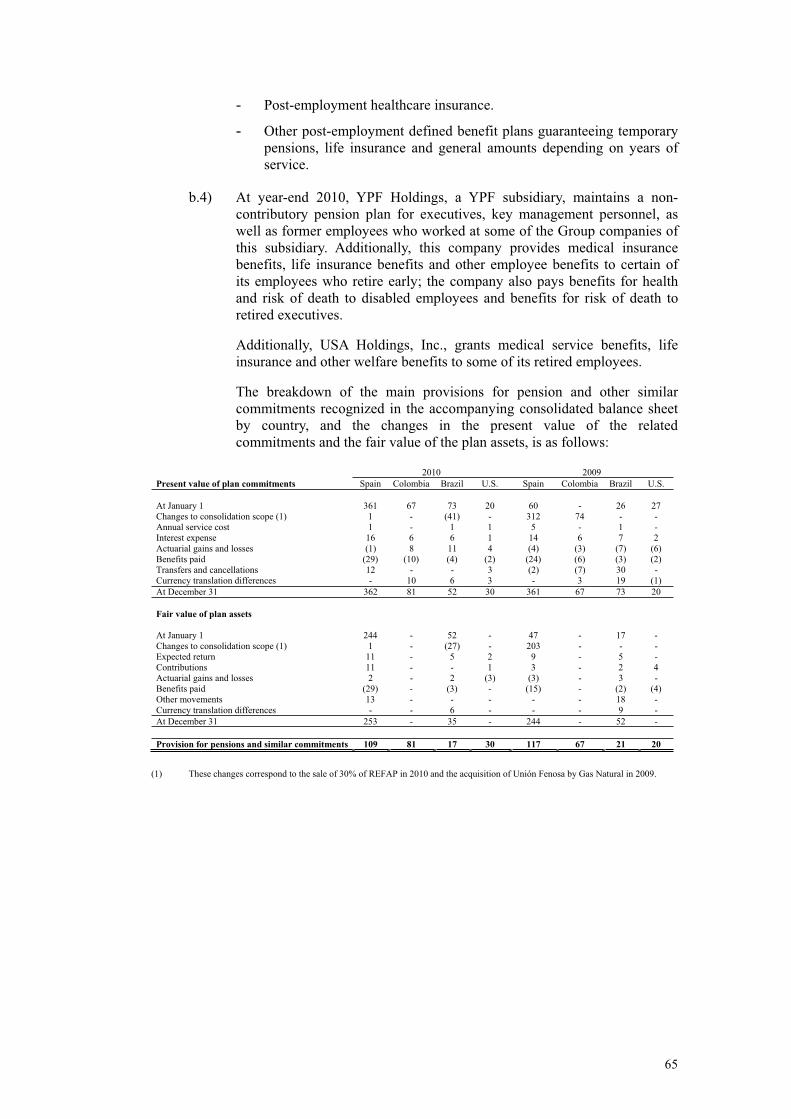
65
- Post-employment healthcare insurance.
- Other post-employment defined benefit plans guaranteeing temporary pensions, life insurance and general amounts depending on years of service.
b.4) At year-end 2010, YPF Holdings, a YPF subsidiary, maintains a non-contributory pension plan for executives, key management personnel, as well as former employees who worked at some of the Group companies of this subsidiary. Additionally, this company provides medical insurance benefits, life insurance benefits and other employee benefits to certain of its employees who retire early; the company also pays benefits for health and risk of death to disabled employees and benefits for risk of death to retired executives.
Additionally, USA Holdings, Inc., grants medical service benefits, life insurance and other welfare benefits to some of its retired employees.
The breakdown of the main provisions for pension and other similar commitments recognized in the accompanying consolidated balance sheet by country, and the changes in the present value of the related commitments and the fair value of the plan assets, is as follows:
2010 2009 Present value of plan commitments Spain Colombia Brazil U.S. Spain Colombia Brazil U.S. At January 1 361 67 73 20 60 - 26 27 Changes to consolidation scope (1) 1 - (41) - 312 74 - - Annual service cost 1 - 1 1 5 - 1 - Interest expense 16 6 6 1 14 6 7 2 Actuarial gains and losses (1) 8 11 4 (4) (3) (7) (6) Benefits paid (29) (10) (4) (2) (24) (6) (3) (2) Transfers and cancellations 12 - - 3 (2) (7) 30 - Currency translation differences - 10 6 3 - 3 19 (1) At December 31 362 81 52 30 361 67 73 20 Fair value of plan assets At January 1 244 - 52 - 47 - 17 - Changes to consolidation scope (1) 1 - (27) - 203 - - - Expected return 11 - 5 2 9 - 5 - Contributions 11 - - 1 3 - 2 4 Actuarial gains and losses 2 - 2 (3) (3) - 3 - Benefits paid (29) - (3) - (15) - (2) (4) Other movements 13 - - - - - 18 - Currency translation differences - - 6 - - - 9 - At December 31 253 - 35 - 244 - 52 - Provision for pensions and similar commitments 109 81 17 30 117 67 21 20
(1) These changes correspond to the sale of 30% of REFAP in 2010 and the acquisition of Unión Fenosa by Gas Natural in 2009.
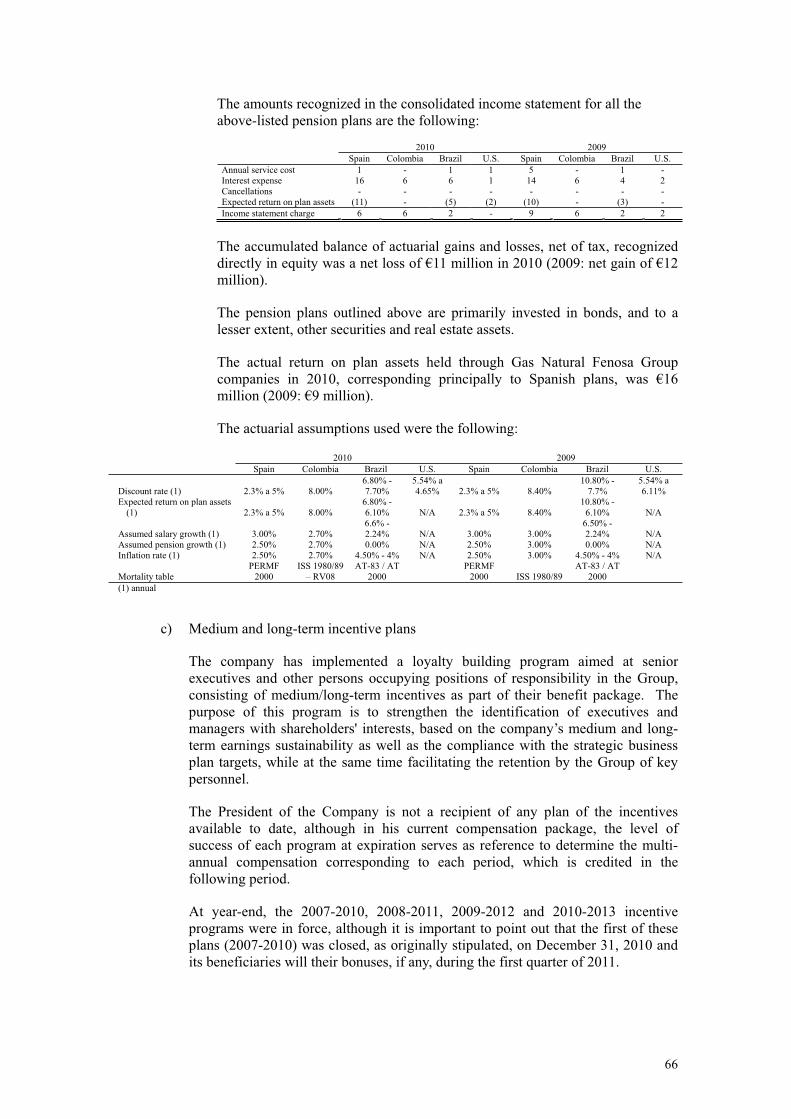
66
The amounts recognized in the consolidated income statement for all the above-listed pension plans are the following:
2010 2009 Spain Colombia Brazil U.S. Spain Colombia Brazil U.S. Annual service cost 1 - 1 1 5 - 1 - Interest expense 16 6 6 1 14 6 4 2 Cancellations - - - - - - - - Expected return on plan assets (11) - (5) (2) (10) - (3) - Income statement charge 6 6 2 - 9 6 2 2
The accumulated balance of actuarial gains and losses, net of tax, recognized directly in equity was a net loss of €11 million in 2010 (2009: net gain of €12 million).
The pension plans outlined above are primarily invested in bonds, and to a lesser extent, other securities and real estate assets.
The actual return on plan assets held through Gas Natural Fenosa Group companies in 2010, corresponding principally to Spanish plans, was €16 million (2009: €9 million).
The actuarial assumptions used were the following:
2010 2009 Spain Colombia Brazil U.S. Spain Colombia Brazil U.S.
Discount rate (1) 2.3% a 5% 8.00% 6.80% - 7.70%
5.54% a 4.65% 2.3% a 5% 8.40%
10.80% - 7.7%
5.54% a 6.11%
Expected return on plan assets (1) 2.3% a 5% 8.00%
6.80% - 6.10% N/A 2.3% a 5% 8.40%
10.80% - 6.10% N/A
Assumed salary growth (1) 3.00% 2.70% 6.6% - 2.24% N/A 3.00% 3.00%
6.50% - 2.24% N/A
Assumed pension growth (1) 2.50% 2.70% 0.00% N/A 2.50% 3.00% 0.00% N/A Inflation rate (1) 2.50% 2.70% 4.50% - 4% N/A 2.50% 3.00% 4.50% - 4% N/A
Mortality table PERMF
2000 ISS 1980/89
– RV08 AT-83 / AT
2000 PERMF
2000 ISS 1980/89 AT-83 / AT
2000 (1) annual
c) Medium and long-term incentive plans
The company has implemented a loyalty building program aimed at senior executives and other persons occupying positions of responsibility in the Group, consisting of medium/long-term incentives as part of their benefit package. The purpose of this program is to strengthen the identification of executives and managers with shareholders' interests, based on the company’s medium and long-term earnings sustainability as well as the compliance with the strategic business plan targets, while at the same time facilitating the retention by the Group of key personnel.
The President of the Company is not a recipient of any plan of the incentives available to date, although in his current compensation package, the level of success of each program at expiration serves as reference to determine the multi-annual compensation corresponding to each period, which is credited in the following period.
At year-end, the 2007-2010, 2008-2011, 2009-2012 and 2010-2013 incentive programs were in force, although it is important to point out that the first of these plans (2007-2010) was closed, as originally stipulated, on December 31, 2010 and its beneficiaries will their bonuses, if any, during the first quarter of 2011.
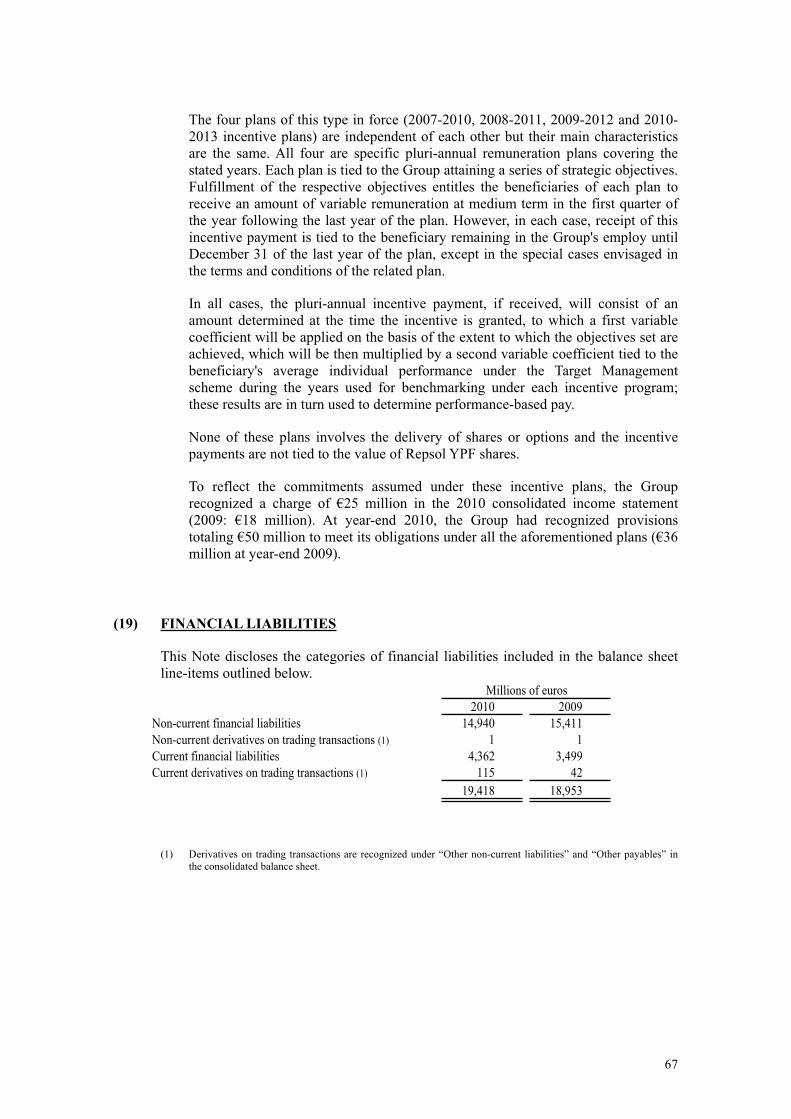
67
The four plans of this type in force (2007-2010, 2008-2011, 2009-2012 and 2010-2013 incentive plans) are independent of each other but their main characteristics are the same. All four are specific pluri-annual remuneration plans covering the stated years. Each plan is tied to the Group attaining a series of strategic objectives. Fulfillment of the respective objectives entitles the beneficiaries of each plan to receive an amount of variable remuneration at medium term in the first quarter of the year following the last year of the plan. However, in each case, receipt of this incentive payment is tied to the beneficiary remaining in the Group's employ until December 31 of the last year of the plan, except in the special cases envisaged in the terms and conditions of the related plan.
In all cases, the pluri-annual incentive payment, if received, will consist of an amount determined at the time the incentive is granted, to which a first variable coefficient will be applied on the basis of the extent to which the objectives set are achieved, which will be then multiplied by a second variable coefficient tied to the beneficiary's average individual performance under the Target Management scheme during the years used for benchmarking under each incentive program; these results are in turn used to determine performance-based pay.
None of these plans involves the delivery of shares or options and the incentive payments are not tied to the value of Repsol YPF shares.
To reflect the commitments assumed under these incentive plans, the Group recognized a charge of €25 million in the 2010 consolidated income statement (2009: €18 million). At year-end 2010, the Group had recognized provisions totaling €50 million to meet its obligations under all the aforementioned plans (€36 million at year-end 2009).
(19) FINANCIAL LIABILITIES
This Note discloses the categories of financial liabilities included in the balance sheet line-items outlined below.
2010 2009Non-current financial liabilities 14,940 15,411 Non-current derivatives on trading transactions (1) 1 1 Current financial liabilities 4,362 3,499 Current derivatives on trading transactions (1) 115 42
19,418 18,953
Millions of euros
(1) Derivatives on trading transactions are recognized under “Other non-current liabilities” and “Other payables” in the consolidated balance sheet.
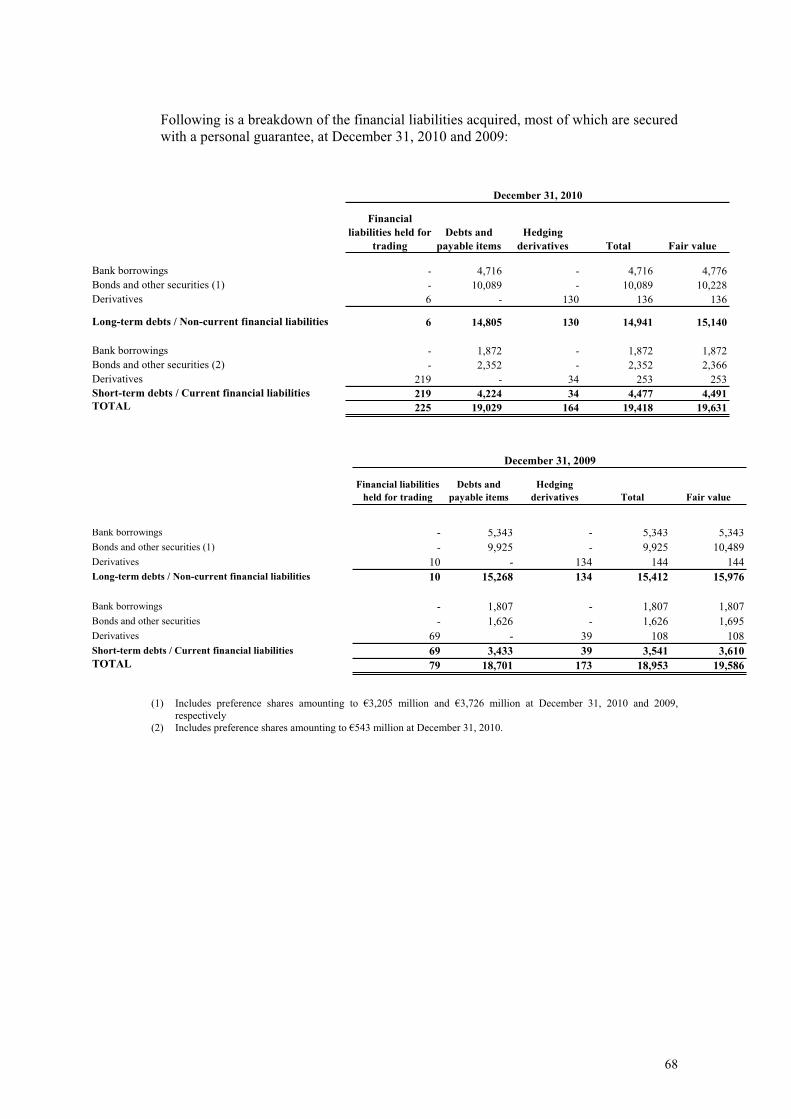
68
Following is a breakdown of the financial liabilities acquired, most of which are secured with a personal guarantee, at December 31, 2010 and 2009:
Bank borrowings - 4,716 - 4,716 4,776Bonds and other securities (1) - 10,089 - 10,089 10,228Derivatives 6 - 130 136 136
Long-term debts / Non-current financial liabilities 6 14,805 130 14,941 15,140
Bank borrowings - 1,872 - 1,872 1,872Bonds and other securities (2) - 2,352 - 2,352 2,366Derivatives 219 - 34 253 253Short-term debts / Current financial liabilities 219 4,224 34 4,477 4,491TOTAL 225 19,029 164 19,418 19,631
December 31, 2010
Fair valueTotal
Financial liabilities held for
trading Debts and
payable itemsHedging
derivatives
Financial liabilities held for trading
Debts and payable items
Hedging derivatives Total Fair value
Bank borrowings - 5,343 - 5,343 5,343Bonds and other securities (1) - 9,925 - 9,925 10,489Derivatives 10 - 134 144 144Long-term debts / Non-current financial liabilities 10 15,268 134 15,412 15,976
Bank borrowings - 1,807 - 1,807 1,807Bonds and other securities - 1,626 - 1,626 1,695Derivatives 69 - 39 108 108Short-term debts / Current financial liabilities 69 3,433 39 3,541 3,610TOTAL 79 18,701 173 18,953 19,586
December 31, 2009
(1) Includes preference shares amounting to €3,205 million and €3,726 million at December 31, 2010 and 2009, respectively
(2) Includes preference shares amounting to €543 million at December 31, 2010.
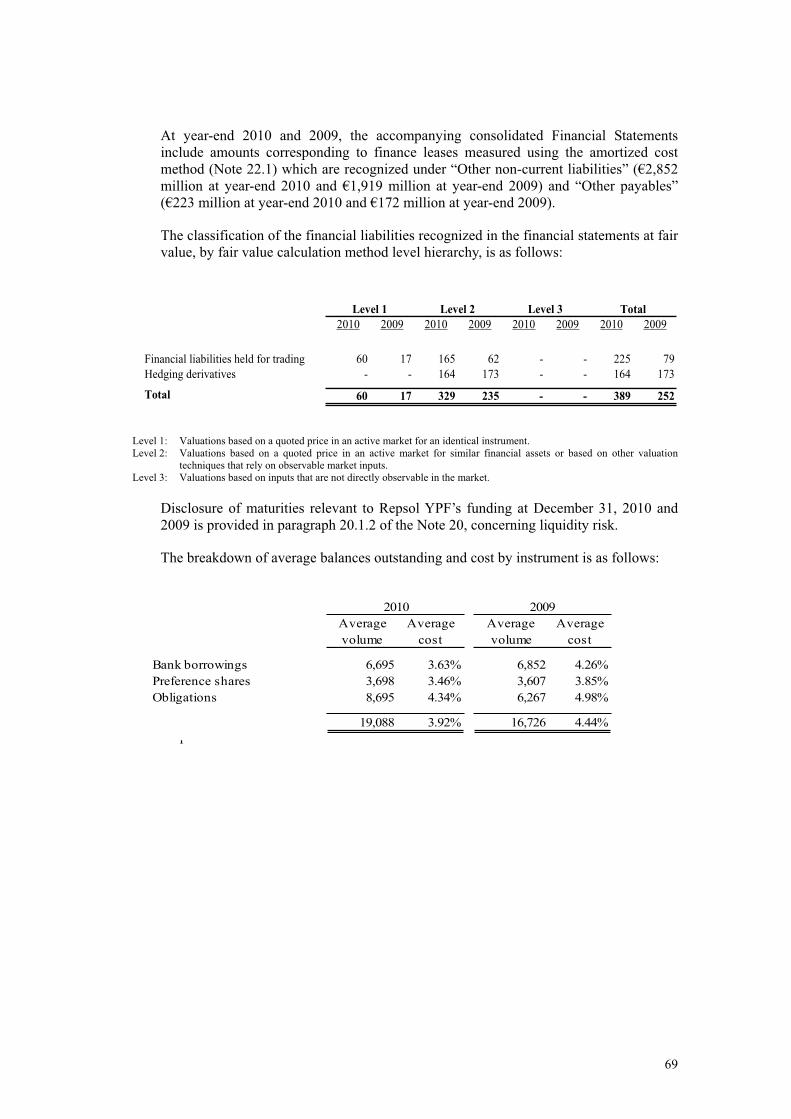
69
At year-end 2010 and 2009, the accompanying consolidated Financial Statements include amounts corresponding to finance leases measured using the amortized cost method (Note 22.1) which are recognized under “Other non-current liabilities” (€2,852 million at year-end 2010 and €1,919 million at year-end 2009) and “Other payables” (€223 million at year-end 2010 and €172 million at year-end 2009).
The classification of the financial liabilities recognized in the financial statements at fair value, by fair value calculation method level hierarchy, is as follows:
2010 2009 2010 2009 2010 2009 2010 2009
Financial liabilities held for trading 60 17 165 62 - - 225 79Hedging derivatives - - 164 173 - - 164 173
Total 60 17 329 235 - - 389 252
Level 1 Level 2 Level 3 Total
Level 1: Valuations based on a quoted price in an active market for an identical instrument. Level 2: Valuations based on a quoted price in an active market for similar financial assets or based on other valuation
techniques that rely on observable market inputs.Level 3: Valuations based on inputs that are not directly observable in the market.
Disclosure of maturities relevant to Repsol YPF’s funding at December 31, 2010 and 2009 is provided in paragraph 20.1.2 of the Note 20, concerning liquidity risk.
The breakdown of average balances outstanding and cost by instrument is as follows:
El
desgl
Average Average Average Averagevolume cost volume cost
Bank borrowings 6,695 3.63% 6,852 4.26%Preference shares 3,698 3.46% 3,607 3.85%Obligations 8,695 4.34% 6,267 4.98%
19,088 3.92% 16,726 4.44%
2010 2009
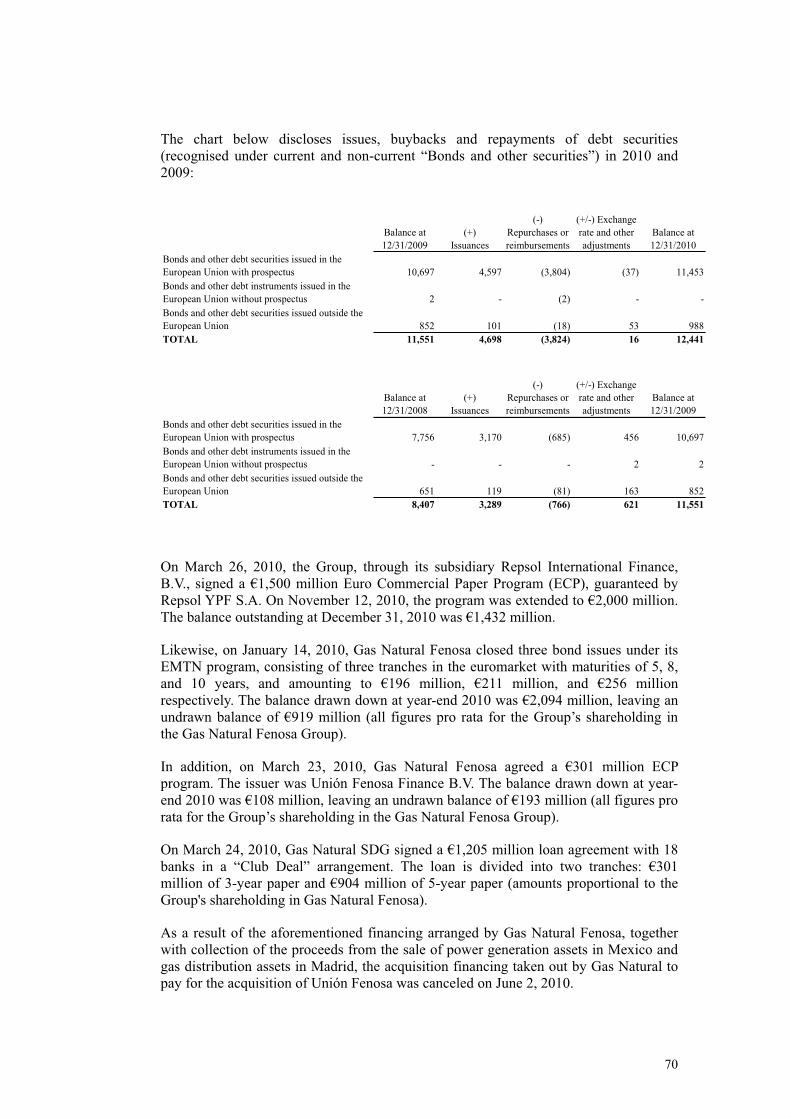
70
The chart below discloses issues, buybacks and repayments of debt securities (recognised under current and non-current “Bonds and other securities”) in 2010 and 2009:
Bonds and other debt securities issued in the European Union with prospectus 10,697 4,597 (3,804) (37) 11,453Bonds and other debt instruments issued in the European Union without prospectus 2 - (2) - -Bonds and other debt securities issued outside the European Union 852 101 (18) 53 988TOTAL 11,551 4,698 (3,824) 16 12,441
Bonds and other debt securities issued in the European Union with prospectus 7,756 3,170 (685) 456 10,697Bonds and other debt instruments issued in the European Union without prospectus - - - 2 2Bonds and other debt securities issued outside the European Union 651 119 (81) 163 852TOTAL 8,407 3,289 (766) 621 11,551
Balance at 12/31/2009
Balance at 12/31/2009
(+)Issuances
(-) Repurchases or reimbursements
(+/-) Exchange rate and other adjustments
Balance at 12/31/2010
Balance at 12/31/2008
(+)Issuances
(-) Repurchases or reimbursements
(+/-) Exchange rate and other adjustments
On March 26, 2010, the Group, through its subsidiary Repsol International Finance, B.V., signed a €1,500 million Euro Commercial Paper Program (ECP), guaranteed by Repsol YPF S.A. On November 12, 2010, the program was extended to €2,000 million. The balance outstanding at December 31, 2010 was €1,432 million.
Likewise, on January 14, 2010, Gas Natural Fenosa closed three bond issues under its EMTN program, consisting of three tranches in the euromarket with maturities of 5, 8, and 10 years, and amounting to €196 million, €211 million, and €256 million respectively. The balance drawn down at year-end 2010 was €2,094 million, leaving an undrawn balance of €919 million (all figures pro rata for the Group’s shareholding in the Gas Natural Fenosa Group).
In addition, on March 23, 2010, Gas Natural Fenosa agreed a €301 million ECP program. The issuer was Unión Fenosa Finance B.V. The balance drawn down at year-end 2010 was €108 million, leaving an undrawn balance of €193 million (all figures pro rata for the Group’s shareholding in the Gas Natural Fenosa Group).
On March 24, 2010, Gas Natural SDG signed a €1,205 million loan agreement with 18 banks in a “Club Deal” arrangement. The loan is divided into two tranches: €301 million of 3-year paper and €904 million of 5-year paper (amounts proportional to the Group's shareholding in Gas Natural Fenosa).
As a result of the aforementioned financing arranged by Gas Natural Fenosa, together with collection of the proceeds from the sale of power generation assets in Mexico and gas distribution assets in Madrid, the acquisition financing taken out by Gas Natural to pay for the acquisition of Unión Fenosa was canceled on June 2, 2010.
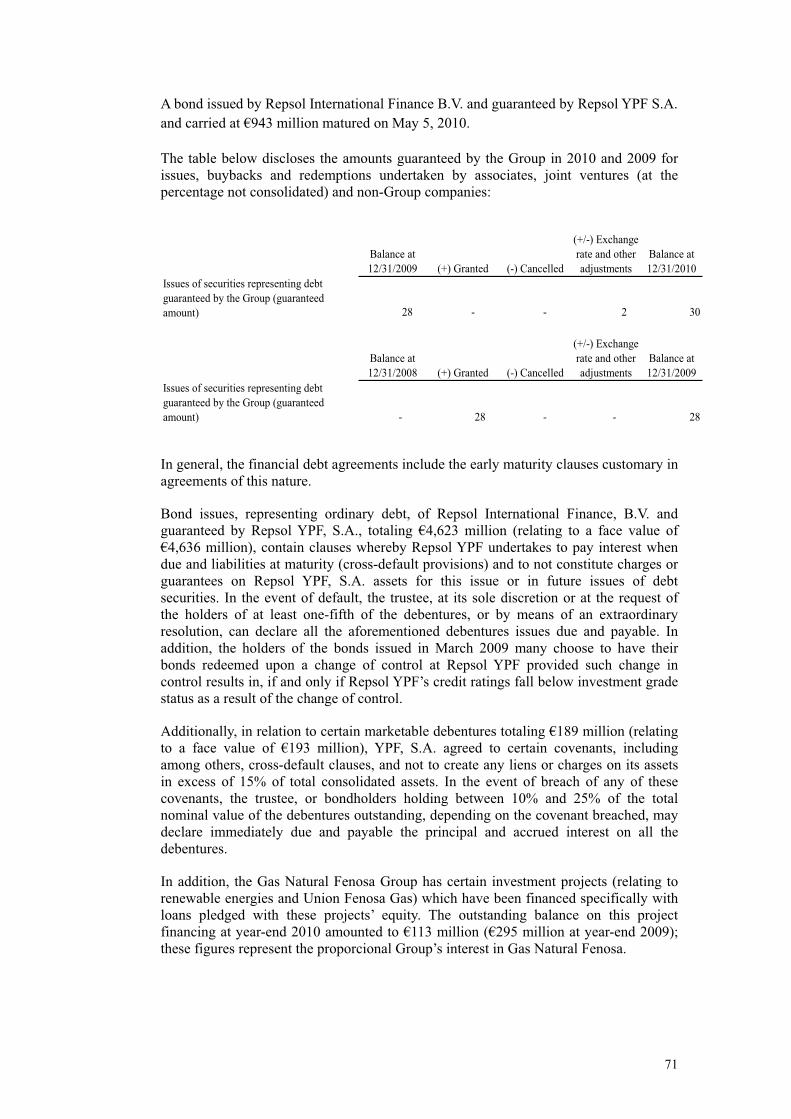
71
A bond issued by Repsol International Finance B.V. and guaranteed by Repsol YPF S.A. and carried at €943 million matured on May 5, 2010.
The table below discloses the amounts guaranteed by the Group in 2010 and 2009 for issues, buybacks and redemptions undertaken by associates, joint ventures (at the percentage not consolidated) and non-Group companies:
Issues of securities representing debt guaranteed by the Group (guaranteed amount) 28 - - 2 30
Issues of securities representing debt guaranteed by the Group (guaranteed amount) - 28 - - 28
Balance at 12/31/2009
Balance at 12/31/2009 (+) Granted (-) Cancelled
(+/-) Exchange rate and other adjustments
Balance at 12/31/2010
Balance at 12/31/2008 (+) Granted (-) Cancelled
(+/-) Exchange rate and other adjustments
In general, the financial debt agreements include the early maturity clauses customary in agreements of this nature.
Bond issues, representing ordinary debt, of Repsol International Finance, B.V. and guaranteed by Repsol YPF, S.A., totaling €4,623 million (relating to a face value of €4,636 million), contain clauses whereby Repsol YPF undertakes to pay interest when due and liabilities at maturity (cross-default provisions) and to not constitute charges or guarantees on Repsol YPF, S.A. assets for this issue or in future issues of debt securities. In the event of default, the trustee, at its sole discretion or at the request of the holders of at least one-fifth of the debentures, or by means of an extraordinary resolution, can declare all the aforementioned debentures issues due and payable. In addition, the holders of the bonds issued in March 2009 many choose to have their bonds redeemed upon a change of control at Repsol YPF provided such change in control results in, if and only if Repsol YPF’s credit ratings fall below investment grade status as a result of the change of control.
Additionally, in relation to certain marketable debentures totaling €189 million (relating to a face value of €193 million), YPF, S.A. agreed to certain covenants, including among others, cross-default clauses, and not to create any liens or charges on its assets in excess of 15% of total consolidated assets. In the event of breach of any of these covenants, the trustee, or bondholders holding between 10% and 25% of the total nominal value of the debentures outstanding, depending on the covenant breached, may declare immediately due and payable the principal and accrued interest on all the debentures.
In addition, the Gas Natural Fenosa Group has certain investment projects (relating to renewable energies and Union Fenosa Gas) which have been financed specifically with loans pledged with these projects’ equity. The outstanding balance on this project financing at year-end 2010 amounted to €113 million (€295 million at year-end 2009); these figures represent the proporcional Group’s interest in Gas Natural Fenosa.
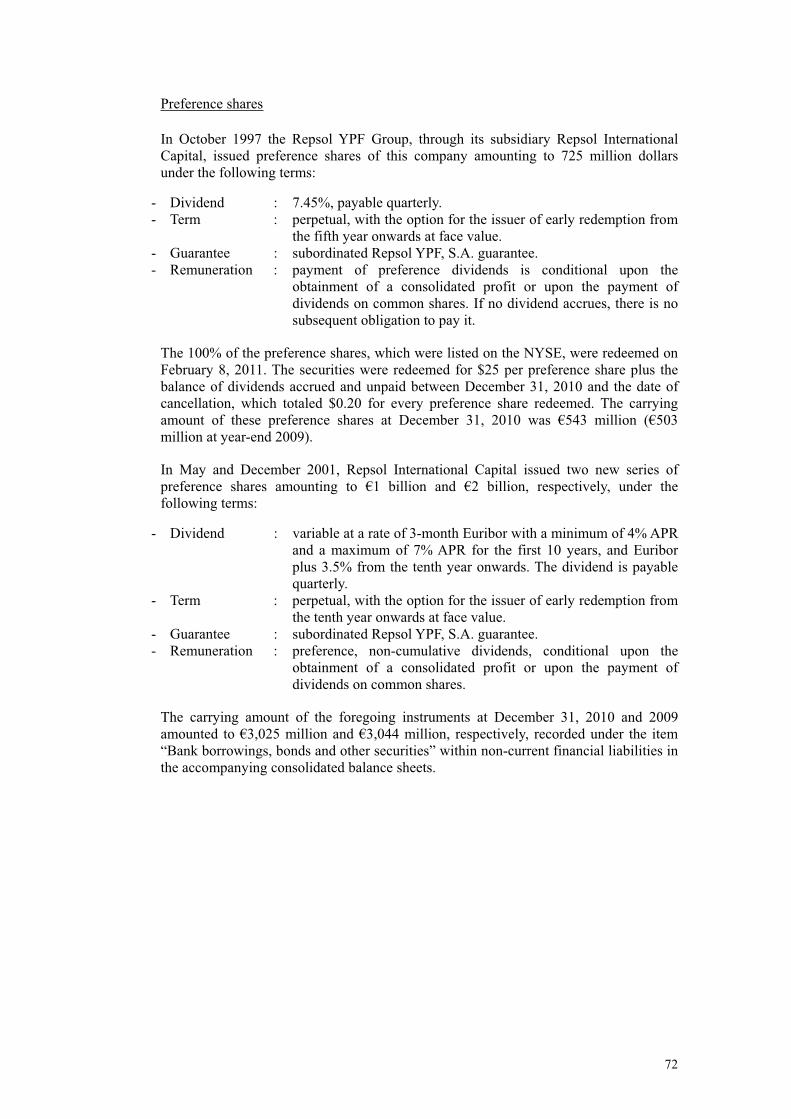
72
Preference shares
In October 1997 the Repsol YPF Group, through its subsidiary Repsol International Capital, issued preference shares of this company amounting to 725 million dollars under the following terms:
- Dividend : 7.45%, payable quarterly. - Term : perpetual, with the option for the issuer of early redemption from
the fifth year onwards at face value. - Guarantee : subordinated Repsol YPF, S.A. guarantee. - Remuneration : payment of preference dividends is conditional upon the
obtainment of a consolidated profit or upon the payment of dividends on common shares. If no dividend accrues, there is no subsequent obligation to pay it.
The 100% of the preference shares, which were listed on the NYSE, were redeemed on February 8, 2011. The securities were redeemed for $25 per preference share plus the balance of dividends accrued and unpaid between December 31, 2010 and the date of cancellation, which totaled $0.20 for every preference share redeemed. The carrying amount of these preference shares at December 31, 2010 was €543 million (€503 million at year-end 2009).
In May and December 2001, Repsol International Capital issued two new series of preference shares amounting to €1 billion and €2 billion, respectively, under the following terms:
- Dividend : variable at a rate of 3-month Euribor with a minimum of 4% APR and a maximum of 7% APR for the first 10 years, and Euribor plus 3.5% from the tenth year onwards. The dividend is payable quarterly.
- Term : perpetual, with the option for the issuer of early redemption from the tenth year onwards at face value.
- Guarantee : subordinated Repsol YPF, S.A. guarantee. - Remuneration : preference, non-cumulative dividends, conditional upon the
obtainment of a consolidated profit or upon the payment of dividends on common shares.
The carrying amount of the foregoing instruments at December 31, 2010 and 2009 amounted to €3,025 million and €3,044 million, respectively, recorded under the item “Bank borrowings, bonds and other securities” within non-current financial liabilities in the accompanying consolidated balance sheets.
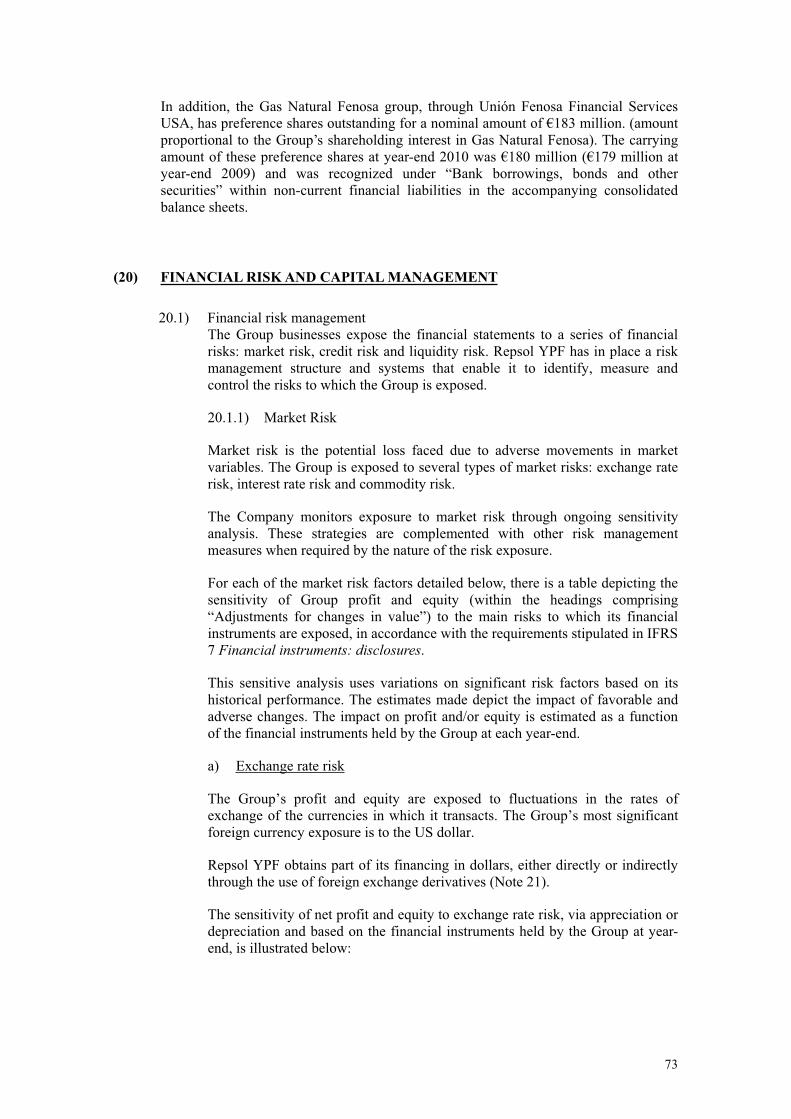
73
In addition, the Gas Natural Fenosa group, through Unión Fenosa Financial Services USA, has preference shares outstanding for a nominal amount of €183 million. (amount proportional to the Group’s shareholding interest in Gas Natural Fenosa). The carrying amount of these preference shares at year-end 2010 was €180 million (€179 million at year-end 2009) and was recognized under “Bank borrowings, bonds and other securities” within non-current financial liabilities in the accompanying consolidated balance sheets.
(20) FINANCIAL RISK AND CAPITAL MANAGEMENT
20.1) Financial risk management The Group businesses expose the financial statements to a series of financial risks: market risk, credit risk and liquidity risk. Repsol YPF has in place a risk management structure and systems that enable it to identify, measure and control the risks to which the Group is exposed.
20.1.1) Market Risk
Market risk is the potential loss faced due to adverse movements in market variables. The Group is exposed to several types of market risks: exchange rate risk, interest rate risk and commodity risk.
The Company monitors exposure to market risk through ongoing sensitivity analysis. These strategies are complemented with other risk management measures when required by the nature of the risk exposure.
For each of the market risk factors detailed below, there is a table depicting the sensitivity of Group profit and equity (within the headings comprising “Adjustments for changes in value”) to the main risks to which its financial instruments are exposed, in accordance with the requirements stipulated in IFRS 7 Financial instruments: disclosures.
This sensitive analysis uses variations on significant risk factors based on its historical performance. The estimates made depict the impact of favorable and adverse changes. The impact on profit and/or equity is estimated as a function of the financial instruments held by the Group at each year-end.
a) Exchange rate risk
The Group’s profit and equity are exposed to fluctuations in the rates of exchange of the currencies in which it transacts. The Group’s most significant foreign currency exposure is to the US dollar.
Repsol YPF obtains part of its financing in dollars, either directly or indirectly through the use of foreign exchange derivatives (Note 21).
The sensitivity of net profit and equity to exchange rate risk, via appreciation or depreciation and based on the financial instruments held by the Group at year-end, is illustrated below:
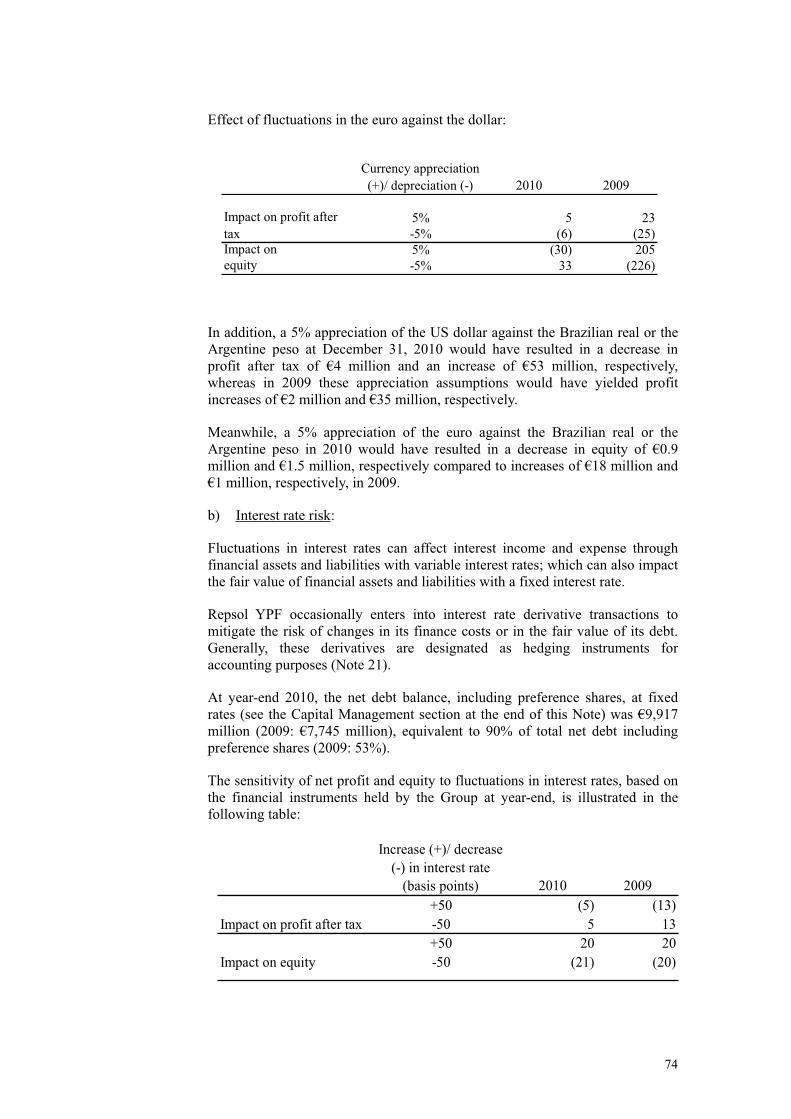
74
Effect of fluctuations in the euro against the dollar:
Currency appreciation (+)/ depreciation (-) 2010 2009
5% 5 23-5% (6) (25)
Impact on 5% (30) 205equity -5% 33 (226)
Impact on profit after tax
In addition, a 5% appreciation of the US dollar against the Brazilian real or the Argentine peso at December 31, 2010 would have resulted in a decrease in profit after tax of €4 million and an increase of €53 million, respectively, whereas in 2009 these appreciation assumptions would have yielded profit increases of €2 million and €35 million, respectively.
Meanwhile, a 5% appreciation of the euro against the Brazilian real or the Argentine peso in 2010 would have resulted in a decrease in equity of €0.9 million and €1.5 million, respectively compared to increases of €18 million and €1 million, respectively, in 2009.
b) Interest rate risk:
Fluctuations in interest rates can affect interest income and expense through financial assets and liabilities with variable interest rates; which can also impact the fair value of financial assets and liabilities with a fixed interest rate.
Repsol YPF occasionally enters into interest rate derivative transactions to mitigate the risk of changes in its finance costs or in the fair value of its debt. Generally, these derivatives are designated as hedging instruments for accounting purposes (Note 21).
At year-end 2010, the net debt balance, including preference shares, at fixed rates (see the Capital Management section at the end of this Note) was €9,917 million (2009: €7,745 million), equivalent to 90% of total net debt including preference shares (2009: 53%).
The sensitivity of net profit and equity to fluctuations in interest rates, based on the financial instruments held by the Group at year-end, is illustrated in the following table:
Increase (+)/ decrease (-) in interest rate
(basis points) 2010 2009+50 (5) (13)-50 5 13+50 20 20-50 (21) (20)Impact on equity
Impact on profit after tax
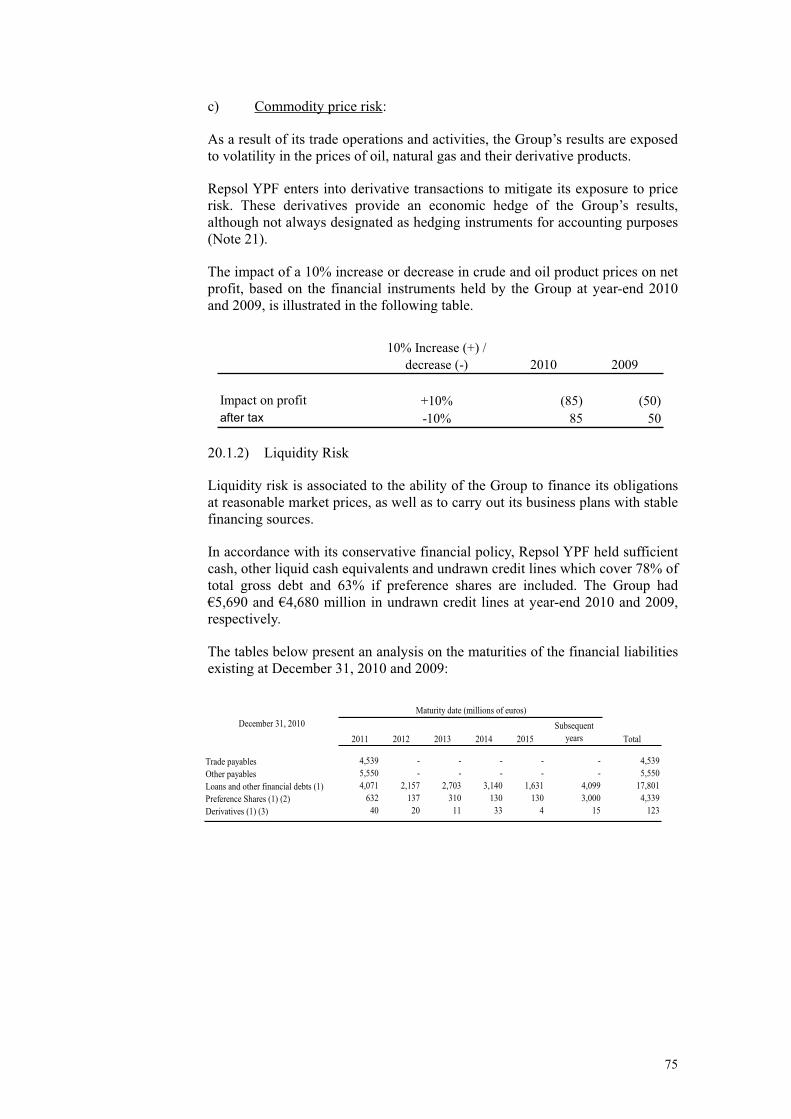
75
c) Commodity price risk:
As a result of its trade operations and activities, the Group’s results are exposed to volatility in the prices of oil, natural gas and their derivative products.
Repsol YPF enters into derivative transactions to mitigate its exposure to price risk. These derivatives provide an economic hedge of the Group’s results, although not always designated as hedging instruments for accounting purposes (Note 21).
The impact of a 10% increase or decrease in crude and oil product prices on net profit, based on the financial instruments held by the Group at year-end 2010 and 2009, is illustrated in the following table.
10% Increase (+) / decrease (-) 2010 2009
Impact on profit +10% (85) (50)after tax -10% 85 50
20.1.2) Liquidity Risk
Liquidity risk is associated to the ability of the Group to finance its obligations at reasonable market prices, as well as to carry out its business plans with stable financing sources.
In accordance with its conservative financial policy, Repsol YPF held sufficient cash, other liquid cash equivalents and undrawn credit lines which cover 78% of total gross debt and 63% if preference shares are included. The Group had €5,690 and €4,680 million in undrawn credit lines at year-end 2010 and 2009, respectively.
The tables below present an analysis on the maturities of the financial liabilities existing at December 31, 2010 and 2009:
2011 2012 2013 2014 2015Subsequent
years Total
Trade payables 4,539 - - - - - 4,539Other payables 5,550 - - - - - 5,550Loans and other financial debts (1) 4,071 2,157 2,703 3,140 1,631 4,099 17,801Preference Shares (1) (2) 632 137 310 130 130 3,000 4,339Derivatives (1) (3) 40 20 11 33 4 15 123
December 31, 2010Maturity date (millions of euros)
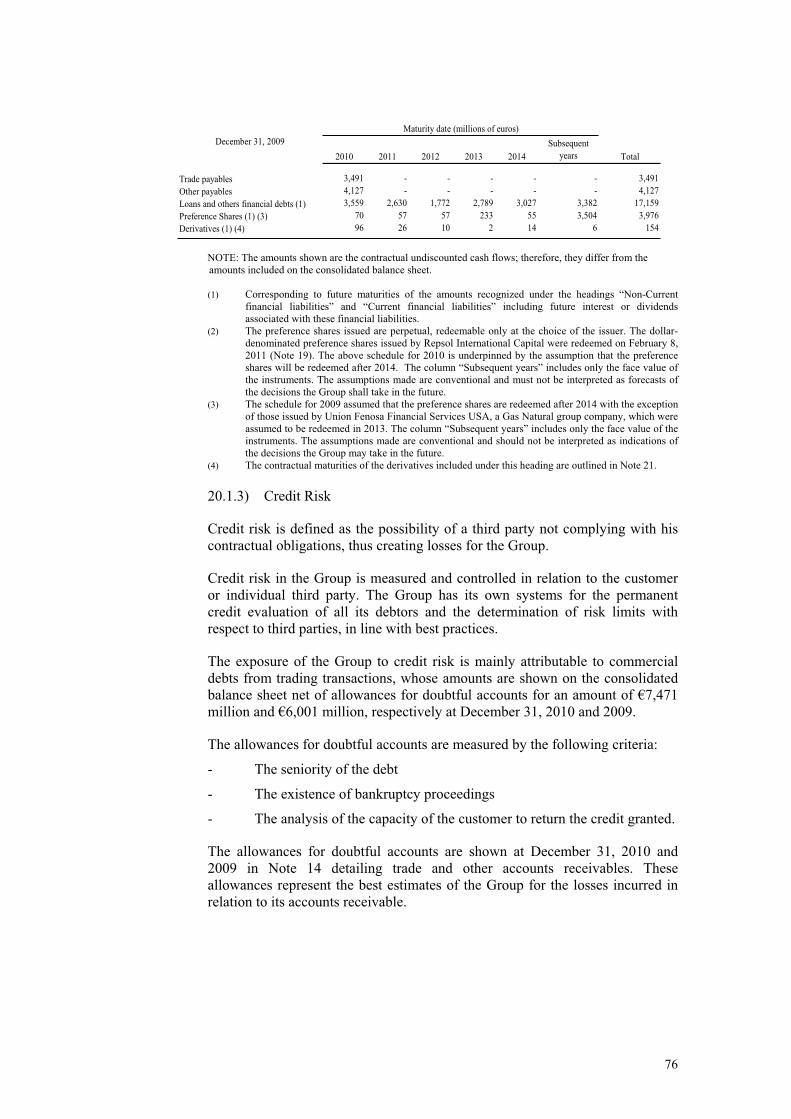
76
2010 2011 2012 2013 2014Subsequent
years Total
Trade payables 3,491 - - - - - 3,491Other payables 4,127 - - - - - 4,127Loans and others financial debts (1) 3,559 2,630 1,772 2,789 3,027 3,382 17,159Preference Shares (1) (3) 70 57 57 233 55 3,504 3,976Derivatives (1) (4) 96 26 10 2 14 6 154
December 31, 2009Maturity date (millions of euros)
NOTE: The amounts shown are the contractual undiscounted cash flows; therefore, they differ from the amounts included on the consolidated balance sheet.
(1) Corresponding to future maturities of the amounts recognized under the headings “Non-Current financial liabilities” and “Current financial liabilities” including future interest or dividends associated with these financial liabilities.
(2) The preference shares issued are perpetual, redeemable only at the choice of the issuer. The dollar-denominated preference shares issued by Repsol International Capital were redeemed on February 8, 2011 (Note 19). The above schedule for 2010 is underpinned by the assumption that the preference shares will be redeemed after 2014. The column “Subsequent years” includes only the face value of the instruments. The assumptions made are conventional and must not be interpreted as forecasts of the decisions the Group shall take in the future.
(3) The schedule for 2009 assumed that the preference shares are redeemed after 2014 with the exception of those issued by Union Fenosa Financial Services USA, a Gas Natural group company, which were assumed to be redeemed in 2013. The column “Subsequent years” includes only the face value of the instruments. The assumptions made are conventional and should not be interpreted as indications of the decisions the Group may take in the future.
(4) The contractual maturities of the derivatives included under this heading are outlined in Note 21.
20.1.3) Credit Risk
Credit risk is defined as the possibility of a third party not complying with his contractual obligations, thus creating losses for the Group.
Credit risk in the Group is measured and controlled in relation to the customer or individual third party. The Group has its own systems for the permanent credit evaluation of all its debtors and the determination of risk limits with respect to third parties, in line with best practices.
The exposure of the Group to credit risk is mainly attributable to commercial debts from trading transactions, whose amounts are shown on the consolidated balance sheet net of allowances for doubtful accounts for an amount of €7,471 million and €6,001 million, respectively at December 31, 2010 and 2009.
The allowances for doubtful accounts are measured by the following criteria:
- The seniority of the debt
- The existence of bankruptcy proceedings
- The analysis of the capacity of the customer to return the credit granted.
The allowances for doubtful accounts are shown at December 31, 2010 and 2009 in Note 14 detailing trade and other accounts receivables. These allowances represent the best estimates of the Group for the losses incurred in relation to its accounts receivable.
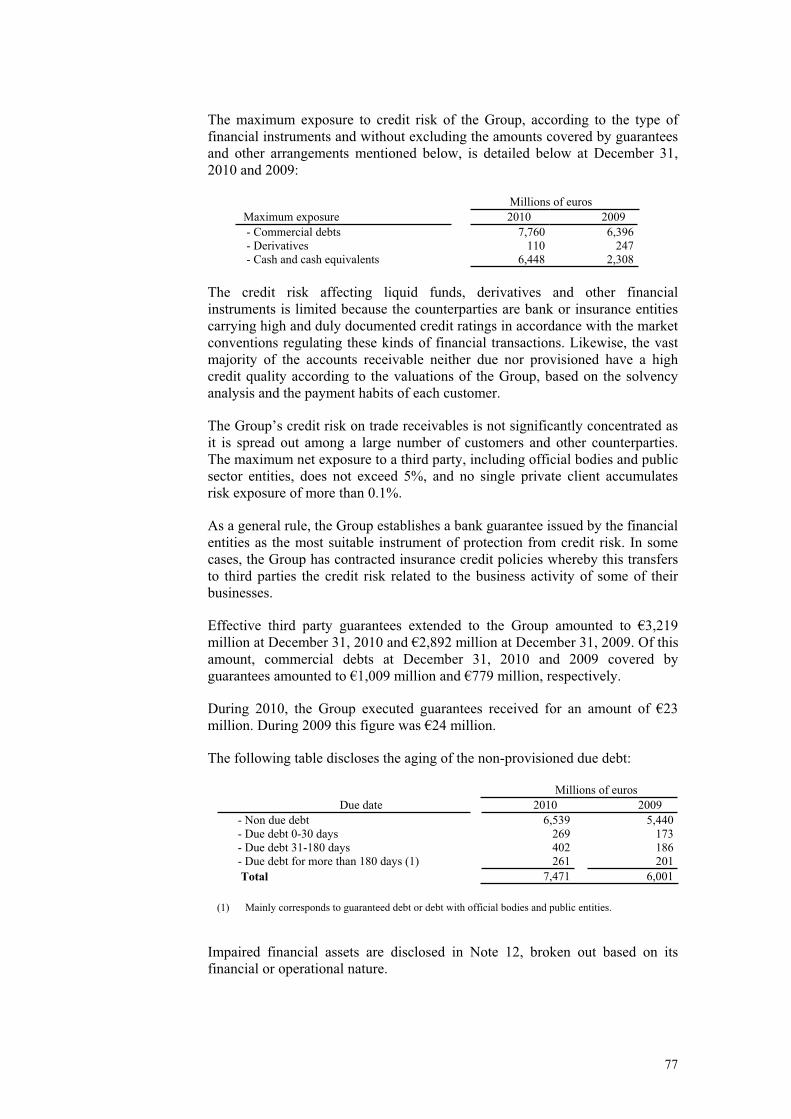
77
The maximum exposure to credit risk of the Group, according to the type of financial instruments and without excluding the amounts covered by guarantees and other arrangements mentioned below, is detailed below at December 31, 2010 and 2009:
Millions of eurosMaximum exposure 2010 2009 - Commercial debts 7,760 6,396 - Derivatives 110 247 - Cash and cash equivalents 6,448 2,308
The credit risk affecting liquid funds, derivatives and other financial instruments is limited because the counterparties are bank or insurance entities carrying high and duly documented credit ratings in accordance with the market conventions regulating these kinds of financial transactions. Likewise, the vast majority of the accounts receivable neither due nor provisioned have a high credit quality according to the valuations of the Group, based on the solvency analysis and the payment habits of each customer.
The Group’s credit risk on trade receivables is not significantly concentrated as it is spread out among a large number of customers and other counterparties. The maximum net exposure to a third party, including official bodies and public sector entities, does not exceed 5%, and no single private client accumulates risk exposure of more than 0.1%.
As a general rule, the Group establishes a bank guarantee issued by the financial entities as the most suitable instrument of protection from credit risk. In some cases, the Group has contracted insurance credit policies whereby this transfers to third parties the credit risk related to the business activity of some of their businesses.
Effective third party guarantees extended to the Group amounted to €3,219 million at December 31, 2010 and €2,892 million at December 31, 2009. Of this amount, commercial debts at December 31, 2010 and 2009 covered by guarantees amounted to €1,009 million and €779 million, respectively.
During 2010, the Group executed guarantees received for an amount of €23 million. During 2009 this figure was €24 million.
The following table discloses the aging of the non-provisioned due debt:
Millions of euros Due date 2010 2009
- Non due debt 6,539 5,440 - Due debt 0-30 days 269 173 - Due debt 31-180 days 402 186 - Due debt for more than 180 days (1) 261 201 Total 7,471 6,001
(1) Mainly corresponds to guaranteed debt or debt with official bodies and public entities.
Impaired financial assets are disclosed in Note 12, broken out based on its financial or operational nature.
78
20.2) Capital Management
Repsol YPF, as an essential part of its strategy, has committed to a policy of financial prudence. The financial structure targeted is defined by this commitment of solvency and the aim to maximize shareholder returns, by optimizing the cost of capital.
Determination of the Group’s target capital structure takes into consideration two leverage ratios, specifically the ratio of net debt (including preference shares, as appropriate) and the capital employed, that includes the net debt, including preference shares, plus the equity:
Net Debt / Capital Employed
Net Debt including Preference Shares / Capital Employed
Calculation of these leverage ratios takes into account the following considerations:
- Preference shares are factored into the process of monitoring the Group’s leverage ratios on account of their significant weight in the Group’s capital structure; however the fact that they are perpetual securities equates them to equity instruments in terms of solvency analysis and creditor claims (Note 19).
- The leverage ratios used net debt concept instead of gross debt in order to factor in the mitigating impact of financial investments. In keeping with its conservative financial policy, Repsol YPF held sufficient cash, other liquid cash equivalents and undrawn credit lines which cover 78% of total gross debt and 63% if preference shares are included. As a result, these ratios provide a better picture of Group solvency when factoring in net debt rather than gross debt.
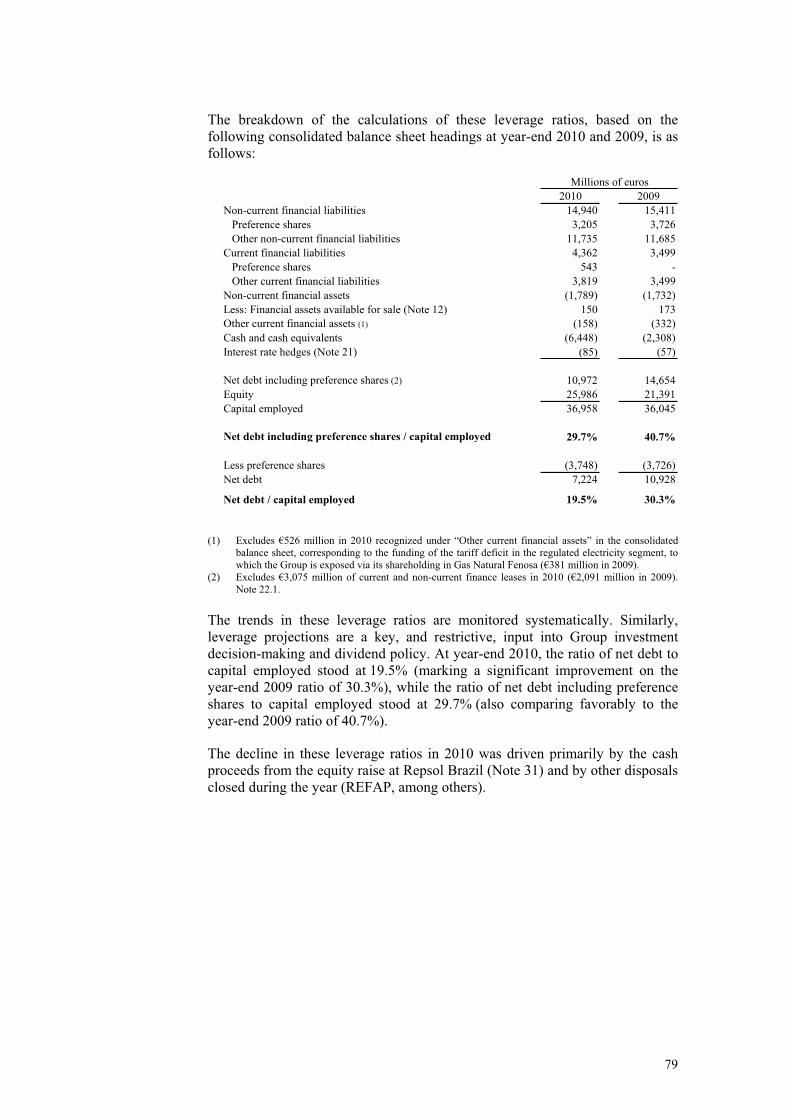
79
The breakdown of the calculations of these leverage ratios, based on the following consolidated balance sheet headings at year-end 2010 and 2009, is as follows:
2010 2009Non-current financial liabilities 14,940 15,411 Preference shares 3,205 3,726 Other non-current financial liabilities 11,735 11,685Current financial liabilities 4,362 3,499 Preference shares 543 - Other current financial liabilities 3,819 3,499Non-current financial assets (1,789) (1,732)Less: Financial assets available for sale (Note 12) 150 173Other current financial assets (1) (158) (332)Cash and cash equivalents (6,448) (2,308)Interest rate hedges (Note 21) (85) (57)
Net debt including preference shares (2) 10,972 14,654Equity 25,986 21,391Capital employed 36,958 36,045
Net debt including preference shares / capital employed 29.7% 40.7%
Less preference shares (3,748) (3,726)Net debt 7,224 10,928
Net debt / capital employed 19.5% 30.3%
Millions of euros
(1) Excludes €526 million in 2010 recognized under “Other current financial assets” in the consolidated balance sheet, corresponding to the funding of the tariff deficit in the regulated electricity segment, to which the Group is exposed via its shareholding in Gas Natural Fenosa (€381 million in 2009).
(2) Excludes €3,075 million of current and non-current finance leases in 2010 (€2,091 million in 2009). Note 22.1.
The trends in these leverage ratios are monitored systematically. Similarly, leverage projections are a key, and restrictive, input into Group investment decision-making and dividend policy. At year-end 2010, the ratio of net debt to capital employed stood at 19.5% (marking a significant improvement on the year-end 2009 ratio of 30.3%), while the ratio of net debt including preference shares to capital employed stood at 29.7% (also comparing favorably to the year-end 2009 ratio of 40.7%).
The decline in these leverage ratios in 2010 was driven primarily by the cash proceeds from the equity raise at Repsol Brazil (Note 31) and by other disposals closed during the year (REFAP, among others).
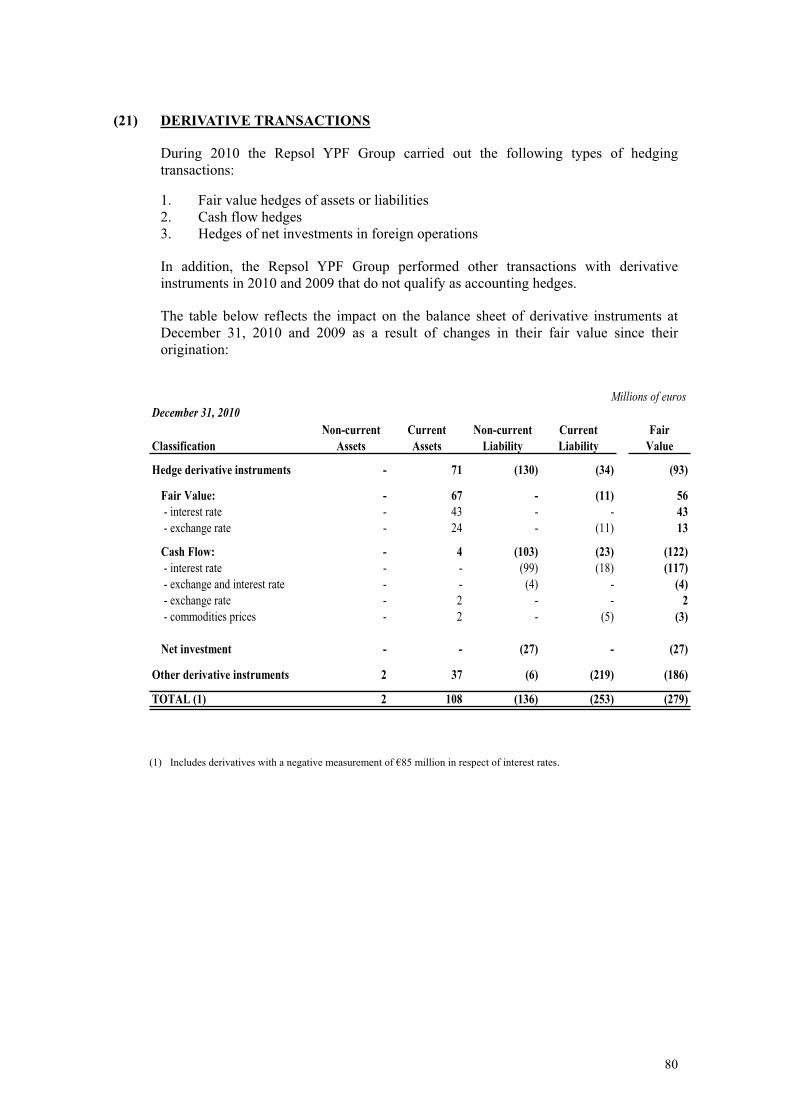
80
(21) DERIVATIVE TRANSACTIONS
During 2010 the Repsol YPF Group carried out the following types of hedging transactions:
1. Fair value hedges of assets or liabilities 2. Cash flow hedges 3. Hedges of net investments in foreign operations
In addition, the Repsol YPF Group performed other transactions with derivative instruments in 2010 and 2009 that do not qualify as accounting hedges.
The table below reflects the impact on the balance sheet of derivative instruments at December 31, 2010 and 2009 as a result of changes in their fair value since their origination:
Millions of eurosDecember 31, 2010
Non-current Current Non-current Current FairAssets Assets Liability Liability Value
Hedge derivative instruments - 71 (130) (34) (93)
Fair Value: - 67 - (11) 56 - interest rate - 43 - - 43 - exchange rate - 24 - (11) 13
Cash Flow: - 4 (103) (23) (122) - interest rate - - (99) (18) (117) - exchange and interest rate - - (4) - (4) - exchange rate - 2 - - 2 - commodities prices - 2 - (5) (3)
Net investment - - (27) - (27)
Other derivative instruments 2 37 (6) (219) (186)
TOTAL (1) 2 108 (136) (253) (279)
Classification
(1) Includes derivatives with a negative measurement of €85 million in respect of interest rates.
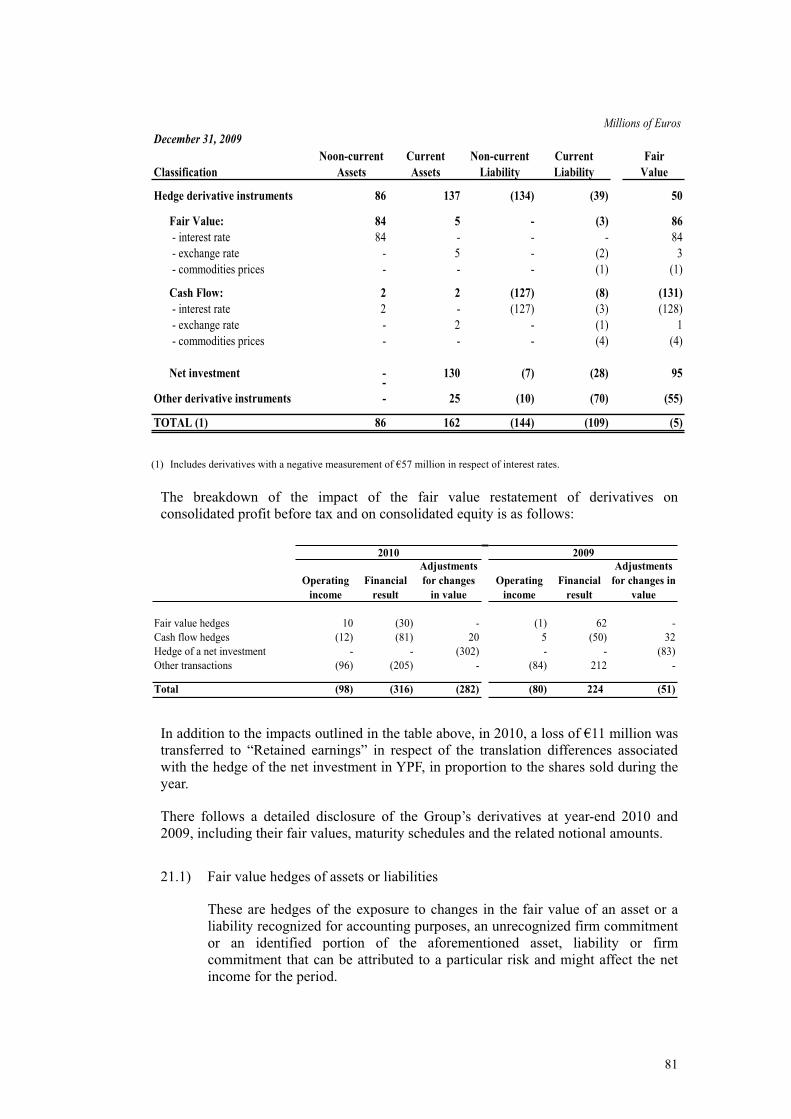
81
Millions of EurosDecember 31, 2009
Noon-current Current Non-current Current FairAssets Assets Liability Liability Value
Hedge derivative instruments 86 137 (134) (39) 50
Fair Value: 84 5 - (3) 86 - interest rate 84 - - - 84 - exchange rate - 5 - (2) 3 - commodities prices - - - (1) (1)
Cash Flow: 2 2 (127) (8) (131) - interest rate 2 - (127) (3) (128) - exchange rate - 2 - (1) 1 - commodities prices - - - (4) (4)
Net investment - 130 (7) (28) 95-
Other derivative instruments - 25 (10) (70) (55)
TOTAL (1) 86 162 (144) (109) (5)
Classification
(1) Includes derivatives with a negative measurement of €57 million in respect of interest rates.
The breakdown of the impact of the fair value restatement of derivatives on consolidated profit before tax and on consolidated equity is as follows:
Operating income
Financial result
Adjustments for changes
in valueOperating
incomeFinancial
result
Adjustments for changes in
value
Fair value hedges 10 (30) - (1) 62 -Cash flow hedges (12) (81) 20 5 (50) 32Hedge of a net investment - - (302) - - (83) Other transactions (96) (205) - (84) 212 -
Total (98) (316) (282) (80) 224 (51)
20092010
In addition to the impacts outlined in the table above, in 2010, a loss of €11 million was transferred to “Retained earnings” in respect of the translation differences associated with the hedge of the net investment in YPF, in proportion to the shares sold during the year.
There follows a detailed disclosure of the Group’s derivatives at year-end 2010 and 2009, including their fair values, maturity schedules and the related notional amounts.
21.1) Fair value hedges of assets or liabilities
These are hedges of the exposure to changes in the fair value of an asset or a liability recognized for accounting purposes, an unrecognized firm commitment or an identified portion of the aforementioned asset, liability or firm commitment that can be attributed to a particular risk and might affect the net income for the period.
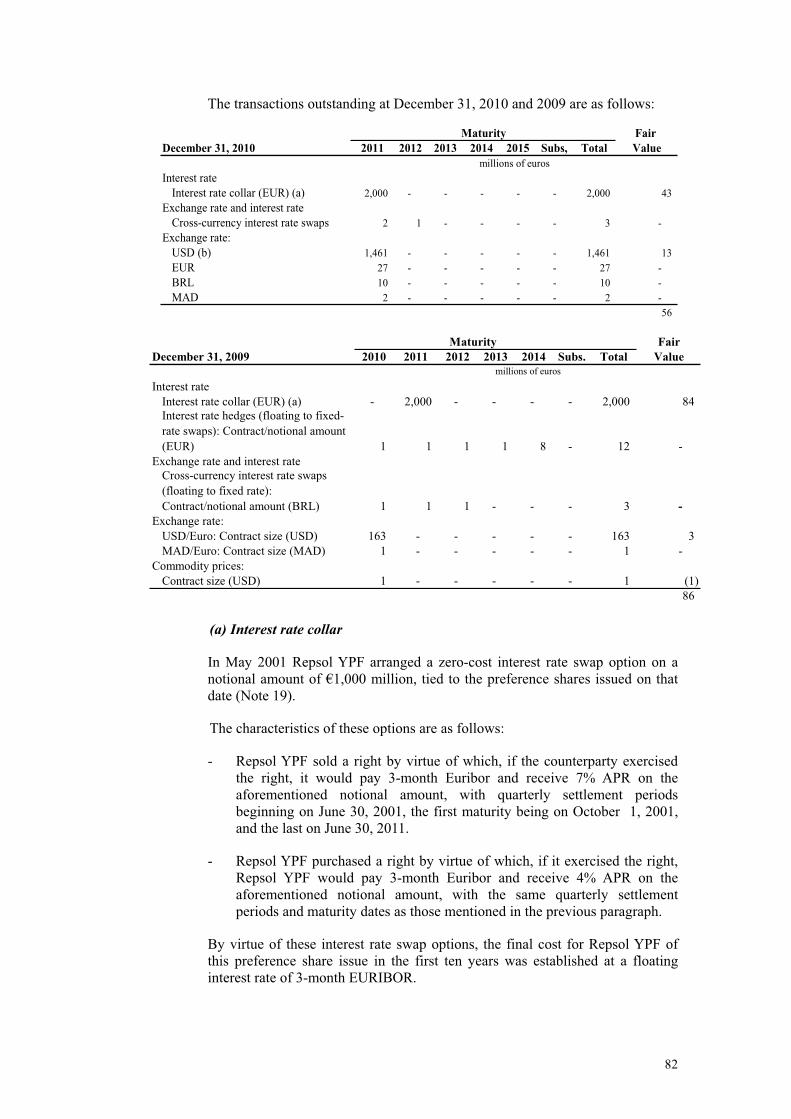
82
The transactions outstanding at December 31, 2010 and 2009 are as follows:
Fair December 31, 2010 2011 2012 2013 2014 2015 Subs, Total Value
Interest rateInterest rate collar (EUR) (a) 2,000 - - - - - 2,000 43
Exchange rate and interest rateCross-currency interest rate swaps 2 1 - - - - 3 -
Exchange rate:USD (b) 1,461 - - - - - 1,461 13 EUR 27 - - - - - 27 - BRL 10 - - - - - 10 - MAD 2 - - - - - 2 -
56
Maturity
millions of euros
FairDecember 31, 2009 2010 2011 2012 2013 2014 Subs. Total Value
Interest rateInterest rate collar (EUR) (a) - 2,000 - - - - 2,000 84 Interest rate hedges (floating to fixed-rate swaps): Contract/notional amount (EUR) 1 1 1 1 8 - 12 -
Exchange rate and interest rateCross-currency interest rate swaps (floating to fixed rate): Contract/notional amount (BRL) 1 1 1 - - - 3 -
Exchange rate:USD/Euro: Contract size (USD) 163 - - - - - 163 3 MAD/Euro: Contract size (MAD) 1 - - - - - 1 -
Commodity prices:Contract size (USD) 1 - - - - - 1 (1)
86
millions of euros
Maturity
(a) Interest rate collar
In May 2001 Repsol YPF arranged a zero-cost interest rate swap option on a notional amount of €1,000 million, tied to the preference shares issued on that date (Note 19).
The characteristics of these options are as follows:
- Repsol YPF sold a right by virtue of which, if the counterparty exercised the right, it would pay 3-month Euribor and receive 7% APR on the aforementioned notional amount, with quarterly settlement periods beginning on June 30, 2001, the first maturity being on October 1, 2001, and the last on June 30, 2011.
- Repsol YPF purchased a right by virtue of which, if it exercised the right, Repsol YPF would pay 3-month Euribor and receive 4% APR on the aforementioned notional amount, with the same quarterly settlement periods and maturity dates as those mentioned in the previous paragraph.
By virtue of these interest rate swap options, the final cost for Repsol YPF of this preference share issue in the first ten years was established at a floating interest rate of 3-month EURIBOR.
83
Also, in April 2002, effective June 30, 2002, Repsol YPF arranged a zero-cost interest rate swap option on a notional amount of € 1,000 million tied to the € 2,000 million preference share issue issued in December 2001 (see Note 19).
The characteristics of these options are as follows:
- Repsol YPF sold a right by virtue of which, if the counterparty exercised the right, Repsol YPF would pay 3-month EURIBOR and receive 7% APR on the aforementioned notional amount, with quarterly settlement periods beginning on June 30, 2002, the first maturity being on September 30, 2002, and the last on December 31, 2011.
- Repsol YPF purchased a right by virtue of which, if it exercised the right, Repsol YPF would pay 3-month EURIBOR and receive 4% APR on the aforementioned notional amount, with the same quarterly settlement periods and maturity dates as those mentioned in the previous paragraph.
By these purchase and sale transactions on interest options, of the total sum of the €2,000 million corresponding to the issue of preference shares in December 2001, €1,000 million have been at a floating rate of 3 months EURIBOR, for the period from September 30, 2002 to December 31, 2011.
(b) USD swaps
At year-end 2010, this heading includes hedges linked to the acquisition of methane ships under finance lease arrangements (Note 22) with a notional amount of US$1,473 million (€1,113 million). The fair value of this hedge at December 31, 2010 implied a loss of €11 million.
The remaining outstanding instruments, whose net fair value at year-end 2010 implied a gain of €24 million, correspond primarily to hedges arranged by the Group through its shareholding in Gas Natural Fenosa.
21.2) Cash flow hedges
These are hedges of the exposure to variability in cash flows that: (i) is attributed to a particular risk associated with a recognized asset or liability (such as all or some future interest payments on variable rate debt) or a highly probable forecasted transaction; and (ii) could affect profit or loss.
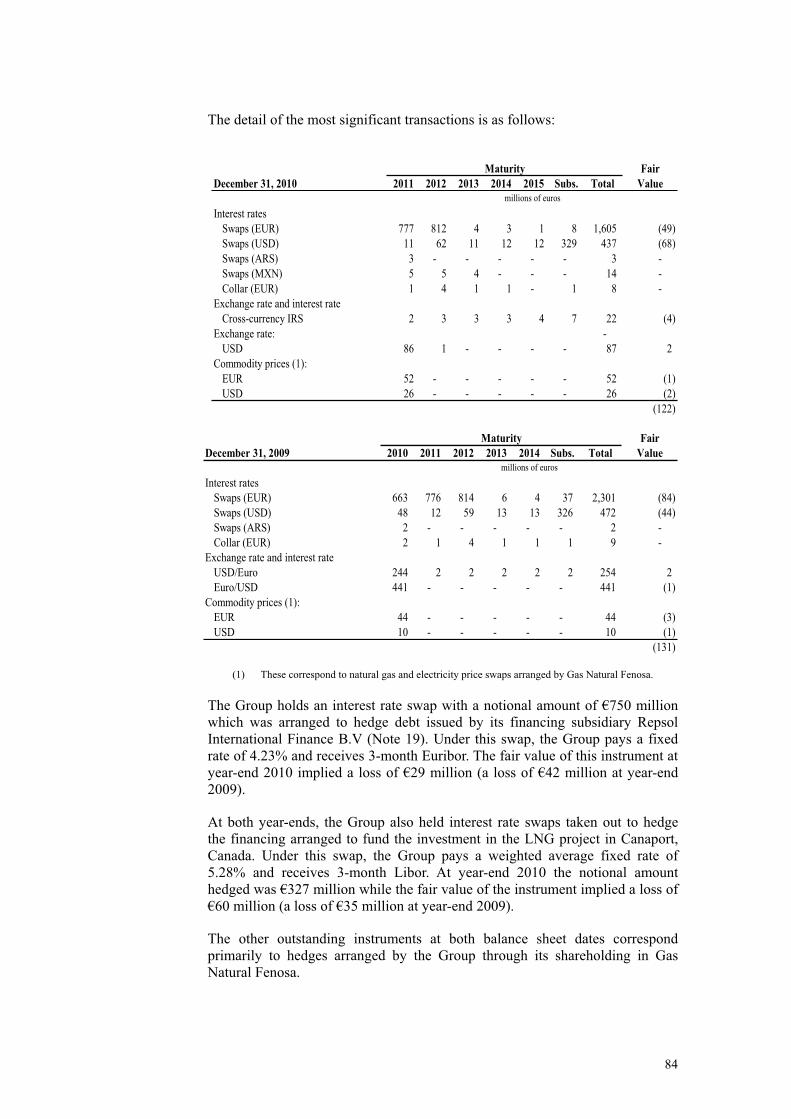
84
The detail of the most significant transactions is as follows:
FairDecember 31, 2010 2011 2012 2013 2014 2015 Subs. Total Value
Interest ratesSwaps (EUR) 777 812 4 3 1 8 1,605 (49) Swaps (USD) 11 62 11 12 12 329 437 (68) Swaps (ARS) 3 - - - - - 3 - Swaps (MXN) 5 5 4 - - - 14 - Collar (EUR) 1 4 1 1 - 1 8 -
Exchange rate and interest rateCross-currency IRS 2 3 3 3 4 7 22 (4)
Exchange rate: - USD 86 1 - - - - 87 2
Commodity prices (1):EUR 52 - - - - - 52 (1) USD 26 - - - - - 26 (2)
(122)
millions of euros
Maturity
FairDecember 31, 2009 2010 2011 2012 2013 2014 Subs. Total Value
Interest ratesSwaps (EUR) 663 776 814 6 4 37 2,301 (84)Swaps (USD) 48 12 59 13 13 326 472 (44)Swaps (ARS) 2 - - - - - 2 -Collar (EUR) 2 1 4 1 1 1 9 -
Exchange rate and interest rateUSD/Euro 244 2 2 2 2 2 254 2 Euro/USD 441 - - - - - 441 (1)
Commodity prices (1):EUR 44 - - - - - 44 (3) USD 10 - - - - - 10 (1)
(131)
millions of euros
Maturity
(1) These correspond to natural gas and electricity price swaps arranged by Gas Natural Fenosa.
The Group holds an interest rate swap with a notional amount of €750 million which was arranged to hedge debt issued by its financing subsidiary Repsol International Finance B.V (Note 19). Under this swap, the Group pays a fixed rate of 4.23% and receives 3-month Euribor. The fair value of this instrument at year-end 2010 implied a loss of €29 million (a loss of €42 million at year-end 2009).
At both year-ends, the Group also held interest rate swaps taken out to hedge the financing arranged to fund the investment in the LNG project in Canaport, Canada. Under this swap, the Group pays a weighted average fixed rate of 5.28% and receives 3-month Libor. At year-end 2010 the notional amount hedged was €327 million while the fair value of the instrument implied a loss of €60 million (a loss of €35 million at year-end 2009).
The other outstanding instruments at both balance sheet dates correspond primarily to hedges arranged by the Group through its shareholding in Gas Natural Fenosa.
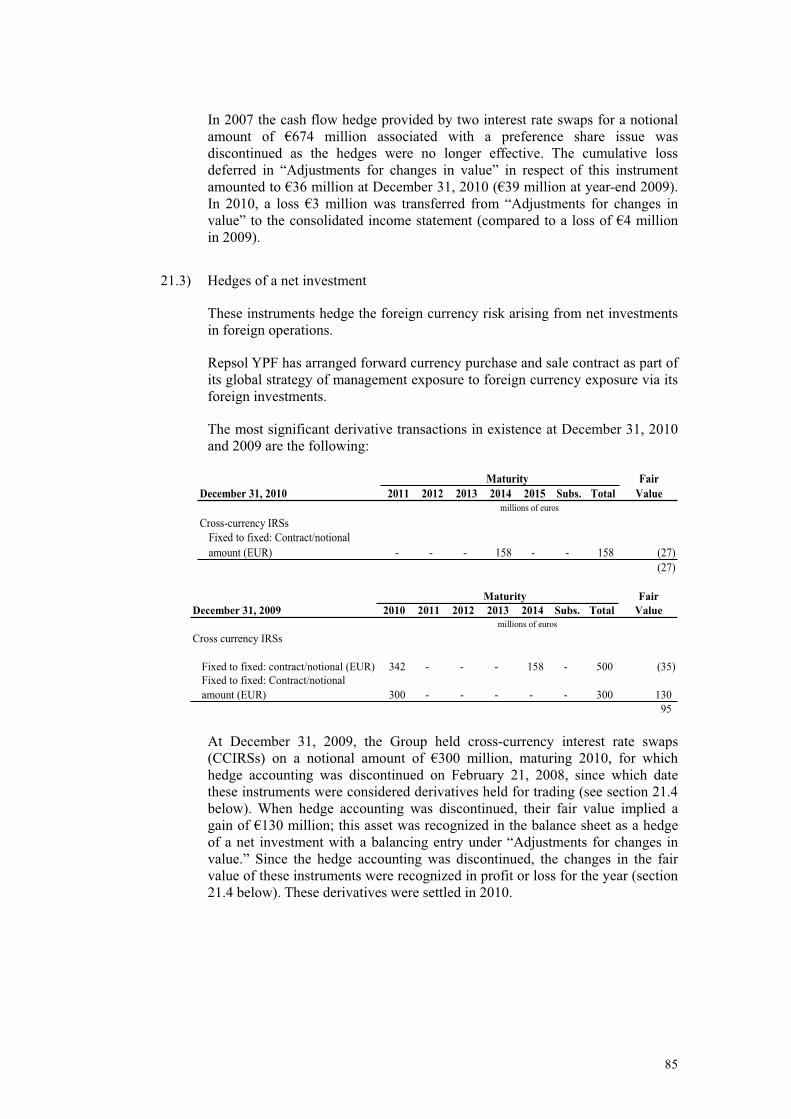
85
In 2007 the cash flow hedge provided by two interest rate swaps for a notional amount of €674 million associated with a preference share issue was discontinued as the hedges were no longer effective. The cumulative loss deferred in “Adjustments for changes in value” in respect of this instrument amounted to €36 million at December 31, 2010 (€39 million at year-end 2009). In 2010, a loss €3 million was transferred from “Adjustments for changes in value” to the consolidated income statement (compared to a loss of €4 million in 2009).
21.3) Hedges of a net investment
These instruments hedge the foreign currency risk arising from net investments in foreign operations.
Repsol YPF has arranged forward currency purchase and sale contract as part of its global strategy of management exposure to foreign currency exposure via its foreign investments.
The most significant derivative transactions in existence at December 31, 2010 and 2009 are the following:
Maturity FairDecember 31, 2010 2011 2012 2013 2014 2015 Subs. Total Value
Cross-currency IRSs Fixed to fixed: Contract/notional amount (EUR) - - - 158 - - 158 (27)
(27)
millions of euros
Maturity FairDecember 31, 2009 2010 2011 2012 2013 2014 Subs. Total Value
Cross currency IRSs
Fixed to fixed: contract/notional (EUR) 342 - - - 158 - 500 (35) Fixed to fixed: Contract/notional amount (EUR) 300 - - - - - 300 130
95
millions of euros
At December 31, 2009, the Group held cross-currency interest rate swaps (CCIRSs) on a notional amount of €300 million, maturing 2010, for which hedge accounting was discontinued on February 21, 2008, since which date these instruments were considered derivatives held for trading (see section 21.4 below). When hedge accounting was discontinued, their fair value implied a gain of €130 million; this asset was recognized in the balance sheet as a hedge of a net investment with a balancing entry under “Adjustments for changes in value.” Since the hedge accounting was discontinued, the changes in the fair value of these instruments were recognized in profit or loss for the year (section 21.4 below). These derivatives were settled in 2010.
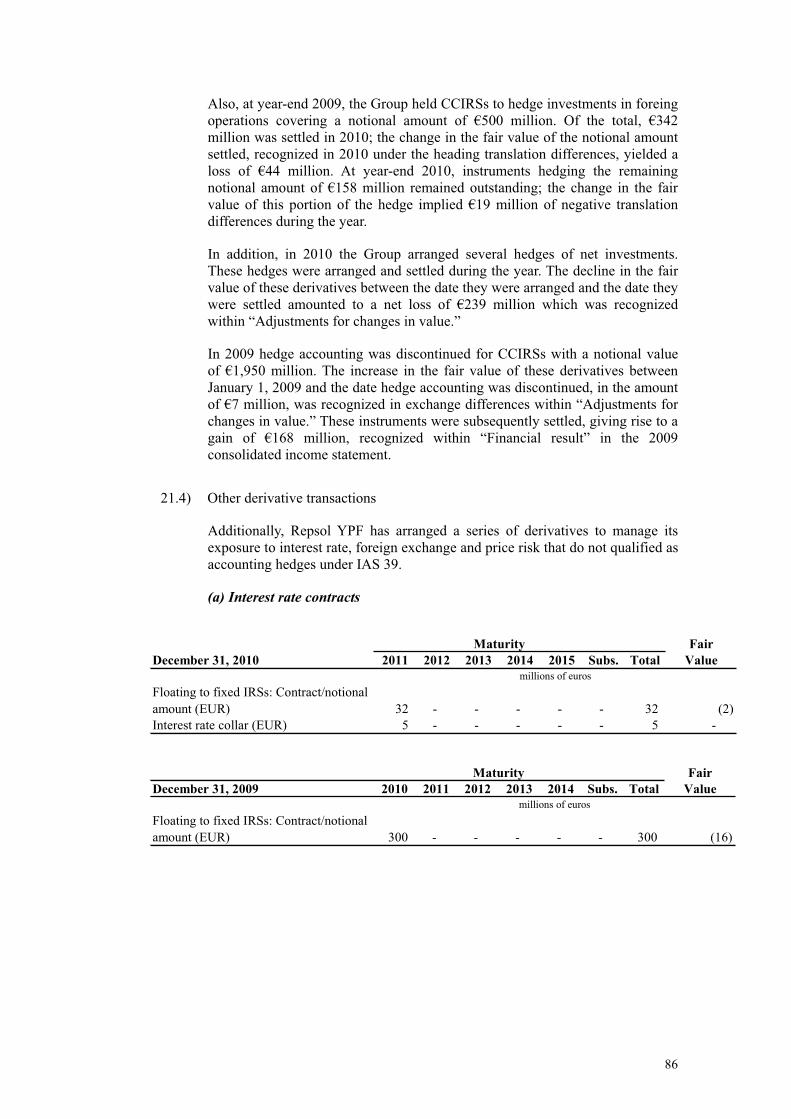
86
Also, at year-end 2009, the Group held CCIRSs to hedge investments in foreing operations covering a notional amount of €500 million. Of the total, €342 million was settled in 2010; the change in the fair value of the notional amount settled, recognized in 2010 under the heading translation differences, yielded a loss of €44 million. At year-end 2010, instruments hedging the remaining notional amount of €158 million remained outstanding; the change in the fair value of this portion of the hedge implied €19 million of negative translation differences during the year.
In addition, in 2010 the Group arranged several hedges of net investments. These hedges were arranged and settled during the year. The decline in the fair value of these derivatives between the date they were arranged and the date they were settled amounted to a net loss of €239 million which was recognized within “Adjustments for changes in value.”
In 2009 hedge accounting was discontinued for CCIRSs with a notional value of €1,950 million. The increase in the fair value of these derivatives between January 1, 2009 and the date hedge accounting was discontinued, in the amount of €7 million, was recognized in exchange differences within “Adjustments for changes in value.” These instruments were subsequently settled, giving rise to a gain of €168 million, recognized within “Financial result” in the 2009 consolidated income statement.
21.4) Other derivative transactions
Additionally, Repsol YPF has arranged a series of derivatives to manage its exposure to interest rate, foreign exchange and price risk that do not qualified as accounting hedges under IAS 39.
(a) Interest rate contracts
FairDecember 31, 2010 2011 2012 2013 2014 2015 Subs. Total Value
Floating to fixed IRSs: Contract/notional amount (EUR) 32 - - - - - 32 (2) Interest rate collar (EUR) 5 - - - - - 5 -
millions of euros
Maturity
FairDecember 31, 2009 2010 2011 2012 2013 2014 Subs. Total Value
Floating to fixed IRSs: Contract/notional amount (EUR) 300 - - - - - 300 (16)
millions of euros
Maturity
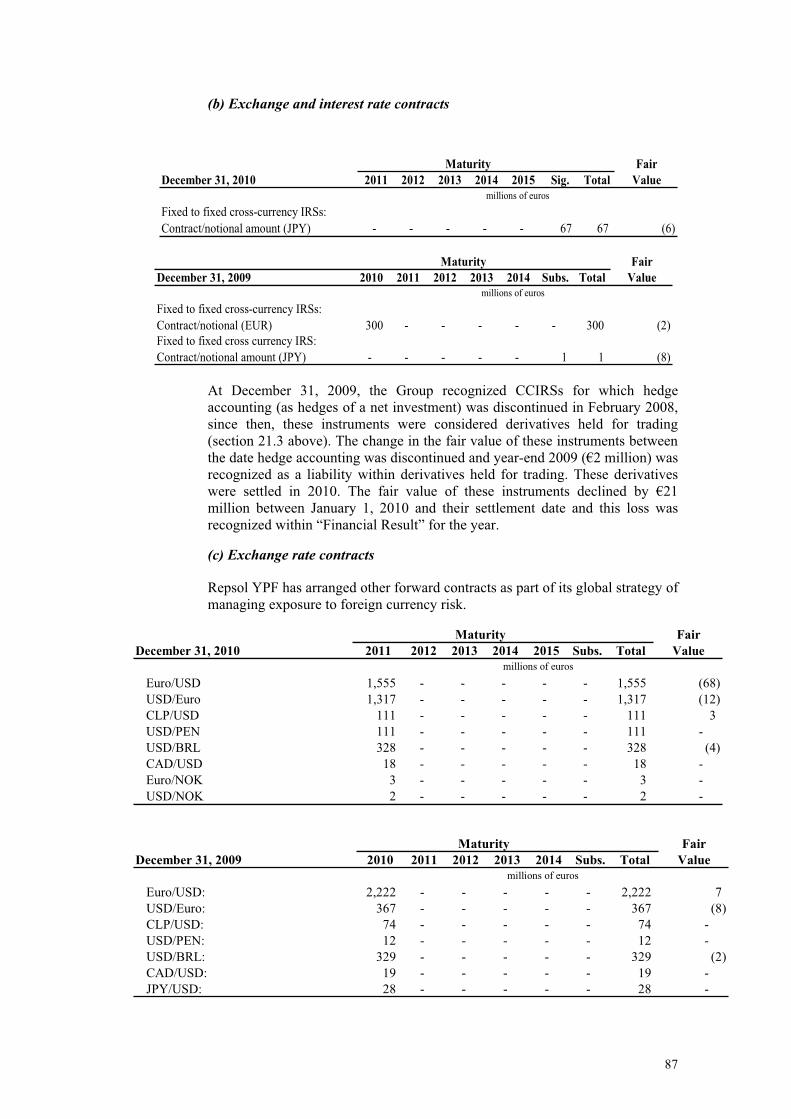
87
(b) Exchange and interest rate contracts
FairDecember 31, 2010 2011 2012 2013 2014 2015 Sig. Total Value
Fixed to fixed cross-currency IRSs: Contract/notional amount (JPY) - - - - - 67 67 (6)
millions of euros
Maturity
FairDecember 31, 2009 2010 2011 2012 2013 2014 Subs. Total Value
Fixed to fixed cross-currency IRSs: Contract/notional (EUR) 300 - - - - - 300 (2) Fixed to fixed cross currency IRS: Contract/notional amount (JPY) - - - - - 1 1 (8)
millions of euros
Maturity
At December 31, 2009, the Group recognized CCIRSs for which hedge accounting (as hedges of a net investment) was discontinued in February 2008, since then, these instruments were considered derivatives held for trading (section 21.3 above). The change in the fair value of these instruments between the date hedge accounting was discontinued and year-end 2009 (€2 million) was recognized as a liability within derivatives held for trading. These derivatives were settled in 2010. The fair value of these instruments declined by €21 million between January 1, 2010 and their settlement date and this loss was recognized within “Financial Result” for the year.
(c) Exchange rate contracts
Repsol YPF has arranged other forward contracts as part of its global strategy of managing exposure to foreign currency risk.
FairDecember 31, 2010 2011 2012 2013 2014 2015 Subs. Total Value
Euro/USD 1,555 - - - - - 1,555 (68)USD/Euro 1,317 - - - - - 1,317 (12)CLP/USD 111 - - - - - 111 3USD/PEN 111 - - - - - 111 -USD/BRL 328 - - - - - 328 (4)CAD/USD 18 - - - - - 18 -Euro/NOK 3 - - - - - 3 -USD/NOK 2 - - - - - 2 -
millions of euros
Maturity
FairDecember 31, 2009 2010 2011 2012 2013 2014 Subs. Total Value
Euro/USD: 2,222 - - - - - 2,222 7 USD/Euro: 367 - - - - - 367 (8) CLP/USD: 74 - - - - - 74 - USD/PEN: 12 - - - - - 12 - USD/BRL: 329 - - - - - 329 (2) CAD/USD: 19 - - - - - 19 - JPY/USD: 28 - - - - - 28 -
millions of euros
Maturity
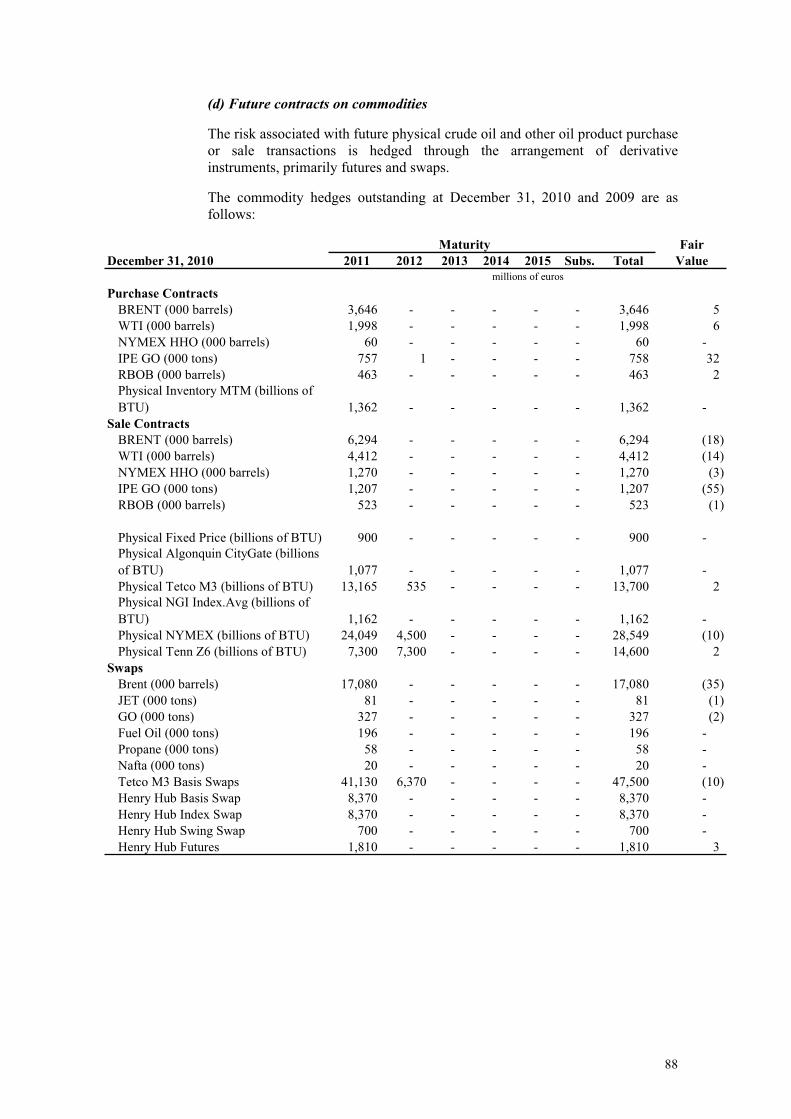
88
(d) Future contracts on commodities
The risk associated with future physical crude oil and other oil product purchase or sale transactions is hedged through the arrangement of derivative instruments, primarily futures and swaps.
The commodity hedges outstanding at December 31, 2010 and 2009 are as follows:
FairDecember 31, 2010 2011 2012 2013 2014 2015 Subs. Total Value
Purchase ContractsBRENT (000 barrels) 3,646 - - - - - 3,646 5 WTI (000 barrels) 1,998 - - - - - 1,998 6 NYMEX HHO (000 barrels) 60 - - - - - 60 - IPE GO (000 tons) 757 1 - - - - 758 32 RBOB (000 barrels) 463 - - - - - 463 2 Physical Inventory MTM (billions of BTU) 1,362 - - - - - 1,362 -
Sale ContractsBRENT (000 barrels) 6,294 - - - - - 6,294 (18) WTI (000 barrels) 4,412 - - - - - 4,412 (14) NYMEX HHO (000 barrels) 1,270 - - - - - 1,270 (3) IPE GO (000 tons) 1,207 - - - - - 1,207 (55) RBOB (000 barrels) 523 - - - - - 523 (1)
Physical Fixed Price (billions of BTU) 900 - - - - - 900 - Physical Algonquin CityGate (billions of BTU) 1,077 - - - - - 1,077 - Physical Tetco M3 (billions of BTU) 13,165 535 - - - - 13,700 2 Physical NGI Index.Avg (billions of BTU) 1,162 - - - - - 1,162 - Physical NYMEX (billions of BTU) 24,049 4,500 - - - - 28,549 (10) Physical Tenn Z6 (billions of BTU) 7,300 7,300 - - - - 14,600 2
SwapsBrent (000 barrels) 17,080 - - - - - 17,080 (35) JET (000 tons) 81 - - - - - 81 (1) GO (000 tons) 327 - - - - - 327 (2) Fuel Oil (000 tons) 196 - - - - - 196 - Propane (000 tons) 58 - - - - - 58 - Nafta (000 tons) 20 - - - - - 20 - Tetco M3 Basis Swaps 41,130 6,370 - - - - 47,500 (10) Henry Hub Basis Swap 8,370 - - - - - 8,370 - Henry Hub Index Swap 8,370 - - - - - 8,370 - Henry Hub Swing Swap 700 - - - - - 700 - Henry Hub Futures 1,810 - - - - - 1,810 3
millions of euros
Maturity
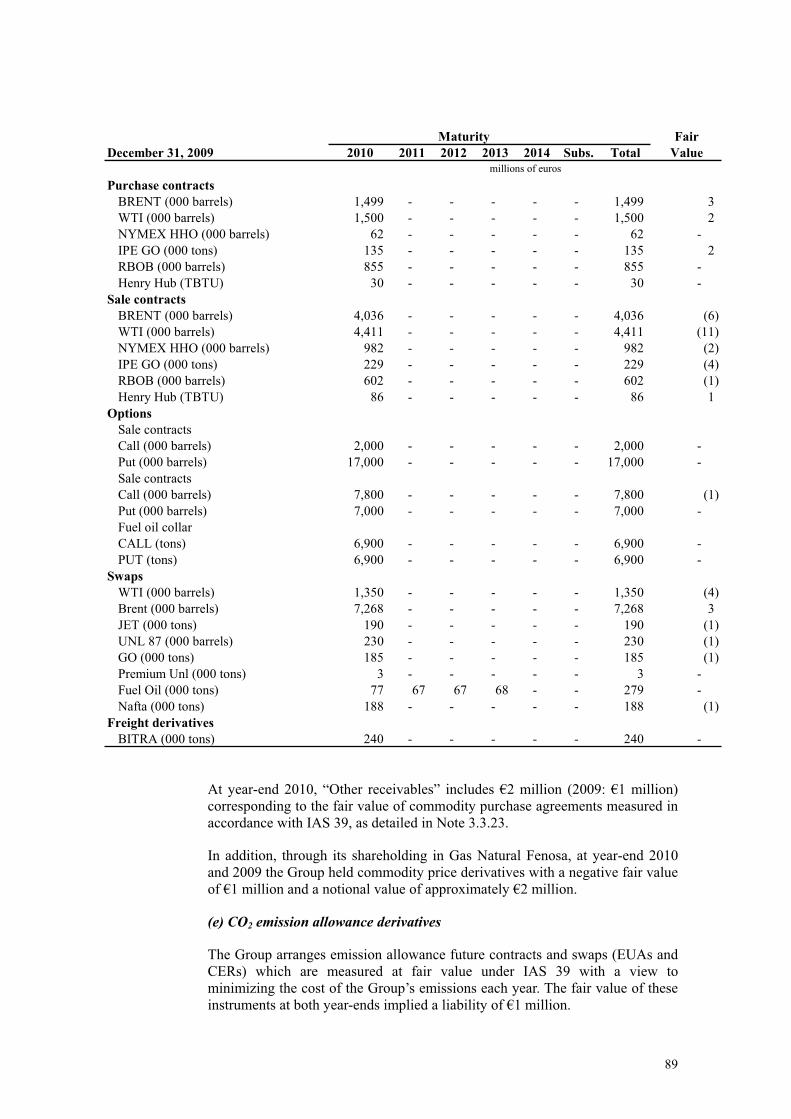
89
FairDecember 31, 2009 2010 2011 2012 2013 2014 Subs. Total Value
Purchase contractsBRENT (000 barrels) 1,499 - - - - - 1,499 3 WTI (000 barrels) 1,500 - - - - - 1,500 2 NYMEX HHO (000 barrels) 62 - - - - - 62 - IPE GO (000 tons) 135 - - - - - 135 2 RBOB (000 barrels) 855 - - - - - 855 - Henry Hub (TBTU) 30 - - - - - 30 -
Sale contractsBRENT (000 barrels) 4,036 - - - - - 4,036 (6) WTI (000 barrels) 4,411 - - - - - 4,411 (11) NYMEX HHO (000 barrels) 982 - - - - - 982 (2) IPE GO (000 tons) 229 - - - - - 229 (4) RBOB (000 barrels) 602 - - - - - 602 (1) Henry Hub (TBTU) 86 - - - - - 86 1
OptionsSale contractsCall (000 barrels) 2,000 - - - - - 2,000 - Put (000 barrels) 17,000 - - - - - 17,000 - Sale contractsCall (000 barrels) 7,800 - - - - - 7,800 (1) Put (000 barrels) 7,000 - - - - - 7,000 - Fuel oil collarCALL (tons) 6,900 - - - - - 6,900 - PUT (tons) 6,900 - - - - - 6,900 -
SwapsWTI (000 barrels) 1,350 - - - - - 1,350 (4) Brent (000 barrels) 7,268 - - - - - 7,268 3 JET (000 tons) 190 - - - - - 190 (1) UNL 87 (000 barrels) 230 - - - - - 230 (1) GO (000 tons) 185 - - - - - 185 (1) Premium Unl (000 tons) 3 - - - - - 3 - Fuel Oil (000 tons) 77 67 67 68 - - 279 - Nafta (000 tons) 188 - - - - - 188 (1)
Freight derivativesBITRA (000 tons) 240 - - - - - 240 -
millions of euros
Maturity
At year-end 2010, “Other receivables” includes €2 million (2009: €1 million) corresponding to the fair value of commodity purchase agreements measured in accordance with IAS 39, as detailed in Note 3.3.23.
In addition, through its shareholding in Gas Natural Fenosa, at year-end 2010 and 2009 the Group held commodity price derivatives with a negative fair value of €1 million and a notional value of approximately €2 million.
(e) CO2 emission allowance derivatives
The Group arranges emission allowance future contracts and swaps (EUAs and CERs) which are measured at fair value under IAS 39 with a view to minimizing the cost of the Group’s emissions each year. The fair value of these instruments at both year-ends implied a liability of €1 million.
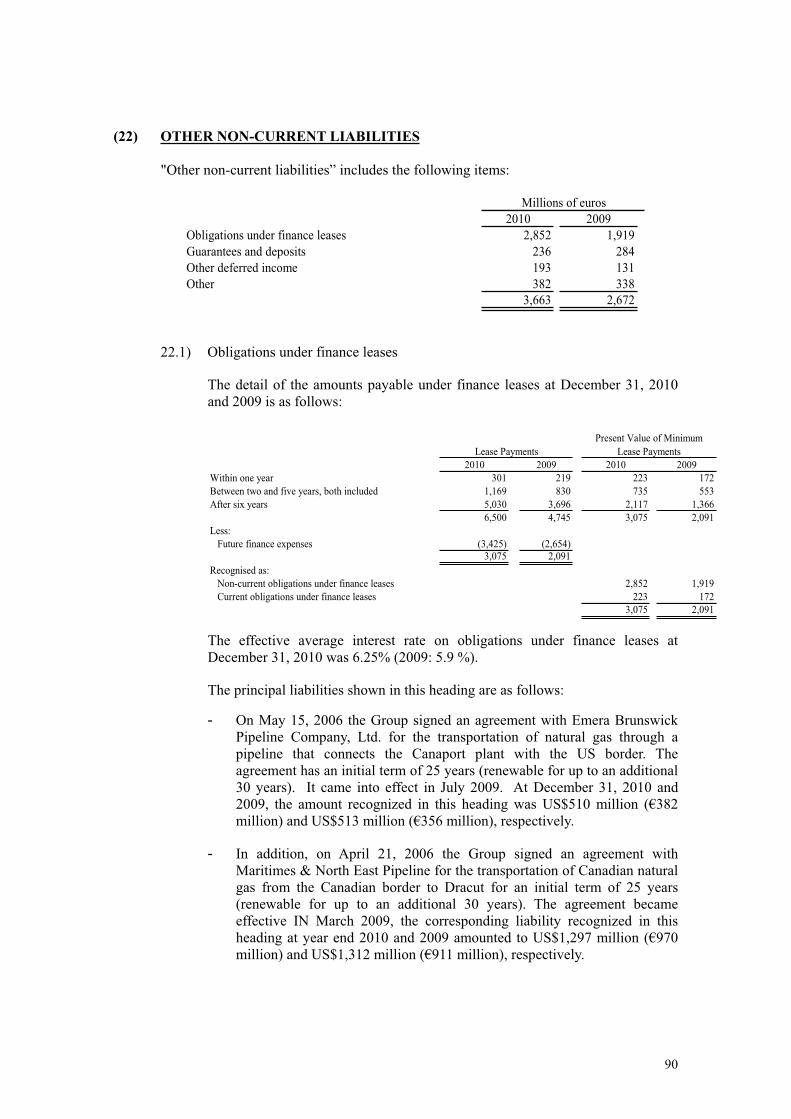
90
(22) OTHER NON-CURRENT LIABILITIES
"Other non-current liabilities” includes the following items:
2010 2009 Obligations under finance leases 2,852 1,919 Guarantees and deposits 236 284 Other deferred income 193 131 Other 382 338
3,663 2,672
Millions of euros
22.1) Obligations under finance leases
The detail of the amounts payable under finance leases at December 31, 2010 and 2009 is as follows:
2010 2009 2010 2009Within one year 301 219 223 172Between two and five years, both included 1,169 830 735 553After six years 5,030 3,696 2,117 1,366
6,500 4,745 3,075 2,091Less: Future finance expenses (3,425) (2,654)
3,075 2,091Recognised as: Non-current obligations under finance leases 2,852 1,919 Current obligations under finance leases 223 172
3,075 2,091
Lease PaymentsPresent Value of Minimum
Lease Payments
The effective average interest rate on obligations under finance leases at December 31, 2010 was 6.25% (2009: 5.9 %).
The principal liabilities shown in this heading are as follows:
- On May 15, 2006 the Group signed an agreement with Emera Brunswick Pipeline Company, Ltd. for the transportation of natural gas through a pipeline that connects the Canaport plant with the US border. The agreement has an initial term of 25 years (renewable for up to an additional 30 years). It came into effect in July 2009. At December 31, 2010 and 2009, the amount recognized in this heading was US$510 million (€382 million) and US$513 million (€356 million), respectively.
- In addition, on April 21, 2006 the Group signed an agreement with Maritimes & North East Pipeline for the transportation of Canadian natural gas from the Canadian border to Dracut for an initial term of 25 years (renewable for up to an additional 30 years). The agreement became effective IN March 2009, the corresponding liability recognized in this heading at year end 2010 and 2009 amounted to US$1,297 million (€970 million) and US$1,312 million (€911 million), respectively.
91
- In December 2007 Repsol YPF (50%) and Gas Natural Fenosa (50%) jointly acquired a 138,000 m3 methane ship under a 25-year time-charter arrangement. The agreement can be extended for consecutive 5-year periods and represents a combined investment of €164 million, a figure which corresponds to the present value of installment commitments. The amount recognized for this tanker in the Group’s consolidated balance sheet at year end 2010 and 2009 amounted to €110 million and €103 million, respectively.
- In 2009 Repsol YPF (50%) and Gas Natural Fenosa (50%) jointly acquired a 138,000 m3 methane ship under a 20-year time-charter arrangement. The agreement can be extended for consecutive 5-year periods and represents a combined investment of €142 million, a figure which corresponds to the present value of installment commitments. The amount recognized for this tanker in the consolidated balance sheet at December 31, 2010 and 2009 amounted to €109 million and €105 million, respectively.
- In 2010, four methane ships purchased for the transport of LNG in Peru were recognized amounting to €818 million. The Barcelona Knutsen, Sevilla Knutsen and Valencia Knutsen tankers, which have a capacity of 173,410 m3, were purchased under a 20-year time-charter arrangement. The agreement can be extended for consecutive 5-year periods. The Castillo de Santiesteban tanker, with a capacity of 173,600 m3 was likewise acquired under a 20-year time-charter agreement with a purchase option upon expiration.
- Finance leases at year end 2010 also include seven other methane tankers acquired prior to 2006 for the transport of LNG, which mature between 2022 and 2029, for €561 million (2009: €570 million). Four of these tankers are owned by Gas Natural Fenosa and the other three by Repsol YPF.
22.2) Guarantees and deposits
This heading includes, among others, deposits received by Repsol Butano, S.A. from the users of gas bottles in accordance with applicable legal regulations. These amounts are refundable when the corresponding contracts are canceled.
92
(23) TRADE PAYABLES AND OTHER PAYABLES
In 2010 and 2009 Repsol YPF had the following accounts payable classified under "Trade payables and other payables":
2010 2009
Trade payables 4,539 3,491
Obligations under finance leases (Note 22.1) 223 172Tax Payables 982 909Hedged items and derivatives on trading transactions at fair value 115 42Other 4,230 3,004
Other payables 5,550 4,127
Income tax liabilities 765 409Total 10,854 8,027
Millions of euros
The fair value of these current items does not differ significantly from their carrying amount.
At December 31, 2010, the balance of trade payables related to Spanish companies which exceed the payment period established by Spanish Law 15/2010, 2010 amounted to €5 million.
(24) TAX SITUATION
Income tax
In view of the geographical dispersion and markedly international nature of the business activities carried on by the companies comprising the Repsol YPF Group, the Group is subject to various different tax and income tax jurisdictions.
a) In Spain
Most of the entities resident in Spain pay income tax under the special consolidation regime. Under this regime, the companies in the Consolidated Tax Group jointly determine the Group’s taxable profit and tax charge, which is allocated among the companies in the Tax Group in accordance with the criteria established by the Spanish Accounting and Audit Institute (ICAC) for the recognition and determination of the individual tax charge.
Repsol YPF, S.A. is the parent of Consolidated Tax Group 6/80, which includes all the companies resident in Spain that are directly or indirectly at least 75% owned by the parent and that meet certain requirements. This Group consists of 48 companies in 2010, of which the main companies in terms of volume of business are as follows: Repsol YPF, S.A., Repsol Petróleo, S.A., Repsol YPF Trading y Transporte, S.A., Repsol Química, S.A., Repsol Butano, S.A., Repsol Exploración, S.A. and Repsol Comercial de Productos Petrolíferos, S.A.
93
Petróleos del Norte, S.A. (“Petronor”) is the parent of Consolidated Tax Group 02/01/B, which includes another two companies that paid income taxes under the Vizcaya Corporation Tax regulations.
Additionally, the consolidated financial statements include, through proportional consolidation, all the corporation tax items of the Gas Natural Fenosa Group. This Group is also taxed for corporation tax purposes under the special consolidated tax regime in Consolidated Tax Group 59/93, of which Gas Natural SDG, S.A. is the parent. The main companies of this Tax Group, in terms of volume of business, are the following: Gas Natural SDG, S.A., Gas Natural Castilla Léon, S.A., Gas Natural Distribución SDG, S.A, Gas Comercial Comercializadora, S.A., Gas Natural Aprovisionamientos, S.A. and Unión Fenosa Distribución, S.A.
Lastly, the other companies resident in Spain and not included in either of the aforementioned Tax Groups file individual corporation tax returns.
The Spanish companies, whether they pay tax on an individual or consolidated basis, apply the standard rate of 30%, with the exception of Repsol Investigaciones Petrolíferas, S.A., which is taxed individually at a rate of 35% under the Special Oil and Gas Regime, and the Petronor Group, which pays tax at 28% under the Vizcaya Corporation Tax regulations.
b) In Argentina
The Group companies resident in Argentina are liable to individual corporate income tax returns at a rate of 35% profit for the year.
Additionally, they calculate the minimum presumed income tax by applying the current tax rate of 1% of the computable assets at the balance sheet date, which may supplement the regular income tax. The tax obligation for each year will coincide with the higher of the two taxes. However, if the minimum presumed income tax exceeds the regular income tax, this excess can be computed as a prepayment of the amount by which the regular income tax exceeds the minimum presumed income tax in the following ten years.
c) In the other countries
The other Group companies are taxed in each of the countries in which they operate by applying the prevailing income tax rate to their profit or loss for the year. In addition, minimum presumed income taxes supplementing the regular income tax are recognized in certain countries.
On the other side, the Group companies resident in Spain and Argentina that carry on a portion of their business activities in other countries are subject to the income tax in force in those countries on the portion of their profit or loss obtained there. This is the case of the branches of the Spanish companies that carry on oil and gas exploration and production activities in other companies (such as Libya, Algeria, Peru or Ecuador).
94
The (nominal) income tax rates applicable in the main jurisdictions where the Group operates are as follows:
- Libya: 65% - Algeria: 38% plus the Tax on Extraordinary Income (TPE) - Trinidad and Tobago: 35% (gas), 55% and 57.25% (oil) - United States: 35% - Brazil: 34% - Ecuador: 25% - Peru: 30% - Bolivia: 25% - Venezuela: 34% (gas) y 50% (oil) - The Netherlands: 25.5% - Portugal: 29%
Income tax expense for accounting purposes
The detail of the income tax expense for accounting purposes in 2010 and 2009, calculated on the basis of the criteria indicated in section 3.3.21 of Note 3, Accounting Policies, is as follows:
Spanish Companies
Argentine Companies
Other companies TOTAL
Accounting profit before tax 1,641 1,416 3,556 6,613Adjustment to accounting profit:Non-temporary differences 2,210 (1) 292 (2,976) (2) (474)Temporary differences (317) 344 109 136Taxable profit 3,534 2,052 689 (3) 6,275Tax charge 1,060 723 533 2,316Tax credits (913) - - (913)Current tax payable 147 723 533 1,403Adjustments to current tax and foreign 539 (6) (22) 511 taxesTotal current income tax expense 686 717 511 1,914Deferred tax for the year 93 (119) (139) (165)Other adjustments to the income tax expense 170 (58) (119) (7)Total deferred tax expense 263 (177) (258) (172)Total income tax expense 949 540 253 1,742
Year 2010Millions of euros
(1) Corresponds primarily to dividends received from other Group companies that are included as taxable profit for Spanish income tax purposes.
(2) Corresponds primarily to the results from the capital increase carried out in Repsol Brasil, S.A. (3) This reflects the net of taxable profits and tax losses in various tax jurisdictions.
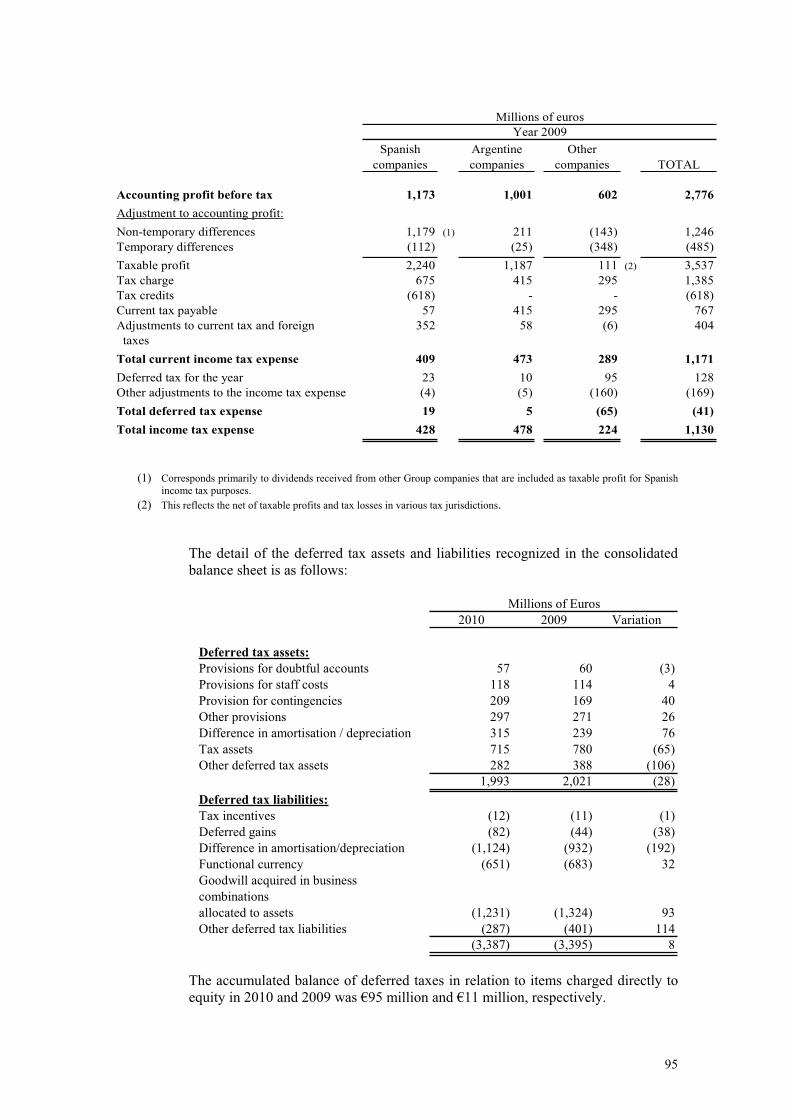
95
Spanish companies
Argentine companies
Other companies TOTAL
Accounting profit before tax 1,173 1,001 602 2,776Adjustment to accounting profit:Non-temporary differences 1,179 (1) 211 (143) 1,246Temporary differences (112) (25) (348) (485)Taxable profit 2,240 1,187 111 (2) 3,537Tax charge 675 415 295 1,385Tax credits (618) - - (618)Current tax payable 57 415 295 767Adjustments to current tax and foreign 352 58 (6) 404 taxesTotal current income tax expense 409 473 289 1,171Deferred tax for the year 23 10 95 128Other adjustments to the income tax expense (4) (5) (160) (169)Total deferred tax expense 19 5 (65) (41)Total income tax expense 428 478 224 1,130
Year 2009Millions of euros
(1) Corresponds primarily to dividends received from other Group companies that are included as taxable profit for Spanish income tax purposes.
(2) This reflects the net of taxable profits and tax losses in various tax jurisdictions.
The detail of the deferred tax assets and liabilities recognized in the consolidated balance sheet is as follows:
2010 2009 Variation
Deferred tax assets:Provisions for doubtful accounts 57 60 (3)Provisions for staff costs 118 114 4Provision for contingencies 209 169 40Other provisions 297 271 26Difference in amortisation / depreciation 315 239 76Tax assets 715 780 (65)Other deferred tax assets 282 388 (106)
1,993 2,021 (28)Deferred tax liabilities:Tax incentives (12) (11) (1)Deferred gains (82) (44) (38)Difference in amortisation/depreciation (1,124) (932) (192)Functional currency (651) (683) 32Goodwill acquired in businesscombinationsallocated to assets (1,231) (1,324) 93Other deferred tax liabilities (287) (401) 114
(3,387) (3,395) 8
Millions of Euros
The accumulated balance of deferred taxes in relation to items charged directly to equity in 2010 and 2009 was €95 million and €11 million, respectively.
96
The Group did not recognized deferred tax assets in the amount of €583 million and €489 million in 2010 and 2009, respectively, corresponding mainly to tax losses carried forward and unused deductions, as these did not fulfill the criteria for registration in accordance with IFRS.
The Group has not recorded deferred tax liabilities in the amount of €119 million and €115 million, in 2010 and 2009, respectively, as it corresponds to taxable temporary differences related to investments in subsidiaries, branches and associated companies that meet the requirements established in IFRS to apply the recognition exception.
Other tax related disclosures
Deductions taken in 2010 amounted to €913 million, arising mainly from the mechanics to avoid double taxation, both domestically and internationally, and to a lesser degree, from investments made.
Judicial and administrative decisions have been taken both in this period and in previous periods, leading to tax consequences contrary to the Group's expectations.
Repsol YPF considers that it has acted lawfully in these matters at all times and that its actions are based on reasonable interpretations of the applicable legislation and, therefore, it has filed the appropriate appeals to defend its interests and those of its shareholders.
However, in view of the uncertainty concerning the materialization of the existing tax contingencies, at year end the Group had recognized provisions under “Other Provisions” (Note 17) that were considered adequate to cover those tax contingencies. The amount recorded in the balance sheet at December 31, 2010 and 2009 for this item amounted to €588 million and €473 million respectively. Such provision relates to the vast number of actions, none of which, individually, represents a significant percentage of such provision.
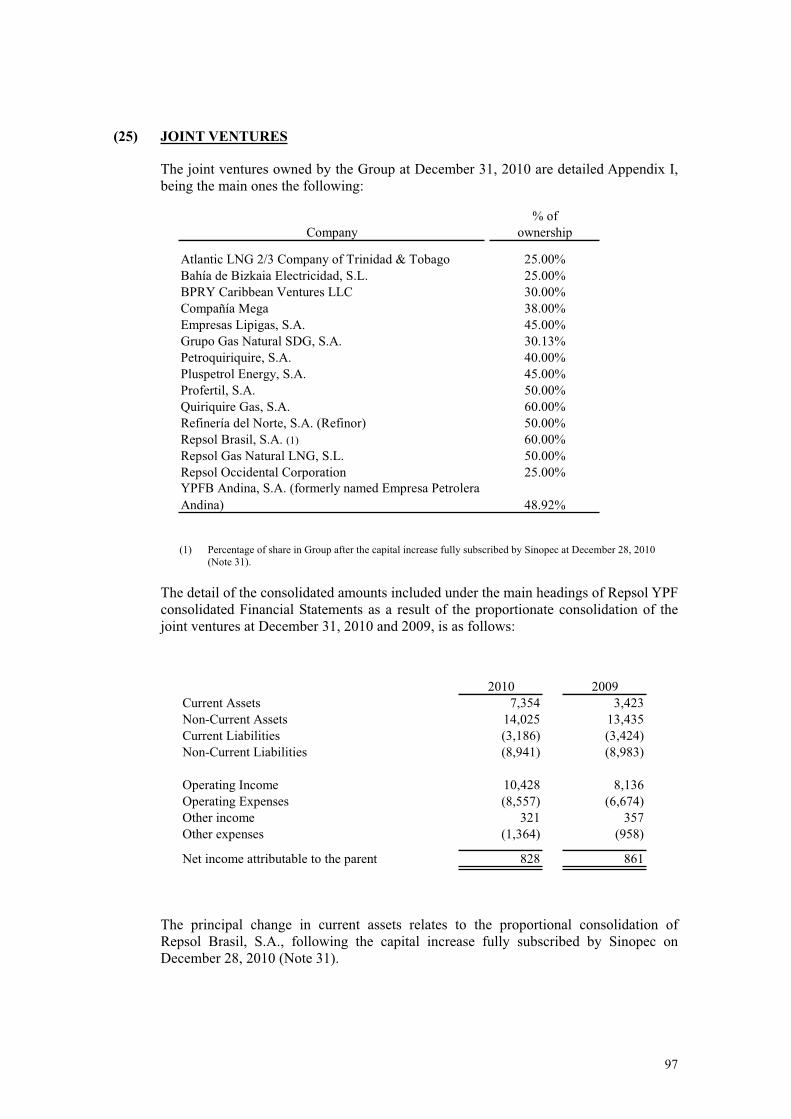
97
(25) JOINT VENTURES
The joint ventures owned by the Group at December 31, 2010 are detailed Appendix I, being the main ones the following:
% ofCompany ownership
Atlantic LNG 2/3 Company of Trinidad & Tobago 25.00%Bahía de Bizkaia Electricidad, S.L. 25.00%BPRY Caribbean Ventures LLC 30.00%Compañía Mega 38.00%Empresas Lipigas, S.A. 45.00%Grupo Gas Natural SDG, S.A. 30.13%Petroquiriquire, S.A. 40.00%Pluspetrol Energy, S.A. 45.00%Profertil, S.A. 50.00%Quiriquire Gas, S.A. 60.00%Refinería del Norte, S.A. (Refinor) 50.00%Repsol Brasil, S.A. (1) 60.00%Repsol Gas Natural LNG, S.L. 50.00%Repsol Occidental Corporation 25.00%YPFB Andina, S.A. (formerly named Empresa Petrolera Andina) 48.92%
(1) Percentage of share in Group after the capital increase fully subscribed by Sinopec at December 28, 2010 (Note 31).
The detail of the consolidated amounts included under the main headings of Repsol YPF consolidated Financial Statements as a result of the proportionate consolidation of the joint ventures at December 31, 2010 and 2009, is as follows:
2010 2009Current Assets 7,354 3,423Non-Current Assets 14,025 13,435Current Liabilities (3,186) (3,424)Non-Current Liabilities (8,941) (8,983)
Operating Income 10,428 8,136Operating Expenses (8,557) (6,674)Other income 321 357Other expenses (1,364) (958)
Net income attributable to the parent 828 861
The principal change in current assets relates to the proportional consolidation of Repsol Brasil, S.A., following the capital increase fully subscribed by Sinopec on December 28, 2010 (Note 31).
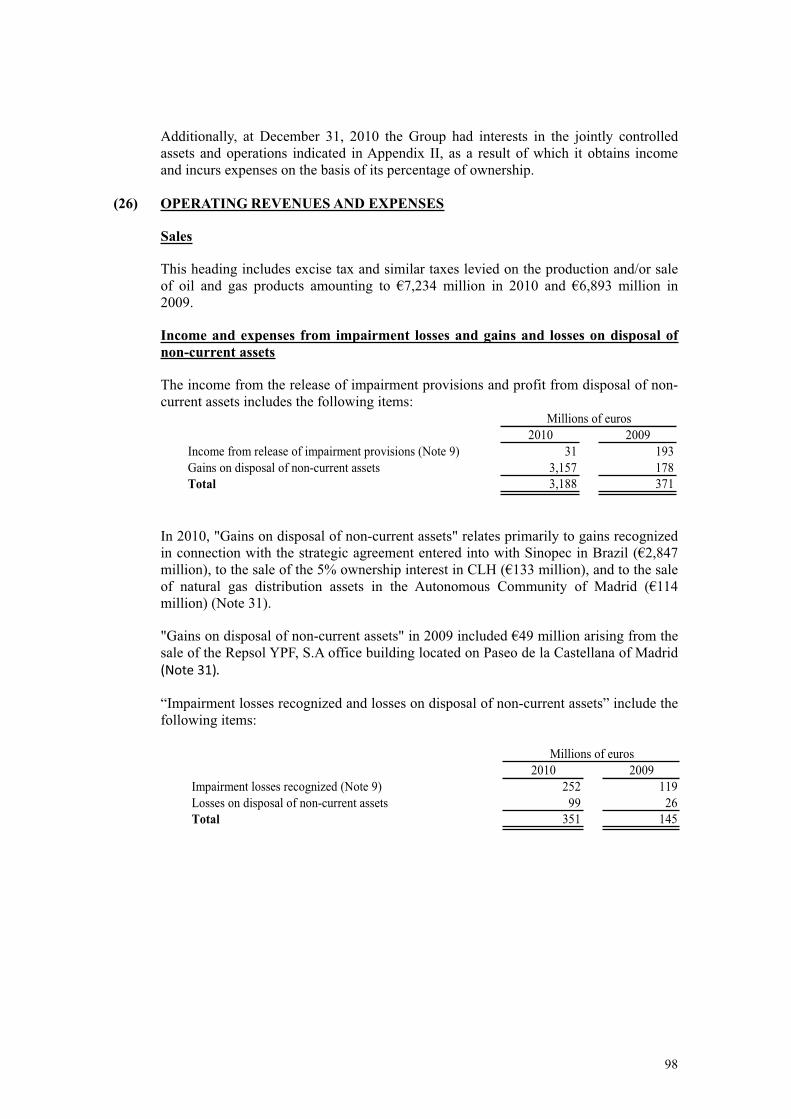
98
Additionally, at December 31, 2010 the Group had interests in the jointly controlled assets and operations indicated in Appendix II, as a result of which it obtains income and incurs expenses on the basis of its percentage of ownership.
(26) OPERATING REVENUES AND EXPENSES
Sales
This heading includes excise tax and similar taxes levied on the production and/or sale of oil and gas products amounting to €7,234 million in 2010 and €6,893 million in 2009.
Income and expenses from impairment losses and gains and losses on disposal of non-current assets
The income from the release of impairment provisions and profit from disposal of non-current assets includes the following items:
2010 2009Income from release of impairment provisions (Note 9) 31 193Gains on disposal of non-current assets 3,157 178Total 3,188 371
Millions of euros
In 2010, "Gains on disposal of non-current assets" relates primarily to gains recognized in connection with the strategic agreement entered into with Sinopec in Brazil (€2,847 million), to the sale of the 5% ownership interest in CLH (€133 million), and to the sale of natural gas distribution assets in the Autonomous Community of Madrid (€114 million) (Note 31).
"Gains on disposal of non-current assets" in 2009 included €49 million arising from the sale of the Repsol YPF, S.A office building located on Paseo de la Castellana of Madrid (Note 31).
“Impairment losses recognized and losses on disposal of non-current assets” include the following items:
2010 2009Impairment losses recognized (Note 9) 252 119Losses on disposal of non-current assets 99 26Total 351 145
Millions of euros
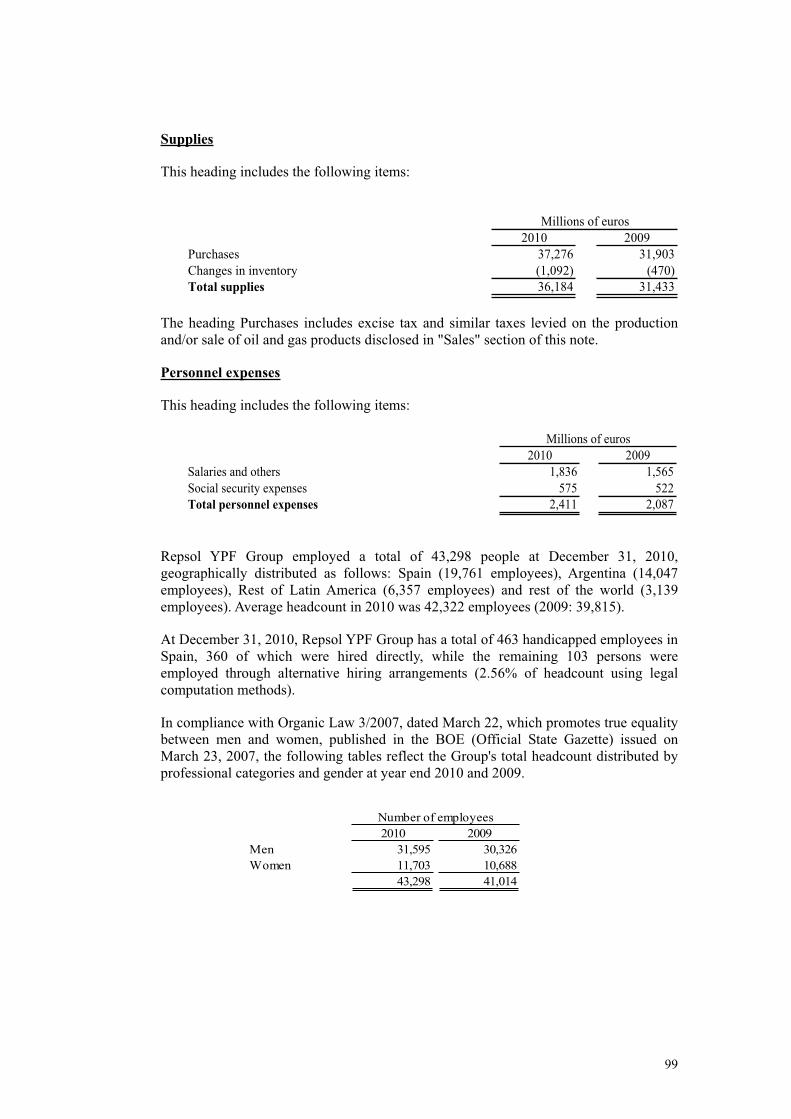
99
Supplies
This heading includes the following items:
2010 2009Purchases 37,276 31,903Changes in inventory (1,092) (470)Total supplies 36,184 31,433
Millions of euros
The heading Purchases includes excise tax and similar taxes levied on the production and/or sale of oil and gas products disclosed in "Sales" section of this note.
Personnel expenses
This heading includes the following items:
2010 2009Salaries and others 1,836 1,565Social security expenses 575 522Total personnel expenses 2,411 2,087
Millions of euros
Repsol YPF Group employed a total of 43,298 people at December 31, 2010, geographically distributed as follows: Spain (19,761 employees), Argentina (14,047 employees), Rest of Latin America (6,357 employees) and rest of the world (3,139 employees). Average headcount in 2010 was 42,322 employees (2009: 39,815).
At December 31, 2010, Repsol YPF Group has a total of 463 handicapped employees in Spain, 360 of which were hired directly, while the remaining 103 persons were employed through alternative hiring arrangements (2.56% of headcount using legal computation methods).
In compliance with Organic Law 3/2007, dated March 22, which promotes true equality between men and women, published in the BOE (Official State Gazette) issued on March 23, 2007, the following tables reflect the Group's total headcount distributed by professional categories and gender at year end 2010 and 2009.
2010 2009Men 31,595 30,326Women 11,703 10,688
43,298 41,014
Number of employees
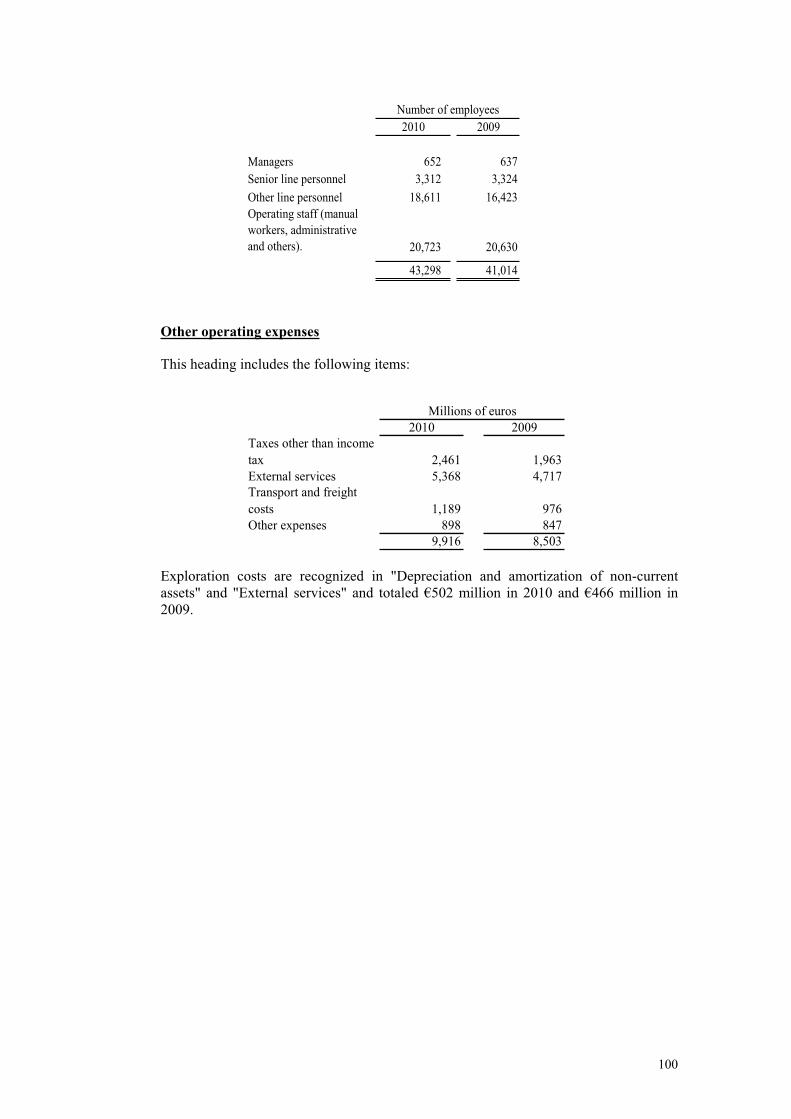
100
2009
Managers 652 637Senior line personnel 3,312 3,324Other line personnel 18,611 16,423Operating staff (manual workers, administrative and others). 20,723 20,630
43,298 41,014
2010Number of employees
Other operating expenses
This heading includes the following items:
2010 2009Taxes other than income tax 2,461 1,963External services 5,368 4,717Transport and freight costs 1,189 976Other expenses 898 847
9,916 8,503
Millions of euros
Exploration costs are recognized in "Depreciation and amortization of non-current assets" and "External services" and totaled €502 million in 2010 and €466 million in 2009.
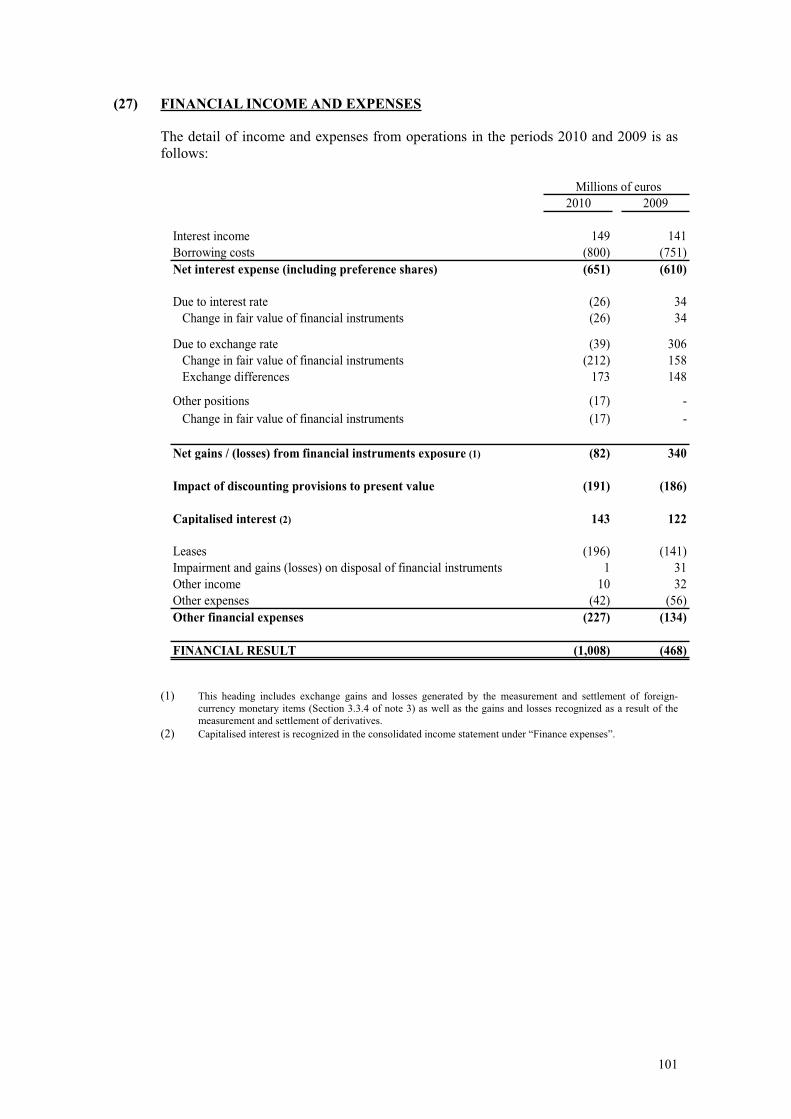
101
(27) FINANCIAL INCOME AND EXPENSES
The detail of income and expenses from operations in the periods 2010 and 2009 is as follows:
2010 2009
Interest income 149 141Borrowing costs (800) (751)Net interest expense (including preference shares) (651) (610)
Due to interest rate (26) 34 Change in fair value of financial instruments (26) 34
Due to exchange rate (39) 306 Change in fair value of financial instruments (212) 158 Exchange differences 173 148
Other positions (17) - Change in fair value of financial instruments (17) -
Net gains / (losses) from financial instruments exposure (1) (82) 340
Impact of discounting provisions to present value (191) (186)
Capitalised interest (2) 143 122
Leases (196) (141)Impairment and gains (losses) on disposal of financial instruments 1 31Other income 10 32Other expenses (42) (56)Other financial expenses (227) (134)
FINANCIAL RESULT (1,008) (468)
Millions of euros
(1) This heading includes exchange gains and losses generated by the measurement and settlement of foreign-currency monetary items (Section 3.3.4 of note 3) as well as the gains and losses recognized as a result of the measurement and settlement of derivatives.
(2) Capitalised interest is recognized in the consolidated income statement under “Finance expenses”.
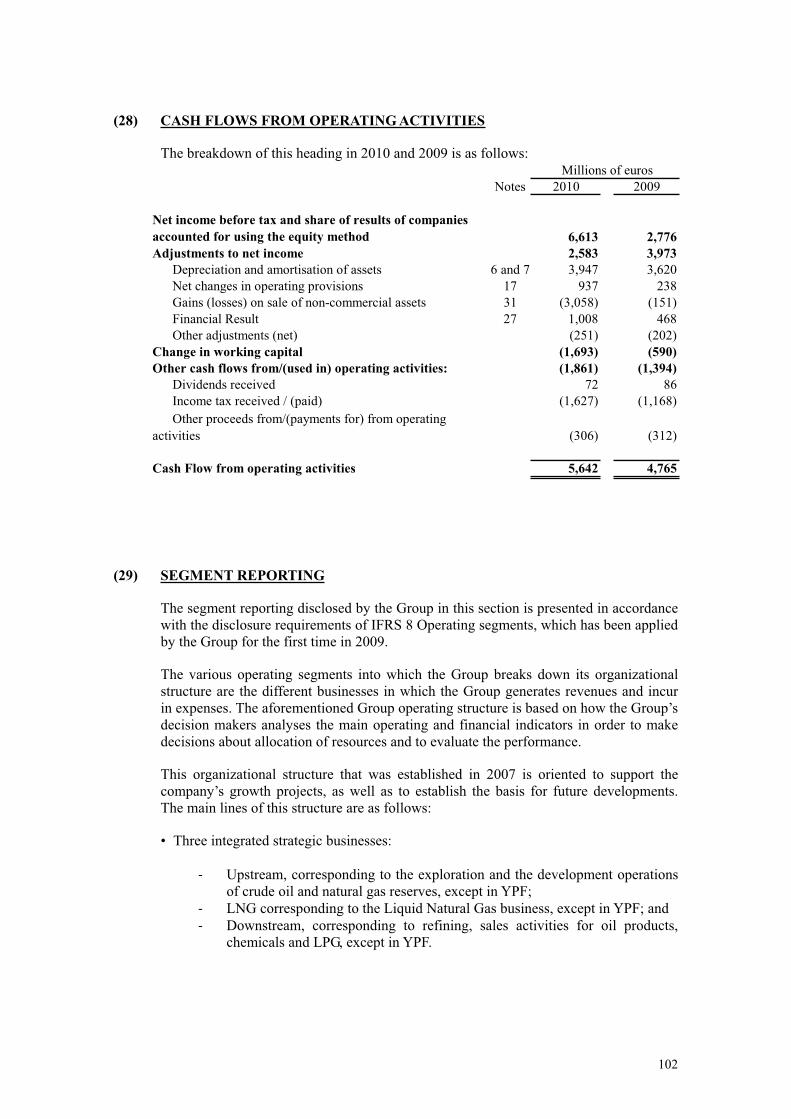
102
(28) CASH FLOWS FROM OPERATING ACTIVITIES
The breakdown of this heading in 2010 and 2009 is as follows:
Notes 2010 2009
Net income before tax and share of results of companies accounted for using the equity method 6,613 2,776Adjustments to net income 2,583 3,973 Depreciation and amortisation of assets 6 and 7 3,947 3,620 Net changes in operating provisions 17 937 238 Gains (losses) on sale of non-commercial assets 31 (3,058) (151) Financial Result 27 1,008 468 Other adjustments (net) (251) (202)Change in working capital (1,693) (590)Other cash flows from/(used in) operating activities: (1,861) (1,394) Dividends received 72 86 Income tax received / (paid) (1,627) (1,168) Other proceeds from/(payments for) from operating activities (306) (312)
Cash Flow from operating activities 5,642 4,765
Millions of euros
(29) SEGMENT REPORTING
The segment reporting disclosed by the Group in this section is presented in accordance with the disclosure requirements of IFRS 8 Operating segments, which has been applied by the Group for the first time in 2009.
The various operating segments into which the Group breaks down its organizational structure are the different businesses in which the Group generates revenues and incur in expenses. The aforementioned Group operating structure is based on how the Group’s decision makers analyses the main operating and financial indicators in order to make decisions about allocation of resources and to evaluate the performance.
This organizational structure that was established in 2007 is oriented to support the company’s growth projects, as well as to establish the basis for future developments. The main lines of this structure are as follows:
• Three integrated strategic businesses:
Upstream, corresponding to the exploration and the development operations of crude oil and natural gas reserves, except in YPF; LNG corresponding to the Liquid Natural Gas business, except in YPF; and Downstream, corresponding to refining, sales activities for oil products, chemicals and LPG, except in YPF.
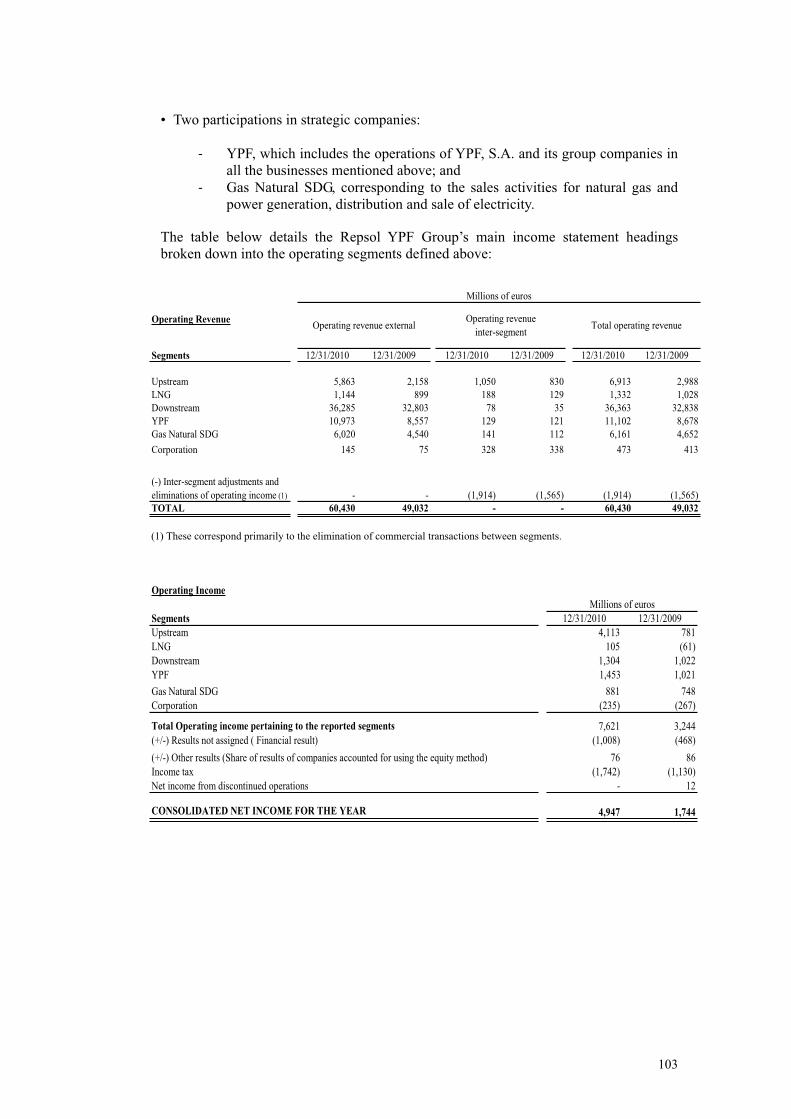
103
• Two participations in strategic companies:
YPF, which includes the operations of YPF, S.A. and its group companies in all the businesses mentioned above; and Gas Natural SDG, corresponding to the sales activities for natural gas and power generation, distribution and sale of electricity.
The table below details the Repsol YPF Group’s main income statement headings broken down into the operating segments defined above:
Operating Revenue
Segments 12/31/2010 12/31/2009 12/31/2010 12/31/2009 12/31/2010 12/31/2009
Upstream 5,863 2,158 1,050 830 6,913 2,988LNG 1,144 899 188 129 1,332 1,028Downstream 36,285 32,803 78 35 36,363 32,838YPF 10,973 8,557 129 121 11,102 8,678Gas Natural SDG 6,020 4,540 141 112 6,161 4,652Corporation 145 75 328 338 473 413
(-) Inter-segment adjustments and eliminations of operating income (1) - - (1,914) (1,565) (1,914) (1,565)TOTAL 60,430 49,032 - - 60,430 49,032
Operating revenue external Operating revenue inter-segment
Millions of euros
Total operating revenue
(1) These correspond primarily to the elimination of commercial transactions between segments.
Operating Income
Segments 12/31/2010 12/31/2009Upstream 4,113 781LNG 105 (61)Downstream 1,304 1,022YPF 1,453 1,021Gas Natural SDG 881 748Corporation (235) (267)
Total Operating income pertaining to the reported segments 7,621 3,244(+/-) Results not assigned ( Financial result) (1,008) (468)(+/-) Other results (Share of results of companies accounted for using the equity method) 76 86Income tax (1,742) (1,130)Net income from discontinued operations - 12
CONSOLIDATED NET INCOME FOR THE YEAR 4,947 1,744
Millions of euros
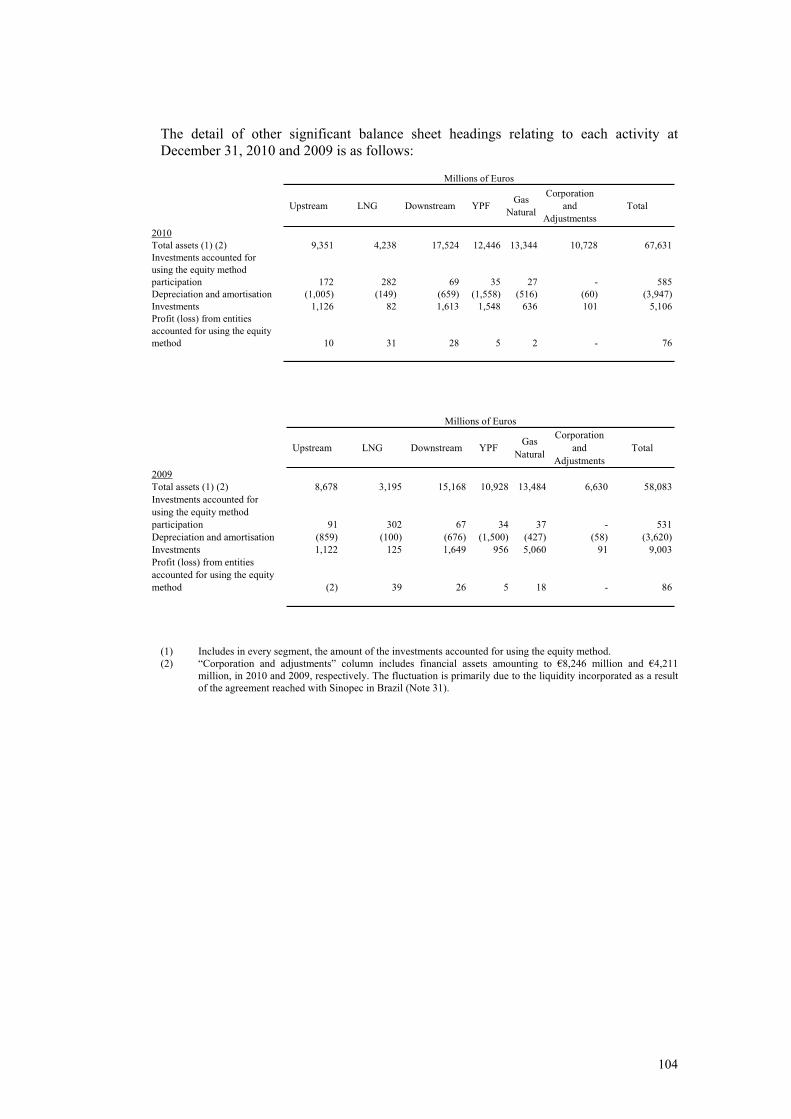
104
The detail of other significant balance sheet headings relating to each activity at December 31, 2010 and 2009 is as follows:
Upstream LNG Downstream YPF Gas Natural
Corporation and
AdjustmentssTotal
2010Total assets (1) (2) 9,351 4,238 17,524 12,446 13,344 10,728 67,631Investments accounted forusing the equity methodparticipation 172 282 69 35 27 - 585Depreciation and amortisation (1,005) (149) (659) (1,558) (516) (60) (3,947)Investments 1,126 82 1,613 1,548 636 101 5,106Profit (loss) from entitiesaccounted for using the equitymethod 10 31 28 5 2 - 76
Millions of Euros
Upstream LNG Downstream YPF Gas Natural
Corporation and
AdjustmentsTotal
2009Total assets (1) (2) 8,678 3,195 15,168 10,928 13,484 6,630 58,083Investments accounted forusing the equity methodparticipation 91 302 67 34 37 - 531Depreciation and amortisation (859) (100) (676) (1,500) (427) (58) (3,620)Investments 1,122 125 1,649 956 5,060 91 9,003Profit (loss) from entitiesaccounted for using the equitymethod (2) 39 26 5 18 - 86
Millions of Euros
(1) Includes in every segment, the amount of the investments accounted for using the equity method. (2) “Corporation and adjustments” column includes financial assets amounting to €8,246 million and €4,211
million, in 2010 and 2009, respectively. The fluctuation is primarily due to the liquidity incorporated as a result of the agreement reached with Sinopec in Brazil (Note 31).
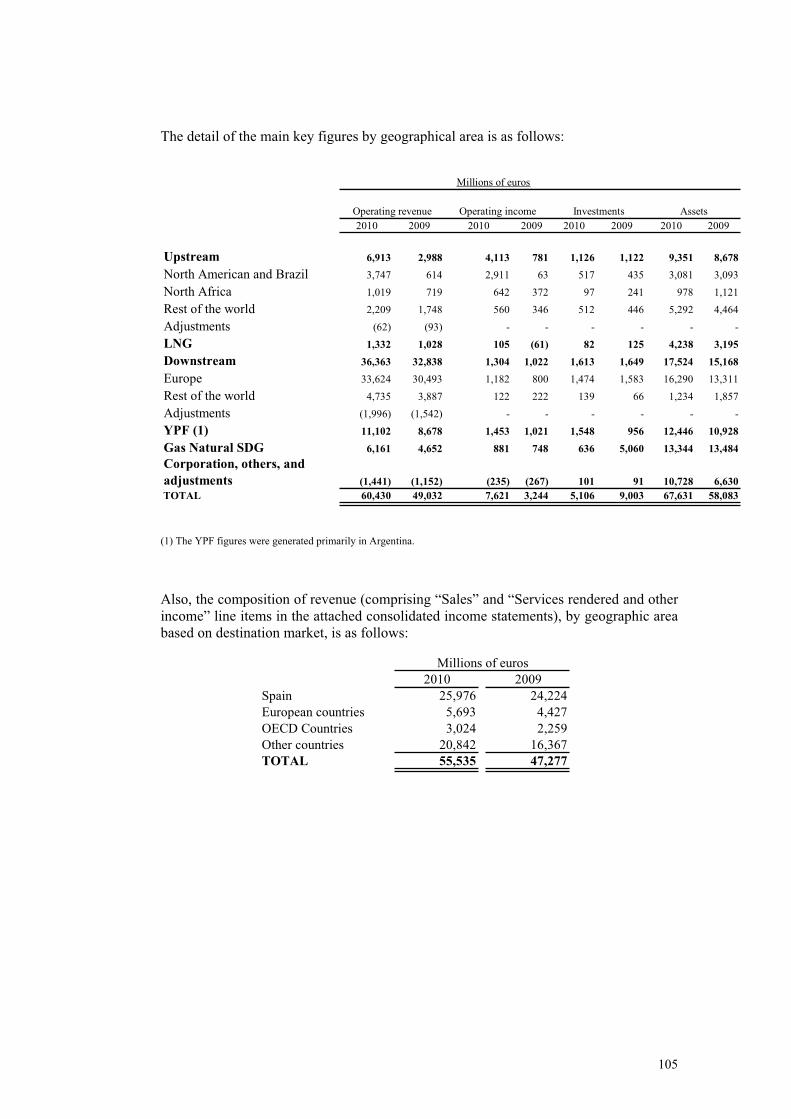
105
The detail of the main key figures by geographical area is as follows:
2010 2009 2010 2009 2010 2009 2010 2009
Upstream 6,913 2,988 4,113 781 1,126 1,122 9,351 8,678North American and Brazil 3,747 614 2,911 63 517 435 3,081 3,093North Africa 1,019 719 642 372 97 241 978 1,121Rest of the world 2,209 1,748 560 346 512 446 5,292 4,464Adjustments (62) (93) - - - - - -LNG 1,332 1,028 105 (61) 82 125 4,238 3,195Downstream 36,363 32,838 1,304 1,022 1,613 1,649 17,524 15,168Europe 33,624 30,493 1,182 800 1,474 1,583 16,290 13,311Rest of the world 4,735 3,887 122 222 139 66 1,234 1,857Adjustments (1,996) (1,542) - - - - - -YPF (1) 11,102 8,678 1,453 1,021 1,548 956 12,446 10,928Gas Natural SDG 6,161 4,652 881 748 636 5,060 13,344 13,484Corporation, others, and adjustments (1,441) (1,152) (235) (267) 101 91 10,728 6,630TOTAL 60,430 49,032 7,621 3,244 5,106 9,003 67,631 58,083
AssetsOperating revenue Operating income
Millions of euros
Investments
(1) The YPF figures were generated primarily in Argentina.
Also, the composition of revenue (comprising “Sales” and “Services rendered and other income” line items in the attached consolidated income statements), by geographic area based on destination market, is as follows:
2010 2009Spain 25,976 24,224European countries 5,693 4,427OECD Countries 3,024 2,259Other countries 20,842 16,367TOTAL 55,535 47,277
Millions of euros
106
(30) BUSINESS COMBINATIONS AND CHANGES IN COMPOSITION OF THE GROUP
Repsol YPF prepares its consolidated Financial Statements including the investments in all its subsidiaries, affiliated companies and joint ventures. Appendix I of the consolidated Financial Statements details the subsidiaries, affiliated companies and joint ventures, held directly or indirectly by Repsol YPF, S.A., which were included in the scope of consolidation during 2010 and 2009. The main business combinations made in 2010 and 2009 are detailed below.
2010 Acquisitions
With effective date February 1, 2010, the productive area Barúa-Motatán located in the Lake Maracaibo basin was incorporated as an asset to be operated by mixed-ownership company Petroquiriquire, S.A. In 2009, Venezuela´s National Assembly published in the official Gazette of the Bolivarian Republic its approval of the activities of Petroquiriquire, S.A., in which Repsol YPF holds a 40% interest, in the production area Barúa-Motatán.
This transaction gives effect to the credit notes amounting to US$173 million (€131 million) received as part of the process of migrating the operating agreements over to the mixed companies and cancells an account receivable from PDVSA amounting to US$34 million (€26 million).The related amount corresponds entirely to property, plant and equipment acquired in connection with this allocation. No goodwill was generated as a result of the transaction (Note 2).
The net profit contributed by the incorporation of the Barúa-Motatán production activities since the date of acquisition amounted to US$36 million (€28 million).
On February 10, 2010, the MENPET awarded the concession of the area of Carabobo 1 to the consortium led by Repsol (11%), and its partners Petronas (11%), OVL (11%), and Indoil (7%). The Venezuelan CVP will maintain its 60% ownership interest. The area will be managed by the mixed-ownership company Petrocarabobo, S.A. This project consists in developing, in conjunction with PDVSA, the heavy crude oil reserves of the blocks Carabobo 1 North and Carabobo 1 Center, located in the Orinoco oil belt. The profit recognized in relation with this company in 2010 was less than €1 million.
Acquisition of Unión Fenosa (2009)
The amounts given in this section related to Gas Natural’s acquisition of an interest in Unión Fenosa take into account the Repsol Group’s ownership interest in Gas Natural Fenosa, which as of the date of these consolidated financial statements is 30.89%, except for amounts stated in percentage terms which reflect Gas Natural Fenosa’s 100% stake.
At December 31, 2008, Gas Natural SDG, S.A. held a 14.7% stake in Unión Fenosa (9.9% acquired from ACS on August 5, 2008, under a share purchase agreement signed on July 30, 2008, and 4.7% acquired from Caixanova on December 12, 2008), which was classified under the heading “Financial assets available for sale”. The corresponding acquisition cost amounted to €756 million (proportionate to Repsol Group’s interest in Gas Natural Fenosa).
107
In addition, in 2008, Gas Natural arranged various Equity Swaps and a share purchase agreement with Caja Navarra entitling it to acquire, in 2009, 9.7% of the voting rights in Unión Fenosa at an average price of €17.33 per share. These contracts were recognized at their fair value as derivatives under “Financial assets designated at fair value through profit and loss” (Notes 12 and 21).
Under the share purchase agreement with ACS, mentioned above, the acquisition of the construction group’s remaining 35.3% shareholding in Unión Fenosa was subject to anti-trust approval. On February 26, 2009, having obtained this authorization, Gas Natural proceeded to acquire the additional 35.3% stake for €1,797 million (pro rata for the Repsol Group’s shareholding in Gas Natural Fenosa). This transaction provided Gas Natural with 50% of the voting rights in Unión Fenosa, above the 30% threshold laid down in the Spanish Takeover Code (“OPA”), triggering a takeover bid for all outstanding shares of Unión Fenosa, S.A. it did not already own. Until conclusion of this tender offer, Gas Natural’s voting rights in Unión Fenosa were limited to 30%, entitling it to appoint 4 out of a total of 20 Directors in the Board of Directors.
This level of board representation provided Gas Natural with significant influence for accounting purposes; accordingly, from February 28, 2009, its investment in Unión Fenosa, S.A. was considered an investment in an associate and was accounted in the Gas Natural Fenosa Group’s financial statements under the equity method.
The takeover tender offer was approved by the Spanish Securities Market Regulator (“CNMV” for its initials in Spanish) on March 18. On April 21, the regulator notified Gas Natural Fenosa the positive outcome of the offer. Consequently, Gas Natural SDG, S.A. acquired an additional 34.8% of Unión Fenosa for €1,771 million (pro rata for the Repsol Group’s shareholding in Gas Natural Fenosa). In April 2009, Gas Natural Fenosa acquired an additional 10.1% as a result of the settlement of the various equity swaps previously arranged, and an additional 0.3% as a result of settlement of a share purchase agreement executed in 2008 in the amount of €532 million (pro rata for the Repsol Group’s shareholding in Gas Natural Fenosa). All these acquisitions provided Gas Natural Fenosa a total shareholding in Unión Fenosa, S.A. of 95.2% for €4,880 million (pro rata for the Repsol Group’s shareholding in Gas Natural Fenosa). Following the takeover bid, Repsol YPF’s shareholding in Gas Natural Fenosa was 30.89%.
The proposed merger of Unión Fenosa, S.A. and Unión Fenosa Generación, S.A. (absorbed companies) into Gas Natural SDG, S.A. (absorbing company), via the dissolution without liquidation of the absorbed companies and the transfer in block of all their assets and liabilities to the absorbing company, was approved at the General Shareholders’ Meeting on June 26, 2009.
On September 1, having met all the legal deadlines and obtained all pertinent regulatory approvals, the merger was filed with the Mercantile Register (“Registro Mercantil”), taking effect on that same date. As a result of the approved exchange ratios, on which an independent expert issued a fairness opinion, Gas Natural SDG, S.A. issued 26,204,895 shares. This shares-issue was targeted exclusively at minority shareholders of Unión Fenosa. As a result of this capital increase, Repsol YPF’s shareholding in Gas Natural Fenosa since September 1, 2009 was established at 30.01%.
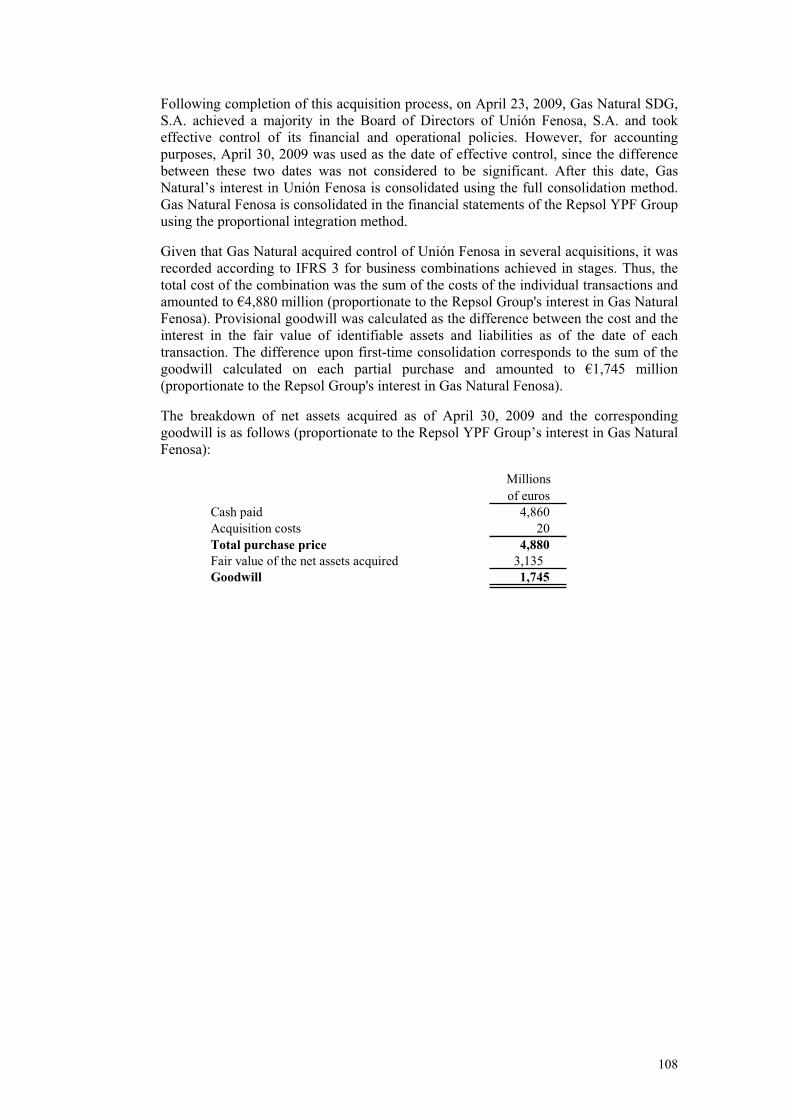
108
Following completion of this acquisition process, on April 23, 2009, Gas Natural SDG, S.A. achieved a majority in the Board of Directors of Unión Fenosa, S.A. and took effective control of its financial and operational policies. However, for accounting purposes, April 30, 2009 was used as the date of effective control, since the difference between these two dates was not considered to be significant. After this date, Gas Natural’s interest in Unión Fenosa is consolidated using the full consolidation method. Gas Natural Fenosa is consolidated in the financial statements of the Repsol YPF Group using the proportional integration method.
Given that Gas Natural acquired control of Unión Fenosa in several acquisitions, it was recorded according to IFRS 3 for business combinations achieved in stages. Thus, the total cost of the combination was the sum of the costs of the individual transactions and amounted to €4,880 million (proportionate to the Repsol Group's interest in Gas Natural Fenosa). Provisional goodwill was calculated as the difference between the cost and the interest in the fair value of identifiable assets and liabilities as of the date of each transaction. The difference upon first-time consolidation corresponds to the sum of the goodwill calculated on each partial purchase and amounted to €1,745 million (proportionate to the Repsol Group's interest in Gas Natural Fenosa).
The breakdown of net assets acquired as of April 30, 2009 and the corresponding goodwill is as follows (proportionate to the Repsol YPF Group’s interest in Gas Natural Fenosa):
Millionsof euros
Cash paid 4,860 Acquisition costs 20 Total purchase price 4,880 Fair value of the net assets acquired 3,135Goodwill 1,745
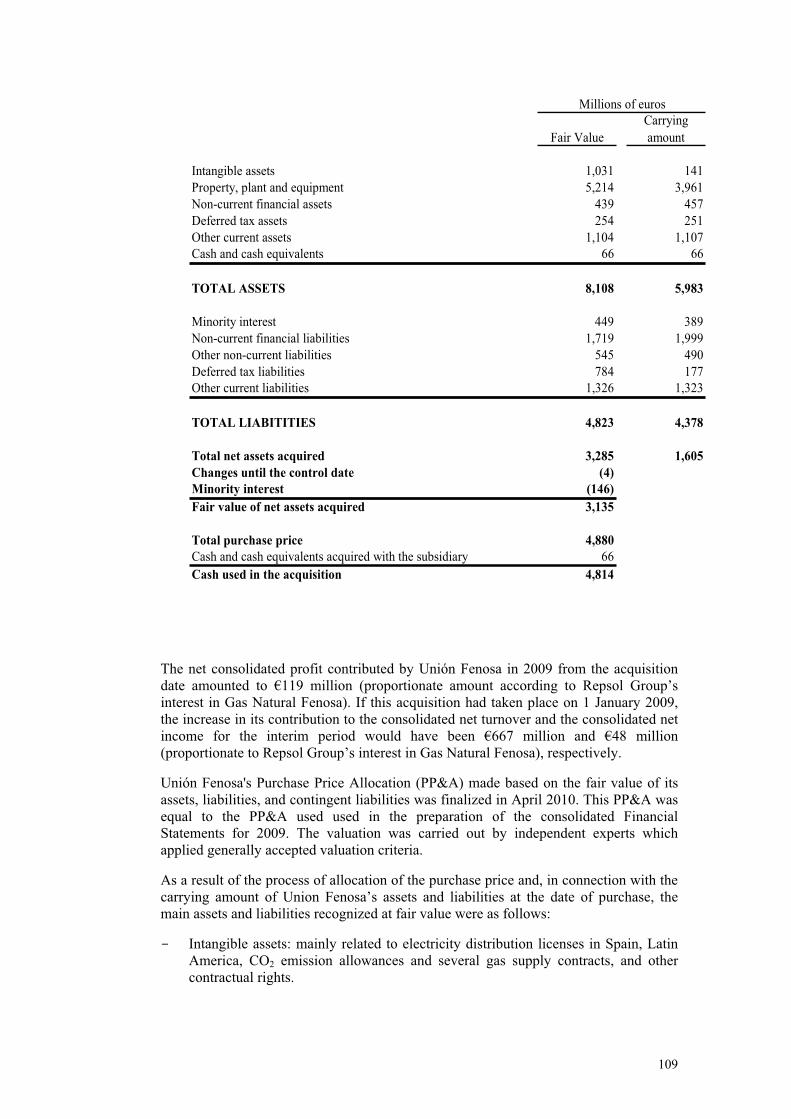
109
Fair ValueCarrying amount
Intangible assets 1,031 141Property, plant and equipment 5,214 3,961Non-current financial assets 439 457Deferred tax assets 254 251Other current assets 1,104 1,107Cash and cash equivalents 66 66
TOTAL ASSETS 8,108 5,983
Minority interest 449 389Non-current financial liabilities 1,719 1,999Other non-current liabilities 545 490Deferred tax liabilities 784 177Other current liabilities 1,326 1,323
TOTAL LIABITITIES 4,823 4,378
Total net assets acquired 3,285 1,605Changes until the control date (4)Minority interest (146)Fair value of net assets acquired 3,135
Total purchase price 4,880Cash and cash equivalents acquired with the subsidiary 66Cash used in the acquisition 4,814
Millions of euros
The net consolidated profit contributed by Unión Fenosa in 2009 from the acquisition date amounted to €119 million (proportionate amount according to Repsol Group’s interest in Gas Natural Fenosa). If this acquisition had taken place on 1 January 2009, the increase in its contribution to the consolidated net turnover and the consolidated net income for the interim period would have been €667 million and €48 million (proportionate to Repsol Group’s interest in Gas Natural Fenosa), respectively.
Unión Fenosa's Purchase Price Allocation (PP&A) made based on the fair value of its assets, liabilities, and contingent liabilities was finalized in April 2010. This PP&A was equal to the PP&A used used in the preparation of the consolidated Financial Statements for 2009. The valuation was carried out by independent experts which applied generally accepted valuation criteria.
As a result of the process of allocation of the purchase price and, in connection with the carrying amount of Union Fenosa’s assets and liabilities at the date of purchase, the main assets and liabilities recognized at fair value were as follows:
- Intangible assets: mainly related to electricity distribution licenses in Spain, Latin America, CO2 emission allowances and several gas supply contracts, and other contractual rights.
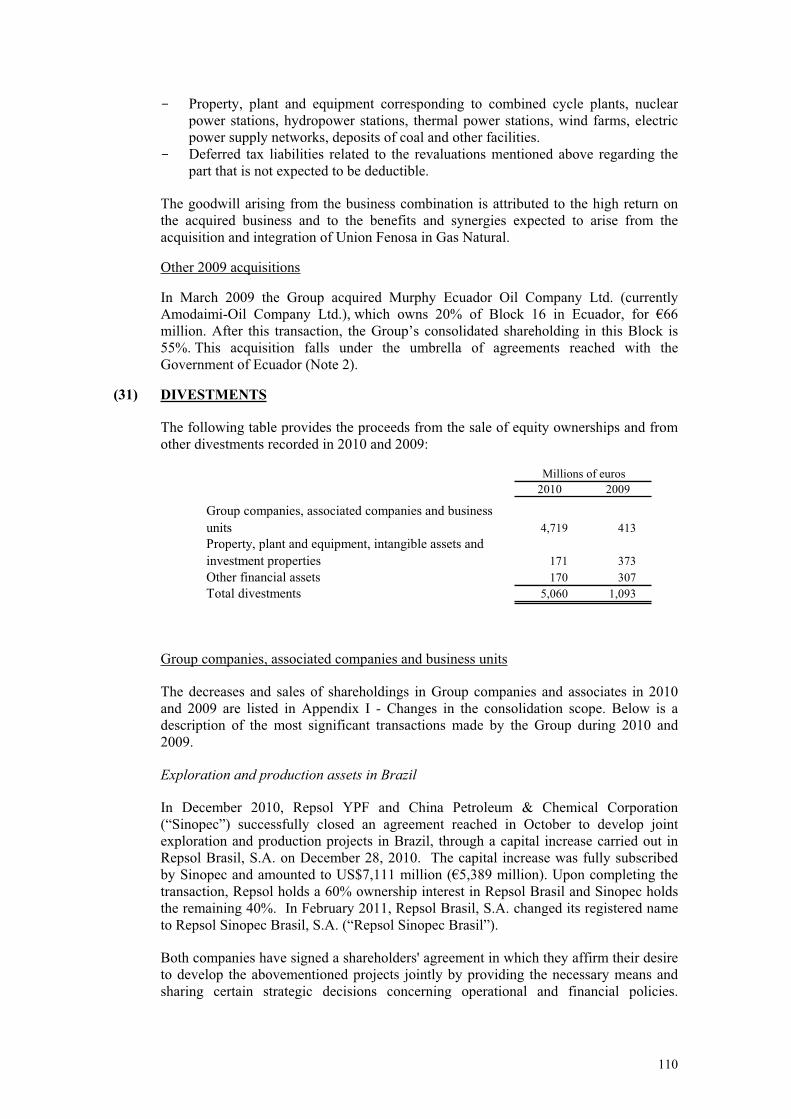
110
- Property, plant and equipment corresponding to combined cycle plants, nuclear power stations, hydropower stations, thermal power stations, wind farms, electric power supply networks, deposits of coal and other facilities.
- Deferred tax liabilities related to the revaluations mentioned above regarding the part that is not expected to be deductible.
The goodwill arising from the business combination is attributed to the high return on the acquired business and to the benefits and synergies expected to arise from the acquisition and integration of Union Fenosa in Gas Natural.
Other 2009 acquisitions
In March 2009 the Group acquired Murphy Ecuador Oil Company Ltd. (currently Amodaimi-Oil Company Ltd.), which owns 20% of Block 16 in Ecuador, for €66 million. After this transaction, the Group’s consolidated shareholding in this Block is 55%. This acquisition falls under the umbrella of agreements reached with the Government of Ecuador (Note 2).
(31) DIVESTMENTS
The following table provides the proceeds from the sale of equity ownerships and from other divestments recorded in 2010 and 2009:
2010 2009
Group companies, associated companies and business units 4,719 413 Property, plant and equipment, intangible assets and investment properties 171 373 Other financial assets 170 307 Total divestments 5,060 1,093
Millions of euros
Group companies, associated companies and business units
The decreases and sales of shareholdings in Group companies and associates in 2010 and 2009 are listed in Appendix I - Changes in the consolidation scope. Below is a description of the most significant transactions made by the Group during 2010 and 2009.
Exploration and production assets in Brazil
In December 2010, Repsol YPF and China Petroleum & Chemical Corporation (“Sinopec”) successfully closed an agreement reached in October to develop joint exploration and production projects in Brazil, through a capital increase carried out in Repsol Brasil, S.A. on December 28, 2010. The capital increase was fully subscribed by Sinopec and amounted to US$7,111 million (€5,389 million). Upon completing the transaction, Repsol holds a 60% ownership interest in Repsol Brasil and Sinopec holds the remaining 40%. In February 2011, Repsol Brasil, S.A. changed its registered name to Repsol Sinopec Brasil, S.A. (“Repsol Sinopec Brasil”).
Both companies have signed a shareholders' agreement in which they affirm their desire to develop the abovementioned projects jointly by providing the necessary means and sharing certain strategic decisions concerning operational and financial policies.
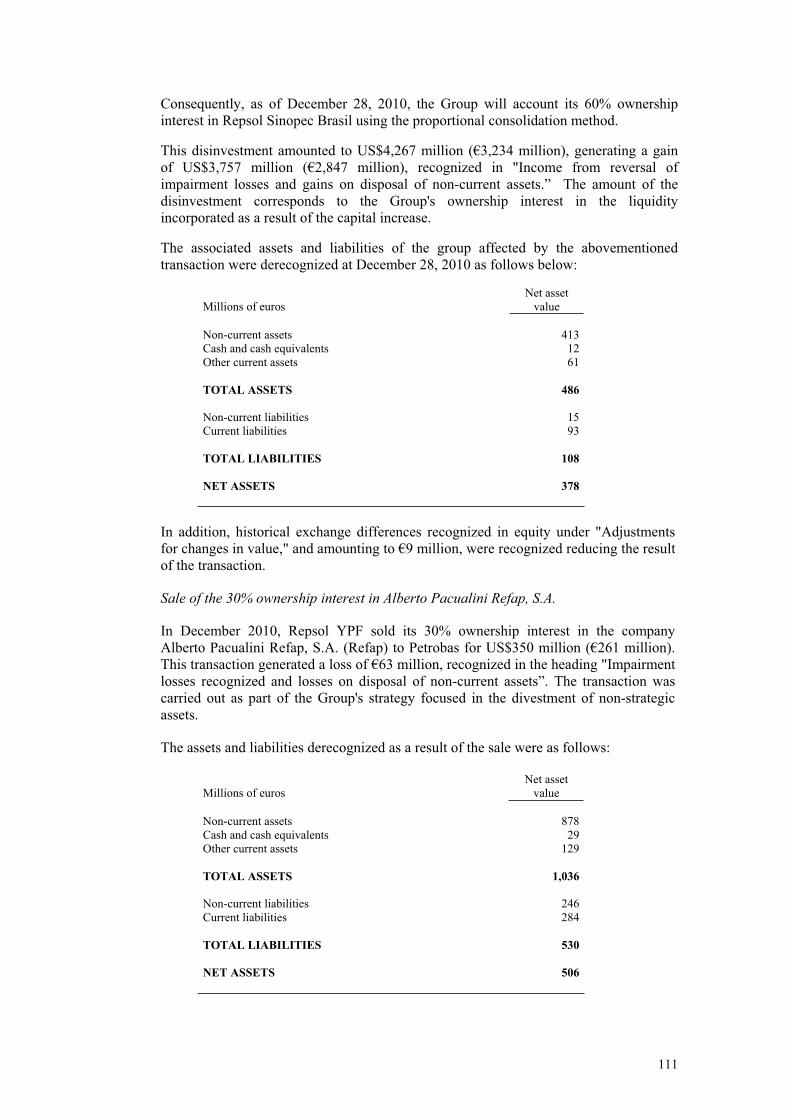
111
Consequently, as of December 28, 2010, the Group will account its 60% ownership interest in Repsol Sinopec Brasil using the proportional consolidation method.
This disinvestment amounted to US$4,267 million (€3,234 million), generating a gain of US$3,757 million (€2,847 million), recognized in "Income from reversal of impairment losses and gains on disposal of non-current assets.” The amount of the disinvestment corresponds to the Group's ownership interest in the liquidity incorporated as a result of the capital increase.
The associated assets and liabilities of the group affected by the abovementioned transaction were derecognized at December 28, 2010 as follows below:
Millions of euros Net asset
value
Non-current assets 413Cash and cash equivalents 12Other current assets 61
TOTAL ASSETS 486
Non-current liabilities 15Current liabilities 93
TOTAL LIABILITIES 108
NET ASSETS 378
In addition, historical exchange differences recognized in equity under "Adjustments for changes in value," and amounting to €9 million, were recognized reducing the result of the transaction.
Sale of the 30% ownership interest in Alberto Pacualini Refap, S.A.
In December 2010, Repsol YPF sold its 30% ownership interest in the company Alberto Pacualini Refap, S.A. (Refap) to Petrobas for US$350 million (€261 million). This transaction generated a loss of €63 million, recognized in the heading "Impairment losses recognized and losses on disposal of non-current assets”. The transaction was carried out as part of the Group's strategy focused in the divestment of non-strategic assets.
The assets and liabilities derecognized as a result of the sale were as follows:
Millions of euros Net asset
value
Non-current assets 878Cash and cash equivalents 29Other current assets 129
TOTAL ASSETS 1,036
Non-current liabilities 246Current liabilities 284
TOTAL LIABILITIES 530
NET ASSETS 506
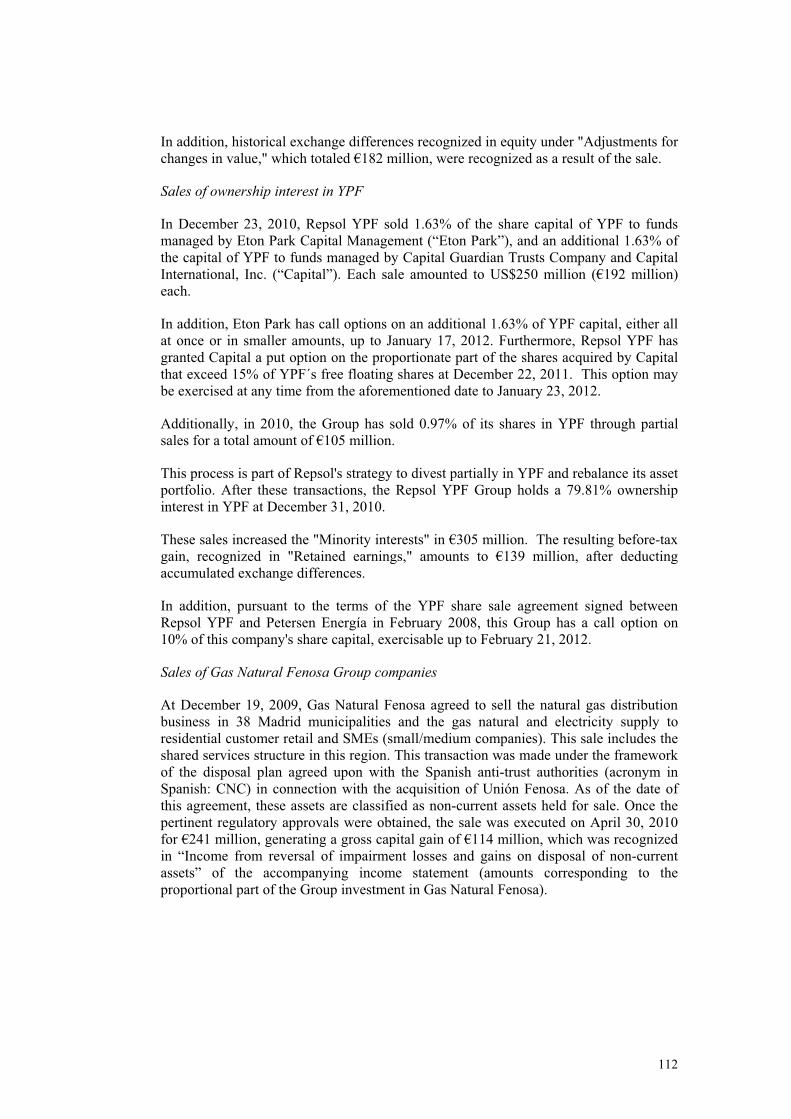
112
In addition, historical exchange differences recognized in equity under "Adjustments for changes in value," which totaled €182 million, were recognized as a result of the sale.
Sales of ownership interest in YPF
In December 23, 2010, Repsol YPF sold 1.63% of the share capital of YPF to funds managed by Eton Park Capital Management (“Eton Park”), and an additional 1.63% of the capital of YPF to funds managed by Capital Guardian Trusts Company and Capital International, Inc. (“Capital”). Each sale amounted to US$250 million (€192 million) each.
In addition, Eton Park has call options on an additional 1.63% of YPF capital, either all at once or in smaller amounts, up to January 17, 2012. Furthermore, Repsol YPF has granted Capital a put option on the proportionate part of the shares acquired by Capital that exceed 15% of YPF´s free floating shares at December 22, 2011. This option may be exercised at any time from the aforementioned date to January 23, 2012.
Additionally, in 2010, the Group has sold 0.97% of its shares in YPF through partial sales for a total amount of €105 million.
This process is part of Repsol's strategy to divest partially in YPF and rebalance its asset portfolio. After these transactions, the Repsol YPF Group holds a 79.81% ownership interest in YPF at December 31, 2010.
These sales increased the "Minority interests" in €305 million. The resulting before-tax gain, recognized in "Retained earnings," amounts to €139 million, after deducting accumulated exchange differences.
In addition, pursuant to the terms of the YPF share sale agreement signed between Repsol YPF and Petersen Energía in February 2008, this Group has a call option on 10% of this company's share capital, exercisable up to February 21, 2012.
Sales of Gas Natural Fenosa Group companies
At December 19, 2009, Gas Natural Fenosa agreed to sell the natural gas distribution business in 38 Madrid municipalities and the gas natural and electricity supply to residential customer retail and SMEs (small/medium companies). This sale includes the shared services structure in this region. This transaction was made under the framework of the disposal plan agreed upon with the Spanish anti-trust authorities (acronym in Spanish: CNC) in connection with the acquisition of Unión Fenosa. As of the date of this agreement, these assets are classified as non-current assets held for sale. Once the pertinent regulatory approvals were obtained, the sale was executed on April 30, 2010 for €241 million, generating a gross capital gain of €114 million, which was recognized in “Income from reversal of impairment losses and gains on disposal of non-current assets” of the accompanying income statement (amounts corresponding to the proportional part of the Group investment in Gas Natural Fenosa).
113
In addition, in December 2009, Gas Natural Fenosa agreed to divest its share in several combined cycle power generation Companies in Mexico with aggregate capacity of 2,233 MW and the Río gas pipeline. From the date of this agreement, these assets were classified as non-current assets held for sale. Once the pertinent regulatory approvals were obtained, the 100% control of the companies was transferred on June 30, 2010 for €304 million, generating a gross loss of €1 million, recognized in “Impairment losses recognized and losses on disposal of non-current assets” of the accompanying income statement (amounts corresponding to the proportional part of the Group investment in Gas Natural Fenosa).
On July 2, 2009, Gas Natural Fenosa closed the sale of the 13% of Indra Sistemas, S.A. for €99 million. The remaining 5% shareholding has been classified as a financial asset held for sale in 2009 (Note 12). This transaction did not have any impact on the income statement because the sales price coincided with the fair value of this investment at the acquisition date of Union Fenosa. The Group’s share of profit of Indra Sistemas, S.A. in 2009 amounted to €1.5 million (amounts pro rata for the Group’s shareholding in Gas Natural Fenosa).
In December 2009, and under the framework of the disposal commitments reached with Spain’s anti-trust authorities in connection with the acquisition of Unión Fenosa, Gas Natural Fenosa sold to Naturgas Group its gas distribution business in the regions of Cantabria and Murcia, along with the gas and power (residential and small and medium companies) supply business and the corresponding shared services in these same regions, as well as the high pressure distribution networks in Cantabria, the Basque Country and Asturias. These assets had been recognized as non-current assets held for sale in July 2009. The selling price was €102 million, generating a gain in 2009 of approximately €15 million (pro rata for the Group’s shareholding in Gas Natural Fenosa).
In addition, in October 2009 Gas Natural Fenosa agreed the sale of its 63.8% interest in Empresa de Energía del Pacífico, S.A. (EPSA) to Colener, S.A.S., Inversiones Argos and Banca de Inversión Bancacolombia, S.A. Corporación Financiera. These assets were classified as non-current assets held for sale on the date the agreement was reached (Note 11). The sale was completed in December 2009 upon obtention of all the pertinent regulatory approvals. The selling price was €207 million, generating a before-tax gain of €3 million (pro rata for the Group’s shareholding in Gas Natural Fenosa, except for the figures presented in percentage terms).
Other sales
On December 17, 2010, the Group sold Gas Natural Fenosa's 35% ownership interest in Gas Aragón, S.A. for €23 million. This was an equity-consolidated company and the sale generated a before-tax gain of €12 million recognized in "Income from reversal of impairment losses and gains on disposal of non-current assets.”
In November 2010, the Repsol YPF Group sold its 25% ownership interest in Bahía Bizkaia Gas (BBG) to Enagas and other non-controlling interests for approximately €31 million, after deducting the amount of dividends received. This sale generated a before-tax gain of €13 million, recognized in “Income from reversal of impairment losses and gain on disposal of non-current assets” of the accompanying consolidated income statement.
114
On March 25, 2010 Repsol YPF, Petronor and BBK signed an agreement whereby BBK acquired a share package for 5% of Compañía Logística de Hidrocarburos (CLH), which Repsol indirectly owned through Petronor. The sale price was €145 million, which generated a gross capital gain of €133 million, recognized in “Income from reversal of impairment losses and gains on disposal of non-current assets” of the accompanying consolidated income statement. As a result of this transaction, Repsol YPF reduced its share in CLH to 10%.
In February 2010, Repsol YPF sold its 100% investment in Termobarrancas and its exploration and development license in the Barrancas area to Petróleos de Venezuela S.A. (PDVSA). The purchase-sale agreement was reached in 2009, year in which these assets were classified as non-current assets held for sale. The sale of these assets generated a gain of €5 million, recognized under “Income from reversal of impairment losses and gains on disposal of non-current assets” in the accompanying consolidated income statement.
Property, plant and equipment, intangible assets and investment property
In 2010, Repsol YPF Group received a €70 million prepayment in connection with sale of the Gaviota underground storage gas facility to Enagás, which was classified at December 31, 2010 under "Non-current assets held for sale." This transaction is awaiting the final approval of the competent authorities (Note 11).
On July 30, 2007 Repsol YPF, S.A. entered into an agreement whereby it sold to Caja Madrid the lot where an office building is under construction in Madrid, as well as the finished works on it, for €815 million of which €570 million were recorded as divestments in 2007. In the same agreement Repsol YPF, S.A. undertook to continue the promotion and development of the pending construction works, with the aim of completing the cited office building. The building was officially delivered to the buyer in 2009. This delivery generated an additional divestment of €245 million and a gain of €49 million, recognized in "Income from reversal of impairment losses and gains on disposal of non-current assets" in the 2009 income statement.
Other financial assets
In April 2010, Gas Natural Fenosa sold its 5% ownership interest in Indra Sistemas, S.A., which was classified under “held-for-sale financial assets” after the disposal of the 13% ownership interest in 2009 (described above). This sale amounted to €38 million, generating a gain of €1 million recognized under "Impairment gains / (losses) on disposal of financial instruments”.
In 2009 Unión Fenosa sold its shareholdings in Red Eléctrica Corporación, S.A. and Isagen for €32 million. These disposals did not have any impact on the income statement because the sales prices coincided with the fair value of these assets at the date of the acquisition of Unión Fenosa by Gas Natural. Disposals of other financial assets also include €47 million in connection with the sale of Gas Natural Fenosa’s 5% shareholding in Enagás, generating a before-tax gain of €31 million, which was recognized as a reduction to “Adjustments for changes in value” (Note 12) (amounts pro rata for the Group’s shareholding in Gas Natural Fenosa, except for the figures presented in percentage terms).
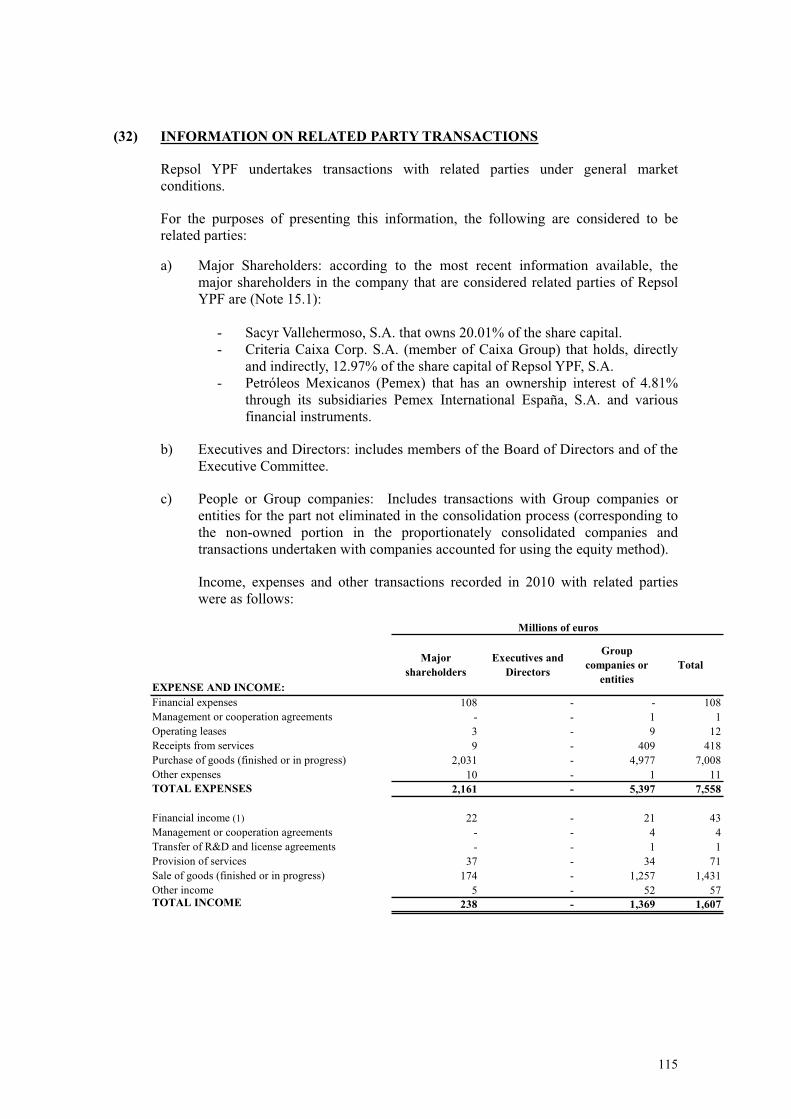
115
(32) INFORMATION ON RELATED PARTY TRANSACTIONS
Repsol YPF undertakes transactions with related parties under general market conditions.
For the purposes of presenting this information, the following are considered to be related parties:
a) Major Shareholders: according to the most recent information available, the major shareholders in the company that are considered related parties of Repsol YPF are (Note 15.1):
- Sacyr Vallehermoso, S.A. that owns 20.01% of the share capital. - Criteria Caixa Corp. S.A. (member of Caixa Group) that holds, directly
and indirectly, 12.97% of the share capital of Repsol YPF, S.A. - Petróleos Mexicanos (Pemex) that has an ownership interest of 4.81%
through its subsidiaries Pemex International España, S.A. and various financial instruments.
b) Executives and Directors: includes members of the Board of Directors and of the Executive Committee.
c) People or Group companies: Includes transactions with Group companies or entities for the part not eliminated in the consolidation process (corresponding to the non-owned portion in the proportionately consolidated companies and transactions undertaken with companies accounted for using the equity method).
Income, expenses and other transactions recorded in 2010 with related parties were as follows:
EXPENSE AND INCOME:Financial expenses 108 - - 108Management or cooperation agreements - - 1 1Operating leases 3 - 9 12Receipts from services 9 - 409 418Purchase of goods (finished or in progress) 2,031 - 4,977 7,008Other expenses 10 - 1 11TOTAL EXPENSES 2,161 - 5,397 7,558
Financial income (1) 22 - 21 43Management or cooperation agreements - - 4 4Transfer of R&D and license agreements - - 1 1Provision of services 37 - 34 71Sale of goods (finished or in progress) 174 - 1,257 1,431Other income 5 - 52 57TOTAL INCOME 238 - 1,369 1,607
Millions of euros
Major shareholders
Executives and Directors
Group companies or
entitiesTotal
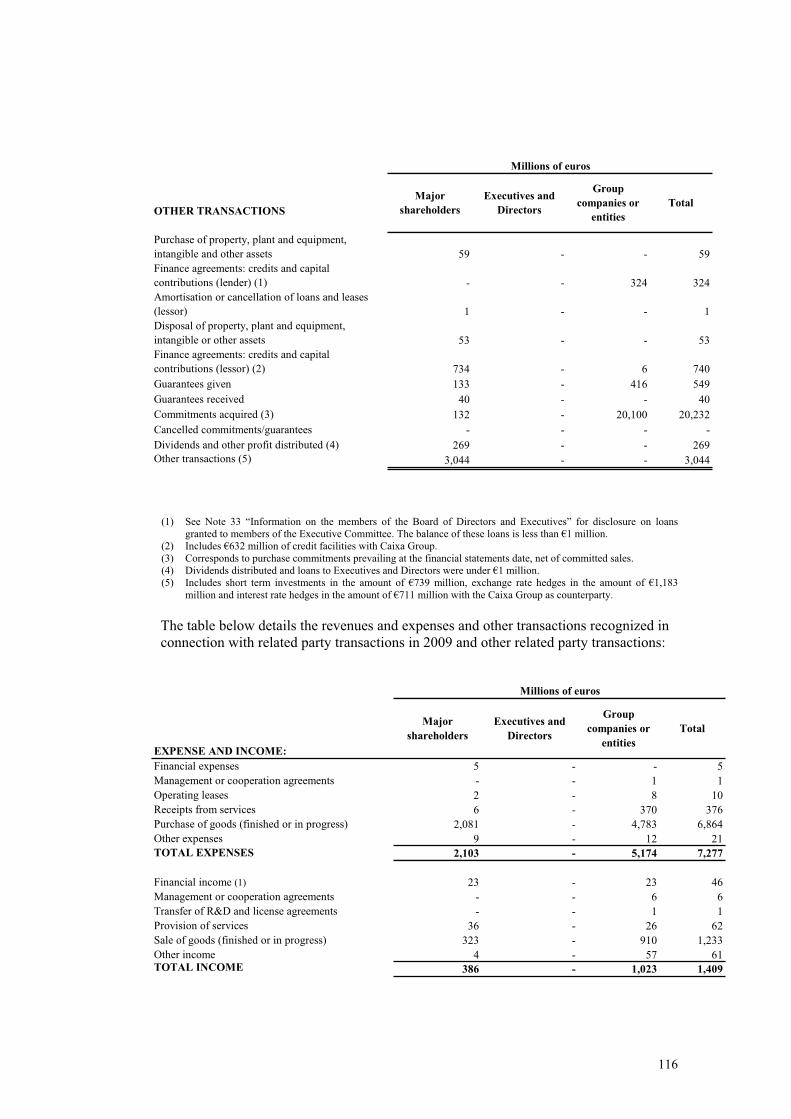
116
OTHER TRANSACTIONS
Purchase of property, plant and equipment, intangible and other assets 59 - - 59Finance agreements: credits and capital contributions (lender) (1) - - 324 324Amortisation or cancellation of loans and leases (lessor) 1 - - 1Disposal of property, plant and equipment, intangible or other assets 53 - - 53Finance agreements: credits and capital contributions (lessor) (2) 734 - 6 740Guarantees given 133 - 416 549Guarantees received 40 - - 40Commitments acquired (3) 132 - 20,100 20,232Cancelled commitments/guarantees - - - -Dividends and other profit distributed (4) 269 - - 269Other transactions (5) 3,044 - - 3,044
Millions of euros
Major shareholders
Executives and Directors
Group companies or
entitiesTotal
(1) See Note 33 “Information on the members of the Board of Directors and Executives” for disclosure on loans granted to members of the Executive Committee. The balance of these loans is less than €1 million.
(2) Includes €632 million of credit facilities with Caixa Group. (3) Corresponds to purchase commitments prevailing at the financial statements date, net of committed sales. (4) Dividends distributed and loans to Executives and Directors were under €1 million. (5) Includes short term investments in the amount of €739 million, exchange rate hedges in the amount of €1,183
million and interest rate hedges in the amount of €711 million with the Caixa Group as counterparty.
The table below details the revenues and expenses and other transactions recognized in connection with related party transactions in 2009 and other related party transactions:
EXPENSE AND INCOME:Financial expenses 5 - - 5Management or cooperation agreements - - 1 1Operating leases 2 - 8 10Receipts from services 6 - 370 376Purchase of goods (finished or in progress) 2,081 - 4,783 6,864Other expenses 9 - 12 21TOTAL EXPENSES 2,103 - 5,174 7,277
Financial income (1) 23 - 23 46Management or cooperation agreements - - 6 6Transfer of R&D and license agreements - - 1 1Provision of services 36 - 26 62Sale of goods (finished or in progress) 323 - 910 1,233Other income 4 - 57 61TOTAL INCOME 386 - 1,023 1,409
Millions of euros
Major shareholders
Executives and Directors
Group companies or
entitiesTotal
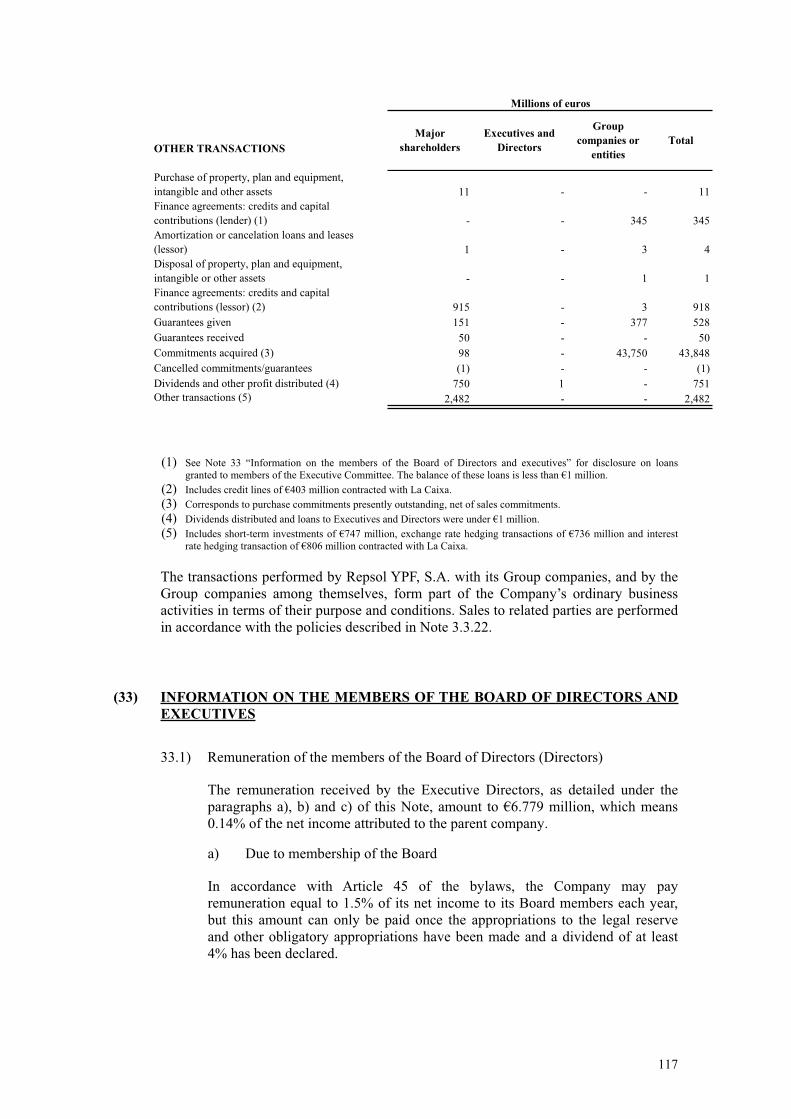
117
OTHER TRANSACTIONS
Purchase of property, plan and equipment, intangible and other assets 11 - - 11Finance agreements: credits and capital contributions (lender) (1) - - 345 345Amortization or cancelation loans and leases (lessor) 1 - 3 4Disposal of property, plan and equipment, intangible or other assets - - 1 1Finance agreements: credits and capital contributions (lessor) (2) 915 - 3 918Guarantees given 151 - 377 528Guarantees received 50 - - 50Commitments acquired (3) 98 - 43,750 43,848Cancelled commitments/guarantees (1) - - (1)Dividends and other profit distributed (4) 750 1 - 751Other transactions (5) 2,482 - - 2,482
Millions of euros
Major shareholders
Executives and Directors
Group companies or
entitiesTotal
(1) See Note 33 “Information on the members of the Board of Directors and executives” for disclosure on loans granted to members of the Executive Committee. The balance of these loans is less than €1 million.
(2) Includes credit lines of €403 million contracted with La Caixa. (3) Corresponds to purchase commitments presently outstanding, net of sales commitments. (4) Dividends distributed and loans to Executives and Directors were under €1 million. (5) Includes short-term investments of €747 million, exchange rate hedging transactions of €736 million and interest
rate hedging transaction of €806 million contracted with La Caixa.
The transactions performed by Repsol YPF, S.A. with its Group companies, and by the Group companies among themselves, form part of the Company’s ordinary business activities in terms of their purpose and conditions. Sales to related parties are performed in accordance with the policies described in Note 3.3.22.
(33) INFORMATION ON THE MEMBERS OF THE BOARD OF DIRECTORS AND EXECUTIVES
33.1) Remuneration of the members of the Board of Directors (Directors)
The remuneration received by the Executive Directors, as detailed under the paragraphs a), b) and c) of this Note, amount to €6.779 million, which means 0.14% of the net income attributed to the parent company.
a) Due to membership of the Board
In accordance with Article 45 of the bylaws, the Company may pay remuneration equal to 1.5% of its net income to its Board members each year, but this amount can only be paid once the appropriations to the legal reserve and other obligatory appropriations have been made and a dividend of at least 4% has been declared.
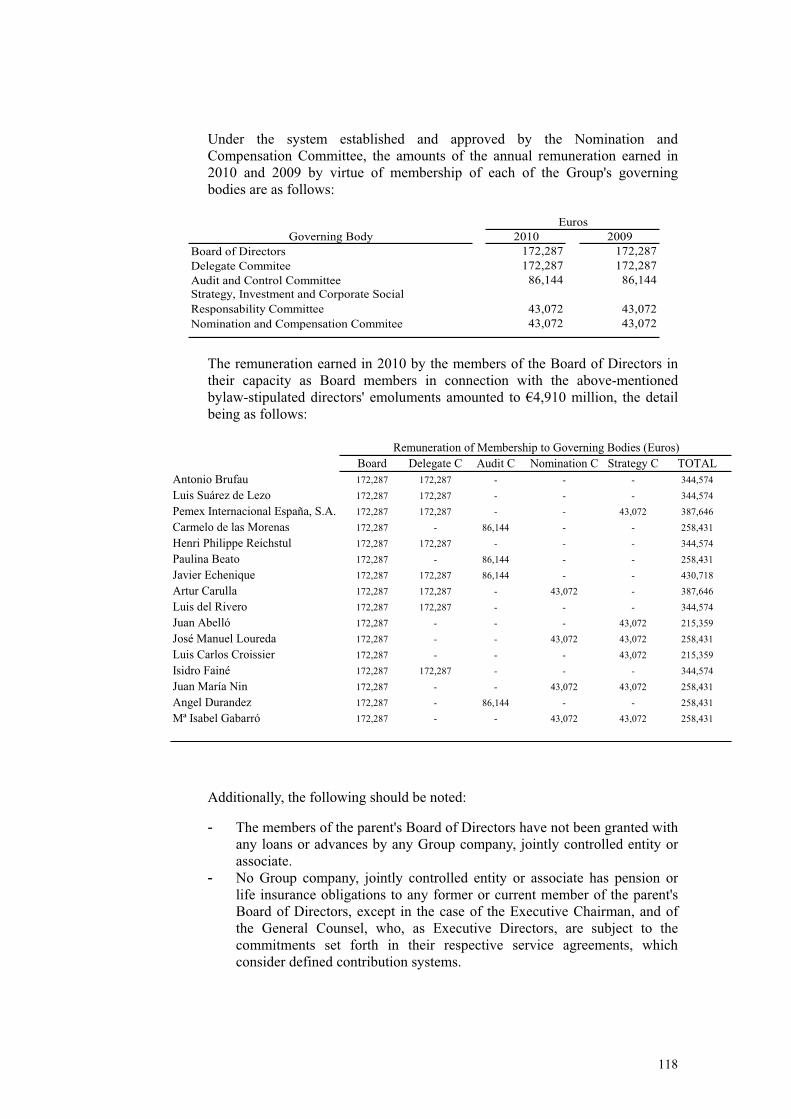
118
Under the system established and approved by the Nomination and Compensation Committee, the amounts of the annual remuneration earned in 2010 and 2009 by virtue of membership of each of the Group's governing bodies are as follows:
Governing Body 2010 2009Board of Directors 172,287 172,287Delegate Commitee 172,287 172,287Audit and Control Committee 86,144 86,144Strategy, Investment and Corporate Social Responsability Committee 43,072 43,072Nomination and Compensation Commitee 43,072 43,072
Euros
The remuneration earned in 2010 by the members of the Board of Directors in their capacity as Board members in connection with the above-mentioned bylaw-stipulated directors' emoluments amounted to €4,910 million, the detail being as follows:
Board Delegate C Audit C Nomination C Strategy C TOTALAntonio Brufau 172,287 172,287 - - - 344,574Luis Suárez de Lezo 172,287 172,287 - - - 344,574Pemex Internacional España, S.A. 172,287 172,287 - - 43,072 387,646Carmelo de las Morenas 172,287 - 86,144 - - 258,431Henri Philippe Reichstul 172,287 172,287 - - - 344,574Paulina Beato 172,287 - 86,144 - - 258,431Javier Echenique 172,287 172,287 86,144 - - 430,718Artur Carulla 172,287 172,287 - 43,072 - 387,646Luis del Rivero 172,287 172,287 - - - 344,574Juan Abelló 172,287 - - - 43,072 215,359José Manuel Loureda 172,287 - - 43,072 43,072 258,431Luis Carlos Croissier 172,287 - - - 43,072 215,359Isidro Fainé 172,287 172,287 - - - 344,574Juan María Nin 172,287 - - 43,072 43,072 258,431Angel Durandez 172,287 - 86,144 - - 258,431Mª Isabel Gabarró 172,287 - - 43,072 43,072 258,431
Remuneration of Membership to Governing Bodies (Euros)
Additionally, the following should be noted:
- The members of the parent's Board of Directors have not been granted with any loans or advances by any Group company, jointly controlled entity or associate.
- No Group company, jointly controlled entity or associate has pension or life insurance obligations to any former or current member of the parent's Board of Directors, except in the case of the Executive Chairman, and of the General Counsel, who, as Executive Directors, are subject to the commitments set forth in their respective service agreements, which consider defined contribution systems.
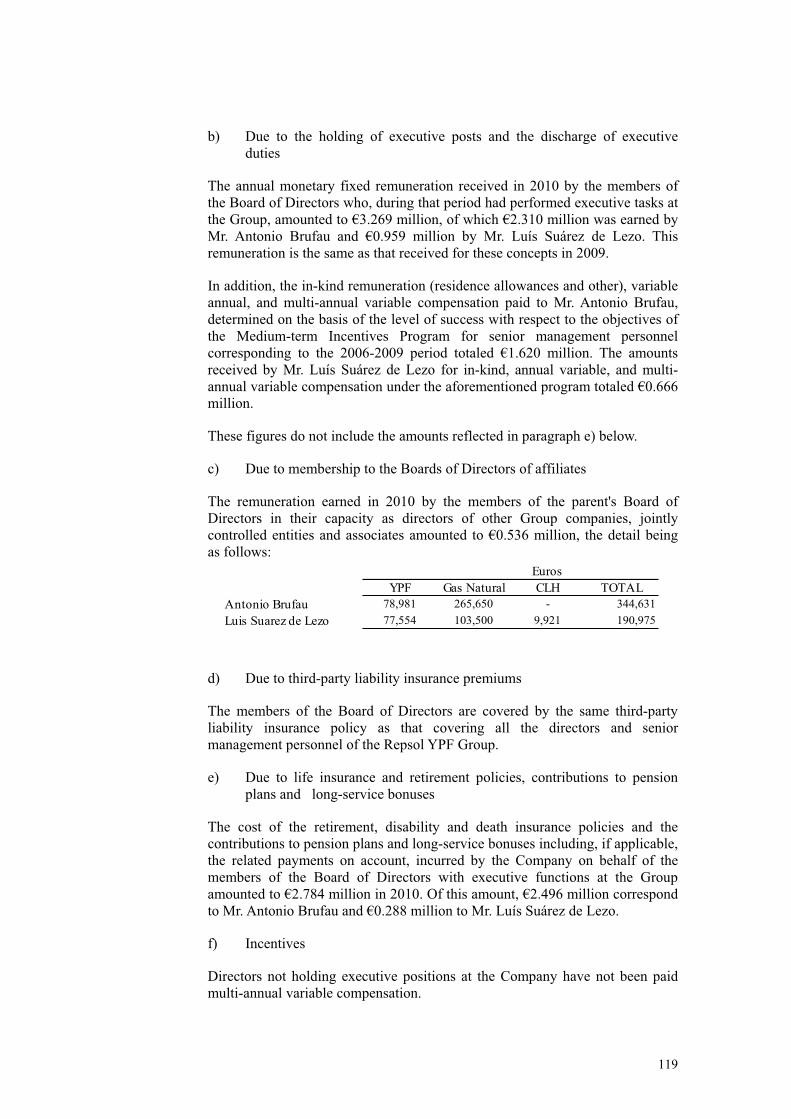
119
b) Due to the holding of executive posts and the discharge of executive duties
The annual monetary fixed remuneration received in 2010 by the members of the Board of Directors who, during that period had performed executive tasks at the Group, amounted to €3.269 million, of which €2.310 million was earned by Mr. Antonio Brufau and €0.959 million by Mr. Luís Suárez de Lezo. This remuneration is the same as that received for these concepts in 2009.
In addition, the in-kind remuneration (residence allowances and other), variable annual, and multi-annual variable compensation paid to Mr. Antonio Brufau, determined on the basis of the level of success with respect to the objectives of the Medium-term Incentives Program for senior management personnel corresponding to the 2006-2009 period totaled €1.620 million. The amounts received by Mr. Luís Suárez de Lezo for in-kind, annual variable, and multi-annual variable compensation under the aforementioned program totaled €0.666 million.
These figures do not include the amounts reflected in paragraph e) below.
c) Due to membership to the Boards of Directors of affiliates
The remuneration earned in 2010 by the members of the parent's Board of Directors in their capacity as directors of other Group companies, jointly controlled entities and associates amounted to €0.536 million, the detail being as follows:
d) Due to third-party liability insurance premiums
The members of the Board of Directors are covered by the same third-party liability insurance policy as that covering all the directors and senior management personnel of the Repsol YPF Group.
e) Due to life insurance and retirement policies, contributions to pension plans and long-service bonuses
The cost of the retirement, disability and death insurance policies and the contributions to pension plans and long-service bonuses including, if applicable, the related payments on account, incurred by the Company on behalf of the members of the Board of Directors with executive functions at the Group amounted to €2.784 million in 2010. Of this amount, €2.496 million correspond to Mr. Antonio Brufau and €0.288 million to Mr. Luís Suárez de Lezo.
f) Incentives
Directors not holding executive positions at the Company have not been paid multi-annual variable compensation.
YPF Gas Natural CLH TOTALAntonio Brufau 78,981 265,650 - 344,631Luis Suarez de Lezo 77,554 103,500 9,921 190,975
Euros
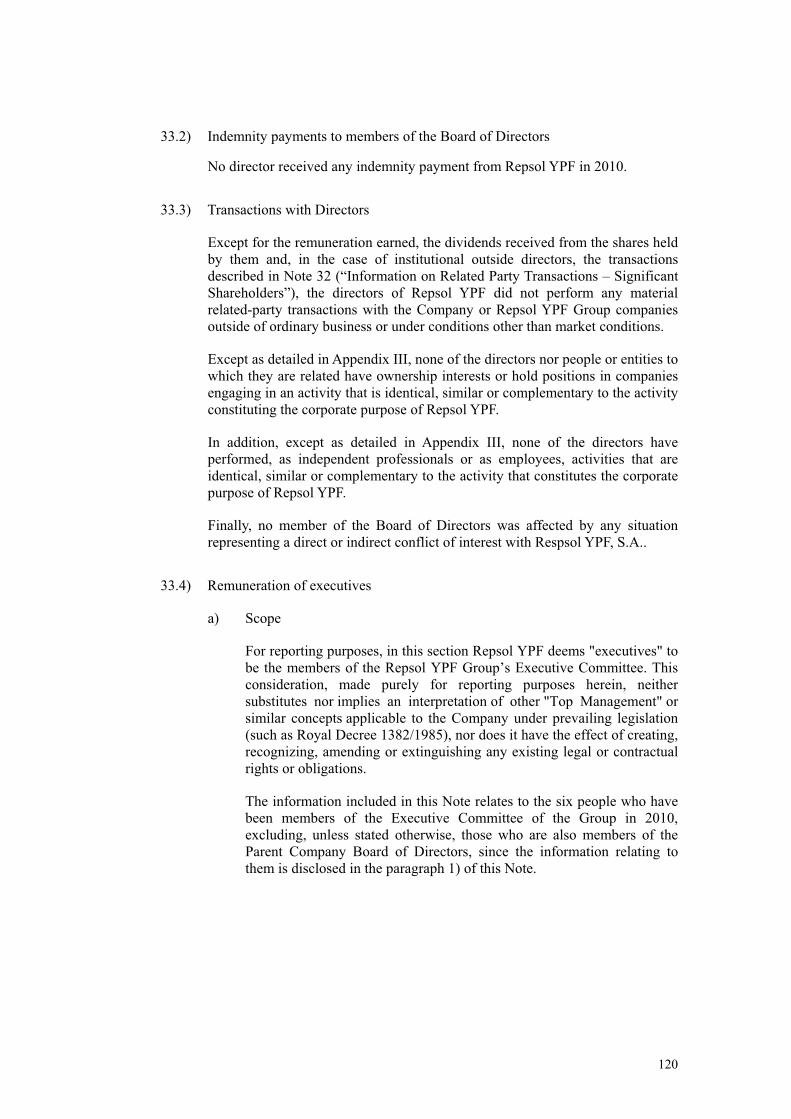
120
33.2) Indemnity payments to members of the Board of Directors
No director received any indemnity payment from Repsol YPF in 2010.
33.3) Transactions with Directors
Except for the remuneration earned, the dividends received from the shares held by them and, in the case of institutional outside directors, the transactions described in Note 32 (“Information on Related Party Transactions – Significant Shareholders”), the directors of Repsol YPF did not perform any material related-party transactions with the Company or Repsol YPF Group companies outside of ordinary business or under conditions other than market conditions.
Except as detailed in Appendix III, none of the directors nor people or entities to which they are related have ownership interests or hold positions in companies engaging in an activity that is identical, similar or complementary to the activity constituting the corporate purpose of Repsol YPF.
In addition, except as detailed in Appendix III, none of the directors have performed, as independent professionals or as employees, activities that are identical, similar or complementary to the activity that constitutes the corporate purpose of Repsol YPF.
Finally, no member of the Board of Directors was affected by any situation representing a direct or indirect conflict of interest with Respsol YPF, S.A..
33.4) Remuneration of executives
a) Scope
For reporting purposes, in this section Repsol YPF deems "executives" to be the members of the Repsol YPF Group’s Executive Committee. This consideration, made purely for reporting purposes herein, neither substitutes nor implies an interpretation of other "Top Management" or similar concepts applicable to the Company under prevailing legislation (such as Royal Decree 1382/1985), nor does it have the effect of creating, recognizing, amending or extinguishing any existing legal or contractual rights or obligations.
The information included in this Note relates to the six people who have been members of the Executive Committee of the Group in 2010, excluding, unless stated otherwise, those who are also members of the Parent Company Board of Directors, since the information relating to them is disclosed in the paragraph 1) of this Note.
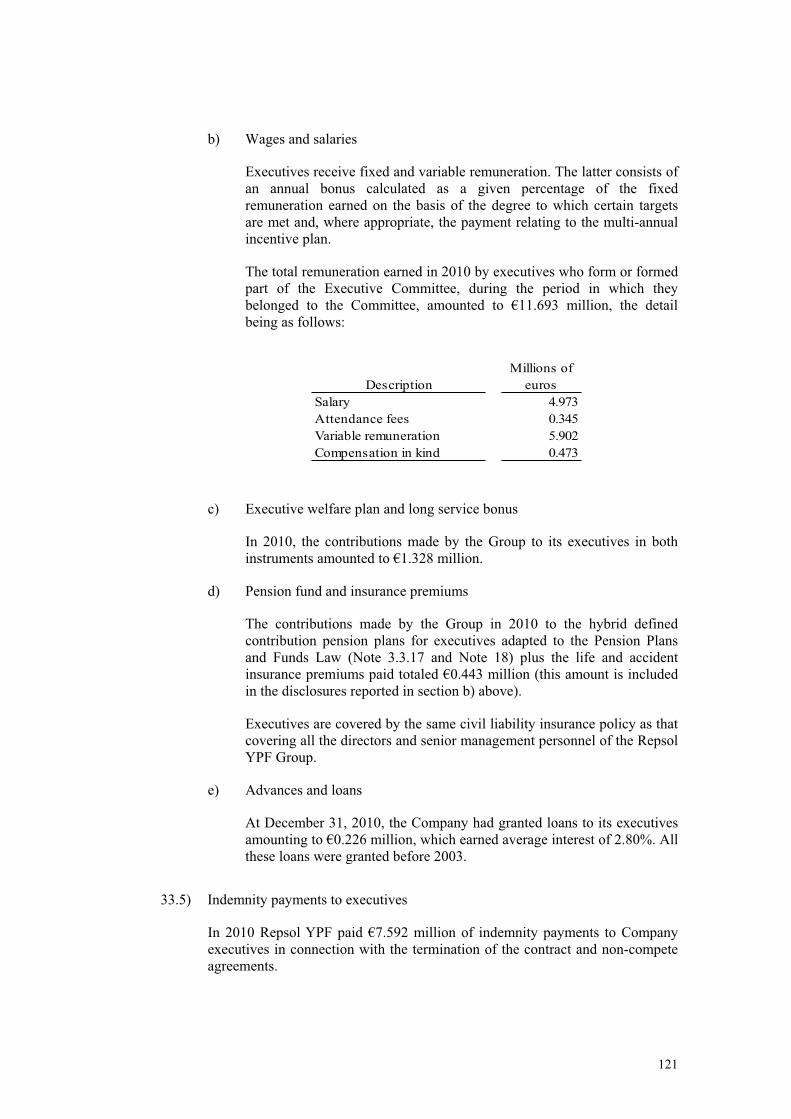
121
b) Wages and salaries
Executives receive fixed and variable remuneration. The latter consists of an annual bonus calculated as a given percentage of the fixed remuneration earned on the basis of the degree to which certain targets are met and, where appropriate, the payment relating to the multi-annual incentive plan.
The total remuneration earned in 2010 by executives who form or formed part of the Executive Committee, during the period in which they belonged to the Committee, amounted to €11.693 million, the detail being as follows:
c) Executive welfare plan and long service bonus
In 2010, the contributions made by the Group to its executives in both instruments amounted to €1.328 million.
d) Pension fund and insurance premiums
The contributions made by the Group in 2010 to the hybrid defined contribution pension plans for executives adapted to the Pension Plans and Funds Law (Note 3.3.17 and Note 18) plus the life and accident insurance premiums paid totaled €0.443 million (this amount is included in the disclosures reported in section b) above).
Executives are covered by the same civil liability insurance policy as that covering all the directors and senior management personnel of the Repsol YPF Group.
e) Advances and loans
At December 31, 2010, the Company had granted loans to its executives amounting to €0.226 million, which earned average interest of 2.80%. All these loans were granted before 2003.
33.5) Indemnity payments to executives
In 2010 Repsol YPF paid €7.592 million of indemnity payments to Company executives in connection with the termination of the contract and non-compete agreements.
Millions of euros
Salary 4.973Attendance fees 0.345Variable remuneration 5.902Compensation in kind 0.473
Description
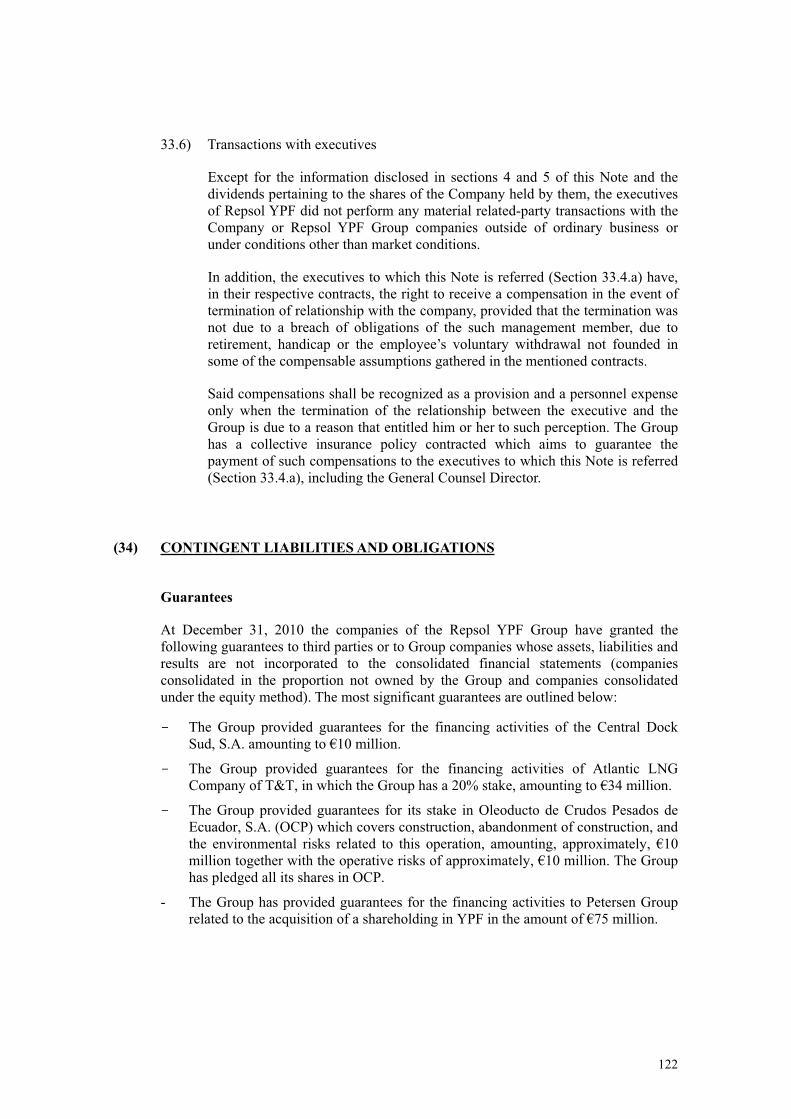
122
33.6) Transactions with executives
Except for the information disclosed in sections 4 and 5 of this Note and the dividends pertaining to the shares of the Company held by them, the executives of Repsol YPF did not perform any material related-party transactions with the Company or Repsol YPF Group companies outside of ordinary business or under conditions other than market conditions.
In addition, the executives to which this Note is referred (Section 33.4.a) have, in their respective contracts, the right to receive a compensation in the event of termination of relationship with the company, provided that the termination was not due to a breach of obligations of the such management member, due to retirement, handicap or the employee’s voluntary withdrawal not founded in some of the compensable assumptions gathered in the mentioned contracts.
Said compensations shall be recognized as a provision and a personnel expense only when the termination of the relationship between the executive and the Group is due to a reason that entitled him or her to such perception. The Group has a collective insurance policy contracted which aims to guarantee the payment of such compensations to the executives to which this Note is referred (Section 33.4.a), including the General Counsel Director.
(34) CONTINGENT LIABILITIES AND OBLIGATIONS
Guarantees
At December 31, 2010 the companies of the Repsol YPF Group have granted the following guarantees to third parties or to Group companies whose assets, liabilities and results are not incorporated to the consolidated financial statements (companies consolidated in the proportion not owned by the Group and companies consolidated under the equity method). The most significant guarantees are outlined below:
- The Group provided guarantees for the financing activities of the Central Dock Sud, S.A. amounting to €10 million.
- The Group provided guarantees for the financing activities of Atlantic LNG Company of T&T, in which the Group has a 20% stake, amounting to €34 million.
- The Group provided guarantees for its stake in Oleoducto de Crudos Pesados de Ecuador, S.A. (OCP) which covers construction, abandonment of construction, and the environmental risks related to this operation, amounting, approximately, €10 million together with the operative risks of approximately, €10 million. The Group has pledged all its shares in OCP.
- The Group has provided guarantees for the financing activities to Petersen Group related to the acquisition of a shareholding in YPF in the amount of €75 million.
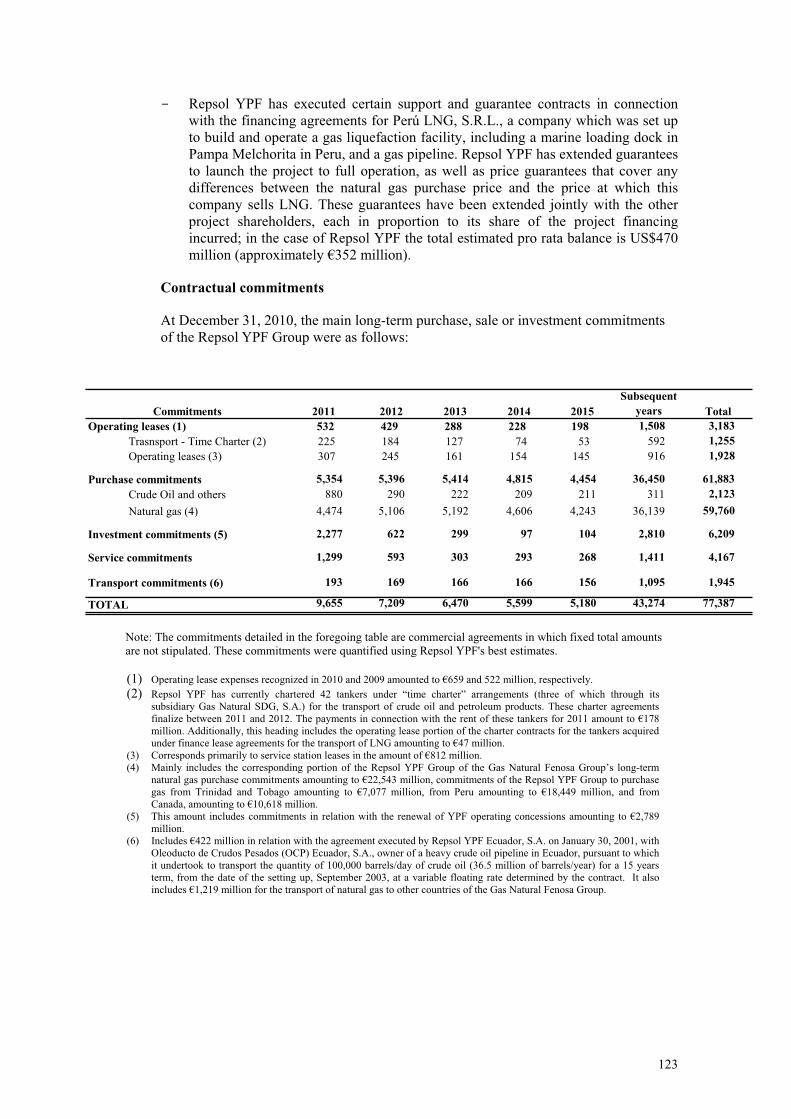
123
- Repsol YPF has executed certain support and guarantee contracts in connection with the financing agreements for Perú LNG, S.R.L., a company which was set up to build and operate a gas liquefaction facility, including a marine loading dock in Pampa Melchorita in Peru, and a gas pipeline. Repsol YPF has extended guarantees to launch the project to full operation, as well as price guarantees that cover any differences between the natural gas purchase price and the price at which this company sells LNG. These guarantees have been extended jointly with the other project shareholders, each in proportion to its share of the project financing incurred; in the case of Repsol YPF the total estimated pro rata balance is US$470 million (approximately €352 million).
Contractual commitments
At December 31, 2010, the main long-term purchase, sale or investment commitments of the Repsol YPF Group were as follows:
2011 2012 2013 2014 2015Subsequent
years TotalOperating leases (1) 532 429 288 228 198 1,508 3,183
Trasnsport - Time Charter (2) 225 184 127 74 53 592 1,255 Operating leases (3) 307 245 161 154 145 916 1,928
Purchase commitments 5,354 5,396 5,414 4,815 4,454 36,450 61,883 Crude Oil and others 880 290 222 209 211 311 2,123 Natural gas (4) 4,474 5,106 5,192 4,606 4,243 36,139 59,760
Investment commitments (5) 2,277 622 299 97 104 2,810 6,209
Service commitments 1,299 593 303 293 268 1,411 4,167
Transport commitments (6) 193 169 166 166 156 1,095 1,945
TOTAL 9,655 7,209 6,470 5,599 5,180 43,274 77,387
Commitments
Note: The commitments detailed in the foregoing table are commercial agreements in which fixed total amounts are not stipulated. These commitments were quantified using Repsol YPF's best estimates.
(1) Operating lease expenses recognized in 2010 and 2009 amounted to €659 and 522 million, respectively.(2) Repsol YPF has currently chartered 42 tankers under “time charter” arrangements (three of which through its
subsidiary Gas Natural SDG, S.A.) for the transport of crude oil and petroleum products. These charter agreements finalize between 2011 and 2012. The payments in connection with the rent of these tankers for 2011 amount to €178 million. Additionally, this heading includes the operating lease portion of the charter contracts for the tankers acquired under finance lease agreements for the transport of LNG amounting to €47 million.
(3) Corresponds primarily to service station leases in the amount of €812 million. (4) Mainly includes the corresponding portion of the Repsol YPF Group of the Gas Natural Fenosa Group’s long-term
natural gas purchase commitments amounting to €22,543 million, commitments of the Repsol YPF Group to purchase gas from Trinidad and Tobago amounting to €7,077 million, from Peru amounting to €18,449 million, and from Canada, amounting to €10,618 million.
(5) This amount includes commitments in relation with the renewal of YPF operating concessions amounting to €2,789 million.
(6) Includes €422 million in relation with the agreement executed by Repsol YPF Ecuador, S.A. on January 30, 2001, with Oleoducto de Crudos Pesados (OCP) Ecuador, S.A., owner of a heavy crude oil pipeline in Ecuador, pursuant to which it undertook to transport the quantity of 100,000 barrels/day of crude oil (36.5 million of barrels/year) for a 15 years term, from the date of the setting up, September 2003, at a variable floating rate determined by the contract. It also includes €1,219 million for the transport of natural gas to other countries of the Gas Natural Fenosa Group.
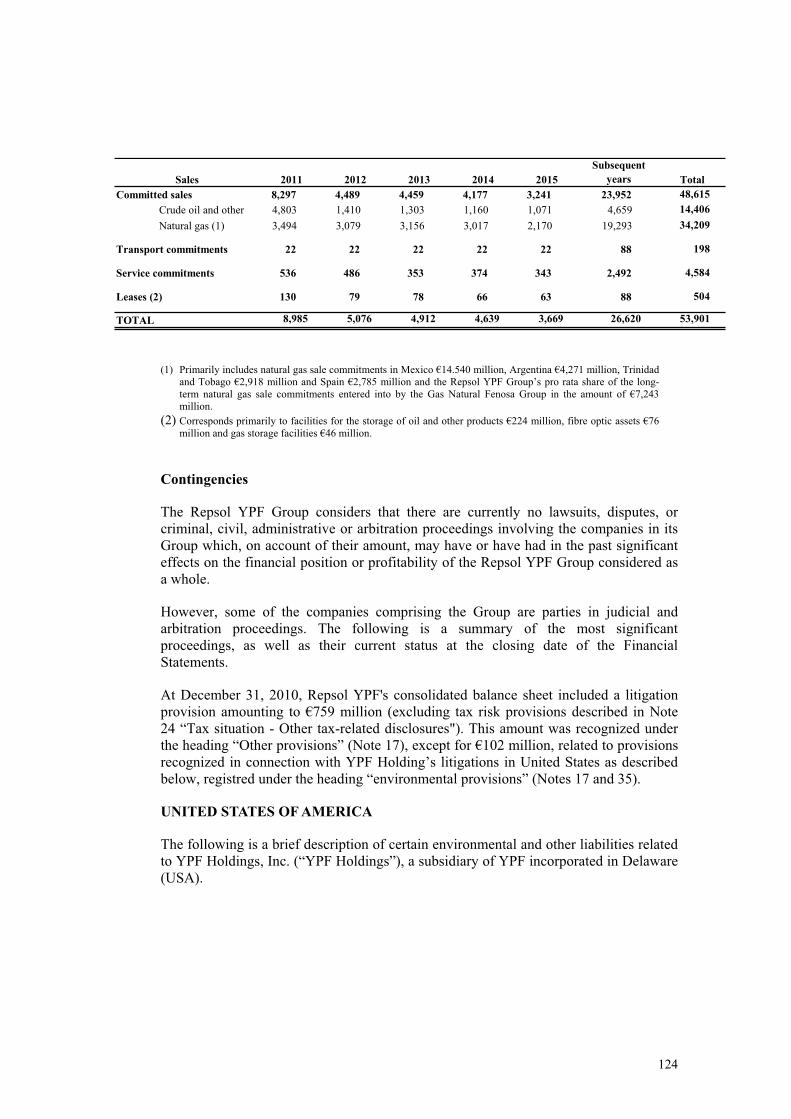
124
2011 2012 2013 2014 2015Subsequent
years TotalCommitted sales 8,297 4,489 4,459 4,177 3,241 23,952 48,615
Crude oil and other 4,803 1,410 1,303 1,160 1,071 4,659 14,406 Natural gas (1) 3,494 3,079 3,156 3,017 2,170 19,293 34,209
Transport commitments 22 22 22 22 22 88 198
Service commitments 536 486 353 374 343 2,492 4,584
Leases (2) 130 79 78 66 63 88 504
TOTAL 8,985 5,076 4,912 4,639 3,669 26,620 53,901
Sales
(1) Primarily includes natural gas sale commitments in Mexico €14.540 million, Argentina €4,271 million, Trinidad and Tobago €2,918 million and Spain €2,785 million and the Repsol YPF Group’s pro rata share of the long-term natural gas sale commitments entered into by the Gas Natural Fenosa Group in the amount of €7,243 million.
(2) Corresponds primarily to facilities for the storage of oil and other products €224 million, fibre optic assets €76 million and gas storage facilities €46 million.
Contingencies
The Repsol YPF Group considers that there are currently no lawsuits, disputes, or criminal, civil, administrative or arbitration proceedings involving the companies in its Group which, on account of their amount, may have or have had in the past significant effects on the financial position or profitability of the Repsol YPF Group considered as a whole.
However, some of the companies comprising the Group are parties in judicial and arbitration proceedings. The following is a summary of the most significant proceedings, as well as their current status at the closing date of the Financial Statements.
At December 31, 2010, Repsol YPF's consolidated balance sheet included a litigation provision amounting to €759 million (excluding tax risk provisions described in Note 24 “Tax situation - Other tax-related disclosures"). This amount was recognized under the heading “Other provisions” (Note 17), except for €102 million, related to provisions recognized in connection with YPF Holding’s litigations in United States as described below, registred under the heading “environmental provisions” (Notes 17 and 35).
UNITED STATES OF AMERICA
The following is a brief description of certain environmental and other liabilities related to YPF Holdings, Inc. (“YPF Holdings”), a subsidiary of YPF incorporated in Delaware (USA).
125
In connection with the sale of Maxus Energy Corporation’s (“Maxus”) former chemical subsidiary, Diamond Shamrock Chemicals Company (“Chemicals”), to a subsidiary of Occidental Petroleum Corporation (“Occidental”), Maxus agreed to indemnify Chemicals and Occidental from and against certain liabilities relating to the business and activities of Chemicals prior to the September 4, 1986 closing date (the “Closing Date”), including certain environmental liabilities relating to certain chemical plants and waste disposal sites used by Chemicals prior to the Closing Date. In 1995, YPF acquired Maxus and in 1999, Repsol YPF acquired YPF.
As of December 31, 2010, YPF Holdings’ reserves for environmental and other contingencies, including litigation, totaled approximately €111 million, of which €102 million were recognized under environmental provisions (Note 35). YPF Holdings management believes it has adequately reserved for these and other contingencies that are probable and can be reasonably estimated based on information as of such time; however, many such contingencies are subject to significant uncertainties, including the completion of ongoing studies, the discovery of new facts, and the issuance of orders by regulatory authorities, which could result in material additions to such reserves in the future. It is possible that additional claims will be made, and additional information about new or existing claims (such as results of ongoing investigations, the issuance of court decisions, or the signing of settlement agreements) is likely to develop over time. YPF Holdings’ reserves for the environmental and other contingencies described below are substantial based solely on currently available information and as a result, YPF Holdings, Maxus and Tierra Solutions Inc. may have to incur substantial costs that may be material, in addition to the reserves already taken.
In the following discussion of the key litigation proceedings underway in the US, references to YPF Holdings include, as appropriate, references to Maxus and Tierra Solutions Inc. (“Tierra”), a subsidiary of YPF Holdings, which has assumed certain of Maxus’ environmental obligations.
Passaic River/Newark Bay, New Jersey.- Chemicals formerly operated an agricultural chemicals plant in Newark, New Jersey. This facility has been the subject of numerous claims of environmental contamination and other damages alleged to result from operations at the facility, at the plant site and surrounding property, including the adjacent water bodies, the Passaic River and Newark Bay. As a result of these claims, Occidental, as the successor to Chemicals, has entered into various agreements with the U.S. Environmental Protection Agency (“EPA”), the New Jersey Department of Environmental Protection (“DEP”), and third parties also alleged to have contributed contamination to the affected properties. These agreements include a 1990 consent order related to the remedy for the plant facility, a 1994 agreement under which Tierra conducted studies on behalf of Occidental in the lower six miles of the Passaic River, a 2004 agreement under which Tierra is presently conducting studies in Newark Bay, and a 2007 agreement under which Tierra and over 70 other parties are presently conducting studies in the lower 17 miles of the Passaic River.
126
In 2007, the EPA released a draft Focused Feasibility Study (“FFS”) that outlines several alternatives for remedial action in the lower eight miles of the Passaic River. These alternatives range from no action to extensive dredging and capping, and are described by the EPA as involving proven technologies that could be carried out in the near term. The total remediation costs, to be split among the more than 300 entities, including Maxus, which could end up being involved in the Passaic River lawsuit, could range (depending on the actions and measures taken) from zero (if no action is taken) to actions which could amount to approximately €1,500 million. Tierra, together with other parties involved in the Passaic River issues, submitted comments on the FFS to the EPA, which has elected to perform further investigation and estimates that a revised remedy proposal will be issued in the third quarter of 2011. Tierra plans to respond to any revised proposal as may be appropriate at that time.
In June 2008, Occidental and Tierra entered an agreement with the EPA, under which Tierra will undertake the removal of sediment from a portion of the Passaic River in the vicinity of the former Newark facility. This action will result in the removal of approximately 200,000 cubic yards of sediment, in two phases, and is expected to cost approximately US$80 million (€60 million), of which US$22 million (€16 million) has been paid into a trust account to fund the work. Notwithstanding the foregoing, during the first quarter of 2010 a credit letter was issued to replace the obligation of making additional deposits in the trust. During the removal work, certain contaminants not produced at Chemicals’ former facility will also be removed; YPF Holdings may seek cost recovery from the parties responsible for such contaminants, but is unable at this time to predict the success of a cost recovery action.
In December 2005, the DEP and the New Jersey Spill Compensation Fund sued YPF Holdings, Tierra, Maxus and other affiliates, as well as Occidental, seeking damages in connection with the contamination allegedly emanating from the Newark facility and allegedly contaminating the Passaic River, Newark Bay, and other nearby water bodies and properties (the Passaic River/Newark Bay litigation). The plaintiffs have represented in court that this litigation should not be preempted by the remedial studies and activities taking place under EPA oversight because they are not seeking remediation, only damages. The defendants have made responsive pleadings, and in February 2009, third-party claims were filed against approximately 300 companies and governmental entities (including certain municipalities) which could have responsibility for the conditions of the allegedly affected properties. The DEP did not quantify damages in its claims but it did: (a) maintain that the US$50 million (€37 million) cap on damages under New Jersey legislation should not be applied; (b) claim it had incurred approximately US$113 million (€85 million) in costs in the past in cleanup and removal work and that it is looking for additional damages of between US$10 and US$20 million (between €7 and €15 million) to finance a study to assess damages to the natural resources; and (c) notify Maxus and Tierra that it is working on financial models outlining costs and other financial impacts. In parallel to this lawsuit, a mediator had started to prepare a roadmap for agreeing an alternative solution to the dispute; however, this alternative was rejected as the various parties were unable to agree on certain basic matters at the heart of the matter.
127
In October 2010, some of the defendants presented several motions to sever and stay, which would have had the effect of allowing the New Jersey DEP to take their case against the direct defendants, which were however dismissed, and also presented motions to dismiss which were overruled in January 2011. Some of the entities have appealed this decision. The judge handling the case will, as a result, hold appeal hearings in March and April. The next step consists of preparing the Trial Plan which will establish the timeline between the discovery and final judgment. At the date of authorizing the accompanying Financial Statements for issue, it is not possible to reasonably estimate when the first judgment will take place.
Hudson and Essex Counties, New Jersey.- Until 1972, Chemicals operated a chromite ore processing facility in Kearny, New Jersey. Tierra, on behalf of Occidental, is conducting remedial work on this facility and surrounding properties where chromite ore processing residue (“COPR”) from the facility is believed to have become located, pursuant to an agreed consent order with the DEP. Tierra has provided financial assurance in the amount of US$20 million (€15 million) in connection with such work.
In May 2005, the DEP issued a directive to Maxus, Occidental, and two other chromium manufacturers directing them to arrange for the cleanup of COPR at three sites in Jersey City, New Jersey, and for the conduct of a study by paying the DEP a total of US$20 million (€15 million). The DEP also filed a lawsuit (the Hudson County, New Jersey litigation) against the above parties seeking cleanup of COPR from various sites not addressed in the consent order described above, recovery of past costs, and treble damages. The parties have reached a tentative agreement to settle both matters, under which Tierra will pay US$5 million (€4 million) and will remediate three sites at an estimated cost of US$2 million (€1 million). In addition, in March 2008, the DEP approved a provisional plan for the work to be performed by Tierra at the site of the Kearny plant and the work to be performed by Tierra together with other parties in the vicinity of the Kearny facility. This adjacent property was included by the EPA in its National Priorities List in 2007. In July 2010, the EPA notified Tierra and another three parties that it considered them potentially liable for this adjacent property, requesting a Remedial Investigation/Feasibility Study (RI/FS) for this site. The parties involved have submitted their response and are waiting to talk with the EPA about the scope of the work. At the date of authorizing the accompanying Financial Statements for issue, it is not known whether work in addition to that already agreed with the DEP will be required.
Other Former Plant Sites and Third Party Sites.- Tierra and Maxus are participating, on behalf of Occidental, in environmental response and remediation activities at a variety of lesser sites, including Chemicals’ former Painesville, Ohio site at which remediation is nearing completion, some smaller manufacturing facilities which Chemicals once owned or had an interest in, and waste disposal sites where Chemicals and other parties are alleged to have contributed waste materials.
128
Dallas Occidental vs. Maxus Litigation.- In 2002, Occidental sued Maxus and Tierra in a state court in Dallas, Texas, seeking a declaration that under the agreement by which Maxus sold Chemicals to Occidental in 1986, Maxus and Tierra have an obligation to defend and indemnify Occidental from certain historical obligations of Chemicals, including claims related to “Agent Orange” and vinyl chloride monomer (VCM). Tierra was dismissed as a party, but at trial in 2006, Maxus was found to be liable to indemnify Occidental for these claims. This decision was affirmed by the Court of Appeals, and Maxus will be required to reimburse Occidental for damages in connection with these claims. Maxus has reimbursed Occidental for the majority of these damages and has reserved for the remaining claims while resolving the final amounts with Occidental. Although this judgment does contain declaratory relief that Maxus must indemnify Occidental for certain types of future claims, YPF Holdings does not believe that these claims associated with the “Agent Orange” will be material to the financial condition of the company.
In developments related to the “Agent Orange litigation”, which may be affected by this lawsuit, the U.S. district court granted the defendants’ motions for summary judgment in a number of these cases. The plaintiffs appealed the judgments to the Second Circuit Court of Appeals, which affirmed the summary judgment; in March 2009, the U.S. Supreme Court declined to hear a further petition. All pending Agent Orange litigation was dismissed in December 2009, and although it is possible that further claims may be filed by unknown parties in the future, no further significant liability is anticipated.
In addition, the other claims filed, which have been dismissed, include claims relating to alleged side effects from exposure to VCM and other chemical products, although these claims are not expected to give rise to material liabilities. However, the declaration of legal liability does imply liability for future claims, if any, related to these effects. As a result, potential future claims, if any, could give rise to additional liability on the part of Maxus.
ARGENTINA
Liabilities and contingencies assumed by the Argentine State.- The Privatization Law provides that the Argentine State shall be responsible for any liabilities, obligations or other commitments existing as of December 31, 1990 that were not acknowledged as such in the financial statements of its predecessor (Yacimientos Petrolíferos Fiscales, Sociedad del Estado) as of that date arising out of any transactions or events that had occurred as of that date, provided that any such liability, obligation or other commitment is established or verified by a final decision of a competent judicial authority. In certain lawsuits related to events or acts that took place before December 31, 1990, YPF has been required to advance the payment of amounts established in certain judicial decisions. YPF believes it has the right to be reimbursed for all such payments by the Argentine Government pursuant to the above-mentioned indemnity. YPF is required to keep the Argentine Government apprised of any claim against it arising from the obligations assumed by the Argentine Government.
129
Argentine National Commission for the Defense of Competition (Comisión Nacional de Defensa de la Competencia – “CNDC”) - Liquefied Petroleum Gas Market.-Resolution No. 189/99 from the former Department of Industry, Commerce and Mining of Argentina imposed on YPF a fine based on the interpretation that YPF had purportedly abused its dominant position in the bulk LPG market due to the existence of different prices between the exports of LPG and the sales to the domestic market from 1993 through 1997. Additionally, the CNDC commenced an investigation in order to prove, among other things, whether the penalized behavior for the period from 1993 through 1997, already settled, continued from October 1997 to March 1999. On December 19, 2003, the CNDC completed its investigation and charged YPF with abuse of dominant market position during this period. YPF has unsuccessfully appealed this decision in several courts. On December 22, 2009, the 4th Court of Appeals rejected one of the outstanding appeals filed by YPF, in which YPF had asserted a statute of limitations defense. YPF has filed an extraordinary appeal which is currently pending.
In addition, on December 21, 2009, YPF filed another appeal based on the statute of limitations with the CNDC, which was dismissed by the CNDC. On the basis of this last ruling, YPF lodged the corresponding appeal calling for the intervention of Room B of the White Collar Crime Chamber (Sala B of the Cámara Penal Económico), and the pertinent grievances briefing was filed on October 7, 2010.
On December 22, 2010, YPF was notified that Room B of the White Collar Crime Chamber had ruled in favor of YPF, with the effect of repealing the CNDC’s ruling and closing the proceedings. At the date of authorizing the accompanying Financial Statements for issue, the ruling was not yet final.
Natural gas market. As a result of the restrictions on natural gas exports since 2004, YPF had been forced in many instances to partially or fully suspend natural gas export deliveries that are contemplated by its contracts with export customers. YPF has taken steps to appeal the Program of Rationalization of Gas Exports and the Use of Transportation Capacity, as well as the Permanent Additional Injection and the Additional Injection Requirements, as it believes that they are arbitrary and illegitimate, and has informed its customers that such measures constitute an event of force majeure which releases YPF from any responsibility and/or penalty deriving from the failure to deliver the volumes of gas stipulated under the relevant agreements.
A number of YPF’s customers, including Electroandina S.A. (Electroandina) and Empresa Eléctrica del Norte Grande S.A. (Edelnor), have rejected YPF’s interpretation and have claimed damages and/or penalties for breach of supply undertakings, while at the same time reserving their rights to file additional claims in the future. YPF has opposed such claims.
On November 5, 2010, YPF and Edelnor and Electroandina entered into a Dispute Resolution Agreement under which, without admitting liability or granting rights, YPF will pay Edelnor and Electroandina a sum that is substantially less than originally claimed, reaching a compromise regarding the arbitration proceedings underway, which implied agreeing to: a) abandon and renounce all actions, rights and claims relating to the natural gas supply undertakings; and b) amend the natural gas supply undertakings to render them ‘interruptible’. YPF received Secretariat of Energy approval for this agreement on January 7, 2011, rendering the agreement amendments effective.
In addition, AES Uruguaiana Empreendimentos S.A. (“AESU”) has claimed damages in a total amount of US$28 million (€21 million) for missed deliveries of natural gas volumes during the period September 16, 2007 through June 25, 2008. On July 16, 2008, AESU also claimed damages in a total amount of US$3 million (€2
130
million) for missed deliveries of natural gas volumes during the period January 18, 2006 through December 1, 2006. YPF has contested both of these claims. By letter dated on March 20, 2009, AESU notified YPF that it was terminating the related contract unilaterally.
On April 6, 2009, YPF was notified by the International Chamber of Commerce (“ICC”) of an arbitration brought by AESU and Companhia de Gás do Estado do Río Grande do Sul (“Sulgás”) against YPF claiming damages in an approximate amount of US$1,052 million (€787 million), which includes the amount referred to above, in connection with YPF’s alleged liability resulting from the termination by AESU and Sulgás of the natural gas export contract entered into in September 1998. YPF denies all liability arising from such termination. Moreover, YPF believes that AESU’s damages assessment is far beyond any reasonable assessment, since it exceeds six-fold the maximum aggregate deliver-or-pay penalties that would have accrued in the event that YPF had breached its delivery obligations for the maximum daily quantity through the expiration of the term of the natural gas export contract, as set forth in the contract entered into in 1998. In addition, more than 90% of AESU’s damages assessment relates to alleged loss of profits that may be strongly challenged on the basis that prior to the termination of the natural gas export contract, AESU voluntarily terminated all of its long term power purchase contracts. YPF’s management considers that the claim brought by AESU is likely to be unsuccessful. On October 1, 2010, the terms of reference (Acta de Misión) were signed establishing the rules governing the proceedings and providing for the bifurcation of the proceedings for the purpose of deciding firstly, the jurisdiction matters. YPF lodged its objections against the Arbitration Tribunal’s jurisdiction on October 29, 2010 and AESU responded on November 30, 2010, dismissing the objections and affirming the Arbitration Tribunal’s jurisdiction. The Tribunal decided that a jurisdiction hearing was not necessary, determining that it is in a position to rule on its jurisdiction in the matter.
Furthermore, on April 6, 2009 YPF registered at the ICC a request for arbitration against AESU, Sulgás and Transportadora de Gas del Mercosur S.A. (“TGM”), seeking an award from the Arbitral Tribunal which states, among other things, that AESU and Sulgás have repudiated and unilaterally and illegally terminated the natural gas export contract entered into in September 1998 and declaring AESU and Sulgás liable for any damages suffered by the parties because of such termination, including but not limited to the damages resulting from the termination of the natural gas transportation contracts associated with the natural gas export contract. A memorandum was signed on October 1, 2010, setting out the claims submitted to arbitration by the parties and the procedural rules governing the arbitration proceedings.
With respect to the termination of the natural gas transportation contracts associated with this natural gas export contract, YPF was notified by the ICC of an arbitration brought by TGM against YPF claiming unpaid and outstanding payments for an approximate amount of US$10 million (€7 million) plus interests, in connection with the transportation fee established in the natural gas transportation contract entered into in September 1998 between YPF and TGM. YPF has requested the joinder of these two proceedings. On July 10, 2009, TGM increased its claim to US$17 million (€13 million) and claimed an additional US$366 million (€274 million) in alleged loss of profits. YPF considers that these claims will be unsuccessful. The relevant Arbitration Tribunal has been set up on June 10, 2010, YPF made its statements before the Tribunal, asking the Tribunal to acknowledge its lack of jurisdiction to rule on the claim. In the event that this motion is rejected, YPF has requested that the Arbitration Tribunal suspend these proceedings until the ongoing arbitration with TGM, AESU and Sulgás is settled. On September 14 and 15, 2010, the Arbitration Tribunal held hearings with both YPF and TGM to establish jurisdiction, a ruling that is pending.
131
On October 11, 2010, the terms of reference (Acta de misión) were signed establishing the parties’ claims and the rules governing the arbitration proceedings and providing for the bifurcation of the proceedings for the purposes of firstly resolving jurisdiction. AESU and TGB filed their objections to the Arbitration Tribunal’s jurisdiction on November 22, 2010, which were opposed by YPF, affirming the Arbitration Tribunal’s jurisdiction to rule on all the issues posed on December 20, 2010. The Tribunal decided that it was not necessary to hold a hearing, determining that it is in a position to rule on its jurisdiction in the matter.
In addition, there are certain claims concerning payments tied to natural gas transportation contracts associated with exports. In this order, one of the parties involved attempted to mediate with a view to determining the merits of these claims. When this mediation effort finalized without agreement, YPF was notified of the instigation of a claim against it under which Transportadora de Gas del Norte S.A. (“TGN”) is seeking contract fulfillment and the cancellation of unpaid invoices, while reserving the right to claim damages. YPF has responded to all these claims. In addition, the plaintiff recently notified YPF the termination of the transportation contract alleging breach by YPF based on its alleged failure to settle the transport service invoices, reserving the right to seek damages. It is YPF’s belief that the claims filed against it to date will not have a material adverse effect on its future results.
In addition, in accordance with the developments outlined in the preceding paragraph,on January 8, 2009, YPF also filed a complaint against TNG with the Argentine Natural Gas Regulatory Authority (“ENARGAS”), seeking the termination of the natural gas transportation contract with TGN for the transport of natural gas in connection with the natural gas export contract entered into with AESU and other parties. The request is based on (i) the termination of the referred natural gas export contract and the legal impossibility to assign the transportation contract to other shippers because of certain changes in law in effect since the year 2002; (ii) TGN’s legal impossibility to render the transportation service on a firm basis because of certain changes in law in effect since the year 2004; and (iii) the “statutory hardship” exemption available under Argentine law when extraordinary events render a party’s obligations excessively burdensome.
Compañía Mega S.A. Compañía Mega S.A. has also claimed compensation from YPF for failure to deliver natural gas under the relevant contract. YPF invoked that natural gas deliveries to Compañía Mega S.A. pursuant to the contract were affected by decisions made by the Argentine Government.
CNDC investigation. On November 17, 2003, within the framework of an official investigation pursuant to Article 29 of the Antitrust Act, the CNDC issued a request for explanations from a group of approximately 30 natural gas production companies, including YPF, with respect, among other things, to the following items: (i) the inclusion of clauses purportedly restraining trade in natural gas purchase/sale contracts; and (ii) gas imports from Bolivia, in particular (a) an expired contract signed by YPF, when it was state-owned, and YPFB (the Bolivian state-owned oil company), under which YPF allegedly sold Bolivian gas in Argentina at prices below the purchase price and (b) the unsuccessful attempts in 2001 by Duke and Distribuidora de Gas del Centro to import gas into Argentina from Bolivia. In January 2006, YPF received a notification of the CNDC ordering that preliminary proceedings be undertaken. YPF contested the complaint on the basis that no violation of the Act took place and that the charges are barred by the applicable statute of limitations. On January 15, 2007, the CNDC charged YPF and eight other producers with violations of Law 25,156. YPF presented evidence for its defense. In June 2007, without acknowledging any conduct in violation of the Antitrust Act, YPF filed with the CNDC a commitment according to Article 36 of the Antitrust Act in which YPF committed not to include the challenged clauses in future
132
sales contracts of natural gas and requested that the CNDC approve the commitment, suspend the investigation and dismiss the proceedings. YPF is still awaiting a formal response. On December 14, 2007, the CNDC elevated the investigation to the Court of Appeals after YPF filed an appeal against the decision which rejected its statute of limitations defense.
YPF is also currently subject to an antitrust proceeding concerning alleged price discrimination practices in the sale of fuel.
La Plata refinery environmental disputes. Since 1999 several claims have been brought for ecological and environmental damages in relation to La Plata refinery, seeking compensation for both collective and individual damages (health, psychological damages, moral damages, property devaluation), as a consequence of environmental pollution purportedly caused by the operation of such refinery, and the remediation of alleged environmental damages in the west water canal to the refinery. These claims likewise demand the undertaking of various works by YPF, the installation of equipment and technology, and the specific performance by YPF of work necessary to stop any environmental damage. YPF believes that, due to the indemnity provided by Law No. 24,145, YPF shall be allowed to request reimbursement of the expenses for liabilities existing on or prior to January 1, 1991 (before its privatization) from the Argentine Government. To the extent some of these claims partially overlap, YPF believes that they will need to be partially consolidated.
On this point, it should be noted that on January 25, 2010, YPF entered into an agreement with the Provincial Organism for Sustainable Development (OPDS for its initials in Spanish), which reports to the Buenos Aires Provincial Government, under the framework of the Program for Controlling Environmental Remediation, Liabilities and Risk set up by virtue of Ruling No 88/10 issued by the executive body of the OPDS. Under this agreement, the parties agreed to jointly undertake work on the canals surrounding the La Plata Refinery over an eight-year period, work which implies risk analysis and profiling of canal sediment. The agreement stipulates that in the event that the risk analysis implies the need to undertake corrective action, the alternatives and technology to be deployed will be analyzed at that time, establishing the steps required to execute the measures identified. The agreement also contemplates performing an analysis of the formation of the sediment in an attempt to establish liability on the part of the Argentine Government on the basis of its obligations to indemnify YPF S.A. pursuant to article 9 of Law 24,145 of YPF privatization.
133
Sale of Electricidad Argentina S.A. and Empresa Distribuidora y Comercializadora Norte S.A. to EDF Internacional S.A. (“EDF”). In July 2002, EDF initiated an international arbitration proceeding under the Arbitration Regulations of the International Chamber of Commerce against YPF, among others, seeking damages from YPF under the Stock Purchase Agreement dated March 30, 2001 which entitled EDF to an adjustment in the purchase price due to changes in the exchange rate of the Argentine peso prior to December 31, 2001. The arbitration decision of October 22, 2007 upheld EDF's claim; nonetheless, it also accepted the counterclaim filed by YPF. The amount payable by YPF should the resulting award become final is US$29 million (€22 million). However, YPF has challenged the award by filing an extraordinary appeal before the Argentine Supreme Court and an appeal before the Argentine Federal Court of Appeals on Commercial Matters. In April 2008, the Argentine Federal Court of Appeals on Commercial Matters suspended the effects of the arbitral award pending its appeal. On December 9, 2009, the Argentine Federal Court of Appeals on Commercial Matters handed down a judgment on the parties’ appeals in which it annulled the arbitration decision that condemned YPF to pay compensation for damages to EDF. It likewise annulled the decision which condemned EDF to pay compensation to YPF. On February 8, 2010, YPF was notified that EDF has filed an extraordinary appeal against the aforementioned court’s judgment which has been dismissed by Argentina’s Supreme Court. EDF filed an appeal against the dismissal, which has also been dismissed, as a result of which the ruling by the Federal Court of Appeals on Commercial Matters is now final.
Elsewhere, YPF has received notification of exequatur proceedings started by EDF in Paris requesting enforcement of the arbitration award in France. Notwithstanding the ruling handed down by the Argentine Supreme Court, a ruling in France enforcing execution of the arbitration award could be enforceable if YPF had any assets in that jurisdiction. In addition, on December 2, 2010, YPF received notification of arbitration award enforcement proceedings in Chile and on December 13, 2010 it received notification of similar enforcement proceedings in Brazil. YPF is in the process of analyzing what steps it will take to have these enforcement proceedings overturned.
Notwithstanding the developments outlined in the preceding paragraph, in light of the fact that the ruling by the Argentine Federal Court of Appeals on Commercial Matters is final, as mentioned earlier, YPF believes that the final outcome of the controversy will not have a material adverse effect on the company.
Northwest basin reserves review. The effectiveness of natural gas export authorizations (related to production in the Northwest basin) granted to YPF pursuant to Resolutions SE Nos. 165/99, 576/99, 629/99 and 168/00, issued by the Secretariat of Energy, is subject to an analysis by the Secretariat of Energy to determine whether sufficient additional natural gas reserves have been discovered or developed by YPF in the Northwest basin. The result of this ongoing review is uncertain and may have an adverse impact upon the execution of the export gas sales agreements related to such export authorizations, and may imply significant costs and liabilities for YPF. YPF has submitted to the Secretariat of Energy documentation in order to allow for the continuation of the authorized exports in accordance with Resolutions SE No. 629/1999, 565/1999, and 576/1999 (the “Export Permits”). These Export Permits relate to the long-term natural gas export contracts with Gas Atacama Generación, Edelnor and Electroandina, which have been amended, as detailed in the section headed “Natural gas market” earlier in this Note, with the effect of rendering supply by YPF ‘interruptible’. YPF has not yet received a response from the Argentine Secretariat of Energy. The file is currently awaiting decision from the Argentine Secretariat of Energy. If the Argentine Secretariat of Energy were to determine that the reserves are not sufficient to continue to comply with our export commitments and other commitments, it could declare the
134
expiration or suspension of one or more of the Export Permits, which would have a direct impact on the related export contracts.
On August 11, 2006, YPF received Note SE No. 1009 (the “Note”) from the Secretariat of Energy, which reviewed the progress of reserves in the Ramos Area in the Northwest basin, in relation to the export authorization granted by Resolution SE No. 169/97 (the “Export Authorization”). The Export Authorization concerns the long-term natural gas export contract between YPF and Gas Atacama Generación for a maximum daily volume of 530,000 m3/day. The Note stated that as a result of the decrease in natural gas reserves supporting the Export Authorization, the domestic market supply was at risk. The Note preventively provided that the maximum natural gas daily volumes authorized to be exported under the Export Authorization was to be reduced to 20%, affecting the export contract. YPF filed an answer to the Note on September 15, 2006 stating YPF’s allegations and defenses. YPF and Gas Atacama have reached an agreement pursuant to which the export contract was substantially amended.
Patagonian Association of Landowners (ASSUPA). In August 2003, ASSUPA filed suit against several concession holders of the operation and permit holders of the exploration of the Neuquén River Basin, including YPF, requesting that they be ordered to remedy the collective environmental damage supposedly caused and to take the necessary measures to avoid environmental damage in the future. The amount claimed is US$548 million (€410 million). YPF and the other defendants filed a motion to dismiss for failure of the plaintiff to state a claim upon which relief may be granted. The court granted the motion, and ASSUPA had to file a supplementary complaint. YPF requested that the claim be rejected because the defects of the demand indicated by the Argentine Supreme Court had not been corrected but such request was denied. However, YPF has also requested that the claim be rejected for other reasons, and has impleaded the National Government, due to its obligation to indemnify YPF against any liability and hold YPF harmless for events and claims previous to January 1, 1991, according to Law No. 22,145 and Decree 546/1993. On August 26, 2008, the Argentine Supreme Court ruled that the plaintiff had rectified the defects of the demand. In compliance with a ruling of January 23, 2009 certain Argentine provinces, the Argentine State and the Argentine Federal Council for the Environment were impleaded. The proceeding has been deferred until such third parties appear before court. To date, the provinces of Río Negro, Buenos Aires, Neuquén, Mendoza and the Argentine State have appeared before court, although the company did not have access to the statements made. The provinces of Neuquén and La Pampa both made lack of jurisdiction (excepción de incompetencia) statements which have been opposed by the plaintiff, being currently pending for resolution.
Dock Sud environmental claims. Residents of the Dock Sud area filed environmental claims against multiple respondents (up to 44) including YPF, the National Government, the Province of Buenos Aires, the Autonomous City of Buenos Aires and fourteen municipalities, seeking individual damage to their health and to their property, environmental remediation in the Dock Sud area and the indemnification of the environmental collective damage produced in the Matanza Riachuelo basin. On July 8, 2008, the Argentine Supreme Court decided that the Basin Authority (Law 26,168) will be in charge of performing a remediation plan as well as of taking preventive measures in the area, while the National Government, the Province of Buenos Aires and the Autonomous City of Buenos Aires shall be responsible for ensuring that such actions are taken, and also ruled that the proceedings to determine the liability for actions taken in the past would continue before the Supreme Court of Argentina.
Additionally, another group of residents of the Dock Sud area, have filed two other environmental lawsuits, one of which does not involve YPF, requesting that several companies located in that area, including YPF, the Province of Buenos Aires and
135
several municipalities, remediate and, alternatively, indemnify the collective environmental damage of the Dock Sud area and any individual damage that has been suffered. YPF has the right of indemnity by the Argentine Government for events and claims prior to January 1, 1991, pursuant to Law No. 22,145 and Decree No. 546/1993.
Quilmes environmental claims. Citizens claiming to be residents living near Quilmes, in the province of Buenos Aires, have filed a lawsuit in which they have requested the remediation of environmental damages and the payment of Ps.47 million (€9 million) as compensation for alleged personal damages, plus interest. The plaintiffs base their claim mainly on a fuel leak that occurred in 1988 in a poliduct running from La Plata to Dock Sud. The fuel leakage became perceptible in 2002, resulting in remediation that is now being performed by YPF in the affected area, supervised by the environmental authority of the province of Buenos Aires. YPF has notified the Argentine Government that it will implead the government when YPF answers the complaint in order to request that it indemnify YPF against any liability and hold YPF harmless in connection with this lawsuit, as provided by Law No. 24,145. The Argentine Government has denied any responsibility to indemnify YPF for this matter, and YPF has sued the Argentine Government to obtain a judicial award that annuls this decision. There are 30 other judicial claims that have been brought against YPF based on similar allegations, amounting to approximately Ps.17 million (€3 million).
Note number 245/08 issued by the Under-Secretariat of Mining and Hydrocarbons for the Province of Río Negro.- On May 15, 2008, YPF was notified of Resolution 433/08 concerning compliance with certain obligations of YPF as exploitation concessionaire in the hydrocarbon bearing zones of Barranca de los Loros, Bajo del Piche, El Medanito and Los Caldenes, all located in Rio Negro Province. This resolution asserts that YPF, among others, in its capacity as a concessionaire, are liable for failing to meet certain concession and environmental obligations. If found liable, YPF could be at risk of termination of these concession contracts. In light of the above, and consistent with provisions of the Hydrocarbons Law, YPF was requested to submit a response. YPF submitted the documentation requested of it in December 2009.
Since the Hydrocarbons Law grants the concessionaire the right, prior to the declaration of termination of the concession, to cure any breach of the concession obligations within a certain period of time after receiving notice thereof, on May 29, 2008, YPF filed a request for nullification of Resolution 433/08 (“MP”), since this resolution failed to grant YPF such right. Additionally, YPF submitted a response denying the charges against it and on November 12, 2008, the Ministry of Production ordered the initiation of the evidence production period. On November 28, 2008, YPF filed a writ requesting the production of certain evidence and the appointment of YPF’s technical expert. YPF has challenged certain aspects related to the production of evidence. On December 1, 2009, the relevant informative evidence was presented, while certain issues related to the evidence raised by YPF are still pending resolution. Lastly, on September 16, 2010, termination of this suit was requested based on: (a) the amounts invested to comply with concession obligations between 2007 and 2010; and (b) the efforts made with respect to environmental obligations.
136
Claim filed against Repsol YPF and YPF by the Union of Consumers and Users. The plaintiff claims the reimbursement of all the amounts allegedly charged in excess of the consumers of bottled LPG in the 1993-2001 period, corresponding to a surcharge for the aforementioned product. With respect to the period from 1993 to 1997, the claim is based on the fine imposed on YPF by the Secretariat of Industry and Commerce through its resolution of March 19, 1999. It should be noted that Repsol YPF has never participated in the LGP market in Argentina and that the fine for abusing a dominant position was imposed on YPF. In addition, YPF has alleged that charges are barred by the applicable statute of limitations. Hearings have commenced and are in process. The claim amounts to Ps.91 million (€17 million) for the 1993-1997 period. Adding interests, this amount would increase to Ps.321 million (€61 million), to which the amount corresponding to the 1997-2001 period should be added, as well as accrued interest and expenses.
ECUADOR
On June 9, 2008 the companies comprising the Block 16 consortium, including Repsol YPF Ecuador S.A., the operator of the block, brought four claims before the International Center for Settlement of Investment Disputes (ICSID) against Empresa Estatal Petróleos del Ecuador (PetroEcuador) in connection, inter alia, with controversies regarding the applicability of certain adjustments to the participation calculation. On August 20, 2008, a settlement agreement was reached and an “Acta de Compensación de Cuentas” was signed by PetroEcuador and Repsol YPF Ecuador S.A., whereby reciprocal outstanding credits and outstanding oil barrels debts for Block 16 and for Campo Unificado Bogi-Capirón were offset. By means of the execution of the “Acta de Compensación de Cuentas,” three of the four claims brought before the ICSID were settled.
The remaining claim, concerning Law 2006-42, relates to the application of the new minimum tax of 50% on extraordinary profits. Notwithstanding the international arbitration process and the injunction requests brought by Repsol YPF Ecuador S.A., the Government of Ecuador brought forward a coercive process, instigated by PetroEcuador, demanding payment in respect of extraordinary profits generated between April 2006 and March 2008, in an amount of US$591 million (€442 million), which were paid under protest. On March 12, 2009, following a negotiation process, a Disbursement Agreement (“Convenio de Desembolsos”) was executed in respect of extraordinary profits generated between April 2008 and December 2008. This Disbursement Agreement was implemented without relinquishing the arbitration process and under the condition that, if such payments are reduced, voided or declared inadmissible by a decision of a court, arbitration tribunal or otherwise, or, alternatively, if Repsol YPF Ecuador S.A.’s right to an indemnification is recognized, Repsol YPF Ecuador S.A. will be able to cease disbursements of pending amounts under Law 2006-42. The signing of the Disbursement Agreement suspended the coercive process.
In accordance with the payment schedule set forth in the Disbursement Agreement, Repsol YPF Ecuador S.A. has paid US$142 million (€106 million).
137
Pursuant to a resolution of the ICSID Arbitration Tribunal dated June 17, 2009, in effect through March 12, 2010, neither the Ecuadorian Government nor PetroEcuador or any other public entity of the Republic of Ecuador, may, by itself or through its officers or employees, take any action against or in relation with the claimants which seeks to seize or garnish Repsol YPF Ecuador S.A.’s assets, or which may result in suspending or materially affecting the activities of the claimants, unless they provide the claimants and the ICSID Arbitration Tribunal with a written notice of their intentions at least six business days in advance of taking such action. On May 7, 2010, the Tribunal agreed to extend effectiveness of the above injunction to March 11, 2011. In September 2010, the Republic of Ecuador filed its memorial response.
Having negotiated and entered into a new Services Agreement with the Ecuadorian Government, which substitutes the former Participation Agreement, Repsol must abandon the ongoing arbitration proceeds, as agreed initially with the Ecuadorian Government (Note 2). The ICSID Arbitration Tribunal, by means of a ruling issued on February 9, 2011, accepted the joint application to terminate the arbitration proceedings, effectively putting an end to the process.
Until March 2009, Repsol YPF’s interest in the Block 16 consortium was 35%; as from that date, Repsol YPF holds, directly and indirectly, a 55% interest in the consortium.
BRAZIL
The Group is party to administrative claims instigated by the Brazilian authorities concerning the importation and circulation of industrial equipment for the exploration and production of hydrocarbons in fields that are not operated by the Repsol Group. The amount of such claims that could be allocated to the Repsol Group on account of its investments in non-operating consortia would total €342 million.
TRINIDAD AND TOBAGO
On September 1, 2008, BP America Production Company initiated arbitration proceedings in New York against Repsol YPF under the UNCITRAL Rules, in connection with Repsol YPF’s alleged obligation to share the extraordinary income derived from the shipping of certain LNG cargoes of Atlantic LNG 2/3 Company of Trinidad and Tobago Unlimited’s trains 2 and 3, under the Supplemental Agreement entered into. The arbitration proceeding was divided into two phases, each of which addressed the interpretation of the Supplemental Agreement and the economic consequences resulting from its application, respectively. On November 17, 2009, the arbitration tribunal validated BP’s interpretation of the Supplemental Agreement. On June 7, 2010, Repsol YPF and BP executed a Settlement Agreement to finally settle the case.
SPAIN
CNC Resolution of June 30, 2009: On July 30, 2009, the CNC Board passed a resolution holding RCPP, BP, and CEPSA liable for violating Article 1 of the LCD and Article 81 of the EC Treaty (current article 101 of the TFEU). The violation consisted of the indirect fixing of fuel prices in their respective gasoline stations. The resolution further imposed a fine of €5 million on RCPP. On October 27, 2009, RCPP filed an administrative appeal with the Sixth Section of the Contentious-Administrative Chamber of the Spanish National Court of Justice against the CNC resolution of July 30, 2009; this appeal was officially lodged on December 29, 2010. The Spanish National Court of Justice has agreed to an injunction against the monetary sanction. In
138
addition, and on a parallel basis, the special claim for jurisdictional protection of fundamental rights was officially lodged before the Administrative Appeals Court of the National Court of Justice.
ALGERIA
Gas Natural Fenosa v. Sonatrach (Gas supply contract litigation). Gas Natural Fenosa and Sonatrach were engaged in a dispute over the price review for the gas supply contracts received from Algeria through the Maghreb-Europe pipeline. The final arbitration ruling notified in August 2010 provides for a price increase from 2007 onwards. The maximum retroactive effects invoiced by Sonatrach to Gas Natural Fenosa would amount to $1,970 million (€444 million pro rata for the Group’s shareholding in Gas Natural Fenosa). Gas Natural Fenosa has challenged the arbitration ruling before the Swiss Federal Court and has requested opening the price review process of the above contracts to take into account the profound changes that have taken place, as well as the current situation of the world markets, particularly in Spain, as contemplated by the contracts.
In November 2010, the Swiss Federal Court granted a stay against the original ruling, which has the effect of suspending it until the Court rules on the motion presented by Gas Natural Fenosa.
Gas Natural Fenosa and Sonatrach are in talks to review the prices stipulated in these contracts which are expected to result in a positive outcome and the definitive end to the controversy between the two parties. In the event that none of the actions being taken by Gas Natural Fenosa to mitigate the impact of the aforementioned ruling prosper, a portion of the price increases would be passed on to certain customers in accordance with the contractual terms of their agreements.
(35) ENVIRONMENTAL INFORMATION
Management of safety and the environment is based on a management system which comprises an extensive body of standards, procedures, technical guides, and management tools that are continually being updated to adapt to the best practices of the sector. We strive for ISO 14001 certification of our installations in order to promote continuous improvement and obtain external validation of our management systems.
A key element in the Repsol YPF Environmental Management System worth highlighting is the annual setting of environmental objectives approved by the executive committee within the framework of the strategic environmental guidelines of the Company. The strategic guidelines take into account critical areas for environmental protection, leadership in management, improvement in management, risk control, and the minimization of the environmental impact of activities and products. They further serve to prepare the action plans for each business, and include the measures required to improve and respond to new legislative requirements, Repsol YPF's strategic focus, plans for corrective measures arising from environmental audits performed, etc., together with the investments and expenses required to implement all these measures, which were addressed in the Company’s general budget.
The criteria used to measure environmental costs are established in the “Repsol YPF Environmental Costs Guide”, which adapts the American Petroleum Institute guidelines to the Group’s operations and technical approach. It is important to note in this regard that the traditional “bottom-line” solutions for reducing environmental impact are
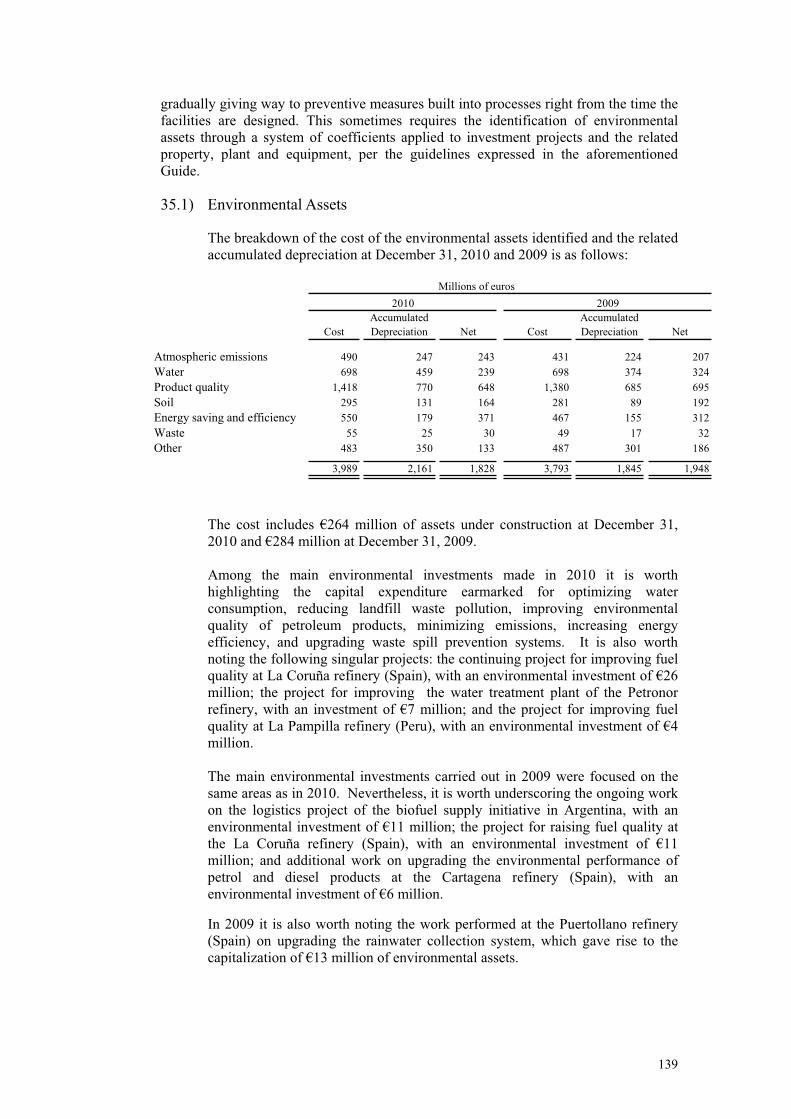
139
gradually giving way to preventive measures built into processes right from the time the facilities are designed. This sometimes requires the identification of environmental assets through a system of coefficients applied to investment projects and the related property, plant and equipment, per the guidelines expressed in the aforementioned Guide.
35.1) Environmental Assets
The breakdown of the cost of the environmental assets identified and the related accumulated depreciation at December 31, 2010 and 2009 is as follows:
CostAccumulated Depreciation Net Cost
Accumulated Depreciation Net
Atmospheric emissions 490 247 243 431 224 207Water 698 459 239 698 374 324Product quality 1,418 770 648 1,380 685 695Soil 295 131 164 281 89 192Energy saving and efficiency 550 179 371 467 155 312Waste 55 25 30 49 17 32Other 483 350 133 487 301 186
3,989 2,161 1,828 3,793 1,845 1,948
2010Millions of euros
2009
The cost includes €264 million of assets under construction at December 31, 2010 and €284 million at December 31, 2009.
Among the main environmental investments made in 2010 it is worth highlighting the capital expenditure earmarked for optimizing water consumption, reducing landfill waste pollution, improving environmental quality of petroleum products, minimizing emissions, increasing energy efficiency, and upgrading waste spill prevention systems. It is also worth noting the following singular projects: the continuing project for improving fuel quality at La Coruña refinery (Spain), with an environmental investment of €26 million; the project for improving the water treatment plant of the Petronor refinery, with an investment of €7 million; and the project for improving fuel quality at La Pampilla refinery (Peru), with an environmental investment of €4 million.
The main environmental investments carried out in 2009 were focused on the same areas as in 2010. Nevertheless, it is worth underscoring the ongoing work on the logistics project of the biofuel supply initiative in Argentina, with an environmental investment of €11 million; the project for raising fuel quality at the La Coruña refinery (Spain), with an environmental investment of €11 million; and additional work on upgrading the environmental performance of petrol and diesel products at the Cartagena refinery (Spain), with an environmental investment of €6 million.
In 2009 it is also worth noting the work performed at the Puertollano refinery (Spain) on upgrading the rainwater collection system, which gave rise to the capitalization of €13 million of environmental assets.
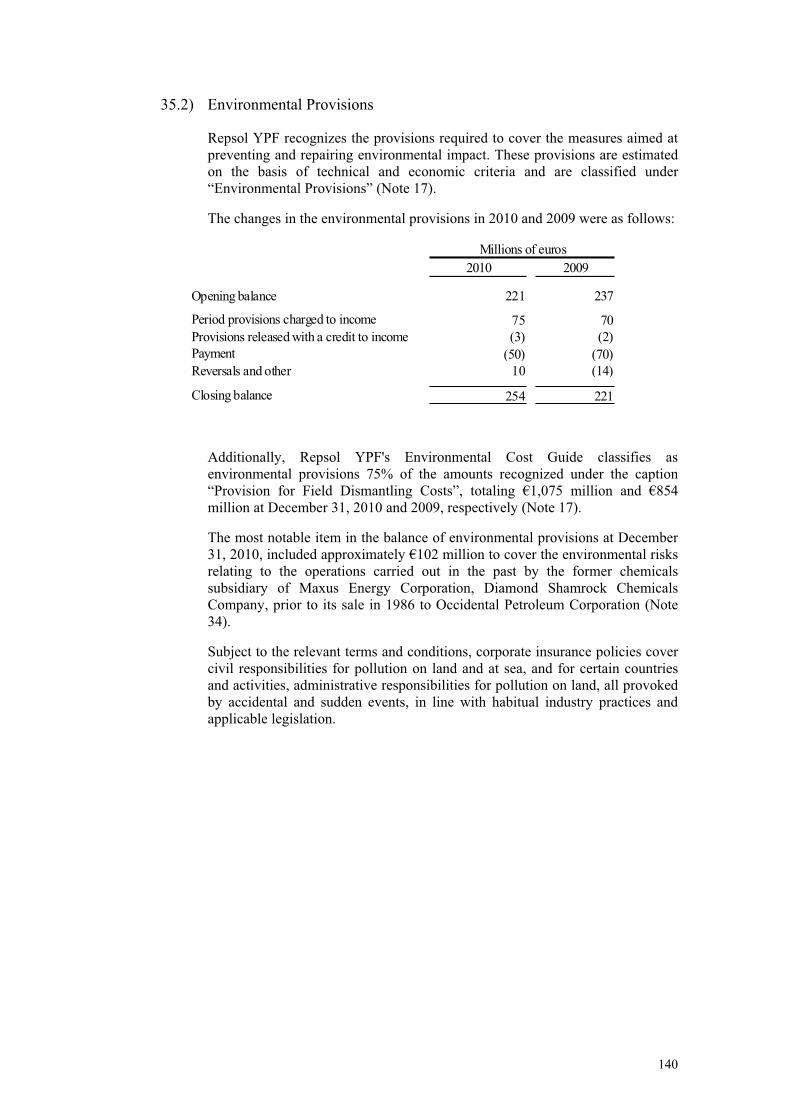
140
35.2) Environmental Provisions
Repsol YPF recognizes the provisions required to cover the measures aimed at preventing and repairing environmental impact. These provisions are estimated on the basis of technical and economic criteria and are classified under “Environmental Provisions” (Note 17).
The changes in the environmental provisions in 2010 and 2009 were as follows:
2010 2009
Opening balance 221 237
Period provisions charged to income 75 70Provisions released with a credit to income (3) (2)Payment (50) (70)Reversals and other 10 (14)
Closing balance 254 221
Millions of euros
Additionally, Repsol YPF's Environmental Cost Guide classifies as environmental provisions 75% of the amounts recognized under the caption “Provision for Field Dismantling Costs”, totaling €1,075 million and €854 million at December 31, 2010 and 2009, respectively (Note 17).
The most notable item in the balance of environmental provisions at December 31, 2010, included approximately €102 million to cover the environmental risks relating to the operations carried out in the past by the former chemicals subsidiary of Maxus Energy Corporation, Diamond Shamrock Chemicals Company, prior to its sale in 1986 to Occidental Petroleum Corporation (Note 34).
Subject to the relevant terms and conditions, corporate insurance policies cover civil responsibilities for pollution on land and at sea, and for certain countries and activities, administrative responsibilities for pollution on land, all provoked by accidental and sudden events, in line with habitual industry practices and applicable legislation.
141
35.3) Environmental Expenses
In 2010 and 2009 environmental expenses amounted to €356 million and €347 million respectively, classified as “Supplies” and “Other operating expenses.”
These expenses include €177 million of expense for the rights necessary to cover CO2 emissions during 2010 (although according to Note 35.5 below, CO2emissions, the effect in the income statement in relation with this item amounted to a net expense of €5 million in 2010). Environmental expenses in 2010 and 2009 also include: other measures for atmospheric protection amounting to €27 million and €22 million respectively; soil remedation and field dismantelily costs remediation amounting to €46 million and €30 million, respectively; waste management amounting to €33 million and €32 million, respectively; and water management amounting to €21 million and €20 million, respectively.
35.4) Planned Initiatives
Among the most relevant issues which could affect Repsol YPF operations and investments in the future, the most noteworthy are related to climate change and energy, integrated pollution prevention and control, environmental responsibility, water quality, as well as waste.
On climate change and energy matters, in April 2009, the European Union approved a package of Directives with the targets set for 2020 in relation to: (i) the reduction of global greenhouse gas emissions over 1990 levels by at least 20%, (ii) boosting the use of renewable energy sources to account for 20% of total output, and (iii) a 20% reduction in energy consumption via enhanced energy efficiency.
Directive 2009/28/EC on the promotion of the use of energy from renewable sources, sets a target of 20% for the overall share of energy from renewable sources and a 10% target for energy from renewable sources in transport for 2020 in respect of 2005 levels. This Directive further sets the sustainability criteria to be met by biofuels in order to guarantee a minimum contribution to reducing carbon emissions relative to the use of petrol and diesel.
Each State member must adopt a national action plan on renewable energy that lays down national targets and the appropriate measures to be taken to ensure delivery of these targets.
Directive 2009/29/EC amending Directive 2003/87/EC so as to improve and extend the greenhouse gas emission allowance trading scheme of the Community, sets the target of cutting the overall greenhouse gas emissions of the Community by at least 20% below 1990 levels by 2020. The reduction of allowances within the trading scheme implies a reduction of 21% on 2005 levels. This reduction is to be achieved on a straight-line annual basis, resulting in an annual reduction in emission allowances of 1.74%.
Auctions are designated as the primary means of allocating emission allowances. Fifty per-cent of state revenues generated from allowance auctions should be used, among others, for contributions to the Adaptation Fund put in practice at the XIV Conference of Parties (COP
142
14) celebrated in Poznan, to fund R&D, for the development of renewable energies and for the capture and geological storage of greenhouse gases. Sectors with particularly high exposure to international competition (refining and chemicals) shall benefit from a free allowance allocation based on sector benchmarking. The installations of sectors and sub-sectors exposed to carbon dioxide leaks will receive a 100% free allowance allocation.
Directive 2009/30/EC as regards the petrol, diesel and gas-oil specifications and introducing a mechanism to monitor and reduce greenhouse gas emissions, which is aimed at controlling, documenting and reducing fuel life greenhouse gas emissions.
The Directive sets fuel performance technical specifications for road vehicles, non-road mobile machinery, agricultural and forestry tractors, and recreational craft when not at sea, as well as a target for the reduction of life cycle greenhouse gas emissions.
Under the Directive, suppliers are obliged to report each year on the intensity of greenhouse gas emissions of the fuels and energy supplied. Member states shall require suppliers to reduce life cycle greenhouse gas emissions per unit of energy from fuel and energy supplied by up to 10 % by December 31, 2020. This reduction shall consist of a 6% reduction by means of biofuels, an indicative additional target of 2% via the capture and geological storage of CO2 and electric vehicles and an additional indicative target of 2% via Clean Development Mechanism CERs.
Directive 2009/31/EC on the geological storage of carbon dioxide establishes the legal framework governing the environmentally safe geological storage of CO2 (permanent confinement that is risk-free for the environment and human health) in a bid to contribute to the fight against climate change. This directive lays down requirements on storage site selection, storage and operating permits and on closure and post-closure obligations.
Spain has begun to transpose the requirements laid down in Directive 2009/29/EC in Law 5/2009, which sets reporting requirements for sectors forming part of the greenhouse gas allowance trading scheme.
The new legislation includes additional information regarding the review of the Community allowance trading scheme, stipulating that owners of facilities that engage in the activities listed in the appendix to the legislative text and which are not subject to the 2008-2012 allowance trading scheme present, by April 30, 2010, emission figures for 2007 and 2008 before the competent regional authorities.
Moreover, Order PRE/2827/2009, which amends the sector allocations made under the 2008-2012 National Greenhouse Gas Allowance Allocation Plan, modified the allocations to the various activities subject to the allowance trading scheme, reducing the amount allocated to the Newcomers Reserve to 6.058 million tons of CO2.
In addition, in 2010 European Union legislation on Large Combustion Facilities was updated, refunding the Directive on Integrated Pollution Prevention and
143
Control (IPPC), other existing directives were revised, and the Directive 2010/75/EC on Industrial Emissions was approved. This last directive addresses, among other issues, new and more demanding emission limits as well as reinforcing the process for determining and applying the best available techniques (BAT).
With respect to environmental responsibility, a draft Ministerial Order was presented in Spain on the requirement of financial guarantees and the order of priority in which all industrial activities are considered.
Regarding water quality, a draft Royal Decree on environmental quality standards was presented in Spain, the purpose of which is to transpose the content of Directive 2008/105/EC. In more detail, the Royal Decree establishes environmental quality standards (EQS) for priority substances and other pollutants with the objective of achieving good surface water chemical status. It also incorporates the technical requirements for chemical analysis established in Directive 2009/90/EC, in other words, the minimum criteria for analytical methods that must be applied to monitor water status, sediment and living organisms, as well as rules for demonstrating the quality of analytical results.
A new law on waste is expected to be approved in Spain shortly, annulling Law 10/1998 of April 21 on waste. The draft law transposes the EU Directive on Waste approved in 2008. The objective is to update current prevailing legislation, orient policy on waste in accordance with the principle of hierarchy, and guarantee protection of human health and the environment, maximizing use of resources and minimizing the impact of waste production and management. This law is also intended to regulate the legal regime over polluted soils.
The most noteworthy of the main novelties with respect to Law 10/1998 are the following: the introduction of specific sections dedicated to sub-products and to the concept of end of useful life of waste; the creation of a coordinating Commission to function as a body for technical cooperation and collaboration amongst the different administrations for matters related to waste; and introduction of the concept of producer responsibility, whereby the producer must accept the return of reusable products, the delivery of waste generated after use of the product, and its corresponding management.
144
35.5) CO2 Emissions
During 2010 and 2009 the companies comprising the consolidation scope recognized emission allowances allocated free of charge under the Spanish national allocation plan equivalent to 16.4 and 15.9 million tons of CO2respectively, measured at €216 and €246 million. The same allocation plan stipulates allocation of 2011 allowances equivalent to 16.7 million tons of CO2.
In 2010 there was no depreciation in the value of emission rights, in contrast to 2009 which saw the recognition of a €50 million provision, almost entirely offset by revenue from deferred income recognized in the income statement in relation to emission allowances received for no consideration.
The net results for 2010 with respect to management of CO2 amounted to an expense of €5 million, while in 2009 a profit of €35 million was recognized.
The Repsol YPF installations included in the European allowance trading scheme are entitled to levels of gratuitous CO2 emissions that are being reduced over time. In order to minimize the cost of meeting these declining allocations in the future, the Company has committed to a series of investments for the acquisition of Clean Development Mechanism (CDM) and Joint Implementation (JI) credits through carbon funds (the Spanish Carbon Fund managed by the World Bank and the Greenhouse Gas Credit Aggregation Pool managed by Natsource). Future trading in CDM and JI credits through carbon funds presents an opportunity to avail of low cost credits for future compliance purposes.
Repsol YPF’s commitments resulted in the acquisition of credits in 2010. Including these purchases, investment commitments at year end 2009 amounted to €52 million.
(36) FEES PAID TO THE AUDITORS
In 2010, the fees earned by Deloitte for the audit services provided to Repsol YPF, S.A. and the Group companies amounted to €8.1 million. Additionally, the fees earned by the auditors and their organization for audit-related services and other services amounted to €0.8 million.
The sum of these amounts does not represent more than 10% of the total volume of business of the auditors and their organization.
(37) SUBSEQUENT EVENTS
On February 22, 2011 the Group formally requested delisting of their American Depositary Shares (ADSs) from the New York Stock Exchange (NYSE). In these sense, it is estimated that the last trading day for the ADSs on the NYSE will be on March 4, 2011.
On February 8, 2011, the 100% of Repsol International Capital's (RIC) preference shares traded on the NYSE were redeemed. The securities were redeemed at US$25.00
145
per preference share plus the amount for undistributed accrued dividends from December 31, 2010 up to the redemption date, which amounted to US$0.20 per preferential share.
(38) EXPLANATION ADDED FOR TRANSLATION TO ENGLISH
These consolidated financial statements are prepared on the basis of IFRSs as undorsed by the European Union and certain accounting practices applied by the Group that conform with IFRSs endorsed by the European Union may not conform with other generally accepted accounting principles.
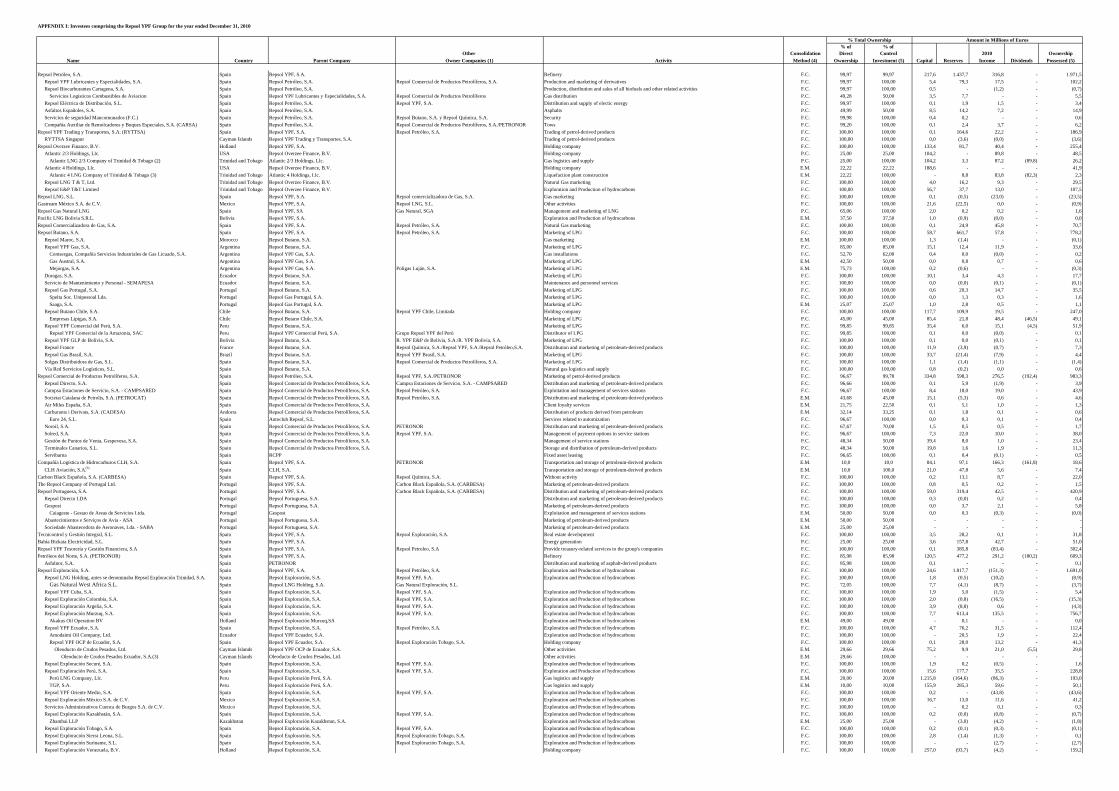
APPENDIX I: Investees comprising the Repsol YPF Group for the year ended December 31, 2010
% of % ofOther Consolidation Direct Control 2010 Ownership
Name Country Parent Company Owner Companies (1) Activity Method (4) Ownership Investment (5) Capital Reserves Income Dividends Possessed (5)
Repsol Petróleo, S.A. Spain Repsol YPF, S.A. Refinery F.C. 99,97 99,97 217,6 1.437,7 316,8 - 1.971,5
Repsol YPF Lubricantes y Especialidades, S.A. Spain Repsol Petróleo, S.A. Repsol Comercial de Productos Petrolíferos, S.A. Production and marketing of derivatives F.C. 99,97 100,00 5,4 79,3 17,5 - 102,2
Repsol Biocarburantes Cartagena, S.A. Spain Repsol Petróleo, S.A. Production, distribution and sales of all biofuels and other related activities F.C. 99,97 100,00 0,5 - (1,2) - (0,7)
Servicios Logisticos Combustibles de Aviacion Spain Repsol YPF Lubricantes y Especialidades, S.A. Repsol Comercial de Productos Petrolíferos Gas distribution P.C. 49,28 50,00 3,5 7,7 - - 5,5
Repsol Eléctrica de Distribución, S.L. Spain Repsol Petróleo, S.A. Repsol YPF, S.A. Distribution and supply of electic energy F.C. 99,97 100,00 0,1 1,9 1,5 - 3,4
Asfaltos Españoles, S.A. Spain Repsol Petróleo, S.A. Asphalts P.C. 49,99 50,00 8,5 14,2 7,2 - 14,9
Servicios de seguridad Mancomunados (F.C.) Spain Repsol Petróleo, S.A. Repsol Butano, S.A. y Repsol Química, S.A. Security F.C. 99,98 100,00 0,4 0,2 - - 0,6
Compañía Auxiliar de Remolcadores y Buques Especiales, S.A. (CARSA) Spain Repsol Petróleo, S.A. Repsol Comercial de Productos Petrolíferos, S.A./PETRONOR Tows F.C. 99,20 100,00 0,1 2,4 3,7 - 6,2
Repsol YPF Trading y Transportes, S.A. (RYTTSA) Spain Repsol YPF, S.A. Repsol Petróleo, S.A. Trading of petrol-derived products F.C. 100,00 100,00 0,1 164,6 22,2 - 186,9
RYTTSA Singapur Cayman Islands Repsol YPF Trading y Transportes, S.A. Trading of petrol-derived products F.C. 100,00 100,00 0,0 (3,6) (0,0) - (3,6)
Repsol Overzee Finance, B.V. Holland Repsol YPF, S.A. Holding company F.C. 100,00 100,00 133,4 81,7 40,4 - 255,4
Atlantic 2/3 Holdings, Llc. USA Repsol Overzee Finance, B.V. Holding company P.C. 25,00 25,00 104,2 - 89,8 - 48,5
Atlantic LNG 2/3 Company of Trinidad & Tobago (2) Trinidad and Tobago Atlantic 2/3 Holdings, Llc. Gas logistics and supply P.C. 25,00 100,00 104,2 3,3 87,2 (89,8) 26,2
Atlantic 4 Holdings, Llc. USA Repsol Overzee Finance, B.V. Holding company E.M. 22,22 22,22 188,6 - - - 41,9
Atlantic 4 LNG Company of Trinidad & Tobago (3) Trinidad and Tobago Atlantic 4 Holdings, Llc. Liquefaction plant construction E.M. 22,22 100,00 - 8,8 83,8 (82,3) 2,3
Repsol LNG T & T, Ltd. Trinidad and Tobago Repsol Overzee Finance, B.V. Natural Gas marketing F.C. 100,00 100,00 4,0 16,2 9,3 - 29,5
Repsol E&P T&T Limited Trinidad and Tobago Repsol Overzee Finance, B.V. Exploration and Production of hydrocarbons F.C. 100,00 100,00 56,7 37,7 13,0 - 107,5
Repsol LNG, S.L. Spain Repsol YPF, S.A. Repsol comercializadora de Gas, S.A. Gas marketing F.C. 100,00 100,00 0,1 (0,5) (23,0) - (23,5)
Gastream México S.A. de C.V. Mexico Repsol YPF, S.A. Repsol LNG, S.L. Other activities F.C. 100,00 100,00 21,6 (22,5) 0,0 - (0,9)
Repsol Gas Natural LNG Spain Repsol YPF, SA Gas Natural, SGA Management and marketing of LNG P.C. 65,06 100,00 2,0 0,2 0,2 - 1,6
Pacific LNG Bolivia S.R.L. Bolivia Repsol YPF, S.A. Exploration and Production of hydrocarbons E.M. 37,50 37,50 1,0 (0,9) (0,0) - 0,0
Repsol Comercializadora de Gas, S.A. Spain Repsol YPF, S.A. Repsol Petróleo, S.A. Natural Gas marketing F.C. 100,00 100,00 0,1 24,9 45,8 - 70,7
Repsol Butano, S.A. Spain Repsol YPF, S.A. Repsol Petróleo, S.A. Marketing of LPG F.C. 100,00 100,00 58,7 661,7 57,8 - 778,2
Repsol Maroc, S.A. Morocco Repsol Butano, S.A. Gas marketing E.M. 100,00 100,00 1,3 (1,4) - - (0,1)
Repsol YPF Gas, S.A. Argentina Repsol Butano, S.A. Marketing of LPG F.C. 85,00 85,00 15,1 12,4 11,9 - 33,6
Comsergas, Compañía Servicios Industriales de Gas Licuado, S.A. Argentina Repsol YPF Gas, S.A. Gas installations F.C. 52,70 62,00 0,4 0,0 (0,0) - 0,2
Gas Austral, S.A. Argentina Repsol YPF Gas, S.A. Marketing of LPG E.M. 42,50 50,00 0,0 0,8 0,7 - 0,6
Mejorgas, S.A. Argentina Repsol YPF Gas, S.A. Poligas Luján, S.A. Marketing of LPG E.M. 75,73 100,00 0,2 (0,6) - - (0,3)
Duragas, S.A. Ecuador Repsol Butano, S.A. Marketing of LPG F.C. 100,00 100,00 10,1 3,4 4,3 - 17,7
Servicio de Mantenimiento y Personal - SEMAPESA Ecuador Repsol Butano, S.A. Maintenance and personnel services F.C. 100,00 100,00 0,0 (0,0) (0,1) - (0,1)
Repsol Gas Portugal, S.A. Portugal Repsol Butano, S.A. Marketing of LPG F.C. 100,00 100,00 0,6 20,3 14,7 - 35,5
Spelta Soc. Unipessoal Lda. Portugal Repsol Gas Portugal, S.A. Marketing of LPG F.C. 100,00 100,00 0,0 1,3 0,3 - 1,6
Saaga, S.A. Portugal Repsol Gas Portugal, S.A. Marketing of LPG E.M. 25,07 25,07 1,0 2,8 0,5 - 1,1
Repsol Butano Chile, S.A. Chile Repsol Butano, S.A. Repsol YPF Chile, Limitada Holding company F.C. 100,00 100,00 117,7 109,9 19,5 - 247,0
Empresas Lipigas, S.A. Chile Repsol Butano Chile, S.A. Marketing of LPG P.C. 45,00 45,00 85,4 21,8 48,4 (46,5) 49,1
Repsol YPF Comercial del Perú, S.A. Peru Repsol Butano, S.A. Marketing of LPG F.C. 99,85 99,85 35,4 6,0 15,1 (4,5) 51,9
Repsol YPF Comercial de la Amazonia, SAC Peru Repsol YPF Comercial Perú, S.A. Grupo Repsol YPF del Perú Distributor of LPG F.C. 99,85 100,00 0,1 0,0 (0,0) - 0,1
Repsol YPF GLP de Bolivia, S.A. Bolivia Repsol Butano, S.A. R. YPF E&P de Bolivia, S.A./R. YPF Bolivia, S.A. Marketing of LPG F.C. 100,00 100,00 0,1 0,0 (0,1) - 0,1
Repsol France France Repsol Butano, S.A. Repsol Química, S.A./Repsol YPF, S.A./Repsol Petróleo,S.A. Distribution and marketing of petroleum-derived products F.C. 100,00 100,00 11,9 (3,9) (0,7) - 7,3
Repsol Gas Brasil, S.A. Brazil Repsol Butano, S.A. Repsol YPF Brasil, S.A. Marketing of LPG F.C. 100,00 100,00 33,7 (21,4) (7,9) - 4,4
Solgas Distribuidora de Gas, S.L. Spain Repsol Butano, S.A. Repsol Comercial de Productos Petrolíferos, S.A. Marketing of LPG F.C. 100,00 100,00 1,1 (1,4) (1,1) - (1,4)
Vía Red Servicios Logísticos, S.L. Spain Repsol Butano, S.A. Natural gas logistics and supply F.C. 100,00 100,00 0,8 (0,2) 0,0 - 0,6
Repsol Comercial de Productos Petrolíferos, S.A. Spain Repsol Petróleo, S.A. Repsol YPF, S.A./PETRONOR Marketing of petrol-derived products F.C. 96,67 99,78 334,8 598,3 276,5 (192,4) 983,3
Repsol Directo, S.A. Spain Repsol Comercial de Productos Petrolíferos, S.A. Campsa Estaciones de Servicio, S.A. - CAMPSARED Distribution and marketing of petroleum-derived products F.C. 96,66 100,00 0,1 5,9 (1,9) - 3,9
Campsa Estaciones de Servicio, S.A. - CAMPSARED Spain Repsol Comercial de Productos Petrolíferos, S.A. Repsol Petróleo, S.A. Exploitation and management of services stations F.C. 96,67 100,00 8,4 18,0 19,0 - 43,9
Societat Catalana de Petrolis, S.A. (PETROCAT) Spain Repsol Comercial de Productos Petrolíferos, S.A. Repsol Petróleo, S.A. Distribution and marketing of petroleum-derived products E.M. 43,68 45,00 15,1 (5,3) 0,6 - 4,6
Air Miles España, S.A. Spain Repsol Comercial de Productos Petrolíferos, S.A. Client loyalty services E.M. 21,75 22,50 0,1 5,1 1,0 - 1,3
Carburants i Derivats, S.A. (CADESA) Andorra Repsol Comercial de Productos Petrolíferos, S.A. Distribution of products derived from petroleum E.M. 32,14 33,25 0,1 1,8 0,1 - 0,6
Euro 24, S.L. Spain Autoclub Repsol, S.L. Services related to automization F.C. 96,67 100,00 0,0 0,3 0,1 - 0,4
Noroil, S.A. Spain Repsol Comercial de Productos Petrolíferos, S.A. PETRONOR Distribution and marketing of petroleum-derived products F.C. 67,67 70,00 1,5 0,5 0,5 - 1,7
Solred, S.A. Spain Repsol Comercial de Productos Petrolíferos, S.A. Repsol YPF, S.A. Management of payment options in service stations F.C. 96,67 100,00 7,3 22,0 10,0 - 38,0
Gestión de Puntos de Venta, Gespevesa, S.A. Spain Repsol Comercial de Productos Petrolíferos, S.A. Management of service stations P.C. 48,34 50,00 39,4 8,0 1,0 - 23,4
Terminales Canarios, S.L. Spain Repsol Comercial de Productos Petrolíferos, S.A. Storage and distribution of petroleum-derived products P.C. 48,34 50,00 19,8 1,6 1,9 - 11,3
Servibarna Spain RCPP Fixed asset leasing F.C. 96,65 100,00 0,1 0,4 (0,1) - 0,5
Compañía Logística de Hidrocarburos CLH, S.A. Spain Repsol YPF, S.A. PETRONOR Transportation and storage of petroleum-derived products E.M. 10,0 10,0 84,1 97,1 166,3 (161,8) 18,6
CLH Aviación, S.A.(3) Spain CLH, S.A. Transportation and storage of petroleum-derived products E.M. 10,0 100,0 21,0 47,8 5,6 - 7,4
Carbon Black Española, S.A. (CARBESA) Spain Repsol YPF, S.A. Repsol Química, S.A. Without activity F.C. 100,00 100,00 0,2 13,1 8,7 - 22,0
The Repsol Company of Portugal Ltd. Portugal Repsol YPF, S.A. Carbon Black Española, S.A. (CARBESA) Marketing of petroleum-derived products F.C. 100,00 100,00 0,8 0,5 0,2 - 1,5
Repsol Portuguesa, S.A. Portugal Repsol YPF, S.A. Carbon Black Española, S.A. (CARBESA) Distribution and marketing of petroleum-derived products F.C. 100,00 100,00 59,0 319,4 42,5 - 420,9
Repsol Directo LDA Portugal Repsol Portuguesa, S.A. Distribution and marketing of petroleum-derived products F.C. 100,00 100,00 0,3 (0,0) 0,2 - 0,4
Gespost Portugal Repsol Portuguesa, S.A. Marketing of petroleum-derived products F.C. 100,00 100,00 0,0 3,7 2,1 - 5,8
Caiageste - Gestao de Areas de Servicios Ltda. Portugal Gespost Exploitation and management of services stations E.M. 50,00 50,00 0,0 0,3 (0,3) - (0,0)
Abastecimientos e Serviços de Avia - ASA Portugal Repsol Portuguesa, S.A. Marketing of petroleum-derived products E.M. 50,00 50,00 - - - - -
Sociedade Abastecedora de Aeronaves, Lda. - SABA Portugal Repsol Portuguesa, S.A. Marketing of petroleum-derived products E.M. 25,00 25,00 - - - - -
Tecnicontrol y Gestión Integral, S.L. Spain Repsol YPF, S.A. Repsol Exploración, S.A. Real estate development F.C. 100,00 100,00 3,5 28,2 0,1 - 31,8
Bahía Bizkaia Electricidad, S.L. Spain Repsol YPF, S.A. Energy generation P.C. 25,00 25,00 3,6 157,8 42,7 - 51,0
Repsol YPF Tesorería y Gestión Financiera, S.A Spain Repsol YPF, S.A. Repsol Petroleo, S.A Provide treasury-related services to the group's companies F.C. 100,00 100,00 0,1 385,8 (83,4) - 302,4
Petróleos del Norte, S.A. (PETRONOR) Spain Repsol YPF, S.A. Refinery F.C. 85,98 85,98 120,5 477,2 291,2 (180,2) 609,3
Asfalnor, S.A. Spain PETRONOR Distribution and marketing of asphalt-derived products F.C. 85,98 100,00 0,1 - - - 0,1
Repsol Exploración, S.A. Spain Repsol YPF, S.A. Repsol Petróleo, S.A. Exploration and Production of hydrocarbons F.C. 100,00 100,00 24,6 1.817,7 (151,3) - 1.691,0
Repsol LNG Holding, antes se denominaba Repsol Exploración Trinidad, S.A. Spain Repsol Exploración, S.A. Repsol YPF, S.A. Exploration and Production of hydrocarbons F.C. 100,00 100,00 1,8 (0,5) (10,2) - (8,9)
Gas Natural West Africa S.L. Spain Repsol LNG Holding, S.A. Gas Natural Exploración, S.L. P.C. 72,05 100,00 7,7 (4,1) (8,7) - (3,7)
Repsol YPF Cuba, S.A. Spain Repsol Exploración, S.A. Repsol YPF, S.A. Exploration and Production of hydrocarbons F.C. 100,00 100,00 1,9 5,0 (1,5) - 5,4
Repsol Exploración Colombia, S.A. Spain Repsol Exploración, S.A. Repsol YPF, S.A. Exploration and Production of hydrocarbons F.C. 100,00 100,00 2,0 (0,8) (16,5) - (15,3)
Repsol Exploración Argelia, S.A. Spain Repsol Exploración, S.A. Repsol YPF, S.A. Exploration and Production of hydrocarbons F.C. 100,00 100,00 3,9 (8,8) 0,6 - (4,3)
Repsol Exploración Murzuq, S.A. Spain Repsol Exploración, S.A. Repsol YPF, S.A. Exploration and Production of hydrocarbons F.C. 100,00 100,00 7,7 613,4 135,5 - 756,7
Akakus Oil Operation BV Holland Repsol Exploración Murzuq,SA Exploration and Production of hydrocarbons E.M. 49,00 49,00 - 0,1 - - 0,0
Repsol YPF Ecuador, S.A. Spain Repsol Exploración, S.A. Repsol Petróleo, S.A. Exploration and Production of hydrocarbons F.C. 100,00 100,00 4,7 76,2 31,5 - 112,4
Amodaimi Oil Company, Ltd. Ecuador Repsol YPF Ecuador, S.A. Exploration and Production of hydrocarbons F.C. 100,00 100,00 - 20,5 1,9 - 22,4
Repsol YPF OCP de Ecuador, S.A. Spain Repsol YPF Ecuador, S.A. Repsol Exploración Tobago, S.A. Holding company F.C. 100,00 100,00 0,1 28,0 13,2 - 41,3
Oleoducto de Crudos Pesados, Ltd. Cayman Islands Repsol YPF OCP de Ecuador, S.A. Other activities E.M. 29,66 29,66 75,2 9,9 21,0 (5,5) 29,8
Oleoducto de Crudos Pesados Ecuador, S.A.(3) Cayman Islands Oleoducto de Crudos Pesados, Ltd. Other activities E.M. 29,66 100,00 - - - - -
Repsol Exploración Securé, S.A. Spain Repsol Exploración, S.A. Repsol YPF, S.A. Exploration and Production of hydrocarbons F.C. 100,00 100,00 1,9 0,2 (0,5) - 1,6
Repsol Exploración Perú, S.A. Spain Repsol Exploración, S.A. Repsol YPF, S.A. Exploration and Production of hydrocarbons F.C. 100,00 100,00 15,6 177,7 35,5 - 228,8
Perú LNG Company, Llc. Peru Repsol Exploración Perú, S.A. Gas logistics and supply E.M. 20,00 20,00 1.215,8 (164,6) (86,3) - 193,0
TGP, S.A. Peru Repsol Exploración Perú, S.A. Gas logistics and supply E.M. 10,00 10,00 155,9 285,3 59,6 - 50,1
Repsol YPF Oriente Medio, S.A. Spain Repsol Exploración, S.A. Repsol YPF, S.A. Exploration and Production of hydrocarbons F.C. 100,00 100,00 0,2 - (43,8) - (43,6)
Repsol Exploración México S.A. de C.V. Mexico Repsol Exploración, S.A. Exploration and Production of hydrocarbons F.C. 100,00 100,00 16,7 13,0 11,6 - 41,2
Servicios Administrativos Cuenca de Burgos S.A. de C.V. Mexico Repsol Exploración, S.A. Exploration and Production of hydrocarbons F.C. 100,00 100,00 - 0,2 0,1 - 0,3
Repsol Exploración Kazakhstán, S.A. Spain Repsol Exploración, S.A. Repsol YPF, S.A. Exploration and Production of hydrocarbons F.C. 100,00 100,00 0,2 (0,0) (0,8) - (0,7)
Zhambai LLP Kazakhstan Repsol Exploración Kazakhstan, S.A. Exploration and Production of hydrocarbons E.M. 25,00 25,00 - (3,0) (4,2) - (1,8)
Repsol Exploración Tobago, S.A. Spain Repsol Exploración, S.A. Repsol YPF, S.A. Exploration and Production of hydrocarbons F.C. 100,00 100,00 0,2 (0,1) (0,3) - (0,1)
Repsol Exploración Sierra Leona, S.L. Spain Repsol Exploración, S.A. Repsol Exploración Tobago, S.A. Exploration and Production of hydrocarbons F.C. 100,00 100,00 2,8 (1,4) (1,3) - 0,1
Repsol Exploración Suriname, S.L. Spain Repsol Exploración, S.A. Repsol Exploración Tobago, S.A. Exploration and Production of hydrocarbons F.C. 100,00 100,00 - - (2,7) - (2,7)
Repsol Exploración Venezuela, B.V. Holland Repsol Exploración, S.A. Holding company F.C. 100,00 100,00 257,0 (93,7) (4,2) - 159,2
% Total Ownership Amount in Millions of Euros
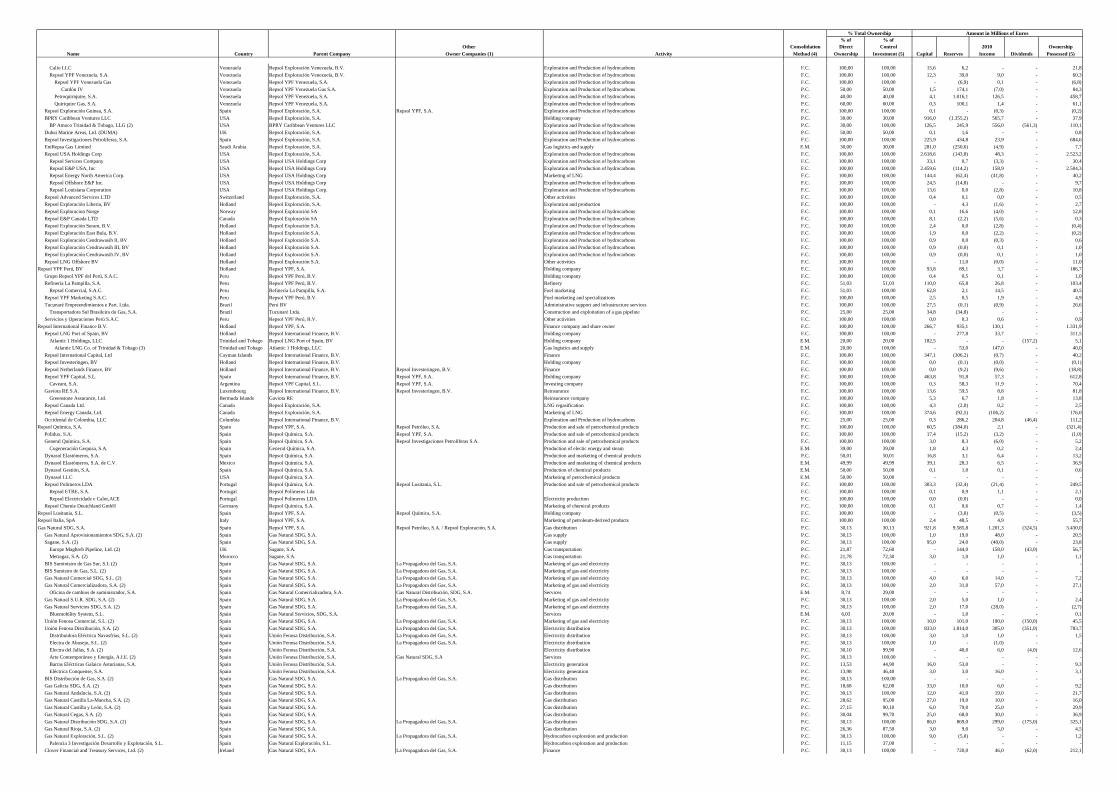
% of % ofOther Consolidation Direct Control 2010 Ownership
Name Country Parent Company Owner Companies (1) Activity Method (4) Ownership Investment (5) Capital Reserves Income Dividends Possessed (5)
% Total Ownership Amount in Millions of Euros
Calio LLC Venezuela Repsol Exploración Venezuela, B.V. Exploration and Production of hydrocarbons F.C. 100,00 100,00 15,6 6,2 - - 21,8
Repsol YPF Venezuela, S.A. Venezuela Repsol Exploración Venezuela, B.V. Exploration and Production of hydrocarbons F.C. 100,00 100,00 12,3 39,0 9,0 - 60,3
Repsol YPF Venezuela Gas Venezuela Repsol YPF Venezuela, S.A. Exploration and Production of hydrocarbons F.C. 100,00 100,00 - (6,9) 0,1 - (6,8)
Cardón IV Venezuela Repsol YPF Venezuela Gas S.A. Exploration and Production of hydrocarbons P.C. 50,00 50,00 1,5 174,1 (7,0) - 84,3
Petroquiriquire, S.A. Venezuela Repsol YPF Venezuela, S.A. Exploration and Production of hydrocarbons P.C. 40,00 40,00 4,1 1.016,1 126,5 - 458,7
Quiriquire Gas, S.A. Venezuela Repsol YPF Venezuela, S.A. Exploration and Production of hydrocarbons P.C. 60,00 60,00 0,3 100,1 1,4 - 61,1
Repsol Exploración Guinea, S.A. Spain Repsol Exploración, S.A. Repsol YPF, S.A. Exploration and Production of hydrocarbons F.C. 100,00 100,00 0,1 - (0,3) - (0,2)
BPRY Caribbean Ventures LLC USA Repsol Exploración, S.A. Holding company P.C. 30,00 30,00 916,0 (1.355,2) 565,7 - 37,9
BP Amoco Trinidad & Tobago, LLG (2) USA BPRY Caribbean Ventures LLC Exploration and Production of hydrocarbons P.C. 30,00 100,00 126,5 245,9 556,0 (561,3) 110,1
Dubai Marine Areas, Ltd. (DUMA) UK Repsol Exploración, S.A. Exploration and Production of hydrocarbons P.C. 50,00 50,00 0,1 1,6 - - 0,8
Repsol Investigaciones Petrolíferas, S.A. Spain Repsol Exploración, S.A. Exploration and Production of hydrocarbons F.C. 100,00 100,00 225,9 434,8 23,9 - 684,6
EniRepsa Gas Limited Saudi Arabia Repsol Exploración, S.A. Gas logistics and supply E.M. 30,00 30,00 281,0 (250,6) (4,9) - 7,7
Repsol USA Holdings Corp USA Repsol Exploración, S.A. Exploration and Production of hydrocarbons F.C. 100,00 100,00 2.618,6 (143,8) 48,3 - 2.523,2
Repsol Services Company USA Repsol USA Holdings Corp Exploration and Production of hydrocarbons F.C. 100,00 100,00 33,1 0,7 (3,3) - 30,4
Repsol E&P USA, Inc USA Repsol USA Holdings Corp Exploration and Production of hydrocarbons F.C. 100,00 100,00 2.459,6 (114,2) 158,9 - 2.504,3
Repsol Energy North America Corp. USA Repsol USA Holdings Corp Marketing of LNG F.C. 100,00 100,00 144,4 (62,4) (41,8) - 40,2
Repsol Offshore E&P Inc. USA Repsol USA Holdings Corp Exploration and Production of hydrocarbons F.C. 100,00 100,00 24,5 (14,8) - - 9,7
Repsol Louisiana Corporation USA Repsol USA Holdings Corp. Exploration and Production of hydrocarbons F.C. 100,00 100,00 13,6 0,0 (2,8) - 10,8
Repsol Advanced Services LTD Switzerland Repsol Exploración, S.A. Other activities F.C. 100,00 100,00 0,4 0,1 0,0 - 0,5
Repsol Exploración Liberia, BV Holland Repsol Exploración, S.A. Exploration and production F.C. 100,00 100,00 - 4,3 (1,6) - 2,7
Repsol Exploracion Norge Norway Repsol Exploración SA Exploration and Production of hydrocarbons F.C. 100,00 100,00 0,1 16,6 (4,0) - 12,8
Repsol E&P Canada LTD Canada Repsol Exploración SA Exploration and Production of hydrocarbons F.C. 100,00 100,00 8,1 (2,2) (5,6) - 0,3
Repsol Exploración Seram, B.V. Holland Repsol Exploración S.A. Exploration and Production of hydrocarbons F.C. 100,00 100,00 2,4 0,0 (2,8) - (0,4)
Repsol Exploración East Bula, B.V. Holland Repsol Exploración S.A. Exploration and Production of hydrocarbons F.C. 100,00 100,00 1,9 0,0 (2,2) - (0,2)
Repsol Exploración Cendrawasih II, BV Holland Repsol Exploración S.A. Exploration and Production of hydrocarbons F.C. 100,00 100,00 0,9 0,0 (0,3) - 0,6
Repsol Exploración Cendrawasih III, BV Holland Repsol Exploración S.A. Exploration and Production of hydrocarbons F.C. 100,00 100,00 0,9 (0,0) 0,1 - 1,0
Repsol Exploración Cendrawasih IV, BV Holland Repsol Exploración S.A. Exploration and Production of hydrocarbons F.C. 100,00 100,00 0,9 (0,0) 0,1 - 1,0
Repsol LNG Offshore BV Holland Repsol Exploración S.A. Other activities F.C. 100,00 100,00 - 11,0 (0,0) - 11,0
Repsol YPF Perú, BV Holland Repsol YPF, S.A. Holding company F.C. 100,00 100,00 93,8 89,1 3,7 - 186,7
Grupo Repsol YPF del Perú, S.A.C. Peru Repsol YPF Perú, B.V. Holding company F.C. 100,00 100,00 0,4 0,5 0,1 - 1,0
Refinería La Pampilla, S.A. Peru Repsol YPF Perú, B.V. Refinery F.C. 51,03 51,03 110,0 65,8 26,8 - 103,4
Repsol Comercial, S.A.C. Peru Refinería La Pampilla, S.A. Fuel marketing F.C. 51,03 100,00 62,8 2,1 14,5 - 40,5
Repsol YPF Marketing S.A.C. Peru Repsol YPF Perú, B.V. Fuel marketing and specializations F.C. 100,00 100,00 2,5 0,5 1,9 - 4,9
Tucunaré Empreendimientos e Part. Ltda. Brazil Perú BV Administrative support and infrastructure services F.C. 100,00 100,00 27,5 (0,1) (0,9) - 26,6
Transportadora Sul Brasileira do Gas, S.A. Brazil Tucunaré Ltda. Construction and exploitation of a gas pipeline P.C. 25,00 25,00 34,8 (34,8) - - -
Servicios y Operaciones Perú S.A.C Peru Repsol YPF Perú, B.V. Other activities F.C. 100,00 100,00 0,0 0,3 0,6 - 0,9
Repsol International Finance B.V. Holland Repsol YPF, S.A. Finance company and share owner F.C. 100,00 100,00 266,7 935,1 130,1 - 1.331,9
Repsol LNG Port of Spain, BV Holland Repsol International Finance, B.V. Holding company F.C. 100,00 100,00 - 277,8 33,7 - 311,5
Atlantic 1 Holdings, LLC Trinidad and Tobago Repsol LNG Port of Spain, BV Holding company E.M. 20,00 20,00 182,5 - - (157,2) 5,1
Atlantic LNG Co. of Trinidad & Tobago (3) Trinidad and Tobago Atlantic 1 Holdings, LLC Gas logistics and supply E.M. 20,00 100,00 - 53,0 147,0 - 40,0
Repsol International Capital, Ltd Cayman Islands Repsol International Finance, B.V. Finance F.C. 100,00 100,00 347,1 (306,2) (0,7) - 40,2
Repsol Investeringen, BV Holland Repsol International Finance, B.V. Holding company F.C. 100,00 100,00 0,0 (0,1) (0,0) - (0,1)
Repsol Netherlands Finance, BV Holland Repsol International Finance, B.V. Repsol Investeringen, B.V. Finance F.C. 100,00 100,00 0,0 (9,2) (9,6) - (18,8)
Repsol YPF Capital, S.L. Spain Repsol International Finance, B.V. Repsol YPF, S.A. Holding company F.C. 100,00 100,00 463,8 91,8 57,3 - 612,8
Caveant, S.A. Argentina Repsol YPF Capital, S.L. Repsol YPF, S.A. Investing company F.C. 100,00 100,00 0,3 58,3 11,9 - 70,4
Gaviota RE S.A. Luxembourg Repsol International Finance, B.V. Repsol Investeringen, B.V. Reinsurance F.C. 100,00 100,00 13,6 59,5 8,8 - 81,8
Greenstone Assurance, Ltd. Bermuda Islands Gaviota RE Reinsurance company F.C. 100,00 100,00 5,3 6,7 1,8 - 13,8
Repsol Canada Ltd. Canada Repsol Exploración, S.A. LNG regasification F.C. 100,00 100,00 4,3 (2,0) 0,2 - 2,5
Repsol Energy Canada, Ltd. Canada Repsol Exploración, S.A. Marketing of LNG F.C. 100,00 100,00 374,6 (92,5) (106,2) - 176,0
Occidental de Colombia, LLC Columbia Repsol International Finance, B.V. Exploration and Production of hydrocarbons P.C. 25,00 25,00 0,3 286,2 204,8 (46,4) 111,2
Repsol Química, S.A. Spain Repsol YPF, S.A. Repsol Petróleo, S.A. Production and sale of petrochemical products F.C. 100,00 100,00 60,5 (384,0) 2,1 - (321,4)
Polidux, S.A. Spain Repsol Química, S.A. Repsol YPF, S.A. Production and sale of petrochemical products F.C. 100,00 100,00 17,4 (15,2) (3,2) - (1,0)
General Química, S.A. Spain Repsol Química, S.A. Repsol Investigaciones Petrolíferas S.A. Production and sale of petrochemical products F.C. 100,00 100,00 3,0 8,3 (6,0) - 5,2
Cogeneración Gequisa, S.A. Spain General Química, S.A. Production of electic energy and steam E.M. 39,00 39,00 1,8 4,3 0,2 - 2,4
Dynasol Elastómeros, S.A. Spain Repsol Química, S.A. Production and marketing of chemical products P.C. 50,01 50,01 16,8 3,1 6,4 - 13,2
Dynasol Elastómeros, S.A. de C.V. Mexico Repsol Química, S.A. Production and marketing of chemical products E.M. 49,99 49,99 39,1 28,3 6,5 - 36,9
Dynasol Gestión, S.A. Spain Repsol Química, S.A. Production of chemical products E.M. 50,00 50,00 0,1 1,0 0,1 - 0,6
Dynasol LLC USA Repsol Química, S.A. Marketing of petrochemical products E.M. 50,00 50,00 - - - - -
Repsol Polimeros LDA Portugal Repsol Química, S.A. Repsol Lusitania, S.L. Production and sale of petrochemical products F.C. 100,00 100,00 303,3 (32,4) (21,4) - 249,5
Repsol ETBE, S.A. Portugal Repsol Polímeros Lda F.C. 100,00 100,00 0,1 0,9 1,1 - 2,1
Repsol Electricidade e Calor,ACE Portugal Repsol Polimeros LDA Electricity production F.C. 100,00 100,00 0,0 (0,0) - - 0,0
Repsol Chemie Deutchland GmbH Germany Repsol Química, S.A. Marketing of chemical products F.C. 100,00 100,00 0,1 0,6 0,7 - 1,4
Repsol Lusitania, S.L. Spain Repsol YPF, S.A. Repsol Química, S.A. Holding company F.C. 100,00 100,00 - (3,0) (0,5) - (3,5)
Repsol Italia, SpA Italy Repsol YPF, S.A. Marketing of petroleum-derived products F.C. 100,00 100,00 2,4 48,5 4,9 - 55,7
Gas Natural SDG, S.A. Spain Repsol YPF, S.A. Repsol Petróleo, S.A. / Repsol Exploración, S.A. Gas distribution P.C. 30,13 30,13 921,8 9.585,8 1.201,3 (324,5) 3.430,0
Gas Natural Aprovisionamientos SDG, S.A. (2) Spain Gas Natural SDG, S.A. Gas supply P.C. 30,13 100,00 1,0 19,0 48,0 - 20,5
Sagane, S.A. (2) Spain Gas Natural SDG, S.A. Gas supply P.C. 30,13 100,00 95,0 24,0 (40,0) - 23,8
Europe Maghreb Pipeline, Ltd. (2) UK Sagane, S.A. Gas transportation P.C. 21,87 72,60 - 144,0 158,0 (43,0) 56,7
Metragaz, S.A. (2) Morocco Sagane, S.A. Gas transportation P.C. 21,78 72,30 3,0 1,0 1,0 - 1,1
BIS Suministro de Gas Sur, S.L (2) Spain Gas Natural SDG, S.A. La Propagadora del Gas, S.A. Marketing of gas and electricity P.C. 30,13 100,00 - - - - -
BIS Sumistro de Gas, S.L. (2) Spain Gas Natural SDG, S.A. La Propagadora del Gas, S.A. Marketing of gas and electricity P.C. 30,13 100,00 - - - - -
Gas Natural Comercial SDG, S.L. (2) Spain Gas Natural SDG, S.A. La Propagadora del Gas, S.A. Marketing of gas and electricity P.C. 30,13 100,00 4,0 6,0 14,0 - 7,2
Gas Natural Comercializadora, S.A. (2) Spain Gas Natural SDG, S.A. La Propagadora del Gas, S.A. Marketing of gas and electricity P.C. 30,13 100,00 2,0 31,0 57,0 - 27,1
Oficina de cambios de suministrador, S.A. Spain Gas Natural Comercializadora, S.A. Gas Natural Distribución, SDG, S.A. Services E.M. 8,74 29,00 - - - - -
Gas Natural S.U.R. SDG, S.A. (2) Spain Gas Natural SDG, S.A. La Propagadora del Gas, S.A. Marketing of gas and electricity P.C. 30,13 100,00 2,0 5,0 1,0 - 2,4
Gas Natural Servicios SDG, S.A. (2) Spain Gas Natural SDG, S.A. La Propagadora del Gas, S.A. Marketing of gas and electricity P.C. 30,13 100,00 2,0 17,0 (28,0) - (2,7)
Bluemobility System, S.L. Spain Gas Natural Servicios, SDG, S.A. Services E.M. 6,03 20,00 - 1,0 - - 0,1
Unión Fenosa Comercial, S.L. (2) Spain Gas Natural SDG, S.A. La Propagadora del Gas, S.A. Marketing of gas and electricity P.C. 30,13 100,00 10,0 101,0 190,0 (150,0) 45,5
Unión Fenosa Distribución, S.A. (2) Spain Gas Natural SDG, S.A. La Propagadora del Gas, S.A. Electricity distribution P.C. 30,13 100,00 833,0 1.814,0 305,0 (351,0) 783,7
Distribuidora Eléctrica Navasfrías, S.L. (2) Spain Unión Fenosa Distribución, S.A. La Propagadora del Gas, S.A. Electricity distribution P.C. 30,13 100,00 3,0 1,0 1,0 - 1,5
Electra de Abusejo, S.L. (2) Spain Unión Fenosa Distribución, S.A. La Propagadora del Gas, S.A. Electricity distribution P.C. 30,13 100,00 1,0 - (1,0) - -
Electra del Jallas, S.A. (2) Spain Unión Fenosa Distribución, S.A. Electricity distribution P.C. 30,10 99,90 - 40,0 6,0 (4,0) 12,6
Arte Contemporáneo y Energía, A.I.E. (2) Spain Unión Fenosa Distribución, S.A. Gas Natural SDG, S.A Services P.C. 30,13 100,00 - - - - -
Barras Eléctricas Galaico Asturianas, S.A. Spain Unión Fenosa Distribución, S.A. Electricity generation P.C. 13,53 44,90 16,0 53,0 - - 9,3
Eléctrica Conquense, S.A. Spain Unión Fenosa Distribución, S.A. Electricity generation P.C. 13,98 46,40 3,0 3,0 16,0 - 3,1
BIS Distribución de Gas, S.A. (2) Spain Gas Natural SDG, S.A. La Propagadora del Gas, S.A. Gas distribution P.C. 30,13 100,00 - - - - -
Gas Galicia SDG, S.A. (2) Spain Gas Natural SDG, S.A. Gas distribution P.C. 18,68 62,00 33,0 10,0 6,0 - 9,2
Gas Natural Andalucía, S.A. (2) Spain Gas Natural SDG, S.A. Gas distribution P.C. 30,13 100,00 12,0 41,0 19,0 - 21,7
Gas Natural Castilla La-Mancha, S.A. (2) Spain Gas Natural SDG, S.A. Gas distribution P.C. 28,62 95,00 27,0 19,0 10,0 - 16,0
Gas Natural Castilla y León, S.A. (2) Spain Gas Natural SDG, S.A. Gas distribution P.C. 27,15 90,10 6,0 79,0 25,0 - 29,9
Gas Natural Cegas, S.A. (2) Spain Gas Natural SDG, S.A. Gas distribution P.C. 30,04 99,70 25,0 68,0 30,0 - 36,9
Gas Natural Distribución SDG, S.A. (2) Spain Gas Natural SDG, S.A. La Propagadora del Gas, S.A. Gas distribution P.C. 30,13 100,00 86,0 869,0 299,0 (175,0) 325,1
Gas Natural Rioja, S.A. (2) Spain Gas Natural SDG, S.A. Gas distribution P.C. 26,36 87,50 3,0 9,0 5,0 - 4,5
Gas Natural Exploración, S.L. (2) Spain Gas Natural SDG, S.A. La Propagadora del Gas, S.A. Hydrocarbon exploration and production P.C. 30,13 100,00 9,0 (5,0) - - 1,2
Palencia 3 Investigación Desarrollo y Explotación, S.L. Spain Gas Natural Exploración, S.L. Hydrocarbon exploration and production P.C. 11,15 37,00 - - - - -
Clover Financial and Treasury Services, Ltd. (2) Ireland Gas Natural SDG, S.A. La Propagadora del Gas, S.A. Finance P.C. 30,13 100,00 - 720,0 46,0 (62,0) 212,1
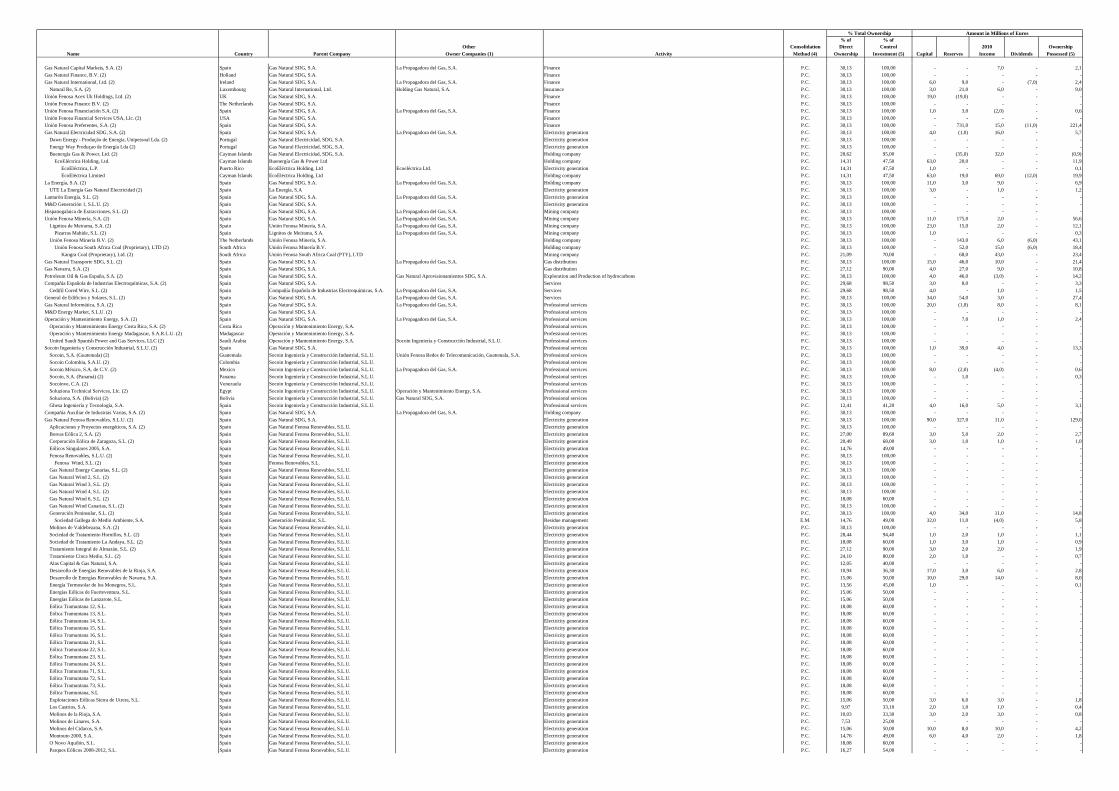
% of % ofOther Consolidation Direct Control 2010 Ownership
Name Country Parent Company Owner Companies (1) Activity Method (4) Ownership Investment (5) Capital Reserves Income Dividends Possessed (5)
% Total Ownership Amount in Millions of Euros
Gas Natural Capital Markets, S.A. (2) Spain Gas Natural SDG, S.A. La Propagadora del Gas, S.A. Finance P.C. 30,13 100,00 - - 7,0 - 2,1
Gas Natural Finance, B.V. (2) Holland Gas Natural SDG, S.A. Finance P.C. 30,13 100,00 - - - - -
Gas Natural International, Ltd. (2) Ireland Gas Natural SDG, S.A. La Propagadora del Gas, S.A. Finance P.C. 30,13 100,00 6,0 9,0 - (7,0) 2,4
Natural Re, S.A. (2) Luxembourg Gas Natural International, Ltd. Holding Gas Natural, S.A. Insurance P.C. 30,13 100,00 3,0 21,0 6,0 - 9,0
Unión Fenosa Acex Uk Holdings, Ltd. (2) UK Gas Natural SDG, S.A. Finance P.C. 30,13 100,00 19,0 (19,0) - - -
Unión Fenosa Finance B.V. (2) The Netherlands Gas Natural SDG, S.A. Finance P.C. 30,13 100,00 - - - - -
Unión Fenosa Financiación S.A. (2) Spain Gas Natural SDG, S.A. La Propagadora del Gas, S.A. Finance P.C. 30,13 100,00 1,0 3,0 (2,0) - 0,6
Unión Fenosa Financial Services USA, Llc. (2) USA Gas Natural SDG, S.A. Finance P.C. 30,13 100,00 - - - - -
Unión Fenosa Preferentes, S.A. (2) Spain Gas Natural SDG, S.A. Finance P.C. 30,13 100,00 - 731,0 15,0 (11,0) 221,4
Gas Natural Electricidad SDG, S.A. (2) Spain Gas Natural SDG, S.A. La Propagadora del Gas, S.A. Electricity generation P.C. 30,13 100,00 4,0 (1,0) 16,0 - 5,7
Dawn Energy - Produção de Energia, Unipessoal Lda. (2) Portugal Gas Natural Electricidad, SDG, S.A. Electricity generation P.C. 30,13 100,00 - - - - -
Energy Way Produçao de Energía Lda (2) Portugal Gas Natural Electricidad, SDG, S.A. Electricity generation P.C. 30,13 100,00 - - - - -
Buenergía Gas & Power, Ltd. (2) Cayman Islands Gas Natural Electricidad, SDG, S.A. Holding company P.C. 28,62 95,00 - (35,0) 32,0 - (0,9)
EcoEléctrica Holding, Ltd. Cayman Islands Buenergía Gas & Power Ltd Holding company P.C. 14,31 47,50 63,0 20,0 - - 11,9
EcoEléctrica, L.P. Puerto Rico EcoEléctrica Holding, Ltd Ecoeléctrica Ltd. Electricity generation P.C. 14,31 47,50 1,0 - - - 0,1
EcoEléctrica Limited Cayman Islands EcoEléctrica Holding, Ltd Holding company P.C. 14,31 47,50 63,0 19,0 69,0 (12,0) 19,9
La Energía, S.A. (2) Spain Gas Natural SDG, S.A. La Propagadora del Gas, S.A. Holding company P.C. 30,13 100,00 11,0 3,0 9,0 - 6,9
UTE La Energía Gas Natural Electricidad (2) Spain La Energía, S.A Electricity generation P.C. 30,13 100,00 3,0 - 1,0 - 1,2
Lantarón Energía, S.L. (2) Spain Gas Natural SDG, S.A. La Propagadora del Gas, S.A. Electricity generation P.C. 30,13 100,00 - - - - -
M&D Generación 1, S.L.U. (2) Spain Gas Natural SDG, S.A. Electricity generation P.C. 30,13 100,00 - - - - -
Hispanogalaica de Extracciones, S.L. (2) Spain Gas Natural SDG, S.A. La Propagadora del Gas, S.A. Mining company P.C. 30,13 100,00 - - - - -
Unión Fenosa Minería, S.A. (2) Spain Gas Natural SDG, S.A. La Propagadora del Gas, S.A. Mining company P.C. 30,13 100,00 11,0 175,0 2,0 - 56,6
Lignitos de Meirama, S.A. (2) Spain Unión Fenosa Minería, S.A. La Propagadora del Gas, S.A. Mining company P.C. 30,13 100,00 23,0 15,0 2,0 - 12,1
Pizarras Mahide, S.L. (2) Spain Lignitos de Meirama, S.A. La Propagadora del Gas, S.A. Mining company P.C. 30,13 100,00 1,0 - - - 0,3
Unión Fenosa Minería B.V. (2) The Netherlands Unión Fenosa Minería, S.A. Holding company P.C. 30,13 100,00 - 143,0 6,0 (6,0) 43,1
Unión Fenosa South Africa Coal (Proprietary), LTD (2) South Africa Unión Fenosa Minería B.V. Holding company P.C. 30,13 100,00 - 52,0 15,0 (6,0) 18,4
Kangra Coal (Proprietary), Ltd. (2) South Africa Unión Fenosa South Africa Coal (PTY), LTD Mining company P.C. 21,09 70,00 - 68,0 43,0 - 23,4
Gas Natural Transporte SDG, S.L. (2) Spain Gas Natural SDG, S.A. La Propagadora del Gas, S.A. Gas distribution P.C. 30,13 100,00 15,0 46,0 10,0 - 21,4
Gas Navarra, S.A. (2) Spain Gas Natural SDG, S.A. Gas distribution P.C. 27,12 90,00 4,0 27,0 9,0 - 10,8
Petroleum Oil & Gas España, S.A. (2) Spain Gas Natural SDG, S.A. Gas Natural Aprovisionamientos SDG, S.A. Exploration and Production of hydrocarbons P.C. 30,13 100,00 4,0 46,0 (3,0) - 14,2
Compañía Española de Industrias Electroquímicas, S.A. (2) Spain Gas Natural SDG, S.A. Services P.C. 29,68 98,50 3,0 8,0 - - 3,3
Cedifil Cored Wire, S.L. (2) Spain Compañía Española de Industrias Electroquímicas, S.A. La Propagadora del Gas, S.A. Services P.C. 29,68 98,50 4,0 - 1,0 - 1,5
General de Edificios y Solares, S.L. (2) Spain Gas Natural SDG, S.A. La Propagadora del Gas, S.A. Services P.C. 30,13 100,00 34,0 54,0 3,0 - 27,4
Gas Natural Informática, S.A. (2) Spain Gas Natural SDG, S.A. La Propagadora del Gas, S.A. Professional services P.C. 30,13 100,00 20,0 (1,0) 8,0 - 8,1
M&D Energy Market, S.L.U. (2) Spain Gas Natural SDG, S.A. Professional services P.C. 30,13 100,00 - - - - -
Operación y Mantenimiento Energy, S.A. (2) Spain Gas Natural SDG, S.A. La Propagadora del Gas, S.A. Professional services P.C. 30,13 100,00 - 7,0 1,0 - 2,4
Operación y Mantenimiento Energy Costa Rica, S.A. (2) Costa Rica Operación y Mantenimiento Energy, S.A. Professional services P.C. 30,13 100,00 - - - - -
Operación y Mantenimiento Energy Madagascar, S.A.R.L.U. (2) Madagascar Operación y Mantenimiento Energy, S.A. Professional services P.C. 30,13 100,00 - - - - -
United Saudi Spanish Power and Gas Services, LLC (2) Saudi Arabia Operación y Mantenimiento Energy, S.A. Socoin Ingeniería y Construcción Industrial, S.L.U. Professional services P.C. 30,13 100,00 - - - - -
Socoin Ingeniería y Construcción Industrial, S.L.U. (2) Spain Gas Natural SDG, S.A. Professional services P.C. 30,13 100,00 1,0 39,0 4,0 - 13,3
Socoin, S.A. (Guatemala) (2) Guatemala Socoin Ingeniería y Construcción Industrial, S.L.U. Unión Fenosa Redes de Telecomunicación, Guatemala, S.A. Professional services P.C. 30,13 100,00 - - - - -
Socoin Colombia, S.A.U. (2) Colombia Socoin Ingeniería y Construcción Industrial, S.L.U. Professional services P.C. 30,13 100,00 - - - - -
Socoin México, S.A. de C.V. (2) Mexico Socoin Ingeniería y Construcción Industrial, S.L.U. La Propagadora del Gas, S.A. Professional services P.C. 30,13 100,00 8,0 (2,0) (4,0) - 0,6
Socoin, S.A. (Panamá) (2) Panama Socoin Ingeniería y Construcción Industrial, S.L.U. Professional services P.C. 30,13 100,00 - 1,0 - - 0,3
Socoinve, C.A. (2) Venezuela Socoin Ingeniería y Construcción Industrial, S.L.U. Professional services P.C. 30,13 100,00 - - - - -
Soluziona Technical Services, Llc. (2) Egypt Socoin Ingeniería y Construcción Industrial, S.L.U. Operación y Mantenimiento Energy, S.A. Professional services P.C. 30,13 100,00 - - - - -
Soluziona, S.A. (Bolivia) (2) Bolivia Socoin Ingeniería y Construcción Industrial, S.L.U. Gas Natural SDG, S.A. Professional services P.C. 30,13 100,00 - - - - -
Ghesa Ingeniería y Tecnología, S.A. Spain Socoin Ingeniería y Construcción Industrial, S.L.U. Professional services P.C. 12,41 41,20 4,0 16,0 5,0 - 3,1
Compañía Auxiliar de Industrias Varias, S.A. (2) Spain Gas Natural SDG, S.A. La Propagadora del Gas, S.A. Holding company P.C. 30,13 100,00 - - - - -
Gas Natural Fenosa Renovables, S.L.U. (2) Spain Gas Natural SDG, S.A. Electricity generation P.C. 30,13 100,00 90,0 327,0 11,0 - 129,0
Aplicaciones y Proyectos energéticos, S.A. (2) Spain Gas Natural Fenosa Renovables, S.L.U. Electricity generation P.C. 30,13 100,00 - - - - -
Boreas Eólica 2, S.A. (2) Spain Gas Natural Fenosa Renovables, S.L.U. Electricity generation P.C. 27,00 89,60 3,0 5,0 2,0 - 2,7
Corporación Eólica de Zaragoza, S.L. (2) Spain Gas Natural Fenosa Renovables, S.L.U. Electricity generation P.C. 20,49 68,00 3,0 1,0 1,0 - 1,0
Eólicos Singulares 2005, S.A. Spain Gas Natural Fenosa Renovables, S.L.U. Electricity generation P.C. 14,76 49,00 - - - - -
Fenosa Renovables, S.L.U. (2) Spain Gas Natural Fenosa Renovables, S.L.U. Electricity generation P.C. 30,13 100,00 - - - - -
Fenosa Wind, S.L. (2) Spain Fenosa Renovables, S.L. Electricity generation P.C. 30,13 100,00 - - - - -
Gas Natural Energy Canarias, S.L. (2) Spain Gas Natural Fenosa Renovables, S.L.U. Electricity generation P.C. 30,13 100,00 - - - - -
Gas Natural Wind 2, S.L. (2) Spain Gas Natural Fenosa Renovables, S.L.U. Electricity generation P.C. 30,13 100,00 - - - - -
Gas Natural Wind 3, S.L. (2) Spain Gas Natural Fenosa Renovables, S.L.U. Electricity generation P.C. 30,13 100,00 - - - - -
Gas Natural Wind 4, S.L. (2) Spain Gas Natural Fenosa Renovables, S.L.U. Electricity generation P.C. 30,13 100,00 - - - - -
Gas Natural Wind 6, S.L. (2) Spain Gas Natural Fenosa Renovables, S.L.U. Electricity generation P.C. 18,08 60,00 - - - - -
Gas Natural Wind Canarias, S.L. (2) Spain Gas Natural Fenosa Renovables, S.L.U. Electricity generation P.C. 30,13 100,00 - - - - -
Generación Peninsular, S.L. (2) Spain Gas Natural Fenosa Renovables, S.L.U. Electricity generation P.C. 30,13 100,00 4,0 34,0 11,0 - 14,8
Sociedad Gallega do Medio Ambiente, S.A. Spain Generación Peninsular, S.L. Residue management E.M. 14,76 49,00 32,0 11,0 (4,0) - 5,8
Molinos de Valdebezana, S.A. (2) Spain Gas Natural Fenosa Renovables, S.L.U. Electricity generation P.C. 30,13 100,00 - - - - -
Sociedad de Tratamiento Hornillos, S.L. (2) Spain Gas Natural Fenosa Renovables, S.L.U. Electricity generation P.C. 28,44 94,40 1,0 2,0 1,0 - 1,1
Sociedad de Tratamiento La Andaya, S.L. (2) Spain Gas Natural Fenosa Renovables, S.L.U. Electricity generation P.C. 18,08 60,00 1,0 3,0 1,0 - 0,9
Tratamiento Integral de Almazán, S.L. (2) Spain Gas Natural Fenosa Renovables, S.L.U. Electricity generation P.C. 27,12 90,00 3,0 2,0 2,0 - 1,9
Tratamiento Cinca Medio, S.L. (2) Spain Gas Natural Fenosa Renovables, S.L.U. Electricity generation P.C. 24,10 80,00 2,0 1,0 - - 0,7
Alas Capital & Gas Natural, S.A. Spain Gas Natural Fenosa Renovables, S.L.U. Electricity generation P.C. 12,05 40,00 - - - - -
Desarrollo de Energías Renovables de la Rioja, S.A. Spain Gas Natural Fenosa Renovables, S.L.U. Electricity generation P.C. 10,94 36,30 17,0 3,0 6,0 - 2,8
Desarrollo de Energías Renovables de Navarra, S.A. Spain Gas Natural Fenosa Renovables, S.L.U. Electricity generation P.C. 15,06 50,00 10,0 29,0 14,0 - 8,0
Energía Termosolar de los Monegros, S.L. Spain Gas Natural Fenosa Renovables, S.L.U. Electricity generation P.C. 13,56 45,00 1,0 - - - 0,1
Energías Eólicas de Fuerteventura, S.L. Spain Gas Natural Fenosa Renovables, S.L.U. Electricity generation P.C. 15,06 50,00 - - - - -
Energías Eólicas de Lanzarote, S.L. Spain Gas Natural Fenosa Renovables, S.L.U. Electricity generation P.C. 15,06 50,00 - - - - -
Eólica Tramuntana 12, S.L. Spain Gas Natural Fenosa Renovables, S.L.U. Electricity generation P.C. 18,08 60,00 - - - - -
Eólica Tramuntana 13, S.L. Spain Gas Natural Fenosa Renovables, S.L.U. Electricity generation P.C. 18,08 60,00 - - - - -
Eólica Tramuntana 14, S.L. Spain Gas Natural Fenosa Renovables, S.L.U. Electricity generation P.C. 18,08 60,00 - - - - -
Eólica Tramuntana 15, S.L. Spain Gas Natural Fenosa Renovables, S.L.U. Electricity generation P.C. 18,08 60,00 - - - - -
Eólica Tramuntana 16, S.L. Spain Gas Natural Fenosa Renovables, S.L.U. Electricity generation P.C. 18,08 60,00 - - - - -
Eólica Tramuntana 21, S.L. Spain Gas Natural Fenosa Renovables, S.L.U. Electricity generation P.C. 18,08 60,00 - - - - -
Eólica Tramuntana 22, S.L. Spain Gas Natural Fenosa Renovables, S.L.U. Electricity generation P.C. 18,08 60,00 - - - - -
Eólica Tramuntana 23, S.L. Spain Gas Natural Fenosa Renovables, S.L.U. Electricity generation P.C. 18,08 60,00 - - - - -
Eólica Tramuntana 24, S.L. Spain Gas Natural Fenosa Renovables, S.L.U. Electricity generation P.C. 18,08 60,00 - - - - -
Eólica Tramuntana 71, S.L. Spain Gas Natural Fenosa Renovables, S.L.U. Electricity generation P.C. 18,08 60,00 - - - - -
Eólica Tramuntana 72, S.L. Spain Gas Natural Fenosa Renovables, S.L.U. Electricity generation P.C. 18,08 60,00 - - - - -
Eólica Tramuntana 73, S.L. Spain Gas Natural Fenosa Renovables, S.L.U. Electricity generation P.C. 18,08 60,00 - - - - -
Eólica Tramuntana, S.L Spain Gas Natural Fenosa Renovables, S.L.U. Electricity generation P.C. 18,08 60,00 - - - - -
Explotaciones Eólicas Sierra de Utrera, S.L. Spain Gas Natural Fenosa Renovables, S.L.U. Electricity generation P.C. 15,06 50,00 3,0 6,0 3,0 - 1,8
Los Castrios, S.A. Spain Gas Natural Fenosa Renovables, S.L.U. Electricity generation P.C. 9,97 33,10 2,0 1,0 1,0 - 0,4
Molinos de la Rioja, S.A. Spain Gas Natural Fenosa Renovables, S.L.U. Electricity generation P.C. 10,03 33,30 3,0 2,0 3,0 - 0,8
Molinos de Linares, S.A. Spain Gas Natural Fenosa Renovables, S.L.U. Electricity generation P.C. 7,53 25,00 - - - - -
Molinos del Cidacos, S.A. Spain Gas Natural Fenosa Renovables, S.L.U. Electricity generation P.C. 15,06 50,00 10,0 8,0 10,0 - 4,2
Montouto 2000, S.A. Spain Gas Natural Fenosa Renovables, S.L.U. Electricity generation P.C. 14,76 49,00 6,0 4,0 2,0 - 1,8
O Novo Aquilón, S.L. Spain Gas Natural Fenosa Renovables, S.L.U. Electricity generation P.C. 18,08 60,00 - - - - -
Parques Eólicos 2008-2012, S.L. Spain Gas Natural Fenosa Renovables, S.L.U. Electricity generation P.C. 16,27 54,00 - - - - -
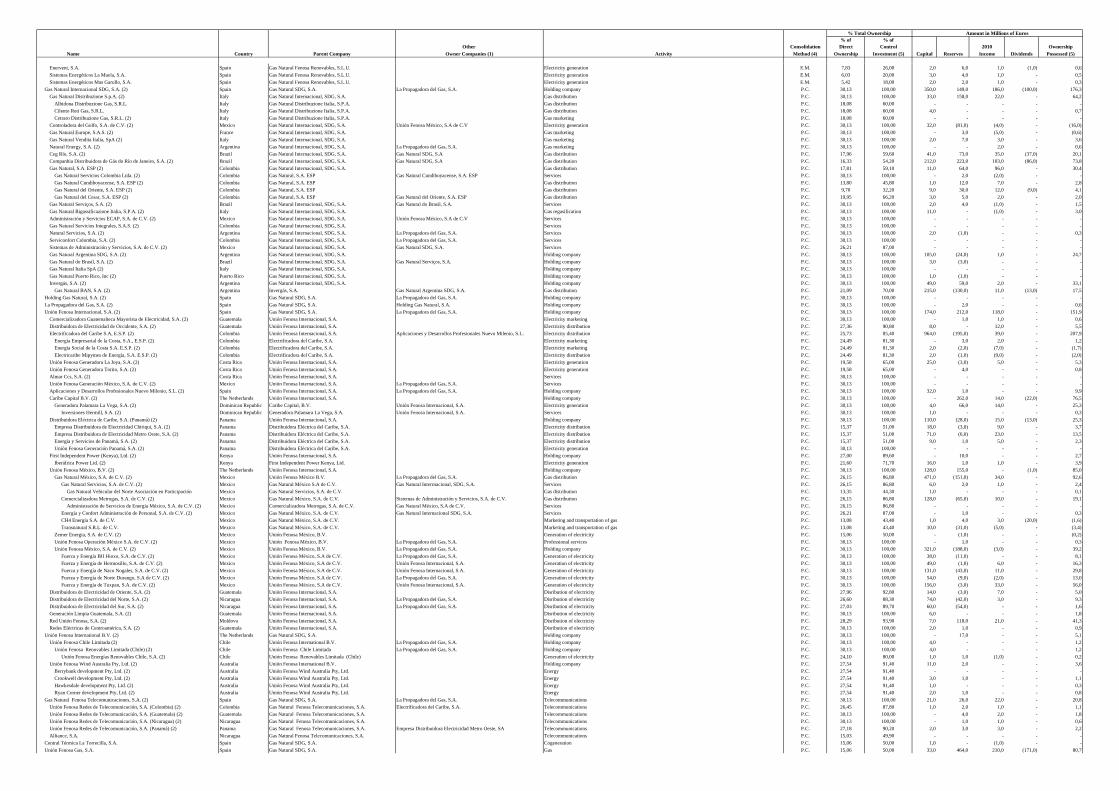
% of % ofOther Consolidation Direct Control 2010 Ownership
Name Country Parent Company Owner Companies (1) Activity Method (4) Ownership Investment (5) Capital Reserves Income Dividends Possessed (5)
% Total Ownership Amount in Millions of Euros
Enervent, S.A. Spain Gas Natural Fenosa Renovables, S.L.U. Electricity generation E.M. 7,83 26,00 2,0 6,0 1,0 (1,0) 0,6
Sistemas Energéticos La Muela, S.A. Spain Gas Natural Fenosa Renovables, S.L.U. Electricity generation E.M. 6,03 20,00 3,0 4,0 1,0 - 0,5
Sistemas Energéticos Mas Garullo, S.A. Spain Gas Natural Fenosa Renovables, S.L.U. Electricity generation E.M. 5,42 18,00 2,0 2,0 1,0 - 0,3
Gas Natural Internacional SDG, S.A. (2) Spain Gas Natural SDG, S.A. La Propagadora del Gas, S.A. Holding company P.C. 30,13 100,00 350,0 149,0 186,0 (100,0) 176,3
Gas Natural Distribuzione S.p.A. (2) Italy Gas Natural Internacional, SDG, S.A. Gas distribution P.C. 30,13 100,00 33,0 158,0 22,0 - 64,2
Albidona Distribuzione Gas, S.R.L. Italy Gas Natural Distribuzione Italia, S.P.A. Gas distribution P.C. 18,08 60,00 - - - - -
Cilento Reti Gas, S.R.L. Italy Gas Natural Distribuzione Italia, S.P.A. Gas distribution P.C. 18,08 60,00 4,0 - - - 0,7
Cetraro Distribuzione Gas, S.R.L. (2) Italy Gas Natural Distribuzione Italia, S.P.A. Gas marketing P.C. 18,08 60,00 - - - - -
Controladora del Golfo, S.A. de C.V. (2) Mexico Gas Natural Internacional, SDG, S.A. Unión Fenosa México, S.A de C.V Electricity generation P.C. 30,13 100,00 32,0 (81,0) (4,0) - (16,0)
Gas Natural Europe, S.A.S. (2) France Gas Natural Internacional, SDG, S.A. Gas marketing P.C. 30,13 100,00 - 3,0 (5,0) - (0,6)
Gas Natural Vendita Italia, SpA (2) Italy Gas Natural Internacional, SDG, S.A. Gas marketing P.C. 30,13 100,00 2,0 7,0 3,0 - 3,6
Natural Energy, S.A. (2) Argentina Gas Natural Internacional, SDG, S.A. La Propagadora del Gas, S.A. Gas marketing P.C. 30,13 100,00 - - 2,0 - 0,6
Ceg Río, S.A. (2) Brazil Gas Natural Internacional, SDG, S.A. Gas Natural SDG, S.A Gas distribution P.C. 17,96 59,60 41,0 73,0 35,0 (37,0) 20,1
Companhia Distribuidora de Gás do Río de Janeiro, S.A. (2) Brazil Gas Natural Internacional, SDG, S.A. Gas Natural SDG, S.A Gas distribution P.C. 16,33 54,20 212,0 223,0 103,0 (86,0) 73,8
Gas Natural, S.A. ESP (2) Colombia Gas Natural Internacional, SDG, S.A. Gas distribution P.C. 17,81 59,10 11,0 64,0 96,0 - 30,4
Gas Natural Servicios Colombia Ltda. (2) Colombia Gas Natural, S.A. ESP Gas Natural Cundiboyacense, S.A. ESP Services P.C. 30,13 100,00 - 2,0 (2,0) - -
Gas Natural Cundiboyacense, S.A. ESP (2) Colombia Gas Natural, S.A. ESP Gas distribution P.C. 13,80 45,80 1,0 12,0 7,0 - 2,8
Gas Natural del Oriente, S.A. ESP (2) Colombia Gas Natural, S.A. ESP Gas distribution P.C. 9,70 32,20 9,0 30,0 12,0 (9,0) 4,1
Gas Natural del Cesar, S.A. ESP (2) Colombia Gas Natural, S.A. ESP Gas Natural del Oriente, S.A. ESP Gas distribution P.C. 19,95 66,20 3,0 5,0 2,0 - 2,0
Gas Natural Serviços, S.A. (2) Brazil Gas Natural Internacional, SDG, S.A. Gas Natural do Brasil, S.A. Services P.C. 30,13 100,00 2,0 4,0 (1,0) - 1,5
Gas Natural Rigassificazione Italia, S.P.A. (2) Italy Gas Natural Internacional, SDG, S.A. Gas regasification P.C. 30,13 100,00 11,0 - (1,0) - 3,0
Administración y Servicios ECAP, S.A. de C.V. (2) Mexico Gas Natural Internacional, SDG, S.A. Unión Fenosa México, S.A de C.V Services P.C. 30,13 100,00 - - - - -
Gas Natural Servicios Integrales, S.A.S. (2) Colombia Gas Natural Internacional, SDG, S.A. Services P.C. 30,13 100,00 - - - - -
Natural Servicios, S.A. (2) Argentina Gas Natural Internacional, SDG, S.A. La Propagadora del Gas, S.A. Services P.C. 30,13 100,00 2,0 (1,0) - - 0,3
Serviconfort Colombia, S.A. (2) Colombia Gas Natural Internacional, SDG, S.A. La Propagadora del Gas, S.A. Services P.C. 30,13 100,00 - - - - -
Sistemas de Administración y Servicios, S.A. de C.V. (2) Mexico Gas Natural Internacional, SDG, S.A. Gas Natural SDG, S.A. Services P.C. 26,21 87,00 - - - - -
Gas Natural Argentina SDG, S.A. (2) Argentina Gas Natural Internacional, SDG, S.A. Holding company P.C. 30,13 100,00 105,0 (24,0) 1,0 - 24,7
Gas Natural do Brasil, S.A. (2) Brazil Gas Natural Internacional, SDG, S.A. Gas Natural Serviços, S.A. Holding company P.C. 30,13 100,00 3,0 (3,0) - - -
Gas Natural Italia SpA (2) Italy Gas Natural Internacional, SDG, S.A. Holding company P.C. 30,13 100,00 - - - - -
Gas Natural Puerto Rico, Inc (2) Puerto Rico Gas Natural Internacional, SDG, S.A. Holding company P.C. 30,13 100,00 1,0 (1,0) - - -
Invergás, S.A. (2) Argentina Gas Natural Internacional, SDG, S.A. Holding company P.C. 30,13 100,00 49,0 59,0 2,0 - 33,1
Gas Natural BAN, S.A. (2) Argentina Invergás, S.A. Gas Natural Argentina SDG, S.A. Gas distribution P.C. 21,09 70,00 215,0 (130,0) 11,0 (13,0) 17,5
Holding Gas Natural, S.A. (2) Spain Gas Natural SDG, S.A. La Propagadora del Gas, S.A. Holding company P.C. 30,13 100,00 - - - - -
La Propagadora del Gas, S.A. (2) Spain Gas Natural SDG, S.A. Holding Gas Natural, S.A. Holding company P.C. 30,13 100,00 - 2,0 - - 0,6
Unión Fenosa Internacional, S.A. (2) Spain Gas Natural SDG, S.A. La Propagadora del Gas, S.A. Holding company P.C. 30,13 100,00 174,0 212,0 118,0 - 151,9
Comercializadora Guatemalteca Mayorista de Electricidad, S.A. (2) Guatemala Unión Fenosa Internacional, S.A. Electricity marketing P.C. 30,13 100,00 - 1,0 1,0 - 0,6
Distribuidora de Electricidad de Occidente, S.A. (2) Guatemala Unión Fenosa Internacional, S.A. Electricity distribution P.C. 27,36 90,80 8,0 - 12,0 - 5,5
Electrificadora del Caribe S.A, E.S.P. (2) Colombia Unión Fenosa Internacional, S.A. Aplicaciones y Desarrollos Profesionales Nuevo Milenio, S.L. Electricity distribution P.C. 25,73 85,40 964,0 (195,0) 39,0 - 207,9
Energía Empresarial de la Costa, S.A., E.S.P. (2) Colombia Electrificadora del Caribe, S.A. Electricity marketing P.C. 24,49 81,30 - 3,0 2,0 - 1,2
Energía Social de la Costa S.A. E.S.P. (2) Colombia Electrificadora del Caribe, S.A. Electricity marketing P.C. 24,49 81,30 2,0 (2,0) (7,0) - (1,7)
Electricaribe Mipymes de Energía, S.A. E.S.P. (2) Colombia Electrificadora del Caribe, S.A. Electricity distribution P.C. 24,49 81,30 2,0 (1,0) (9,0) - (2,0)
Unión Fenosa Generadora La Joya, S.A. (2) Costa Rica Unión Fenosa Internacional, S.A. Electricity generation P.C. 19,58 65,00 25,0 (3,0) 5,0 - 5,3
Unión Fenosa Generadora Torito, S.A. (2) Costa Rica Unión Fenosa Internacional, S.A. Electricity generation P.C. 19,58 65,00 - 4,0 - - 0,8
Almar Ccs, S.A. (2) Costa Rica Unión Fenosa Internacional, S.A. Services P.C. 30,13 100,00 - - - - -
Unión Fenosa Generación México, S.A. de C.V. (2) Mexico Unión Fenosa Internacional, S.A. La Propagadora del Gas, S.A. Services P.C. 30,13 100,00 - - - - -
Aplicaciones y Desarrollos Profesionales Nuevo Milenio, S.L. (2) Spain Unión Fenosa Internacional, S.A. La Propagadora del Gas, S.A. Holding company P.C. 30,13 100,00 32,0 1,0 - - 9,9
Caribe Capital B.V. (2) The Netherlands Unión Fenosa Internacional, S.A. Holding company P.C. 30,13 100,00 - 262,0 14,0 (22,0) 76,5
Generadora Palamara La Vega, S.A. (2) Dominican Republic Caribe Capital, B.V. Unión Fenosa Internacional, S.A. Electricity generation P.C. 30,13 100,00 4,0 66,0 14,0 - 25,3
Inversiones Hermill, S.A. (2) Dominican Republic Generadora Palamara La Vega, S.A. Unión Fenosa Internacional, S.A. Services P.C. 30,13 100,00 1,0 - - - 0,3
Distribuidora Eléctrica de Caribe, S.A. (Panamá) (2) Panama Unión Fenosa Internacional, S.A. Holding company P.C. 30,13 100,00 110,0 (28,0) 15,0 (13,0) 25,3
Empresa Distribuidora de Electricidad Chiriqui, S.A. (2) Panama Distribuidora Eléctrica del Caribe, S.A. Electricity distribution P.C. 15,37 51,00 18,0 (3,0) 9,0 - 3,7
Empresa Distribuidora de Electricidad Metro Oeste, S.A. (2) Panama Distribuidora Eléctrica del Caribe, S.A. Electricity distribution P.C. 15,37 51,00 71,0 (6,0) 23,0 - 13,5
Energía y Servicios de Panamá, S.A. (2) Panama Distribuidora Eléctrica del Caribe, S.A. Electricity distribution P.C. 15,37 51,00 9,0 1,0 5,0 - 2,3
Unión Fenosa Generación Panamá, S.A. (2) Panama Distribuidora Eléctrica del Caribe, S.A. Electricity generation P.C. 30,13 100,00 - - - - -
First Independent Power (Kenya), Ltd. (2) Kenya Unión Fenosa Internacional, S.A. Holding company P.C. 27,00 89,60 - 10,0 - - 2,7
Iberáfrica Power Ltd. (2) Kenya First Independent Power Kenya, Ltd. Electricity generation P.C. 21,60 71,70 16,0 1,0 1,0 - 3,9
Unión Fenosa México, B.V. (2) The Netherlands Unión Fenosa Internacional, S.A. Holding company P.C. 30,13 100,00 128,0 155,0 - (1,0) 85,0
Gas Natural México, S.A. de C.V. (2) Mexico Unión Fenosa México B.V. La Propagadora del Gas, S.A. Gas distribution P.C. 26,15 86,80 471,0 (151,0) 34,0 - 92,6
Gas Natural Servicios, S.A. de C.V. (2) Mexico Gas Natural México S.A de C.V. Gas Natural Interrnacional, SDG, S.A. Services P.C. 26,15 86,80 6,0 2,0 1,0 - 2,4
Gas Natural Vehicular del Norte Asociación en Participación Mexico Gas Natural Servicios, S.A. de C.V. Gas distribution P.C. 13,35 44,30 1,0 - - - 0,1
Comercializadora Metrogas, S.A. de C.V. (2) Mexico Gas Natural México, S.A. de C.V. Sistemas de Administración y Servicios, S.A. de C.V. Gas distribution P.C. 26,15 86,80 128,0 (65,0) 10,0 - 19,1
Administración de Servicios de Energía México, S.A. de C.V. (2) Mexico Comercializadora Metrogas, S.A. de C.V. Gas Natural México, S.A de C.V. Services P.C. 26,15 86,80 - - - - -
Energía y Confort Administración de Personal, S.A. de C.V. (2) Mexico Gas Natural México, S.A. de C.V. Gas Natural Internacional SDG, S.A. Services P.C. 26,21 87,00 - 1,0 - - 0,3
CH4 Energía S.A. de C.V. Mexico Gas Natural México, S.A. de C.V. Marketing and transportation of gas P.C. 13,08 43,40 1,0 4,0 3,0 (20,0) (1,6)
Transnatural S.R.L. de C.V. Mexico Gas Natural México, S.A. de C.V. Marketing and transportation of gas P.C. 13,08 43,40 10,0 (31,0) (5,0) - (3,4)
Zemer Energia, S.A. de C.V. (2) Mexico Unión Fenosa México, B.V. Generation of electricity P.C. 15,06 50,00 - (1,0) - - (0,2)
Unión Fenosa Operación México S.A. de C.V. (2) Mexico Unión Fenosa México, B.V. La Propagadora del Gas, S.A. Professional services P.C. 30,13 100,00 - 1,0 - - 0,3
Unión Fenosa México, S.A. de C.V. (2) Mexico Unión Fenosa México, B.V. La Propagadora del Gas, S.A. Holding company P.C. 30,13 100,00 321,0 (188,0) (3,0) - 39,2
Fuerza y Energía BII Hioxo, S.A. de C.V. (2) Mexico Unión Fenosa México, S.A de C.V. La Propagadora del Gas, S.A. Generation of electricity P.C. 30,13 100,00 38,0 (11,0) - - 8,1
Fuerza y Energía de Hermosillo, S.A. de C.V. (2) Mexico Unión Fenosa México, S.A de C.V. Unión Fenosa Internacional, S.A. Generation of electricity P.C. 30,13 100,00 49,0 (1,0) 6,0 - 16,3
Fuerza y Energía de Naco Nogales, S.A. de C.V. (2) Mexico Unión Fenosa México, S.A de C.V. Unión Fenosa Internacional, S.A. Generation of electricity P.C. 30,13 100,00 131,0 (43,0) 11,0 - 29,8
Fuerza y Energía de Norte Durango, S.A de C.V. (2) Mexico Unión Fenosa México, S.A de C.V. La Propagadora del Gas, S.A. Generation of electricity P.C. 30,13 100,00 54,0 (9,0) (2,0) - 13,0
Fuerza y Energía de Tuxpan, S.A. de C.V. (2) Mexico Unión Fenosa México, S.A de C.V. Unión Fenosa Internacional, S.A. Generation of electricity P.C. 30,13 100,00 156,0 (3,0) 33,0 - 56,0
Distribuidora de Electricidad de Oriente, S.A. (2) Guatemala Unión Fenosa Internacional, S.A. Disribution of electricity P.C. 27,96 92,80 14,0 (3,0) 7,0 - 5,0
Distribuidora de Electricidad del Norte, S.A. (2) Nicaragua Unión Fenosa Internacional, S.A. La Propagadora del Gas, S.A. Disribution of electricity P.C. 26,60 88,30 74,0 (42,0) 3,0 - 9,3
Distribuidora de Electricidad del Sur, S.A. (2) Nicaragua Unión Fenosa Internacional, S.A. La Propagadora del Gas, S.A. Disribution of electricity P.C. 27,03 89,70 60,0 (54,0) - - 1,6
Generación Limpia Guatemala, S.A. (2) Guatemala Unión Fenosa Internacional, S.A. Disribution of electricity P.C. 30,13 100,00 6,0 - - - 1,8
Red Unión Fenosa, S.A. (2) Moldova Unión Fenosa Internacional, S.A. Disribution of electricity P.C. 28,29 93,90 7,0 118,0 21,0 - 41,3
Redes Eléctricas de Centroamérica, S.A. (2) Guatemala Unión Fenosa Internacional, S.A. Disribution of electricity P.C. 30,13 100,00 2,0 1,0 - - 0,9
Unión Fenosa International B.V. (2) The Netherlands Gas Natural SDG, S.A. Holding company P.C. 30,13 100,00 - 17,0 - - 5,1
Unión Fenosa Chile Limitada (2) Chile Unión Fenosa International B.V. La Propagadora del Gas, S.A. Holding company P.C. 30,13 100,00 4,0 - - - 1,2
Unión Fenosa Renovables Limitada (Chile) (2) Chile Unión Fenosa Chile Limitada La Propagadora del Gas, S.A. Holding company P.C. 30,13 100,00 4,0 - - - 1,2
Unión Fenosa Energías Renovables Chile, S.A. (2) Chile Unión Fenosa Renovables Limitada (Chile) Generation of electricity P.C. 24,10 80,00 1,0 1,0 (1,0) - 0,2
Unión Fenosa Wind Australia Pty, Ltd. (2) Australia Unión Fenosa International B.V. Holding company P.C. 27,54 91,40 11,0 2,0 - - 3,6
Berrybank development Pty, Ltd. (2) Australia Unión Fenosa Wind Australia Pty, Ltd. Energy P.C. 27,54 91,40 - - - - -
Crookwell development Pty, Ltd. (2) Australia Unión Fenosa Wind Australia Pty, Ltd. Energy P.C. 27,54 91,40 3,0 1,0 - - 1,1
Hawkesdale development Pty, Ltd. (2) Australia Unión Fenosa Wind Australia Pty, Ltd. Energy P.C. 27,54 91,40 1,0 - - - 0,3
Ryan Corner development Pty, Ltd. (2) Australia Unión Fenosa Wind Australia Pty, Ltd. Energy P.C. 27,54 91,40 2,0 1,0 - - 0,8
Gas Natural Fenosa Telecomunicaciones, S.A. (2) Spain Gas Natural SDG, S.A. La Propagadora del Gas, S.A. Telecommunications P.C. 30,13 100,00 21,0 26,0 22,0 - 20,8
Unión Fenosa Redes de Telecomunicación, S.A. (Colombia) (2) Colombia Gas Natural Fenosa Telecomunicaciones, S.A. Electrificadora del Caribe, S.A. Telecommunications P.C. 26,45 87,80 1,0 2,0 1,0 - 1,1
Unión Fenosa Redes de Telecomunicación, S.A. (Guatemala) (2) Guatemala Gas Natural Fenosa Telecomunicaciones, S.A. Telecommunications P.C. 30,13 100,00 - 4,0 2,0 - 1,8
Unión Fenosa Redes de Telecomunicación, S.A. (Nicaragua) (2) Nicaragua Gas Natural Fenosa Telecomunicaciones, S.A. Telecommunications P.C. 30,13 100,00 - 1,0 1,0 - 0,6
Unión Fenosa Redes de Telecomunicación, S.A. (Panamá) (2) Panama Gas Natural Fenosa Telecomunicaciones, S.A. Empresa Distribuidora Electricidad Metro Oeste, SA Telecommunications P.C. 27,18 90,20 2,0 3,0 3,0 - 2,2
Alliance, S.A. Nicaragua Gas Natural Fenosa Telecomunicaciones, S.A. Telecommunications P.C. 15,03 49,90 - - - - -
Central Térmica La Torrecilla, S.A. Spain Gas Natural SDG, S.A. Cogeneration P.C. 15,06 50,00 1,0 - (1,0) - -
Unión Fenosa Gas, S.A. Spain Gas Natural SDG, S.A. Gas P.C. 15,06 50,00 33,0 464,0 210,0 (171,0) 80,7
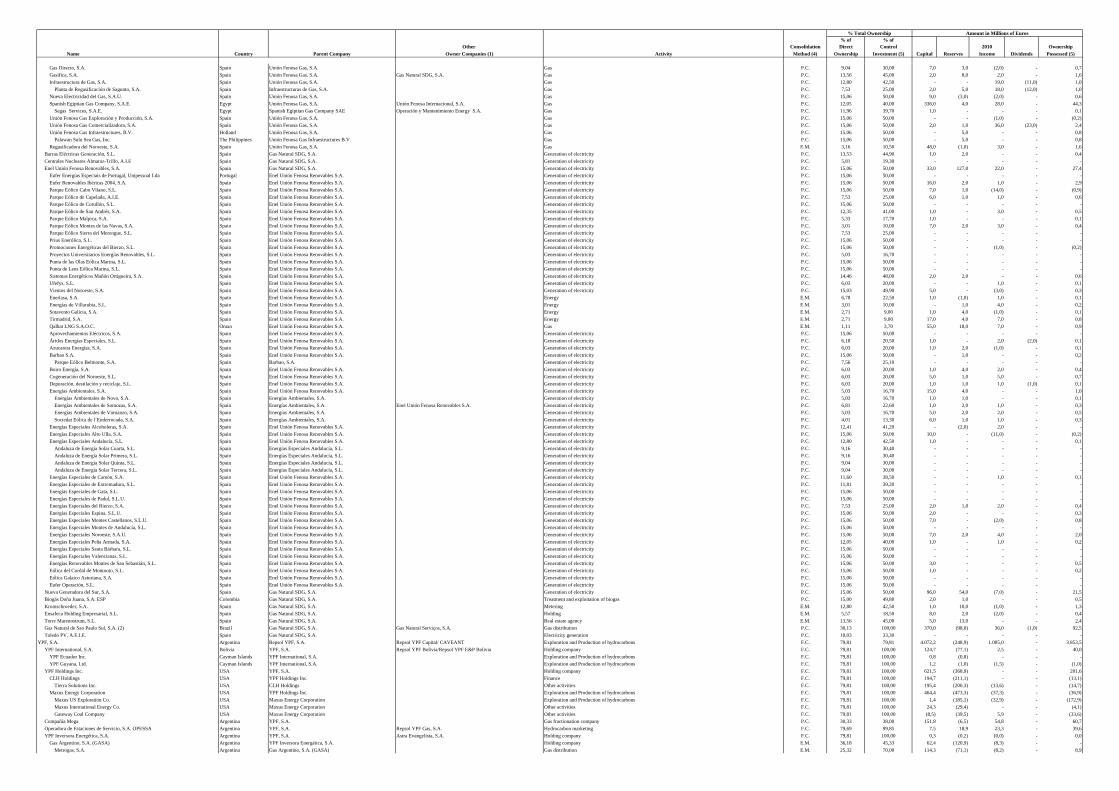
% of % ofOther Consolidation Direct Control 2010 Ownership
Name Country Parent Company Owner Companies (1) Activity Method (4) Ownership Investment (5) Capital Reserves Income Dividends Possessed (5)
% Total Ownership Amount in Millions of Euros
Gas Directo, S.A. Spain Unión Fenosa Gas, S.A. Gas P.C. 9,04 30,00 7,0 3,0 (2,0) - 0,7
Gasifica, S.A. Spain Unión Fenosa Gas, S.A. Gas Natural SDG, S.A. Gas P.C. 13,56 45,00 2,0 8,0 2,0 - 1,6
Infraestructura de Gas, S.A. Spain Unión Fenosa Gas, S.A. Gas P.C. 12,80 42,50 - - 19,0 (11,0) 1,0
Planta de Regasificación de Sagunto, S.A. Spain Infraestructuras de Gas, S.A. Gas P.C. 7,53 25,00 2,0 5,0 18,0 (12,0) 1,0
Nueva Electricidad del Gas, S.A.U. Spain Unión Fenosa Gas, S.A. Gas P.C. 15,06 50,00 9,0 (3,0) (2,0) - 0,6
Spanish Egiptian Gas Company, S.A.E. Egypt Unión Fenosa Gas, S.A. Unión Fenosa Internacional, S.A. Gas P.C. 12,05 40,00 336,0 4,0 28,0 - 44,3
Segas Services, S.A.E. Egypt Spanish Egiptian Gas Company SAE Operación y Mantenimiento Energy S.A. Gas P.C. 11,96 39,70 1,0 - - - 0,1
Unión Fenosa Gas Exploración y Producción, S.A. Spain Unión Fenosa Gas, S.A. Gas P.C. 15,06 50,00 - - (1,0) - (0,2)
Unión Fenosa Gas Comercializadora, S.A. Spain Unión Fenosa Gas, S.A. Gas P.C. 15,06 50,00 2,0 1,0 36,0 (23,0) 2,4
Unión Fenosa Gas Infraestructures, B.V. Holland Unión Fenosa Gas, S.A. Gas P.C. 15,06 50,00 - 5,0 - - 0,8
Palawan Sulu Sea Gas, Inc. The Philippines Unión Fenosa Gas Infraestructures B.V. Gas P.C. 15,06 50,00 - 5,0 - - 0,8
Regasificadora del Noroeste, S.A. Spain Unión Fenosa Gas, S.A. Gas E.M. 3,16 10,50 48,0 (1,0) 3,0 - 1,6
Barras Eléctricas Generación, S.L. Spain Gas Natural SDG, S.A. Generation of electricity P.C. 13,53 44,90 1,0 2,0 - - 0,4
Centrales Nucleares Almaraz-Trillo, A.I.E Spain Gas Natural SDG, S.A. Generation of electricity P.C. 5,81 19,30 - - - - -
Enel Unión Fenosa Renovables, S.A. Spain Gas Natural SDG, S.A. Generation of electricity P.C. 15,06 50,00 33,0 127,0 22,0 - 27,4
Eufer Energías Especiais de Portugal, Unipessoal Lda Portugal Enel Unión Fenosa Renovables S.A. Generation of electricity P.C. 15,06 50,00 - - - - -
Eufer Renovables Ibéricas 2004, S.A. Spain Enel Unión Fenosa Renovables S.A. Generation of electricity P.C. 15,06 50,00 16,0 2,0 1,0 - 2,9
Parque Eólico Cabo Vilano, S.L. Spain Enel Unión Fenosa Renovables S.A. Generation of electricity P.C. 15,06 50,00 7,0 1,0 (14,0) - (0,9)
Parque Eólico de Capelada, A.I.E. Spain Enel Unión Fenosa Renovables S.A. Generation of electricity P.C. 7,53 25,00 6,0 1,0 1,0 - 0,6
Parque Eólico de Corullón, S.L. Spain Enel Unión Fenosa Renovables S.A. Generation of electricity P.C. 15,06 50,00 - - - - -
Parque Eólico de San Andrés, S.A. Spain Enel Unión Fenosa Renovables S.A. Generation of electricity P.C. 12,35 41,00 1,0 - 3,0 - 0,5
Parque Eólico Malpica, S.A. Spain Enel Unión Fenosa Renovables S.A. Generation of electricity P.C. 5,33 17,70 1,0 - - - 0,1
Parque Eólico Montes de las Navas, S.A. Spain Enel Unión Fenosa Renovables S.A. Generation of electricity P.C. 3,01 10,00 7,0 2,0 3,0 - 0,4
Parque Eólico Sierra del Merengue, S.L. Spain Enel Unión Fenosa Renovables S.A. Generation of electricity P.C. 7,53 25,00 - - - - -
Prius Enerólica, S.L. Spain Enel Unión Fenosa Renovables S.A. Generation of electricity P.C. 15,06 50,00 - - - - -
Promociones Energéticas del Bierzo, S.L. Spain Enel Unión Fenosa Renovables S.A. Generation of electricity P.C. 15,06 50,00 - - (1,0) - (0,2)
Proyectos Universitarios Energías Renovables, S.L. Spain Enel Unión Fenosa Renovables S.A. Generation of electricity P.C. 5,03 16,70 - - - - -
Punta de las Olas Eólica Marina, S.L. Spain Enel Unión Fenosa Renovables S.A. Generation of electricity P.C. 15,06 50,00 - - - - -
Punta de Lens Eólica Marina, S.L. Spain Enel Unión Fenosa Renovables S.A. Generation of electricity P.C. 15,06 50,00 - - - - -
Sistemas Energéticos Mañón Ortigueira, S.A. Spain Enel Unión Fenosa Renovables S.A. Generation of electricity P.C. 14,46 48,00 2,0 2,0 - - 0,6
Ufefys, S.L. Spain Enel Unión Fenosa Renovables S.A. Generation of electricity P.C. 6,03 20,00 - - 1,0 - 0,1
Vientos del Noroeste, S.A. Spain Enel Unión Fenosa Renovables S.A. Generation of electricity P.C. 15,03 49,90 5,0 - (3,0) - 0,3
Enerlasa, S.A. Spain Enel Unión Fenosa Renovables S.A. Energy E.M. 6,78 22,50 1,0 (1,0) 1,0 - 0,1
Energías de Villarubia, S.L. Spain Enel Unión Fenosa Renovables S.A. Energy E.M. 3,01 10,00 - 1,0 4,0 - 0,2
Sotavento Galicia, S.A. Spain Enel Unión Fenosa Renovables S.A. Energy E.M. 2,71 9,00 1,0 4,0 (1,0) - 0,1
Tirmadrid, S.A. Spain Enel Unión Fenosa Renovables S.A. Energy E.M. 2,71 9,00 17,0 4,0 7,0 - 0,8
Qalhat LNG S.A.O.C. Oman Enel Unión Fenosa Renovables S.A. Gas E.M. 1,11 3,70 55,0 18,0 7,0 - 0,9
Aprovechamientos Eléctricos, S.A. Spain Enel Unión Fenosa Renovables S.A. Generation of electricity P.C. 15,06 50,00 - - - - -
Áridos Energías Especiales, S.L. Spain Enel Unión Fenosa Renovables S.A. Generation of electricity P.C. 6,18 20,50 1,0 - 2,0 (2,0) 0,1
Azucarera Energías, S.A. Spain Enel Unión Fenosa Renovables S.A. Generation of electricity P.C. 6,03 20,00 1,0 2,0 (1,0) - 0,1
Barbao S.A. Spain Enel Unión Fenosa Renovables S.A. Generation of electricity P.C. 15,06 50,00 - 1,0 - - 0,2
Parque Eólico Belmonte, S.A. Spain Barbao, S.A. Generation of electricity P.C. 7,56 25,10 - - - - -
Boiro Energía, S.A. Spain Enel Unión Fenosa Renovables S.A. Generation of electricity P.C. 6,03 20,00 1,0 4,0 2,0 - 0,4
Cogeneración del Noroeste, S.L. Spain Enel Unión Fenosa Renovables S.A. Generation of electricity P.C. 6,03 20,00 5,0 1,0 5,0 - 0,7
Depuración, destilación y reciclaje, S.L. Spain Enel Unión Fenosa Renovables S.A. Generation of electricity P.C. 6,03 20,00 1,0 1,0 1,0 (1,0) 0,1
Energías Ambientales, S.A. Spain Enel Unión Fenosa Renovables S.A. Generation of electricity P.C. 5,03 16,70 15,0 4,0 - - 1,0
Energías Ambientales de Novo, S.A. Spain Energías Ambientales, S.A. Generation of electricity P.C. 5,03 16,70 1,0 1,0 - - 0,1
Energías Ambientales de Somozas, S.A. Spain Energías Ambientales, S.A. Enel Unión Fenosa Renovables S.A. Generation of electricity P.C. 6,81 22,60 1,0 2,0 1,0 - 0,3
Energías Ambientales de Vimianzo, S.A. Spain Energías Ambientales, S.A. Generation of electricity P.C. 5,03 16,70 5,0 2,0 2,0 - 0,5
Sociedat Eólica de l´Enderrocada, S.A. Spain Energías Ambientales, S.A. Generation of electricity P.C. 4,01 13,30 6,0 1,0 1,0 - 0,3
Energías Especiales Alcoholeras, S.A. Spain Enel Unión Fenosa Renovables S.A. Generation of electricity P.C. 12,41 41,20 - (2,0) 2,0 - -
Energías Especiales Alto Ulla, S.A. Spain Enel Unión Fenosa Renovables S.A. Generation of electricity P.C. 15,06 50,00 10,0 - (11,0) - (0,2)
Energías Especiales Andalucía, S.L. Spain Enel Unión Fenosa Renovables S.A. Generation of electricity P.C. 12,80 42,50 1,0 - - - 0,1
Andaluza de Energía Solar Cuarta, S.L. Spain Energías Especiales Andalucía, S.L. Generation of electricity P.C. 9,16 30,40 - - - - -
Andaluza de Energía Solar Primera, S.L. Spain Energías Especiales Andalucía, S.L. Generation of electricity P.C. 9,16 30,40 - - - - -
Andaluza de Energía Solar Quinta, S.L. Spain Energías Especiales Andalucía, S.L. Generation of electricity P.C. 9,04 30,00 - - - - -
Andaluza de Energía Solar Tercera, S.L. Spain Energías Especiales Andalucía, S.L. Generation of electricity P.C. 9,04 30,00 - - - - -
Energías Especiales de Careón, S.A. Spain Enel Unión Fenosa Renovables S.A. Generation of electricity P.C. 11,60 38,50 - - 1,0 - 0,1
Energías Especiales de Extremadura, S.L. Spain Enel Unión Fenosa Renovables S.A. Generation of electricity P.C. 11,81 39,20 - - - - -
Energías Especiales de Gata, S.L. Spain Enel Unión Fenosa Renovables S.A. Generation of electricity P.C. 15,06 50,00 - - - - -
Energías Especiales de Padul, S.L.U. Spain Enel Unión Fenosa Renovables S.A. Generation of electricity P.C. 15,06 50,00 - - - - -
Energías Especiales del Bierzo, S.A. Spain Enel Unión Fenosa Renovables S.A. Generation of electricity P.C. 7,53 25,00 2,0 1,0 2,0 - 0,4
Energías Especiales Espina, S.L.U. Spain Enel Unión Fenosa Renovables S.A. Generation of electricity P.C. 15,06 50,00 2,0 - - - 0,3
Energías Especiales Montes Castellanos, S.L.U. Spain Enel Unión Fenosa Renovables S.A. Generation of electricity P.C. 15,06 50,00 7,0 - (2,0) - 0,8
Energías Especiales Montes de Andalucía, S.L. Spain Enel Unión Fenosa Renovables S.A. Generation of electricity P.C. 15,06 50,00 - - - - -
Energías Especiales Noroeste, S.A.U. Spain Enel Unión Fenosa Renovables S.A. Generation of electricity P.C. 15,06 50,00 7,0 2,0 4,0 - 2,0
Energías Especiales Peña Armada, S.A. Spain Enel Unión Fenosa Renovables S.A. Generation of electricity P.C. 12,05 40,00 1,0 - 1,0 - 0,2
Energías Especiales Santa Bárbara, S.L. Spain Enel Unión Fenosa Renovables S.A. Generation of electricity P.C. 15,06 50,00 - - - - -
Energías Especiales Valencianas, S.L. Spain Enel Unión Fenosa Renovables S.A. Generation of electricity P.C. 15,06 50,00 - - - - -
Energías Renovables Montes de San Sebastián, S.L. Spain Enel Unión Fenosa Renovables S.A. Generation of electricity P.C. 15,06 50,00 3,0 - - - 0,5
Eólica del Cordal de Montouto, S.L. Spain Enel Unión Fenosa Renovables S.A. Generation of electricity P.C. 15,06 50,00 1,0 - - - 0,2
Eólica Galaico Asturiana, S.A. Spain Enel Unión Fenosa Renovables S.A. Generation of electricity P.C. 15,06 50,00 - - - - -
Eufer Operación, S.L. Spain Enel Unión Fenosa Renovables S.A. Generation of electricity P.C. 15,06 50,00 - - - - -
Nueva Generadora del Sur, S.A. Spain Gas Natural SDG, S.A. Generation of electricity P.C. 15,06 50,00 96,0 54,0 (7,0) - 21,5
Biogás Doña Juana, S.A. ESP Colombia Gas Natural SDG, S.A. Treatment and exploitation of biogas P.C. 15,00 49,80 2,0 1,0 - - 0,5
Kromschroeder, S.A. Spain Gas Natural SDG, S.A. Metering E.M. 12,80 42,50 1,0 10,0 (1,0) - 1,3
Ensafeca Holding Empresarial, S.L. Spain Gas Natural SDG, S.A. Holding E.M. 5,57 18,50 8,0 2,0 (2,0) - 0,4
Torre Marenostrum, S.L. Spain Gas Natural SDG, S.A. Real estate agency E.M. 13,56 45,00 5,0 13,0 - - 2,4
Gas Natural de Sao Paulo Sul, S.A. (2) Brazil Gas Natural SDG, S.A. Gas Natural Serviços, S.A. Gas distribution P.C. 30,13 100,00 370,0 (98,0) 36,0 (1,0) 92,5
Toledo PV, A.E.I.E. Spain Gas Natural SDG, S.A. Electricity generation P.C. 10,03 33,30 - - - - -
YPF, S.A. Argentina Repsol YPF, S.A. Repsol YPF Capital/ CAVEANT Exploration and Production of hydrocarbons F.C. 79,81 79,81 4.072,2 (248,9) 1.005,0 - 3.853,5
YPF International, S.A. Bolivia YPF, S.A. Repsol YPF Bolivia/Repsol YPF E&P Bolivia Holding company F.C. 79,81 100,00 124,7 (77,1) 2,5 - 40,0
YPF Ecuador Inc. Cayman Islands YPF International, S.A. Exploration and Production of hydrocarbons F.C. 79,81 100,00 0,8 (0,8) - - -
YPF Guyana, Ltd. Cayman Islands YPF International, S.A. Exploration and Production of hydrocarbons F.C. 79,81 100,00 1,2 (1,0) (1,5) - (1,0)
YPF Holdings Inc. USA YPF, S.A. Holding company F.C. 79,81 100,00 621,5 (368,9) - - 201,6
CLH Holdings USA YPF Holdings Inc. Finance F.C. 79,81 100,00 194,7 (211,1) - - (13,1)
Tierra Solutions Inc. USA CLH Holdings Other activities F.C. 79,81 100,00 195,4 (200,3) (13,6) - (14,7)
Maxus Energy Corporation USA YPF Holdings Inc. Exploration and Production of hydrocarbons F.C. 79,81 100,00 464,4 (473,3) (37,3) - (36,9)
Maxus US Exploration Co. USA Maxus Energy Corporation Exploration and Production of hydrocarbons F.C. 79,81 100,00 1,4 (185,1) (32,9) - (172,9)
Maxus International Energy Co. USA Maxus Energy Corporation Other activities F.C. 79,81 100,00 24,3 (29,4) - - (4,1)
Gateway Coal Company USA Maxus Energy Corporation Other activities F.C. 79,81 100,00 (8,5) (39,5) 5,9 - (33,6)
Compañía Mega Argentina YPF, S.A. Gas fractionation company P.C. 30,33 38,00 151,8 (6,5) 54,8 - 60,7
Operadora de Estaciones de Servicio, S.A. OPESSA Argentina YPF, S.A. Repsol YPF Gas, S.A. Hydrocarbon marketing F.C. 79,69 99,85 7,5 18,9 23,3 - 39,6
YPF Inversora Energética, S.A. Argentina YPF, S.A. Astra Evangelista, S.A. Holding company F.C. 79,81 100,00 0,3 (0,2) (0,0) - 0,0
Gas Argentino, S.A. (GASA) Argentina YPF Inversora Energética, S.A. Holding company E.M. 36,18 45,33 62,4 (120,9) (8,3) - -
Metrogas, S.A. Argentina Gas Argentino, S.A. (GASA) Gas distribution E.M. 25,32 70,00 114,3 (71,1) (8,2) - 8,9
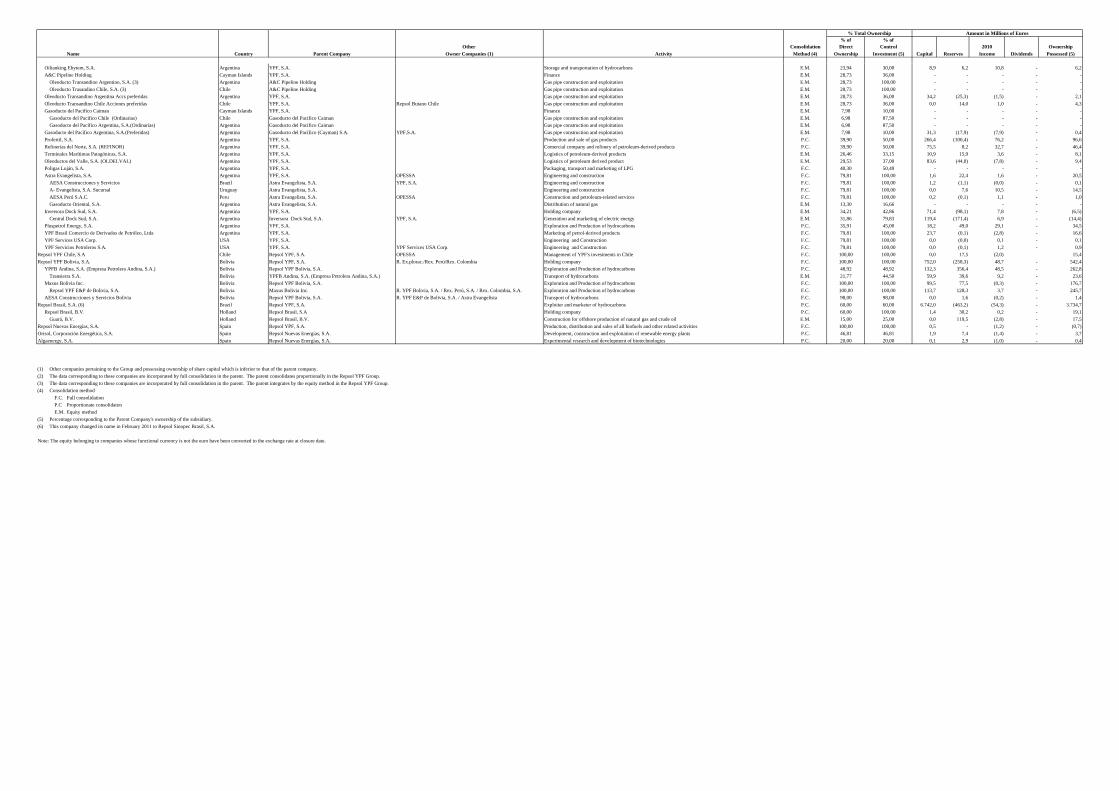
% of % ofOther Consolidation Direct Control 2010 Ownership
Name Country Parent Company Owner Companies (1) Activity Method (4) Ownership Investment (5) Capital Reserves Income Dividends Possessed (5)
% Total Ownership Amount in Millions of Euros
Oiltanking Ebytem, S.A. Argentina YPF, S.A. Storage and transportation of hydrocarbons E.M. 23,94 30,00 8,9 6,2 10,8 - 6,2
A&C Pipeline Holding Cayman Islands YPF, S.A. Finance E.M. 28,73 36,00 - - - - -
Oleoducto Transandino Argentino, S.A. (3) Argentina A&C Pipeline Holding Gas pipe construction and exploitation E.M. 28,73 100,00 - - - - -
Oleoducto Trasandino Chile, S.A. (3) Chile A&C Pipeline Holding Gas pipe construction and exploitation E.M. 28,73 100,00 - - - - -
Oleoducto Transandino Argentina Accs preferidas Argentina YPF, S.A. Gas pipe construction and exploitation E.M. 28,73 36,00 34,2 (25,3) (1,5) - 2,1
Oleoducto Transandino Chile Acciones preferidas Chile YPF, S.A. Repsol Butano Chile Gas pipe construction and exploitation E.M. 28,73 36,00 0,0 14,0 1,0 - 4,3
Gasoducto del Pacifico Caiman Cayman Islands YPF, S.A. Finance E.M. 7,98 10,00 - - - - -
Gasoducto del Pacifico Chile (Ordinarias) Chile Gasoducto del Pacifico Caiman Gas pipe construction and exploitation E.M. 6,98 87,50 - - - - -
Gasoducto del Pacífico Argentina, S.A.(Ordinarias) Argentina Gasoducto del Pacifico Caiman Gas pipe construction and exploitation E.M. 6,98 87,50 - - - - -
Gasoducto del Pacífico Argentina, S.A.(Preferidas) Argentina Gasoducto del Pacífico (Cayman) S.A. YPF,S.A. Gas pipe construction and exploitation E.M. 7,98 10,00 31,3 (17,9) (7,9) - 0,4
Profertil, S.A. Argentina YPF, S.A. Production and sale of gas products P.C. 39,90 50,00 266,4 (100,4) 76,2 - 96,6
Refinerías del Norte, S.A. (REFINOR) Argentina YPF, S.A. Comercial company and refinery of petroleum-derived products P.C. 39,90 50,00 75,5 8,2 32,7 - 46,4
Terminales Marítimas Patagónicas, S.A. Argentina YPF, S.A. Logistics of petroleum-derived products E.M. 26,46 33,15 10,9 15,9 3,6 - 8,1
Oleoductos del Valle, S.A. (OLDELVAL) Argentina YPF, S.A. Logistics of petroleum derived product E.M. 29,53 37,00 83,6 (44,0) (7,8) - 9,4
Poligas Luján, S.A. Argentina YPF, S.A. Packaging, transport and marketing of LPG F.C. 40,30 50,49 - - - - -
Astra Evangelista, S.A. Argentina YPF, S.A. OPESSA Engineering and construction F.C. 79,81 100,00 1,6 22,4 1,6 - 20,5
AESA Construcciones y Servicios Brazil Astra Evangelista, S.A. YPF, S.A. Engineering and construction F.C. 79,81 100,00 1,2 (1,1) (0,0) - 0,1
A- Evangelista, S.A. Sucursal Uruguay Astra Evangelista, S.A. Engineering and construction F.C. 79,81 100,00 0,0 7,6 10,5 - 14,5
AESA Perú S.A.C. Peru Astra Evangelista, S.A. OPESSA Construction and petroleum-related services F.C. 79,81 100,00 0,2 (0,1) 1,1 - 1,0
Gasoducto Oriental, S.A. Argentina Astra Evangelista, S.A. Distribution of natural gas E.M. 13,30 16,66 - - - - -
Inversora Dock Sud, S.A. Argentina YPF, S.A. Holding company E.M. 34,21 42,86 71,4 (98,1) 7,8 - (6,5)
Central Dock Sud, S.A. Argentina Inversora Dock Sud, S.A. YPF, S.A. Generation and marketing of electric energy E.M. 31,86 79,83 119,4 (171,4) 6,9 - (14,4)
Pluspetrol Energy, S.A. Argentina YPF, S.A. Exploration and Production of hydrocarbons P.C. 35,91 45,00 18,2 49,0 29,1 - 34,5
YPF Brasil Comercio de Derivados de Petróleo, Ltda Argentina YPF, S.A. Marketing of petrol-derived products F.C. 79,81 100,00 23,7 (0,1) (2,8) - 16,6
YPF Services USA Corp. USA YPF, S.A. Engineering and Construction F.C. 79,81 100,00 0,0 (0,0) 0,1 - 0,1
YPF Servicios Petroleros S.A. USA YPF, S.A. YPF Services USA Corp. Engineering and Construction F.C. 79,81 100,00 0,0 (0,1) 1,2 - 0,9
Repsol YPF Chile, S.A Chile Repsol YPF, S.A. OPESSA Management of YPF's investments in Chile F.C. 100,00 100,00 0,0 17,5 (2,0) 15,4
Repsol YPF Bolivia, S.A. Bolivia Repsol YPF, S.A. R. Ex.plorac./Rex. Perú/Rex. Colombia Holding company F.C. 100,00 100,00 752,0 (258,3) 48,7 - 542,4
YPFB Andina, S.A. (Empresa Petrolera Andina, S.A.) Bolivia Repsol YPF Bolivia, S.A. Exploration and Production of hydrocarbons P.C. 48,92 48,92 132,3 356,4 48,5 - 262,8
Transierra S.A. Bolivia YPFB Andina, S.A. (Empresa Petrolera Andina, S.A.) Transport of hydrocarbons E.M. 21,77 44,50 59,9 39,6 9,2 - 23,6
Maxus Bolivia Inc. Bolivia Repsol YPF Bolivia, S.A. Exploration and Production of hydrocarbons F.C. 100,00 100,00 99,5 77,5 (0,3) - 176,7
Repsol YPF E&P de Bolivia, S.A. Bolivia Maxus Bolivia Inc. R. YPF Bolivia, S.A. / Rex. Perú, S.A. / Rex. Colombia, S.A. Exploration and Production of hydrocarbons F.C. 100,00 100,00 113,7 128,3 3,7 - 245,7
AESA Construcciones y Servicios Bolivia Bolivia Repsol YPF Bolivia, S.A. R. YPF E&P de Bolivia, S.A. / Astra Evangelista Transport of hydrocarbons F.C. 98,00 98,00 0,0 1,6 (0,2) - 1,4
Repsol Brasil, S.A. (6) Brazil Repsol YPF, S.A. Exploiter and marketer of hydrocarbons P.C. 60,00 60,00 6.742,0 (463,2) (54,3) - 3.734,7
Repsol Brasil, B.V. Holland Repsol Brasil, S.A Holding company P.C. 60,00 100,00 1,4 30,2 0,2 - 19,1
Guará, B.V. Holland Repsol Brasil, B.V. Construction for offshore production of natural gas and crude oil E.M. 15,00 25,00 0,0 119,5 (2,8) - 17,5
Repsol Nuevas Energías, S.A. Spain Repsol YPF, S.A. Production, distribution and sales of all biofuels and other related activities F.C. 100,00 100,00 0,5 - (1,2) - (0,7)
Orisol, Corporación Energética, S.A. Spain Repsol Nuevas Energías, S.A. Development, construction and exploitation of renewable energy plants P.C. 46,81 46,81 1,9 7,4 (1,4) - 3,7
Algaenergy, S.A. Spain Repsol Nuevas Energías, S.A. Experimental research and development of biotechnologies P.C. 20,00 20,00 0,1 2,9 (1,0) - 0,4
(1) Other companies pertaining to the Group and possessing ownership of share capital which is inferior to that of the parent company.
(2) The data corresponding to these companies are incorporated by full consolidation in the parent. The parent consolidates proportionally in the Repsol YPF Group.
(3) The data corresponding to these companies are incorporated by full consolidation in the parent. The parent integrates by the equity method in the Repsol YPF Group.
(4) Consolidation method
F.C. Full consolidation
P.C Proportionate consolidaton
E.M. Equity method
(5) Percentage corresponding to the Parent Company's ownership of the subsidiary.
(6) This company changed its name in February 2011 to Repsol Sinopec Brasil, S.A.
Note: The equity belonging to companies whose functional currency is not the euro have been converted to the exchange rate at closure date.
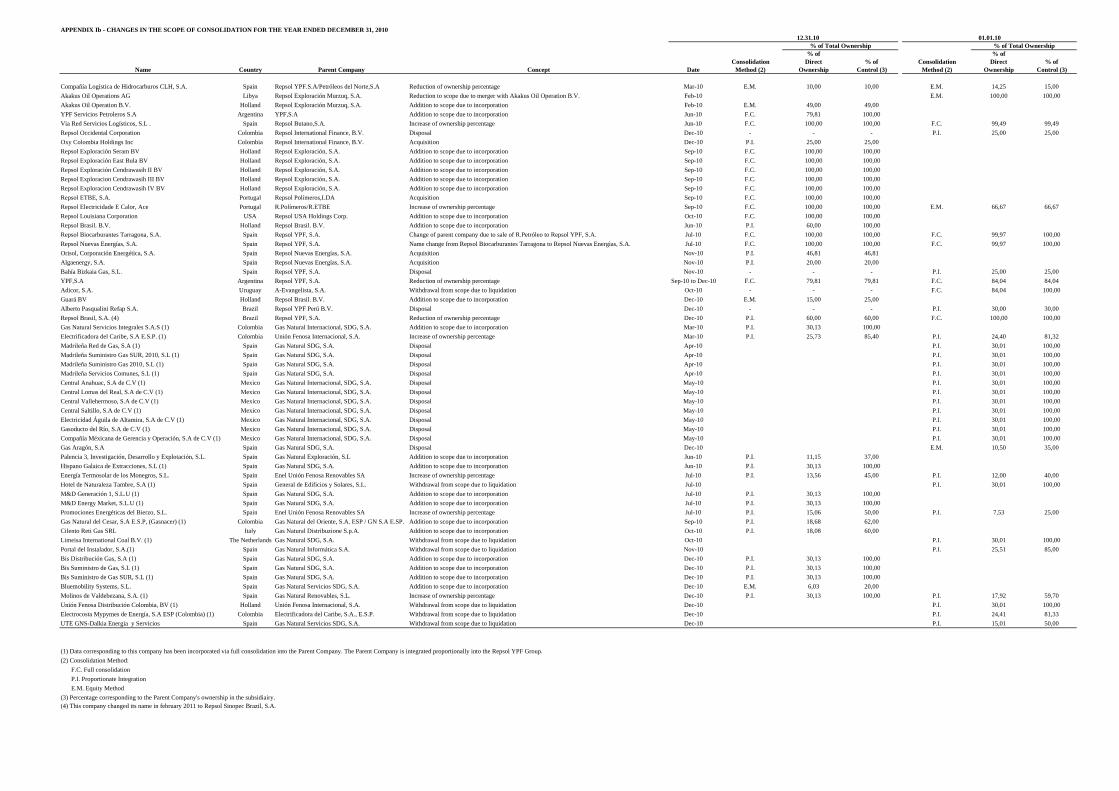
APPENDIX Ib - CHANGES IN THE SCOPE OF CONSOLIDATION FOR THE YEAR ENDED DECEMBER 31, 2010
% of % ofConsolidation Direct % of Consolidation Direct % of
Name Country Parent Company Concept Date Method (2) Ownership Control (3) Method (2) Ownership Control (3)
Compañía Logística de Hidrocarburos CLH, S.A. Spain Repsol YPF.S.A/Petróleos del Norte,S.A Reduction of ownership percentage Mar-10 E.M. 10,00 10,00 E.M. 14,25 15,00
Akakus Oil Operations AG Libya Repsol Exploración Murzuq, S.A. Reduction to scope due to merger with Akakus Oil Operation B.V. Feb-10 E.M. 100,00 100,00
Akakus Oil Operation B.V. Holland Repsol Exploración Murzuq, S.A. Addition to scope due to incorporation Feb-10 E.M. 49,00 49,00
YPF Servicios Petroleros S.A Argentina YPF,S.A Addition to scope due to incorporation Jun-10 F.C. 79,81 100,00
Via Red Servicios Logísticos, S.L . Spain Repsol Butano,S.A. Increase of ownership percentage Jun-10 F.C. 100,00 100,00 F.C. 99,49 99,49
Repsol Occidental Corporation Colombia Repsol International Finance, B.V. Disposal Dec-10 - - - P.I. 25,00 25,00
Oxy Colombia Holdings Inc Colombia Repsol International Finance, B.V. Acquisition Dec-10 P.I. 25,00 25,00
Repsol Exploración Seram BV Holland Repsol Exploración, S.A. Addition to scope due to incorporation Sep-10 F.C. 100,00 100,00
Repsol Exploración East Bula BV Holland Repsol Exploración, S.A. Addition to scope due to incorporation Sep-10 F.C. 100,00 100,00
Repsol Exploración Cendrawasih II BV Holland Repsol Exploración, S.A. Addition to scope due to incorporation Sep-10 F.C. 100,00 100,00
Repsol Exploracion Cendrawasih III BV Holland Repsol Exploración, S.A. Addition to scope due to incorporation Sep-10 F.C. 100,00 100,00
Repsol Exploracion Cendrawasih IV BV Holland Repsol Exploración, S.A. Addition to scope due to incorporation Sep-10 F.C. 100,00 100,00
Repsol ETBE, S.A. Portugal Repsol Polímeros,LDA Acquisition Sep-10 F.C. 100,00 100,00
Repsol Electricidade E Calor, Ace Portugal R.Polímeros/R.ETBE Increase of ownership percentage Sep-10 F.C. 100,00 100,00 E.M. 66,67 66,67
Repsol Louisiana Corporation USA Repsol USA Holdings Corp. Addition to scope due to incorporation Oct-10 F.C. 100,00 100,00
Repsol Brasil. B.V. Holland Repsol Brasil. B.V. Addition to scope due to incorporation Jun-10 P.I. 60,00 100,00
Repsol Biocarburantes Tarragona, S.A. Spain Repsol YPF, S.A. Change of parent company due to sale of R.Petróleo to Repsol YPF, S.A. Jul-10 F.C. 100,00 100,00 F.C. 99,97 100,00
Repsol Nuevas Energías, S.A. Spain Repsol YPF, S.A. Name change from Repsol Biocarburantes Tarragona to Repsol Nuevas Energìas, S.A. Jul-10 F.C. 100,00 100,00 F.C. 99,97 100,00
Orisol, Corporación Energética, S.A. Spain Repsol Nuevas Energías, S.A. Acquisition Nov-10 P.I. 46,81 46,81
Algaenergy, S.A. Spain Repsol Nuevas Energías, S.A. Acquisition Nov-10 P.I. 20,00 20,00
Bahía Bizkaia Gas, S.L. Spain Repsol YPF, S.A. Disposal Nov-10 - - - P.I. 25,00 25,00
YPF,S.A Argentina Repsol YPF, S.A. Reduction of ownership percentage Sep-10 to Dec-10 F.C. 79,81 79,81 F.C. 84,04 84,04
Adicor, S.A. Uruguay A-Evangelista, S.A. Withdrawal from scope due to liquidation Oct-10 - - - F.C. 84,04 100,00
Guará BV Holland Repsol Brasil. B.V. Addition to scope due to incorporation Dec-10 E.M. 15,00 25,00
Alberto Pasqualini Refap S.A. Brazil Repsol YPF Perú B.V. Disposal Dec-10 - - - P.I. 30,00 30,00
Repsol Brasil, S.A. (4) Brazil Repsol YPF, S.A. Reduction of ownership percentage Dec-10 P.I. 60,00 60,00 F.C. 100,00 100,00
Gas Natural Servicios Integrales S.A.S (1) Colombia Gas Natural Internacional, SDG, S.A. Addition to scope due to incorporation Mar-10 P.I. 30,13 100,00
Electrificadora del Caribe, S.A E.S.P. (1) Colombia Unión Fenosa Internacional, S.A. Increase of ownership percentage Mar-10 P.I. 25,73 85,40 P.I. 24,40 81,32
Madrileña Red de Gas, S.A (1) Spain Gas Natural SDG, S.A. Disposal Apr-10 P.I. 30,01 100,00
Madrileña Suministro Gas SUR, 2010, S.L (1) Spain Gas Natural SDG, S.A. Disposal Apr-10 P.I. 30,01 100,00
Madrileña Suministro Gas 2010, S.L (1) Spain Gas Natural SDG, S.A. Disposal Apr-10 P.I. 30,01 100,00
Madrileña Servicios Comunes, S.L (1) Spain Gas Natural SDG, S.A. Disposal Apr-10 P.I. 30,01 100,00
Central Anahuac, S.A de C.V (1) Mexico Gas Natural Internacional, SDG, S.A. Disposal May-10 P.I. 30,01 100,00
Central Lomas del Real, S.A de C.V (1) Mexico Gas Natural Internacional, SDG, S.A. Disposal May-10 P.I. 30,01 100,00
Central Vallehermoso, S.A de C.V (1) Mexico Gas Natural Internacional, SDG, S.A. Disposal May-10 P.I. 30,01 100,00
Central Saltillo, S.A de C.V (1) Mexico Gas Natural Internacional, SDG, S.A. Disposal May-10 P.I. 30,01 100,00
Electricidad Águila de Altamira, S.A de C.V (1) Mexico Gas Natural Internacional, SDG, S.A. Disposal May-10 P.I. 30,01 100,00
Gasoducto del Río, S.A de C.V (1) Mexico Gas Natural Internacional, SDG, S.A. Disposal May-10 P.I. 30,01 100,00
Compañía Méxicana de Gerencia y Operación, S.A de C.V (1) Mexico Gas Natural Internacional, SDG, S.A. Disposal May-10 P.I. 30,01 100,00
Gas Aragón, S.A Spain Gas Natural SDG, S.A. Disposal Dec-10 E.M. 10,50 35,00
Palencia 3, Investigación, Desarrollo y Explotación, S.L. Spain Gas Natural Exploración, S.L Addition to scope due to incorporation Jun-10 P.I. 11,15 37,00
Hispano Galaica de Extracciones, S.L (1) Spain Gas Natural SDG, S.A. Addition to scope due to incorporation Jun-10 P.I. 30,13 100,00
Energía Termosolar de los Monegros, S.L. Spain Enel Unión Fenosa Renovables SA Increase of ownership percentage Jul-10 P.I. 13,56 45,00 P.I. 12,00 40,00
Hotel de Naturaleza Tambre, S.A (1) Spain General de Edificios y Solares, S.L. Withdrawal from scope due to liquidation Jul-10 P.I. 30,01 100,00
M&D Generación 1, S.L.U (1) Spain Gas Natural SDG, S.A. Addition to scope due to incorporation Jul-10 P.I. 30,13 100,00
M&D Energy Market, S.L.U (1) Spain Gas Natural SDG, S.A. Addition to scope due to incorporation Jul-10 P.I. 30,13 100,00
Promociones Energéticas del Bierzo, S.L. Spain Enel Unión Fenosa Renovables SA Increase of ownership percentage Jul-10 P.I. 15,06 50,00 P.I. 7,53 25,00
Gas Natural del Cesar, S.A E.S.P, (Gasnacer) (1) Colombia Gas Natural del Oriente, S.A. ESP / GN S.A E.SP. Addition to scope due to incorporation Sep-10 P.I. 18,68 62,00
Cilento Reti Gas SRL Italy Gas Natural Distribuzione S.p.A. Addition to scope due to incorporation Oct-10 P.I. 18,08 60,00
Limeisa International Coal B.V. (1) The Netherlands Gas Natural SDG, S.A. Withdrawal from scope due to liquidation Oct-10 P.I. 30,01 100,00
Portal del Instalador, S.A.(1) Spain Gas Natural Informática S.A. Withdrawal from scope due to liquidation Nov-10 P.I. 25,51 85,00
Bis Distribución Gas, S.A (1) Spain Gas Natural SDG, S.A. Addition to scope due to incorporation Dec-10 P.I. 30,13 100,00
Bis Suministro de Gas, S.L (1) Spain Gas Natural SDG, S.A. Addition to scope due to incorporation Dec-10 P.I. 30,13 100,00
Bis Suministro de Gas SUR, S.L (1) Spain Gas Natural SDG, S.A. Addition to scope due to incorporation Dec-10 P.I. 30,13 100,00
Bluemobility Systems, S.L. Spain Gas Natural Servicios SDG, S.A. Addition to scope due to incorporation Dec-10 E.M. 6,03 20,00
Molinos de Valdebezana, S.A. (1) Spain Gas Natural Renovables, S.L. Increase of ownership percentage Dec-10 P.I. 30,13 100,00 P.I. 17,92 59,70
Unión Fenosa Distribución Colombia, BV (1) Holland Unión Fenosa Internacional, S.A. Withdrawal from scope due to liquidation Dec-10 P.I. 30,01 100,00
Electrocosta Mypymes de Energía, S.A ESP (Colombia) (1) Colombia Electrificadora del Caribe, S.A., E.S.P. Withdrawal from scope due to liquidation Dec-10 P.I. 24,41 81,33
UTE GNS-Dalkia Energia y Servicios Spain Gas Natural Servicios SDG, S.A. Withdrawal from scope due to liquidation Dec-10 P.I. 15,01 50,00
(1) Data corresponding to this company has been incorporated via full consolidation into the Parent Company. The Parent Company is integrated proportionally into the Repsol YPF Group.
(2) Consolidation Method:
F.C. Full consolidation
P.I. Proportionate Integration
E.M. Equity Method
(3) Percentage corresponding to the Parent Company's ownership in the subsidiairy.(4) This company changed its name in february 2011 to Repsol Sinopec Brazil, S.A.
12.31.10 01.01.10% of Total Ownership % of Total Ownership
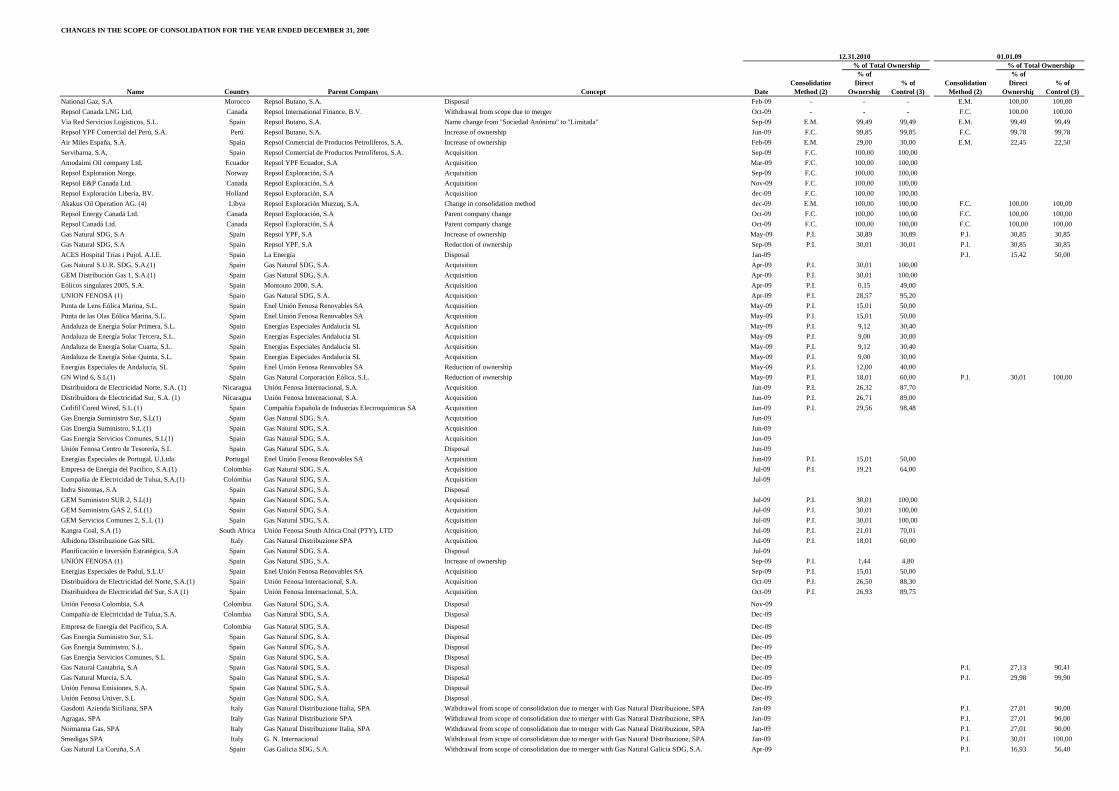
CHANGES IN THE SCOPE OF CONSOLIDATION FOR THE YEAR ENDED DECEMBER 31, 2009
% of % ofConsolidation Direct % of Consolidation Direct % of
Name Country Parent Company Concept Date Method (2) Ownership Control (3) Method (2) Ownership Control (3)
National Gaz, S.A Morocco Repsol Butano, S.A. Disposal Feb-09 - - - E.M. 100,00 100,00
Repsol Canada LNG Ltd, Canada Repsol International Finance, B.V. Withdrawal from scope due to merger Oct-09 - - - F.C. 100,00 100,00
Via Red Servicios Logísticos, S.L. Spain Repsol Butano, S.A. Name change from ''Sociedad Anónima'' to ''Limitada'' Sep-09 E.M. 99,49 99,49 E.M. 99,49 99,49
Repsol YPF Comercial del Perú, S.A. Perú Repsol Butano, S.A. Increase of ownership Jun-09 F.C. 99,85 99,85 F.C. 99,78 99,78
Air Miles España, S.A. Spain Repsol Comercial de Productos Petrolíferos, S.A. Increase of ownership Feb-09 E.M. 29,00 30,00 E.M. 22,45 22,50
Servibarna, S.A, Spain Repsol Comercial de Productos Petrolíferos, S.A. Acquisition Sep-09 F.C. 100,00 100,00
Amodaimi Oil company Ltd. Ecuador Repsol YPF Ecuador, S.A Acquisition Mar-09 F.C. 100,00 100,00
Repsol Exploration Norge. Norway Repsol Exploración, S.A Acquisition Sep-09 F.C. 100,00 100,00
Repsol E&P Canada Ltd. Canada Repsol Exploración, S.A Acquisition Nov-09 F.C. 100,00 100,00
Repsol Exploración Liberia, BV. Holland Repsol Exploración, S.A Acquisition dec-09 F.C. 100,00 100,00
Akakus Oil Operation AG. (4) Libya Repsol Exploración Murzuq, S.A. Change in consolidation method dec-09 E.M. 100,00 100,00 F.C. 100,00 100,00
Repsol Energy Canadá Ltd. Canada Repsol Exploración, S.A Parent company change Oct-09 F.C. 100,00 100,00 F.C. 100,00 100,00
Repsol Canadá Ltd. Canada Repsol Exploración, S.A Parent company change Oct-09 F.C. 100,00 100,00 F.C. 100,00 100,00
Gas Natural SDG, S.A Spain Repsol YPF, S.A Increase of ownership May-09 P.I. 30,89 30,89 P.I. 30,85 30,85
Gas Natural SDG, S.A Spain Repsol YPF, S.A Reduction of ownership Sep-09 P.I. 30,01 30,01 P.I. 30,85 30,85
ACES Hospital Trías i Pujol, A.I.E. Spain La Energía Disposal Jan-09 P.I. 15,42 50,00
Gas Natural S.U.R. SDG, S.A.(1) Spain Gas Natural SDG, S.A. Acquisition Apr-09 P.I. 30,01 100,00
GEM Distribución Gas 1, S.A.(1) Spain Gas Natural SDG, S.A. Acquisition Apr-09 P.I. 30,01 100,00
Eólicos singulares 2005, S.A. Spain Montouto 2000, S.A. Acquisition Apr-09 P.I. 0,15 49,00
UNION FENOSA (1) Spain Gas Natural SDG, S.A. Acquisition Apr-09 P.I. 28,57 95,20
Punta de Lens Eólica Marina, S.L. Spain Enel Unión Fenosa Renovables SA Acquisition May-09 P.I. 15,01 50,00
Punta de las Olas Eólica Marina, S.L. Spain Enel Unión Fenosa Renovables SA Acquisition May-09 P.I. 15,01 50,00
Andaluza de Energía Solar Primera, S.L. Spain Energías Especiales Andalucía SL Acquisition May-09 P.I. 9,12 30,40
Andaluza de Energía Solar Tercera, S.L. Spain Energías Especiales Andalucía SL Acquisition May-09 P.I. 9,00 30,00
Andaluza de Energía Solar Cuarta, S.L. Spain Energías Especiales Andalucía SL Acquisition May-09 P.I. 9,12 30,40
Andaluza de Energía Solar Quinta, S.L. Spain Energías Especiales Andalucía SL Acquisition May-09 P.I. 9,00 30,00
Energías Especiales de Andalucía, SL Spain Enel Unión Fenosa Renovables SA Reduction of ownership May-09 P.I. 12,00 40,00
GN Wind 6, S.L(1) Spain Gas Natural Corporación Eólica, S.L. Reduction of ownership May-09 P.I. 18,01 60,00 P.I. 30,01 100,00
Distribuidora de Electricidad Norte, S.A. (1) Nicaragua Unión Fenosa Internacional, S.A. Acquisition Jun-09 P.I. 26,32 87,70
Distribuidora de Electricidad Sur, S.A. (1) Nicaragua Unión Fenosa Internacional, S.A. Acquisition Jun-09 P.I. 26,71 89,00
Cedifil Cored Wired, S.L.(1) Spain Compañía Española de Industrias Electroquímicas SA Acquisition Jun-09 P.I. 29,56 98,48
Gas Energía Suministro Sur, S.L(1) Spain Gas Natural SDG, S.A. Acquisition Jun-09
Gas Energía Suministro, S.L.(1) Spain Gas Natural SDG, S.A. Acquisition Jun-09
Gas Energía Servicios Comunes, S.L(1) Spain Gas Natural SDG, S.A. Acquisition Jun-09
Unión Fenosa Centro de Tesorería, S.L Spain Gas Natural SDG, S.A. Disposal Jun-09
Energías Especiales de Portugal, U,Ltda. Portugal Enel Unión Fenosa Renovables SA Acquisition Jun-09 P.I. 15,01 50,00
Empresa de Energía del Pacífico, S.A.(1) Colombia Gas Natural SDG, S.A. Acquisition Jul-09 P.I. 19,21 64,00
Compañía de Electricidad de Tulua, S.A.(1) Colombia Gas Natural SDG, S.A. Acquisition Jul-09
Indra Sistemas, S.A Spain Gas Natural SDG, S.A. Disposal
GEM Suministro SUR 2, S.L(1) Spain Gas Natural SDG, S.A. Acquisition Jul-09 P.I. 30,01 100,00
GEM Suministro GAS 2, S.L(1) Spain Gas Natural SDG, S.A. Acquisition Jul-09 P.I. 30,01 100,00
GEM Servicios Comunes 2, S..L (1) Spain Gas Natural SDG, S.A. Acquisition Jul-09 P.I. 30,01 100,00
Kangra Coal, S.A (1) South Africa Unión Fenosa South Africa Coal (PTY), LTD Acquisition Jul-09 P.I. 21,01 70,01
Albidona Distribuzione Gas SRL Italy Gas Natural Distribuzione SPA Acquisition Jul-09 P.I. 18,01 60,00
Planificación e Inversión Estratégica, S.A Spain Gas Natural SDG, S.A. Disposal Jul-09
UNIÓN FENOSA (1) Spain Gas Natural SDG, S.A. Increase of ownership Sep-09 P.I. 1,44 4,80
Energías Especiales de Padul, S.L.U Spain Enel Unión Fenosa Renovables SA Acquisition Sep-09 P.I. 15,01 50,00
Distribuidora de Electricidad del Norte, S.A.(1) Spain Unión Fenosa Internacional, S.A. Acquisition Oct-09 P.I. 26,50 88,30
Distribuidora de Electricidad del Sur, S.A (1) Spain Unión Fenosa Internacional, S.A. Acquisition Oct-09 P.I. 26,93 89,75
Unión Fenosa Colombia, S.A Colombia Gas Natural SDG, S.A. Disposal Nov-09
Compañía de Electricidad de Tulua, S.A. Colombia Gas Natural SDG, S.A. Disposal Dec-09
Empresa de Energía del Pacífico, S.A. Colombia Gas Natural SDG, S.A. Disposal Dec-09
Gas Energía Suministro Sur, S.L Spain Gas Natural SDG, S.A. Disposal Dec-09
Gas Energía Suministro, S.L. Spain Gas Natural SDG, S.A. Disposal Dec-09
Gas Energía Servicios Comunes, S.L Spain Gas Natural SDG, S.A. Disposal Dec-09
Gas Natural Cantabria, S.A Spain Gas Natural SDG, S.A. Disposal Dec-09 P.I. 27,13 90,41
Gas Natural Murcia, S.A. Spain Gas Natural SDG, S.A. Disposal Dec-09 P.I. 29,98 99,90
Unión Fenosa Emisiones, S.A. Spain Gas Natural SDG, S.A. Disposal Dec-09
Unión Fenosa Univer, S.L Spain Gas Natural SDG, S.A. Disposal Dec-09
Gasdotti Azienda Siciliana, SPA Italy Gas Natural Distribuzione Italia, SPA Withdrawal from scope of consolidation due to merger with Gas Natural Distribuzione, SPA Jan-09 P.I. 27,01 90,00
Agragas, SPA Italy Gas Natural Distribuzione SPA Withdrawal from scope of consolidation due to merger with Gas Natural Distribuzione, SPA Jan-09 P.I. 27,01 90,00
Normanna Gas, SPA Italy Gas Natural Distribuzione Italia, SPA Withdrawal from scope of consolidation due to merger with Gas Natural Distribuzione, SPA Jan-09 P.I. 27,01 90,00
Smedigas SPA Italy G. N. Internacional Withdrawal from scope of consolidation due to merger with Gas Natural Distribuzione, SPA Jan-09 P.I. 30,01 100,00
Gas Natural La Coruña, S.A Spain Gas Galicia SDG, S.A. Withdrawal from scope of consolidation due to merger with Gas Natural Galicia SDG, S.A. Apr-09 P.I. 16,93 56,40
12.31.2010 01.01.09% of Total Ownership % of Total Ownership
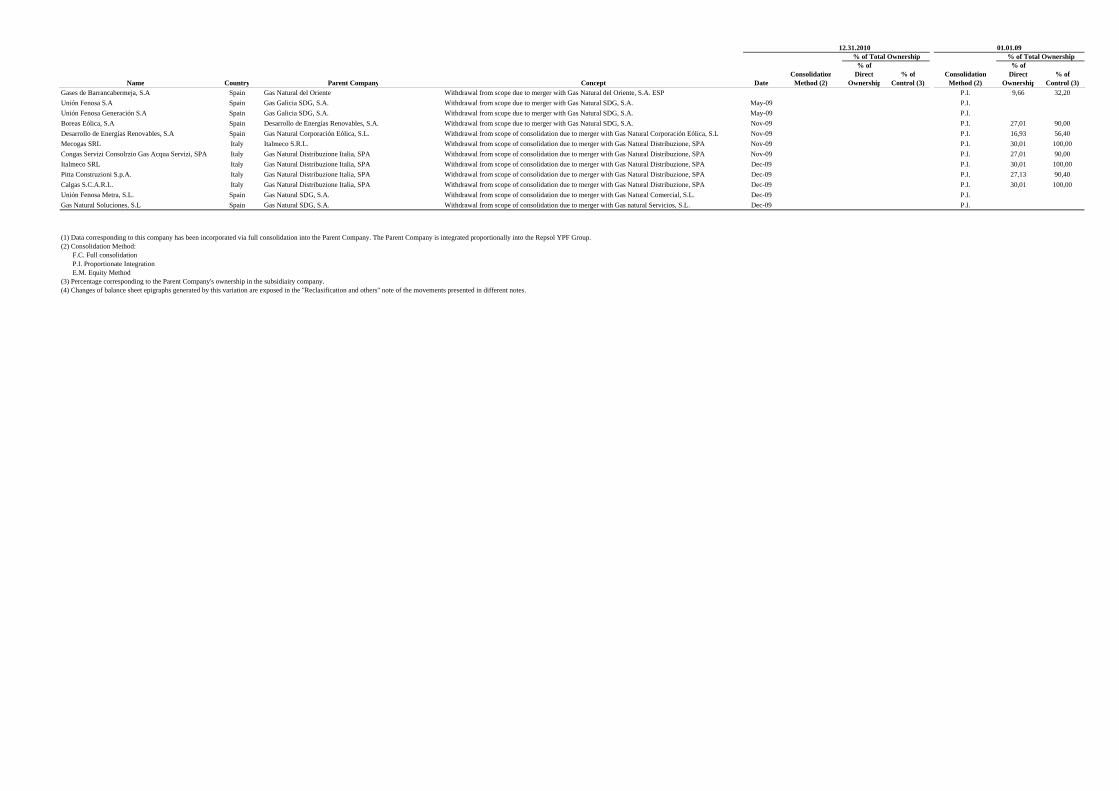
% of % ofConsolidation Direct % of Consolidation Direct % of
Name Country Parent Company Concept Date Method (2) Ownership Control (3) Method (2) Ownership Control (3)
12.31.2010 01.01.09% of Total Ownership % of Total Ownership
Gases de Barrancabermeja, S.A Spain Gas Natural del Oriente Withdrawal from scope due to merger with Gas Natural del Oriente, S.A. ESP P.I. 9,66 32,20
Unión Fenosa S.A Spain Gas Galicia SDG, S.A. Withdrawal from scope due to merger with Gas Natural SDG, S.A. May-09 P.I.
Unión Fenosa Generación S.A Spain Gas Galicia SDG, S.A. Withdrawal from scope due to merger with Gas Natural SDG, S.A. May-09 P.I.
Boreas Eólica, S.A Spain Desarrollo de Energías Renovables, S.A. Withdrawal from scope due to merger with Gas Natural SDG, S.A. Nov-09 P.I. 27,01 90,00
Desarrollo de Energías Renovables, S.A Spain Gas Natural Corporación Eólica, S.L. Withdrawal from scope of consolidation due to merger with Gas Natural Corporación Eólica, S.L Nov-09 P.I. 16,93 56,40
Mecogas SRL Italy Italmeco S.R.L. Withdrawal from scope of consolidation due to merger with Gas Natural Distribuzione, SPA Nov-09 P.I. 30,01 100,00
Congas Servizi Consolrzio Gas Acqua Servizi, SPA Italy Gas Natural Distribuzione Italia, SPA Withdrawal from scope of consolidation due to merger with Gas Natural Distribuzione, SPA Nov-09 P.I. 27,01 90,00
Italmeco SRL Italy Gas Natural Distribuzione Italia, SPA Withdrawal from scope of consolidation due to merger with Gas Natural Distribuzione, SPA Dec-09 P.I. 30,01 100,00
Pitta Construzioni S.p.A. Italy Gas Natural Distribuzione Italia, SPA Withdrawal from scope of consolidation due to merger with Gas Natural Distribuzione, SPA Dec-09 P.I. 27,13 90,40
Calgas S.C.A.R.L. Italy Gas Natural Distribuzione Italia, SPA Withdrawal from scope of consolidation due to merger with Gas Natural Distribuzione, SPA Dec-09 P.I. 30,01 100,00
Unión Fenosa Metra, S.L. Spain Gas Natural SDG, S.A. Withdrawal from scope of consolidation due to merger with Gas Natural Comercial, S.L. Dec-09 P.I.
Gas Natural Soluciones, S.L Spain Gas Natural SDG, S.A. Withdrawal from scope of consolidation due to merger with Gas natural Servicios, S.L. Dec-09 P.I.
(1) Data corresponding to this company has been incorporated via full consolidation into the Parent Company. The Parent Company is integrated proportionally into the Repsol YPF Group.(2) Consolidation Method:
F.C. Full consolidationP.I. Proportionate IntegrationE.M. Equity Method
(3) Percentage corresponding to the Parent Company's ownership in the subsidiairy company.(4) Changes of balance sheet epigraphs generated by this variation are exposed in the ''Reclasification and others'' note of the movements presented in different notes.
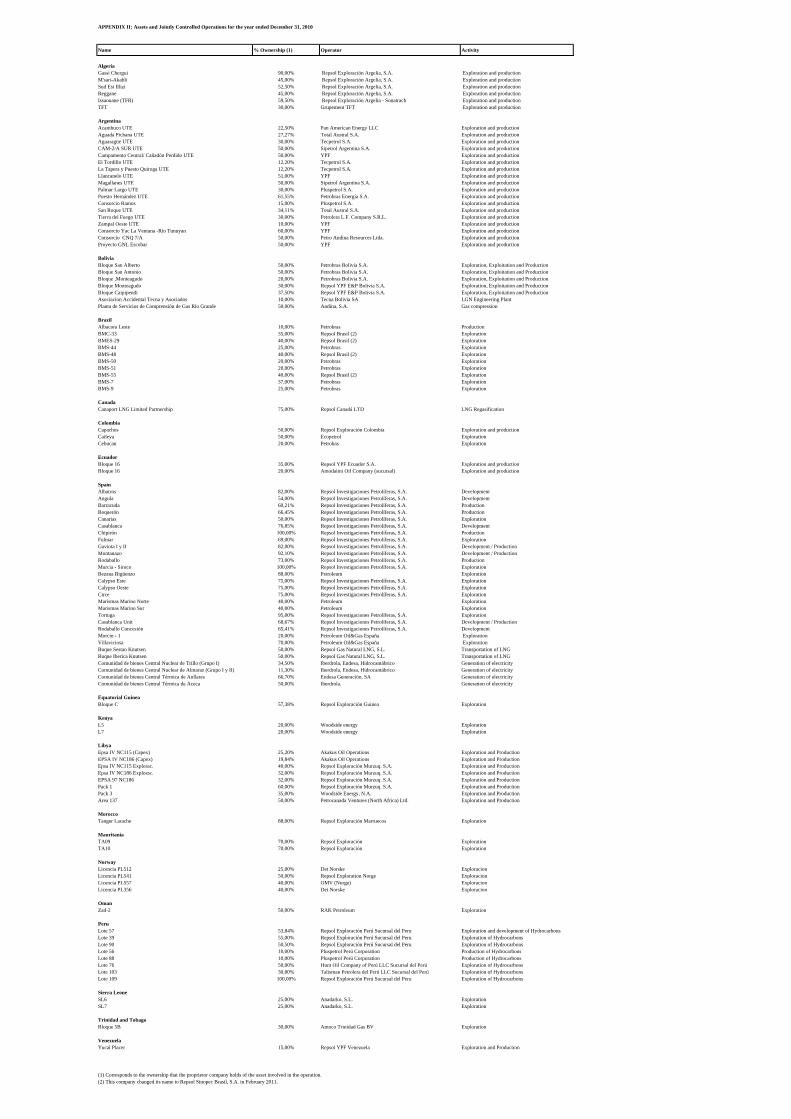
APPENDIX II: Assets and Jointly Controlled Operations for the year ended December 31, 2010
Name % Ownership (1) Operator Activity
AlgeriaGassi Chergui 90,00% Repsol Exploración Argelia, S.A. Exploration and productionM'sari-Akabli 45,00% Repsol Exploración Argelia, S.A. Exploration and productionSud Est Illizi 52,50% Repsol Exploración Argelia, S.A. Exploration and productionReggane 45,00% Repsol Exploración Argelia, S.A. Exploration and productionIssaouane (TFR) 59,50% Repsol Exploración Argelia - Sonatrach Exploration and productionTFT 30,00% Grupement TFT Exploration and production
ArgentinaAcambuco UTE 22,50% Pan American Energy LLC Exploration and productionAguada Pichana UTE 27,27% Total Austral S.A. Exploration and productionAguaragüe UTE 30,00% Tecpetrol S.A. Exploration and productionCAM-2/A SUR UTE 50,00% Sipetrol Argentina S.A. Exploration and productionCampamento Central/ Cañadón Perdido UTE 50,00% YPF Exploration and productionEl Tordillo UTE 12,20% Tecpetrol S.A. Exploration and productionLa Tapera y Puesto Quiroga UTE 12,20% Tecpetrol S.A. Exploration and productionLlancanelo UTE 51,00% YPF Exploration and productionMagallanes UTE 50,00% Sipetrol Argentina S.A. Exploration and productionPalmar Largo UTE 30,00% Pluspetrol S.A. Exploration and productionPuesto Hernández UTE 61,55% Petrobras Energía S.A. Exploration and productionConsorcio Ramos 15,00% Pluspetrol S.A. Exploration and productionSan Roque UTE 34,11% Total Austral S.A. Exploration and productionTierra del Fuego UTE 30,00% Petrolera L.F. Company S.R.L. Exploration and productionZampal Oeste UTE 10,00% YPF Exploration and productionConsorcio Yac La Ventana -Río Tunuyan 60,00% YPF Exploration and productionConsorcio CNQ 7/A 50,00% Petro Andina Resources Ltda. Exploration and productionProyecto GNL Escobar 50,00% YPF Exploration and production
BoliviaBloque San Alberto 50,00% Petrobras Bolivia S.A. Exploration, Exploitation and ProductionBloque San Antonio 50,00% Petrobras Bolivia S.A. Exploration, Exploitation and ProductionBloque ,Monteagudo 20,00% Petrobras Bolivia S.A. Exploration, Exploitation and ProductionBloque Monteagudo 30,00% Repsol YPF E&P Bolivia S.A. Exploration, Exploitation and ProductionBloque Caipipendi 37,50% Repsol YPF E&P Bolivia S.A. Exploration, Exploitation and ProductionAsociacion Accidental Tecna y Asociados 10,00% Tecna Bolivia SA LGN Engineering PlantPlanta de Servicios de Comprensión de Gas Río Grande 50,00% Andina, S.A. Gas compression
BrazilAlbacora Leste 10,00% Petrobras ProductionBMC-33 35,00% Repsol Brasil (2) ExplorationBMES-29 40,00% Repsol Brasil (2) ExplorationBMS-44 25,00% Petrobras ExplorationBMS-48 40,00% Repsol Brasil (2) ExplorationBMS-50 20,00% Petrobras ExplorationBMS-51 20,00% Petrobras ExplorationBMS-55 40,00% Repsol Brasil (2) ExplorationBMS-7 37,00% Petrobras ExplorationBMS-9 25,00% Petrobras Exploration
CanadaCanaport LNG Limited Partnership 75,00% Repsol Canadá LTD LNG Regasification
ColombiaCapachos 50,00% Repsol Exploración Colombia Exploration and productionCatleya 50,00% Ecopetrol ExplorationCebucan 20,00% Petrobas Exploration
EcuadorBloque 16 35,00% Repsol YPF Ecuador S.A. Exploration and productionBloque 16 20,00% Amodaimi Oil Company (sucursal) Exploration and production
SpainAlbatros 82,00% Repsol Investigaciones Petrolíferas, S.A. DevelopmentAngula 54,00% Repsol Investigaciones Petrolíferas, S.A. DevelopmentBarracuda 60,21% Repsol Investigaciones Petrolíferas, S.A. ProductionBoquerón 66,45% Repsol Investigaciones Petrolíferas, S.A. ProductionCanarias 50,00% Repsol Investigaciones Petrolíferas, S.A. ExplorationCasablanca 76,85% Repsol Investigaciones Petrolíferas, S.A. DevelopmentChipirón 100,00% Repsol Investigaciones Petrolíferas, S.A. ProductionFulmar 69,00% Repsol Investigaciones Petrolíferas, S.A. ExplorationGaviota I y II 82,00% Repsol Investigaciones Petrolíferas, S.A. Development / ProductionMontanazo 92,10% Repsol Investigaciones Petrolíferas, S.A. Development / ProductionRodaballo 73,00% Repsol Investigaciones Petrolíferas, S.A. ProductionMurcia - Siroco 100,00% Repsol Investigaciones Petrolíferas, S.A. ExplorationBezana Bigúenzo 88,00% Petroleum ExplorationCalypso Este 75,00% Repsol Investigaciones Petrolíferas, S.A. ExplorationCalypso Oeste 75,00% Repsol Investigaciones Petrolíferas, S.A. ExplorationCirce 75,00% Repsol Investigaciones Petrolíferas, S.A. ExplorationMarismas Marino Norte 40,00% Petroleum ExplorationMarismas Marino Sur 40,00% Petroleum ExplorationTortuga 95,00% Repsol Investigaciones Petrolíferas, S.A. ExplorationCasablanca Unit 68,67% Repsol Investigaciones Petrolíferas, S.A. Development / ProductionRodaballo Concesión 65,41% Repsol Investigaciones Petrolíferas, S.A. DevelopmentMorcín - 1 20,00% Petroleum Oil&Gas España ExplorationVillaviciosa 70,00% Petroleum Oil&Gas España ExplorationBuque Sestao Knutsen 50,00% Repsol Gas Natural LNG, S.L. Transportation of LNGBuque Iberica Knutsen 50,00% Repsol Gas Natural LNG, S.L. Transportation of LNGComunidad de bienes Central Nuclear de Trillo (Grupo I) 34,50% Iberdrola, Endesa, Hidrocantábrico Generation of electricityComunidad de bienes Central Nuclear de Almaraz (Grupo I y II) 11,30% Iberdrola, Endesa, Hidrocantábrico Generation of electricityComunidad de bienes Central Térmica de Anllares 66,70% Endesa Generación, SA Generation of electricityComunidad de bienes Central Térmica de Aceca 50,00% Iberdrola. Generation of electricity
Equatorial GuineaBloque C 57,38% Repsol Exploración Guinea Exploration
KenyaL5 20,00% Woodside energy ExplorationL7 20,00% Woodside energy Exploration
LibyaEpsa IV NC115 (Capex) 25,20% Akakus Oil Operations Exploration and ProductionEPSA IV NC186 (Capex) 19,84% Akakus Oil Operations Exploration and ProductionEpsa IV NC115 Explorac. 40,00% Repsol Exploración Murzuq. S.A. Exploration and ProductionEpsa IV NC186 Explorac. 32,00% Repsol Exploración Murzuq. S.A. Exploration and ProductionEPSA 97 NC186 32,00% Repsol Exploración Murzuq. S.A. Exploration and ProductionPack 1 60,00% Repsol Exploración Murzuq. S.A. Exploration and ProductionPack 3 35,00% Woodside Energy, N.A. Exploration and ProductionArea 137 50,00% Petrocanada Ventures (North Africa) Ltd. Exploration and Production
MoroccoTanger Larache 88,00% Repsol Exploración Marruecos Exploration
MauritaniaTA09 70,00% Repsol Exploración ExplorationTA10 70,00% Repsol Exploración Exploration
NorwayLicencia PL512 25,00% Det Norske ExploracionLicencia PL541 50,00% Repsol Exploration Norge ExploracionLicencia PL557 40,00% OMV (Norge) ExploracionLicencia PL356 40,00% Det Norske Exploracion
OmanZad-2 50,00% RAK Petroleum Exploration
PeruLote 57 53,84% Repsol Exploración Perú Sucursal del Peru Exploration and development of HydrocarbonsLote 39 55,00% Repsol Exploración Perú Sucursal del Peru Exploration of HydrocarbonsLote 90 50,50% Repsol Exploración Perú Sucursal del Peru Exploration of HydrocarbonsLote 56 10,00% Pluspetrol Perú Corporation Production of HydrocarbonsLote 88 10,00% Pluspetrol Perú Corporation Production of HydrocarbonsLote 76 50,00% Hunt Oil Company of Perú LLC Sucursal del Perú Exploration of HydrocarbonsLote 103 30,00% Talisman Petrolera del Perú LLC Sucursal del Perú Exploration of HydrocarbonsLote 109 100,00% Repsol Exploración Perú Sucursal del Peru Exploration of Hydrocarbons
Sierra LeoneSL6 25,00% Anadarko, S.L. ExplorationSL7 25,00% Anadarko, S.L. Exploration
Trinidad and TobagoBloque 5B 30,00% Amoco Trinidad Gas BV Exploration
VenezuelaYucal Placer 15,00% Repsol YPF Venezuela Exploration and Production
(1) Corresponds to the ownership that the proprietor company holds of the asset involved in the operation.(2) This company changed its name to Repsol Sinopec Brasil, S.A. in February 2011.
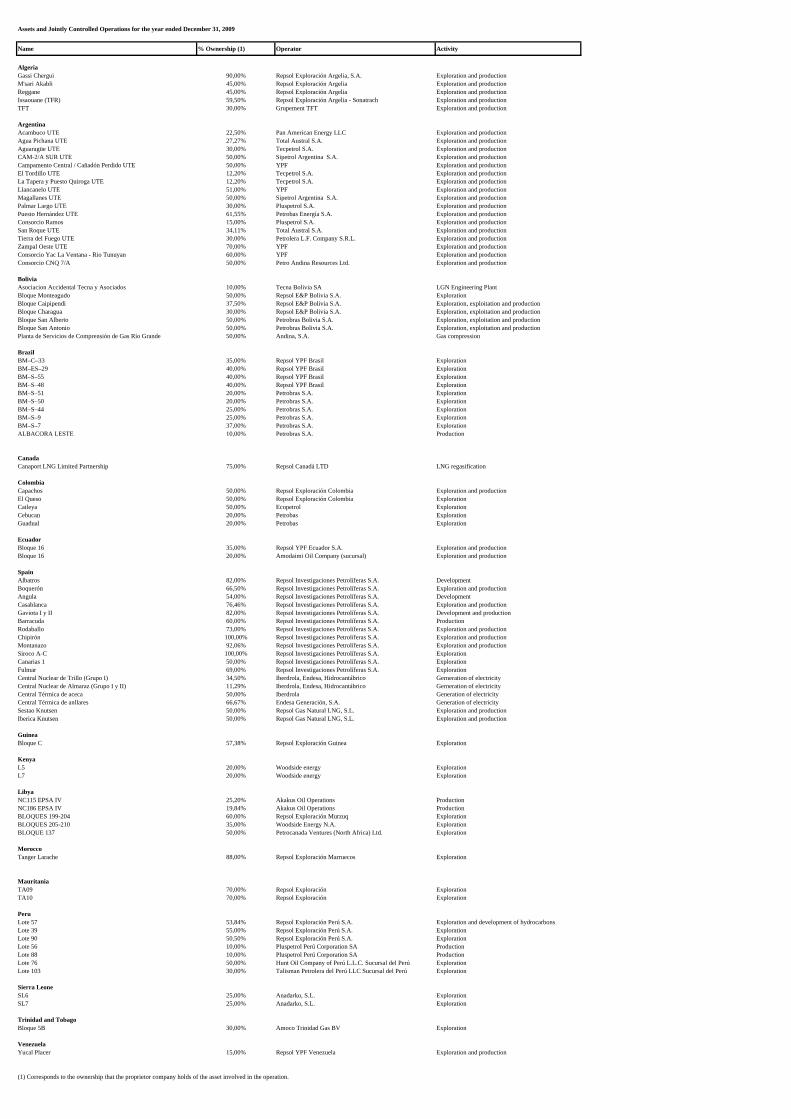
Assets and Jointly Controlled Operations for the year ended December 31, 2009
Name % Ownership (1) Operator Activity
AlgeriaGassi Chergui 90,00% Repsol Exploración Argelia, S.A. Exploration and productionM'sari Akabli 45,00% Repsol Exploración Argelia Exploration and productionReggane 45,00% Repsol Exploración Argelia Exploration and productionIssaouane (TFR) 59,50% Repsol Exploración Argelia - Sonatrach Exploration and productionTFT 30,00% Grupement TFT Exploration and production
ArgentinaAcambuco UTE 22,50% Pan American Energy LLC Exploration and productionAgua Pichana UTE 27,27% Total Austral S.A. Exploration and productionAguaragüe UTE 30,00% Tecpetrol S.A. Exploration and productionCAM-2/A SUR UTE 50,00% Sipetrol Argentina S.A. Exploration and productionCampamento Central / Cañadón Perdido UTE 50,00% YPF Exploration and productionEl Tordillo UTE 12,20% Tecpetrol S.A. Exploration and productionLa Tapera y Puesto Quiroga UTE 12,20% Tecpetrol S.A. Exploration and productionLlancanelo UTE 51,00% YPF Exploration and productionMagallanes UTE 50,00% Sipetrol Argentina S.A. Exploration and productionPalmar Largo UTE 30,00% Pluspetrol S.A. Exploration and productionPuesto Hernández UTE 61,55% Petrobas Energía S.A. Exploration and productionConsorcio Ramos 15,00% Pluspetrol S.A. Exploration and productionSan Roque UTE 34,11% Total Austral S.A. Exploration and productionTierra del Fuego UTE 30,00% Petrolera L.F. Company S.R.L. Exploration and productionZampal Oeste UTE 70,00% YPF Exploration and productionConsorcio Yac La Ventana - Rio Tunuyan 60,00% YPF Exploration and productionConsorcio CNQ 7/A 50,00% Petro Andina Resources Ltd. Exploration and production
BoliviaAsociacion Accidental Tecna y Asociados 10,00% Tecna Bolivia SA LGN Engineering PlantBloque Monteagudo 50,00% Repsol E&P Bolivia S.A. ExplorationBloque Caipipendi 37,50% Repsol E&P Bolivia S.A. Exploration, exploitation and productionBloque Charagua 30,00% Repsol E&P Bolivia S.A. Exploration, exploitation and productionBloque San Alberto 50,00% Petrobras Bolivia S.A. Exploration, exploitation and productionBloque San Antonio 50,00% Petrobras Bolivia S.A. Exploration, exploitation and productionPlanta de Servicios de Comprensión de Gas Río Grande 50,00% Andina, S.A. Gas compression
BrazilBM–C–33 35,00% Repsol YPF Brasil ExplorationBM–ES–29 40,00% Repsol YPF Brasil ExplorationBM–S–55 40,00% Repsol YPF Brasil ExplorationBM–S–48 40,00% Repsol YPF Brasil ExplorationBM–S–51 20,00% Petrobras S.A. ExplorationBM–S–50 20,00% Petrobras S.A. ExplorationBM–S–44 25,00% Petrobras S.A. ExplorationBM–S–9 25,00% Petrobras S.A. ExplorationBM–S–7 37,00% Petrobras S.A. ExplorationALBACORA LESTE 10,00% Petrobras S.A. Production
CanadaCanaport LNG Limited Partnership 75,00% Repsol Canadá LTD LNG regasification
ColombiaCapachos 50,00% Repsol Exploración Colombia Exploration and productionEl Queso 50,00% Repsol Exploración Colombia ExplorationCatleya 50,00% Ecopetrol ExplorationCebucan 20,00% Petrobas ExplorationGuadual 20,00% Petrobas Exploration
EcuadorBloque 16 35,00% Repsol YPF Ecuador S.A. Exploration and productionBloque 16 20,00% Amodaimi Oil Company (sucursal) Exploration and production
SpainAlbatros 82,00% Repsol Investigaciones Petrolíferas S.A. DevelopmentBoquerón 66,50% Repsol Investigaciones Petrolíferas S.A. Exploration and productionAngula 54,00% Repsol Investigaciones Petrolíferas S.A. DevelopmentCasablanca 76,46% Repsol Investigaciones Petrolíferas S.A. Exploration and productionGaviota I y II 82,00% Repsol Investigaciones Petrolíferas S.A. Development and productionBarracuda 60,00% Repsol Investigaciones Petrolíferas S.A. ProductionRodaballo 73,00% Repsol Investigaciones Petrolíferas S.A. Exploration and productionChipirón 100,00% Repsol Investigaciones Petrolíferas S.A. Exploration and productionMontanazo 92,06% Repsol Investigaciones Petrolíferas S.A. Exploration and productionSiroco A-C 100,00% Repsol Investigaciones Petrolíferas S.A. ExplorationCanarias 1 50,00% Repsol Investigaciones Petrolíferas S.A. ExplorationFulmar 69,00% Repsol Investigaciones Petrolíferas S.A. ExplorationCentral Nuclear de Trillo (Grupo I) 34,50% Iberdrola, Endesa, Hidrocantábrico Gerneration of electricityCentral Nuclear de Almaraz (Grupo I y II) 11,29% Iberdrola, Endesa, Hidrocantábrico Gerneration of electricityCentral Térmica de aceca 50,00% Iberdrola Generation of electricityCentral Térmica de anllares 66,67% Endesa Generación, S.A. Generation of electricitySestao Knutsen 50,00% Repsol Gas Natural LNG, S.L. Exploration and productionIberica Knutsen 50,00% Repsol Gas Natural LNG, S.L. Exploration and production
GuineaBloque C 57,38% Repsol Exploración Guinea Exploration
KenyaL5 20,00% Woodside energy ExplorationL7 20,00% Woodside energy Exploration
LibyaNC115 EPSA IV 25,20% Akakus Oil Operations ProductionNC186 EPSA IV 19,84% Akakus Oil Operations ProductionBLOQUES 199-204 60,00% Repsol Exploración Murzuq ExplorationBLOQUES 205-210 35,00% Woodside Energy N.A. ExplorationBLOQUE 137 50,00% Petrocanada Ventures (North Africa) Ltd. Exploration
MoroccoTanger Larache 88,00% Repsol Exploración Marruecos Exploration
MauritaniaTA09 70,00% Repsol Exploración ExplorationTA10 70,00% Repsol Exploración Exploration
PeruLote 57 53,84% Repsol Exploración Perú S.A. Exploration and development of hydrocarbonsLote 39 55,00% Repsol Exploración Perú S.A. ExplorationLote 90 50,50% Repsol Exploración Perú S.A. ExplorationLote 56 10,00% Pluspetrol Perú Corporation SA ProductionLote 88 10,00% Pluspetrol Perú Corporation SA ProductionLote 76 50,00% Hunt Oil Company of Perú L.L.C. Sucursal del Perú ExplorationLote 103 30,00% Talisman Petrolera del Perú LLC Sucursal del Perú Exploration
Sierra LeoneSL6 25,00% Anadarko, S.L. ExplorationSL7 25,00% Anadarko, S.L. Exploration
Trinidad and TobagoBloque 5B 30,00% Amoco Trinidad Gas BV Exploration
VenezuelaYucal Placer 15,00% Repsol YPF Venezuela Exploration and production
(1) Corresponds to the ownership that the proprietor company holds of the asset involved in the operation.
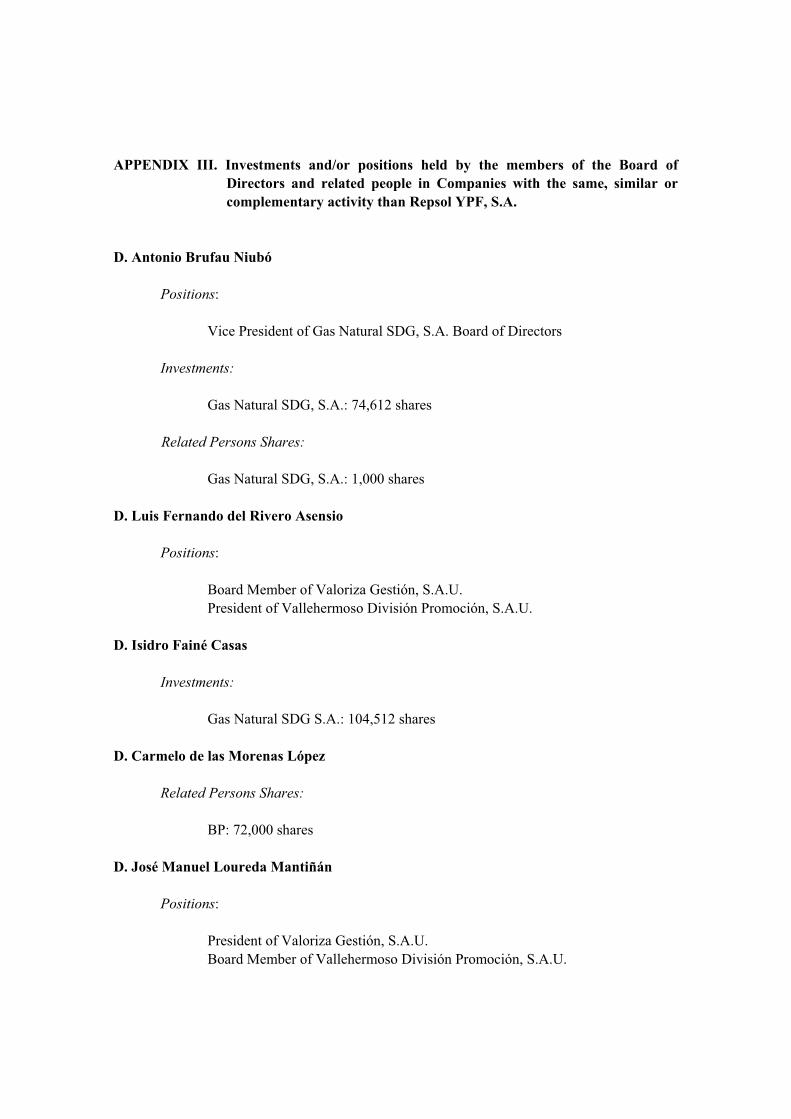
APPENDIX III. Investments and/or positions held by the members of the Board of Directors and related people in Companies with the same, similar or complementary activity than Repsol YPF, S.A.
D. Antonio Brufau Niubó
Positions:
Vice President of Gas Natural SDG, S.A. Board of Directors
Investments:
Gas Natural SDG, S.A.: 74,612 shares
Related Persons Shares:
Gas Natural SDG, S.A.: 1,000 shares
D. Luis Fernando del Rivero Asensio
Positions:
Board Member of Valoriza Gestión, S.A.U. President of Vallehermoso División Promoción, S.A.U.
D. Isidro Fainé Casas
Investments:
Gas Natural SDG S.A.: 104,512 shares
D. Carmelo de las Morenas López
Related Persons Shares:
BP: 72,000 shares
D. José Manuel Loureda Mantiñán
Positions:
President of Valoriza Gestión, S.A.U. Board Member of Vallehermoso División Promoción, S.A.U.
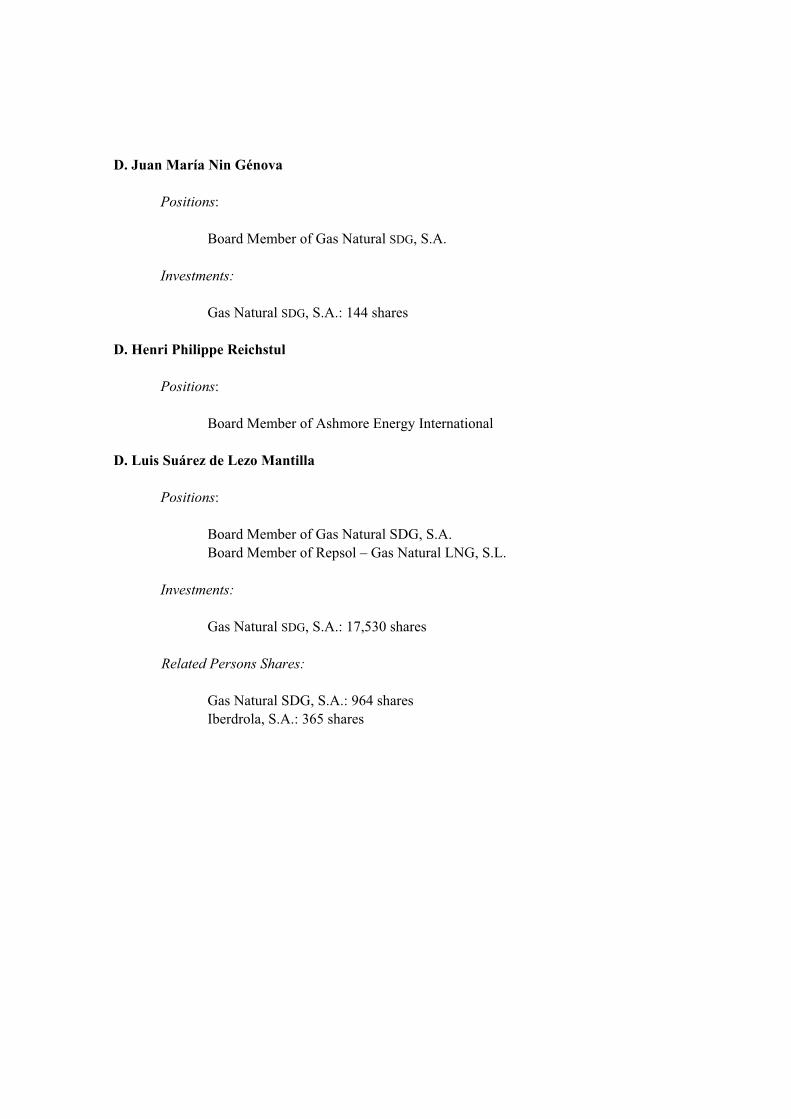
D. Juan María Nin Génova
Positions:
Board Member of Gas Natural SDG, S.A.
Investments:
Gas Natural SDG, S.A.: 144 shares
D. Henri Philippe Reichstul
Positions:
Board Member of Ashmore Energy International
D. Luis Suárez de Lezo Mantilla
Positions:
Board Member of Gas Natural SDG, S.A. Board Member of Repsol – Gas Natural LNG, S.L.
Investments:
Gas Natural SDG, S.A.: 17,530 shares
Related Persons Shares:
Gas Natural SDG, S.A.: 964 shares Iberdrola, S.A.: 365 shares

CONSOLIDATED MANAGEMENT REPORT 2010
REPSOL YPF GROUP
CONTENTS
GENERAL AND ECONOMIC-FINANCIAL INFORMATION.......................................... 3
MACROECONOMIC ENVIRONMENT....................................................................................................3
THE GROUP'S ACTIVITIES......................................................................................................................5
HORIZON 2014 PLAN................................................................................................................................6
RESULTS.....................................................................................................................................................8
FINANCIAL OVERVIEW ........................................................................................................................10
RISK FACTORS........................................................................................................................................13
BUSINESS AREAS...................................................................................................... 20
UPSTREAM...............................................................................................................................................21
LIQUEFIED NATURAL GAS (LNG) ......................................................................................................38
DOWNSTREAM .......................................................................................................................................42
YPF ............................................................................................................................................................53
GAS NATURAL FENOSA .......................................................................................................................66
CORPORATE AREAS ................................................................................................. 71
PEOPLE MANAGEMENT........................................................................................................................71
INNOVATION AND TECHNOLOGY.....................................................................................................80
CORPORATE RESPONSIBILITY ...........................................................................................................82
THE ENVIRONMENT..............................................................................................................................88
SUSTAINABLE ENERGY AND CLIMATE CHANGE..........................................................................89
COMMUNICATION .................................................................................................................................90
INTANGIBLE ASSETS MANAGEMENT...............................................................................................93
SPORTS SPONSORSHIP..........................................................................................................................93
NEW REPSOL HEADQUARTERS..........................................................................................................94
SUPPLEMENTARY CONTENT OF THE MANAGEMENT REPORT........................ 951
GENERAL AND ECONOMIC-FINANCIAL INFORMATION
MACROECONOMIC ENVIRONMENT
This year, 2010, has marked the beginning of global economic recovery after the crisis of 2008-2009, already known as the Great Recession. The world economy has grown 5.0% during 2010 and forecasts estimate 4.4% growth during 2011. However, the global economy is still facing the consequences of the crisis and this recovery process is not free of risks and weaknesses.
After a first half of the year during which the pace of recovery was stronger than expected - thanks to the upward trend in inventories and fixed investments, which led to a strong increase in international trade - the tendency in the following stage was more moderate growth.
This moderation began to be noticeable in the second half of the year, with slower industrial production and global exports, despite a higher-than-expected consumer spending in Japan and the United States, fostered by the incentive programmes introduced by both economies, which maintained economic growth in the period above the forecast rates.
The different speeds of recovery seen in each region during both the crisis and the recovery process as a whole became consolidated this year. The most advanced economies have grown 3.0% in 2010 and estimates for 2011 are in the region of 2.5%, while emerging economies grew 7.1% and are expected to grow about 6.5% in 2011. Similarly, in late 2010, the industrial activity in some emerging economies was above the activity levels recorded before the crisis, while a large number of advanced economies had not yet regained their record levels.
This uneven progress has posed different challenges in terms of economic policies. Although in advanced economies private consumer spending has become steadier, the moderate economic growth may not be enough to tackle the high unemployment rate. These countries still have to deal with the excesses of the period before the crisis by reforming their financial systems and, in the most indebted economies in the Eurozone, they must also face the challenge of fiscal sustainability.
At the same time, many developing economies have already recovered their economic activity levels and, in some cases, they are not far from achieving full employment. Their favourable evolution has led them to receive strong capital input which, in addition to the prosperous economy, have caused the onset of inflationary pressure and even symptoms of overheating. For this reason, some of these economies have partially withdrawn the incentive measures they had introduced to face the crisis.
Regarding the main economies, the United States achieved 2.9% growth, managing to avoid the feared double dip. However, the rebound in activity towards late 2009 and early 2010 was supported mainly by transitory factors, such as public aid and an expansive inventory cycle.
By mid-year the economy suffered a slowdown that was noticed in a new growth of the unemployment rate and a steep fall-off in property sales, increasing the fear of a new recession. The American authorities reacted by announcing new expansive monetary and tax policies. These were, on the one hand, a programme to buy up public debt announced by the Federal Reserve, known as “Quantitative Easing 2”, and on the other, an agreement between the two main parties to extend tax exemptions for the
next two years, equivalent to US$ 800 billion. These measures managed to accelerate growth towards the end of 2010. However, significant weaknesses still remain, mostly connected to the property market and high unemployment.
Global reactivation also reached the Eurozone, which finished 2010 with a 1.8% growth, while estimates for 2011 are around 1.5%. The German economy is still the driving force behind the region's economic recovery, which is still weak due to the tensions in the peripheral Eurozone countries and the high levels of unemployment.
Throughout 2010, international financial stability was affected by doubts regarding the sustainability of the public accounts of some of the region's countries, especially Greece and Ireland. The fear that these countries could not meet their sovereign debt obligations and the effect this would have on the single currency led to the creation of the European Financial Stability Mechanism and the approval of financial aid for those countries. The persistent risk that the crisis could spread to other economies in the Eurozone led the European Central Bank to extend its expansive monetary policy.
Despite these measures, doubts about the sustainability of public debt in several countries and about the cost of restructuring their debt could involve for bondholders have kept interest rate differential of these countries' debt high compared to German debt.
For its part, Spain's Gross Domestic Product (GDP) dropped 0.1% in 2010, although positive quarterly growth rates indicate that economic recovery is beginning, albeit slowly.
During the first half of the year, private consumer spending showed some improvement, mostly linked to transitory measures. However, the persistence of high unemployment rates and the lack of credit have kept domestic demand at a low level, thus dragging down the whole economy.
The foreign sector was the main source of movement this year. The gradual recovery of Spain's main trade partners boosted the export sector, avoiding a more marked setback in activity and employment.
What happened in Greece and Ireland had a major impact on market perception of Spanish public debt, causing a sharp rise in the country risk and making access to finance expensive for both the public and private sectors.
Doubts about the capacity of the Spanish economy to go back to positive growth rates, along with the steep increase in public deficit registered in 2009 (-11.1% of GDP) forced the Government to implement measures to cut public deficit and to carry out structural reforms in order to provide the maximum credibility for the fiscal consolidation path.
Untouched by these trends, Latin America, in general terms, is experiencing strong, fast economic recovery thanks to the rebound in commodity prices and to relatively favourable financing conditions. The region's GDP has grown 5.9% in 2010, which is expected to be moderated to 4.3% in 2011.
This positive trend is reflected in risk premiums which, for some Latin American economies, are currently lower than those demanded from developed economies. However, some of the main economies in the region are receiving strong capital input, which they should handle with careful macroeconomic management.
The growth in the Asia-Pacific region has already gone back to the rhythm it had before
the crisis and the solidity in growth stands out compared to the weaknesses of more advanced economies. The emerging Asian economies, with China at the forefront, have grown 9.3% in 2010, and are expected to reach 8.4% in 2011.
Towards the end of the year, and especially after the Federal Reserve's decision to inject more dollars into the American economy, a return of inflationary pressure in countries such as China, South Korea, India, Australia and New Zealand, has led their governments to raise interest rates and adopt more restrictive monetary policies.
Recovery of global oil demand
The behaviour of the oil market during 2010 was characterised by a recovery of supply and demand fundamentals and, as a consequence, of prices, which were significantly influenced by the global economic-financial context.
Regarding the fundamentals, 2010 marked a change with respect to the two previous years, when consumption shrunk by about 1.5 million barrels. On the contrary, this year saw an increase in global oil demand in excess of two million barrels per day, according to official international energy agencies.
The main drivers behind this growth in demand were China, the United States and the rest of those countries that do not belong to the Organization for the Economic Cooperation and Development (OECD), of which China and the United States accounted for almost half of the global demand growth in 2010.
During 2010, there still was a certain excess supply on the market as a direct consequence of two factors. The first being the policy applied by the Organization of Petroleum Exporting Countries (OPEC), which led to production levels of about 2 million barrels per day, well above their agreed quotas. The second factor was the high inventory levels carried over from 2009, despite their gradual reduction during 2010.
Regarding the price of oil, it was highly volatile during the year, with an average of about US$ 80 per barrel (79.6 in the case of West Texas Intermediate oil), an increase of about 29% compared to 2009 or a price increase of nearly US$ 18 per barrel.
The upward trend in prices was more noticeable in the second half of the year, highly influenced by macroeconomic and financial factors. In this sense, the monetary easing adopted by the United States in the second half of 2010 through quantitative expansion measures, which generated a capital flow towards high yielding assets (commodities and oil), which contributed to oil price increases.
THE GROUP'S ACTIVITIES
The Group’s activities are divided into five business areas which correspond to the main divisions in its organizational structure:
Three strategic integrated activities, including the operations undertaken by the Group's companies (except YPF and Gas Natural Fenosa) in the following areas:
Upstream, relating to the exploration and production of oil and natural gas;
LNG, relating to the midstream operations (liquefaction, transport and regasification) of natural gas and to marketing operations for natural gas and liquefied natural gas; and
Downstream, corresponding to refining and marketing activities involving oil products, chemicals, and liquefied petroleum gas.
Two holdings in strategic companies:
YPF, which includes YPF S.A. and its Group operations in all of the aforementioned activities; as of 31 December 2010, the Group owned 79.81% of YPF, S.A., that is included in the Group's financial statements through full consolidation; and
Gas Natural Fenosa, which mainly engages in natural gas marketing and the generation, distribution, and marketing of electricity; as of 31 December 2010, the Group owned 30.13% of Gas Natural Fenosa, which is included through proportional consolidation.
HORIZON 2014 PLAN
In 2010 the company presented the Horizon 2014 Plan to the markets, which establishes the Group's priorities for the 2010-2014 period. The remarkable success in explorations during 2008 and 2009, and the changes in the sector brought about by the financial crisis, led to the Group updating its objectives and bases, which will enable it to tackle the next growth stage.
The main strategic lines guiding each business are:
Upstream: the company's driver of growth.
- Repsol's presence in geographical areas with a high exploration potential and its recognised ability for deepwater exploration has transformed the company into one of the energy companies with the best growth prospects.
- The investment strategy will be based on a solid portfolio of strategic projects: the exploitation of those already in operation and making progress on those projects in the delineation or development phase. Additionally, the company will continue to pursue its commitment for organic growth and for exploration activities in new areas of interest for the Group.
- The development of these projects will increase the annual oil production in the Upstream area by between 3 and 4% until 2014, and even further up to 2019, with an estimated reserve replacement rate in excess of 110% for the next five years.
Downstream: optimising and improving profitability
- The projects to enlarge and improve the Bilbao and Cartagena refineries are already at a very advanced stage, and commercial operations are expected to start in late 2011. The start-up of these
plants will increase exploitation margins and consolidate the company's integrated position and its position as leader in this business in Spain.
- From 2012 onwards, the excellent position developed by Repsol's Downstream business will allow the company to capitalise on the economic recovery, thereby obtaining solid cashflow generation for the Group.
YPF: capturing the company's hidden value.
- YPF is a leading company in Argentina, a growing market that offers plenty of business opportunities. The energy transition that is taking place in the country towards international prices and the strict management of investments and costs will allow the company to reach the growth goal in results and dividends.
Gas Natural Fenosa: a leader in the gas and electricity convergence industries.
- Creation of a leading integrated gas and electricity company that will ensure steady cashflow generation for the Group.
The keys for generating value in the various businesses and strict financial discipline will enable the Group to reach the Plan's ultimate goal: maximising the value created for the stockholder.
In 2010, the Horizon 2014 Plan has benefited from investments of €5,106 million to help it achieve this goal. The main initiatives during the financial year were delineating the largest exploratory discoveries (in countries like Brazil and Venezuela); the progress made in the building phase of refining projects for Spain (Cartagena and Bilbao); the start-up of major projects such as Peru LNG; and the efficient operation of Repsol's earning assets (Shenzi in the Gulf of Mexico, I/R in Libya, Trinidad and Tobago, Bolivia and Canaport in Canada).
The latest discoveries made in West Africa and Latin America and the acquisition of new mining rights in Latin America, Norway, Oman, Algeria, Indonesia and Angola have laid the foundations for generating future growth.
Moreover, the Group's affiliate companies made progress in their respective strategic lines during 2010:
YPF which, bolstered by the recovery of prices in Argentina, is focusing on the exploitation of mature fields (mainly through the improvement of the recovery factor) and making advances in marketing management and operational optimisation,
Gas Natural Fenosa defined their new strategic framework for the upcoming years, after the acquisition and integration of Fenosa.
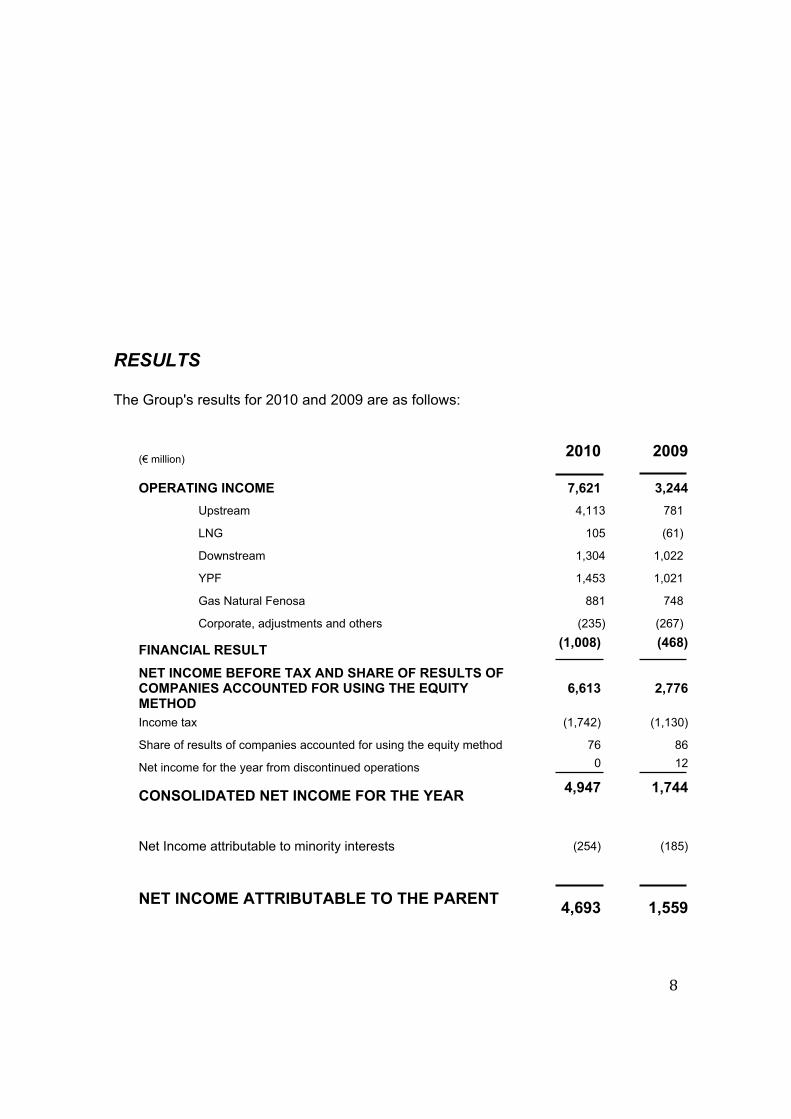
RESULTS
The Group's results for 2010 and 2009 are as follows:
(€ million) 2010 2009
OPERATING INCOME 7,621 3,244Upstream 4,113 781
LNG 105 (61)
Downstream 1,304 1,022
YPF 1,453 1,021
Gas Natural Fenosa 881 748
Corporate, adjustments and others (235) (267)
FINANCIAL RESULT (1,008) (468)
NET INCOME BEFORE TAX AND SHARE OF RESULTS OF COMPANIES ACCOUNTED FOR USING THE EQUITY METHOD
6,613 2,776
Income tax (1,742) (1,130)
Share of results of companies accounted for using the equity method 76 86
Net income for the year from discontinued operations 0 12
CONSOLIDATED NET INCOME FOR THE YEAR 4,947 1,744
Net Income attributable to minority interests (254) (185)
NET INCOME ATTRIBUTABLE TO THE PARENT 4,693 1,559
Repsol YPF's net income for 2010 was €4,693 million, more than three times the result obtained in the previous year (€1,559 million). Operating income was €7,621 million, up 134.9% from the €3,244 million posted a year earlier. EBITDA was €9,196 million, 36.3% more than in 2009. Earnings per share were €3.84.
The results in 2010 show an improvement in every business area and, in large part due to the agreement with China Petroleum & Chemical Corporation (Sinopec), achieve a record result for the Group.
This agreement is one of the highlights of the year. In December 2010, Repsol and Sinopec signed a strategic agreement to develop joint exploration and production projects in Brazil, and to this end formalised a capital increase for Repsol Brasil, S.A. (“Repsol Brasil”, which in February 2011 changed its name to Repsol Sinopec Brasil S.A., “Repsol Sinopec Brasil”) fully subscribed by Sinopec, for an amount of US$ 7,111 million (€5,389 million). With this operation, Repsol has maintained its 60% stockholding in Repsol Sinopec Brasil, while Sinopec holds the remaining 40%. The agreement ensures financing for the development of the discoveries in Brazil, in particular Guará, Carioca and Panoramix, as well as their exploitation, reflecting an estimated market value of these assets of over US$10.6 billion.
The operating income for the Upstream area (Exploration and Production) jumped 426.6% from €781 million in 2009 to €4,113 million by 31 December 2010. The result for 2010 includes € 2,847 million capital gains, resulting from the agreement between Repsol and Sinopec. Leaving these capital gains aside, the result for the Upstream area in 2010 is still higher than that of 2009, basically as a result of higher oil and gas resolution prices, and increased production in this period.
The Liquefied Natural Gas (LNG) business posted profits of €105 million in 2010, thanks to larger LNG trading margins and volumes than in 2009, a year in which this area's operating performance was negative, with a recorded loss of €61 million (a figure that includes the losses stemming from arbitration decisions such as the Gassi Touil dispute).
Operating income in the Downstream division (Refining, Marketing, Liquefied Petroleum Gas, Chemicals and Trading) was €1,304 million compared to €1,022 million in the previous year, implying a 27.6% increase. The operating income considering the inventories at the current cost of supplies (CCS), instead of at the average cost, was €806 million, 23.1% higher than the €655 million obtained in 2009, mainly due to the recovery of the chemical business and the improved results in refining.
Regarding YPF, it finished 2010 with a €1,453 million operating income, a 42.3% increase compared with €1,021 million in 2009. This increase is a result of bringing fuel prices in service stations closer to the international parity in dollars, and of the higher income from those products whose prices, despite being sold in Argentina's internal market, are linked to international prices, as well as the effect of the higher income stemming from exports.
Repsol's 30% stake in Gas Natural Fenosa generated an operating income of €881 million, 17.8% higher than the previous year, mainly due to the incorporation of 100% of Unión Fenosa from 30 April 2009, and the capital gains obtained in the subsequent divestment process.
The consolidated Group recorded a net financial result of minus €1,008 million in 2010 in comparison with minus €468 million a year earlier. The difference is mainly due to the increase in expenses for investments under a financial leasing arrangement (pipelines and gas tankers) and to the differences in exchange rates, which in 2009 yielded considerable profits due to the depreciation of the dollar against the euro,
while in 2010 the dollar regained value in relation to the euro, thus having a negative impact on the financial result through positions with an exchange rate risk.
The Corporate Income Tax accured was €1,742 million, with an effective tax rate of 26.3% (40.7% in 2009). This unusually low rate is a consequence of the unusual transactions carried out during the year (agreement with Sinopec, sale of Refap and CLH, etc.).
FINANCIAL OVERVIEW
At year-end 2010, Repsol YPF holds a solid financial position.
The Group's net financial debt excluding Gas Natural Fenosa, in other words, without taking into account the proportional integration of the figures corresponding to this company, was €1,697 million as of 31 December 2010, compared to the €4,905 million in the previous period, which means a 65% reduction. The good progress being made across the business, as well as the divestment of the Refinería Alberto Pasqualini (Refap) in Brazil, the sale of over 4% of YPF's capital to the market and, very significantly, the capital increase for Repsol Brasil have been the causes behind this reduction.
The Group’s consolidated net financial debt at year-end 2010 was €7,224 million, that is, €3,704 million less than the net debt as of 31 December 2009, which totalled €10,928 million.
During 2010, investments reached €5,091 million. (1). These investments are explained in detail in the sections pertaining to each business area contained in this Management Report.
Divestments in the year totalled €4,972 million(2). Of this amount, it is important to point out, in addition to the inflow of funds as a result of the Sinopec agreement, the sale of 4.23% of the shares Repsol had in YPF on the market for a total amount of € 489 million. Likewise, it includes the sale of the 30% stake Repsol held in the Refinería Alberto Pasqualini (Refap), of 5% in the Compañía Logística de Hidrocarburos (CLH) and of 25% in Bahía de Bizkaia Gas (BBG). These transactions are dealt with in greater detail in the sections devoted to each business area contained in this Management Report.
During 2010, exceptionally, there was a single dividend payment (€0.425 per share as an 2009 final dividend) due to the payment of 2009 interim dividends by Repsol YPF, S.A. in December of that year. Furthermore, the Group's Board of Directors authorised a 2010 interim dividend of €0.525 per share, a 23.53% increase compared to the 2009 interim dividend, which was paid in January 2011.
In relation to transactions involving company shares, the Annual General Meeting held on 30 April 2010, resolved to grant authorisation to the Board of Directors “for the derivative acquisition of shares of Repsol YPF, S.A. by purchase, exchange, or by any other transaction for valuable consideration, directly or through controlled companies, in one or more transactions, up to a maximum number of shares that, added to those already held
(1) This figure does not include financial investments of €15 million in 2010.
(2) This figure does not include financial divestments in the 2010 period, totalling €88 million.
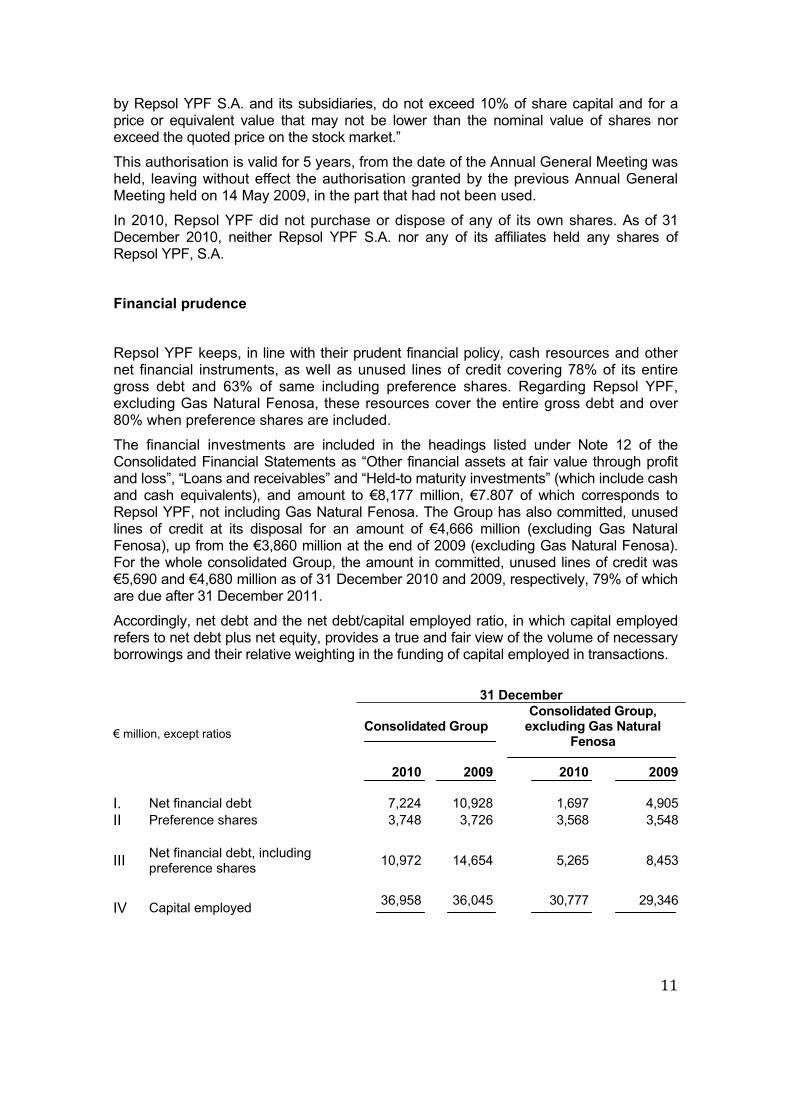
by Repsol YPF S.A. and its subsidiaries, do not exceed 10% of share capital and for a price or equivalent value that may not be lower than the nominal value of shares nor exceed the quoted price on the stock market.”
This authorisation is valid for 5 years, from the date of the Annual General Meeting was held, leaving without effect the authorisation granted by the previous Annual General Meeting held on 14 May 2009, in the part that had not been used.
In 2010, Repsol YPF did not purchase or dispose of any of its own shares. As of 31 December 2010, neither Repsol YPF S.A. nor any of its affiliates held any shares of Repsol YPF, S.A.
Financial prudence
Repsol YPF keeps, in line with their prudent financial policy, cash resources and other net financial instruments, as well as unused lines of credit covering 78% of its entire gross debt and 63% of same including preference shares. Regarding Repsol YPF, excluding Gas Natural Fenosa, these resources cover the entire gross debt and over 80% when preference shares are included.
The financial investments are included in the headings listed under Note 12 of the Consolidated Financial Statements as “Other financial assets at fair value through profit and loss”, “Loans and receivables” and “Held-to maturity investments” (which include cash and cash equivalents), and amount to €8,177 million, €7.807 of which corresponds to Repsol YPF, not including Gas Natural Fenosa. The Group has also committed, unused lines of credit at its disposal for an amount of €4,666 million (excluding Gas Natural Fenosa), up from the €3,860 million at the end of 2009 (excluding Gas Natural Fenosa). For the whole consolidated Group, the amount in committed, unused lines of credit was €5,690 and €4,680 million as of 31 December 2010 and 2009, respectively, 79% of which are due after 31 December 2011.
Accordingly, net debt and the net debt/capital employed ratio, in which capital employed refers to net debt plus net equity, provides a true and fair view of the volume of necessary borrowings and their relative weighting in the funding of capital employed in transactions.
31 December
€ million, except ratios Consolidated Group Consolidated Group,
excluding Gas Natural Fenosa
2010 2009 2010 2009
I. Net financial debt 7,224 10,928 1,697 4,905II Preference shares 3,748 3,726 3,568 3,548
III Net financial debt, including preference shares 10,972 14,654 5,265 8,453
IV Capital employed 36,958 36,045 30,777 29,346
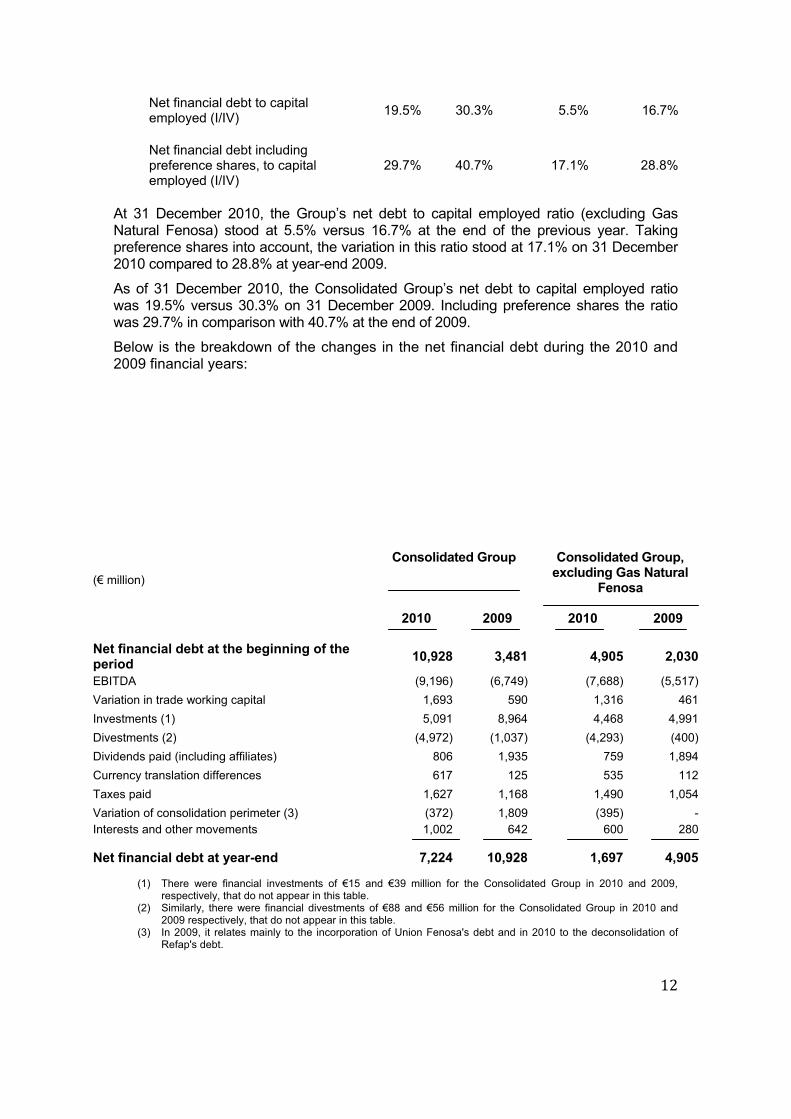
Net financial debt to capital employed (I/IV) 19.5% 30.3% 5.5% 16.7%
Net financial debt including preference shares, to capital employed (I/IV)
29.7% 40.7% 17.1% 28.8%
At 31 December 2010, the Group’s net debt to capital employed ratio (excluding Gas Natural Fenosa) stood at 5.5% versus 16.7% at the end of the previous year. Taking preference shares into account, the variation in this ratio stood at 17.1% on 31 December 2010 compared to 28.8% at year-end 2009.
As of 31 December 2010, the Consolidated Group’s net debt to capital employed ratio was 19.5% versus 30.3% on 31 December 2009. Including preference shares the ratio was 29.7% in comparison with 40.7% at the end of 2009.
Below is the breakdown of the changes in the net financial debt during the 2010 and 2009 financial years:
(€ million)
Consolidated Group Consolidated Group, excluding Gas Natural
Fenosa
2010 2009 2010 2009
Net financial debt at the beginning of the period 10,928 3,481 4,905 2,030
EBITDA (9,196) (6,749) (7,688) (5,517) Variation in trade working capital 1,693 590 1,316 461 Investments (1) 5,091 8,964 4,468 4,991 Divestments (2) (4,972) (1,037) (4,293) (400) Dividends paid (including affiliates) 806 1,935 759 1,894 Currency translation differences 617 125 535 112 Taxes paid 1,627 1,168 1,490 1,054 Variation of consolidation perimeter (3) (372) 1,809 (395) - Interests and other movements 1,002 642 600 280
Net financial debt at year-end 7,224 10,928 1,697 4,905
(1) There were financial investments of €15 and €39 million for the Consolidated Group in 2010 and 2009, respectively, that do not appear in this table.
(2) Similarly, there were financial divestments of €88 and €56 million for the Consolidated Group in 2010 and 2009 respectively, that do not appear in this table.
(3) In 2009, it relates mainly to the incorporation of Union Fenosa's debt and in 2010 to the deconsolidation of Refap's debt.
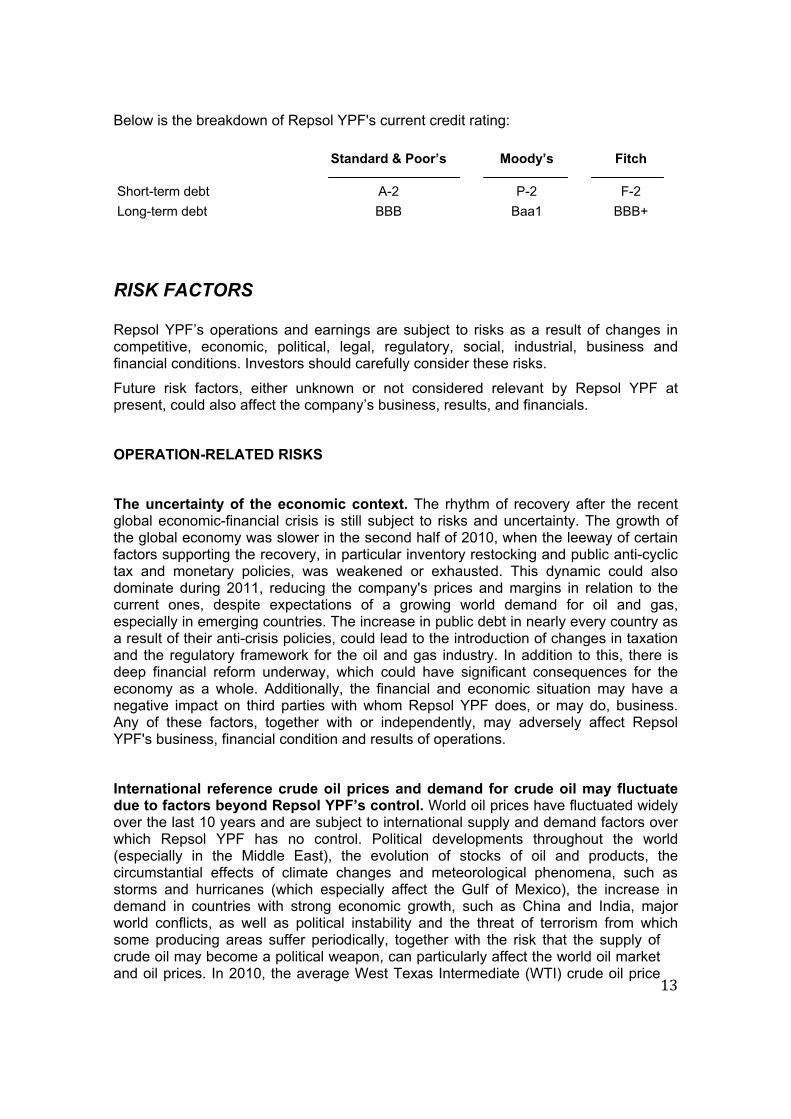
Below is the breakdown of Repsol YPF's current credit rating:
Standard & Poor’s Moody’s Fitch
Short-term debt A-2 P-2 F-2 Long-term debt BBB Baa1 BBB+
RISK FACTORS
Repsol YPF’s operations and earnings are subject to risks as a result of changes in competitive, economic, political, legal, regulatory, social, industrial, business and financial conditions. Investors should carefully consider these risks.
Future risk factors, either unknown or not considered relevant by Repsol YPF at present, could also affect the company’s business, results, and financials.
OPERATION-RELATED RISKS
The uncertainty of the economic context. The rhythm of recovery after the recent global economic-financial crisis is still subject to risks and uncertainty. The growth of the global economy was slower in the second half of 2010, when the leeway of certain factors supporting the recovery, in particular inventory restocking and public anti-cyclic tax and monetary policies, was weakened or exhausted. This dynamic could also dominate during 2011, reducing the company's prices and margins in relation to the current ones, despite expectations of a growing world demand for oil and gas, especially in emerging countries. The increase in public debt in nearly every country as a result of their anti-crisis policies, could lead to the introduction of changes in taxation and the regulatory framework for the oil and gas industry. In addition to this, there is deep financial reform underway, which could have significant consequences for the economy as a whole. Additionally, the financial and economic situation may have a negative impact on third parties with whom Repsol YPF does, or may do, business. Any of these factors, together with or independently, may adversely affect Repsol YPF's business, financial condition and results of operations.
International reference crude oil prices and demand for crude oil may fluctuate due to factors beyond Repsol YPF’s control. World oil prices have fluctuated widely over the last 10 years and are subject to international supply and demand factors over which Repsol YPF has no control. Political developments throughout the world (especially in the Middle East), the evolution of stocks of oil and products, the circumstantial effects of climate changes and meteorological phenomena, such as storms and hurricanes (which especially affect the Gulf of Mexico), the increase in demand in countries with strong economic growth, such as China and India, major world conflicts, as well as political instability and the threat of terrorism from which some producing areas suffer periodically, together with the risk that the supply of crude oil may become a political weapon, can particularly affect the world oil market and oil prices. In 2010, the average West Texas Intermediate (WTI) crude oil price
was US$79.61 per barrel, compared to an average of US$56.13 per barrel for the period 2001-2010, with maximum and minimum annual averages of US$99.75 per barrel and US$25.96 per barrel in 2008 and 2001, respectively. In 2010, oil (WTI) was trading at a range of approximately US$68-92/barrel.
Demand for crude oil may also fluctuate significantly during economic cycles.
Reductions in oil prices negatively affect Repsol YPF’s profitability, the valuation of its assets and its plans for capital investment including projected capital expenditures related to exploration and development activities. A significant reduction of capital investments may negatively affect Repsol YPF’s ability to replace oil reserves.
Repsol YPF’s operations are subject to regulation. The oil industry is subject to extensive regulation and intervention by governments throughout the world in such matters as the award of exploration and production interests, the imposition of specific drilling and exploration obligations, restrictions on production, price controls, required divestments of assets and foreign currency controls over the development and nationalization, expropriation or cancellation of contract rights. Such legislation and regulations apply to virtually all aspects of Repsol YPF’s operations inside and outside Spain. In addition, certain countries contemplate in their legislation the imposition of sanctions on non-domestic companies which make certain types of investments in other countries.
In addition, the terms and conditions of the agreements under which Repsol YPF’s oil and gas interests are held generally reflect negotiations with governmental authorities and vary significantly by country and even by field within a country. These agreements generally take the form of licenses or production sharing agreements. Under license agreements, the license holder provides financing and bears the risk of the exploration and production activities in exchange for resulting production, if any. Part of the production may have to be sold to the state or the state-owned oil company. License holders are generally required to make certain tax or royalty payments and pay income tax which can be high compared with the taxes paid by other businesses. Nevertheless, production sharing agreements generally require the contractor to finance exploration and production activities in exchange for the recovery of its costs from part of production (cost oil) and the remainder of production (profit oil) is shared with the state-owned oil company.
Repsol YPF cannot predict changes in the aforementioned regulation and legislation or the interpretation or implementation thereof.
Repsol YPF is subject to extensive environmental regulations and risks. RepsolYPF is subject to extensive environmental laws and regulations in practically all the countries in which it operates, which regulate, among other matters affecting Repsol YPF’s operations, environmental quality standards for products, air emissions and climate change, energy efficiency, water discharges, surface water pollution, remediation of soil and groundwater and the generation, storage, transportation, treatment and disposal of waste materials.
In particular, due to concern over the risk of climate change, a number of countries have adopted, or are considering the adoption of, new regulatory requirements to reduce greenhouse gas emissions, such as carbon taxes, increased efficiency standards, or the adoption of trade regimes. These requirements could make Repsol YPF’s products more expensive as well as shift hydrocarbon demand toward
relatively lower-carbon sources such as renewable energies. In addition, compliance with greenhouse gas regulations may also require the company to upgrade the facilities, monitor or sequester emissions or take other actions which may increase the compliance costs.
These laws and regulations have had and will continue to have an impact on Repsol YPF’s business, financial condition and results of operations..
Operating risks related to exploration and explotation of oil and gas, and reliance on the cost-effective acquisition or discovery of, and, thereafter, development of new oil and gas reserves. Oil and gas exploration and production activities are subject to particular risks, some of which are beyond the control of Repsol YPF. These activities are subject to production, equipment and transportation risks, natural hazards and other uncertainties including those relating to the physical characteristics of an oil or natural gas field. The operations of Repsol YPF may be curtailed, delayed or cancelled as a result of weather conditions, mechanical difficulties, delays in the delivery of equipment or compliance with governmental requirements. In addition to this, some of our development projects are located in deep waters and other difficult environments, such as the Gulf of Mexico, Brazil and the Amazon rainforest or in challenging reservoirs, which could aggravate these risks. The offshore operations, in particular, are subject to sea risks, among them storms and other adverse climate conditions or shipwrecks. Also, the transportation of oil products, by any means, always has inherent risks: during road, rail or sea transport, or by pipeline, oil or another hazardous substance could leak; this is a significant risk due to the potential impact a spill could have on the environment and on people, especially considering the high volume of products that can be carried at any one time. If these risks materialize, there could be personal and environmental damage, production losses or destruction of goods and legal actions and, depending on the cause and the severity of the damages, Repsol YPF's reputation could also be damaged.
Moreover, Repsol YPF is dependent on the replacement of depleted oil and gas reserves with new proved reserves in a cost-effective manner that permits subsequent production to be economically viable. Repsol YPF’s ability to acquire or discover new reserves, however, is subject to a number of risks. For example, drilling may involve unprofitable efforts, not only with respect to dry wells, but also with respect to wells that are productive but do not produce sufficient net revenues to return a profit after drilling, operating and other costs are taken into account. In addition, crude oil and natural gas production blocks are typically auctioned by governmental authorities and Repsol YPF faces intense competition in bidding for such production blocks, in particular those blocks with the most attractive potential reserves. Such competition may result in Repsol YPF’s failing to obtain desirable production blocks or result in Repsol YPF acquiring such blocks at a higher price, which could mean that subsequent production would not be economically viable.
If Repsol YPF fails to acquire or discover, and, thereafter, develop new oil and gas reserves in a cost-effective manner or if any of the aforementioned risks materialises, its business, results of operations and financial condition would be materially and adversely affected.
Location of reserves. Part of the oil and gas reserves are located in countries that are or could be economically or politically unstable.
Reserves in these areas as well as related production operations may be subject to risks, including increases in taxes and royalties, the establishment of limits on
production and export volumes, the compulsory renegotiation or cancellation of contracts, the nationalization or denationalization of assets, changes in local government regimes and policies, changes in business customs and practices, payment delays, currency exchange restrictions and losses and impairment of operations by actions of insurgent groups. In addition, political changes may lead to changes in the business environment. Economic downturns, political instability or civil disturbances may disrupt distribution logistics or limit sales in the markets affected by such events.
Oil and gas reserves estimates. Repsol YPF uses the guidelines and the conceptual framework of the Securities and Exchange Commission (SEC)'s definition of proven reserves in order to calculate proven oil and gas reserves. Oil and gas proved reserves are estimated using geological and engineering data to determine with reasonable certainty whether the crude oil or natural gas in known reservoirs is recoverable under existing economic and operating conditions.
The accuracy of proved reserve estimates depends on a number of factors, assumptions and variables, some of which are beyond our control. Factors susceptible to the company’s control include drilling, testing and production after the date of the estimates, which may require substantial upward or downward revisions to reserves estimates; the quality of available geological, technical and economic data used and its interpretation thereof; the production performance of reservoirs and recovery rates, both of which depend in significant part on available technologies as well as the company’s ability to implement such technologies and the relevant know-how; the selection of third parties with which Repsol YPF enters into business; and the accuracy of its estimates of initial hydrocarbons in place, which may prove to be incorrect or require substantial revisions. Factors mainly beyond Repsol YPF’s control include changes in prevailing oil and natural gas prices, which could have an effect on the quantities of proved reserves (since the estimates of reserves are calculated under existing economic conditions when such estimates are made); changes in the prevailing tax rules, other government regulations and contractual conditions after the date estimates are made (which could make reserves no longer economically viable to exploit); and certain actions of third parties, including the operators of fields in which the Group has an interest.
As a result of the foregoing, measures of reserves are not precise and are subject to revision. Any downward revision in estimated quantities of proved reserves could adversely impact financial results, leading to increased depreciation, depletion and amortization charges and/or impairment charges, which would reduce earnings and shareholders’ equity.
Repsol YPF’s natural gas operations are subject to particular operational and market risks. Natural gas prices in the various regions in which Repsol YPF operates tend to vary from one to another as a result of significantly different supply, demand and regulatory circumstances, and such prices may be lower than prevailing prices in other regions of the world. In addition, excess supply conditions that exist in some regions cannot be utilized in other regions due to a lack of infrastructure and difficulties in transporting natural gas.
In addition, Repsol YPF has entered into long-term contracts to purchase and supply of natural gas in various parts of the world. These contracts have different price formulas, which could result in higher purchase prices than the price at which such
gas could be sold in increasingly liberalized markets. In addition, gas availability could be subject to risks of contract fulfillment from counterparties. Thus, it might be necessary to look for other sources of natural gas in the event of non-delivery from any of these sources, which could require payment of higher prices than those called for under such contracts.
Repsol YPF also has long-term contracts to sell and deliver gas, mainly to clients in Argentina, Bolivia, Brazil, Chile, Venezuela, Spain and Mexico. These contracts present additional types of risks to the company as they are linked to current proved reserves in Argentina, Bolivia, Venezuela, Trinidad and Tobago and Peru. If sufficient reserves in those countries were not available, Repsol YPF might not be able to satisfy its obligations under these contracts, several of which include penalty clauses for non-fulfillment.
Conditions in the petrochemicals industry are cyclical and may change due to factors beyond Repsol YPF’s control. The petrochemicals industry is subject to wide fluctuations in supply and demand reflecting the cyclical nature of the chemicals market at regional and global levels. These fluctuations affect prices and profitability for petrochemicals companies, including Repsol YPF. Repsol YPF’s petrochemicals business is also subject to extensive governmental regulation and intervention in such matters as safety and environmental controls.
Significant presence in Argentina. Nearly 19% and 20% of Repsol YPF’s assets were in Argentina as of 31 December 2010 and 2009 respectively, corresponding for the most part to exploration and production activities. In addition, approximately 20% and 33% of operating income as of 31 December 2010 and 2009 respectively was generated from activities in that country.
After the economic crisis of 2001 and 2002, Argentina's GDP has grown at an average rate of approximately 8.5% from 2003 to 2008, slowing down in 2009 due to the international financial crisis. In 2010, after a recovery process and according to preliminary estimates, the growth rate achieved is in the region of 9%. The Argentinean economy is still sensitive to volatile commodities prices, the limited credit and international investment in infrastructure, the development of energy resources supporting economic growth and the rise in inflation rates, among other factors.
The main economic risks Repsol YPF faces due to its operations in Argentina include the following:
• limitations on its ability to pass on increases in international oil prices and other fuels, and exchange rate fluctuations and/or other costs affecting the operations to local prices;
• higher taxes on hydrocarbon exports;
• restrictions on hydrocarbon export volumes driven mainly by the requirement to satisfy domestic demand, thereby affecting the company’s prior arrangements with its clients;
• the need to extend concessions, some of which expire in 2017;
• work disruptions and stoppages by the workforce;
• changes in the Argentinean peso exchange rate.
In recent years, new and increased duties have been imposed on exports (see note 2, “Argentina - Regulatory Framework” in the Consolidated Financial Statements for 2010). As a result of these export tax increases, YPF could be, and on certain occasions has been, forced to renegotiate its export contracts despite the Government’s prior approval of them. The imposition of these export withholdings has had an adverse impact on the operating income of YPF.
In addition, YPF has been obliged to sell a part of its natural gas production previously destined for the export market in the local Argentine market and has not been able to meet its contractual gas export commitments in whole or, in some cases, in part, leading to disputes with its export clients and forcing YPF to declare force majeure under its export sales agreements. Repsol YPF believes that these actions from the government constitute force majeure events that relieve YPF from any contingent liability for the failure to comply with its contractual obligations.
Repsol YPF’s current insurance coverage to all the operational risks may not be sufficient. As discussed in several of the risk factos mentioned in this document, Repsol YPF’s operation are subject to extensive economic, operational, regulatory and legal risk. The company maintains insurance covering against certain risks inherent in the oil and gas industry in line with industry practice, including loss of or damage to property and equipment, control-of-well incidents, loss of production or income incidents, removal of debris, sudden and accidental seepage pollution, contamination and clean up and third-party liability claims, including personal injury and loss of life, among other business risks. However, the insurance coverage is subject to deductibles and limits that in certain cases may be materially exceeded by its liabilities. In addition, certain of Repsol YPF’s insurance policies contain exclusions that could leave the Group with limited coverage in certain events. On the other hand, the company may not be able to maintain adequate insurance at rates or on terms that are considered reasonable or acceptable or be able to obtain insurance against certain risks that materialize in the future. If the company experiences an incident against which it is not insured, or the costs of which materially exceed its coverage, it could have a material adverse effect on its business, financial condition and results of operations.
FINANCIAL RISKS
Liquidity risk. Liquidity risk is associated with the Group's ability to finance its obligations at reasonable market prices, as well as being able to carry out its business plans with stable financing sources.
Repsol YPF keeps, in line with their prudent financial policy, resources available covering 78% of its entire gross debt and 63% of this debt including preference shares. Regarding Repsol YPF excluding Gas Natural Fenosa, these resources cover the entire gross debt and over 80% when preference shares are included.
Credit risk. The Group’s credit risk exposure mainly relates to trade accounts payable, which are measured and controlled by individual client or third party. To this end, the Group has its own systems, aligned to best practices, for constantly monitoring the creditworthiness of all its debtors and for determining the risk limits of third parties.
As a general rule, the Group establishes a bank guarantee issued by financial entities as the most suitable instrument of protection from credit risk. In some cases, the Group has taken out credit insurance policies whereby this transfers the credit risk related to the business activity of some of their businesses to third parties.
Market risk
Exchange rate fluctuation risk. Repsol YPF is exposed to fluctuations in currency exchange rates since revenues and cashflows generated by oil, natural gas, and refined product sales are generally denominated in dollars or affected by this currency’s exchange rate. Operating income is also exposed to fluctuations in currency exchange rates in countries where Repsol YPF conducts its activities. In order to mitigate the exchange rate risk on results, and when it deems appropriate, Repsol YPF may use derivatives for those currencies for which there is a liquid market and where transaction costs are reasonable.
The company is also exposed to exchange rate risk affecting the value of its assets or financial investments in dollars. Repsol YPF obtains financing in dollars and in other currencies, either directly or synthetically through currency derivatives.
In addition, Repsol YPF’s financial statements are expressed in euros and, consequently, the assets and liabilities of investee companies with a different functional currency are translated into euros at the exchange rate prevailing on the balance sheet date. The revenues and expenses of each of these items in the profit and loss accounts are translated into euros by applying the exchange rate in force on the date of each transaction; for practical reasons, the exchange rate used is, in general, the average of the period in which the transactions were made. The fluctuations in the exchange rates applied in the process for converting the currencies into euros generates variations (gains or losses) which are recognised in the Repsol YPF Group consolidated financial statements and expressed in euros.
Commodity price risk. In the normal course of operations and trading activities, Repsol YPF Group earnings are exposed to volatility in the price of oil, natural gas, and related derivative products (see the previous section “Possible fluctuations in international benchmark oil prices and oil demand due to factors beyond the control of Repsol YPF” and “Operational and market risks affecting Repsol YPF’s activities in the natural gas industry”).
Interest rate risk. The market value of the Group’s net financing and net interest expenses could be affected by interest rate fluctuations.
Note 20 “Financial risk and capital management” and Note 21 “Derivative transactions” in the Consolidated Financial Statements for the financial year 2010 include additional details on the financial risks described in this section.
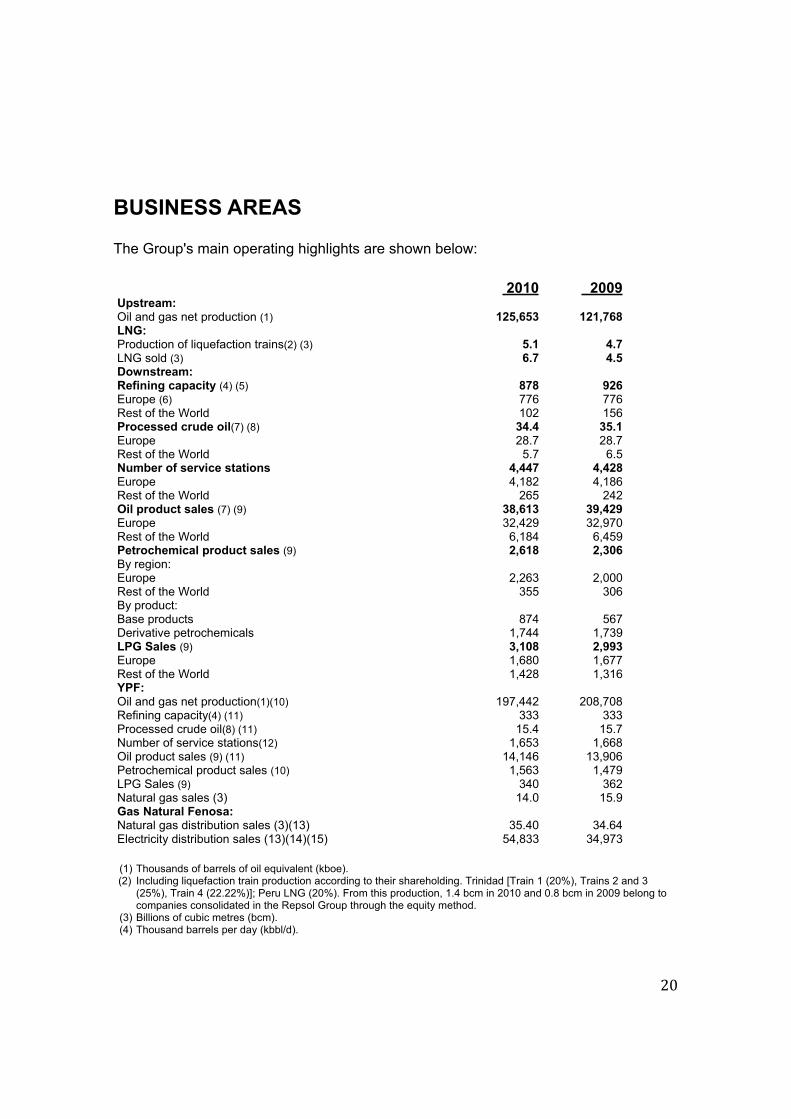
BUSINESS AREAS
The Group's main operating highlights are shown below:
2010 2009Upstream: Oil and gas net production (1) 125,653 121,768 LNG: Production of liquefaction trains(2) (3) 5.1 4.7 LNG sold (3) 6.7 4.5 Downstream: Refining capacity (4) (5) 878 926 Europe (6) 776 776 Rest of the World 102 156 Processed crude oil(7) (8) 34.4 35.1 Europe 28.7 28.7 Rest of the World 5.7 6.5 Number of service stations 4,447 4,428 Europe 4,182 4,186 Rest of the World 265 242 Oil product sales (7) (9) 38,613 39,429 Europe 32,429 32,970 Rest of the World 6,184 6,459 Petrochemical product sales (9) 2,618 2,306 By region: Europe 2,263 2,000 Rest of the World 355 306 By product: Base products 874 567 Derivative petrochemicals 1,744 1,739 LPG Sales (9) 3,108 2,993 Europe 1,680 1,677 Rest of the World 1,428 1,316 YPF: Oil and gas net production(1)(10) 197,442 208,708 Refining capacity(4) (11) 333 333 Processed crude oil(8) (11) 15.4 15.7 Number of service stations(12) 1,653 1,668 Oil product sales (9) (11) 14,146 13,906 Petrochemical product sales (10) 1,563 1,479 LPG Sales (9) 340 362 Natural gas sales (3) 14.0 15.9 Gas Natural Fenosa: Natural gas distribution sales (3)(13) 35.40 34.64 Electricity distribution sales (13)(14)(15) 54,833 34,973
(1) Thousands of barrels of oil equivalent (kboe). (2) Including liquefaction train production according to their shareholding. Trinidad [Train 1 (20%), Trains 2 and 3
(25%), Train 4 (22.22%)]; Peru LNG (20%). From this production, 1.4 bcm in 2010 and 0.8 bcm in 2009 belong to companies consolidated in the Repsol Group through the equity method.
(3) Billions of cubic metres (bcm). (4) Thousand barrels per day (kbbl/d).
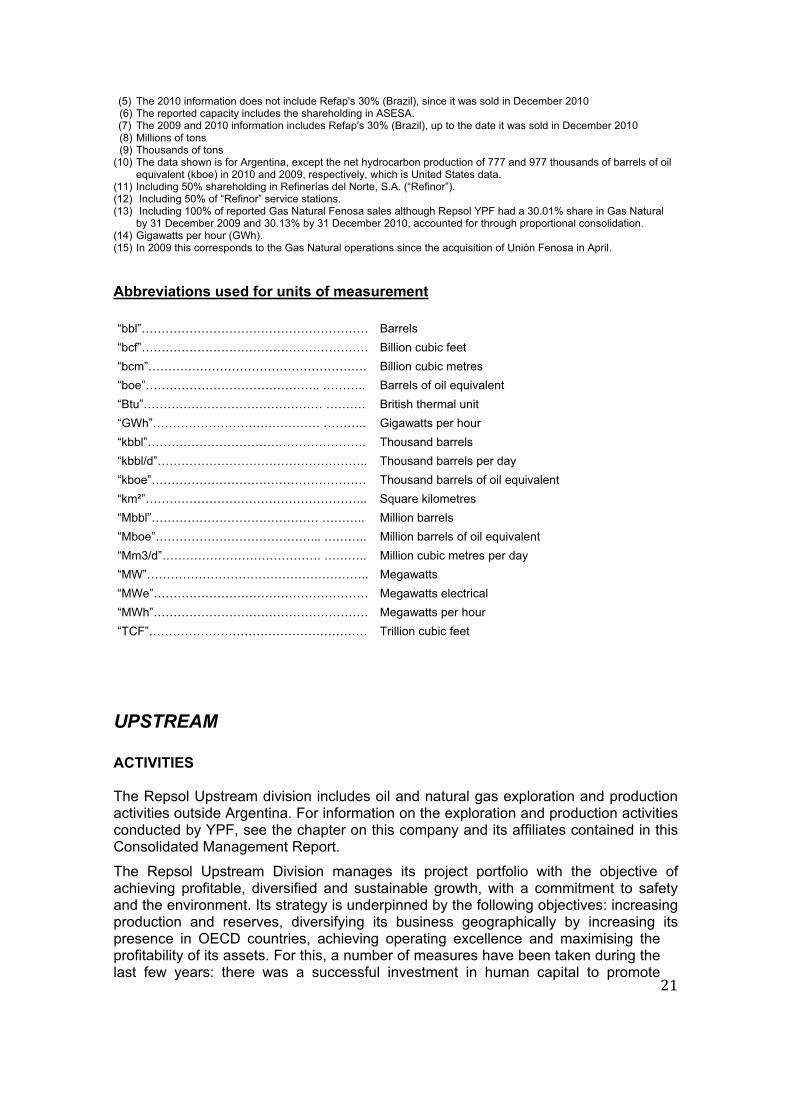
(5) The 2010 information does not include Refap's 30% (Brazil), since it was sold in December 2010 (6) The reported capacity includes the shareholding in ASESA. (7) The 2009 and 2010 information includes Refap's 30% (Brazil), up to the date it was sold in December 2010
(8) Millions of tons (9) Thousands of tons (10) The data shown is for Argentina, except the net hydrocarbon production of 777 and 977 thousands of barrels of oil
equivalent (kboe) in 2010 and 2009, respectively, which is United States data. (11) Including 50% shareholding in Refinerías del Norte, S.A. (“Refinor”). (12) Including 50% of “Refinor” service stations. (13) Including 100% of reported Gas Natural Fenosa sales although Repsol YPF had a 30.01% share in Gas Natural
by 31 December 2009 and 30.13% by 31 December 2010, accounted for through proportional consolidation. (14) Gigawatts per hour (GWh). (15) In 2009 this corresponds to the Gas Natural operations since the acquisition of Unión Fenosa in April.
Abbreviations used for units of measurement
“bbl”………………………………………………… Barrels “bcf”………………………………………………… Billion cubic feet “bcm”………………………………………………. Billion cubic metres “boe”…………………………………….. ……….. Barrels of oil equivalent “Btu”……………………………………… ………. British thermal unit “GWh”…………………………………… ……….. Gigawatts per hour “kbbl”………………………………………………. Thousand barrels “kbbl/d”…………………………………………….. Thousand barrels per day “kboe”……………………………………………… Thousand barrels of oil equivalent “km²”……………………………………………….. Square kilometres “Mbbl”…………………………………… ……….. Million barrels “Mboe”…………………………………... ……….. Million barrels of oil equivalent “Mm3/d”…………………………………. ……….. Million cubic metres per day “MW”……………………………………………….. Megawatts “MWe”……………………………………………… Megawatts electrical “MWh”……………………………………………… Megawatts per hour “TCF”………………………………………………. Trillion cubic feet
UPSTREAM
ACTIVITIES
The Repsol Upstream division includes oil and natural gas exploration and production activities outside Argentina. For information on the exploration and production activities conducted by YPF, see the chapter on this company and its affiliates contained in this Consolidated Management Report.
The Repsol Upstream Division manages its project portfolio with the objective of achieving profitable, diversified and sustainable growth, with a commitment to safety and the environment. Its strategy is underpinned by the following objectives: increasing production and reserves, diversifying its business geographically by increasing its presence in OECD countries, achieving operating excellence and maximising the profitability of its assets. For this, a number of measures have been taken during the last few years: there was a successful investment in human capital to promote
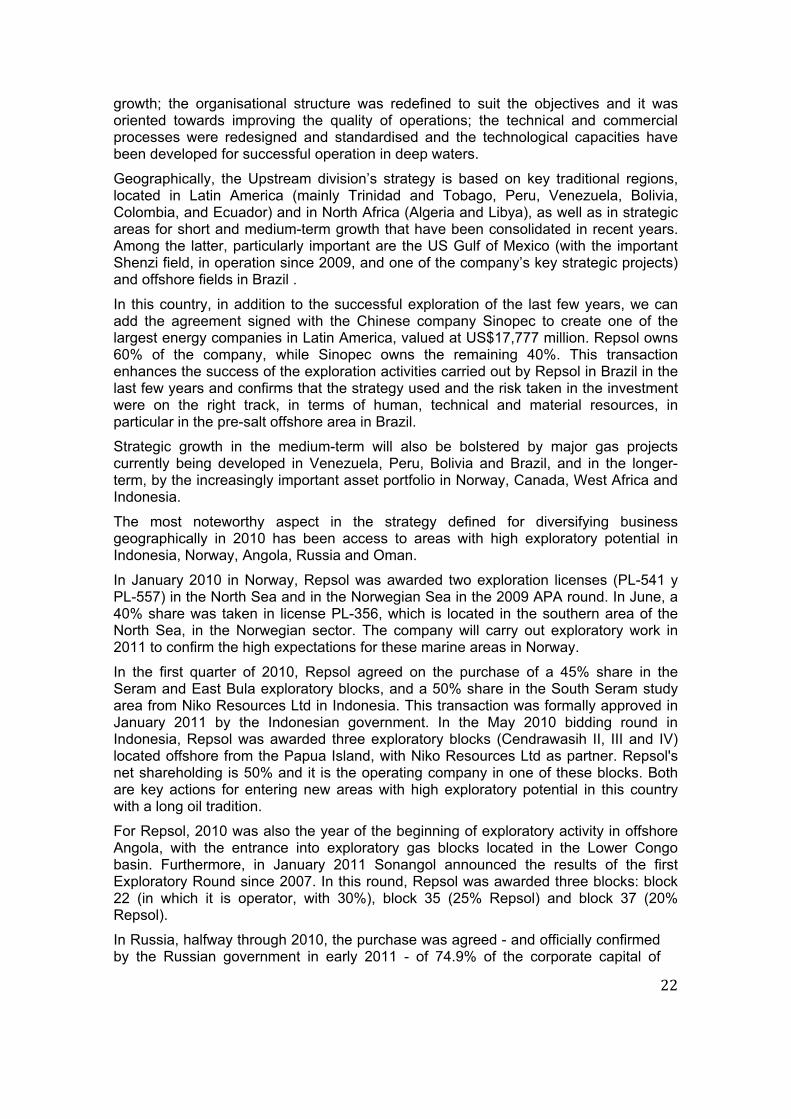
growth; the organisational structure was redefined to suit the objectives and it was oriented towards improving the quality of operations; the technical and commercial processes were redesigned and standardised and the technological capacities have been developed for successful operation in deep waters.
Geographically, the Upstream division’s strategy is based on key traditional regions, located in Latin America (mainly Trinidad and Tobago, Peru, Venezuela, Bolivia, Colombia, and Ecuador) and in North Africa (Algeria and Libya), as well as in strategic areas for short and medium-term growth that have been consolidated in recent years. Among the latter, particularly important are the US Gulf of Mexico (with the important Shenzi field, in operation since 2009, and one of the company’s key strategic projects) and offshore fields in Brazil .
In this country, in addition to the successful exploration of the last few years, we can add the agreement signed with the Chinese company Sinopec to create one of the largest energy companies in Latin America, valued at US$17,777 million. Repsol owns 60% of the company, while Sinopec owns the remaining 40%. This transaction enhances the success of the exploration activities carried out by Repsol in Brazil in the last few years and confirms that the strategy used and the risk taken in the investment were on the right track, in terms of human, technical and material resources, in particular in the pre-salt offshore area in Brazil.
Strategic growth in the medium-term will also be bolstered by major gas projects currently being developed in Venezuela, Peru, Bolivia and Brazil, and in the longer-term, by the increasingly important asset portfolio in Norway, Canada, West Africa and Indonesia.
The most noteworthy aspect in the strategy defined for diversifying business geographically in 2010 has been access to areas with high exploratory potential in Indonesia, Norway, Angola, Russia and Oman.
In January 2010 in Norway, Repsol was awarded two exploration licenses (PL-541 y PL-557) in the North Sea and in the Norwegian Sea in the 2009 APA round. In June, a 40% share was taken in license PL-356, which is located in the southern area of the North Sea, in the Norwegian sector. The company will carry out exploratory work in 2011 to confirm the high expectations for these marine areas in Norway.
In the first quarter of 2010, Repsol agreed on the purchase of a 45% share in the Seram and East Bula exploratory blocks, and a 50% share in the South Seram study area from Niko Resources Ltd in Indonesia. This transaction was formally approved in January 2011 by the Indonesian government. In the May 2010 bidding round in Indonesia, Repsol was awarded three exploratory blocks (Cendrawasih II, III and IV) located offshore from the Papua Island, with Niko Resources Ltd as partner. Repsol's net shareholding is 50% and it is the operating company in one of these blocks. Both are key actions for entering new areas with high exploratory potential in this country with a long oil tradition.
For Repsol, 2010 was also the year of the beginning of exploratory activity in offshore Angola, with the entrance into exploratory gas blocks located in the Lower Congo basin. Furthermore, in January 2011 Sonangol announced the results of the first Exploratory Round since 2007. In this round, Repsol was awarded three blocks: block 22 (in which it is operator, with 30%), block 35 (25% Repsol) and block 37 (20% Repsol).
In Russia, halfway through 2010, the purchase was agreed - and officially confirmed by the Russian government in early 2011 - of 74.9% of the corporate capital of
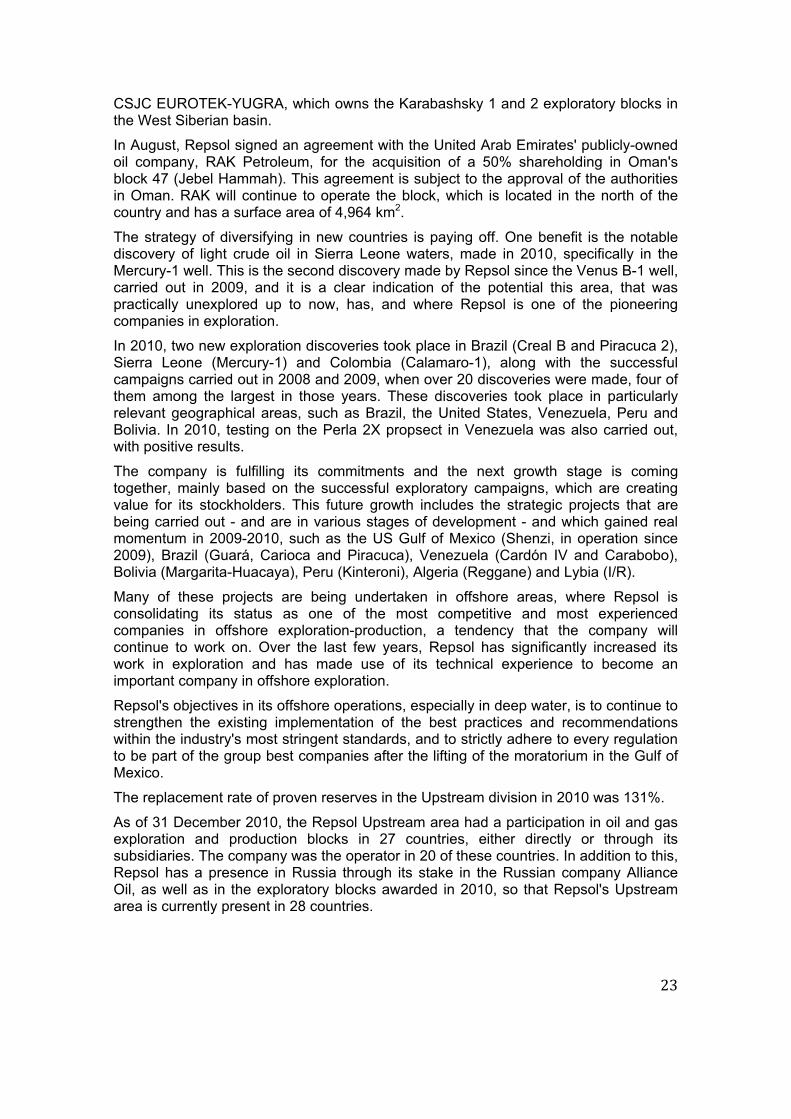
CSJC EUROTEK-YUGRA, which owns the Karabashsky 1 and 2 exploratory blocks in the West Siberian basin.
In August, Repsol signed an agreement with the United Arab Emirates' publicly-owned oil company, RAK Petroleum, for the acquisition of a 50% shareholding in Oman's block 47 (Jebel Hammah). This agreement is subject to the approval of the authorities in Oman. RAK will continue to operate the block, which is located in the north of the country and has a surface area of 4,964 km2.
The strategy of diversifying in new countries is paying off. One benefit is the notable discovery of light crude oil in Sierra Leone waters, made in 2010, specifically in the Mercury-1 well. This is the second discovery made by Repsol since the Venus B-1 well, carried out in 2009, and it is a clear indication of the potential this area, that was practically unexplored up to now, has, and where Repsol is one of the pioneering companies in exploration.
In 2010, two new exploration discoveries took place in Brazil (Creal B and Piracuca 2), Sierra Leone (Mercury-1) and Colombia (Calamaro-1), along with the successful campaigns carried out in 2008 and 2009, when over 20 discoveries were made, four of them among the largest in those years. These discoveries took place in particularly relevant geographical areas, such as Brazil, the United States, Venezuela, Peru and Bolivia. In 2010, testing on the Perla 2X propsect in Venezuela was also carried out, with positive results.
The company is fulfilling its commitments and the next growth stage is coming together, mainly based on the successful exploratory campaigns, which are creating value for its stockholders. This future growth includes the strategic projects that are being carried out - and are in various stages of development - and which gained real momentum in 2009-2010, such as the US Gulf of Mexico (Shenzi, in operation since 2009), Brazil (Guará, Carioca and Piracuca), Venezuela (Cardón IV and Carabobo), Bolivia (Margarita-Huacaya), Peru (Kinteroni), Algeria (Reggane) and Lybia (I/R).
Many of these projects are being undertaken in offshore areas, where Repsol is consolidating its status as one of the most competitive and most experienced companies in offshore exploration-production, a tendency that the company will continue to work on. Over the last few years, Repsol has significantly increased its work in exploration and has made use of its technical experience to become an important company in offshore exploration.
Repsol's objectives in its offshore operations, especially in deep water, is to continue to strengthen the existing implementation of the best practices and recommendations within the industry's most stringent standards, and to strictly adhere to every regulation to be part of the group best companies after the lifting of the moratorium in the Gulf of Mexico.
The replacement rate of proven reserves in the Upstream division in 2010 was 131%.
As of 31 December 2010, the Repsol Upstream area had a participation in oil and gas exploration and production blocks in 27 countries, either directly or through its subsidiaries. The company was the operator in 20 of these countries. In addition to this, Repsol has a presence in Russia through its stake in the Russian company Alliance Oil, as well as in the exploratory blocks awarded in 2010, so that Repsol's Upstream area is currently present in 28 countries.
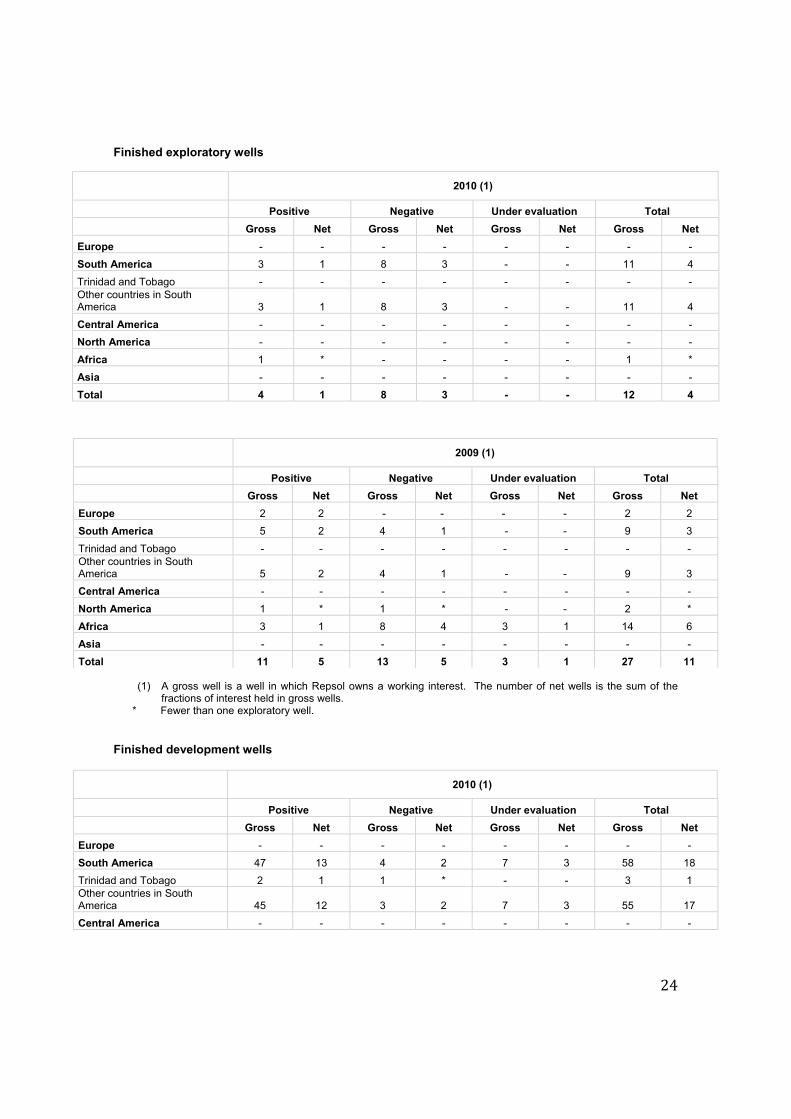
Finished exploratory wells
2010 (1)
Positive Negative Under evaluation Total Gross Net Gross Net Gross Net Gross Net Europe - - - - - - - - South America 3 1 8 3 - - 11 4 Trinidad and Tobago - - - - - - - - Other countries in South America 3 1 8 3 - - 11 4 Central America - - - - - - - - North America - - - - - - - - Africa 1 * - - - - 1 * Asia - - - - - - - -Total 4 1 8 3 - - 12 4
2009 (1)
Positive Negative Under evaluation Total Gross Net Gross Net Gross Net Gross Net Europe 2 2 - - - - 2 2 South America 5 2 4 1 - - 9 3 Trinidad and Tobago - - - - - - - - Other countries in South America 5 2 4 1 - - 9 3 Central America - - - - - - - - North America 1 * 1 * - - 2 * Africa 3 1 8 4 3 1 14 6 Asia - - - - - - - -Total 11 5 13 5 3 1 27 11
(1) A gross well is a well in which Repsol owns a working interest. The number of net wells is the sum of the fractions of interest held in gross wells.
* Fewer than one exploratory well.
Finished development wells
2010 (1)
Positive Negative Under evaluation Total Gross Net Gross Net Gross Net Gross Net Europe - - - - - - - - South America 47 13 4 2 7 3 58 18 Trinidad and Tobago 2 1 1 * - - 3 1 Other countries in South America 45 12 3 2 7 3 55 17 Central America - - - - - - - -
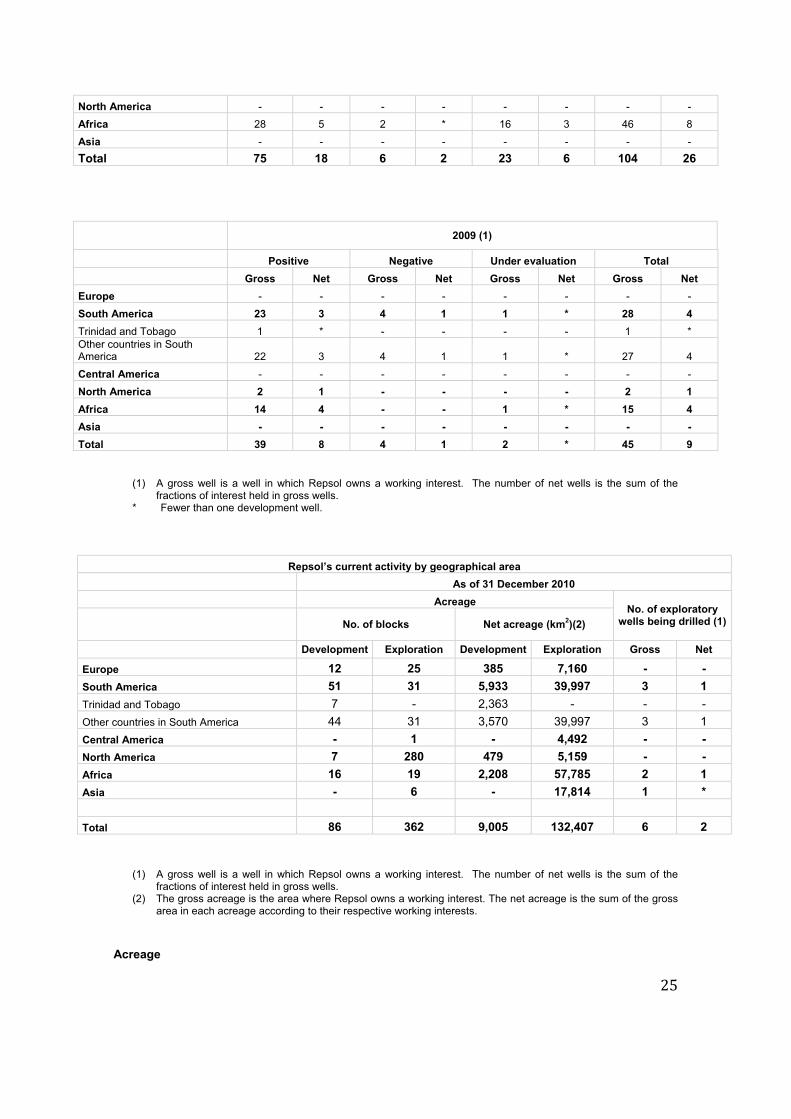
North America - - - - - - - - Africa 28 5 2 * 16 3 46 8 Asia - - - - - - - - Total 75 18 6 2 23 6 104 26
2009 (1)
Positive Negative Under evaluation Total Gross Net Gross Net Gross Net Gross Net Europe - - - - - - - - South America 23 3 4 1 1 * 28 4 Trinidad and Tobago 1 * - - - - 1 * Other countries in South America 22 3 4 1 1 * 27 4 Central America - - - - - - - - North America 2 1 - - - - 2 1 Africa 14 4 - - 1 * 15 4 Asia - - - - - - - - Total 39 8 4 1 2 * 45 9
(1) A gross well is a well in which Repsol owns a working interest. The number of net wells is the sum of the fractions of interest held in gross wells.
* Fewer than one development well.
Repsol’s current activity by geographical area As of 31 December 2010
Acreage
No. of blocks Net acreage (km2)(2) No. of exploratory
wells being drilled (1)
Development Exploration Development Exploration Gross Net
Europe 12 25 385 7,160 - - South America 51 31 5,933 39,997 3 1 Trinidad and Tobago 7 - 2,363 - - - Other countries in South America 44 31 3,570 39,997 3 1 Central America - 1 - 4,492 - - North America 7 280 479 5,159 - - Africa 16 19 2,208 57,785 2 1 Asia - 6 - 17,814 1 *
Total 86 362 9,005 132,407 6 2
(1) A gross well is a well in which Repsol owns a working interest. The number of net wells is the sum of the fractions of interest held in gross wells.
(2) The gross acreage is the area where Repsol owns a working interest. The net acreage is the sum of the gross area in each acreage according to their respective working interests.
Acreage
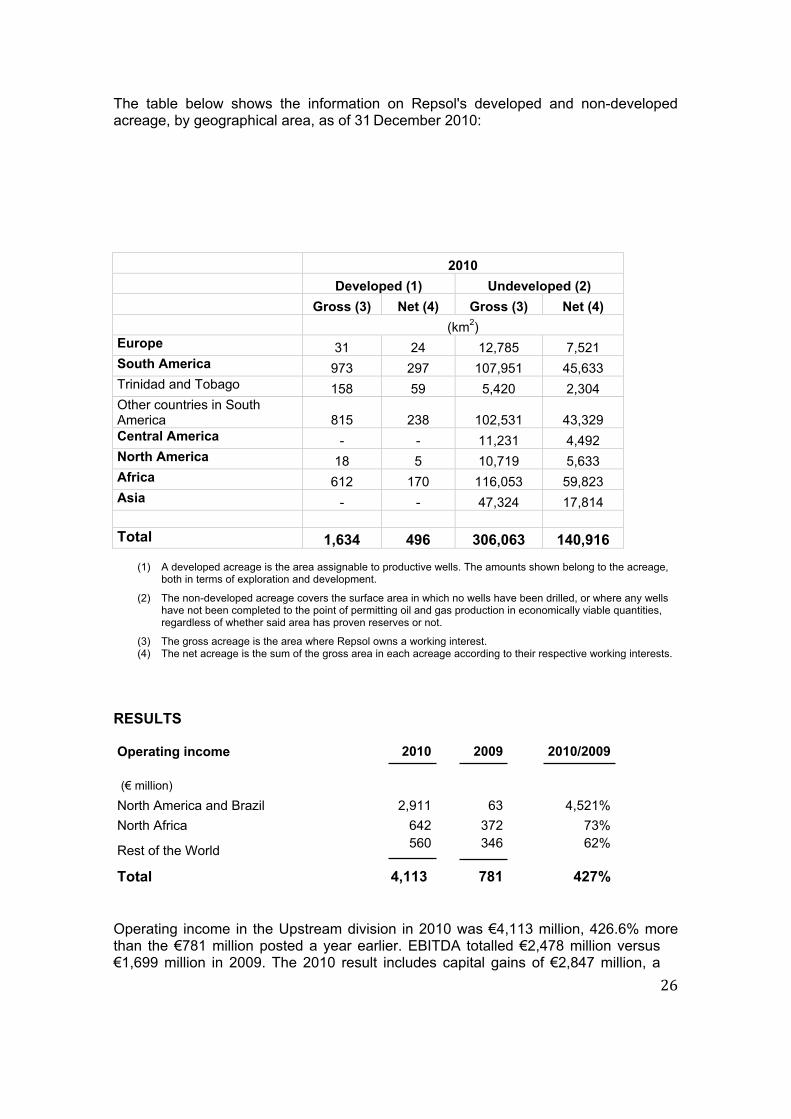
The table below shows the information on Repsol's developed and non-developed acreage, by geographical area, as of 31 December 2010:
2010Developed (1) Undeveloped (2)
Gross (3) Net (4) Gross (3) Net (4) (km2)
Europe 31 24 12,785 7,521 South America 973 297 107,951 45,633 Trinidad and Tobago 158 59 5,420 2,304 Other countries in South America 815 238 102,531 43,329 Central America - - 11,231 4,492 North America 18 5 10,719 5,633 Africa 612 170 116,053 59,823 Asia - - 47,324 17,814 Total 1,634 496 306,063 140,916
(1) A developed acreage is the area assignable to productive wells. The amounts shown belong to the acreage, both in terms of exploration and development.
(2) The non-developed acreage covers the surface area in which no wells have been drilled, or where any wells have not been completed to the point of permitting oil and gas production in economically viable quantities, regardless of whether said area has proven reserves or not.
(3) The gross acreage is the area where Repsol owns a working interest. (4) The net acreage is the sum of the gross area in each acreage according to their respective working interests.
RESULTS
Operating income 2010 2009 2010/2009
(€ million)
North America and Brazil 2,911 63 4,521% North Africa 642 372 73%
Rest of the World 560 346 62%
Total 4,113 781 427%
Operating income in the Upstream division in 2010 was €4,113 million, 426.6% more than the €781 million posted a year earlier. EBITDA totalled €2,478 million versus €1,699 million in 2009. The 2010 result includes capital gains of €2,847 million, a
consequence of the agreement reached between Repsol and Sinopec to develop joint exploration and production projects in Brazil. The result of the activity in the Upstream division, not considering the aforementioned capital gains, was better in 2010, basically due to higher oil and gas realisation prices and increased production during the period, and despite larger exploration costs and the effects of discontinuing the Persian LNG project.
The average realisation price of the Repsol oil product mix was US$ 72.6/barrel (€54.7 /barrel) versus US$ 56.7/barrel (€40.7/barrel) in 2009. The average price of gas was US$ 2.7 per thousand cubic feet, 19% higher than the previous year. These variations are in line with those experienced by benchmark prices on international markets.
The lifting cost was US$ 3.0/barrel. This amount is very similar to that seen in 2009 (US$ 2.9 per barrel). The finding costs of proven reserves averaged US$44.1/barrel in the 2008-2010 period.
DISCOVERIES
In 2010, the company took part in new discoveries, continuing its successful exploratory results of 2008 and 2009. These discoveries took place in Brazil (with the Creal B and Piracuca 2 wells), Sierra Leone (Mercury-1 well) and Colombia (Calamaro-1 well). Another highlight of 2010 was the positive results from the Perla 2X appraisal well in Venezuela, confirming and, in fact, improving the area's great potential.
Some of the discoveries in this historic stage for the company from an exploratory point of view have taken place in important locations from an exploratory point of view, such as Brazil, the United States, Venezuela, Peru, Bolivia and Algeria, and have allowed to carry out strategic development projects to guarantee the future organic growth of the company.
Furthermore, Repsol discovered gas in the RGD 22 well during the development works on the Rio Grande Area in Bolivia in 2010.
In Brazil, drilling for the Creal B well was finished in June 2010, with a positive result in the pre-salt objective, which could significantly increase the potential of the remaining reserves in this important offshore field. The Albacora Leste field (Santos basin), in which Repsol holds a 10% interest, has been producing since April 2006.
In May 2010, the exploratory well Piracuca-2 in the BM-S-7 development block, located in the Brazilian offshore area (Santos basin) was finished with positive results. This is the third positive well drilled after the two that were carried out in 2009 (Pialamba and Piracuca-1). After the positive exploratory and appraisal results of 2009, confirmed in 2010 with the Piracuca-2 well, it was decided that development works in the block should begin, with a view to starting production by 2015.
In November 2010 a second deepwater discovery in Sierra Leone was announced, this time with the Mercury-1 well, which confirms the high potential of this area, virtually unexplored up to now, where Repsol is one of the pioneering companies. The discovering well is in block SL-07B-10, at a depth of 4,862 metres, under 1,600 metres of water. The oil found is a 41-metre column. Repsol, along with its partners Anadarko and Tullow, is appraising the positive tests obtained and studying the drilling of new wells to assess the commercial viability of the area. The Mercury-1 well was drilled about 64 kilometres southeast of the 2009 Venus B-1 discovery.
By the end of the year, the Calamaro-1 well, in Colombia, made an exploratory discovery in the Rondón block, located in the Llanos basin.
On 12 April 2010, Repsol announced the end of the Perla 2X appraisal well with positive results, in the Cardón IV block, located in Venezuelan waters. This well, drilled under 60 metres of water, went through 840 feet (260 metres) of net pay. The result of this well confirmed and indeed revised expectations upwards on the recoverable gas resources in this block, estimated at 8 trillion cubic feet (TCF) of gas after the discovery in 2009 with the Perla 1X well. In fact, after drilling the Perla 2X well, the Ministry of Energy and Petroleum of Venezuela (MPPEP) approved the new resource estimate amounting to 9 TCF, confirming the Perla megafield as the largest gas discovery in Repsol's history, and one of the most important in Venezuela.
In the exploration phase, Repsol is operating the Cardón IV block, in a 50% interest agreement with the Italian company ENI. In the block's future development phase, which is still being defined, PDVSA, Venezuela's national oil company, would have 35% interest in the project, along with Repsol (32.5%) and ENI (32.5%).
In Bolivia in August 2010, Repsol, as part of the YPFB Andina consortium, announced a large gas discovery in the Rio Grande Area with the RGD 22 development well. This area, with production since 1968 in geological formations different from the one discovered in 2010, is 55 kilometres southeast of the city of Santa Cruz de la Sierra. Repsol discovered this gas deposit while working to deepen existing wells in order to increase production in this field. The finding will provide an estimated total resources of 1TCF of gas, which is about 10 months' gas consumption in Spain. Since Rio Grande already has the necessary infrastructure, the new resources could be in production shortly.
The production tests in the RGD 22 well have shown a flow rate of 6 million cubic feet/day and 160 barrels of condensate. Future drillings will allow for a more accurate definition of the size of the find.
In January 2011 the company announced the positive result of the Carioca NE appraisal well in the prolific BM-S-9 block, in deep water off the coast of Brazil.
PRODUCTION
Repsol's hydrocarbon production in 2010 (excluding YPF) was 344,256 barrels of oil equivalent/day, up 3.2% on 2009's figures. This increase derives mainly from activities in Peru, due to the start-up of the Peru LNG liquefaction plant in June 2010, in the United States after the start-up of Shenzi in March 2009, in Libya, as a result of the increase in the quota and in Venezuela through the incorporation of Barua Motatan, partially compensated by the sale of Barrancas, both in February 2010. All of this was partially offset by lower production in Algeria, especially due to the change of ratio in 2010, based on the application of contract terms and in Brazil (due to the decline of Albacora Leste). Isolating the impact of higher benchmark prices in PSCs (Production Sharing Contracts), production would have increased 6% compared to 2009.
It should be pointed out that the extended well test on the Guará field in offshore block BM-S-9 in Brazil began on 25 December 2010 and this test is expected to last for five months.
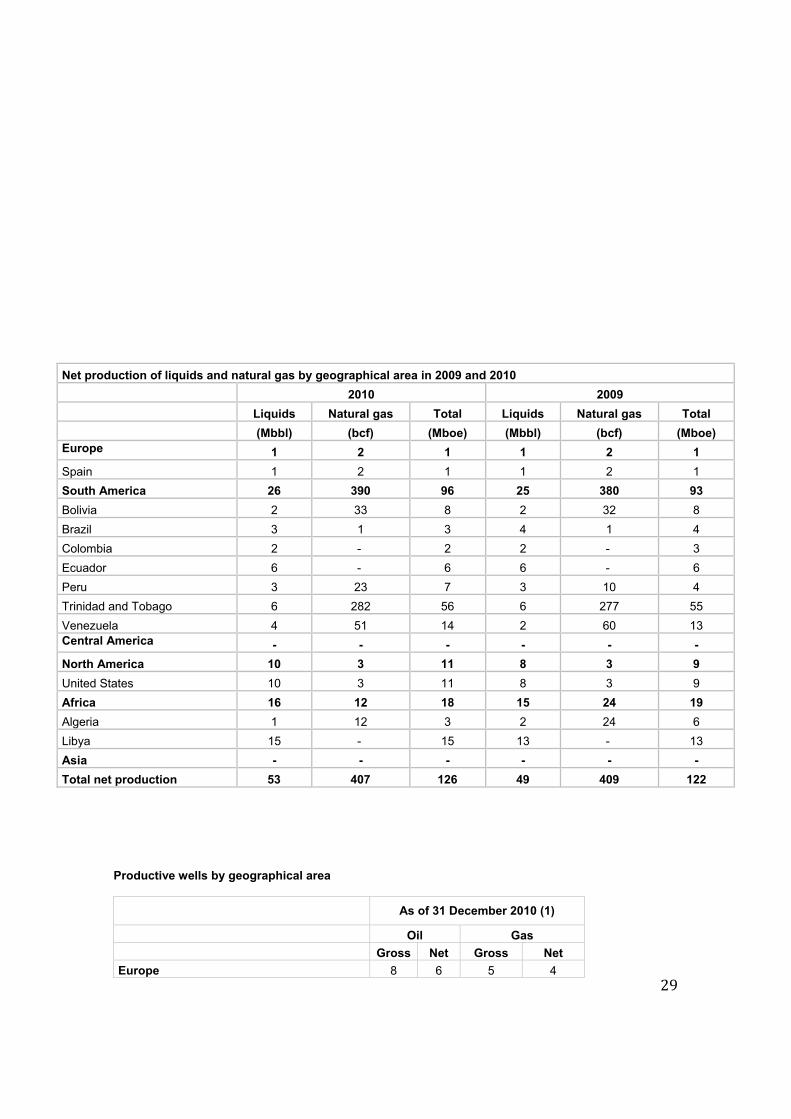
Net production of liquids and natural gas by geographical area in 2009 and 20102010 2009
Liquids Natural gas Total Liquids Natural gas Total (Mbbl) (bcf) (Mboe) (Mbbl) (bcf) (Mboe)
Europe 1 2 1 1 2 1 Spain 1 2 1 1 2 1 South America 26 390 96 25 380 93 Bolivia 2 33 8 2 32 8 Brazil 3 1 3 4 1 4 Colombia 2 - 2 2 - 3 Ecuador 6 - 6 6 - 6 Peru 3 23 7 3 10 4 Trinidad and Tobago 6 282 56 6 277 55 Venezuela 4 51 14 2 60 13 Central America - - - - - - North America 10 3 11 8 3 9 United States 10 3 11 8 3 9 Africa 16 12 18 15 24 19 Algeria 1 12 3 2 24 6 Libya 15 - 15 13 - 13 Asia - - - - - - Total net production 53 407 126 49 409 122
Productive wells by geographical area
As of 31 December 2010 (1)
Oil Gas Gross Net Gross Net Europe 8 6 5 4
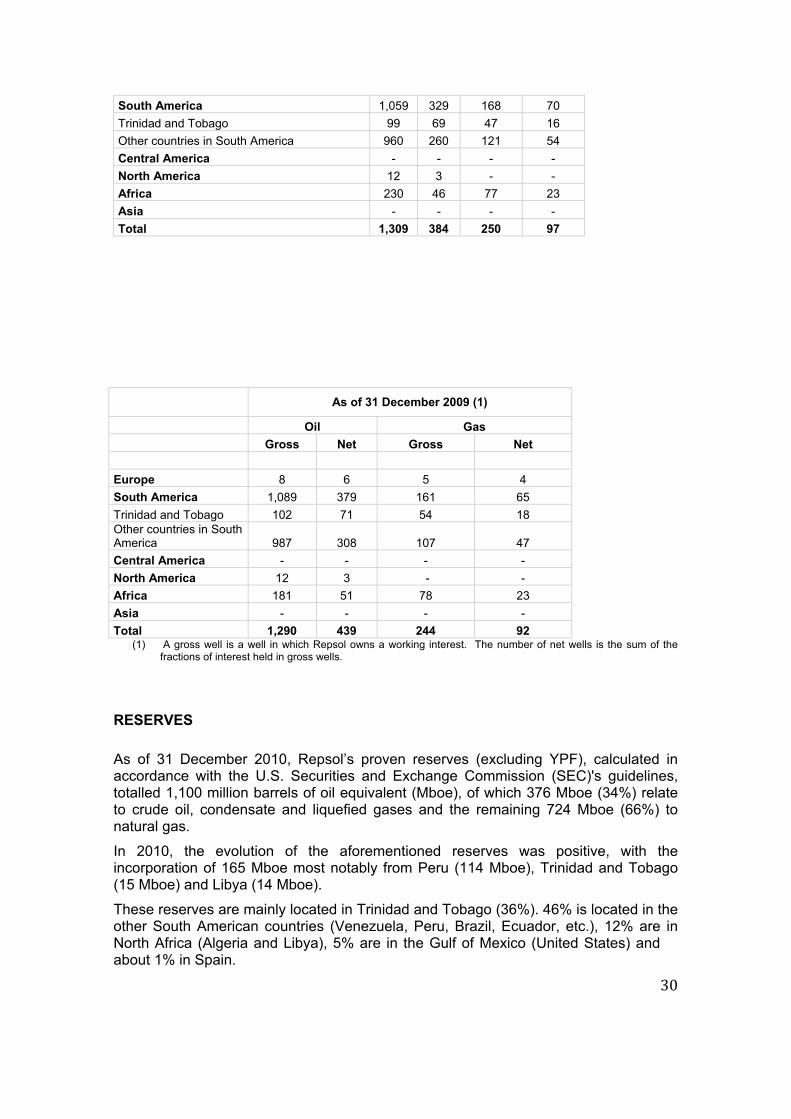
South America 1,059 329 168 70 Trinidad and Tobago 99 69 47 16 Other countries in South America 960 260 121 54 Central America - - - - North America 12 3 - - Africa 230 46 77 23 Asia - - - - Total 1,309 384 250 97
As of 31 December 2009 (1)
Oil Gas Gross Net Gross Net
Europe 8 6 5 4 South America 1,089 379 161 65 Trinidad and Tobago 102 71 54 18 Other countries in South America 987 308 107 47 Central America - - - - North America 12 3 - - Africa 181 51 78 23 Asia - - - - Total 1,290 439 244 92
(1) A gross well is a well in which Repsol owns a working interest. The number of net wells is the sum of the fractions of interest held in gross wells.
RESERVES
As of 31 December 2010, Repsol’s proven reserves (excluding YPF), calculated in accordance with the U.S. Securities and Exchange Commission (SEC)'s guidelines, totalled 1,100 million barrels of oil equivalent (Mboe), of which 376 Mboe (34%) relate to crude oil, condensate and liquefied gases and the remaining 724 Mboe (66%) to natural gas.
In 2010, the evolution of the aforementioned reserves was positive, with the incorporation of 165 Mboe most notably from Peru (114 Mboe), Trinidad and Tobago (15 Mboe) and Libya (14 Mboe).
These reserves are mainly located in Trinidad and Tobago (36%). 46% is located in the other South American countries (Venezuela, Peru, Brazil, Ecuador, etc.), 12% are in North Africa (Algeria and Libya), 5% are in the Gulf of Mexico (United States) and about 1% in Spain.
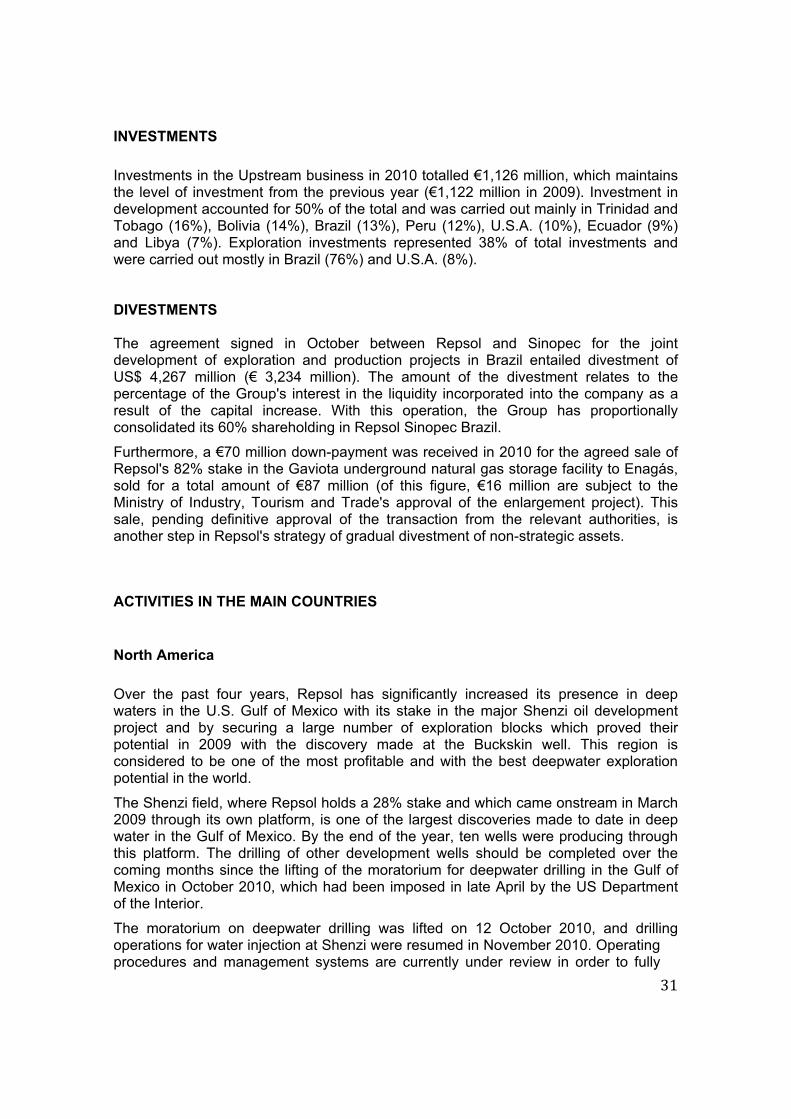
INVESTMENTS
Investments in the Upstream business in 2010 totalled €1,126 million, which maintains the level of investment from the previous year (€1,122 million in 2009). Investment in development accounted for 50% of the total and was carried out mainly in Trinidad and Tobago (16%), Bolivia (14%), Brazil (13%), Peru (12%), U.S.A. (10%), Ecuador (9%) and Libya (7%). Exploration investments represented 38% of total investments and were carried out mostly in Brazil (76%) and U.S.A. (8%).
DIVESTMENTS
The agreement signed in October between Repsol and Sinopec for the joint development of exploration and production projects in Brazil entailed divestment of US$ 4,267 million (€ 3,234 million). The amount of the divestment relates to the percentage of the Group's interest in the liquidity incorporated into the company as a result of the capital increase. With this operation, the Group has proportionally consolidated its 60% shareholding in Repsol Sinopec Brazil.
Furthermore, a €70 million down-payment was received in 2010 for the agreed sale of Repsol's 82% stake in the Gaviota underground natural gas storage facility to Enagás, sold for a total amount of €87 million (of this figure, €16 million are subject to the Ministry of Industry, Tourism and Trade's approval of the enlargement project). This sale, pending definitive approval of the transaction from the relevant authorities, is another step in Repsol's strategy of gradual divestment of non-strategic assets.
ACTIVITIES IN THE MAIN COUNTRIES
North America
Over the past four years, Repsol has significantly increased its presence in deep waters in the U.S. Gulf of Mexico with its stake in the major Shenzi oil development project and by securing a large number of exploration blocks which proved their potential in 2009 with the discovery made at the Buckskin well. This region is considered to be one of the most profitable and with the best deepwater exploration potential in the world.
The Shenzi field, where Repsol holds a 28% stake and which came onstream in March 2009 through its own platform, is one of the largest discoveries made to date in deep water in the Gulf of Mexico. By the end of the year, ten wells were producing through this platform. The drilling of other development wells should be completed over the coming months since the lifting of the moratorium for deepwater drilling in the Gulf of Mexico in October 2010, which had been imposed in late April by the US Department of the Interior.
The moratorium on deepwater drilling was lifted on 12 October 2010, and drilling operations for water injection at Shenzi were resumed in November 2010. Operating procedures and management systems are currently under review in order to fully
comply with the new regulatory demands for the drilling of additional exploration and production wells. In 2010, production levels on the Shenzi platform exceeded 105,000 bbl/d. The objective of the future investment plan is to maintain an annual production plateau in the range of 100,000 to 120,000 boe/d for the next five years and includes a secondary recovery project via water injection, which will be operative by mid-2012. Development of the Shenzi North Flank is at an earlier stage, although the successful results of drilling work carried out in 2009 have increased the forecast potential of this area. The first delineation well in these formations is planned for 2011.
The appraisal well for the Buckskin discovery, which was initially planned for drilling in 2010, has been rescheduled for 2011. This delay is due to the drilling moratorium imposed by the United States in 2010; however, this does not affect the estimated start of production for this field in 2017. This appraisal well will help define the future development plan for the field. Repsol, as the project's operator in its exploratory phase, made this major discovery in 2009. At a depth of more than 10,000 metres, this is the deepest well operated by Repsol to date and one of the deepest wells in this region.
In March 2010, Repsol was awarded 16 new exploration blocks in exploration round 213, in the Gulf of Mexico; five of them with a 100% stake and the rest in partnership with Ecopetrol (five with a 60% stake, another five with 40% and a last block with a 50% stake). These blocks are in the Mississippi Canyon, Garden Banks, Walker Ridge and Keathley Canyon basins. In addition to the aforementioned 16 blocks, Repsol also obtained interests in another two blocks made available during exploration round 213 in Mississippi Canyon and Keathley Canyon through agreements with the awardee companies,.
In Alaska, Repsol holds a 20% interest in 71 adjacent offshore blocks in the Beaufort Sea, alongside Shell Offshore Inc. and Eni Petroleum US LLC. Researches are being conducted to establish their exploratory potential. The company also has a 100% stake in 93 offshore blocks in the Chukchi Sea.
These assets, along with those awarded over the last few years, form a large and solid exploration project portfolio in the United States, with over 275 blocks. The company’s participation in these rounds is in-keeping with its diversification and growth strategy in OECD countries.
In Canada, during 2010, Repsol continued to expand its geological knowledge on the available areas in order to assess the value of the opportunities that are arising in this country. The company is already actively participating in three blocks in the Newfoundland (Terranova) and Labrador offshore areas. Two of these blocks are located in the Central Ridge/Flemish Pass area and another in Jeanne d’Arc Basin. Furthermore, in the Exploration Round carried out at the end of 2010, Repsol obtained a 25% stake in blocks NL 10-01 and NL 10-02 in the Jeanne d’Arc Basin area, which are awaiting official ratification from the Canadian authorities.
Latin America
Brazil
2010 marked a very important milestone in the strategy in this key area for the company. In October, the partnership between Repsol and Sinopec in Brazil was announced to create one of the largest private energy companies in Latin America. On 28 December 2010, the Shareholders' Board of Repsol Brasil approved a capital
increase of more than US$ 7,111 million, entirely subscribed by Sinopec, resulting in a company valued at US$17,777 million. After this operation, Repsol holds 60% of the company's corporate capital and Sinopec, the largest Chinese oil company, holds the remaining 40%. The funding provided by this operation will allow the company to undertake the investments needed for the full development of its assets in Brazil, including some of the largest discoveries in the world, like those in the Guará and Carioca blocks. Repsol and Sinopec will continue working on their expansion plans in Brazil and will take part, jointly or separately, in future bidding rounds in the country. This transaction between two leading companies, highlights the successful exploratory activities that Repsol has been carrying out in Brazil during the last few years.
The offshore area of Brazil is one of the largest growth areas in the world in terms of oil reserves. The agreement signed between Repsol and Sinopec is an example of the great international interest in this historic time for Brazil, especially regarding the activity in the pre-salt area of the Santos basin.
Repsol is one of the leading independent energy companies in Brazil, in terms of exploration and production. It enjoys a strategic position in the areas with the greatest potential of the Brazilian pre-salt zone and also leads the exploratory activity in the prolific Santos basin, along with Petrobras and BG. The company has a large, diversified asset portfolio, including a field already in production (Albacora Leste) and other assets with big discoveries made over the last few years, among which, the BM-S-9 block in the Santos basin, is especially important, with discoveries like Guará, Carioca, Iguazu Norte and Abare Oeste, as well as the Piracuca field, located in the BM-S-7 block (currently in the development stage) and Panoramix, in block BM-S-48 (674).
In the Guará area, the Guará North appraisal well was finished in August 2010, with positive results confirming the high reserve potential of this field. During 2010, the preliminary works were carried out in order to conduct an extended well test (EWT) which will take five months, starting in December 2010. Also, there were agreements made to set up an additional drilling rig and to build a second floating production storage and offloading unit (FPSO). These works are intended to start the development of this area, with a view to starting production in 2013.
In 2010, the drilling of an appraisal well was started in the northeast zone of the Carioca area structure, with the purpose of obtaining definitive data in order to define a development plan for the field and its future production start-up, as well as conducting extended well tests (EWT), scheduled for 2011, and the drilling of an additional well. The company announced the positive results from this appraisal well (Carioca NE) in January 2011.
The BM-S-9 block has an exploration potential that should be assessed over the next two years. Two other exploration discoveries were made in 2009 (Iguazu North and Abare West), so the expectations for the rest of the block are also high.
The development plan approved in 2009 for the Piracuca field (block BM-S-7) was continued in 2010, with the objective of starting production by 2015. The exploration well Piracuca-2 in this block of the offshore area of Brazil, was finished in May 2010 with positive results. The two previous exploration appraisal wells carried out in this field in 2009 also had positive results and were the reason behind the present development of this field.
Repsol holds a 10% interest in the Albacora Leste field (Campos basin), which has
been producing since April 2006. Drilling for the Creal B well in this major deepwater Brazilian oil field was finished in June 2010, with a positive result in the pre-salt objective.
The important exploration discoveries made in recent years, the development projects that are being carried out and the agreement reached with Sinopec bolster the company’s strategy in offshore Brazil and represent one of the key growth projects in the Upstream division.
Bolivia
The consortium involved in the major Margarita-Huacaya gas project, one of the company's strategic initiatives, decided to begin the work on the development of Phase I in 2010. A consortium comprising Repsol (operator with a 37.5% stake), BG (37.5%) and PAE (25%) is undertaking this key project at the Margarita and Huacaya fields, in the north of Tarija state. The objective of the joint development project for the Margarita and Huacaya fields (the latter, found in 2008, was one of the five largest discoveries made in the world that year) is to increase the field’s current output (2.3 Mm3/d) to an intermediate plateau of 8.3 Mm3/d in 2012, and possibly increasing the production in a second phase to 14 Mm3/d in 2013. Within the context of this development plan, the signing of a building contract for the new gas processing plant in Campo Margarita to increase current production capacity to 8.3 Mm3/d was announced in July 2010. The building works on the plant are estimated to finish within 20 months of signing the contract.
In August 2010, as part of the development drilling programme for the Rio Grande Area, located 55 kilometres southeast of the city of Santa Cruz de la Sierra, Repsol announced a large gas discovery in Bolivia in the RGD 22 development well, successfully finishing a project to deepen existing wells for the purposes of increasing the country's oil production. The finding will provide estimated total resources of 1TCF of gas. Since Rio Grande already has the necessary infrastructure, these resources could be in production shortly.
Peru
In June 2010, the natural gas supply from the Camisea field, in which Repsol holds a 10% stake, to the Peru LNG liquefaction plant, in which the company has a 20% interest, was started. The Camisea field is made up by blocks 56 and 88, and its production is aimed at the local market and at supplying the Peru LNG liquefaction plant. There are two fields in block 88: San Martin (onstream since 2004) and Cashiriari (onstream since 2009). In block 56, the Pagoreni field came onstream in 2008.
In 2010, works began on the plan for the early development of the southern part of the major discovery made in 2008 with the Kinteroni well in block 57 (one of the largest discoveries made in the world that year) located in the Ucayali-Madre de Dios basin in the country’s central forest, 50 kilometres from the Camisea gas and condensate field. Repsol, with a 53.84% stake, is the operator of this block.
The early development of southern Kinteroni involves drilling two new wells and the workover of the 2008 discovery well. Before the start of the drilling phase, the approval of the required Environmental Impact Study was obtained in 2010. The drilling of the first development well started in August 2010, which finished in the fourth quarter of the same year. Drilling of the second development well and the workover of the discovery well will be carried out in 2011. Production is expected to start in 2012.
In October 2010, Perupetro awarded (pending official confirmation) exploration licenses for blocks 176, 180, 182 and 184 in the Sub-Andean Belt, to a consortium formed by Repsol (25% and operator), Ecopetrol (50%) and YPF (25%). These areas complete Repsol's exploratory positioning in the Peruvian Sub-Andean Belt. Also in 2010, Repsol obtained a 30% stake in block 101 operated by the Talisman and located in the Marañon basin.
Venezuela
Two important milestones concerning key projects for the company were reached in 2010: the discovery made with the Perla 2X appraisal well, in the Cardón IV block, and entering into the Carabobo-1 project.
In April, preliminary results from the Perla 2X appraisal well confirmed, and even improved, expectations of recoverable gas resources in this block after the major discovery in 2009 with the Perla 1X well (8 TCF). Repsol operates with a 50% stake with the Italian company ENI, the consortium that made the discovery in Cardón IV block, where the Perla megafield is located in shallow waters of the Gulf of Venezuela.
In June, the Ministry of Energy and Petroleum of Venezuela (MPPEP) approved the evaluation plan for the Cardón IV block, which includes drilling the Perla 3X, concluded in 2010 with positive results, and Perla 4X delineation wells, started in 2010, as well as the optional drilling of another well. Furthermore, the MPPEP approved the new resource estimate, about 9 TCF, after the drilling of the Perla 2X well.
In February 2010, a consortium of international companies led by Repsol, with an 11% share, was awarded the Carabobo-1 project by the Venezuelan government. This project involves the development, along with PDVSA, of the heavy crude oil reserves in the Carabobo 1 Norte and Carabobo 1 Centro blocks located in the Orinoco Oil Belt, one of the areas with the largest undeveloped oil reserves in the world. The Carabobo area is located on the eastern side of the belt which, according to the US Geological Survey, could have a recoverable volume of up to 513 billion barrels of heavy crude oil. The estimated production that could be reached with this project is 400,000 barrels of oil per day for 40 years. The project includes building a heavy oil upgrader with a processing capacity of about 200,000 barrels of oil/day.
In May 2010, the Petrocarabobo S.A. mixed-ownership company was formed in Caracas, which is in charge of the development of the heavy crude oil reserves in the Carabobo project.
The Carabobo project will allow Repsol to increase its production and its resources, in line with its targets. Part of the heavy crude oil in the project will be sent to Repsol's Spanish refineries, which will allow the company to profit from their investment in advanced deep conversion techniques in those premises.
The Barua-Motatan productive area was effectively incorporated on 1 February 2010 as an asset to be operated by the Petroquiriquire S.A. mixed-ownership company. Back in 2009, the Venezuelan National Assembly had already stated that the development of activities by the mixed-ownership company Petroquiriquire had been approved, by means of publication in the Official Gazette of the Bolivarian Republic of Venezuela. Repsol holds a 40% stake in this mixed-ownership company, and the approved activities are to be carried out in the Barua-Motatan area, located in the Lake Maracaibo basin. The Barua-Motatan production was incorporated to Petroquiriquire S.A. on 10 February 2010. As a result, Repsol used the credit received during the process of migrating of operating contracts into mixed-ownership companies.
Trinidad and Tobago
Repsol continues to be one of the main private companies in this country, in terms of oil and gas production and reserves, along with BP, with whom it shares the ownership of the bpTT company. This enterprise, in which Repsol holds a 30% stake, operates a large productive oil area in the country's offshore zone, which in 2010 produced a total daily average of over 470,000 boe.
Furthermore, Repsol, with a 70% stake, is the operator of the TSP sea block.
Other countries
In the exploration bidding round carried out in 2010, Colombia's National Oil Agency (ANH) awarded two offshore blocks (Cayos-1 and Cayos-5), pending official confirmation, to the consortium formed by Repsol (35%), Ecopetrol (50%) and YPF (15%). In January 2011, Repsol signed an agreement with the Colombian company Ecopetrol and the Brazilian company Petrobras to acquire a share in the Tayrona offshore exploration block, located in Colombian Caribbean waters, near La Guajira peninsula. After this agreement, Repsol's interest in the block is 30%, while Ecopetrol owns another 30% and Petrobras, which will continue to operate the block, holds the remaining 40%. The operation is subject to the ANH's approval.
In Guyana in 2010, Repsol carried out the preliminary works for the drilling of the Jaguar-1X well, scheduled for the second quarter of 2011. The well is located in the Georgetown sea block and Repsol operates it while holding a 15% stake, the other partners being YPF (30%), Tullow Oil (30%) and CGX Energy (25%).
In Cuba in January 2010, Repsol signed a lease contract with Saipem to use the Scarabeo-9 drilling rig, which complies with all the technical requirements and all the limitations established by the US administration for drilling operations in Cuba. This, along with the rest of the preliminary works carried out during 2010, will allow drilling to start on the Jagüey exploration well in the second half of 2011.
In Ecuador on 23 November 2010, the modification of the sharing contract for the exploration and exploitation of oil and gas in Block 16 was agreed. The new contract was that of a service contract will be valid until 2018, and came into effect on 1 January 2011. Likewise, on 22 January 2011, the service contract for the Tivacuno Block was signed.
Africa
Repsol’s significant presence in North Africa is mainly concentrated in Libya and Algeria, countries where it holds a stake in major projects that will ensure sustained and profitable growth over the coming years. In addition, the company is consolidating its presence in West Africa, in particular in Sierra Leone, where in 2010 the Mercury-1 well yielded an important discovery. Repsol also has a stake in exploration blocks in Liberia, Angola and Equatorial Guinea.
Libya
2010 saw the completion of important works within the development plan for the “I/R” field, which started production in June 2008 and is expected to reach its maximum output potential between 2012 and 2013 once the permanent facilities are finished, with a production plateau of 75 kbbl/d. Repsol holds an interest in this field, situated in the NC 186 and NC 115 blocks in the prolific Murzuq basin. Discovered in 2006, the “I/R” field, one of the most important exploration findings in the company’s history and the most important one in Libya in the last decade, is one of the key growth projects defined by Repsol.
Therefore, in 2010 the four manifolds included in the development plan for the field started operations, as well as the definitive crude export line towards NC115 block's central facilities. The installations for water injection in the field were finished in 2010, and injection began at the end of the year.
Production at the “K” field in block NC186 came on stream in May 2010. This development plan had been approved by the Libyan National Oil Company, NOC, in December 2008. There are two producing wells in this field.
Algeria
In January 2010, Repsol signed an agreement with Sonatrach and the National Agency for the Assessment of Oil Resources (ALNAFT) of Algeria for the exploration and exploitation of the Sud-Est Illizi block, located in the southeast of Algeria. The consortium developing the exploration activities is formed by Repsol (52.5%) as the operator, the Italian company Enel (27.5%) and the French-Belgian GdF-Suez (20%).
The awarding of this new block in December 2009, reinforces Repsol's position in Algeria, where the company has an important presence in the Reggane, Tinfouye Tabenkort and Tifernine areas, and confirms this country as one of the company's growth areas.
Regarding the major gas project in Reggane, during 2010 the company worked with the Algerian authorities on the final steps to launch a development plan for the block, and works are scheduled to start in 2011. The Development Plan includes the drilling and completion of 74 wells, further drilling work to deepen 10 additional wells, and workovers on another 12 existing wells. Gas production is expected to start in late 2014 or 2015. Repsol is the operator in this project, with a share of 29.25%, while RWE owns 19.5%; Edison, 11.25%; and Sonatrach, the Algerian national company, the remaining 40%.
Sierra Leone
During 2010, Repsol and its partners Anadarko and Tullow, made a second deepwater discovery in this country. This new hydrocarbon discovery, made in the Mercury-1 well, is a clear indication of the potential of an area that has been virtually unexplored up to now. New wells will be drilled to determine the commercial viability of the zone.
This discovery adds to the success of the Venus B-1 well, in which gas and liquid hydrocarbons were found at a depth of 5,639 metres. The Mercury-1 well was drilled about 64 kilometres southeast of the Venus B-1 well.
Repsol is a pioneering company in the exploration of this African region. The
company's operations, started in 2003, have discovered an area with a high potential, and where further exploration will be carried out in collaboration with its partners.
Europe
Norway
In January 2010, during the APA 2009 round, the Norwegian government awarded two new exploration licenses (PL-541 and PL-557), specifically in the North Sea and the Norwegian Sea, to two consortiums in which Repsol is involved.
Repsol is the operator of the PL-541 license, located in the Norwegian part of the North Sea. The company holds a 50% stake in this contract, along with the Italian company Edison (35%) and the Norwegian Skagen (15%). This award is the first for Repsol as an operator on the Norwegian Continental Shelf (NCS), and implies the Norwegian authorities' recognition, highly rated in the sector, of the company's abilities.
Regarding the second license, PL-557, located in the Norwegian Sea, Repsol holds a 40% stake in partnership with the Austrian OMV (50% and operator) and the Norwegian company Skagen (10%).
Furthermore, in June 2010 Repsol acquired a 40% stake in the PL-356 licence, operated by DetNorske which holds the remaining 60%, and which is located in the southern area of the North Sea, in the Norwegian sector.
In 2009, Repsol opened a permanent office in Oslo, Norway’s capital, in line with its geographical diversification and with the objective of increasing the company’s presence in this Scandinavian country.
Spain
During the year, Repsol made progress in the works towards the development of the oil fields discovered in 2009, Montanazo D-5 and Lubina-1, in the Mediterranean Sea. The production plan schedules them to come onstream in 2011 through the Casablanca platform, will make it possible to extend production of Repsol’s existing fields in this area (Casablanca, Boqueron, Rodaballo, and Chipiron) as well as the useful life of this platform.
In 2010, Repsol finished and submitted the Environmental Impact Study, and also the equipment's detail engineering to the authorities, and requested the operating license.
Also in 2010, Repsol was awarded the Turbon exploration block in the South Pyrenean basin.
LIQUEFIED NATURAL GAS (LNG)
ACTIVITY AND CONTEXT
LNG activities include the liquefaction, transportation, marketing, and regasification of liquefied natural gas, in addition to electricity generation activities in Spain not conducted by Gas Natural Fenosa and natural gas marketing in North America. Since 1 January 2008, the information in this section refers solely to the Repsol Group's LNG commercial segment. For information on YPF’s LNG activities, please refer to the chapter on this company and its affiliates contained in this Consolidated Management Report.
The LNG market in 2010 was marked by the recovery of gas demand, both in Europe and in the Far East. In Europe, the increase in the first six months was about 10% more than the previous year.
Regarding prices, the year began with the American market and its benchmark, the Henry Hub (HH), setting the market price and defining the spot transactions in the Atlantic basin. However, in the second quarter of the year, the American market began to lose ground against the European market and the National Balancing Point (NBP) became the benchmark for the spot transactions, both in the Atlantic and in the Pacific basins. The market took advantage of differentials of up to US$ 4.5/Mbtu between the NBP and the HH to carry out several diversions from the American terminals to Europe.
The drop in the American benchmark could be related to the lower production cost of shale gas. The NBP has kept its value, helped by the decline of the North Sea reserves and by the UK gas sales to Central Europe (an alternative to Brent-indexed long term contracts).
With regard to the power generation market, the average Spanish electricity pool price in 2010 was €37.0/MWh, similar to the price in 2009. Electricity demand in the peninsula during 2010 was 259,940 GWh, 3.2% higher than in 2009. With the temperature effect adjustments, annual growth was 2.9% versus the 4.8% fall recorded in 2009.
Regarding the production balance in Spain, the most significant fact was the outstanding 59% growth of hydraulic power generation, which covered 14% of the demand versus 9% in 2009. At the other end of the scale were the coal and combined cycle groups, where production has dropped off markedly compared to the previous period, 34% and 17%, respectively.
RESULTS
The operating income from LNG operations was €105 million in 2010 in comparison with the negative result of €61 million a year earlier. 2010 EBITDA was €277 million compared to the €150 million recorded in 2009.
The improvement in these results is mainly due to larger LNG trading margins and volumes in 2010, partially offset by the effects of discontinuing the Persian LNG project. In 2009, this area's operating income was negative, a figure that includes the losses stemming from adverse arbitration decisions such as the Gassi Touil dispute.
ASSETS AND PROJECTS
One of the milestones in 2010 was the start-up of the Peru LNG liquefaction plant in Pampa Melchorita, in June, in which Repsol holds a 20% interest, and of a gas
pipeline linking up with the existing one in Ayacucho. The other partners in Peru LNG are Hunt Oil (50%), SK Energy (20%) and Marubeni (10%). The Camisea consortium, in which Repsol also has a 10% stake, supplies natural gas to this plant.
This plant, with a nominal capacity of 4.4 million tons per year, processes 17 million m3
of gas per day. It has the two largest storage tanks in Peru (with a capacity of 130,000 m3 each) and a sea terminal over one kilometre long to receive ships with capacities between 90,000 and 173,000m3.
Additionally, the project includes Repsol’s exclusive marketing of the liquefaction plant’s entire production. The term of the gas purchase agreement entered into with Peru LNG is 18 years from the start of commercial operations. This is the largest LNG acquisition ever made by Repsol in terms of volume.
In September 2007, Repsol was awarded a contract in an international tender sponsored by the Federal Electricity Commission (CFE) for the supply of LNG to the natural gas terminal in the port of Manzanillo on Mexico’s Pacific coast. The contract entails supplying over 67 bcm of LNG to the Mexican plant over a fifteen-year period. The Manzanillo plant, which will supply gas to the CFE power plants in the central-western area of Mexico, will receive gas from Peru LNG, and is set to start operations in the second half of 2011.
The start of production in the Canaport LNG regasification plant, a Repsol (75%) and Irving Oil (25%) partnership, took place in June 2009. This is the first LNG regasification plant on Canada’s eastern shore. Located in Saint John (New Brunswick) and with an initial send-out capacity of 10 bcm/year (1 billion cubic feet per day), the Canaport terminal is one of the largest in North America and supplies markets on the eastern coast of Canada and the north-eastern United States. Repsol, the operator of this plant, supplies the LNG that feeds the terminal and is entitled to the entire regasification capacity. The third tank, which started operations in April 2010, can receive loads from the largest LNG carriers in the world.
A multi-year LNG supply agreement was signed in 2010 with Qatargas for the Canaport LNG plant. The supply will be carried out using Q-Flex and Q-Max carriers, the largest in the world, whose capacities are 210,000 and 260,000 m3, respectively, Canaport LNG one of the few plants in the world that can receive these ships at its offshore terminal. This agreement bolsters Repsol's position as a reliable, diversified and flexible natural gas provider for the Canadian and north-eastern American markets.
Repsol is present in the Trinidad and Tobago integrated LNG project, in which it holds a interest alongside BP, BG and others, in the Atlantic LNG liquefaction plant. The strategic geographical location of this plant enables it to supply markets in the Atlantic Basin (Europe, the United States, and the Caribbean) under very advantageous economic conditions.
This plant has four liquefaction trains with a combined capacity of 15 million tons per year. Repsol holds a 20% stake in train 1, a 25% stake in trains 2 and 3, and 22.22% in train 4 (the latter is one of the largest in the world, with an output capacity of 5.0 million tons/year). In addition to its interests in the liquefaction trains, Repsol plays a leading role in gas supplies and is one of the main purchasers of LNG.
Repsol holds a 25% stake in Bahia de Bizkaia Electricidad S.L. (BBE), This company owns a combined cycle power plant with 800 MWe installed capacity. The plant uses natural gas delivered by BBG as its main feedstock. Power generated at this plant is fed to the grid for residential, commercial, and industrial consumption. In 2010, the availability rate of the plant, situated in Bilbao Harbour, was 83% and the load factor was less than 46%, both parameters much
lower than in 2009, due to the scheduled stoppage in October 2010, when it reached 48,000 operating hours, and another unscheduled stoppage due to problems found during this review. Furthermore, generation was lower in the first half of the year, because of the increase in hydraulic and renewable power generation.
In 2010, Repsol sold its 25% share in BBG; Enagas bought 15% of it, while the Basque Energy Agency (EVE) and a German infrastructure fund purchased 5% each. This company owns a regasification plant with unloading facilities for methane tankers of up to 140,000 m3; two 150,000 m3 LNG storage tanks, and a vaporisation capacity of 800,000 Nm3/hour. Its enlargement has been further supplemented by building a third 150,000 m3 storage tank and improving its regasification capacity by an extra 400,000 Nm3/hour.
In December 2007, Repsol and Gas Natural SDG signed a shareholders’ agreement with Sonangol Gas Natural (Sonagas) with the aim of starting work on developing an integrated gas project in Angola. This initiative involves the appraisal of gas reserves to determine the investments that would be required for their development and export in the form of liquefied natural gas. In accordance with the timetable, Repsol and Gas Natural SDG, through Gas Natural West Africa (GNWA) were involved in the exploration activities currently being undertaken by Sonagas, the operator of the consortium in which GNWA holds a 20% interest, followed by Sonagas (40%), Eni (20%), Galp (10%), and Exem (10%).
As part of the significant structural and legal progress achieved to date, an office was set up in Luanda and gas and mining rights were awarded by the Government of Angola. The Concession Decree was approved by the Council of Ministers, confirmed by the National Assembly and published in the Official Gazette. In addition to this, the Risk Service Agreement was signed in July 2010.
Moreover, drilling on the Garoupa-2 well was finished in January 2011. As it progresses, it will allow for the assessment of the consortium’s potential gas resources in this field.
In Brazil, Repsol signed a contract in December 2009 to join the consortium formed by Petrobras (51.1%), BG (16.3%), Galp (16.3%) and Repsol (16.3%) which will be responsible for the technical engineering studies–Front End Engineering Design (FEED)–prior to the installation of a floating LNG plant in the BSM-9 and BSM-11 fields. These studies serve to assess the floating liquefaction plant's technical and economic viability. Three parallel studies are being conducted with three different consortiums to reduce technical uncertainties in a trailblazing development for the LNG industry and to create the necessary competition among the various contractors in order to optimise development and construction costs. The results of these studies will also be compared with other logistical solutions for extracting gas in the Brazilian pre-salt area in order to select the best option for capitalising on these resources. In the event that the project is finally declared feasible, Repsol will be guaranteed the option of participating in the construction of the plant.
In May 2010, Repsol notified the National Iranian Oil Company (NIOC) and Shell of its intention to discontinue its participation in the Persian LNG project.
LNG TRANSPORT AND MARKETING
The Repsol-Gas Natural LNG (Stream) 50-50% joint venture is one of the leading LNG
marketing and transport companies in the world and one of the most important operators in the Atlantic basin. One of this company's objectives is to optimise management of both partners' fleets, which includes 15 gas tankers.
In 2010, Repsol, with management support from Stream, marketed 6.7 bcm of LNG, 49% more than in 2009, most of which was from Trinidad and Tobago and the new Peru LNG liquefaction plant, which was started up in June 2010. The cargoes' main destination was Spain and Canaport LNG, although there were sales both in the Atlantic basin (Europe and America) and in the Pacific basin.
Regarding ships, at year-end 2010, Repsol had seven LNG vessels, and a further two whose ownership is shared (50%) with Gas Natural Fenosa, all of them under time charter agreements, with a total capacity of 1,248,630 m3. Four of these methane tankers were added during 2010, linked to the start-up of the Peru LNG project, one from Naviera Elcano and three more from Knutsen OAS. The four ships have a nominal capacity of 175,000 cubic metres of LNG each and are equipped with state-of-the-art technology.
In addition to this, Repsol has leased a further two LNG vessels for 33 months and occasionally rents vessels for short-term leases.
INVESTMENTS
Investments in the LNG business in 2010 totalled €82 million, 34% less than the €125 million invested in 2009. This amount was mainly used to build the third tank for the Canaport LNG regasification terminal, as well as the Floating LNG Brazil and Angola LNG projects.
DIVESTMENTS
In July 2010, Repsol sold its 25% share in BBG to Enagas and other minor shareholders, for €31 million.
DOWNSTREAM
The Repsol Group Downstream business comprises the supply and trading, refining and marketing of oil and oil products, LPG and chemicals. The information in this section does not include YPF's activities. For information on YPF's Downstream activities, please see the section on this company and its affiliates contained in this Consolidated Management Report.
RESULTS
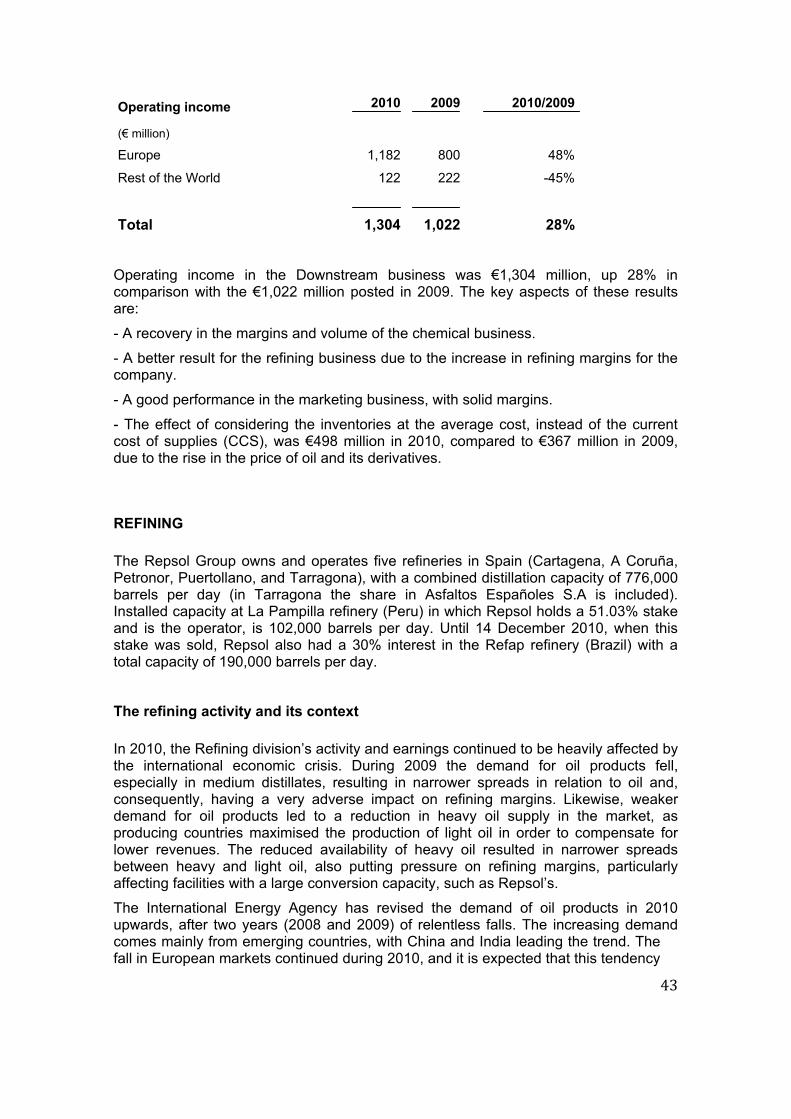
Operating income 2010 2009 2010/2009
(€ million)
Europe 1,182 800 48%
Rest of the World 122 222 -45%
Total 1,304 1,022 28%
Operating income in the Downstream business was €1,304 million, up 28% in comparison with the €1,022 million posted in 2009. The key aspects of these results are:
- A recovery in the margins and volume of the chemical business.
- A better result for the refining business due to the increase in refining margins for the company.
- A good performance in the marketing business, with solid margins.
- The effect of considering the inventories at the average cost, instead of the current cost of supplies (CCS), was €498 million in 2010, compared to €367 million in 2009, due to the rise in the price of oil and its derivatives.
REFINING
The Repsol Group owns and operates five refineries in Spain (Cartagena, A Coruña, Petronor, Puertollano, and Tarragona), with a combined distillation capacity of 776,000 barrels per day (in Tarragona the share in Asfaltos Españoles S.A is included). Installed capacity at La Pampilla refinery (Peru) in which Repsol holds a 51.03% stake and is the operator, is 102,000 barrels per day. Until 14 December 2010, when this stake was sold, Repsol also had a 30% interest in the Refap refinery (Brazil) with a total capacity of 190,000 barrels per day.
The refining activity and its context
In 2010, the Refining division’s activity and earnings continued to be heavily affected by the international economic crisis. During 2009 the demand for oil products fell, especially in medium distillates, resulting in narrower spreads in relation to oil and, consequently, having a very adverse impact on refining margins. Likewise, weaker demand for oil products led to a reduction in heavy oil supply in the market, as producing countries maximised the production of light oil in order to compensate for lower revenues. The reduced availability of heavy oil resulted in narrower spreads between heavy and light oil, also putting pressure on refining margins, particularly affecting facilities with a large conversion capacity, such as Repsol’s.
The International Energy Agency has revised the demand of oil products in 2010 upwards, after two years (2008 and 2009) of relentless falls. The increasing demand comes mainly from emerging countries, with China and India leading the trend. The fall in European markets continued during 2010, and it is expected that this tendency
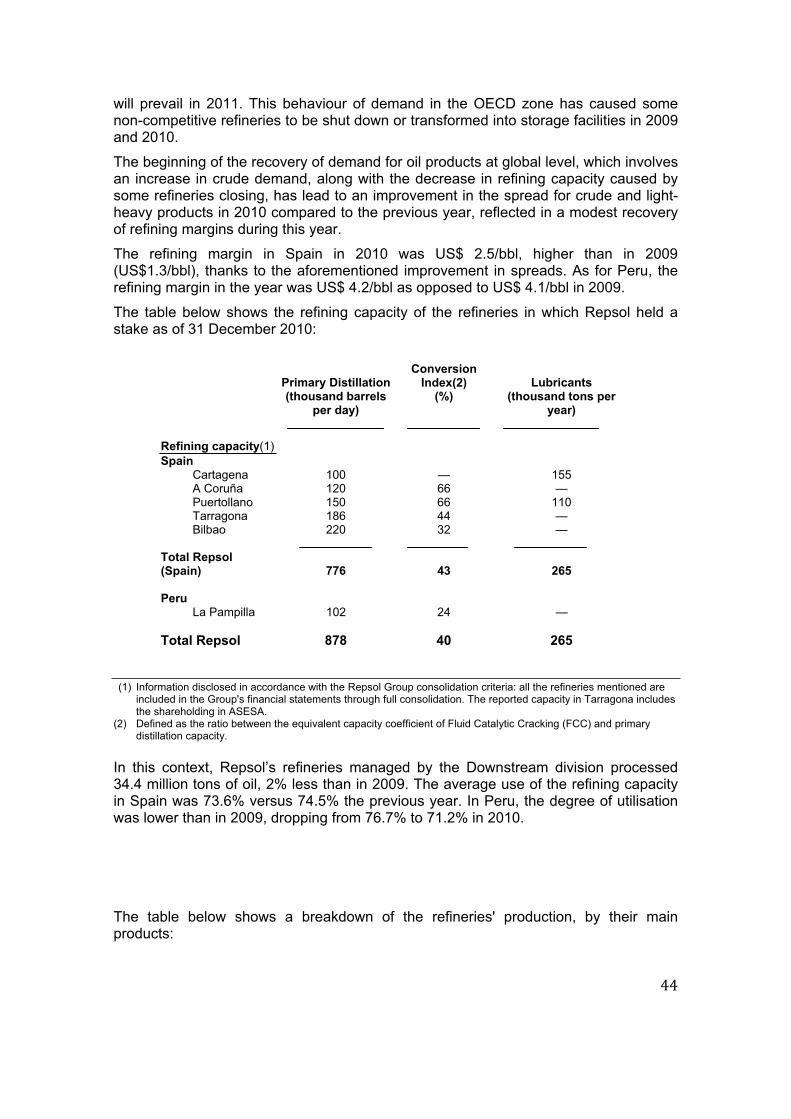
will prevail in 2011. This behaviour of demand in the OECD zone has caused some non-competitive refineries to be shut down or transformed into storage facilities in 2009 and 2010.
The beginning of the recovery of demand for oil products at global level, which involves an increase in crude demand, along with the decrease in refining capacity caused by some refineries closing, has lead to an improvement in the spread for crude and light-heavy products in 2010 compared to the previous year, reflected in a modest recovery of refining margins during this year.
The refining margin in Spain in 2010 was US$ 2.5/bbl, higher than in 2009 (US$1.3/bbl), thanks to the aforementioned improvement in spreads. As for Peru, the refining margin in the year was US$ 4.2/bbl as opposed to US$ 4.1/bbl in 2009.
The table below shows the refining capacity of the refineries in which Repsol held a stake as of 31 December 2010:
Primary DistillationConversion
Index(2) Lubricants
Refining capacity(1)
(thousand barrels per day)
(%) (thousand tons per year)
Spain Cartagena 100 — 155 A Coruña 120 66 — Puertollano 150 66 110 Tarragona 186 44 — Bilbao 220 32 —
Total Repsol (Spain) 776 43 265 Peru
La Pampilla 102 24 — Total Repsol 878 40 265
(1) Information disclosed in accordance with the Repsol Group consolidation criteria: all the refineries mentioned are included in the Group's financial statements through full consolidation. The reported capacity in Tarragona includes the shareholding in ASESA.
(2) Defined as the ratio between the equivalent capacity coefficient of Fluid Catalytic Cracking (FCC) and primary distillation capacity.
In this context, Repsol’s refineries managed by the Downstream division processed 34.4 million tons of oil, 2% less than in 2009. The average use of the refining capacity in Spain was 73.6% versus 74.5% the previous year. In Peru, the degree of utilisation was lower than in 2009, dropping from 76.7% to 71.2% in 2010.
The table below shows a breakdown of the refineries' production, by their main products:
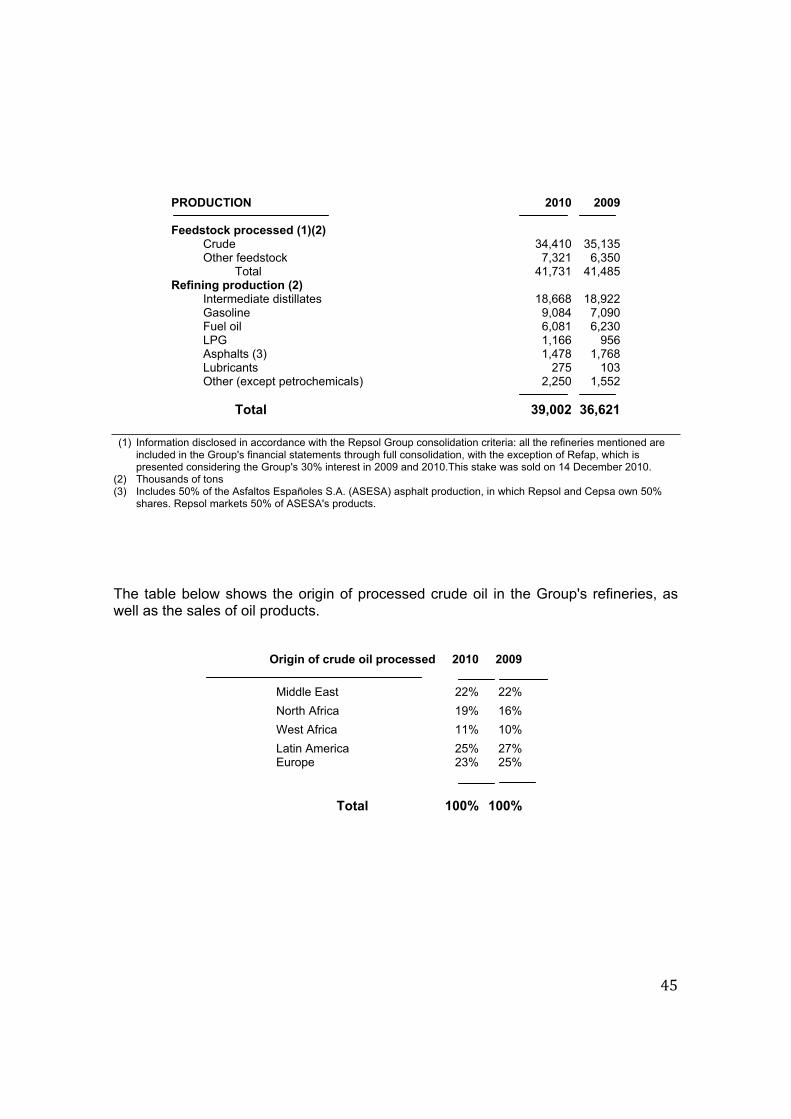
PRODUCTION 2010 2009
Feedstock processed (1)(2)Crude 34,410 35,135Other feedstock 7,321 6,350
Total 41,731 41,485Refining production (2)
Intermediate distillates 18,668 18,922Gasoline 9,084 7,090Fuel oil 6,081 6,230LPG 1,166 956Asphalts (3) 1,478 1,768Lubricants 275 103Other (except petrochemicals) 2,250 1,552
Total 39,002 36,621
(1) Information disclosed in accordance with the Repsol Group consolidation criteria: all the refineries mentioned are included in the Group's financial statements through full consolidation, with the exception of Refap, which is presented considering the Group's 30% interest in 2009 and 2010.This stake was sold on 14 December 2010.
(2) Thousands of tons (3) Includes 50% of the Asfaltos Españoles S.A. (ASESA) asphalt production, in which Repsol and Cepsa own 50%
shares. Repsol markets 50% of ASESA's products.
The table below shows the origin of processed crude oil in the Group's refineries, as well as the sales of oil products.
Origin of crude oil processed 2010 2009
Middle East 22% 22% North Africa 19% 16% West Africa 11% 10% Latin America 25% 27% Europe 23% 25%
Total 100% 100%
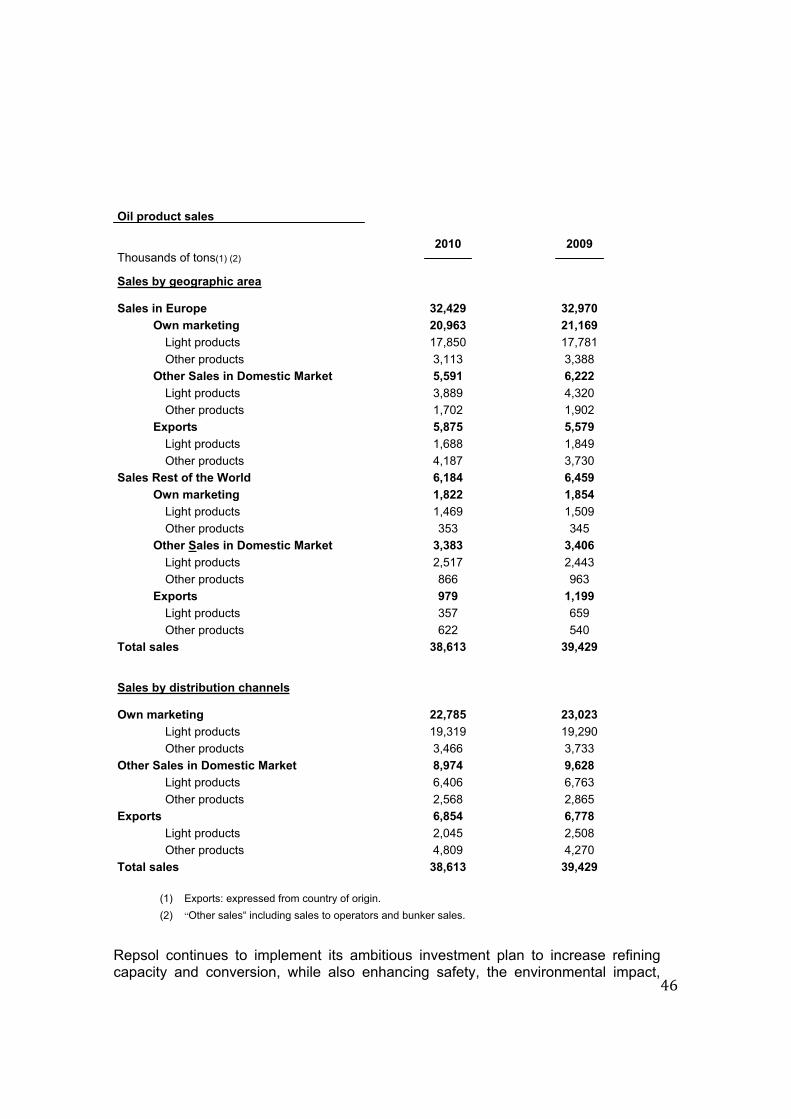
Oil product sales
Thousands of tons(1) (2)2010 2009
Sales by geographic area
Sales in Europe 32,429 32,970 Own marketing 20,963 21,169
Light products 17,850 17,781 Other products 3,113 3,388
Other Sales in Domestic Market 5,591 6,222Light products 3,889 4,320Other products 1,702 1,902
Exports 5,875 5,579Light products 1,688 1,849Other products 4,187 3,730
Sales Rest of the World 6,184 6,459Own marketing 1,822 1,854
Light products 1,469 1,509Other products 353 345
Other Sales in Domestic Market 3,383 3,406Light products 2,517 2,443Other products 866 963
Exports 979 1,199Light products 357 659Other products 622 540
Total sales 38,613 39,429
Sales by distribution channels
Own marketing 22,785 23,023 Light products 19,319 19,290 Other products 3,466 3,733
Other Sales in Domestic Market 8,974 9,628Light products 6,406 6,763Other products 2,568 2,865
Exports 6,854 6,778Light products 2,045 2,508Other products 4,809 4,270
Total sales 38,613 39,429
(1) Exports: expressed from country of origin. (2) “Other sales“ including sales to operators and bunker sales.
Repsol continues to implement its ambitious investment plan to increase refining capacity and conversion, while also enhancing safety, the environmental impact,
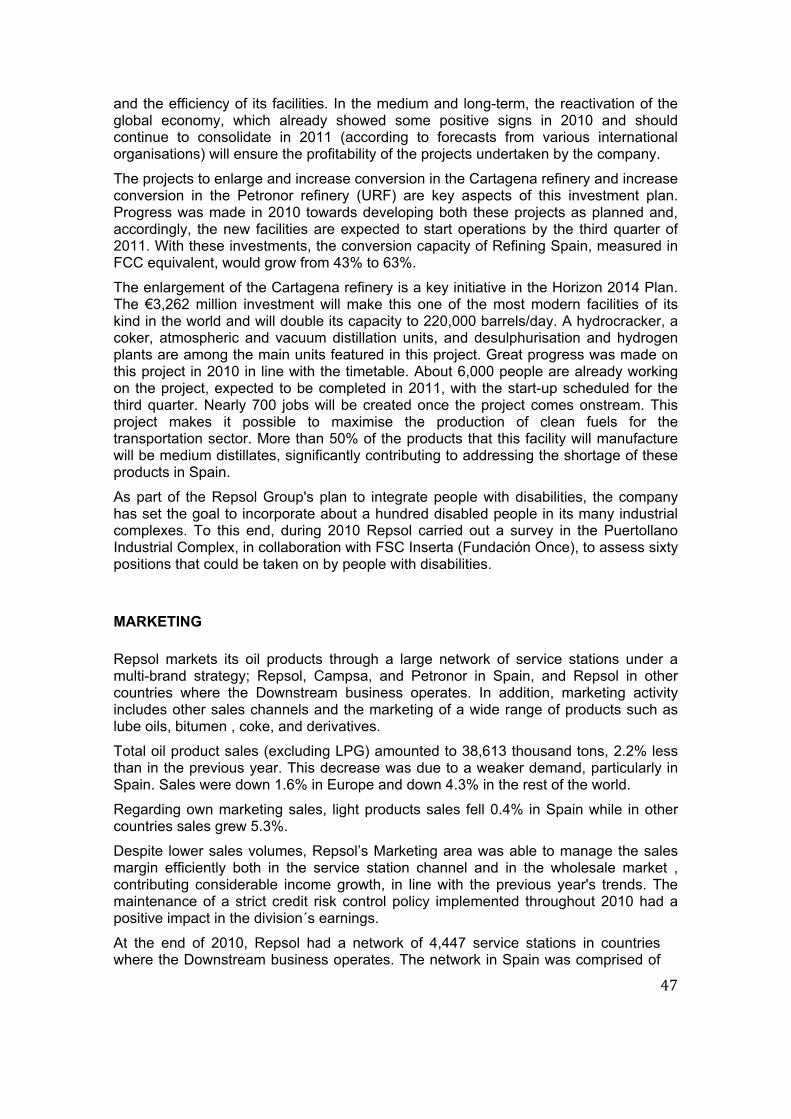
and the efficiency of its facilities. In the medium and long-term, the reactivation of the global economy, which already showed some positive signs in 2010 and should continue to consolidate in 2011 (according to forecasts from various international organisations) will ensure the profitability of the projects undertaken by the company.
The projects to enlarge and increase conversion in the Cartagena refinery and increase conversion in the Petronor refinery (URF) are key aspects of this investment plan. Progress was made in 2010 towards developing both these projects as planned and, accordingly, the new facilities are expected to start operations by the third quarter of 2011. With these investments, the conversion capacity of Refining Spain, measured in FCC equivalent, would grow from 43% to 63%.
The enlargement of the Cartagena refinery is a key initiative in the Horizon 2014 Plan. The €3,262 million investment will make this one of the most modern facilities of its kind in the world and will double its capacity to 220,000 barrels/day. A hydrocracker, a coker, atmospheric and vacuum distillation units, and desulphurisation and hydrogen plants are among the main units featured in this project. Great progress was made on this project in 2010 in line with the timetable. About 6,000 people are already working on the project, expected to be completed in 2011, with the start-up scheduled for the third quarter. Nearly 700 jobs will be created once the project comes onstream. This project makes it possible to maximise the production of clean fuels for the transportation sector. More than 50% of the products that this facility will manufacture will be medium distillates, significantly contributing to addressing the shortage of these products in Spain.
As part of the Repsol Group's plan to integrate people with disabilities, the company has set the goal to incorporate about a hundred disabled people in its many industrial complexes. To this end, during 2010 Repsol carried out a survey in the Puertollano Industrial Complex, in collaboration with FSC Inserta (Fundación Once), to assess sixty positions that could be taken on by people with disabilities.
MARKETING
Repsol markets its oil products through a large network of service stations under a multi-brand strategy; Repsol, Campsa, and Petronor in Spain, and Repsol in other countries where the Downstream business operates. In addition, marketing activity includes other sales channels and the marketing of a wide range of products such as lube oils, bitumen , coke, and derivatives.
Total oil product sales (excluding LPG) amounted to 38,613 thousand tons, 2.2% less than in the previous year. This decrease was due to a weaker demand, particularly in Spain. Sales were down 1.6% in Europe and down 4.3% in the rest of the world.
Regarding own marketing sales, light products sales fell 0.4% in Spain while in other countries sales grew 5.3%.
Despite lower sales volumes, Repsol’s Marketing area was able to manage the sales margin efficiently both in the service station channel and in the wholesale market , contributing considerable income growth, in line with the previous year's trends. The maintenance of a strict credit risk control policy implemented throughout 2010 had a positive impact in the division´s earnings.
At the end of 2010, Repsol had a network of 4,447 service stations in countries where the Downstream business operates. The network in Spain was comprised of
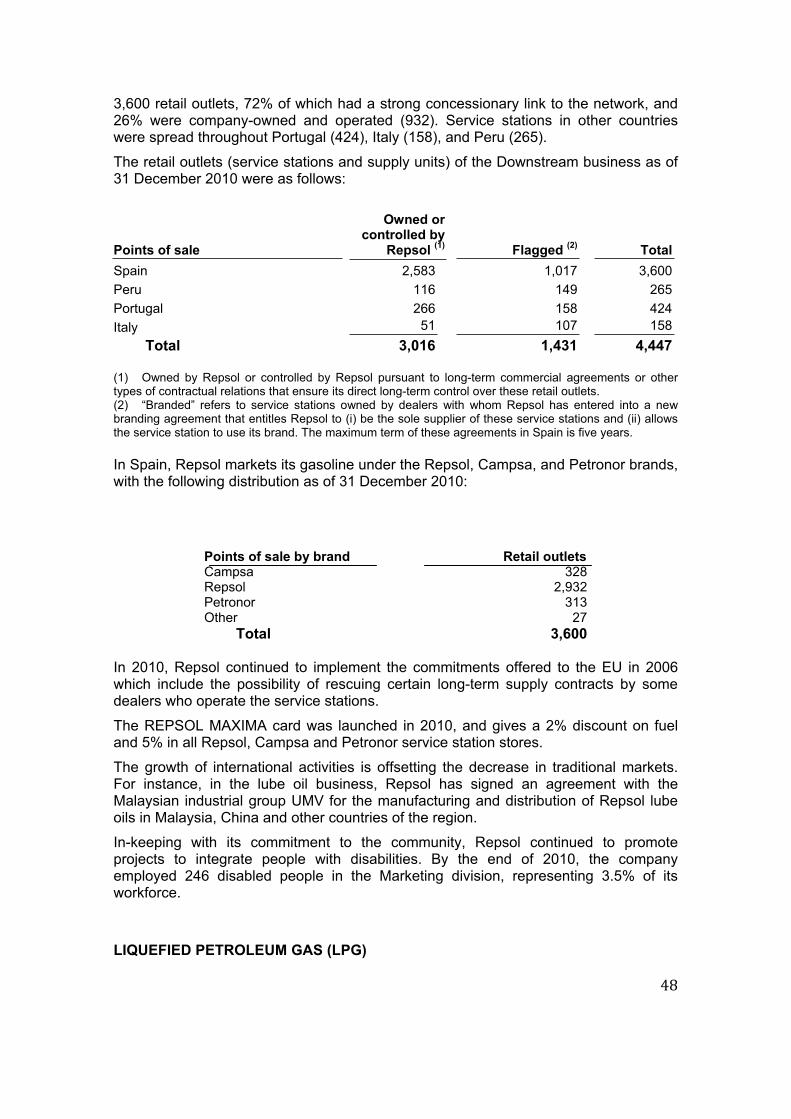
3,600 retail outlets, 72% of which had a strong concessionary link to the network, and 26% were company-owned and operated (932). Service stations in other countries were spread throughout Portugal (424), Italy (158), and Peru (265).
The retail outlets (service stations and supply units) of the Downstream business as of 31 December 2010 were as follows:
Points of sale
Owned or controlled by
Repsol (1) Flagged (2) TotalSpain 2,583 1,017 3,600Peru 116 149 265Portugal 266 158 424Italy 51 107 158
Total 3,016 1,431 4,447
(1) Owned by Repsol or controlled by Repsol pursuant to long-term commercial agreements or other types of contractual relations that ensure its direct long-term control over these retail outlets. (2) “Branded” refers to service stations owned by dealers with whom Repsol has entered into a new branding agreement that entitles Repsol to (i) be the sole supplier of these service stations and (ii) allows the service station to use its brand. The maximum term of these agreements in Spain is five years.
In Spain, Repsol markets its gasoline under the Repsol, Campsa, and Petronor brands, with the following distribution as of 31 December 2010:
Points of sale by brand Retail outlets Campsa 328Repsol 2,932Petronor 313Other 27
Total 3,600
In 2010, Repsol continued to implement the commitments offered to the EU in 2006 which include the possibility of rescuing certain long-term supply contracts by some dealers who operate the service stations.
The REPSOL MAXIMA card was launched in 2010, and gives a 2% discount on fuel and 5% in all Repsol, Campsa and Petronor service station stores.
The growth of international activities is offsetting the decrease in traditional markets. For instance, in the lube oil business, Repsol has signed an agreement with the Malaysian industrial group UMV for the manufacturing and distribution of Repsol lube oils in Malaysia, China and other countries of the region.
In-keeping with its commitment to the community, Repsol continued to promote projects to integrate people with disabilities. By the end of 2010, the company employed 246 disabled people in the Marketing division, representing 3.5% of its workforce.
LIQUEFIED PETROLEUM GAS (LPG)
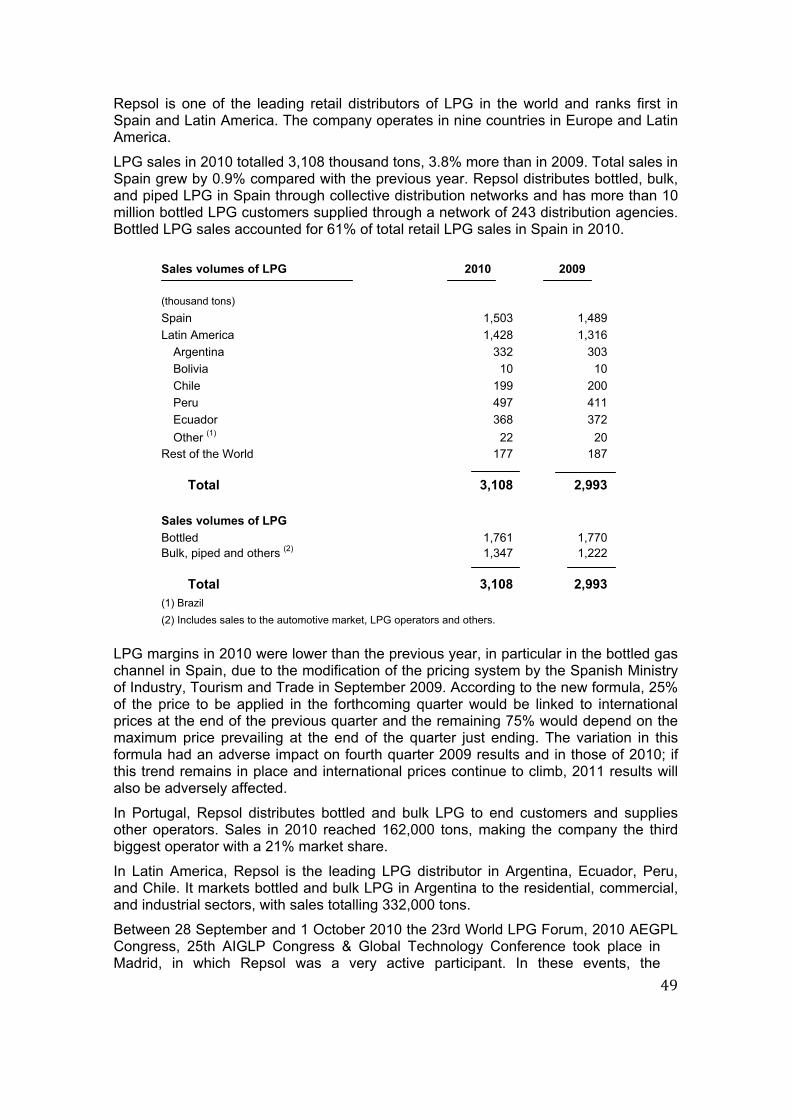
Repsol is one of the leading retail distributors of LPG in the world and ranks first in Spain and Latin America. The company operates in nine countries in Europe and Latin America.
LPG sales in 2010 totalled 3,108 thousand tons, 3.8% more than in 2009. Total sales in Spain grew by 0.9% compared with the previous year. Repsol distributes bottled, bulk, and piped LPG in Spain through collective distribution networks and has more than 10 million bottled LPG customers supplied through a network of 243 distribution agencies. Bottled LPG sales accounted for 61% of total retail LPG sales in Spain in 2010.
Sales volumes of LPG 2010 2009
(thousand tons)Spain 1,503 1,489 Latin America 1,428 1,316
Argentina 332 303 Bolivia 10 10 Chile 199 200 Peru 497 411 Ecuador 368 372 Other (1) 22 20
Rest of the World 177 187
Total 3,108 2,993 Sales volumes of LPG Bottled 1,761 1,770 Bulk, piped and others (2) 1,347 1,222
Total 3,108 2,993 (1) Brazil (2) Includes sales to the automotive market, LPG operators and others.
LPG margins in 2010 were lower than the previous year, in particular in the bottled gas channel in Spain, due to the modification of the pricing system by the Spanish Ministry of Industry, Tourism and Trade in September 2009. According to the new formula, 25% of the price to be applied in the forthcoming quarter would be linked to international prices at the end of the previous quarter and the remaining 75% would depend on the maximum price prevailing at the end of the quarter just ending. The variation in this formula had an adverse impact on fourth quarter 2009 results and in those of 2010; if this trend remains in place and international prices continue to climb, 2011 results will also be adversely affected.
In Portugal, Repsol distributes bottled and bulk LPG to end customers and supplies other operators. Sales in 2010 reached 162,000 tons, making the company the third biggest operator with a 21% market share.
In Latin America, Repsol is the leading LPG distributor in Argentina, Ecuador, Peru, and Chile. It markets bottled and bulk LPG in Argentina to the residential, commercial, and industrial sectors, with sales totalling 332,000 tons.
Between 28 September and 1 October 2010 the 23rd World LPG Forum, 2010 AEGPL Congress, 25th AIGLP Congress & Global Technology Conference took place in Madrid, in which Repsol was a very active participant. In these events, the
importance of LPG was stressed in the fight against climate change and in improving air quality, as well as its role as a sustainable fuel with a leading position among alternative energy sources.
Over the last few years, Repsol has been developing several research, development and innovation programmes based on the use of LPG as an alternative fuel. A few examples of this are the SolarGas application, a ground-breaking, integral energy supply system combining solar energy with LPG to provide hot water to homes and businesses in a sustainable, economic manner with very low CO2 emissions; the Autogas application, where LPG is used as an automotive fuel with considerable environmental advantages due to its low emissions compared to other fuels; and new uses in agriculture, fishing and the development of products and services, such as Portugal's Easy Gas.
CHEMICALS
The chemical business, part of the Downstream division, involves the production and marketing of a wide range of products from base to derivative petrochemicals. Its products are marketed in over 90 countries leading the market in the Iberian peninsula.
Production most significant facilities include three petrochemical complexes located in Sines (Portugal), and Puertollano and Tarragona (Spain), where there is a high level of integration between basic and derivative chemicals, as well as with refining activities. Repsol also has a number of subsidiary and affiliate companies, through which the company produces styrene derivatives, chemical specialties and synthetic rubber. The latter is produced through Dynasol, a 50% partnership with the Mexican KUO group, with plants in Mexico and Spain.
Operating income in the chemical business, part of the Downstream division, experienced a great improvement compared to the previous year, with a return to positive values. The improved situation, both in terms of margins and demand, together with the implementation of strong measures to reduce costs and optimization and plant´s production adjustments have allowed to reverse the situation of losses of 2008 and 2009, although the business is still remains in a low cycle.
Sales to third parties in 2010 amounted to 2.6 million tons, 13.5% more than the 2.3 million tons sold in 2009.
As an example of the efficient integration with the refining activity, in June Repsol acquired the Neste Oil Portugal company, owner of the ethyl tert-butyl ether (ETBE) plant located in the Sines complex, with a production capacity of 50,000 tons per year.
In December, Dynasol, a Repsol Group subsidiary, signed an agreement with the Chinese company Shanxi Northern Xing’an Chemical Industry (Xing’an) to form a joint venture for the manufacturing and marketing of synthetic rubber in China. The new plant will increase Dynasol's production capacity by 50% making the company a global producer with plants in Europe, America and Asia.
In addition, during 2010 revamping of the cracker unit at the Tarragona plant continued, achieving the capacity of 702,000 tons of ethylene . The rest of the investments were used to improve existing assets, achieve greater efficiency and, cost reductions as well as improving product quality, safety and environmental standards.
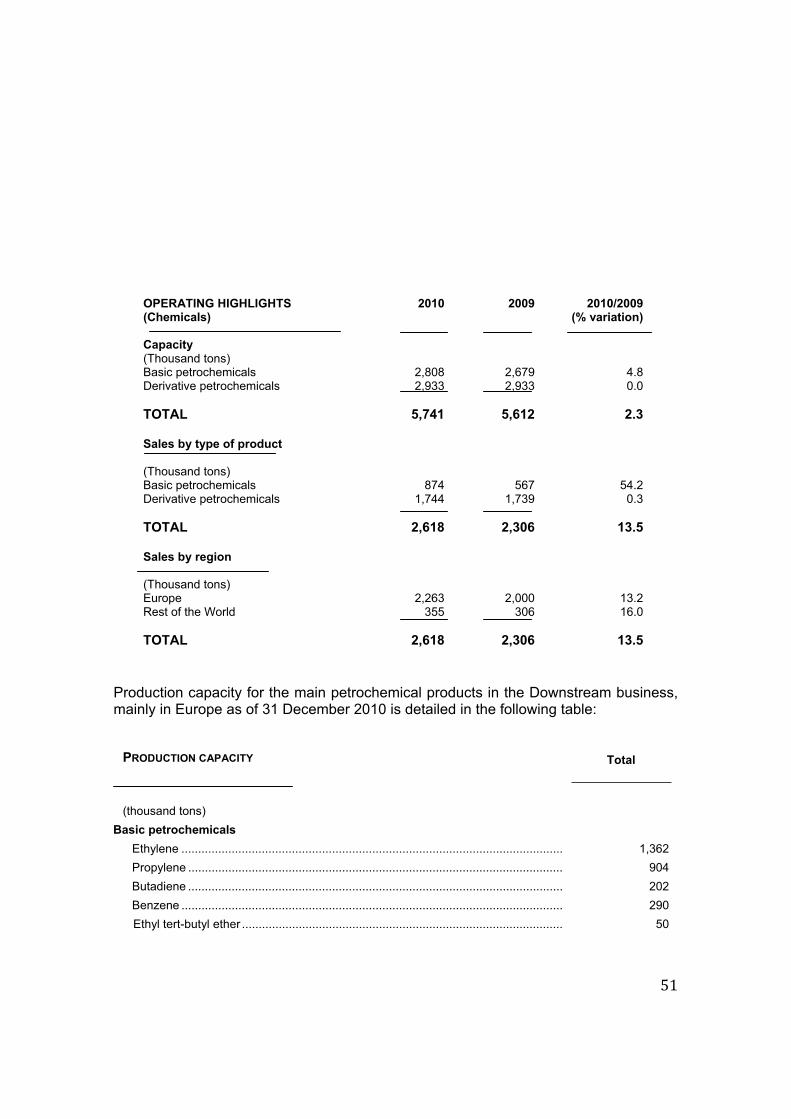
OPERATING HIGHLIGHTS (Chemicals)
2010 2009 2010/2009 (% variation)
Capacity (Thousand tons) Basic petrochemicals 2,808 2,679 4.8 Derivative petrochemicals 2,933 2,933 0.0
TOTAL 5,741 5,612 2.3
Sales by type of product
(Thousand tons) Basic petrochemicals 874 567 54.2 Derivative petrochemicals 1,744 1,739 0.3
TOTAL 2,618 2,306 13.5
Sales by region
(Thousand tons) Europe 2,263 2,000 13.2 Rest of the World 355 306 16.0
TOTAL 2,618 2,306 13.5
Production capacity for the main petrochemical products in the Downstream business, mainly in Europe as of 31 December 2010 is detailed in the following table:
PRODUCTION CAPACITY Total
(thousand tons)Basic petrochemicals
Ethylene ................................................................................................................... 1,362Propylene ................................................................................................................. 904Butadiene ................................................................................................................. 202Benzene ................................................................................................................... 290
Ethyl tert-butyl ether ................................................................................................. 50
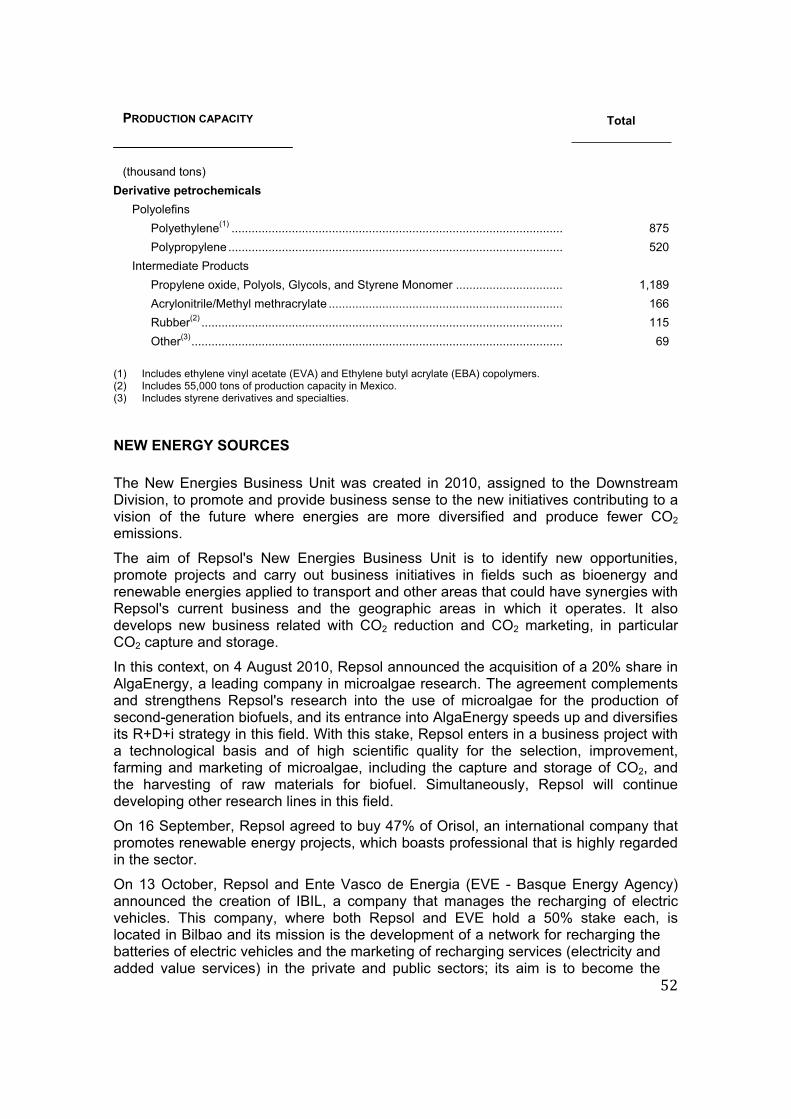
PRODUCTION CAPACITY Total
(thousand tons)Derivative petrochemicals
Polyolefins Polyethylene(1) .................................................................................................... 875Polypropylene ..................................................................................................... 520
Intermediate Products Propylene oxide, Polyols, Glycols, and Styrene Monomer ................................. 1,189Acrylonitrile/Methyl methracrylate ....................................................................... 166Rubber(2) ............................................................................................................. 115Other(3)................................................................................................................ 69
(1) Includes ethylene vinyl acetate (EVA) and Ethylene butyl acrylate (EBA) copolymers. (2) Includes 55,000 tons of production capacity in Mexico. (3) Includes styrene derivatives and specialties.
NEW ENERGY SOURCES
The New Energies Business Unit was created in 2010, assigned to the Downstream Division, to promote and provide business sense to the new initiatives contributing to a vision of the future where energies are more diversified and produce fewer CO2emissions.
The aim of Repsol's New Energies Business Unit is to identify new opportunities, promote projects and carry out business initiatives in fields such as bioenergy and renewable energies applied to transport and other areas that could have synergies with Repsol's current business and the geographic areas in which it operates. It also develops new business related with CO2 reduction and CO2 marketing, in particular CO2 capture and storage.
In this context, on 4 August 2010, Repsol announced the acquisition of a 20% share in AlgaEnergy, a leading company in microalgae research. The agreement complements and strengthens Repsol's research into the use of microalgae for the production of second-generation biofuels, and its entrance into AlgaEnergy speeds up and diversifies its R+D+i strategy in this field. With this stake, Repsol enters in a business project with a technological basis and of high scientific quality for the selection, improvement, farming and marketing of microalgae, including the capture and storage of CO2, and the harvesting of raw materials for biofuel. Simultaneously, Repsol will continue developing other research lines in this field.
On 16 September, Repsol agreed to buy 47% of Orisol, an international company that promotes renewable energy projects, which boasts professional that is highly regarded in the sector.
On 13 October, Repsol and Ente Vasco de Energia (EVE - Basque Energy Agency) announced the creation of IBIL, a company that manages the recharging of electric vehicles. This company, where both Repsol and EVE hold a 50% stake each, is located in Bilbao and its mission is the development of a network for recharging the batteries of electric vehicles and the marketing of recharging services (electricity and added value services) in the private and public sectors; its aim is to become the
leading company in the Basque Country in terms of recharging points and a technological benchmark for the electrical vehicle recharging technology market.
On 28 October, Repsol and the Mexican Group KUO signed an agreement to create a joint venture called KUOSOL, devoted to the development of bioenergy by farming jatropha curcas, an oilseed with high non-edible oil content. KUOSOL will be owned by Repsol (50%) and the KUO Group (50%), its headquarters will be in Mexico and it will receive a total investment estimated at US$ 80 million. Its activities range from farming to the industrial facilities, and its objective is to fully harness the biomass from the jatropha curcas plantations, the production of oil as the raw material for biofuel and the generation of bioenergy, with high sustainability criteria.
INVESTMENTS
Investments in Downstream totalled €1,613 million, down 2% compared to €1,649 million the previous year. Most of this amount was spent on ongoing refining projects, particularly in Spain, upgrading operations, installations and fuel quality, and on safety and the environment, as described above.
DIVESTMENTS
On 25 March 2010, Repsol, Petronor and BBK signed an agreement through which BBK purchased a 5% stake in CLH that Repsol indirectly owned through Petronor. The selling price was €145 million. Repsol thus reduced its interest in CLH to 10%, while a competitive process is still open to divest a further 5% in the logistics company.
In December 2010, Repsol sold Petrobras its 30% stake in the Refinería Alberto Pasqualini (Refap), located in the Brazilian state of Rio Grande do Sul, for the amount of US$ 350 million (€ 261 million). With this sale Repsol brought the process to sell non-integrated Downstream assets in Latin America, which had started in 2007, to a close.
YPF
Since 1 January 2008, the date on which the new organisational structure of the Repsol Group was presented, the value chain integrated activities (exploration, production, refining, logistics, marketing, and chemicals) conducted by YPF and its affiliates, have been reported separately. In essence, most YPF operations, assets, and clients are located in Argentina.
In April 2010 the company's new strategic lines for the 2010-2014 period were
presented under the name YPF, un proyecto de futuro (YPF, a plan for the future). This is an action plan that is based on values and ideas such as efficiency, quality, safety, responsibility, austerity, commitment and profitability.
The major aspect in the action plan supporting this strategy, is the 2010-2014 Exploration Development Programme, presented at the end of 2009 in the presence of the president of Argentina, Cristina Fernandez de Kirchner and other authorities. The key objective of this plan is to obtain information on all exploration blocks that could contain oil and gas reserves which the Government of Argentina or the local authorities have not yet awarded to any company. This programme also includes improving the oil recovery factor by applying new technologies and the development of unconventional gas, such as shale oil, tight gas and shale gas. Within this programme's framework, there have been agreements signed with 12 provinces, although this project's goal is to cover the whole country.
RESULTS
YPF posted €1,453 million in operating income in 2010, 42.3% more than the €1,021 million recorded in 2009.
This increase is a result of bringing fuel prices in service stations closer to the international parity in dollars, and of the higher international product prices, which affect both the income stemming from exports (such as fuel oil and petrochemicals) and the income from those products whose prices, despite being sold in Argentina's internal market, are linked to international prices, such as petrochemicals, aviation fuel and LPG.
The average annual production was 541 kboe/d, compared to 572 in 2009, a 5.4% decrease. The decrease has been 7.9% in gas, and 3.2% in production of liquids, and 1.6% in crude oil. The smaller drop in crude oil production is a result of the investment effort carried out as a response to the Petroleo Plus programme.
INVESTMENTS
Investments were €1,548 million compared to €956 million the previous year. About 70% of the money spent in 2010 was used in the development of oil and gas exploration and production projects, and nearly 27% was spent in updating projects for the refining and chemical production system.
UPSTREAM
This is the area in charge of exploration, exploitation and production of hydrocarbons, mainly in Argentinean territory, the source for the rest of the company's value chain. In Argentina the company has 26 onshore and offshore exploration blocks with a surface area of over 110,000 km2, being direct or associate operator in 91 productive areas located in the Neuquén, Golfo de San Jorge, Cuyo, Noroeste and Austral basins. The company also develops activities in the United States and Guyana, through YPF International.
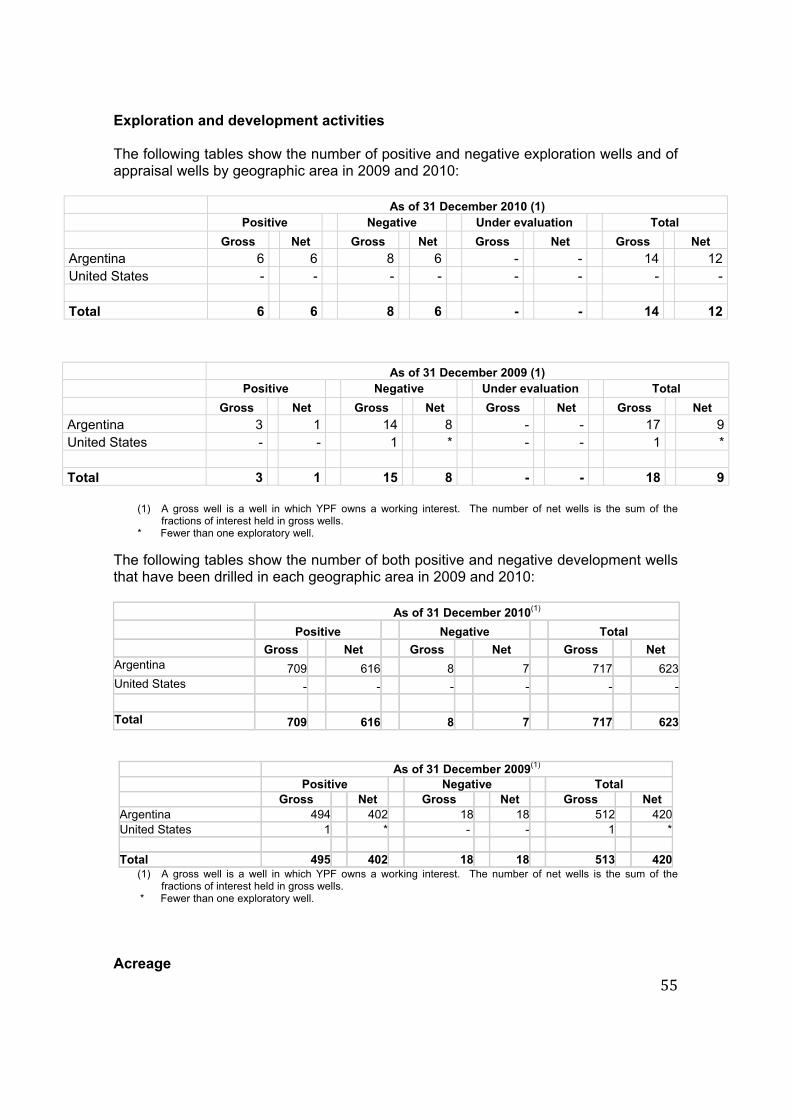
Exploration and development activities
The following tables show the number of positive and negative exploration wells and of appraisal wells by geographic area in 2009 and 2010:
As of 31 December 2010 (1) Positive Negative Under evaluation Total
Gross Net Gross Net Gross Net Gross Net Argentina 6 6 8 6 - - 14 12United States - - - - - - - - Total 6 6 8 6 - - 14 12
(1) A gross well is a well in which YPF owns a working interest. The number of net wells is the sum of the fractions of interest held in gross wells.
* Fewer than one exploratory well.
The following tables show the number of both positive and negative development wells that have been drilled in each geographic area in 2009 and 2010:
As of 31 December 2010(1)
Positive Negative Total Gross Net Gross Net Gross Net
Argentina 709 616 8 7 717 623United States - - - - - - Total 709 616 8 7 717 623
As of 31 December 2009(1)
Positive Negative Total Gross Net Gross Net Gross Net
Argentina 494 402 18 18 512 420United States 1 * - - 1 * Total 495 402 18 18 513 420
(1) A gross well is a well in which YPF owns a working interest. The number of net wells is the sum of the fractions of interest held in gross wells.
* Fewer than one exploratory well.
Acreage
As of 31 December 2009 (1) Positive Negative Under evaluation Total
Gross Net Gross Net Gross Net Gross Net Argentina 3 1 14 8 - - 17 9United States - - 1 * - - 1 * Total 3 1 15 8 - - 18 9
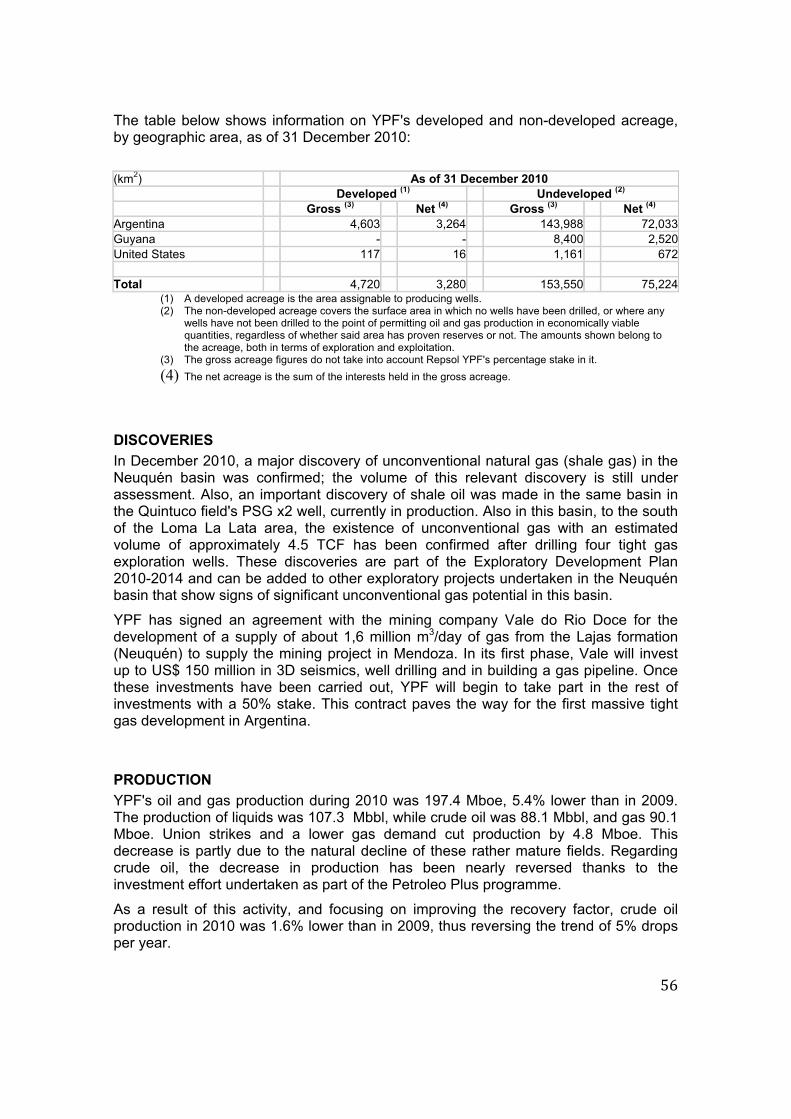
The table below shows information on YPF's developed and non-developed acreage, by geographic area, as of 31 December 2010:
(km2) As of 31 December 2010 Developed (1) Undeveloped (2)
Gross (3) Net (4) Gross (3) Net (4)
Argentina 4,603 3,264 143,988 72,033Guyana - - 8,400 2,520United States 117 16 1,161 672 Total 4,720 3,280 153,550 75,224
(1) A developed acreage is the area assignable to producing wells. (2) The non-developed acreage covers the surface area in which no wells have been drilled, or where any
wells have not been drilled to the point of permitting oil and gas production in economically viable quantities, regardless of whether said area has proven reserves or not. The amounts shown belong to the acreage, both in terms of exploration and exploitation.
(3) The gross acreage figures do not take into account Repsol YPF's percentage stake in it. (4) The net acreage is the sum of the interests held in the gross acreage.
DISCOVERIES In December 2010, a major discovery of unconventional natural gas (shale gas) in the Neuquén basin was confirmed; the volume of this relevant discovery is still under assessment. Also, an important discovery of shale oil was made in the same basin in the Quintuco field's PSG x2 well, currently in production. Also in this basin, to the south of the Loma La Lata area, the existence of unconventional gas with an estimated volume of approximately 4.5 TCF has been confirmed after drilling four tight gas exploration wells. These discoveries are part of the Exploratory Development Plan 2010-2014 and can be added to other exploratory projects undertaken in the Neuquén basin that show signs of significant unconventional gas potential in this basin.
YPF has signed an agreement with the mining company Vale do Rio Doce for the development of a supply of about 1,6 million m3/day of gas from the Lajas formation (Neuquén) to supply the mining project in Mendoza. In its first phase, Vale will invest up to US$ 150 million in 3D seismics, well drilling and in building a gas pipeline. Once these investments have been carried out, YPF will begin to take part in the rest of investments with a 50% stake. This contract paves the way for the first massive tight gas development in Argentina.
PRODUCTION YPF's oil and gas production during 2010 was 197.4 Mboe, 5.4% lower than in 2009. The production of liquids was 107.3 Mbbl, while crude oil was 88.1 Mbbl, and gas 90.1 Mboe. Union strikes and a lower gas demand cut production by 4.8 Mboe. This decrease is partly due to the natural decline of these rather mature fields. Regarding crude oil, the decrease in production has been nearly reversed thanks to the investment effort undertaken as part of the Petroleo Plus programme.
As a result of this activity, and focusing on improving the recovery factor, crude oil production in 2010 was 1.6% lower than in 2009, thus reversing the trend of 5% drops per year.
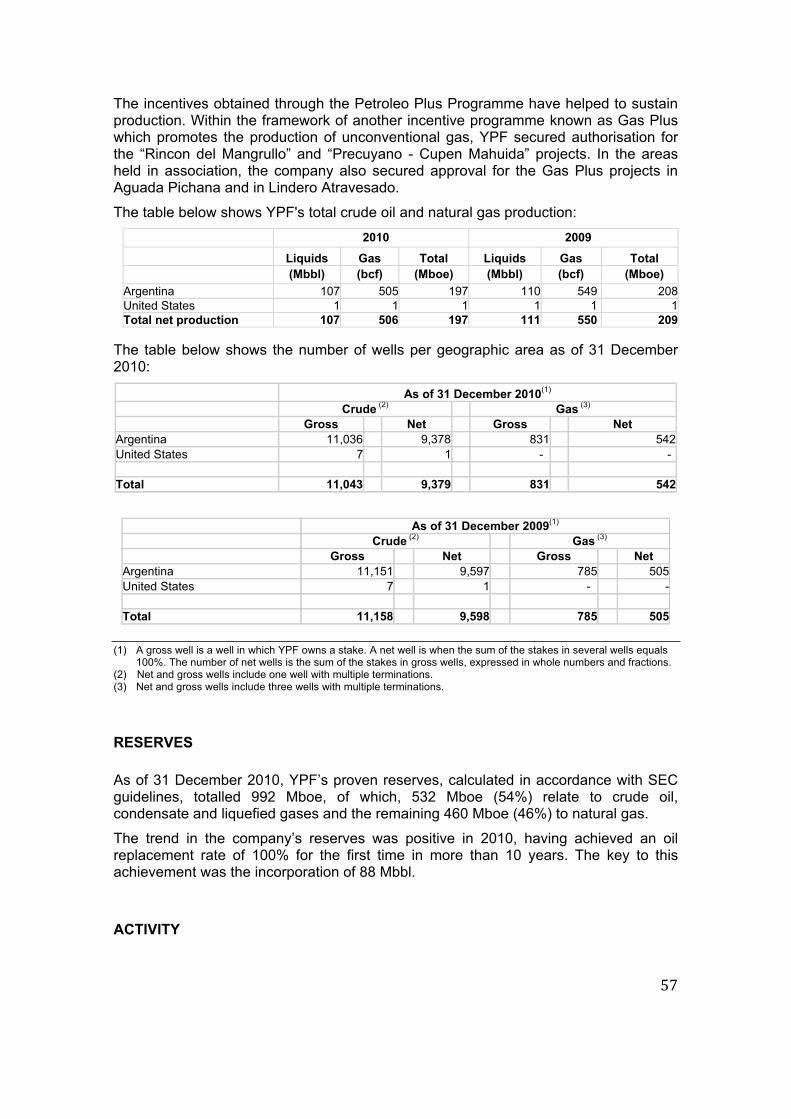
The incentives obtained through the Petroleo Plus Programme have helped to sustain production. Within the framework of another incentive programme known as Gas Plus which promotes the production of unconventional gas, YPF secured authorisation for the “Rincon del Mangrullo” and “Precuyano - Cupen Mahuida” projects. In the areas held in association, the company also secured approval for the Gas Plus projects in Aguada Pichana and in Lindero Atravesado.
The table below shows YPF's total crude oil and natural gas production: 2010 2009
Liquids Gas Total Liquids Gas Total (Mbbl) (bcf) (Mboe) (Mbbl) (bcf) (Mboe)
Argentina 107 505 197 110 549 208United States 1 1 1 1 1 1Total net production 107 506 197 111 550 209
The table below shows the number of wells per geographic area as of 31 December 2010:
As of 31 December 2010(1)
Crude (2) Gas (3)
Gross Net Gross Net Argentina 11,036 9,378 831 542United States 7 1 - - Total 11,043 9,379 831 542
As of 31 December 2009(1)
Crude (2) Gas (3)
Gross Net Gross Net Argentina 11,151 9,597 785 505United States 7 1 - - Total 11,158 9,598 785 505
(1) A gross well is a well in which YPF owns a stake. A net well is when the sum of the stakes in several wells equals 100%. The number of net wells is the sum of the stakes in gross wells, expressed in whole numbers and fractions.
(2) Net and gross wells include one well with multiple terminations. (3) Net and gross wells include three wells with multiple terminations.
RESERVES
As of 31 December 2010, YPF’s proven reserves, calculated in accordance with SEC guidelines, totalled 992 Mboe, of which, 532 Mboe (54%) relate to crude oil, condensate and liquefied gases and the remaining 460 Mboe (46%) to natural gas.
The trend in the company’s reserves was positive in 2010, having achieved an oil replacement rate of 100% for the first time in more than 10 years. The key to this achievement was the incorporation of 88 Mbbl.
ACTIVITY
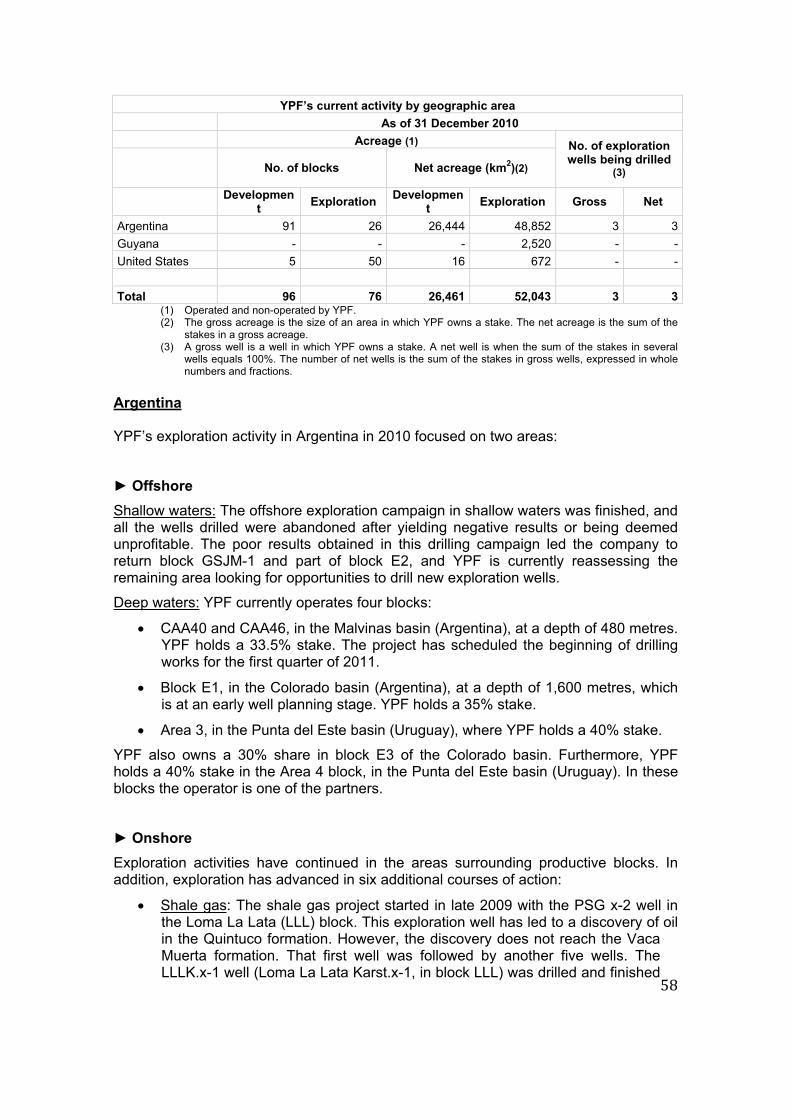
YPF’s current activity by geographic area As of 31 December 2010
Acreage (1)
No. of blocks Net acreage (km2)(2)
No. of exploration wells being drilled
(3)
Development Exploration Developmen
t Exploration Gross Net
Argentina 91 26 26,444 48,852 3 3Guyana - - - 2,520 - -United States 5 50 16 672 - - Total 96 76 26,461 52,043 3 3
(1) Operated and non-operated by YPF. (2) The gross acreage is the size of an area in which YPF owns a stake. The net acreage is the sum of the
stakes in a gross acreage. (3) A gross well is a well in which YPF owns a stake. A net well is when the sum of the stakes in several
wells equals 100%. The number of net wells is the sum of the stakes in gross wells, expressed in whole numbers and fractions.
Argentina
YPF’s exploration activity in Argentina in 2010 focused on two areas:
Offshore Shallow waters: The offshore exploration campaign in shallow waters was finished, and all the wells drilled were abandoned after yielding negative results or being deemed unprofitable. The poor results obtained in this drilling campaign led the company to return block GSJM-1 and part of block E2, and YPF is currently reassessing the remaining area looking for opportunities to drill new exploration wells.
Deep waters: YPF currently operates four blocks:
CAA40 and CAA46, in the Malvinas basin (Argentina), at a depth of 480 metres. YPF holds a 33.5% stake. The project has scheduled the beginning of drilling works for the first quarter of 2011.
Block E1, in the Colorado basin (Argentina), at a depth of 1,600 metres, which is at an early well planning stage. YPF holds a 35% stake.
Area 3, in the Punta del Este basin (Uruguay), where YPF holds a 40% stake.
YPF also owns a 30% share in block E3 of the Colorado basin. Furthermore, YPF holds a 40% stake in the Area 4 block, in the Punta del Este basin (Uruguay). In these blocks the operator is one of the partners.
Onshore Exploration activities have continued in the areas surrounding productive blocks. In addition, exploration has advanced in six additional courses of action:
Shale gas: The shale gas project started in late 2009 with the PSG x-2 well in the Loma La Lata (LLL) block. This exploration well has led to a discovery of oil in the Quintuco formation. However, the discovery does not reach the Vaca Muerta formation. That first well was followed by another five wells. The LLLK.x-1 well (Loma La Lata Karst.x-1, in block LLL) was drilled and finished
in the Vaca Muerta formation, leading to the discovery of rich, condensed gas. Another well in Vaca Muerta, LLL-479 (Loma La Lata-479, in the same block), was drilled and finished, yielding oil and gas. The LLL-482 well was drilled and has been producing oil and gas since the same time. Well LLL.x-475 was drilled and will be finished by early 2011. Finally, the horizontal well LLLK.x-2c, is being drilled near LLLK.x-1 to test productivity in horizontal wells. The plans are to continue with intense exploration activity during 2011, including the drilling of several wells whose main objective is to determine the potential of the Vaca Muerta formation as a reservoir of unconventional gas and oil (shale gas and shale oil) in various blocks of the Neuquén basin.
Shale oil: In late October 2010, the drilling of Argentina's first shale oil well (SOil.x-1, in the Loma Campana block) began. It is expected to be finished in 2011. This is the first of a total of three planned wells for this block, including two vertical wells and a horizontal well. The objective of this project, as was mentioned above, is to prove the productive potential of the Vaca Muerta formation as an unconventional oil reservoir, using state-of-the-art technology such as microseismic and massive hydraulic stimulation.
Quintuco formation: The new exploration concepts developed in these traditional reservoirs continued to be worked on. Five discovery wells were drilled during 2010: PSG x-2, La Caverna x-5, Loma Campana a-3, Los Gusanos x-1 and Los Gusanos x-2 and one negative well (La Caverna x-3) in the Bandurria block. The company plans to continue this exploration activity by drilling five additional wells in 2011.
Liasico Inferior: A new exploration campaign was launched in 2010 on mature blocks, and 55 kilometres. of 2D seismics were recorded in the Valle del Rio Grande block, which is owned entirely by YPF.
Ramos xp-1012: Ramos, a Temporary Joint Venture operated by Pluspetrol Energy, in which YPF holds a 42% stake, finished the drilling stage during 2009, reaching a final depth of 5,826 metres. In 2010, the Tarija and Tupambi formations, in the lower block of the field, were appraised with negative results. The Santa Rosa formation is currently under appraisal.
Frontier areas: In 2010, 386 km2 of 3D seismics were recorded in the Los Tordillos Oeste block, in Mendoza, in a joint venture with Oxy, which holds a 50% stake. During the first quarter of 2011, two wells will be drilled in the Tamberías (province of San Juan) and Gan Gan (province of Chubut) blocks, the latter in association with Wintershall. In November 2010, the company requested the second exploration period in the Bolson del Oeste block (La Rioja), in which the company is committed to recording 200 kilometres of 2D seismics and to drilling a well. In the Rio Barrancas block, the drilling of the Quebrada Butaco x-1 well was finished, at a depth of 2,374 metres and with a negative result. A total of 580 kilometres of 3D seismics have been acquired, as well as 500 kilometres of 2D seismics and 4,100 kilometres of terrestrial gravity and magnetometrics.
In 2010, YPF finished 14 exploration wells in Argentina (8 of them under the company's operation, 7 of them in the Neuquén basin and one in the Noroeste basin). Of these, six were discovery wells (all of them operated by YPF). The total exploration investment in Argentina was about US$102 million.
Regarding field development activities, 742 development wells were drilled, which, along with secondary repair and infrastructure activities, amounted to an investment of US$ 1,222 million. Total well construction time was 1% less than in 2009, achieving a 16% accumulated improvement since 2008. This efficiency in terms of
time, along with cost savings in various stages of the process, allowed activity to increase about 39% on 2009 levels.
During 2010, YPF continued to work on improving its facilities and optimising oil and gas production. In the sixth stage of the low-pressure compression project in the Loma La Lata field, the gas production and wellhead pressure obtained surpassed the initial forecasts. New simulations of the reservoirs and installations were carried out, with a view to carrying on working on optimising the compression capacity and the above-ground installations in 2011.
YPF's key initiatives for the improvement of productive assets include:
The WAG (Water Alternating Gas) injection project in Chihuido de la Sierra Negra has finished and its conclusion was that expansion was not economically viable. Current projects are focused on the assessment of chemically enhanced oil recovery opportunities (SP –Surfactant Polymer). Development and delineation works were carried out in Manantiales Behr, Cañadón Yatel, Barranca Baya, Desfiladero Bayo, Señal Picada and Cañadón Amarillo.
A pilot project to assess the tight gas opportunities in the Las Lajas formation, in the Cupen Mahuida area. The company, using simulated models, is carrying out significant work to optimise the secondary recovery ratio in Chihuido de la Sierra Negra, Los Perales and Cañadon Seco-Cañadón Leon.
An assessment programme in the field El Medanito field (100% owned by YPF) has been implemented during the last two years, and especially in 2010, to analyse the field's remaining potential. Thirty-two wells have been drilled as part of a pilot infill water injection project and 57 delineation wells in what is known as the South area. The partial results are encouraging. The new massive development of the field is scheduled for 2011, while continuing with another assessment project.
During 2010, ten integral development projects have been started in Santa Cruz, divided into four development areas: Las Heras, El Guadal, Los Perales and Cañadon Seco, forming a portfolio of 82 projects. The main ones are Cerro Grande, Maurek, Seco Leon and Los Perales. As part of these projects, 161 wells have been drilled, a total investment estimated at almost US$ 300 million, including their associated resources. The main objective of these projects is to obtain an integral development of the areas by building new wells, introducing new projects for improved oil recovery and supporting the development of installations in the area in question. In 2011, these projects will continue in line with the planned investments.
In 2010, the company began the process of extending the concessions in the provinces of Mendoza, Santa Cruz, Río Negro and Tierra del Fuego (in the latter, the blocks are held in association with Apache Energía Argentina S.R.L's affiliate companies, as a non-operating partner; the negotiation is being handled by the operator). The authorities have called any interested companies to negotiate the aforementioned extension through Public Call No. 1268/10/907 in Mendoza, where YPF has officially communicated its interest in renovating the permits on the areas to the local authorities, and has submitted the relevant documentation.
Non-operated areas
In the CNQ 7A block the delineation of the reservoirs in El Corcobo Norte, Jagüel Casa de Piedra, Cerro Huanunl Sur and Puesto Pinto was finished and their development has begun. This block is operated by Petro Andina Resources Argentina SA (PAR) and YPF holds a 50% stake. The pilot project for water injection in Cerro Huanul Sur was finished with good results.
Exploration wells Lo-x-1 and Lo-x-2 were drilled. The first is in the appraisal phase and the second is yet to be finished.
In September 2010, there was an incident on the offshore platform AM-2 of the Magallanes field, operated by Sipetrol and located in the Strait of Magellan. There was no environmental damage or serious personal injuries. Due to this incident, the field was out of production until December 2010. Its production activity will return to normal during the first half of 2011.
In the Tierra del Fuego area, operated by Apache Corp. and where YPF holds a 30% stake, there has been exploration activity in mature fields. The interpretation of the 3D seismics provided tools for the generation of various drilling projects, mainly in the southern area of the block. During 2010, the Bajo Guadaloso (BGO-x-2001 and BGO-a-2002), Entre Lagos (EL-x-2001) and Bodega (BO-x-2001) projects in Los Chorrillos area, were carried out, where the first two yielded positive results. The operator's strategy is to continue the exploration activity in small geologic structures in Los Chorrillos and to begin activities in the most southerly section, known as Uribe section.
Natural gas
YPF’s natural gas sales totalled 13,959 million m3 in 2010, about 12% less than in 2009. The most relevant sale reduction was seen in the manufacturing industry, since during 2010 no Bolivian gas was bought from ENARSA to sell to the Compañia Administradora del Mercado Mayorista Eléctrico, S.A. (CAMMESA). YPF enjoys a 31.7% market share in Argentina. The average price of natural gas sold by the company was 5% higher than the previous year, mainly due to the higher rate for industry and factories.
As part of a programme launched by the Argentinean government, an LNG regasification ship, located in Bahia Blanca, was put into operation to incorporate 1,800 million m3 of gas (125% more than in the previous year) into the country’s gas network. Of that total amount, 1,100 million m3 were injected to help satisfy increased demand throughout the five winter months, about 7.2 million m3/day.
Since May 2010 YPF-AESA has been operating the ENARSA propane-air injection plant (PIPA). This plant has injected a total of 30 million m3 into the network, processing 24,300 tons of propane. Every injection request received was duly fulfilled. During this period the ENARSA staff received theoretical and practical training.
ENARSA and YPF have entered a Temporary Joint Venture for the purpose of executing and exploiting the Escobar LNG Project. Both companies hold a 50% stake, while YPF has been designated the joint venture's operator.
The project aims to copy the operation that is being carried out in Bahia Blanca in the Escobar area, on the river Parana de las Palmas, that is, mooring a LNG regasification ship, regasifying LNG and injecting it as a gas into the gas pipeline system. For this, a pier must be built in the operation zone, a high pressure unloading arm must be assembled and an interconnecting gas pipeline must be laid.
It is estimated that in the first year an average 5 million m3/day of gas will be injected into the system. From the second year onwards, the injection flow could reach an average of about 7 million m3/day. The facility is scheduled to start up in the first half of 2011.
United States
The Neptune development field initiated its production in July 2008 with seven offshore wells. As of September 2010, the platform was producing more than 16,000 gross bbl/d. In 2010, a decision was made to delay finalising the well in the M9 and M10 reservoirs, and to put the M12 reservoir into production. The technical and economic viability of completing well SB-02 to the depth objectives of the M9 and M10 reservoirs is currently being assessed.
In October 2010 the company decided to give up nine OCS (Offshore Continental Shelf) blocks in the Alaminos Protraction area, after analysing the results of their technical assessment.
REFINING, LOGISTICS AND MARKETING
YPF has three refineries: La Plata (in the province of Buenos Aires), Lujan de Cuyo (in Mendoza) and Plaza Huincul (in Neuquén). La Plata has a distillation capacity of 189,000 barrels per day and a conversion capacity of 119,000 barrels per day; Luján de Cuyo has a distillation capacity of 106,000 barrels per day and the same conversion capacity; and Plaza Huincul has a distillation capacity of 25,000 barrels per day. Furthermore, the La Plata refinery has a lubricant manufacturing plant with a capacity of 860 m3/day of finished base product.
The logistics for crude oil are carried out by three companies in which YPF holds a stake (Oldelval, Termap and Oiltanking Ebytem), hired tankers and two pipelines that belong to the company (Puesto Hernández - Lujan de Cuyo and Puerto Rosales - La Plata). The products' logistics are mostly carried out through two polyducts owned by the company (Lujan de Cuyo-San Lorenzo-La Matanza and La Plata-La Matanza), three loading ports, 11 tankers, six barges, four tow boats, 16 terminals (nine of which with connected ports), six LPG plants, 54 aeroplants and 1,105 trucks.
YPF owns a network of 1,618 service stations, of which 169 are directly managed through the company Opessa (100% shareholding) and has also eight bases for the distribution of diesel oil for agricultural activities, known as YPF Directos.
It also holds a 50% stake in Refinor, a company that refines, transports and markets fuels (70 service stations, or 35 if we take into account YPF's 50% share) and derivatives in the Argentinean northeast.
YPF’s refineries processed 47.3 thousands m3/day in 2010, 1.8% less than in 2009. This reduction was mainly due to less availability of crude oil in the market, to the scheduled stoppages in the Lujan de Cuyo and La Plata refineries, and to the conflicts with unions, which affected the operations of oil coming from the Gulf of San Jorge.
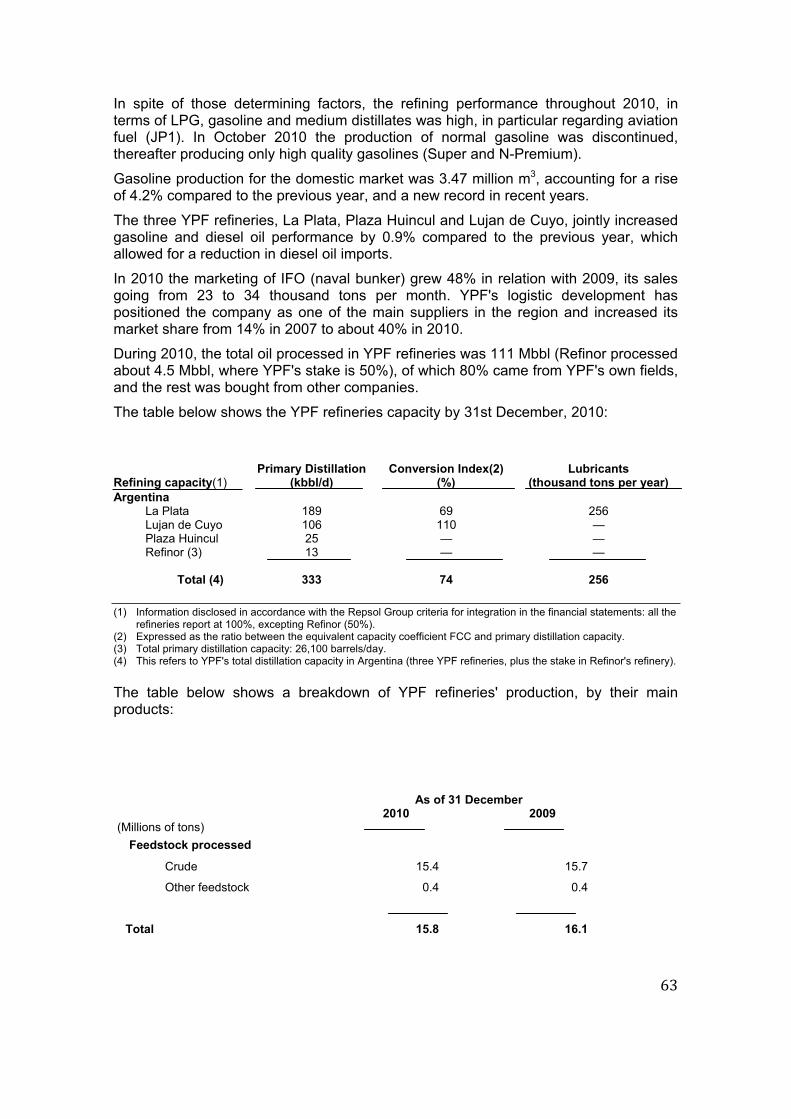
In spite of those determining factors, the refining performance throughout 2010, in terms of LPG, gasoline and medium distillates was high, in particular regarding aviation fuel (JP1). In October 2010 the production of normal gasoline was discontinued, thereafter producing only high quality gasolines (Super and N-Premium).
Gasoline production for the domestic market was 3.47 million m3, accounting for a rise of 4.2% compared to the previous year, and a new record in recent years.
The three YPF refineries, La Plata, Plaza Huincul and Lujan de Cuyo, jointly increased gasoline and diesel oil performance by 0.9% compared to the previous year, which allowed for a reduction in diesel oil imports.
In 2010 the marketing of IFO (naval bunker) grew 48% in relation with 2009, its sales going from 23 to 34 thousand tons per month. YPF's logistic development has positioned the company as one of the main suppliers in the region and increased its market share from 14% in 2007 to about 40% in 2010.
During 2010, the total oil processed in YPF refineries was 111 Mbbl (Refinor processed about 4.5 Mbbl, where YPF's stake is 50%), of which 80% came from YPF's own fields, and the rest was bought from other companies.
The table below shows the YPF refineries capacity by 31st December, 2010:
Primary Distillation Conversion Index(2) LubricantsRefining capacity(1) (kbbl/d) (%) (thousand tons per year)Argentina
La Plata 189 69 256 Lujan de Cuyo 106 110 — Plaza Huincul 25 — — Refinor (3) 13 — —
Total (4) 333 74 256
(1) Information disclosed in accordance with the Repsol Group criteria for integration in the financial statements: all the refineries report at 100%, excepting Refinor (50%).
(2) Expressed as the ratio between the equivalent capacity coefficient FCC and primary distillation capacity. (3) Total primary distillation capacity: 26,100 barrels/day. (4) This refers to YPF's total distillation capacity in Argentina (three YPF refineries, plus the stake in Refinor's refinery).
The table below shows a breakdown of YPF refineries' production, by their main products:
As of 31 December
(Millions of tons)2010 2009
Feedstock processed Crude 15.4 15.7
Other feedstock 0.4 0.4
Total 15.8 16.1
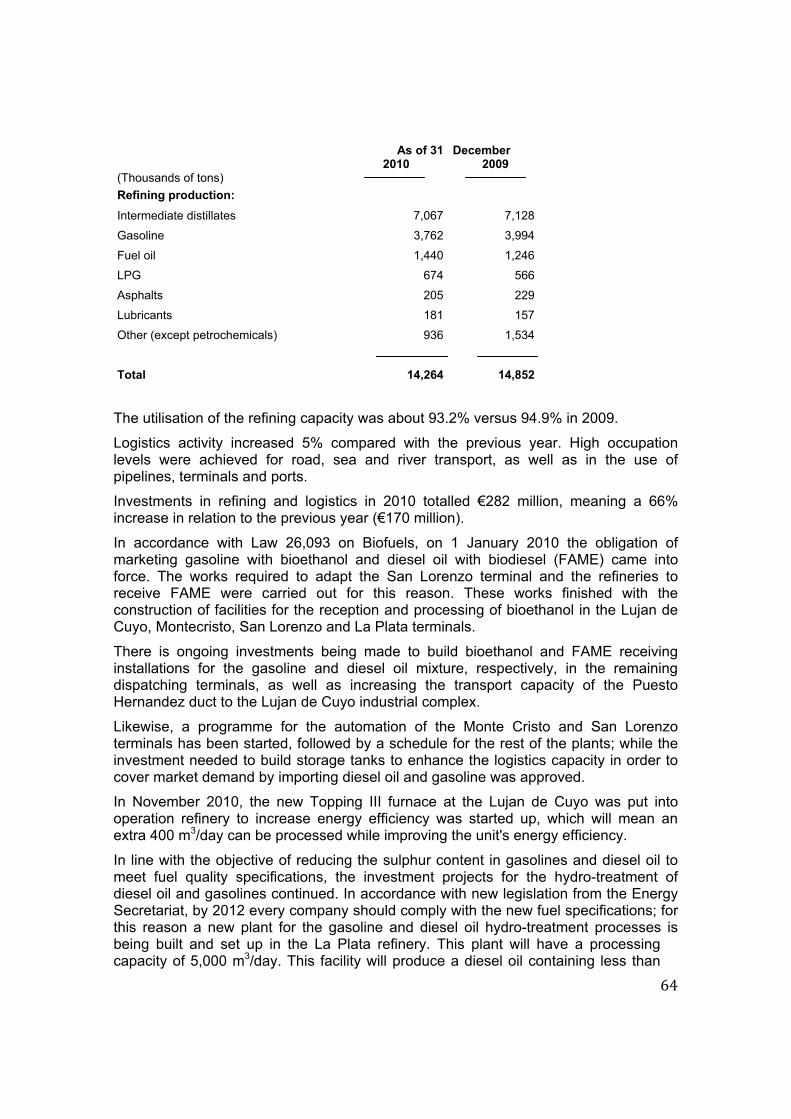
As of 31 December
(Thousands of tons) 2010 2009
Refining production: Intermediate distillates 7,067 7,128
Gasoline 3,762 3,994
Fuel oil 1,440 1,246
LPG 674 566
Asphalts 205 229
Lubricants 181 157
Other (except petrochemicals) 936 1,534
Total 14,264 14,852
The utilisation of the refining capacity was about 93.2% versus 94.9% in 2009.
Logistics activity increased 5% compared with the previous year. High occupation levels were achieved for road, sea and river transport, as well as in the use of pipelines, terminals and ports.
Investments in refining and logistics in 2010 totalled €282 million, meaning a 66% increase in relation to the previous year (€170 million).
In accordance with Law 26,093 on Biofuels, on 1 January 2010 the obligation of marketing gasoline with bioethanol and diesel oil with biodiesel (FAME) came into force. The works required to adapt the San Lorenzo terminal and the refineries to receive FAME were carried out for this reason. These works finished with the construction of facilities for the reception and processing of bioethanol in the Lujan de Cuyo, Montecristo, San Lorenzo and La Plata terminals.
There is ongoing investments being made to build bioethanol and FAME receiving installations for the gasoline and diesel oil mixture, respectively, in the remaining dispatching terminals, as well as increasing the transport capacity of the Puesto Hernandez duct to the Lujan de Cuyo industrial complex.
Likewise, a programme for the automation of the Monte Cristo and San Lorenzo terminals has been started, followed by a schedule for the rest of the plants; while the investment needed to build storage tanks to enhance the logistics capacity in order to cover market demand by importing diesel oil and gasoline was approved.
In November 2010, the new Topping III furnace at the Lujan de Cuyo was put into operation refinery to increase energy efficiency was started up, which will mean an extra 400 m3/day can be processed while improving the unit's energy efficiency.
In line with the objective of reducing the sulphur content in gasolines and diesel oil to meet fuel quality specifications, the investment projects for the hydro-treatment of diesel oil and gasolines continued. In accordance with new legislation from the Energy Secretariat, by 2012 every company should comply with the new fuel specifications; for this reason a new plant for the gasoline and diesel oil hydro-treatment processes is being built and set up in the La Plata refinery. This plant will have a processing capacity of 5,000 m3/day. This facility will produce a diesel oil containing less than
50 parts per million (ppm) of sulphur. To fulfil this objective, the Lujan de Cuyo refinery has bought an existing plant with a capacity of 2,640 m3/day. In this refinery they have also begun the development of the detail engineering for a gasoline hydro-treatment unit.
In the La Plata refinery the development of the engineering for the new coke unit “A” began. This unit will increase the processing capacity from110 to185 m3/day.
The participation by YPF in the Refino Plus programme should be highlighted, as it encourages increased fuel production through benefits to be applied in the form of tax relief. In this regard, applications for five investment projects that will avail of this programme have already been approved.
During 2010 YPF launched an image improvement plan for its service stations with the aim of uniting and enhancing the overall image of the network based on the concepts of modernity and rationality. As well as renovating 47 service stations, a new station, Hito, was built in Nordelta and the first station of the Red Camionera (Truck Drivers Network), located in Fighiera (province of Santa Fe), was opened as part of the agreement between YPF and Camión Club Argentino (CCA).
YPF promoted the synergy with the agricultural world by creating the Agrocentros and developing a cereal exchange programme. These Agrocentros sell products such as diesel oil, fertiliser and agricultural chemicals which are paid for with cereal (mainly soya and corn), which is then processed to obtain flour and oil for export. In this new phase, part of the oil obtained will be used for the production of FAME (methyl ester from vegetable oil), nowadays added to commercial diesel oil (up to 5 % of its volume).
During the first half of 2010, domestic market prices were gradually brought into line with international prices and prices in neighbouring countries. Resolution 925/2010 froze retail prices from 31 July until December. From November 2010, the company decided to clearly segment the quality of its gasoline products and identify the attributes of each one through its name. For this reason, the highest quality gasoline (grade 3) is now called “N-Premium”. This product became the market leader during this year, with a 61% market share.
In the diesel oil area, the premium product with a low sulphur content (D-Euro) was marketed aggressively. This product is recommended for all high performance EURO IV engines. D-Euro has reached a 49% market share in the retail segment.
This strategy enabled the company to market a larger part of the Ultradiesel XXI diesel oil through the industry and transport channels, providing the market with a sufficient supply while minimising imports.
CHEMICALS
The chemicals business carries out its operations in the Ensenada industrial complex, integrated with the La Plata refinery, and in the Methanol Plaza Huincul complex, integrated with the Plaza Huincul refinery. Likewise, YPF carries out chemical activity in the Bahia Blanca complex through its investee company Profértil.
These industrial complexes have an aggregated production capacity in excess of 2,000,000 tons per year, for market segments such as modified naphtas, resins, detergents, automotives, agrochemicals and fertilisers, among others.
During 2010, there has been a recovery of international prices in the main products, consolidating the improvement seen in the second half of 2009. The price of methanol rose due to the postponement of new plant projects and to a good level of demand in the United States and China.
The maleic anhydride (the raw material for plastics) trend showed a noticeable improvement, with prices rising compared to 2009. This price increase was due to stronger demand, along with the closure of one of the main European plants in January 2010.
From a commercial perspective, YPF's chemicals business improved significantly in terms of the aromatic and methanol sales mix, with sales increasing in Argentina by 18% compared to the previous year. A larger volume of aromatics was used in the gasoline production process (blending) and the sales of methanol in the Argentinean market to the biodiesel production sector continued to develop.
The building and setting up of the Continuous Catalytic Regenerator (CCR) began as well, which will allow production of aromatics to be increased by 50% and thus be able to meet the needs of growing internal demand for octane components, used in high quality gasoline and hydrogen production, necessary for gasoline and diesel oil hydro-treatment processes at the La Plata refinery. The estimated investment for this project is approximately €250 million, the largest petro-chemical investment in Argentina made in the last decade.
The table below shows the production capacity of the main petrochemicals: Capacity
(tons per year) Ensenada:
AromaticsBTX (Benzene, Toluene, Xylene) 244,000Paraxylene 38,000Orthoxylene 25,000Cyclohexane 95,000Solvents 66,100
Olefins and Derivatives MTBE 60,000Butene I 25,000Oxo-alcohols 35,000TAME 105,000
LAB/LASLAB 52,000LAS 25,000
Polybutenes PIB 26,000
Maleic Maleic Anhydride 17,500
Plaza Huincul:Methanol 411,000
Bahia BlancaAmmonia/Urea 933,000
GAS NATURAL FENOSA
RESULTS
As of 31 December 2010, Repsol owns 30% of the Gas Natural Group, which is proportionally consolidated. The operating income contributed by Grupo Gas Natural Fenosa in 2010 rose by 17.8% to €881 million compared to the previous year (€748 million).
The additional provision that was made for the risks arising from the Sonatrach dispute has been a determining factor on the results, but their evolution has been supported by the recovery of energy demand in Spain, the growing contribution of international business and the results of the disposal of gas distribution assets in the Madrid Region.
EBITDA in the year was €1,507 million, compared to €1,232 million in 2009, 22.4% higher mainly as the result of the non-incorporation of Union Fenosa in the scope of consolidation until 30 April 2009.
The performance in the aforementioned context highlight the bases of the Gas Natural Fenosa business model, based on the balance between regulated and free business in the gas and electricity markets, with a growing, diversified contribution made by its international presence.
Gas Natural fully integrated Union Fenosa S.A. and its subsidiaries in the scope of consolidation as of 30 April 2009. As a result, the 2009 consolidated financial statement includes Union Fenosa transactions only as of that date. In September 2009, Gas Natural completed the merger by absorption process with Unión Fenosa.
The business' main operating highlights are shown below: For a better understanding, the figures relate to the amounts generated by Gas Natural Fenosa, although the Group's holding in the company is 30%.
Gas distribution
Spain
Business in Spain includes the compensated gas distribution activity, third-party network access services and secondary transport, as well as non-compensated distribution activities (rental of gas meters, connections to customers, etc.).
Sales from regulated gas activity in Spain, which includes access services to the network by third parties, both in terms of gas distribution and secondary transport, fell 9.8% from the previous year's figures to 207,174 GWh. This drop was the result of the sale of assets in Cantabria, Murcia, Asturias, the Basque Country and the Madrid Region which, once set aside, imply 3.9% growth, due to the increase in residential demand caused by a cold winter and a slight recovery in industrial demand.
In 2010, Gas Natural Fenosa continued to expand its distribution network, with the addition of 1,152 kilometres in the last 12 months, and reached 33 new municipalities. The number of supply points increased by 84,000 in the last twelve months, 16.8% less than the previous year, due to the impact of the economic crisis, despite the recovery in the last quarter of 2010. Neither effect takes into account the aforementioned divestments.
By year-end, the gas distribution network reached 44,931 kilometres, 5.6% less than the previous year, and the number of supply points stood at 5,274,000, also 7.4% lower
than before, according to the divestments carried out to fulfil the Action Plan approved by the Spanish National Competition Commission (CNC) in relation to the Unión Fenosa acquisition process.
Latin America
This concerns the gas distribution activity in Argentina, Brazil, Colombia and Mexico. During 2010, the number of gas supply points in the distribution network reached 5,665,000. The high year-on-year growth rates have been maintained, with 243,000 new supply points; the performance was particularly good in Colombia, where the new supply points this year were 152,000, thus exceeding 2 million customers.
Gas activity sales in Latin America, which include gas sales and third-party network access services, amounted to 200,995 GWh, 18.5% more than in the previous year. This increase was mainly in the industrial market and the supply to electricity generation plants in Brazil.
The gas distribution network has been extended 2,177 kilometres in the last 12 months, and by the end of December 2010 it reached 64,492 kilometres, 3.5% more than in 2009.
Italy
Business in Italy also includes rate-regulated gas sales.
Gas Natural Fenosa has reached a total of 422,000 supply points in the gas distribution business in Italy, a figure 1.9% higher than year-end 2009.
The gas distribution activity reached 3,387 GWh this year, 3.1% less than in 2009, mainly due to different weather conditions. The distribution network was extended by 204 kilometres, thus amounting to 5,849 kilometres by the end of the period.
Power distribution
Spain
This business includes regulated power distribution activity and customer network services, mainly connection and link-up rights, and other services such as metering and access by third parties to the company’s distribution network. The comprehensive tariff ceased to exist on 1 July 2009 following the creation of the last-resort power commercialisation entities. Accordingly, no power sales were made as of that date by the electricity distribution activity in Spain. Electricity supply points have grown slightly, about 0.6%, in 2010, reaching a total of 3,719,000.
Latin America
Business activity involves regulated power distribution in Colombia, Guatemala, Nicaragua, and Panama. Electricity sales reached 18,002 GWh, a 49.3% increase, and the customer portfolio was increased by 17.9%, with a particularly good performance in Colombia due to more up-to-date information in low-income areas, and in Nicaragua, due to the improved effectiveness of subscription campaigns.
Moldavia
Business in Moldavia includes regulated power distribution and its marketing at a tariff in the capital and metropolitan area and in the country’s central and southern regions. Despite a context of economic slowdown, the customer base in this country grew by 1.1% to reach 816,000.
Electricity
Spain
The electricity business in Spain includes power generation activities, electricity trading in wholesale markets and the wholesale and retail marketing of electricity in the deregulated Spanish market and electricity supply at the tariff of last resort.
In 2010, electricity demand in the peninsula grew 3.4% in relation to the previous year, an increase that started in the first half of the year, after the fall in demand recorded in 2009. With the corrections due to employment and temperature, the actual growth in demand was 2.9%.
Gas Natural Fenosa power generation in the Iberian Peninsula was 38,338 GWh in 2010. Of this amount, 35,809 GWh came from Ordinary Regime generation, and 2,529 GWh from Special Regime generation. Gas Natural Fenosa's accumulated share in Ordinary Regime generation by 31 December 2010 was 20.2%, slightly higher than the previous year.
Hydroelectric production in 2010 was 4,752 GWh, much higher than 2009 as a result of hydrological conditions at the beginning of the year. Power generation at combined cycle plants in 2010 amounted to 25,928 GWh, also higher than in 2009. Furthermore, nuclear, fuel and coal-fired power generation also increased in comparison with 2009.
In the electricity marketing activity, sales in 2010 were 40,559 GWh.
Latin America
This section relates to power generation assets in Mexico, Puerto Rico, Panama and the Dominican Republic.
In Mexico, the assets currently operating are the Hermosillo (270 MW) and Naco Nogales (300 MW) power plants, both located in the state of Sonora; in the state of Veracruz, the Tuxpan III and IV (1,000 MW) power plants; in the state of Coahuila, the Saltillo (248 MW) power plant; and the Norte Durango power plant, with 450 MW, located in the state of Durango, on which construction finished in 2010.
The power generated in Latin America during 2010 was 19,147 GWh, with a 75.4% load factor and 92.9% availability.
Other countries (Kenya)
This section includes power generation in Kenya. In 2010, fuel-based power generation reached 645 GWh, far higher than 2009 production, due to the
enlargement of the plant's capacity in the third quarter of 2009, when an extra 52 MW started commercial operations.
Infrastructure
This business includes the development of integrated liquefied natural gas projects; oil exploration, development and production; sea transport management and operation of the Maghreb-Europe gas pipeline.
The gas transportation activity carried out in Morocco through the companies EMPL and Metragaz represented a total volume of 109,792 GWh, a similar amount to the previous year. Of this figure, 80,740 GWh were transported for Gas Natural Fenosa through the company Sagane and 29,052 GWh for Portugal and Morocco.
Regarding gas exploration and production at the Tanger-Larache project (Morocco) in which the company holds a 24% stake, a seismic campaign was acquired in the second quarter of 2010 and was then processed and analysed in preparation for the drilling activity scheduled for 2011.
Supply and marketing
This business area involves the supply and marketing of gas (wholesale and retail) both in Spain and abroad, and of other products and services related to retail marketing in Spain, as well as marketing of the gas tariff of last resort in Spain.
Gas Natural Fenosa's marketing in the Spanish gas market reached 184,744 GWh, 1.3% higher than the previous year, mainly due to higher gas consumption by residential and industrial clients, while the sales of gas for combined-cycle power generation stayed the same. Moreover, supply for third parties in the Spanish market was 66,141 GWh, showing a 27.4% increase.
Unión Fenosa Gas
This business involves the gas supply and marketing activities carried out by Unión Fenosa Gas, including the liquefaction infrastructure in Damietta (Egypt), regasification in Sagunto and management of the vessel fleet.
The gas supplied to the Spanish market reached 59,518 GWh, an all-time sales record for the company. Furthermore, 27,774 GWh of energy was handled in international sale operations and led to the company posting a sales record in international markets.
Investments
Taking into account Repsol’s 30% stake in Gas Natural Fenosa, investments in the
year amounted to €636 million in comparison to €5,060 million in 2009. This reduction is mainly due to the inclusion of the investments for the acquisition of Union Fenosa in 2009.
In 2010, Gas Natural Fenosa assigned 23.4% of its fixed asset investments to the electricity generation activity in Spain and 20.3% to electricity distribution in Spain.
The main investment projects for 2010 were the completion of the combined-cycle power plants in Malaga and the Port of Barcelona, and well as the development of wind farm projects.
CORPORATE AREAS
PEOPLE MANAGEMENT
At year-end 2010, Repsol had a consolidated workforce of 43,298 people representing over 70 nationalities. Of this figure, a total of 36,323 employees were working in companies directly controlled by Repsol and the figures presented in this section refer to these employees. The company’s employees work in more than 30 countries, mainly in Spain (46%) and Argentina (37%), as well as Portugal (3%), Peru (7.2%), Ecuador (2%), and Trinidad and Tobago (1%). Of these employees, 51% work in the Downstream division, 7% in Upstream and LNG, 36% in YPF, and 6% in corporate departments.The breakdown of the workforce is 1% executive personnel, 6% technical managers, 47% technicians, 4% administrative staff and 42% operators. Permanent work contracts account for 91% of the total and women represent 27% of the total workforce.
Change in the organisational structure
One of the most significant organisational changes in 2010 was aimed at promoting, boosting and providing business sense to new initiatives contributing to a vision of a more diversified and less CO2-intensive future for energy. Some examples are the creation of the New Energies Business Unit, within the Downstream Executive Department (ED); two new offices within the Media Corporate Department (CD); the New Energies Technology Division and the Environmental Footprint and Carbon Unit Division, as well as the creation of the New Energy Development Area in YPF.
At the same time, with the purpose of further promoting a culture of organisation as a way to boost efficiency and ideas in the company, divisions were created within the People and Organisation ED, as well as in each different business, that are in
charge of directing the innovation process and the generation and development of initiatives, thus converting them into value for the market.
Also in 2010, the YPF transformation project started which aims to turn YPF into a more dynamic, modern and efficient organisation by revising its processes and structures.
On 30 December 2010, the following changes in the company's top executive level were approved, entering into force in January 2011:
- The functions of the Corporate Strategy and Development CD were incorporated into the Economic and Financial ED.
- The Audit and Control and Reserve Control Departments, operationally reporting to Repsol's Board of Directors' Audit and Control Committee, will now report to the General Counsel and Secretary of the Board of Directors instead of the Economic and Financial ED, thus consolidating its independence.
- The Investors Relations Department will report directly to the Chairman’s Office.
- The Communication and Chairman's Office CD will become the Communication and Chairman's Office ED, becoming part of the company's Executive Committee.
Renovation of the Management team
The Group has continued the process of renovating its structures and its management team, with a view to having the leaders Repsol needs to face the challenges and to guarantee that each business and strategic project has the people it needs.
The positioning and the presence of the company has been reinforced in all the countries it operates in, following the business strategy for each one. The organisational needs and the executive profile have been subjected to analysis in order to ensure that the organisational structures meet business needs, reinforcing aspects such as innovation, business development or safety and the environment.
This has brought career opportunities to those with the desired personal and professional profile, and has made it possible to renew part of the management team. When the 60 new executives appointed in 2010 are incorporated (some of them will take their position in January 2011), the new management team will be more diverse in terms of gender and nationality.
In mid-December, Repsol gathered all of its management team for a two-day world convention held in Madrid, under the motto Juntos creamos futuro (Together we create future).
Diversity, equal opportunities and balance In 2010, Repsol’s Diversity and Balance Committee continued to foster a culture of respect in the company where diversity is valued and promoted, and the balance between the personal and professional life of its employees is made easier.
In addition to continuing to develop programmes from previous years, the company has decided to structure its policies and measures in accordance with the flexible
and responsible business management model, and it is currently analysing the elements this includes, such as employment quality, flexibility measures, support to families, professional development and equal opportunities. This work is being carried out across the entire company.
Regarding diversity measures, Repsol has made progress in its programme to integrate people with disabilities, and has continued to promote actions aimed at guaranteeing equal opportunities for all employees.
An important aspect of the work in 2010 were the procedures designed to help incorporate people with disabilities into the industrial sphere. The awareness-raising procedures that have been carried out since the beginning of the programme have been reinforced, and 990 people have taken part in some of the seminars organised this year in various locations within the company.
Likewise, the guide Superando barreras (Overcoming barriers) was published and distributed among the employees. This guide contains recommendations, suggestions, best practices and guidelines to improve relations with people with disabilities within the company, thereby helping them to integrate.
In December 2010, and in recognition of the company's work in the social and workplace integration of people with disabilities, Repsol received an award from the Imserso's Recovery Centre for the Physically Disabled.
As well as continuing its collaboration with Fundación ONCE through the second INSERTA agreement, the company has signed new collaboration contracts with the Fundación Seeliger y Conde, Fundación PADEIA (A Coruña), Imsero's CRMF, IVADIS and Afanias, among other institutions.
In January 2011, Repsol received the Telefónica Ability Award to the Best Private Corporation. This award, whose ceremony was attended by Queen Sofia of Spain, publicly acknowledges the work of those Spanish companies and institutions developing sustainable business models and which have integrated people with disabilities as part of their value chain, be they employees, providers or customers.
Repsol has, as of December 2010, a total of 463 employees with disabilities in Spain, of which 360 are directly-hired employees, and the remaining 103 were hired via alternative methods (2.56% of the workforce, according to the legal headcount). In addition to this, there are 90 employees with disabilities in Argentina, 25 in Ecuador, 10 in Peru and 11 in Portugal.
Repsol has also continued to foster measures to improve the balance between the personal and professional life of its employees, adapting them when necessary to the specific nature of the business and to the cultural environments in which the company operates.
Teleworking is becoming consolidated and spreading as one of the best accepted measures. As of 31 December 2010, there are over 557 teleworkers in Spain, 20 of whom are part of the pilot project taking place in industrial complexes. In addition to this, there are 120 teleworkers in Argentina and 14 in Portugal who take advantage of the spatial flexibility of this way of working, one of the top demands of employees reflected in the 2006 opinion poll.
Teleworking, which began in Repsol as a pilot programme in 2008, and has spread gradually through various stages throughout 2009, has become a perfectly normal
working mode in the company and is very highly regarded by both teleworkers and their bosses. Both parties stress that the critical factors for success are task planning and the use of technological advances.
The group of teleworkers is made up of employees from virtually all areas of the company, and from all professional groups and age ranges.
Repsol YPF, S.A. was one of 36 companies awarded the Distintivo de Igualdad en la Empresa (Equality in Business Badge), from among the 600 that participated in 2010. This badge is promoted by the Spanish government's Ministry of Health, Social Policies and Equality, and it is awarded to entities whose equality in treatment and opportunities policies for their workers are particularly noteworthy. Among other aspects, the Ministry has given special consideration to the work carried out by the Diversity and Balance Committee, the existence of a forum (Equality Department of the Fifth Framework Agreement), where company representatives and the workers' monitor these matters, and the progress seen in both the implementation and the use of the balance measures.
In Argentina, YPF received the Fundacion Proyecto Padres award Hacia una empresa familiarmente responsible (Towards family responsibility in business) for the second consecutive year, which in 2010 was declared of interest by the Honourable House of Deputies of the Nation.
Attracting the top professionals
Repsol was once again chosen as the best company to work for, according to the MercoPersonas survey and the Top Employer monitor.
In line with the activity carried out in previous years, the company continues to develop programmes to capture, motivate and commit the best professionals, offering them attractive working conditions and guaranteeing and promoting equal opportunities for their professional development.
Among the most important initiatives launched in 2010 is the improvement of the Welcome and Integration Programme, intended to optimise introductory processes for new employees coming from outside the company as well as those moving between different units within the company. The objective is to streamline their adaptation to the new work environment, guaranteeing their integration into the company and its values, as well as retaining talent. A new corporate framework for welcoming and integration has been designed this year, as a value proposition Repsol offers its employees that sets it apart from other employers.
Of the new incorporations in 2010, it is important to mention the actions carried out to hire young talent through the master’s courses in the Centro Superior de Formación Repsol (CSFR) for technical profiles and the New Professionals Plan for management profiles (71 new professionals were brought in to the company in Spain, Peru and Brazil).
The selection of candidates for the job banks of different profiles (chemical plant workers, bilingual sales representatives, etc.), the technification of profiles and the promotion of hiring people with disabilities for the industrial environment are other aspects worth mentioning.
Repsol has signed over 200 agreements with universities and other educational centres, through which almost 300 trainees have been brought into the company,
thus continuing this line of collaboration. Noteworthy among these is the agreement signed with the Universidad de Elche to foster “the best training in the world”, which has allowed a student with disabilities to do training at the Information Systems Managing Division. Furthermore, thanks to agreements with foundations and educational centres, students with disabilities have had access to various training programmes and grants offered by the company, some of them in the industrial environment.
Due to its success as a pilot programme, the “Impulsa” Scholarship Programme, which is based on providing training for the grant recipients, was continued in 2010: over 100 grant recipients with university degrees were provided with online training in languages, general skills courses, attending conferences, etc.
The Employment Channel on the repsol.com website consolidated its position among job seekers in 2010, incorporating the company's strategy of making it accessible to people with any disability.
Simultaneously, the company has continued to take part in forums, job fairs, seminars, etc., very often as a benchmark case for the employment of people with disabilities in a number of roundtables and lectures.
Repsol has also featured strongly in social organisation's awards, councils and seminars.
Talent management
One of the company's goals is to combine the need to have the adequate competencies and skills, acquire those that may be necessary in the future in a planned manner, while committing to offer people professional development opportunities by appropriately managing their talent.
With this aim in mind, 2010 saw the consolidation of the systems the organisation uses to assess and highlight its employees' talents: the People Review model and the professional development scheme for technical areas.
People Review is a development model to identify talent and to plan the main actions for the development of people, which was applied to 3,712 professionals in 2010.
Professional development in technical areas
Since technical knowledge is a key factor for business growth in Repsol, as well as for the development of people, technical skills charts and position types have been updated during 2010 by means of revision projects in different areas and units. They are a key element for the effective management of technical talent based on a platform of common knowledge shared by all employees.
In 2010 the company defined and approved its own technical career model as a means for professional advancement in critical technical areas, with the objective of attracting, retaining and developing the technical talent needed to reinforce its present activity and promote its future strategy. This mechanism has already been established in all the areas of the company where this type of profile is the base for development.
Training
Repsol is a company committed to people: it values, promotes and facilitates employee training as a key for their personal and professional development. The training should be focused on developing people's knowledge, skills and attitudes in order to reach the objectives of each unit, while aligned with the company's strategy and oriented towards Repsol's culture and leadership style.
A new Virtual Learning Environment (EVA Repsol) was designed and launched in 2010, based on new information and web 2.0 technologies, with the purpose of improving policies, models and training and learning actions to guarantee the company's present and future competitiveness. This new environment enables and boosts access to quality online training, to both standard courses on offer and to courses and activities designed specifically for Repsol.
Furthermore, in 2010 new training management processes and systems have been revised and developed by and for employees and their bosses, bringing catalogue training and training plans to employees so that they can assess their need for learning, improvement or to acquire new knowledge and skills.
During 2010, more than 1,200,000 hours of training were provided to over 29,500 employees worldwide.
One of the highlights of this tendency was training on the “Repsol Style” addressed to over 700 bosses in 14 countries. The “Repsol Style” is the trademark of Repsol's people managers; it defines the behaviour and attitudes expected and needed by the company to make its strategic plans become a reality. It involved standardising, simplifying and integrating the various reference frameworks on abilities, generic skills and behaviours that existed in the company, and promoting a leadership and management culture.
To meet their different needs, each division has designed its own specific programme based on a common work scheme, which in turn is based in an assessment of the situation.
Mobility
The approach on internal mobility was consolidated during 2010. The objective is to promote professional growth and the development of people by taking on new roles and challenges, while guaranteeing the maximum added value to the business.
To this end, a number of teams made up by representatives of the company's different divisions and units, known as “Development and mobility desks”, have been formed and are expected to generate cross-sectional development opportunities for employees.
In specific cases, when there is a need to present the opportunities that have arisen in a certain business, along with its projects for the future, and simultaneously, attract professionals interested in becoming part of these initiatives, internal job forums, known as “bridge projects” are formed.
In 2010 there were 5,892 employees changed position within the company.
International careers
In Repsol, 708 employees were working in other countries than the ones in which they were hired in 2010, and they form the group of employees on international assignment.
2010 has been marked by a need to quickly meet the needs that arose regarding the new projects that the company had started in various countries, which involved sending 175 people to other countries and hiring 64 professionals with an international profile, who bring with them specific experience in key areas in order to face these new challenges.
Once again, given its experience in managing expatriates, Repsol has been re-elected to the chairmanship of the Spanish Expatriation Forum (FEEX), for the 2011-2013 period. This forum, in which there are currently 25 Spanish multinationals, is a place to discuss the management of international assignments affecting their employees, as well as sharing experiences, good practices and initiatives.
Performance assessment
Four years after the introduction of the Repsol performance system, known as Gestión por Compromisos (Management by Commitments, GxC), the company has revised and improved the model to meet new needs. To this end, the information received through individual interviews with the top management, as well as the results of the annual audits, the working climate survey, etc have been taken into account.
The evolution of the GxC system reinforces the three pillars on which it is based responsibility, recognition and development , and maintains the key role given to
manager/worker dialogue within the process. It is also an evolution and flexibilisation of the assessment system.
These improvements went into force for the 2010 assessment, and they were preceded by an important communication campaign targeting all the parties involved.
The company also has an assessment system designed exclusively for employees covered by the collective bargaining agreement, which is used to appraise their skills and knowledge. It is, at the same time, a tool for identifying strong points and areas that need improvement in different skills areas.
This assessment is carried out through campaigns, according to the company's needs. It was applied during 2010 in Repsol YPF S.A., Repsol Butano and various Marketing areas, covering a total of 2,055 employees.
Innovation and improvement
Repsol fosters innovation as a key value of management, which is reflected in its quality policy.
During 2010, the company performed a reflection and repositioning process regarding the current quality and knowledge management functions. As a result, the company has made a strong commitment to foster innovation and improvement and incorporate them into management by creating specific areas in the company and the business divisions.
These new areas, based on collaboration and teamwork, and acting as a link between different areas and business divisions, will lead the promotion of a new innovation culture in Repsol, fostering the exchange of experience and good practices, as well as the identification of high-impact cross-sectional and multidisciplinary initiatives. They will also be in charge of driving their execution and of reporting on their results.
The first assessment of the innovation level was carried out in 2010, applying the innovation model as defined by the Club Excelencia en Gestión and the Fundación COTEC.
In addition, the company continued to implement key measures in the Strategic Quality Plan. Regarding self-assessments, it is important to stress that more than 50% of the organisation has performed at least three self-assessments.
In 2010, Repsol's self-assessment methodology was submitted to the European Foundation for Quality Management (EFQM) and the Ibero-American Foundation for Quality (FUNDIBEQ), after the review process started in 2007, for the purpose of ensuring that the self-assessment process is in line with the business strategy, the integration of improvement initiatives, the monitoring of action plans and to make quality a factor in the change management. This methodology has been formally acknowledged by the EFQM and by Fundibeq as “good management practice”.
In 2010, Repsol continued to work on the roll-out of process-oriented management across the entire company and on the use of benchmarking as a tool for continuous improvement. The formalisation of processes and identification of indicators and performance measures support decision-making and help to identify and implement improvements to ensure that targets are met.
Knowledge management
The competitive market in which Repsol operates requires constant innovation in order to adapt to its needs. For this reason, the company has decided to contribute to this adaptation through the creation of value and innovative capabilities in the organisation through knowledge management techniques and tools.
The knowledge management initiatives in Repsol contribute to business results, to improving efficiency and to management through commitments by designing and rolling out a model for development and skill transfer between all the business units and cross-over areas in the company. This becomes the way towards a common framework for generating innovation capabilities, constantly in line with strategic objectives and with quantifiable results to ensure continuous improvement.
Repsol aspires for knowledge management to become an essential part of its employees' daily activity, work processes and assessment systems, thus contributing to the creation of both a continuous improvement and innovation framework and an environment that fosters the participation, involvement and development of the people who work for the company. Repsol would like its employees to feel professionally enriched and motivated through knowledge management, as well as inspired on a personal level to actively participate in the progress of the organisation.
Repsol employees, regardless of where they are located or which unit or area they work in, will have access to all the knowledge available (content, people and processes), so that they can, at any time, locate the relevant knowledge they require, and the good practice identification and transfer in all areas and key processes, contributing to the creation of an environment open to innovation.
Regarding knowledge management and within its strategic framework, new practice communities were created in 2010 which, together with those already in existence, include approximately 26,000 people throughout the company. In 2010 several projects for retaining employees’ knowledge and transferring it to others were undertaken in order to ensure that critical knowledge is kept within the company when employees retire, are rotated, change office, or when new professionals or training materials are incorporated, etc. The methodology applied is mainly supported by compiling personal histories and experiences which are recorded and distributed with audiovisual media.
To bring company knowledge to all the employees, and based on the experience of the Moebius pilot project, the semantic search system is undergoing functional analysis for the purpose of making this knowledge that exists in Repsol regarding people, business processes and any other type of content, available to every employee. This analysis involves designing indicators to measure the employees' contribution to the company knowledge, as a key element for making the cultural change that this initiative requires a reality.
In 2010 a project was carried out to define the framework and reference architecture to support the roll-out of the chosen strategy for the management of knowledge in the entire company. In addition to this, the first two business innovation portals, which were designed in accordance with the open innovation paradigm to give employees a channel for their innovation and improvement proposals, have been introduced. Once this has been properly assessed, the company intends to expand the use of this type of portal to other businesses. One element that sets this system apart is the use of semantic technology, which optimises the entire process of collecting, selecting and appraising the ideas received and favours the creation of teams of people linked by the similarity of their innovation and improvement proposals.
Work relations During 2010 in Spain there were negotiations regarding the collective labour agreements to temporarily adapt the workforce of those businesses whose activity has been affected by market conditions.
On 29 September the CC.OO and UGT unions organised a general strike to protest against the labour market reforms passed by the Spanish government. In the Repsol Group companies, 9.79% followed the strike.
Regarding YPF, the company took part in the roundtables organised by the Argentinean government as part of the so-called “Social Agreement” between companies, unions and the government. At the same time the work guidelines were established for the renegotiation of the Collective Agreement signed with the United Oil and Hydrocarbons Workers Union (Sindicato Unido Petroleros e Hidrocarburiferos - SUPeH). An addendum to this Agreement was also signed with the aforementioned union, incorporating new benefits for the workers.
Health and safety In the health area, the following initiatives were developed in 2010:
Internal Health Regulation Compliance Audit: the process started in 2009 by the Refining Spain Managing Division came to an end with the audits carried out in the Puertollano and Petronor industrial complexes.
Standards for the Assessment of the Social, Environmental and Health Impact were developed and, in collaboration with Safety and Environment Department and with the Corporate Responsibility Department, there were workshops for the employees in Madrid and Buenos Aires.
Preparation of a “Health Management System”, with the purpose of standardising the tasks and functions of medical services.
Health Promotion Campaigns in different countries: such as the Early Detection of Colon Cancer and Detection and Control of Hypertension in Spain; Prevention of Malaria and Hepatitis A in Ecuador, Venezuela and Colombia; Prevention of contagious diseases in Ecuador, Colombia and Brazil, etc.
INNOVATION AND TECHNOLOGY
Repsol YPF considers its R&D investments to be one of the key factors for creating an efficient and sustainable energy system that will be capable of meeting the industry’s two main challenges: security of supply and the reduction of CO2, while maintaining the competitiveness of the energy system. Consequently, Repsol invests in R&D to find solutions to these major challenges, providing value both for the company and for society as a whole.
Uncertainty about what will be the dominant technologies of the future, prospective R&D results, business cycles and cost reduction stresses at low points in the cycle have led Repsol to develop a Strategic Technology Plan as part of its business strategy. The lines of work set out in the plan cover all the company’s businesses: hydrocarbons exploration and production, the natural gas value chain, oil refining and related products and petrochemicals, and new energies for diversifying energy production and its use.
In 2010 Repsol invested €64 million in R&D activities carried out directly at its technology centres in Spain (Mostoles) and Argentina (La Plata) and a further €7 million in projects undertaken in the company’s different business units. Repsol maintains an active policy of collaboration with both public and private technology institutes and universities in Spain and internationally. The investment earmarked for these types of agreements was in the region of €8 million in 2010. Repsol participates in R&D financing projects sponsored by different areas of government. In 2010 it took part in 29 projects promoted by the Spanish Government, 10 European Union projects, and 15 projects involving the Argentinean government.
R&D programmes
Upstream. Repsol applies the most advanced technologies in the exploration of new oil and gas fields. The major finds reported in 2008, 2009 and 2010 are a good example of the efficient application of these technologies, which include the geophysical technology developed in the Kaleidoscope project, placing Repsol at the cutting edge in the exploration of complex areas. The objective of raising the reliability of underground imaging and reducing the uncertainty inherent in the search for oil and gas can be applied at a depth of thousands of meters in difficult areas with
significant reserves, such as U.S. waters in the Gulf of Mexico and Brazil, where thick layers of salt hide oil companies’ targets.
Meanwhile, new advanced analytical and geo-chemical methodologies to describe oil-bearing systems in detail can be applied in both hydrocarbon exploration and in the development and operation of finds, and the company uses its own proprietary models and methods to assess and assure the flow of oil or gas under adverse conditions, especially in offshore production.
Another key R&D line at Repsol involves the use of improved recovery technologies for extracting more oil and gas from mature reservoirs. Also, the search for unconventional hydrocarbons, world reserves of which are expected to be significantly higher than have been exploited to date, represents a major challenge for the company, requiring the development and application of special technologies.
LNG. During 2010, with the start-up of Peru LNG, Repsol consolidates its position as a global leader in the LNG sector. Liquefaction technologies are being developed in this area for use in floating systems, which will make it possible to capitalise on gas reserves that cannot be exploited in an economically viable manner at present. Repsol also systematically monitors alternative technologies that would enable capitalisation of gas reserves, such as the conversion of natural gas into liquid fuels.
Downstream. In the area of oil refining and oil derivative products (gasoline, fuel oils, LPG, asphalts, lubricants, specialities, etc.), technological knowledge is applied to the operational optimisation of refineries and the enhancement of product quality with particular attention to advances in energy efficiency and environmental issues.
Developments allowing unconventional crude oils and biofuels to be processed may be cited as an example of progress in this field, as well as co-processing biomass in refineries, innovation for international expansion in lubricants, the development of more environmentally-friendly asphalt, LPG automotive applications and integrated systems providing enhanced energy efficiency.
Technological development lines in petrochemicals are oriented on a priority basis towards new differentiated products and specialties, as well as towards improving the overall efficiency and cost-saving of processes. Some of 2010 highlights are the industrial introduction of new catalysts for polyolefins and the development of piping, injection and fibre products with better properties, the manufacturing of hydrogenated rubber of various degrees of hardness of a higher added value and the development of technologies for the production of next-generation polyols for polyurethane foams, sulphured fertilisers and bioparaffins.
In April 2010, while the New Energies Business Unit was being created, the New Energies Technology Department was also set up to promote and boost new energy-related R&D and demonstration projects, among others, intensifying activity in the bioenergy field by developing projects on the renewable biological fuel production value chain.
In the area of CO2 management, the activity is focused on developing projects for the geological CO2 capture and storage and other alternative technologies such as CO2fixation by biomass. In addition to this, the investigation of emerging technologies in renewable electricity generation and electricity power supply, recharging and storage systems for hybrid and electric vehicles has begun.
Technology prospecting studies In order to achieve a sustainable energy future, we must overcome ambitious technology barriers to arrive at new and better solutions, both in the oil and gas sector and with other energy sources. Repsol carries out systematic prospecting studies to identify opportunities arising from the long-term evolution of key technologies for the energy and petrochemical sectors.
These include studies on bio-energy, future combustion engines, electrification of transport, renewable energy, CO2 capture and storage and biopolymers. These studies allow Repsol to develop new expertise and guide its future lines of work.
CORPORATE RESPONSIBILITY Energy companies have taken on a great responsibility by facing the challenges of a sustainable energy model that can guarantee a safe supply, contributes to minimising the effects of climate change and respects human rights in every area.
Since 2003, Repsol has maintained an active commitment to the ten principles of the United Nations Global Compact. The company signed up to this initiative to make the world a fairer, more united place. During 2010 it took part in various Global Compact-related actions. Likewise, Repsol is aware that its oil and gas extraction activities are an important source of income for the governments in the countries that own these natural resources. These resources, if properly managed, can and should be a positive contribution to their economic growth. For this reason, the company signed up to the Extractive Industries Transparency Initiative (EITI) from its launch, and we believe that this global initiative is in the best position to achieve its goal of increasing financial transparency. In 2010, Repsol has provided financial support for the EITI and has been involved in several programmes to spread information and awareness about the initiative.
Likewise, its second 2012 Sustainability Plan was launched. This plan is part of the Corporate Responsibility model, in its phase of managing any necessary changes to maximise social and environmental opportunities, and it consists of actions aimed at reviewing the company's processes and the employees' specific training.
The plan's 61 actions are divided in nine strategic programmes:
1. Safety increased.
2. Ethical behaviour and fight against corruption.
3. Respect human rights.
4. Compromiso con nuestra gente (Commitment to our people).
5. Integration into the community.
6. Sustainable energy and climate change.
7. Controlling and minimising environmental impact.
8. Influencing our suppliers, contractors, subcontractors, distributors, partners and customers.
9. Being accountable for our social and environmental performance.
Repsol will continue working to make safety a distinguishing feature of the company's culture, promoting initiatives such as updating its risk management system and improving safety in processes, transportation, emergency control and the safety management system.
Ethical behaviour and fight against corruption are the essential base for all other actions. The company will continue to reinforce ethical standards in its businesses, fostering initiatives to increase the ability to make ethical decisions when faced with any dilemma and to reinforce the commitment to the Group's Ethical and Conduct Regulation. Repsol will formally adopt a Policy for the Promotion of Transparency, Against Corruption and Bribery, and it will foster financial transparency in the extractive industry.
The programme for the respect of human rights will help reinforce the requirement to respect human rights that is already in force in the company's code of conduct, by providing a global policy for this purpose. It will also increase employees' capability to act and make decisions to favour human rights, even in unusual situations, supported by specific training programmes, which will become embedded in the training programmes for the company's professionals.
Another programme is the one called Compromiso con nuestra gente. This plan gave Repsol the chance to approach certain innovative ideas within the scope of protecting women's equal rights among the employees; the balance between work and personal life; the promotion of innovative ideas; and the promotion of a health culture.
The programme for the integration into the community includes some actions to get to know the expectations of the company's stakeholders; and social performance, with a view to improving it. Repsol will also work on improving our relations with local communities, because it believes that they can benefit from the employment and the purchases the company generates.
Regarding environmental initiatives, the company will continue to identify opportunities to increase its energy efficiency and to reduce its greenhouse gas emissions. It will likewise continue to invest in research and development of new biofuels and other alternative energies, and in technologies for CO2 capture and storage; in addition to continuing to work to reduce its emissions, optimise water management, improve waste management, heighten spill control and gain a better understanding of the impact on biodiversity.
One of the new areas included in this plan concerns the company's actions to influence its partners and the value chain to take on higher standards in ethical, social and environmental management. Since reputation is largely linked to that of our partners, suppliers, contractors, subcontractors and distributors, Repsol will promote its ethical, social and environmental standards among them, as well as promoting responsible energy consumption among our clients.
The progress made on these issues and ethical, social and environmental performance are detailed in the Corporate Responsibility Report and the United Nations Global Compact Progress Report. Aware of the importance of the impact caused by the company's activities and operations, and therefore, the relevance of being accountable to the local stakeholders, for the second year running the company has published its Repsol YPF Ecuador Corporate Responsibility Report. A new aspect was that the 2009 Ecuador report, published in 2010, was assured by an independent expert. In Argentina, in 2010, YPF has published the first Corporate Responsibility Report.
Repsol's presence in the sustainability indexes is proof that the company has been able to gain the trust of analysts and institutional investors who understand that corporate responsibility is a good indicator of a company's quality of management and governance.
For the fifth year running, the company's performance in terms of corporate responsibility has been acknowledged by remaining in the prestigious FTSE4Good and Dow Jones Sustainability Indexes. In the latter, out of 112 oil firms analysed on an international level, Repsol was one of the 12 companies included in the world index (DJSI World), while it is one of only four European companies in the oil and gas sector that have made it to the European index (DJSI Europe). Repsol is the second company in the sector on points in the environmental dimension, and the first in the social dimension. Furthermore, for the first time ever, it obtained the maximum overall points in environmental policy and management system, and it has been awarded the maximum qualifications in the sector regarding the following criteria: climate strategy, standards for suppliers, stakeholders engagement, social impact on communities, customer relationship management and transparency.
Also in 2010, Repsol confirmed its continued presence in the Global and European Ethibel Sustainability Indexes (ESI), which recognise the best companies in each sector in terms of their corporate responsibility and sustainability performance.
Repsol Foundation The Repsol Foundation carried out a number of projects in 2010 as part of its commitment to the sustainable improvement of society.
One special area of interest for the Foundation is that of public responsibility. The Citizen R programme can be included in this area of action. This is an initiative to promote a culture of civic participation and commitment, and to promote values such as responsibility, solidarity and respect. During 2010, the Citizen R caravan, a mobile unit with exhibitions and interactive games and workshops, moved around various Spanish cities raising awareness among children about the importance of making a responsible, efficient use of energy, and the need to respect and care for the environment. During its travels, the caravan received over 37,700 visits.
As part of its Energy Observatory, the Foundation updated its Energy Efficiency Index, which provides comprehensive and itemised information on its evolution and its contribution to reducing electricity consumption. It has also developed a new index on Intensity of Greenhouse Gas Emissions. This index offers information, by sectors, on greenhouse gas emissions associated with energy production, distribution and use in Spain and in the European Union's 15 main countries.
In the education and training field, in addition to scholarship programmes and collaboration with universities and other academic institutions, the Foundation fosters scientific research and the generation and dissemination of knowledge. In this sense it is worth mentioning Movilab, a programme developed with the Spanish National Research Council (CSIC) to bring science to the general public and, in particular, to promote an interest in science among schoolchildren. During the academic year, a mobile laboratory installed in a truck's trailer went to the main provincial capitals and other cities in Spain bringing interactive workshops prepared with teaching techniques and scientific rigour.
Contributing to the social and workplace integration of people with disabilities is one of the tasks in which the Foundation is increasingly involved, by working in
educational, cultural and sports projects. In the last quarter of the year, in collaboration with the Fundación ONCE, the educational awareness programme Tu formación no tiene límites. Desarrolla tu futuro (Training is unlimited. Develop your future) started, with the aim of promoting access to university for people with disabilities and normalise their workplace integration process. Another noteworthy programme is the one carried out in collaboration with the Fundación Bobath, through which young people suffering from cerebral palsy and brain damage can have access to formal education in Administration, which provides them with employment opportunities. In 2010, three students in this programme, which includes an internship in a company, finished their course successfully, obtaining their administrative technician degrees. Regarding sports, the Fundación supports programmes that make possible the practice of mountain sports and adapted cycling for sportsmen with various disabilities in a relaxed environment and in the company of family and friends. Simultaneously and in collaboration with other entities, it promotes creative writing and theatre workshops specifically designed for people with disabilities.
In this line of action is the “Recapacita” (Think it over) programme, aimed at raising awareness in society about the problems faced by people with various types of disabilities. “Recapacita” is an interactive space with a circuit involving different senses showing, by means of a series of activities in which participants have to put themselves in a disabled person's position, the difficulties they face in their daily lives.
In the area of international cooperation and development aid, the Repsol Foundation has become actively involved in the rebuilding of Haiti. In addition to the initial 100,000 euro donation and the collection of funds among our employees and the general public to help the victims of the earthquake, the Foundation has organised a global aid project to encourage the development and rebuilding of the Caribbean country. One of its programmes, called árboles solidarios (tree solidarity), aims to plant 29,000 trees of local species as part of an agroforestry plan to generate resources in a sustainable manner and improve food resources and the social, economic and environmental conditions of the towns in the Pichon area, in the southeast of Haiti. Other projects are focused on fostering local initiatives to promote agricultural, fishing and livestock production, as well as the manufacture and sale of these products in local markets. These programmes are carried out in collaboration with Solidaridad Internacional.
In Senegal, collaborating with the Fundación Por Una Sonrisa en Africa, several educational and health centres have been provided with infrastructure. These centres are located in several communities south of Dakar, and 6,000 people have benefitted from this programme either directly or indirectly.
As part of the International Year of Biodiversity, the Foundation contributed to improving knowledge on biodiversity and its importance for life and economic development by organising several activities, such as the exhibitions in the Royal Botanical Gardens of Madrid: Biodiversidad en España (Biodiversity in Spain) and Imágenes del paraíso. Las colecciones de Mutis y Sherwood (Images from Paradise. The Mutis and Sherwood collections), and the First Seminar on Biodiversity and Social Responsibility. This forum, held in May 2010, considered the issue of biodiversity from economic, social, environmental and scientific points of view, stressing its importance in a sustainable development model.
Another factor that contributes to the development and progress of a community is the dissemination of art and culture. Consequently, the Foundation cooperates with museums, institutions and other cultural foundations to bring music, theatre, art and literature to the public.
The Foundation also promotes and develops social studies of general interest with the intention of gaining more in-depth knowledge about those social problems and needs that are most prevalent in our society, thus contributing to the generation and dissemination of knowledge, both at a popular and at an expert level. Its research lines include a number of areas: social observatory of energy, responsible mobility and science and society. In the area of responsible mobility, two complementary studies were presented in 2010: La alimentación en los viajes por carretera. Hábitos y comportamientos (Food during road trips. Habits and behaviours), which analyses drivers' and their companions' main food-related habits and behaviour while on the road; and Recomendaciones nutricionales durante los viajes (Nutritional recommendations for journeys), prepared in collaboration with the Spanish Nutrition Foundation to establish the most suitable food guidelines regarding different kinds of journeys, considering factors such as population groups, type of journey, transport used and season. As a complement to these studies, and in collaboration with the Dirección General de Trafico (Spanish Department of Traffic), the Foundation prepared a set of good practices for good feeding habits on the road, contributing to safer driving.
The Repsol Foundation undertakes its activities in those countries where the company operates its business, with specific projects adapted to the local needs. In Ecuador, for instance, it fosters a microcredit programme in the Orellana and Sucumbios provinces, designed for low-income women who are excluded from the usual financial system, and enables them to become self-employed.
In Peru, the Foundation has opened the Centre for Education and Integrated Human Development (CEDHI) for young people at risk of social exclusion in Arequipa; the educational infrastructure of Pachacutec has been extended by building a secondary school and a basic training space at the Centre for Education and Community Development (CEDEC), making the integration of young people at risk of social exclusion into the education system possible. Construction on the Luisa Astrain School has also begun in order to provide access to education for children living in extreme poverty.
In Bolivia, in the area of health, the building of a paediatric and emergency section has been started to enlarge the capacity of the Hospital San José Obrero in Santa Cruz de la Sierra, an area with significant unmet needs in this field. Similarly, the Foundation continues to work on the healthy home programme to fight Chagas disease in some zones of the country.
These and other programmes and projects are but an example of the Repsol Foundation's commitment to improving society and the welfare of people.
YPF Foundation Since its creation in 1996, the YPF Foundation has worked on initiatives relating to education, scientific research, heritage conservation, the dissemination of culture and environmental protection, in Argentina in particular.
A social development path was begun in 2009, in those areas where the company has operations. By 2010 two important milestones were reached: the opening of the Centro Cultural Las Heras, in Santa Cruz, and of the Oil and the Environment Museum, in La Plata.
In education, 33 technical schools in the provinces of Buenos Aires, Chubut, Mendoza, Neuquén and Santa Cruz benefitted from high-level teacher training, next-
generation equipment and educational materials. The mobile interpretation centre Ciencia y Tecnologia en Movimiento (Science and Technology in motion) was presented at the International Book Fair and travelled to schools and science fairs in different parts of the country. In addition to this, 200 students received support in their oil and gas industry-related university studies, as well as 69 professionals who were carrying out post-graduate scientific and technological work.
With the aim of improving people's social and work inclusion, the Foundation has continued to offer a job training programme in the towns where Repsol has operations. A new project was added in 2010, the Re-Conocer programme, which deals with disability related problems by raising awareness and implementing actions for educational and workplace inclusion.
In the area of sustainable development, the YPF Foundation has been working alongside various institutions such as Ecocentro, the NGO Aves Argentinas and Parques Nacionales, to coordinate research and awareness projects on environmental improvement and on the protection and conservation of the environment and biodiversity.
Regarding cultural activities, the First International Violin Competition Buenos Aires 2010 was organised, in collaboration with the Amijai community and as part of the patronage of the Buenos Aires city council: 25 young violin players from all over the world were judged by an internationally-renowned jury chaired by Shlomo Mintz.
For the second consecutive year, the YPF Foundation Cultural Season presented over 100 free plays and musicals for adults and young people in 13 towns. And with Arte en la Torre (Art in the Tower), a new contemporary art venue in its Buenos Aires headquarters, the YPF Foundation brought the work of many important Argentinean artists to the general public.
The Muestras Itinerantes (Travelling Exhibitions) programme also started, with Marcos López's photography exhibition Vuelo de Cabotaje. Another art-related programme, carried out in the provinces of Formosa and La Rioja, was called Argentina Pinta Bien 2010. A sculpture called Los Caballos de San Martin, made from industrial waste material, was presented by the artists taking part in the Metalwork Art Workshop.
During 2010 the Foundation has worked actively in the conservation of Argentinean heritage. Some of the projects were: the project to restore and conserve Candido Lopez's work; the restoration of the group of sculptures on the facade of the Museo Etnografico Juan Ambrosetti; renovation of the Teatro Colón tearoom and the recovery of Museo Gauchesco and Parque Criollo Ricardo Güiraldes.
Two books, on the history of the Rosedal (rose garden) de Palermo and the Patio Andaluz, have been published; the book Parques Nacionales Argentinos (National Parks of Argentina), by artist Diego Ortiz Mugica, developed in collaboration with the Fundación Parques Nacionales and Telefónica, was presented; and the second volume of the lexical dictionaries La Academia y La Lengua del Pueblo, with the Argentinean Academy of Literature was launched.
Repsol YPF Ecuador Foundation In line with its firm social commitment, Repsol decided voluntarily to create a foundation in Ecuador with the basic objective of working for the development of
indigenous and mixed-race communities in the territories indirectly within the sphere of influence of Block 16. The Repsol YPF Ecuador Foundation was created on 11 May 2001.
Based on a study of socio-economic and cultural conditions in the area, three priorities were identified to improve the conditions of life for the population. The first is related to education and job market insertion; the second is oriented towards health and hygiene; and the third concerns efforts to strengthen production and commercial capability at the micro and local levels. Likewise, it should be mentioned that the Inclusive Business Model was introduced in 2010 which, in addition to generating business profit, creates social and economic value by integrating low-income people into the operations of several companies.
The Repsol YPF Ecuador Foundation took part in 22 social development projects in 2010. Of these, 11 were completed during the year, and the remaining 11 are ongoing projects basically involving monitoring and technical support work. The foundation is convinced that the sustainability of its initiatives requires not only the injection of funds, but also continuous monitoring and support for projects after the funding process is complete, to ensure full autonomy.
A total of 11,865 people benefited from the initiatives funded by the Repsol YPF Ecuador Foundation using its own resources and contributions from counterparty entities, strategic allies of the foundation and the communities themselves.
The foundation is making a consistent effort to generate proposals and seek additional funding with the aim of enlisting the support of multilateral cooperation organisations and other companies in its social and environmental development projects and initiatives.
THE ENVIRONMENT
Caring for the environment is an essential aspect in the management of Repsol’s activities. This principle is part of the company’s strategic vision and its commitment to “contribute to sustainable development and the improvement of the social environment, and to respect human rights, the environment and safety”.
Repsol's principles in terms of safety and the environment are defined in its Safety, Health and Environment Policy, applicable to all the activities of the company. One of these principles is incorporating safety and environment criteria to the entire life cycle of the activities, with the purpose of preventing damage to people and assets and minimising the impact on the environment.
The basis for managing safety and the environment is the management system, formed by a large body of regulations, procedures, technical guides and management tools which are constantly updated to adapt them to the sector's best practices.
The ISO 14001 certificate has been promoted in the facilities as a way to foster continuous improvement and to obtain an external validation of the management systems. All the refineries, chemical plants and lubricant and specialties facilities are currently certified, as well as nearly all the exploration and production centres and a growing number of installations devoted to other activities. (See a list of the certified centres at www.repsol.com)
Significant environmental investments were made during 2010, with the aim of improving the environmental quality of oil products, minimising air emissions, increasing energy efficiency, optimising water consumption and reducing the pollutant load in water discharges, and of improving spill prevention systems by applying the best practices available and technological innovations. The company has also made a significant effort to identify, appraise and correct possible polluting situations that occurred in the past.
Details of the Group’s environmental assets, provisions, expenses and future actions are detailed in Note 35 of the Consolidated Financial Statements. Furthermore, in Repsol's Corporate Responsibility Report 2010 there is a list of the most important actions carried out during the year for the protection and conservation of the environment, as well as the evolution of the most relevant indicators.
SUSTAINABLE ENERGY AND CLIMATE CHANGE
During 2009 and 2010 Repsol has developed the Carbon Strategy to meet the challenge of providing a responsible energy supply. After creating the New Energies business unit (see Downstream and Innovation and Technology sections) and the roll-out of positionings and action plans, a new stage has begun in Repsol's Carbon Strategy, with the purpose of:
Promote a common carbon-reducing culture and guide the deployment of future projects, both in Upstream and Downstream as well as in the New Energies businesses.
Identify synergies between all businesses, in order to reduce carbon.
Repsol's Carbon Strategy is geared towards six areas:
Energy efficiency to curb CO2 emissions and operating costs.
Carbon markets, which focuses on covering the expected deficit under the EU emissions trading scheme (ETS), the development of Clean Development Mechanism (CDM) projects and obtaining Certified Emissions Reductions (CER).
Prospection, development and implementation of technologies for CO2 capture and storage.
Biofuels strategy: research, development, production, blending and distribution.
Development of new technologies for transport, contributing to guarantee the supply of cleaner fuels with less environmental impact.
Search for business opportunities for renewable electricity generation, establishing synergies with the company's current operations.
In the area of climate change, the following events in 2010 are worth mentioning:
The United Nations has approved the industrial project for the YPF refinery in La Plata (Argentina) as a Clean Development Mechanism (CDM), thus becoming the first project of this kind approved in the world. The CDM, an instrument included in the Kyoto Protocol, allows companies to develop Greenhouse Gas Emissions reduction projects, thus favouring sustainable
development and the introduction of clean technologies in the countries where such investment is made. This project will considerably reduce the emission of greenhouse gases (about 200,000 CO2 metric tons/year) by reusing waste gas which normally would have been burnt in the flare. The use of this gas in the refinery's equipment partly replaces the use of fuels such as natural gas or fuel oil.
Likewise, for the project to be approved, it was necessary to develop a new methodology which was also approved by the United Nations in 2007 under the name AM0055 “Baseline and Monitoring Methodology for the recovery and utilization of waste gas in refinery facilities”. Four projects in the world are currently applying this methodology.
Once again, the company has been included in the selective Climate Disclosure Leadership (CDLI) index, which groups the 51 best industrial companies in the world featured in the FTSE Global Equity Index Series (Global 500) regarding climate change communication and transparency. The company has also been qualified in the new Climate Performance Leadership Index (CDPI), which recognises the 48 companies with the most highly-developed strategy for the management of climate change-related risks and opportunities and which are adopting the best measures regarding its mitigation. Repsol is one of only two oil companies in the world, and one of two Spanish companies, that is featured in both indexes.
Additionally, in March 2010, Repsol received the Emissions Tracking Carbon Verification Leaders Award 2010, acknowledging the information disclosed by the company on the verification and accounting of its greenhouse gases. According to the Environmental Investment Organization (EIO), the entity behind this award, Repsol is one of seven companies, among 1,000 analysed in this study, whose Emission Report was entirely verified and accepted and it was also the only energy company to obtain full recognition.
COMMUNICATION
Transparency and close relations with the company’s different stakeholders are the mainstay of Repsol’s communications strategy. Nowadays, society demands accessible information, and Repsol does not hesitate to cater for this need in the smoothest and most reliable way possible with a number of tools.
Shareholders and investors These groups have access to all sorts of resources that enable them to find out about the day-to-day business of the company. Since its stock market flotation in 1989, Repsol has had a Shareholder Information Office (OIA) and an Investor Relations Department, and through them it deals with the needs of its shareholders, institutional investors and stock market analysts. Over the last few years the company has been increasingly covered by analysts; currently there are 41 analysts monitoring the company's evolution.
Shareholders can ask for any information they need from the OIA by going to the office in person, calling the 900 100 100 freephone or by post or e-mail. The OIA received about 52,000 calls in 2010 (an average of 200 per day). Most of the
enquiries concerned the share price, the Annual General Shareholders' Meeting, the policy on and payment dates of dividends, and the material facts on the company.
In addition, the corporate website (www.repsol.com) provides access to all the relevant information about the company, as well as specific contents in the section “Information for shareholders and investors”, which in 2010 had more than 200,000 visits. The portal has also several e-mail addresses (the standard one being [email protected]) for asking questions or requesting publications. In 2010 over 5,000 e-mails were sent to these mailboxes, mainly asking for information about Repsol.
The Investor Relations Department provides smooth communication with institutional investors and stock market analysts. During this year the company organised a roadshow (meetings with institutional investors outside the Repsol offices) in Europe and the United States, with the participation of the top management, and another 20 meetings with the Investors Relations team. Furthermore, Repsol has been present in several conferences in the sector, both in Europe and in the United States, within which there were also meetings with institutional investors. Adding to the aforementioned the visits received in the company's offices, the total is about 500 institutional investors contacted during 2010. Finally, the Investor Relations Department organised a field trip (a visit for analysts and institutional investors focused on a certain representative asset of the company, with the presence of the top management and the local management) in Peru, attended by 23 analysts who follow the company's evolution.
Media relations Repsol’s policy for media relations is based on the principles of transparency, immediacy, accuracy and reliability of the information conveyed. The company at all times endeavours to ensure that requests for information from journalists are answered as quickly as possible, keeping up a free-flowing and ongoing contact with the media, which is regarded as vital for conveying developments in the business activity and management of a company that is present in more than 30 countries.
Repsol’s Communication and Chairman's Office ED deals daily with general and specialist media at international, national, regional and local level, providing them with information about everything that professionals from this sector need to know. In addition, it works closely with the local media in the places where the company’s industrial complexes are located.
All the media are informed of key activities and initiatives undertaken by Repsol by means of press releases. In Spain, Repsol distributed over 70 press releases during 2010, as well as those disseminated locally by the industrial complexes, the information released by the company in the countries where it operates and those related to sports sponsorship projects.
To strengthen the relationship with journalists, press conferences and specific informative meetings are arranged. In this sense, one of 2010 highlights was the press conference for the presentation of the 2009 results, which took place on 25 February 2010, and the one for the presentation of the main projects and investments included in the Horizon 2014 Plan (29 April 2010).
The company’s website has a specific space, the press room, that provides immediate access to information about the Group. From this space, the press releases issued by
Repsol, as well as publications, pictures, videos and all kinds of relevant information about the company are made available to the media and the general public. It also contains useful tools and a glossary of terms.
Repsol has a press mailbox ([email protected]), which aids relations with the different media. Over 4,000 enquiries and requests for information were handled through this channel in 2010. Likewise, every day dozens of queries are answered on the phone.
Repsol's commitment to transparency and truthful information was acknowledged in 2010 with two awards: in February, Repsol was chosen as the energy company with the best relationship with the Spanish press, according to the second wave of the KAR survey carried out by IPSOS. 46% of Spanish journalists polled chose Repsol as the company in the sector that had the best relationship with the press.
In mid-November, the Chamber of Commerce, Industry and Shipping of Barcelona informed Repsol that it had been awarded the 46th Premio Llotja, which acknowledges the company's effort to set up a truthful, complete and accessible information system for its shareholders and investors, and also for the general public.
Repsol online For Repsol, transparency and openness with concern groups is a priority. The portal www.repsol.com is, in this sense, a key tool.
In 2010, the company reinforced its interest in digital media by focusing on three main lines of action. In the first place, the creation of new digitised contents to make Repsol, its brands and products better known to users, and to get closer to them via exclusive, interesting content. Secondly, enabling access through new platforms such as the iPad and iPhone, where applications related to the Repsol Guide are already available. And last but not least, fostering dialogue and interaction through its profiles in social networks.
In 2010, repsol.com had 70 million webpage viewings and 5 million visits per month and was once again distinguished by Spanish and European digital communication experts: the Spanish Association of Accountancy and Business Management, which gave the 8th Premio AECA to the Ibex 35 company with the best financial information on the Internet, and the international consultancy company Hallvarsson & Halvarsson who, for the seventh consecutive year, chose Repsol as the top Spanish company, thus retaining its position as one of the ten best European companies in terms of the efficiency and transparency of their corporate websites.
Regarding social networks, Repsol reinforced its presence, focusing mainly on the Repsol Guide and sports sponsorship. Its Facebook and Twitter profiles gather over 60,000 and 4,000 fans respectively. The company also has a gastronomy blog and another two with the Repsol riders Dani Pedrosa and Marc Marquez. In corporate terms, a monitoring and active listening system has been introduced to learn more about the perception of concern groups on the web.
These results and Repsol's constant interest in strengthening the relationship with its stakeholders, fostering interaction and providing direct access to communication via the multiple possibilities offered by digital media, have enabled the consolidation of repsol.com's leadership in online transparency and communication in Spain and Europe during 2010.
INTANGIBLE ASSETS MANAGEMENT
A large part of a company's value is in its intangible assets; brand and reputation being the two key strategic values for the differentiation and the generation of trust among stakeholders.
For this reason, the management of these intangible assets in Repsol is handled by the Department of Communication Strategy, Corporate Reputation and Branding.
Brand strategy Repsol understands the concept of brand in its broader sense, from visual identity to different types of communication (internal communication, advertising, marketing, public relations, sponsorship and patronage). And Repsol is convinced of its increasing importance as a key element in product and service differentiation, the continuity of leadership in relation to customers and society in general, and the ability to attract and retain human capital.
A perfectly managed common identity allows the company to issue an unambiguous, differentiated message to its public, as well as building links with them.
Throughout its history, the Repsol brand has received awards and recognition, including high positions in the most prestigious brand rankings such as Interbrand and “Trusted Brands 2010”.
ReputationCorporate reputation, understood as the company's ability to generate trust, respect and admiration, is a key factor in business management. The aim of reputation management is to promote the constant improvement of the organisation and of its external recognition.
Repsol, a pioneer in this area,.is one of the founding companies of the Corporate Reputation Forum and has adopted the Reptrak model - an internationally recognized standard - as part of its reputation management and monitoring tools.
To reinforce this function, in 2010 Repsol created a department whose specific objective is to define corporate reputation policies, strategies and management models as well as the periodical monitoring of its status.
Repsol has retained its top ten position in local and international reputation indicators, such as MERCO (Spanish Business Reputation Monitor) and in Fortune’s World's Most Admired Companies (Oil & Gas sector).
SPORTS SPONSORSHIP
During 2010, Repsol took part in the world's top motor sport competitions, like the World Motorcycle Championship, the best possible testing bench for its lubricants and fuels. Thanks specifically to the cumulative experience gained in the development of products for top-level competitions, Repsol is able to maintain its leading position in
research and the development of products capable of living up to the expectations of its customers.
In line with our track record, 2010 was an outstanding season in terms of the world championship titles won by the Repsol drivers in international competitions. In MotoGP, Repsol came second with Dani Pedrosa. The Spanish motorcyclist won four grand prix, breaking his personal record, but bad luck and an injury when he was at his best meant he could not fight for the championship in the last few races. The Italian Dovizioso topped the podium seven times, but finished the season in fifth place.
But if there is something to remember about the 2010 season, it is that Marc Márquez won his first 125cc world championship. This motorcyclist, sponsored by Repsol, won ten grand prix, becoming the youngest Spanish rider to win a world title and the second in history. Marc's talent and charisma have made his races as popular as the top category.
Furthermore, the Repsol team won the Indoor and Outdoor Trial World Championship in the male competition and Outdoor Trial in the female competition. Toni Bou has won eight world championships. At 25, he is the rider with the second-highest number of prizes in history. On the female side, Laia Sanz, ten times world champion and winner of the Premio Nacional del deporte Reina Sofia, won the female competition in her first time at the Dakar rally. Similarly, Marc Coma, with Repsol's personal sponsorship, won his third Dakar rally in America in the motorcycle category.
Repsol Team 2011Repsol will continue to be the main sponsor for the Honda team. The agreement has in fact been renewed for two more years (2011 and 2012). The season beginning in Qatar on 20 March 2011 will see three out of the five best riders in the world as part of the Honda team. Cassey Stoner, 2007 champion and one of the favourites for the 2011 championship, will join Dani Pedrosa and Andrea Dovizioso. The presence of the Australian motorcyclist in the team will help the international projection of the Repsol brand.
In terms of logistics, the company will continue to provide its products so that the Repsol team enjoys the best fuels and lubricants.
Also, Marc Márquez will ascend to the Moto2 category with a great team, in technical and human terms, designed to help the 125cc champion compete in a few years' time with his role model Dani Pedrosa.
Other sponsorships Repsol is also committed to Olympic sports and cooperates in the ADO plan, which helps young people fulfil their dream of taking part in the Olympic Games. In this way, with the objective of London 2012, Repsol is committed to consolidating this highly successful time in Spanish sports.
NEW REPSOL HEADQUARTERS
Construction on the new Repsol headquarters began in November 2008 and work continued apace in 2010.
The underground structure is finished, and 80% of the structure above ground has been built; the underground installations are about 70% finished. In 2010 Repsol submitted the project documentation to the US Green Building Council (certifying body for the LEED sustainability qualification system). This body accepted all the credits submitted; for this reason, the company expects a Gold certification in terms of sustainability.
The final project design for the approval of the interiors was also completed, including the design of the different types of spaces. For the design and functionality of the main services the company enlisted the help of the change agents team and the union representatives.
Lastly, each unit collaborated in assessing in detail their actual installation in the business park, and the work finished with a simulated installation, functionality check and a survey for any particular needs.
The future headquarters of Repsol will consist of a ground floor and four storeys of offices and service rooms. It will also have two basement floors containing facilities and a car park with capacity for 1,800 vehicles. The project includes over 5,000 m2 providing services to employees. The closed ring layout of the buildings will provide a large tree-lined garden enclosure of almost 10,000 m2. Also, a new green area will be created within the perimeter of the business park. Repsol has remained fully committed to sustainability from the design stage of the project. It is expected that the building work and most of the installation of the approved interior design will be finished in 2011 and the rest, in early 2012.
SUPPLEMENTARY CONTENT OF THE MANAGEMENT REPORT(Pursuant to section 116.b of the Spanish Securities Market Act)
A. Capital structure, including securities not traded on a European Union regulated market, indicating, where appropriate, the different classes of shares and, for each class of shares, the rights and obligations that it confers and the percentage of capital that it represents.
The Share Capital of Repsol YPF, S.A. is currently €1,220,863,463, represented by 1,220,863,463 shares, each with a par value of €1, fully subscribed and paid up, belonging to the same class and, consequently, having the same rights and obligations.
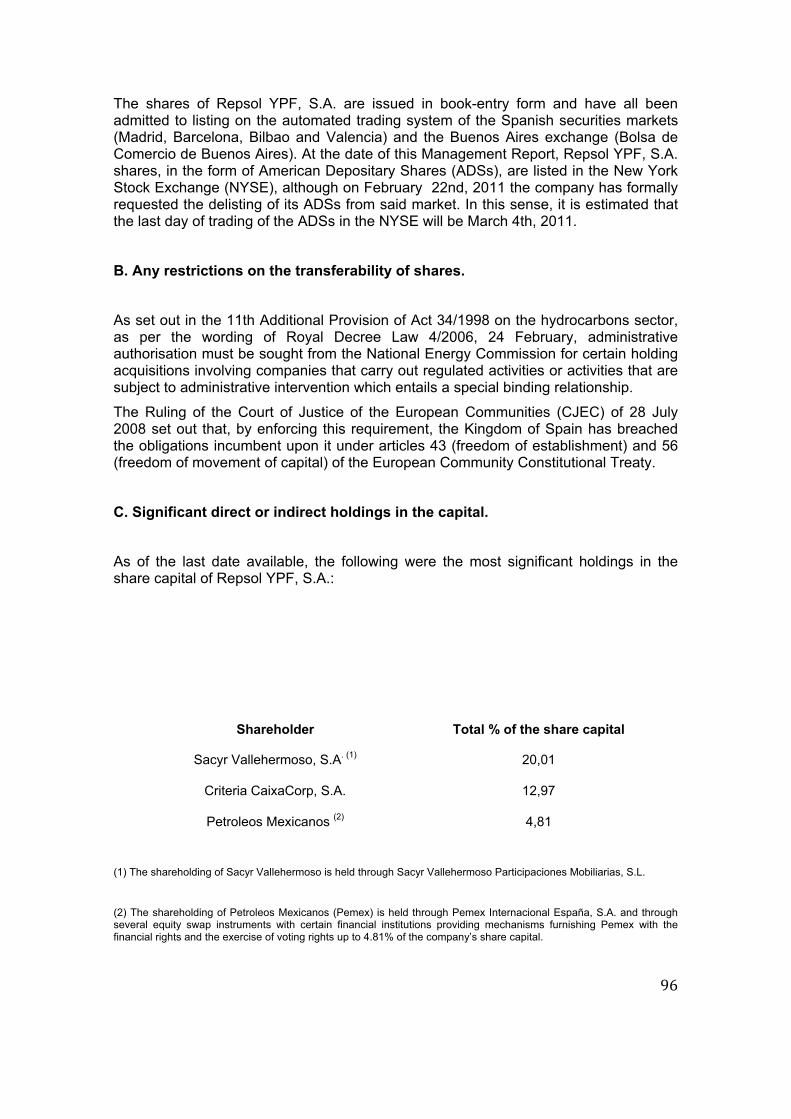
The shares of Repsol YPF, S.A. are issued in book-entry form and have all been admitted to listing on the automated trading system of the Spanish securities markets (Madrid, Barcelona, Bilbao and Valencia) and the Buenos Aires exchange (Bolsa de Comercio de Buenos Aires). At the date of this Management Report, Repsol YPF, S.A. shares, in the form of American Depositary Shares (ADSs), are listed in the New York Stock Exchange (NYSE), although on February 22nd, 2011 the company has formally requested the delisting of its ADSs from said market. In this sense, it is estimated that the last day of trading of the ADSs in the NYSE will be March 4th, 2011.
B. Any restrictions on the transferability of shares.
As set out in the 11th Additional Provision of Act 34/1998 on the hydrocarbons sector, as per the wording of Royal Decree Law 4/2006, 24 February, administrative authorisation must be sought from the National Energy Commission for certain holding acquisitions involving companies that carry out regulated activities or activities that are subject to administrative intervention which entails a special binding relationship.
The Ruling of the Court of Justice of the European Communities (CJEC) of 28 July 2008 set out that, by enforcing this requirement, the Kingdom of Spain has breached the obligations incumbent upon it under articles 43 (freedom of establishment) and 56 (freedom of movement of capital) of the European Community Constitutional Treaty.
C. Significant direct or indirect holdings in the capital.
As of the last date available, the following were the most significant holdings in the share capital of Repsol YPF, S.A.:
Shareholder Total % of the share capital
Sacyr Vallehermoso, S.A. (1) 20,01
Criteria CaixaCorp, S.A. 12,97
Petroleos Mexicanos (2) 4,81
(1) The shareholding of Sacyr Vallehermoso is held through Sacyr Vallehermoso Participaciones Mobiliarias, S.L.
(2) The shareholding of Petroleos Mexicanos (Pemex) is held through Pemex Internacional España, S.A. and through several equity swap instruments with certain financial institutions providing mechanisms furnishing Pemex with the financial rights and the exercise of voting rights up to 4.81% of the company’s share capital.
D. Any restriction on voting rights
Article 27 of the Corporate Articles of Association of Repsol YPF, S.A. lays down that the maximum number of votes than an individual shareholder, or companies belonging to the same Group, may cast at the General Meeting of Shareholders shall be 10% of the Share Capital with voting rights.
Furthermore, article 34 of Royal Decree-Law 6/2000 sets out certain restrictions on the exercise of voting rights in more than one principal operator in the same market or sector. Among others, it lists the markets for the production and distribution of fuels, the production and supply of liquid petroleum gases and the production and supply of natural gas, the principal operator being understood to be any of the entities that hold the five largest shares in the market in question.
Such constraints are specified as follows:
Natural or legal persons who have a direct or indirect holding of over 3% in the Share Capital or the voting rights of two or more principal operators in the same market may not exercise the voting rights attached to the excess over and above such percentage in more than one of those companies.
A principal operator may not exercise voting rights representing more than 3% of the Share Capital of another principal operator in the same market.
These prohibitions shall not apply to parent companies which have the status of principal operator with respect to their controlled companies that have the same status, provided that such a structure is imposed by the legal system or is the consequence of a mere redistribution of securities or assets among companies in the same Group.
The National Energy Commission, as the energy market regulatory body, may authorise the exercise of the voting rights attached to the excess, provided that this does not favour the exchange of strategic information or entail risks of coordination in their strategic activities.
E. Shareholders’ Agreements.
Repsol YPF S.A. has not been informed of any shareholders’ agreements that include regulating the exercising of voting rights at its general meetings or that restrict or place conditions on the free transfer of Repsol YPF S.A. shares.
F. Rules applicable to the appointment and replacement of members of the Board of Directors and amendment of the corporate Articles of Association.
Appointment
The General Shareholders´ Meeting is entrusted with appointing the members of the Board of Directors, notwithstanding the powers of the Board to appoint Directors from among the shareholders to fill vacancies that arise until the next General Meeting is held.
Persons to whom the prohibitions under section 213 of the Spanish Stock Companies Act apply, and those who are under disqualifying circumstances according to the law in force may not be appointed as directors.
Nor may persons and entities that are in a situation of permanent conflict of interest with the company, including rival entities, their directors, executives or employees and the persons linked with or proposed by them be directors of the company.
Nominees shall be persons who, in addition to fulfilling the requirements for the post stipulated in the law and Articles of Association, have acknowledged prestige and possess the appropriate professional knowledge and expertise for the performance of their duties.
The proposals for the appointment of Directors that the Board submits to the General Meeting, and appointments made by co-option, shall be approved by the Board (i) at the proposal of the Nomination and Compensation Committee, in the case of Independent Outside Directors, or (ii) subject to a prior report by that Committee in the case of other directors.
Re-election
The Nomination and Compensation Committee is responsible for assessing the quality of work and dedication to the office during the preceding term of office of directors proposed for re-election.
The proposals for the re-election of Directors that the Board submits to the General Meeting, and appointments made by co-option, shall be approved by the Board (i) at the proposal of the Nomination and Compensation Committee, in the case of Independent Outside Directors, or (ii) subject to a prior report by that Committee in the case of other directors.
Withdrawal or resignation
Directors shall cease to hold office when the term for which they were appointed expires (unless they are re-elected) and in the other circumstances provided for in the Law, the Corporate Articles of Association and the Regulations of the Board of Directors.
Furthermore, directors must submit their resignation to the Board of Directors in any of the following circumstances:
a) When they are under any disqualifying circumstance or prohibition provided for by law, the company’s Articles of Association or the regulations that apply to them.
b) When they have been seriously cautioned by the Nomination and Compensation Committee or the Audit and Control Committee for having breached their obligations as Directors.
c) When, in the opinion of the Board, subject to a prior report by the Nomination and Compensation Committee:
1. Their continued presence on the Board may jeopardise the interests of the company or impair the functioning of the board itself or the standing and reputation of the company; or
2. When the reasons for which they were appointed no longer concur. This includes, in particular:
- Institutional Outside Directors when the shareholder that they represent or that had proposed their appointment transfers the whole of their shareholding. They must also surrender their post to the Board and, if the Board deems it fit, tender the respective formal resignation, in the corresponding proportion, when such shareholder reduces its shareholding to a level that requires the reduction in the number of its Institutional Outside Directors.
- The Executive Directors, when they cease to hold the executive posts outside the Board to which their appointment as Director was linked.
The Board of Directors shall not propose the withdrawal from office of any Independent Outside Director before the statutory period for which he/she had been appointed comes to an end, except where there are proper grounds for doing so, in the opinion of the Board subject to a prior report by the Nomination and Compensation Committee. In particular, proper grounds shall be deemed to exist if the Director (i) had breached the duties inherent in his/her office; (ii) were in any of the situations described in the previous paragraphs; or (iii) were in any of the circumstances described in the Regulations of the Board as a result of which he/she cannot be classified as an Independent Outside Director.
Proposals for the withdrawal from office of Independent Outside Directors may also be made as a result of takeover bids, mergers or other similar corporate operations that entail a change in the company’s capital structure, to the extent necessary to establish a reasonable balance between Institutional Outside Directors and Independent Outside Directors according to the relationship between the capital represented by the former and the remainder of the capital.
Amendment of the Articles of Association
The Articles of Association of Repsol YPF, S.A., which are available on its website (www.repsol.com), do not lay down different conditions from those contained in the Spanish Stock Companies Act for their amendment, with the exception of the amendment of the last paragraph of section 27, regarding the maximum number of votes that a shareholder or companies belonging to the same Group may cast at the General Meeting. This resolution, as well as the resolution to amend this special rule contained in the last paragraph of section 22 of the Articles of Association, requires, both in the first and in the second call, the favourable vote of 75% of the share capital with voting rights attending or represented at the General Meeting.
G. Faculties of the members of the Board of Directors and, in particular, those concerning the possibility of issuing or repurchasing shares.
The Annual General Meeting of Shareholders of the company, held on 30 April 2010 agreed to authorise the Board of Directors to increase the Share Capital, once or several times, during a period of 5 years, by the maximum amount of €610,431,731 (approximately half the current Share Capital), by issuing new shares the counter value of which shall consist of cash contributions.
Likewise, the Annual General Meeting of Shareholders of the company, held on 30 April 2010, authorised the Board of Directors to engage in the derivative acquisition of own shares, under the terms indicated above in the “Financial situation” section of this Management Report.
Finally, in addition to the powers recognised in the company’s Articles of Association and the Board Regulations as being conferred upon the Chairman and Vice-Chairmen of the Board, the Executive Directors have each been granted general powers of attorney to represent the company, conferred by the Board of Directors, and which are duly recorded in the Commercial Register of Madrid.
H. Significant agreements to which the company is party and that take effect, alter or terminate upon a change of control at the company as a result of a takeover bid, and their effects, except when disclosure thereof would be seriously detrimental to the company. This exception shall not apply when the company is under the legal obligation to make this information public.
The company participates in exploring for and exploiting hydrocarbons through consortiums or joint ventures with other oil companies, both public and private. In the contracts governing the relations between the members of the consortium the other partners are usually granted a right of first refusal over the holding of the partner on which a change of control takes place when the value of said holding is significant in relation to the overall assets of the transaction or when other conditions set out in the contracts occur.
Likewise, according to the rules regulating the oil and gas industry in the different countries in which the company operates, the transfer, total or partial, of research permits and exploitation concessions as well as, on occasions, the change of control in the concessionaire entity or entities and in particular in the entity that has the status of acreage operator, are subject to prior authorisation from the competent administrative authority.
In addition, the agreements entered into by and between Repsol YPF and Caja de Ahorros y Pensiones de Barcelona (“la Caixa”) relating to Gas Natural Fenosa S.A., reported as relevant events through the Securities Market Commission, as well as the Industrial Agreement Activity between Repsol YPF and Gas Natural Fenosa S.A. set forth in the abovementioned agreements and disclosed as a relevant event on 29 April 2005 and the Partnership Agreement between Repsol YPF and Gas Natural Fenosa relating to Repsol–Gas Natural LNG S.L. consider the change in the control structure of either of the parties to be grounds for termination.
I. Agreements between the company and its directors and executives or employees providing for compensation when they resign or are unfairly
dismissed or if the employment relationship comes to an end because of a takeover bid.
Executive Directors
The Chairman and the Secretary and General Counsel are entitled to a Deferred Financial Compensation in the event of the termination of their relationship with the company, provided that said termination does not take place as a result of a breach of their obligations or of their own free will, without there being grounds for it, among those provided for in the contract itself. The amount of the compensation for termination of the relationship shall be three years of their aggregate cash remuneration.
Executives
The Repsol YPF Group has established a sole legal rule for executive staff, which is specified in the Executive Contract, in which the compensation system applicable in circumstances involving termination of the employment relationship is regulated and in which the grounds for compensation are the ones laid down in the current Spanish legislation.
In the case of members of the Executive Committee, they include the resignation of the executive in the event of transfer of undertakings or a major change in its ownership, resulting in a replacement of its governing bodies or of the content and guidelines of its core business activity. The amount of compensation for current members of the Executive Committee is calculated according to the Executive's age, years in the company and salary.
Further information about this matter can be found in Note 33 to the Repsol YPF Consolidated Financial Statements.
Translation of the original in Spanish. In case of any discrepancy, the Spanish version prevails.
ANNUAL REPORT ON CORPORATE GOVERNANCE
LISTED COMPANIES
YEAR
1
TAX REGISTRATION NUMBER: A78374725
Name: REPSOL YPF, S.A.
ISSUER 2010
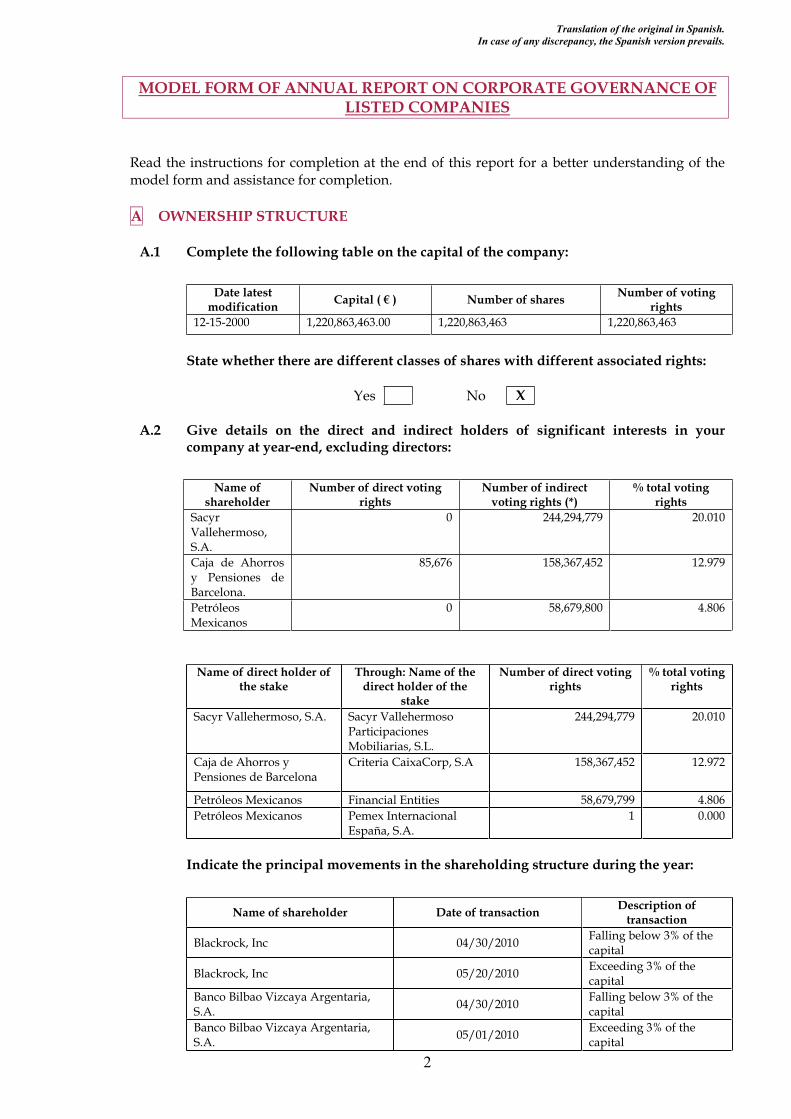
Translation of the original in Spanish. In case of any discrepancy, the Spanish version prevails.
2
MODEL FORM OF ANNUAL REPORT ON CORPORATE GOVERNANCE OF LISTED COMPANIES
Read the instructions for completion at the end of this report for a better understanding of the model form and assistance for completion.
A OWNERSHIP STRUCTURE
A.1 Complete the following table on the capital of the company:
Date latest modification Capital ( € ) Number of shares Number of voting
rights 12-15-2000 1,220,863,463.00 1,220,863,463 1,220,863,463
State whether there are different classes of shares with different associated rights:
Yes No X
A.2 Give details on the direct and indirect holders of significant interests in your company at year-end, excluding directors:
Name of shareholder
Number of direct voting rights
Number of indirect voting rights (*)
% total voting rights
SacyrVallehermoso,S.A.
0 244,294,779 20.010
Caja de Ahorros y Pensiones de Barcelona.
85,676 158,367,452 12.979
Petróleos Mexicanos
0 58,679,800 4.806
Name of direct holder of the stake
Through: Name of the direct holder of the
stake
Number of direct voting rights
% total voting rights
Sacyr Vallehermoso, S.A. Sacyr Vallehermoso Participaciones Mobiliarias, S.L.
244,294,779 20.010
Caja de Ahorros y Pensiones de Barcelona
Criteria CaixaCorp, S.A 158,367,452 12.972
Petróleos Mexicanos Financial Entities 58,679,799 4.806Petróleos Mexicanos Pemex Internacional
España, S.A. 1 0.000
Indicate the principal movements in the shareholding structure during the year:
Name of shareholder Date of transaction Description of transaction
Blackrock, Inc 04/30/2010 Falling below 3% of the capital
Blackrock, Inc 05/20/2010 Exceeding 3% of the capital
Banco Bilbao Vizcaya Argentaria, S.A. 04/30/2010 Falling below 3% of the
capitalBanco Bilbao Vizcaya Argentaria, S.A. 05/01/2010 Exceeding 3% of the
capital
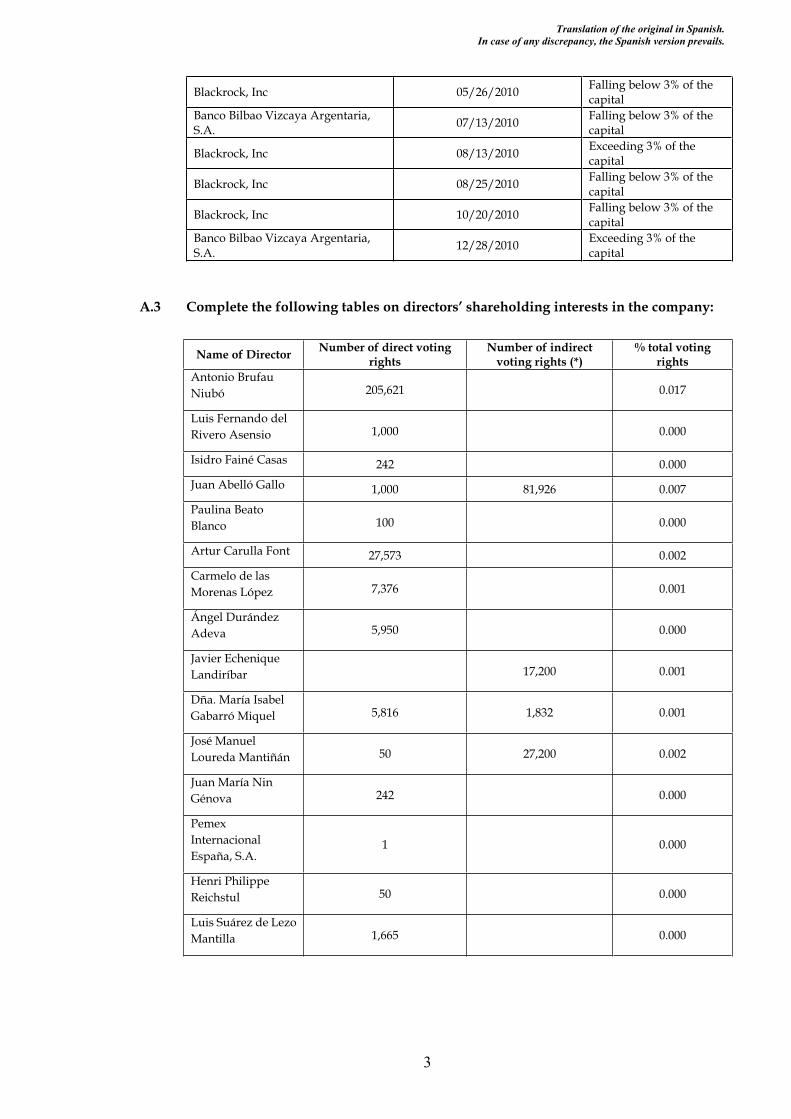
Translation of the original in Spanish. In case of any discrepancy, the Spanish version prevails.
3
Blackrock, Inc 05/26/2010 Falling below 3% of the capital
Banco Bilbao Vizcaya Argentaria, S.A. 07/13/2010 Falling below 3% of the
capital
Blackrock, Inc 08/13/2010 Exceeding 3% of the capital
Blackrock, Inc 08/25/2010 Falling below 3% of the capital
Blackrock, Inc 10/20/2010 Falling below 3% of the capital
Banco Bilbao Vizcaya Argentaria, S.A. 12/28/2010 Exceeding 3% of the
capital
A.3 Complete the following tables on directors’ shareholding interests in the company:
Name of Director Number of direct voting rights
Number of indirect voting rights (*)
% total voting rights
Antonio Brufau Niubó 205,621 0.017
Luis Fernando del Rivero Asensio 1,000 0.000
Isidro Fainé Casas 242 0.000
Juan Abelló Gallo 1,000 81,926 0.007
Paulina Beato Blanco 100 0.000
Artur Carulla Font 27,573 0.002
Carmelo de las Morenas López 7,376 0.001
Ángel Durández Adeva 5,950 0.000
Javier Echenique Landiríbar 17,200 0.001
Dña. María Isabel Gabarró Miquel 5,816 1,832 0.001
José Manuel Loureda Mantiñán 50 27,200 0.002
Juan María Nin Génova 242 0.000
Pemex InternacionalEspaña, S.A.
1 0.000
Henri Philippe Reichstul 50 0.000
Luis Suárez de Lezo Mantilla 1,665 0.000
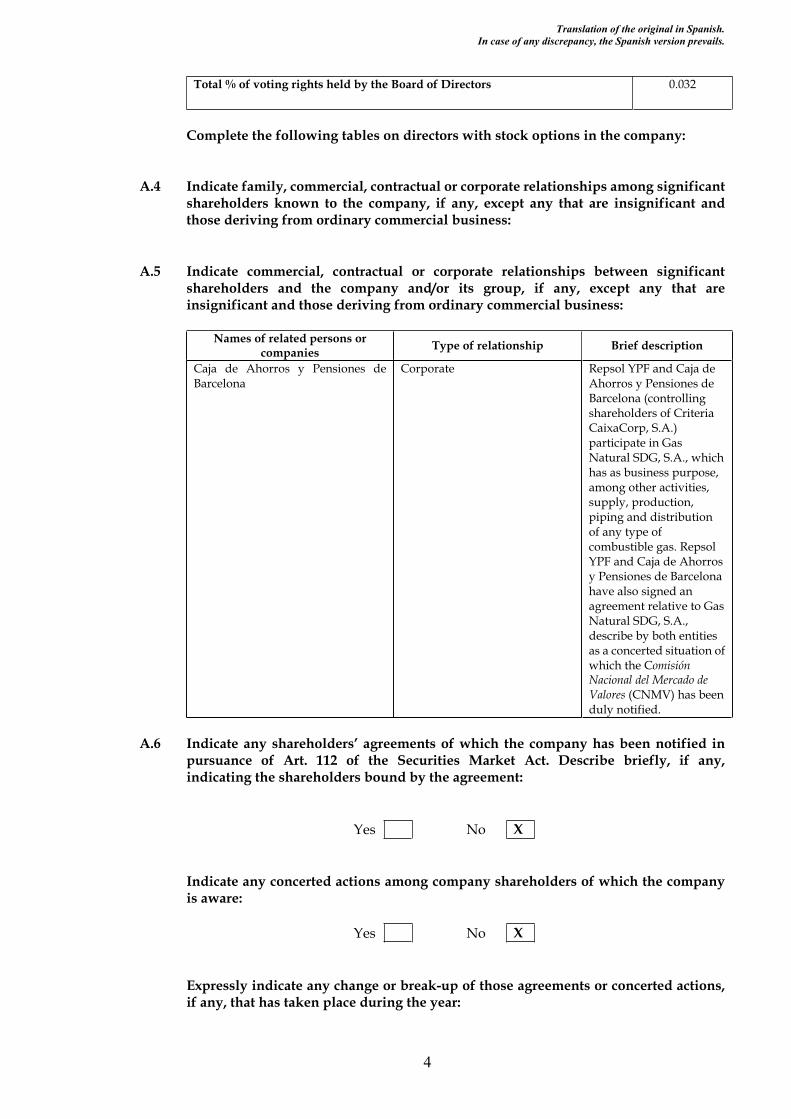
Translation of the original in Spanish. In case of any discrepancy, the Spanish version prevails.
4
Total % of voting rights held by the Board of Directors 0.032
Complete the following tables on directors with stock options in the company:
A.4 Indicate family, commercial, contractual or corporate relationships among significant shareholders known to the company, if any, except any that are insignificant and those deriving from ordinary commercial business:
A.5 Indicate commercial, contractual or corporate relationships between significant shareholders and the company and/or its group, if any, except any that are insignificant and those deriving from ordinary commercial business:
Names of related persons or companies Type of relationship Brief description
Caja de Ahorros y Pensiones de Barcelona
Corporate Repsol YPF and Caja de Ahorros y Pensiones de Barcelona (controlling shareholders of Criteria CaixaCorp, S.A.) participate in Gas Natural SDG, S.A., which has as business purpose, among other activities, supply, production, piping and distribution of any type of combustible gas. Repsol YPF and Caja de Ahorros y Pensiones de Barcelona have also signed an agreement relative to Gas Natural SDG, S.A., describe by both entities as a concerted situation of which the Comisión Nacional del Mercado de Valores (CNMV) has been duly notified.
A.6 Indicate any shareholders’ agreements of which the company has been notified in pursuance of Art. 112 of the Securities Market Act. Describe briefly, if any, indicating the shareholders bound by the agreement:
Yes No X
Indicate any concerted actions among company shareholders of which the company is aware:
Yes No X
Expressly indicate any change or break-up of those agreements or concerted actions, if any, that has taken place during the year:
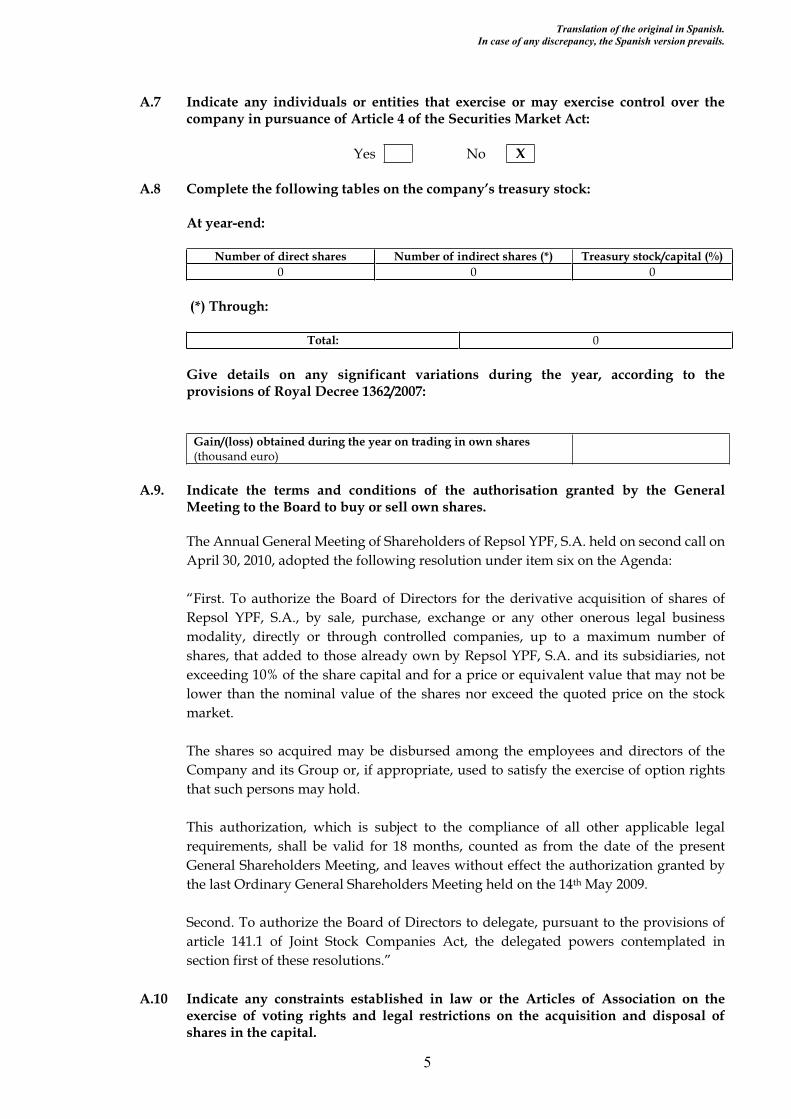
Translation of the original in Spanish. In case of any discrepancy, the Spanish version prevails.
5
A.7 Indicate any individuals or entities that exercise or may exercise control over the company in pursuance of Article 4 of the Securities Market Act:
Yes No X
A.8 Complete the following tables on the company’s treasury stock:
At year-end:
Number of direct shares Number of indirect shares (*) Treasury stock/capital (%) 0 0 0
(*) Through:
Total: 0
Give details on any significant variations during the year, according to the provisions of Royal Decree 1362/2007:
Gain/(loss) obtained during the year on trading in own shares(thousand euro)
A.9. Indicate the terms and conditions of the authorisation granted by the General Meeting to the Board to buy or sell own shares.
The Annual General Meeting of Shareholders of Repsol YPF, S.A. held on second call on April 30, 2010, adopted the following resolution under item six on the Agenda:
“First. To authorize the Board of Directors for the derivative acquisition of shares of Repsol YPF, S.A., by sale, purchase, exchange or any other onerous legal business modality, directly or through controlled companies, up to a maximum number of shares, that added to those already own by Repsol YPF, S.A. and its subsidiaries, not exceeding 10% of the share capital and for a price or equivalent value that may not be lower than the nominal value of the shares nor exceed the quoted price on the stock market.
The shares so acquired may be disbursed among the employees and directors of the Company and its Group or, if appropriate, used to satisfy the exercise of option rights that such persons may hold.
This authorization, which is subject to the compliance of all other applicable legal requirements, shall be valid for 18 months, counted as from the date of the present General Shareholders Meeting, and leaves without effect the authorization granted by the last Ordinary General Shareholders Meeting held on the 14th May 2009.
Second. To authorize the Board of Directors to delegate, pursuant to the provisions of article 141.1 of Joint Stock Companies Act, the delegated powers contemplated in section first of these resolutions.”
A.10 Indicate any constraints established in law or the Articles of Association on the exercise of voting rights and legal restrictions on the acquisition and disposal of shares in the capital.
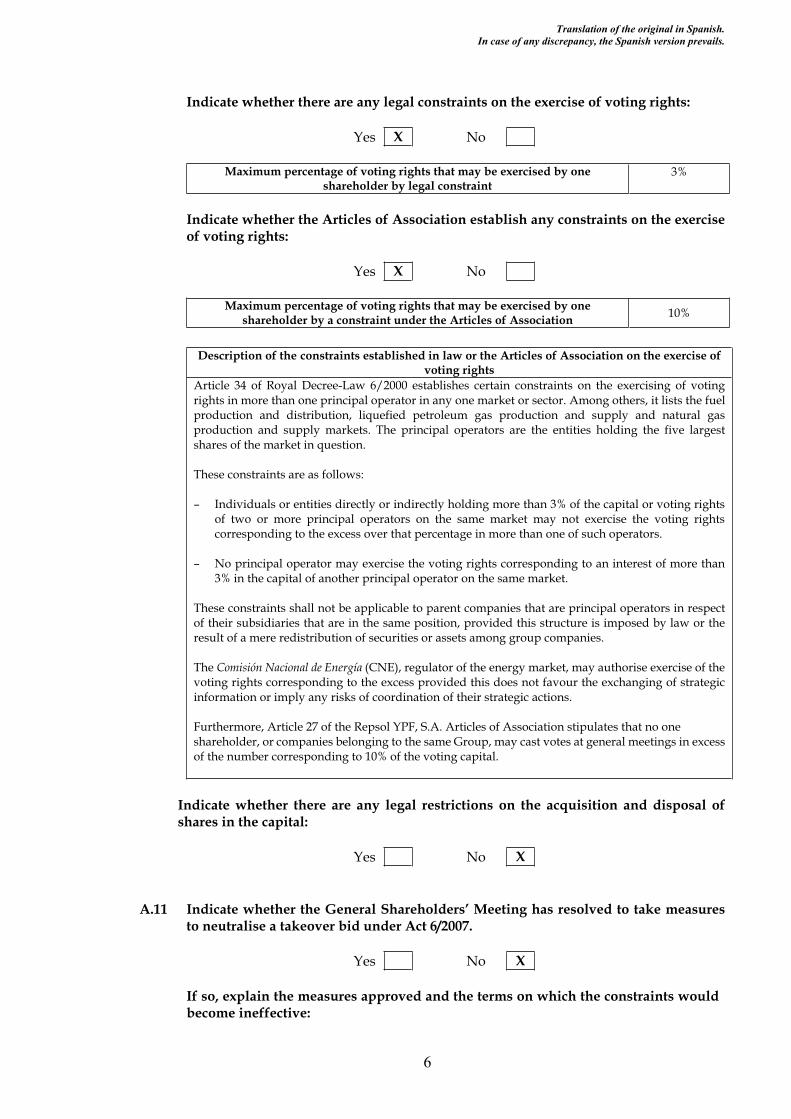
Translation of the original in Spanish. In case of any discrepancy, the Spanish version prevails.
6
Indicate whether there are any legal constraints on the exercise of voting rights:
Yes X No
Maximum percentage of voting rights that may be exercised by one shareholder by legal constraint
3%
Indicate whether the Articles of Association establish any constraints on the exercise of voting rights:
Yes X No
Maximum percentage of voting rights that may be exercised by one shareholder by a constraint under the Articles of Association 10%
Description of the constraints established in law or the Articles of Association on the exercise of voting rights
Article 34 of Royal Decree-Law 6/2000 establishes certain constraints on the exercising of voting rights in more than one principal operator in any one market or sector. Among others, it lists the fuel production and distribution, liquefied petroleum gas production and supply and natural gas production and supply markets. The principal operators are the entities holding the five largest shares of the market in question.
These constraints are as follows:
– Individuals or entities directly or indirectly holding more than 3% of the capital or voting rights of two or more principal operators on the same market may not exercise the voting rights corresponding to the excess over that percentage in more than one of such operators.
– No principal operator may exercise the voting rights corresponding to an interest of more than 3% in the capital of another principal operator on the same market.
These constraints shall not be applicable to parent companies that are principal operators in respect of their subsidiaries that are in the same position, provided this structure is imposed by law or the result of a mere redistribution of securities or assets among group companies.
The Comisión Nacional de Energía (CNE), regulator of the energy market, may authorise exercise of the voting rights corresponding to the excess provided this does not favour the exchanging of strategic information or imply any risks of coordination of their strategic actions.
Furthermore, Article 27 of the Repsol YPF, S.A. Articles of Association stipulates that no one shareholder, or companies belonging to the same Group, may cast votes at general meetings in excess of the number corresponding to 10% of the voting capital.
Indicate whether there are any legal restrictions on the acquisition and disposal of shares in the capital:
Yes No X
A.11 Indicate whether the General Shareholders’ Meeting has resolved to take measures to neutralise a takeover bid under Act 6/2007.
Yes No X
If so, explain the measures approved and the terms on which the constraints would become ineffective:
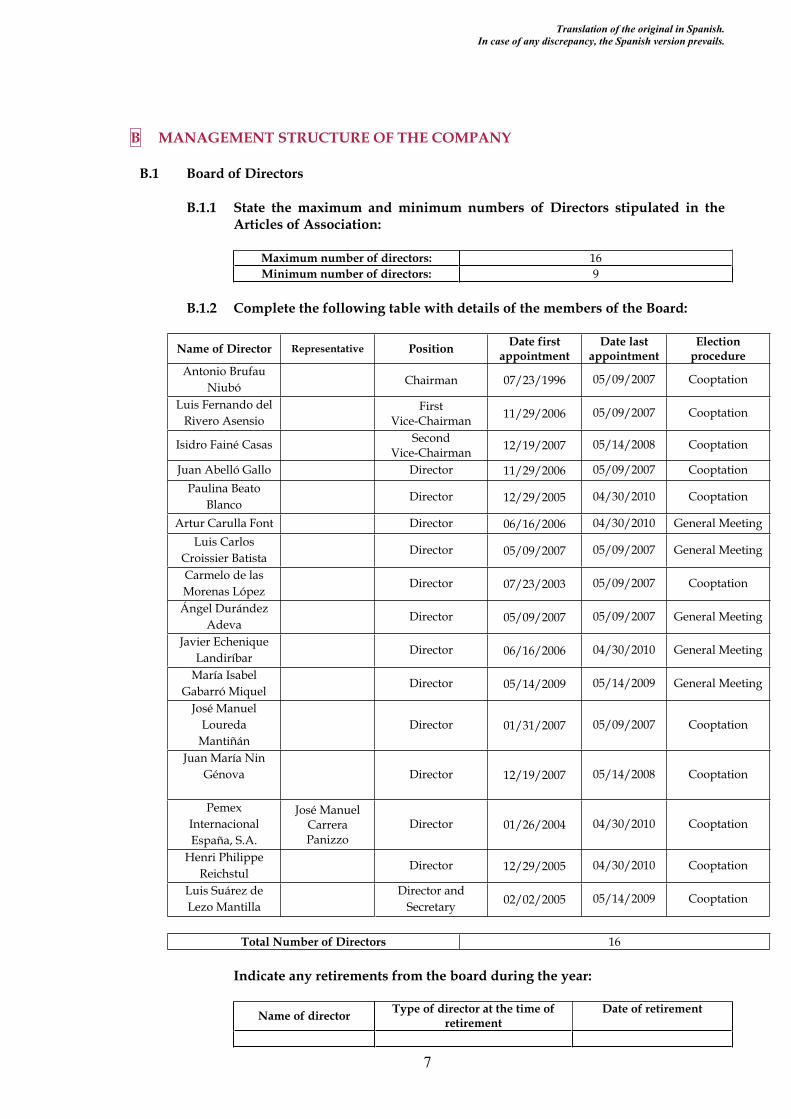
Translation of the original in Spanish. In case of any discrepancy, the Spanish version prevails.
7
B MANAGEMENT STRUCTURE OF THE COMPANY
B.1 Board of Directors
B.1.1 State the maximum and minimum numbers of Directors stipulated in the Articles of Association:
Maximum number of directors: 16Minimum number of directors: 9
B.1.2 Complete the following table with details of the members of the Board:
Name of Director Representative Position Date first appointment
Date last appointment
Election procedure
Antonio Brufau Niubó Chairman 07/23/1996 05/09/2007 Cooptation
Luis Fernando del Rivero Asensio
First Vice-Chairman 11/29/2006 05/09/2007 Cooptation
Isidro Fainé Casas SecondVice-Chairman 12/19/2007 05/14/2008 Cooptation
Juan Abelló Gallo Director 11/29/2006 05/09/2007 CooptationPaulina Beato
BlancoDirector 12/29/2005 04/30/2010 Cooptation
Artur Carulla Font Director 06/16/2006 04/30/2010 General MeetingLuis Carlos
Croissier Batista Director 05/09/2007 05/09/2007 General Meeting
Carmelo de las Morenas López
Director 07/23/2003 05/09/2007 Cooptation
Ángel Durández Adeva
Director 05/09/2007 05/09/2007 General Meeting
Javier Echenique Landiríbar
Director 06/16/2006 04/30/2010 General Meeting
María Isabel Gabarró Miquel
Director 05/14/2009 05/14/2009 General Meeting
José Manuel Loureda
MantiñánDirector 01/31/2007 05/09/2007 Cooptation
Juan María Nin Génova Director 12/19/2007 05/14/2008 Cooptation
Pemex InternacionalEspaña, S.A.
José Manuel CarreraPanizzo
Director 01/26/2004 04/30/2010 Cooptation
Henri Philippe Reichstul
Director 12/29/2005 04/30/2010 Cooptation
Luis Suárez de Lezo Mantilla
Director and Secretary 02/02/2005 05/14/2009 Cooptation
Total Number of Directors 16
Indicate any retirements from the board during the year:
Name of director Type of director at the time of retirement
Date of retirement
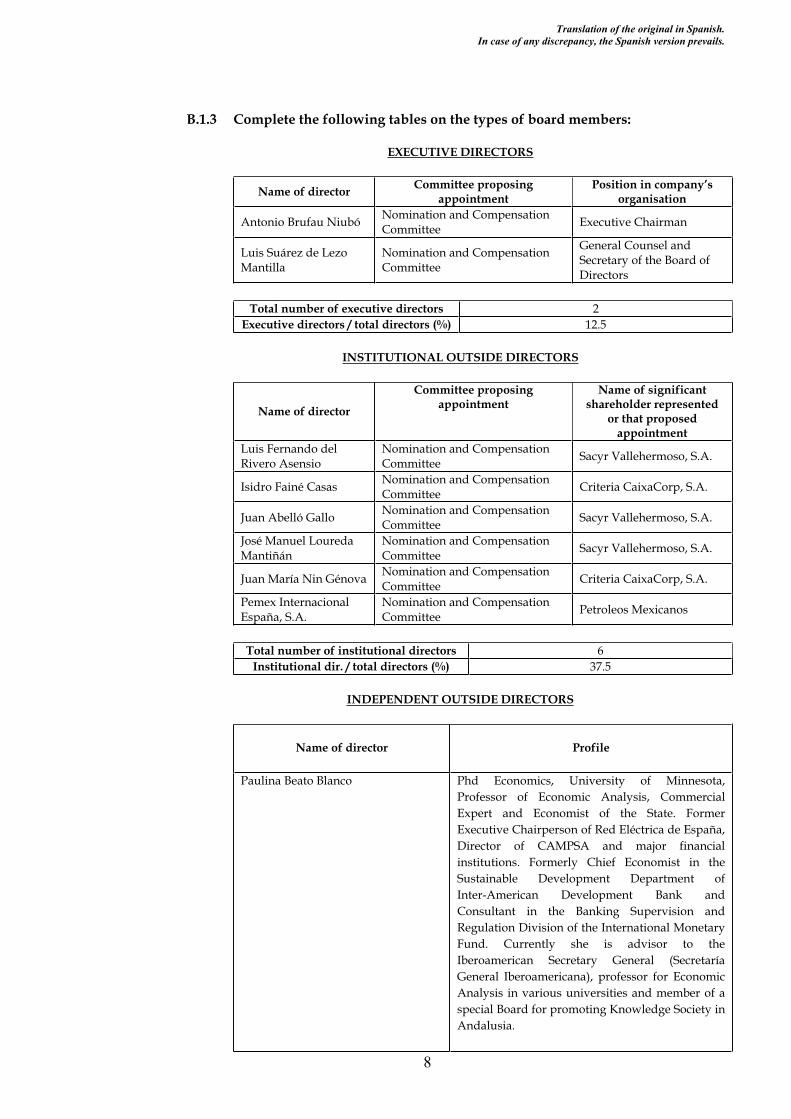
Translation of the original in Spanish. In case of any discrepancy, the Spanish version prevails.
8
B.1.3 Complete the following tables on the types of board members:
EXECUTIVE DIRECTORS
Name of director Committee proposing appointment
Position in company’s organisation
Antonio Brufau Niubó Nomination and Compensation Committee Executive Chairman
Luis Suárez de Lezo Mantilla
Nomination and Compensation Committee
General Counsel and Secretary of the Board of Directors
Total number of executive directors 2Executive directors / total directors (%) 12.5
INSTITUTIONAL OUTSIDE DIRECTORS
Name of director
Committee proposing appointment
Name of significant shareholder represented
or that proposed appointment
Luis Fernando del Rivero Asensio
Nomination and Compensation Committee Sacyr Vallehermoso, S.A.
Isidro Fainé Casas Nomination and Compensation Committee Criteria CaixaCorp, S.A.
Juan Abelló Gallo Nomination and Compensation Committee Sacyr Vallehermoso, S.A.
José Manuel Loureda Mantiñán
Nomination and Compensation Committee Sacyr Vallehermoso, S.A.
Juan María Nin Génova Nomination and Compensation Committee Criteria CaixaCorp, S.A.
Pemex Internacional España, S.A.
Nomination and Compensation Committee Petroleos Mexicanos
Total number of institutional directors 6Institutional dir. / total directors (%) 37.5
INDEPENDENT OUTSIDE DIRECTORS
Name of director Profile
Paulina Beato Blanco Phd Economics, University of Minnesota, Professor of Economic Analysis, Commercial Expert and Economist of the State. Former Executive Chairperson of Red Eléctrica de España, Director of CAMPSA and major financial institutions. Formerly Chief Economist in the Sustainable Development Department of Inter-American Development Bank and Consultant in the Banking Supervision and Regulation Division of the International Monetary Fund. Currently she is advisor to the Iberoamerican Secretary General (Secretaría General Iberoamericana), professor for Economic Analysis in various universities and member of a special Board for promoting Knowledge Society in Andalusia.
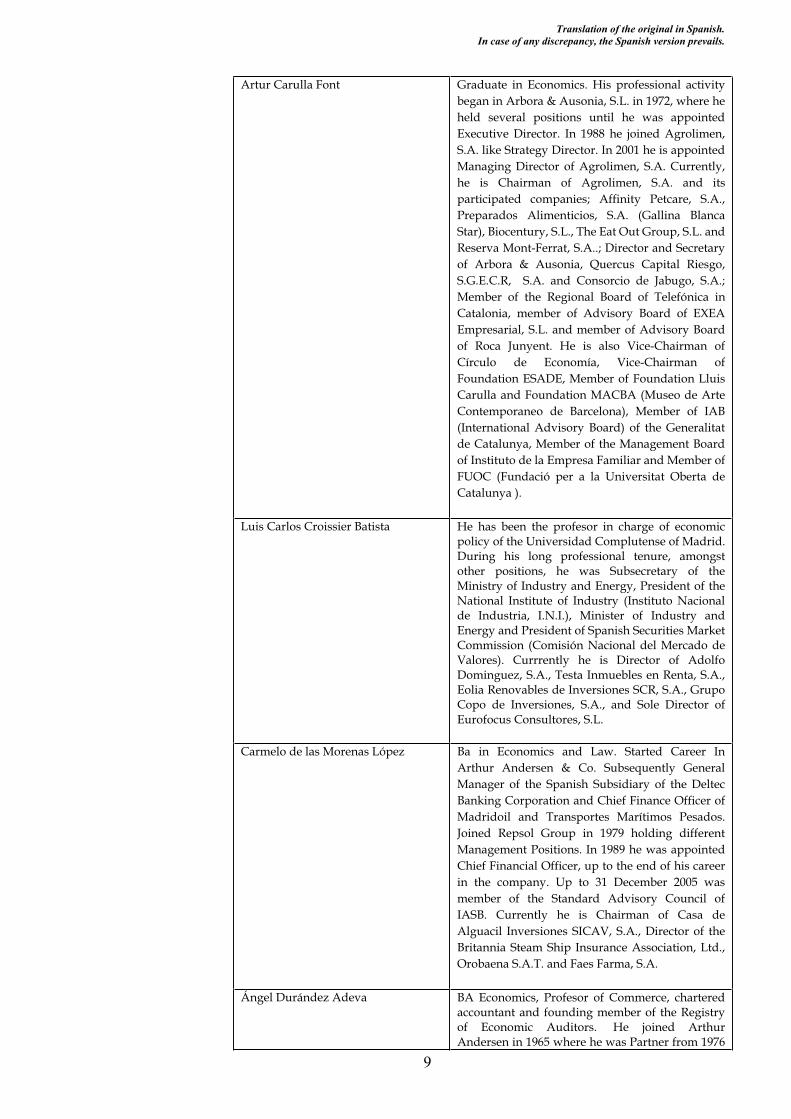
Translation of the original in Spanish. In case of any discrepancy, the Spanish version prevails.
9
Artur Carulla Font Graduate in Economics. His professional activity began in Arbora & Ausonia, S.L. in 1972, where he held several positions until he was appointed Executive Director. In 1988 he joined Agrolimen, S.A. like Strategy Director. In 2001 he is appointed Managing Director of Agrolimen, S.A. Currently, he is Chairman of Agrolimen, S.A. and its participated companies; Affinity Petcare, S.A., Preparados Alimenticios, S.A. (Gallina Blanca Star), Biocentury, S.L., The Eat Out Group, S.L. and Reserva Mont-Ferrat, S.A..; Director and Secretary of Arbora & Ausonia, Quercus Capital Riesgo, S.G.E.C.R, S.A. and Consorcio de Jabugo, S.A.; Member of the Regional Board of Telefónica in Catalonia, member of Advisory Board of EXEA Empresarial, S.L. and member of Advisory Board of Roca Junyent. He is also Vice-Chairman of Círculo de Economía, Vice-Chairman of Foundation ESADE, Member of Foundation Lluis Carulla and Foundation MACBA (Museo de Arte Contemporaneo de Barcelona), Member of IAB (International Advisory Board) of the Generalitat de Catalunya, Member of the Management Board of Instituto de la Empresa Familiar and Member of FUOC (Fundació per a la Universitat Oberta de Catalunya ).
Luis Carlos Croissier Batista He has been the profesor in charge of economic policy of the Universidad Complutense of Madrid. During his long professional tenure, amongst other positions, he was Subsecretary of the Ministry of Industry and Energy, President of the National Institute of Industry (Instituto Nacional de Industria, I.N.I.), Minister of Industry and Energy and President of Spanish Securities Market Commission (Comisión Nacional del Mercado de Valores). Currrently he is Director of Adolfo Dominguez, S.A., Testa Inmuebles en Renta, S.A., Eolia Renovables de Inversiones SCR, S.A., Grupo Copo de Inversiones, S.A., and Sole Director of Eurofocus Consultores, S.L.
Carmelo de las Morenas López Ba in Economics and Law. Started Career In Arthur Andersen & Co. Subsequently General Manager of the Spanish Subsidiary of the Deltec Banking Corporation and Chief Finance Officer of Madridoil and Transportes Marítimos Pesados. Joined Repsol Group in 1979 holding different Management Positions. In 1989 he was appointed Chief Financial Officer, up to the end of his career in the company. Up to 31 December 2005 was member of the Standard Advisory Council of IASB. Currently he is Chairman of Casa de Alguacil Inversiones SICAV, S.A., Director of the Britannia Steam Ship Insurance Association, Ltd., Orobaena S.A.T. and Faes Farma, S.A.
Ángel Durández Adeva BA Economics, Profesor of Commerce, chartered accountant and founding member of the Registry of Economic Auditors. He joined Arthur Andersen in 1965 where he was Partner from 1976
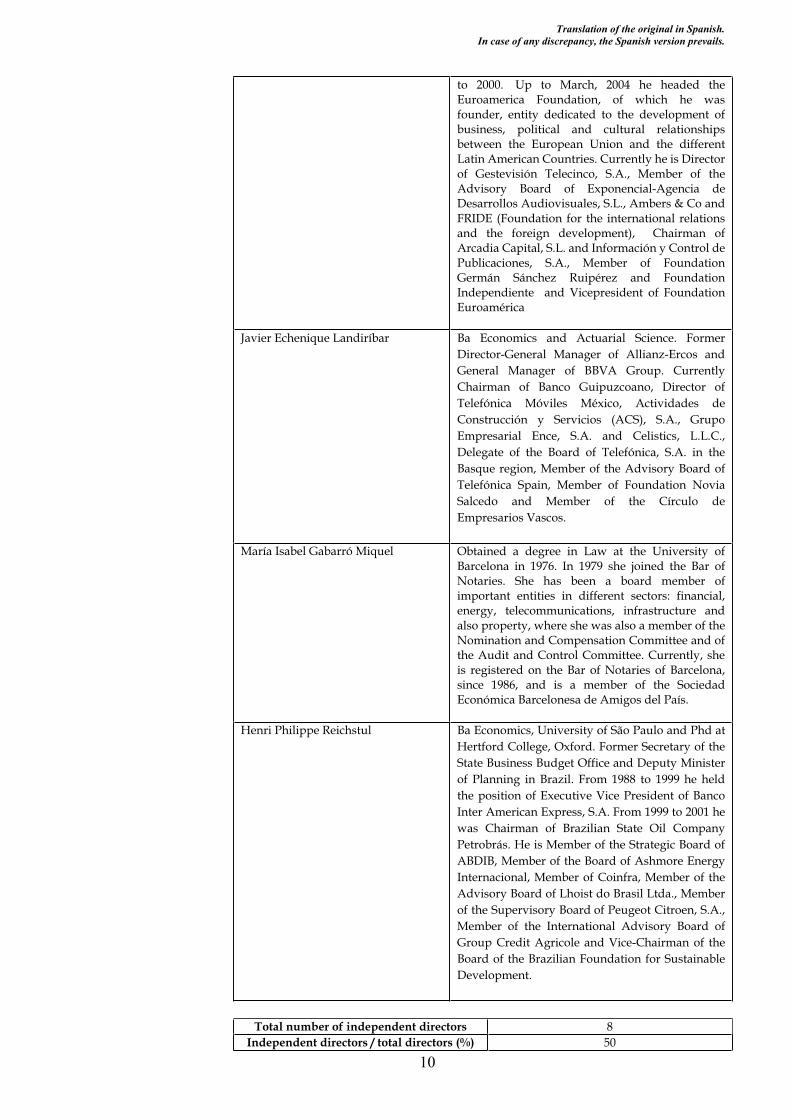
Translation of the original in Spanish. In case of any discrepancy, the Spanish version prevails.
10
to 2000. Up to March, 2004 he headed the Euroamerica Foundation, of which he was founder, entity dedicated to the development of business, political and cultural relationships between the European Union and the different Latin American Countries. Currently he is Director of Gestevisión Telecinco, S.A., Member of the Advisory Board of Exponencial-Agencia de Desarrollos Audiovisuales, S.L., Ambers & Co and FRIDE (Foundation for the international relations and the foreign development), Chairman of Arcadia Capital, S.L. and Información y Control de Publicaciones, S.A., Member of Foundation Germán Sánchez Ruipérez and Foundation Independiente and Vicepresident of Foundation Euroamérica
Javier Echenique Landiríbar Ba Economics and Actuarial Science. Former Director-General Manager of Allianz-Ercos and General Manager of BBVA Group. Currently Chairman of Banco Guipuzcoano, Director of Telefónica Móviles México, Actividades de Construcción y Servicios (ACS), S.A., Grupo Empresarial Ence, S.A. and Celistics, L.L.C., Delegate of the Board of Telefónica, S.A. in the Basque region, Member of the Advisory Board of Telefónica Spain, Member of Foundation Novia Salcedo and Member of the Círculo de Empresarios Vascos.
María Isabel Gabarró Miquel Obtained a degree in Law at the University of Barcelona in 1976. In 1979 she joined the Bar of Notaries. She has been a board member of important entities in different sectors: financial, energy, telecommunications, infrastructure and also property, where she was also a member of the Nomination and Compensation Committee and of the Audit and Control Committee. Currently, she is registered on the Bar of Notaries of Barcelona, since 1986, and is a member of the Sociedad Económica Barcelonesa de Amigos del País.
Henri Philippe Reichstul Ba Economics, University of São Paulo and Phd at Hertford College, Oxford. Former Secretary of the State Business Budget Office and Deputy Minister of Planning in Brazil. From 1988 to 1999 he held the position of Executive Vice President of Banco Inter American Express, S.A. From 1999 to 2001 he was Chairman of Brazilian State Oil Company Petrobrás. He is Member of the Strategic Board of ABDIB, Member of the Board of Ashmore Energy Internacional, Member of Coinfra, Member of the Advisory Board of Lhoist do Brasil Ltda., Member of the Supervisory Board of Peugeot Citroen, S.A., Member of the International Advisory Board of Group Credit Agricole and Vice-Chairman of the Board of the Brazilian Foundation for Sustainable Development.
Total number of independent directors 8Independent directors / total directors (%) 50
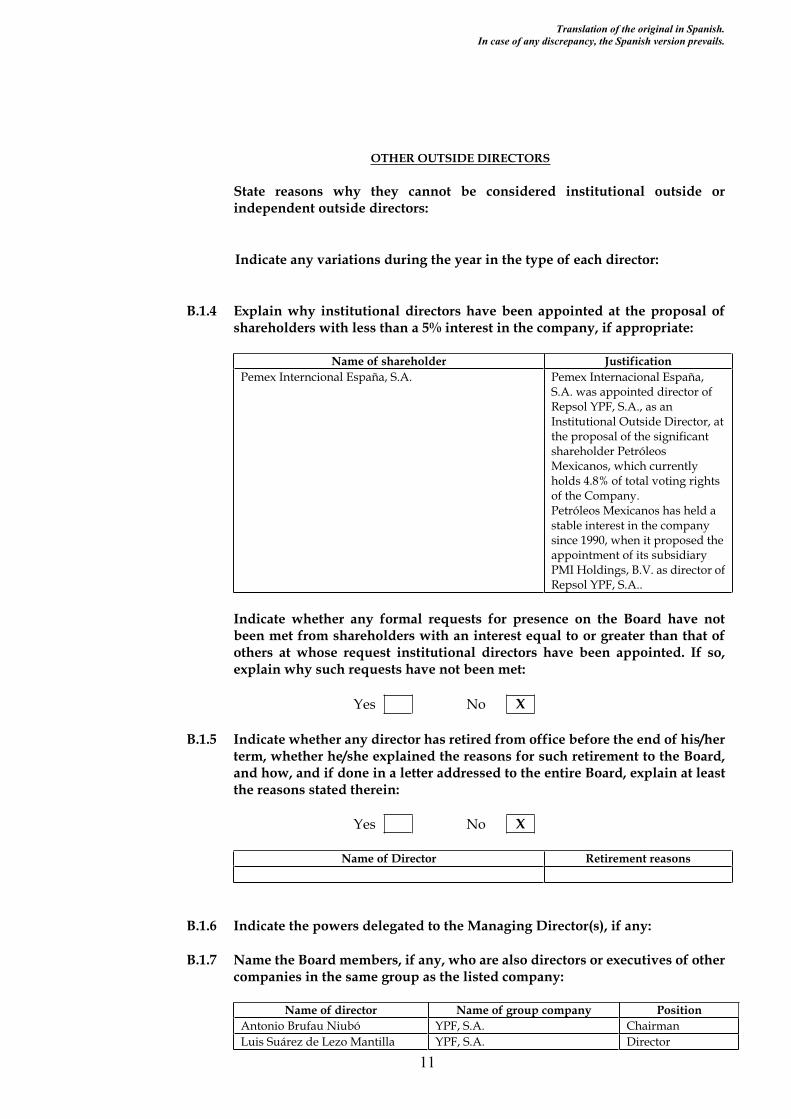
Translation of the original in Spanish. In case of any discrepancy, the Spanish version prevails.
11
OTHER OUTSIDE DIRECTORS
State reasons why they cannot be considered institutional outside or independent outside directors:
Indicate any variations during the year in the type of each director:
B.1.4 Explain why institutional directors have been appointed at the proposal of shareholders with less than a 5% interest in the company, if appropriate:
Name of shareholder JustificationPemex Interncional España, S.A. Pemex Internacional España,
S.A. was appointed director of Repsol YPF, S.A., as an Institutional Outside Director, at the proposal of the significant shareholder Petróleos Mexicanos, which currently holds 4.8% of total voting rights of the Company. Petróleos Mexicanos has held a stable interest in the company since 1990, when it proposed the appointment of its subsidiary PMI Holdings, B.V. as director of Repsol YPF, S.A..
Indicate whether any formal requests for presence on the Board have not been met from shareholders with an interest equal to or greater than that of others at whose request institutional directors have been appointed. If so, explain why such requests have not been met:
Yes No X
B.1.5 Indicate whether any director has retired from office before the end of his/her term, whether he/she explained the reasons for such retirement to the Board, and how, and if done in a letter addressed to the entire Board, explain at least the reasons stated therein:
Yes No X
Name of Director Retirement reasons
B.1.6 Indicate the powers delegated to the Managing Director(s), if any:
B.1.7 Name the Board members, if any, who are also directors or executives of other companies in the same group as the listed company:
Name of director Name of group company PositionAntonio Brufau Niubó YPF, S.A. ChairmanLuis Suárez de Lezo Mantilla YPF, S.A. Director
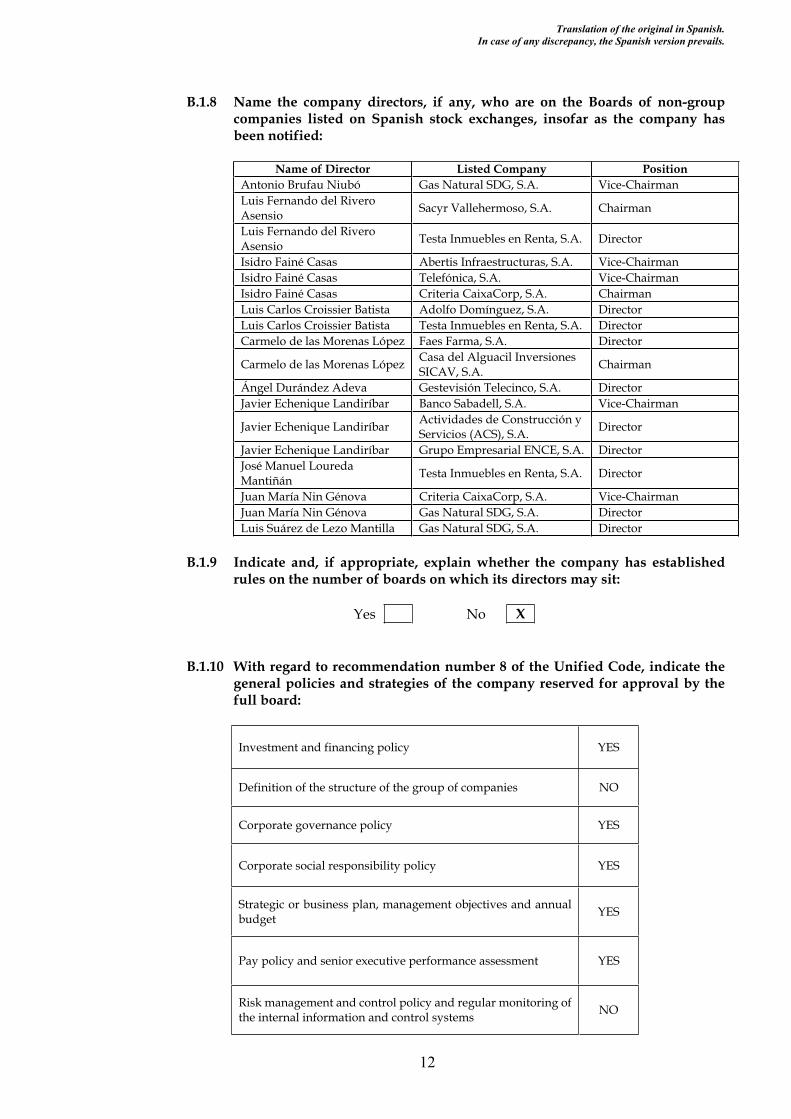
Translation of the original in Spanish. In case of any discrepancy, the Spanish version prevails.
12
B.1.8 Name the company directors, if any, who are on the Boards of non-group companies listed on Spanish stock exchanges, insofar as the company has been notified:
Name of Director Listed Company PositionAntonio Brufau Niubó Gas Natural SDG, S.A. Vice-Chairman Luis Fernando del Rivero Asensio Sacyr Vallehermoso, S.A. Chairman
Luis Fernando del Rivero Asensio Testa Inmuebles en Renta, S.A. Director
Isidro Fainé Casas Abertis Infraestructuras, S.A. Vice-Chairman Isidro Fainé Casas Telefónica, S.A. Vice-Chairman Isidro Fainé Casas Criteria CaixaCorp, S.A. Chairman Luis Carlos Croissier Batista Adolfo Domínguez, S.A. DirectorLuis Carlos Croissier Batista Testa Inmuebles en Renta, S.A. DirectorCarmelo de las Morenas López Faes Farma, S.A. Director
Carmelo de las Morenas López Casa del Alguacil Inversiones SICAV, S.A. Chairman
Ángel Durández Adeva Gestevisión Telecinco, S.A. DirectorJavier Echenique Landiríbar Banco Sabadell, S.A. Vice-Chairman
Javier Echenique Landiríbar Actividades de Construcción y Servicios (ACS), S.A. Director
Javier Echenique Landiríbar Grupo Empresarial ENCE, S.A. DirectorJosé Manuel Loureda Mantiñán Testa Inmuebles en Renta, S.A. Director
Juan María Nin Génova Criteria CaixaCorp, S.A. Vice-Chairman Juan María Nin Génova Gas Natural SDG, S.A. DirectorLuis Suárez de Lezo Mantilla Gas Natural SDG, S.A. Director
B.1.9 Indicate and, if appropriate, explain whether the company has established rules on the number of boards on which its directors may sit:
Yes No X
B.1.10 With regard to recommendation number 8 of the Unified Code, indicate the general policies and strategies of the company reserved for approval by the full board:
Investment and financing policy YES
Definition of the structure of the group of companies NO
Corporate governance policy YES
Corporate social responsibility policy YES
Strategic or business plan, management objectives and annual budget YES
Pay policy and senior executive performance assessment YES
Risk management and control policy and regular monitoring of the internal information and control systems NO
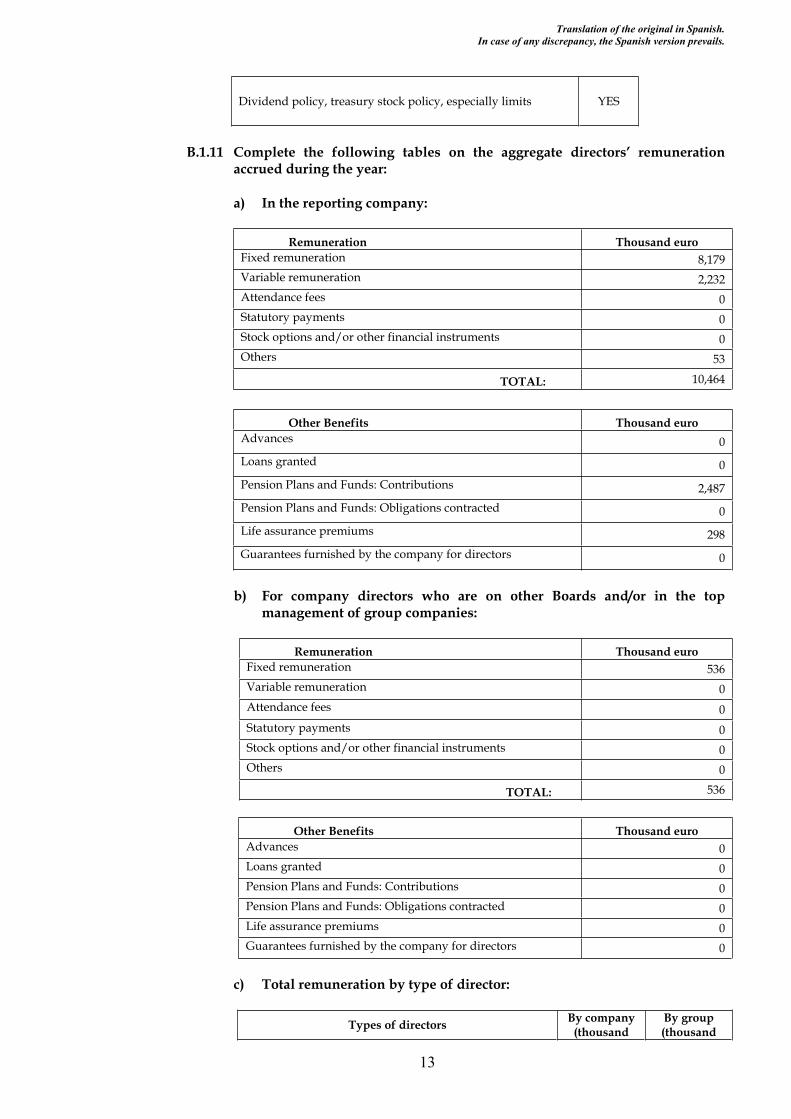
Translation of the original in Spanish. In case of any discrepancy, the Spanish version prevails.
13
Dividend policy, treasury stock policy, especially limits YES
B.1.11 Complete the following tables on the aggregate directors’ remuneration accrued during the year:
a) In the reporting company:
Remuneration Thousand euro Fixed remuneration 8,179Variable remuneration 2,232Attendance fees 0Statutory payments 0Stock options and/or other financial instruments 0Others 53
TOTAL: 10,464
Other Benefits Thousand euro Advances 0Loans granted 0Pension Plans and Funds: Contributions 2,487Pension Plans and Funds: Obligations contracted 0Life assurance premiums 298Guarantees furnished by the company for directors 0
b) For company directors who are on other Boards and/or in the top management of group companies:
Remuneration Thousand euro Fixed remuneration 536Variable remuneration 0Attendance fees 0Statutory payments 0Stock options and/or other financial instruments 0Others 0
TOTAL: 536
Other Benefits Thousand euro Advances 0Loans granted 0Pension Plans and Funds: Contributions 0Pension Plans and Funds: Obligations contracted 0Life assurance premiums 0Guarantees furnished by the company for directors 0
c) Total remuneration by type of director:
Types of directors By company (thousand
By group (thousand
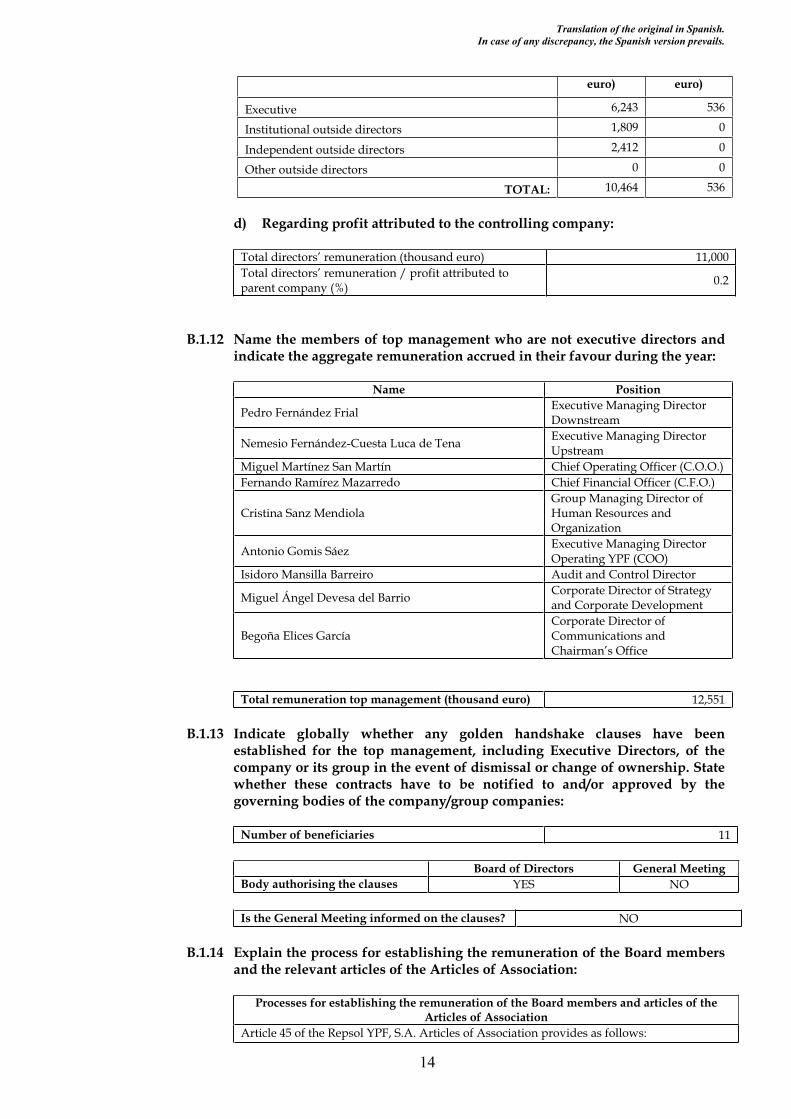
Translation of the original in Spanish. In case of any discrepancy, the Spanish version prevails.
14
euro) euro)
Executive 6,243 536
Institutional outside directors 1,809 0
Independent outside directors 2,412 0
Other outside directors 0 0
TOTAL: 10,464 536
d) Regarding profit attributed to the controlling company:
Total directors’ remuneration (thousand euro) 11,000Total directors’ remuneration / profit attributed to parent company (%) 0.2
B.1.12 Name the members of top management who are not executive directors and indicate the aggregate remuneration accrued in their favour during the year:
Name Position
Pedro Fernández Frial Executive Managing Director Downstream
Nemesio Fernández-Cuesta Luca de Tena Executive Managing Director Upstream
Miguel Martínez San Martín Chief Operating Officer (C.O.O.) Fernando Ramírez Mazarredo Chief Financial Officer (C.F.O.)
Cristina Sanz Mendiola Group Managing Director of Human Resources and Organization
Antonio Gomis Sáez Executive Managing Director Operating YPF (COO)
Isidoro Mansilla Barreiro Audit and Control Director
Miguel Ángel Devesa del Barrio Corporate Director of Strategy and Corporate Development
Begoña Elices García Corporate Director of Communications and Chairman’s Office
Total remuneration top management (thousand euro) 12,551
B.1.13 Indicate globally whether any golden handshake clauses have been established for the top management, including Executive Directors, of the company or its group in the event of dismissal or change of ownership. State whether these contracts have to be notified to and/or approved by the governing bodies of the company/group companies:
Number of beneficiaries 11
Board of Directors General Meeting Body authorising the clauses YES NO
Is the General Meeting informed on the clauses? NO
B.1.14 Explain the process for establishing the remuneration of the Board members and the relevant articles of the Articles of Association:
Processes for establishing the remuneration of the Board members and articles of the Articles of Association
Article 45 of the Repsol YPF, S.A. Articles of Association provides as follows:
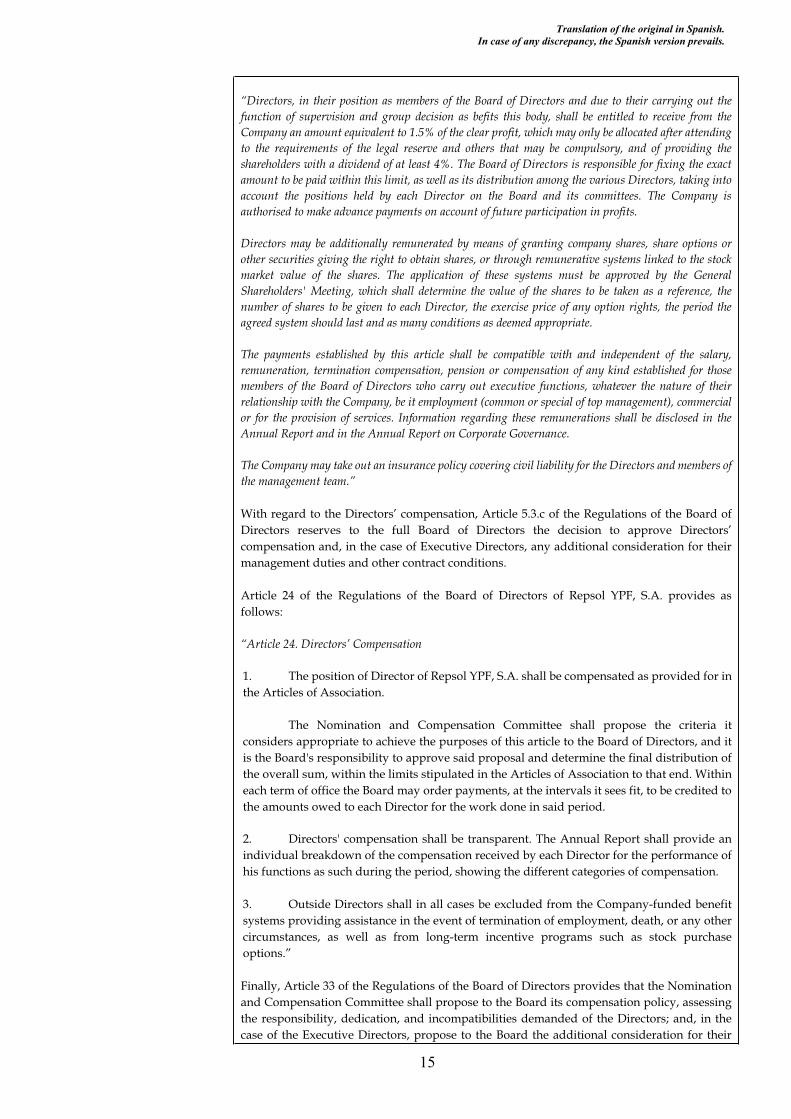
Translation of the original in Spanish. In case of any discrepancy, the Spanish version prevails.
15
“Directors, in their position as members of the Board of Directors and due to their carrying out the function of supervision and group decision as befits this body, shall be entitled to receive from the Company an amount equivalent to 1.5% of the clear profit, which may only be allocated after attending to the requirements of the legal reserve and others that may be compulsory, and of providing the shareholders with a dividend of at least 4%. The Board of Directors is responsible for fixing the exact amount to be paid within this limit, as well as its distribution among the various Directors, taking into account the positions held by each Director on the Board and its committees. The Company is authorised to make advance payments on account of future participation in profits.
Directors may be additionally remunerated by means of granting company shares, share options or other securities giving the right to obtain shares, or through remunerative systems linked to the stock market value of the shares. The application of these systems must be approved by the General Shareholders' Meeting, which shall determine the value of the shares to be taken as a reference, the number of shares to be given to each Director, the exercise price of any option rights, the period the agreed system should last and as many conditions as deemed appropriate.
The payments established by this article shall be compatible with and independent of the salary, remuneration, termination compensation, pension or compensation of any kind established for those members of the Board of Directors who carry out executive functions, whatever the nature of their relationship with the Company, be it employment (common or special of top management), commercial or for the provision of services. Information regarding these remunerations shall be disclosed in the Annual Report and in the Annual Report on Corporate Governance.
The Company may take out an insurance policy covering civil liability for the Directors and members of the management team.”
With regard to the Directors’ compensation, Article 5.3.c of the Regulations of the Board of Directors reserves to the full Board of Directors the decision to approve Directors’ compensation and, in the case of Executive Directors, any additional consideration for their management duties and other contract conditions.
Article 24 of the Regulations of the Board of Directors of Repsol YPF, S.A. provides as follows:
“Article 24. Directors’ Compensation
1. The position of Director of Repsol YPF, S.A. shall be compensated as provided for in the Articles of Association.
The Nomination and Compensation Committee shall propose the criteria it considers appropriate to achieve the purposes of this article to the Board of Directors, and it is the Board's responsibility to approve said proposal and determine the final distribution of the overall sum, within the limits stipulated in the Articles of Association to that end. Within each term of office the Board may order payments, at the intervals it sees fit, to be credited to the amounts owed to each Director for the work done in said period.
2. Directors' compensation shall be transparent. The Annual Report shall provide an individual breakdown of the compensation received by each Director for the performance of his functions as such during the period, showing the different categories of compensation.
3. Outside Directors shall in all cases be excluded from the Company-funded benefit systems providing assistance in the event of termination of employment, death, or any other circumstances, as well as from long-term incentive programs such as stock purchase options.”
Finally, Article 33 of the Regulations of the Board of Directors provides that the Nomination and Compensation Committee shall propose to the Board its compensation policy, assessing the responsibility, dedication, and incompatibilities demanded of the Directors; and, in the case of the Executive Directors, propose to the Board the additional consideration for their
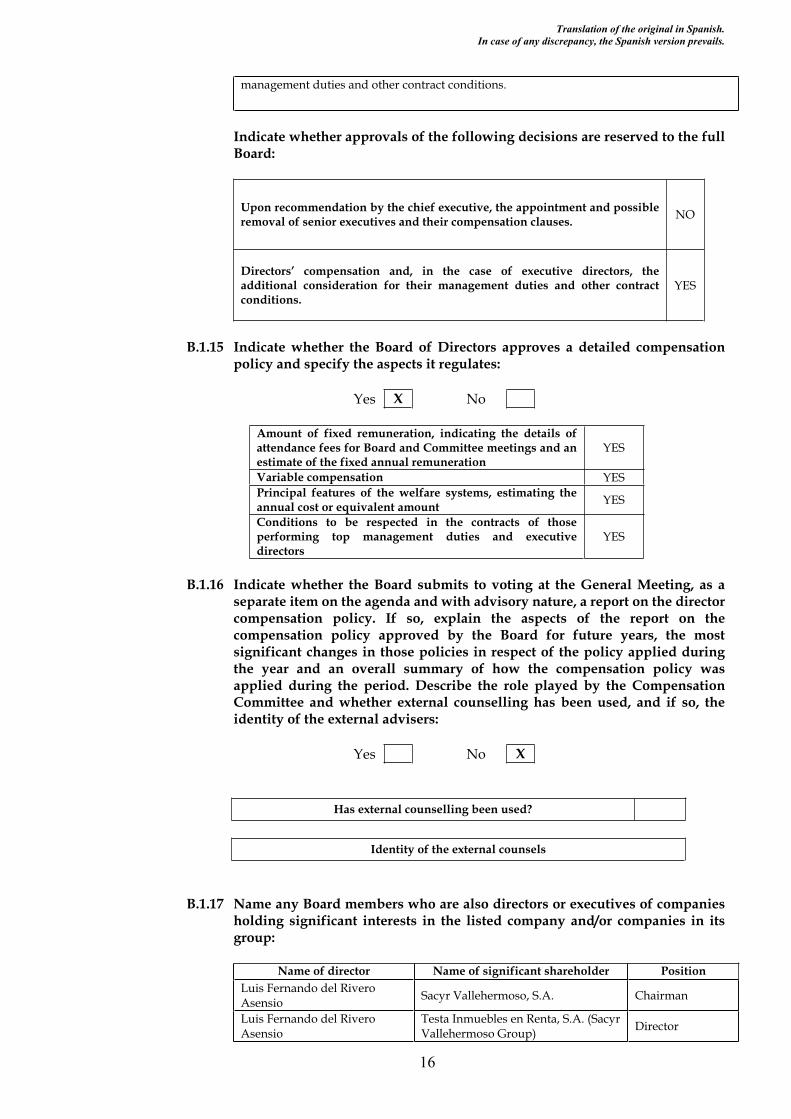
Translation of the original in Spanish. In case of any discrepancy, the Spanish version prevails.
16
management duties and other contract conditions.
Indicate whether approvals of the following decisions are reserved to the full Board:
Upon recommendation by the chief executive, the appointment and possible removal of senior executives and their compensation clauses. NO
Directors’ compensation and, in the case of executive directors, the additional consideration for their management duties and other contract conditions.
YES
B.1.15 Indicate whether the Board of Directors approves a detailed compensation policy and specify the aspects it regulates:
Yes X No
Amount of fixed remuneration, indicating the details of attendance fees for Board and Committee meetings and an estimate of the fixed annual remuneration
YES
Variable compensation YESPrincipal features of the welfare systems, estimating the annual cost or equivalent amount YES
Conditions to be respected in the contracts of those performing top management duties and executive directors
YES
B.1.16 Indicate whether the Board submits to voting at the General Meeting, as a separate item on the agenda and with advisory nature, a report on the director compensation policy. If so, explain the aspects of the report on the compensation policy approved by the Board for future years, the most significant changes in those policies in respect of the policy applied during the year and an overall summary of how the compensation policy was applied during the period. Describe the role played by the Compensation Committee and whether external counselling has been used, and if so, the identity of the external advisers:
Yes No X
Has external counselling been used?
Identity of the external counsels
B.1.17 Name any Board members who are also directors or executives of companies holding significant interests in the listed company and/or companies in its group:
Name of director Name of significant shareholder PositionLuis Fernando del Rivero Asensio Sacyr Vallehermoso, S.A. Chairman
Luis Fernando del Rivero Asensio
Testa Inmuebles en Renta, S.A. (Sacyr Vallehermoso Group) Director
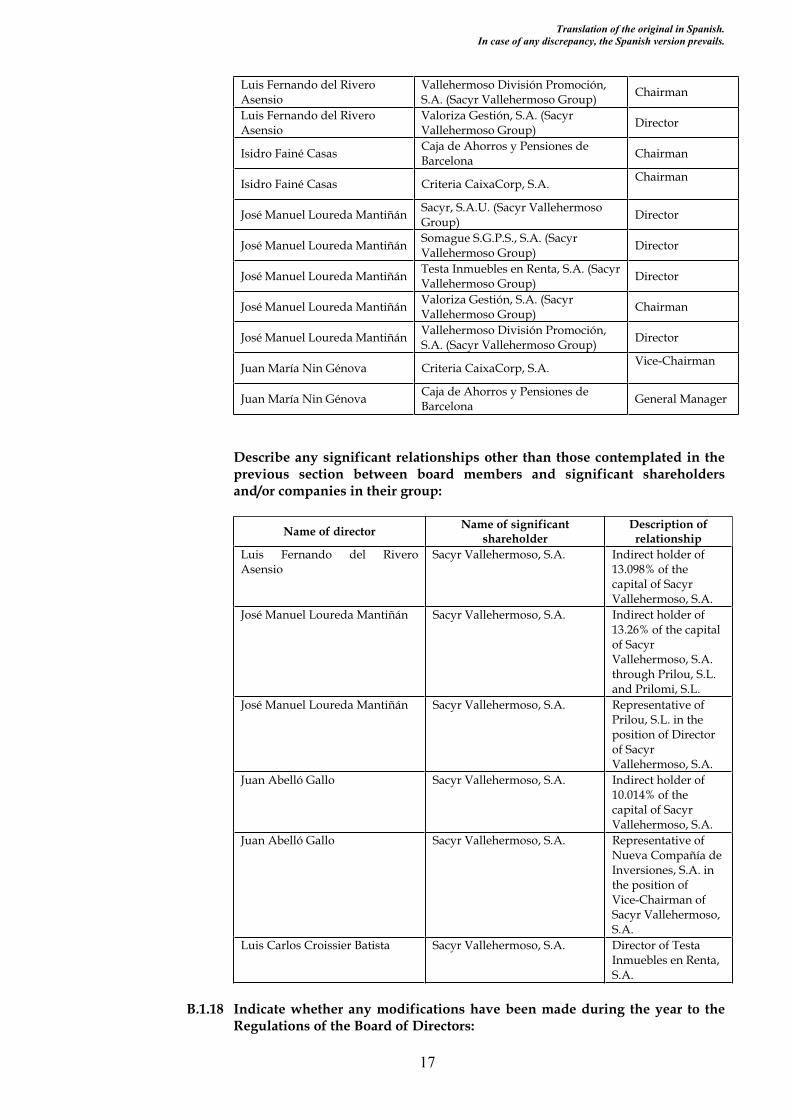
Translation of the original in Spanish. In case of any discrepancy, the Spanish version prevails.
17
Luis Fernando del Rivero Asensio
Vallehermoso División Promoción, S.A. (Sacyr Vallehermoso Group) Chairman
Luis Fernando del Rivero Asensio
Valoriza Gestión, S.A. (Sacyr Vallehermoso Group) Director
Isidro Fainé Casas Caja de Ahorros y Pensiones de Barcelona Chairman
Isidro Fainé Casas Criteria CaixaCorp, S.A. Chairman
José Manuel Loureda Mantiñán Sacyr, S.A.U. (Sacyr Vallehermoso Group) Director
José Manuel Loureda Mantiñán Somague S.G.P.S., S.A. (Sacyr Vallehermoso Group) Director
José Manuel Loureda Mantiñán Testa Inmuebles en Renta, S.A. (Sacyr Vallehermoso Group) Director
José Manuel Loureda Mantiñán Valoriza Gestión, S.A. (Sacyr Vallehermoso Group) Chairman
José Manuel Loureda Mantiñán Vallehermoso División Promoción, S.A. (Sacyr Vallehermoso Group) Director
Juan María Nin Génova Criteria CaixaCorp, S.A. Vice-Chairman
Juan María Nin Génova Caja de Ahorros y Pensiones de Barcelona General Manager
Describe any significant relationships other than those contemplated in the previous section between board members and significant shareholders and/or companies in their group:
Name of director Name of significant shareholder
Description of relationship
Luis Fernando del Rivero Asensio
Sacyr Vallehermoso, S.A. Indirect holder of 13.098% of the capital of Sacyr Vallehermoso, S.A.
José Manuel Loureda Mantiñán Sacyr Vallehermoso, S.A. Indirect holder of 13.26% of the capital of Sacyr Vallehermoso, S.A. through Prilou, S.L. and Prilomi, S.L.
José Manuel Loureda Mantiñán Sacyr Vallehermoso, S.A. Representative of Prilou, S.L. in the position of Director of Sacyr Vallehermoso, S.A.
Juan Abelló Gallo Sacyr Vallehermoso, S.A. Indirect holder of 10.014% of the capital of Sacyr Vallehermoso, S.A.
Juan Abelló Gallo Sacyr Vallehermoso, S.A. Representative of Nueva Compañía de Inversiones, S.A. in the position of Vice-Chairman of Sacyr Vallehermoso, S.A.
Luis Carlos Croissier Batista Sacyr Vallehermoso, S.A. Director of Testa Inmuebles en Renta, S.A.
B.1.18 Indicate whether any modifications have been made during the year to the Regulations of the Board of Directors:
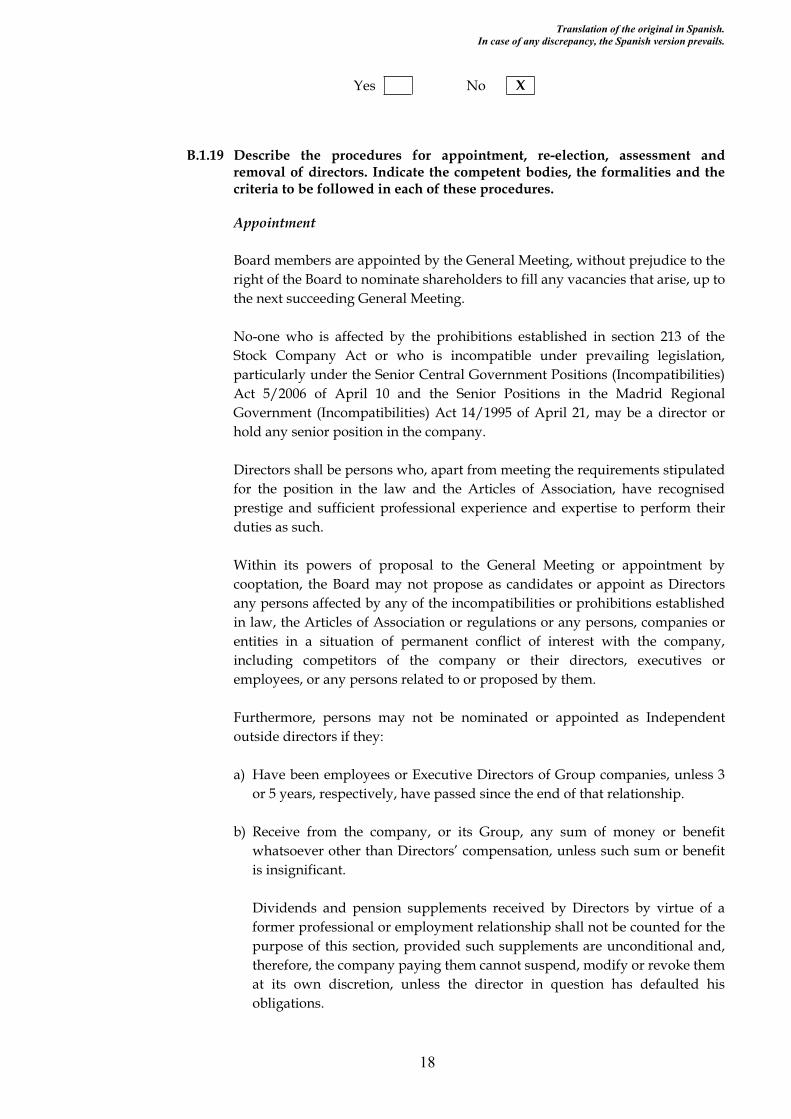
Translation of the original in Spanish. In case of any discrepancy, the Spanish version prevails.
18
Yes No X
B.1.19 Describe the procedures for appointment, re-election, assessment and removal of directors. Indicate the competent bodies, the formalities and the criteria to be followed in each of these procedures.
Appointment
Board members are appointed by the General Meeting, without prejudice to the right of the Board to nominate shareholders to fill any vacancies that arise, up to the next succeeding General Meeting.
No-one who is affected by the prohibitions established in section 213 of the Stock Company Act or who is incompatible under prevailing legislation, particularly under the Senior Central Government Positions (Incompatibilities) Act 5/2006 of April 10 and the Senior Positions in the Madrid Regional Government (Incompatibilities) Act 14/1995 of April 21, may be a director or hold any senior position in the company.
Directors shall be persons who, apart from meeting the requirements stipulated for the position in the law and the Articles of Association, have recognised prestige and sufficient professional experience and expertise to perform their duties as such.
Within its powers of proposal to the General Meeting or appointment by cooptation, the Board may not propose as candidates or appoint as Directors any persons affected by any of the incompatibilities or prohibitions established in law, the Articles of Association or regulations or any persons, companies or entities in a situation of permanent conflict of interest with the company, including competitors of the company or their directors, executives or employees, or any persons related to or proposed by them.
Furthermore, persons may not be nominated or appointed as Independent outside directors if they:
a) Have been employees or Executive Directors of Group companies, unless 3 or 5 years, respectively, have passed since the end of that relationship.
b) Receive from the company, or its Group, any sum of money or benefit whatsoever other than Directors’ compensation, unless such sum or benefit is insignificant.
Dividends and pension supplements received by Directors by virtue of a former professional or employment relationship shall not be counted for the purpose of this section, provided such supplements are unconditional and, therefore, the company paying them cannot suspend, modify or revoke them at its own discretion, unless the director in question has defaulted his obligations.
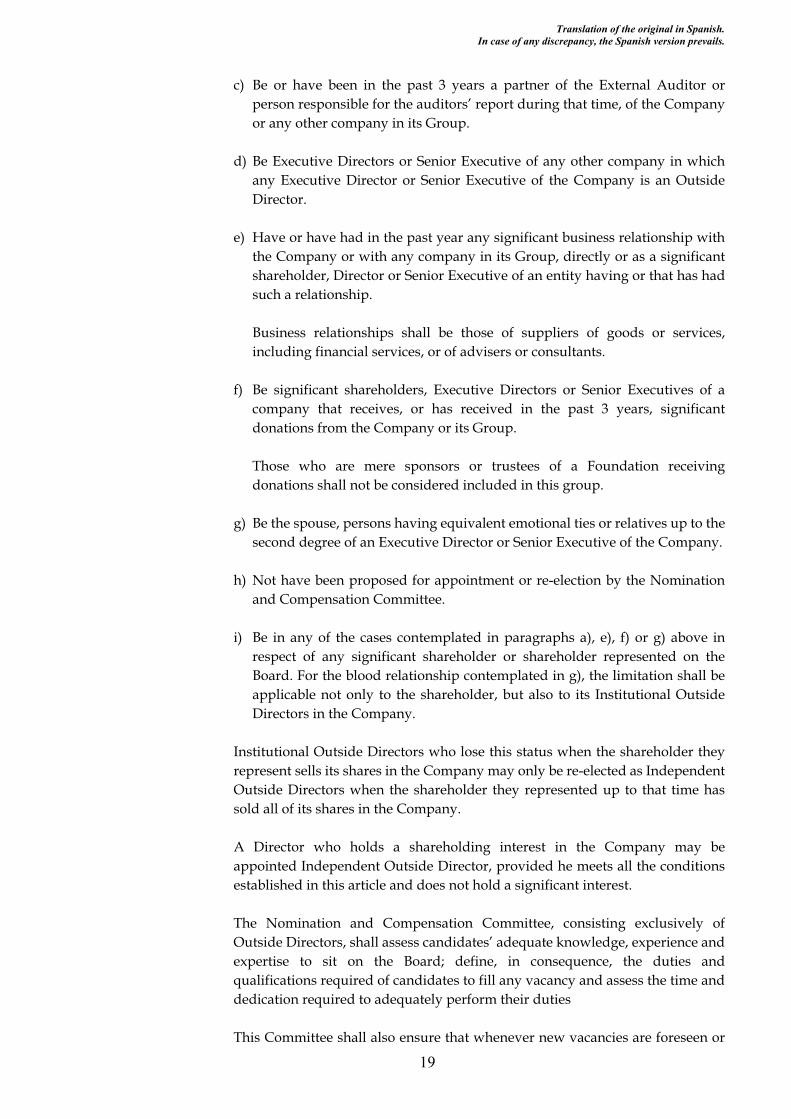
Translation of the original in Spanish. In case of any discrepancy, the Spanish version prevails.
19
c) Be or have been in the past 3 years a partner of the External Auditor or person responsible for the auditors’ report during that time, of the Company or any other company in its Group.
d) Be Executive Directors or Senior Executive of any other company in which any Executive Director or Senior Executive of the Company is an Outside Director.
e) Have or have had in the past year any significant business relationship with the Company or with any company in its Group, directly or as a significant shareholder, Director or Senior Executive of an entity having or that has had such a relationship.
Business relationships shall be those of suppliers of goods or services, including financial services, or of advisers or consultants.
f) Be significant shareholders, Executive Directors or Senior Executives of a company that receives, or has received in the past 3 years, significant donations from the Company or its Group.
Those who are mere sponsors or trustees of a Foundation receiving donations shall not be considered included in this group.
g) Be the spouse, persons having equivalent emotional ties or relatives up to the second degree of an Executive Director or Senior Executive of the Company.
h) Not have been proposed for appointment or re-election by the Nomination and Compensation Committee.
i) Be in any of the cases contemplated in paragraphs a), e), f) or g) above in respect of any significant shareholder or shareholder represented on the Board. For the blood relationship contemplated in g), the limitation shall be applicable not only to the shareholder, but also to its Institutional Outside Directors in the Company.
Institutional Outside Directors who lose this status when the shareholder they represent sells its shares in the Company may only be re-elected as Independent Outside Directors when the shareholder they represented up to that time has sold all of its shares in the Company.
A Director who holds a shareholding interest in the Company may be appointed Independent Outside Director, provided he meets all the conditions established in this article and does not hold a significant interest.
The Nomination and Compensation Committee, consisting exclusively of Outside Directors, shall assess candidates’ adequate knowledge, experience and expertise to sit on the Board; define, in consequence, the duties and qualifications required of candidates to fill any vacancy and assess the time and dedication required to adequately perform their duties
This Committee shall also ensure that whenever new vacancies are foreseen or
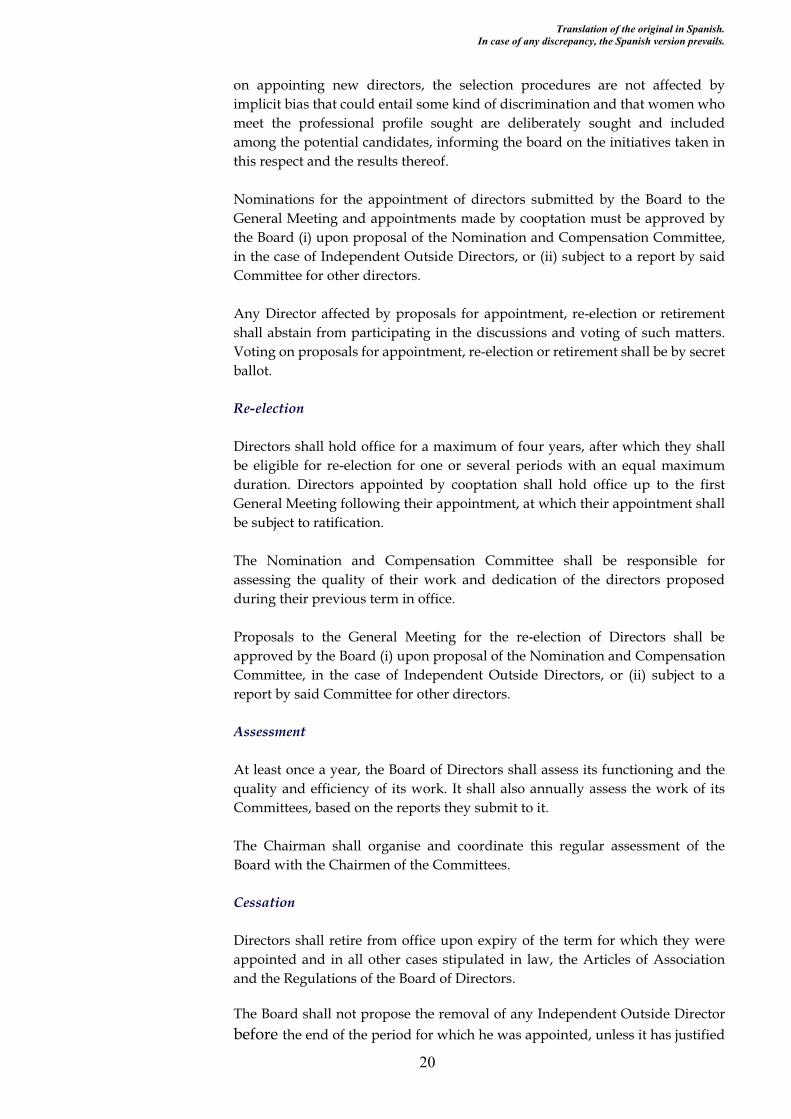
Translation of the original in Spanish. In case of any discrepancy, the Spanish version prevails.
20
on appointing new directors, the selection procedures are not affected by implicit bias that could entail some kind of discrimination and that women who meet the professional profile sought are deliberately sought and included among the potential candidates, informing the board on the initiatives taken in this respect and the results thereof.
Nominations for the appointment of directors submitted by the Board to the General Meeting and appointments made by cooptation must be approved by the Board (i) upon proposal of the Nomination and Compensation Committee, in the case of Independent Outside Directors, or (ii) subject to a report by said Committee for other directors.
Any Director affected by proposals for appointment, re-election or retirement shall abstain from participating in the discussions and voting of such matters. Voting on proposals for appointment, re-election or retirement shall be by secret ballot.
Re-election
Directors shall hold office for a maximum of four years, after which they shall be eligible for re-election for one or several periods with an equal maximum duration. Directors appointed by cooptation shall hold office up to the first General Meeting following their appointment, at which their appointment shall be subject to ratification.
The Nomination and Compensation Committee shall be responsible for assessing the quality of their work and dedication of the directors proposed during their previous term in office.
Proposals to the General Meeting for the re-election of Directors shall be approved by the Board (i) upon proposal of the Nomination and Compensation Committee, in the case of Independent Outside Directors, or (ii) subject to a report by said Committee for other directors.
Assessment
At least once a year, the Board of Directors shall assess its functioning and the quality and efficiency of its work. It shall also annually assess the work of its Committees, based on the reports they submit to it.
The Chairman shall organise and coordinate this regular assessment of the Board with the Chairmen of the Committees.
Cessation
Directors shall retire from office upon expiry of the term for which they were appointed and in all other cases stipulated in law, the Articles of Association and the Regulations of the Board of Directors.
The Board shall not propose the removal of any Independent Outside Director before the end of the period for which he was appointed, unless it has justified
Translation of the original in Spanish. In case of any discrepancy, the Spanish version prevails.
21
reasons for doing so, based on a report by the Nomination and Compensation Committee. In particular, such a proposal shall be justified if the Director (i) has defaulted the duties corresponding to his position; (ii) is in any of the situations described in section B.1.20 below; or (iii) falls into any of the circumstances described above, by virtue of which he may no longer be considered an Independent Outside Director.
The removal of Independent Outside Directors may also be proposed following takeover bids, mergers or other similar corporate operations causing a change in the capital structure of the Company, insofar as may be necessary to establish a reasonable balance between Institutional Outside Directors and Independent Outside Directors, according to the ratio of capital represented by the former to the rest of the capital.
Directors shall also tender their resignations in any of the circumstances defined in the following section.
B.1.20 Indicate the events in which directors are obliged to retire.
Directors shall tender their resignations and step down from the Board, should the latter consider this appropriate, in the following events:
a) If they fall into circumstances of incompatibility or prohibition contemplated in law, the Articles of Association or applicable regulations.
b) If they receive a serious warning from the Nomination and Compensation Committee or the Audit and Control Committee for defaulting their obligations as directors.
c) If, in the opinion of the board, in view of a report by the Nomination and Compensation Committee:
(i) Their remaining on the Board could jeopardise the interests of the company or adversely affect the functioning of the Board or the standing and reputation of the Company; or
(ii) If the reasons why they were appointed disappear. Directors shall find themselves in this position, particularly in the following cases:
- Institutional Outside Directors, when the shareholder they represent or that nominated them directors transfers its entire shareholding interest. They shall also offer their resignation and, should the Board deem fit, step down from the Board, in the corresponding proportion, if the shareholder reduces its shareholding interest to a level requiring a reduction in the number of its Institutional Outside Directors.
- Executive directors, when they cease to hold the executive positions outside the board to which their appointment as director was linked.
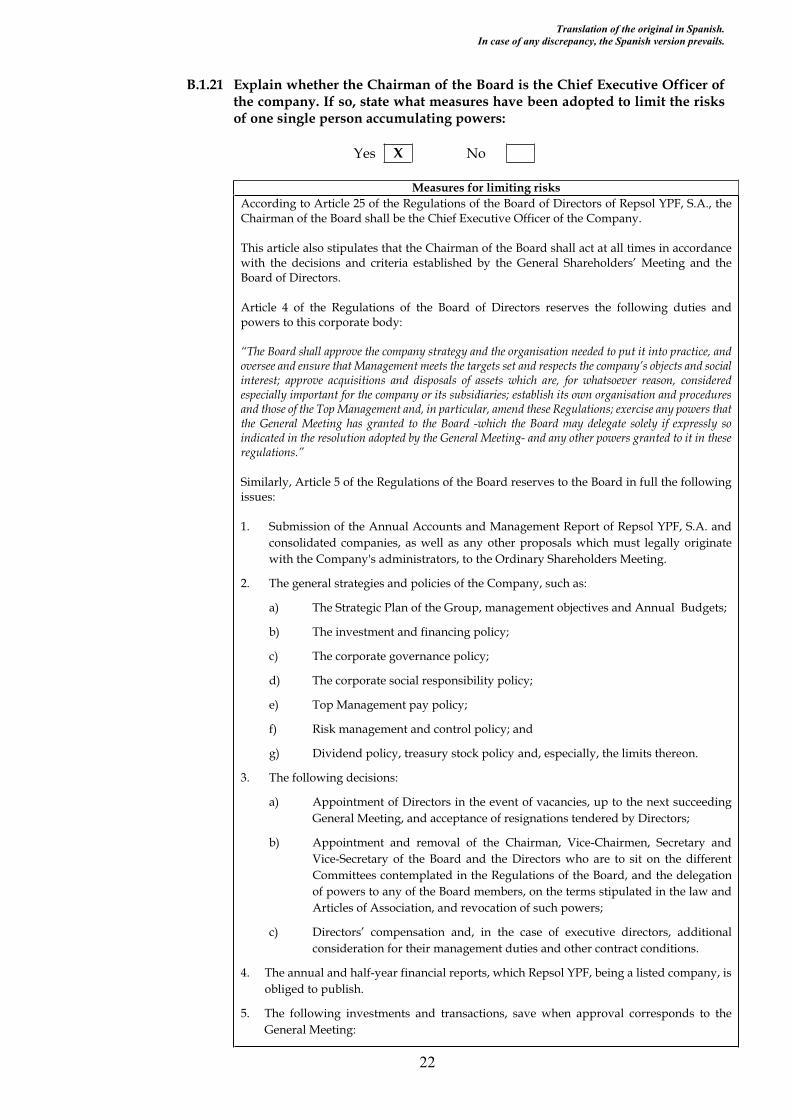
Translation of the original in Spanish. In case of any discrepancy, the Spanish version prevails.
22
B.1.21 Explain whether the Chairman of the Board is the Chief Executive Officer of the company. If so, state what measures have been adopted to limit the risks of one single person accumulating powers:
Yes X No
Measures for limiting risks According to Article 25 of the Regulations of the Board of Directors of Repsol YPF, S.A., the Chairman of the Board shall be the Chief Executive Officer of the Company.
This article also stipulates that the Chairman of the Board shall act at all times in accordance with the decisions and criteria established by the General Shareholders’ Meeting and the Board of Directors.
Article 4 of the Regulations of the Board of Directors reserves the following duties and powers to this corporate body:
“The Board shall approve the company strategy and the organisation needed to put it into practice, and oversee and ensure that Management meets the targets set and respects the company’s objects and social interest; approve acquisitions and disposals of assets which are, for whatsoever reason, considered especially important for the company or its subsidiaries; establish its own organisation and procedures and those of the Top Management and, in particular, amend these Regulations; exercise any powers that the General Meeting has granted to the Board -which the Board may delegate solely if expressly so indicated in the resolution adopted by the General Meeting- and any other powers granted to it in these regulations.”
Similarly, Article 5 of the Regulations of the Board reserves to the Board in full the following issues:
1. Submission of the Annual Accounts and Management Report of Repsol YPF, S.A. and consolidated companies, as well as any other proposals which must legally originate with the Company's administrators, to the Ordinary Shareholders Meeting.
2. The general strategies and policies of the Company, such as:
a) The Strategic Plan of the Group, management objectives and Annual Budgets;
b) The investment and financing policy;
c) The corporate governance policy;
d) The corporate social responsibility policy;
e) Top Management pay policy;
f) Risk management and control policy; and
g) Dividend policy, treasury stock policy and, especially, the limits thereon.
3. The following decisions:
a) Appointment of Directors in the event of vacancies, up to the next succeeding General Meeting, and acceptance of resignations tendered by Directors;
b) Appointment and removal of the Chairman, Vice-Chairmen, Secretary and Vice-Secretary of the Board and the Directors who are to sit on the different Committees contemplated in the Regulations of the Board, and the delegation of powers to any of the Board members, on the terms stipulated in the law and Articles of Association, and revocation of such powers;
c) Directors’ compensation and, in the case of executive directors, additional consideration for their management duties and other contract conditions.
4. The annual and half-year financial reports, which Repsol YPF, being a listed company, is obliged to publish.
5. The following investments and transactions, save when approval corresponds to the General Meeting:
Translation of the original in Spanish. In case of any discrepancy, the Spanish version prevails.
23
a) Incorporation of new companies and entities or initial acquisition of stakes in existing companies and entities whenever they entail a long-standing investment of more than six million euro for the Repsol YPF Group or are unrelated to the main activity of the company.
In other cases, the first paragraph of e) below will be applicable. By exception, decisions on investments in the incorporation of new companies and entities or initial acquisition of stakes in existing companies or entities provided for in sufficient detail in the Group’s annual budgets and strategic plan shall be left up to the Chairman.
b) Creation or acquisition of shares in special purpose vehicles whenever they go beyond the ordinary administration of the company.
c) Mergers, takeovers, spin-offs or concentrations of strategic importance of interest for any of the major subsidiaries or investees in which any of the companies in the Repsol YPF group has a direct interest.
d) Sale of shares in companies or other fixed assets with a value of over thirty million euro; the Delegate Committee shall approve such sales valued at between fifteen and thirty million euro, informing the board at the next meeting of all sales authorised.
e) Approval of investment projects with a value of over thirty million euro; the Delegate Committee shall approve projects valued at between fifteen and thirty million euro, informing the Board at the next meeting of all investments approved.
By exception, the Chairman shall decide, after discussion by the Management Committee if necessary, whether to approve the following investment projects
- Those involving the prospecting or working of oil fields in fulfilment of commitments deriving from the corresponding contracts, concessions or licences.
- Those performed in fulfilment of legal provisions binding on the company concerned, concerning environmental protection, safety of installations, product specifications or similar.
- Those provided for in sufficient detail in the group’s annual budgets and strategic plan.
In these cases, the Chairman shall report on the approval of these investments to the Board or Delegate Committee, depending on their values and as established in the first paragraph of this point e), wherever possible before commencement of the respective projects.
f) Notes, debentures or other issues made by Repsol YPF, S.A. or its majority-owned or controlled subsidiaries.
g) Granting of guarantees to secure the obligations of entities not controlled by the group.
h) Assignment of rights over the trade name and trade marks, and over any other patents, technology and any form of industrial or intellectual property of economic importance belonging to Repsol YPF, S.A. or group companies.
i) Creation, investment and supervision of the management of employee pension schemes and any other commitments to employees involving long-term financial responsibilities for the Company.
j) Signing of long-term commercial, industrial or financial agreements of strategic importance for the Repsol YPF Group.
6. Any other business or matter reserved in these Regulations for approval by the full
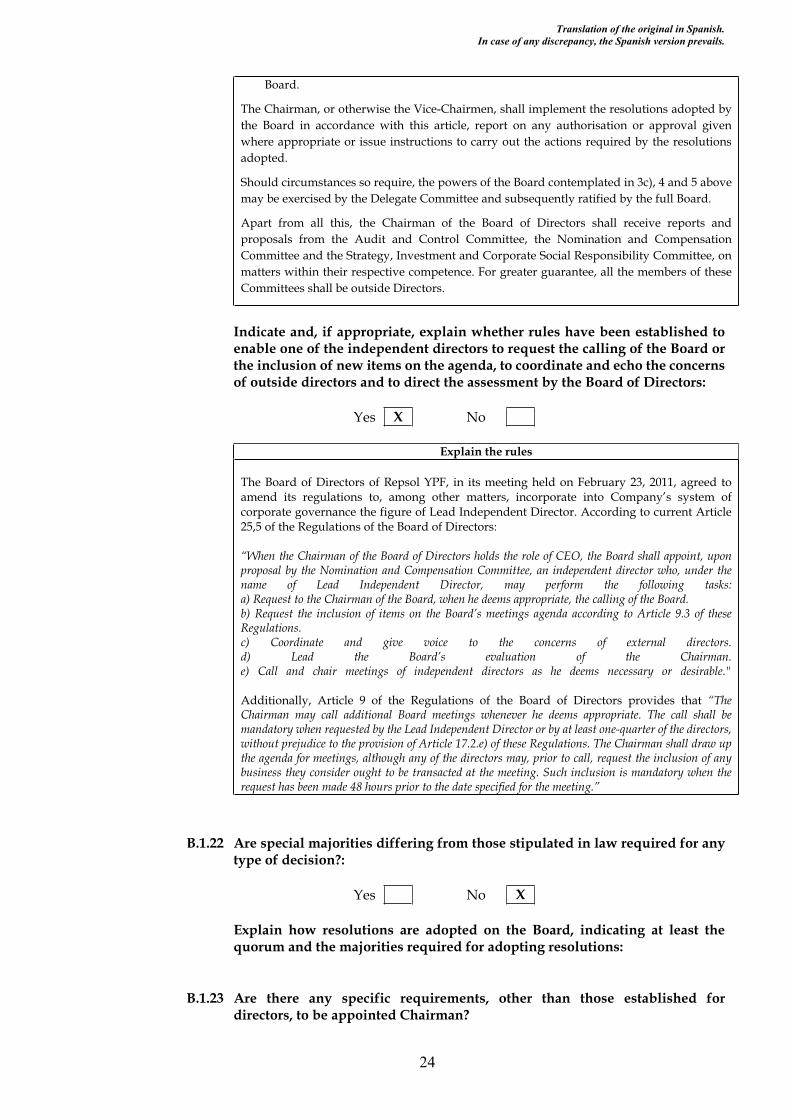
Translation of the original in Spanish. In case of any discrepancy, the Spanish version prevails.
24
Board.
The Chairman, or otherwise the Vice-Chairmen, shall implement the resolutions adopted by the Board in accordance with this article, report on any authorisation or approval given where appropriate or issue instructions to carry out the actions required by the resolutions adopted.
Should circumstances so require, the powers of the Board contemplated in 3c), 4 and 5 above may be exercised by the Delegate Committee and subsequently ratified by the full Board.
Apart from all this, the Chairman of the Board of Directors shall receive reports and proposals from the Audit and Control Committee, the Nomination and Compensation Committee and the Strategy, Investment and Corporate Social Responsibility Committee, on matters within their respective competence. For greater guarantee, all the members of these Committees shall be outside Directors.
Indicate and, if appropriate, explain whether rules have been established to enable one of the independent directors to request the calling of the Board or the inclusion of new items on the agenda, to coordinate and echo the concerns of outside directors and to direct the assessment by the Board of Directors:
Yes X No
Explain the rules
The Board of Directors of Repsol YPF, in its meeting held on February 23, 2011, agreed to amend its regulations to, among other matters, incorporate into Company’s system of corporate governance the figure of Lead Independent Director. According to current Article 25,5 of the Regulations of the Board of Directors:
“When the Chairman of the Board of Directors holds the role of CEO, the Board shall appoint, upon proposal by the Nomination and Compensation Committee, an independent director who, under the name of Lead Independent Director, may perform the following tasks:a) Request to the Chairman of the Board, when he deems appropriate, the calling of the Board. b) Request the inclusion of items on the Board’s meetings agenda according to Article 9.3 of these Regulations.c) Coordinate and give voice to the concerns of external directors.d) Lead the Board’s evaluation of the Chairman.e) Call and chair meetings of independent directors as he deems necessary or desirable."
Additionally, Article 9 of the Regulations of the Board of Directors provides that “The Chairman may call additional Board meetings whenever he deems appropriate. The call shall be mandatory when requested by the Lead Independent Director or by at least one-quarter of the directors, without prejudice to the provision of Article 17.2.e) of these Regulations. The Chairman shall draw up the agenda for meetings, although any of the directors may, prior to call, request the inclusion of any business they consider ought to be transacted at the meeting. Such inclusion is mandatory when the request has been made 48 hours prior to the date specified for the meeting.”
B.1.22 Are special majorities differing from those stipulated in law required for any type of decision?:
Yes No X
Explain how resolutions are adopted on the Board, indicating at least the quorum and the majorities required for adopting resolutions:
B.1.23 Are there any specific requirements, other than those established for directors, to be appointed Chairman?
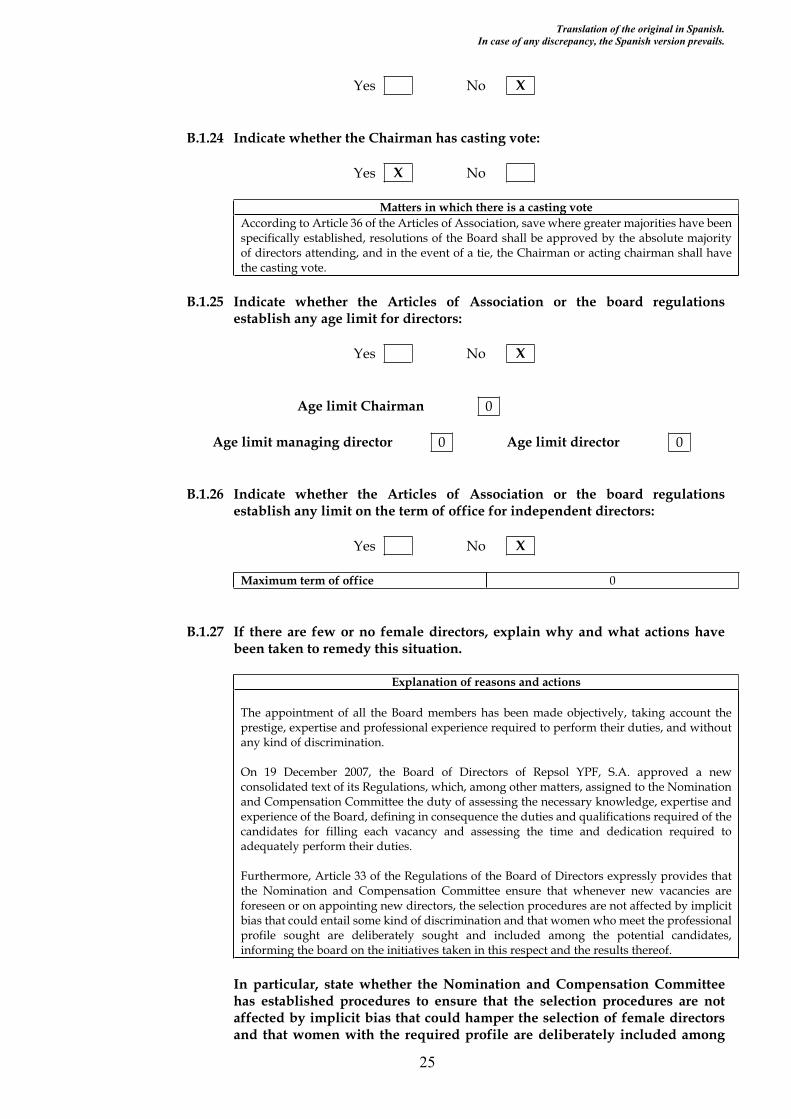
Translation of the original in Spanish. In case of any discrepancy, the Spanish version prevails.
25
Yes No X
B.1.24 Indicate whether the Chairman has casting vote:
Yes X No
Matters in which there is a casting vote According to Article 36 of the Articles of Association, save where greater majorities have been specifically established, resolutions of the Board shall be approved by the absolute majority of directors attending, and in the event of a tie, the Chairman or acting chairman shall have the casting vote.
B.1.25 Indicate whether the Articles of Association or the board regulations establish any age limit for directors:
Yes No X
Age limit Chairman 0
Age limit managing director 0 Age limit director 0
B.1.26 Indicate whether the Articles of Association or the board regulations establish any limit on the term of office for independent directors:
Yes No X
Maximum term of office 0
B.1.27 If there are few or no female directors, explain why and what actions have been taken to remedy this situation.
Explanation of reasons and actions
The appointment of all the Board members has been made objectively, taking account the prestige, expertise and professional experience required to perform their duties, and without any kind of discrimination.
On 19 December 2007, the Board of Directors of Repsol YPF, S.A. approved a new consolidated text of its Regulations, which, among other matters, assigned to the Nomination and Compensation Committee the duty of assessing the necessary knowledge, expertise and experience of the Board, defining in consequence the duties and qualifications required of the candidates for filling each vacancy and assessing the time and dedication required to adequately perform their duties.
Furthermore, Article 33 of the Regulations of the Board of Directors expressly provides that the Nomination and Compensation Committee ensure that whenever new vacancies are foreseen or on appointing new directors, the selection procedures are not affected by implicit bias that could entail some kind of discrimination and that women who meet the professional profile sought are deliberately sought and included among the potential candidates, informing the board on the initiatives taken in this respect and the results thereof.
In particular, state whether the Nomination and Compensation Committee has established procedures to ensure that the selection procedures are not affected by implicit bias that could hamper the selection of female directors and that women with the required profile are deliberately included among
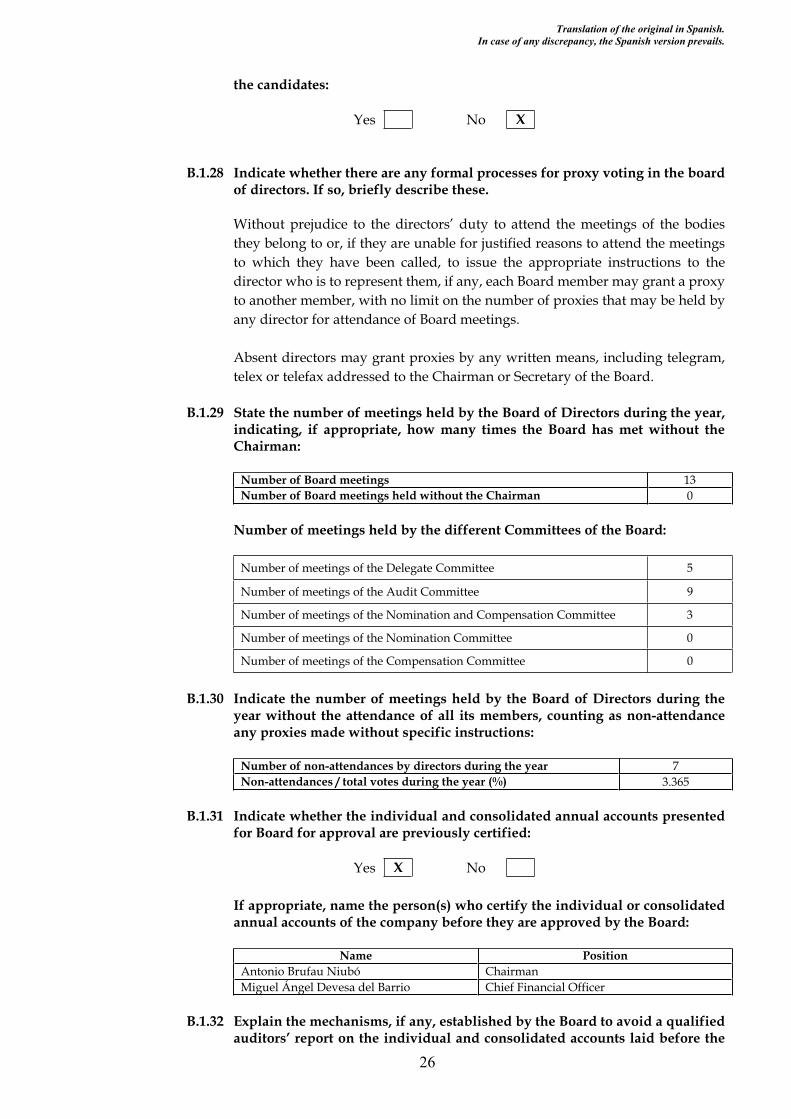
Translation of the original in Spanish. In case of any discrepancy, the Spanish version prevails.
26
the candidates:
Yes No X
B.1.28 Indicate whether there are any formal processes for proxy voting in the board of directors. If so, briefly describe these.
Without prejudice to the directors’ duty to attend the meetings of the bodies they belong to or, if they are unable for justified reasons to attend the meetings to which they have been called, to issue the appropriate instructions to the director who is to represent them, if any, each Board member may grant a proxy to another member, with no limit on the number of proxies that may be held by any director for attendance of Board meetings.
Absent directors may grant proxies by any written means, including telegram, telex or telefax addressed to the Chairman or Secretary of the Board.
B.1.29 State the number of meetings held by the Board of Directors during the year, indicating, if appropriate, how many times the Board has met without the Chairman:
Number of Board meetings 13Number of Board meetings held without the Chairman 0
Number of meetings held by the different Committees of the Board:
Number of meetings of the Delegate Committee 5
Number of meetings of the Audit Committee 9
Number of meetings of the Nomination and Compensation Committee 3
Number of meetings of the Nomination Committee 0
Number of meetings of the Compensation Committee 0
B.1.30 Indicate the number of meetings held by the Board of Directors during the year without the attendance of all its members, counting as non-attendance any proxies made without specific instructions:
Number of non-attendances by directors during the year 7Non-attendances / total votes during the year (%) 3.365
B.1.31 Indicate whether the individual and consolidated annual accounts presented for Board for approval are previously certified:
Yes X No
If appropriate, name the person(s) who certify the individual or consolidated annual accounts of the company before they are approved by the Board:
Name PositionAntonio Brufau Niubó ChairmanMiguel Ángel Devesa del Barrio Chief Financial Officer
B.1.32 Explain the mechanisms, if any, established by the Board to avoid a qualified auditors’ report on the individual and consolidated accounts laid before the
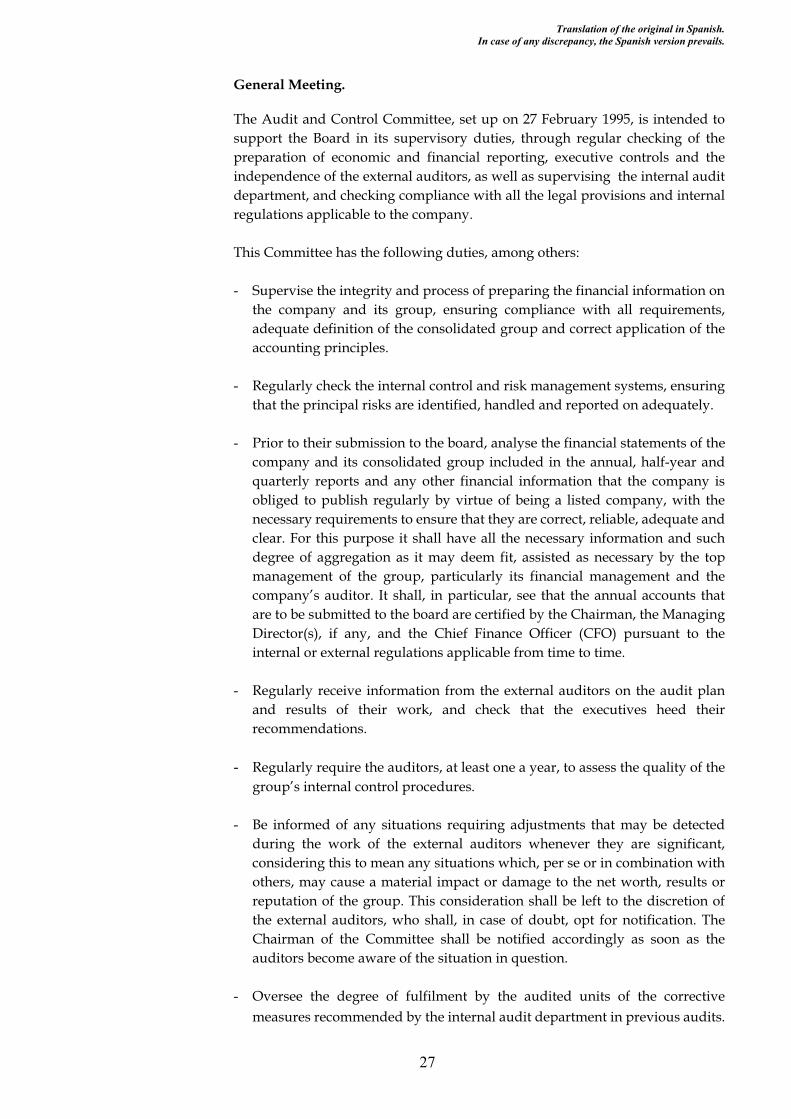
Translation of the original in Spanish. In case of any discrepancy, the Spanish version prevails.
27
General Meeting.
The Audit and Control Committee, set up on 27 February 1995, is intended to support the Board in its supervisory duties, through regular checking of the preparation of economic and financial reporting, executive controls and the independence of the external auditors, as well as supervising the internal audit department, and checking compliance with all the legal provisions and internal regulations applicable to the company.
This Committee has the following duties, among others:
- Supervise the integrity and process of preparing the financial information on the company and its group, ensuring compliance with all requirements, adequate definition of the consolidated group and correct application of the accounting principles.
- Regularly check the internal control and risk management systems, ensuring that the principal risks are identified, handled and reported on adequately.
- Prior to their submission to the board, analyse the financial statements of the company and its consolidated group included in the annual, half-year and quarterly reports and any other financial information that the company is obliged to publish regularly by virtue of being a listed company, with the necessary requirements to ensure that they are correct, reliable, adequate and clear. For this purpose it shall have all the necessary information and such degree of aggregation as it may deem fit, assisted as necessary by the top management of the group, particularly its financial management and the company’s auditor. It shall, in particular, see that the annual accounts that are to be submitted to the board are certified by the Chairman, the Managing Director(s), if any, and the Chief Finance Officer (CFO) pursuant to the internal or external regulations applicable from time to time.
- Regularly receive information from the external auditors on the audit plan and results of their work, and check that the executives heed their recommendations.
- Regularly require the auditors, at least one a year, to assess the quality of the group’s internal control procedures.
- Be informed of any situations requiring adjustments that may be detected during the work of the external auditors whenever they are significant, considering this to mean any situations which, per se or in combination with others, may cause a material impact or damage to the net worth, results or reputation of the group. This consideration shall be left to the discretion of the external auditors, who shall, in case of doubt, opt for notification. The Chairman of the Committee shall be notified accordingly as soon as the auditors become aware of the situation in question.
- Oversee the degree of fulfilment by the audited units of the corrective measures recommended by the internal audit department in previous audits.
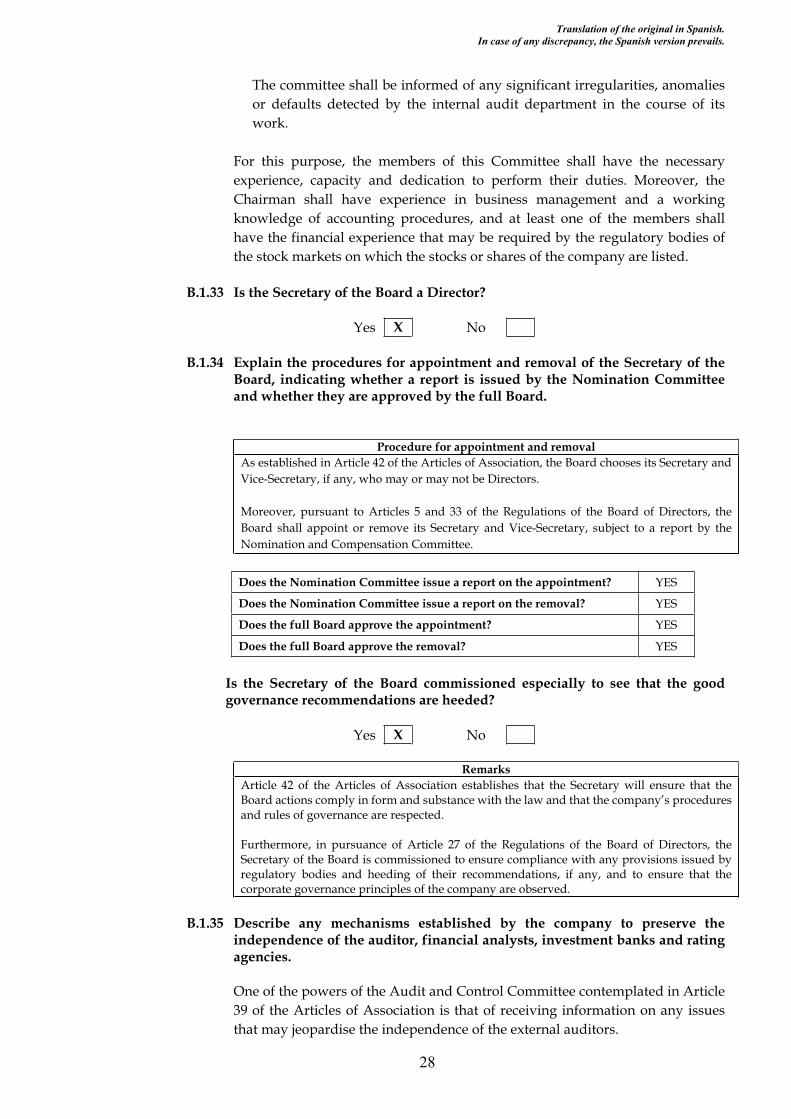
Translation of the original in Spanish. In case of any discrepancy, the Spanish version prevails.
28
The committee shall be informed of any significant irregularities, anomalies or defaults detected by the internal audit department in the course of its work.
For this purpose, the members of this Committee shall have the necessary experience, capacity and dedication to perform their duties. Moreover, the Chairman shall have experience in business management and a working knowledge of accounting procedures, and at least one of the members shall have the financial experience that may be required by the regulatory bodies of the stock markets on which the stocks or shares of the company are listed.
B.1.33 Is the Secretary of the Board a Director?
Yes X No
B.1.34 Explain the procedures for appointment and removal of the Secretary of the Board, indicating whether a report is issued by the Nomination Committee and whether they are approved by the full Board.
Procedure for appointment and removal As established in Article 42 of the Articles of Association, the Board chooses its Secretary and Vice-Secretary, if any, who may or may not be Directors.
Moreover, pursuant to Articles 5 and 33 of the Regulations of the Board of Directors, the Board shall appoint or remove its Secretary and Vice-Secretary, subject to a report by the Nomination and Compensation Committee.
Does the Nomination Committee issue a report on the appointment? YES
Does the Nomination Committee issue a report on the removal? YES
Does the full Board approve the appointment? YES
Does the full Board approve the removal? YES
Is the Secretary of the Board commissioned especially to see that the good governance recommendations are heeded?
Yes X No
Remarks Article 42 of the Articles of Association establishes that the Secretary will ensure that the Board actions comply in form and substance with the law and that the company’s procedures and rules of governance are respected.
Furthermore, in pursuance of Article 27 of the Regulations of the Board of Directors, the Secretary of the Board is commissioned to ensure compliance with any provisions issued by regulatory bodies and heeding of their recommendations, if any, and to ensure that the corporate governance principles of the company are observed.
B.1.35 Describe any mechanisms established by the company to preserve the independence of the auditor, financial analysts, investment banks and rating agencies.
One of the powers of the Audit and Control Committee contemplated in Article 39 of the Articles of Association is that of receiving information on any issues that may jeopardise the independence of the external auditors.
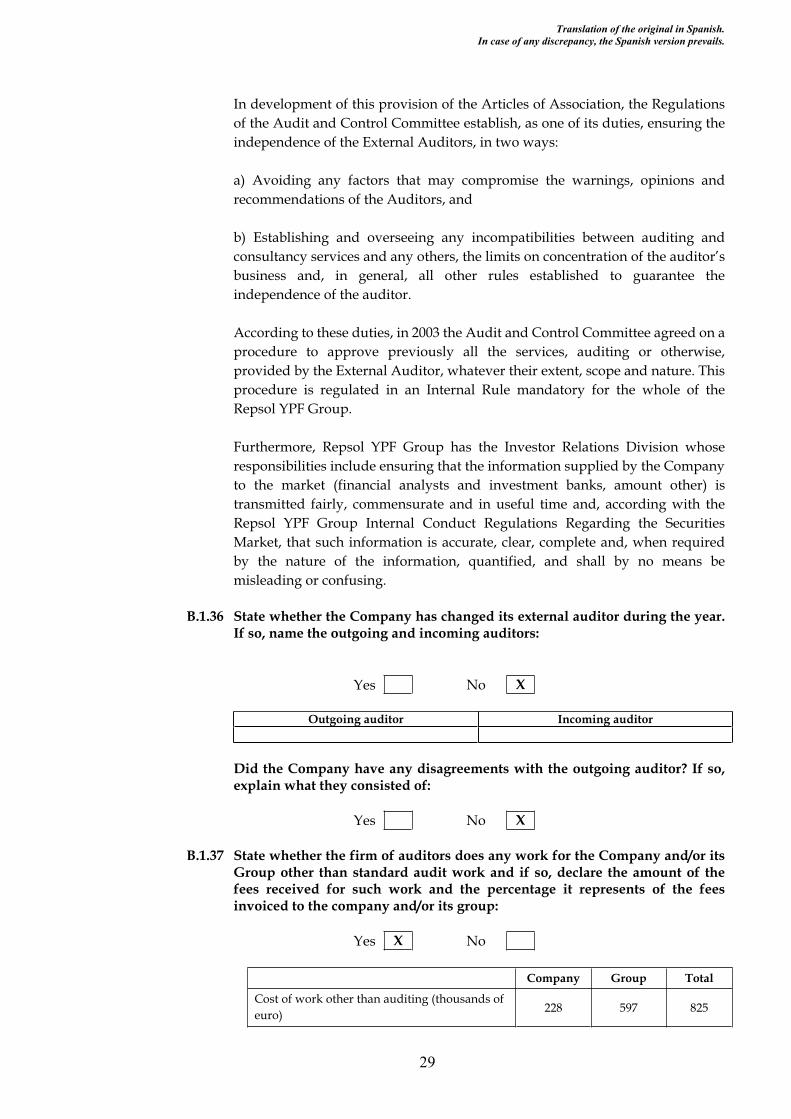
Translation of the original in Spanish. In case of any discrepancy, the Spanish version prevails.
29
In development of this provision of the Articles of Association, the Regulations of the Audit and Control Committee establish, as one of its duties, ensuring the independence of the External Auditors, in two ways:
a) Avoiding any factors that may compromise the warnings, opinions and recommendations of the Auditors, and
b) Establishing and overseeing any incompatibilities between auditing and consultancy services and any others, the limits on concentration of the auditor’s business and, in general, all other rules established to guarantee the independence of the auditor.
According to these duties, in 2003 the Audit and Control Committee agreed on a procedure to approve previously all the services, auditing or otherwise, provided by the External Auditor, whatever their extent, scope and nature. This procedure is regulated in an Internal Rule mandatory for the whole of the Repsol YPF Group.
Furthermore, Repsol YPF Group has the Investor Relations Division whose responsibilities include ensuring that the information supplied by the Company to the market (financial analysts and investment banks, amount other) is transmitted fairly, commensurate and in useful time and, according with the Repsol YPF Group Internal Conduct Regulations Regarding the Securities Market, that such information is accurate, clear, complete and, when required by the nature of the information, quantified, and shall by no means be misleading or confusing.
B.1.36 State whether the Company has changed its external auditor during the year. If so, name the outgoing and incoming auditors:
Yes No X
Outgoing auditor Incoming auditor
Did the Company have any disagreements with the outgoing auditor? If so, explain what they consisted of:
Yes No X
B.1.37 State whether the firm of auditors does any work for the Company and/or its Group other than standard audit work and if so, declare the amount of the fees received for such work and the percentage it represents of the fees invoiced to the company and/or its group:
Yes X No
Company Group Total
Cost of work other than auditing (thousands of euro) 228 597 825
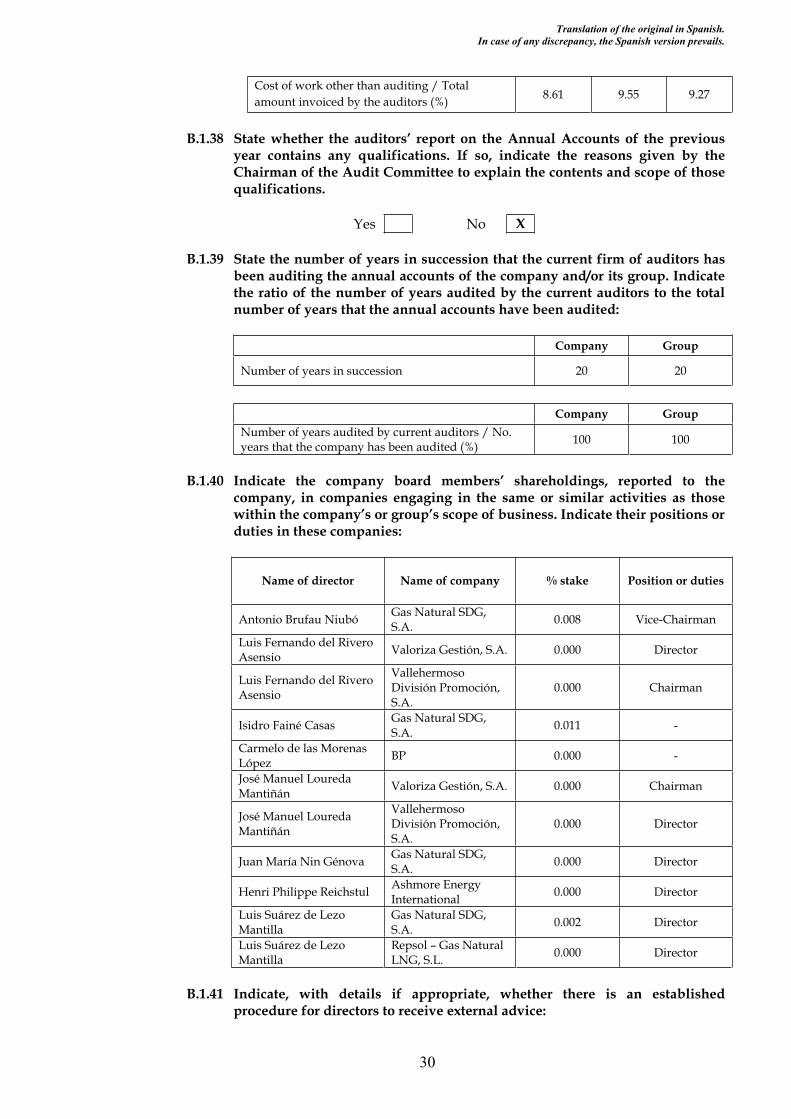
Translation of the original in Spanish. In case of any discrepancy, the Spanish version prevails.
30
Cost of work other than auditing / Total amount invoiced by the auditors (%) 8.61 9.55 9.27
B.1.38 State whether the auditors’ report on the Annual Accounts of the previous year contains any qualifications. If so, indicate the reasons given by the Chairman of the Audit Committee to explain the contents and scope of those qualifications.
Yes No X
B.1.39 State the number of years in succession that the current firm of auditors has been auditing the annual accounts of the company and/or its group. Indicate the ratio of the number of years audited by the current auditors to the total number of years that the annual accounts have been audited:
Company Group
Number of years in succession 20 20
Company Group Number of years audited by current auditors / No. years that the company has been audited (%) 100 100
B.1.40 Indicate the company board members’ shareholdings, reported to the company, in companies engaging in the same or similar activities as those within the company’s or group’s scope of business. Indicate their positions or duties in these companies:
Name of director Name of company % stake Position or duties
Antonio Brufau Niubó Gas Natural SDG, S.A. 0.008 Vice-Chairman
Luis Fernando del Rivero Asensio Valoriza Gestión, S.A. 0.000 Director
Luis Fernando del Rivero Asensio
VallehermosoDivisión Promoción, S.A.
0.000 Chairman
Isidro Fainé Casas Gas Natural SDG, S.A. 0.011 -
Carmelo de las Morenas López BP 0.000 -
José Manuel Loureda Mantiñán Valoriza Gestión, S.A. 0.000 Chairman
José Manuel Loureda Mantiñán
VallehermosoDivisión Promoción, S.A.
0.000 Director
Juan María Nin Génova Gas Natural SDG, S.A. 0.000 Director
Henri Philippe Reichstul Ashmore Energy International 0.000 Director
Luis Suárez de Lezo Mantilla
Gas Natural SDG, S.A. 0.002 Director
Luis Suárez de Lezo Mantilla
Repsol – Gas Natural LNG, S.L. 0.000 Director
B.1.41 Indicate, with details if appropriate, whether there is an established procedure for directors to receive external advice:
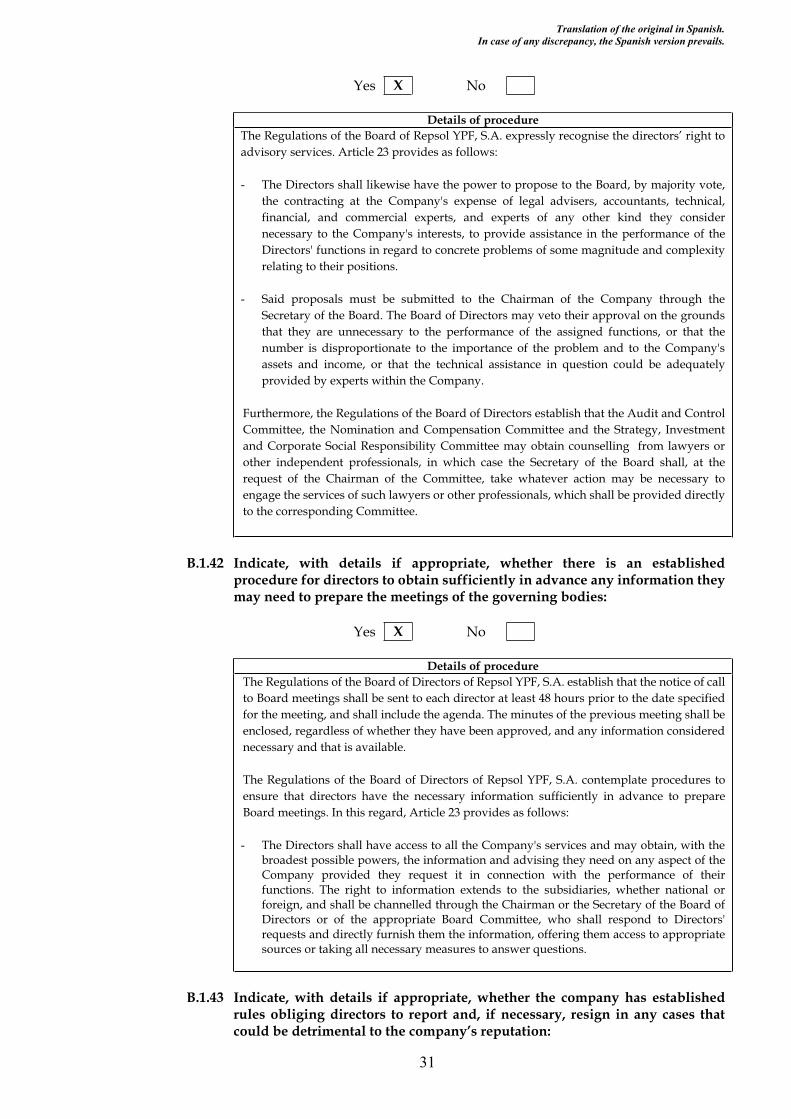
Translation of the original in Spanish. In case of any discrepancy, the Spanish version prevails.
31
Yes X No
Details of procedure The Regulations of the Board of Repsol YPF, S.A. expressly recognise the directors’ right to advisory services. Article 23 provides as follows:
- The Directors shall likewise have the power to propose to the Board, by majority vote, the contracting at the Company's expense of legal advisers, accountants, technical, financial, and commercial experts, and experts of any other kind they consider necessary to the Company's interests, to provide assistance in the performance of the Directors' functions in regard to concrete problems of some magnitude and complexity relating to their positions.
- Said proposals must be submitted to the Chairman of the Company through the Secretary of the Board. The Board of Directors may veto their approval on the grounds that they are unnecessary to the performance of the assigned functions, or that the number is disproportionate to the importance of the problem and to the Company's assets and income, or that the technical assistance in question could be adequately provided by experts within the Company.
Furthermore, the Regulations of the Board of Directors establish that the Audit and Control Committee, the Nomination and Compensation Committee and the Strategy, Investment and Corporate Social Responsibility Committee may obtain counselling from lawyers or other independent professionals, in which case the Secretary of the Board shall, at the request of the Chairman of the Committee, take whatever action may be necessary to engage the services of such lawyers or other professionals, which shall be provided directly to the corresponding Committee.
B.1.42 Indicate, with details if appropriate, whether there is an established procedure for directors to obtain sufficiently in advance any information they may need to prepare the meetings of the governing bodies:
Yes X No
Details of procedure The Regulations of the Board of Directors of Repsol YPF, S.A. establish that the notice of call to Board meetings shall be sent to each director at least 48 hours prior to the date specified for the meeting, and shall include the agenda. The minutes of the previous meeting shall be enclosed, regardless of whether they have been approved, and any information considered necessary and that is available.
The Regulations of the Board of Directors of Repsol YPF, S.A. contemplate procedures to ensure that directors have the necessary information sufficiently in advance to prepare Board meetings. In this regard, Article 23 provides as follows:
- The Directors shall have access to all the Company's services and may obtain, with the broadest possible powers, the information and advising they need on any aspect of the Company provided they request it in connection with the performance of their functions. The right to information extends to the subsidiaries, whether national or foreign, and shall be channelled through the Chairman or the Secretary of the Board of Directors or of the appropriate Board Committee, who shall respond to Directors' requests and directly furnish them the information, offering them access to appropriate sources or taking all necessary measures to answer questions.
B.1.43 Indicate, with details if appropriate, whether the company has established rules obliging directors to report and, if necessary, resign in any cases that could be detrimental to the company’s reputation:
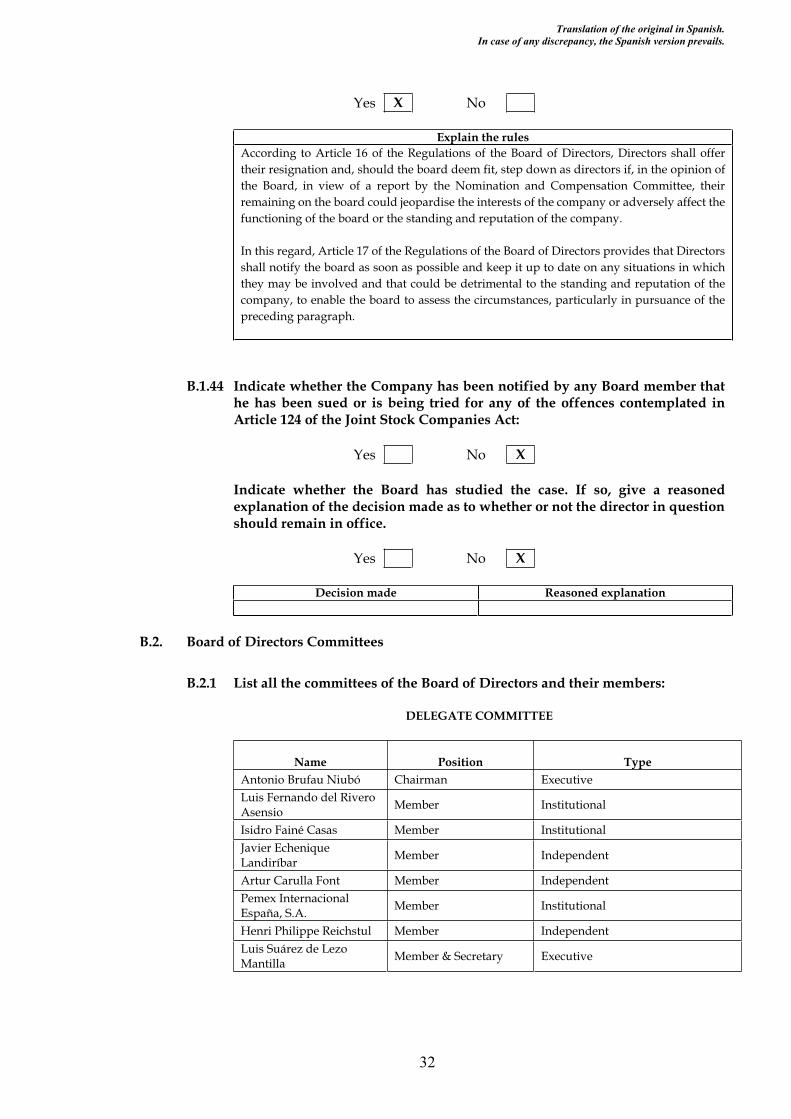
Translation of the original in Spanish. In case of any discrepancy, the Spanish version prevails.
32
Yes X No
Explain the rules According to Article 16 of the Regulations of the Board of Directors, Directors shall offer their resignation and, should the board deem fit, step down as directors if, in the opinion of the Board, in view of a report by the Nomination and Compensation Committee, their remaining on the board could jeopardise the interests of the company or adversely affect the functioning of the board or the standing and reputation of the company.
In this regard, Article 17 of the Regulations of the Board of Directors provides that Directors shall notify the board as soon as possible and keep it up to date on any situations in which they may be involved and that could be detrimental to the standing and reputation of the company, to enable the board to assess the circumstances, particularly in pursuance of the preceding paragraph.
B.1.44 Indicate whether the Company has been notified by any Board member that he has been sued or is being tried for any of the offences contemplated in Article 124 of the Joint Stock Companies Act:
Yes No X
Indicate whether the Board has studied the case. If so, give a reasoned explanation of the decision made as to whether or not the director in question should remain in office.
Yes No X
Decision made Reasoned explanation
B.2. Board of Directors Committees
B.2.1 List all the committees of the Board of Directors and their members:
DELEGATE COMMITTEE
Name Position TypeAntonio Brufau Niubó Chairman Executive Luis Fernando del Rivero Asensio Member Institutional
Isidro Fainé Casas Member Institutional Javier Echenique Landiríbar Member Independent
Artur Carulla Font Member IndependentPemex Internacional España, S.A. Member Institutional
Henri Philippe Reichstul Member IndependentLuis Suárez de Lezo Mantilla Member & Secretary Executive
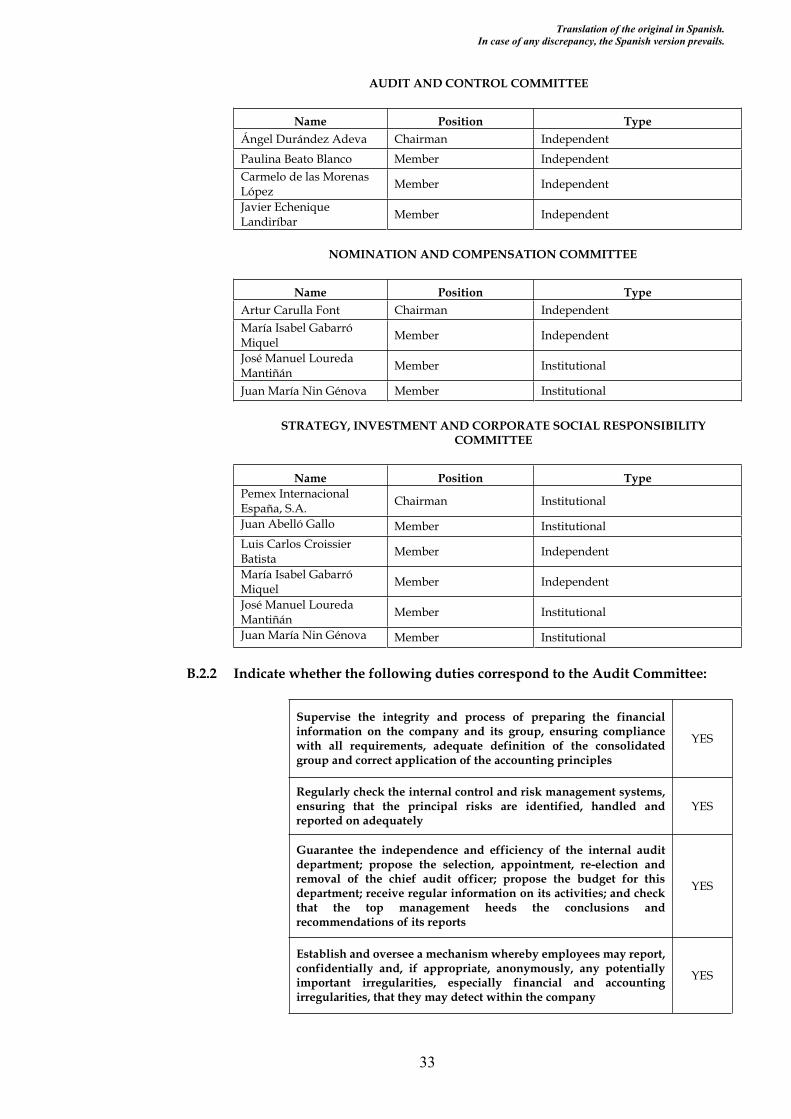
Translation of the original in Spanish. In case of any discrepancy, the Spanish version prevails.
33
AUDIT AND CONTROL COMMITTEE
Name Position TypeÁngel Durández Adeva Chairman IndependentPaulina Beato Blanco Member IndependentCarmelo de las Morenas López Member Independent
Javier Echenique Landiríbar Member Independent
NOMINATION AND COMPENSATION COMMITTEE
Name Position TypeArtur Carulla Font Chairman IndependentMaría Isabel Gabarró Miquel Member Independent
José Manuel Loureda Mantiñán Member Institutional
Juan María Nin Génova Member Institutional
STRATEGY, INVESTMENT AND CORPORATE SOCIAL RESPONSIBILITY COMMITTEE
Name Position TypePemex Internacional España, S.A. Chairman Institutional
Juan Abelló Gallo Member Institutional Luis Carlos Croissier Batista Member Independent
María Isabel Gabarró Miquel Member Independent
José Manuel Loureda Mantiñán Member Institutional
Juan María Nin Génova Member Institutional
B.2.2 Indicate whether the following duties correspond to the Audit Committee:
Supervise the integrity and process of preparing the financial information on the company and its group, ensuring compliance with all requirements, adequate definition of the consolidated group and correct application of the accounting principles
YES
Regularly check the internal control and risk management systems, ensuring that the principal risks are identified, handled and reported on adequately
YES
Guarantee the independence and efficiency of the internal audit department; propose the selection, appointment, re-election and removal of the chief audit officer; propose the budget for this department; receive regular information on its activities; and check that the top management heeds the conclusions and recommendations of its reports
YES
Establish and oversee a mechanism whereby employees may report, confidentially and, if appropriate, anonymously, any potentially important irregularities, especially financial and accounting irregularities, that they may detect within the company
YES
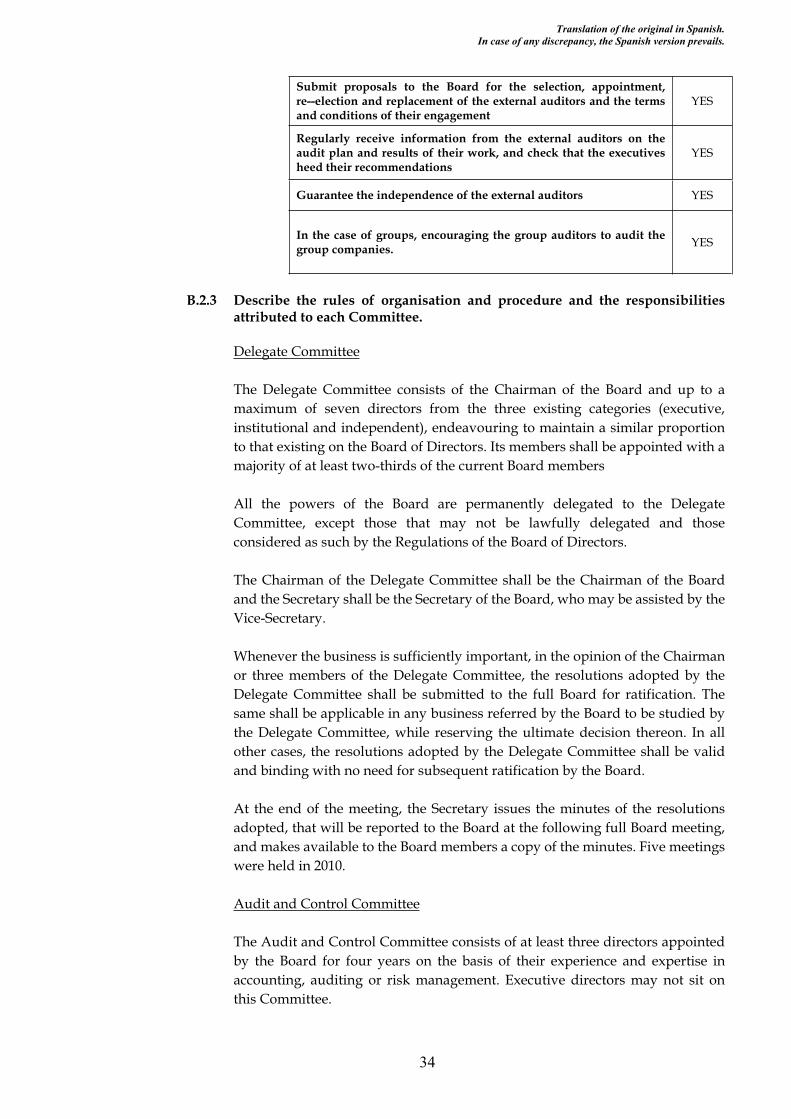
Translation of the original in Spanish. In case of any discrepancy, the Spanish version prevails.
34
Submit proposals to the Board for the selection, appointment, re--election and replacement of the external auditors and the terms and conditions of their engagement
YES
Regularly receive information from the external auditors on the audit plan and results of their work, and check that the executives heed their recommendations
YES
Guarantee the independence of the external auditors YES
In the case of groups, encouraging the group auditors to audit the group companies. YES
B.2.3 Describe the rules of organisation and procedure and the responsibilities attributed to each Committee.
Delegate Committee
The Delegate Committee consists of the Chairman of the Board and up to a maximum of seven directors from the three existing categories (executive, institutional and independent), endeavouring to maintain a similar proportion to that existing on the Board of Directors. Its members shall be appointed with a majority of at least two-thirds of the current Board members
All the powers of the Board are permanently delegated to the Delegate Committee, except those that may not be lawfully delegated and those considered as such by the Regulations of the Board of Directors.
The Chairman of the Delegate Committee shall be the Chairman of the Board and the Secretary shall be the Secretary of the Board, who may be assisted by the Vice-Secretary.
Whenever the business is sufficiently important, in the opinion of the Chairman or three members of the Delegate Committee, the resolutions adopted by the Delegate Committee shall be submitted to the full Board for ratification. The same shall be applicable in any business referred by the Board to be studied by the Delegate Committee, while reserving the ultimate decision thereon. In all other cases, the resolutions adopted by the Delegate Committee shall be valid and binding with no need for subsequent ratification by the Board.
At the end of the meeting, the Secretary issues the minutes of the resolutions adopted, that will be reported to the Board at the following full Board meeting, and makes available to the Board members a copy of the minutes. Five meetings were held in 2010.
Audit and Control Committee
The Audit and Control Committee consists of at least three directors appointed by the Board for four years on the basis of their experience and expertise in accounting, auditing or risk management. Executive directors may not sit on this Committee.
Translation of the original in Spanish. In case of any discrepancy, the Spanish version prevails.
35
This Committee, set up on 27 February 1995, supports the Board in its supervisory duties, through regular checking of the preparation of economic and financial reporting, executive controls, supervision of the systems for recording and controlling the company’s hydrocarbon reserves, the internal audit department and the independence of the external auditors, as well as checking compliance with all the legal provisions and internal regulations applicable to the company. This Committee is competent to submit proposals to the Board regarding the appointment of external auditors, extension of their appointment, their removal and the terms of their engagement. It shall also inform the General Meeting, through its Chairman, on any issues raised by shareholders regarding matters within its competence.
Its duties shall also include knowing and guiding the company’s environmental and safety policies and objectives and drawing up an Annual Report on its activities, on which it shall report to the Board.
The Committee shall appoint one of its members to be Chairman, who shall necessarily be an Independent Outside Director; the Secretary shall be the Secretary of the Board.
The Committee shall meet as often as necessary, in the opinion of the Chairman, to perform the duties commissioned to it, although an annual calendar of meetings shall be drawn up before the end of each year for the following year, as well as an Action Plan for each year, informing the Board accordingly. Meetings shall be called whenever so requested by any two of its members. Nine meetings were held in 2010.
The Chairman of the Committee shall regularly report to the Board on the actions taken by the Committee.
At least once a year, the Committee shall assess its functioning and the quality and efficiency of its work, reporting to the full Board.
The Secretary of the Committee shall issue minutes of the resolutions adopted at each meeting, which shall be made available to Board members.
Nomination and Compensation Committee
This Committee consists of no fewer than three directors appointed by the board for four years, taking account of the expertise, skills and experience of the directors and the duties of the committee.
This Committee, which was set up on 27 February 1995, has the duties of proposing and reporting to the Board on the selection, appointment, re-election and removal of Directors, Managing Director, Chairman, Vice-Chairman, Secretary, Vice-Secretary and the Directors who are to sit on the different Committees of the Board; proposing the Board compensation policy and, in the case of Executive Directors, the additional consideration for their management duties and other contract conditions; reporting on the appointment of Senior Executives of the Company and their general pay policy and incentives; reporting on the compliance by Directors of the corporate governance principles
Translation of the original in Spanish. In case of any discrepancy, the Spanish version prevails.
36
or the obligations established in the Articles of Association or the Regulations of the Board; and, in general, proposing and informing on any other business related with the above at the request of the Chairman or the Board of Directors.
The Chairman of this Committee shall be one of its members, who shall necessarily be an Independent Outside Director, and the Secretary shall be the Secretary of the Board.
The Committee shall meet whenever the Board or Chairman of the Board requests reports or proposals within the scope of its duties, and whenever called by the Chairman of the Committee, requested by two Committee members or when reports are required to be able to adopt the corresponding resolutions. Three meetings were held in 2010.
The Chairman of the Committee shall regularly report to the Board on the actions taken by the Committee.
At least once a year, the Committee shall assess its functioning and the quality and efficiency of its work, reporting to the full Board.
The Secretary of the Committee shall issue minutes of the resolutions adopted at each meeting, which shall be made available to Board members.
Strategy, Investment and Corporate Social Responsibility Committee
On December 2007, the Board of Directors of Repsol YPF, S.A. resolved, within the modification of its Regulations, to change the name of the Strategy, Investment and Competition Committee, set up on 25 September 2002, to Strategy, Investment and Corporate Social Responsibility Committee.
The strategy, investment and corporate social responsibility committee consists of no fewer than three directors appointed by the board, taking account of the expertise, skills and experience of the directors and the duties of the committee. The members of this Committee shall retire four years after their appointment.
This Committee has the duties of reporting on the principal highlights, landmarks and reviews of the group’s strategic plan; major strategic decisions for the Repsol YPF Group; and investments or divestments in assets which, by virtue of their value or strategic nature, the Executive Chairman believes should be first considered by the Committee.
It must also be familiar with and steer the policy, objectives and guidelines of the Repsol YPF Group on Corporate Social Responsibility and inform the Board thereon; check and report on the Corporate Responsibility Report of the Repsol YPF Group before it is submitted to the Board; and, in general, perform any other duties related with the matters within its competence and requested by the Board or its Chairman.
One of the members of this Committee shall be appointed Chairman and the secretary shall be the Secretary of the Board.
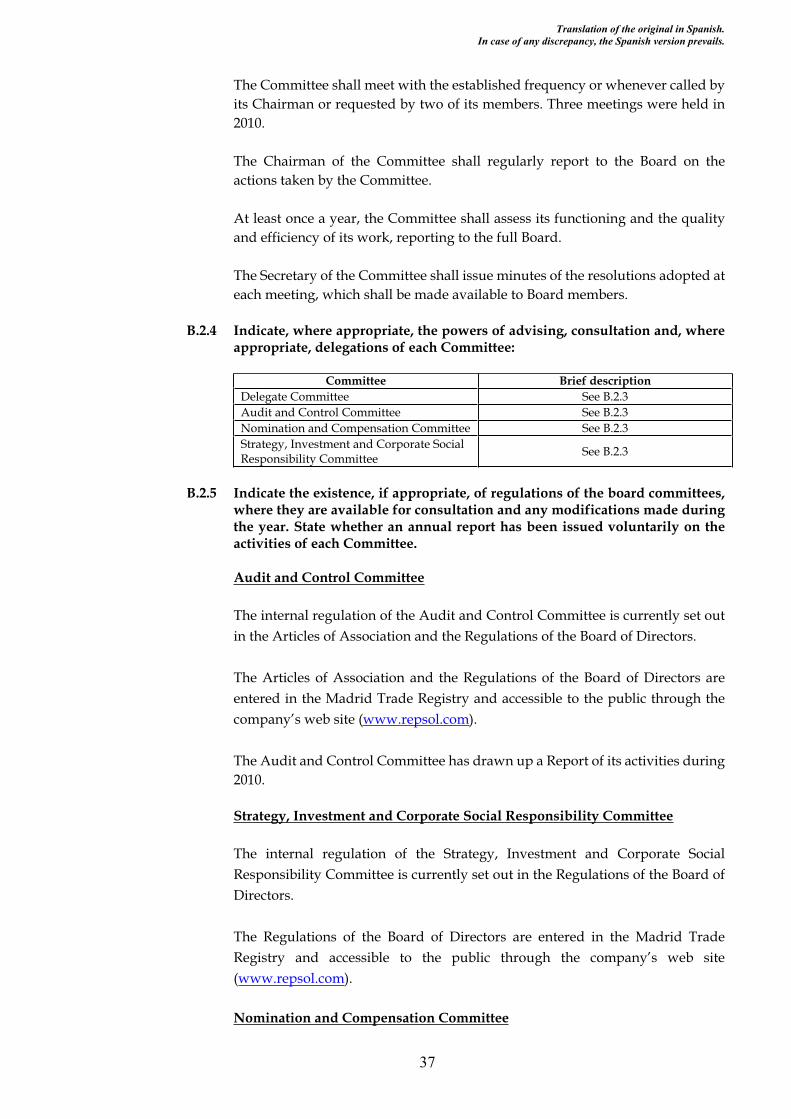
Translation of the original in Spanish. In case of any discrepancy, the Spanish version prevails.
37
The Committee shall meet with the established frequency or whenever called by its Chairman or requested by two of its members. Three meetings were held in 2010.
The Chairman of the Committee shall regularly report to the Board on the actions taken by the Committee.
At least once a year, the Committee shall assess its functioning and the quality and efficiency of its work, reporting to the full Board.
The Secretary of the Committee shall issue minutes of the resolutions adopted at each meeting, which shall be made available to Board members.
B.2.4 Indicate, where appropriate, the powers of advising, consultation and, where appropriate, delegations of each Committee:
Committee Brief description Delegate Committee See B.2.3 Audit and Control Committee See B.2.3 Nomination and Compensation Committee See B.2.3 Strategy, Investment and Corporate Social Responsibility Committee See B.2.3
B.2.5 Indicate the existence, if appropriate, of regulations of the board committees, where they are available for consultation and any modifications made during the year. State whether an annual report has been issued voluntarily on the activities of each Committee.
Audit and Control Committee
The internal regulation of the Audit and Control Committee is currently set out in the Articles of Association and the Regulations of the Board of Directors.
The Articles of Association and the Regulations of the Board of Directors are entered in the Madrid Trade Registry and accessible to the public through the company’s web site (www.repsol.com).
The Audit and Control Committee has drawn up a Report of its activities during 2010.
Strategy, Investment and Corporate Social Responsibility Committee
The internal regulation of the Strategy, Investment and Corporate Social Responsibility Committee is currently set out in the Regulations of the Board of Directors.
The Regulations of the Board of Directors are entered in the Madrid Trade Registry and accessible to the public through the company’s web site (www.repsol.com).
Nomination and Compensation Committee
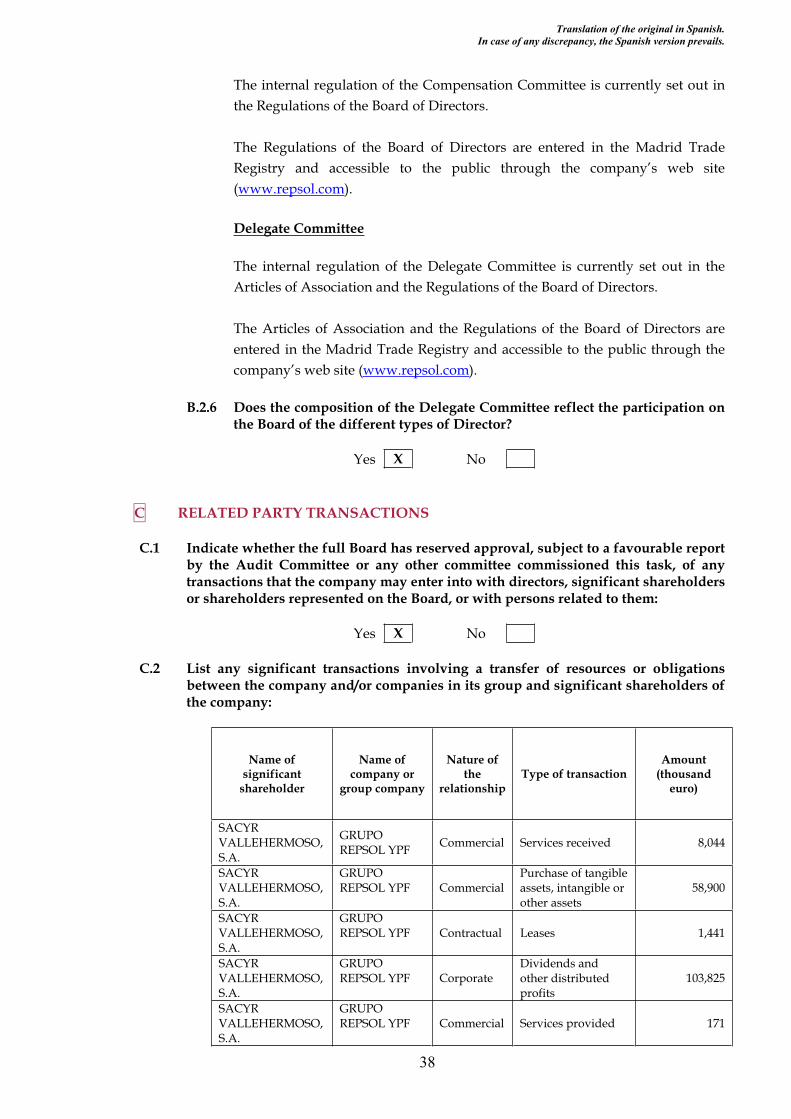
Translation of the original in Spanish. In case of any discrepancy, the Spanish version prevails.
38
The internal regulation of the Compensation Committee is currently set out in the Regulations of the Board of Directors.
The Regulations of the Board of Directors are entered in the Madrid Trade Registry and accessible to the public through the company’s web site (www.repsol.com).
Delegate Committee
The internal regulation of the Delegate Committee is currently set out in the Articles of Association and the Regulations of the Board of Directors.
The Articles of Association and the Regulations of the Board of Directors are entered in the Madrid Trade Registry and accessible to the public through the company’s web site (www.repsol.com).
B.2.6 Does the composition of the Delegate Committee reflect the participation on the Board of the different types of Director?
Yes X No
C RELATED PARTY TRANSACTIONS
C.1 Indicate whether the full Board has reserved approval, subject to a favourable report by the Audit Committee or any other committee commissioned this task, of any transactions that the company may enter into with directors, significant shareholders or shareholders represented on the Board, or with persons related to them:
Yes X No
C.2 List any significant transactions involving a transfer of resources or obligations between the company and/or companies in its group and significant shareholders of the company:
Name of significant
shareholder
Name of company or
group company
Nature of the
relationshipType of transaction
Amount (thousand
euro)
SACYRVALLEHERMOSO, S.A.
GRUPO REPSOL YPF Commercial Services received 8,044
SACYRVALLEHERMOSO, S.A.
GRUPO REPSOL YPF Commercial
Purchase of tangible assets, intangible or other assets
58,900
SACYRVALLEHERMOSO, S.A.
GRUPO REPSOL YPF Contractual Leases 1,441
SACYRVALLEHERMOSO, S.A.
GRUPO REPSOL YPF Corporate
Dividends and other distributed profits
103,825
SACYRVALLEHERMOSO, S.A.
GRUPO REPSOL YPF Commercial Services provided 171
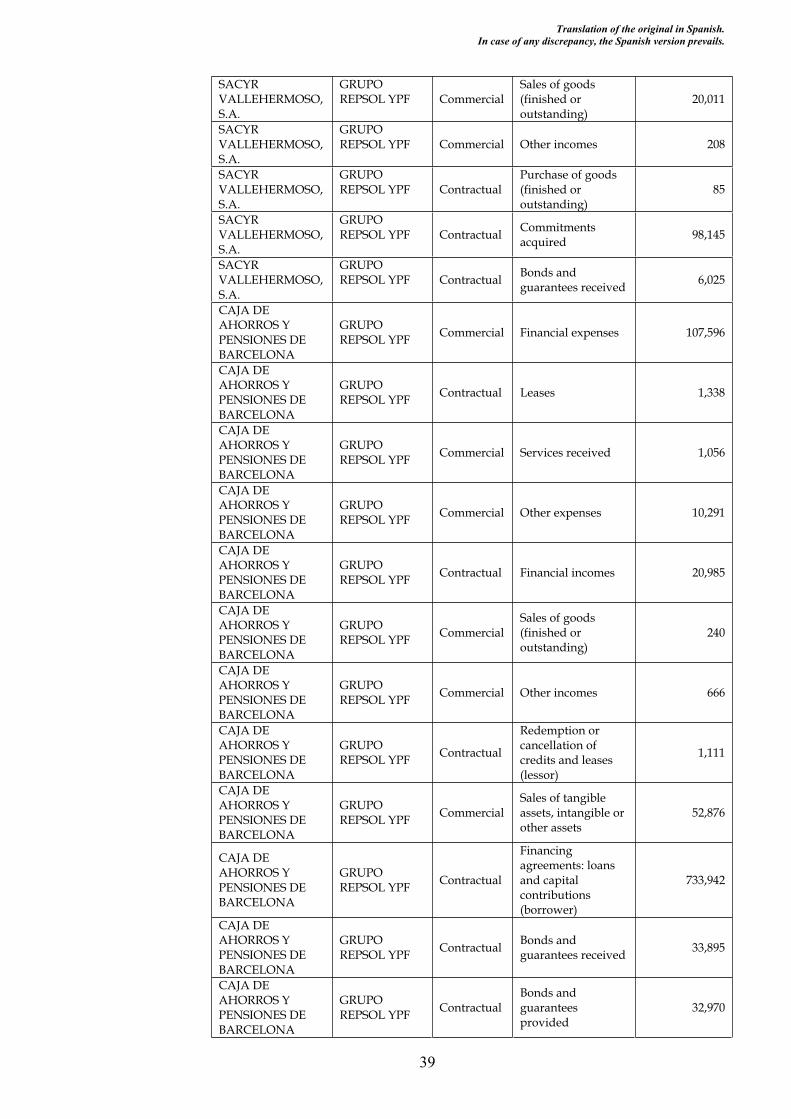
Translation of the original in Spanish. In case of any discrepancy, the Spanish version prevails.
39
SACYRVALLEHERMOSO, S.A.
GRUPO REPSOL YPF Commercial
Sales of goods (finished or outstanding)
20,011
SACYRVALLEHERMOSO, S.A.
GRUPO REPSOL YPF Commercial Other incomes 208
SACYRVALLEHERMOSO, S.A.
GRUPO REPSOL YPF Contractual
Purchase of goods (finished or outstanding)
85
SACYRVALLEHERMOSO, S.A.
GRUPO REPSOL YPF Contractual Commitments
acquired 98,145
SACYRVALLEHERMOSO, S.A.
GRUPO REPSOL YPF Contractual Bonds and
guarantees received 6,025
CAJA DE AHORROS Y PENSIONES DE BARCELONA
GRUPO REPSOL YPF Commercial Financial expenses 107,596
CAJA DE AHORROS Y PENSIONES DE BARCELONA
GRUPO REPSOL YPF Contractual Leases 1,338
CAJA DE AHORROS Y PENSIONES DE BARCELONA
GRUPO REPSOL YPF Commercial Services received 1,056
CAJA DE AHORROS Y PENSIONES DE BARCELONA
GRUPO REPSOL YPF Commercial Other expenses 10,291
CAJA DE AHORROS Y PENSIONES DE BARCELONA
GRUPO REPSOL YPF Contractual Financial incomes 20,985
CAJA DE AHORROS Y PENSIONES DE BARCELONA
GRUPO REPSOL YPF Commercial
Sales of goods (finished or outstanding)
240
CAJA DE AHORROS Y PENSIONES DE BARCELONA
GRUPO REPSOL YPF Commercial Other incomes 666
CAJA DE AHORROS Y PENSIONES DE BARCELONA
GRUPO REPSOL YPF Contractual
Redemption or cancellation of credits and leases (lessor)
1,111
CAJA DE AHORROS Y PENSIONES DE BARCELONA
GRUPO REPSOL YPF Commercial
Sales of tangible assets, intangible or other assets
52,876
CAJA DE AHORROS Y PENSIONES DE BARCELONA
GRUPO REPSOL YPF Contractual
Financingagreements: loans and capital contributions (borrower)
733,942
CAJA DE AHORROS Y PENSIONES DE BARCELONA
GRUPO REPSOL YPF Contractual Bonds and
guarantees received 33,895
CAJA DE AHORROS Y PENSIONES DE BARCELONA
GRUPO REPSOL YPF Contractual
Bonds and guaranteesprovided
32,970
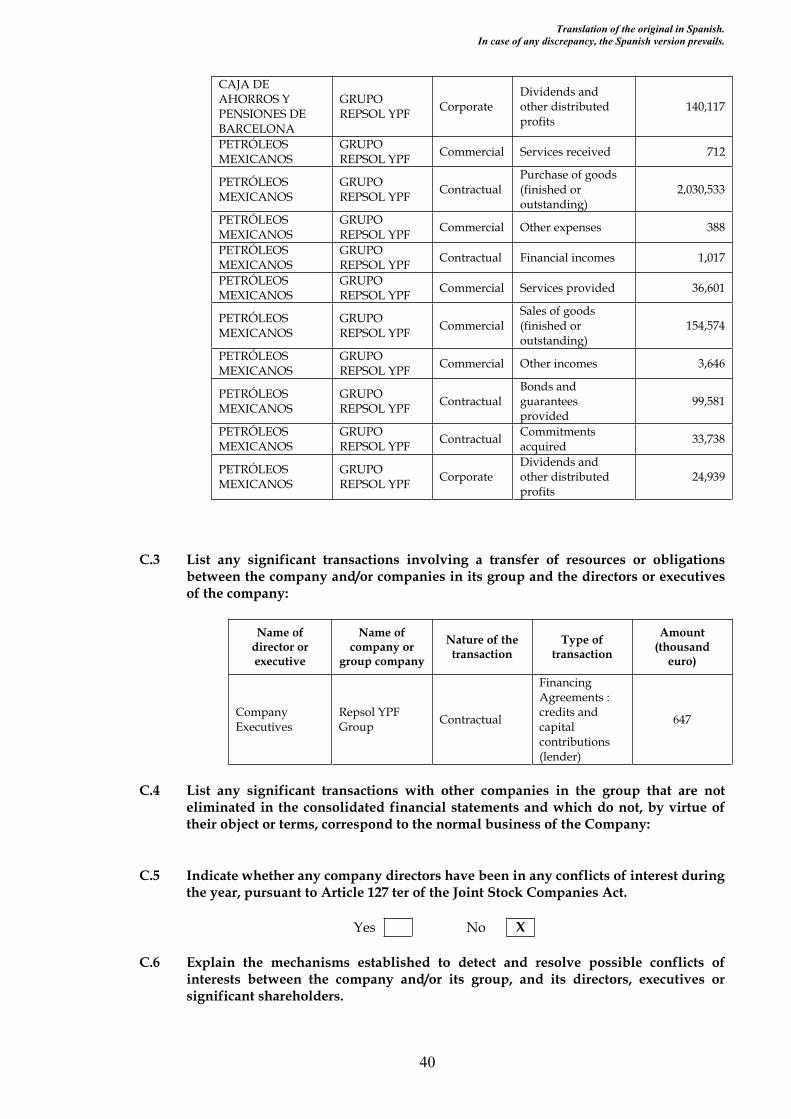
Translation of the original in Spanish. In case of any discrepancy, the Spanish version prevails.
40
CAJA DE AHORROS Y PENSIONES DE BARCELONA
GRUPO REPSOL YPF Corporate
Dividends and other distributed profits
140,117
PETRÓLEOSMEXICANOS
GRUPO REPSOL YPF Commercial Services received 712
PETRÓLEOSMEXICANOS
GRUPO REPSOL YPF Contractual
Purchase of goods (finished or outstanding)
2,030,533
PETRÓLEOSMEXICANOS
GRUPO REPSOL YPF Commercial Other expenses 388
PETRÓLEOSMEXICANOS
GRUPO REPSOL YPF Contractual Financial incomes 1,017
PETRÓLEOSMEXICANOS
GRUPO REPSOL YPF Commercial Services provided 36,601
PETRÓLEOSMEXICANOS
GRUPO REPSOL YPF Commercial
Sales of goods (finished or outstanding)
154,574
PETRÓLEOSMEXICANOS
GRUPO REPSOL YPF Commercial Other incomes 3,646
PETRÓLEOSMEXICANOS
GRUPO REPSOL YPF Contractual
Bonds and guaranteesprovided
99,581
PETRÓLEOSMEXICANOS
GRUPO REPSOL YPF Contractual Commitments
acquired 33,738
PETRÓLEOSMEXICANOS
GRUPO REPSOL YPF Corporate
Dividends and other distributed profits
24,939
C.3 List any significant transactions involving a transfer of resources or obligations between the company and/or companies in its group and the directors or executives of the company:
Name of director or executive
Name of company or
group company
Nature of the transaction
Type of transaction
Amount (thousand
euro)
Company Executives
Repsol YPF Group Contractual
FinancingAgreements : credits and capital contributions (lender)
647
C.4 List any significant transactions with other companies in the group that are not eliminated in the consolidated financial statements and which do not, by virtue of their object or terms, correspond to the normal business of the Company:
C.5 Indicate whether any company directors have been in any conflicts of interest during the year, pursuant to Article 127 ter of the Joint Stock Companies Act.
Yes No X
C.6 Explain the mechanisms established to detect and resolve possible conflicts of interests between the company and/or its group, and its directors, executives or significant shareholders.
Translation of the original in Spanish. In case of any discrepancy, the Spanish version prevails.
41
The Regulations of the Board of Directors require directors to avoid any direct or indirect conflicts of interest with the Company’s interests, notifying the Board whenever any such conflicts inevitably exist. In the event of a conflict, the director affected shall abstain in the discussion and decision dealing with the issues giving rise to the conflict.
Any directors affected by proposals for appointment, re-election or removal shall abstain in the discussions and votings dealing with those matters. Ballots shall be secret.
Directors shall inform the Nomination and Compensation Committee of any other professional obligations they may have and any material change in their professional situation, as well as any affecting the nature or condition by virtue of which they have been appointed Director.
Finally, directors shall tender their resignations and step down from the Board, should the latter deem fit, whenever they incur in any of the events of incompatibility or disqualification established in law, the Articles of Association or Regulations.
In this regard, Articles 19-22 of the Regulations of the Board of Directors set out the obligations to be met by Directors in respect of non-competition, use of corporate information and assets and taking advantage of business opportunities, and the requirements established in respect of related party transactions between the Company and the Directors, significant shareholders represented on the Board or persons related to them.
Similarly, the Repsol YPF Group Internal Conduct Regulations regarding the Securities Market, applicable to directors, top management and the executives of certain departments and divisions with access to privileged information of the company or its group and who carry out tasks related with the Securities Market, contemplate the preclusion and solving of conflicts of interest in Articles 8.3. and 8.4., as follows:
"To control potential conflicts of interest, the executives and employees of Repsol YPF Group must inform the person responsible for their respective Area, sufficiently in advance for timely decisions to be made and before conducting the transaction or concluding the business in question, of any situation which may potentially involve, and in each concrete circumstance that actually involves, the appearance of a conflict of interest with Repsol YPF, S.A. or any company of its Group.
If the person affected is a member of the Board of Directors, the conflict must be reported to the Board of Directors, which, if it considers fit, will apply for the opinion of the Audit and Control Committee.
In case of a doubt about the existence of a conflict of interest, the executives and employees of Repsol YPF Group must act prudently and inform the person responsible for their respective Area or the Board of Directors, as the case may be, about the specific circumstances of the case, for the appropriate consideration of the situation by the latter.
The general principle to be considered in the resolution of all kind of conflicts of interest is abstention. Therefore, persons subject to conflicts of interest must refrain from making decisions that could affect the individuals or legal entities with which said conflict is posed. They must likewise refrain from exerting any influence on said decision-making and must act with full
Translation of the original in Spanish. In case of any discrepancy, the Spanish version prevails.
42
loyalty to the Repsol YPF Group in all cases. In any situation of conflict of interest between the executives and employees of Repsol YPF Group and Repsol YPF or any company within the Group, the former must act in all moments with loyalty to the Repsol YPF Group, giving preference to the interest of the Repsol YPF Group over its own interests."
Finally, the Ethics and Conduct Regulation for Repsol YPF Employees stipulates in Article 6.4., with regard to executives, that “Repsol YPF recognizes and respects the financial and business activities of its employees that are not directly related to the activities carried out for the Company provided that these are legal and do not represent a conflict of interests with their responsibilities as Repsol YPF employees.
Repsol YPF employees should avoid any situation that could give rise to any conflict between their personal interests and those of the Company and will abstain from representing the Company, taking part in or influencing decisions in any situation in which, the employee or any close relative has a personal interest. Employees should always act in accordance with their responsibilities, loyally and defending the interests of Repsol YPF.
Furthermore, employees may not undertake any tasks, jobs, or render any services in the benefit of companies in the sector or those that engage in activities that may, directly or indirectly, compete, or could compete, with those of Repsol YPF.
Repsol YPF employees, who could be affected by a conflict of interests, will inform the head of their Area before undertaking any transaction or closing any business deal, in order to make the appropriate decisions in each specific case thereby avoiding compromising their impartial job performance.”
C.7 Are more than one of the Group companies listed in Spain?
Yes No X
Name the subsidiaries listed in Spain:
D RISK CONTROL SYSTEMS
D.1 General description of the risk policy of the company and/or its group, including details and assessment of the risks covered by the system, together with justification that those systems adapt to the profile of each type of risk.
Repsol YPF operates in numerous countries, under numerous regulatory frameworks and in all areas of the oil and gas business. Consequently, Repsol YPF is exposed to:
- market risks, deriving from the price volatility of oil, natural gas and by-products, exchange rates and interest rates,
- counterparty risks, deriving from financial arrangements and commercial commitments with suppliers and clients,
- liquidity and solvency risks,
- legal and regulatory risks (including risks of changes in the tax regimes, sectorial and environmental regulations, exchange legislation, production constraints, limits on exports, etc.),
Translation of the original in Spanish. In case of any discrepancy, the Spanish version prevails.
43
- operating risks (including the risks of accidents and natural catastrophes, uncertainty regarding the geological characteristics of oil and gas fields, safety and environmental risks and reputation risks, such as those relating to corporate ethics and the social impact of Repsol YPF’s business),
- economic environment risks (including those resulting from international and local business cycles, technological innovations in the industries in which Repsol YPF operates, etc.).
The company considers the most important risks to be those that could hamper it in achieving the goals established in its Strategic Plan, particularly the goal of maintaining its financial flexibility and long-term solvency. Repsol YPF manages its assets and businesses prudently. Nevertheless, many of the risks mentioned above are inherent in the activities it performs, are beyond the control of the company and cannot be entirely eliminated.
Repsol YPF has an organisation, procedures and systems that enable it to identify measure, assess, prioritize and control the risks to which the group is exposed, and decide to what extent those risks are to be assumed, managed, reduced or avoided. Risk analysis is an integral element in the group’s decision-making processes, both in the centralised governing bodies and in the management of the different businesses, paying special attention in all cases to the existence of several risks at the same time or the effects of diversification that may occur on an aggregate level.
The following independent analysis, supervision and control units specialise in different areas of risk management exist:
* Internal Audit Unit, focusing on the permanent assessment and improvement of existing controls to ensure that potential risks of whatsoever nature (control, business, reputation, etc...) that could hamper achievement of the strategic goals of the Repsol YPF Group are identified, measured and controlled at all times.
* Credit Risk Management Unit, responsible for:
- monitoring and controlling the Group’s credit risk,
- coordinating the development of specific rules and regulations concerning market and credit risks of the different business units and corporate areas of the Group and establishing methods for measuring and assessing such risks according to the best practices,
- analysing and controlling the credit risk generated by the Group’s activities, establishing individual third-party credit risk limits,
- defining the criteria regarding the funding and use of provisions for insolvency, refinancing and judicial claiming of debts.
* Market Middle Office Unit, responsible for:
- calculating, monitoring, controlling and assesing at market the liquidity positions, foreign exchange and interest rate risk positions,
- measuring of the risk position and analysis of sensitivity of the result and the value of products and instruments traded for different risk factors,
Translation of the original in Spanish. In case of any discrepancy, the Spanish version prevails.
44
- developing and validation of the methodology for measuring and assessing instruments and positions according to best market practices.
* Risk Monitoring Unit, responsible for:
- coordinating the development of specific rules and regulations concerning commodities price risk of the different business units and corporate areas of the Group, and establishing methods for measuring and assessing these risks according to best practices,
- monitoring and controlling Group’s commodities price risk.
* Insurance Unit, responsible for:
- analysing and assessing any accidental risks that could affect the assets and activities of the Group,
- defining the most efficient financing policy for these risks, through an optimum combination of self-insurance and risk transfer measures,
- taking out such insurance cover as may be considered convenient in each case,
- negotiating the compensations deriving from insured accidents.
* Safety and Environment Unit, responsible for:
- defining and monitoring the company’s safety and environmental strategic policies and objectives,
- establishing the corporate rules and regulations (policy, rules, procedures, manuals and guidelines) on safety and environment throughout the company worldwide and the mechanisms required to publicise them,
- identifying and leading corporate safety and environment projects, counselling business units in their implementation and monitoring the progress,
- establishing key indicators of performance, monitoring the company’s performance in safety and environmental matters and proposing actions for improvement,
- promoting the creation of working groups and exchanging of the best practices in safety and the environment,
- coordinating safety and environmental audits and following them up.
* Corporate Responsibility Unit, within the Direction of Corporate Responsibility and Institutional Services, responsible for advising, promoting and coordinating the joint Company’s Corporate Responsibility strategy:
- Proposing corporate government elements, such as corporate regulations, manuals or guides, goals, indicators and other management tools of CR, and issuing them in a complementary manner to that provided within the Company in a general level.
- Coordinating the dialogue with Company’s stakeholders at corporate level and submitting their expectations to the Corporate Responsibility Committee.
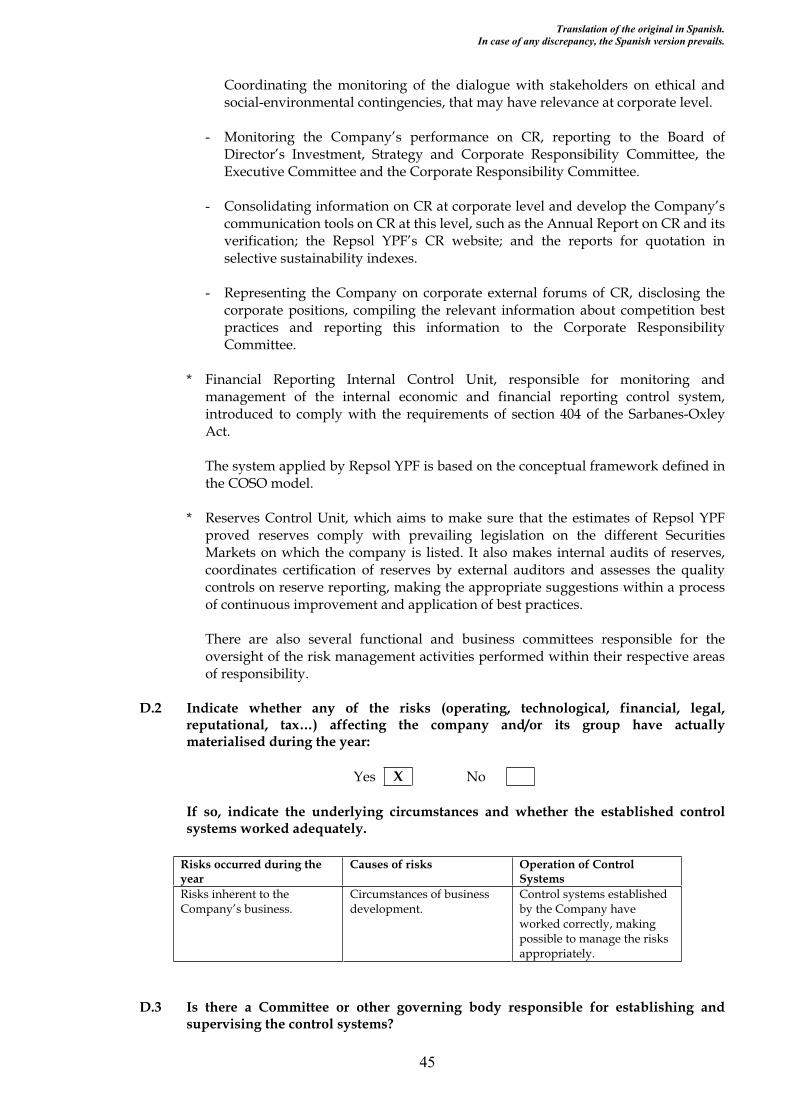
Translation of the original in Spanish. In case of any discrepancy, the Spanish version prevails.
45
Coordinating the monitoring of the dialogue with stakeholders on ethical and social-environmental contingencies, that may have relevance at corporate level.
- Monitoring the Company’s performance on CR, reporting to the Board of Director’s Investment, Strategy and Corporate Responsibility Committee, the Executive Committee and the Corporate Responsibility Committee.
- Consolidating information on CR at corporate level and develop the Company’s communication tools on CR at this level, such as the Annual Report on CR and its verification; the Repsol YPF’s CR website; and the reports for quotation in selective sustainability indexes.
- Representing the Company on corporate external forums of CR, disclosing the corporate positions, compiling the relevant information about competition best practices and reporting this information to the Corporate Responsibility Committee.
* Financial Reporting Internal Control Unit, responsible for monitoring and management of the internal economic and financial reporting control system, introduced to comply with the requirements of section 404 of the Sarbanes-Oxley Act.
The system applied by Repsol YPF is based on the conceptual framework defined in the COSO model.
* Reserves Control Unit, which aims to make sure that the estimates of Repsol YPF proved reserves comply with prevailing legislation on the different Securities Markets on which the company is listed. It also makes internal audits of reserves, coordinates certification of reserves by external auditors and assesses the quality controls on reserve reporting, making the appropriate suggestions within a process of continuous improvement and application of best practices.
There are also several functional and business committees responsible for the oversight of the risk management activities performed within their respective areas of responsibility.
D.2 Indicate whether any of the risks (operating, technological, financial, legal, reputational, tax…) affecting the company and/or its group have actually materialised during the year:
Yes X No
If so, indicate the underlying circumstances and whether the established control systems worked adequately.
Risks occurred during the year
Causes of risks Operation of Control Systems
Risks inherent to theCompany’s business.
Circumstances of business development.
Control systems established by the Company have worked correctly, making possible to manage the risks appropriately.
D.3 Is there a Committee or other governing body responsible for establishing and supervising the control systems?
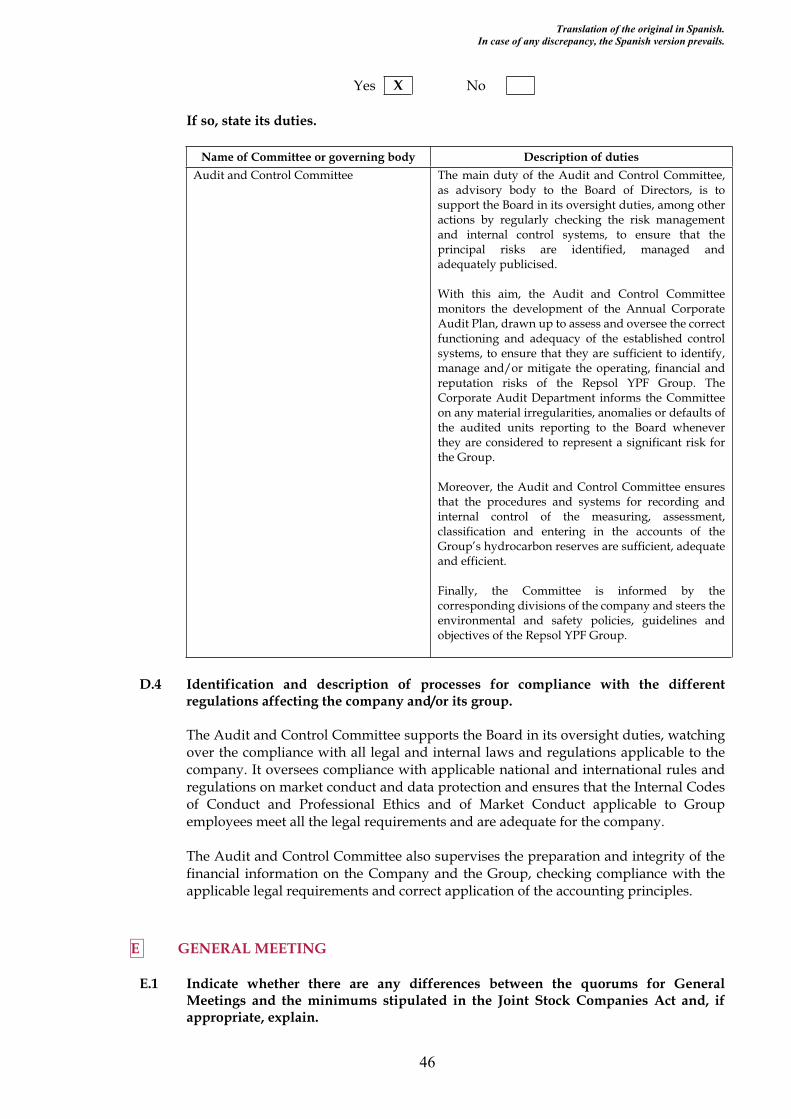
Translation of the original in Spanish. In case of any discrepancy, the Spanish version prevails.
46
Yes X No
If so, state its duties.
Name of Committee or governing body Description of duties Audit and Control Committee The main duty of the Audit and Control Committee,
as advisory body to the Board of Directors, is to support the Board in its oversight duties, among other actions by regularly checking the risk management and internal control systems, to ensure that the principal risks are identified, managed and adequately publicised.
With this aim, the Audit and Control Committee monitors the development of the Annual Corporate Audit Plan, drawn up to assess and oversee the correct functioning and adequacy of the established control systems, to ensure that they are sufficient to identify, manage and/or mitigate the operating, financial and reputation risks of the Repsol YPF Group. The Corporate Audit Department informs the Committee on any material irregularities, anomalies or defaults of the audited units reporting to the Board whenever they are considered to represent a significant risk for the Group.
Moreover, the Audit and Control Committee ensures that the procedures and systems for recording and internal control of the measuring, assessment, classification and entering in the accounts of the Group’s hydrocarbon reserves are sufficient, adequate and efficient.
Finally, the Committee is informed by the corresponding divisions of the company and steers the environmental and safety policies, guidelines and objectives of the Repsol YPF Group.
D.4 Identification and description of processes for compliance with the different regulations affecting the company and/or its group.
The Audit and Control Committee supports the Board in its oversight duties, watching over the compliance with all legal and internal laws and regulations applicable to the company. It oversees compliance with applicable national and international rules and regulations on market conduct and data protection and ensures that the Internal Codes of Conduct and Professional Ethics and of Market Conduct applicable to Group employees meet all the legal requirements and are adequate for the company.
The Audit and Control Committee also supervises the preparation and integrity of the financial information on the Company and the Group, checking compliance with the applicable legal requirements and correct application of the accounting principles.
E GENERAL MEETING
E.1 Indicate whether there are any differences between the quorums for General Meetings and the minimums stipulated in the Joint Stock Companies Act and, if appropriate, explain.
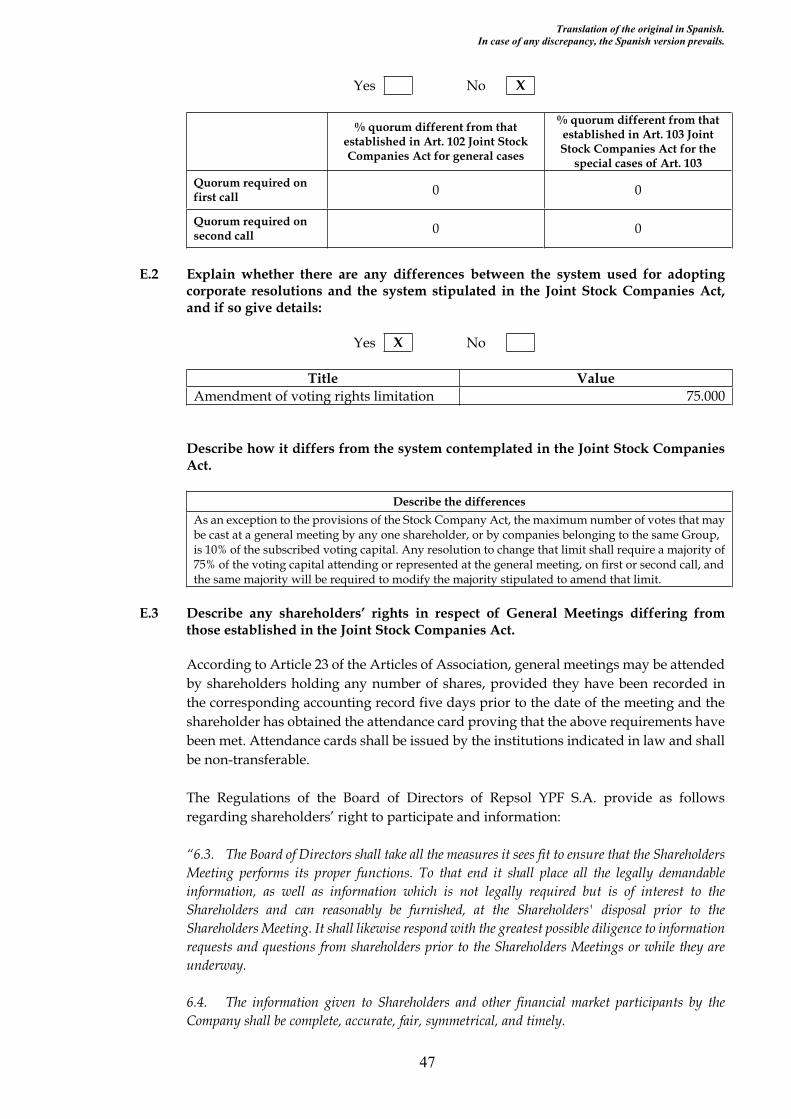
Translation of the original in Spanish. In case of any discrepancy, the Spanish version prevails.
47
Yes No X
% quorum different from that established in Art. 102 Joint Stock Companies Act for general cases
% quorum different from that established in Art. 103 Joint Stock Companies Act for the
special cases of Art. 103 Quorum required on first call 0 0
Quorum required on second call 0 0
E.2 Explain whether there are any differences between the system used for adopting corporate resolutions and the system stipulated in the Joint Stock Companies Act, and if so give details:
Yes X No
Title ValueAmendment of voting rights limitation 75.000
Describe how it differs from the system contemplated in the Joint Stock Companies Act.
Describe the differencesAs an exception to the provisions of the Stock Company Act, the maximum number of votes that may be cast at a general meeting by any one shareholder, or by companies belonging to the same Group, is 10% of the subscribed voting capital. Any resolution to change that limit shall require a majority of 75% of the voting capital attending or represented at the general meeting, on first or second call, and the same majority will be required to modify the majority stipulated to amend that limit.
E.3 Describe any shareholders’ rights in respect of General Meetings differing from those established in the Joint Stock Companies Act.
According to Article 23 of the Articles of Association, general meetings may be attended by shareholders holding any number of shares, provided they have been recorded in the corresponding accounting record five days prior to the date of the meeting and the shareholder has obtained the attendance card proving that the above requirements have been met. Attendance cards shall be issued by the institutions indicated in law and shall be non-transferable.
The Regulations of the Board of Directors of Repsol YPF S.A. provide as follows regarding shareholders’ right to participate and information:
“6.3. The Board of Directors shall take all the measures it sees fit to ensure that the Shareholders Meeting performs its proper functions. To that end it shall place all the legally demandable information, as well as information which is not legally required but is of interest to the Shareholders and can reasonably be furnished, at the Shareholders' disposal prior to the Shareholders Meeting. It shall likewise respond with the greatest possible diligence to information requests and questions from shareholders prior to the Shareholders Meetings or while they are underway.
6.4. The information given to Shareholders and other financial market participants by the Company shall be complete, accurate, fair, symmetrical, and timely.
Translation of the original in Spanish. In case of any discrepancy, the Spanish version prevails.
48
To achieve maximum transparency and immediacy in the dissemination of information, the Company shall make use of the generally available procedures and technologies to which companies and private citizens have access. To that end, the Board of Directors shall intensify the use of the Company's Web page and determine the contents to be transmitted through that medium, which shall include among other documents the Articles of Association, the Board of Directors' Regulations, the quarterly and annual reports, the notices of Shareholders Meetings, their regulations and the resolutions or decisions adopted at the previous meeting, and any other information considered of interest.”
Furthermore, pursuant to Article 5 of the Regulations of the General Shareholders Meeting, concerning shareholders’ right to information and participation, the notice of call to General Meetings shall state “the place and times at which shareholders may consult the documents to be laid before the general meeting and such other reports as may be required by law or decided by the board, without prejudice to the right of shareholders to request and receive, free of charge, copies of all the above-mentioned documents”.
Article 5 of the Regulations of the General Shareholders Meeting also provides that “in addition to the requirements stipulated in law or the Articles of Association, as from the date of publication of the notice of call to the general meeting, the company shall publish on its web site the text of all proposed resolutions submitted by the board in connection with the items on the agenda, including, with regard to proposals for the appointment of directors, the information contemplated in Article 47.13 of the Articles of Association ((i) professional and biographic profile, (ii) list of other boards they are on, (iii) indication of the type of director, indicating, in the case of institutional directors, the shareholder they represent or with which they have ties, (iv) date of first appointment as company directors, and subsequent appointments, and (v) company shares and options they hold).
An exception may be made to this rule for proposals which the law and Articles of Association do not require to be made available to shareholders as from the notice of call, if the board considers there are just grounds for not doing so.
If a supplementary notice of call is published, the company shall thereafter publish on its web site the text of the proposals contained in that supplementary notice, provided they have been sent to the company.”
Article 6.1. of the Regulations for the General Shareholders Meeting further provides that:
“Through the Shareholders’ Information Office of the Company’s web page, shareholders may at any time, upon entering proof of identification as such, raise any questions or make suggestions relating to the activities and interests of the Company and which they consider should be discussed at a General Shareholders’ Meeting.
Once a General Shareholders’ Meeting has been called and up to seven consecutive days before the date set for the meeting on first call, shareholders may utilize the same means to comment upon or make suggestions in writing regarding the proposals included on the Agenda thereof.
The Company's Departments will examine the shareholders’ questions, suggestions and comments, and the responses will be disclosed, grouped together as pertinent, on the Company web page or, if the Board of Directors considers it appropriate, they will be considered at the General Shareholders’ Meeting, even if they are not included on the Agenda.”
Translation of the original in Spanish. In case of any discrepancy, the Spanish version prevails.
49
Apart from the foregoing and with a view to facilitating access by shareholders to the information on the company, Repsol set up the Shareholders’ Information Office mentioned above, offering shareholders a free call service and an e-mail address at which they may request whatever information they may require. Shareholders may also visit the Office, where they will receive personal attention.
E.4 Describe the measures adopted, if any, to encourage the participation of shareholders at General Meetings.
To encourage shareholders to participate in general meetings, Article 6 of the Regulations of the General Shareholders Meeting, establishes shareholders’ right to information and participation, indicating that they may raise any questions or make any suggestions in connection with the company’s activities or interests which they consider ought to be discussed by the General Meeting, through the Shareholders’ Information Office or the company’s web site (www.repsol.com).
Apart from these measures, which are expressly contemplated in the Repsol YPF, S.A. Rules of Corporate Governance, the company also encourages shareholders to participate in general meetings with the following measures:
- Publication of the notice of call sufficiently in advance in the media with the widest distribution, inserting a copy on the company’s web site (www.repsol.com) and sending copies to the stock exchanges on which its shares are listed and to the depositaries of its shares, so that they can issue the necessary attendance cards.
- Warning in the notice of call that the general meeting will be held on second call.
- Practices to encourage attendance, by delivering gifts and even, if appropriate, paying attendance premiums.
- Holding general meetings at a large-capacity location with ideal conditions for the procedure and following of the meeting, providing transport.
- Possibility of exercising or delegating the vote through distance means (post or electronic means), providing for shareholders:
* A form prepared for postal votes on the company’s web site and at the Shareholders’ Information Office.
* An application on the web site to exercise or delegate the vote by electronic means, for all shareholders having a recognised or advanced electronic signature based on a recognised, valid electronic certificate issued by the Spanish Public Certification Entity (CERES).
- Possibility of fractioning votes through the voting platform and delegation by post and electronic means.
- Assistance and personalized guidance for all shareholders who wish to participate through staff of the Shareholders’ Information Office.
- Possibility of connecting to a live broadcast of the meeting through the company’s
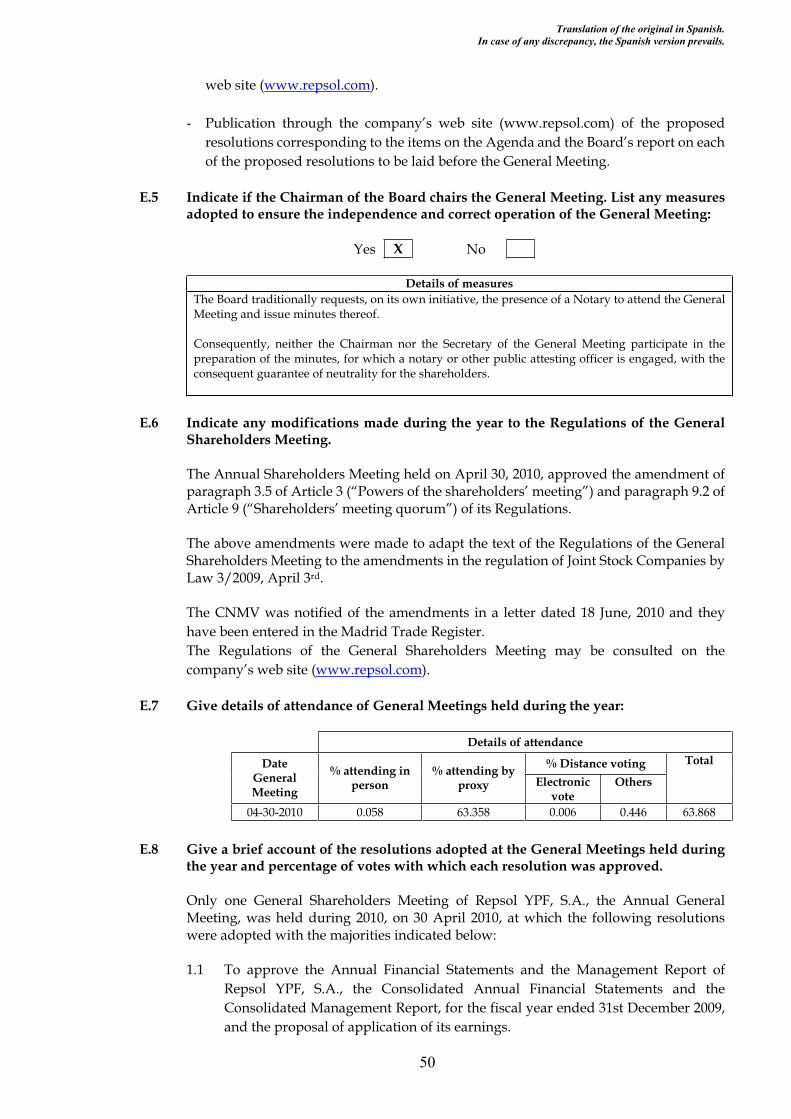
Translation of the original in Spanish. In case of any discrepancy, the Spanish version prevails.
50
web site (www.repsol.com).
- Publication through the company’s web site (www.repsol.com) of the proposed resolutions corresponding to the items on the Agenda and the Board’s report on each of the proposed resolutions to be laid before the General Meeting.
E.5 Indicate if the Chairman of the Board chairs the General Meeting. List any measures adopted to ensure the independence and correct operation of the General Meeting:
Yes X No
Details of measures The Board traditionally requests, on its own initiative, the presence of a Notary to attend the General Meeting and issue minutes thereof.
Consequently, neither the Chairman nor the Secretary of the General Meeting participate in the preparation of the minutes, for which a notary or other public attesting officer is engaged, with the consequent guarantee of neutrality for the shareholders.
E.6 Indicate any modifications made during the year to the Regulations of the General Shareholders Meeting.
The Annual Shareholders Meeting held on April 30, 2010, approved the amendment of paragraph 3.5 of Article 3 (“Powers of the shareholders’ meeting”) and paragraph 9.2 of Article 9 (“Shareholders’ meeting quorum”) of its Regulations.
The above amendments were made to adapt the text of the Regulations of the General Shareholders Meeting to the amendments in the regulation of Joint Stock Companies by Law 3/2009, April 3rd.
The CNMV was notified of the amendments in a letter dated 18 June, 2010 and they have been entered in the Madrid Trade Register. The Regulations of the General Shareholders Meeting may be consulted on the company’s web site (www.repsol.com).
E.7 Give details of attendance of General Meetings held during the year:
Details of attendance
% Distance voting DateGeneralMeeting
% attending in person
% attending by proxy Electronic
voteOthers
Total
04-30-2010 0.058 63.358 0.006 0.446 63.868
E.8 Give a brief account of the resolutions adopted at the General Meetings held during the year and percentage of votes with which each resolution was approved.
Only one General Shareholders Meeting of Repsol YPF, S.A., the Annual General Meeting, was held during 2010, on 30 April 2010, at which the following resolutions were adopted with the majorities indicated below:
1.1 To approve the Annual Financial Statements and the Management Report of Repsol YPF, S.A., the Consolidated Annual Financial Statements and the Consolidated Management Report, for the fiscal year ended 31st December 2009, and the proposal of application of its earnings.
Translation of the original in Spanish. In case of any discrepancy, the Spanish version prevails.
51
Votes for 604,291,620 shares, votes against 98,609 shares, abstentions 10,971,712 shares.
1.2 To approve the management by the Board of Directors during fiscal year 2009.
Votes for 596,098,123 shares, votes against 8,741,305 shares, abstentions 10,522,513 shares.
2.1 To amend the first paragraph of Article 9 (“Capital calls and default by the Shareholders”).
Votes for 600,008,846 shares, votes against 98,358 shares, abstentions 15,254,737 shares.
2.2 To amend Article 12.bis (“Preferential subscription right”).
Votes for 599,694,119 shares, votes against 413,679 shares, abstentions 15,254,143 shares.
2.3 To amend the first paragraph of Article 22 (“Special resolutions, constitution and majorities”).
Votes for 599,960,369 shares, votes against 143,416 shares, abstentions 15,258,156 shares.
3.1 To amend paragraph 3.5 of Article 3 (“Powers of the shareholders’ meeting”).
Votes for 599,880,057 shares, votes against 176,115 shares, abstentions 15,305,769 shares.
3.2 To amend paragraph 9.2 of Article 9 (“Shareholders’ meeting quorum”).
Votes for 599,984,159 shares, votes against 131,195 shares, abstentions 15,246,587 shares.
4.1 To re-elect Mrs. Paulina Beato, as Director of the Company, for a new period of four years.
Votes for 602,026,416 shares, votes against 156,935 shares, abstentions 13,178,590 shares.
4.2 To re-elect Mr. Carulla Font, as Director of the Company, for a new period of four years.
Votes for 595,416,578 shares, votes against 7,240,441 shares, abstentions 12,704,922 shares.
4.3 To re-elect Mr. Javier Echenique Landiríbar, as Director of the Company, for a new period of four years.
Translation of the original in Spanish. In case of any discrepancy, the Spanish version prevails.
52
Votes for 601,633,095 shares, votes against 2,491,037 shares, abstentions 11,237,809 shares.
4.4 To re-elect Pemex International España, S.A., as Director of the Company, for a new period of four years.
Votes for 597,174,003 shares, votes against 6,246,245 shares, abstentions 11,941,693 shares.
4.5 To re-elect Mr. Henri Philippe Reichstul, as Director of the Company, for a new period of four years.
Votes for 604,012,048 shares, votes against 148,075 shares, abstentions 11,201,818 shares.
5. To re-elect as the Accounts Auditor of Repsol YPF, S.A. and of its Consolidated Group the company Deloitte, S.L. for the legally established period of one year. It is also entrusted with carrying out the other Audit services required by Law and needed by the Company until the next Ordinary General Shareholders' Meeting is held.
Votes for 602,410,163 shares, votes against 2,507,334 shares, abstentions 10,444,444 shares.
6. To authorize the Board of Directors, with express power of delegation, for the derivative acquisition of shares of Repsol YPF, S.A., directly or through controlled companies, within a period of 5 years from the resolution of the Shareholders Meeting, leaving without effect the authorization granted by the Ordinary General Shareholders Meeting held on May 14, 2009.
Votes for 594,579,635 shares, votes against 9,602,838 shares, abstentions 11,179,468 shares.
7. To delegate to the Board of Directors of the power to resolve the increase of the capital stock, up to the maximum amount legally prescribed, with the possibility of excluding the preferential subscription right, leaving without effect the sixth resolution of the General Shareholders’ Meeting held on May 31, 2005.
Votes for 570,986,716 shares, votes against 27,382,419 shares, abstentions 16,992,806 shares.
8. To delegate the powers to supplement, develop, execute, rectify and formalize the resolutions adopted by the General Shareholders' Meeting”.
Votes for 602,821,148 shares, votes against 2,637,137 shares, abstentions 9,903,656 shares.
E.9 State whether any restrictions are established in the Articles of Association requiring a minimum number of shares to attend General Meetings:
Yes No X
Translation of the original in Spanish. In case of any discrepancy, the Spanish version prevails.
53
Number of shares required to attend General Meetings
E.10 Describe and justify the company’s policies on proxy votes at General Meetings.
According to Article 8 of the Regulations of the General Shareholders Meeting, all shareholders entitled to attend may be represented at general meetings by another person, who need not be a shareholder. Proxies shall be granted in writing or by distance communication, especially for each general meeting.
For this purpose, apart from the possibility of sending proxies for attendance and voting at general meetings through the members of “Sociedad de Gestión de Sistemas de Registro, Compensación y Liquidación de Valores S.A.” (Iberclear), shareholders also have the Shareholders’ Information Office, where they may deliver proxies by post or by hand, and another office opened exclusively for this purpose at the registered office, Paseo de la Castellana no. 278, where attendance cards may be received and the corresponding gifts are handed out.
An application is made available on the web site for electronic proxies, available for shareholders who have a recognised or advanced electronic signature based on a recognised, valid electronic certificate issued by the Entidad Pública de Certificación Española (CERES).
E.11 Indicate whether the company is aware of the policies of institutional investors regarding their participation or otherwise in company decisions:
Yes No X
E.12 Indicate the address and access to the corporate governance contents on the company’s web site.
The information on corporate governance, regulated in Act 26/2003 of 17 July, Order ECO/3722/2003 of 26 December, and the Comisión Nacional del Mercado de Valores(CNMV) Circular 1/2004 of 17 March, is published in the section “Shareholders and investors” on the company’s web site (www.repsolypf.com).
F EXTENT OF COMPLIANCE WITH THE CORPORATE GOVERNANCE RECOMMENDATIONS
Indicate the degree of compliance by the company with the recommendations of the Unified Good Governance Code.
In the event of non-compliance with any recommendations, explain the recommendations, standards, practices or principles applied by the company.
1. The bylaws of listed companies should not place an upper limit on the votes that can be cast by a single shareholder, or impose other obstacles to the takeover of the company by means of share purchases on the market.
See sections: A.9, B.1.22, B.1.23 and E.1, E.2.
Explain
Translation of the original in Spanish. In case of any discrepancy, the Spanish version prevails.
54
Art. 27 of the Bylaws and Art. 13.6 of the Regulations of the General Shareholders Meeting of Company stipulate that the maximum number of votes that may be cast at a General Meeting by one shareholder or companies belonging to the same group shall be 10% of the total voting capital.
This limit was approved, according to the provision of article 105 of the Joint Stock Companies Act, at the Extraordinary General Meeting held in 1999 by 95% of the capital attending.
2. When a dominant and a subsidiary company are stock market listed, the two should provide detailed disclosure on:
a) The type of activity they engage in, and any business dealings between them, as well as between the subsidiary and other group companies;
b) The mechanisms in place to resolve possible conflicts of interest.
See sections: C.4 and C.7
Not applicable
3. Even when not expressly required under company law, any decisions involving a fundamental corporate change should be submitted to the General Shareholders' Meeting for approval or ratification. In particular:
a) The transformation of listed companies into holding companies through the process of subsidiarisation, i.e. reallocating core activities to subsidiaries that were previously carried out by the originating firm, even though the latter retains full control of the former;
b) Any acquisition or disposal of key operating assets that would effectively alter the company's corporate purpose;
c) Operations that effectively add up to the company's liquidation.
Comply
4. Detailed proposals of the resolutions to be adopted at the General Shareholders’ Meeting, including the information stated in Recommendation 28, should be made available at the same time as the publication of the Meeting notice.
Comply
5. Separate votes should be taken at the General Shareholders’ Meeting on materially separate items, so shareholders can express their preferences in each case. This rule shall apply in particular to:
a) The appointment or ratification of directors, with separate voting on each candidate;
b) Amendments to the bylaws, with votes taken on all articles or groups of articles that are materially independent.
See section: E.8
Comply
6. Companies should allow split votes, so financial intermediaries acting as nominees on behalf of different clients can issue their votes according to instructions.
Translation of the original in Spanish. In case of any discrepancy, the Spanish version prevails.
55
See section: E.4
Comply
7. The Board of Directors should perform its duties with unity of purpose and independent judgement, according all shareholders the same treatment. It should be guided at all times by the company's best interest and, as such, strive to maximise its value over time.
It should likewise ensure that the company abides by the laws and regulations in its dealings with stakeholders; fulfils its obligations and contracts in good faith; respects the customs and good practices of the sectors and territories where it does business; and upholds any additional social responsibility principles it has subscribed to voluntarily.
Comply
8. The board should see the core components of its mission as to approve the company's strategy and authorise the organisational resources to carry it forward, and to ensure that management meets the objectives set while pursuing the company's interests and corporate purpose. As such, the board in full should reserve the right to approve:
a) The company's general policies and strategies, and in particular:
i) The strategic or business plan, management targets and annual budgets;
ii) Investment and financing policy;
iii) Design of the structure of the corporate group;
iv) Corporate governance policy;
v) Corporate social responsibility policy;
vi) Remuneration and evaluation of senior officers;
vii) Risk control and management, and the periodic monitoring of internal information and control systems;
viii) Dividend policy, as well as the policies and limits applying to treasury stock.
See sections: B.1.10, B.1.13, B.1.14 and D.3
b) The following decisions:
i) On the proposal of the company's chief executive, the appointment and removal of senior officers, and their compensation clauses.
See section: B.1.14.
ii) Directors’ remuneration and, in the case of executive directors, the additional consideration for their management duties and other contract conditions.
See section: B.1.14.
iii) The financial information listed companies must periodically disclose.
iv) Investments or operations considered strategic by virtue of their amount or
Translation of the original in Spanish. In case of any discrepancy, the Spanish version prevails.
56
special characteristics, unless their approval corresponds to the General Shareholders’ Meeting;
v) The creation or acquisition of shares in special purpose entities resident in jurisdictions considered tax havens, and any other transactions or operations of a comparable nature whose complexity might impair the transparency of the group.
c) Transactions which the company conducts with directors, significant shareholders, shareholders with board representation or other persons related thereto (“related-party transactions”).
However, board authorisation need not be required for related-party transactions that simultaneously meet the following three conditions:
1. They are governed by standard form agreements applied on an across-the-board basis to a large number of clients;
2. They go through at market rates, generally set by the person supplying the goods or services;
3. Their amount is no more than 1% of the company's annual revenues.
It is advisable that related-party transactions should only be approved on the basis of a favourable report from the Audit Committee or committee handling the same function; and that the directors involved should neither exercise nor delegate their votes, and should withdraw from the meeting room while the board deliberates and votes.
Ideally the above powers should not be delegated with the exception of those mentioned in b) and c), which may be delegated to the Delegate Committee in urgent cases and later ratified by the full board.
See sections: C.1 and C.6
Partial compliance
The company complies with this recommendation, except for the following sections:
- a.iii) Owing to the complexity and large number of companies in the Repsol YPF Group at present, it has not been considered convenient to expressly include the contents of this recommendation in the company’s internal regulations.
- a.vii) The Company complies with this recommendation, except regarding the periodic monitoring of internal information and control systems. In this regard, since recommendation 50.1 of the Unified Code assigns duties to the Audit and Control Committee involving supervision of the information, internal control and risk management systems, and Repsol YPF is subject to the US Sarbanes-Oxley Act (Section 404), according to which the Audit Committee must oversee and control the functioning of the Internal Financial Reporting Control system, the Company has considered it convenient to assign that Committee the duty of supervising the risk management, internal control and information systems of the company, without prejudice to reporting to the Board on these matters.
- b.i) The Regulations of the Board of Directors does not reserve to the Board the removal of senior officers. The Company considers that this power over the top management should be reserved for the chief executive, since these positions come under his trust and responsibility, without prejudice to reporting to the Board.
Translation of the original in Spanish. In case of any discrepancy, the Spanish version prevails.
57
Nevertheless, the Board of Directors reserves the power to approve any guarantee or golden parachute clauses for senior executives of the company in cases of dismissals or changes of ownership, when the conditions exceed those normally established on the market.
- b.v) The Company complies with this recommendation, except regarding the creation or acquisition of shares in companies domiciled in countries or territories considered tax havens. In this regard, the Company has opted for the Audit and Control Committee to receive information on these matters and ensure that these transactions correspond to appropriate purposes, and for the Top Management to take the appropriate measures to identify and adequately manage them, without prejudice to reporting to the Board on these matters.
Furthermore, this recommendation includes a vague concept (transactions which might impair the transparency of the Group), which the company has not considered it convenient to include in its internal regulations, owing to the uncertainty that could arise in its application.
9. In the interests of maximum effectiveness and participation, the Board of Directors should ideally comprise no fewer then five and no more than fifteen members.
See section: B.1.1 Explain
The Board of Directors considered it convenient for the company, taking account of the structure of its capital and shareholders’ representation on the Board, to incorporate persons with an outstanding professional prestige, from the auditing, financial/accounting, industrial and stock market sectors, who could increase the decision-making capacity of the Board and enhance its points of view.
For this purpose, the Board of Directors proposed to the General Shareholders Meeting in 2007, within the maximum and minimum limits established in the Articles of Association (9 - 16), to set the number of directors at 16. This proposal was approved at the aforesaid General Meeting.
10. External directors, proprietary and independent, should occupy an ample majority of board places, while the number of executive directors should be the minimum practical bearing in mind the complexity of the corporate group and the ownership interests they control.
See sections: A.2, A.3, B.1.3 and B.1.14.
Comply
11. In the event that some external director can be deemed neither proprietary nor independent, the company should disclose this circumstance and the links that person maintains with the company or its senior officers, or its shareholders.
See section: B.1.3 Not applicable
12. That among external directors, the relation between proprietary members and independents should match the proportion between the capital represented on the board by proprietary directors and the remainder of the company’s capital.
This proportional criterion can be relaxed so the weight of proprietary directors is greater than would strictly correspond to the total percentage of capital they represent:
Translation of the original in Spanish. In case of any discrepancy, the Spanish version prevails.
58
1. In large cap companies where few or no equity stakes attain the legal threshold for significant shareholdings, despite the considerable sums actually invested.
2. In companies with a plurality of shareholders represented on the board but not otherwise related.
See sections: B.1.3, A.2 and A.3
Comply
13. The number of independent directors should represent at least one third of all board members.
See section: B.1.3 Comply
14. The nature of each director should be explained to the General Meeting of Shareholders, which will make or ratify his or her appointment. Such determination should subsequently be confirmed or reviewed in each year’s Annual Corporate Governance Report, after verification by the Nomination Committee. The said Report should also disclose the reasons for the appointment of proprietary directors at the urging of shareholders controlling less than 5% of capital; and explain any rejection of a formal request for a board place from shareholders whose equity stake is equal to or greater than that of others applying successfully for a proprietary directorship.
See sections: B.1.3 and B.1.4
Comply
15. When women directors are few or non existent, the board should state the reasons for this situation and the measures taken to correct it; in particular, the Nomination Committee should take steps to ensure that: a) The process of filling board vacancies has no implicit bias against women
candidates;
b) The company makes a conscious effort to include women with the target profile among the candidates for board places.
See sections: B.1.2, B.1.27 and B.2.3.
Comply
16. The Chairman, as the person responsible for the proper operation of the Board of Directors, should ensure that directors are supplied with sufficient information in advance of board meetings, and work to procure a good level of debate and the active involvement of all members, safeguarding their rights to freely express and adopt positions; he or she should organise and coordinate regular evaluations of the board and, where appropriate, the company’s chief executive, along with the chairmen of the relevant board committees.
See section: B.1 42
Comply
17. When a company's Chairman is also its chief executive, an independent director should be empowered to request the calling of board meetings or the inclusion of new business on the agenda; to coordinate and give voice to the concerns of external directors; and to lead the board’s evaluation of the Chairman.
Translation of the original in Spanish. In case of any discrepancy, the Spanish version prevails.
59
See section: B.1.21
Comply
18. The Secretary should take care to ensure that the Board’s actions:
a) Adhere to the spirit and letter of laws and their implementing regulations, including those issued by regulatory agencies;
b) Comply with the company bylaws and the regulations of the General Shareholders' Meeting, the Board of Directors and others;
c) Are informed by those good governance recommendations of the Unified Code that the company has subscribed to.
In order to safeguard the independence, impartiality and professionalism of the Secretary, his or her appointment and removal should be proposed by the Nomination Committee and approved by a full board meeting, the relevant appointment and removal procedures being spelled out in the board’s regulations.
See section: B.1.34
Comply
19. The Board should meet with the necessary frequency to properly perform its functions, in accordance with a calendar and agendas set at the beginning of the year, to which each director may propose the addition of other items.
See section: B.1.29
Comply
20. Director absences should be kept to the bare minimum and quantified in the Annual Corporate Governance Report. When directors have no choice but to delegate their vote, they should do so with instructions.
See sections: B.1.28 and B.1.30
Comply
21. When directors or the Secretary express concerns about some proposal or, in the case of directors, about the company's performance, and such concerns are not resolved at the meeting, the person expressing them can request that they be recorded in the minute book.
Not applicable
22. The board in full should evaluate the following points on a yearly basis:
a) The quality and efficiency of the board's operation;
b) Starting from a report submitted by the Nomination Committee, how well the Chairman and chief executive have carried out their duties;
c) The performance of its committees on the basis of the reports furnished by the same.
See section: B.1.19
Translation of the original in Spanish. In case of any discrepancy, the Spanish version prevails.
60
Comply
23. All directors should be able to exercise their right to receive any additional information they require on matters within the board's competence. Unless the bylaws or board regulations indicate otherwise, such requests should be addressed to the Chairman or Secretary.
See section: B.1.42
Comply
24. All directors should be entitled to call on the company for the advice and guidance they need to carry out their duties. The company should provide suitable channels for the exercise of this right, extending in special circumstances to external assistance at the company's expense.
See section: B.1.41
Comply
25. Companies should organise induction programmes for new directors to acquaint them rapidly with the workings of the company and its corporate governance rules. Directors should also be offered refresher programmes when circumstances so advise.
Comply
26. Companies should require their directors to devote sufficient time and effort to perform their duties effectively, and, as such:
a) Directors should apprise the Nomination Committee of any other professional obligations, in case they might detract from the necessary dedication;
b) Companies should lay down rules about the number of directorships their board members can hold.
See sections: B.1.8, B.1.9 and B.1.17
Partial compliance
The Company complies with this recommendation, except regarding the rules on the number of directorships its directors may hold. It considers the obligations that Directors are to meet by virtue of their office, as stipulated in Article 17 of the Regulations of the Board of Directors, sufficient to guarantee the efficient performance by directors of their duties:
Constantly devote such time and efforts as may be necessary to regularly oversee the issues concerning administration of the company.
Be informed and adequately prepare meetings of the board and any other delegated and advisory committees to which they belong, obtaining sufficient information and such collaboration or assistance as they may deem fit.
Attend meetings of all committees they are on and participate actively in the debates, such that their opinions may contribute effectively to the decision-making process. If they are justifiably unable to attend any meetings to which they have been called, they shall duly instruct another director to represent them.
Translation of the original in Spanish. In case of any discrepancy, the Spanish version prevails.
61
Carry out any specific task commissioned by the board that is reasonably within his dedication commitment.
Inform the Nomination and Compensation Committee of any other professional obligations they may have and any material changes in their professional situation, as well as any that may affect the nature or condition by virtue of which they have been appointed director.
The Nomination and Compensation Committee shall inform the Board on directors’ performance of these obligations.
27. The proposal for the appointment or renewal of directors which the board submits to the General Shareholders’ Meeting, as well as provisional appointments by the method of co-option, should be approved by the board:
a) On the proposal of the Nomination Committee, in the case of independent directors.
b) Subject to a report from the Nomination Committee in all other cases.
See section: B.1.2
Comply
28. Companies should post the following director particulars on their websites and keep them permanently updated:
a) Professional experience and background;
b) Directorships held in other companies, listed or otherwise;
c) An indication of the director's classification as executive, proprietary or independent; in the case of proprietary directors, stating the shareholder they represent or have links with.
d) The date of their first and subsequent appointments as a company director, and;
e) Shares held in the company and any options on the same.
Comply
29. Independent directors should not stay on as such for a continuous period of more than 12 years.
See section: B.1.2
Comply
30. Proprietary directors should resign when the shareholders they represent dispose of their ownership interest in its entirety. If such shareholders reduce their stakes, thereby losing some of their entitlement to proprietary directors, the latter’s number should be reduced accordingly.
See sections: A.2, A.3 and B.1.2
Comply
31. The Board of Directors should not propose the removal of independent directors before the expiry of their tenure as mandated by the bylaws, except where just cause is
Translation of the original in Spanish. In case of any discrepancy, the Spanish version prevails.
62
found by the board, based on a proposal from the Nomination Committee. In particular, just cause will be presumed when a director is in breach of his or her fiduciary duties or comes under one of the disqualifying grounds enumerated in section III.5 (Definitions) of this Code.
The removal of independents may also be proposed when a takeover bid, merger or similar corporate operation produces changes in the company’s capital structure, in order to meet the proportionality criterion set out in Recommendation 12.
See sections: B.1.2, B.1.5 and B.1.26
Comply
32. Companies should establish rules obliging directors to inform the board of any circumstance that might harm the organisation's name or reputation, tendering their resignation as the case may be, with particular mention of any criminal charges brought against them and the progress of any subsequent trial.
The moment a director is indicted or tried for any of the crimes stated in article 124 of the Public Limited Companies Law, the board should examine the matter and, in view of the particular circumstances and potential harm to the company's name and reputation, decide whether or not he or she should be called on to resign. The board should also disclose all such determinations in the Annual Corporate Governance Report.
See sections: B.1.43, B.1.44
Comply
33. All directors should express clear opposition when they feel a proposal submitted for the board's approval might damage the corporate interest. In particular, independents and other directors unaffected by the conflict of interest should challenge any decision that could go against the interests of shareholders lacking board representation.
When the board makes material or reiterated decisions about which a director has expressed serious reservations, then he or she must draw the pertinent conclusions. Directors resigning for such causes should set out their reasons in the letter referred to in the next Recommendation.
The terms of this Recommendation should also apply to the Secretary of the board; director or otherwise.
Not applicable
34. Directors who give up their place before their tenure expires, through resignation or otherwise, should state their reasons in a letter to be sent to all members of the board. Irrespective of whether such resignation is filed as a significant event, the motive for the same must be explained in the Annual Corporate Governance Report.
See section: B.1.5
Not applicable
35. The company's remuneration policy, as approved by its Board of Directors, should specify at least the following points:
a) The amount of the fixed components, itemised where necessary, of board and board committee attendance fees, with an estimate of the fixed annual payment
Translation of the original in Spanish. In case of any discrepancy, the Spanish version prevails.
63
they give rise to;
b) Variable components, in particular:
i) The types of directors they apply to, with an explanation of the relative weight of variable to fixed remuneration items;
ii) Performance evaluation criteria used to calculate entitlement to the award of shares or share options or any performance-related remuneration;
iii) The main parameters and grounds for any system of annual bonuses or other, non cash benefits; and
iv) An estimate of the sum total of variable payments arising from the remuneration policy proposed, as a function of degree of compliance with pre-set targets or benchmarks.
c) The main characteristics of pension systems (for example, supplementary pensions, life insurance and similar arrangements), with an estimate of their amount or annual equivalent cost.
d) The conditions to apply to the contracts of executive directors exercising senior management functions. Among them:
i) Duration;
ii) Notice periods; and
iii) Any other clauses covering hiring bonuses, as well as indemnities or ‘golden parachutes’ in the event of early termination of the contractual relation between company and executive director.
See section: B.1.15
Comply
36. Remuneration comprising the delivery of shares in the company or other companies in the group, share options or other share-based instruments, payments linked to the company’s performance or membership of pension schemes should be confined to executive directors.
The delivery of shares is excluded from this limitation when directors are obliged to retain them until the end of their tenure.
See sections: A.3, B.1.3
Comply
37. External directors' remuneration should sufficiently compensate them for the dedication, abilities and responsibilities that the post entails, but should not be so high as to compromise their independence.
Comply
38. In the case of remuneration linked to company earnings, deductions should be computed for any qualifications stated in the external auditor’s report.
Comply

Translation of the original in Spanish. In case of any discrepancy, the Spanish version prevails.
64
39. In the case of variable awards, remuneration policies should include technical safeguards to ensure they reflect the professional performance of the beneficiaries and not simply the general progress of the markets or the company’s sector, atypical or exceptional transactions or circumstances of this kind.
Comply
40. The board should submit a report on the directors’ remuneration policy to the advisory vote of the General Shareholders’ Meeting, as a separate point on the agenda. This report can be supplied to shareholders separately or in the manner each company sees fit.
The report will focus on the remuneration policy the board has approved for the current year with reference, as the case may be, to the policy planned for future years. It will address all the points referred to in Recommendation 34, except those potentially entailing the disclosure of commercially sensitive information. It will also identify and explain the most significant changes in remuneration policy with respect to the previous year, with a global summary of how the policy was applied over the period in question.
The role of the Remuneration Committee in designing the policy should be reported to the Meeting, along with the identity of any external advisors engaged.
See section: B.1.16 Partial compliance
The company prepared the Report on the Directors’ Remuneration Policy, which is made available to shareholders, for their information, at the Ordinary General Shareholders Meeting.
41. The notes to the annual accounts should list individual directors’ remuneration in the year, including:
a) A breakdown of the compensation obtained by each company director, to include where appropriate:
i) Participation and attendance fees and other fixed director payments;
ii) Additional compensation for acting as chairman or member of a board committee;
iii) Any payments made under profit-sharing or bonus schemes, and the reason for their accrual;
iv) Contributions on the director’s behalf to defined-contribution pension plans, or any increase in the director’s vested rights in the case of contributions to defined-benefit schemes;
v) Any severance packages agreed or paid;
vi) Any compensation they receive as directors of other companies in the group;
vii) The remuneration executive directors receive in respect of their senior management posts;
viii) Any kind of compensation other than those listed above, of whatever nature and provenance within the group, especially when it may be accounted as a related-party transaction or when its omission would detract from a true and fair view of the total remuneration received by the director.
Translation of the original in Spanish. In case of any discrepancy, the Spanish version prevails.
65
b) An individual breakdown of deliveries to directors of shares, share options or other share-based instruments, itemised by:
i) Number of shares or options awarded in the year, and the terms set for their execution;
ii) Number of options exercised in the year, specifying the number of shares involved and the exercise price;
iii) Number of options outstanding at the annual close, specifying their price, date and other exercise conditions;
iv) Any change in the year in the exercise terms of previously awarded options.
c) Information on the relation in the year between the remuneration obtained by executive directors and the company’s profits, or some other measure of enterprise results.
Comply
42. When the company has a Delegate Committee, the breakdown of its members by director category should be similar to that of the board itself. The Secretary of the board should also act as secretary to the Delegate Committee.
See sections: B.2.1 and B.2.6
Comply
43. The board should be kept fully informed of the business transacted and decisions made by the Delegate Committee. To this end, all board members should receive a copy of the Committee’s minutes.
Comply
44. In addition to the Audit Committee mandatory under the Securities Market Law, the Board of Directors should form a committee, or two separate committees, of Nomination and Remuneration.
The rules governing the make-up and operation of the Audit Committee and the committee or committees of Nomination and Remuneration should be set forth in the board regulations, and include the following:
a) The Board of Directors should appoint the members of such committees with regard to the knowledge, aptitudes and experience of its directors and the terms of reference of each committee; discuss their proposals and reports; and be responsible for overseeing and evaluating their work, which should be reported to the first board plenary following each meeting;
b) These committees should be formed exclusively of external directors and have a minimum of three members. Executive directors or senior officers may also attend meetings, for information purposes, at the Committees’ invitation.
c) Committees should be chaired by an independent director.
d) They may engage external advisors, when they feel this is necessary for the discharge of their duties.
e) Meeting proceedings should be minuted and a copy sent to all board members.
See sections: B.2.1 and B.2.3
Translation of the original in Spanish. In case of any discrepancy, the Spanish version prevails.
66
Comply
45. The job of supervising compliance with internal codes of conduct and corporate governance rules should be entrusted to the Audit Committee, the Nomination Committee or, as the case may be, separate Compliance or Corporate Governance committees.
Comply
46. All members of the Audit Committee, particularly its chairman, should be appointed with regard to their knowledge and background in accounting, auditing and risk management matters.
Comply
47. Listed companies should have an internal audit function, under the supervision of the Audit Committee, to ensure the proper operation of internal reporting and control systems.
Comply
48. The head of internal audit should present an annual work programme to the Audit Committee; report to it directly on any incidents arising during its implementation; and submit an activities report at the end of each year.
Comply
49. Control and risk management policy should specify at least:
a) The different types of risk (operational, technological, financial, legal, reputational…) the company is exposed to, with the inclusion under financial or economic risks of contingent liabilities and other off-balance-sheet risks;
b) The determination of the risk level the company sees as acceptable;
c) Measures in place to mitigate the impact of risk events should they occur;
d) The internal reporting and control systems to be used to control and manage the above risks, including contingent liabilities and off-balance-sheet risks.
See section: D Comply
50. The Audit Committee’s role should be:
1. With respect to internal control and reporting systems:
a) Monitor the preparation and the integrity of the financial information prepared on the company and, where appropriate, the group, checking for compliance with legal provisions, the accurate demarcation of the consolidation perimeter, and the correct application of accounting principles.
b) Review internal control and risk management systems on a regular basis, so main risks are properly identified, managed and disclosed.
c) Monitor the independence and efficacy of the internal audit function; propose the selection, appointment, reappointment and removal of the head of internal audit; propose the department’s budget; receive regular report-backs on its
Translation of the original in Spanish. In case of any discrepancy, the Spanish version prevails.
67
activities; and verify that senior management are acting on the findings and recommendations of its reports.
d) Establish and supervise a mechanism whereby staff can report confidentially and, if necessary, anonymously, any irregularities they detect in the course of their duties , in particular financial or accounting irregularities, with potentially serious implications for the firm.
2. With respect to the external auditor:
a) Make recommendations to the board for the selection, appointment, reappointment and removal of the external auditor, and the terms and conditions of his engagement.
b) Receive regular information from the external auditor on the progress andfindings of the audit programme, and check that senior management are acting on its recommendations.
c) Monitor the independence of the external auditor, to which end:
i) The company should notify any change of auditor to the CNMV as a significant event, accompanied by a statement of any disagreements arising with the outgoing auditor and the reasons for the same.
ii) The Committee should ensure that the company and the auditor adhere to current regulations on the provision of non-audit services, the limits on the concentration of the auditor’s business and, in general, other requirements designed to safeguard auditors’ independence;
iii) The Committee should investigate the issues giving rise to the resignation of any external auditor.
d) In the case of groups, the Committee should urge the group auditor to take on the auditing of all component companies.
See sections: B.1.35, B.2.2, B.2.3 and D.3
Comply
51. The Audit Committee should be empowered to meet with any company employee or manager, even ordering their appearance without the presence of another senior officer.
Comply
52. The Audit Committee should prepare information on the following points from Recommendation 8 for input to board decision-making:
a) The financial information that all listed companies must periodically disclose. The Committee should ensure that interim statements are drawn up under the same accounting principles as the annual statements and, to this end, may ask the external auditor to conduct a limited review.
b) The creation or acquisition of shares in special purpose vehicles or entities resident in countries or territories considered tax havens, and any other transactions or operations of a comparable nature whose complexity might impair the transparency of the group.
c) Related-party transactions, except where their scrutiny has been entrusted to some other supervision and control committee.
Translation of the original in Spanish. In case of any discrepancy, the Spanish version prevails.
68
See sections: B.2.2 and B.2.3
Partial compliance
The Company complies with this recommendation, except for paragraph b on entities resident in tax havens and transactions that might impair the transparency of the group.
In this respect, Article 32 of the Regulations of the Board of Directors establishes that the Audit and Control Committee shall be informed on the creation or acquisition of shares in companies domiciled in countries or territories considered tax havens. The Committee shall also see that these transactions correspond to appropriate purposes and that top management takes the necessary measures to identify and adequately handle them.
Furthermore, this recommendation includes a vague concept (transactions which might impair the transparency of the Group), which the company has not considered it convenient to include in its internal regulations, owing to the uncertainty that could arise in its application.
53. The Board of Directors should seek to present the annual accounts to the General Shareholders’ Meeting without reservations or qualifications in the audit report. Should such reservations or qualifications exist, both the Chairman of the Audit Committee and the auditors should give a clear account to shareholders of their scope and content.
See section: B.1.38
Comply
54. The majority of Nomination Committee members – or Nomination and Remuneration Committee members as the case may be – should be independent directors.
See section: B.2.1
Explain
The Nomination and Compensation Committee has proposed to the Board of Directors the appointment of Mr. Mario Fernández Pelaz as a third Independent member of the Nomination and Compensation Committee, with the purpose that the majority of the members of said Committee will hold the condition of Outside Independent Director.
The above appointment will be agreed, if appropriate, by the Company’s Board of Directors scheduled for the day of the Annual Shareholders Meeting 2011, after it, which shall approve the appointment of Mr. Fernandez as Director of the Company.
55. The Nomination Committee should have the following functions in addition to those stated in earlier recommendations:
a) Evaluate the balance of skills, knowledge and experience on the board, define the roles and capabilities required of the candidates to fill each vacancy, and decide the time and dedication necessary for them to properly perform their duties.
b) Examine or organise, in appropriate form the succession of the chairman and the chief executive, making recommendations to the board so the handover proceeds in a planned and orderly manner.
Translation of the original in Spanish. In case of any discrepancy, the Spanish version prevails.
69
c) Report on the senior officer appointments and removals which the chief executive proposes to the board.
d) Report to the board on the gender diversity issues discussed in Recommendation 14 of this Code.
See section: B.2.3
Partial compliance
As mentioned in respect of Recommendation 8 above, the Company considers that the power to remove senior officers of the company should be reserved to the chief executive, since they are positions within his trust and responsibility.
56. The Nomination Committee should consult with the company’s Chairman and chief executive, especially on matters relating to executive directors.
Any board member may suggest directorship candidates to the Nomination Committee for its consideration.
Comply
57. The Remuneration Committee should have the following functions in addition to those stated in earlier recommendations:
a) Make proposals to the Board of Directors regarding:
i) The remuneration policy for directors and senior officers;
ii) The individual remuneration and other contractual conditions of executive directors.
iii) The standard conditions for senior officer employment contracts.
b) Oversee compliance with the remuneration policy set by the company.
See sections: B.1.14, B.2.3
Comply
58. The Remuneration Committee should consult with the Chairman and chief executive, especially on matters relating to executive directors and senior officers.
Comply
G OTHER INFORMATION OF INTEREST
If you consider there to be an important principle or aspect regarding the corporate governance practices applied by your company that have not been mentioned in this report, indicate them below and explain the contents.
This section may be used to include any other information, clarification or qualification relating to the previous sections of the report.
In particular, state whether the company is subject to any laws other than the laws of Spain on corporate governance and, if this is the case, include whatever information
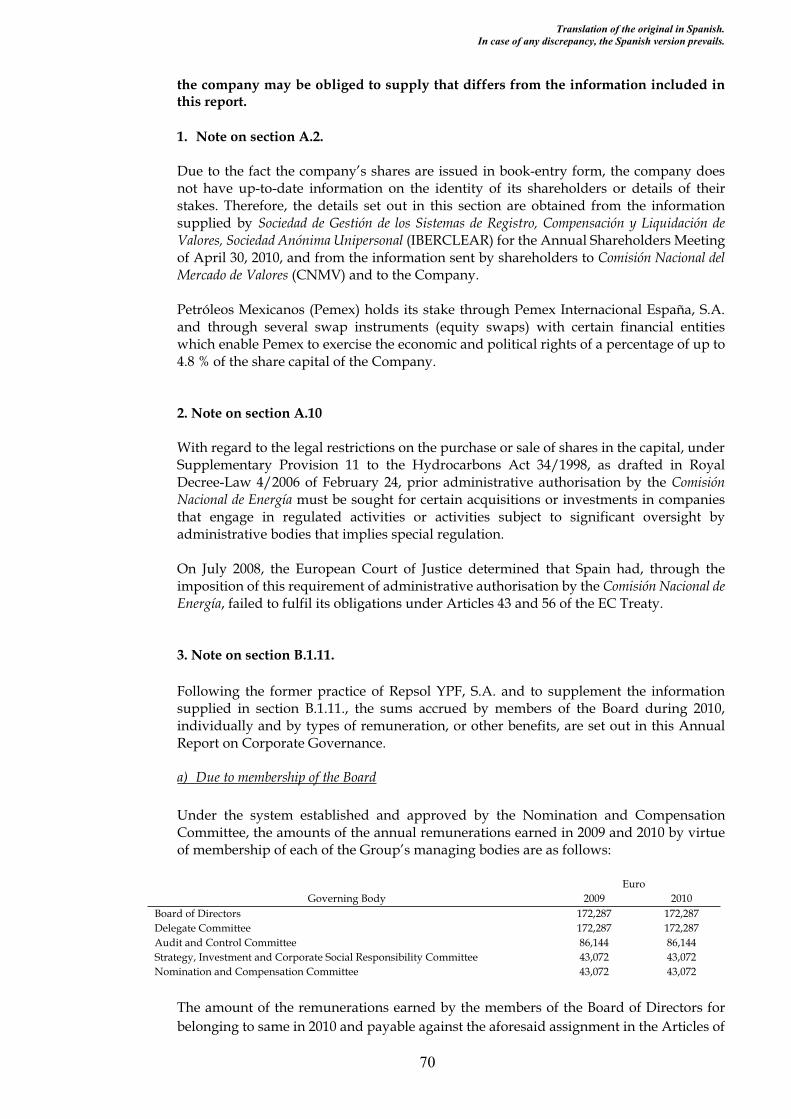
Translation of the original in Spanish. In case of any discrepancy, the Spanish version prevails.
70
the company may be obliged to supply that differs from the information included in this report.
1. Note on section A.2.
Due to the fact the company’s shares are issued in book-entry form, the company does not have up-to-date information on the identity of its shareholders or details of their stakes. Therefore, the details set out in this section are obtained from the information supplied by Sociedad de Gestión de los Sistemas de Registro, Compensación y Liquidación de Valores, Sociedad Anónima Unipersonal (IBERCLEAR) for the Annual Shareholders Meeting of April 30, 2010, and from the information sent by shareholders to Comisión Nacional del Mercado de Valores (CNMV) and to the Company.
Petróleos Mexicanos (Pemex) holds its stake through Pemex Internacional España, S.A. and through several swap instruments (equity swaps) with certain financial entities which enable Pemex to exercise the economic and political rights of a percentage of up to 4.8 % of the share capital of the Company.
2. Note on section A.10
With regard to the legal restrictions on the purchase or sale of shares in the capital, under Supplementary Provision 11 to the Hydrocarbons Act 34/1998, as drafted in Royal Decree-Law 4/2006 of February 24, prior administrative authorisation by the Comisión Nacional de Energía must be sought for certain acquisitions or investments in companies that engage in regulated activities or activities subject to significant oversight by administrative bodies that implies special regulation.
On July 2008, the European Court of Justice determined that Spain had, through the imposition of this requirement of administrative authorisation by the Comisión Nacional de Energía, failed to fulfil its obligations under Articles 43 and 56 of the EC Treaty.
3. Note on section B.1.11.
Following the former practice of Repsol YPF, S.A. and to supplement the information supplied in section B.1.11., the sums accrued by members of the Board during 2010, individually and by types of remuneration, or other benefits, are set out in this Annual Report on Corporate Governance.
a) Due to membership of the Board
Under the system established and approved by the Nomination and Compensation Committee, the amounts of the annual remunerations earned in 2009 and 2010 by virtue of membership of each of the Group’s managing bodies are as follows:
Euro Governing Body 2009 2010
Board of Directors 172,287 172,287 Delegate Committee 172,287 172,287 Audit and Control Committee 86,144 86,144 Strategy, Investment and Corporate Social Responsibility Committee 43,072 43,072Nomination and Compensation Committee 43,072 43,072
The amount of the remunerations earned by the members of the Board of Directors for belonging to same in 2010 and payable against the aforesaid assignment in the Articles of
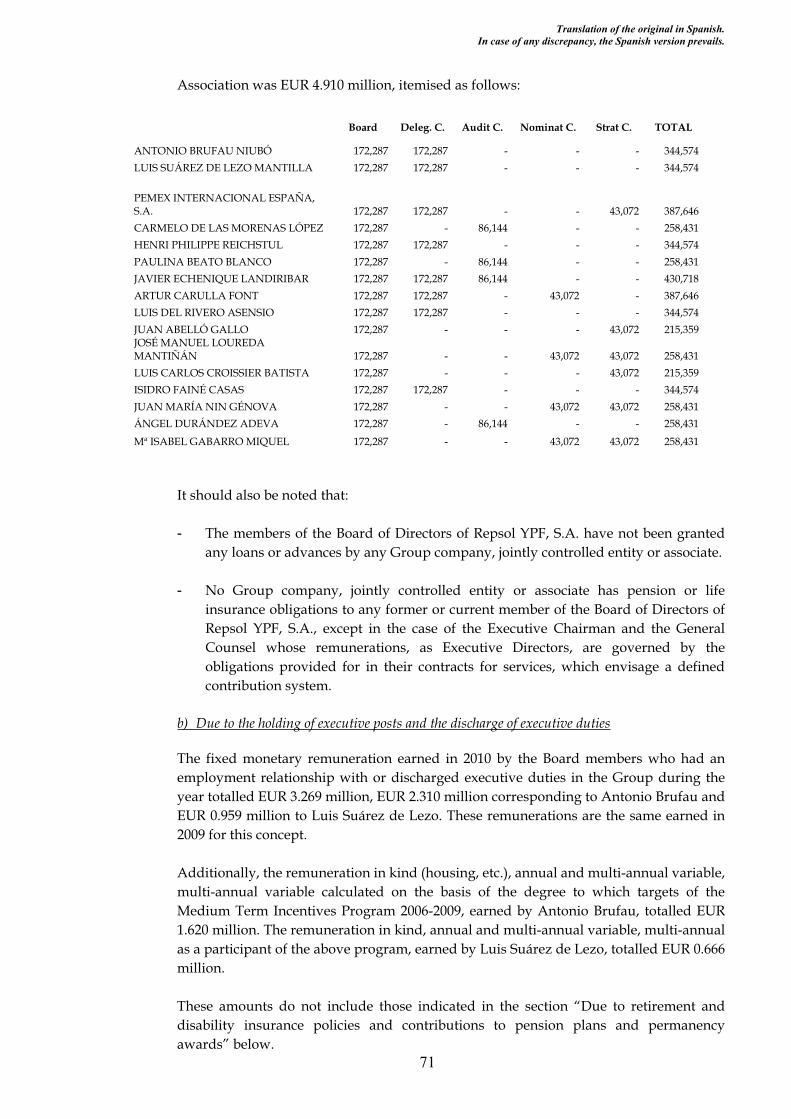
Translation of the original in Spanish. In case of any discrepancy, the Spanish version prevails.
71
Association was EUR 4.910 million, itemised as follows:
Board Deleg. C. Audit C. Nominat C. Strat C. TOTAL
ANTONIO BRUFAU NIUBÓ 172,287 172,287 - - - 344,574LUIS SUÁREZ DE LEZO MANTILLA 172,287 172,287 - - - 344,574
PEMEX INTERNACIONAL ESPAÑA, S.A. 172,287 172,287 - - 43,072 387,646CARMELO DE LAS MORENAS LÓPEZ 172,287 - 86,144 - - 258,431HENRI PHILIPPE REICHSTUL 172,287 172,287 - - - 344,574PAULINA BEATO BLANCO 172,287 - 86,144 - - 258,431JAVIER ECHENIQUE LANDIRIBAR 172,287 172,287 86,144 - - 430,718ARTUR CARULLA FONT 172,287 172,287 - 43,072 - 387,646LUIS DEL RIVERO ASENSIO 172,287 172,287 - - - 344,574JUAN ABELLÓ GALLO 172,287 - - - 43,072 215,359JOSÉ MANUEL LOUREDA MANTIÑÁN 172,287 - - 43,072 43,072 258,431LUIS CARLOS CROISSIER BATISTA 172,287 - - - 43,072 215,359ISIDRO FAINÉ CASAS 172,287 172,287 - - - 344,574JUAN MARÍA NIN GÉNOVA 172,287 - - 43,072 43,072 258,431ÁNGEL DURÁNDEZ ADEVA 172,287 - 86,144 - - 258,431
Mª ISABEL GABARRO MIQUEL 172,287 - - 43,072 43,072 258,431
It should also be noted that:
- The members of the Board of Directors of Repsol YPF, S.A. have not been granted any loans or advances by any Group company, jointly controlled entity or associate.
- No Group company, jointly controlled entity or associate has pension or life insurance obligations to any former or current member of the Board of Directors of Repsol YPF, S.A., except in the case of the Executive Chairman and the General Counsel whose remunerations, as Executive Directors, are governed by the obligations provided for in their contracts for services, which envisage a defined contribution system.
b) Due to the holding of executive posts and the discharge of executive duties
The fixed monetary remuneration earned in 2010 by the Board members who had an employment relationship with or discharged executive duties in the Group during the year totalled EUR 3.269 million, EUR 2.310 million corresponding to Antonio Brufau and EUR 0.959 million to Luis Suárez de Lezo. These remunerations are the same earned in 2009 for this concept.
Additionally, the remuneration in kind (housing, etc.), annual and multi-annual variable, multi-annual variable calculated on the basis of the degree to which targets of the Medium Term Incentives Program 2006-2009, earned by Antonio Brufau, totalled EUR 1.620 million. The remuneration in kind, annual and multi-annual variable, multi-annual as a participant of the above program, earned by Luis Suárez de Lezo, totalled EUR 0.666 million.
These amounts do not include those indicated in the section “Due to retirement and disability insurance policies and contributions to pension plans and permanency awards” below.
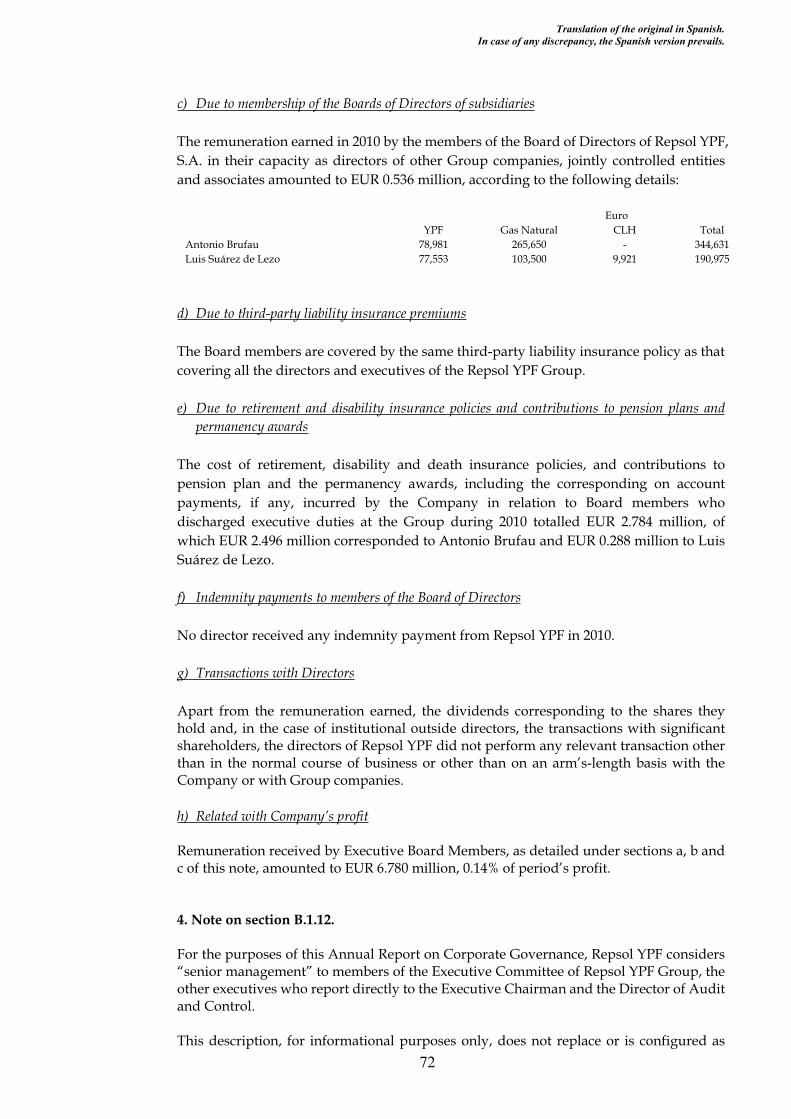
Translation of the original in Spanish. In case of any discrepancy, the Spanish version prevails.
72
c) Due to membership of the Boards of Directors of subsidiaries
The remuneration earned in 2010 by the members of the Board of Directors of Repsol YPF, S.A. in their capacity as directors of other Group companies, jointly controlled entities and associates amounted to EUR 0.536 million, according to the following details:
Euro YPF Gas Natural CLH Total
Antonio Brufau 78,981 265,650 - 344,631 Luis Suárez de Lezo 77,553 103,500 9,921 190,975
d) Due to third-party liability insurance premiums
The Board members are covered by the same third-party liability insurance policy as that covering all the directors and executives of the Repsol YPF Group.
e) Due to retirement and disability insurance policies and contributions to pension plans and permanency awards
The cost of retirement, disability and death insurance policies, and contributions to pension plan and the permanency awards, including the corresponding on account payments, if any, incurred by the Company in relation to Board members who discharged executive duties at the Group during 2010 totalled EUR 2.784 million, of which EUR 2.496 million corresponded to Antonio Brufau and EUR 0.288 million to Luis Suárez de Lezo.
f) Indemnity payments to members of the Board of Directors
No director received any indemnity payment from Repsol YPF in 2010.
g) Transactions with Directors
Apart from the remuneration earned, the dividends corresponding to the shares they hold and, in the case of institutional outside directors, the transactions with significant shareholders, the directors of Repsol YPF did not perform any relevant transaction other than in the normal course of business or other than on an arm’s-length basis with the Company or with Group companies.
h) Related with Company’s profit
Remuneration received by Executive Board Members, as detailed under sections a, b and c of this note, amounted to EUR 6.780 million, 0.14% of period’s profit.
4. Note on section B.1.12.
For the purposes of this Annual Report on Corporate Governance, Repsol YPF considers “senior management” to members of the Executive Committee of Repsol YPF Group, the other executives who report directly to the Executive Chairman and the Director of Audit and Control.
This description, for informational purposes only, does not replace or is configured as
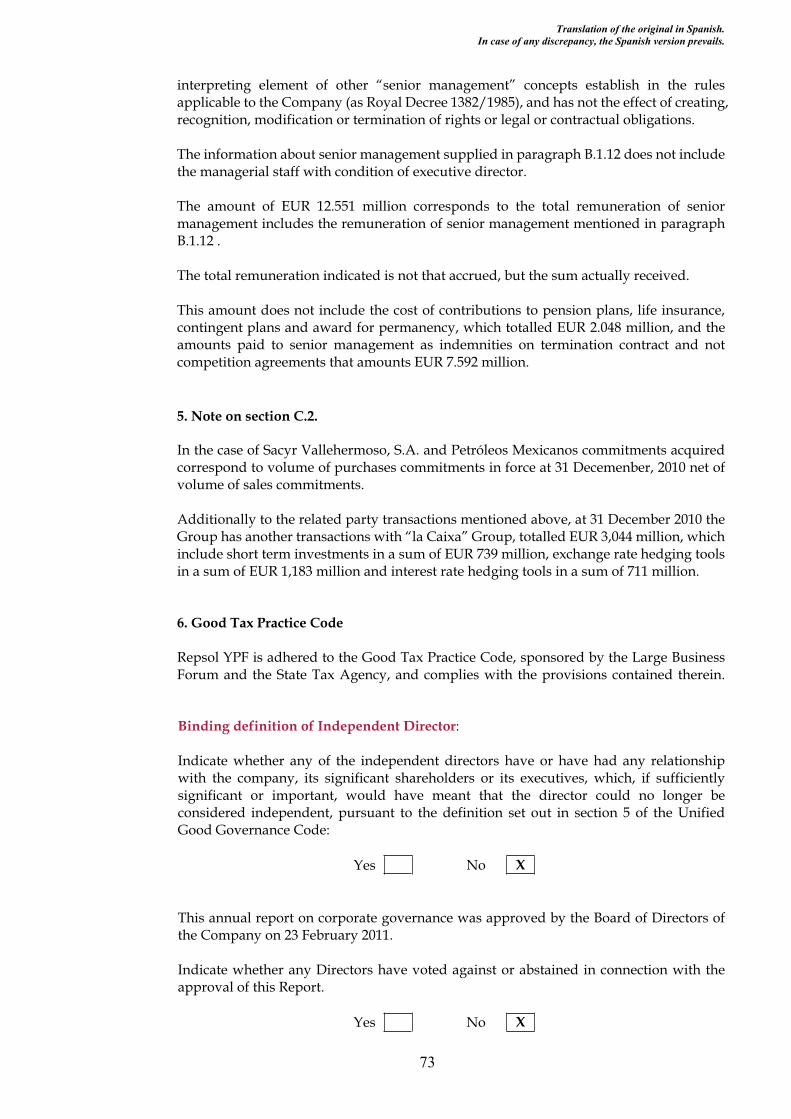
Translation of the original in Spanish. In case of any discrepancy, the Spanish version prevails.
73
interpreting element of other “senior management” concepts establish in the rules applicable to the Company (as Royal Decree 1382/1985), and has not the effect of creating, recognition, modification or termination of rights or legal or contractual obligations.
The information about senior management supplied in paragraph B.1.12 does not include the managerial staff with condition of executive director.
The amount of EUR 12.551 million corresponds to the total remuneration of senior management includes the remuneration of senior management mentioned in paragraph B.1.12 .
The total remuneration indicated is not that accrued, but the sum actually received.
This amount does not include the cost of contributions to pension plans, life insurance, contingent plans and award for permanency, which totalled EUR 2.048 million, and the amounts paid to senior management as indemnities on termination contract and not competition agreements that amounts EUR 7.592 million.
5. Note on section C.2.
In the case of Sacyr Vallehermoso, S.A. and Petróleos Mexicanos commitments acquired correspond to volume of purchases commitments in force at 31 Decemenber, 2010 net of volume of sales commitments.
Additionally to the related party transactions mentioned above, at 31 December 2010 the Group has another transactions with “la Caixa” Group, totalled EUR 3,044 million, which include short term investments in a sum of EUR 739 million, exchange rate hedging tools in a sum of EUR 1,183 million and interest rate hedging tools in a sum of 711 million.
6. Good Tax Practice Code
Repsol YPF is adhered to the Good Tax Practice Code, sponsored by the Large Business Forum and the State Tax Agency, and complies with the provisions contained therein.
Binding definition of Independent Director:
Indicate whether any of the independent directors have or have had any relationship with the company, its significant shareholders or its executives, which, if sufficiently significant or important, would have meant that the director could no longer be considered independent, pursuant to the definition set out in section 5 of the Unified Good Governance Code:
Yes No X
This annual report on corporate governance was approved by the Board of Directors of the Company on 23 February 2011.
Indicate whether any Directors have voted against or abstained in connection with the approval of this Report.
Yes No X
November 24, 2011
An increase of 23.53 percent
REPSOL APPROVES AN INTERIM DIVIDEND OF 0.525 EUROS PER SHARE
Repsol YPF, S.A.’s Board of Directors today agreed to distribute a gross interim dividend of 0.525 euros per share from the 2010 earnings. This dividend represents a 23.53% increase compared to the previous year and would be equivalent to a total dividend of 1.05 euros per share for the year 2010. This dividend reflects the positive development in the company’s earnings throughout 2010 and is in accordance with the Repsol’s policy of financial discipline combined with appropriate shareholder return, as laid out in the company’s strategic plan. Payment will be made on January 13(*). Additionally, the Board of Directors was informed of the appointment of Jose Manuel Carrera Panizzo as representative of Pemex Internacional España on the Board of Directors and its Committees, replacing Raul Cardoso Maycotte. (*) Information for holders of American Depositary Shares (ADSs): The interim gross dividend will be transferred to the Depositary, Bank of New York Mellon, on January 13, 2011. Owners of records of ADSs at the close of business on January 12, 2011, will be entitled to receive the dividend when payable by the Bank of New York Mellon, which is expected to be on January 24, 2011.
1
Official Notice
Corporate Division of
Finance and Corporate Services
Paseo de la Castellana, 278-280 28046 Madrid Spain
Tel. 34 917 538 100 34 917 538 000 Fax 34 913 489 494 www.repsol.com
Madrid, November 25th, 2010 Upon request of its majority shareholder Repsol YPF, S.A., the Board of Directors of YPF, S.A. approved today the preparation and filing before the U.S. Securities and Exchange Commission (SEC) of a Form F-3 in accordance with the applicable U.S. Law. The filing of the Form F-3 will make possible an increase of the liquidity of the shares of YPF, S.A. through the sale by Repsol YPF, S.A., Repsol YPF Capital, S.L. and Caveant, S.A. (together, the “Repsol YPF Group”) of up to 58,996,919 Class D shares (including in the form of ADSs), representing a 15% of the share capital and voting rights of YPF, S.A. Such Form F-3 will replace the one previously registered on February 29, 2008 with the SEC and will offer Repsol YPF Group a flexible framework for the sale of YPF, S.A. Class D shares or ADSs in the form considered more convenient in each moment, including private transactions or on any stock exchange, market or trading facility on which Class D shares or ADSs are traded. The determination of the number of securities, the timing, convenience, offer and sale mechanism, the price or the mechanism for its determination as well as the rest of the economic and legal terms of the transactions will be decided by the relevant seller company.
2
Hecho Relevante
Finan Dirección General
Económico Financiera Paseo de la Castellana, 278-280 28046 Madrid España
Tls. 91 348 81 00 91 348 80 00 Fax 91 314 28 21 91 348 94 94 www.repsolypf.com
Madrid, December 7, 2010 YPF has made the following announcement: As part of the 2010/2014 exploration and production development programme, four tight gas exploration wells were drilled in the Loma La Lata area, in the Neuquen Province. The presence of 4.5 TCF of non-conventional gas was verified. At the same time, two wells drilled as part of the exploratory work being carried out in the Neuquen Province revealed that the Vaca Muerta formation presents similar conditions to shale gas-producing basins in the United States. The volume of non-conventional oil and gas existing in our acreage will be defined once the appraisal of the discoveries and exploration of that geological concept are completed in the Neuquen Basin. Given that these projects are at an initial phase, there is not enough information to quantify these resources. Finally, YPF mentions that in 2010 the oil production decline has been reversed and the company estimates it will replace 100% of the oil produced in the year.
3
Madrid, December 14th 2010
Completing the divestment of non-integrated downstream assets in Latin America
REPSOL SELLS STAKE IN REFAP REFINERY FOR $350 MILLION
Additionally Repsol will reduce debt by approximately $500 million.
The sale will free Repsol of $355 million in investment commitments.
The deal marks the completion of the programme to divest non-integrated downstream assets in Latin America.
At the start of October Repsol signed an alliance with China’s Sinopec to create one of Latin-America’s largest privately-owned energy companies.
Repsol has agreed to sell to Petrobras its 30% stake in the Alberto Pasqualini Refinery (REFAP) in the Brazilian state of Rio Grande do Sul. Following the transaction, Petrobras becomes the only shareholder of the refinery, which has a nominal capacity of 190,000 bbld.
Under the terms of the agreement, Repsol will receive $350 million and additionally will reduce its consolidated net debt associated to its stake in the REFAP refinery by a further $500 million. The sale will free Repsol from investment commitments of $355 million corresponding to its stake in REFAP. The difference between the accounting value of REFAP and its sale price, once the appreciation of the local currency is taken into consideration, is of approximately -$60 million.
4
Official Notice
2
Completion of non-strategic assets divestment programme
The deal is part of the Repsol Group’s divestment of non-strategic assets as laid out in the Horizon 2014 strategic plan. Specifically, this deal completes the process of divesting stakes in non-integrated downstream assets in Latin-America which Repsol began in 2007.
The process included the sale of service stations in Chile (2007) Ecuador (2008) and Brazil (2008), and the stakes in the Brazilian refineries Manguinhos (2008) and REFAP (2010). In total, Repsol obtains $700 million by this process and reduces consolidated debt by approximately $500 million.
Repsol in Brazil
Repsol is one of the largest independent upstream operators in Brazil and the country’s third-largest oil producer in 2009. It is the largest foreign owner of exploratory blocks, with presence in the Santos, Campos and Espiritu Santo Basins. Repsol has a strategic presence in Brazil’s pre-salt areas with the most potential and, together with Petrobras is leading exploration in the prolific Santos basin.
The company’s diversified projects portfolio in Brazil includes a producing field (Albacora Leste), one block under development (BM-S-7: Piracuca BA), two planned pilot projects (BM-S-9: Guara and Carioca) and fourteen exploration blocks with significant potential.
In October of 2010, Repsol signed an agreement with Sinopec to jointly develop exploration and production projects in Brazil and to create one of Latin-America’s largest energy companies, valued at $17.7 billion. The deal is still pending authorization by the competent authorities. Brazil’s offshore is one of the world’s fastest-growing oil regions. The agreement between Repsol and Sinopec highlights the significant international interest in the historic moment which Brazil is experiencing, especially in the subsalt plays.
5
Official Notice
Chief Financial
Officer
Paseo de la Castellana, 278-280 28046 Madrid Spain
Tel. 34 917 538 100 34 917 538 000 Fax 34 913 489 494 www.repsol.com
Additionally, agrees to issue warrants for a further 1.63%
Madrid, December 23rd 2010
Repsol has agreed to sell 3.3% of YPF’s share capital to Eton Park and Capital for $500 million.
The $39/share deal is in line with the most significant sales carried out during the last few weeks with YPF stock.
Eton Park has acquired a 1.63% stake in YPF, for $250 million. Similarly, Capital has acquired an identical stake at the same price.
Additionally, Eton Park acquired warrants to buy, in one or multiple transactions, a further 1.63% of YPF at $43/share. The warrants are exercisable until January 17, 2012.
• Repsol reaches an agreement with funds advised by Eton Park Capital Management (“Eton Park”) and funds advised by Capital Guardian Trust Company and Capital International, Inc. (“Capital”) to sell a 1.63% stake in YPF to each.
• These transactions are part of Repsol's strategic plan to rebalance its portfolio of assets.
• The $39/share transactions are in line with the most significant sales carried out in the last few weeks.
• Additionally, Eton Park acquired warrants to purchase up to an additional 1.63% of YPF, exercisable until January 2012 at $43/share.
• YPF is Argentina’s largest privately-owned company and one of Latin-America’s leading energy companies.
• “These transactions help to increase the value of Repsol and brings us closer to achieving one of our key strategic goals,” said Repsol Chairman Antonio Brufau.
REPSOL AGREES TO SELL ANOTHER 3.3% OF YPF FOR $500 MILLION
6
Official Notice
2
The shares covered by these private transactions, in the form of American Depositary Shares (ADS), are subject to transfer restrictions and cannot be resold until a possible resale by Eton Park or Capital is registered with the US Securities and Exchange Commission, or pursuant to an exemption from the registration requirements under the US securities laws. Repsol has agreed to cause the resale of the ADS sold in these transactions (including any ADSs underlying the warrants sold to Eton Park), to be registered with the SEC.
After these transactions, YPF’s ownership structure is as follows: Repsol Group (79.84%), Petersen Group (15.46%) and a 4.69% free float.
This process is part of Repsol’s strategy, as laid out in the Horizon 2014 plan, to partially divest in YPF to rebalance its global asset portfolio.
YPF is Argentina’s largest company, the largest investor in the country, the second-largest exporter and one of the biggest employers. It is market-leader in exploration and production, refining and marketing and chemicals and provides more than 30,000 direct and indirect jobs. YPF plays in important social role, contributing permanently with numerous programs to the communities in which it does business.
Repsol has granted Capital a put option to sell the ADS at $39/share in proportion to the amount by which the stock acquired by Capital exceeds 15% of YPF’s public float at December 22, 2011. Given that YPF’s current free float is already 4.7%, an additional 6.2% needs to be sold in the market to avoid the option being exercised. Independently of these transactions, YPF filed a registration statement with the United States’ Securities Exchange Commission (SEC) in November, not yet effective, so that Repsol may sell as much as 15% of YPF shares in the market.
The ADS subject to this transaction have not been registered under the US Securities Act of 1933 and may not be offered or sold in the United States absent registration or an applicable exemption from registration requirements.
7
Madrid, December 28th 2010
Antonio Brufau: With this transaction, concluded in a short time, we have created one of Latin America’s largest energy companies, in one of the countries with greatest economic push in the world.
The Shareholders’ Meeting of Repsol Brazil, held today in Rio de Janeiro (Brazil) approved a capital increase worth $7.1 billion, subscribed in its entirety by Sinopec.
Repsol holds 60% of the share capital of the Brazilian company and Sinopec the remaining 40%. These shareholdings are reflected in the composition of the Board of Directors and company management.
The Board of Directors will be chaired by Nemesio Fernandez-Cuesta and, Graciano Rodriguez Mateos will continue as Chief Executive Officer (CEO).
This transaction generates for Repsol an accounting capital gain of $3.8 billion.
The funds generated by this transaction ensure the necessary investments for the development of the Brazilian offshore assets, which include some of the world’s largest exploratory discoveries such as Guara and Carioca.
“This agreement becomes a milestone in the development of Repsol’s exploratory strategy and is a good value reflection of our commitment in Brazil, with a great industrial partner as is Sinopec”, said Repsol Chairman, Antonio Brufau.
REPSOL SUCCESSFULLY COMPLETES THE CAPITAL INCREASE IN BRAZIL, SUBSCRIBED IN ITS ENTIRETY BY SINOPEC
Repsol and Sinopec today successfully closed the agreement reached in October to jointly develop the exploration and production of its Brazil offshore assets and to create one of the Latin America’s largest private energy companies. After obtaining the necessary authorizations from the authorities of the People’s Republic of China, Sinopec has subscribed in its entirety for a capital increase of Repsol Brazil of $7.1 billion, which has resulted in a company valued at $17.8 billion.
After completing this transaction in the shareholders' meeting held today in Rio de Janeiro, Repsol holds 60% of the shares of Repsol Brazil while Sinopec holds the remaining 40%. These shareholdings are reflected in the composition of the Board of Directors of the company, made up
8
by 10 members and chaired by Nemesio Fernandez-Cuesta, Repsol YPF’s Executive Managing Director of Upstream. Both companies have signed a shareholders’ agreement to jointly develop the current exploration and production businesses in Brazil, bringing together the necessary resources and sharing certain operational and financial strategic decisions.
In order to determine the results of this transaction in its consolidated financial statements, Repsol has applied the criteria laid out in NIC 31. This has resulted in a capital gain of $3.8 billion corresponding to 40% of the value assigned to Repsol's assets in Brazil, after reducing their book value.
The injection of funds by Sinopec in this transaction will allow Repsol Sinopec Brazil to fully develop all of its current projects, which include some of the world’s largest exploratory discoveries in recent years. Brazil’s Offshore boasts one of the world’s fastest-growing oil and gas reserves.
The agreement between Repsol and Sinopec highlights the enormous international interest in the pre-salt exploration and production activity led by Petrobras, where Repsol Brazil has a very high profile due to the quality of its assets in that area.
Both Repsol and Sinopec will continue their expansion plans in Brazil and will participate, jointly or independently, in future bids in Brazil.
Antonio Brufau said, “This agreement becomes a milestone in the development of Repsol’s exploratory strategy and is a good value reflection of our commitment in Brazil, with a great industrial partner as is Sinopec”.
9
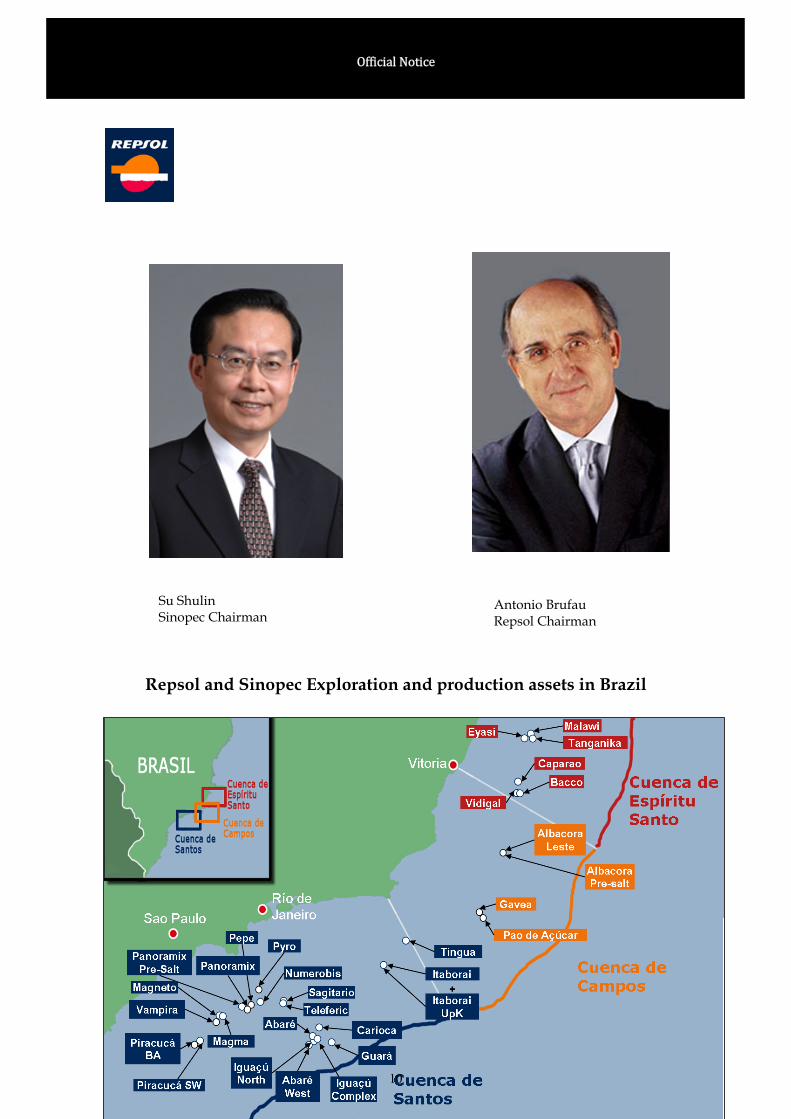
Official Notice
Su Shulin Sinopec Chairman
Antonio Brufau Repsol Chairman
Repsol and Sinopec Exploration and production assets in Brazil
310
Official Notice
Chief Financial
Officer
Paseo de la Castellana, 278-280 28046 Madrid Spain
Tel. 34 917 538 100 34 917 538 000 Fax 34 913 489 494 www.repsol.com
Changes in Senior Management
New appointments to the Executive Committee of Repsol YPF Repsol YPF announces today, December 30th 2010, the approval of the following appointments: Miguel Angel Devesa del Barrio, until now Corporate Director of Strategy and Corporate Development, has been appointed Chief Financial Officer, replacing Fernando Ramirez Mazarredo, who after reaching an agreement with the company, and for personal reasons will be leaving the Group. Repsol YPF acknowledges and recognises his hard work and dedication during his term in the Group. Also, Begoña Elices García, until now Corporate Director of Communication and Chairman's Office, has been appointed ED for Communication and Chairman's Office. In January 2011, Miguel Ángel Devesa and Begoña Elices will be members of the Executive Committee of Repsol YPF. Additionally, the following changes have been made:
• The function of the Corporate Directorate of Strategy and Corporate Development will be incorporated into the Chief Financial Office.
• Both the Internal Audit and Reserves Control Directorate, that report to the Audit and
Control Committee, will pass from the Chief Financial Office to depend functionally on the General Counsel Office and Secretariat of the Board of Directors, hence strengthening their independence.
• Investor Relations will report directly to the Chairman
11
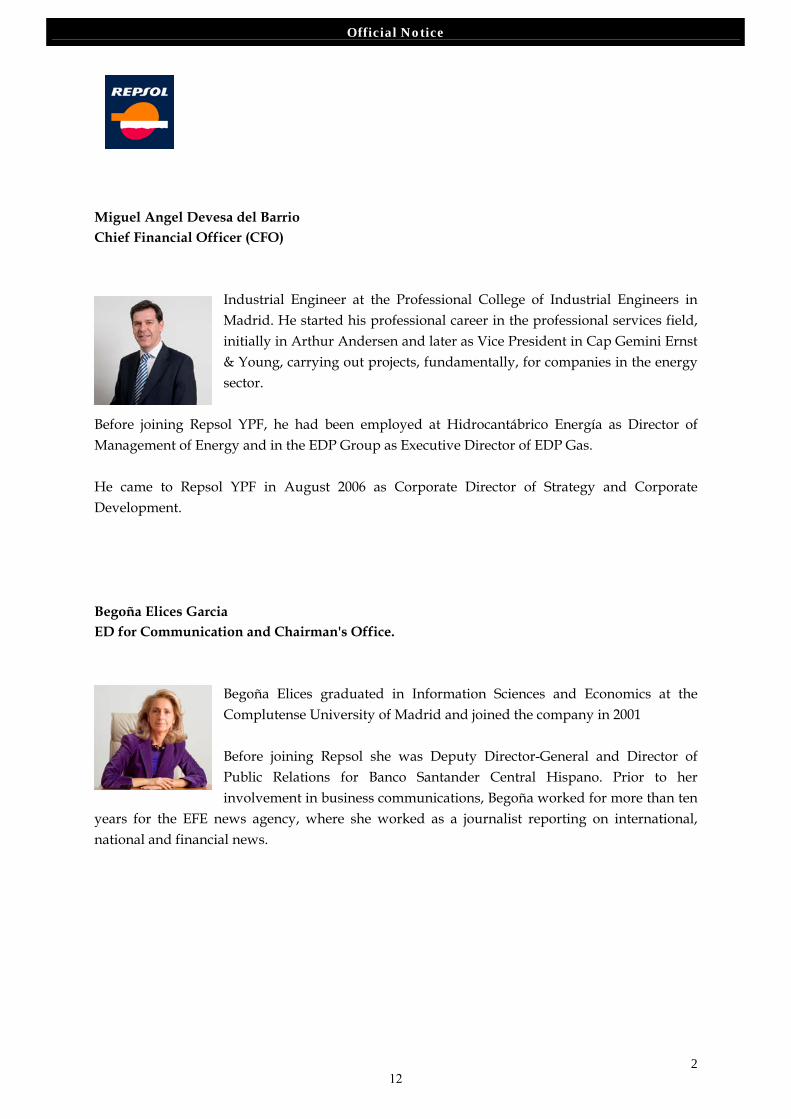
Official Notice
2
Miguel Angel Devesa del Barrio Chief Financial Officer (CFO)
Industrial Engineer at the Professional College of Industrial Engineers in Madrid. He started his professional career in the professional services field, initially in Arthur Andersen and later as Vice President in Cap Gemini Ernst & Young, carrying out projects, fundamentally, for companies in the energy sector.
Before joining Repsol YPF, he had been employed at Hidrocantábrico Energía as Director of Management of Energy and in the EDP Group as Executive Director of EDP Gas. He came to Repsol YPF in August 2006 as Corporate Director of Strategy and Corporate Development. Begoña Elices Garcia ED for Communication and Chairman's Office.
Begoña Elices graduated in Information Sciences and Economics at the Complutense University of Madrid and joined the company in 2001 Before joining Repsol she was Deputy Director-General and Director of Public Relations for Banco Santander Central Hispano. Prior to her involvement in business communications, Begoña worked for more than ten
years for the EFE news agency, where she worked as a journalist reporting on international, national and financial news.
12
Official Notice
Chief Financial
Officer
Paseo de la Castellana, 278-280 28046 Madrid Spain
Tel. 34 917 538 100 34 917 538 000 Fax 34 913 489 494 www.repsol.com
Redemption of 100% of Repsol International Capital Limited’s
Series A Preference Shares
January 3rd, 2011 The Board of Directors of Repsol International Capital Limited (RIC) has authorized the redemption of 100% of the outstanding Series A Preference Shares issued by RIC and guaranteed by Repsol YPF (the Series A Preference Shares). The Series A Preference Shares are currently listed on the NYSE under the symbol REPPRA (CUSIP G7513K103, ISIN No. KYG7513K1031, Common Code 011340539). On December 30th, 2010, RIC’s Board of Directors resolved to carry out the redemption pursuant to the terms of the Memorandum and Articles of Association of the Company as amended from time to time, a Prospectus issued by the Company dated October 10th, 1997 and a Prospectus Supplement issued by the Company dated October 1997, of 100% of the outstanding Series A Preference Shares at the stated redemption amount of $25.00 per Series A Preference Share, plus accrued and unpaid dividends thereon from and including December 31st, 2010 (dividend date of the last dividend paid) to but excluding the date of redemption, amounting to $0.20 per Preference Share. Notice of redemption will be mailed to holders of the Series A Preference Shares on January 4th, 2011, and the date of redemption has been set for February 8th, 2011.
13
© Repsol YPF SA, – January 2011
Analyst’s Day – London, January 27th
Brief Exploration Update
January 201114
© Repsol YPF SA, – January 2011
Disclaimer
ALL RIGHTS ARE RESERVED© REPSOL YPF, S.A. 2010
Esta presentación es propiedad exclusiva de Repsol YPF, S.A. y su reproducción total o parcial está totalmente prohibida y queda amparada por la legislación vigente. Los contraventores serán perseguidos legalmente tanto en España como en el extranjero. El uso, copia, reproducción o venta de esta publicación, sólo podrárealizarse con autorización expresa y por escrito de Repsol YPF, S.A.
Este documento contiene información y afirmaciones o declaraciones que constituyen estimaciones o proyecciones de futuro sobre Repsol YPF. Dichas estimaciones o proyecciones pueden incluir declaraciones sobre planes, objetivos y expectativas actuales, incluyendo declaraciones en relación con tendencias que afecten a la situación financiera de Repsol YPF, ratios financieros, resultados operativos, negocios, estrategia, concentración geográfica, volúmenes de producción y reservas, asícomo planes, expectativas u objetivos de Repsol YPF respecto de gastos de capital, negocios, estrategia, concentración geográfica, ahorros de costes, inversiones y políticas de dividendos. Dichas estimaciones o proyecciones pueden incluir también asunciones sobre futuras condiciones de tipo económico o de cualquier otro tipo, tales como los futuros precios del crudo u otros precios, márgenes de refino o marketing y tipos de cambio. Las estimaciones o proyecciones de futuro se identifican generalmente por el uso de términos como “espera”, “anticipa”, “pronostica”, “cree”, “estima”, “aprecia” y expresiones similares. Dichas declaraciones no constituyen garantías de un futuro cumplimiento, precios, márgenes, tipos de cambio o de cualquier otro suceso, y se encuentran sujetas a riesgos significativos, incertidumbres, cambios y otros factores que pueden estar fuera del control de Repsol YPF o que pueden ser difíciles de prever. Entre tales riesgos e incertidumbres están aquellos factores identificados en los documentos registrados por Repsol YPF y sus filiales en la Comisión Nacional del Mercado de Valores en España, en la Comisión Nacional de Valores en Argentina y en la Securities and Exchange Commission de los Estados Unidos de América.
Salvo en la medida que lo requiera la ley aplicable, Repsol YPF no asume ninguna obligación -aun cuando se publiquen nuevos datos o se produzcan nuevos hechos-de informar públicamente de la actualización o revisión de estas manifestaciones de futuro.
15
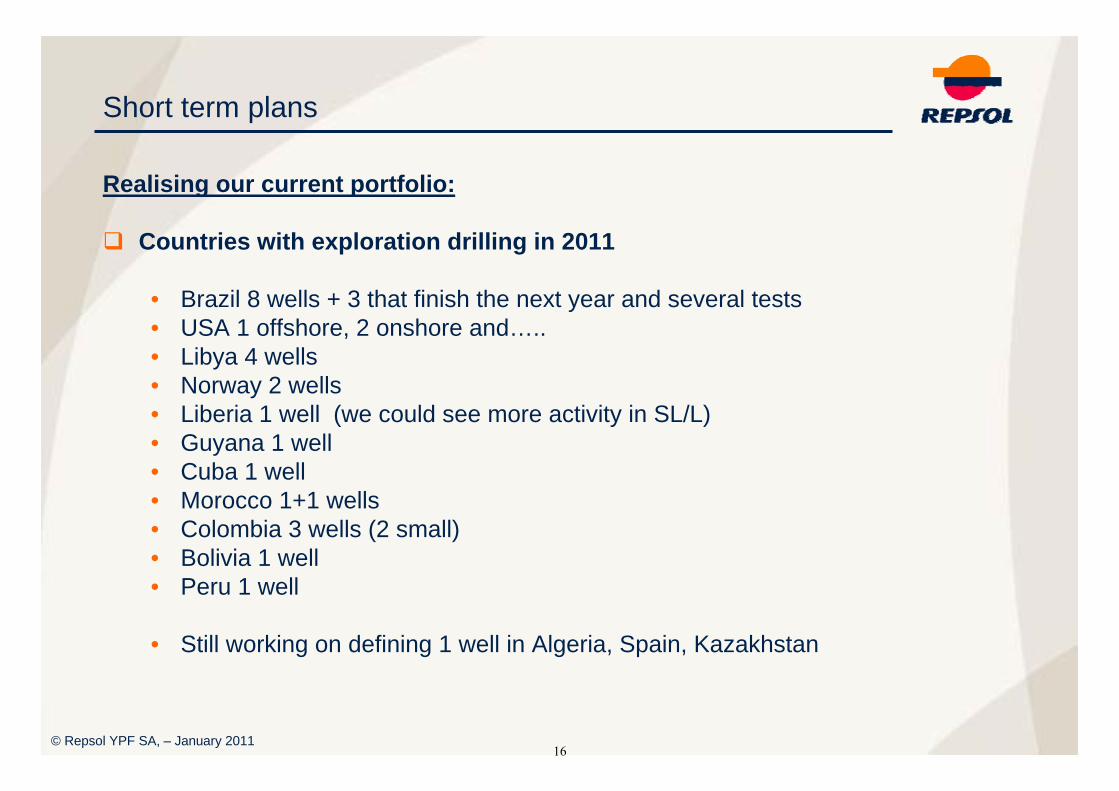
© Repsol YPF SA, – January 2011
Short term plans
Realising our current portfolio:
Countries with exploration drilling in 2011
• Brazil 8 wells + 3 that finish the next year and several tests• USA 1 offshore, 2 onshore and…..• Libya 4 wells• Norway 2 wells• Liberia 1 well (we could see more activity in SL/L)• Guyana 1 well• Cuba 1 well • Morocco 1+1 wells• Colombia 3 wells (2 small)• Bolivia 1 well• Peru 1 well
• Still working on defining 1 well in Algeria, Spain, Kazakhstan
16
© Repsol YPF SA, – January 2011
Short term plans
Realising our current portfolio:
Present operations
• Advanced 1 well in Oman
• In the final stages in two wells in Libya
• Casing 1 well in Brazil
And
• Drilling in Bolivia
• Spud 1 well onshore USA
17
© Repsol YPF SA, – January 2011
Short term plans
Building our future portfolio:
Main seismic programmes for 2011
• Norway offshore 3D
• Libya onshore 3D op
• Algeria onshore 3D op
• Indonesia offshore 2D op
• Russia onshore 2D op
• Brazil offshore 3D
• Colombia offshore 3D coop
• Several 3D spec acquisitions in onshore & offshore USA
18
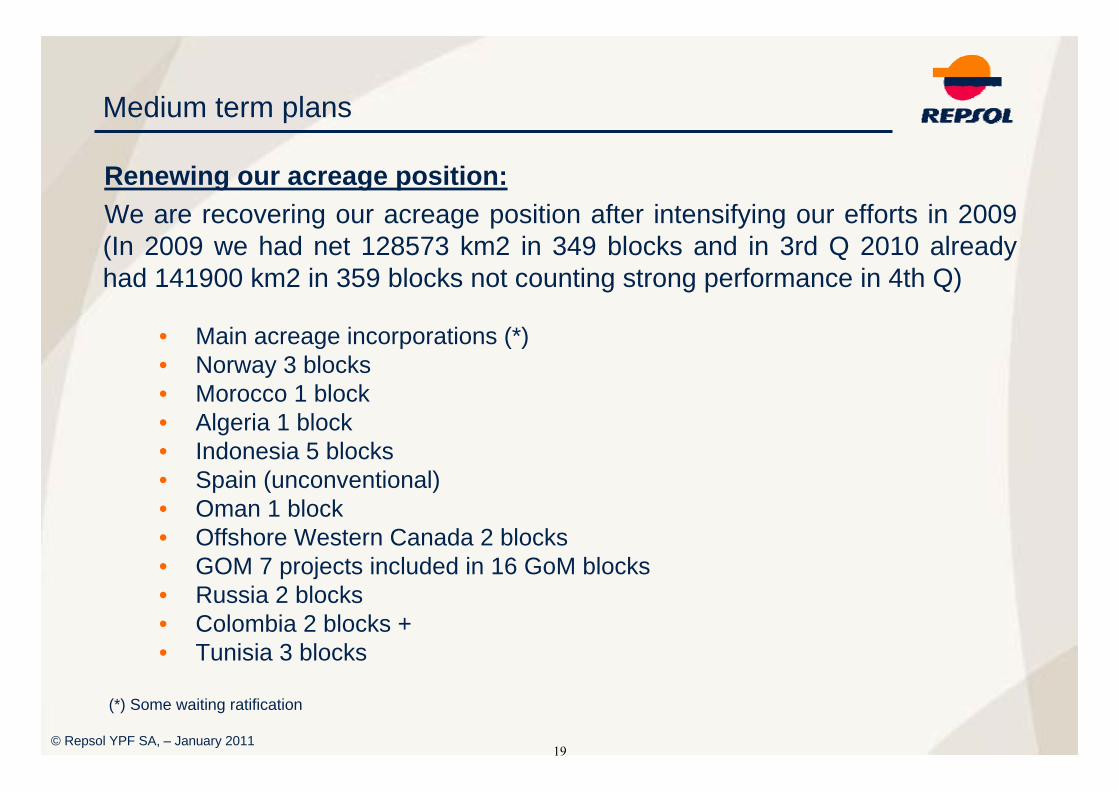
© Repsol YPF SA, – January 2011
Medium term plans
Renewing our acreage position:We are recovering our acreage position after intensifying our efforts in 2009 (In 2009 we had net 128573 km2 in 349 blocks and in 3rd Q 2010 already had 141900 km2 in 359 blocks not counting strong performance in 4th Q)
• Main acreage incorporations (*)• Norway 3 blocks• Morocco 1 block• Algeria 1 block• Indonesia 5 blocks • Spain (unconventional)• Oman 1 block• Offshore Western Canada 2 blocks• GOM 7 projects included in 16 GoM blocks• Russia 2 blocks• Colombia 2 blocks +• Tunisia 3 blocks
(*) Some waiting ratification
19
© Repsol YPF SA, – January 2011
Medium term plans
In spite of the hard external context we are succeeding in replacing our
acreage and are well positioned to continue capturing blocks in the areas
we have selected for growth
In this process, during 2010 we screened 230 farm in opportunities and
192 blocks that were included in bid rounds
20
© Repsol YPF SA, – January 2011
Continuing Medium to Long term plans
We will:
• Expand our efforts in West Africa (SL, L, EG, A+)
• Continue with our strategy of balancing North America offshore with more onshore opportunities
• Work and expand beyond Norway the Eastern North Atlantic Margin
• Continue looking for additional acreage in plays we are developing for the Mediterranean
• Expand the Tertiary Caribbean play
• Be ready for more opportunities in Brazil
• Mature our play in the Peruvian Subandean belt
• Exploit our presence in ME Caspian for more opportunities
21

© Repsol YPF SA, – January 2011
Analyst’s Day – London, January 27th
Brief Exploration Update
January 201122
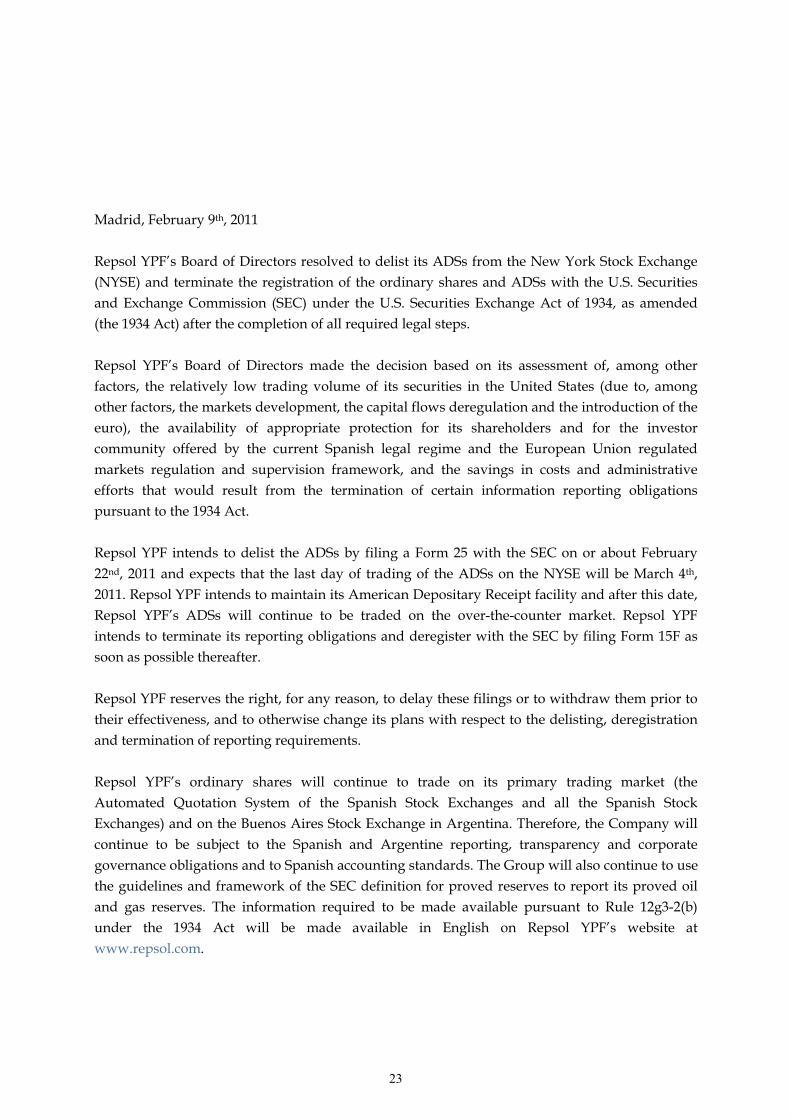
Madrid, February 9th, 2011 Repsol YPF’s Board of Directors resolved to delist its ADSs from the New York Stock Exchange (NYSE) and terminate the registration of the ordinary shares and ADSs with the U.S. Securities and Exchange Commission (SEC) under the U.S. Securities Exchange Act of 1934, as amended (the 1934 Act) after the completion of all required legal steps. Repsol YPF’s Board of Directors made the decision based on its assessment of, among other factors, the relatively low trading volume of its securities in the United States (due to, among other factors, the markets development, the capital flows deregulation and the introduction of the euro), the availability of appropriate protection for its shareholders and for the investor community offered by the current Spanish legal regime and the European Union regulated markets regulation and supervision framework, and the savings in costs and administrative efforts that would result from the termination of certain information reporting obligations pursuant to the 1934 Act. Repsol YPF intends to delist the ADSs by filing a Form 25 with the SEC on or about February 22nd, 2011 and expects that the last day of trading of the ADSs on the NYSE will be March 4th, 2011. Repsol YPF intends to maintain its American Depositary Receipt facility and after this date, Repsol YPF’s ADSs will continue to be traded on the over-the-counter market. Repsol YPF intends to terminate its reporting obligations and deregister with the SEC by filing Form 15F as soon as possible thereafter. Repsol YPF reserves the right, for any reason, to delay these filings or to withdraw them prior to their effectiveness, and to otherwise change its plans with respect to the delisting, deregistration and termination of reporting requirements.
Repsol YPF’s ordinary shares will continue to trade on its primary trading market (the Automated Quotation System of the Spanish Stock Exchanges and all the Spanish Stock Exchanges) and on the Buenos Aires Stock Exchange in Argentina. Therefore, the Company will continue to be subject to the Spanish and Argentine reporting, transparency and corporate governance obligations and to Spanish accounting standards. The Group will also continue to use the guidelines and framework of the SEC definition for proved reserves to report its proved oil and gas reserves. The information required to be made available pursuant to Rule 12g3-2(b) under the 1934 Act will be made available in English on Repsol YPF’s website at www.repsol.com.
23
Preview of the 4Q10 income statement
Madrid, 24 February 2011
24
Repsol YPF S.A. 4Q 2010 Earnings Preview
Repsol YPF S.A. 2
CONTENTS: FOURTH QUARTER 2010 MAIN HIGHLIGHTS AND KEY FINANCIAL FIGURES...................................3 1.- BREAKDOWN OF RESULTS BY BUSINESS AREA.............................................................................4
1.1.- UPSTREAM ....................................................................................4 1.2.- LNG ....................................................................................6 1.3.- DOWNSTREAM ....................................................................................7 1.4.- YPF ....................................................................................9 1.5.- GAS NATURAL FENOSA ..................................................................................11 1.6.- CORPORATE AND OTHERS ..................................................................................11
2.- FINANCIAL INCOME/CHARGES AND DEBT ..................................................................................12 3.- OTHER CAPTIONS IN THE PROFIT AND LOSS ACCOUNT ................................................................14
3.1.- TAXES ..................................................................................14 3.2.- EQUITY ON EARNINGS OF UNCONSOLIDATED AFFILIATES ....................................14 3.3.- MINORITY INTERESTS ..................................................................................14
4.- HIGHLIGHTS ..................................................................................15 TABLES:
4Q 2010 RESULTS ..................................................................................17 OPERATING HIGHLIGHTS 4Q 2010 ..................................................................................27
25
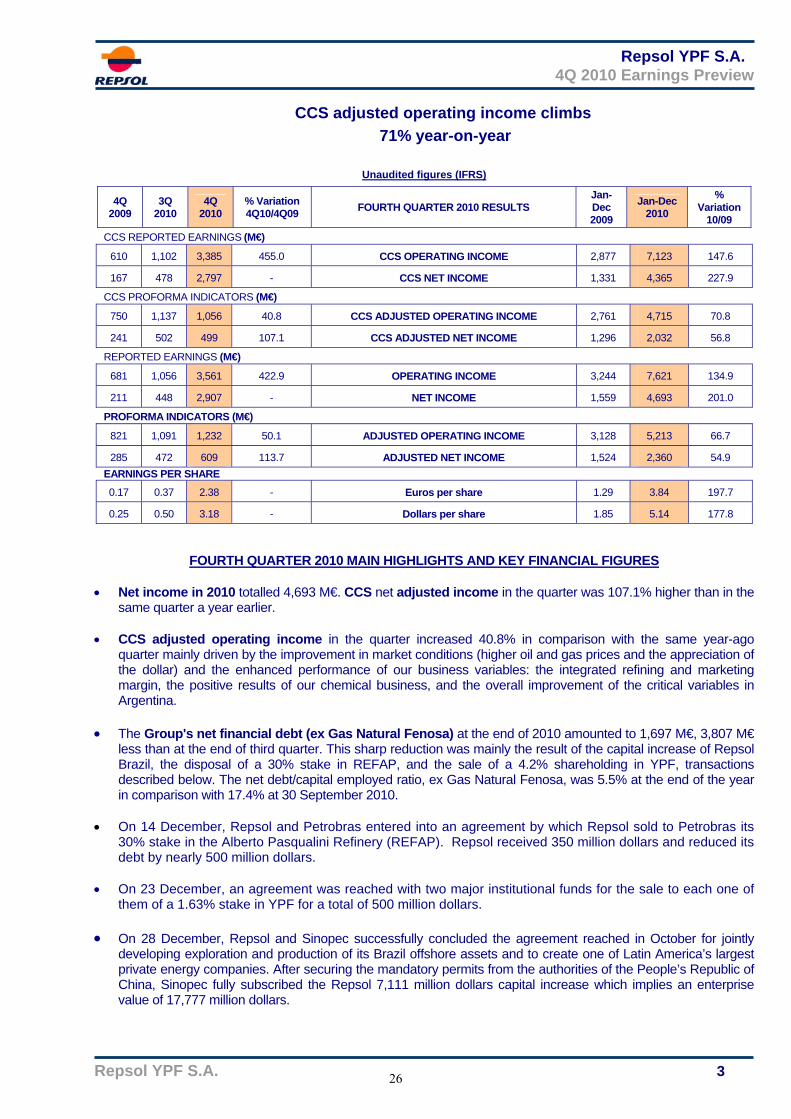
Repsol YPF S.A. 4Q 2010 Earnings Preview
Repsol YPF S.A. 3
CCS adjusted operating income climbs 71% year-on-year
Unaudited figures (IFRS)
4Q 2009
3Q 2010
4Q 2010
% Variation 4Q10/4Q09 FOURTH QUARTER 2010 RESULTS
Jan-Dec 2009
Jan-Dec 2010
% Variation
10/09 CCS REPORTED EARNINGS (M€)
610 1,102 3,385 455.0 CCS OPERATING INCOME 2,877 7,123 147.6
167 478 2,797 - CCS NET INCOME 1,331 4,365 227.9
CCS PROFORMA INDICATORS (M€)
750 1,137 1,056 40.8 CCS ADJUSTED OPERATING INCOME 2,761 4,715 70.8
241 502 499 107.1 CCS ADJUSTED NET INCOME 1,296 2,032 56.8
REPORTED EARNINGS (M€)
681 1,056 3,561 422.9 OPERATING INCOME 3,244 7,621 134.9
211 448 2,907 - NET INCOME 1,559 4,693 201.0
PROFORMA INDICATORS (M€)
821 1,091 1,232 50.1 ADJUSTED OPERATING INCOME 3,128 5,213 66.7
285 472 609 113.7 ADJUSTED NET INCOME 1,524 2,360 54.9
EARNINGS PER SHARE
0.17 0.37 2.38 - Euros per share 1.29 3.84 197.7
0.25 0.50 3.18 - Dollars per share 1.85 5.14 177.8
FOURTH QUARTER 2010 MAIN HIGHLIGHTS AND KEY FINANCIAL FIGURES • Net income in 2010 totalled 4,693 M€. CCS net adjusted income in the quarter was 107.1% higher than in the
same quarter a year earlier. • CCS adjusted operating income in the quarter increased 40.8% in comparison with the same year-ago
quarter mainly driven by the improvement in market conditions (higher oil and gas prices and the appreciation of the dollar) and the enhanced performance of our business variables: the integrated refining and marketing margin, the positive results of our chemical business, and the overall improvement of the critical variables in Argentina.
• The Group's net financial debt (ex Gas Natural Fenosa) at the end of 2010 amounted to 1,697 M€, 3,807 M€
less than at the end of third quarter. This sharp reduction was mainly the result of the capital increase of Repsol Brazil, the disposal of a 30% stake in REFAP, and the sale of a 4.2% shareholding in YPF, transactions described below. The net debt/capital employed ratio, ex Gas Natural Fenosa, was 5.5% at the end of the year in comparison with 17.4% at 30 September 2010.
• On 14 December, Repsol and Petrobras entered into an agreement by which Repsol sold to Petrobras its
30% stake in the Alberto Pasqualini Refinery (REFAP). Repsol received 350 million dollars and reduced its debt by nearly 500 million dollars.
• On 23 December, an agreement was reached with two major institutional funds for the sale to each one of
them of a 1.63% stake in YPF for a total of 500 million dollars.
• On 28 December, Repsol and Sinopec successfully concluded the agreement reached in October for jointly developing exploration and production of its Brazil offshore assets and to create one of Latin America’s largest private energy companies. After securing the mandatory permits from the authorities of the People’s Republic of China, Sinopec fully subscribed the Repsol 7,111 million dollars capital increase which implies an enterprise value of 17,777 million dollars.
26
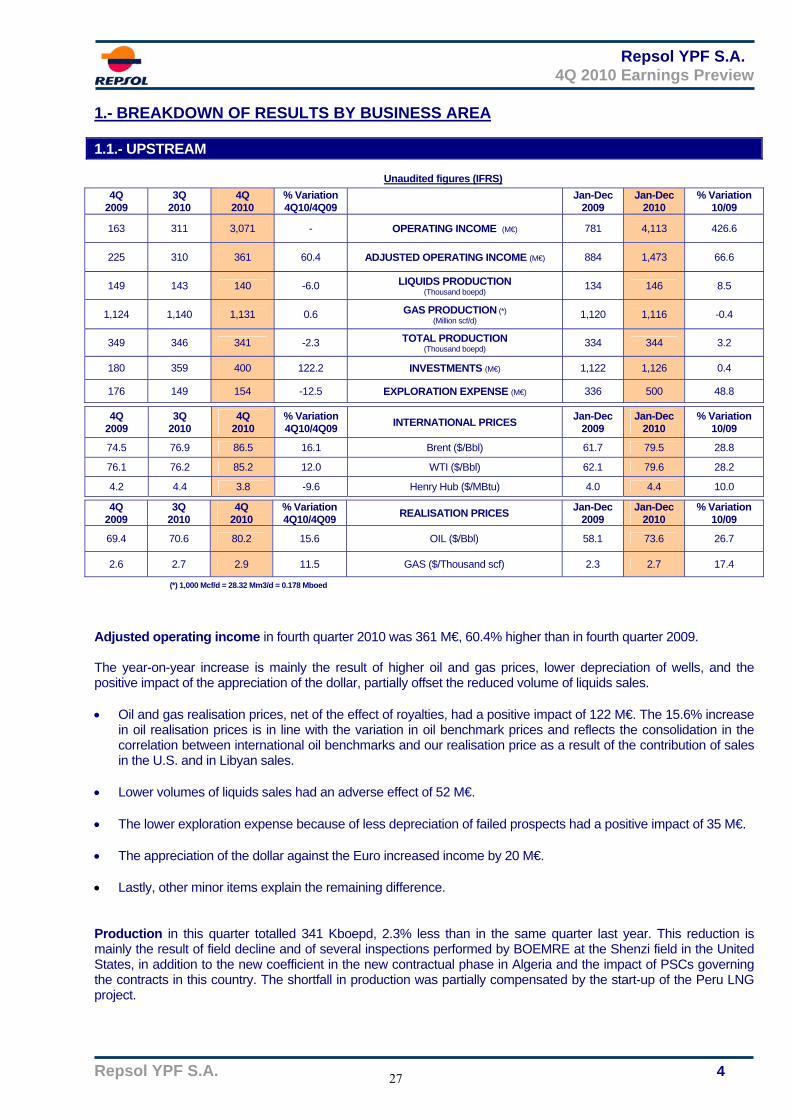
Repsol YPF S.A. 4Q 2010 Earnings Preview
Repsol YPF S.A. 4
1.- BREAKDOWN OF RESULTS BY BUSINESS AREA 1.1.- UPSTREAM
Unaudited figures (IFRS)
4Q 2009
3Q 2010
4Q 2010
% Variation 4Q10/4Q09 Jan-Dec
2009 Jan-Dec
2010 % Variation
10/09
163 311 3,071 - OPERATING INCOME (M€) 781 4,113 426.6
225 310 361 60.4 ADJUSTED OPERATING INCOME (M€) 884 1,473 66.6
149 143 140 -6.0 LIQUIDS PRODUCTION (Thousand boepd)
134 146 8.5
1,124 1,140 1,131 0.6 GAS PRODUCTION (*) (Million scf/d)
1,120 1,116 -0.4
349 346 341 -2.3 TOTAL PRODUCTION (Thousand boepd) 334 344 3.2
180 359 400 122.2 INVESTMENTS (M€) 1,122 1,126 0.4
176 149 154 -12.5 EXPLORATION EXPENSE (M€) 336 500 48.8
4Q 2009
3Q 2010
4Q 2010
% Variation 4Q10/4Q09 INTERNATIONAL PRICES Jan-Dec
2009 Jan-Dec
2010 % Variation
10/09
74.5 76.9 86.5 16.1 Brent ($/Bbl) 61.7 79.5 28.8
76.1 76.2 85.2 12.0 WTI ($/Bbl) 62.1 79.6 28.2
4.2 4.4 3.8 -9.6 Henry Hub ($/MBtu) 4.0 4.4 10.0
4Q 2009
3Q 2010
4Q 2010
% Variation 4Q10/4Q09 REALISATION PRICES Jan-Dec
2009 Jan-Dec
2010 % Variation
10/09
69.4 70.6 80.2 15.6 OIL ($/Bbl) 58.1 73.6 26.7
2.6 2.7 2.9 11.5 GAS ($/Thousand scf) 2.3 2.7 17.4
(*) 1,000 Mcf/d = 28.32 Mm3/d = 0.178 Mboed
Adjusted operating income in fourth quarter 2010 was 361 M€, 60.4% higher than in fourth quarter 2009. The year-on-year increase is mainly the result of higher oil and gas prices, lower depreciation of wells, and the positive impact of the appreciation of the dollar, partially offset the reduced volume of liquids sales. • Oil and gas realisation prices, net of the effect of royalties, had a positive impact of 122 M€. The 15.6% increase
in oil realisation prices is in line with the variation in oil benchmark prices and reflects the consolidation in the correlation between international oil benchmarks and our realisation price as a result of the contribution of sales in the U.S. and in Libyan sales.
• Lower volumes of liquids sales had an adverse effect of 52 M€.
• The lower exploration expense because of less depreciation of failed prospects had a positive impact of 35 M€. • The appreciation of the dollar against the Euro increased income by 20 M€. • Lastly, other minor items explain the remaining difference. Production in this quarter totalled 341 Kboepd, 2.3% less than in the same quarter last year. This reduction is mainly the result of field decline and of several inspections performed by BOEMRE at the Shenzi field in the United States, in addition to the new coefficient in the new contractual phase in Algeria and the impact of PSCs governing the contracts in this country. The shortfall in production was partially compensated by the start-up of the Peru LNG project.
27
Repsol YPF S.A. 4Q 2010 Earnings Preview
Repsol YPF S.A. 5
January – December 2010 results Adjusted operating income in 2010 totalled 1,473 M€, up 66.6% in comparison with 2009. This is mainly attributable to higher international oil and gas realization prices and greater production volumes, partially offset by higher exploration expenses due to increased activity. Production in 2010 (344 Kboepd) was 3.2% higher than in the in 2009 (334 Kboepd), mainly as the result of the start-up of Shenzi and the increased quota in Libya - which improved the production mix - in addition to the start-up of the Peru LNG project. The production mix in 2010 was 42.3% liquids and 57.7% gas, improving from 40.2% liquids and 59.8% gas in 2009. In 2010, the reserve replacement rate stood at 131% versus 94% in 2009 Investments Investments in fourth quarter 2010 in Upstream amounted to 400 M€. Investments in development accounted for 57% of the total amount, mainly spent in Brazil (20%), Bolivia (15%), Peru (13%), the U.S. (13%), Spain (10%), Trinidad & Tobago (9%), and Ecuador (8%). Investments in exploration accounted for 38% of the total amount, most of which was spent in Brazil (62%) and in Sierra Leone (9%). Investments in Upstream in 2010 were 1,126 M€, very similar to the figure in 2009 (1,122 M€). Investments in development represented 50% of the total and were mainly spent in Trinidad y Tobago (16%), Bolivia (14%), Brazil (13%), Peru (12%), the U.S. (10%), Ecuador (9%), and Libya (7%). Investments in exploration accounted for 38% of the total and were mainly earmarked for Brazil (76%) and the United States (8%).
28
Repsol YPF S.A. 4Q 2010 Earnings Preview
Repsol YPF S.A. 6
1.2.- LNG
Unaudited figures (IFRS)
4Q 2009
3Q 2010
4Q 2010
% Variation 4Q10/4Q09 Jan-Dec
2009 Jan-Dec
2010 % Variation
10/09
-100 48 46 - OPERATING INCOME (M€) -61 105 -
11 47 33 200.0 ADJUSTED OPERATING INCOME (M€) 50 127 154.0
32.9 44.1 43.3 31.6 ELECTRICITY PRICES IN THE SPANISH
ELECTRICITY POOL (€/MWh) 37.0 37.0 0.0
46.3 67.9 93.2 101.3 LNG SALES (TBtu) 179.5 267.6 49.1
22 5 28 27.3 INVESTMENTS (M€) 125 82 -34.4
1 TBtu= 1,000,000 MBtu 1 bcm= 1,000 Mm3= 39.683 TBtu
Adjusted operating income in fourth quarter 2010 was 33 M€ versus 11 M€ posted in the same year-ago period. The rise in fourth quarter 2010 operating income was mainly driven by higher LNG marketing margins and sales volumes following the start-up of the Peru LNG project. January - December 2010 results Adjusted operating income in 2010 was 127 M€, 154.0% higher than in the previous year, principally because of higher LNG marketing margins and sales volumes. Investments Investments in fourth quarter and in full-year 2010 in the LNG division totalled 28 M€ and 82M€, respectively. These investments were basically for the construction of the third tank at the Canaport LNG terminal and for the Floating LNG project in Brazil.
29
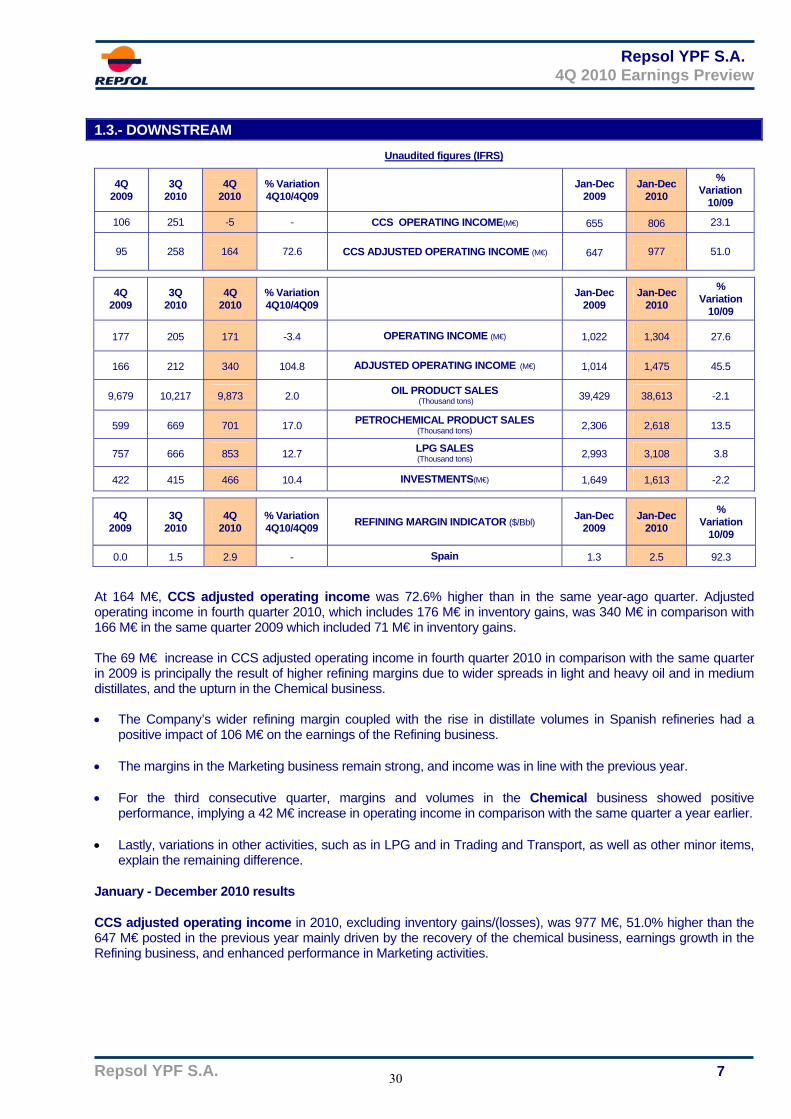
Repsol YPF S.A. 4Q 2010 Earnings Preview
Repsol YPF S.A. 7
1.3.- DOWNSTREAM
Unaudited figures (IFRS)
4Q 2009
3Q 2010
4Q 2010
% Variation 4Q10/4Q09 Jan-Dec
2009 Jan-Dec
2010
% Variation
10/09
106 251 -5 - CCS OPERATING INCOME(M€) 655 806 23.1
95 258 164 72.6 CCS ADJUSTED OPERATING INCOME (M€) 647 977 51.0
4Q 2009
3Q 2010
4Q 2010
% Variation 4Q10/4Q09 Jan-Dec
2009 Jan-Dec
2010
% Variation
10/09
177 205 171 -3.4 OPERATING INCOME (M€) 1,022 1,304 27.6
166 212 340 104.8 ADJUSTED OPERATING INCOME (M€) 1,014 1,475 45.5
9,679 10,217 9,873 2.0 OIL PRODUCT SALES (Thousand tons) 39,429 38,613 -2.1
599 669 701 17.0 PETROCHEMICAL PRODUCT SALES (Thousand tons) 2,306 2,618 13.5
757 666 853 12.7 LPG SALES (Thousand tons) 2,993 3,108 3.8
422 415 466 10.4 INVESTMENTS(M€) 1,649 1,613 -2.2
4Q 2009
3Q 2010
4Q 2010
% Variation 4Q10/4Q09 REFINING MARGIN INDICATOR ($/Bbl) Jan-Dec
2009 Jan-Dec
2010
% Variation
10/09
0.0 1.5 2.9 - Spain 1.3 2.5 92.3
At 164 M€, CCS adjusted operating income was 72.6% higher than in the same year-ago quarter. Adjusted operating income in fourth quarter 2010, which includes 176 M€ in inventory gains, was 340 M€ in comparison with 166 M€ in the same quarter 2009 which included 71 M€ in inventory gains. The 69 M€ increase in CCS adjusted operating income in fourth quarter 2010 in comparison with the same quarter in 2009 is principally the result of higher refining margins due to wider spreads in light and heavy oil and in medium distillates, and the upturn in the Chemical business. • The Company’s wider refining margin coupled with the rise in distillate volumes in Spanish refineries had a
positive impact of 106 M€ on the earnings of the Refining business. • The margins in the Marketing business remain strong, and income was in line with the previous year. • For the third consecutive quarter, margins and volumes in the Chemical business showed positive
performance, implying a 42 M€ increase in operating income in comparison with the same quarter a year earlier. • Lastly, variations in other activities, such as in LPG and in Trading and Transport, as well as other minor items,
explain the remaining difference. January - December 2010 results CCS adjusted operating income in 2010, excluding inventory gains/(losses), was 977 M€, 51.0% higher than the 647 M€ posted in the previous year mainly driven by the recovery of the chemical business, earnings growth in the Refining business, and enhanced performance in Marketing activities.
30
Repsol YPF S.A. 4Q 2010 Earnings Preview
Repsol YPF S.A. 8
Investments Investments in Downstream in fourth quarter and in the entire fiscal year 2010 amounted to 466 M€ and 1,613 M€, respectively, and were mainly allocated to enlargement and conversion projects at the Cartagena refinery and in the fuel oil reductor unit at the Bilbao facilities, both of which are contemplated in the Strategic Plan.
31
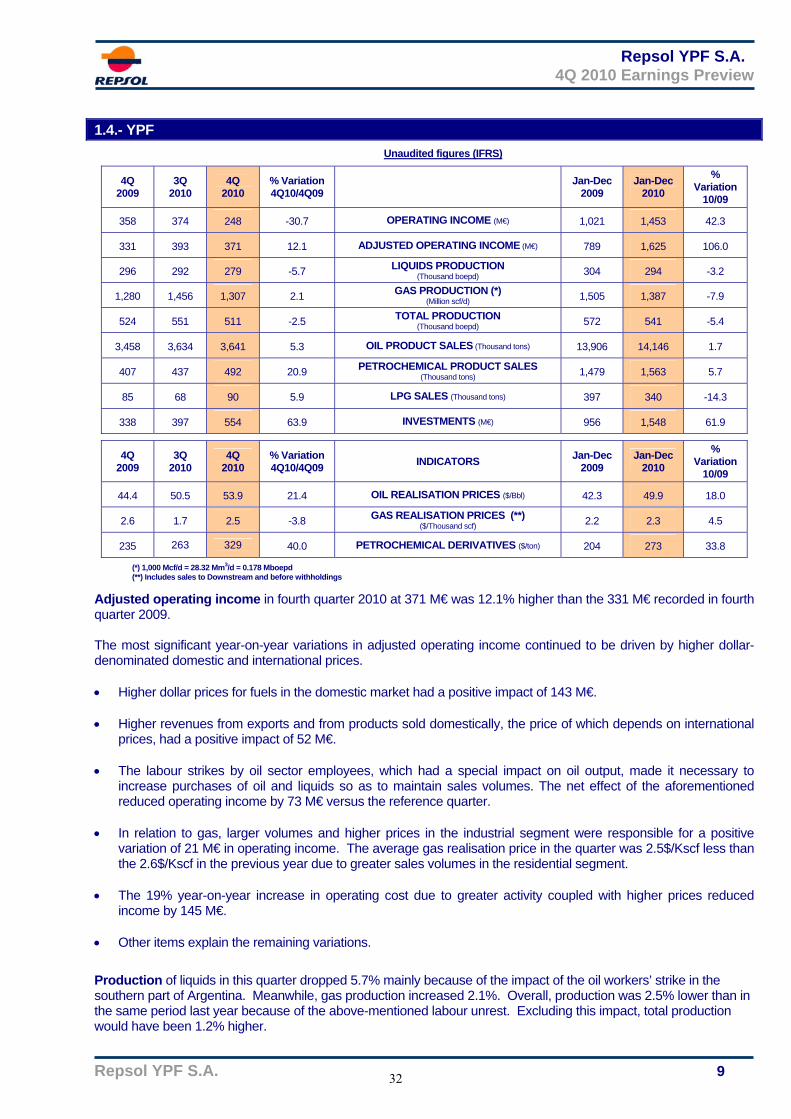
Repsol YPF S.A. 4Q 2010 Earnings Preview
Repsol YPF S.A. 9
1.4.- YPF
Unaudited figures (IFRS)
4Q 2009
3Q 2010
4Q 2010
% Variation 4Q10/4Q09 Jan-Dec
2009 Jan-Dec
2010
% Variation
10/09
358 374 248 -30.7 OPERATING INCOME (M€) 1,021 1,453 42.3
331 393 371 12.1 ADJUSTED OPERATING INCOME (M€) 789 1,625 106.0
296 292 279 -5.7 LIQUIDS PRODUCTION (Thousand boepd) 304 294 -3.2
1,280 1,456 1,307 2.1 GAS PRODUCTION (*) (Million scf/d) 1,505 1,387 -7.9
524 551 511 -2.5 TOTAL PRODUCTION (Thousand boepd) 572 541 -5.4
3,458 3,634 3,641 5.3 OIL PRODUCT SALES (Thousand tons) 13,906 14,146 1.7
407 437 492 20.9 PETROCHEMICAL PRODUCT SALES (Thousand tons) 1,479 1,563 5.7
85 68 90 5.9 LPG SALES (Thousand tons) 397 340 -14.3
338 397 554 63.9 INVESTMENTS (M€) 956 1,548 61.9
4Q 2009
3Q 2010
4Q 2010
% Variation 4Q10/4Q09 INDICATORS Jan-Dec
2009 Jan-Dec
2010
% Variation
10/09
44.4 50.5 53.9 21.4 OIL REALISATION PRICES ($/Bbl) 42.3 49.9 18.0
2.6 1.7 2.5 -3.8 GAS REALISATION PRICES (**) ($/Thousand scf) 2.2 2.3 4.5
235 263 329 40.0 PETROCHEMICAL DERIVATIVES ($/ton) 204 273 33.8
(*) 1,000 Mcf/d = 28.32 Mm3/d = 0.178 Mboepd (**) Includes sales to Downstream and before withholdings
Adjusted operating income in fourth quarter 2010 at 371 M€ was 12.1% higher than the 331 M€ recorded in fourth quarter 2009. The most significant year-on-year variations in adjusted operating income continued to be driven by higher dollar-denominated domestic and international prices. • Higher dollar prices for fuels in the domestic market had a positive impact of 143 M€. • Higher revenues from exports and from products sold domestically, the price of which depends on international
prices, had a positive impact of 52 M€. • The labour strikes by oil sector employees, which had a special impact on oil output, made it necessary to
increase purchases of oil and liquids so as to maintain sales volumes. The net effect of the aforementioned reduced operating income by 73 M€ versus the reference quarter.
• In relation to gas, larger volumes and higher prices in the industrial segment were responsible for a positive
variation of 21 M€ in operating income. The average gas realisation price in the quarter was 2.5$/Kscf less than the 2.6$/Kscf in the previous year due to greater sales volumes in the residential segment.
• The 19% year-on-year increase in operating cost due to greater activity coupled with higher prices reduced income by 145 M€.
• Other items explain the remaining variations. Production of liquids in this quarter dropped 5.7% mainly because of the impact of the oil workers’ strike in the southern part of Argentina. Meanwhile, gas production increased 2.1%. Overall, production was 2.5% lower than in the same period last year because of the above-mentioned labour unrest. Excluding this impact, total production would have been 1.2% higher.
32
Repsol YPF S.A. 4Q 2010 Earnings Preview
Repsol YPF S.A. 10
January - December 2010 results At 1625 M€, adjusted operating income in 2010 was 106.0% higher than in the previous last year. This growth was driven by pump station fuel prices, which were closer to the international dollar parity, greater revenue contribution from products sold in the domestic market the price of which is pegged to international prices, and the impact of higher export revenues. The 15% rise in operating costs during the year mitigated earnings growth. Production in 2010 was 541 Kboepd, 5.4% less year-on-year. The drop was 7.9% in gas, 3.2% in liquids production and 1.6% in crude oil. The less pronounced drop in oil production was achieved thanks to the investment efforts in response to the Petróleo Plus plan and higher prices at the pump due to the gradual alignment with international parities. YPF’s reserve replacement rate was 84% and the replacement rate for crude reached 100%. Investments Investments in fourth quarter 2010 at YPF totalled 554 M€, 310 M€ of which were spent in Exploration and Production, and 79% in development projects. In full-year 2010, investments amounted to 1,548 M€, of which 1,064 M€ were earmarked for Exploration and Production and 87% of this amount to development projects.
33
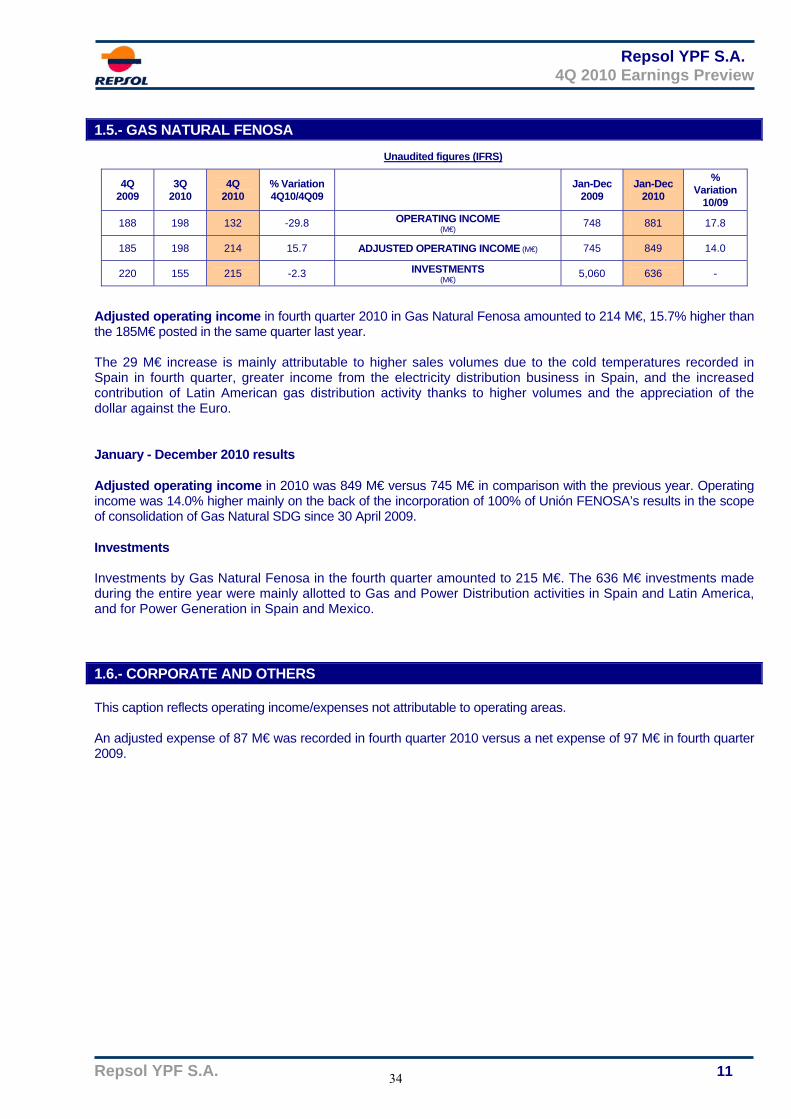
Repsol YPF S.A. 4Q 2010 Earnings Preview
Repsol YPF S.A. 11
1.5.- GAS NATURAL FENOSA
Unaudited figures (IFRS)
4Q 2009
3Q 2010
4Q 2010
% Variation 4Q10/4Q09 Jan-Dec
2009 Jan-Dec
2010
% Variation
10/09
188 198 132 -29.8 OPERATING INCOME (M€) 748 881 17.8
185 198 214 15.7 ADJUSTED OPERATING INCOME (M€) 745 849 14.0
220 155 215 -2.3 INVESTMENTS (M€)
5,060 636 -
Adjusted operating income in fourth quarter 2010 in Gas Natural Fenosa amounted to 214 M€, 15.7% higher than the 185M€ posted in the same quarter last year. The 29 M€ increase is mainly attributable to higher sales volumes due to the cold temperatures recorded in Spain in fourth quarter, greater income from the electricity distribution business in Spain, and the increased contribution of Latin American gas distribution activity thanks to higher volumes and the appreciation of the dollar against the Euro. January - December 2010 results Adjusted operating income in 2010 was 849 M€ versus 745 M€ in comparison with the previous year. Operating income was 14.0% higher mainly on the back of the incorporation of 100% of Unión FENOSA’s results in the scope of consolidation of Gas Natural SDG since 30 April 2009. Investments Investments by Gas Natural Fenosa in the fourth quarter amounted to 215 M€. The 636 M€ investments made during the entire year were mainly allotted to Gas and Power Distribution activities in Spain and Latin America, and for Power Generation in Spain and Mexico.
1.6.- CORPORATE AND OTHERS This caption reflects operating income/expenses not attributable to operating areas. An adjusted expense of 87 M€ was recorded in fourth quarter 2010 versus a net expense of 97 M€ in fourth quarter 2009.
34
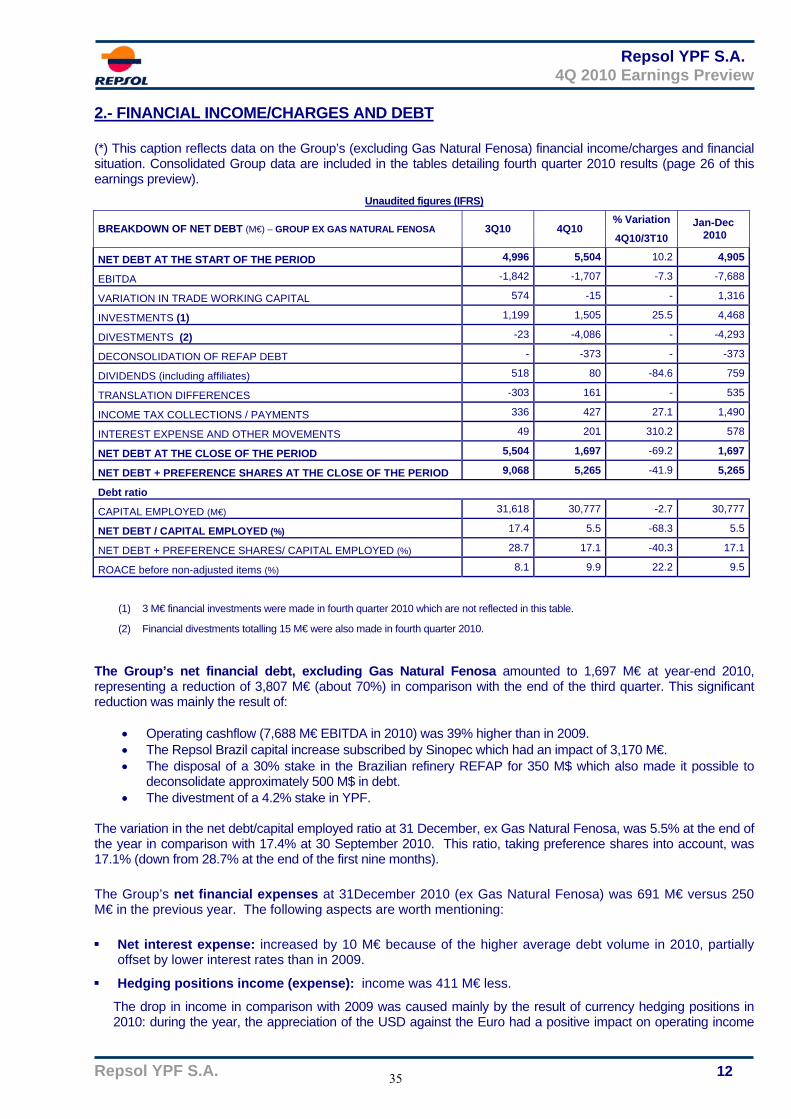
Repsol YPF S.A. 4Q 2010 Earnings Preview
Repsol YPF S.A. 12
2.- FINANCIAL INCOME/CHARGES AND DEBT (*) This caption reflects data on the Group’s (excluding Gas Natural Fenosa) financial income/charges and financial situation. Consolidated Group data are included in the tables detailing fourth quarter 2010 results (page 26 of this earnings preview).
Unaudited figures (IFRS)
% Variation BREAKDOWN OF NET DEBT (M€) – GROUP EX GAS NATURAL FENOSA 3Q10 4Q10
4Q10/3T10 Jan-Dec
2010
NET DEBT AT THE START OF THE PERIOD 4,996 5,504 10.2 4,905
EBITDA -1,842 -1,707 -7.3 -7,688
VARIATION IN TRADE WORKING CAPITAL 574 -15 - 1,316
INVESTMENTS (1) 1,199 1,505 25.5 4,468
DIVESTMENTS (2) -23 -4,086 - -4,293
DECONSOLIDATION OF REFAP DEBT - -373 - -373
DIVIDENDS (including affiliates) 518 80 -84.6 759
TRANSLATION DIFFERENCES -303 161 - 535
INCOME TAX COLLECTIONS / PAYMENTS 336 427 27.1 1,490
INTEREST EXPENSE AND OTHER MOVEMENTS 49 201 310.2 578
NET DEBT AT THE CLOSE OF THE PERIOD 5,504 1,697 -69.2 1,697
NET DEBT + PREFERENCE SHARES AT THE CLOSE OF THE PERIOD 9,068 5,265 -41.9 5,265
Debt ratio
CAPITAL EMPLOYED (M€) 31,618 30,777 -2.7 30,777
NET DEBT / CAPITAL EMPLOYED (%) 17.4 5.5 -68.3 5.5
NET DEBT + PREFERENCE SHARES/ CAPITAL EMPLOYED (%) 28.7 17.1 -40.3 17.1
ROACE before non-adjusted items (%) 8.1 9.9 22.2 9.5
(1) 3 M€ financial investments were made in fourth quarter 2010 which are not reflected in this table.
(2) Financial divestments totalling 15 M€ were also made in fourth quarter 2010.
The Group’s net financial debt, excluding Gas Natural Fenosa amounted to 1,697 M€ at year-end 2010, representing a reduction of 3,807 M€ (about 70%) in comparison with the end of the third quarter. This significant reduction was mainly the result of:
• Operating cashflow (7,688 M€ EBITDA in 2010) was 39% higher than in 2009. • The Repsol Brazil capital increase subscribed by Sinopec which had an impact of 3,170 M€. • The disposal of a 30% stake in the Brazilian refinery REFAP for 350 M$ which also made it possible to
deconsolidate approximately 500 M$ in debt. • The divestment of a 4.2% stake in YPF.
The variation in the net debt/capital employed ratio at 31 December, ex Gas Natural Fenosa, was 5.5% at the end of the year in comparison with 17.4% at 30 September 2010. This ratio, taking preference shares into account, was 17.1% (down from 28.7% at the end of the first nine months).
The Group’s net financial expenses at 31December 2010 (ex Gas Natural Fenosa) was 691 M€ versus 250 M€ in the previous year. The following aspects are worth mentioning:
Net interest expense: increased by 10 M€ because of the higher average debt volume in 2010, partially
offset by lower interest rates than in 2009.
Hedging positions income (expense): income was 411 M€ less.
The drop in income in comparison with 2009 was caused mainly by the result of currency hedging positions in 2010: during the year, the appreciation of the USD against the Euro had a positive impact on operating income
35
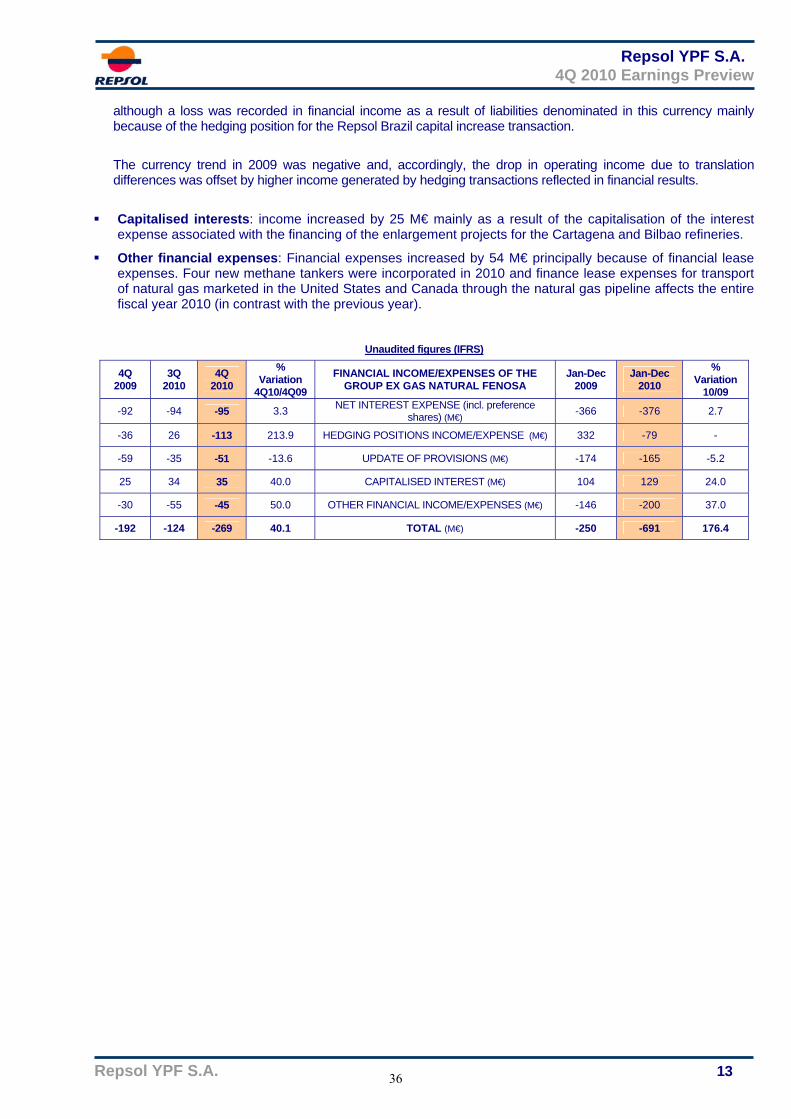
Repsol YPF S.A. 4Q 2010 Earnings Preview
Repsol YPF S.A. 13
although a loss was recorded in financial income as a result of liabilities denominated in this currency mainly because of the hedging position for the Repsol Brazil capital increase transaction.
The currency trend in 2009 was negative and, accordingly, the drop in operating income due to translation differences was offset by higher income generated by hedging transactions reflected in financial results.
Capitalised interests: income increased by 25 M€ mainly as a result of the capitalisation of the interest expense associated with the financing of the enlargement projects for the Cartagena and Bilbao refineries.
Other financial expenses: Financial expenses increased by 54 M€ principally because of financial lease expenses. Four new methane tankers were incorporated in 2010 and finance lease expenses for transport of natural gas marketed in the United States and Canada through the natural gas pipeline affects the entire fiscal year 2010 (in contrast with the previous year).
Unaudited figures (IFRS)
4Q 2009
3Q 2010
4Q 2010
% Variation
4Q10/4Q09
FINANCIAL INCOME/EXPENSES OF THE GROUP EX GAS NATURAL FENOSA
Jan-Dec 2009
Jan-Dec 2010
% Variation
10/09
-92 -94 -95 3.3 NET INTEREST EXPENSE (incl. preference
shares) (M€) -366 -376 2.7
-36 26 -113 213.9 HEDGING POSITIONS INCOME/EXPENSE (M€) 332 -79 -
-59 -35 -51 -13.6 UPDATE OF PROVISIONS (M€) -174 -165 -5.2
25 34 35 40.0 CAPITALISED INTEREST (M€) 104 129 24.0
-30 -55 -45 50.0 OTHER FINANCIAL INCOME/EXPENSES (M€) -146 -200 37.0
-192 -124 -269 40.1 TOTAL (M€) -250 -691 176.4
36
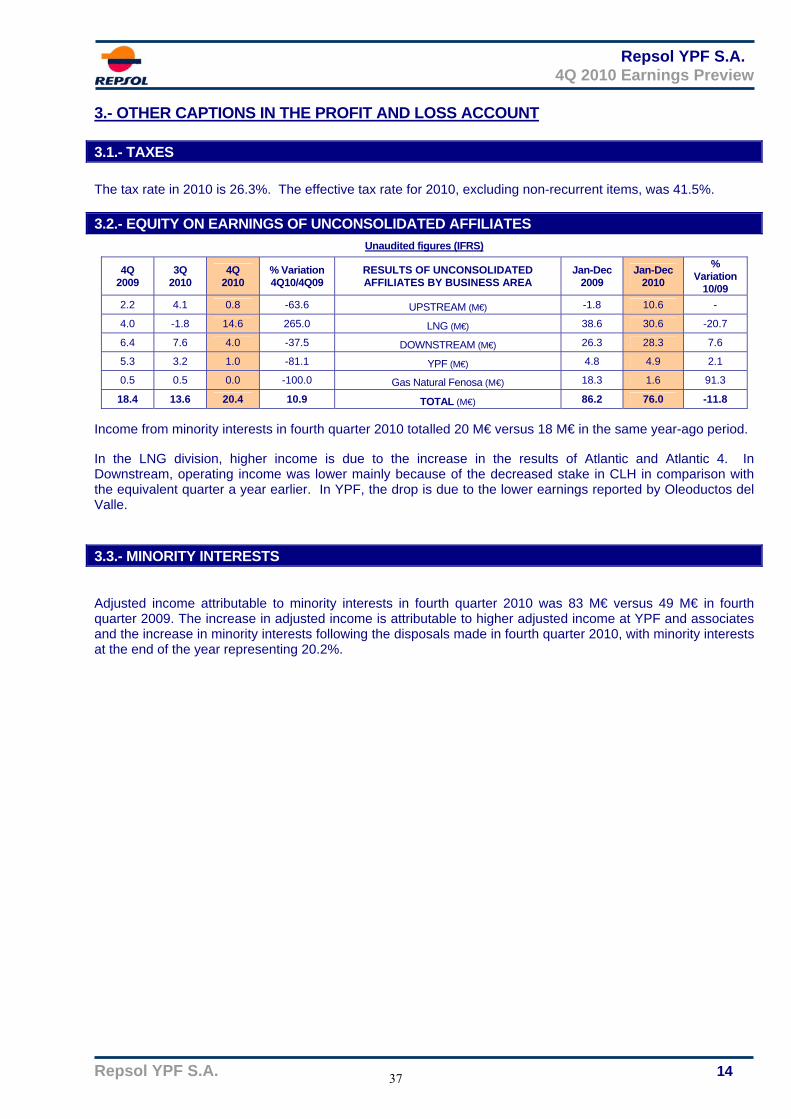
Repsol YPF S.A. 4Q 2010 Earnings Preview
Repsol YPF S.A. 14
3.- OTHER CAPTIONS IN THE PROFIT AND LOSS ACCOUNT 3.1.- TAXES The tax rate in 2010 is 26.3%. The effective tax rate for 2010, excluding non-recurrent items, was 41.5%.
3.2.- EQUITY ON EARNINGS OF UNCONSOLIDATED AFFILIATES
Unaudited figures (IFRS)
4Q 2009
3Q 2010
4Q 2010
% Variation 4Q10/4Q09
RESULTS OF UNCONSOLIDATED AFFILIATES BY BUSINESS AREA
Jan-Dec 2009
Jan-Dec 2010
% Variation
10/09 2.2 4.1 0.8 -63.6 UPSTREAM (M€) -1.8 10.6 -
4.0 -1.8 14.6 265.0 LNG (M€) 38.6 30.6 -20.7
6.4 7.6 4.0 -37.5 DOWNSTREAM (M€) 26.3 28.3 7.6
5.3 3.2 1.0 -81.1 YPF (M€) 4.8 4.9 2.1
0.5 0.5 0.0 -100.0 Gas Natural Fenosa (M€) 18.3 1.6 91.3
18.4 13.6 20.4 10.9 TOTAL (M€) 86.2 76.0 -11.8 Income from minority interests in fourth quarter 2010 totalled 20 M€ versus 18 M€ in the same year-ago period. In the LNG division, higher income is due to the increase in the results of Atlantic and Atlantic 4. In Downstream, operating income was lower mainly because of the decreased stake in CLH in comparison with the equivalent quarter a year earlier. In YPF, the drop is due to the lower earnings reported by Oleoductos del Valle. 3.3.- MINORITY INTERESTS Adjusted income attributable to minority interests in fourth quarter 2010 was 83 M€ versus 49 M€ in fourth quarter 2009. The increase in adjusted income is attributable to higher adjusted income at YPF and associates and the increase in minority interests following the disposals made in fourth quarter 2010, with minority interests at the end of the year representing 20.2%.
37
Repsol YPF S.A. 4Q 2010 Earnings Preview
Repsol YPF S.A. 15
4.- HIGHLIGHTS Since the publication of third quarter results, the most relevant items on the Company were as follows:
In the Corporation, on 23 December, an agreement was reached with two major institutional funds for the sale of a 1.63% stake in YPF to each one of them for a total of 500 million dollars. On 28 December, Repsol and Sinopec successfully concluded the agreement reached in October for jointly developing exploration and production of its Brazil offshore assets and to create one of Latin America’s largest private energy companies. After securing the mandatory permits from the authorities of the People’s Republic of China, Sinopec fully subscribed the Repsol Brazil 7,111 million dollars capital increase which implies an enterprise value of 17,777 million dollars. On 30 December, the Repsol International Capital Limited (RIC) Board of Directors authorized the redemption of 100% of outstanding Series A Preference Shares issued by RIC and guaranteed by Repsol YPF. These Series A preference shares were listed in the New York Stock Exchange. The securities were redeemed at the established price of 25.00 USD per Preference Shares, plus accrued dividends not paid since 31 December 2010 up to the redemption date, implying 0.20 dollar per Preference Share On 30 December, Repsol approved the appointment of Miguel Ángel Devesa del Barrio and Begoña Elices García as Executive Officers of the Company and members of the Executive Committee as of January 2011. The Company organized a meeting in London on 27 January with financial analysts to explain the outlook for the Company’s exploration business in 2011. On 23 February, the Repsol YPF Board of Directors passed a resolution approving payment of a final dividend for fiscal year 2010 of 0.525 Euro per share to be paid from July 7th, 2011 (Note to ADS’s holders: Owners of record of ADS’s at the closing of business of July 6th 2011 would be entitled to receive such dividend when payable by the Bank of New York Mellon, which is expected to be on July 18th, 2011). With this proposal, which must be ratified at the Annual General Meeting, the gross dividend for 2010 will be 1.05 Euro per share, 23.53% more than the one paid against 2009 results. In Upstream, on 15 November, Repsol and its partners, the American company Anadarko and the British Tullow, announced a new light oil discovery offshore Sierra Leone. The new oil and gas discovery at the Mercury-1 prospect is in addition to the success achieved in 2009 at the Venus B-1 well 64 miles to the southeast and is a clear indication of the potential of this practically up to now unexplored area. On 21 November, Repsol (33%) a Husky (67% and operator) were awarded concessions for exploration blocks NL-10-01 and NL-10-02 in Canada’s offshore Jeanne D'Arc basin. Pending official ratification, the blocks are situated in the same basin as blocks EL-1110, EL-1111 and EL-1114 in which Repsol holds interests. On 16 December, the Calamaro -1 exploration well in Block Rondón at the Llanos Basin in Colombia was completed, yielding positive results. On 7 January, the Indonesian Government approved the farm-in for Repsol’s acquisition of a 45% stake in the East Bula and Seram wells from Canada’s Niko Resources. Following this acquisition, the partners in these blocks east of Seram Island offshore Indonesia, are Niko (55% and operator) and Repsol (45%). On 24 January, Sonangol announced the results of the first Exploration Round since 2007. Repsol was awarded three blocks in the Bidding Round: block 22 (as the operator with a 30% interest); block 35 (Repsol, 25%), and Block 37 (Repsol, 20%). On 26 January, Repsol Sinopec and its partners, Brazil’s Petrobras, and the British BG Group, announced the positive results obtained with the Carioca Nordeste appraisal well which found good-quality oil in deepwaters at Brazil’s presalt Santos Basin. The new well is in the Carioca well’s appraisal area 2,151 meters below sea level. Initial tests indicated the existence of a 200 meter reservoir containing high quality 26º API oil.
38
Repsol YPF S.A. 4Q 2010 Earnings Preview
Repsol YPF S.A. 16
In LNG, on 23 December, Repsol received the first LNG shipment from Qatar in Canada pursuant to the long-term agreement executed with Qatargas last October. The Canaport regassification plant in Canada is the only one in the North American eastern seaboard that is able to accommodate Q-Max and Q-Flex type vessels, the largest in the world. On 14 February, Repsol announced that it had executed an agreement with the state company Korea Gas Corporation (KOGAS) for the supply of liquefied gas to the Asian market. The agreement, which entered into force in January 2011, contemplates the supply of 1.9 bcm of LNG from the liquefaction plant associated with the Peru LNG project. In Downstream, on 29 November Repsol and the Malaysian UMW industrial Group announced an agreement to produce and distribute Repsol Lubricants in Malaysia, China, and other countries in the region, including Singapore, Brunei, Papua New Guinea and Myanmar. On 14 December, Repsol and Petrobras entered into an agreement under which Repsol sold to Petrobras its 30% stake in the Alberto Pasqualini Refinery (REFAP) in the Brazilian state of Rio Grande do Sul. Repsol received 350 million dollars and, as a result of its divestment in REFAP, reduced its consolidated debt by nearly 500 million dollars. In YPF, on 25 November, YPF, S.A. management, at the request of Repsol YPF, S.A., agreed to prepare and file Form F-3 before the U.S. Securities and Exchange Commission (“SEC”), as foreseen in U.S. regulations. Registration of Form F-3 will contribute to increasing the liquidity of YPF, S.A. shares as Repsol YPF S.A., Repsol YPF Capital S.L. and Caveant S.A. (jointly, “Grupo Repsol YPF”) will be selling up to 58,996,919 Class D shares (or the equivalent in ADSs), representing 15% of YPF, S.A. share capital and voting rights in the company. On 7 December, Repsol announced the discovery of non-conventional natural gas (shale gas) at the Neuquén basin. As part of the exploration and production development program for 2010-2014 and after drilling 4 tight gas exploration wells south of Loma La Lata in Neuquén province, it was possible to confirm the existence of non-conventional gas with an estimated volume of approximately 4.5 TCF (trillion cubic feet).
Madrid, 24 February 2011
Investor Relations E-mail: [email protected] Website: www.repsol.com Pº Castellana 278-280 28046 Madrid (Spain) T: 34 917 53 55 48 F: 34 913 48 87 77 A teleconference for analysts and institutional investors is scheduled today, 24 February 2011, at 4:00 p.m. (CET) to report on Repsol’s fourth quarter 2010 results. The teleconference can be followed live at Repsol’s website (www.repsol.com). A recording of the entire event will be available for at least one month at the company’s website www.repsol.com for investors and any interested party.
39
Repsol YPF S.A. 4Q 2010 Earnings Preview
Repsol YPF S.A. 17
TABLES
4Q 2010 RESULTS
40
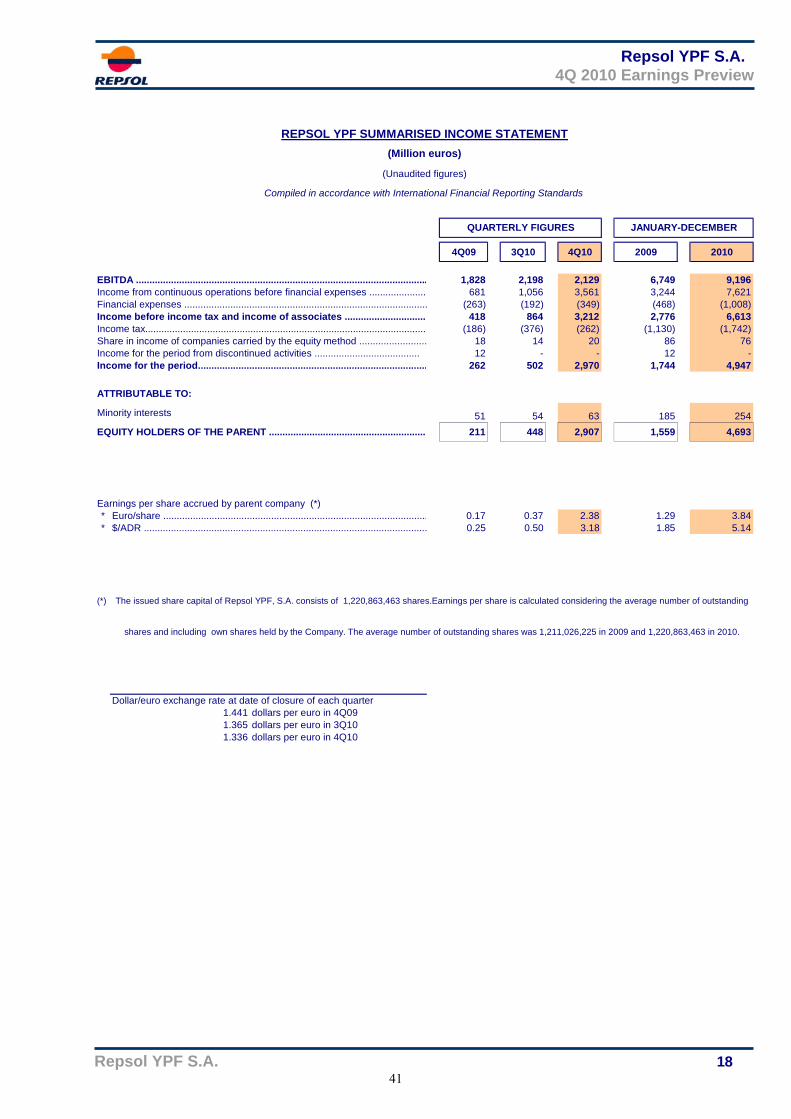
Repsol YPF S.A. 4Q 2010 Earnings Preview
Repsol YPF S.A. 18
4Q09 3Q10 4Q10 2009 2010
EBITDA ............................................................................................................ 1,828 2,198 2,129 6,749 9,196Income from continuous operations before financial expenses ..................... 681 1,056 3,561 3,244 7,621Financial expenses .......................................................................................... (263) (192) (349) (468) (1,008)Income before income tax and income of associates .............................. 418 864 3,212 2,776 6,613Income tax........................................................................................................ (186) (376) (262) (1,130) (1,742)Share in income of companies carried by the equity method ......................... 18 14 20 86 76Income for the period from discontinued activities ....................................... 12 - - 12 -Income for the period..................................................................................... 262 502 2,970 1,744 4,947
ATTRIBUTABLE TO:
Minority interests 51 54 63 185 254
EQUITY HOLDERS OF THE PARENT ........................................................... 211 448 2,907 1,559 4,693
Earnings per share accrued by parent company (*)* Euro/share .................................................................................................. 0.17 0.37 2.38 1.29 3.84* $/ADR ......................................................................................................... 0.25 0.50 3.18 1.85 5.14
(*)
Dollar/euro exchange rate at date of closure of each quarter1.441 dollars per euro in 4Q091.365 dollars per euro in 3Q101.336 dollars per euro in 4Q10
The issued share capital of Repsol YPF, S.A. consists of 1,220,863,463 shares.Earnings per share is calculated considering the average number of outstanding
shares and including own shares held by the Company. The average number of outstanding shares was 1,211,026,225 in 2009 and 1,220,863,463 in 2010.
JANUARY-DECEMBER
REPSOL YPF SUMMARISED INCOME STATEMENT(Million euros)
(Unaudited figures)
Compiled in accordance with International Financial Reporting Standards
QUARTERLY FIGURES
41
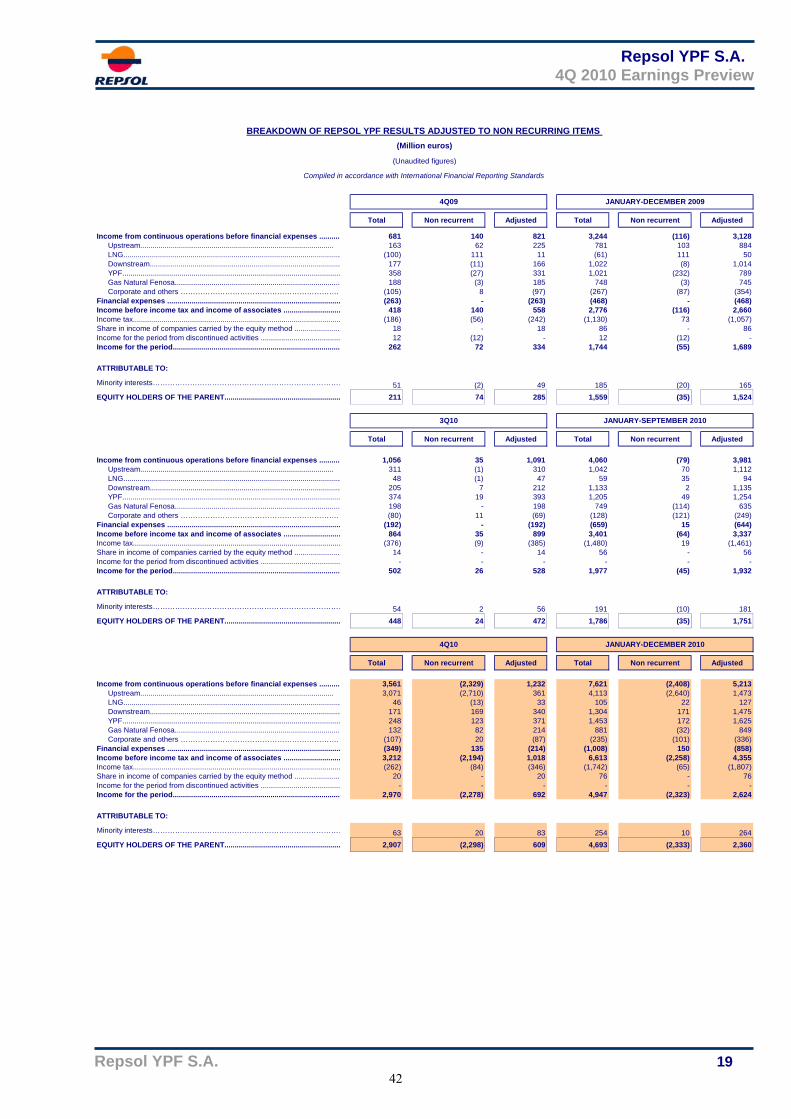
Repsol YPF S.A. 4Q 2010 Earnings Preview
Repsol YPF S.A. 19
Total Non recurrent Adjusted Total Non recurrent Adjusted
Income from continuous operations before financial expenses ........... 681 140 821 3,244 (116) 3,128Upstream............................................................................................... 163 62 225 781 103 884LNG........................................................................................................... (100) 111 11 (61) 111 50Downstream.............................................................................................. 177 (11) 166 1,022 (8) 1,014YPF........................................................................................................... 358 (27) 331 1,021 (232) 789Gas Natural Fenosa................................................................................. 188 (3) 185 748 (3) 745Corporate and others ………………………………………………………. (105) 8 (97) (267) (87) (354)
Financial expenses ..................................................................................... (263) - (263) (468) - (468)Income before income tax and income of associates ............................ 418 140 558 2,776 (116) 2,660Income tax...................................................................................................... (186) (56) (242) (1,130) 73 (1,057)Share in income of companies carried by the equity method ....................... 18 - 18 86 - 86Income for the period from discontinued activities ....................................... 12 (12) - 12 (12) -Income for the period................................................................................... 262 72 334 1,744 (55) 1,689
ATTRIBUTABLE TO:
Minority interests…………………………………………………………………… 51 (2) 49 185 (20) 165
EQUITY HOLDERS OF THE PARENT......................................................... 211 74 285 1,559 (35) 1,524
Total Non recurrent Adjusted Total Non recurrent Adjusted
Income from continuous operations before financial expenses ........... 1,056 35 1,091 4,060 (79) 3,981Upstream............................................................................................... 311 (1) 310 1,042 70 1,112LNG........................................................................................................... 48 (1) 47 59 35 94Downstream.............................................................................................. 205 7 212 1,133 2 1,135YPF........................................................................................................... 374 19 393 1,205 49 1,254Gas Natural Fenosa................................................................................. 198 - 198 749 (114) 635Corporate and others ………………………………………………………. (80) 11 (69) (128) (121) (249)
Financial expenses ..................................................................................... (192) - (192) (659) 15 (644)Income before income tax and income of associates ............................ 864 35 899 3,401 (64) 3,337Income tax...................................................................................................... (376) (9) (385) (1,480) 19 (1,461)Share in income of companies carried by the equity method ....................... 14 - 14 56 - 56Income for the period from discontinued activities ....................................... - - - - - -Income for the period................................................................................... 502 26 528 1,977 (45) 1,932
ATTRIBUTABLE TO:
Minority interests…………………………………………………………………… 54 2 56 191 (10) 181
EQUITY HOLDERS OF THE PARENT......................................................... 448 24 472 1,786 (35) 1,751
Total Non recurrent Adjusted Total Non recurrent Adjusted
Income from continuous operations before financial expenses ........... 3,561 (2,329) 1,232 7,621 (2,408) 5,213Upstream............................................................................................... 3,071 (2,710) 361 4,113 (2,640) 1,473LNG........................................................................................................... 46 (13) 33 105 22 127Downstream.............................................................................................. 171 169 340 1,304 171 1,475YPF........................................................................................................... 248 123 371 1,453 172 1,625Gas Natural Fenosa................................................................................. 132 82 214 881 (32) 849Corporate and others ………………………………………………………. (107) 20 (87) (235) (101) (336)
Financial expenses ..................................................................................... (349) 135 (214) (1,008) 150 (858)Income before income tax and income of associates ............................ 3,212 (2,194) 1,018 6,613 (2,258) 4,355Income tax...................................................................................................... (262) (84) (346) (1,742) (65) (1,807)Share in income of companies carried by the equity method ....................... 20 - 20 76 - 76Income for the period from discontinued activities ....................................... - - - - - -Income for the period................................................................................... 2,970 (2,278) 692 4,947 (2,323) 2,624
ATTRIBUTABLE TO:
Minority interests…………………………………………………………………… 63 20 83 254 10 264
EQUITY HOLDERS OF THE PARENT......................................................... 2,907 (2,298) 609 4,693 (2,333) 2,360
JANUARY-DECEMBER 2009
JANUARY-SEPTEMBER 2010
JANUARY-DECEMBER 2010
BREAKDOWN OF REPSOL YPF RESULTS ADJUSTED TO NON RECURRING ITEMS (Million euros)
(Unaudited figures)
Compiled in accordance with International Financial Reporting Standards
4Q09
3Q10
4Q10
42
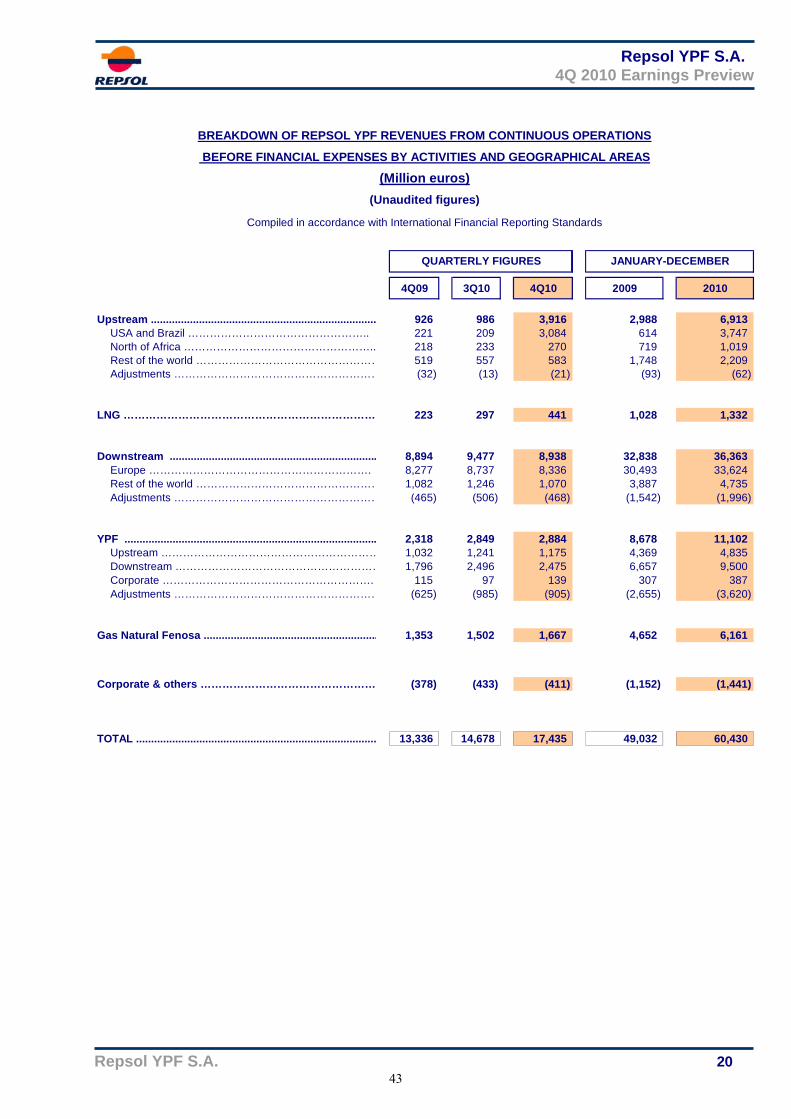
Repsol YPF S.A. 4Q 2010 Earnings Preview
Repsol YPF S.A. 20
4Q09 3Q10 4Q10 2009 2010
Upstream ........................................................................... 926 986 3,916 2,988 6,913USA and Brazil ………………………………………….. 221 209 3,084 614 3,747North of Africa …………………………………………….. 218 233 270 719 1,019Rest of the world …………………………………………… 519 557 583 1,748 2,209Adjustments ………………………………………………… (32) (13) (21) (93) (62)
LNG …………………………………………………………… 223 297 441 1,028 1,332
Downstream ..................................................................... 8,894 9,477 8,938 32,838 36,363
Europe ……………………………………………………. 8,277 8,737 8,336 30,493 33,624Rest of the world …………………………………………… 1,082 1,246 1,070 3,887 4,735Adjustments ………………………………………………… (465) (506) (468) (1,542) (1,996)
YPF .................................................................................... 2,318 2,849 2,884 8,678 11,102Upstream …………………………………………………… 1,032 1,241 1,175 4,369 4,835Downstream ………………………………………………… 1,796 2,496 2,475 6,657 9,500Corporate …………………………………………………. 115 97 139 307 387Adjustments ………………………………………………… (625) (985) (905) (2,655) (3,620)
Gas Natural Fenosa .......................................................... 1,353 1,502 1,667 4,652 6,161
Corporate & others ………………………………………… (378) (433) (411) (1,152) (1,441)
TOTAL ................................................................................ 13,336 14,678 17,435 49,032 60,430
JANUARY-DECEMBER
BREAKDOWN OF REPSOL YPF REVENUES FROM CONTINUOUS OPERATIONS
BEFORE FINANCIAL EXPENSES BY ACTIVITIES AND GEOGRAPHICAL AREAS
(Million euros)(Unaudited figures)
Compiled in accordance with International Financial Reporting Standards
QUARTERLY FIGURES
43
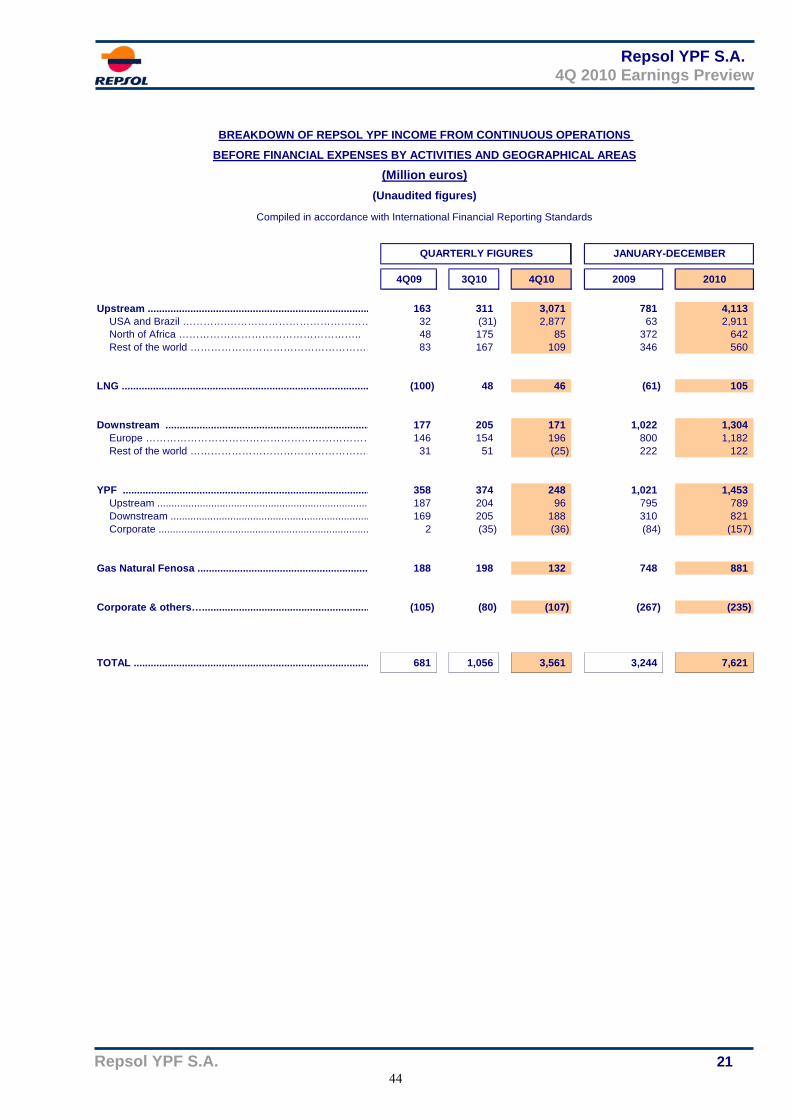
Repsol YPF S.A. 4Q 2010 Earnings Preview
Repsol YPF S.A. 21
4Q09 3Q10 4Q10 2009 2010
Upstream .............................................................................. 163 311 3,071 781 4,113USA and Brazil ………….…………………………………… 32 (31) 2,877 63 2,911North of Africa …………………………………………….. 48 175 85 372 642Rest of the world ……………………………………………… 83 167 109 346 560
LNG ....................................................................................... (100) 48 46 (61) 105
Downstream ........................................................................ 177 205 171 1,022 1,304
Europe ………………………………………………………… 146 154 196 800 1,182Rest of the world ……………………………………………… 31 51 (25) 222 122
YPF ....................................................................................... 358 374 248 1,021 1,453Upstream .......................................................................... 187 204 96 795 789Downstream ...................................................................... 169 205 188 310 821Corporate .......................................................................... 2 (35) (36) (84) (157)
Gas Natural Fenosa ............................................................ 188 198 132 748 881
Corporate & others…........................................................... (105) (80) (107) (267) (235)
TOTAL ................................................................................... 681 1,056 3,561 3,244 7,621
JANUARY-DECEMBER
BREAKDOWN OF REPSOL YPF INCOME FROM CONTINUOUS OPERATIONS
BEFORE FINANCIAL EXPENSES BY ACTIVITIES AND GEOGRAPHICAL AREAS
(Million euros)(Unaudited figures)
Compiled in accordance with International Financial Reporting Standards
QUARTERLY FIGURES
44
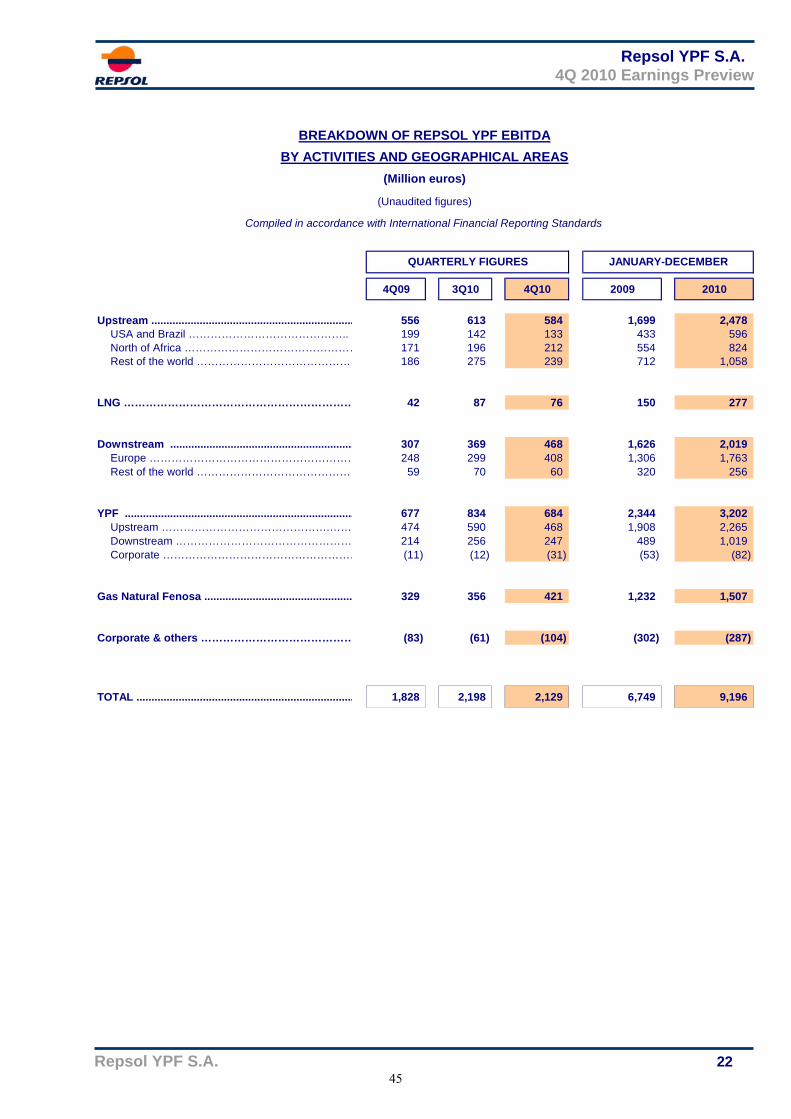
Repsol YPF S.A. 4Q 2010 Earnings Preview
Repsol YPF S.A. 22
4Q09 3Q10 4Q10 2009 2010
Upstream ................................................................... 556 613 584 1,699 2,478USA and Brazil …………………………………….. 199 142 133 433 596North of Africa ………………………………………… 171 196 212 554 824Rest of the world ……………………………………… 186 275 239 712 1,058
LNG ……………………………………………………… 42 87 76 150 277
Downstream ............................................................. 307 369 468 1,626 2,019
Europe ………………………………………………… 248 299 408 1,306 1,763Rest of the world ……………………………………… 59 70 60 320 256
YPF ............................................................................ 677 834 684 2,344 3,202Upstream ……………………………………….…… 474 590 468 1,908 2,265Downstream ………………………………………… 214 256 247 489 1,019Corporate ……………………………………………… (11) (12) (31) (53) (82)
Gas Natural Fenosa ................................................. 329 356 421 1,232 1,507
Corporate & others …………………………………… (83) (61) (104) (302) (287)
TOTAL ........................................................................ 1,828 2,198 2,129 6,749 9,196
JANUARY-DECEMBER
BREAKDOWN OF REPSOL YPF EBITDABY ACTIVITIES AND GEOGRAPHICAL AREAS
(Million euros)
(Unaudited figures)
Compiled in accordance with International Financial Reporting Standards
QUARTERLY FIGURES
45
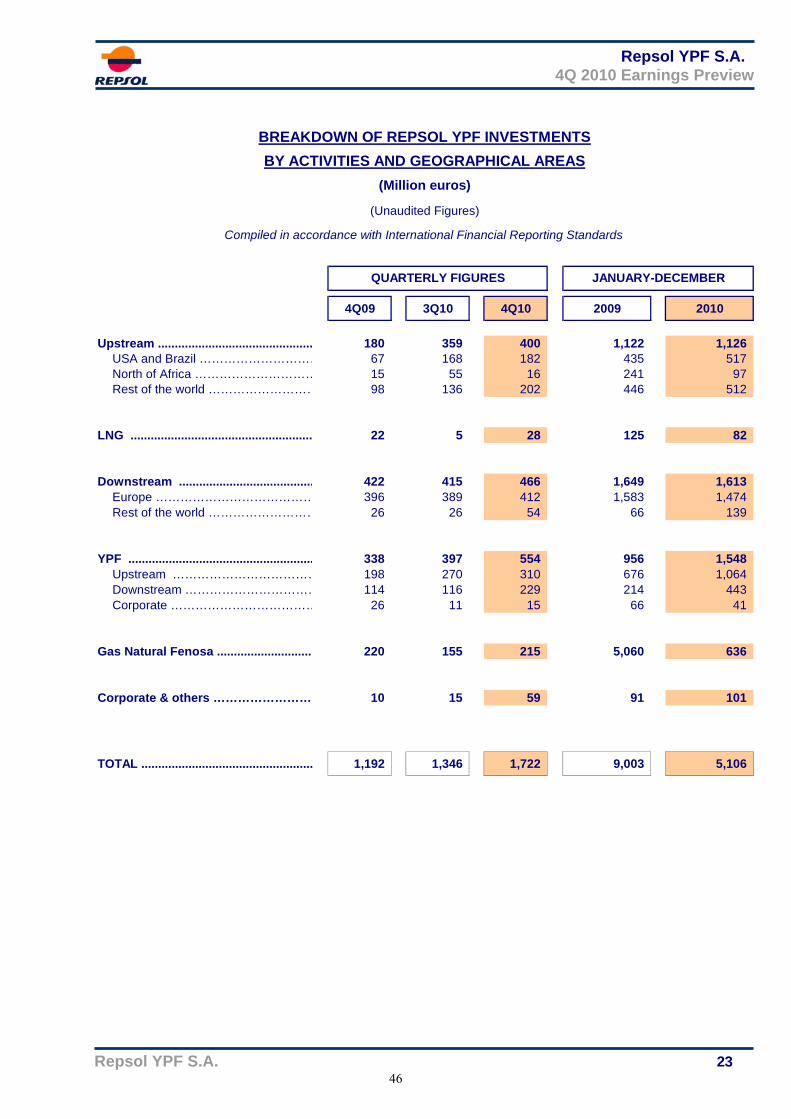
Repsol YPF S.A. 4Q 2010 Earnings Preview
Repsol YPF S.A. 23
4Q09 3Q10 4Q10 2009 2010
Upstream .............................................. 180 359 400 1,122 1,126USA and Brazil ………………………… 67 168 182 435 517North of Africa ………………………… 15 55 16 241 97Rest of the world ……………………… 98 136 202 446 512
LNG ...................................................... 22 5 28 125 82
Downstream ........................................ 422 415 466 1,649 1,613
Europe ………………………………… 396 389 412 1,583 1,474Rest of the world ……………………… 26 26 54 66 139
YPF ....................................................... 338 397 554 956 1,548Upstream ……………………………… 198 270 310 676 1,064Downstream …………………………… 114 116 229 214 443Corporate ……………………………… 26 11 15 66 41
Gas Natural Fenosa ............................. 220 155 215 5,060 636
Corporate & others …………………… 10 15 59 91 101
TOTAL ................................................... 1,192 1,346 1,722 9,003 5,106
JANUARY-DECEMBER
BREAKDOWN OF REPSOL YPF INVESTMENTSBY ACTIVITIES AND GEOGRAPHICAL AREAS
(Million euros)
(Unaudited Figures)
Compiled in accordance with International Financial Reporting Standards
QUARTERLY FIGURES
46
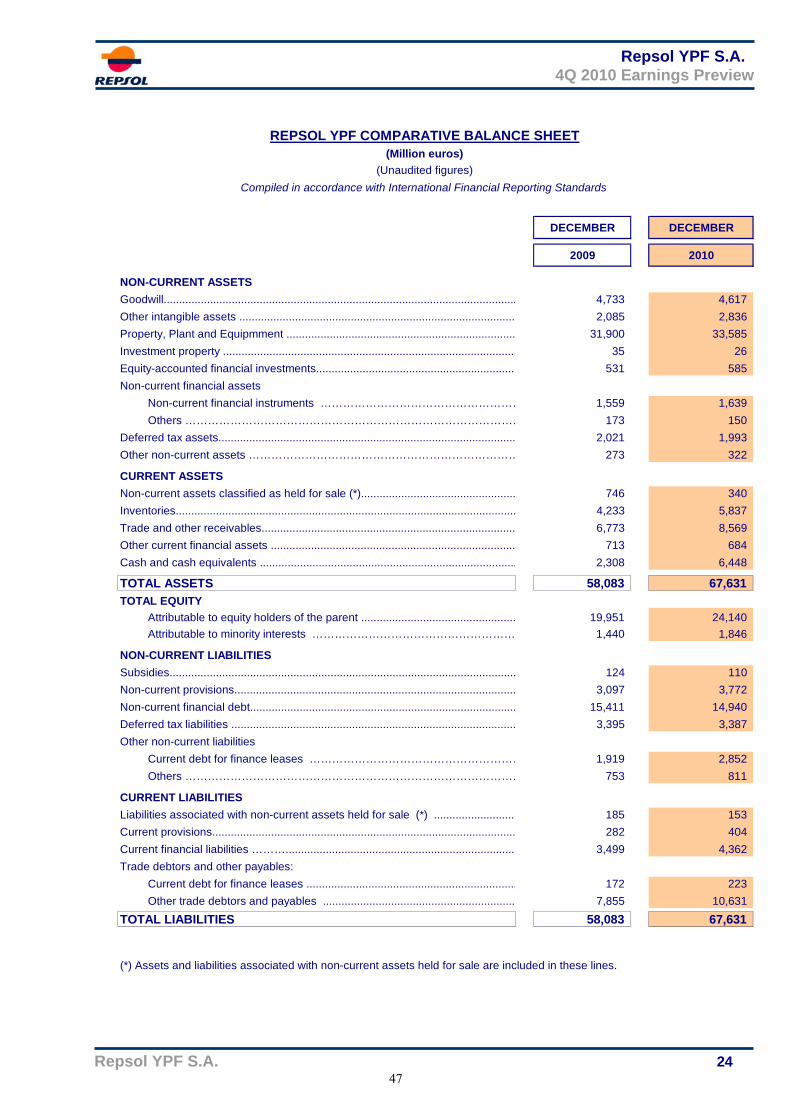
Repsol YPF S.A. 4Q 2010 Earnings Preview
Repsol YPF S.A. 24
DECEMBER DECEMBER
2009 2010
NON-CURRENT ASSETSGoodwill.................................................................................................................. 4,733 4,617
Other intangible assets ......................................................................................... 2,085 2,836
Property, Plant and Equipmment .......................................................................... 31,900 33,585
Investment property ............................................................................................... 35 26
Equity-accounted financial investments................................................................ 531 585
Non-current financial assets
Non-current financial instruments ……………………………………………… 1,559 1,639
Others ……………………………………………………………………………… 173 150
Deferred tax assets................................................................................................ 2,021 1,993
Other non-current assets ……………………………………………………………… 273 322
CURRENT ASSETSNon-current assets classified as held for sale (*).................................................. 746 340
Inventories.............................................................................................................. 4,233 5,837
Trade and other receivables.................................................................................. 6,773 8,569
Other current financial assets ............................................................................... 713 684
Cash and cash equivalents ................................................................................... 2,308 6,448
TOTAL ASSETS 58,083 67,631TOTAL EQUITY
Attributable to equity holders of the parent .................................................. 19,951 24,140
Attributable to minority interests ……………………………………………… 1,440 1,846
NON-CURRENT LIABILITIESSubsidies................................................................................................................ 124 110
Non-current provisions........................................................................................... 3,097 3,772
Non-current financial debt...................................................................................... 15,411 14,940
Deferred tax liabilities ............................................................................................ 3,395 3,387
Other non-current liabilities
Current debt for finance leases ………………………………………………… 1,919 2,852
Others ……………………………………………………………………………… 753 811
CURRENT LIABILITIESLiabilities associated with non-current assets held for sale (*) .......................... 185 153
Current provisions.................................................................................................. 282 404
Current financial liabilities ……….......................................................................... 3,499 4,362
Trade debtors and other payables:
Current debt for finance leases .................................................................... 172 223
Other trade debtors and payables .............................................................. 7,855 10,631
TOTAL LIABILITIES 58,083 67,631
(*) Assets and liabilities associated with non-current assets held for sale are included in these lines.
REPSOL YPF COMPARATIVE BALANCE SHEET(Million euros)
(Unaudited figures)
Compiled in accordance with International Financial Reporting Standards
47
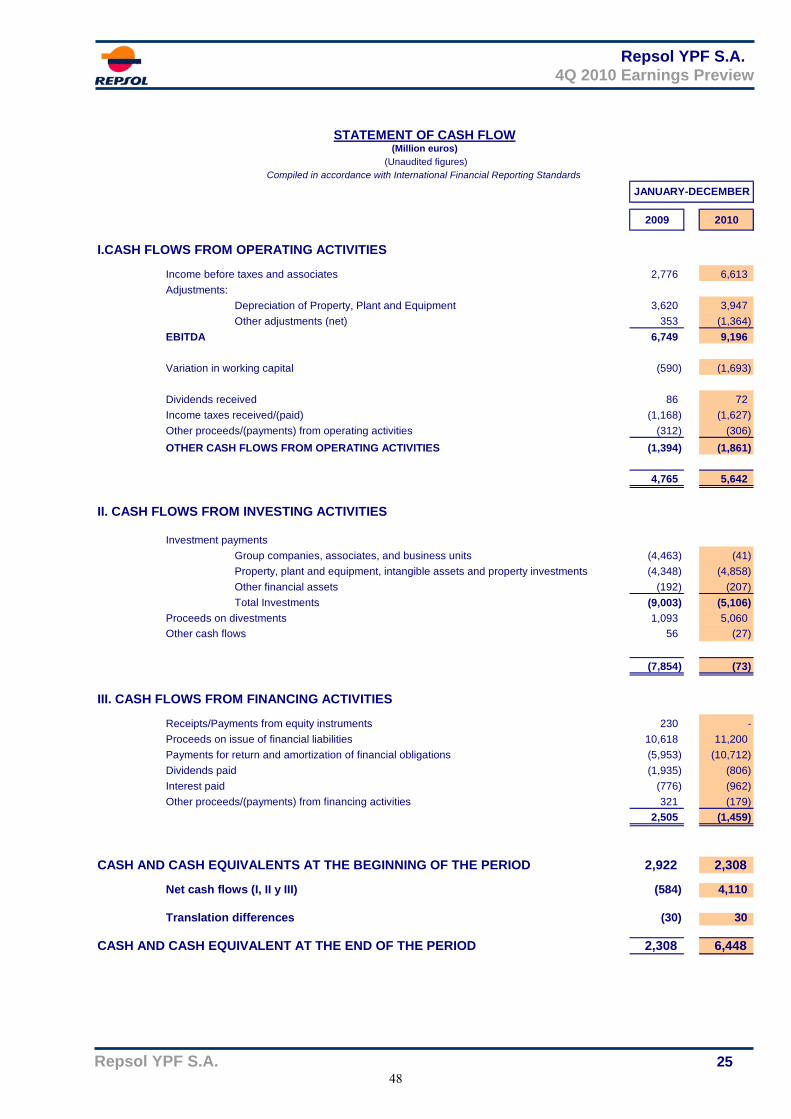
Repsol YPF S.A. 4Q 2010 Earnings Preview
Repsol YPF S.A. 25
2009 2010
I.CASH FLOWS FROM OPERATING ACTIVITIES
Income before taxes and associates 2,776 6,613
Adjustments:
Depreciation of Property, Plant and Equipment 3,620 3,947
Other adjustments (net) 353 (1,364)
EBITDA 6,749 9,196
Variation in working capital (590) (1,693)
Dividends received 86 72
Income taxes received/(paid) (1,168) (1,627)
Other proceeds/(payments) from operating activities (312) (306)
OTHER CASH FLOWS FROM OPERATING ACTIVITIES (1,394) (1,861)
4,765 5,642
II. CASH FLOWS FROM INVESTING ACTIVITIES
Investment payments
Group companies, associates, and business units (4,463) (41)
Property, plant and equipment, intangible assets and property investments (4,348) (4,858)
Other financial assets (192) (207)
Total Investments (9,003) (5,106)Proceeds on divestments 1,093 5,060
Other cash flows 56 (27)
(7,854) (73)
III. CASH FLOWS FROM FINANCING ACTIVITIES
Receipts/Payments from equity instruments 230 -
Proceeds on issue of financial liabilities 10,618 11,200
Payments for return and amortization of financial obligations (5,953) (10,712)
Dividends paid (1,935) (806)
Interest paid (776) (962)
Other proceeds/(payments) from financing activities 321 (179)
2,505 (1,459)
CASH AND CASH EQUIVALENTS AT THE BEGINNING OF THE PERIOD 2,922 2,308
Net cash flows (I, II y III) (584) 4,110
Translation differences (30) 30
CASH AND CASH EQUIVALENT AT THE END OF THE PERIOD 2,308 6,448
JANUARY-DECEMBER
STATEMENT OF CASH FLOW(Million euros)
(Unaudited figures)Compiled in accordance with International Financial Reporting Standards
48
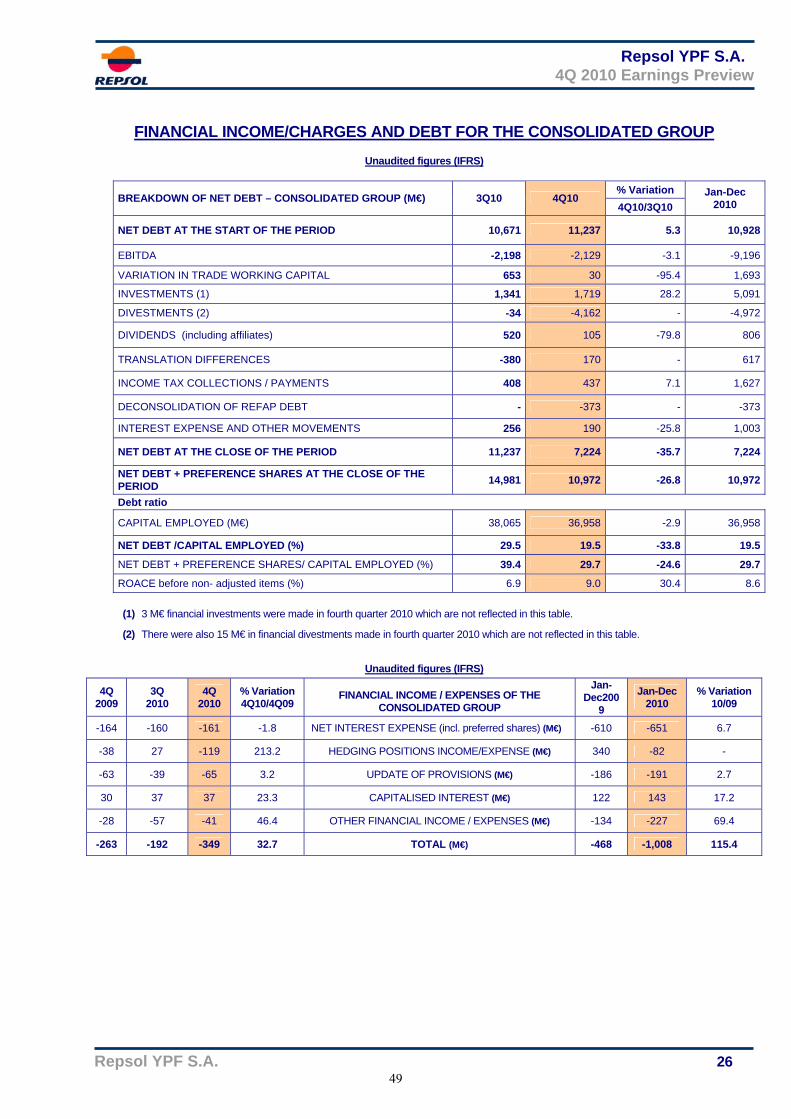
Repsol YPF S.A. 4Q 2010 Earnings Preview
Repsol YPF S.A. 26
FINANCIAL INCOME/CHARGES AND DEBT FOR THE CONSOLIDATED GROUP
Unaudited figures (IFRS)
% Variation BREAKDOWN OF NET DEBT – CONSOLIDATED GROUP (M€) 3Q10 4Q10
4Q10/3Q10 Jan-Dec
2010
NET DEBT AT THE START OF THE PERIOD 10,671 11,237 5.3 10,928
EBITDA -2,198 -2,129 -3.1 -9,196
VARIATION IN TRADE WORKING CAPITAL 653 30 -95.4 1,693
INVESTMENTS (1) 1,341 1,719 28.2 5,091
DIVESTMENTS (2) -34 -4,162 - -4,972
DIVIDENDS (including affiliates) 520 105 -79.8 806
TRANSLATION DIFFERENCES -380 170 - 617
INCOME TAX COLLECTIONS / PAYMENTS 408 437 7.1 1,627
DECONSOLIDATION OF REFAP DEBT - -373 - -373
INTEREST EXPENSE AND OTHER MOVEMENTS 256 190 -25.8 1,003
NET DEBT AT THE CLOSE OF THE PERIOD 11,237 7,224 -35.7 7,224
NET DEBT + PREFERENCE SHARES AT THE CLOSE OF THE PERIOD 14,981 10,972 -26.8 10,972
Debt ratio
CAPITAL EMPLOYED (M€) 38,065 36,958 -2.9 36,958
NET DEBT /CAPITAL EMPLOYED (%) 29.5 19.5 -33.8 19.5
NET DEBT + PREFERENCE SHARES/ CAPITAL EMPLOYED (%) 39.4 29.7 -24.6 29.7
ROACE before non- adjusted items (%) 6.9 9.0 30.4 8.6
(1) 3 M€ financial investments were made in fourth quarter 2010 which are not reflected in this table.
(2) There were also 15 M€ in financial divestments made in fourth quarter 2010 which are not reflected in this table.
Unaudited figures (IFRS)
4Q 2009
3Q 2010
4Q 2010
% Variation 4Q10/4Q09
FINANCIAL INCOME / EXPENSES OF THE CONSOLIDATED GROUP
Jan-Dec200
9
Jan-Dec 2010
% Variation 10/09
-164 -160 -161 -1.8 NET INTEREST EXPENSE (incl. preferred shares) (M€) -610 -651 6.7
-38 27 -119 213.2 HEDGING POSITIONS INCOME/EXPENSE (M€) 340 -82 -
-63 -39 -65 3.2 UPDATE OF PROVISIONS (M€) -186 -191 2.7
30 37 37 23.3 CAPITALISED INTEREST (M€) 122 143 17.2
-28 -57 -41 46.4 OTHER FINANCIAL INCOME / EXPENSES (M€) -134 -227 69.4
-263 -192 -349 32.7 TOTAL (M€) -468 -1,008 115.4
49
Repsol YPF S.A. 4Q 2010 Earnings Preview
Repsol YPF S.A. 27
TABLES
OPERATING HIGHLIGHTS 4Q 2010
50
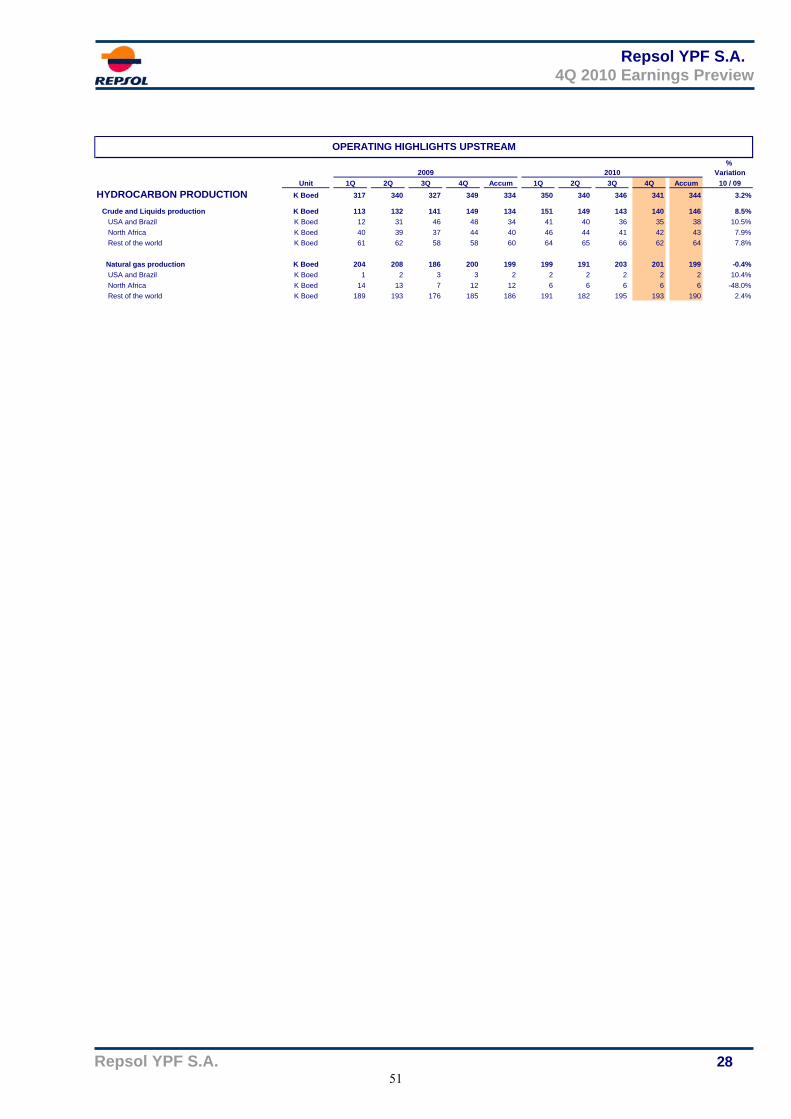
Repsol YPF S.A. 4Q 2010 Earnings Preview
Repsol YPF S.A. 28
% Variation
Unit 1Q 2Q 3Q 4Q Accum 1Q 2Q 3Q 4Q Accum 10 / 09HYDROCARBON PRODUCTION K Boed 317 340 327 349 334 350 340 346 341 344 3.2%
Crude and Liquids production K Boed 113 132 141 149 134 151 149 143 140 146 8.5%USA and Brazil K Boed 12 31 46 48 34 41 40 36 35 38 10.5%
North Africa K Boed 40 39 37 44 40 46 44 41 42 43 7.9%
Rest of the world K Boed 61 62 58 58 60 64 65 66 62 64 7.8%
Natural gas production K Boed 204 208 186 200 199 199 191 203 201 199 -0.4%USA and Brazil K Boed 1 2 3 3 2 2 2 2 2 2 10.4%
North Africa K Boed 14 13 7 12 12 6 6 6 6 6 -48.0%
Rest of the world K Boed 189 193 176 185 186 191 182 195 193 190 2.4%
OPERATING HIGHLIGHTS UPSTREAM
2009 2010
51
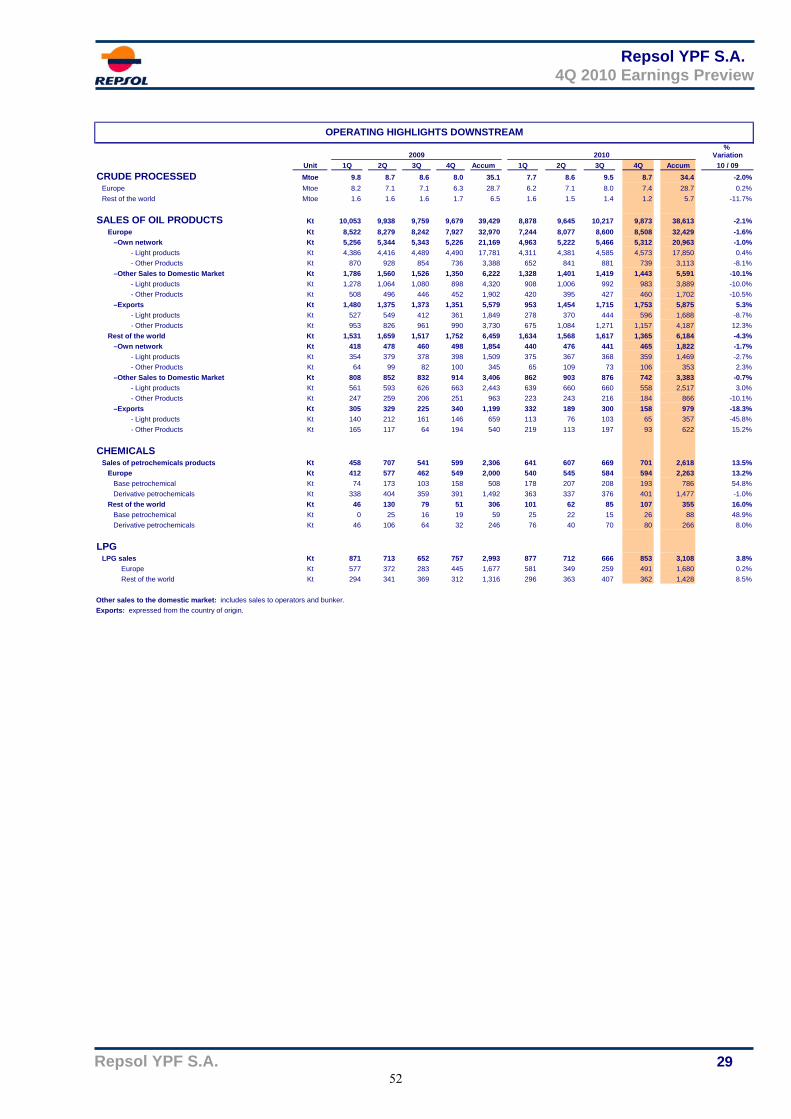
Repsol YPF S.A. 4Q 2010 Earnings Preview
Repsol YPF S.A. 29
% Variation
Unit 1Q 2Q 3Q 4Q Accum 1Q 2Q 3Q 4Q Accum 10 / 09CRUDE PROCESSED Mtoe 9.8 8.7 8.6 8.0 35.1 7.7 8.6 9.5 8.7 34.4 -2.0%
Europe Mtoe 8.2 7.1 7.1 6.3 28.7 6.2 7.1 8.0 7.4 28.7 0.2%
Rest of the world Mtoe 1.6 1.6 1.6 1.7 6.5 1.6 1.5 1.4 1.2 5.7 -11.7%
SALES OF OIL PRODUCTS Kt 10,053 9,938 9,759 9,679 39,429 8,878 9,645 10,217 9,873 38,613 -2.1%Europe Kt 8,522 8,279 8,242 7,927 32,970 7,244 8,077 8,600 8,508 32,429 -1.6%
–Own network Kt 5,256 5,344 5,343 5,226 21,169 4,963 5,222 5,466 5,312 20,963 -1.0% - Light products Kt 4,386 4,416 4,489 4,490 17,781 4,311 4,381 4,585 4,573 17,850 0.4%
- Other Products Kt 870 928 854 736 3,388 652 841 881 739 3,113 -8.1%
–Other Sales to Domestic Market Kt 1,786 1,560 1,526 1,350 6,222 1,328 1,401 1,419 1,443 5,591 -10.1% - Light products Kt 1,278 1,064 1,080 898 4,320 908 1,006 992 983 3,889 -10.0%
- Other Products Kt 508 496 446 452 1,902 420 395 427 460 1,702 -10.5%
–Exports Kt 1,480 1,375 1,373 1,351 5,579 953 1,454 1,715 1,753 5,875 5.3% - Light products Kt 527 549 412 361 1,849 278 370 444 596 1,688 -8.7%
- Other Products Kt 953 826 961 990 3,730 675 1,084 1,271 1,157 4,187 12.3%
Rest of the world Kt 1,531 1,659 1,517 1,752 6,459 1,634 1,568 1,617 1,365 6,184 -4.3%–Own network Kt 418 478 460 498 1,854 440 476 441 465 1,822 -1.7%
- Light products Kt 354 379 378 398 1,509 375 367 368 359 1,469 -2.7%
- Other Products Kt 64 99 82 100 345 65 109 73 106 353 2.3%
–Other Sales to Domestic Market Kt 808 852 832 914 3,406 862 903 876 742 3,383 -0.7% - Light products Kt 561 593 626 663 2,443 639 660 660 558 2,517 3.0%
- Other Products Kt 247 259 206 251 963 223 243 216 184 866 -10.1%
–Exports Kt 305 329 225 340 1,199 332 189 300 158 979 -18.3% - Light products Kt 140 212 161 146 659 113 76 103 65 357 -45.8%
- Other Products Kt 165 117 64 194 540 219 113 197 93 622 15.2%
CHEMICALSSales of petrochemicals products Kt 458 707 541 599 2,306 641 607 669 701 2,618 13.5%
Europe Kt 412 577 462 549 2,000 540 545 584 594 2,263 13.2%Base petrochemical Kt 74 173 103 158 508 178 207 208 193 786 54.8%
Derivative petrochemicals Kt 338 404 359 391 1,492 363 337 376 401 1,477 -1.0%
Rest of the world Kt 46 130 79 51 306 101 62 85 107 355 16.0%Base petrochemical Kt 0 25 16 19 59 25 22 15 26 88 48.9%
Derivative petrochemicals Kt 46 106 64 32 246 76 40 70 80 266 8.0%
LPGLPG sales Kt 871 713 652 757 2,993 877 712 666 853 3,108 3.8%
Europe Kt 577 372 283 445 1,677 581 349 259 491 1,680 0.2%
Rest of the world Kt 294 341 369 312 1,316 296 363 407 362 1,428 8.5%
Other sales to the domestic market: includes sales to operators and bunker.
Exports: expressed from the country of origin.
2009 2010
OPERATING HIGHLIGHTS DOWNSTREAM
52
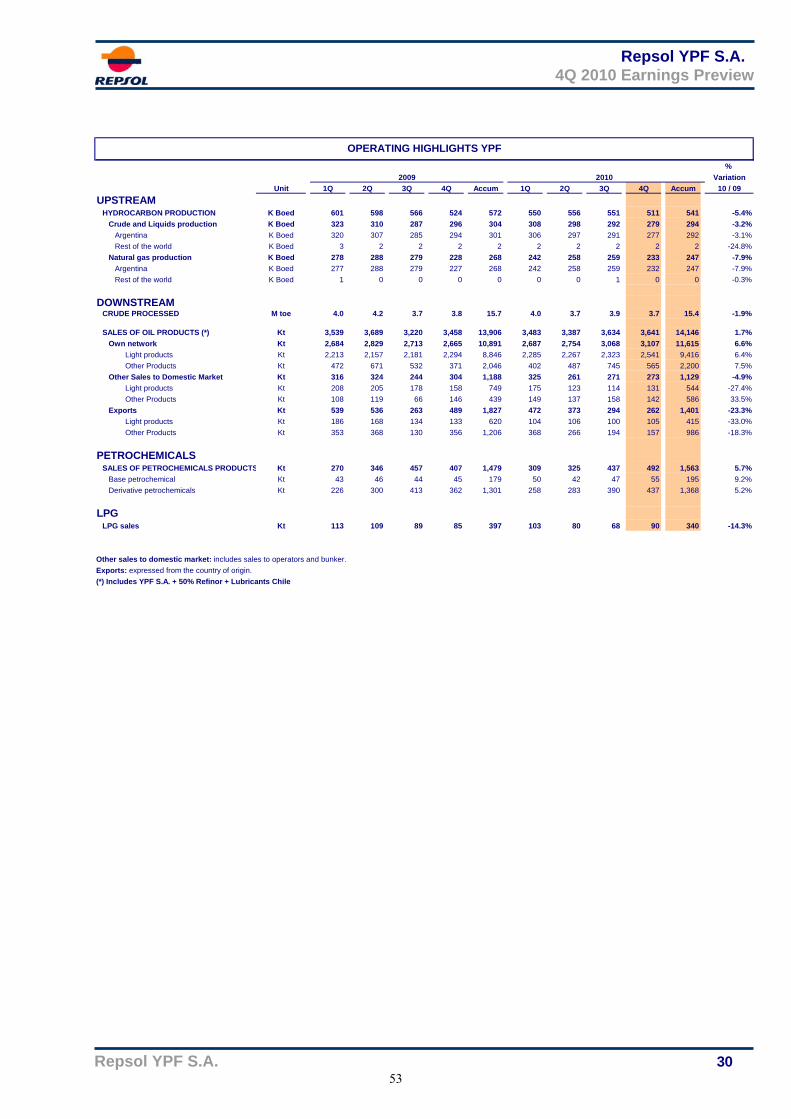
Repsol YPF S.A. 4Q 2010 Earnings Preview
Repsol YPF S.A. 30
% 2009 2010 Variation
Unit 1Q 2Q 3Q 4Q Accum 1Q 2Q 3Q 4Q Accum 10 / 09UPSTREAM
HYDROCARBON PRODUCTION K Boed 601 598 566 524 572 550 556 551 511 541 -5.4%Crude and Liquids production K Boed 323 310 287 296 304 308 298 292 279 294 -3.2%
Argentina K Boed 320 307 285 294 301 306 297 291 277 292 -3.1%
Rest of the world K Boed 3 2 2 2 2 2 2 2 2 2 -24.8%
Natural gas production K Boed 278 288 279 228 268 242 258 259 233 247 -7.9%Argentina K Boed 277 288 279 227 268 242 258 259 232 247 -7.9%
Rest of the world K Boed 1 0 0 0 0 0 0 1 0 0 -0.3%
DOWNSTREAMCRUDE PROCESSED M toe 4.0 4.2 3.7 3.8 15.7 4.0 3.7 3.9 3.7 15.4 -1.9%
SALES OF OIL PRODUCTS (*) Kt 3,539 3,689 3,220 3,458 13,906 3,483 3,387 3,634 3,641 14,146 1.7%Own network Kt 2,684 2,829 2,713 2,665 10,891 2,687 2,754 3,068 3,107 11,615 6.6%
Light products Kt 2,213 2,157 2,181 2,294 8,846 2,285 2,267 2,323 2,541 9,416 6.4%
Other Products Kt 472 671 532 371 2,046 402 487 745 565 2,200 7.5%
Other Sales to Domestic Market Kt 316 324 244 304 1,188 325 261 271 273 1,129 -4.9% Light products Kt 208 205 178 158 749 175 123 114 131 544 -27.4%
Other Products Kt 108 119 66 146 439 149 137 158 142 586 33.5%
Exports Kt 539 536 263 489 1,827 472 373 294 262 1,401 -23.3% Light products Kt 186 168 134 133 620 104 106 100 105 415 -33.0%
Other Products Kt 353 368 130 356 1,206 368 266 194 157 986 -18.3%
PETROCHEMICALSSALES OF PETROCHEMICALS PRODUCTS Kt 270 346 457 407 1,479 309 325 437 492 1,563 5.7%
Base petrochemical Kt 43 46 44 45 179 50 42 47 55 195 9.2%
Derivative petrochemicals Kt 226 300 413 362 1,301 258 283 390 437 1,368 5.2%
LPGLPG sales Kt 113 109 89 85 397 103 80 68 90 340 -14.3%
Other sales to domestic market: includes sales to operators and bunker.
Exports: expressed from the country of origin.
(*) Includes YPF S.A. + 50% Refinor + Lubricants Chile
OPERATING HIGHLIGHTS YPF
53
Repsol YPF S.A. 4Q 2010 Earnings Preview
Repsol YPF S.A. 31
This document contains statements that Repsol YPF believes constitute forward-looking statements within the meaning of the US Private Securities Litigation Reform Act of 1995. These forward-looking statements may include statements regarding the intent, belief, or current expectations of Repsol YPF and its management, including statements with respect to trends affecting Repsol YPF’s financial condition, financial ratios, results of operations, business, strategy, geographic concentration, production volume and reserves, as well as Repsol YPF’s plans, expectations or objectives with respect to capital expenditures, business, strategy, geographic concentration, costs savings, investments and dividend payout policies. These forward-looking statements may also include assumptions regarding future economic and other conditions, such as future crude oil and other prices, refining and marketing margins and exchange rates. These statements are not guarantees of future performance, prices, margins, exchange rates or other events and are subject to material risks, uncertainties, changes and other factors which may be beyond Repsol YPF’s control or may be difficult to predict. Repsol YPF’s future financial condition, financial ratios, results of operations, business, strategy, geographic concentration, production volumes, reserves, capital expenditures, costs savings, investments and dividend payout policies, as well as future economic and other conditions, such as future crude oil and other prices, refining margins and exchange rates, could differ materially from those expressed or implied in any such forward-looking statements. Important factors that could cause such differences include, but are not limited to, oil, gas and other price fluctuations, supply and demand levels, currency fluctuations, exploration, drilling and production results, changes in reserves estimates, success in partnering with third parties, loss of market share, industry competition, environmental risks, physical risks, the risks of doing business in developing countries, legislative, tax, legal and regulatory developments, economic and financial market conditions in various countries and regions, political risks, wars and acts of terrorism, natural disasters, project delays or advancements and lack of approvals, as well as those factors described in the filings made by Repsol YPF and its affiliates with the Comisión Nacional del Mercado de Valores in Spain, the Comisión Nacional de Valores in Argentina, and the Securities and Exchange Commission in the United States. These documents are available on Repsol YPF’s website (www.repsol.com). In light of the foregoing, the forward-looking statements included in this document may not occur. Repsol YPF does not undertake to publicly update or revise these forward-looking statements even if experience or future changes make it clear that the projected performance, conditions or events expressed or implied therein will not be realized. This document does not constitute an offer to purchase, subscribe, sale or exchange of Repsol YPF's or YPF Sociedad Anonima's respective ordinary shares or ADSs in the United States or otherwise. Repsol YPF's and YPF Sociedad Anonima's respective ordinary shares and ADSs may not be sold in the United States absent registration or an exemption from registration under the US Securities Act of 1933, as amended.
54

Madrid, 24th February 2011
The Board of Directors of Repsol YPF, S.A. resolved yesterday to convene the Ordinary General Shareholders’ Meeting which will be held at the Palacio Municipal de Congresos, Avenida de la Capital de España-Madrid, Campo de las Naciones, Madrid on 14th April 2011 at 12:00 noon on first call, and at the same time and place on 15th April 2011 on second call.
The notice of call and the report referred to in Section 116.bis of the Securities Market Act are attached.
The notice of call will be published in the Official Commercial Registry Bulletin and in the newspapers in the following days. On the date of publication, all the relevant information will be available to shareholders. All the information related to the General Shareholders´ Meeting will also be available on the Company’s website (www.repsol.com).
The Board of Directors also unanimously agreed, at the proposal of the Nomination and Compensation Committee, to include in the agenda of the next General Shareholders´ Meeting the re-election of the following board members for a new period of four years: - Mr. Luis Carlos Croissier Batista.
- Mr. Ángel Durández Adeva.
Similarly, following a report from the Nomination and Compensation Committee, the Board of Directors, by unanimous consent, agreed to include in the agenda of the next General Shareholders’ Meeting the re-election of Mr. Antonio Brufau Niubó, Mr. Luis Fernando del Rivero Asensio, Mr. Juan Abelló Gallo and Mr. José Manuel Loureda Mantiñan as Directors of the Company for a new four-year period. Additionally, the Nomination and Compensation Committee proposed to the Board of Directors the appointment of Mr. Mario Fernández Pelaz as a new Independent Director and as member of the Nomination and Compensation Committee, so that the majority of the members of said Committee will be Independent Directors. Mr. Mario Fernández Pelaz will fill the vacancy produced by the resignation of Mr. Carmelo de las Morenas López, who will give up his position as Independent Director in the same day that the Ordinary General Shareholders’ Meeting will be held. Mr. Mario Fernández Pelaz is currently Chairman of BBK. Previously, from 1980 to 1985 was Member of the Board and Vicelehendakari of the Basque Government. Chairman of the Joint Committee of Central Administration—Basque Government relations, Chairman of the Basque Board of Finance, Chairman of the Economic Committee of the Basque Government. From 1997
55
to 2002 was Executive Director of Legal Affairs and Member of the Executive Committee of BBVA Group and from 2002 to June 2009 was Principal Partner of Uría Menéndez. During the meeting of the Board of Directors the Executive Chairman of Repsol, Mr. Antonio Brufau thanked Mr. Carmelo de las Morenas López for his dedication, contribution, effort and loyalty to the company during his years as employee and member of the Board of Directors. Finally, the Board of Directors, in its meeting held yesterday, agreed to amend its Regulations1. Said amendment, which was favourably informed by the Nomination and Compensation Committee and by the Audit and Control Committee, has a two-fold purpose:
First, to incorporate into the Company’s system of Corporate Governance the position of the Lead Independent Director, appointed among the Outside Independent Directors. This position, that will held by Mr. Artur Carulla Font, current Chairman of the Nomination and Compensation Committee, will confer, among others, the powers recommended by the Unified Code of Good Government; and
Second, to regulate the Audit and Control Committee in the same manner than the
current 18th Additional Provision of the Securities Market Act, which regulates the Audit Committee of the entities which issue marketable securities in Spanish official markets, as amended by Act 12/2010, of 30th July.
1 The adapted text of the Regulations of the Board of Directors, will be available for the shareholders through the web site of the Company once communicated and delivered to the “Comisión Nacional del Mercado de Valores”.
56
REPSOL YPF, S.A. CALL FOR ORDINARY GENERAL SHAREHOLDERS' MEETING
By resolution of the Board of Directors of Repsol YPF, S.A., shareholders are called to the Ordinary General Shareholders’ Meeting which will be held at the Palacio Municipal de Congresos, Avenida de la Capital de España-Madrid, Campo de las Naciones, Madrid, on 14th April 2011 at 12:00 noon on first call, and at the same time and place on 15th April 2011 on the second call, with respect to the following:
AGENDA
POINTS REGARDING THE ANNUAL ACCOUNTS, THE MANAGEMENT BY THE BOARD AND THE REELECTION OF THE ACCOUNTS AUDITOR
First. Review and approval, if appropriate, of the Annual Financial Statements and the Management Report of Repsol YPF, S.A., of the Consolidated Annual Financial Statements and the Consolidated Management Report, for the fiscal year ended 31st December 2010, of the proposal of application of its earnings
Second. Approval of the management by the Board of Directors during fiscal year 2010.
Third. Appointment of the Accounts Auditor of Repsol YPF, S.A. and of its Consolidated Group for the fiscal year 2011.
POINTS REGARDING THE AMENDMENTS OF THE ARTICLES OF ASSOCIATION AND OF THE REGULATIONS OF THE GENERAL SHAREHOLDERS MEETING
Forth. Amendment of articles 9, 11, 19, 24, 27, 29, 44, 50 and 56 of the Articles of Association; and of the articles 3, 5, 8, 13, 14 and 15 of the Regulations of the General Shareholders Meeting.
Fifth. Amendment of article 52 of the Articles of Association, regarding the application of profit/loss of the fiscal year.
Sixth. Amendment of articles 40 and 35 of the Articles of Association, regarding the internal positions and meetings of the Board of Directors.
POINTS REGARDING THE COMPOSITION OF THE BOARD OF DIRECTORS
Seventh. Re-election of Mr. Antonio Brufau Niubo as Director.
Eighth. Re-election of Mr. Luis Fernando del Rivero Asensio as Director.
57
Ninth. Re-election of Mr. Juan Abelló Gallo as Director.
Tenth. Re-election of Mr. Luis Carlos Croissier Batista as Director.
Eleventh. Re-election of Mr. Ángel Durández Adeva as Director.
Twelfth. Re-election of Mr. José Manuel Loureda Mantiñan as Director.
Thirteenth. Appointment of Mr. Mario Fernández Pelaz as Director.
POINTS REGARDING THE PROGRAMS OF PARTICIPATION IN THE SHARE CAPITAL OF THE COMPANY
Fourteenth. Delivery Plan Shares to the Beneficiaries of Multi-Annual Programs.
Fifthteenth. Stock Purchase Plan 2011-2012.
POINT REGARDING THE AUTHORISATION AND EXPRESS DELEGATION REQUIRED FOR THE BOARD OF DIRECTORS
Sixthteenth. Delegation to the Board of Directors of the power to issue fixed rate securities, convertible or exchangeable by shares of the Company or exchangeable by shares of other companies, as well as warrants (options to subscribe new shares or to acquire preexisting shares of the Company). Establishment of the criteria for the determination of the basis and methods for the conversion and/or exchange and delegation to the Board of Directors of the powers to increase the capital stock in the necessary amount, as well to exclude, in whole or in part, the preemptive subscription rights of shareholders over said issues. Authorisation to guarantee by the Company of issues made by its subsidiaries. To leave without effect, in the portion not used, the seventh resolution of the Ordinary General Shareholders’ Meeting held on June 16th, 2006”.
POINT REGARDING GENERAL MATTERS
Seventeenth. Delegation of powers to supplement, develop, execute, rectify and formalize the resolutions adopted by the General Shareholders' Meeting.
After the exposure of the matters included in the Agenda it will be reported to the General Shareholder’s Meeting the amendments of the Regulations of the Board of Directors, according with article 516 of the Stock Companies Act.
58
COMPLEMENT TO THE CALL
Shareholders representing at least five per cent of the capital may request the publication of a supplemental notice of call to the general meeting, including one or several items on the agenda. This request shall be sent through any certifying means, evidencing that they hold the required stake, to be received at the registered office within five days after publication of the original notice of call.
RIGHTS OF ATTENDANCE
Shareholders whose shares have been registered in the appropriate stock ledger five days prior to the date set for the Shareholders’ Meeting and who have the corresponding attendance card may attend.
The attendance cards shall be issued by the proper entity participating in the systems managed by Sociedad de Gestión de los Sistemas de Registro, Compensación y Liquidación de Valores, S.A. (hereinafter IBERCLEAR) in each particular case. Said attendance cards may be exchanged on the date of the Shareholders’ Meeting for other standardized documents of record attendance, issued by the Company with the purpose of facilitating the drawing up of the attendance list, the exercise of the shareholders' voting and other rights.
The registration of attendance cards shall begin two hours before the scheduled time of the General Shareholders’ Meeting.
For purposes of verifying the identity of shareholders or those who validly represent them, attendees may be asked, at the place of the General Shareholders Meeting, for evidence of their identity by means of the presentation of a National Identity Document or any other official document generally accepted for these purposes.
REPRESENTATION
Any shareholder entitled to attend may be represented by a proxy, who needs not to be a shareholder.
If the name of the proxy is left blank on the proxy form received by the Company, it will be presumed granted in favour of the Chairman of the Board.
The voting instructions will be set out in proxy forms. If no express instructions are issued, the proxy will vote for the proposals submitted by the Board.
Save otherwise indicated by the represented shareholder, the proxy will be deemed extended to any business which, although not included on the agenda, may be put to the vote at the General
59
Shareholders Meeting. In this case, the proxy will vote however he may consider most favourable for the interests of the represented shareholder.
Save otherwise expressly indicated by the represented shareholder, in cases where the proxy incurs a conflict of interests for voting on any item, included or not in the Agenda, put to the General Shareholders Meeting, the proxy will be considered granted to the Vice-Secretary to the Board of Directors.
Shareholders who grant a proxy must notify the person designated as representative of the proxy granted thereto. When this is granted to a member of the Board of Directors, the notification shall be deemed to be effected upon receipt by the Company of the documentation setting forth such proxy.
RIGHT OF INFORMATION
In addition to the provisions of Articles 197 and 527 of the Stock Companies Act, as of the date of publication of this notice, the following documents are at shareholders disposal on the Shareholder Information Office, from 10:00 to 18:00, working days, and on the Company’s website at www.repsol.com: the Annual Financial Statements of Repsol YPF, S.A. and the Consolidated Annual Financial Statements of Repsol YPF Group, for the fiscal year ending on 31st December 2010; the Management Report of Repsol YPF, S.A. and the Consolidated Management Report for said year; the Report referred to Section 116.bis of the Securities Market Act; the Report of the Auditors on the Annual Financial Statements of Repsol YPF, S.A., and on the Consolidated Annual Financial Statements of Repsol YPF Group; the literal text of the proposals of resolutions already formulated corresponding to the points of the Agenda; the reports of the Board of Directors on each proposal of resolutions corresponding to the points of the Agenda; the Report on the remuneration policy for Directors; the Annual Report on Corporate Governance; and the Activity Report of the Audit and Control Committee.
Shareholders may request the delivery or the sending free of charge of all the mentioned documents.
DISTANCE VOTING AND PROXIES PRIOR TO THE GENERAL MEETING
1. Voting by distance communication prior to the General Shareholders Meeting
Pursuant to Article 23 of the Articles of Association and Article 7 of the Regulations of the General Shareholders Meeting, shareholders entitled to attend may vote through distance communication on the proposals regarding the items on the Agenda prior to the date of the General Shareholders Meeting, provided the identity of the voting shareholder is duly guaranteed.
60
1.1 Means for distance voting
The means of communication valid for distance voting are as follows:
(i) Postal vote
To vote by post on the items on the Agenda, shareholders must complete and sign the “Distance Voting” section of the attendance, proxy and voting card issued by the IBERCLEAR participating entity with which they have deposited their shares.
Once the appropriate section of the card has been completed and signed - with hand-written signature-, the shareholder must send it to the Company to the attention of the Shareholder Information Office at Paseo de la Castellana nº 278, 28046 Madrid.
If the attendance card does not include the section “Distance Voting”, the shareholder may use the Distance Voting Form provided on the company’s web site (www.repsol.com) and also available at the Shareholders Information Office. This form, duly signed, must be sent to the Company together with the corresponding attendance card, also signed- both with hand-written signature-.
(ii) Electronic vote
Shareholders may vote on the items on the Agenda for the General Meeting through the company’s web site (www.repsol.com), entering the AGM 2011 page and following the procedure established there, provided the shareholder has a recognised or advanced electronic signature, based on a recognised and valid electronic certificate issued by the Entidad Pública de Certificación Española (CERES), of the Fábrica Nacional de Moneda y Timbre, and uses it to identify himself.
1.2 Specific rules for distance voting
(i) Voting indications
If the shareholder sending a distance vote fails to mark any of the boxes provided for any of the items on the Agenda, he will be presumed to vote for the Board’s proposal.
(ii) Receipt by company
In order to be valid, postal or electronic votes must be received by the company no later than 09:00 on April 13th, 2011. After this time, the Company will only accept the votes cast at the General Shareholders Meeting.
61
2. Distance proxies
Pursuant to Article 24 of the Articles of Association and Article 8 of the Regulations of the General Shareholders Meeting, shareholders entitled to attend may grant a proxy by distance communication on the proposals regarding the items on the Agenda and prior to the date of the General Shareholders Meeting, provided the identity of the persons concerned is duly guaranteed.
2.1 Means for granting distance proxies
The means of communication valid for distance proxies are as follows:
(i) Postal proxy
To grant proxies by post, shareholders must complete the corresponding section of the attendance, proxy and voting card issued by the IBERCLEAR participating entity with which they have deposited their shares.
This section must be signed - with hand-written signature-by the shareholder and sent to the Company to the attention of the Shareholder Information Office, Paseo de la Castellana nº 278, 28046 Madrid.
(ii) Electronic proxy
Shareholders may grant proxies through the company’s web site (www.repsol.com), entering the page of the AGM 2011 and following the procedure established there, provided the shareholder has a recognised or advanced electronic signature, based on a recognised, valid electronic certificate issued by Entidad Pública de Certificación Española (CERES), of the Fábrica Nacional de Moneda y Timbre, and uses it to identify himself.
2.2 Specific rules for distance proxies
Distance proxies will also be subject to the general rules applicable to representation, related to (i) blank proxies received by the Company; (ii) absence of voting instructions (iii) extension of proxy to any business not included on the agenda that may be put to the vote at the General Shareholders Meeting; as well as voting instructions regarding points not included in the Agenda; (iv) designation of a representative’s substitute when the representative is in a conflict of interests in relation with the vote of any business, included or not in the Agenda, that may be put to the vote of the General Shareholders Meeting; and (v) the necessary notification to the representative of the proxy granted.
In order to be valid, distance proxies must be received by the Company no later than 09:00 on April 13th, 2011. After this time, the company will only accept the proxies made in writing
62
through the attendance, proxy and voting cards presented for registration of shareholders on entry at the place and date scheduled for the General Shareholders Meeting.
At the place and date of the General Shareholders Meeting, the proxies must prove their identity by showing their identity cards or any other official document generally accepted for these purposes, together with a print-out of the electronic proof of proxy, if necessary, so that the company can confirm the proxy granted.
3. Rules common to distance voting and distance proxies
(i) Confirmation of distance vote or distance proxy
The validity of votes cast and proxies granted through distance communication is subject to checking of the particulars supplied by the shareholder against those contained in the file supplied by IBERCLEAR. In the event of any discrepancy between the number of shares indicated by the shareholder in the proxy form or distance voting form and those indicated in the aforesaid file, the number of shares indicated by IBERCLEAR will prevail for the purposes of quorum and voting.
(ii) Rules of priority
Personal attendance of the General Shareholders Meeting by a shareholder who has previously granted a proxy or voted through distance communication, by whatsoever means used, will render that distance proxy or vote void.
If a shareholder validly issues both a distance vote and a proxy, the former will prevail. Similarly, electronic votes and proxies will prevail over those sent by post.
Electronic votes and proxies may be rendered void through express revocation by the shareholder through the same means.
(iii) Other provisions
The Company reserves the right to modify, suspend, cancel or restrict the electronic voting and proxy mechanisms for technical or security reasons. The Company further reserves the right to request additional identification from shareholders as and when it may so deem fit to guarantee the identity of those concerned, the authenticity of the vote or proxy and, in general, the legal certainty of the General Shareholders Meeting.
The Company will not be responsible for any damages caused to shareholders through unavailability or failure in the maintenance and effective functioning of its web site and the services and contents provided through such site, or for any faults, overrun, overload, fallen
63
lines, connection faults or whatsoever other similar incidents beyond the Company’s control, which prevent use of the electronic voting and proxy mechanisms.
The electronic mechanisms for distance voting and proxy will be operative as of March 7th 2011 and up to April 13th 2011 at 09:00.
In any aspects not expressly contemplated in these procedures, the General Conditions set out in the Legal Notice on the Company’s web site will be applicable.
PRESENCE OF NOTARY
The Board of Directors has requested the presence of a Notary to take the Minutes of the General Shareholders' Meeting.
ELECTRONIC SHAREHOLDERS FORUM
According with a article 528, 2 of the Stock Companies Act, Repsol YPF, S.A. has enable, with the occasion of the General Shareholders' Meeting, an Electronic Shareholders Forum in the web site of the Company (www.repsol.com), which will be accessible due to both individual shareholders and voluntary associations that could be established in accordance with current regulations, in order to facilitate communication prior to the General Shareholders' Meeting.
In the Forum may be published proposals claiming to be a complement to the agenda posted on the announcement, applications to support such proposals, initiatives to achieve the percentage sufficient to execute a right for minorities under the law, as well as offers or requests for voluntary representation.
The Forum does not constitute a communication channel between the Company and its shareholders and is enabled only for the purpose of facilitating communication between the shareholders of Repsol YPF, SA during the General Shareholders' Meeting.
To access the Forum, the shareholders must be obtained through the website (www.repsol.com) a specific password for it by following the instructions and conditions of use of the Forum , that are located in the space dedicated to the General Shareholders' Meeting 2011. Accreditation for the key may be, in general, either through the electronic ID card or through a recognized or advanced electronic signature, based on a recognized and valid electronic certificate issued by Entidad Pública de Certificación Española (CERES), of the Fábrica Nacional de Moneda y Timbre.
GENERAL INFORMATION
All personal data submitted by the shareholders for the exercise or delegation of their rights of attendance and vote at the General Shareholders Meeting shall be used by the Company for the
64
development, management and control of the shareholding relation, and therefore for inform them about the Company’s business and activities.
Save otherwise indicated by the shareholders (using the free telephone number 900 100 100) between the date of the meeting and the following thirty days, the abovementioned data may also be used by the Company to send their shareholders information about the oil&gas sector. Once those thirty days have elapsed – without opposition – the consent for such use shall be considered granted by the shareholder.
The rights of access, rectification, deletion and opposition may be exercised in the terms prescribed by Law by written communication sent to the registered office of the Company, at Paseo de la Castellana 278, 28046 Madrid.
FORECAST OF HOLDING THE SHAREHOLDERS’ MEETING
It is expected to hold the General Shareholders' Meeting on SECOND CALL, that is, on April 15th 2011, at the place and time indicated above. Otherwise, an announcement shall be made in the daily press with sufficient advance notice, as well as in the company’s web site.
Madrid, February 23rd, 2010
Luis Suárez de Lezo Mantilla The Director Secretary of the Board of Directors
65
REPSOL YPF, S.A. AND COMPANIES COMPOSING REPSOL YPF GROUP
REPORT EXPLAINING THE ADDITIONAL INFORMATION OF THE MANAGEMENT REPORT FOR THE FISCAL YEAR
ENDED ON DECEMBER 31ST, 2010
In accordance with Section 116.bis of the Securities Market Act, the present report, regarding the additional information required by said provision to be included in the Management Report, is formulated for its presentation at the Ordinary General Shareholders’ Meeting of the Company.
A. Structure of the capital, including any securities not traded on a EU regulated market, indicating the different classes of shares, if any, the rights and obligations granted by each class and the percentage of capital it represents.
Repsol YPF, S.A. currently has a capital of 1,220,863,463 euros, divided into 1,220,863,463 shares with a par value of 1 euro each, fully subscribed and paid up, all in the same class and, consequently, with the same rights and obligations.
The Repsol YPF, S.A. shares are issued in book-entry form and were admitted in their entirety for listing in the electronic continuous trading system of the Spanish stock exchanges (Madrid, Barcelona, Bilbao and Valencia), New York (New York Stock Exchange) and Buenos Aires (Bolsa de Comercio de Buenos Aires). At the date of the present Management Report, Repsol YPF, S.A. ADSs, are listed in the New York Stock Exchange-NYSE but on February 22nd, 2011 the company has formally applied for the delisting of the ADSs in said market. In this sense, it is estimated that the last day of trading of the ADSs on the NYSE will be March 4th, 2011
B. Any restriction on the transferability of shares
As set out in the 11th Additional Provision of Act 34/1998 on the hydrocarbons sector, as per the wording of Royal Decree Law 4/2006, 24 February, administrative authorization must be sought from the National Energy Commission for certain holding acquisitions that involve companies that carry out regulated activities or activities that are subject to administrative intervention which entails a special binding relationship.
The Ruling of the Court of Justice of the European Communities (CJEC) of 28 July 2008 set out that, by enforcing this requirement, the Kingdom of Spain has breached the obligations incumbent upon it under articles 43 (freedom of establishment) and 56 (freedom of movement of capital) of the European Community Constitutional Treaty.
66
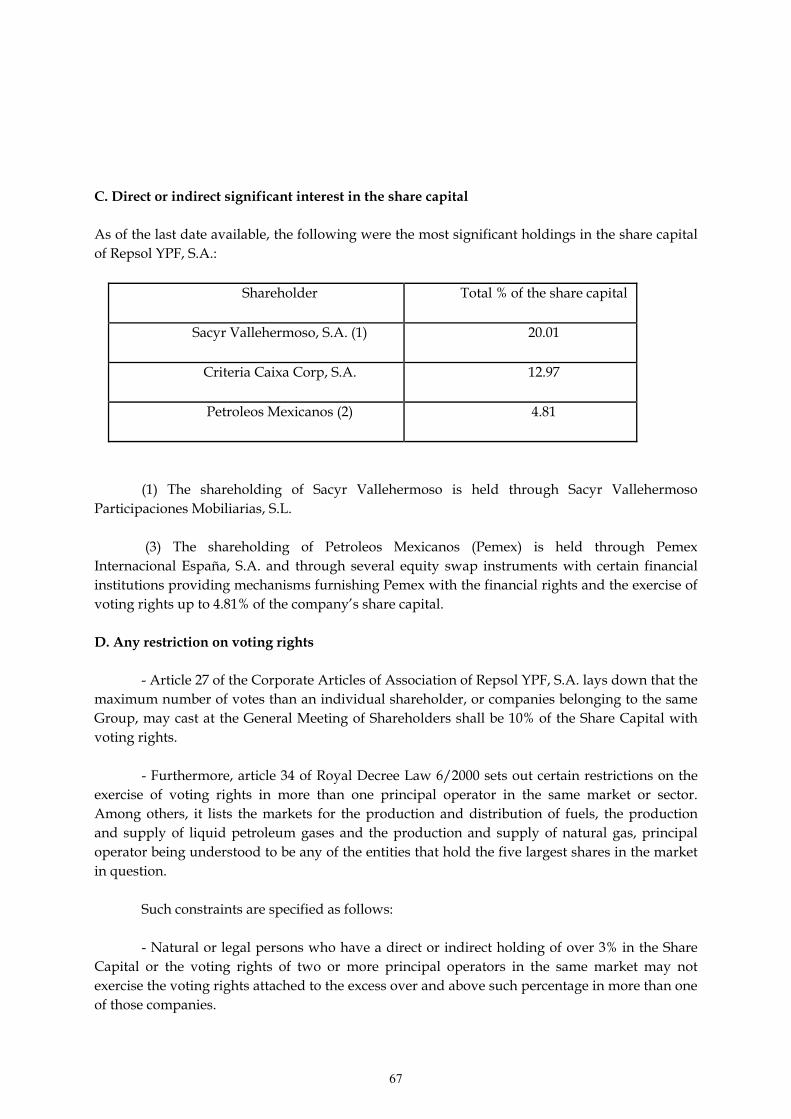
C. Direct or indirect significant interest in the share capital
As of the last date available, the following were the most significant holdings in the share capital of Repsol YPF, S.A.:
Shareholder Total % of the share capital
Sacyr Vallehermoso, S.A. (1) 20.01
Criteria Caixa Corp, S.A. 12.97
Petroleos Mexicanos (2) 4.81
(1) The shareholding of Sacyr Vallehermoso is held through Sacyr Vallehermoso Participaciones Mobiliarias, S.L.
(3) The shareholding of Petroleos Mexicanos (Pemex) is held through Pemex Internacional España, S.A. and through several equity swap instruments with certain financial institutions providing mechanisms furnishing Pemex with the financial rights and the exercise of voting rights up to 4.81% of the company’s share capital.
D. Any restriction on voting rights
- Article 27 of the Corporate Articles of Association of Repsol YPF, S.A. lays down that the maximum number of votes than an individual shareholder, or companies belonging to the same Group, may cast at the General Meeting of Shareholders shall be 10% of the Share Capital with voting rights.
- Furthermore, article 34 of Royal Decree Law 6/2000 sets out certain restrictions on the exercise of voting rights in more than one principal operator in the same market or sector. Among others, it lists the markets for the production and distribution of fuels, the production and supply of liquid petroleum gases and the production and supply of natural gas, principal operator being understood to be any of the entities that hold the five largest shares in the market in question.
Such constraints are specified as follows:
- Natural or legal persons who have a direct or indirect holding of over 3% in the Share Capital or the voting rights of two or more principal operators in the same market may not exercise the voting rights attached to the excess over and above such percentage in more than one of those companies.
67
- A principal operator may not exercise voting rights representing more than 3% of the Share Capital of another principal operator in the same market.
These prohibitions shall not apply to parent companies which have the status of principal operator with respect to their controlled companies that have the same status, provided that such structure is imposed by the legal system or is the consequence of a mere redistribution of securities or assets among companies in the same Group.
The National Energy Commission, as the energy market regulatory body, may authorize the exercise of the voting rights attached to the excess, provided that this does not favour the exchange of strategic information or entail risks of coordination in their strategic activities.
E. Shareholders’ agreements
Repsol YPF, S.A. has not been notified of any shareholders’ agreement regulating the exercising of voting right at its general meetings or limiting or establishing condition for the free transferability of the Repsol YPF, S.A. shares.
F. Rules applicable to the appointment and replacement of directors and to the amendment of the Articles of Association.
Appointment
Members of the board are appointed by the General Meeting of Shareholders, without prejudice to the power of the Board to appoint shareholders to fill any vacancies that may arise, up to the next general meeting.
No-one affected by the prohibitions established in article 213 of the Stock Companies Act or any other incompatibilities established in current laws may be appointed director of the company.
Nor may persons or entities that are in a permanent conflict of interest with the company be directors, including competing companies, their directors, executives or employees, or any persons related to or proposed by such companies.
Directors must be persons who, as well as meeting the requirements stipulated in law and the bylaws, have recognised prestige and adequate knowledge and professional experience and expertise to perform their duties.
Nominations for the appointment of directors submitted by the Board to the General Meeting and appointments made by cooptation must be approved by the Board (i) upon proposal of the Nomination and Compensation Committee, in the case of Independent Outside Directors, or (ii) subject to a report by said Committee for other directors.
68
Re-election
The Nomination and Compensation Committee assesses the quality of work and dedication to office during the preceding term in office of any directors proposed for re-election.
The proposals for re-election of directors submitted by the Board to the General Meeting must be approved by the Board (i) upon proposal of the Nomination and Compensation Committee, in the case of Independent Outside Directors, or (ii) subject to a report by said Committee for other directors.
Retirement
Directors shall retire from office upon expiry of the term for which they were appointed (unless they are re-elected) and in the other cases contemplated in law, the Articles of Association and the Regulations of the Board.
Directors must also tender their resignations to the board in any of the following circumstances:
a) When they are affected by any of the cases of incompatibility or prohibition established in law, the Articles of Association or regulations.
b) If they are seriously reprimanded by the Nomination and Compensation Committee or the Audit and Control Committee for defaulting their obligations as directors.
c) When, in the opinion of the Board, subject to a previous report by the Nomination and Compensation Committee:
1. Their remaining on the Board could jeopardise the interests of the company or adversely affect the functioning of the board or the reputation of the company; or
2. The reasons for their appointment have disappeared. This includes, in particular:
- Institutional Outside Directors, if the shareholder they represent or that proposed their appointment disposes of all their shares. They shall also tender their resignations and resign, should the board so deem fit, in the corresponding proportion, if the shareholder in question disposes of part of its shareholding interest, to an extent requiring a reduction in the number of its institutional outside directors.
69
- Executive Directors, if they cease to hold the executive positions outside the Board to which their appointment as director was linked.
The Board will not propose the removal of any Independent Outside Director before the end of the statutory term for which he/she has been appointed, unless there are just grounds for doing so, in the opinion of the Board, subject to a previous report by the Nomination and Compensation Committee. In particular, there shall be deemed to be just grounds when the director (i) has defaulted the duties corresponding to his/her office; (ii) is in any of the situations described in the preceding paragraphs; or (iii) falls into any of the circumstances described in the Regulations of the Board, whereby he/she can no longer be classified as a Independent Outside Director.
The retirement of Independent Outside Directors may also be proposed as a result of takeover bids, mergers or other similar corporate operations entailing a change in the ownership structure of the company, insofar as this may make it necessary to establish a reasonable balance between Institutional and Independent Outside Directors, in accordance with the ratio of capital represented by the former and the rest of the capital.
Amendment of the Articles of Association
The Articles of Association of Repsol YPF, S.A., available on its web site (www.repsol.com), do not establish any conditions differing from those set out in the Joint Stock Companies Act for their amendment, except for the amendment of the last paragraph of Article 27, concerning the maximum number of votes that may be cast at General Meetings by any one shareholder or the companies belonging to the same group. This resolution, and the resolution to amend this special provision contained in the final paragraph of Article 22 of the Articles of Association, must be adopted with the favourable vote, on first and second call, of 75% of the voting capital attending or represented at the general meeting.
G. Powers of the Board, particularly those concerning the issuing or repurchasing of shares
The Annual General Meeting of Shareholders of the company, held on 31 May 2005 agreed to authorise the Board of Directors to increase the Share Capital, once or several times, during a period of 5 years, by the maximum amount of €610,431,731 (approximately half of the current Share Capital), by issuing new shares the counter value of which shall consist of cash contributions.
Likewise, the Annual General Meeting of Shareholders of the company, held on 14 May 2009, authorised the Board of Directors to engage in the derivative acquisition of own shares, under the terms indicated above in the “Financial situation” section of this Management Report.
Finally, in addition to the powers recognised in the company’s Articles of Association and the Board Regulations as being conferred upon the Chairman and Vice-Chairmen of the Board,
70

the Executive Directors have each been granted general powers of attorney to represent the company, conferred by the Board of Directors, and which are duly recorded in the Commercial Register of Madrid.
H. Significant agreements entered into by the company, which are to become effective, be amended or terminate upon a change in the control of the company following a takeover bid, and the effects thereof, unless disclosure may be seriously detrimental to the company. This exception will not be applicable when the company is legally obliged to disclose this information.
The company participates in exploring for and exploiting hydrocarbons through consortiums or joint ventures with other oil companies, both public and private. In the contracts that govern relations between the members of the consortium the other partners are usually granted a right of first refusal over the holding of the partner on which a change of control takes place when the value of said holding is significant in relation to the overall assets of the transaction or when other conditions set out in the contracts occur.
Likewise, according to the rules regulating the oil and gas industry in the different countries in which the company operates, the transfer, total or partial, of research permits and exploitation concessions as well as, on occasions, the change of control in the concessionaire entity or entities and in particular in the entity that has the status of mining area operator, are subject to prior authorisation by the competent administrative authority.
In addition, the agreements entered into by and between Repsol YPF and Caja de Ahorros y Pensiones de Barcelona (“la Caixa”) relating to Gas Natural SDG S.A., reported as relevant events through the Securities Market Commission, as well as the Industrial Agreement Activity between Repsol YPF and Gas Natural SDG S.A. foreseen in the abovementioned agreements and disclosed as a relevant event on 29 April 2005 and the Partnership Agreement between Repsol YPF and Gas Natural SDG relating to Repsol–Gas Natural LNG S.L. consider the change in the control structure of either of the parties to be grounds for termination.
I. Agreements between the company and its directors, executives or employees contemplating compensations when the latter resign or are dismissed without cause, or if their employment relationship is terminated as a result of a takeover bid.
Executive Directors
The Chairman and the Secretary and General Counsel are entitled to a Deferred Economic Compensation in the event of termination of their relation with the company, provided such termination is not due to any default of their obligations or at their own desire, without any of the justifying causes contemplated in the contract. The amount of the compensation for termination of the relation is three years’ total monetary remuneration.
71
Translation of the original in Spanish.
In case of any discrepancy, the Spanish version prevails.
18
Executives
The Repsol YPF Group has established a single legal statute for its executives, set out in the Executive Contract, which regulates the compensations applicable in cases of termination of the employment relationship, contemplating as grounds for compensation those stipulated in current legislation.
For members of the Executive Committee, these grounds include resignation by the executive following a business succession or major change in the ownership of the company, resulting in a material change in the members of the governing bodies or in the contents and approach of the principal activity of the company. The amount of the compensation of the current members of the Executive Committee is calculated according to the age, seniority and salary of the executive.
Additional information of these matters is detailed in note 33 to the Consolidated Annual Accounts.
72
Official Notice
Paseo de la
Castellana, 278-280 28046 Madrid Spain
Tel. 34 917 538 100 34 917 538 000 Fax 34 913 489 494 www.repsol.com
1
Madrid, 7 March 2011 Repsol YPF S.A. announces that its subsidiary “Repsol E&P USA Inc.” has reached an agreement with “70 & 148 LLC” and “GMT Exploration LLC” to jointly carry out exploration activity in the blocks that the latter two companies own on Alaska’s prolific North Slope. Repsol will have a 70% working interest in the blocks. The blocks are located close to large producing fields and cover an area of 2,000 square kilometers. Repsol has agreed to carry out the investment necessary to explore and evaluate the economic viability of the resources contained in these blocks. The estimated minimum exposure of this investment for Repsol, including amounts to be paid to its partners and the cost of exploration to be carried out over several years, amounts to 768 million dollars. Repsol plans to begin exploratory drilling at the earliest possible time, aiming to start operations during the next winter. “70 & 148 LLC,” an affiliate of Armstrong Oil & Gas Inc, and “GMT Exploration LLC” are privately-owned companies based in Denver, Colorado which have together explored Alaska’s North Slope during the last decade.
73
Official Notice
Paseo de la
Castellana, 278-280 28046 Madrid España
Tel. 34 917 538 100 34 917 538 000 Fax 34 913 489 494 www.repsol.com
Madrid, 14 March 2011 Repsol YPF S.A. Announces Agreements to Sell 15,069,990 Shares of YPF Class D Common Stock Repsol announced today that it has agreed to sell 11,414,329 shares of YPF Sociedad Anónima’s Class D common stock to Lazard Asset Management LLC, on behalf of certain of its clients, and an aggregate of 3,655,661 shares of YPF’s Class D common stock to certain other investors, each at a price of $42.40 per share. Each share sold will be in the form of American Depositary Shares. The shares being sold by Repsol are registered pursuant to YPF's effective shelf registration statement on Form F-3 filed with the Securities and Exchange Commission and are freely transferable. Repsol has also granted Lazard Asset Management, on behalf of its clients, 11,414,329 non-transferable put options with respect to the shares purchased by it, on behalf of its clients, subject to adjustments in accordance with certain customary anti-dilution provisions. The put options will entitle, upon exercise, the holders to require Repsol to purchase one share of Class D common stock at a price of $42.40 per share in proportion to the amount by which the 11,414,329 shares acquired exceed 20% of YPF’s public float six months after the sale. The closing of the sale to Lazard Asset Management is expected to occur on or about March 21, 2011 and the closing of the sales to the other investors is expected to occur on or about March 17, 2011. These sales, together with prior sales by Repsol, including its previously announced sales to certain funds affiliated with Eton Park Capital Management (“Eton Park”) and certain funds affiliated with Capital Guardian Trust Company and Capital International, Inc. in December 2010, represent approximately 8.2% of YPF’s capital stock (approximately 9.8% if Eton Park exercises certain warrants purchased by it in connection with the December 2010 transactions) and have resulted in more than $1.25 billion in proceeds to Repsol. Repsol currently intends to continue selling YPF shares off the shelf registration statement, including in the capital markets, in the short term if market conditions permit. Raymond James Argentina S.B.S.A. acted as financial advisor to Repsol in connection with the sales. This press release does not constitute an offer to sell or a solicitation of an offer to buy any securities. This news release contains certain forward-looking information that is subject to certain risks and uncertainties that could cause actual results to differ materially from those expected or projected in the forward-looking statements. You are urged to carefully review the reports that the company files with the Securities and Exchange Commission containing discussions of such risks and uncertainties.
74
Official Notice
Paseo de la
Castellana, 278-280 28046 Madrid España
Tel. 34 917 538 100 34 917 538 000 Fax 34 913 489 494 www.repsol.com
Madrid, 14 March 2011
REPSOL ANNOUNCES SECONDARY OFFERING FOR UP TO 7.1% OF YPF
Repsol announced on Monday a public offering of 24.27 million shares of YPF, in the form of American Depositary Shares (ADS), representing 6.17% of the company’s stock. Additionally, Repsol has granted the underwriters an option to purchase an additional 3.64 million shares, representing 0.93% of YPF. This process is part of Repsol’s strategic aim to rebalance its global assets portfolio as laid out in the Horizon 2014 plan, allowing new shareholders into YPF. This press release contains certain forward-looking information that is subject to certain risks and uncertainties that could cause actual results to differ materially from those expected or projected in the forward-looking statements. You are urged to carefully review the reports that the company files with the U.S. Securities and Exchange Commission and other securities regulators containing discussions of such risks and uncertainties, including but not limited to risk factors contained in the prospectus supplement related to the offering. This press release does not constitute an offer to sell or a solicitation of an offer to buy any securities.
• Repsol announced today the launch of a public offering of 6.17% of YPF, expandable to up to 7.1%
• The sale is part of Repsol’s strategic goal to rebalance its portfolio of assets
75
Official Notice
Paseo de la
Castellana, 278-280 28046 Madrid España
Tel. 34 917 538 100 34 917 538 000 Fax 34 913 489 494 www.repsol.com
Madrid, 23 March 2011
PRICING OF SECONDARY OFFERING OF SHARES OF YPF The price of the public offering, announced on March 14, 2011, in which 26,215,000 shares of YPF will be sold, in the form of American Depositary Shares (ADS) has been set at $41 per ADS. The size of the offering was increased from the previously announced offering of 24,270,306 ADS. Repsol has granted the underwriters a 30-day option to purchase up to 3,930,898 additional ADSs at the public offering price. The offering is expected to close on March 28, 2011, subject to customary closing conditions. This press release contains certain forward-looking information that is subject to certain risks and uncertainties that could cause actual results to differ materially from those expected or projected in the forward-looking statements. You are urged to carefully review the reports that the company files with the U.S. Securities and Exchange Commission and other securities regulators containing discussions of such risks and uncertainties, including but not limited to risk factors contained in the prospectus supplement related to the offering. This press release does not constitute an offer to sell or a solicitation of an offer to buy any securities, nor will there be any sale of these securities in any state in which such offer, solicitation or sale is not permitted. Copies of the final prospectus supplement and accompanying prospectus may be obtained from: Credit Suisse, Prospectus Department, 1 Madison Ave, New York, NY 10010, (800) 221-1037; Deutsche Bank Securities, Attn: Prospectus Department, 100 Plaza One, Jersey City, NJ 07311, telephone: 1-800-503-4611, email: [email protected]; Goldman, Sachs & Co., Prospectus Department, 200 West Street, New York, NY 10282, telephone: 1-866-471-2526, facsimile: 212-902-9316 or by emailing [email protected]; Itaú BBA USA Securities, Inc., 767 Fifth Avenue 50th Floor, New York, NY 10153, USA, Att.: Equity Sales Desk; Morgan Stanley & Co. Incorporated, Attention: Prospectus Department, 180 Varick Street, 2nd Floor, New York, New York 10014, by phone at 866-718-1649, or by email at [email protected]; Raymond James, Kent Nelson (Equity Capital Markets), email: [email protected], Tel: + 1 727-567-2456 or Carlos A. Iglesias (Investment Banking); Tel: + 54-11-4850-2510, email: [email protected]; and Santander Investment, Attn: Alexander Robarts, 45 East 53rd Street, New York, NY 10022, email: [email protected].
76
Official Notice
Paseo de la
Castellana, 278-280 28046 Madrid España
Tel. 34 917 538 100 34 917 538 000 Fax 34 913 489 494 www.repsol.com
Madrid, March 25, 2011
EXERCISE OF UNDERWRITERS’ OPTION IN CONNECTION WITH SECONDARY OFFERING OF SHARES OF YPF
The underwriters of the public offering of shares YPF, in the form of American Depositary Shares, or ADSs, have exercised in full their option to purchase from Repsol YPF 3,930,898 additional ADSs, in the light of demand of securities that occurred during the offering. Consequently, the total size of the offering of shares that will be sold has increased to 30,145,898 ADSs, at a price of $ 41.00 per ADS. After the offering the stake of Repsol YPF in YPF's capital will be 68.23%. The offering of the 30,145,898 ADSs is expected to close on March 28, 2011, subject to customary closing conditions. Credit Suisse, Deutsche Bank Securities, Goldman, Sachs & Co., Itaú BBA, Morgan Stanley, Raymond James and Santander Investment are acting as underwriters for the offering. This press release contains certain forward-looking information that is subject to certain risks and uncertainties that could cause actual results to differ materially from those expected or projected in the forward-looking statements. You are urged to carefully review the reports that the company files with the U.S. Securities and Exchange Commission and other securities regulators containing discussions of such risks and uncertainties, including but not limited to risk factors contained in the prospectus supplement related to the offering. This press release does not constitute an offer to sell or a solicitation of an offer to buy any securities, nor will there be any sale of these securities in any state in which such offer, solicitation or sale is not permitted. Copies of the final prospectus supplement and accompanying prospectus may be obtained from: Credit Suisse, Prospectus Department, 1 Madison Ave, New York, NY 10010, (800) 221-1037; Deutsche Bank Securities, Attn: Prospectus Department, 100 Plaza One, Jersey City, NJ 07311, telephone: 1-800-503-4611, email: [email protected]; Goldman, Sachs & Co., Prospectus Department, 200 West Street, New York, NY 10282, telephone: 1-866-471-2526, facsimile: 212-902-9316 or by emailing [email protected]; Itaú BBA USA Securities, Inc., 767 Fifth Avenue 50th Floor, New York, NY 10153, USA, Att.: Equity Sales Desk; Morgan Stanley & Co. Incorporated, Attention: Prospectus Department, 180 Varick Street, 2nd Floor, New York, New York 10014, by phone at 866-718-1649, or by email at [email protected]; Raymond James, Kent Nelson (Equity Capital Markets), email: [email protected], Tel: + 1 727-567-2456 or Carlos A. Iglesias (Investment Banking); Tel: + 54-11-4850-2510, email: [email protected]; and Santander Investment, Attn: Alexander Robarts, 45 East 53rd Street, New York, NY 10022, email: [email protected].
77
Official Notice
Paseo de la
Castellana, 278-280 28046 Madrid España
Tel. 34 917 538 100 34 917 538 000 Fax 34 913 489 494 www.repsol.com
Madrid, April 15th, 2011
The Ordinary General Shareholders’ Meeting of Repsol YPF, S.A., held today, on second call, approved all the proposals of resolutions submitted by the Board of Directors concerning the points of the Agenda. Likewise, the Ordinary General Shareholders’ Meeting approved the re-election as Directors of Mr. Antonio Brufau, Mr. Luis del Rivero, Mr. Juan Abelló, Mr. Luis Carlos Croissier, Mr. Ángel Durández and Mr. Jose Manuel Loureda and the appointment as Director of Mr. Mario Fernández, all of them for the statutory term of 4 years. With these agreements and with the ones adopted in the meeting of the Board of Directors held after the Ordinary General Shareholders’ Meeting, the composition of the Board of Directors of Repsol YPF and of its Committees is as follows: Board of Directors: Chairman: Mr. Antonio Brufau Niubó (Executive Director) 1st Vice-Chairman: Mr. Luis Fernando del Rivero Asensio (Institutional Outside Director) 2nd Vice-Chairman: Mr. Isidre Fainé Casas (Institutional Outside Director) Directors: Mr. Juan Abelló Gallo (Institutional Outside Director) Mrs. Paulina Beato Blanco (Independent Outside Director) Mr. Artur Carulla Font (Independent Outside Director) Mr. Luis Carlos Croissier Batista (Independent Outside Director) Mr. Ángel Durández Adeva (Independent Outside Director) Mr. Javier Echenique Landiríbar (Independent Outside Director) Mr. Mario Fernández Pelaz (Independent Outside Director) Mrs. María Isabel Gabarró Miquel (Independent Outside Director) Mr. José Manuel Loureda Mantiñán (Institutional Outside Director) Mr. Juan María Nin Génova (Institutional Outside Director) Pemex Internacional España, S.A. (Institutional Outside Director) Mr. Henri Philippe Reichstul (Independent Outside Director) Mr. Luis Suárez de Lezo Mantilla (*) (Executive Director) (*) Director and Secretary
78
1
Delegated Committee: Mr. Antonio Brufau Niubó (Chairman) Mr. Artur Carulla Font Mr. Luis Fernando del Rivero Asensio Mr. Javier Echenique Landiríbar Mr. Isidre Fainé Casas Pemex Internacional España, S.A. Mr. Henri Philippe Reichstul Mr. Luis Suárez de Lezo Mantilla Audit and Control Committee: Mr. Ángel Durández Adeva (Chairman) Mrs. Paulina Beato Blanco Mr. Javier Echenique Landiríbar Nomination and Compensation Committee: Mr. Artur Carulla Font (Chairman) Mr. Mario Fernández Pelaz Mrs. María Isabel Gabarró Miquel Mr. José Manuel Loureda Mantiñán Mr. Juan María Nin Génova Strategy, Investment and Corporate Social Responsibility Committee: Mr. Juan María Nin Génova (Chairman) Mr. Juan Abelló Gallo Mr. Luis Carlos Croissier Batista Mrs. María Isabel Gabarró Miquel Mr. José Manuel Loureda Mantiñán Pemex Internacional España, S.A.
79
Receive our headlines on your mobile
General Division of Communication Telf. 91 753 87 87
Press release Madrid, April 15th 2011
Number of pages: 6
The Chairman outlined the decisive progress made on the
Horizon 2014 strategic plan
• The Shareholders’ Meeting approved the payment of a dividend from 2010 earnings of 1.05 euros/share, a rise of 23.53% from 2009.
• Repsol’s net income for 2010 was 4.693 billion euros compared with 1.559 billion euros in the previous year due to the good performance of all the business units and the capital increase of the Brazilian subsidiary.
• In 2010 Repsol made significant advances in achieving the goals laid out in the Horizon 2014 strategic plan.
• The creation of Repsol Sinopec Brazil was a key milestone in the development of the company’s exploration activity and validated the success of the company’s strategy in the last few years.
• Repsol has advanced significantly in its partial divestment of its stake in YPF. Repsol currently holds 68% of YPF after selling shares on the stock exchange, to investment funds as well as the public offering carried out in March 2010.
• The start-up of the expanded refineries in Cartagena and Bilbao in the latter part of the year will mark the completion of the Downstream unit’s objectives in the Horizon 2014 strategic plan.
• Antonio Brufau: ”In 2011 we aim to build on the successful execution of our strategic plan, continuing to meet our growth and value-creation objectives.”
REPSOL SHAREHOLDERS’ MEETING APPROVES THE 2010 EARNINGS AND A 23.5%
DIVIDEND INCREASE
80
2
General Division of Communication Telf. 91 753 87 87
Repsol Chairman, Antonio Brufau today presided over the company’s General Shareholders’ Meeting, where he presented the significant advances made in achieving the goals laid out in the Horizon 2014 strategic plan. He also outlined the company’s mid-term outlook based on the development of the oil discoveries of the last three years and the start-up of the key downstream projects.
The General Shareholders’ Meeting approved a gross dividend of 1.05 euros per share payable from 2010 earnings, 23.53% more than in 2009. On January 13th, the company paid an interim dividend of 0.525 euros per share against 2010 earnings. The final dividend is to be paid from July 7th 2011 (*). The total dividend payout from 2010 earnings amounts to 1.282 billion euros and is compatible with the company's growth plans. Antonio Brufau began his presentation to shareholders with an analysis of 2010 earnings, when the company posted net income of 4.693 billion euros for 2010 compared to 1.559 billion euros in the previous year. The 2010 earnings increase is mainly due to the good performance of the company’s ongoing activities, boosted in the fourth quarter by the capital increase of Repsol Brazil.
The Chairman outlined the context in which the results were obtained, in an environment marked by the improvement in all business indicators. Repsol’s crude realisation prices improved in line with Brent Crude, and gas realisation prices outpaced the increase at the Henry Hub. At the same time, Repsol’s integrated refining margin was more than double the industry average, in a market tending to slightly higher margins.
In 2010, Repsol's recurring operating income was 5.213 billion euros, 66.7% higher than the previous year, based on a significant improvement in the recurring earnings of all the business areas: Upstream (+66.6%), Downstream (+45.5%), YPF (+106%) and Gas Natural Fenosa (+14%).
These earnings were accompanied by a significant reduction in net financial debt which, excluding Gas Natural Fenosa, stood at 1.697 billion euros at year end compared with 4.905 billion in 2009. This implies a net debt to capital employed ratio of 5.5%.
DECISIVE ADVANCES IN HORIZON 2014
Repsol’s Chairman outlined the main strategic goals achieved during the last year in the company’s two key business units and the two companies in which it has a strategic stake as part of the Horizon 2014 Strategic Plan presented at the 2010 General Shareholders’ Meeting.
81
3
General Division of Communication Telf. 91 753 87 87
In the Upstream business unit, with a projected average yearly investment of 1.8 billion euros for the 2010-2014 period, production rose 3.2% and the reserve replacement ratio was 131%.
This unit, identified as the company’s main growth vector in the coming years, will carry out intense exploration work, with a projected 25-30 wells yearly in 2010-2014. Especially noteworthy are the 34 discoveries made by Repsol in the last three years, in the world’s most promising areas in terms of hydrocarbons potential.
Another milestone reached during the year was the start-up of the gas liquefaction plant, at the Peru LNG project. The plant is located in Melchorita (Peru), and is the first gas liquefaction plant in South America. The project involves total spending of $3.8 billion, the largest investment ever made in a single project in the history of Peru.
In the Downstream unit, Brufau referred particularly to the start-up of the expanded Cartagena and Bilbao refineries and the creation of the New Energy business unit, which aims to identify, promote and develop projects related to bioenergy, renewable energy and new transport vectors in line with Repsol’s commitment to sustainable energy solutions.
Antonio Brufau also pointed to the company’s management capabilities which allowed it to obtain one of the highest integrated refining margins in the industry, a situation which will be reinforced with the start-up of the mentioned Downstream improvement projects, the extension and modernisation of the Cartagena refinery and the Coker unit at the Petronor refinery in Bilbao.
The start-up of both projects in the latter part of the year will increase the efficiency of the business and will significantly increase the volume of diesel produced, helping cut Spain’s import needs.
The Chairman also explained to shareholders the two most significant deals of the year; the agreement with China’s Sinopec in Brazil and the partial divestment of YPF.
In December 2010, Repsol and Sinopec successfully concluded a deal whereby the Chinese company subscribed in its entirety a capital increase in Repsol Brazil, a deal that led to the creation of one of the largest private energy groups in Latin America, valued at $17.777 billion. Repsol owns 60% of the resulting company and Sinopec the remaining 40%.
82
4
General Division of Communication Telf. 91 753 87 87
Also toward the end of 2010, Repsol made significant progress in its partial divestment of YPF, selling shares on the stock exchange and also selling a 3.3% of the argentine company to Eton Park and Capital Guardian for $500 million.
The process continued into 2011 with the sale of 2.9% of YPF to Lazard’s investment funds and a further 0.9% sold to other investment funds. In March a public offering for 7.7% of YPF was carried out at $41 per share.
Following these deals, Repsol retains a 68% stake in YPF. The Petersen Group owns 15.46% of YPF and has an option to buy a further 10%.
Repsol’s Chairman also detailed the performance of YPF over the last year, when the company achieved a reserve replacement ratio of 100% during a year in which the price of liquids approached international parity.
Exploration work carried out by YPF in Argentina in 2010 led to an important discovery of unconventional gas (tight gas) in the Neuquen Basin. Additionally, in this same basin there is evidence of high potential for shale oil & gas that greatly increases the value of the area. This year, Repsol has won recognition as one of the world’s best performers in environment and sustainability and continues to be included in in the most reputable global sustainability indices, including the DJSI World (Dow Jones Sustainability Index World), DJSI Europe, (Dow Jones Sustainability Index Europe), Climate Disclosure Leadership (CDLI) and Climate Performance Leadership (CPLI).
Repsol has also won recognition in people integration and diversity. Its work in this area recently won the company the Ability Award for the "Best Private Company" in recognition of its overall contribution and significant participation in the development and recruitment of people with disabilities. Repsol also won the Once Foundation’s Discapnet Award for its commitment to people with disabilities and its work in integration. MEMBERS OF THE BOARD OF DIRECTORS
The General Shareholder’s Meeting approved the re-election as Directors, for a new period of four years, of Antonio Brufau Niubó, Luis Fernando del Rivero Asensio, Juan Abelló Gallo, Jose Manuel Loureda Mantiñán, Luis Carlos Croissier Batista and Ángel Durández Adeva.
83
5
General Division of Communication Telf. 91 753 87 87
The Shareholders’ Meeting also approved the appointment as independent Director of Mario Fernandez Pelaz to replace Carmelo de las Morenas López. Additionally, Mario Fernández will join the Nominations and Compensation Committee.
(*) Information for holders of American Depositary Shares (ADSs): The final gross dividend will be transferred to the Depositary, Bank of New York Mellon, on July 7, 2011. Owners of records of ADSs at the close of business on July 6, 2011, will be entitled to receive the dividend when payable by the Bank of New York Mellon, which is expected to be on July 18, 2011.
DISCLAIMER
This document contains statements that Repsol YPF believes constitute forward-looking
statements within the meaning of the US Private Securities Litigation Reform Act of 1995.
These forward-looking statements may include statements regarding the intent, belief, or
current expectations of Repsol YPF and its management, including statements with
respect to trends affecting Repsol YPF’s financial condition, financial ratios, results of
operations, business, strategy, geographic concentration, production volume and
reserves, as well as Repsol YPF’s plans, expectations or objectives with respect to capital
expenditures, business, strategy, geographic concentration, costs savings, investments
and dividend payout policies. These forward-looking statements may also include
assumptions regarding future economic and other conditions, such as future crude oil and
other prices, refining and marketing margins and exchange rates. These statements are
not guarantees of future performance, prices, margins, exchange rates or other events
and are subject to material risks, uncertainties, changes and other factors which may be
beyond Repsol YPF’s control or may be difficult to predict.
Repsol YPF’s future financial condition, financial ratios, results of operations, business,
strategy, geographic concentration, production volumes, reserves, capital expenditures,
costs savings, investments and dividend payout policies, as well as future economic and
other conditions, such as future crude oil and other prices, refining margins and
exchange rates, could differ materially from those expressed or implied in any such
forward-looking statements.
84
6
General Division of Communication Telf. 91 753 87 87
Important factors that could cause such differences include, but are not limited to, oil,
gas and other price fluctuations, supply and demand levels, currency fluctuations,
exploration, drilling and production results, changes in reserves estimates, success in
partnering with third parties, loss of market share, industry competition, environmental
risks, physical risks, the risks of doing business in developing countries, legislative, tax,
legal and regulatory developments, economic and financial market conditions in various
countries and regions, political risks, wars and acts of terrorism, natural disasters,
project delays or advancements and lack of approvals, as well as those factors described
in the filings made by Repsol YPF and its affiliates with the Comisión Nacional del
Mercado de Valores in Spain, the Comisión Nacional de Valores in Argentina, and the
Securities and Exchange Commission in the United States. These documents are
available on Repsol YPF’s website (www.repsol.com). In light of the foregoing, the
forward-looking statements included in this document may not occur.
Repsol YPF does not undertake to publicly update or revise these forward-looking
statements even if experience or future changes make it clear that the projected
performance, conditions or events expressed or implied therein will not be realized.
This document does not constitute an offer to purchase, subscribe, sale or exchange of
Repsol YPF's or YPF Sociedad Anonima's respective ordinary shares or ADSs in the United
States or otherwise. Repsol YPF's and YPF Sociedad Anonima's respective ordinary shares
and ADSs may not be sold in the United States absent registration or an exemption from
registration under the US Securities Act of 1933, as amended.
85
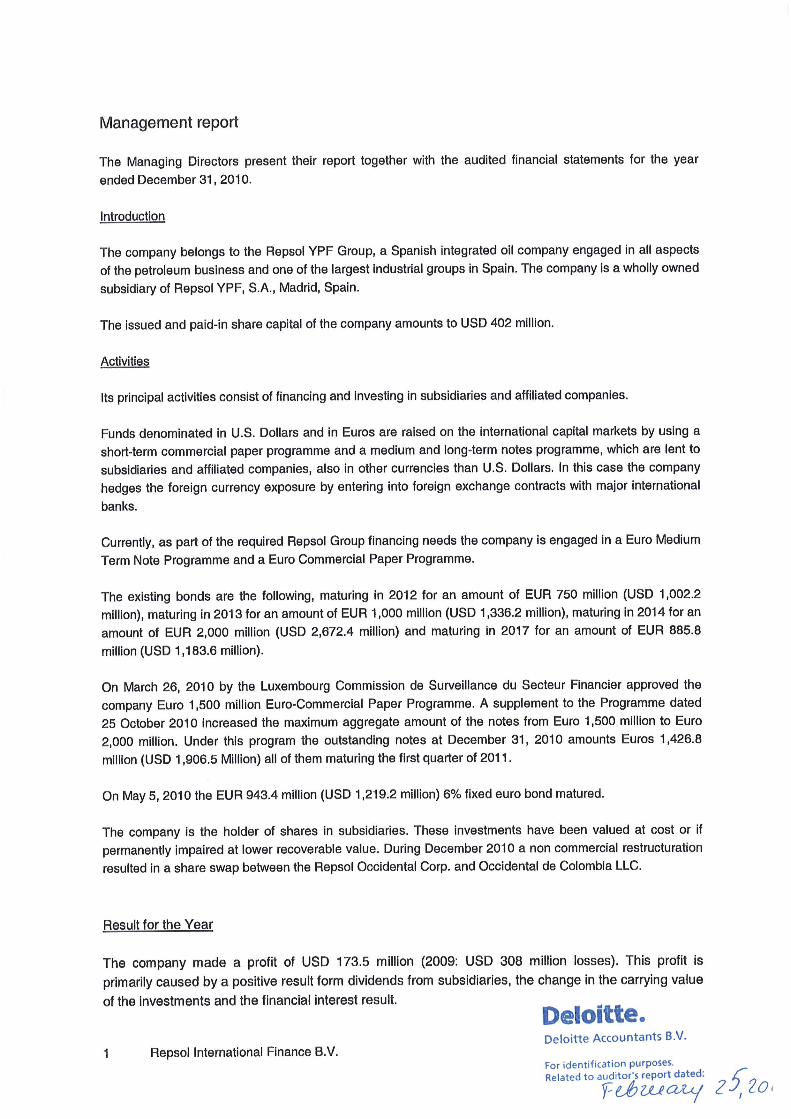
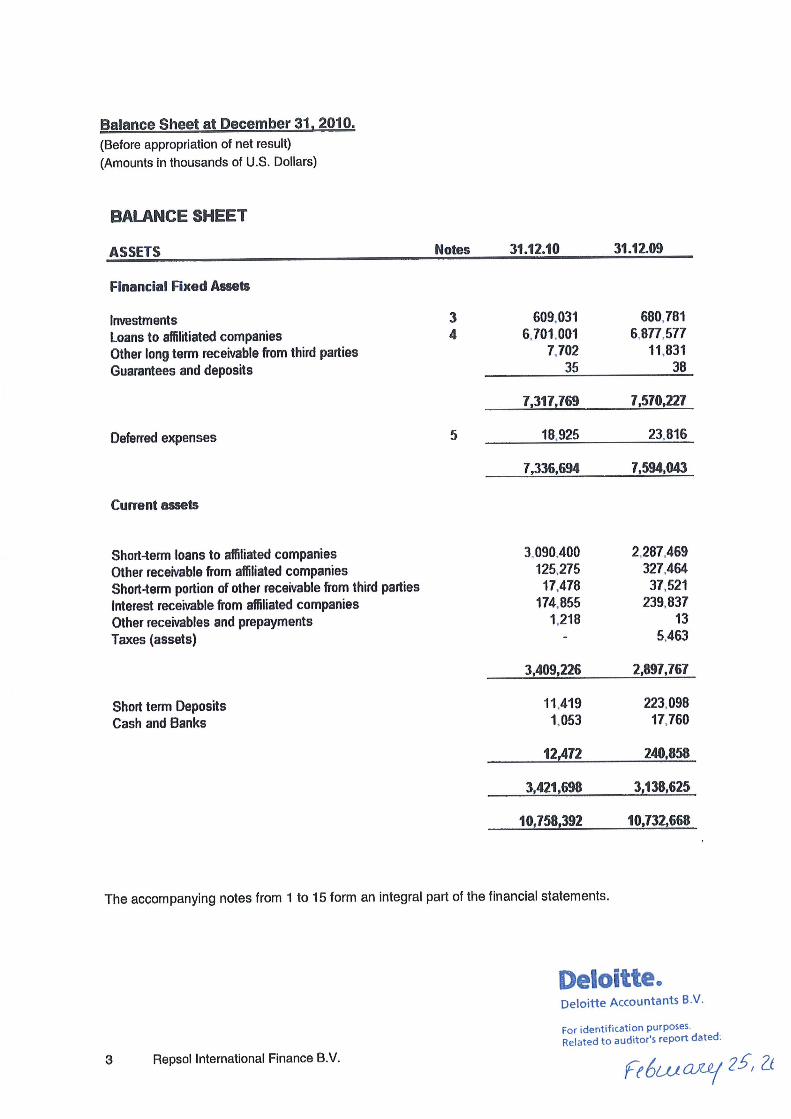
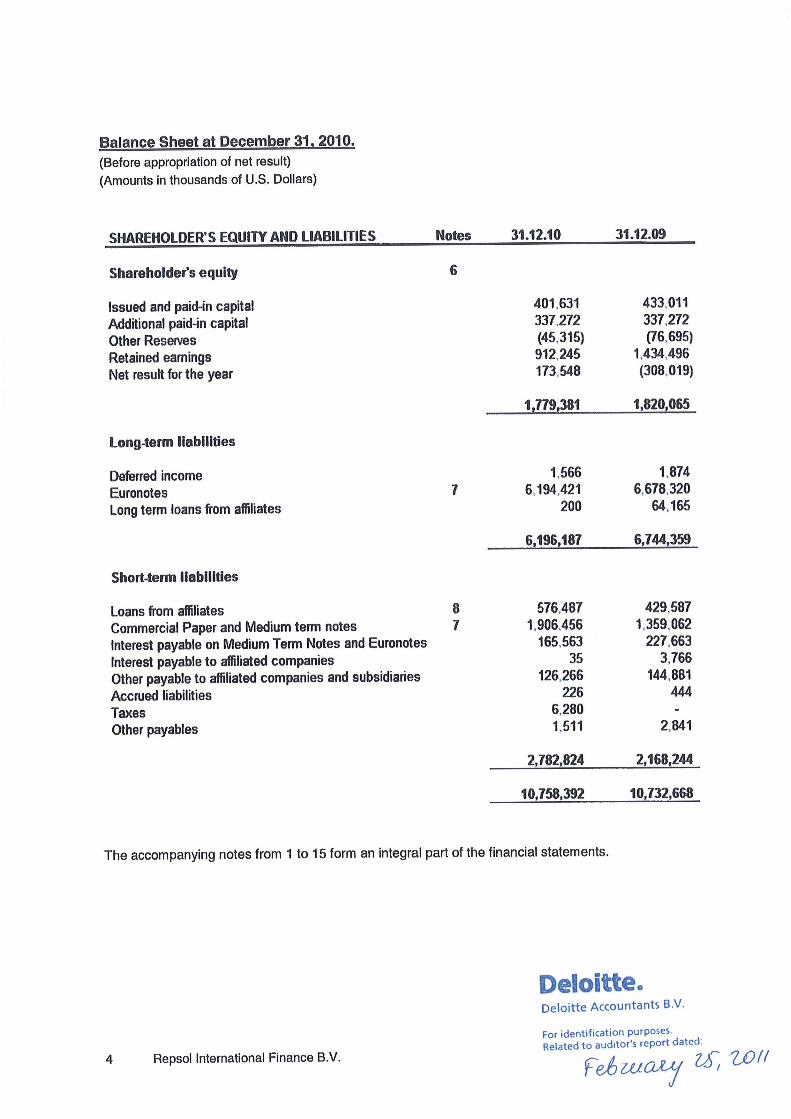
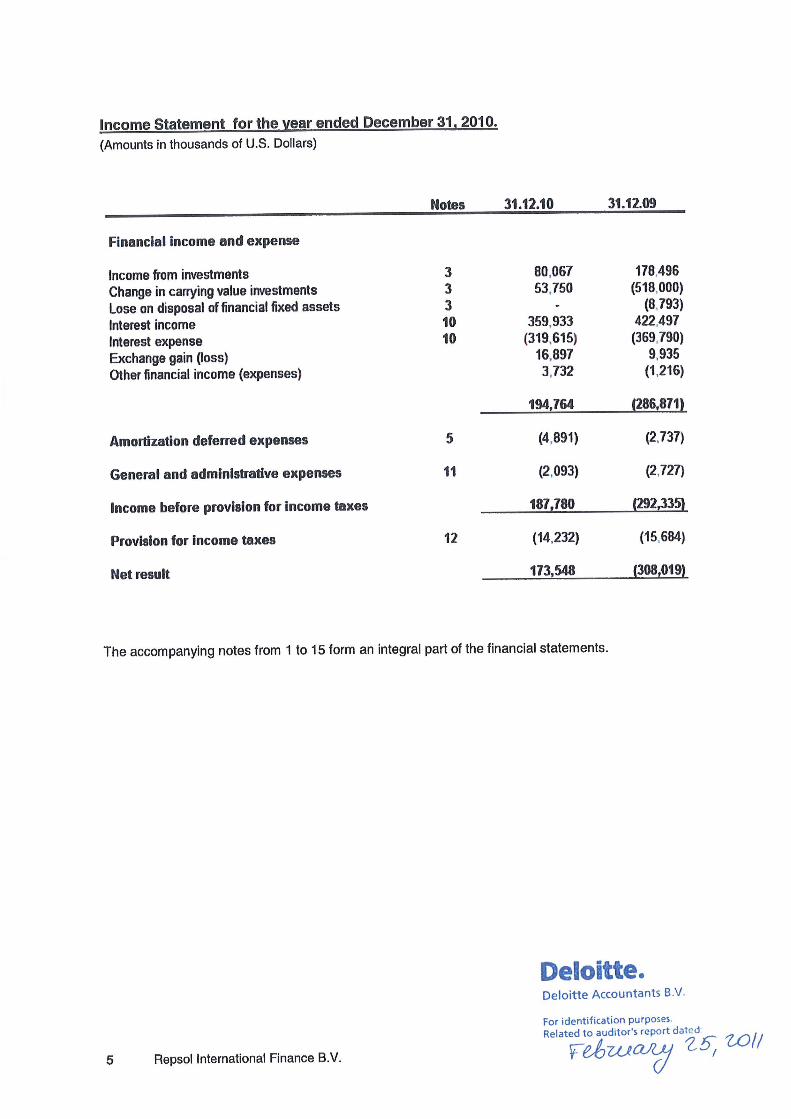
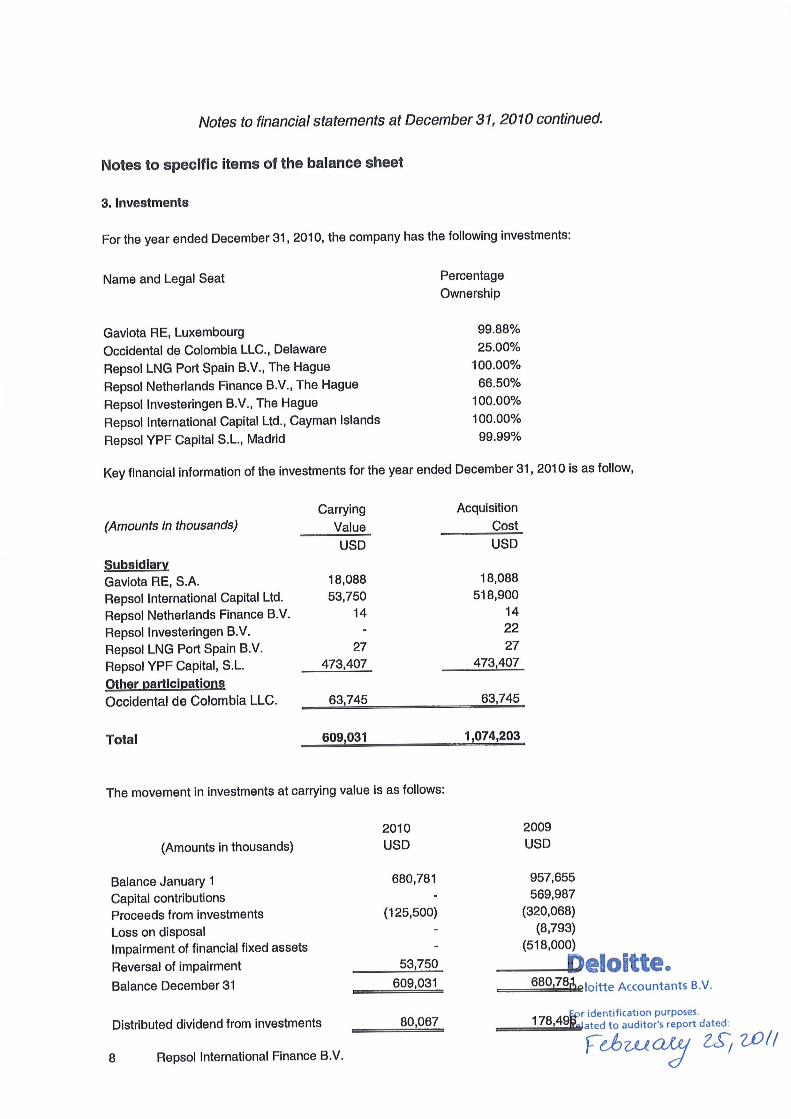
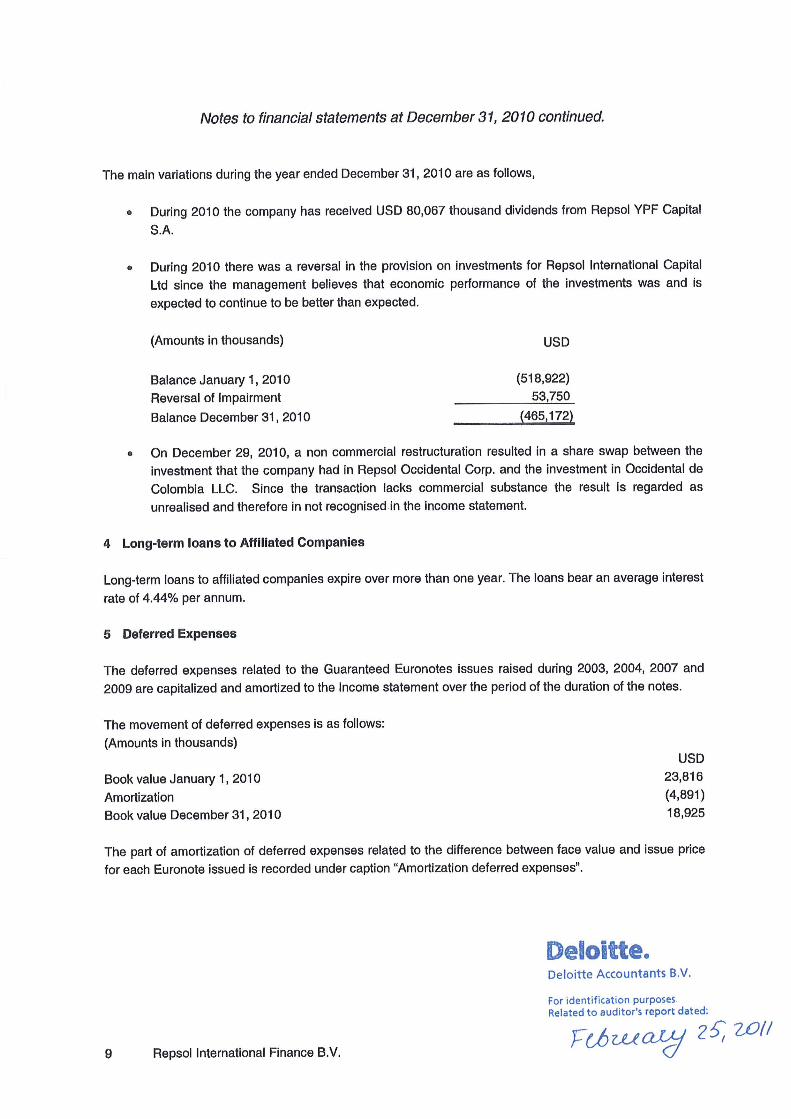
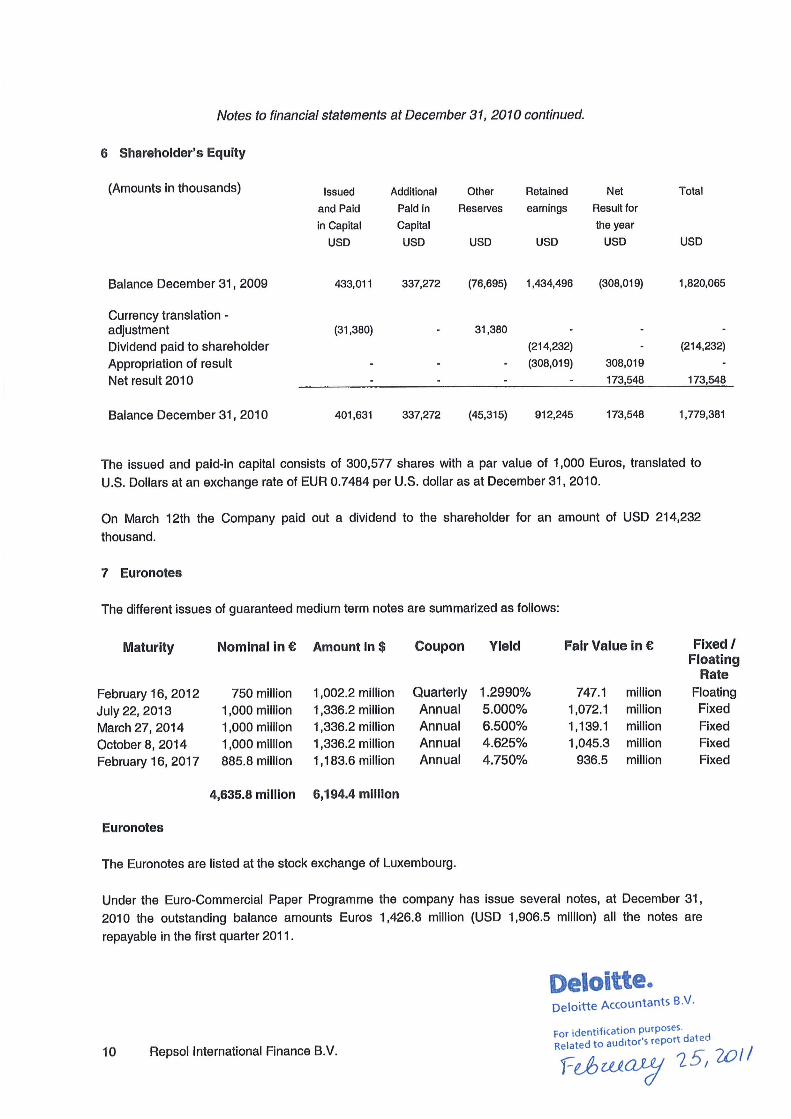
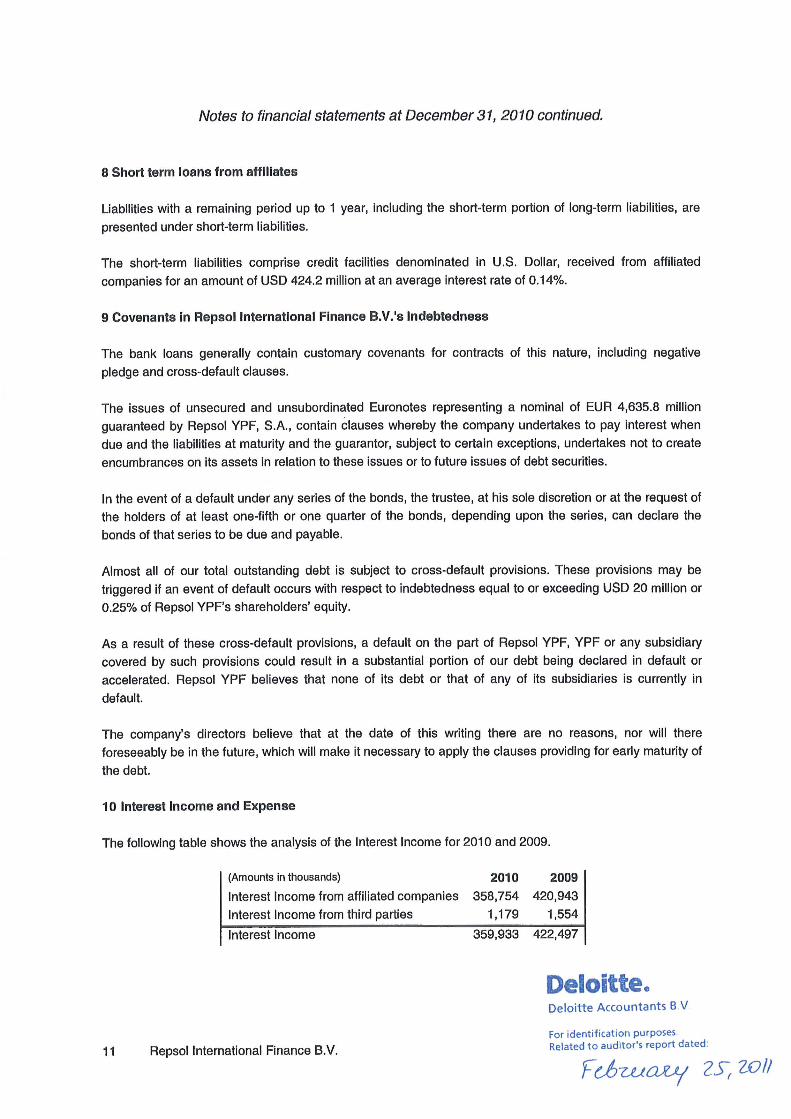
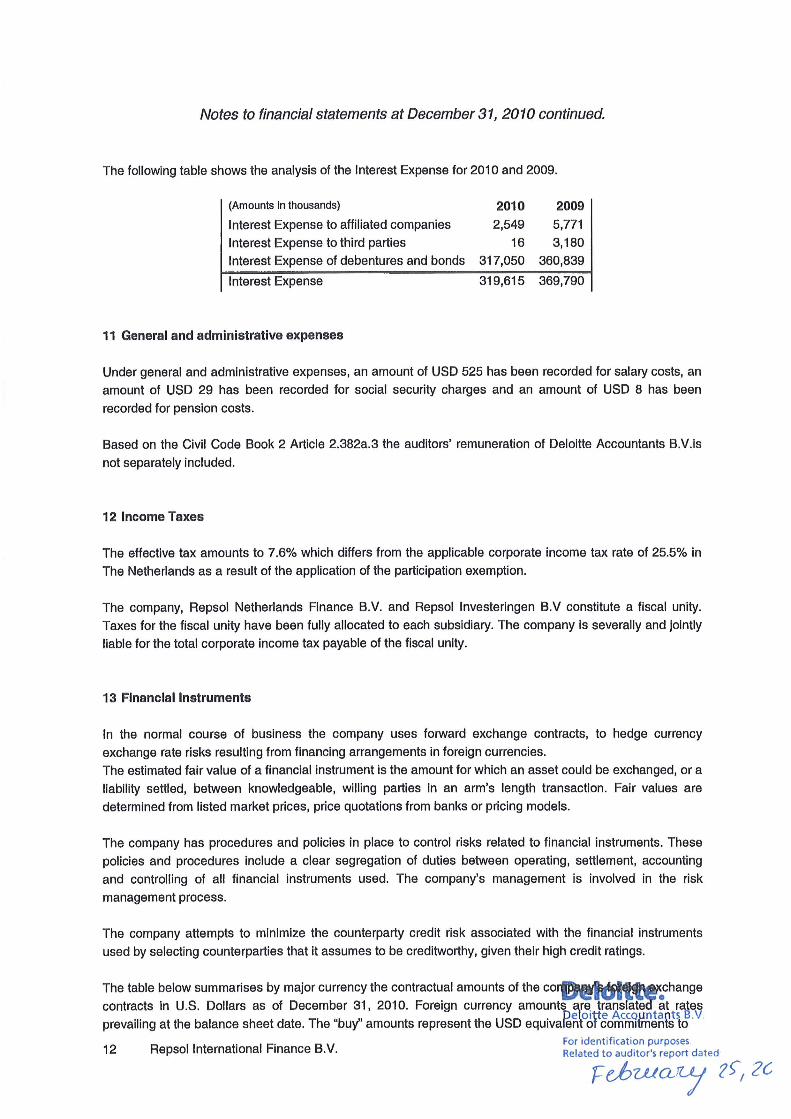
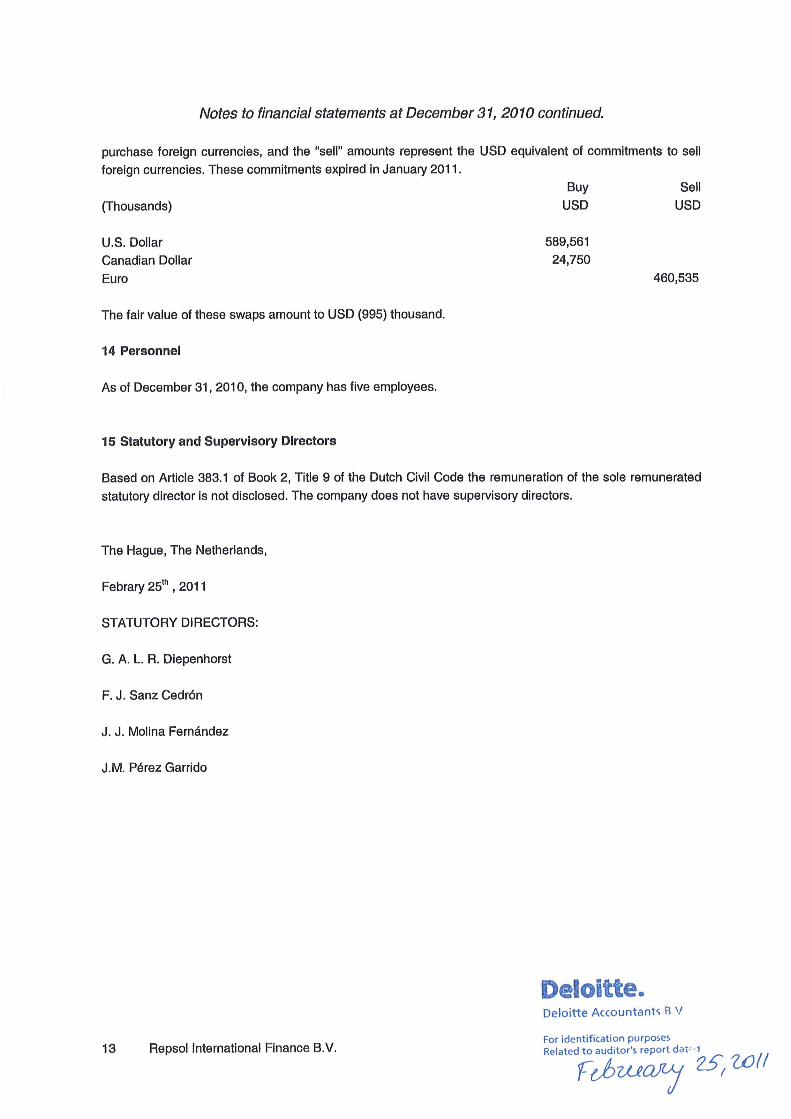
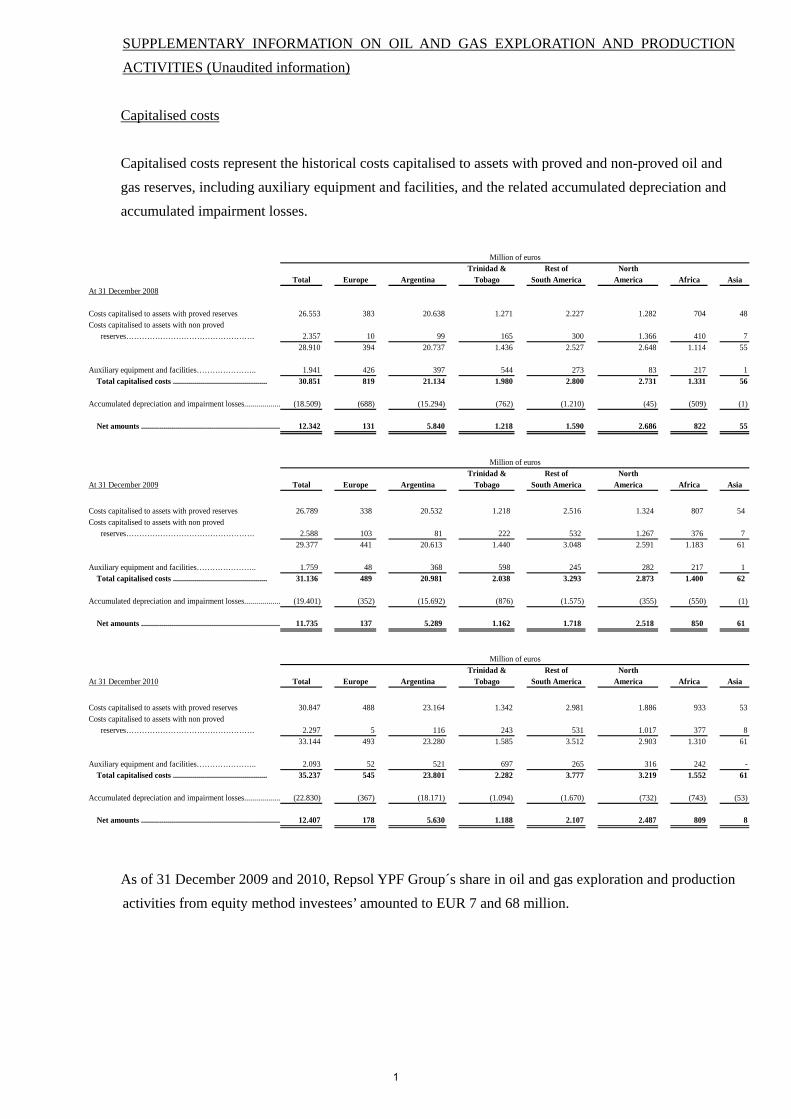
SUPPLEMENTARY INFORMATION ON OIL AND GAS EXPLORATION AND PRODUCTION
ACTIVITIES (Unaudited information)
Capitalised costs
Capitalised costs represent the historical costs capitalised to assets with proved and non-proved oil and
gas reserves, including auxiliary equipment and facilities, and the related accumulated depreciation and
accumulated impairment losses.
Trinidad & Rest of NorthTotal Europe Argentina Tobago South America America Africa Asia
At 31 December 2008
Costs capitalised to assets with proved reserves 26.553 383 20.638 1.271 2.227 1.282 704 48Costs capitalised to assets with non proved reserves…………………………………………. 2.357 10 99 165 300 1.366 410 7
28.910 394 20.737 1.436 2.527 2.648 1.114 55
Auxiliary equipment and facilities………………….. 1.941 426 397 544 273 83 217 1 Total capitalised costs ............................................... 30.851 819 21.134 1.980 2.800 2.731 1.331 56
Accumulated depreciation and impairment losses.................. (18.509) (688) (15.294) (762) (1.210) (45) (509) (1)
Net amounts ...................................................................... 12.342 131 5.840 1.218 1.590 2.686 822 55
Trinidad & Rest of NorthAt 31 December 2009 Total Europe Argentina Tobago South America America Africa Asia
Costs capitalised to assets with proved reserves 26.789 338 20.532 1.218 2.516 1.324 807 54Costs capitalised to assets with non proved reserves…………………………………………. 2.588 103 81 222 532 1.267 376 7
29.377 441 20.613 1.440 3.048 2.591 1.183 61
Auxiliary equipment and facilities………………….. 1.759 48 368 598 245 282 217 1 Total capitalised costs ............................................... 31.136 489 20.981 2.038 3.293 2.873 1.400 62
Accumulated depreciation and impairment losses.................. (19.401) (352) (15.692) (876) (1.575) (355) (550) (1)
Net amounts ...................................................................... 11.735 137 5.289 1.162 1.718 2.518 850 61
Trinidad & Rest of NorthAt 31 December 2010 Total Europe Argentina Tobago South America America Africa Asia
Costs capitalised to assets with proved reserves 30.847 488 23.164 1.342 2.981 1.886 933 53Costs capitalised to assets with non proved reserves…………………………………………. 2.297 5 116 243 531 1.017 377 8
33.144 493 23.280 1.585 3.512 2.903 1.310 61
Auxiliary equipment and facilities………………….. 2.093 52 521 697 265 316 242 - Total capitalised costs ............................................... 35.237 545 23.801 2.282 3.777 3.219 1.552 61
Accumulated depreciation and impairment losses.................. (22.830) (367) (18.171) (1.094) (1.670) (732) (743) (53)
Net amounts ...................................................................... 12.407 178 5.630 1.188 2.107 2.487 809 8
Million of euros
Million of euros
Million of euros
As of 31 December 2009 and 2010, Repsol YPF Group´s share in oil and gas exploration and production
activities from equity method investees’ amounted to EUR 7 and 68 million.
1
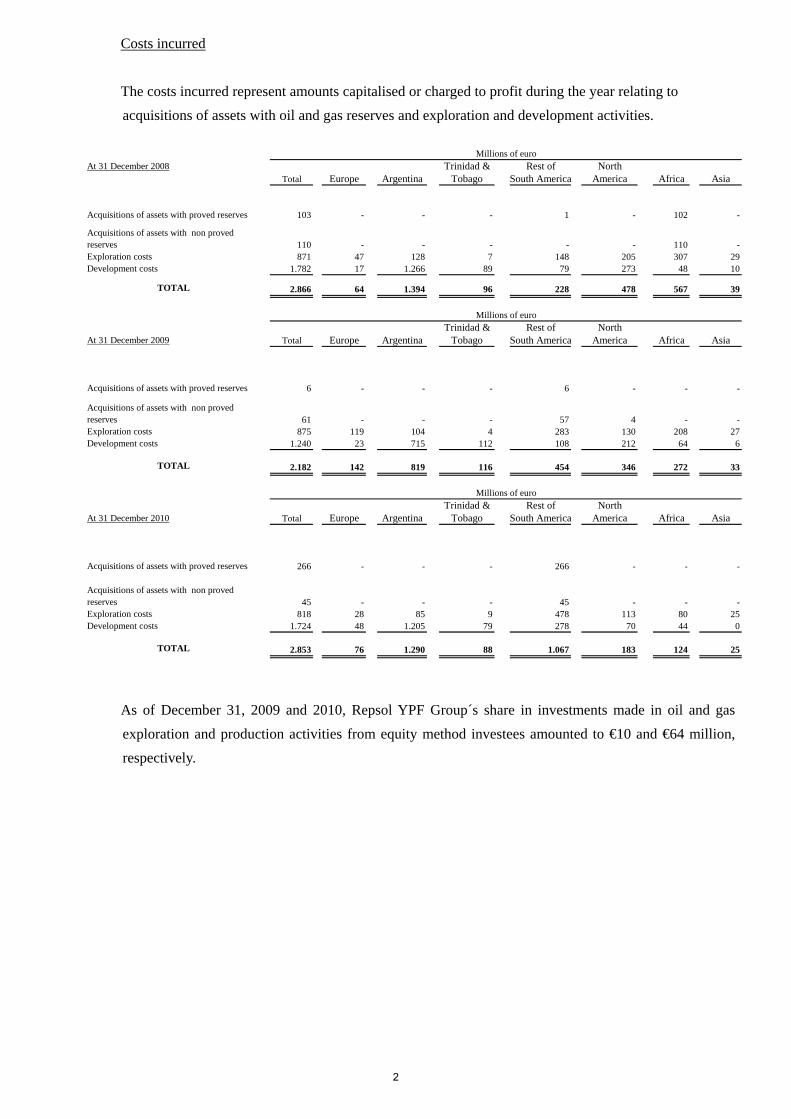
Costs incurred
The costs incurred represent amounts capitalised or charged to profit during the year relating to
acquisitions of assets with oil and gas reserves and exploration and development activities.
At 31 December 2008 Trinidad & Rest of NorthTotal Europe Argentina Tobago South America America Africa Asia
Acquisitions of assets with proved reserves 103 - - - 1 - 102 -
Acquisitions of assets with non proved reserves 110 - - - - - 110 -Exploration costs 871 47 128 7 148 205 307 29Development costs 1.782 17 1.266 89 79 273 48 10
TOTAL 2.866 64 1.394 96 228 478 567 39
Trinidad & Rest of NorthAt 31 December 2009 Total Europe Argentina Tobago South America America Africa Asia
Acquisitions of assets with proved reserves 6 - - - 6 - - -
Acquisitions of assets with non proved reserves 61 - - - 57 4 - -Exploration costs 875 119 104 4 283 130 208 27Development costs 1.240 23 715 112 108 212 64 6
TOTAL 2.182 142 819 116 454 346 272 33
Trinidad & Rest of NorthAt 31 December 2010 Total Europe Argentina Tobago South America America Africa Asia
Acquisitions of assets with proved reserves 266 - - - 266 - - -
Acquisitions of assets with non proved reserves 45 - - - 45 - - -Exploration costs 818 28 85 9 478 113 80 25Development costs 1.724 48 1.205 79 278 70 44 0
TOTAL 2.853 76 1.290 88 1.067 183 124 25
Millions of euro
Millions of euro
Millions of euro
As of December 31, 2009 and 2010, Repsol YPF Group´s share in investments made in oil and gas
exploration and production activities from equity method investees amounted to €10 and €64 million,
respectively.
2
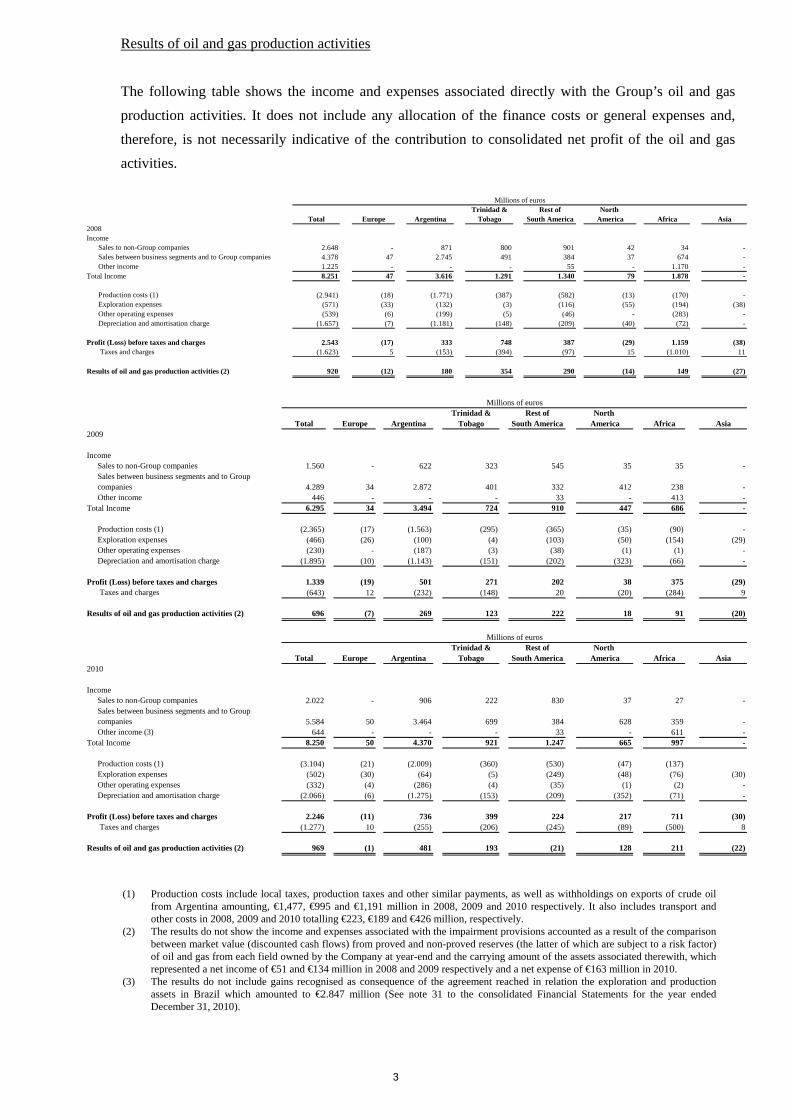
Results of oil and gas production activities
The following table shows the income and expenses associated directly with the Group’s oil and gas
production activities. It does not include any allocation of the finance costs or general expenses and,
therefore, is not necessarily indicative of the contribution to consolidated net profit of the oil and gas
activities.
Trinidad & Rest of North Total Europe Argentina Tobago South America America Africa Asia
2008Income
Sales to non-Group companies 2.648 - 871 800 901 42 34 -Sales between business segments and to Group companies 4.378 47 2.745 491 384 37 674 -Other income 1.225 - - - 55 - 1.170 -
Total Income 8.251 47 3.616 1.291 1.340 79 1.878 -
Production costs (1) (2.941) (18) (1.771) (387) (582) (13) (170) -Exploration expenses (571) (33) (132) (3) (116) (55) (194) (38)Other operating expenses (539) (6) (199) (5) (46) - (283) -Depreciation and amortisation charge (1.657) (7) (1.181) (148) (209) (40) (72) -
Profit (Loss) before taxes and charges 2.543 (17) 333 748 387 (29) 1.159 (38) Taxes and charges (1.623) 5 (153) (394) (97) 15 (1.010) 11
920 (12) 180 354 290 (14) 149 (27)
Millions of euros
Results of oil and gas production activities (2)
Trinidad & Rest of North Total Europe Argentina Tobago South America America Africa Asia
2009
IncomeSales to non-Group companies 1.560 - 622 323 545 35 35 -Sales between business segments and to Group companies 4.289 34 2.872 401 332 412 238 -Other income 446 - - - 33 - 413 -
Total Income 6.295 34 3.494 724 910 447 686 -
Production costs (1) (2.365) (17) (1.563) (295) (365) (35) (90) -Exploration expenses (466) (26) (100) (4) (103) (50) (154) (29)Other operating expenses (230) - (187) (3) (38) (1) (1) -Depreciation and amortisation charge (1.895) (10) (1.143) (151) (202) (323) (66) -
Profit (Loss) before taxes and charges 1.339 (19) 501 271 202 38 375 (29) Taxes and charges (643) 12 (232) (148) 20 (20) (284) 9
696 (7) 269 123 222 18 91 (20)
Millions of euros
Results of oil and gas production activities (2)
Trinidad & Rest of North Total Europe Argentina Tobago South America America Africa Asia
2010
IncomeSales to non-Group companies 2.022 - 906 222 830 37 27 -Sales between business segments and to Group companies 5.584 50 3.464 699 384 628 359 -Other income (3) 644 - - - 33 - 611 -
Total Income 8.250 50 4.370 921 1.247 665 997 -
Production costs (1) (3.104) (21) (2.009) (360) (530) (47) (137)Exploration expenses (502) (30) (64) (5) (249) (48) (76) (30)Other operating expenses (332) (4) (286) (4) (35) (1) (2) -Depreciation and amortisation charge (2.066) (6) (1.275) (153) (209) (352) (71) -
Profit (Loss) before taxes and charges 2.246 (11) 736 399 224 217 711 (30) Taxes and charges (1.277) 10 (255) (206) (245) (89) (500) 8
969 (1) 481 193 (21) 128 211 (22)
Millions of euros
Results of oil and gas production activities (2)
(1) Production costs include local taxes, production taxes and other similar payments, as well as withholdings on exports of crude oil from Argentina amounting, €1,477, €995 and €1,191 million in 2008, 2009 and 2010 respectively. It also includes transport and other costs in 2008, 2009 and 2010 totalling €223, €189 and €426 million, respectively.
(2) The results do not show the income and expenses associated with the impairment provisions accounted as a result of the comparison between market value (discounted cash flows) from proved and non-proved reserves (the latter of which are subject to a risk factor) of oil and gas from each field owned by the Company at year-end and the carrying amount of the assets associated therewith, which represented a net income of €51 and €134 million in 2008 and 2009 respectively and a net expense of €163 million in 2010.
(3) The results do not include gains recognised as consequence of the agreement reached in relation the exploration and production assets in Brazil which amounted to €2.847 million (See note 31 to the consolidated Financial Statements for the year ended December 31, 2010).
3
Estimated proved net developed and undeveloped oil and gas reserves:
The tables below reflect the net developed and undeveloped proved reserves of crude oil, condensed oil
and LPG and natural gas as of December 31, 2008, 2009 and 2010, and the variations therein. Proved
reserves shown includes the reserves equivalent to the economic income obtained under certain
production sharing contracts entered into as of December 31, 2008, 2009 and 2010.
In determining net reserves, we exclude from our reported reserves royalties due to others, whether
payable in cash or in kind, where the royalty owner has a direct interest in the underlying production
and is able to make lifting and sales arrangements independently. By contrast, to the extent that royalty
payments required to be made to a third party, whether payable in cash or in kind, are a financial
obligation, or are substantially equivalent to a production or severance tax, the related reserves are not
excluded from our reported reserves despite the fact that such payments are referred to as “royalties”
under local rules. We follow the same methodology in reporting our production amounts.
Proved reserves in each year were estimated in accordance with the rules and regulations established for
the petroleum and gas industry by the U.S. Securities and Exchange Commission (SEC) and the
accounting principles laid down by the “Financial Accounting Standards Board”. In accordance with
these rules, proved oil and gas reserves are those quantities of oil and gas, which, by analysis of
geoscience and engineering data, can be estimated with reasonable certainty to be economically
producible – from a given date forward, from known reservoirs, and under existing economic
conditions, operating methods, and government regulations – prior to the time at which contracts
providing the right to operate expire, regardless of whether deterministic or probabilistic methods are
used for the estimation. The project to extract the hydrocarbons must have commenced or the operator
must be reasonable certain that it will commence the project within a reasonable time.
All of Repsol YPF´s oil and gas reserves have been estimated by the company’s petroleum engineers.
To control the quality of reserves booked, Repsol YPF has established a process that is integrated into
Repsol YPF’s internal control system. The process to manage reserves booking is centrally controlled by
the Reserve Control Direction which is independent from the upstream activities and it is overseen by
the Audit and Control Committee. Furthermore, the volumes booked are submitted to third party
engineers for a reserves audit on a periodic basis (100% of the reserves on a three years cycle).
For those areas submitted to third party audit, Repsol YPF´s proved reserves figures have to be within
7% of the third party reserves audit figures for Repsol YPF to declare that the reserves information
meets the third party reserves audit standards. In the event that the difference is greater than 7%
tolerance, Repsol YPF reestimates its proved reserves to achieve this tolerance level or discloses the
third party reserves audit figures.
In 2010, Gaffney, Cline & Associates Inc., (CGA) audited certain areas in USA Gulf of Mexico and
South America; DeGolyer and MacNaughton (D&M) audited certain areas in Argentina; Netherland,
Sewell & Associates, Inc., (NSAI) audited certain areas in South America, and Ryder Scott Company
(RSC) audited certain areas in South America. The third party engineers’ reports are available at
www.repsol.com
4
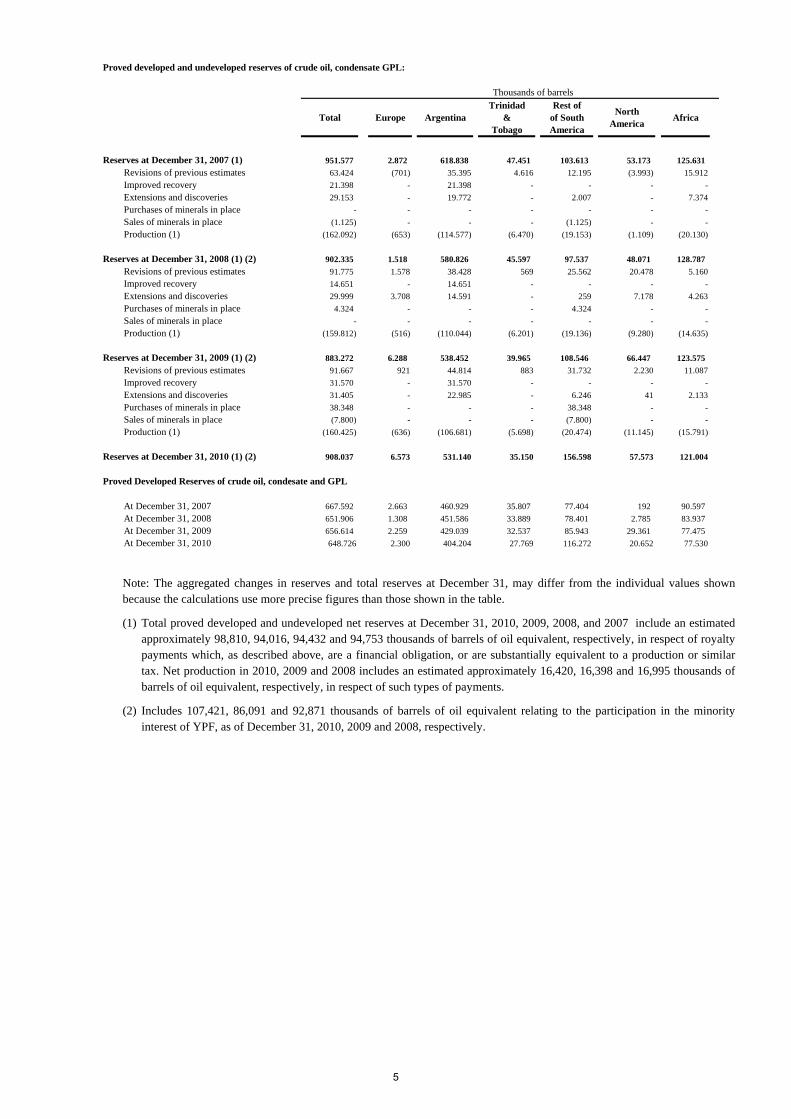
Proved developed and undeveloped reserves of crude oil, condensate GPL:
Total Europe ArgentinaTrinidad
&Tobago
Rest of of South America
North America
Africa
Reserves at December 31, 2007 (1) 951.577 2.872 618.838 47.451 103.613 53.173 125.631
Revisions of previous estimates 63.424 (701) 35.395 4.616 12.195 (3.993) 15.912
Improved recovery 21.398 - 21.398 - - - -
Extensions and discoveries 29.153 - 19.772 - 2.007 - 7.374
Purchases of minerals in place - - - - - - -
Sales of minerals in place (1.125) - - - (1.125) - -
Production (1) (162.092) (653) (114.577) (6.470) (19.153) (1.109) (20.130)
Reserves at December 31, 2008 (1) (2) 902.335 1.518 580.826 45.597 97.537 48.071 128.787
Revisions of previous estimates 91.775 1.578 38.428 569 25.562 20.478 5.160
Improved recovery 14.651 - 14.651 - - - -
Extensions and discoveries 29.999 3.708 14.591 - 259 7.178 4.263
Purchases of minerals in place 4.324 - - - 4.324 - -
Sales of minerals in place - - - - - - -
Production (1) (159.812) (516) (110.044) (6.201) (19.136) (9.280) (14.635)
Reserves at December 31, 2009 (1) (2) 883.272 6.288 538.452 39.965 108.546 66.447 123.575
Revisions of previous estimates 91.667 921 44.814 883 31.732 2.230 11.087
Improved recovery 31.570 - 31.570 - - - -
Extensions and discoveries 31.405 - 22.985 - 6.246 41 2.133
Purchases of minerals in place 38.348 - - - 38.348 - -
Sales of minerals in place (7.800) - - - (7.800) - -
Production (1) (160.425) (636) (106.681) (5.698) (20.474) (11.145) (15.791)
Reserves at December 31, 2010 (1) (2) 908.037 6.573 531.140 35.150 156.598 57.573 121.004
Proved Developed Reserves of crude oil, condesate and GPL
At December 31, 2007 667.592 2.663 460.929 35.807 77.404 192 90.597
At December 31, 2008 651.906 1.308 451.586 33.889 78.401 2.785 83.937
At December 31, 2009 656.614 2.259 429.039 32.537 85.943 29.361 77.475
At December 31, 2010 648.726 2.300 404.204 27.769 116.272 20.652 77.530
Thousands of barrels
Note: The aggregated changes in reserves and total reserves at December 31, may differ from the individual values shown because the calculations use more precise figures than those shown in the table.
(1) Total proved developed and undeveloped net reserves at December 31, 2010, 2009, 2008, and 2007 include an estimated approximately 98,810, 94,016, 94,432 and 94,753 thousands of barrels of oil equivalent, respectively, in respect of royalty payments which, as described above, are a financial obligation, or are substantially equivalent to a production or similar tax. Net production in 2010, 2009 and 2008 includes an estimated approximately 16,420, 16,398 and 16,995 thousands of barrels of oil equivalent, respectively, in respect of such types of payments.
(2) Includes 107,421, 86,091 and 92,871 thousands of barrels of oil equivalent relating to the participation in the minority interest of YPF, as of December 31, 2010, 2009 and 2008, respectively.
5
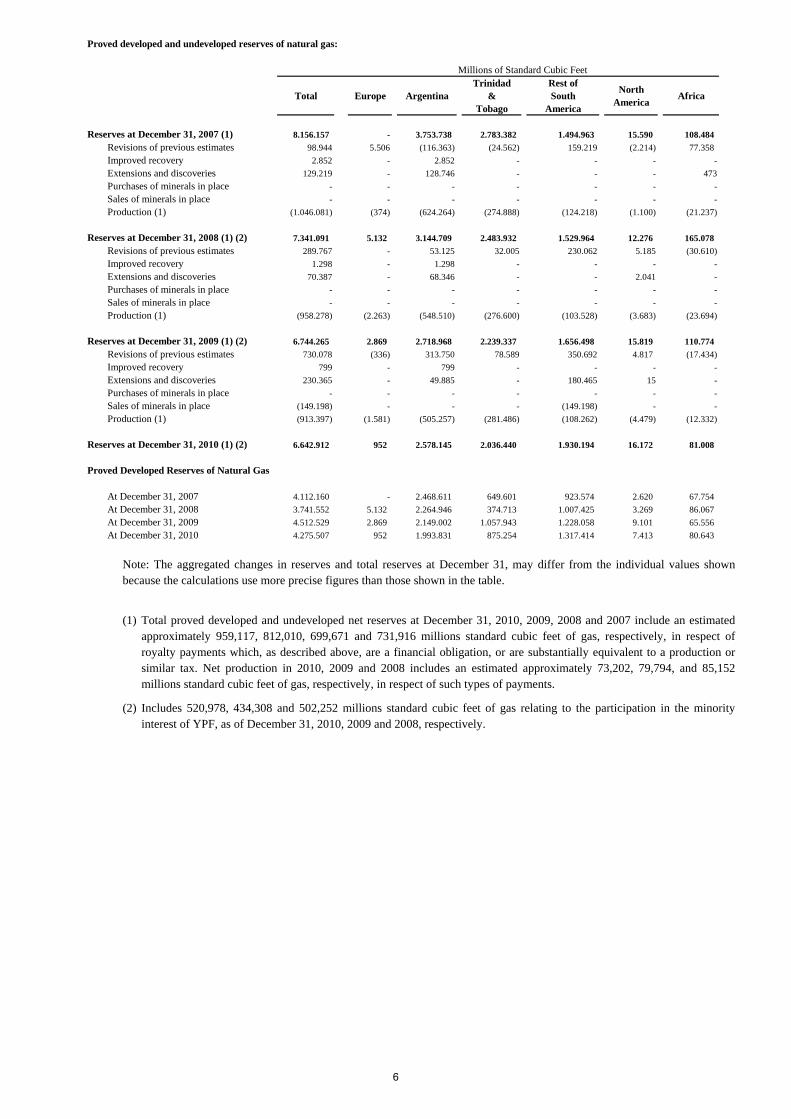
Proved developed and undeveloped reserves of natural gas:
Total Europe ArgentinaTrinidad
&Tobago
Rest of South
America
North America
Africa
Reserves at December 31, 2007 (1) 8.156.157 - 3.753.738 2.783.382 1.494.963 15.590 108.484
Revisions of previous estimates 98.944 5.506 (116.363) (24.562) 159.219 (2.214) 77.358
Improved recovery 2.852 - 2.852 - - - -
Extensions and discoveries 129.219 - 128.746 - - - 473
Purchases of minerals in place - - - - - - -
Sales of minerals in place - - - - - - -
Production (1) (1.046.081) (374) (624.264) (274.888) (124.218) (1.100) (21.237)
Reserves at December 31, 2008 (1) (2) 7.341.091 5.132 3.144.709 2.483.932 1.529.964 12.276 165.078
Revisions of previous estimates 289.767 - 53.125 32.005 230.062 5.185 (30.610)
Improved recovery 1.298 - 1.298 - - - -
Extensions and discoveries 70.387 - 68.346 - - 2.041 -
Purchases of minerals in place - - - - - - -
Sales of minerals in place - - - - - - -
Production (1) (958.278) (2.263) (548.510) (276.600) (103.528) (3.683) (23.694)
Reserves at December 31, 2009 (1) (2) 6.744.265 2.869 2.718.968 2.239.337 1.656.498 15.819 110.774
Revisions of previous estimates 730.078 (336) 313.750 78.589 350.692 4.817 (17.434)
Improved recovery 799 - 799 - - - -
Extensions and discoveries 230.365 - 49.885 - 180.465 15 -
Purchases of minerals in place - - - - - - -
Sales of minerals in place (149.198) - - - (149.198) - -
Production (1) (913.397) (1.581) (505.257) (281.486) (108.262) (4.479) (12.332)
Reserves at December 31, 2010 (1) (2) 6.642.912 952 2.578.145 2.036.440 1.930.194 16.172 81.008
Proved Developed Reserves of Natural Gas
At December 31, 2007 4.112.160 - 2.468.611 649.601 923.574 2.620 67.754
At December 31, 2008 3.741.552 5.132 2.264.946 374.713 1.007.425 3.269 86.067
At December 31, 2009 4.512.529 2.869 2.149.002 1.057.943 1.228.058 9.101 65.556
At December 31, 2010 4.275.507 952 1.993.831 875.254 1.317.414 7.413 80.643
Millions of Standard Cubic Feet
Note: The aggregated changes in reserves and total reserves at December 31, may differ from the individual values shown because the calculations use more precise figures than those shown in the table.
(1) Total proved developed and undeveloped net reserves at December 31, 2010, 2009, 2008 and 2007 include an estimated
approximately 959,117, 812,010, 699,671 and 731,916 millions standard cubic feet of gas, respectively, in respect of royalty payments which, as described above, are a financial obligation, or are substantially equivalent to a production or similar tax. Net production in 2010, 2009 and 2008 includes an estimated approximately 73,202, 79,794, and 85,152 millions standard cubic feet of gas, respectively, in respect of such types of payments.
(2) Includes 520,978, 434,308 and 502,252 millions standard cubic feet of gas relating to the participation in the minority interest of YPF, as of December 31, 2010, 2009 and 2008, respectively.
6
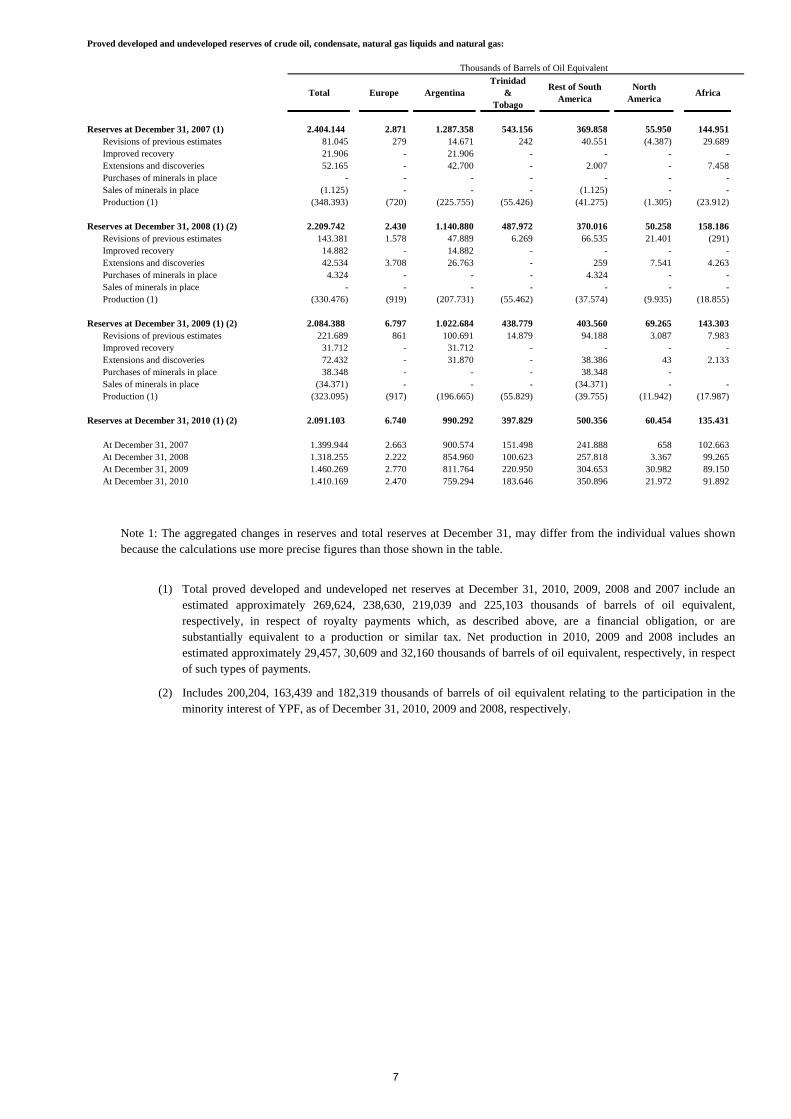
Proved developed and undeveloped reserves of crude oil, condensate, natural gas liquids and natural gas:
Total Europe ArgentinaTrinidad
&Tobago
Rest of SouthAmerica
North America
Africa
Reserves at December 31, 2007 (1) 2.404.144 2.871 1.287.358 543.156 369.858 55.950 144.951Revisions of previous estimates 81.045 279 14.671 242 40.551 (4.387) 29.689Improved recovery 21.906 - 21.906 - - - -Extensions and discoveries 52.165 - 42.700 - 2.007 - 7.458Purchases of minerals in place - - - - - - -Sales of minerals in place (1.125) - - - (1.125) - -Production (1) (348.393) (720) (225.755) (55.426) (41.275) (1.305) (23.912)
Reserves at December 31, 2008 (1) (2) 2.209.742 2.430 1.140.880 487.972 370.016 50.258 158.186Revisions of previous estimates 143.381 1.578 47.889 6.269 66.535 21.401 (291)Improved recovery 14.882 - 14.882 - - - -Extensions and discoveries 42.534 3.708 26.763 - 259 7.541 4.263Purchases of minerals in place 4.324 - - - 4.324 - -Sales of minerals in place - - - - - - -Production (1) (330.476) (919) (207.731) (55.462) (37.574) (9.935) (18.855)
Reserves at December 31, 2009 (1) (2) 2.084.388 6.797 1.022.684 438.779 403.560 69.265 143.303Revisions of previous estimates 221.689 861 100.691 14.879 94.188 3.087 7.983Improved recovery 31.712 - 31.712 - - - -Extensions and discoveries 72.432 - 31.870 - 38.386 43 2.133Purchases of minerals in place 38.348 - - - 38.348 -Sales of minerals in place (34.371) - - - (34.371) - -Production (1) (323.095) (917) (196.665) (55.829) (39.755) (11.942) (17.987)
Reserves at December 31, 2010 (1) (2) 2.091.103 6.740 990.292 397.829 500.356 60.454 135.431
At December 31, 2007 1.399.944 2.663 900.574 151.498 241.888 658 102.663At December 31, 2008 1.318.255 2.222 854.960 100.623 257.818 3.367 99.265At December 31, 2009 1.460.269 2.770 811.764 220.950 304.653 30.982 89.150At December 31, 2010 1.410.169 2.470 759.294 183.646 350.896 21.972 91.892
Thousands of Barrels of Oil Equivalent
Note 1: The aggregated changes in reserves and total reserves at December 31, may differ from the individual values shown because the calculations use more precise figures than those shown in the table.
(1) Total proved developed and undeveloped net reserves at December 31, 2010, 2009, 2008 and 2007 include an
estimated approximately 269,624, 238,630, 219,039 and 225,103 thousands of barrels of oil equivalent, respectively, in respect of royalty payments which, as described above, are a financial obligation, or are substantially equivalent to a production or similar tax. Net production in 2010, 2009 and 2008 includes an estimated approximately 29,457, 30,609 and 32,160 thousands of barrels of oil equivalent, respectively, in respect of such types of payments.
(2) Includes 200,204, 163,439 and 182,319 thousands of barrels of oil equivalent relating to the participation in the minority interest of YPF, as of December 31, 2010, 2009 and 2008, respectively.
7
Standardized measure of discounted future net cash flows and changes therein relating to proved oil and
gas reserves
The estimate of future net cash flows was performed in accordance with the rules and regulations
established for the oil and gas industry by the U.S. Securities and Exchange Commission and the
accounting principles laid down by the Financial Accounting Standards Board of the U.S. which govern
stock market information practices in the U.S.A. The method applied is the impartiality or fairness
method and is the result of applying the average oil and gas prices in 2010 (considering price changes
only by contractual agreement) to estimated future production of proved reserves of oil and gas as of the
date of the last balance sheet filed, less the estimated future costs (based on current costs) to be incurred
in the development and production of proved reserves, assuming the continuation of current economic
conditions.
Future production costs were estimated on the basis of actual costs borne in 2008, 2009 and 2010.
Future development costs were calculated on the basis of technical studies conducted by Repsol YPF
and by the operators holding joint title with Repsol YPF. The taxes projected for each of the future years
were determined by applying the applicable nominal tax rate, reduced by the tax benefits available to the
Company in each of the years. The rate used to discount the future net revenues was 10%.
The present value of the future net cash flows estimated on the basis of the aforementioned assumptions,
applying the principle of impartiality, is not intended to be interpreted, and should not be interpreted, as
the fair value of the Group’s oil and gas reserves. An estimation of the fair value of these reserves should
also include the future exploitation of reserves not yet classified as proved reserves, possible changes in
future prices and costs and a discount rate which represents the time value of money at the calculation
date and the uncertainties inherent to estimating the reserves.
The following table shows the present value of the future net revenues relating to proved oil and gas
reserves, calculated on the basis of the aforementioned assumptions:
8
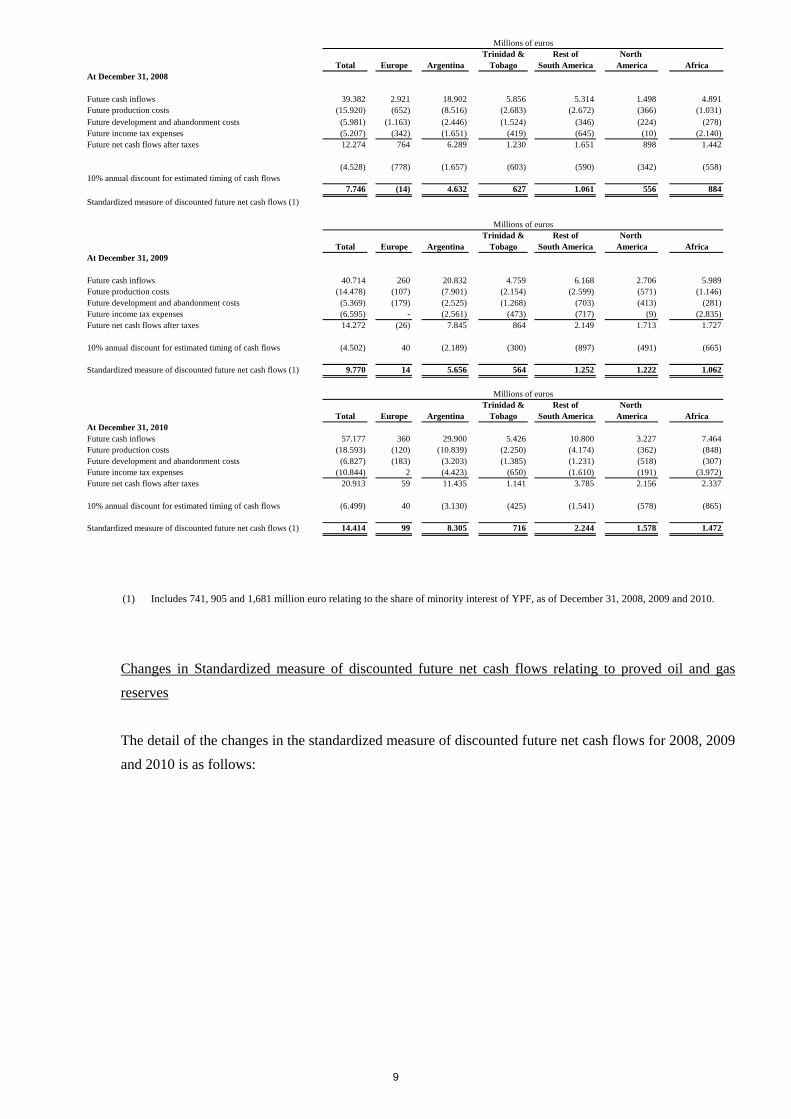
Trinidad & Rest of North Total Europe Argentina Tobago South America America Africa
At December 31, 2008
Future cash inflows 39.382 2.921 18.902 5.856 5.314 1.498 4.891Future production costs (15.920) (652) (8.516) (2.683) (2.672) (366) (1.031)Future development and abandonment costs (5.981) (1.163) (2.446) (1.524) (346) (224) (278)Future income tax expenses (5.207) (342) (1.651) (419) (645) (10) (2.140)Future net cash flows after taxes 12.274 764 6.289 1.230 1.651 898 1.442
(4.528) (778) (1.657) (603) (590) (342) (558)10% annual discount for estimated timing of cash flows
7.746 (14) 4.632 627 1.061 556 884
Standardized measure of discounted future net cash flows (1)
Trinidad & Rest of North Total Europe Argentina Tobago South America America Africa
At December 31, 2009
Future cash inflows 40.714 260 20.832 4.759 6.168 2.706 5.989Future production costs (14.478) (107) (7.901) (2.154) (2.599) (571) (1.146)Future development and abandonment costs (5.369) (179) (2.525) (1.268) (703) (413) (281)Future income tax expenses (6.595) - (2.561) (473) (717) (9) (2.835)Future net cash flows after taxes 14.272 (26) 7.845 864 2.149 1.713 1.727
10% annual discount for estimated timing of cash flows (4.502) 40 (2.189) (300) (897) (491) (665)
Standardized measure of discounted future net cash flows (1) 9.770 14 5.656 564 1.252 1.222 1.062
Trinidad & Rest of North Total Europe Argentina Tobago South America America Africa
At December 31, 2010Future cash inflows 57.177 360 29.900 5.426 10.800 3.227 7.464Future production costs (18.593) (120) (10.839) (2.250) (4.174) (362) (848)Future development and abandonment costs (6.827) (183) (3.203) (1.385) (1.231) (518) (307)Future income tax expenses (10.844) 2 (4.423) (650) (1.610) (191) (3.972)Future net cash flows after taxes 20.913 59 11.435 1.141 3.785 2.156 2.337
10% annual discount for estimated timing of cash flows (6.499) 40 (3.130) (425) (1.541) (578) (865)
Standardized measure of discounted future net cash flows (1) 14.414 99 8.305 716 2.244 1.578 1.472
Millions of euros
Millions of euros
Millions of euros
(1) Includes 741, 905 and 1,681 million euro relating to the share of minority interest of YPF, as of December 31, 2008, 2009 and 2010.
Changes in Standardized measure of discounted future net cash flows relating to proved oil and gas
reserves
The detail of the changes in the standardized measure of discounted future net cash flows for 2008, 2009
and 2010 is as follows:
9
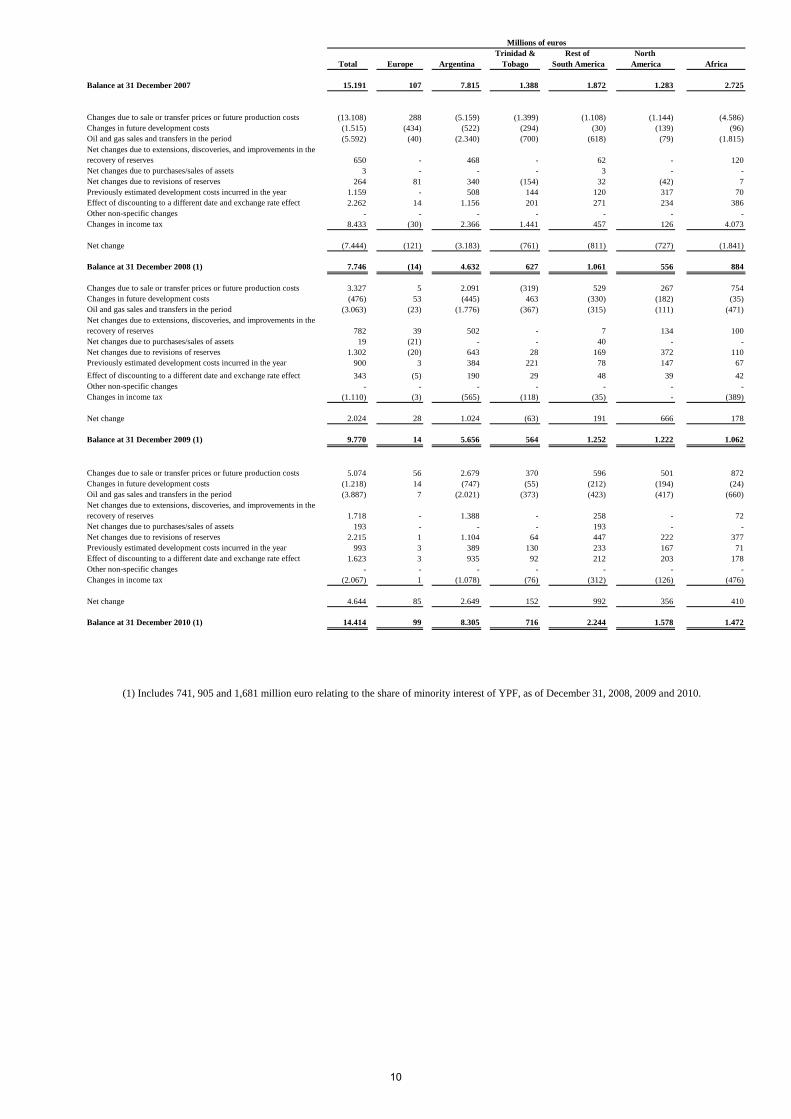
Trinidad & Rest of North Total Europe Argentina Tobago South America America Africa
Balance at 31 December 2007 15.191 107 7.815 1.388 1.872 1.283 2.725
Changes due to sale or transfer prices or future production costs (13.108) 288 (5.159) (1.399) (1.108) (1.144) (4.586)Changes in future development costs (1.515) (434) (522) (294) (30) (139) (96)Oil and gas sales and transfers in the period (5.592) (40) (2.340) (700) (618) (79) (1.815)Net changes due to extensions, discoveries, and improvements in the recovery of reserves 650 - 468 - 62 - 120Net changes due to purchases/sales of assets 3 - - - 3 - -Net changes due to revisions of reserves 264 81 340 (154) 32 (42) 7Previously estimated development costs incurred in the year 1.159 - 508 144 120 317 70Effect of discounting to a different date and exchange rate effect 2.262 14 1.156 201 271 234 386Other non-specific changes - - - - - - -Changes in income tax 8.433 (30) 2.366 1.441 457 126 4.073
Net change (7.444) (121) (3.183) (761) (811) (727) (1.841)
Balance at 31 December 2008 (1) 7.746 (14) 4.632 627 1.061 556 884
Changes due to sale or transfer prices or future production costs 3.327 5 2.091 (319) 529 267 754Changes in future development costs (476) 53 (445) 463 (330) (182) (35)Oil and gas sales and transfers in the period (3.063) (23) (1.776) (367) (315) (111) (471)Net changes due to extensions, discoveries, and improvements in the recovery of reserves 782 39 502 - 7 134 100Net changes due to purchases/sales of assets 19 (21) - - 40 - -Net changes due to revisions of reserves 1.302 (20) 643 28 169 372 110Previously estimated development costs incurred in the year 900 3 384 221 78 147 67
Effect of discounting to a different date and exchange rate effect 343 (5) 190 29 48 39 42Other non-specific changes - - - - - - -Changes in income tax (1.110) (3) (565) (118) (35) - (389)
Net change 2.024 28 1.024 (63) 191 666 178
Balance at 31 December 2009 (1) 9.770 14 5.656 564 1.252 1.222 1.062
Changes due to sale or transfer prices or future production costs 5.074 56 2.679 370 596 501 872Changes in future development costs (1.218) 14 (747) (55) (212) (194) (24)Oil and gas sales and transfers in the period (3.887) 7 (2.021) (373) (423) (417) (660)Net changes due to extensions, discoveries, and improvements in the recovery of reserves 1.718 - 1.388 - 258 - 72Net changes due to purchases/sales of assets 193 - - - 193 - -Net changes due to revisions of reserves 2.215 1 1.104 64 447 222 377Previously estimated development costs incurred in the year 993 3 389 130 233 167 71Effect of discounting to a different date and exchange rate effect 1.623 3 935 92 212 203 178Other non-specific changes - - - - - - -Changes in income tax (2.067) 1 (1.078) (76) (312) (126) (476)
Net change 4.644 85 2.649 152 992 356 410
Balance at 31 December 2010 (1) 14.414 99 8.305 716 2.244 1.578 1.472
Millions of euros
(1) Includes 741, 905 and 1,681 million euro relating to the share of minority interest of YPF, as of December 31, 2008, 2009 and 2010.
10
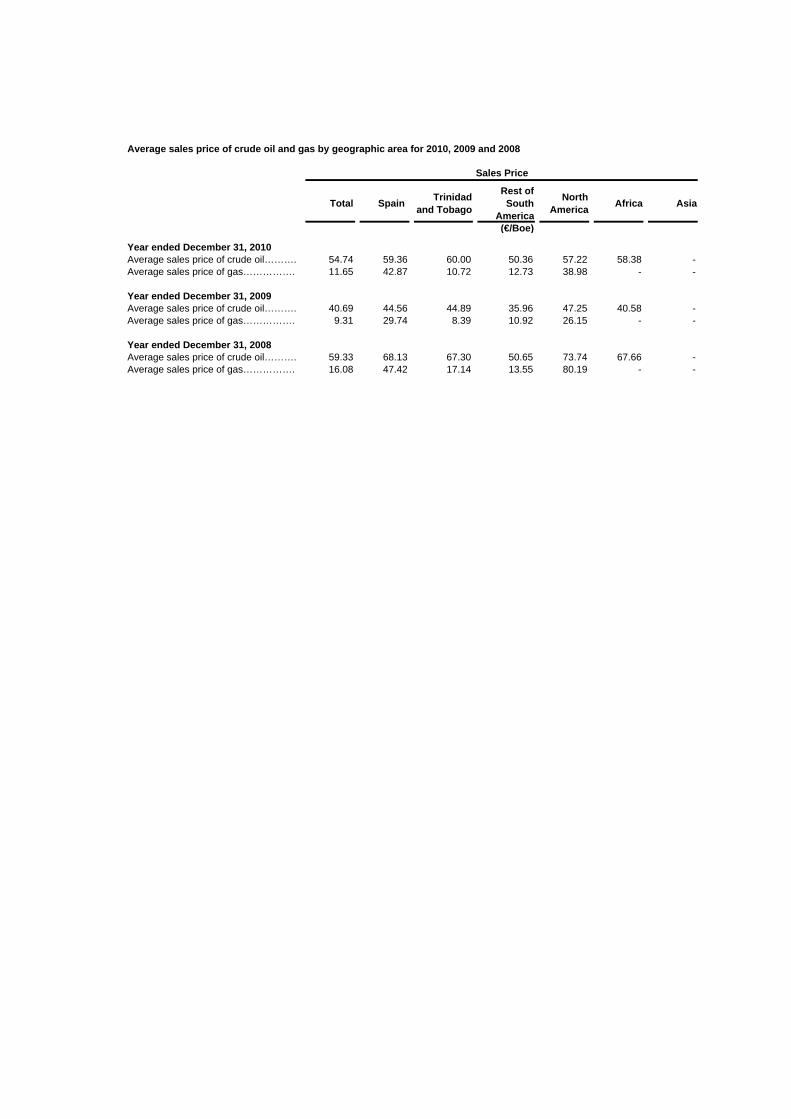
Average sales price of crude oil and gas by geographic area for 2010, 2009 and 2008
Total Spain Trinidad and Tobago
Rest of South
America
North America Africa Asia
(€/Boe)
Year ended December 31, 2010Average sales price of crude oil………. 54.74 59.36 60.00 50.36 57.22 58.38 -Average sales price of gas……………. 11.65 42.87 10.72 12.73 38.98 - -
Year ended December 31, 2009Average sales price of crude oil………. 40.69 44.56 44.89 35.96 47.25 40.58 -Average sales price of gas……………. 9.31 29.74 8.39 10.92 26.15 - -
Year ended December 31, 2008Average sales price of crude oil………. 59.33 68.13 67.30 50.65 73.74 67.66 -Average sales price of gas……………. 16.08 47.42 17.14 13.55 80.19 - -
Sales Price