Embed Size (px)
Citation preview
DOCUMENT RESUME
ED 445 547 FL 026 431
AUTHOR Christopher, Virginia LouiseTITLE Direct and Indirect Placement Test Scores as Measures of
Language Proficiency and Predictors of Academic Success forESL Students.
PUB DATE 1993-12-00NOTE 79p.; Master's thesis, University of British Columbia.PUB TYPE Dissertations/Theses Masters Theses (042)EDRS PRICE MF01/PC04 Plus Postage.DESCRIPTORS *Academic Achievement; College Students; Comparative
Analysis; *English (Second Language); *Evaluation Criteria;Evaluation Methods; *Grade Point Average; High SchoolStudents; High Schools; Higher Education; Language Tests;*Scores; Second Language Instruction; Second LanguageLearning; Student Evaluation; *Student Placement; Testing
IDENTIFIERS Academic Language; Michigan Test of English LanguageProficiency
ABSTRACTCurrent research in the English-as-a-Second-Language (ESL)
field has not assessed the comparative ability of indirect and direct testscores to predict academic success. Work of this kind would inform practicein the area of testing and placement. This study investigates the practicalproblem of making appropriate placement decisions for students whose testresults show wide enough discrepancies to indicate placement in differentacademic programs, or at different levels within programs. The question ofwhether scores derived from indirect measures (language proficiency tests) ordirect measures (writing samples) are better indicators of academic languageproficiency is addressed. This study also explores the usefulness of gradepoint average (GPA) as a measure of academic success, and proposes the use ofaverage accumulated credit per semester (AACPS) as an additional measure.Several researchers have questioned the use of GPA as the sole measure ofacademic success for ESL students, and this study adds to existing research.The ability of two types of placement tests to predict academic success forESL students in secondary and university programs is evaluated: one indirect(the Michigan Test of English Language Proficiency); the other direct (acombination of GPA and AACPS measures). Results are mixed. Nine data-richappendices and 48 references are included. (KFT)
Reproductions supplied by EDRS are the best that can be madefrom the original document.
DIRECT AND INDIRECT PLACEMENT TEST SCORES AS MEASURES
OF LANGUAGE PROFICIENCY AND PREDICTORS
OF ACADEMIC SUCCESS FOR ESL STUDENTS
PERMISSION TO REPRODUCE ANDDISSEMINATE THIS MATERIAL HAS
BEEN GRANTED BY
by
VIRGINIA LOUISE CHRISTOPHER
B.F.A., University of British Columbia, 1976
A THESIS SUBMITTED IN PARTIAL FULFILMENT OF
THE REQUIREMENT FOR THE DEGREE OF
MASTER OF ARTS
in
THE FACULTY OF GRADUATE STUDIES
(Department of Language Education)
1
TO THE EDUCATIONAL RESOURCESINFORMATION CENTER (ERIC)
U.S. DEPARTMENT OF EDUCATIONOffice of Educational Research and Improvement
EDUCATIONAL RESOURCES INFORMATIONCENTER (ERIC)
his document has been reproduced asceived from the person or organization
originating it.
Minor changes have been made toimprove reproduction quality.
Points of view or opinions stated in thisdocument do not necessarily representofficial OERI position or policy.
We accept this thesis as conforming
to the required standard
THE UNIVERSITY OF BRITISH COLUMBIA
December, 1993
(ZWIRGINIA LOUISE CHRISTOPHER, 1993
2 BEST COPY AVAILABLE
In presenting this thesis in partial fulfilment of the requirements for an advanced degree at the
University of British Columbia, I agree that the Library shall make it freely available for
reference and study. I further agree that permission for extensive copying of this thesis for
scholarly purposes may be granted by the Head of my Department or by his or her
representatives. It is understood that copying or publication of this thesis for financial gain shall
not be allowed without written permission.
Department of
The University of British Columbia
Vancouver, Canada
Date
j
(Signature)
iv
TABLE OF' CONTENTS
Page
ABSTRACT ii
TABLE OF CONTENTS iv
LIST OF TABLES vii
LIST OF FIGURES viii
ACKNOWLEDGEMENTS ix
CHAPTER I. INTRODUCTION 1
Background of the Study 1
Development of the Problem 3
Purpose of the Study 5Definition of Terms 6Summary and Preview 9
CHAPTER II. REVIEW OF THE LITERATURE 11
Introduction 11
Direct and Indirect Language Tests 11
Alternatives for Assessing Writing 16
Predicting Academic Success 21
Academic Criteria for Successful Writing 21
GPA as a Measure of Academic Success 24Placement Test Scores as Predictors of Success 27
Summary 29
CHAPTER BT. METHODOLOGY 32
Design 32The Setting 33The Subjects 36Data Collection Procedures 36Measures 37
Indirect 37Direct 38
L"V 4
TABLE OF CONTENTS (cont'd)
V
Page
Grade Point Average 40Academic Credit 43
Hypotheses 43Data Analysis 45
Correlational Analysis 46Multiple Regression Analysis 47Summary 47
CHAPTER IV. RESULTS AND DISCUSSION 48
Introduction 48Hypotheses 1 and 2 49
Secondary Students 51University Students 52
Hypotheses 3 and 4 54Secondary Students 57University Students 58
Hypotheses 5 and 6 59Secondary Students 61
University Students 62Discussion 63
Hypotheses 1, 2, 3 and 4 63University Students 63Secondary Students 64
Hypotheses 5 and 6 66University Students 66Secondary Students 66
Summary 68
CHAPTER V. SUMMARY, CONCLUSIONS AND IMPLICATIONSOF THE RESEARCH 69
Introduction 69Summary of Results 69Conclusions and Implications 71
Secondary Students 71University Students 72
Limitations of the Study 74Validity of the In-House Holistic Grading System 74
TABLE OF CONTENTS (cont'd)
vi
Page
Influence of the Setting on the Academic Performance ofSecondary Students 75The Length of the Study 75
Extension of the Research 76Summary 77
_ REFERENCES 79
APPENDIX A: Test of Written English (TWE) Scoring Guide 83
APPENDIX B: Letter of Permission 85
APPENDIX C: English Placement Information 86
APPENDIX D: Conversion Table: GPA to Percentages 87
APPENDIX E: Conversion Table: Direct Test Scores to Percentages 88
APPENDIX F: Data for In-house Direct Test 89
APPENDIX G: Data for TOEFL Test of Written English 90
APPENDIX H: Data for Secondary Students 91
APPENDIX I: Data for University Students 93
vu
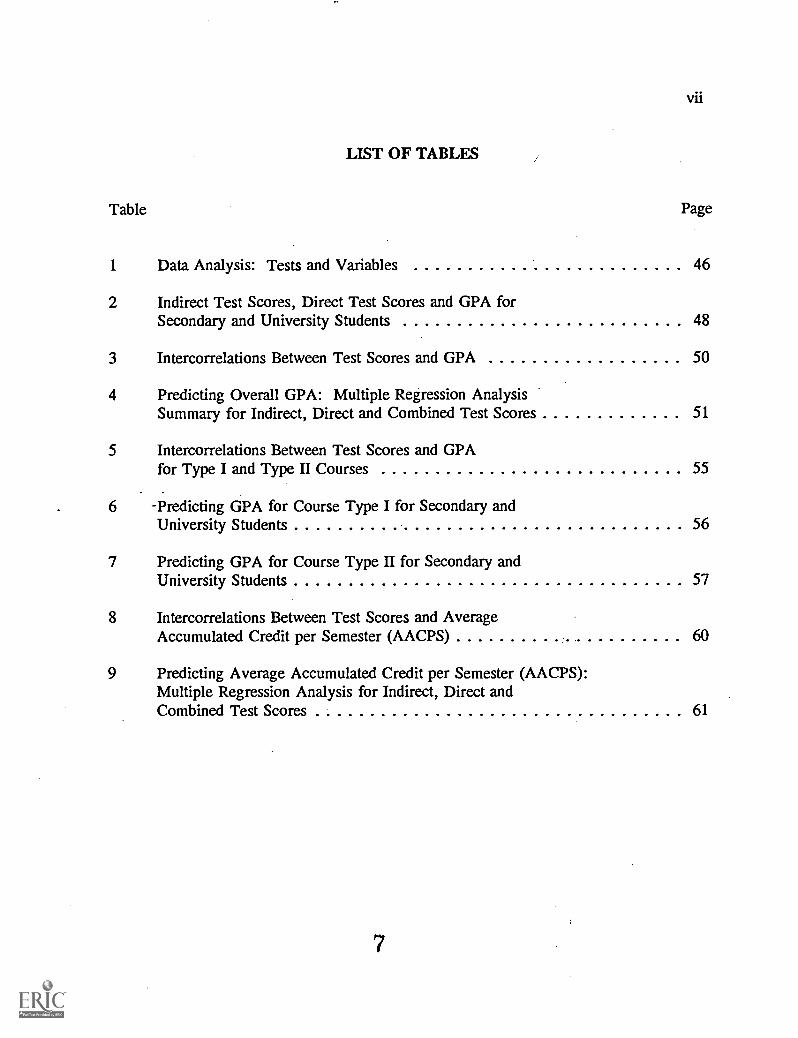
LIST OF TABLES
Table Page
1 Data Analysis: Tests and Variables 46
2 Indirect Test Scores, Direct Test Scores and GPA forSecondary and University Students 48
3 Intercorrelations Between Test Scores and GPA 50
4 Predicting Overall GPA: Multiple Regression AnalysisSummary for Indirect, Direct and Combined Test Scores 51
5 Intercorrelations Between Test Scores and GPAfor Type I and Type H Courses 55
6 -Predicting GPA for Course Type I for Secondary andUniversity Students 56
7 Predicting GPA for Course Type II for Secondary andUniversity Students 57
8 Intercorrelations Between Test Scores and AverageAccumulated Credit per Semester (AACPS) 60
9 Predicting Average Accumulated Credit per Semester (AACPS):Multiple Regression Analysis for Indirect, Direct andCombined Test Scores 61
7
viii
LIST OF FIGURES
Figure Page
1 Academic Programs and Placement Test Score Requirements 35
2 Letter Grades, Percentages, and GPA Points for Secondaryand University Programs 42
ix
ACKNOWLEDGEMENTS
There are several people who were instrumental in helping me complete this study. I
would like to thank Columbia College for allowing me to conduct the research at the
College, and for encouraging me in many ways. I also wish to extend my thanks to the
members of my thesis committee: Dr. Bernard Mohan, Dr. Lee Gunderson, Dr. Steven
Carey and, in particular, Dr. Richard Berwick, who provided invaluable advice and guidance
through the many revisions the work required. Finally, and most importantly, I extend my
most heartfelt gratitude to my family and friends. I am especially thankful to my two
daughters, Vanessa and Alexandra, who accepted responsibility beyond their years, and
whose unfailing patience provided me with motivation and encouragement.
1
CHAPTER I. INTRODUCTION
BACKGROUND OF THE STUDY
Interest in this study grew out of the practical experience of testing ESL students
entering college and secondary programs, and placing them in appropriate classes on the
basis of test results. This study explores the problem of maldng correct placement decisions
when the results of two tests suggest different placement levels. Extensive research on
testing has addressed the important issues of test validity and reliability, and the uses to
which test results are put (Brown, 1989; Carroll, 1965; Cervenka, 1978; Cumming, 1989;
Johns, 1981; Graham, 1987; Hanania and Shikhani, 1986; Jenks, 1987; Raimes, 1990). Still
lacking, though, is research addressing the problem of maldng placement decisions on the
basis of results of two tests whose scores do not concur.
ESL proficiency tests take many forms. Placement tests most widely-used for
college-level students in ESL classes are objective, multiple-choice tests with vocabulary,
grammar, and reading comprehension sections; some include a listening component. Most
academic programs administer a writing test, and some, a listening /speaking test. Test
results are used to place students in programs and in levels within programs, and are
sometimes used in the prediction of academic success. Researchers and practitioners alike
often question the ability of these kinds of tests to accurately measure the language ability
of ESL students and assist placement decisions.. Results from two different tests may
indicate the same level of language proficiency, but there are many cases in which they do
not. In these cases, testing and placement personnel are faced with making the difficult
10
2
decision as to which test results most accurately measure language proficiency, and should,
therefore, be the basis upon which placements are made.
Besides being used for placement purposes, language test results are often looked to
as predictors of academic success. Some test manuals clearly state that proficiency tests
should not be used for this purpose, since there are many other variables which affect
academic success (University of Michigan English Language Institute, 1977; Educational
Testing Service, 1990). Prediction studies, though, have been conducted by the test
designers themselves, a useful practice that is likely to continue. Research into how
academic success is measured and the predictive ability of test scores is also of relevance to
this study, and has been examined by Black (1991), Graham (1987) and others. Prediction
studies tend to use grade point average (GPA) as the sole measure of academic success. It
is the view of some researchers that the use of GPA as the only measure of academic success
is questionable for those ESL students whose level of language proficiency does not meet the
entry requirements of post-secondary institutions, most commonly, a TOEFL score of 550
(Light et al., 1987). One of the purposes of this study is to explore the usefulness of GPA
as a predictor of academic success for ESL students with various levels of language
proficiency, i.e., with TOEFL scores both above and below 550. GPA does not take course
load into consideration and thus excludes an important element in second-language learning,
namely, the time it takes to acquire the language skills required for academic study. The
difference between the language skills required for basic communication and those required
for academic study has been explored by Cummins (1979a) and others. The time necessary
to achieve a high level of proficiency in these two areas differs greatly. This fact has an
1.1
3
impact on the lives of ESL students enrolled in secondary and tertiary academic studies.
Expectations placed on ESL students as to the length of time deemed necessary to complete
a program of academic studies are often unrealistically short. Such expectations are created
with first-language students in mind, a group for which language proficiency is assumed.
ESL students are clearly at a disadvantage here, yet are measured by the same criteria as
first-language students.
DEVELOPMENT OF THE PROBLEM
The focus of this study is the prediction of academic success based on the results of
two types of tests.. For most students, placement test scores derived from two different tests
are typically interpreted as measuring a similar general level of language proficiency in that
they indicate the same placement level. For example, the scores of both an indirect test such
as the TOEFL, and a direct (writing) test may indicate that a student's language proficiency
is adequate for study at a first-year university level; the student is placed accordingly. In
these cases, placing students in appropriate programs or levels within programs poses few
problems for assessors. In a substantial number of cases, though, there is enough
discrepancy between the two measures' scores to indicate placement at different levels, or
in different programs. For example, an indirect test score such as a TOEFL or MTELP
score may be well above the minimum requirement for entry into a university program, but
a writing test score for the same student may indicate placement in a university preparatory
or ESL program. Assessors are presented with the problem of deciding which measure is
to be given more weight. In most cases, the student is given the benefit of the doubt, and
12
4
is placed according to the higher of the two scores. Instructors often question this practice.
There is controversy as to whether students placed in this way have problems maintaining
the expected level of performance the curriculum demands, and whether the students would
not have been more appropriately placed in the lower level as indicated by the lower test
score, particularly when the writing test score is the lower of the two. Research does not
indicate which score is a better predictor of academic success, that derived from an indirect
test or that derived from a direct (writing) test when there are discrepancies between these
scores. While most instructors know that no single score should be used as a basis for
placement, there is a special problem when discrepant scores are involved. Most instructors
also know that ESL students can become extremely proficient at test-taking through practice,
and that, indeed, many students take courses designed to maximize chances of achieving high
scores. Language proficiency test scores, then, may be more indicative of students' test-
taking skills than of their actual language proficiency. In addition, in a direct test, students
are required to demonstrate their practical knowledge of a language and are assessed on the
basis of that performance, but are not required to demonstrate a skill on an indirect test.
The difference between competence and performance raises the question of whether a test
assessing skill in using a language should be considered a more valid measure of language
proficiency than one assessing knowledge about a language.
A problem related to competence vs. performance pertains to the measurement of
academic success, and whether measures designed for first-language learners are appropriate
for second-language students. Throughout the literature, grade point average is used in most
prediction studies as the only dependent variable. A few researchers question the validity
5
of GPA as a measure of academic success, as it does not reflect the number of courses taken
(Black, 1991; Heil and Aleamoni, 1974). This study extends such research in including
average accumulated credit per semester (AACPS) as a measure of academic success. In
conjunction with GPA, this seems to be an appropriate approach to measuring the academic
success of ESL students, particularly until students are better able to compete with their
native English-speaking peers more fairly. The length of time required for achieving such
a level of proficiency would vary according to individual rates of acquisition of academic
language proficiency.
Research investigating the phenomenon of variable success rates by course type may
inform practice, particularly in the area of counselling and course planning. This study
explores this area by conducting prediction studies on two types of courses separated on the
basis of a) whether previous experience in the student's native language would be expected,
and b) the level of language proficiency required for successful completion of the course.
In particular, the study examines the ability of indirect and direct test scores to predict
academic success in each of the two course categories.
PURPOSE OF THE STUDY
The purpose of the study is to investigate whether indirect test scores or direct
(writing) test scores should be the deciding factor for placement purposes for students who
have discrepancies in these scores. In addition, the research carried out in the study provides
insight into the question of whether writing test scores give a clearer indication of academic
language proficiency than do indirect test results in terms of predicting academic success.
14
6
In order to accomplish this purpose, several hypotheses, as presented in Chapter III, were
tested; results are presented and discussed in Chapters IV and V.
DEFINITION OF TERMS
To ensure understanding of the terminology as it is used in the following chapters of
the study, the following definitions are included:
1. Direct tests/Writing tests: (These terms will be used interchangeably.) These are
tests which require students to perform an activity which demonstrates directly their
proficiency in the use of English. In this study the direct measure is a writing test. Essay
tests used as placement measures are usually graded in a holistic manner, using a criterion-
referenced scoring guide. An example is the Educational Testing Service's Test of Written
English (TWE).
2. Indirect tests/Objective tests: (These terms will be used interchangeably.) These are
tests which do not require students to perform an activity demonstrating their proficiency in
English. Instead, they test recognition of grammatically correct, standard English. These
tests usually consist of separate sections focusing on specific language sub-skills, contain
only multiple-choice items, and are graded objectively. Examples are the Test of English
as a Foreign Language (TOEFL), and the Michigan Test of English Language Proficiency
(MTELP).
3. Holistic Scoring: A composition evaluation process whereby raters grade texts as a
whole in an impressionistic manner; overall writing proficiency is assessed according to a
scoring guide by at least two raters. Sample papers displaying the range of possible scores
15
7
are used as reference points continually throughout the process.
4. Analytical Scoring: A composition evaluation process whereby various features of
the text are separated out and graded individually according to specific criteria. One or more
raters are used in this method of evaluation.
5. Diagnostic test: A test which isolates specific strengths and weaknesses of an
individual in some particular field of knowledge (Lien, 1967).
6. Proficiency test: A test which measures overall ability in English, independent of a
particular instructional program. Proficiency tests are often used to assess readiness to work
at a particular level of instruction.
7. Placement test: A test whose results determine readiness to work at a particular level
of instruction: Placement tests should test skills that will be used in the program of study
for which students are being tested. Proficiency tests are often used as placement tests.
8. Test reliability: The extent to which a test is dependable, stable and consistent, when
given to different people and/or administered on different occasions (Page and Thomas,
1977).
9. Inter-rater reliability: The tendency of a test to produce similar assessments by more
than one rater.
10. Intra-rater reliability: The tendency of test scores to be consistent for the same rater
on different administrations of the same instrument.
11. Test validity: The extent to which a given test is an appropriate measure of what it
was intended to measure (Page & Thomas, 1977).
12. Construct validity: The extent to which test performance can be interpreted in terms
16
8
of certain psychological constructs (Lien, 1967).
13. Content validity: The extent to which the content of a test is judged to be
representative of a larger domain of content (McMillan & Schumacher, 1989).
14. Concurrent validity: The extent to which test scores can be correlated with scores
from an existing instrument given at about the same time (McMillan & Schumacher, 1989).
15. Predictive validity: The extent to which scores from a test are correlated with future
behavior (McMillan & Schumacher, 1989).
16. Academic Success: The achievement (or non-achievement) of standards established
by academic institutions. This achievement is usually measured in terms of grade point
average (GPA).
17. Average accumulated credit per semester: The average number of course- credits
accumulated in a specified number of semesters at an academic institution.
18. Competence: Internalized rules about a language that are organized into a system
(Ellis, 1985). Includes the ability to recognize grammatically correct, standard English,
usually tested by indirect means (answering multiple-choice questions about written
English).
19. Performance: The actual use of a system of internalized rules about a language
(Ellis, 1985). Includes the ability to demonstrate knowledge of grammatically correct.
standard English by performing a skill or an activity e.g., writing an essay.
20. Course Type I: In this study, a category of courses for which previous experience
in a student's home country would not be expected, e.g., English Literature, Humanities.
21 Course Type II: In this study, a category of courses for which previous experience
17
9
in a student's home country would be expected, e.g., Mathematics, Sciences.
22. Cultural Literacy: Common knowledge or collective memory that allows for
communication within a culture. The knowledge assumed in public discourse. (Hirsch, Khett
& Trefil, 1988).
SUMMARY AND PREVIEW
This chapter has described the problem investigated in the study and the practical
experience from which interest in the problem arose. Several related issues in testing and
placement have been introduced. The research accomplished in this study will add to current
knowledge and should be directly applicable to the process of testing college and secondary
ESL students for plaCement purposes. Several studies in the area of language proficiency
testing and the measurement of academic success which are relevant to this study have been
introduced and the terms used in the study have been defined.
A brief description of the contents of the remaining four chapters follows:
Chapter II presents a review of related research in a) direct and indirect testing of language
proficiency, b) methods of assessing writing and c) measurement and prediction of academic
success. Chapter III presents six hypotheses to be tested, describes the methodology of the
study, the design, the subjects and the setting. The data collection procedures are included,
as well as the five measures used to assess the subjects' level of language proficiency and
degree of academic success. Chapter III also describes the two methods of data analysis
used. In Chapter IV, the results of the hypothesis-testing are reported. A discussion of
these results is presented for each hypothesis in turn. Chapter V draws conclusions from
18
10
the results of the hypotheses-testing and presents implications for practice in the area of
testing and placement. Suggestions for extension of the research are made and limitations
of the study are presented.
11
CHAPTER H. REVIEW OF THE LITERATURE
INTRODUCTION
This chapter presents research in the teaching of English as a second language that
has a bearing on the present study. The relevant literature has been divided into three
sections. First is research into testing, in particular studies on both indirect and direct
language tests and the differences in the way they measure language proficiency are
reviewed. The second section includes research into methods of assessing ESL writing,
focusing specifically on holistic grading and its validity and reliability. Finally, literature
concerning the measurement and prediction of academic success is discussed in three sub-
sections and related to the specific issue of the study, i.e., the predictive ability of direct and
indirect placement tests.
DIRECT AND INDIRECT LANGUAGE TESTS
Research on the testing and measuring of ESL students' language ability has raised
questions as to the validity and usefulness of the various types of tests used for placing
students in academic programs. Depending on the information administrators and teachers
want to obtain, four main types of tests are used: proficiency tests, achievement tests,
placement tests, and diagnostic tests. This study is concerned with the placement of
students, and since both placement and proficiency tests are used for this purpose, these are
the two types of tests which will be discussed.
The Test of English as a Foreign Language (TOEFL), a widely used, indirect,
20
12
objectively-scored measure of language proficiency, has been the subject of numerous studies
(Raimes, 1990; Light, Xu, and Mossop, 1987; Graham, 1987; Jacobs, Zinkgraf, Wormuth,
Hartfiel, and Hughey, 1981; Hanania and Shikhani, 1986; Brown, 1989, and others).
Besides testing listening comprehension, grammar, reading comprehension and vocabulary,
the TOEFL purports to measure writing ability indirectly, that is, it measures the abilities
which underlie the skill of writing by testing recognition of standard, formal English
(Educational Testing Service, 1990). Its recent supplement, the Test of Written English
(TWE), is instead, a direct measure of writing ability in that it rates students' actual
production. Students' essays are rated against a criterion-referenced scoring guide (Appendix
A). Sometimes placement decisions must be made based upon conflicting data from two test
sources, one assessing the ability to recognize standard, formal English, and one assessing
the ability to produce such English.
Raimes (1990) provides background on both TOEFL and TWE tests, relates them to
native-speaker tests and questions the need for both when each claims to test writing
proficiency. She makes recommendations regarding the uses of these tests, mentioning the
importance of the training of readers, an issue also discussed by Norton-Pierce (1992) and
Jacobs et al., (1981).
Norton-Pierce's (1991) review of the TWE describes the test as a complement to the
TOEFL and mentions the high inter-rater reliability achieved. This reliability is attributed
to the criterion-referenced scoring guide, which Norton-Pierce views as a major strength,
since it gives raters clear descriptions of ability at each level, focuses on meaning and gives
readers an opportunity to reward students for what they do well. Holistic assessment is
21.
13
contrasted with analytic scoring which, in its concern with discrete points of language usage,
often does not attend to the communicative aspects of writing. But the scoring guide's
neglect of the role of the reader/rater as partner in the communicative act of writing is noted
as a shortcoming of the TWE and it is compared to the British Council's English Language
Testing Service (ELT) scoring guide, which does include the reader as participant (Norton-
Pierce, 1981). Norton-Pierce concludes that the ultimate reliability of the TWE lies in the
strength of the reader-training program.
Jacobs (1981) is also concerned with the unreliability of essay-readers' evaluations,
and notes that differences in experience and academic background of essay readers result in
low inter-rater reliability. She quotes Harris (1977) who found that teachers, though ranking
content and organization as primary aspects to consi-der- in assessing composition, actually
rated essays according to mechanics and sentence-level errors. Conversely, Cooper (in
Cooper and Odell, 1987), maintains that high reliability can be achieved by adhering to a
holistic scoring guide. Brown and Bailey (1984), tested the reliability of a composition
scoring grid developed on the assumption that a precise and informative diagnosis of ESL
writing could be made by focusing raters' attention on specific criteria. These researchers
found that after subjecting outliers to a third reading, the level of inter-rater reliability fell
within acceptable limits. The system of using of a third reader for significantly differing
scores is also practised by the Educational Testing Service (ETS) in rating the TWE.
In addition to concern with the reliability of scoring grids, researchers are also
addressing the issue of the limitations of language proficiency tests and the use to which
results are put. Graham (1987) discusses the difference between measuring students'
22
14
recognition of standard English and their demonstrated use of it, and questions the
widespread expectation that placement/proficiency tests act as predictors of academic
success. Studies done by Farhady (1983) and Hanania and Shikhani (1986) show high
correlations between direct tests and indirect ones, that is, those demanding production or
use of the language. Others question the use of TOEFL or other indirect tests as placement
tools and indicate that measures assessing communicative competence would be more
appropriate, as these ask students to demonstrate the skill they will later be graded on in
their academic careers (Graham, 1987).
Perkins (1983) also compares direct and indirect methods of testing writing ability
and suggests that when scores on indirect tests and direct (writing) tests concur, indirect tests
are as valid as essays when used for placement purposes. The Perkins study, though, does
not include cases in which indirect and direct test scores do not concur. These cases are
central to this study.
Both Brown (1989) and Farhady (1982) deal with most tests' neglect of learner
differences and both recommend that tests be designed to suit the population to be tested.
Brown finds discrepancies between test results and actual progress and proposes that tests
be redesigned to reflect curricula. Farhady suggests that rather than relying on one
comprehensive test (such as TOEFL) as is the general practice, administrators should turn
to discipline-oriented measures. By this method of testing, communicative competence could
be taken into account for disciplines requiring a high level of linguistic ability, e.g., the
Humanities. A problem here is that students are usually required to take courses demanding
varying levels of language proficiency, from mathematics to literature. The difficulty in
23
15
creating a single test with the content validity required for the range of disciplines that exist
across the wide variety of programs available at most post-secondary institutions makes this
kind of testing impractical; students would likely have to write several tests. Though these
and other researchers believe that in-house placement and proficiency tests are appropriate,
as they are designed specifically for the population, curricula, and standards of a particular
school, many institutions rely on TOEFL- scores for reasons relating to cost and efficiency.
The TOEFL, with its comprehensive assessment and huge scale of administration in
approximately 170 countries and areas throughout the world (Davies and West, 1989),
remains an appealing placement measure for most academic institutions.
Also relevant to the study is research which questions just what language ability
encompasses and argues that writing proficiency is quite separate from- other language skills.
Farhady (1982) suggests that language is not a unidimensional phenomenon. In order for
tests to make adequate assessments, they must serve multiple purposes and attend to the
variability in students' language ability. Cumming (1989) proposes that writing expertise is
a specially developed intelligence and its cognitive characteristics can be applied across
languages. He views language proficiency as dependant upon a) the development of the
language faculty (a cognitive faculty separate from intelligence) and b) its operation within
the parameters of a code, that is, the ability of the language faculty to engage in
communication using previously set rules which organize sounds and symbols into oral or
written language. He argues that writing performance depends on the contribution of both
these factors. Cumming asserts that in academic settings where students are assessed through
writing, the distinctions between these two abilities should be made, and they should be
16
developed and measured separately. A test measuring writing ability, therefore, should be
used to place students in programs where their future grades will be based upon their writing
proficiency, as indirect test scores do not measure writing as a skill.
In relation to this study, the literature on ESL proficiency/placement testing seems
to suggest that indirect test scores should not be considered the most accurate indication of
language proficiency, particularly when there is a discrepancy between them and other scores
which have been shown to be valid measures of language proficiency (Graham, 1987;
Brown, 1989; Farhady, 1982). There is a general concern at the college level regarding
language proficiency tests and their appropriateness as placement and predictive instruments,
particularly in cases where there are discrepancies in scores wide enough to indicate different
placement levels for the same student. The research does not address the question of
whether a direct score is a better predictor of academic success than an indirect score when
the scores show wide discrepancies, an issue this study will address.
ALTERNATIVES FOR ASSESSING WRITING
Many researchers believe holistic grading of writing is valid, reliable, and a more
accurate measure than indirect evaluation. One of the purposes of this study is to test
whether holistic grading of a writing sample can provide a more accurate assessment for
placement purposes than indirect testing. Holistic grading of the direct test is performed by
experienced instructors involved in the placement process at the institution where the study
was conducted.
The topic of writing assessment at the classroom level has been studied extensively.
25.4
17
Many researchers agree that instructors' response to error in writing varies widely and is
often not effective as productive feedback for ESL learners. Hendrickson (1978), in an
historical treatment of studies of learner errors, reviews attitudes toward error correction and
suggests that a separation of error type into the categories of global and local would be
useful in determining which are more serious and which should be corrected first. He
denotes as global those errors which interfere with communication and as local those which
do not. The latter group consists of sentence-level, mechanical errors. Hendrickson argues
that an order of error correction should be established. Zamel (1985) agrees with this view.
In addition, Zamel asserts that most instructors' responses are inconsistent, imprecise, and
concerned with surface-level errors too early in the composition process. She cites Krashen
(1982) and supports his contention that production may be inhibited by the monitoring_of
output which is still in the developing stages. Zamel suggests that communicative
effectiveness would be better achieved by allowing students time to apply instructors'
responses and incorporate them into the text.
On the measurement of communicative effectiveness, Janopoulos (1989) studies the
extent to which holistic raters' comprehension of ESL students' texts affects scores. His
position is that judgements are made on the degree to which messages sent by the writer
correspond to those received by the reader. He uses recall protocols finding that holistic
raters do attend to meaning and can recall more content of the higher-quality texts (i.e.,
those that received higher scores) than they can cf the lower-scoring texts. Thus, holistic
assessment of writing appears to allow raters to attend to meaning, while analytic scoring
methods do not. As such, it is a more appropriate measure for academic writing, as
L 26,
18
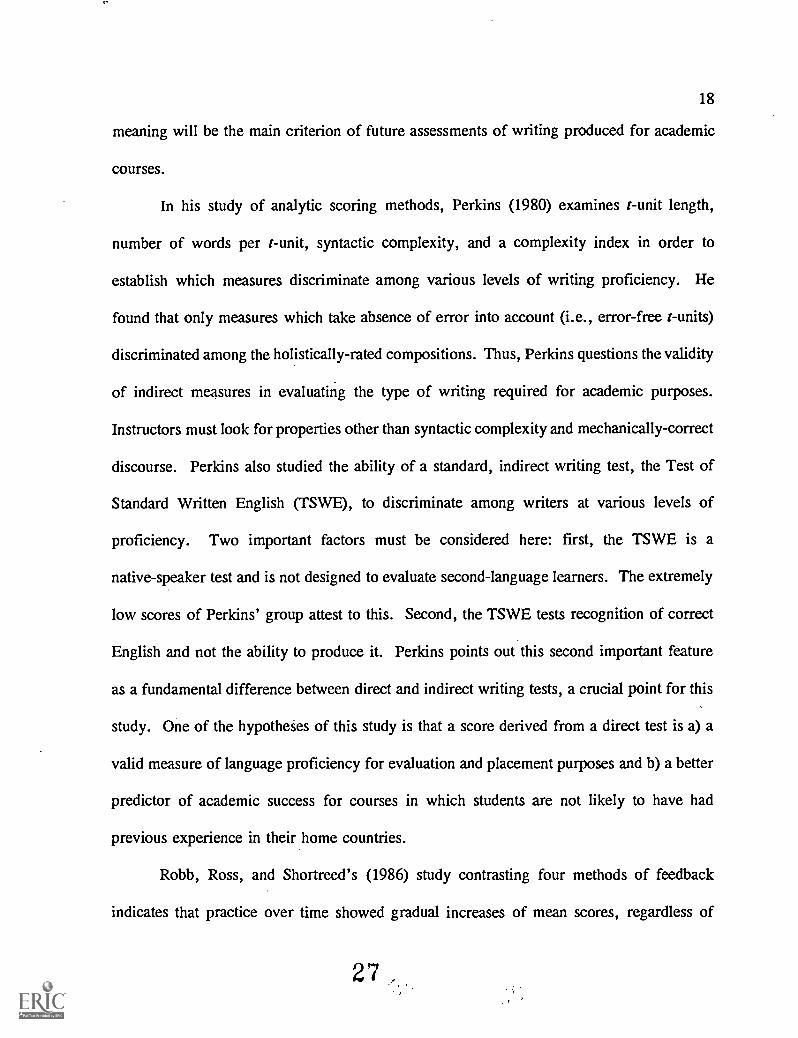
meaning will be the main criterion of future assessments of writing produced for academic
courses.
In his study of analytic scoring methods, Perkins (1980) examines t-unit length,
number of words per t-unit, syntactic complexity, and a complexity index in order to
establish which measures discriminate among various levels of writing proficiency. He
found that only measures which take absence of error into account (i.e., error-free t-units)
discriminated among the holistically-rated compositions. Thus, Perkins questions the validity
of indirect measures in evaluating the type of writing required for academic purposes.
Instructors must look for properties other than syntactic complexity and mechanically-correct
discourse. Perkins also studied the ability of a standard, indirect writing test, the Test of
Standard Written English (TSWE), to discriminate among writers at various levels of
proficiency. Two important factors must be considered here: first, the TSWE is a
native-speaker test and is not designed to evaluate second-language learners. The extremely
low scores of Perkins' group attest to this. Second, the TSWE tests recognition of correct
English and not the ability to produce it. Perkins points out this second important feature
as a fundamental difference between direct and indirect writing tests, a crucial point for this
study. One of the hypotheses of this study is that a score derived from a direct test is a) a
valid measure of language proficiency for evaluation and placement purposes and b) a better
predictor of academic success for courses in which students are not likely to have had
previous experience in their home countries.
Robb, Ross, and Shortreed's (1986) study contrasting four methods of feedback
indicates that practice over time showed gradual increases of mean scores, regardless of
27
43
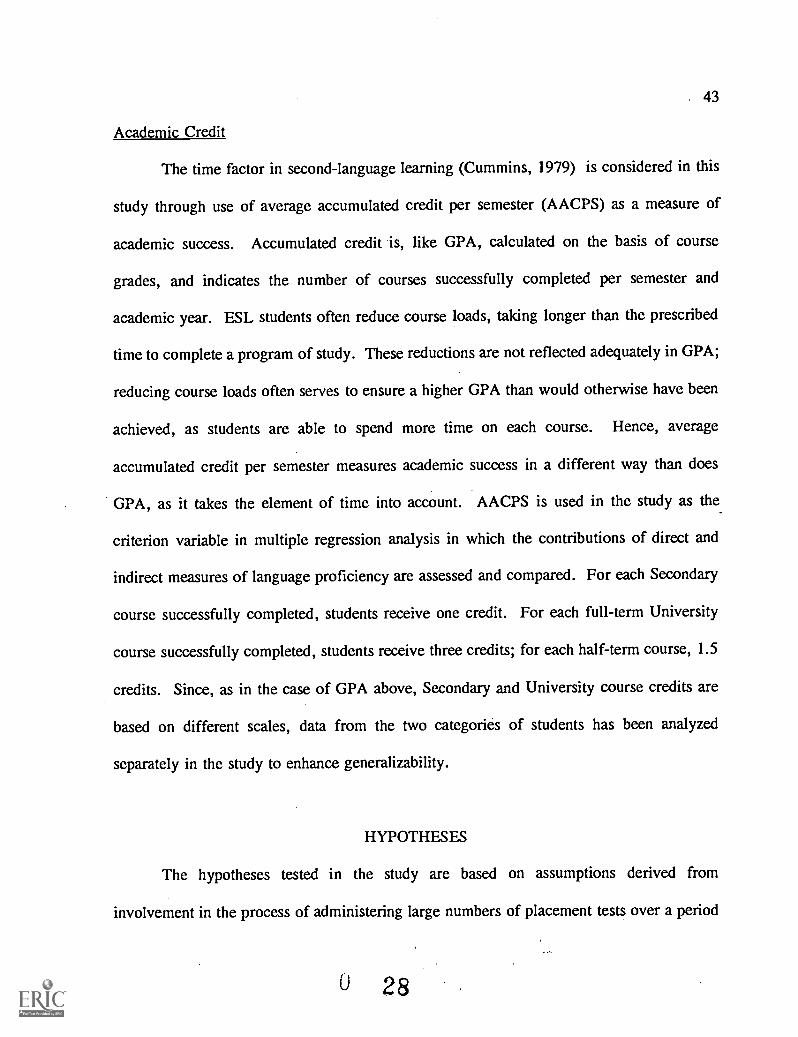
Academic Credit
The time factor in second-language learning (Cummins, 1979) is considered in this
study through use of average accumulated credit per semester (AACPS) as a measure of
academic success. Accumulated credit 'is, like GPA, calculated on the basis of course
grades, and indicates the number of courses successfully completed per semester and
academic year. ESL students often reduce course loads, taking longer than the prescribed
time to complete a program of study. These reductions are not reflected adequately in GPA;
reducing course loads often serves to ensure a higher GPA than would otherwise have been
achieved, as students are able to spend more time on each course. Hence, average
accumulated credit per semester measures academic success in a different way than does
GPA, as it takes the element of time into account. AACPS is used in the study as the
criterion variable in multiple regression analysis in which the contributions of direct and
indirect measures of language proficiency are assessed and compared. For each Secondary
course successfully completed, students receive one credit. For each full-term University
course successfully completed, students receive three credits; for each half-term course, 1.5
credits. Since, as in the case of GPA above, Secondary and University course credits are
based on different scales, data from the two categories of students has been analyzed
separately in the study to enhance generalizability.
HYPOTHESES
The hypotheses tested in the study are based on assumptions derived from
involvement in the process of administering large numbers of placement tests over a period
28
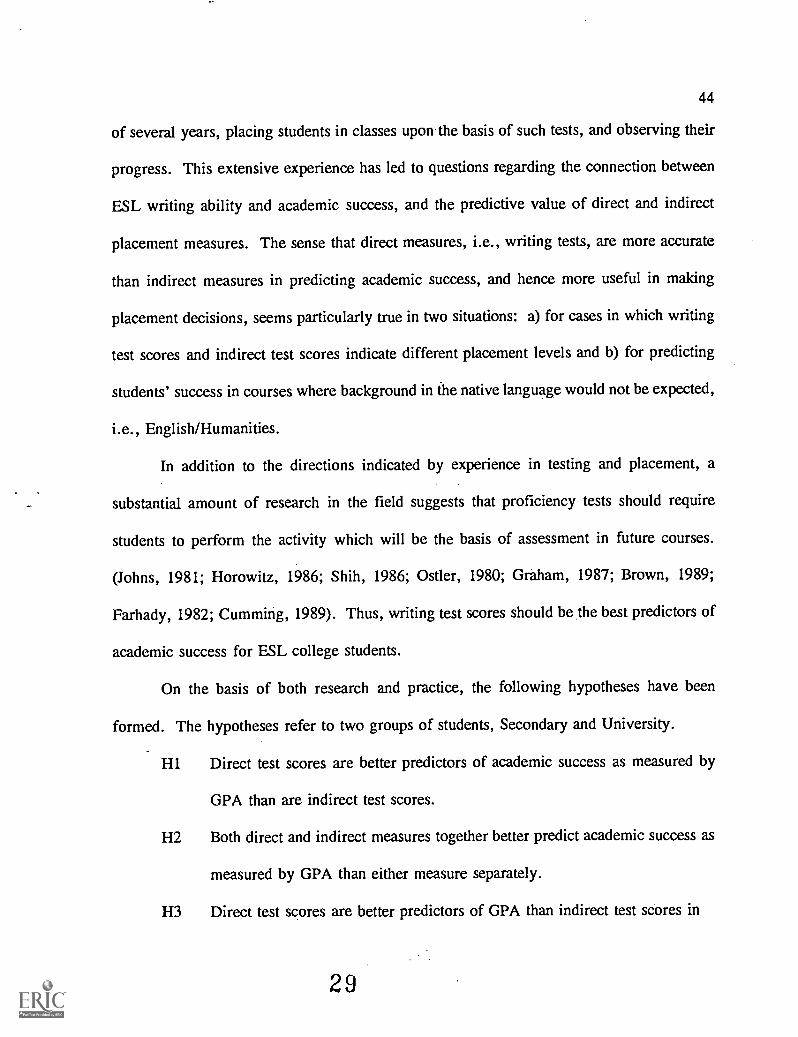
44
of several years, placing students in classes upon the basis of such tests, and observing their
progress. This extensive experience has led to questions regarding the connection between
ESL writing ability and academic success, and the predictive value of direct and indirect
placement measures. The sense that direct measures, i.e., writing tests, are more accurate
than indirect measures in predicting academic success, and hence more useful in making
placement decisions, seems particularly true in two situations: a) for cases in which writing
test scores and indirect test scores indicate different placement levels and b) for predicting
students' success in courses where background in the native language would not be expected,
i.e., English/Humanities.
In addition to the directions indicated by experience in testing and placement, a
substantial amount of research in the field suggests that proficiency tests should require
students to perform the activity which will be the basis of assessment in future courses.
(Johns, 1981; Horowitz, 1986; Shih, 1986; Ostler, 1980; Graham, 1987; Brown, 1989;
Farhady, 1982; Cumming, 1989). Thus, writing test scores should be the best predictors of
academic success for ESL college students.
On the basis of both research and practice, the following hypotheses have been
formed. The hypotheses refer to two groups of students, Secondary and University.
H1 Direct test scores are better predictors of academic success as measured by
GPA than are indirect test scores.
H2 Both direct and indirect measures together better predict academic success as
measured by GPA than either measure separately.
H3 Direct test scores are better predictors of GPA than indirect test scores in
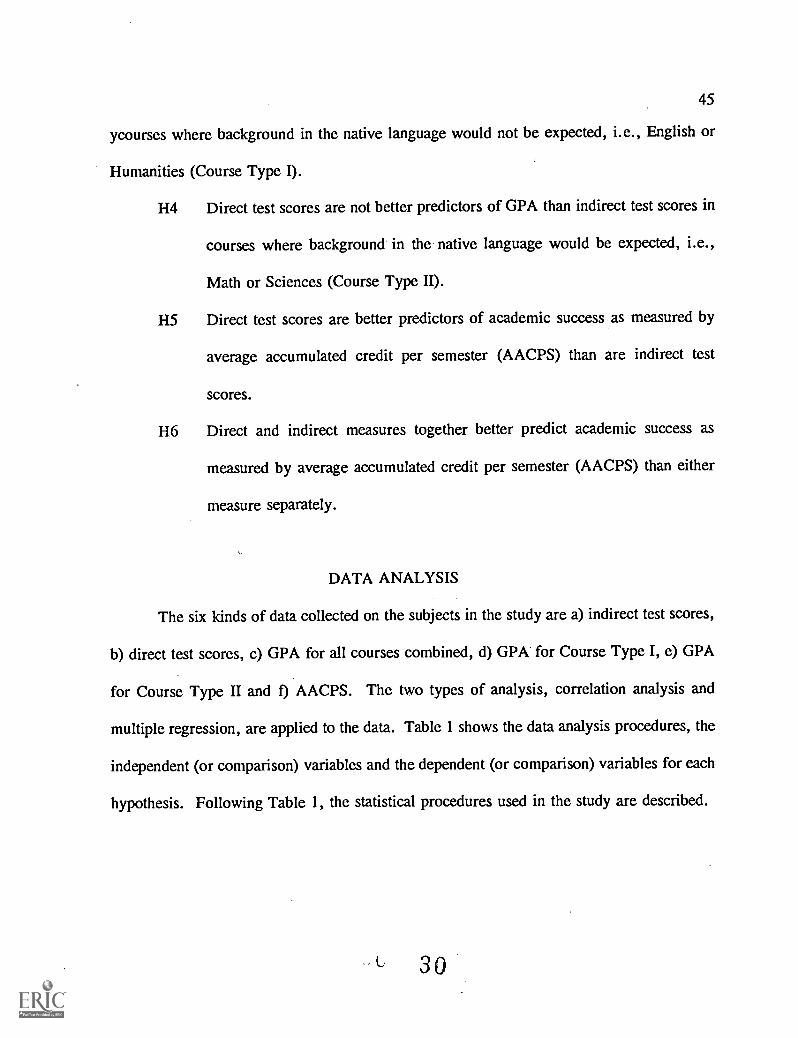
45
ycourses where background in the native language would not be expected, i.e., English or
Humanities (Course Type I).
H4 Direct test scores are not better predictors of GPA than indirect test scores in
courses where background in the native language would be expected, i.e.,
Math or Sciences (Course Type II).
H5 Direct test scores are better predictors of academic success as measured by
average accumulated credit per semester (AACPS) than are indirect test
scores.
H6 Direct and indirect measures together better predict academic success as
measured by average accumulated credit per semester (AACPS) than either
measure separately.
DATA ANALYSIS
The six kinds of data collected on the subjects in the study are a) indirect test scores,
b) direct test scores, c) GPA for all courses combined, d) GPA for Course Type I, e) GPA
for Course Type II and 0 AACPS. The two types of analysis, correlation analysis and
multiple regression, are applied to the data. Table 1 shows the data analysis procedures, the
independent (or comparison) variables and the dependent (or comparison) variables for each
hypothesis. Following Table 1, the statistical procedures used in the study are described.
L 3 0
46
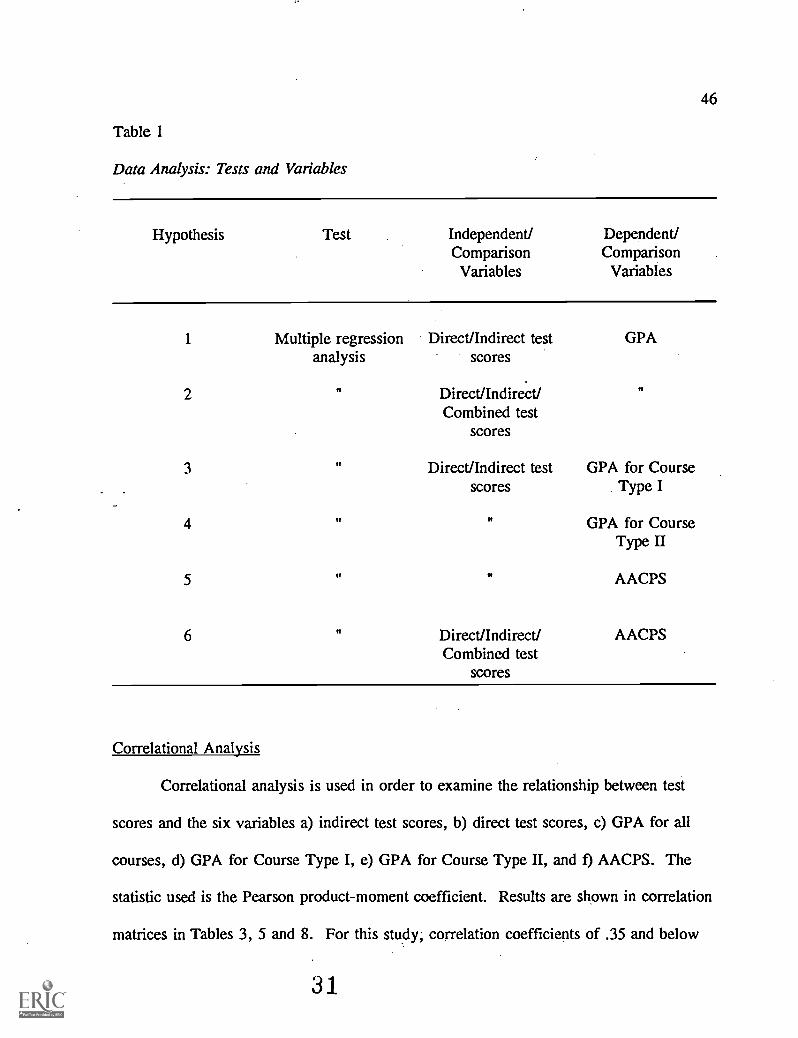
Table 1
Data Analysis: Tests and Variables
Hypothesis Test Independent/ Dependent/Comparison ComparisonVariables Variables
1 Multiple regressionanalysis
Direct/Indirect testscores
GPA
2 Direct/Indirect/Combined test
scores
3 Direct/Indirect testscores
GPA for CourseType I
4 GPA for CourseType II
5 AACPS
6 s, Direct/Indirect/Combined test
scores
AACPS
Correlational Analysis
Correlational analysis is used in order to examine the relationship between test
scores and the six variables a) indirect test scores, b) direct test scores, c) GPA for all
courses, d) GPA for Course Type I, e) GPA for Course Type II, and 0 AACPS. The
statistic used is the Pearson product-moment coefficient. Results are shown in correlation
matrices in Tables 3, 5 and 8. For this study, correlation coefficients of .35 and below
31
47
are to be considered low, those between .35 and .75 moderate, and those over .75 are to
be considered high (McMillan & Schumacher, 1989).
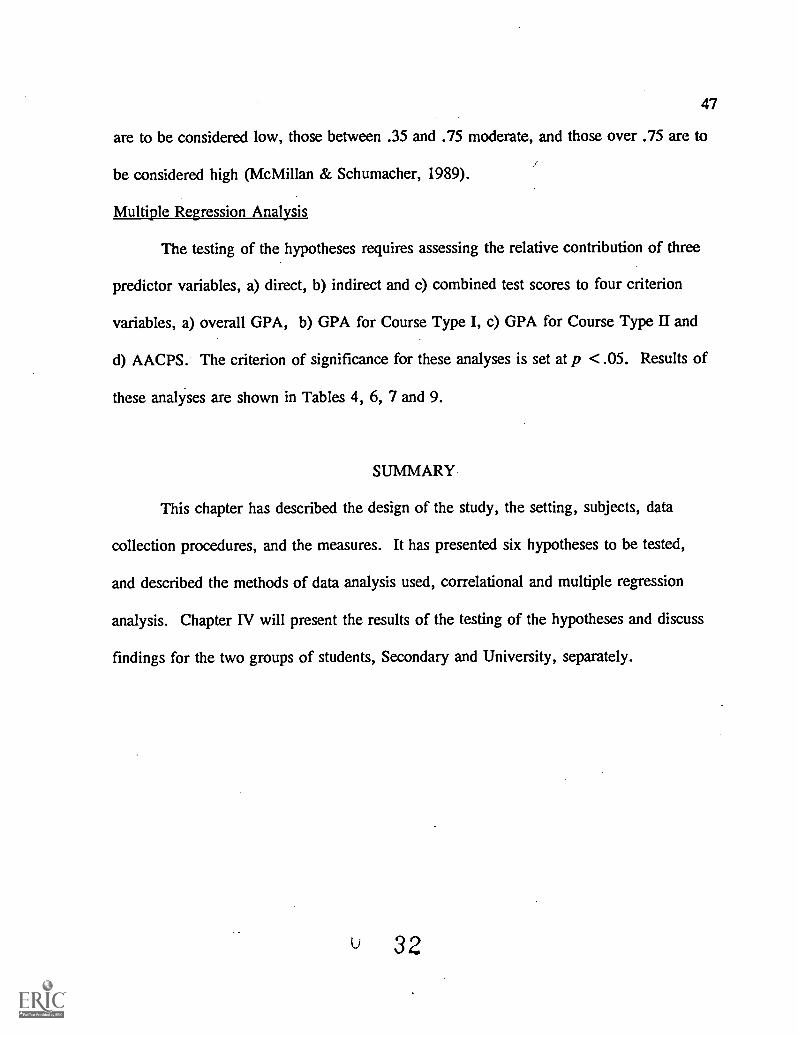
Multiple Regression Analysis
The testing of the hypotheses requires assessing the relative contribution of three
predictor variables, a) direct, b) indirect and c) combined test scores to four criterion
variables, a) overall GPA, b) GPA for Course Type I, c) GPA for Course Type II and
d) AACPS. The criterion of significance for these analyses is set at p < .05. Results of
these analyses are shown in Tables 4, 6, 7 and 9.
SUMMARY
This chapter has described the design of the study, the setting, subjects, data
collection procedures, and the measures. It has presented six hypotheses to be tested,
and described the methods of data analysis used, correlational and multiple regression
analysis. Chapter IV will present the results of the testing of the hypotheses and discuss
findings for the two groups of students, Secondary and University, separately.
32
48
CHAPTER IV. RESULTS AND DISCUSSION
INTRODUCTION
In this chapter, the subjects are further defined by their test scores and GPA
(Table 2), the six hypotheses to be tested are re-stated with results for each presented in
brief form in the next three sections. The final section of this chapter presents a more
extensive discussion of the results. Data pertaining to Hypotheses 1 and 2 are displayed
in Tables 3 and 4. Tables 5, 6 and 7 present results for Hypotheses 3 and -4, and Tables
8 and 9 show results for Hypotheses 5 and 6.
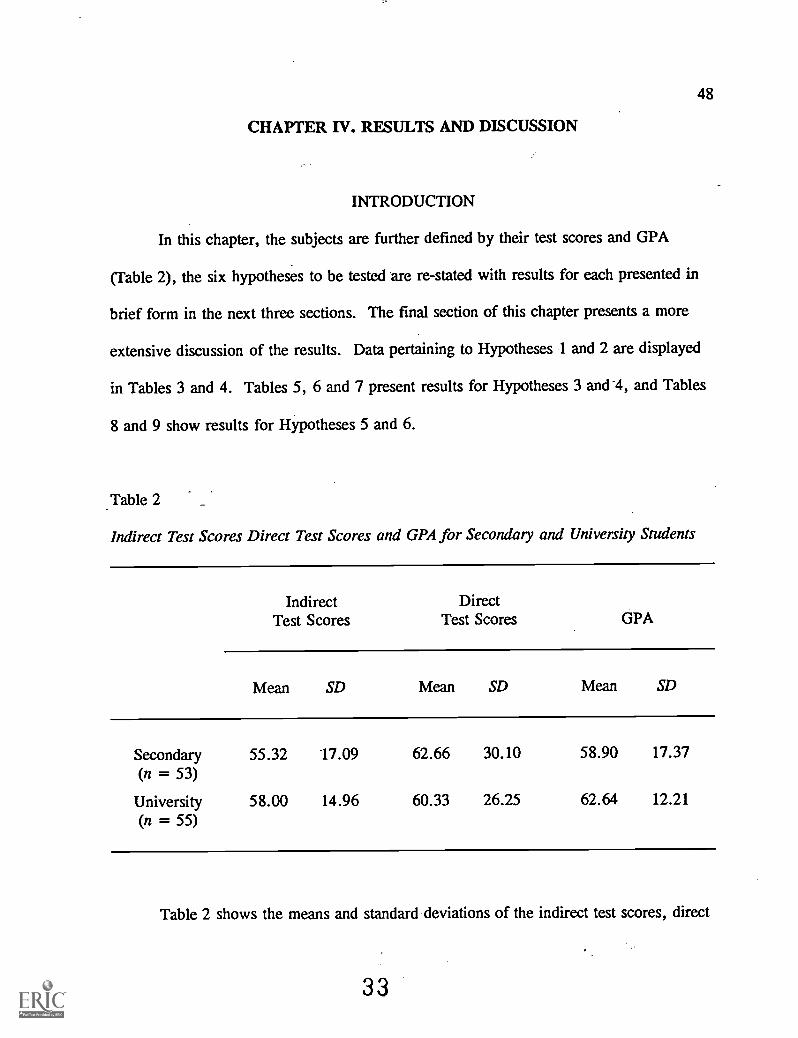
Table 2
Indirect Test Scores Direct Test Scores and GPA for Secondary and University Students
Indirect DirectTest Scores Test Scores GPA
Mean SD Mean SD Mean SD
Secondary(n = 53)
55.32 17.09 62.66 30.10 58.90 17.37
University(n = 55)
58.00 14.96 60.33 26.25 62.64 12.21
Table 2 shows the means and standard deviations of the indirect test scores, direct
33
49
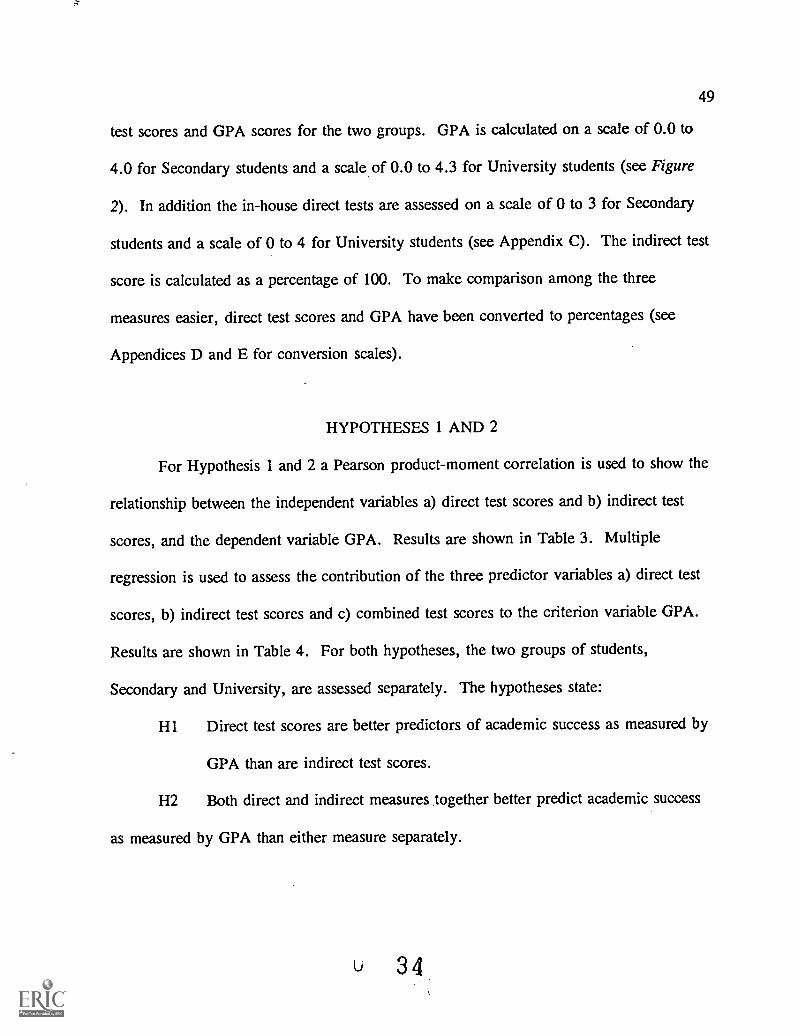
test scores and GPA scores for the two groups. GPA is calculated on a scale of 0.0 to
4.0 for Secondary students and a scale of 0.0 to 4.3 for University students (see Figure
2). In addition the in-house direct tests are assessed on a scale of 0 to 3 for Secondary
students and a scale of 0 to 4 for University students (see Appendix C). The indirect test
score is calculated as a percentage of 100. To make comparison among the three
measures easier, direct test scores and GPA have been converted to percentages (see
Appendices D and E for conversion scales).
HYPOTHESES 1 AND 2
For Hypothesis 1 and 2 a Pearson product-moment correlation is used to show the
relationship between the independent variables a) direct test scores and b) indirect test
scores, and the dependent variable GPA. Results are shown in Table 3. Multiple
regression is used to assess the contribution of the three predictor variables a) direct test
scores, b) indirect test scores and c) combined test scores to the criterion variable GPA.
Results are shown in Table 4. For both hypotheses, the two groups of students,
Secondary and University, are assessed separately. The hypotheses state:
H1 Direct test scores are better predictors of academic success as measured by
GPA than are indirect test scores.
H2 Both direct and indirect measures together better predict academic success
as measured by GPA than either measure separately.
Li 34
50
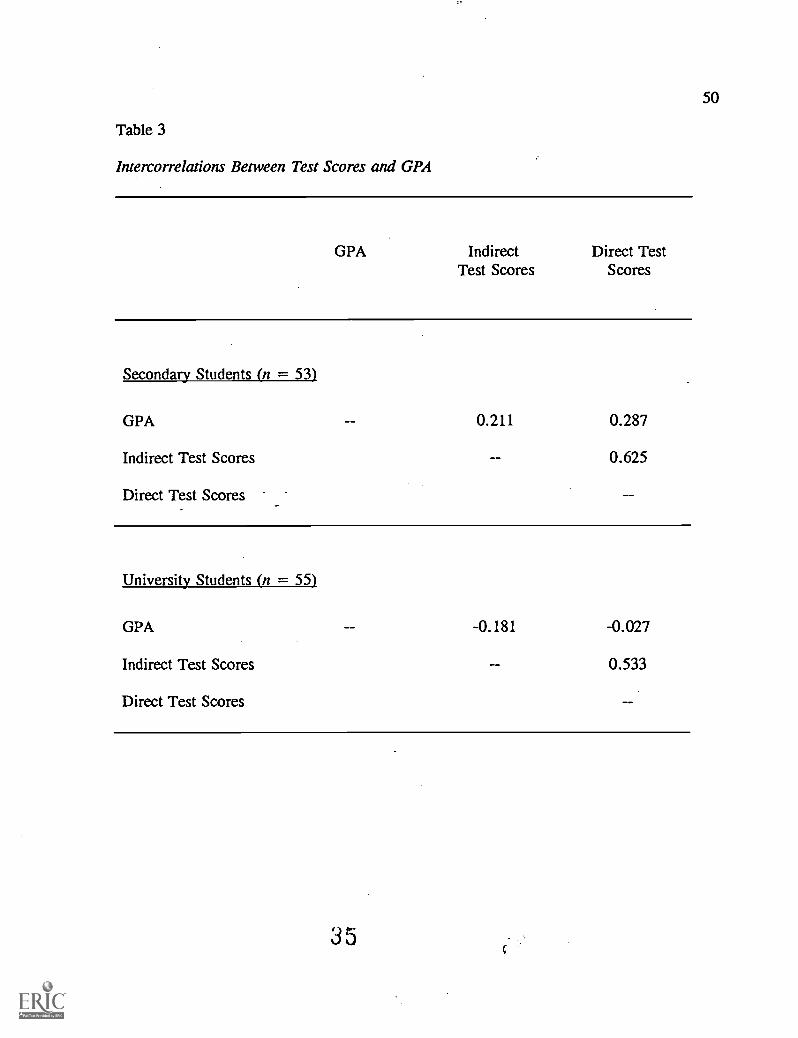
Table 3
Intercorrelations Between Test Scores and GPA
GPA Indirect Direct TestTest Scores Scores
Secondary Students (n = 53)
0.211 0.287
0.625
GPA
Indirect Test Scores
Direct Test Scores
University Students (n = 55)
-0.181 -0.027
0.533
GPA
Indirect Test Scores
Direct Test Scores
51
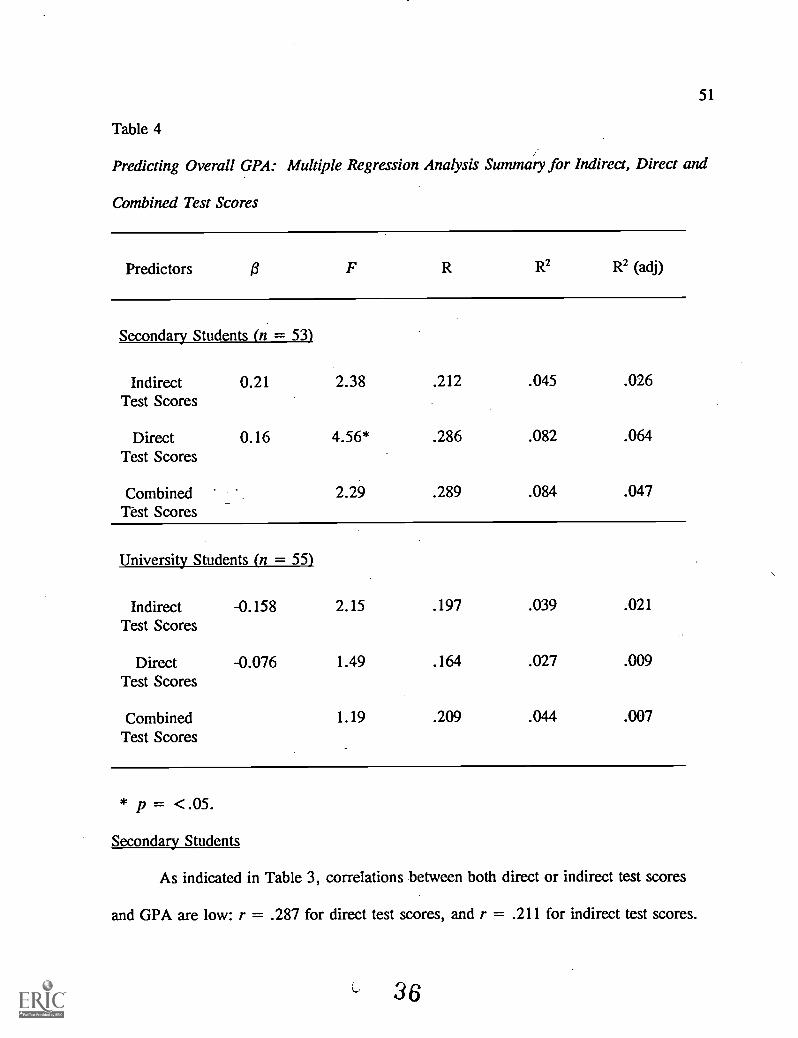
Table 4
Predicting Overall GPA: Multiple Regression Analysis Summary for Indirect, Direct and
Combined Test Scores
Predictors F R R2 R2 (adj)
Secondary Students (n = 53)
Indirect 0.21 2.38 .212 .045 .026Test Scores
Direct 0.16 4.56* .286 .082 .064Test Scores
Combined 2.29 .289 .084 .047Test Scores
University Students (n = 55)
Indirect -0.158 2.15 .197 .039 .021Test Scores
Direct -0.076 1.49 .164 .027 .009Test Scores
Combined 1.19 .209 .044 .007Test Scores
* p = <.05.
Secondary Students
As indicated in Table 3, correlations between both direct or indirect test scores
and GPA are low: r = .287 for direct test scores, and r = .211 for indirect test scores.
36
52
Results of the multiple regression analysis (Table 4) show that direct test scores
accounted for 6.4% of the variance in GPA, while indirect test scores accounted for
2.6%. Though the contribution of direct test scores was higher than that of indirect test
scores, neither score contributed a significant amount to GPA. These results do not
support Hypothesis 1, as they indicate that neither the direct nor indirect test scores
predicted GPA for Secondary students.
The results of the test of Hypothesis 2 show that direct and indirect measures
combined predicted academic success as measured by overall GPA better than indirect
test scores alone, but not better than direct test scores alone. As Table 4 indicates,
combined test scores accounted for 4.7% of the variance in GPA (F = 2.29, df = 52,
p = n.s.) and did not contribute significantly to the prediction of GPA. This contribution
is greater than the 2.6% accounted for by indirect test scores and the 6.4% accounted
for by direct test scores. Combined test scores proved not to be reliable predictors of
GPA for Secondary students, as so little of the variance was accounted for.
University Students
Results in Table 3 indicate that both direct and indirect test scores showed no
relationship between either indirect or direct test scores and GPA for University students
(r = -0.027 and r = -0.181 respectively). The findings of the multiple regression
analysis reported in Table 4 show that while the contribution of indirect and direct test
scores was similar (0.9% and 2.1% respectively), neither test score accounted for a
significant amount of the variance in GPA, and thus did not predict GPA. Thus, as for
53
Secondary students, Hypothesis 1 was not supported for University students. The results
of the multiple regression analysis conducted for Hypothesis 2 (Table 4) indicate that the
contribution of combined test scores was not significant (R2 adj = 0.7%). Thus,
Hypothesis 2 was not supported; combined test scores were not reliable predictors of
GPA.
It must be noted here that for further comparison, each of the two categories of
students, Secondary and University, were further divided into two sub-groups based on
discrepancies in their placement test scores for the purpose of comparing differences in
GPA between students with low writing test scores, and students with higher writing test
scores. The groups were characterized as follows:
Group A: Students whose indirect te-sticores indicated a placement of at least one
level higher than their direct test scores. Placement was made according to indirect test
scores.
Group B: Students whose direct test scores indicated a placement of at least one
level higher than their indirect test scores. Placement was made according to direct test
scores.
Though it was found that Secondary students in Group A (the lower writing test
scorers) had significantly lower GPA than those in Group B (the higher writing test
scorers), this division between groups could not be sustained for purposes of hypothesis-
testing for the balance of the study due to the unusually small number of subjects in
Group A Secondary (n = 6) and a wide standard deviation for the direct test scores. It
remains a point of interest, though, that the lower scorers on writing test among
38
54
University students (Group A) did not achieve a lower GPA than the higher writing test
scorers (Group B).
HYPOTHESES 3 AND 4
For Hypotheses 3 and 4, courses are separated into two categories, Type I and
Type II as previously described. Correlation matrices and a multiple regression analysis
reflecting these categories were produced for the Secondary and University students. The
dependent variable for Hypothesis 3 is GPA for Course Type I; for Hypothesis 4 it is
GPA for Course Type II. In both cases, the two independent variables are indirect test
scores and direct test scores.
- -
The hypotheses state: _
H3 Direct test scores are better predictors of GPA than indirect test scores in
courses where background in the native language would not be expected,
i.e., in English or Humanities (Course Type I).
H4 Direct test scores are not significantly better predictors of GPA than
indirect test scores in courses where background in the native language
would be expected, i.e., Math or Science (Course Type II).
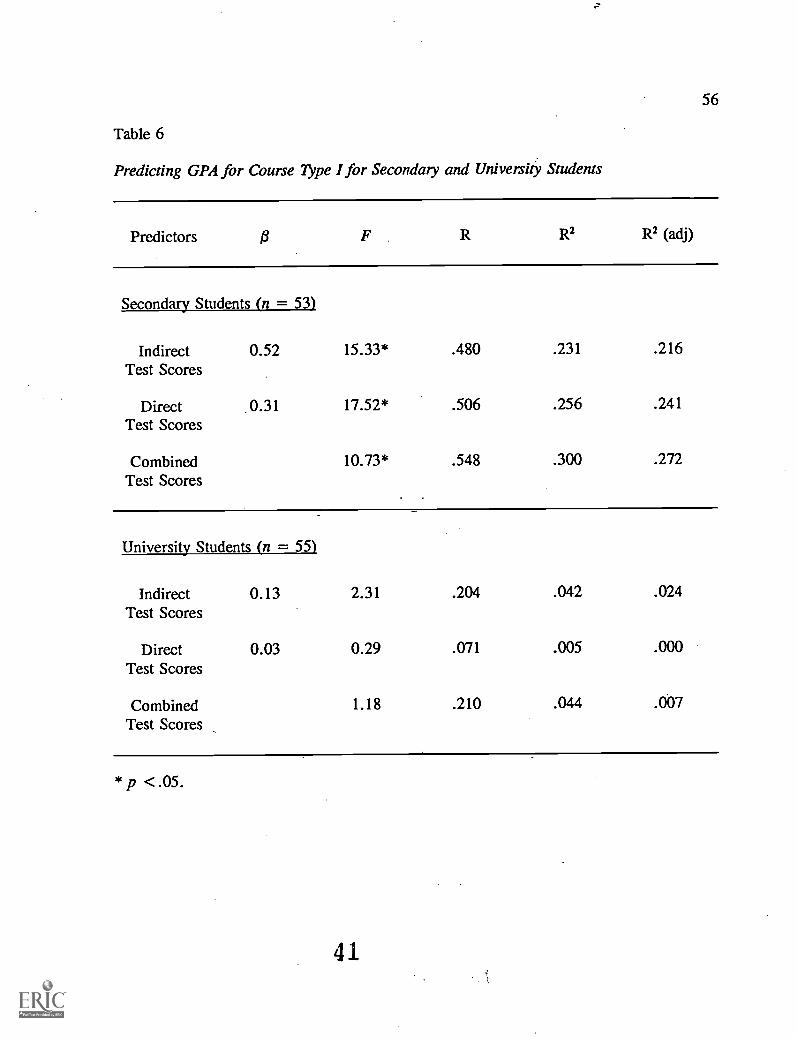
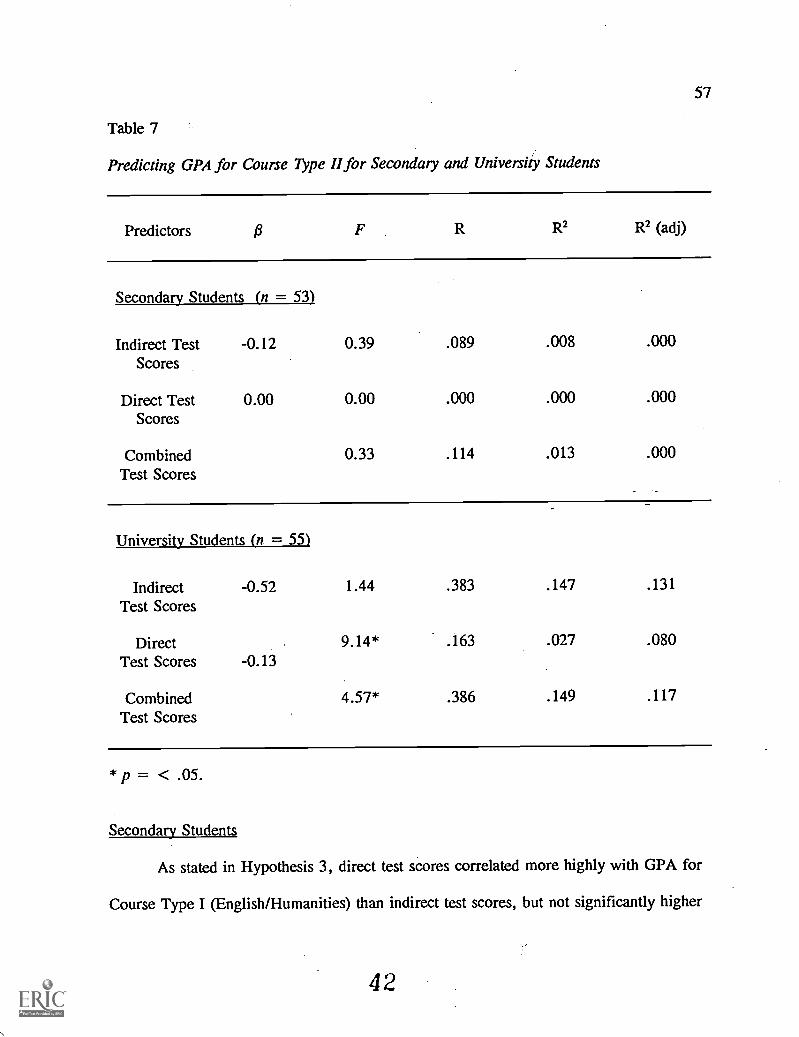
Table 5 shows the intercorrelations of GPA and test scores for Course Type I and
Course Type II for Secondary and University students. Table 6 indicates results of
multiple regression analysis for Course Type I for Secondary and University students,
and Table 8 shows results for Course Type II for both groups of students.
39
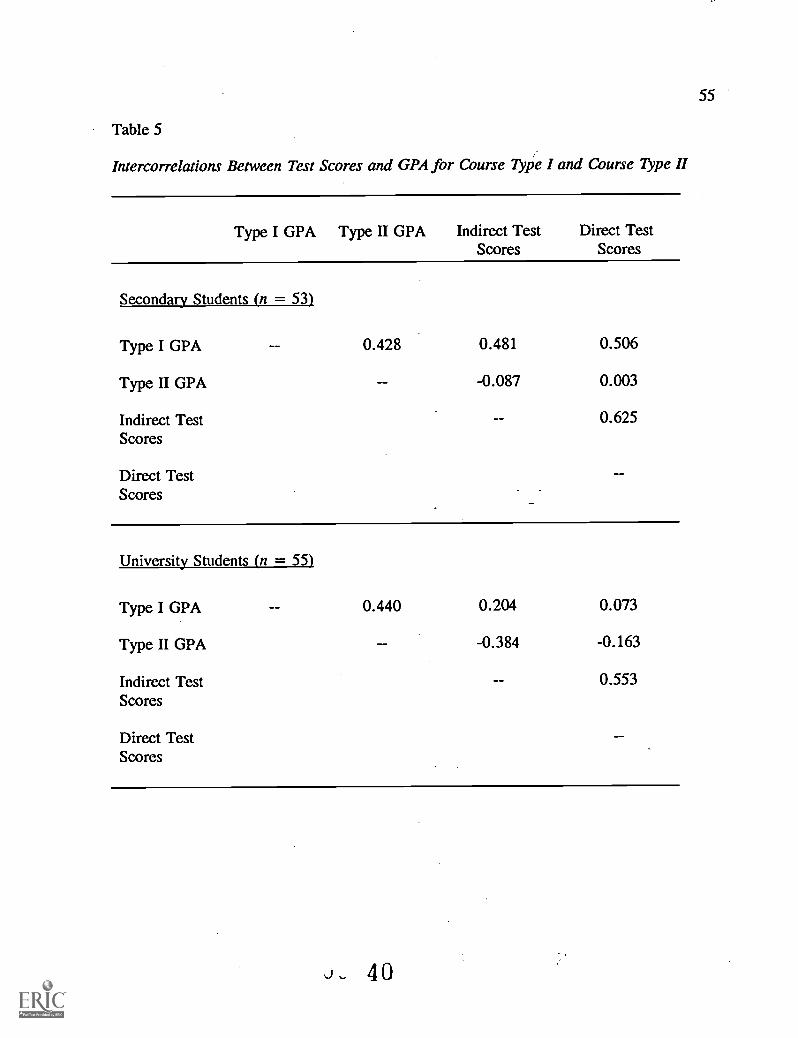
Table 5
55
Intercorrelations Between Test Scores and GPA for Course 7ype I and Course Type II
Type I GPA Type II GPA Indirect TestScores
Direct TestScores
Secondary Students (n = 53)
0.428 0.481
-0.087
0.506
0.003
0.625
Type I GPA
Type II GPA
Indirect TestScores
Direct TestScores
University Students (n = 55)
0.440 0.204
-0.384
0.073
-0.163
0.553
Type I GPA
Type H GPA
Indirect TestScores
Direct TestScores
40
56
Table 6
Predicting GPA for Course Type 1 for Secondary and University Students
Predictors 13 R R2 R2 (adj)
Secondary Students (n = 53)
Indirect 0.52 15.33* .480 .231 .216Test Scores
Direct 0.31 17.52* .506 .256 .241Test Scores
Combined 10.73* .548 .300 .272Test Scores
University Students (n = 55)
Indirect 0.13 2.31 .204 .042 .024Test Scores
Direct 0.03 0.29 .071 .005 .000Test Scores
Combined 1.18 .210 .044 .007Test Scores
*p <.05.
57
Table 7
Predicting GPA for Course 7)ipe II for Secondary and University Students
Predictors F R R2 R2 (adj)
Secondary Students (n = 53)
Indirect Test -0.12 0.39 .089 .008 .000Scores
Direct Test 0.00 0.00 .000 .000 .000Scores
Combined 0.33 .114 .013 .000Test Scores
University Students (n = 55)
Indirect -0.52 1.44 .383 .147 .131Test Scores
Direct 9.14* .163 .027 .080Test Scores -0.13
Combined 4.57* .386 .149 .117Test Scores
* p = < .05.
Secondary Students
As stated in Hypothesis 3, direct test scores correlated more highly with GPA for
Course Type I (English/Humanities) than indirect test scores, but not significantly higher
42
58
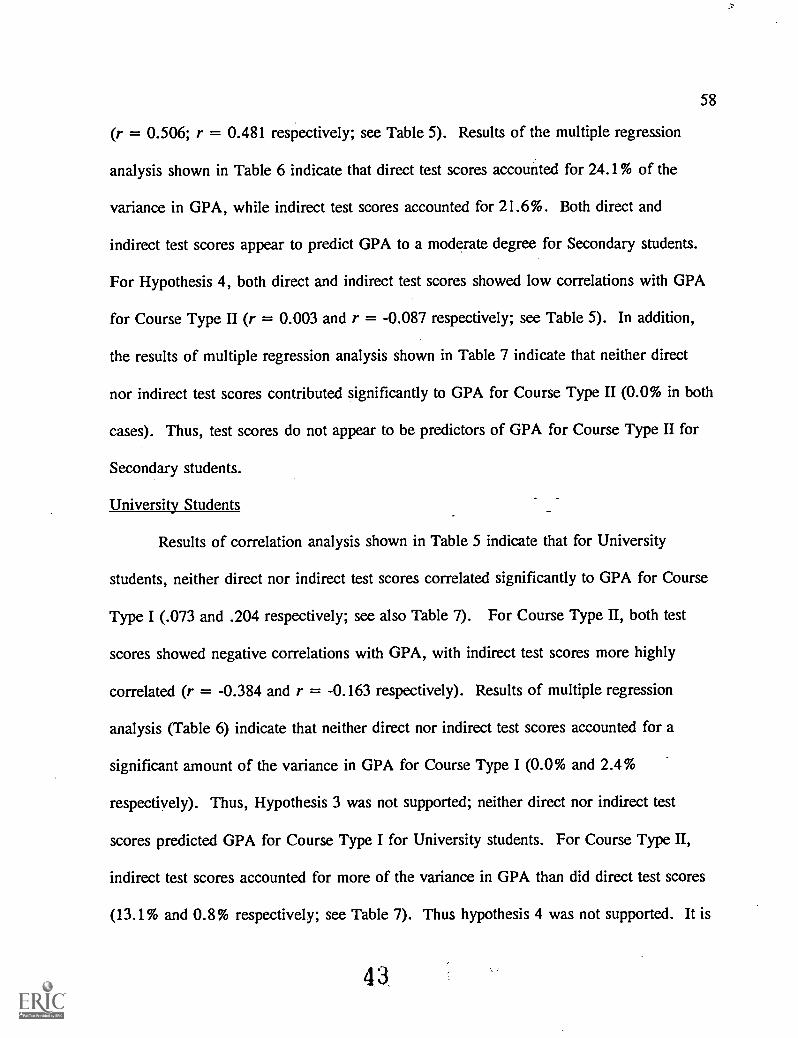
(r = 0.506; r = 0.481 respectively; see Table 5). Results of the multiple regression
analysis shown in Table 6 indicate that direct test scores accounted for 24.1% of the
variance in GPA, while indirect test scores accounted for 21.6%. Both direct and
indirect test scores appear to predict GPA to a moderate degree for Secondary students.
For Hypothesis 4, both direct and indirect test scores showed low correlations with GPA
for Course Type II (r = 0.003 and r = -0.087 respectively; see Table 5). In addition,
the results of multiple regression analysis shown in Table 7 indicate that neither direct
nor indirect test scores contributed significantly to GPA for Course Type II (0.0% in both
cases). Thus, test scores do not appear to be predictors of GPA for Course Type II for
Secondary students.
University Students
Results of correlation analysis shown in Table 5 indicate that for University
students, neither direct nor indirect test scores correlated significantly to GPA for Course
Type I (.073 and .204 respectively; see also Table 7). For Course Type H, both test
scores showed negative correlations with GPA, with indirect test scores more highly
correlated (r = -0.384 and r = -0.163 respectively). Results of multiple regression
analysis (Table 6) indicate that neither direct nor indirect test scores accounted for a
significant amount of the variance in GPA for Course Type I (0.0% and 2.4%
respectively). Thus, Hypothesis 3 was not supported; neither direct nor indirect test
scores predicted GPA for Course Type I for University students. For Course Type II,
indirect test scores accounted for more of the variance in GPA than did direct test scores
(13.1% and 0.8% respectively; see Table 7). Thus hypothesis 4 was not supported. It is
43.
59
noteworthy that indirect test scores were much better predictors than direct test scores for
Course Type II GPA, but since they did not account for a significant amount of the
variation in Course Type II GPA, they did not prove to be reliable predictors for
University students.
HYPOTHESES 5 AND 6
For Hypothesis 5 and 6, the relationship between the dependent variable, average
accumulated credit per semester (AACPS) and two independent variables, a) indirect test
scores and b) direct test scores is assessed. This relationship is measured by a separate
Pearson product-moment correlation for the two groups, Secondary and University. For
these hypotheses, multiple regression analysis is used to assess the contribution of three
predictor variables, a) indirect test scores, b) direct test scores and c) combined test
scores to the criterion variable, AACPS. Hypotheses 5 and 6 state:
H5 Direct test scores are better predictors of academic success as measured by
average accumulated credit per semester (AACPS) than are indirect test
scores.
H6 Both direct and indirect measures together better predict academic success
as measured by average accumulated credit per semester (AACPS) than
either measure separately.
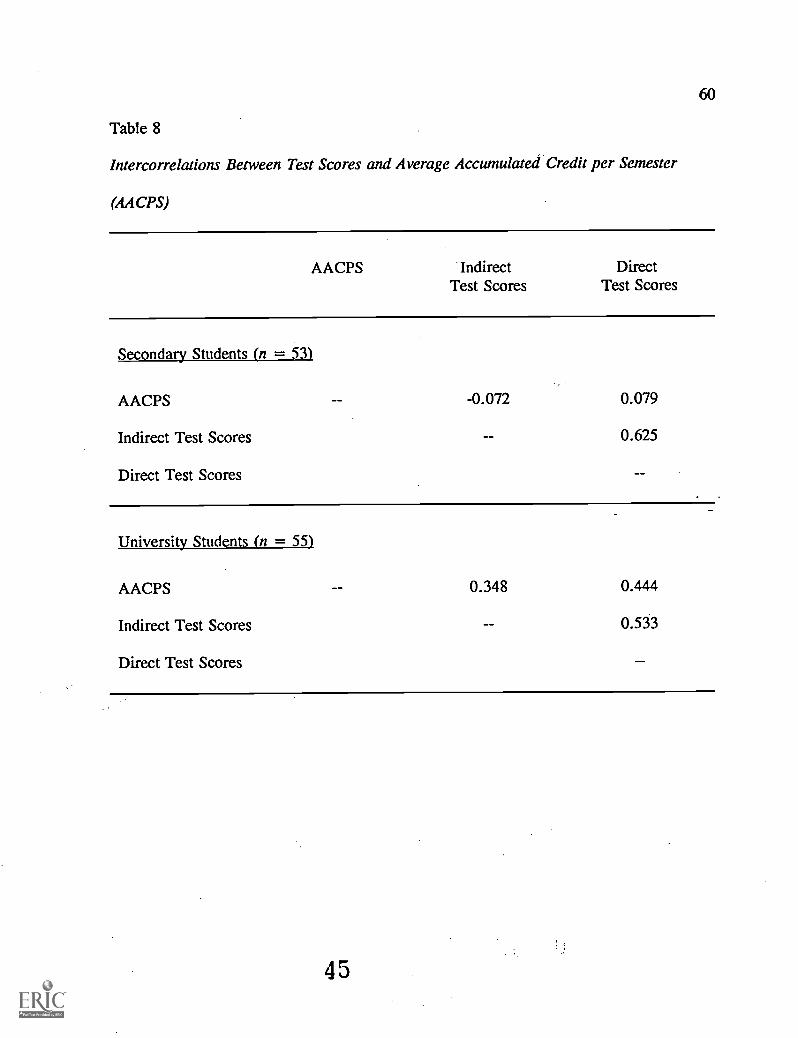
Results of the correlation analysis for these two hypotheses are shown in the
correlation matrices in Table 8. Table 9 shows the results of the multiple regression
analysis for the two hypotheses.
60
Table 8
Intercorrelations Between Test Scores and Average Accumulated Credit per Semester
(AACPS)
AACPS Indirect DirectTest Scores Test Scores
Secondary Students (n = 53)
AACPS -0.072 0.079
Indirect Test Scores 0.625
Direct Test Scores
University Students = 55)
AACPS 0.348 0.444
Indirect Test Scores 0.533
Direct Test Scores
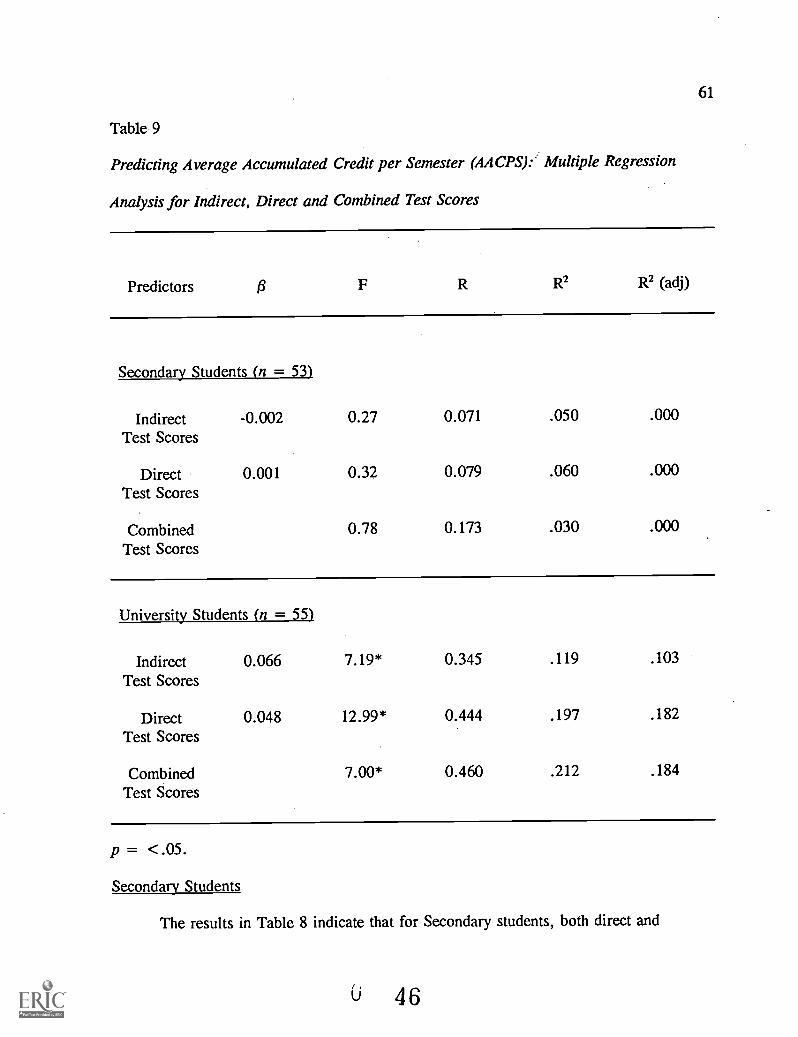
61
Table 9
Predicting Average Accumulated Credit per Semester (AACPS):' Multiple Regression
Analysis for Indirect, Direct and Combined Test Scores
Predictors 13 F R R2 R2 (adj)
Secondary Students (n = 53)
Indirect -0.002 0.27 0.071 .050 .000Test Scores
Direct 0.001 0.32 0.079 .060 .000Test Scores
Combined 0.78 0.173 .030 .000
Test Scores
University Students (n = 55)
Indirect 0.066 7.19* 0.345 .119 .103
Test Scores
Direct 0.048 12.99* 0.444 .197 .182Test Scores
Combined 7.00* 0.460 .212 .184
Test Scores
p = <.05.
Secondary Students
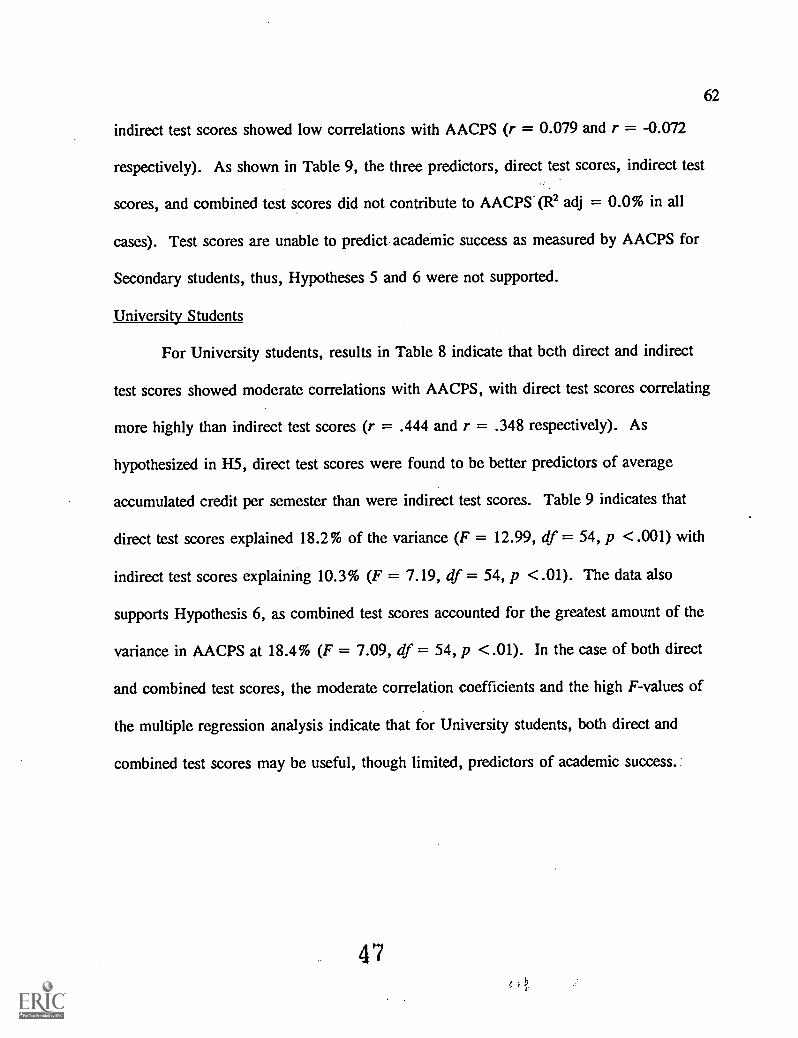
The results in Table 8 indicate that for Secondary students, both direct and
46
62
indirect test scores showed low correlations with AACPS (r = 0.079 and r = -0.072
respectively). As shown in Table 9, the three predictors, direct test scores, indirect test
scores, and combined test scores did not contribute to AACPS. (R2 adj = 0.0% in all
cases). Test scores are unable to predict academic success as measured by AACPS for
Secondary students, thus, Hypotheses 5 and 6 were not supported.
University Students
For University students, results in Table 8 indicate that bcth direct and indirect
test scores showed moderate correlations with AACPS, with direct test scores correlating
more highly than indirect test scores (r = .444 and r = .348 respectively). As
hypothesized in H5, direct test scores were found to be better predictors of average
accumulated credit per semester than were indirect test scores. Table 9 indicates that
direct test scores explained 18.2% of the variance (F = 12.99, df = 54, p < .001) with
indirect test scores explaining 10.3% (F = 7.19, df = 54, p < .01). The data also
supports Hypothesis 6, as combined test scores accounted for the greatest amount of the
variance in AACPS at 18.4% (F = 7.09, df = 54, p < .01). In the case of both direct
and combined test scores, the moderate correlation coefficients and the high F-values of
the multiple regression analysis indicate that for University students, both direct and
combined test scores may be useful, though limited, predictors of academic success.:
63
DISCUSSION
Hypotheses 1. 2. 3 and 4
University Students.
In the case of University students, overall GPA, GPA for Course Type I or GPA
for Course Type II were not predicted by either indirect or direct test scores. (This
finding was also supported by the comparison of GPA scores between lower writing test
scorers (Group A) and higher writing test scorers (Group B), in which higher scorers did
not achieve higher GPA.) Hypothesis 3, stating that direct test scores would predict GPA
for Course Type I (English/ Humanities), was unsupported. Thus, factors other than
language proficiency may have contributed to GPA for these students. There may be
several reasons why GPA was not predicted at all for the University students, but was
moderately predicted for Course Type I for Secondary students; some are included here.
First, more stringent academic expectations are placed on University students than on
Secondary students. For University level courses, the volume of content increases
dramatically over that of Secondary courses, and only some of the cognitive skills
required to process this input are measured by language proficiency tests. There are
higher expectations for University students to produce original ideas, and this ability is
better measured by direct tests than indirect tests. In addition, research has shown that
when grading, instructors put varying degrees of emphasis on the evidence of these ideas
as opposed to the linguistic fluency demonstrated in explaining them (Santos, 1988,
Sheory, 1986, Vann et al., 1984, and others). Perhaps instructors rate language fluency
48
64
above evidence of original ideas for Secondary students, but expect more originality from
University students. This variation in instructors' expectations could work in two
directions, which may further complicate prediction studies. If language proficiency is
not valued as highly as a) originality of ideas and b) ability to relate content to other
disciplines, then highly proficient writers could fare no better than those of lower
proficiency, as long as the lower group's writing skills were adequate to show evidence
of the more valued attributes i.e., a) and b) above. Thus, language proficiency appears
to be just one factor upon which academic success depends.
Also, in the category of Course Type I, English 101 is the only required course
for University students; choices are offered within the Humanities, and aptitude for and
interest in such elective courses would affect success. Since these attributes are not
measured by language proficiency tests, other types of studies would have to be designed
to test the contribution of such variables to GPA.
Finally, as is evidenced in the tests of Hypotheses 5 and 6, perhaps there are
other, more valid measures of academic success for University students. The use of GPA
as the sole measure does not take the important element of time into account. The tests
for Hypotheses 5 and 6 use AACPS as a criterion variable, and here, test results for
University students were quite different from results of the tests for which GPA was the
criterion variable.
Secondary Students.
For Hypotheses 1 and 2, multiple regression analyses revealed that writing scores
accounted for only 6.4% of the variance in overall GPA for Secondary students, with the
49
65
other two independent variables, indirect and combined test scores, accounting for even
less (see Table 4). It appears that overall GPA cannot be reliably predicted by placement
test scores for the students in the study. These findings indicate that there must be many
other factors that contribute to overall GPA, such as motivation, personal attributes, and
presence or absence of external pressures, among others. (It is interesting to note that for
Secondary students in the smaller comparison groups, lower writing test scorers (Group
A) achieved lower overall GPA than did higher writing test scorers (Group B).)
In light of the results for Hypotheses 1 and 2, the findings for Hypothesis 3,
which indicate that better writers achieve higher GPA for Course Type I
(English/Humanities), are of interest. For Hypotheses 3 and 4, courses were separated
into Type I (English/ Humanities) and Type II (Math/Sciences), as previously described.
Correlations and predictive ability of test scores and GPA for each course type were
measured separately. Here, GPA for Course Type I (English/Humanities) correlated
moderately to both direct and indirect test scores (see Table 5), while for Course Type II
(Math/Science) though, both test scores showed low correlations with GPA. In addition
results of multiple regression analysis shown in Tables 6 and 7 indicate that test scores
were moderate predictors of GPA for Course Type I, but did not predict GPA for Course
Type II. These findings indicate that for Secondary students, the use of GPA for Course
Type II decreases the ability of the test scores to predict overall GPA. That is, direct and
indirect test scores can be relied upon somewhat to predict GPA for courses in which a
higher level of language proficiency is required (English/Humanities), but when GPA is
included for courses in which language proficiency is less important (Math/ Science),
66
predictive ability of the test is weakened.
,Hypotheses 5 and 6
University Students.
For University students, results of tests for Hypotheses 1, 2, 3, and 4 show that
academic success as measured by GPA was not predicted by any of the independent
variables. But tests for Hypotheses 5 and 6 showed that academic success as measured
by (AACPS) was predicted moderately well by two of the independent variables. Both
direct and combined test scores predicted academic success by this measure moderately
well: R2 adj = 18.2% and 18.4% respectively (see Table 9). The fact that GPA was not
predicted for University students but average credit per semester was, raises the question
of just what constitutes academic success, and what the criteria for its measurement
should be. As discussed by Black (1991), Graham (1987), Light et al. (1987), and
others, the element of time is not taken into consideration in the conventional practice of
using GPA as the criterion by which academic success is measured. The strategy in
which students use withdrawal from and repetition of courses to increase GPA may help
to explain these results. Thus, despite the fact that test scores did not predict success by
the criterion of GPA, they did predict moderately well for AACPS.
Secondary Students.
For Secondary students, none of the independent variables predicted academic
success as measured by average accumulated credit per semester. This finding differed
from the results for University students, where direct and combined test scores predicted
success as measured by this criterion variable moderately well. Some possible reasons
51
67
for the different results for Secondary and University students are included here.
Students must have the opportunity to make adjustments to course load in order
for average accumulated credit per semester to be an effective measure of academic
success. Secondary students, though, are not allowed to withdraw from or repeat courses
in the same way University students are, and thus may carry courses in which they are
not faring well through to the end of the semester. Secondary programs are less flexible
than are University programs; there are 13 required courses and four academic electives
in the provincial Senior Secondary Program, while English 101 is the only required
course for University students. Also, Secondary students' perceptions of their progress in
courses may not be as accurate as that of the more mature University students and they
may stay in courses past the withdrawal deadline for this reason. For Secondary
students, time is of the essence, as they have a much longer academic road to travel to
graduation from university than do students already studying in the University program.
Thus, course withdrawal may not be as readily accomplished by Secondary students, even
if the option to do so were not so restricted.
The students in the study are from educational systems in which programs of
study are relatively rigid and are followed as prescribed. This previous academic
experience, along with their younger age, may hinder Secondary students' ability to
realistically assess their academic paths and the options open to them. Also, Secondary
students may be more reluctant to make changes to their programs, as most institutions
notify the parents of students under 19 years of age of any program changes including
repetition of and withdrawal from courses. Thus, students may be deterred from making
52
68
changes for fear of parents' disapproval.
The opportunity to use the strategy of adjusting course load, then, is not as
available to Secondary students as it is to University students due to the design of the
particular programs. This fact has an effect on the usefulness of average accumulated
credit per semester as a measure of academic success for Secondary students.
SUMMARY
This chapter presented results for the six hypotheses in tabular and discussion
form, then extended the discussion in subsequent sections. Though it was hypothesized
that direct test scores would be better indicators of academic success as measured by
GPA, this hypothesis was supported only for Secondary students in the case of Course
Type I (English/Humanities). It was not supported for University students for any course
type. The results also indicate that direct test scores are better predictors of AACPS than
GPA for University students, but that AACPS is not a useful measure at all for
Secondary students.
The following and final chapter will draw conclusions from the results and
examine implications of the research. It will also suggest directions for further research
and discuss the limitations of the study.
69
CHAPTER V:
SUMMARY, CONCLUSIONS AND IMPLICATIONS OF THE RESEARCH
INTRODUCTION
The main focus of the study was the question of whether writing test scores give a
more accurate indication of academic success than do indirect test scores. The study
investigated whether indirect or direct (writing) test scores should be the deciding factor for
placement purposes for students who have discrepancies in these scores. Based on the results
described in Chapter IV, some conclusions have been drawn that answer these questions to
a degree for the students in the study. Results are summarized below for each hypothesis,
and conclusions and implications of the study follow.
SUMMARY OF RESULTS
H1 As hypothesized for Secondary students, direct test scores were better predictors of
academic success as measured by GPA than were indirect test scores, but only marginally
so. Neither test score was found to be a reliable predictor (R2 adj = 6.4% and 2.6%
respectively). For University students, neither direct nor indirect test scores predicted GPA
(R2 adj = 0.9% and 2.1%).
H2 As hypothesized for Secondary students, direct test scores predicted academic success
as measured by GPA better than either indirect test scores or combined test scores, but only
marginally better (R2 adj = 6.4%, 2.6% and 4.7% respectively). Neither test score was
found to be a reliable predictor. For University students, combined test scores did not
54
70
predict GPA. (R2 adj = 0.7%).
H3 As hypothesized for Secondary students, direct test scores were better predictors than
indirect test scores of GPA for courses where background in the native language would not
be expected, i.e., English/ Humanities (Course Type I) (R2 adj = 24.1% and 21.6%
respectively). For the University students tested, neither direct nor indirect test scores
predicted GPA for this course type (R2 adj = 0.0% and 2.4% respectively).
H4 As hypothesized for Secondary students, direct test scores were not significantly
better predictors of GPA than indirect test scores where background in the native language
would be expected, i.e., Math/Sciences (Course Type II) (R2 adj = 0.0% for both kinds of
test scores). For University students, indirect test scores predicted GPA for Course Type
-H better than direct test scores ( R2 adj = 13.1% and 8.0% respectively) .
H5 For Secondary students, neither direct nor indirect test scores predicted academic
success as measured by AACPS (RZ adj = 0.0% for both kinds of test scores). But, as
hypothesized for University students, direct test scores were better predictors of AACPS than
indirect test scores (R2 adj = 18.2% and 10.3% respectively).
H6 For Secondary students, both direct and indirect test scores together were not better
predictors of academic success as measured by AACPS than either measure separately( R2
adj = 0.0%). For University students, direct test scores and both direct and indirect scores
combined predicted this measure of academic success equally well (R2 adj = 18.2% and
18.4% respectively).
71
CONCLUSIONS AND IMPLICATIONS
As can be seen above, not all of the hypotheses were supported for the students in
the study. Some conclusions that can be drawn from the results, and implications for
practice are elaborated below. Since results differed in some instances for Secondary and
University students, the two groups will be discussed separately.
Secondary Students
Writing scores as predictors of academic success are only reliable to a moderate
degree when predicting success for courses in which previous experience in the native
language would not be expected, such as English and Humanities. They are not reliable
predictors for courses in which students have accumulated considerable experience, such as
Math and Sciences, or when Course Types I and II are combined. Since courses of the first
type also require a higher level of language proficiency than do those of the second type, it
may be reasonable to conclude that writing proficiency does indicate how well students will
do in more linguistically demanding courses. A direction for practice here may be that
students with lower writing scores could be counselled into courses with less demanding
language proficiency requirements for as long as possible, while providing writing tutorial
classes. An important implication that may be drawn from these results for testing and
plaCement personnel is that Secondary students should be placed according to their writing
test scores when these scores indicate placement at a level lower than their indirect test
scores if Type I courses are to be included in the first semesters of their programs.
Finally, it may be possible to conclude from results of the testing of Hypotheses 5
and 6 that the use of AACPS as a measure of academic success for Secondary students is not
56
72
advisable, as the opportunity to adjust course load to a significant degree is not available to
students in this program.
University Students
Neither writing nor indirect test scores predict academic success as measured by
GPA, which indicates that there are other factors that contribute to academic success for
University students. The scores used in the study are derived from language proficiency
tests and it is not surprising that these scores are not predictors of success for courses in
which language proficiency is less important than other types of skills, such as those required
for mathematics (e.g., logic, problem-solving). Despite the fact that a certain level of
language ability is required in Type II courses (Math/Sciences), there seem to be other skills
that are more important for success. Hence, scores from tests such as the GRE Quantitative
may be better predictors for Type II courses than those used in this study (see Graham,
1987). Also, practitioners know that many ESL students use textbooks in their native
languages as study tools for courses such as mathematics. This and the fact that students
have had previous experience with the content of Type II courses in their home countries
substantially decreases their dependence on a high level of proficiency in English for success
in these types of courses.
Writing and combined test scores do predict academic success moderately well when
AACPS instead of GPA is used as the measure of this criterion. These findings indicate that
time is indeed an important aspect of academic success; both writing and combined test
scores may indicate the length of time it will take students to complete a program of studies
(see Cummins (1979a) re: Cognitive/Academic Language Proficiency). Also evidenced in
57
73
these results, is that the strategy of dropping and/or repeating courses is effective. Exposure
not only to the subject matter, but to the culture of the class by way of teacher expectations,
types of assignments given, lecture style, reading requirements, and level of competition
expected from peers may indeed contribute to higher grades when the second attempt at the
course is made. But there may be a point beyond which the strategy of retaking a course
is not effective, as is shown by the fact that in some cases grades achieved in the second
attempt at the course are no higher than those achieved in the first attempt. For these
students, perhaps the positive effect of the experience derived from this strategy is not great
enough to offset deficiencies in language ability. In support of this possibility, some
researchers have suggested that despite the presence of other factors which contribute to
academic success, e.g., intelligence, motivation and aptitude, students with particularly low
language proficiency are not likely to succeed academically until their level of language
proficiency increases (Graham, 1987; Sharon, 1972). Writing and/or combined test scores
could be used as indicators of students' success in English and Humanities courses, as well
as their success in using the strategy of dropping and/or repeating courses.
The most widely used criterion of academic success is GPA, a measure developed for
first-language students for whom language proficiency is not nearly as much of an obstacle
for academic success as it is for ESL students. GPA was not predicted for University
students by the test scores in this study, but AACPS was. This may indicate that other
measures of academic success need to be developed, as advocated by several researchers
(Black, 1991; Graham, 1987; Heil and Aleamoni, 1974; Light, et al., 1987; Gue and
Holdaway, 1973). When GPA is used as a measure of academic success, a student's rate
74
of language acquisition may be the factor that is being measured, rather than the degree to
which the course content has been learned.
LIMITATIONS OF THE STUDY
Three limitations of this study that must be mentioned are a) the validity of the in-
house holistic grading system, b) the influence of the setting on the academic performance
of Secondary students and c) the length of the study.
Validity of the In -House Holistic Grading System
The validity of the in-house holistic grading system is an important consideration,
since direct test scores are derived from this system. In an attempt to establish the
concurrent validity of the direct measure used in the study, the in-house writing test was
compared to the TOEFL Test of Written English (TWE). A Spearman rank-order
correlation between the average scores that four TWE raters and four in-house raters
assigned to the same 21 essays achieved a low correlation of -0.015. Though these two
measures would appear to be similar in that they are both used a placement tools, and both
assess writing by holistic means, there are two important differences which account for their
low correlation. First, tests of inter-rater reliability indicated that the in-house writing test
had greater reliability than the TWE writing test. In rating 21 essays and allowing for a one-
point discrepancy among the four raters in each group, the raters of the in-house measure
achieved a 66.6% consensus, while the consensus achieved by the TWE raters was lower at
47.6%. This difference in reliability suggests that the in-house measure is being correlated
to a less reliable measure (for the raters used in this study). This discrepancy may be
75
explained by a) there are differences in the rating criteria for the two tests (see Appendices
A and C) and b) there are differences in the reader-training systems and rating environments
which create quite different rater expectations of the writing samples. An opportunity for
the two groups of raters rated each other's tests would be helpful in establishing similar
rating criteria, rater expectations of the writing, and thus, more highly correlated scores.
Influence of the Setting on the Academic Performance of Secondary students
A second limitation of the study is that the research took place in a college, and
though Secondary students are enrolled, the college setting is quite different than that of a
typical high-school which most ESL students of this age attend. The hours of instruction in
the Secondary Program are increased by a minimum of 10% over the number specified by
government regulations. There is an average of 21 students per class, and the sutpoi-t
services offered in proportion to the small population of the college (400 to 700 students) is
high. Also, the college is an independent institution and receives no government funding.
This may have a bearing on motivation, parental expectations, and other aspects important
to Secondary students' academic success. The college setting, then, may allow other
influences to affect success that would not be present for students in public Secondary
schools, and hence, may affect generalizability of results obtained in this study.
In addition, over 90% of the students in the study were Asian; this may not reflect
the demographics of other institutions to which the findings of this study could be extended.
The Length of the Study
The study incorporated a sampling from records collected over time and qualities
inherent in this type of design could have affected results since the correlation between
76
variables usually decreases as the time span of the study increases (McMillan and
Schumacher, 1989). Students accumulated grades and credits over a minimum of three
semesters (one year), and this period of time provided opportunity for other factors to
influence the GPA and AACPS. It also may be useful to extend the study to a full-scale
longitudinal study, following several cohorts through their stay at an academic institution.
EXTENSION OF THE RESEARCH
There are several ways in which the research conducted here could be extended. The
ability of placement test scores to predict average accumulated credit per semester could be
assessed for Course Type I (English/Humanities) and Course Type II (Math/Sciences)
separately. Since this measure of academic success was predicted moderately well by direct
and combined test scores for University students, one would expect that these scores would
predict success in Course Type I to a greater extent, since courses with lower language
proficiency demands would be excluded.
A more extensive study of factors which are related to academic success would be
informative. Among the variables examined in such a study could be students' native
language, number of years of previous English study, type of high-school attended in home
country, sex, age, education of parents, intelligence, values, loneliness, homesickness,
adaptation to Canadian culture, use of English outside of school hours, and degree of social
support, and others. A combination of data-collection procedures, both qualitative and
quantitative would be appropriate here, since there appears to be such a wide array of factors
that contribute to academic success for ESL students. This study explored some of the more
61
77
quantifiable variables, i.e., test scores, but since so many other factors are likely to influence
test results, test data should not necessarily be considered more meaningful than other data.
Continued study on academic success and its measurement will help serve ESL students'
needs; more appropriate measures for this population need to be found.
SUMMARY
The study has examined placement test scores as predictors of academic success for
ESL students. Some conclusions have been drawn, and suggestions for application to
practice have been made. There are three areas in which the study has made a contribution:
First, because studies which compare Secondary and University students with regard
to the effect of writing proficiency on academic success are not common, the research
accomplished here will add to current knowledge in this area.
Second, interest in the study arose from the recurring problem of making accurate
placement decisions for students with discrepant indirect and direct test scores. The findings
of the study may indicate a direction for those involved in this process.
Finally, the measurement of academic success was an important issue in the study.
GPA is not specifically designed to measure language proficiency, but in using it as a
measure of academic success for ESL students, it is often inadvertently put to that purpose.
New assessment tools for ESL students must be created, at least for the interim period in
which language proficiency is being brought up to the level at which second-language
students can fairly compete with native speakers. The measure of the number of credits
earned per semester takes a vital aspect of second-language learning into
78
consideration -- time. Perhaps a better indicator of academic success than GPA alone would
be a combination of GPA, AACPS and other factors yet to be assessed.
63
79
REFERENCES
Bauldauf, R. B., Jr., & Dawson, R. L. T. (1980). The predictive validity of theMichigan test of English language proficiency for teacher trainees in Papua New
Guinea. Educational and Pschological Measurement, 40, 1201-1205.
Black, J. (1991). Performance in English skills courses and overall academicachievement. TESL Canada Journal, 9, 42-55.
Berwick, R., (1992). Ritsumeikan Evaluation. Study. Unpublished manuscript. Universityof British Columbia, Vancouver.
Berwick, R., (1993). Ritsumeikan Evaluation Study. Unpublished manuscript. Universityof British Columbia, Vancouver.
Brown, J. D. (1989). Improving ESL placement tests using two perspectives. TESOLQuarterly, 23, 65-83.
Brown, J. D. (1991). Do English and ESL faculties rate writing samples differently?TESOL Quarterly, 25, 587-603.
Brown, J. D., & Bailey, K. M. (1984). A categorical instrument for scoring secondlanguage writing skills. Language Learning, 34, 21-42.
Carroll, J. B. (1965). Review of the Michigan test of English language proficiency. In0. K. Burrows (Ed.), The Sixth Mental Measurements Yearbook (review # 360).Highland Park, New Jersey: Gryphon.
Cervenka, E. J. (1965). Review of the Michigan test of English language proficiency. In0. K. Burrows (Ed.), The Eighth Mental Measurements Yearbook (review # 106).Highland Park, New Jersey: Gryphon.
Cooper, C. L. (1977). Holistic evaluation of writing. In C. R. Cooper & L. Odell(Eds.), Evaluating Writing: Describing, Measuring, Judging (pp. 2-31). Illinois:National Council of Teachers of English.
Cumming, A. (1989). Writing expertise and second language proficiency. LanguageLearning, 39, 81-141.
Cumming, A. (1990). Expertise in evaluating second language composition. LanguageTesting, 1, 31-51.
80
Cummins, J. (1979a). Cognitive/academic language proficiency, linguisticinterdependence, the optimum age question and some other matters. Working
Papers on Bilingualism, 19, 179-205.
Davies, S., & West, R. (1989). English Language Examinations. Essex, England:Longman.
Educational Testing Service. (1990). TOEFL Test Score Manual. Princeton, NewJersey: Author.
Ellis, R. (1985). Understanding Second Language Acquisition. Oxford, England:Oxford University Press.
Farhady, H. (1982). Measures of language proficiency from the learners' perspective.TESOL Quarterly, 16, 43-59.
Graham, J. G. (1987). English language proficiency and the prediction of academicsuccess. TESOL Quarterly, 21, 505-521.
Hanania, E., .& Shikhani, M. (1986). Interrelationships among three tests of languageproficiency: Standardized ESL, doze, and writing. TESOL Quarterly, 20,97-109.
Harris, W. H. (1977). Teacher response to student writing: A study of the responsepatterns of high-school English teachers to determine the basis for teacherjudgement of student writing. Research in the Teaching of English, 11, 175-185.
Hendrickson, J. M. (1978). Error correction in foreign language teaching: Recenttheory, research and practice. Modern Language Journal, 62, 386- 398.
Hirsch, E. D., Jr., Khett, J. F., & Trefil, J. (1988). The Dictionary of CulturalLiteracy: What Every American Needs to Know. Boston: Houghton Mifflin.
Homburg, T. J. (1984). Holistic evaluation of ESL compositions: Can it be evaluatedobjectively? TESOL Quarterly, 18, 87-105.
Horowitz, D. M. (1986). What professors actually require: Academic tasks for the ESLclassroom. TESOL Quarterly 20, 445-462.
Hwang, K., & Dizney, H. F. (1970) Predictive validity of the test of English as aforeign language for Chinese graduate students at an American university.Educational and Psychological Measurement, 30, 475-477.
65
81
Jacobs, H. L., Zinkgraf, S. A., Wormuth, D. R., Hartfiel, V. F., & Hughey, J. B.(1981). Testing ESL Composition: A Practical Approach. Rowley, Massachusetts:Newbury House.
Janopoulos, M. (1989). Reader comprehension and holistic assessment of secondlanguage writing proficiency. Written Communication, 6, 218-235.
Jenks, F. (1987). Michigan test of English language proficiency. In J. C. Alderson,K. J. Krahnke, & C. W. Stansfield (Eds.), Reviews of English LanguageProficiency Tests (pp. 58-60). Washington, D.C.: TESOL.
Johns, A. M. (1981). Necessary English: A faculty survey. TESOL Quarterly, 15,51-57.
Krashen, S. D. (1982). Principles and Practice in Second Language Acquisition. NewYork: Pergamon Press.
Lien, A. J. (1967). Measurement and Evaluation of Learning. Dubuque, Iowa: Wm. C.Brown.
Light, R. L., Xu, M., & Mossop, J. (1987). English proficiency and academicperformance of international students. TESOL Quarterly, 21, 251-261.
Ling, S. (1986). Responding to product in the composing process. TESL Canada, 2,65-75.
Low, G. (1982). The direct testing of academic writing in a second language. System,10, 247-257.
McMillan, J. H., & Schumacher, S. (1989). Research in Education: A ConceptualIntroduction. Illinios: Scott, Foresman.
Norton-Pierce, B. (1991). TOEFL test of written English (TWE) scoring guide.Educational Testing Service, (Review). TESOL Quarterly, 25, 159-163.
Ostler, S. E. (1980). A survey of academic needs for advanced ESL. TESOL Quarterly,14, 489-502.
Page, G. T., & Thomas, J. B. (1977). International Dictionary of Education. London:Kogan Page.
Perkins, K. (1980). Using objective methods of attained writing proficiency todiscriminate among holistic evaluations. TESOL Quarterly, 14, 61-67.
6
82
Perkins, K. (1983). On the use of composition scoring techniques, objective measures,and objective tests to evaluate ESL writing ability. TESOL Quarterly, 17,651-669.
Raimes, A. (1990). The TOEFL test of written English: causes for concern. TESOLQuarterly, 24, 427-442.
Robb, T., Ross, S., & Shortreed, I. (1986). Salience of feedback on error and its effectson EFL writing quality. TESOL Quarterly, 20, 83-93.
Santos, T. (1988). Professors' reactions to the academic writing of nonnative speakingstudents. TESOL Quarterly, 22, 69-90.
Sheory, R. (1986). Error perceptions of native-speaking and non-native-speakingteachers of ESL. ELT Journal, 40, 306-312.
Shih, M. (1986). Content-based approaches to teaching academic writing. TESOLQuarterly, 20, 617-647.
University of Michigan English Language Institute, Division of Testing and Certification.(1977).. Michigan TfS. t of English Language Proficiency Test Manual. AnnArbor, Michigan: Author.
Vann, R. J., Meyer, D. E., & Lorenz, F. 0. (1984). Error gravity: A study of facultyopinion of ESL errors. TESOL Quarterly, 18, 427-440.
Zamel, V. (1985). Responding to student writing. TESOL Quarterly, 19, 79-101.
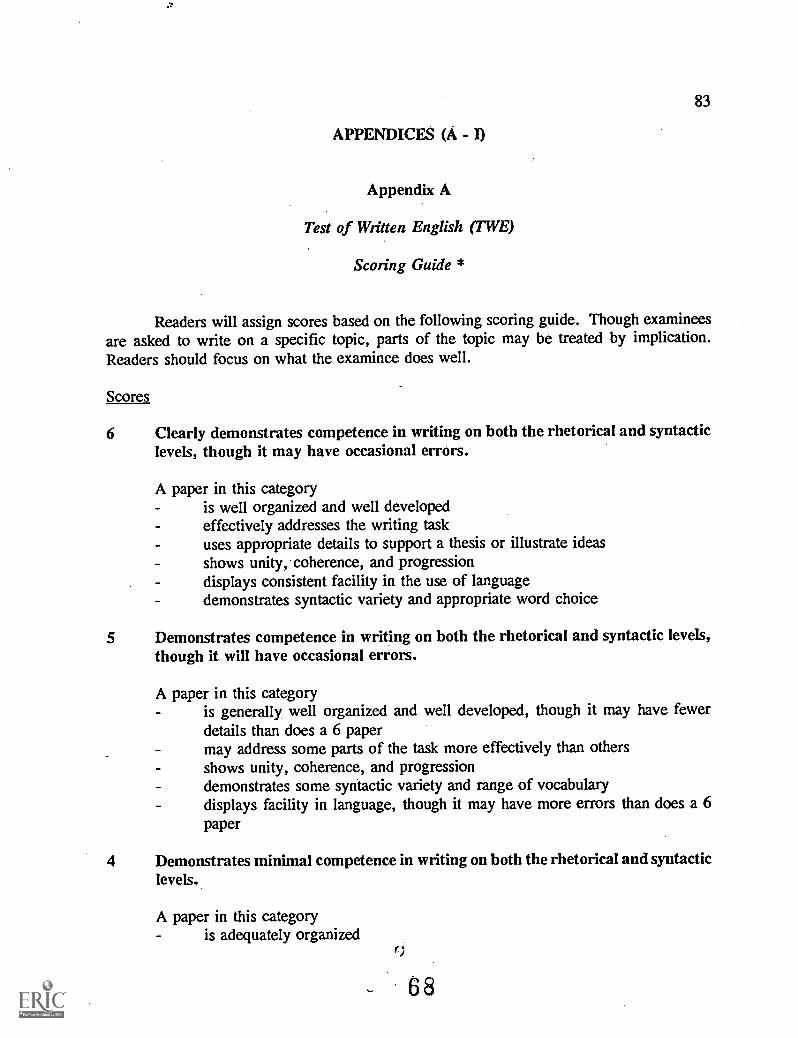
83
APPENDICES (A -
Appendix A
Test of Written English (TWE)
Scoring Guide *
Readers will assign scores based on the following scoring guide. Though examineesare asked to write on a specific topic, parts of the topic may be treated by implication.Readers should focus on what the examinee does well.
Scores
6 Clearly demonstrates competence in writing on both the rhetorical and syntacticlevels, though it may have occasional errors.
A paper in this categoryis well organized and well developedeffectively addresses the writing taskuses appropriate details to support a thesis or illustrate ideasshows unity, coherence, and progressiondisplays consistent facility in the use of languagedemonstrates syntactic variety and appropriate word choice
5 Demonstrates competence in writing on both the rhetorical and syntactic levels,though it will have occasional errors.
A paper in this categoryis generally well organized and well developed, though it may have fewerdetails than does a 6 papermay address some parts of the task more effectively than othersshows unity, coherence, and progressiondemonstrates some syntactic variety and range of vocabularydisplays facility in language, though it may have more errors than does a 6paper
4 Demonstrates minimal competence in writing on both the rhetorical and syntacticlevels.
A paper in this categoryis adequately organized
68
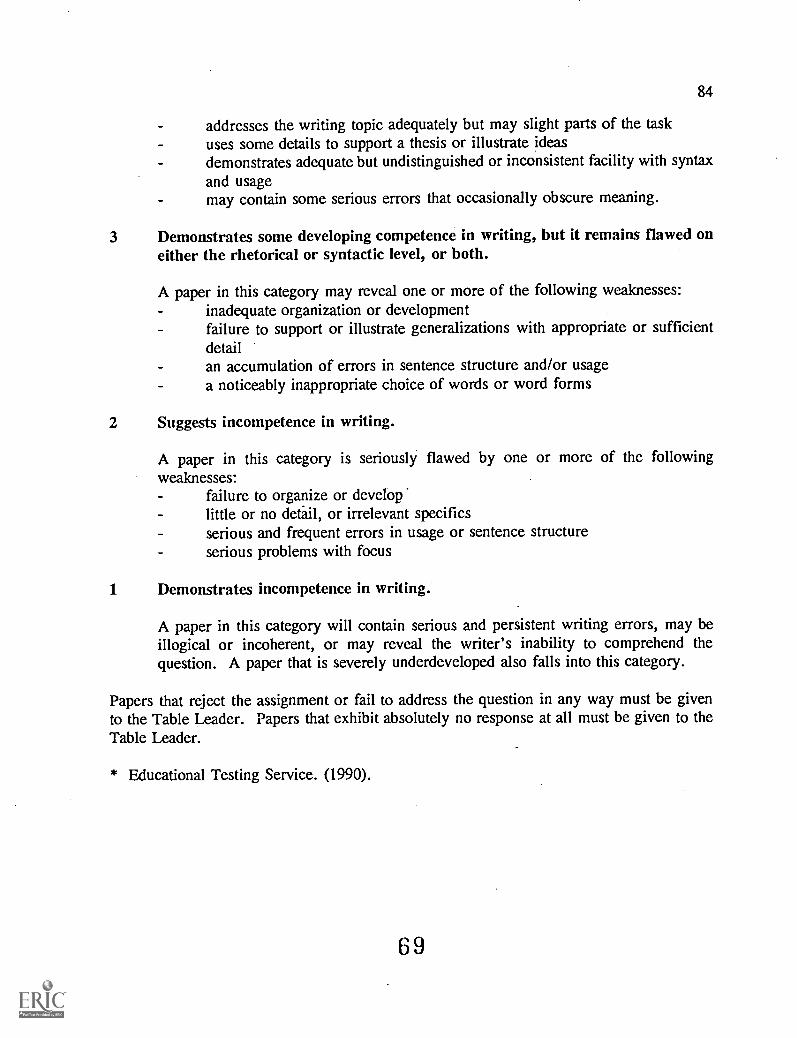
84
addresses the writing topic adequately but may slight parts of the taskuses some details to support a thesis or illustrate ideasdemonstrates adequate but undistinguished or inconsistent facility with syntaxand usagemay contain some serious errors that occasionally obscure meaning.
3 Demonstrates some developing competence in writing, but it remains flawed oneither the rhetorical or syntactic level, or both.
A paper in this category may reveal one or more of the following weaknesses:inadequate organization or developmentfailure to support or illustrate generalizations with appropriate or sufficientdetailan accumulation of errors in sentence structure and/or usagea noticeably inappropriate choice of words or word forms
2 Suggests incompetence in writing.
A paper in this category is seriously flawed by one or more of the followingweaknesses:
failure to organize or developlittle or no detail, or irrelevant specificsserious and frequent errors in usage or sentence structureserious problems with focus
1 Demonstrates incompetence in writing.
A paper in this category will contain serious and persistent writing errors, may beillogical or incoherent, or may reveal the writer's inability to comprehend thequestion. A paper that is severely underdeveloped also falls into this category.
Papers that reject the assignment or fail to address the question in any way must be givento the Table Leader. Papers that exhibit absolutely no response at all must be given to theTable Leader.
* Educational Testing Service. (1990).
69
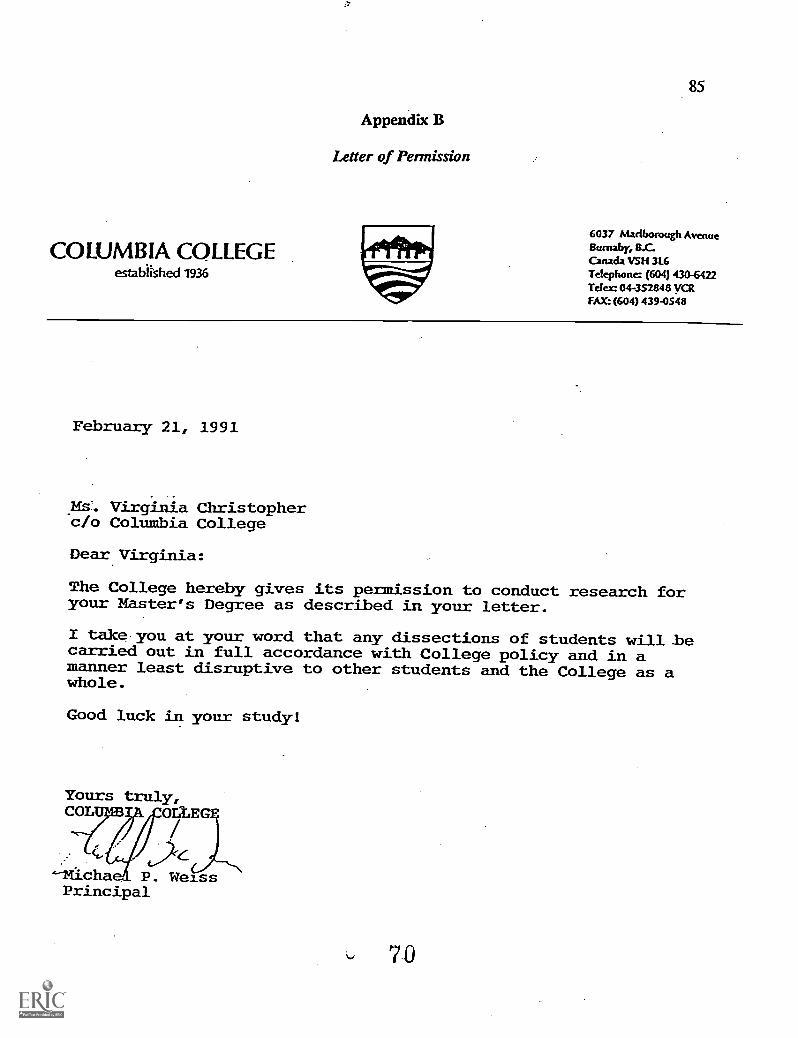
COLUMBIA COLLEGEestablished 1936
Appendix B
Letter of Permission
85
6037 Madbocough AvenueBurnaby, B.C.Canada VSH 3L6Telephone: (604) 430-6422Tele= 04-352848 VCRFAX: (604) 439-0548
February 21, 1991
_Its. Virginia Christopherco Columbia College
Dear Virginia:
The College hereby gives its permission to conduct research foryour Master's Degree as described in your letter.
I take you at your word that any dissections of students will becarried out in full accordance with College policy and in amanner least disruptive to other students and the College as awhole.
Good luck in your study!
Yours truly,COL OLLE
Nicha P. WeissPrincipal
70
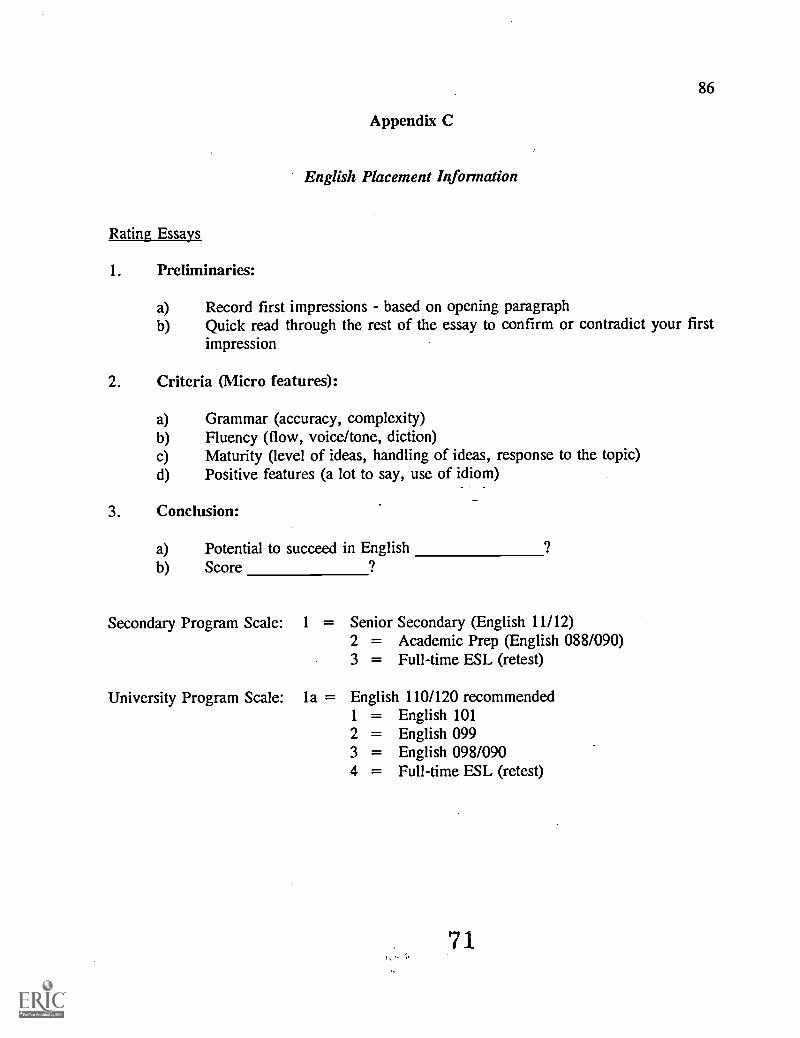
Appendix C
English Placement Information
Rating Essays
1. Preliminaries:
86
a) Record first impressions - based on opening paragraphb) Quick read through the rest of the essay to confirm or contradict your first
impression
2. Criteria (Micro features):
a) Grammar (accuracy, complexity)b) Fluency (flow, voice/tone, diction)c) Maturity (level of ideas, handling of ideas, response to the topic)d) Positive features (a lot to say, use of idiom)
3. Conclusion:
a) Potential to succeed in Englishb) Score
Secondary Program Scale: 1 = Senior Secondary (English 11/12)2 = Academic Prep (English 088/090)3 = Full-time ESL (retest)
University Program Scale: la = English 110/120 recommended1 = English 1012 = English 0993 = English 098/0904 = Full-time ESL (retest)
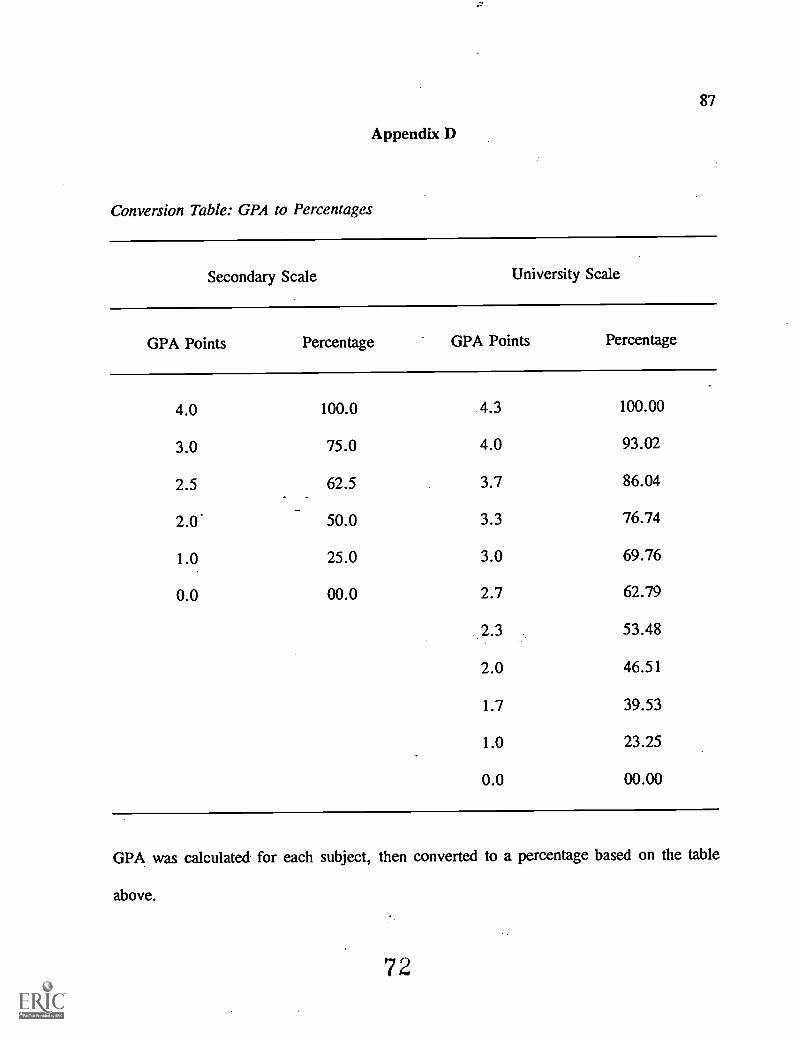
87
Appendix D
Conversion Table: GPA to Percentages
Secondary Scale University Scale
GPA Points Percentage GPA Points Percentage
4.0 100.0 .4.3 100.00
3.0 75.0 4.0 93.02
2.5 62.5 3.7 86.04
_2.0 50.0 3.3 76.74
1.0 25.0 3.0 69.76
0.0 00.0 2.7 62.79
2.3 53.48
2.0 46.51
1.7 39.53
1.0 23.25
0.0 00.00
GPA was calculated for each subject, then converted to a percentage based on the table
above.
72
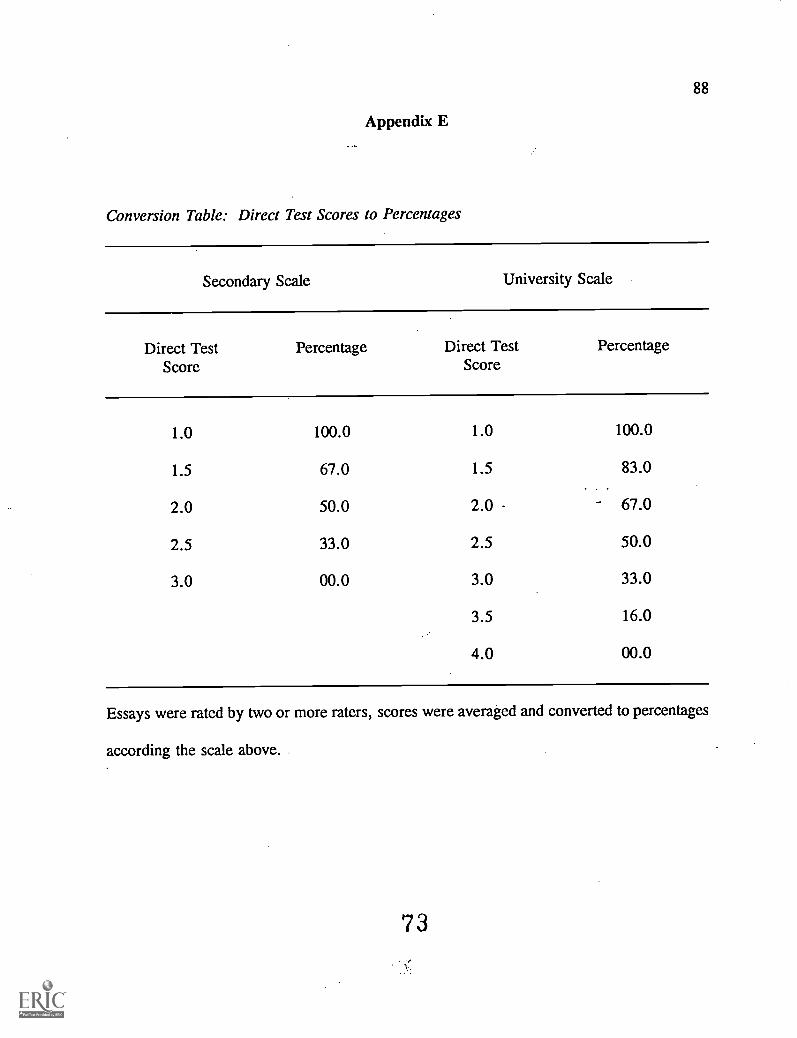
88
Appendix E
Conversion Table: Direct Test Scores to Percentages
Secondary Scale University Scale
Direct TestScore
Percentage Direct TestScore
Percentage
1.0 100.0 1.0 100.0
1.5 67.0 1.5 83.0
2.0 50.0 2.0 67.0
2.5 33.0 2.5 50.0
3.0 00.0 3.0 33.0
3.5 16.0
4.0 00.0
Essays were rated by two or more raters, scores were averaged and converted to percentages
according the scale above.
73
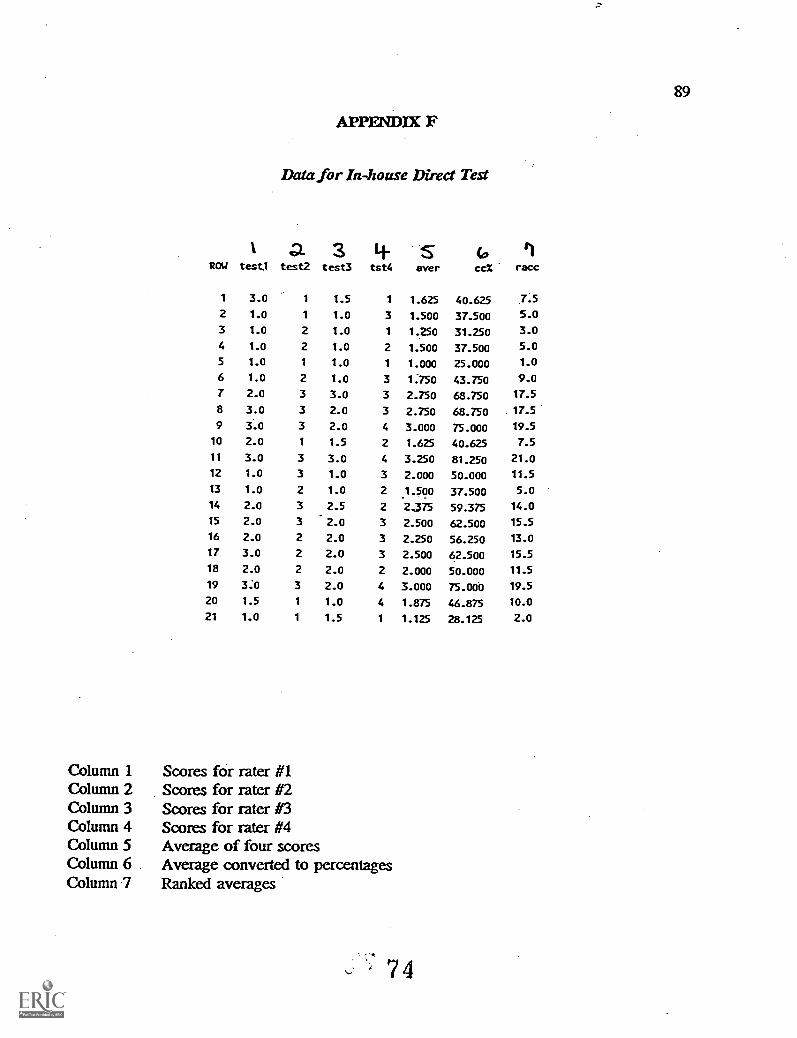
Column 1Column 2Column 3Column 4Column 5Column 6Column .7
APPENMX F
Data for In-house Direct Test
a 3 1+ s co1.1
ROW testi test2 test3 tst4 aver cc% racc
1 3.0 1 1.5 1 1.625 40.625 7.5
2 1.0 1 1.0 3 1.500 37.500 5.0
3 1.0 2 1.0 1 1.250 31.250 3.0
4 1.0 2 1.0 2 1.500 37.500 5.0
5 1.0 1 1.0 1 1.000 25.000 1-0
6 1.0 2 1.0 3 1.750 43.750 9.0
7 2.0 3 3.0 3 2.750 68.750 17.5
8 3.0 3 2.0 3 2.750 68.750 17.5
9 3.0 3 2.0 4 3.000 75.000 19.5
10 2.0 1 1.5 2 1.625 40.625 7.5
11 3.0 3 3.0 4 3.250 81.250 21.0
12 1.0 3 1.0 3 2.000 50.000 11.5
13 1.0 2 1.0 2 37.500 5.0
14 2.0 3 2.5 2
.1.500
2.375 59.375 14.0
15 2.0 3 2.0 3 2.500 62.500 15.5
16 2.0 2 2.0 3 2.250 56.250 13.0
17 3.0 2 2.0 3 2.500 62.500 15.5
18 2.0 2 2.0 2 2.000 50.000 11.5
19 3:0 3 2.0 4 3.000 75.000 19.5
20 1.5 1 1.0 4 1.875 46.875 10.0
21 1.0 1 1.5 1 1.125 28.125 2.0
Scores for rater #1Scores for rater #2Scores for rater #3Scores for rater #4Average of four scoresAverage converted to percentagesRanked averages
7 4
89
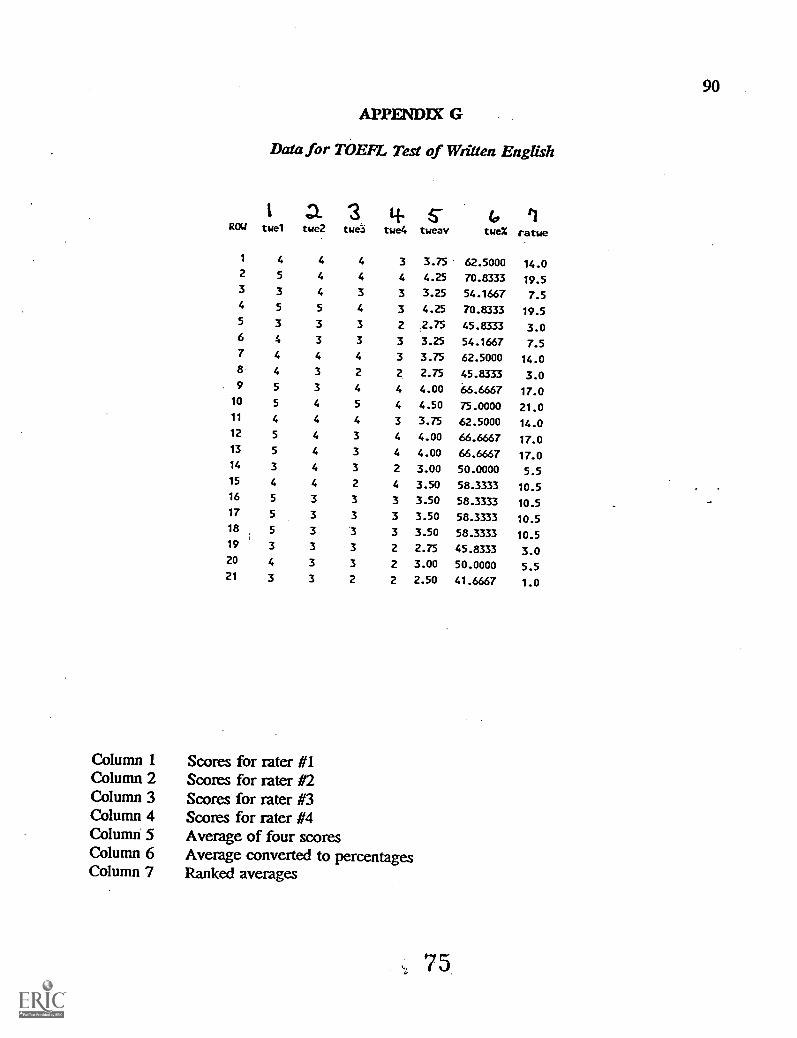
Column 1Column 2Column 3Column 4Column 5Column 6Column 7
APPENDIX G
Data for TOEFL Test of Written English
I a 3 4. 5-ROW twel twe2 twe3 twe4 tweav twe% ratwe
1 4 4 4 3 3.75 62.5000 14.02 5 4 4 4 4.25 70.8333 19.53 3 4 3 3 3.25 54.1667 7.54 5 5 4 3 4.25 70.8333 19.55 3 3 3 2 2.75 45.8333 3.06 4 3 3 3 3.25 54.1667 7.57 4 4 4 3 3.75 62.5000 14.08 4 3 2 2 2.75 45.8333 3.09 5 3 4 4 4.00 66.6667 17.010 5 4 5 4 4.50 75.0000 21.011 4 4 4 3 3.75 62.5000 14.012 5 4 3 4 4.00 66.6667 17.013 5 4 3 4 4.00 66.6667 17.014 3 4 3 2 3.00 50.0000 5.515 4 4 2 4 3.50 58.3333 10.516 5 3 3 3 3.50 58.3333 10.517 5 3 3 3 3.50 58.3333 10.518 5 3 3 3 3.50 58.3333 10.519 3 3 3 2 2.75 45.8333 3.020 4 3 3 2 3.00 50.0000 5.521 3 3 2 2 2.50 41.6667 1.0
Scores for rater #1Scores for rater #2Scores for rater #3Scores for rater #4Average of four scoresAverage converted to percentagesRanked averages
75
90
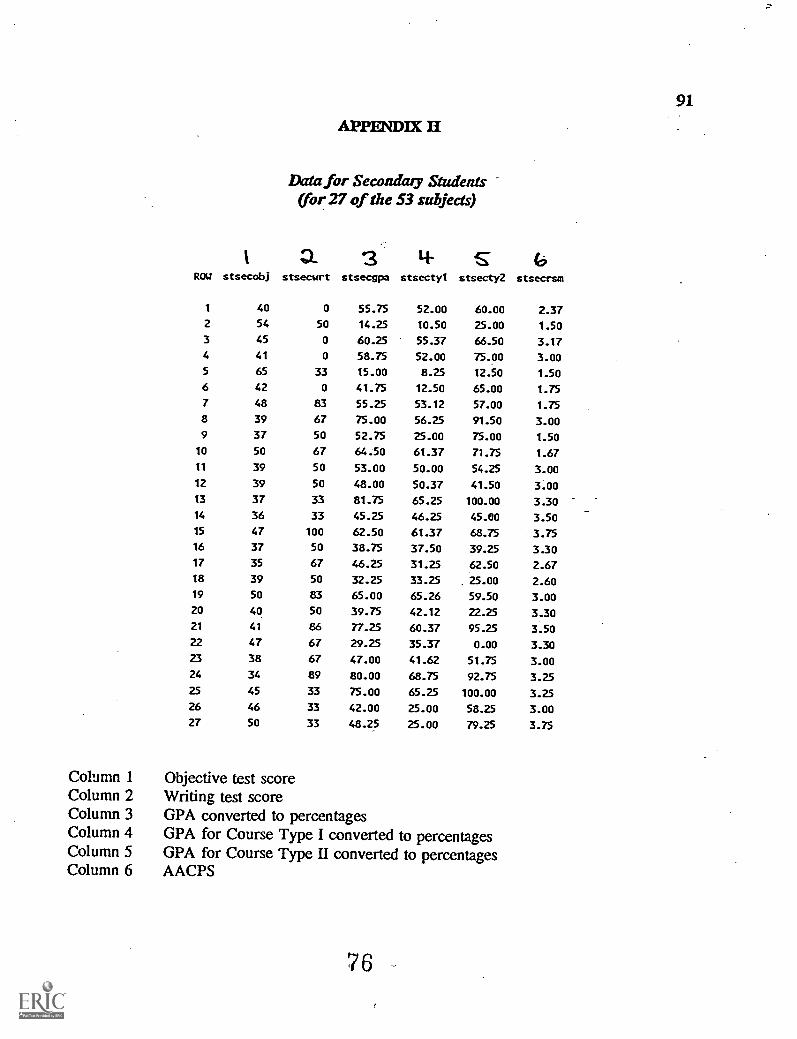
91
APPEND= )1
Data for Secondary Students(for 27 of the 53 subjects)
a '3 4-ROV stsecobj stsecwrt stsecgpa stsectyl stsecty2 stsecrsm
1 40 0 55.75 52.00 60.00 2.37
2 54 50 14.25 10.50 25.00 1.50
3 45 0 60.25 55.37 66.50 3.174 41 0 58.75 52.00 75.00 3.00
5 65 33 15.00 8.25 12.50 1.50
6 42 0 41.75 12.50 65.00 1.75
7 48 83 55.25 53.12 57.00 1.75
8 39 67 75.00 56.25 91.50 3.00
9 37 50 52.75 25.00 75.00 1.50
10 50 67 64.50 61.37 71.75 1.67
11 39 50 53.00 50.00 54.25 3.00
12 39 50 48.00 50.37 41.50 3.00
13 37 33 81.75 65.25 100.00 3.30
14 36 33 45.25 46.25 45.00 3.50
15 47 100 62.50 61.37 68.75 3.75
16 37 50 38.75 37.50 39.25 3.3017 35 67 46.25 31.25 62.50 2.6718 39 50 32.25 33.25 25.00 2.60
19 50 83 65.00 65.26 59.50 3.00
20 40 50 39.75 42.12 22.25 3.3021 41 86 77.25 60.37 95.25 3.50
22 47 67 29.25 35.37 0.00 3.30
23 38 67 47.00 41.62 51.75 3.0024 34 89 80.00 68.75 92.75 3.25
25 45 33 75.00 65.25 100.00 3.25
26 46 33 42.00 25.00 58.25 3.0027 50 33 48.25 25.00 79.25 3.75
Column 1 Objective test scoreColumn 2 Writing test scoreColumn 3 GPA converted to percentagesColumn 4 GPA for Course Type I converted to percentagesColumn 5 GPA for Course Type II converted to percentagesColumn 6 AACPS
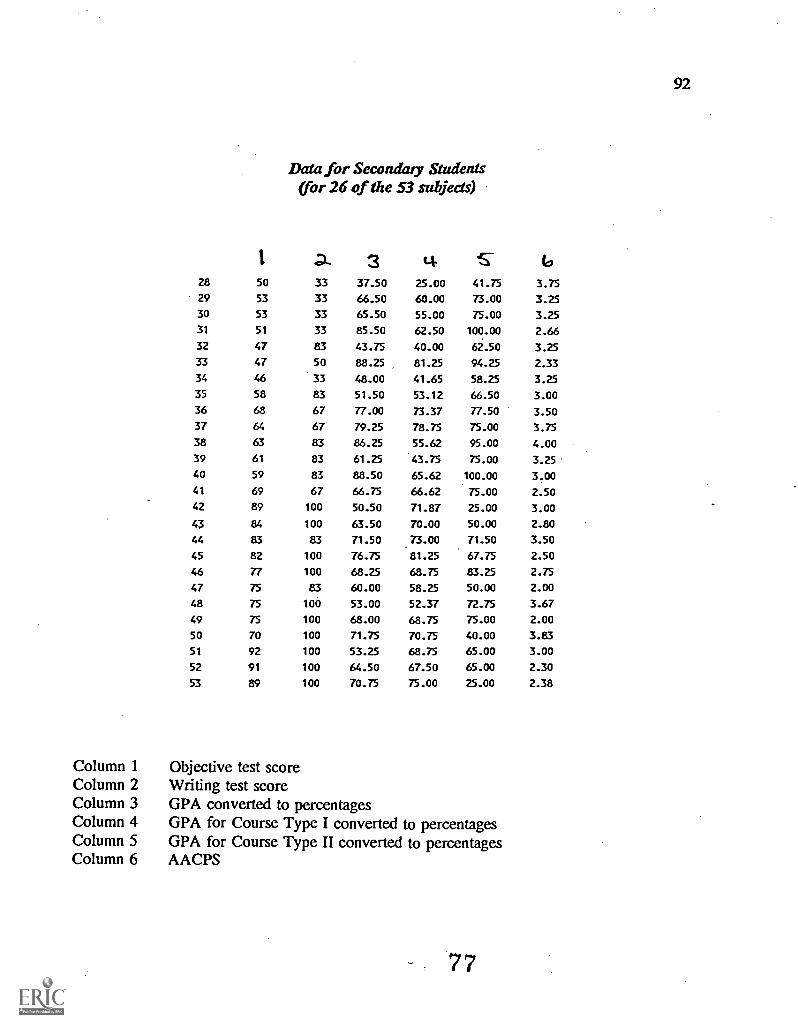
92
Data for Secondary Students(for 26 of the 53 subjects)
1 ::).. :3 Lt. 1ST (2
28 50 33 37.50 25.00 41.75 3.75
29 53 33 66.50 60.00 73.00 3.25
30 53 33 65.50 55.00 75.00 3.25
31 51 33 85.50 62.50 100.00 2.66
32 47 83 43.75 40.00 62.50 3.25
33 47 50 88.25 81.25 94.25 2.33
34 46 33 48.00 41.65 58.25 3.25
35 58 83 51.50 53.12 66.50 3.00
36 68 67 77.00 73.37 77.50 3.50
37 64 67 79.25 78.75 75.00 3.75
38 63 83 86.25 55.62 95.00 4.00
39 61 83 61.25 43.75 75.00 3.25
40 59 83 88.50 65.62 100.00 3.00
41 69 67 66.75 66.62 75.00 2.50
42 89 100 50.50 71.87 25.00 3.00
43 84 100 63.50 70.00 50.00 2.80
44 83 83 71.50 73.00 71.50 3.50
45 82 100 76.75 81.25 67.75 2.50
46 77 100 68.25 68.75 83.25 2.75
47 75 83 60.00 58.25 50.00 2.00
48 75 100 53.00 52.37 72.75 3.67
49 75 100 68.00 68.75 75.00 2.00
50 70 100 71.75 70.75 40.00 3.83
51 92 100 53.25 68.75 65.00 3.00
52 91 100 64.50 67.50 65.00 2.30
53 89 100 70.75 75.00 25.00 2.38
Column 1 Objective test scoreColumn 2 Writing test scoreColumn 3 GPA converted to percentagesColumn 4 GPA for Course Type I converted to percentagesColumn 5 GPA for Course Type II converted to percentagesColumn 6 AACPS
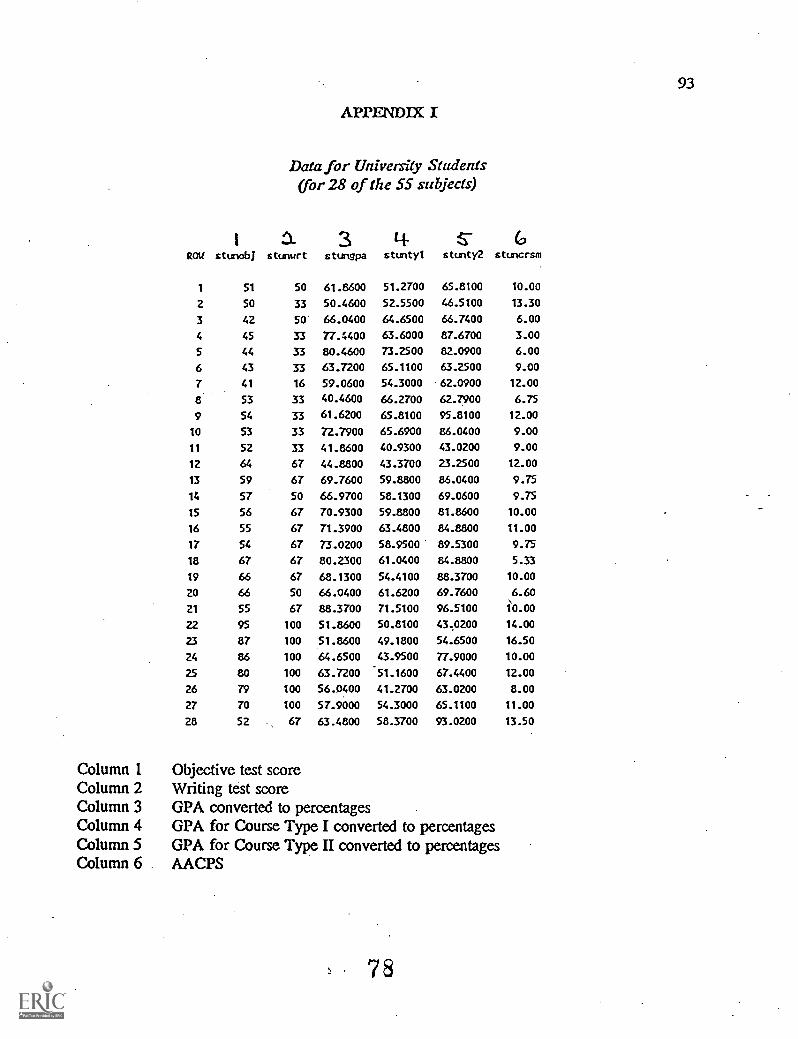
93
APPENDIX I
Data for University Students(for 28 of the 55 subjects)
a 3 4 GROU stunobj stunurt stungpa stuntyl stunty2 stuncrsm
1 51 50 61.8600 51.2700 65.8100 10.00
2 50 33 50.4600 52.5500 46.5100 13.30
3 42 50 66.0400 64.6500 66.7400 6.00
4 45 33 77.4400 63.6000 87.6700 3.00
5 44 33 80.4600 73.2500 82.0900 6.00
6 43 33 63.7200 65.1100 63.2500 9.00
7 41 16 59.0600 54.3000 62.0900 12.00
8 53 33 40.4600 66.2700 62.7900 6.75
9 54 33 61.6200 65.8100 95.8100 12.00
10 53 33 72.7900 65.6900 86.0400 9.00
11 52 33 41.8600 40.9300 43.0200 9.00
12 64 67 44.8800 43.3700 23.2500 12.00
13 59 67 69.7600 59.8800 86.0400 9.75
14 57 50 66.9700 58.1300 69.0600 9.75
15 56 67 70.9300 59.8800 81.8600 10.00
16 55 67 71.3900 63.4800 84.8800 11.00
17 54 67 73.0200 58.9500 89.5300 9.75
18 67 67 80.2300 61.0400 84.8800 5.33
19 66 67 68.1300 54.4100 88.3700 10.00
20 66 50 66.0400 61.6200 69.7600 6.60
21 55 67 88.3700 71.5100 96.5100 10.00
22 95 100 51.8600 50.8100 43.0200 14.00
23 87 100 51.8600 49.1800 54.6500 16.50
24 86 100 64.6500 43.9500 77.9000 10.00
25 80 100 63.7200 51.1600 67.4400 12.00
26 79 100 56.0400 41.2700 63.0200 8.00
27 70 100 57.9000 54.3000 65.1100 11.00
28 52 67 63.4800 58.3700 93.0200 13.50
Column 1 Objective test scoreColumn 2 Writing test scoreColumn 3 GPA converted to percentagesColumn 4 GPA for Course Type I converted to percentagesColumn 5 GPA for Course Type II converted to percentagesColumn 6 AACPS
78
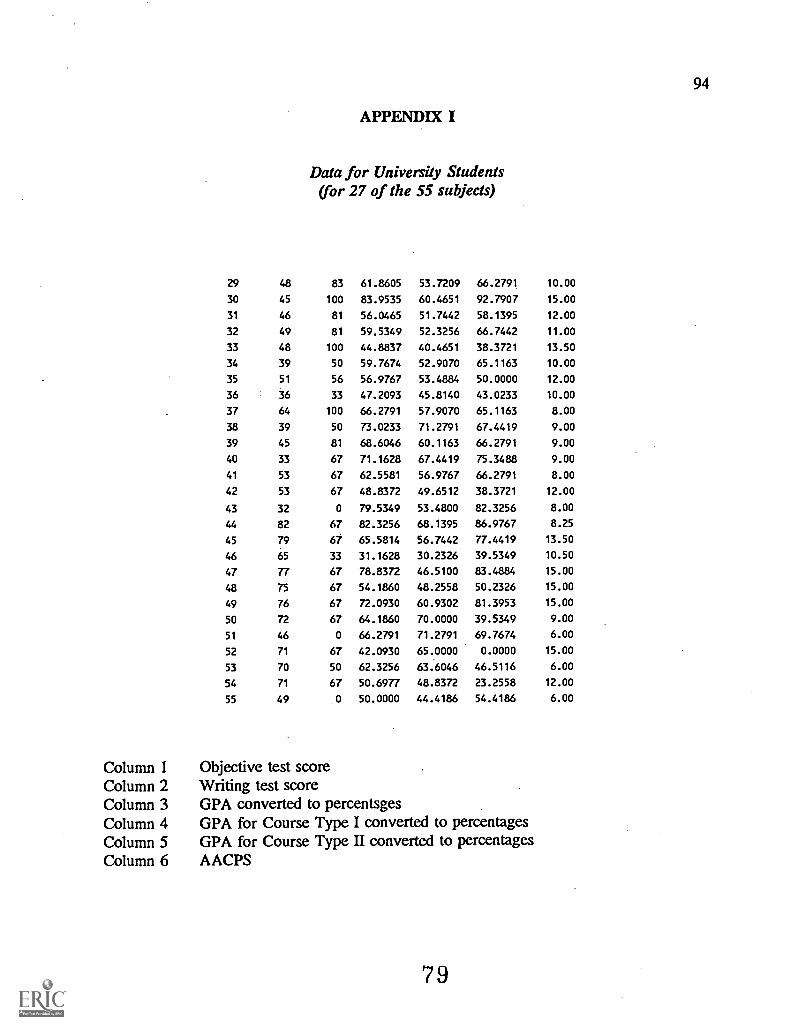
94
APPENDIX I
Data for University Students(for 27 of the 55 subjects)
29 48 83 61.8605 53.7209 66.2791 10.00
30 45 100 83.9535 60.4651 92.7907 15.00
31 46 81 56.0465 51.7442 58.1395 12.00
32 49 81 59.5349 52.3256 66.7442 11.00
33 48 100 44.8837 40.4651 38.3721 13.50
34 39 50 59.7674 52.9070 65.1163 10.00
35 51 56 56.9767 53.4884 50.0000 12.00
36 36 33 47.2093 45.8140 43.0233 10.00
37 64 100 66.2791 57.9070 65.1163 8.00
38 39 50 73.0233 71.2791 67.4419 9.00
39 45 81 68.6046 60.1163 66.2791 9.00
40 33 67 71.1628 67.4419 75.3488 9.00
41 53 67 62.5581 56.9767 66.2791 8.00
42 53 67 48.8372 49.6512 38.3721 12.00
43 32 0 79.5349 53.4800 82.3256 8.00
44 82 67 82.3256 68.1395 86.9767 8.25
45 79 67 65.5814 56.7442 77.4419 13.50
46 65 33 31.1628 30.2326 39.5349 10.50
47 77 67 78.8372 46.5100 83.4884 15.00
48 75 67 54.1860 48.2558 50.2326 15.00
49 76 67 72.0930 60.9302 81.3953 15.00
50 72 67 64.1860 70.0000 39.5349 9.00
51 46 0 66.2791 71.2791 69.7674 6.00
52 71 67 42.0930 65.0000 0.0000 15.00
53 70 50 62.3256 63.6046 46.5116 6.00
54 71 67 50.6977 48.8372 23.2558 12.00
55 49 .0 50.0000 44.4186 54.4186 6.00
Column 1 Objective test scoreColumn 2 Writing test scoreColumn 3 GPA converted to percentsgesColumn 4 GPA for Course Type I converted to percentagesColumn 5 GPA for Course Type II converted to percentagesColumn 6 AACPS
79
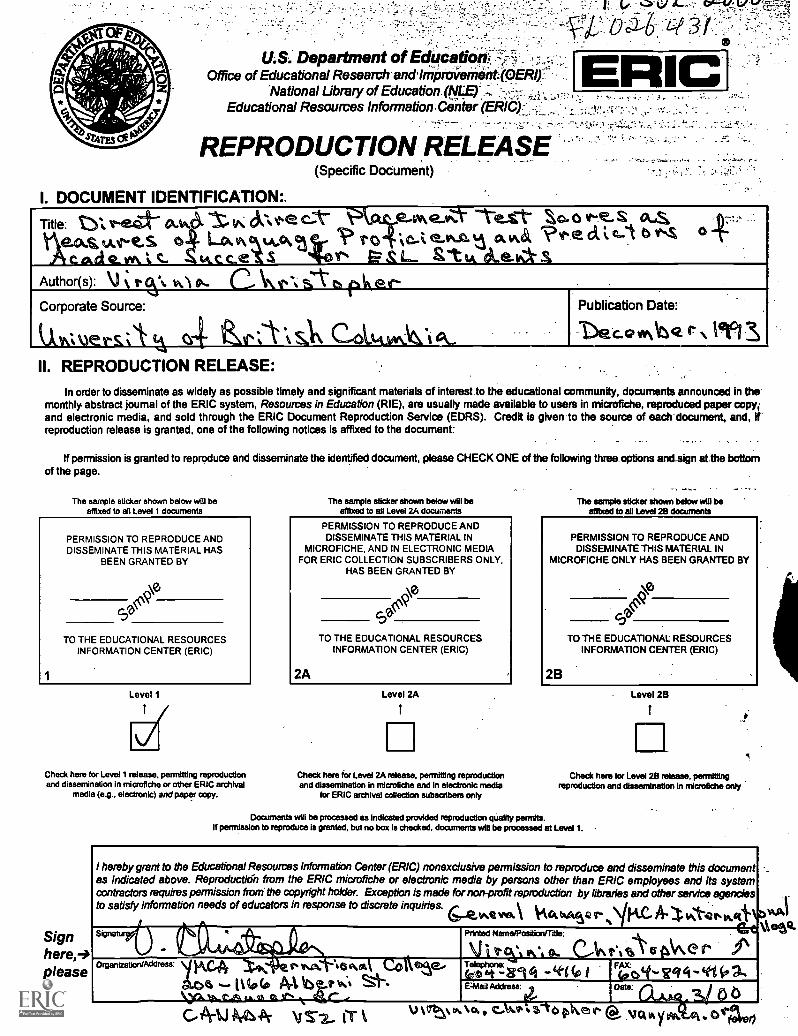
U.S. Department of Erlutcatiom _
Office of Educational Researctrandimpraiernent(OER1)::"National Library of Education (NLEI
Educational Resources Information.CenteriER14_
REPRODUCTION RELEASE(Specific Document)
I. DOCUMENT IDENTIFICATION::
ERIC
Title: Zel reer a. v c: a4 c-A" kctce-Aveatt Sc. 0 s 04-S
te.a.% vor-e.S. 6 Lo. .0.0t Tr. oonik ?Pe a b
ficacte.vAA,c. utcceMS *or atut cLehl-,1Author(s): e- ik %1.. eh .p IN et-
Corporate Source:
II. REPRODUCTION RELEASE:
voN16ca r len 1Publication Date :'
In order to disseminate as widely as possible timely and significant materials of interest. to the educational community, documents announced in themonthly abstract journal of the ERIC system, Resources in Education (RIE), are usually made available to users in microfiche, reproduced paper copy;and electronic media, and sold through the ERIC Document Reproduction Service (EDRS). Credit is given to the source of each document, and, Ifreproduction release is granted, one of the following notices is affixed to the document:
. .
If permission is granted to reproduce and disseminate the identified document, please CHECK ONE of the following three. options and.sign at. the bottomof the page.
The sample sticker shown below will beaffixed to all Level 1 documents
1
PERMISSION TO REPRODUCE ANDDISSEMINATE THIS MATERIAL HAS
BEEN GRANTED BY
TO THE EDUCATIONAL RESOURCESINFORMATION CENTER (ERIC)
Level 1
Check here for Level 1 release, permitting reproductionand dissemination in microfiche or other ERIC archival
media (e.g., electronic) and paper copy.
Signhere,-)please °rganizawn'Addre"
.0-06 ittp(a, AA
CMiWk
The sample sticker shown below will beaffixed to all Level 2A documents
PERMISSION TO REPRODUCE ANDDISSEMINATE THIS MATERIAL IN
MICROFICHE, AND IN ELECTRONIC MEDIAFOR ERIC COLLECTION SUBSCRIBERS ONLY,
HAS BEEN GRANTED BY
2A
TO THE EDUCATIONAL RESOURCESINFORMATION CENTER (ERIC)
Level 2A
Check here for Level 2A release, permitting reproductionand dissemination in microfiche and in electronic media
for ERIC archival collection subscribers only
The sample sticker shown below will beaffixed to all Level 28 documents
PERMISSION TO REPRODUCE ANDDISSEMINATE THIS MATERIAL IN
MICROFICHE ONLY HAS BEEN GRANTED BY
2B
TO THE EDUCATIONAL RESOURCESINFORMATION CENTER (ERIC)
Level 2B
Check here for Level 2B release, pemefingreproduction and dissemination In microfiche only
Documents will be processed as indicated provided reproduction quality permits.if permission to reproduce Is granted, but no box is checked, documents will be processed at Level 1.
I hereby grant to the Educational Resources Information Center (ERIC) nonexclusive permission to reproduce and disseminate this documentas indicated above. Reproductidh from the ERIC microfiche or electronic media by persons other than ERIC employees and its systemcontractors requires permission from the copyright holder. Exception is made for non-profit reproduction by libraries and other service agenciesto satisfy information needs of educators in response to discrete inquiries. we tAkt,tuy2 \IIIALC w1-42 poB.
C,e
al. 0. V. tett6-k \Ne rPrinted Nene/Positiorattie:
Telephone: FAX(0014t act4 (i) 1 (0041- gq - ted
0OPIVIlls a .'say c)1.400
III. DOCUMENT AVAILABILITY INFORMATION (FROM NON-ERIC SOURCE):
If permission to reproduce is not granted to ERIC, or, if you wish ERIC to cite the availability of the document from another source, pleaseprovide the following information regarding the availability of the document. (ERIC will not announce a document unless it is publiclyavailable, and a dependable source can be specified. Contributors should also be aware that ERIC selection criteria are significantly morestringent for documents that cannot be made available through EDRS.)
Publisher/Distributor:
Addreis:
o.
Price:
IV. REFERRAL OF ERIC TO COPYRIGHT/REPRODUCTION RIGHTS HOLDER:
If the right to grant this reproduction release is held by someone other than the addressee, please provide the appropriate name andaddress:
Name:
Address:
V. WHERE TO SEND THIS FORM:
Send this form to the following ERIC Clearinghouse:
ERIC Clearinghouse on
Languages & Linguistics4646 40TH ST. NW
WASHINGTON, D.C. 20016.1859
However, if solicited by the ERIC Facility, or if making an unsolicited contribution to ERIC, return this form (and the document beingcontributed) to:
ERIC Processing and Reference Facility1100 West Street, 2nd Floor
Laurel, Maryland 20707-3598
'Telephone: 301-4974080Toll Free: 800-799-3742
FAX: 301-953-0263e-mall:-,[email protected]
VYVVW:,.tittp://ericfac.piccard:psc,com
EFF-088 fRev. 9/97) .
PREVIOUS VERSION'S 'OF THIS FORM ARE OBSOLETE.