Embed Size (px)
Citation preview

ED 439 965
AUTHORTITLEINSTITUTION
SPONS AGENCYISBNPUB DATENOTE
CONTRACTAVAILABLE FROM
PUB TYPEEDRS PRICEDESCRIPTORS
IDENTIFIERS
ABSTRACT
DOCUMENT RESUME
SE 063 489
Baroway, WilliamConstruct-a-Boat. Science by Design Series.TERC, Cambridge, MA.; National Science Teachers Association,Arlington, VA.National Science Foundation, Arlington, VA.ISBN-0-87355-178-82000-03-00107p.; For other books in the Science by Design Series, seeSE 063 488-491.ESI-9252894; ESI-9550540NSTA Press, 1840 Wilson Blvd., Arlington, VA 22201-3000. Website: http://www.nsta.org.Books (010) Guides - Classroom Teacher (052)MF01/PC05 Plus Postage.*Construction (Process); *Design; High Schools; MaritimeEducation; Physics; Problem Solving; Research Methodology;*Resource Materials; *Science Activities; Teaching Methods;Technology*Boats
This book is one of four books in the Science-by-DesignSeries created by TERC and funded by the National Science Foundation (NSF).It challenges high school students to investigate the physics of boatperformance and work with systems and modeling. Through research, design,testing, and evaluation of a model boat, students experience the practicalapplication of mass, speed, and acceleration while applying the math andscience necessary to build a scale model. The activities have assessmentsuggestions and Internet extensions through the National Science TeachersAssociation's (NSTA) sciLINKS program and are designed to meet the newInternational Technology Education Standards as well as the National ScienceEducation Standards. Key ideas include: (1) "Forces, Speed, andAcceleration"--as they seek to meet the design specifications of the boat,students learn about mass, speed, acceleration, and forces through practicalapplication of these concepts. Students investigate the relationships amongthese variables through qualitative observation and quantitative measurementof changes and rates of change in each variable; (2) "Systems"--students workwith variables to study system behavior and learn to construct the feedbackloops that determine the limits of model boat performance; (3)
"Modeling"--students apply the science and math necessary to build anaccurate scale model and extend this analysis to computer modeling. Homeworkand class assignments guide students through problem-solving in algebra,plane and solid geometry, and making connections to other disciplines; and(4) "Inquiry and Design"--students undertake inquiry and design as iterative,multi-disciplinary processes through which to develop abilities inidentifying, creating, investigating, decision-making, building, testing, andevaluating. Appendices contain inquiry and design processes, textreconstruction, and sample answers. (Contains a glossary and 26 references.)(CCM)
Reproductions supplied by EDRS are the best that can be madefrom the original document.

ts#
tr)C)Ch
di
press BEST COPY AVAILABLE
NATIONAL SCIENCE TEACHERS ASSOCIATICN
2
U S DEPARTMENT OF EDUCATIONOffice of Educational Research and Improvement
EDUCATIONAL RESOURCES INFORMATIONCENTER (ERIC)
This document has been reproduced asawed from the person or organization
originating it
Minor changes have been made toimprove reproduction qualify
Points of view or opinions stated in thisdocument do not necessarily representofficial OERI position or policy
-1*

Construct-a-BoatDeveloped by TERC
Lead author: William Baroway
This curriculum was developed by TERC,Cambridge, Massachusetts. Funded in part
by a grant from the National ScienceFoundation.
National Science Teachers Association1840 Wilson Boulevard
Arlington, VA 22201http: www.nsta.org
3
X0.4%*AmAssitT E R C'
pressNATIONAL SCIENCE lEACHERS ASSOCIAJION

NATIONAL SCIENCE TEACHERS ASSOCIATION
Shirley Watt Ireton, DirectorBeth Daniels, Managing EditorErin Miller, Associate EditorJessica Green, Assistant EditorAnne Early, Editorial Assistant
Art and DesignKim Alberto, Director
NSTA WebTim Weber, Webmaster
OutreachMichael Byrnes, Editor-at-LargePeriodicals PublishingShelley Carey, Director
Printing and ProductionCatherine Lorrain-Hale, Director
Publications OperationsErin Miller, Manager
sciLINKSTyson Brown, Manager
National Science Teachers AssociationGerald F. Wheeler, Executive Director
David Beacom, Publisher
NSTA Press, NSTA Journals, and the NSTA
Web site deliver high-quality resources for
science educators.
© 2000 by the National Science Teachers Association. The mission of the National Science TeachersAssociation is to promote excellence and innovation in science teaching and learning for all.
Permission is granted in advance for the reproduction of short portions of this book for the purpose ofclassroom or workshop instruction. To request permission for other uses, send specific use requests to:
NSTA Press1840 Wilson BoulevardArlington, VA 22201-3000http://www.nsta.org/
Science by Design: Construct-a-BoatLibrary of Congress Catalog Card Number 00-131680NSTA Stock Number: PB152X2ISBN 0-87355-178-8Printed in the United States of America by Automated Graphic Systems, Inc.Printed on recycled paper
All rights reserved. No part of this publication may be reproduced, stored in a retrieval system, ortransmitted, in any form or by any means, electronic, mechanical, photocopying, recording, or otherwise,without the prior written permission of the copyright owner.
This book was prepared with the support of the National Science Foundation under Grant Nos. ESI-9252894and ESI-9550540. However, any opinions, findings, conclusions, and/or recommendations herein are thoseof the authors and do not necessarily reflect the views of the National Science Foundation.
NationalScienceTeachersAssociation
4

C ledgMenr 1;Zs
Thecreation of the NSTA Science by Design series builds on five years of
research and development at TERC. This work was funded by two National ScienceFoundation grants: ESI-9252894 and ESI-9550540 and was directed by John Foster,David Crismond, William Barowy, and Jack Lochhead.
We are especially grateful for the vision, guidance, and prodding of our programofficer, Gerhard Sa linger, who was our GPS in uncharted territory.
We were helped in innumerable ways by an especially insightful advisory board: JoanBaron, Goery Delacote, Andy DiSessa, Woodie Flowers, John Foster, Mike Hacker,Colleen Hill, Gretchen Kalonji, Robert McCormick, Jim Minstrel, Jim Neujahr, andDavid Perkins.
The members of the TERC team who contributed to the development and testing ofthe Science by Design units include:
Tim BarclayWilliam BarowyCathy CallJudith CollisonDavid CrismondBrian DraytonChristine DiPietrantonioJoni FalkJohn FosterJune FosterRiley HartNathan Kimball
Felicia LeeJack LochheadTasha MorrisTracy NobleAlison PaddockMeghan PfisterLee PulisJerry TougerMargaret VickersPaul WagonerKelly WeddingAmy Weinberg
Special mention must be made of the enthusiasm, dedication, and long hours con-tributed by David Crismond and Earl Canyon. The following hard-working consultantsadded greatly to our efforts: Hilton Abbott, Robert B. Angus, Carol Ascher, Warren R.Atkinson, Earl Canyon, Michael Clarage, Jan Hawkins, Kathy Kittredge, Crispin Miller,James E. LaPorte, Kjell-Jan Rye, Rick Satchwell, Mike Stevens, and Ron Todd.
The authors of the final Science by Design units were William Barowy, Felicia Lee, JackLochhead, Alison Paddock, and Lee Pulis of TERC.
Science by Design: Construct-a-Boat was produced by NSTA Press: Shirley Watt Ireton,director; Beth Daniels, managing editor; Erin Miller, associate editor; Jessica Green,assistant editor; Michelle Treistman, assistant editor; Anne Early, editorial assistant.Beth Daniels was project editor for the Science by Design series. The cover design andbook design are by Camden Frost and Vicky Robinson of Graves Fowler Associates.

Field testing of the Science by Design series depended on the dedication of dozensof teachers and the helpful cooperation of their school systems:
Jerian Abel, Northwest RegionalEducation Laboratory
Bruce Andersen, Buker Middle SchoolDave Armstrong, Lawrence Middle SchoolHenry Bachand, Mansfield High SchoolHilda Bachrach, Dana Hall SchoolRonald Bjorklund, Leicester High SchoolMarcella Boyd, Manchester Junior High
SchoolKaren Bouffard, Governor Dummer
AcademyAlthea Brown, Medford High SchoolLee Burgess, Lawrence Middle SchoolDavid Corbett, Whittier Regional
Vocational Technical High SchoolSteve Cremer, Braintree High SchoolDeborah Crough, Long Beach High SchoolRon Daddario, McCall Middle SchoolRaymond P. Gaynor, Reid Middle SchoolElizabeth George, Westborough High
SchoolPam Glass, Talbot Middle SchoolRick Harwood, Ware High SchoolGary Herl, Tantasqua Regional Junior
High SchoolKate Hibbitt, Lincoln SchoolPatrick Keleher, Norwood Junior High
SchoolMarty Kibby, Minetron Technology
Education OfficeMatias Kvaternik, Chelmsford Public
Charter SchoolJeff Leonard, F.A. Day Middle School
Walter Lewandowsler, Bartlett HighSchool
David R. Littlewood, Agawam Junior HighSchool
John Matthews, Southwick TollandRegional High School
Ellen McCormack, South Jr. High BrocktonScott McDonald, Needham High SchoolBrian McGee, Lexington Middle SchoolBob Meltz, Manchester Junior-Senior
High SchoolCharles O'Reilly, Lexington High SchoolConstance Patten, Lincoln-Sudbury High
SchoolFred Perrone, East Junior High SchoolJoe Pignatiello, Somerville High SchoolDoug Prime, Lancaster Middle SchoolMichael Rinaldi, Bedford High SchoolThomas Rosa, Walsh Middle SchoolEugene A. Santoro, Silver Lake Regional
High SchoolJohn Schott, Smith AcademyBruce Seiger, Wellesley High SchoolDouglas Somerville, Woodword Middle
SchoolJohn Stamp, Manchester High SchoolMike Stevens, Maynard High SchoolMichael Sylvia, Charles E. Brown Middle
SchoolSyd Taylor, Mahar Regional SchoolTed Vining, Monument Regional High
SchoolFrank Viscardi, Framingham High School
This project would not have been possible without the help and critique of hundredsof students whom we regretfully cannot mention by name.
6

INTRODUCTION
A Note from the Developers 1
Key Ideas 2
Assessment 3
Standards and Benchmarks Connections 4
sciLIN KS 6
Course Outline 7
ACTIVITY 1: Design Brief
Student Activity Pages
Model Boat Design Brief 9
Snapshot of Understanding 10
Scale Modeling at Work 12
Teacher Pages
OverviewDesign Brief 13
Teaching Suggestions 13
Miscellaneous Suggestions 14
ACTIVITY 2: Quick-Build Model Boat
Student Activity Pages
Quick-Build Model Boat 16
Quick-Build Specifications 17
Blueprint 18
Electrical Drawings 19
Electrical Switch Detail Drawing 20
Making the Test Tank 21
Exploring the Model Boat System 22
Systems Modeling Introduction 24
Causal Relationships 25
Teacher Pages
OverviewQuick-Build 27
Teaching Suggestions 27
Miscellaneous Suggestions 28
ACTIVITY 3: Research
Student Activity Pages
OverviewResearch 30
Baseline Measurements 31
7
Organizing the Data 32
Identifying Variables 34
Working with the Variables 37
Scale Model Preparation Homework 38
Applications of Scaling 39
Scale Model Extensions Homework 40
Fluid Friction Dynamics 41
Minimizing Surface Area 42
Teacher Pages
OverviewResearch 44
Teaching Suggestions 45
ACTIVITY 4: Development
Student Activity Pages
OverviewDevelopment 49
Designer Problem 50
Builder Problem 51
Prototype Construction 52
Evaluating Your Design 53
Teacher Pages
OverviewDevelopment 55
Teaching Suggestions 55
ACTIVITY 5: Communication
Student Activity Pages
OverviewCommunication 58
Creating a Project Report 59
Presentation 60
Reflection and Recommendations 61
Snapshot of Understanding 62
Teacher Pages
OverviewCommunication 64
Teaching Suggestions 64
8

APPENDIX A: Side Roads
Side Roads 66
Inquiry Process 67
Modeling Design Solutions 69
Design Process 70
Charting a Mathematical Model 72
Simulating Model Calculations 75
Snapshot of Understanding: Models 78
Snapshot of Understanding: Control of Variables 79
APPENDIX B: Text Reconstruction
Text Reconstruction 81
Forces, Speed, and Acceleration Exercise 82
Systems Exercise 84
Modeling Exercise 85
Forces, Speed, and Acceleration Text Reconstruction Key 87
Systems Text Reconstruction Key 89
Modeling Text Reconstruction Key 90
APPENDIX C: Sample Answers
Organizing the Data 92
Scale Model Extensions Homework 93
Minimizing Surface Area 93
Builder Problem 94
Prototype Construction 94
GLOSSARY 95
REFERENCES 96

,ntroduction
A NOTE FROM THE DEVELOPERS
Integrating Science and TechnologyConstruct-a-Boat is aligned with the National Science Education Standards for
process and content standards in both physical science and mathematics. This
alignment, is illustrated on pages four and five. Through inquiry and design, students
develop conceptual understanding of electromechanical energy transfer, friction, and
mathematical modeling. Because design activities motivate inquiry, and inquiry
informs design, students engage in the iterative processes of scientific inquiry and
technological design through a variety of hands-on activities.
Compare these materials to a highway: if you rush straight through, your students
will learn only a little about the territory they have crossed. We provide a number of
interesting side roads, which offer additional opportunities to investigate the linkage
of inquiry and design. For your first trip, you may want to stay close to the highway,
but as you gain experience, we hope you will drift further and further from it.
Schedule and CostThe minimum time needed to complete the core unit is about 14-19 class sessions.
More time will be needed if you choose to extend the unit either by undertaking a
more advanced design and fabrication process, or by pursuing more advanced
treatment of mathematical modeling.
Working in teams, students make a Quick-Build model boat using the Design Brief
challenge and instructions for (about three class sessions). During the research and
development phases (8-12 class sessions), students take baseline measurements,
identify relevant variables, design and conduct experiments, study the model boat
system, propose conceptual models, and generate possible solutions to their design
problems. Students develop designs, build the models, conduct further investiga-
tions, analyze their data, and redesign their models if necessary. The unit concludes
with student presentations of products, including supporting scientific arguments
(threefour class periods).
We suggest that you impose a very low cost limit on materials ($1 to $2 per student)
and encourage the use of recycled materials.
Construct-a-Boat works well in a physical science, technology, or mathematics course.
You may wish to coordinate instruction of relevant topics with teachers of other
courses.
CONSTRUCT-A-BOAT
i0
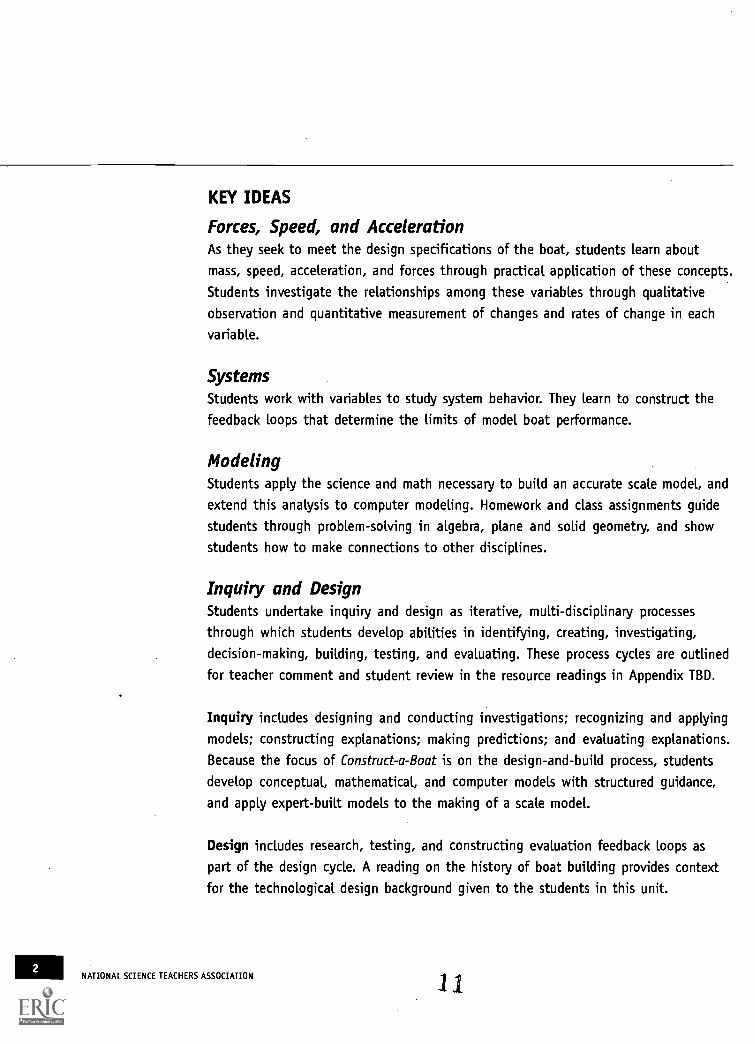
KEY IDEAS
Forces, Speed, and AccelerationAs they seek to meet the design specifications of the boat, students learn about
mass, speed, acceleration, and forces through practical application of these concepts.
Students investigate the relationships among these variables through qualitative
observation and quantitative measurement of changes and rates of change in each
variable.
SystemsStudents work with variables to study system behavior. They learn to construct the
feedback loops that determine the limits of model boat performance.
ModelingStudents apply the science and math necessary to build an accurate scale model, and
extend this analysis to computer modeling. Homework and class assignments guide
students through problem-solving in algebra, plane and solid geometry, and show
students how to make connections to other disciplines.
Inquiry and DesignStudents undertake inquiry and design as iterative, multi-disciplinary processes
through which students develop abilities in identifying, creating, investigating,
decision-making, building, testing, and evaluating. These process cycles are outlined
for teacher comment and student review in the resource readings in Appendix TBD.
Inquiry includes designing and conducting investigations; recognizing and applying
models; constructing explanations; making predictions; and evaluating explanations.
Because the focus of Construct-a-Boat is on the design-and-build process, students
develop conceptual, mathematical, and computer models with structured guidance,
and apply expert-built models to the making of a scale model.
Design includes research, testing, and constructing evaluation feedback loops as
part of the design cycle. A reading on the history of boat building provides context
for the technological design background given to the students in this unit.
NATIONAL SCIENCE TEACHERS ASSOCIATION 11

ASSESSMENT
Student activity sheets may be used for formative or summative assessment. The
first Snapshot of Understanding is intended as a pre-learning index of prior
knowledge. It may be compared to similar answers on the final Snapshot given at the
end of the last activity, for student self-assessment of learning. Because group work
is stressed throughout the unit, group assessment may prove to be more appropriate
than individual scores. However, depending on your class objectives, homework
assignments may provide the best measure of individual performance.
Portfolio Suggestions
A portfolio can be a useful tool for maintaining individual accountability in a team-
work environment, because in a portfolio, students can capture representative
samples of their work done over time. One resource among the many guides to
portfolio assessment is:
Portfolio Assessment: A Handbook for Educators by James Barton and Angelo
Collins, Addison-Wesley, 1997.
Potential Portfolio ItemsThe following set of items and products can be accumulated in portfolios for
summative assessment. Each corresponds to a core or enrichment activity outlined in
the Activities Overview schematic on page six. They are (with handouts printed in
italics):
i7 Initial questions: Design BriefE)' Individual information search
Sketch of boat hull design
(i. Brainstorming record(7 List of variables[7 Research and results1/ Group process description: The Inquiry Process
k2. Group process description: The Design Process
tZ7 Prototype demonstration notesGroup summary documentation: Product Prospectus
Post-test and self-assessment: Snapshot of Understanding
CONSTRUCT-A-BOAT
I2
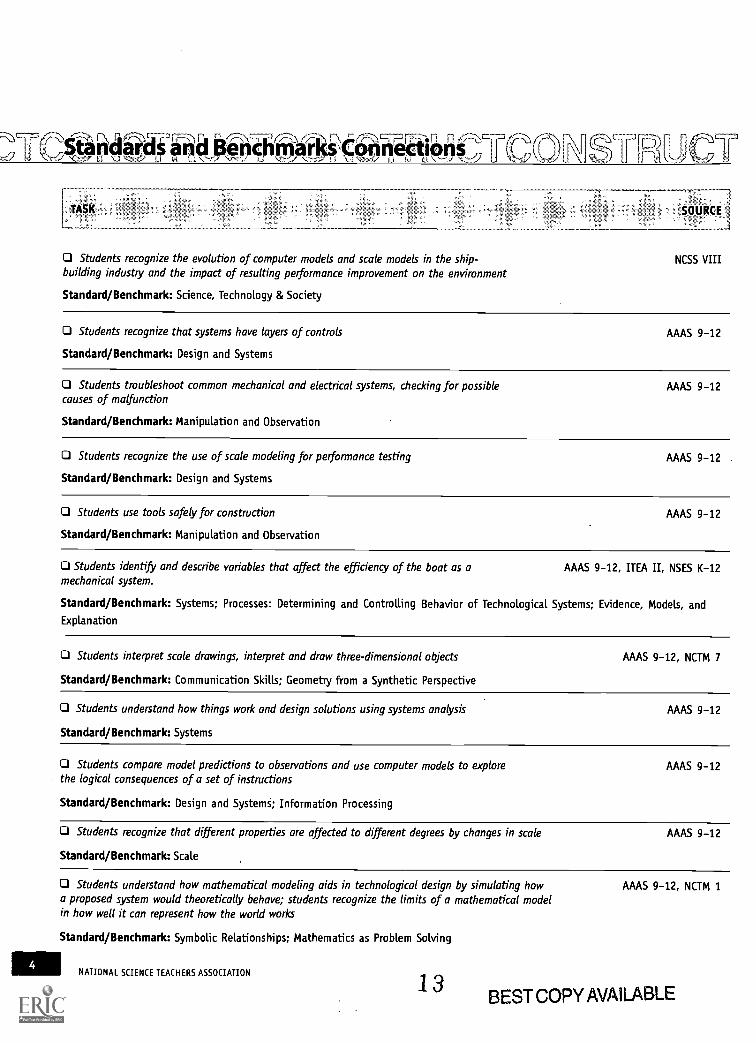
Standards an,
TASK SOURCE
Students recognize the evolution of computer models and scale models in the ship-building industry and the impact of resulting performance improvement on the environment
Standard/Benchmark: Science, Technology & Society
NCSS VIII
Students recognize that systems have layers of controls
Standard/Benchmark: Design and Systems
AAAS 9-12
Students troubleshoot common mechanical and electrical systems, checking for possiblecauses of malfunction
Standard/Benchmark: Manipulation and Observation
AAAS 9-12
Students recognize the use of scale modeling for performance testing AAAS 9-12
Standard/Benchmark: Design and Systems
O Students use tools safely for construction AAAS 9-12
Standard/Benchmark: Manipulation and Observation
0 Students identify and describe variables that affect the efficiency of the boat as amechanical system.
Standard/Benchmark: Systems; Processes: Determining and Controlling Behavior of Technological Systems; Evidence, Models, and
Explanation
AAAS 9-12, ITEA II, NSES K-12
Students interpret scale drawings, interpret and draw three-dimensional objects AAAS 9-12, NCTM 7
Standard/Benchmark: Communication Skills; Geometry from a Synthetic Perspective
Students understand how things work and design solutions using systems analysis AAAS 9-12
Standard/Benchmark: Systems
Students compare model predictions to observations and use computer models to explore AAAS 9-12
the logical consequences of a set of instructions
Standard/Benchmark: Design and Systems; Information Processing
Students recognize that different properties are affected to different degrees by changes in scale AAAS 9-12
Standard/Benchmark: Scale
O Students understand how mathematical modeling aids in technological design by simulating howa proposed system would theoretically behave; students recognize the limits of a mathematical modelin how well it can represent how the world works
Standard/Benchmark: Symbolic Relationships; Mathematics as Problem Solving
4NATIONAL SCIENCE TEACHERS ASSOCIATION
13
AAAS 9-12, NCTM 1
BEST COPY AVAILABLE

+ASK
O Students recognize tables, graphs, and symbols as alternative ways to represent data andrelationships that can be translated from one to another, and use computer for producing tables
and graphs and for making spreadsheet calculations
Standard/Benchmark: Symbolic Relationships; Manipulation and Observation
SOURCE
J
AAAS 9-12
Students model real-world phenomena with a variety of functions, represent and analyzerelationships using tables, verbal rules, equations, and graphs to translate among tabular,symbolic, and graphical representations of functions
Standard/Benchmark: Functions
NCTM 6
Students design and conduct a scientific investigation, formulate and revise scientific NSES 9-12
explanations and models using logic and evidence
Standard/Benchmark: Science as Inquiry
Students observe that objects change their motion only when a net force is applied NSES 9-12
Standard/Benchmark: Physical Science
O Students develop abilities of technological design including brainstorming design ideas,
choosing among alternative solutions, implementing a proposed solution, and evaluatingthe solution and its consequences
Standard/Benchmark: Science and Technology
NSES 9-12
Students communicate the design problem, process, and solution, and write clear, AAAS 9-12, NSES 9-12
step-by-step instructions for conducting investigations
Standard/Benchmark: Communication Skills; Science and Technology
Students self-assess their learning by comparing pre- and post-Snapshots of Understanding AAAS 9-12, NCSS VIII
Standard/Benchmark: Issues in Technology; Science, Technology, and Society
SOURCE KEY:
AAAS American Association for the Advancement of Science. 1993. Project 2061: Benchmarks for Science Literacy. New York: Oxford
University Press.
ITEA International Technology Education Association. 1996. Technology for All Americans: A Rationale and Structurefor the Study
of Technology.
NCSS Task Force on Social Studies Teacher Education Standards. 1997. National Standards for Social Studies Teachers. Washington,
DC: National Council for the Social Studies.
NCTM National Council for Teachers of Mathematics. 1991. Professional Standards for Teaching Mathematics. Reston, VA: NCTM.
NSES National Research Council. 1996. National Science Education Standards. Washington DC: National Academy Press.
BESTCOPYAVAlLAIKE14
CONSTRUCT-A-BOAT
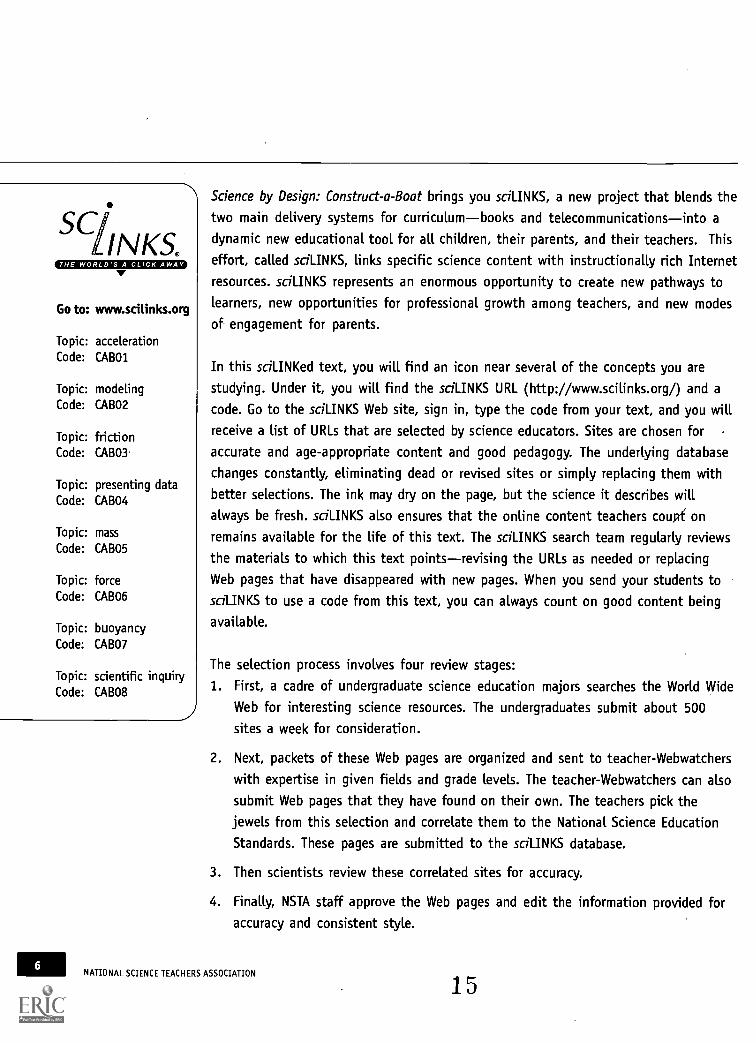
SC/L INKS.
Go to: www.scilinks.org
Topic: accelerationCode: CABO1
Topic: modelingCode: CABO2
Topic: frictionCode: CABO3
Topic: presenting dataCode: CABO4
Topic: massCode: CABO5
Topic: forceCode: CABO6
Topic: buoyancyCode: CABO7
Topic: scientific inquiryCode: CABO8
6
Science by Design: Construct-a-Boat brings you sciLINKS, a new project that blends the
two main delivery systems for curriculumbooks and telecommunicationsinto adynamic new educational tool for all children, their parents, and their teachers. This
effort, called sciLINKS, links specific science content with instructionally rich Internet
resources. sciLINKS represents an enormous opportunity to create new pathways to
learners, new opportunities for professional growth among teachers, and new modes
of engagement for parents.
In this sciLlNKed text, you will find an icon near several of the concepts you are
studying. Under it, you will find the sciLINKS URL (http: / /www.scilinks.org /) and a
code. Go to the sciLINKS Web site, sign in, type the code from your text, and you will
receive a list of URLs that are selected by science educators. Sites are chosen for
accurate and age-appropriate content and good pedagogy. The underlying database
changes constantly, eliminating dead or revised sites or simply replacing them with
better selections. The ink may dry on the page, but the science it describes will
always be fresh. sciLINKS also ensures that the online content teachers coup on
remains available for the life of this text. The sciLINKS search team regularly reviews
the materials to which this text pointsrevising the URLs as needed or replacing
Web pages that have disappeared with new pages. When you send your students to
sciLINKS to use a code from this text, you can always count on good content being
available.
The selection process involves four review stages:
1. First, a cadre of undergraduate science education majors searches the World Wide
Web for interesting science resources. The undergraduates submit about 500
sites a week for consideration.
2. Next, packets of these Web pages are organized and sent to teacher-Webwatchers
with expertise in given fields and grade levels. The teacher-Webwatchers can also
submit Web pages that they have found on their own. The teachers pick the
jewels from this selection and correlate them to the National Science Education
Standards. These pages are submitted to the sciLINKS database.
3. Then scientists review these correlated sites for accuracy.
4. Finally, NSTA staff approve the Web pages and edit the information provided for
accuracy and consistent style.
NATIONAL SCIENCE TEACHERS ASSOCIATION
1.5

n,Course Outhne-
Design BriefModel Boat Design BriefSnapshot of UnderstandingScale Modeling at Work
Quick-Build Model BoatQuick-Build SpecificationsBlueprintElectrical DrawingsElectrical Switch Detail DrawingMaking the Test TankExploring the Model Boat SystemSystems Modeling
ResearchOverviewBaseline MeasurementsIdentifying VariablesScale Model Preparation
HomeworkApplication of ScalingScale Model Extension
Fluid Friction DynamicsMinimizing Surface Area
DevelopmentOverviewDesigner ProblemBuilder ProblemPrototype ConstructionEvaluating Design
CommunicationOverviewCreating a Project ReportPresentationSnapshot of Understanding
°16CONSTRUCT-A-BOAT
7

r-7w--47 , IItYl 2 , kJ.
8
(34 $
*F
NATIONAL SCIENCE TEACHERS ASSOCIATION
5'
L
Design Brief
17

MODEL BOAT DESIGN BRIEF
You are an employee of Quality Boat Systems (QBS), a company that
designs boat hulls for carrying people and cars. Like many other boatdesign companies, QBS has been able to develop cost-effective, high-performance hulls by computer modeling and testing scale models. Yourcustomers want boats that will speed up service. QBS scientists say thatthe way to do this is to maximize the boat's acceleration and its topspeed. Your team's challenge is to research how to improve accelerationand top speed by redesigning the boat hull.
Scope of Work
'a Make a Quick-Build according to plans and collect baselineperformance data
'0 Identify and research key design features
'a Redesign the model hull to improve performance
0 Test the new design to calculate percent improvement inperformance
Document progress, design improvements and tests
'a Write a report and present your work
If successful, your new design will perform better than the Quick-Buildmodel.
Salespeople have determined that the QBS company can sell boats tocustomers with the following specifications similar to the M/V Nantucket:
Performance SpecificationsMaximum top speed: 30 km/hrFuel consumption: 350 liters/hr
Physical SpecificationsWeight: 1170 metric tonsBeam: 18 metersPassenger capacity: 1100
(including crew)
Maximum acceleration: 0.1 m/sec2Power twin 3,000 horsepower turbine
Length overall: 70 metersVehicle capacity: 60 mid-size cars
18 CONSTRUCT-A-BOAT9

10
hat I already know about models, systems, anddesign.
The unit of study you are about to begin will challenge you to design,build, and test the performance of a model boat. To meet this challenge,you will have to investigate the physics of performance and the conceptsof a model boat system. Before you begin, record a sampling of what youalready know by answering the questions below. This is not a test; rather,it is a series of questions that ask about your current knowledge of keyideas in this unit. At the end of the unit, you will answer similar ques-tions and compare what you have learned.
1. What are some of the factors that would have significant effects on thespeed and acceleration of a model boat?
2. Do these factors have any effect on each other? If so, what mightthose effects be?
3. What are models used for?
NATIONAL SCIENCE TEACHERS ASSOCIATION
19
4. What is a system?
5. Have you ever designed a project or built something with tools?
If yes, describe your project and list your major process stages fromconcept to finish. If no, think about and list what steps you might gothrough to design and build a boat hull for higher performance.
6. Describe an experiment that determines which of two boats has greateracceleration.
I
SC/LINKS®
Topic: accelerationGo to: www.scilinks.orgCode: CABO1
CONSTRUCT-A-BOAT11

SC/INKS.
Topic: modelingGo to: www.scilinks.orgCode: CABO2
12
'\ SCALE MODELING AT WORK: TESTING SHIP PERFORMANCE
In ship building, scale models are basically small versions of the shipthat the designer wants to make. It is important that the model looks
like the ship and acts like the ship. Ship designers often do their testingon models in order to develop cost-effective, high-performance ships.Testing is cheaper, less time-consuming, and safer when carried out onmodels rather than on full scale ships.
By placing the model in a test tank, designers can measure handlingcharacteristics such as stability in heavy seas, resistance to forward mo-tion, and power required to move at a certain speed.
Sometimes ship designers must build and test several models, particularlyif they are working under strict requirements regarding speed, fuel cost,and the ship's effect on the environment. Years ago, one or two tests wereenough to ensure that the actual ship would satisfy design requirements.Today, however, ship designers must find ways to lower fuel costs andreduce pollution from engines, so it has become more important to designefficient hulls. Designers often test models and make modifications manytimes for each design.
One measure of ship designers' success with models is how much they canreduce the cost of running a ship over a 20-year lifespan. It is not un-usual to obtain a 10-15 percent improvement as a result of careful modeltesting. These gains can be obtained by making small changes in theshape and finish of the hull, the size of the propellers, or the power of theengine.
On new cruise liners, fuel costs have been reduced by 10-15 percent through model testing.
NATIONAL SCIENCE TEACHERS ASSOCIATION
21

Pages: cti*,1.04.\ r
OVERVIEW DESIGN BRIEF
r: eve students the Design Brief and
U the Snapshot of Understanding.
Initiate class discussion and highlight
important design issues.
Construct-a-Boat Challenge toStudentsEach student, as a member of a product
research and development team, is to
research how to improve acceleration
and top speed by redesigning a boat
hull. If successful, the new design will
perform better than the Quick-Build
model.
SHOTerstanding:
Working individually,
students answer
questions about their
prior experience with
modeling and with
designing experi-
ments.
Homework (optional): Students might
read about the history of boat building
to understand boat design as it has
evolved from a craft to the highly
developed computer modeling tech-
niques of today.
TEACHING SUGGESTIONS
IntroductionHand out the Design Brief student
activity sheets. Ask students to keep
these and future sheets together and
to bring them to the classroom with
other notes to serve as a record and
reference for daily activity (and assess-
ment) in the unit. Advise students that
they will work in teams, use processes
of technological design and scientific
inquiry, and that other teams will
critique their prototype with respect to
the challenge criteria.
Students are also required to document
their activity in a Lab Journal in order
to contribute effectively to the final
team presentation and to enhance their
individual portfolios. Be clear on your
rubrics for assessing work and share
them with students. Indicate which
activities will be individually graded
and which will be given a team score.
Be prepared to justify team scoring if
some students (or parents) are not
used to the idea.
If computer modeling, Computer Aided
Design (CAD), or Computer Aided
Modeling (CAM) activities will be
involved, you may want to mention
this at the beginning of the unit, buthold introduction of the equipment
until a later class.
22
MATERIALS
Student Activity SheetsCourse Outline
Design Brief
Snapshot of
Understanding
Ring, Pocket, or Folio Binder(student supplied) for
keeping student activity
sheets, notes, Lab Journal,
and drawings for reference
and portfolio
PREPARATION
Read and become familiar
with the entire unit.
Define your assessment
system with a clear, simple
description.
Locate optional homework
readings. These should
feature local boat buildingactivities: traditional or
contemporary.
CONSTRUCT-A-BOAT13
Pre-AssessmentHand out the Snapshot of Understand-
ing. Emphasize that it is not a test, and
that students will not be graded on
this activity. The purpose of the
Snapshot is self-diagnosticto findout what students know initially about
the key science and technology learn-
ing objectives of Construct-a-Boat.
An inventory of students' prior knowl-
edge is an important teaching and
learning tool. Not only does the
inventory help guide students toward
the concepts they need to learn the
most, but it also prepares them to
accept new information in a manner
that ties meaningfully to what they
already know. At the end of Construct-a-
Boat, students will be able to compare
answers given at the beginning of the
unit to those they will answer at the
end of the unit.
Allow about 20 minutes for students to
complete the Snapshot, then collect
and retain.
NATIONAL SCIENCE TEACHERS ASSOCIATION 23
MISCELLANEOUSSUGGESTIONS
This unit can be conducted with little
i or no computer use, or it can
involve some or all aspects of com-
puter modeling, data collection,
design, and manufacturing. If you
decide to use computer modeling, you
will need to introduce these concepts
briefly and indicate what level of
expertise you expect students to
acquire in these areas.

Quick-Build Model Boat
S
CONSTRUCT-A-BOAT
24

MATERIALS
polystyrene (hull)
9-volt battery
#22 AWG wire
fanbattery connector
binder clip
hot-glue
large paper clips
electrical tape
switch
TOOLSsaw
pliers
wire strippers
wire cutter
sandpaper
hot-glue gun
QUICK-BUILD MODEL BOAT
The Quick-Build is a simple model boat that you build to begin explor-ing the variables that affect boat performance. Your team can build it
quickly, within one class period. Use the specified materials to build thismodel, and follow the technical instructions. You will then use the Quick-Build to make some baseline measurements. Do not make any designchanges before you make baseline measurements! Here is why:
Building According to SpecificationsIt is important that you build according to the technical instructions anddrawings provided. The Quick-Build ensures that every team starts in thesame way, and you will be assessed on the improvements you will make tothe Quick-Build's baseline performance. You must make the baseline mea-surements before you redesign anything so that you can measure improve-ments accurately. Be sure to check with your teacher before you make anysubstitutions for materials.
In this section, you are provided with:
Materials and tools listsTechnical instructionsTechnical drawings
NATIONAL SCIENCE TEACHERS ASSOCIATION 25

QUICK-BUILD SPECIFICATIONS
Technical Instructions1. Cut the polystyrene to meet requirements for length and width of the
scale model hull according to the "Model Boat Quick-Build" blueprint.
2. Position the fan 2 cm from the Quick-Build stern. See the "Model BoatQuick-Build" blueprint for details.
3. Build the switch according to the "Electric Switch Detail Drawing."
4. Build the electric system according to the "Electrical Drawings."
5. Place the 9-volt battery and switch on the top surface of the hull. The
waterline is where the surface of the water meets the hull. Position thebattery and switch so that the waterline is parallel to the deck. Fastenthem in place using glue or tape.
6. Straighten the two outer bends of each of two paper clips, and insertthe straight end into center of the hull. The paper clip will look like anupside-down "J." See the "Model Boat Quick-Build" drawing for details.
7. All lengths must be accurate within two millimeters. This type of ac-
ceptable error margin is called tolerance.
26 CONSTRUCT-A-BOAT17

..?
27
Not
e:A
lign
cent
ers
ofbo
at h
ull,
batte
ry, s
witc
h,fa
n, a
ndpa
perc
lips
Fro
nt V
iew
1i30
.0
Top
Vie
w
Wire
9V B
atte
ry_
0
Sw
itch\4
Pap
ercl
ips
1.9
Pap
ercl
ips
f--
Fan
Pol
ysty
rene
Sid
e V
iew
Dim
ensi
ons
are
inT
itle:
Mod
el B
oat Q
uick
-Bui
ldce
ntim
eter
s-M
ater
ial:
Pol
ysty
rene
Tol
eran
ces:
Dra
wn
By:
.X -
+/-
0.2
cm
Che
cked
By:
SC
ALE
1:2
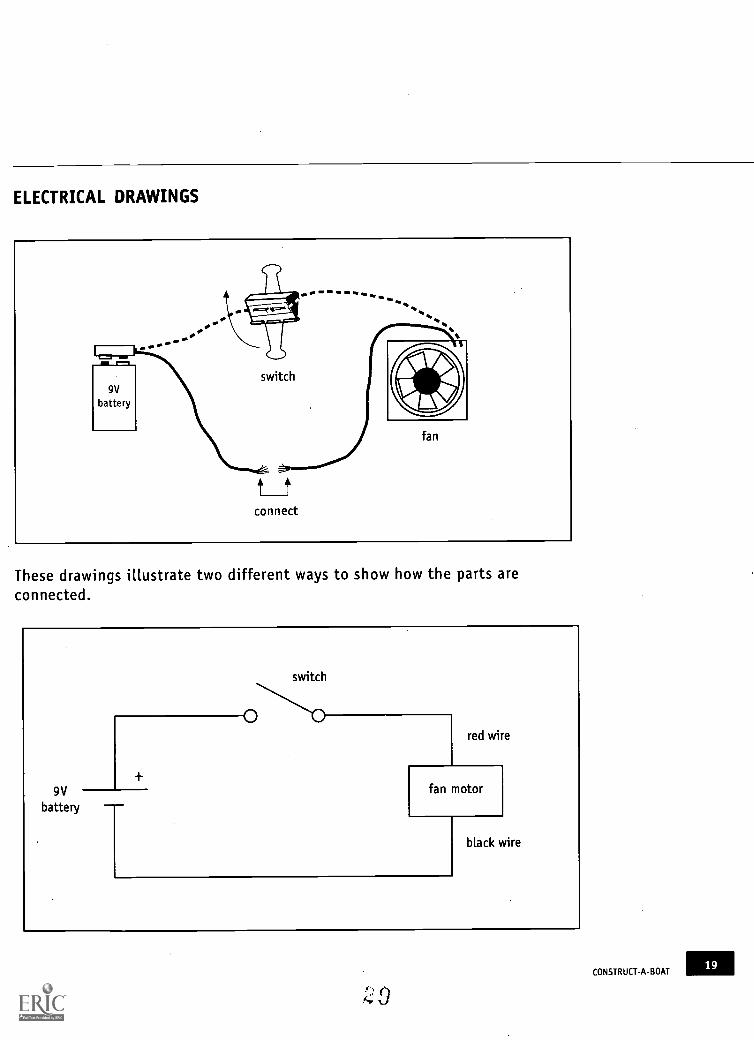
connected.These drawings illustrate two different ways to shotv how the Parts are

20
ELECTRICAL SWITCH DETAIL DRAWING
ElectricalTape
Insulator
NATIONAL SCIENCE TEACHERS ASSOCIATION
4..
30

MAKING THE TEST TANK
Materials List
Part Type Quantity
Sides wood 2.5 m x 5 cm x 10 cm 2
Seal 6 mm plastic sheet 1 roll 60 cm wide
Corner Bracket corner 30 cm
Nails 8 d 32
Duct Tape 1 roll
Guidepost 2
Guidewire monofilament fishing line 1 roll
Technical Instructions1. Fasten guideposts so that they are centered at each end of the tank.
2. Tie the monofilament fishing line to each guidepost, making sure that
the height is adjusted so that the line can run through the approxi-mate center of the paper clips on the Quick-Builds. Your ability to do
this will be affected by the height of the water.
78"
BEST COPY AVAILABLE
31CONSTRUCT-A-BOAT
21
22
EXPLORING THE MODEL BOAT SYSTEM
The Boat is a System
Asystem is a collection of interacting elements that function together
as a unit. By studying the design of a boat as a system, you begin tounderstand the reasons why a boat performs well or poorly. Then you canimprove the boat's performance by redesigning the most important ele-ments of the system.
Exploring the Model Boat SystemThe purpose of this activity is to explore the performance of your Quick-Build before you make any design changes. As you explore, keep track ofyour observations and hypotheses about what affects the speed of theboat.
ObserveRun your Quick-Build along the water tank, and observe what happens tothe boat, the guidance system, the water, etc. You don't have to take anymeasurements, just make qualitative observations. Describe what you seeand try to explain your observations in the space below.
NATIONAL SCIENCE TEACHERS ASSOCIATION 32
Make an "educated guess"Discuss with other members of your team which elements in the modelboat system will affect its performance the most. Write down what you andyour teammates think. Here are some questions to help you get started:
What makes the boat move? Is it the battery, the fan, the switch,the fishing line, or some combination of these elements?
What makes it hard for the boat to pick up speed?
You are challenged to redesign the boat hull. What part does theboat hull play in helping with the boat's performance? How does itaffect the other elements?
Do you or your team have other ideas?
33CONSTRUCT-A-BOAT
23
24
SYSTEMS MODELING INTRODUCTION
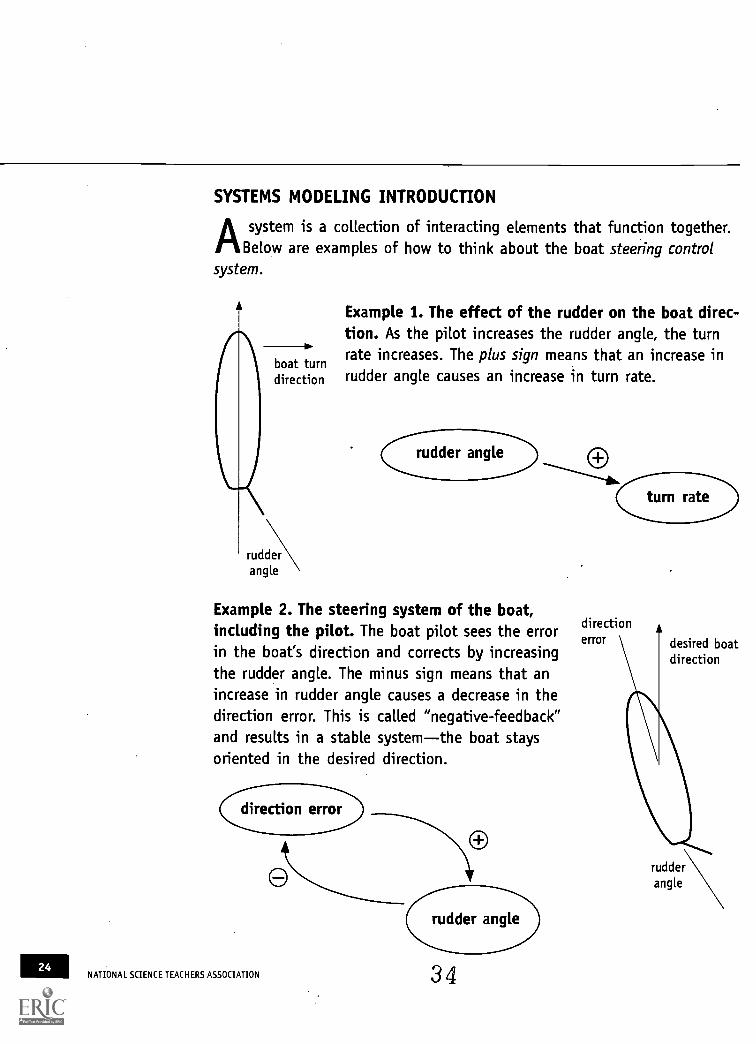
A system is a collection of interacting elements that function together.rt Below are examples of how to think about the boat steering controlsystem.
boat turndirection
rudderangle
Example 1. The effect of the rudder on the boat direc-tion. As the pilot increases the rudder angle, the turnrate increases. The plus sign means that an increase inrudder angle causes an increase in turn rate.
Example 2. The steering system of the boat,including the pilot. The boat pilot sees the errorin the boat's direction and corrects by increasingthe rudder angle. The minus sign means that anincrease in rudder angle causes a decrease in thedirection error. This is called "negative-feedback"and results in a stable systemthe boat staysoriented in the desired direction.
direction error
NATIONAL SCIENCE TEACHERS ASSOCIATION 34
directionerror desired boat
direction
rudderangle
CAUSAL RELATIONSHIPS
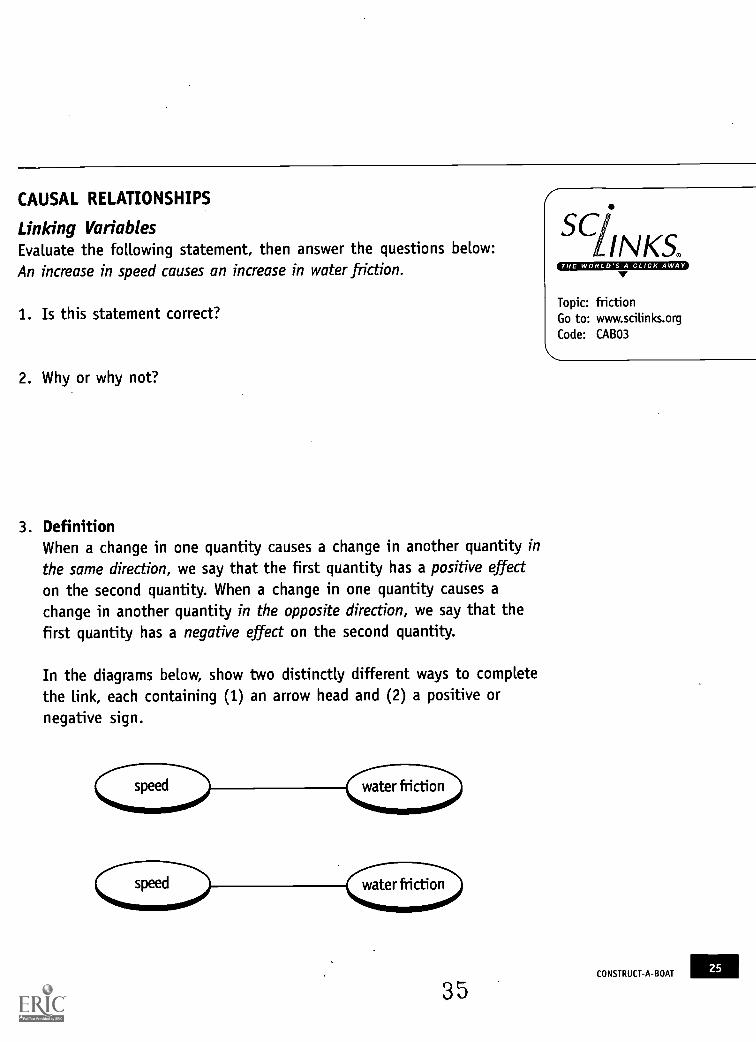
Linking VariablesEvaluate the following statement, then answer the questions below:An increase in speed causes an increase in water friction.
1. Is this statement correct?
2. Why or why not?
3. DefinitionWhen a change in one quantity causes a change in another quantity inthe same direction, we say that the first quantity has a positive effecton the second quantity. When a change in one quantity causes achange in another quantity in the opposite direction, we say that thefirst quantity has a negative effect on the second quantity.
In the diagrams below, show two distinctly different ways to completethe link, each containing (1) an arrow head and (2) a positive ornegative sign.
speed
35
SC
Topic: frictionGo to: www.scilinks.orgCode: CABO3
CONSTRUCT-A-BOAT25

4. Combine the two Links from step three to make one diagram.
5. State in words what your diagram shows.
36NATIONAL SCIENCE TEACHERS ASSOCIATION
r7-9)er Pages: #cti
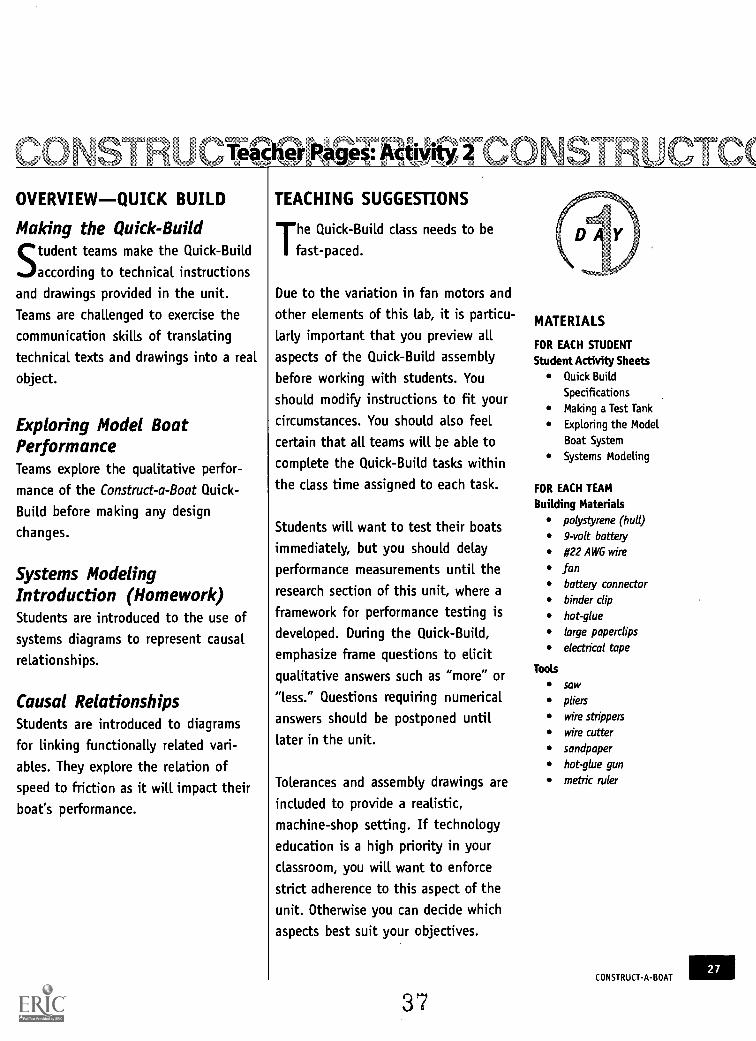
OVERVIEWQUICK BUILD
Making the Quick-BuildStudent teams make the Quick-Build
according to technical instructions
and drawings provided in the unit.
Teams are challenged to exercise the
communication skills of translating
technical texts and drawings into a real
object.
Exploring Model BoatPerformanceTeams explore the qualitative perfor-
mance of the Construct-a-Boat Quick-
Build before making any design
changes.
Systems ModelingIntroduction (Homework)Students are introduced to the use of
systems diagrams to represent causal
relationships.
Causal RelationshipsStudents are introduced to diagrams
for linking functionally related vari-
ables. They explore the relation of
speed to friction as it will impact their
boat's performance.
TEACHING SUGGESTIONS
The Quick-Build class needs to be
fast-paced.
Due to the variation in fan motors and
other elements of this lab, it is particu-
larly important that you preview alt
aspects of the Quick-Build assembly
before working with students. You
should modify instructions to fit your
circumstances. You should also feel
certain that all teams will be able to
complete the Quick-Build tasks within
the class time assigned to each task.
Students will want to test their boats
immediately, but you should delay
performance measurements until the
research section of this unit, where a
framework for performance testing is
developed. During the Quick-Build,
emphasize frame questions to elicit
qualitative answers such as "more" or
"less." Questions requiring numerical
answers should be postponed until
later in the unit.
Tolerances and assembly drawings are
included to provide a realistic,
machine-shop setting. If technology
education is a high priority in your
classroom, you will want to enforce
strict adherence to this aspect of the
unit. Otherwise you can decide which
aspects best suit your objectives.
37
MATERIALS
FOR EACH STUDENT
Student Activity SheetsQuick Build
Specifications
Making a Test Tank
Exploring the Model
Boat System
Systems Modeling
FOR EACH TEAM
Building Materialspolystyrene (hull)
9-volt battery
#22 AWG wire
fanbattery connector
binder clip
hot-glue
large paperclips
electrical tape
Tools
saw
pliers
wire strippers
wire cutter
sandpaper
hot-glue gun
metric ruler
CONSTRUCT-A-BOAT27

PREPARATION
Obtain Quick-Build
construction and testing
materials.
Run through Quick-Build
assembly yourself.
Modify instructions to fit
your materials.
Preview library and Internet
resources.
Consider noise, safety,
access to water (and AC
poweroptional) in choiceof worksite.
Organize materials for
orderly access.
Determine strategy for
student team formation.
Prepare test tank.
Contact local boat builders
(optional).
MISCELLANEOUSSUGGESTIONS
The Quick-Build and subsequent
I research sections stress systematic
descriptions of qualitative relations. It
is likely that these considerations will
be new to your students.
Do not be surprised if your students
show disdain for the qualitative ques-
tions in these materials. Your students
may also feel intimidated by the
apparently simple, but in reality very
difficult, reasoning that lies behind the
qualitative questions. It is very impor-
tant that you show your own enthusi-
asm for these questions and that you
insist that students know how to
handle them before moving on to
quantitative calculations.
Research on the learning of mathemat-
ics and science has shown that stan-
dard modes of instruction place far too
little emphasis on these essential
aspects of mathematical thinking
(Stigler and Hiebert 1999). Compari-
sons of expert and novice problem-
solving practices show that a key
characteristic of expert problem-solvers
is that they spend a great deal of time
with qualitative issues before ever
considering a numerical calculation.
Novices tend to employ a formula
immediately, often without any under-
standing of its function or suitability.
NATIONAL SCIENCE TEACHERS ASSOCIATION
38

COW" McalCo ST C,
CONSTRUCT-A-BOAT
39

CDA
OVERVIEW RESEARCH
You have completed the Quick-Build and made rough observations ofthe Construct-a-Boat system. Your team's challenge is to improve the
performance of your boat, so that it will achieve a higher top speed asquickly as possible after starting. You will first need to establish somebaseline measurements, then collect data on variables that are importantto high performance, and investigate how these variables work with oragainst each other.
There are different ways to go about meeting your challenge. Trial-and-error is one methodfiddling around until something works. Trial-and-error is usually more effective when it is not an entirely random process;an educated "try" by an investigator who is alert to outcomes can yieldshortcuts. However, time investment, cost effectiveness of materials, andlabor are usually important considerations that work against the benefitsof trial-and-error.
A systematic approach to research involves careful planning and documen-tation, and has several important strengths. Planning allows for divisionof labor, a sensible cost estimate, and a manageable time schedule. Esti-mates and schedules are essential if you want to finish the project ontime and at a price you can afford.
Scope of WorkExperiment with your Quick-Build to determine baseline data.
'0 Research the science concepts related to the performance of theboat.
Identifying variables and effectsScalingMinimizing surface area
1..) Read science text books to study the relationships among force,speed, and acceleration.
Explore the use of conceptual models, computer modeling, andscale models in explaining, designing, and evaluating a physicalsystem.
NATIONAL SCIENCE TEACHERS ASSOCIATION 40

BASELINE MEASUREMENTS
PurposeTo show that you have met the challenge scientifically, you will need to
compare your Quick-Build performance data to your final design. You
can use the Quick-Build performance data as a baseline, and from thatdata, you can tell if your design changes actually improve performance.Remember that your challenge is to redesign and build a boat hull thatwill:
(1) achieve the highest top speed(2) achieve the greatest acceleration
Collecting Performance DataIn the space below, write down a plan for collecting data to show
(1) the top speed of a model boat(2) the time it takes for the boat to achieve top speed
In your plan, describe what you are measuring, how you are measuring it,what calculations you need to make, how many people are needed to takemeasurements, and other pertinent information.
41
PROCESS
ALERT!You will probably revisit
these research activities
several times, because as
you move on through the
development activities, you
will find that you need
information you had not
previously identified! No
matter how carefully you
plan, you may make
mistakes; be alert to learn
from them and adjust your
plans.
CONSTRUCT-A-BOAT31

SCINKS.
Topic: presenting dataGo to: www.scilinks.orgCode: CABO4
32
ORGANIZING THE DATA
Well-organized data will help you keep track of improvements in yourdesigns and will help you make better designs in later stages. Care-
fully collect and record your data. Include notes on unexpected occur-rences, such as someone bumping the water table. Organize your data sothat you can make sense of it and use it later when you are redesigningyour boat hull.
Set up Tables for Recording Original and Calculated DataHere is an example of recording and calculating data for the change ofspeed over time.
Time onstopwatch
(in seconds)
Distance fromstarting point
(in meters)
Speed@ distance
(in m/s)
Speed change =speed- speedn.,
(in m/s)
In your notebook or laboratory journal, set up tables for all variables thatyou have identified, measured, or calculated. Your tables should not lookexactly like the one above, which is given only as a rough example. Belowyour table, leave space for notes on unexpected occurrences.
NATIONAL SCIENCE TEACHERS ASSOCIATION
BEST COPY AVAILABLE
42

Represent Your Data Using GraphsThink about what you might want to study or show graphically. Graphs
allow you to visualize relationships between the variables you are measur-
ing and to see changes in your data. There are different kinds of varia-
tions over time: distance traveled, instantaneous speed, and acceleration
all change over time. Here is an example of how you may represent this
kind of variation:
Speed over Time
1
0.8
0.6
0.4
0.2 -0 I I I I I I I I I I I I
0 1 2 3 4 5 6 7 8 9 10 11 12
Time (s)
Make similar graphs for all variables that you have identified, measured, or
calculated.
Are There Other Ways to Work with Data?If you have access to a computer and spreadsheet software, such as Excel
or ClarisWorks, try making the tables and graphs using a spreadsheet.
43 CONSTRUCT-A-BOAT33

34
IDENTIFYING VARIABLES
You have already made measurements of the speed of your Quick-Build,and have probably noticed that the measurements vary over time. You
will now identify the factors that could produce these variations.
Improved performance for the Construct-a-Boat challenge was defined asachieving higher top speed and reaching top speed in a shorter time. Thescientific way to meet this challenge is to determine which variables affectimproved performance. Once you've identified these variables, you canmake sure to include these variables in your design changes.
Discuss variables with members in your work group, then complete thetable below.
Variable Why is it important? How do you measure it?
mass
force of the motor
friction of thewater
wet surface area
surface roughness
[add your own]
NATIONAL SCIENCE TEACHERS ASSOCIATION
BEST COPY AVAILABLE
44

Plan for Collecting Data for Model Boat VariablesComplete the table on the next page for a plan to do your experiments.Make sure that your plan provides answers to these questions about eachvariable that you have identified:
1. Is this variable directly measurable? If not, what can you measure toobtain quantitative data on this variable?
2. How do you do the measurement? Specify tools and comment on yourexpectation for accuracy.
3. Will you need to do any calculations from your measurements?
4. How do you calculate for the variable that you want to study? Whatassumptions or estimates do you need to make?
Use the space below to put down ideas, either your own or those of yourteammates. These ideas do not have to be perfect or complete, and you donot have to write in complete sentences. Phrases, charts, or diagrams cansometimes do a better job, as long as you can come back to them laterwhen you need to revisit your first thoughts.
45
SC/LINKS.
Topic: massGo to: www.scilinks.orgCode: CABO5
Topic: forceGo to: www.scilinks.orgCode: CABO6
CONSTRUCT-A-BOAT

36
Measurement Plan
VariableWhat to
- MeasureHow to
Measure Calculations
mass weight Put model ontriple-beam balance
mass = weight/(acceleration due to
gravity)
force of motor
friction ofwater
wet surfacearea
surfaceroughness
NATIONAL SCIENCE TEACHERS ASSOCIATION
46

WORKING WITH THE VARIABLES
We want to know how each variable affects:
(1) the top speed of the boat, and
(2) the time it takes the boat to reach top speed.
Design a table (or some other way to record your data) so that you can
work with the variables you have planned to investigate. Use the space on
this page to put down your ideas, and keep legible copies of your mea-
surements for later reference.
a
47 CONSTRUCT-A-BOAT37

38
SCALE MODEL PREPARATION HOMEWORK
The shape of the scale model is the same as the actual boat you hope todesign even though the model is smaller. You can calculate the linear
scale factor by taking the ratio of the actual boat length to the modelboat length. This will be useful to determine other dimensions of themodel boat. Calculate what the linear scale factor would be for a 30 cm-long model of a 70 meter boat and write it below.
Linear Scale Factor =
Use the boat design specifications and the linear scale factor to determinehow wide the 30 cm model boat should be. The width of a boat is calledthe beam. For your ferry, the beam is 18 meters.
Real Boat Length =
Model Boat Length =
Real Boat Beam =
Model Boat Beam =
NATIONAL SCIENCE TEACHERS ASSOCIATION
48
e

APPLICATIONS OF SCALING
Try using the linear scale factor to calculate the weight of the modelboat. Explain why you cannot use the result. Use the space below to
show your work and explanation.
Work out a strategy to estimate theweight scale factor for the modelboat; it should allow you to calcu-late the weight in grams. Write thestrategy below and include anyassumptions you must make.
Weight Scale Factor = ffr
49 CONSTRUCT-A-BOAT39

SC/L INKS.
Topic: buoyancyGo to: www.scilinks.orgCode: CABO7
40
SCALE MODEL EXTENSIONS HOMEWORK
1. Use the Weight Scale Factor to calculate the weight for the model boatbased on the Design Brief data for a real boat with no cars or people.Write your solution below in grams.
Model Boat Weight =
2. Estimate the maximum weight of people and cars that the ferry M/VNantucket carries.
People and Cars Weight =
Determine the scale weight for people and cars in grams.
People and Cars Scale Weight =
50NATIONAL SCIENCE TEACHERS ASSOCIATION

FLUID FRICTION DYNAMICS
Boat designers and builders use the following mathematical model todetermine efficient hull designs. The most efficient hulls are designed
to have the least friction. The model is a formula:
FrictionForce
C x A xV2
FrictionCoefficient Wet Surface
Area
11\Speed
The wet surface area is the part of the boat hull that is in contact with thewater. The friction coefficient is determined by the roughness of the wetsurface area. The designer tries to create a more efficient hull by reducingthe wet surface area. Builders can create more efficient hulls by reducingthe friction coefficient. The trade-off for the builder is to balance the needfor a low coefficient of friction with a durable, affordable, hull surface.
Fluid Friction. In thismodel, the ship slidesthrough the water and pullslayers of water along withit. An enlarged view showsthat layers closest to theboat hull are pulled thefastest. The roughness ofthe hull surface determineshow much water is pulledalong with the boat. Thisroughness is represented bythe friction coefficient.
Fluid Friction Concept Model
0 0 0 00' 0
Boat BottomSurface Edge
IndIPPAPAIVAMPINv-/IVAIVA
15.1271frifilNIA1711111."-lot
51CONSTRUCT-A-BOAT
41
42
MINIMIZING SURFACE AREA
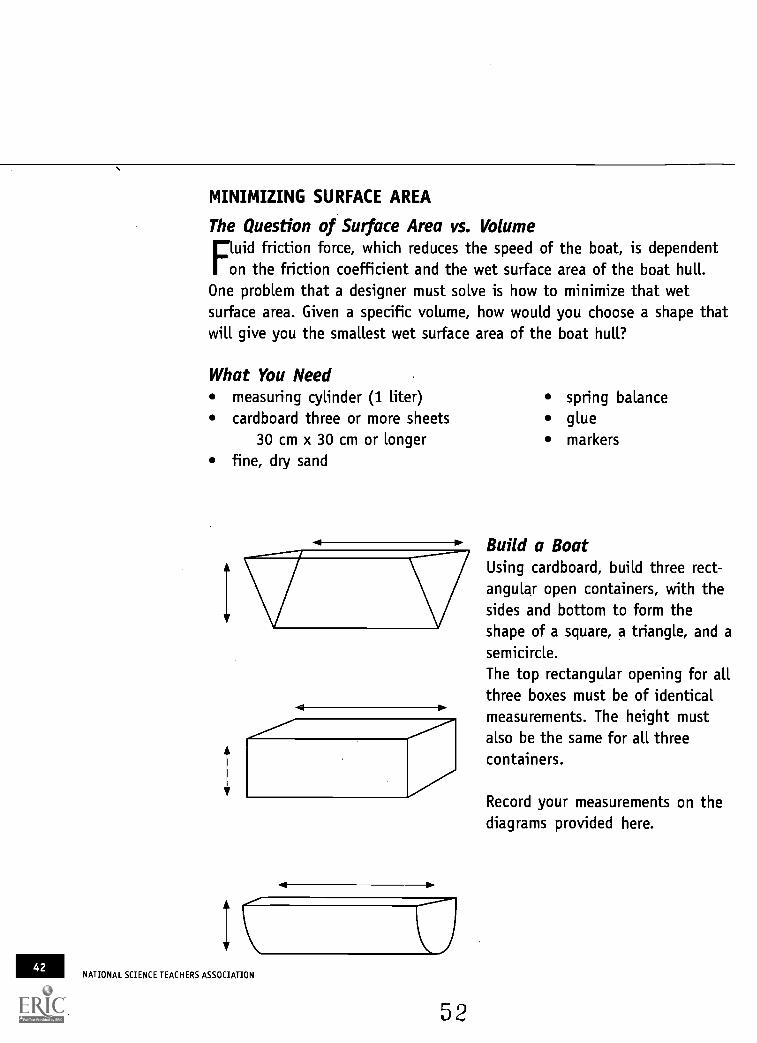
The Question of Surface Area vs. VolumeFluid friction force, which reduces the speed of the boat, is dependenton the friction coefficient and the wet surface area of the boat hull.
One problem that a designer must solve is how to minimize that wetsurface area. Given a specific volume, how would you choose a shape thatwill give you the smallest wet surface area of the boat hull?
What You Needmeasuring cylinder (1 liter) spring balancecardboard three or more sheets glue
30 cm x 30 cm or longer markers
fine, dry sand
ICNATIONAL SCIENCE TEACHERS ASSOCIATION
52
Build a BoatUsing cardboard, build three rect-angular open containers, with thesides and bottom to form theshape of a square, a triangle, and asemicircle.The top rectangular opening for allthree boxes must be of identicalmeasurements. The height mustalso be the same for all threecontainers.
Record your measurements on thediagrams provided here.

Fill with Sand1. Into each of the three containers, pour a carefully measured volume of
1000 cc (1 liter) of sand. Gently shake each one so that the sand islevel when the container is standing flat on the table top. Mark the fill-line all the way around on the inside surface of the container.
2. Discard the sand from each container and unfold each along the seams.
3. Compute the total area of the inside surface that touched the sand.Note the units you use for area.
4. What is your conclusion about the relationship between volume andsurface area?
5. How will this information help you in the design of the boat hull?
53 CONSTRUCT-A-BOAT43

diher fa ,cPt L1
MATERIALS
FOR EACH STUDENT
Student Activity SheetsOverviewResearchBaseline Measurements
Identifying Variables
Scale Model Preparation
Applications of Scaling
Scale Model Extensions
Fluid Friction Dynamics
Minimizing Surface Area
FOR EACH TEAM
Quick-Build boat
stop watch and meter stick
graph paper
set of 27 identical solid
cubes and spheres of
different diameters but of
identical material
one liter of fine sand
FOR CLASS
accurate balance
water tank
computer-based or
graphing calculator-linked
position detector (op-
tional)
set of measuring cups
(optional)
PREPARATION
Review preparation issues for
Quick-Build.
Prepare support materials for
discussion of scaling.
Define Laboratory Journal
requirements.
44
OVERVIEWRESEARCH
Student teams work through a
tightly structured series of activity
sheets to familiarize themselves with
the skills and structures they will need
in the more open-ended Development
sections.
Baseline MeasurementsStudents make speed vs. time measure-
ments of their Quick-Build model so
that they may determine performance
improvements through their design
changes.
Identifying VariablesTeams list important variables and plan
how to measure each.
Scale Model PreparationHomeworkStudents are introduced to scale
modeling as an accurate three-dimen-
sional (3D) representation of the
actual object, and determine some
physical specifications for the model
boat by scaling down from the real
boat specifications in the design brief.
NATIONAL SCIENCE TEACHERS ASSOCIATION
54
Applications of ScalingStudents figure out why the linear
scale factor does not work for weight
(weight scales as volume, not length)
and then determine a weight scale
factor. They may use formulas from
mathematics (length3) or empirically
determine the scaling factor by cutting
and weighing cubes of different sizes.
Scale Model ExtensionsHomeworkStudents use the weight scale factor to
determine the model boat weight when
empty and when loaded with people
and cars.
Fluid Friction DynamicsStudents are introduced to the quanti-
tative relationship linking speed and
friction for a boat hull.
Minimizing Surface AreaUsing a constant volume of sand
poured into 3D shapes (open trays of
circular, triangular, and rectangular
cross-sections), students explore the
relationships between area and volume.
This provides some baseline experience
for designing a boat hull with mini-
mum wet surface.
This activity should be revisited after
students encounter The Designer
Problem development activity. The
initial introduction should be brief

TEACHING SUGGESTIONS
This activity will take three class
sessions. The research portion of
the Construct-a-Boat unit is tightly
structured due to the relative complex-
ity of the tasks required of the stu-
dents and the need to ensure that all
students acquire the skills necessary to
advance to the Development stage. If
time permits, you may want to add
Library and Internet search activities to
this activity. A visit to a boat builder
would also be an excellent extension
option.
Devote the first class to the Overview,
Baseline Measurements, and Identifying
Variables sections. Most of the class will
be conducted with teams working
independently, but during final wrap-
up, teams should share their ideas
about variables to be measured and
techniques of measurement. Each
student should keep notes in a Lab
Journal on both team and full class
activity.
The next class should be used for the
exercise in applications of scaling,
because this exercise may prove more
complicated than it looks. For students
who understand linear, quadratic, and
cubic scaling, the exercise is simple
(and will not require more than a few
minutes). For students who do not
understand scaling, this will be a
difficult and highly important lesson.
The third class period is devoted to
fluid friction dynamics and to minimiz-
ing surface area. Most of this class will
be taken up with experimentally
investigating the relation of shape to
surface area. An understanding of
scaling is essential background for
these measurements. If your students
do not yet grasp scaling, you might
delay this class until the middle of the
Development activity.
DAY 1Encourage students to develop their
own methods and ideas through
the Baseline Measurements and Identi-
fying Variables activity sheets. You will
need to observe their activities care-
fully. It is quite possible for students
to design methods for measuring
speed that do not work well in practice.
Try to have the teams discover these
errors themselves, perhaps by respond-
ing to your probing questions. If oneteam has developed a good system, ask
that team to work with a team that is
still struggling. Avoid giving all teams
a set procedure, because students will
be able to implement a procedure
without really 'understanding what they
are doing.
CONSTRUCT-A-BOAT45

46
If you have access to a computer or
graphic calculator-linked position and
velocity detector, you will want to set
this up on the test tank. It may be
necessary to add a large target sail-like
structure on the boat in order to get
good position data. You will need to
pretest this setup and may have to
modify Quick-Build instructions to
ensure good data recording.
Use a brief, full-class discussion to
make sure that all teams have a com-
plete list of important variables.
Students may wish to investigate
variables that you feel are unimportant
or are a diversion from the main focus
of the unit. Try to find a suitable
balance between cutting off their
curiosity and allowing the class to be
diverted to a completely different
topic.
DAY 2If your class has difficulty with the
material on scaling, use the optional
second sheet on weight scaling.
Provide each team of students with 27
identical cubes, which they can stack to
create a large cube three units long on
each edge. Also provide objects in a
range of sizes and of uniform density.
Have the students predict the weight of
one size based only on the weight of a
different size and a length measure
from each.
NATIONAL SCIENCE TEACHERS ASSOCIATION
56
Allow students to repeat this prediction
and measurement several times before
attempting to explain why weight will
be proportional to the cube of the
linear measure.
Cubes and spheres are the best shapes
for this exercise. Other shapes may
introduce confusion concerning the
best linear measure. If students have
developed a fairly strong grasp of the
concept, you may want to refine it by
introducing cylinders of the same
length but of different diameters. Here
the weight scaling will depend on the
square of the diameter (not the cube).
It is also useful for students to see
that cylinders of the same diameter but
of different lengths will have weights
that scale linearly.
Encourage students to explain these
phenomena to each other and be very
patient with any difficulties students
may have in understanding your
explanations. Scaling is a very difficult
concept to learn even though it is a
simple and obvious concept to remem-
ber once it is understood.
One powerful way to stress the nature
of cubic scaling is with two large cubes,
the smaller being light enough to lift
with some effort and the larger being
impossible to budge.

DAY 3The student activity sheet, Minimiz-
ing Surface Area, assumes an
understanding of the principle that a
boat must displace a volume of water
equal to its weight. Most students know
of the Archimedes Principle, but many
might not really understand it. If this
is the case, you could remind the
students of the story of Archimedes in
the bathtub.
To understand boats, it is important to
distinguish floating objects from
objects that are completely submerged.
You might need to provide some time
for informal investigation of these
questions.
On the Minimizing Surface Area activity
sheet, the volume of sand represents
the volume of water that must be
displaced by the vessel. The top of the
sand represents where the water tine
would be. Unfolding the container
reveals the surface area that would lie
below the water line. Different shapes
will yield different surface areas.
Some students might be troubled by
the results of this investigation. The
minimum surface area would be gener-
ated by a spherical shaped boat, yet no
surface boats are designed as spheres.
We have been ignoring the effect of
the frontal cross section. The need to
design for a small frontal cross section
is what forces designers to choose long
thin designs of greater length than
beam. The Minimizing Surface Area
activity is useful in choosing between
different possible cross sections. But
minimizing surface area is not the only
important consideration. The stability
of the boat depends very much on the
shape of the cross section and a good
design must consider the trade-off
between stability and minimal wet area.
NoteThe mass vs. weight issue is a tricky
one, requiring teachers to give special
attention to the actual measurement
procedure and to students' misconcep-
tions.
Weight is the force due to gravity, and
is typically measured with a spring
scale. Mass is the "amount of stuff' and
is generally determined by comparing
the sample to another standard sample.
A triple beam balance is typically used
to determine mass.
Confusion can arise if someone
"weighs" something on a spring scale
(as in this activity) and gives its weight
in, say, grams, a measure of mass.
The relationship, weight = mass x force
of gravity, allows us to indirectly
measure a weight by measuring its
mass on a triple beam balance.
57CONSTRUCT-A-BOAT
47

48NATIONAL SCIENCE TEACHERS ASSOCIATION
Development
58

OVERVIEW DEVELOPMENT
You have completed activities investigating a model boat system. You
have also researched the relationships among force, speed, and accel-eration. To meet the Construct-a-Boat design challenge, your team will nowdevelop a prototype that allows your re-designed model boat to achievethe highest top speed possible after starting in the fastest time possible.In designing and building this prototype, keep in mind that differentvariables may affect different aspects of the boat performance, and thatyou may not want to sacrifice too much of one aspect for the sake of
another.
Scope of Work'0 Redesign your boat hull so that your newly re-designed model boat
will have improved performance over that of the Quick-Build.
10 Build your prototype and test its performance.
Collect performance data for the re-designed model boat, for com-parison with the Quick-Build.
Evaluate your design modifications.
Good planning is essential to good design. Look again at your researchwhere you identified variables and wrote down key factors that affectedperformance. Think how best to combine design options to improve per-formance. Be creative within your objectives and constraints. Review theInquiry Process and Design Process resource sheets for ideas on next steps.Evaluate your prototype critically and make modifications until you aresatisfied with improved performance, or are simply out of time. Rememberto reflect on your process, because how you go about your design, andwhat you learn, are key elements in the Communication and Assessmentactivities to follow.
59 CONSTRUCT-A-BOAT49

50
DESIGNER PROBLEM
Invent a new design that improves the performance of the model boathull and sketch your design. Propose a redesigned boat hull:
(1) Provide diagrams of the hull, including dimensions.(2) Include explanations based on your research for how your design
improves the model boat performance.
Here are some examples of hull shapes:
NATIONAL SCIENCE TEACHERS ASSOCIATION
Flat Bottom
V Bottom
Round Bottom
60

BUILDER PROBLEM
propose two distinct methods to minimize fluid friction and describethem in the space below. Use additional pages for sketches if that
helps your explanation.
Design and conduct a test to determine improvements in the frictioncoefficient for the model boat. If you can, try using the computer modelto understand better how the friction coefficient affects the model boatperformance. Describe your test below.
61CONSTRUCT-A-BOAT
51

52
PROTOTYPE CONSTRUCTION
ProposalRevisit the Design Brief and propose a design of a model boat that wouldshow improved performancea higher top speed and a shorter time toreach top speed. In the space below, summarize the features of your newdesign and the rationale for including those features.
MaterialsList materials required for the construction of your redesigned model boat:
SchematicsOn separate pages, make technical drawings for the construction of yournew design. Include a side view, front view, back view, and top view.Specify dimensions in metric measurement units on each of the drawings.
ConstructionBuild your model boat according to the specifications of your team'sdesign. If you must make modifications as you are building, take note ofthe modifications in your laboratory journal.
NATIONAL SCIENCE TEACHERS ASSOCIATION
62

EVALUATING YOUR NEW DESIGN
PurposeObtain performance data and compare these data to the baseline measure-
ments, so you can tell whether your design changes actually improved
performance.
Collecting Performance DataYour challenge is to redesign and build a boat hull that will:
(1) achieve the highest top speed(2) reach top speed as quickly as possible after starting
To show scientifically that you have met your challenge, you will need to
compare performance data of the Quick-Build to those of your redesigned
model. For the comparison to be valid, you need to collect data for your
new model the same way that you did for your Quick-Build.
Collect data to show or calculate:(1) top speed of model boat(2) time it takes to achieve top speed
Set up tables for recording original and calculated dataYou have collected, recorded, and represented data obtained from working
with your Quick-Build. Now collect data for your newly designed model
boat. It is important to take your measurements in the same way that you
did when you worked with your Quick-Build. You should also represent the
new data in such a way that you can make unambiguous comparisons of
the performance data sets. Pay special attention to the units of measure-
ment.
Represent your data using graphsWhen you make graphs from your data, try to work with a scale thataccommodates the performance data for both the Quick-Build and the newdesign. Overlay the two graphs if you can.
Make similar graphs for all variables that you have identified, measured, orcalculated.
CONSTRUCT-A-BOAT
63
53

54
Comparing Performance Data1. Did either or both of your Quick-Build and the newly re-designed
model reach a maximum speed? Yes / No
top speed of Quick-Build =top speed of new model =
2. How long did it take each of your two models to reach its maximumspeed?
acceleration time for Quick-Build =acceleration time for new model =
3. Compare the performance of your new model to that of your Quick-Build. Provide a brief qualitative description below.
4. How would you describe the improvement in performance quantita-tively? What calculations do you need to make?
5. Summarize your results and explain how you have achieved them.
NATIONAL SCIENCE TEACHERS ASSOCIATION 64

TaegOkerlkateV
OVERVIEW DEVELOPMENT
The object of the work in this
section is for students to redesign
their boat hull to obtain improved
performance over that of the Quick-
Build.
In the Designer Problem activity,
students consider alternative shapes
for their hulls that reduce the wet
surface area. Next, in the Builder
Problem, students develop procedures
to test for improvements in frictional
drag. The Prototype Construction
activity is an opportunity to put it all
together. Finally, Evaluating Your New
Design lets students test their im-
proved designs to compare boat
performance to the baseline measure-
ments made with the Quick-Build.
TimeThis activity will take a minimum of
four class sessions.
When possible, several days should be
allotted to prototype construction,
allowing students to undertake several
redesign cycles.
co404r9011\ THUCTCC
TEACHING SUGGESTIONS
Designer Problem
Thequality of the Designer Problem
activity depends strongly on the
fabrication techniques you are willing
to explore. In the simplest case, where
only straight cuts are permitted, all
designs will be limited to flat, angled
surfaces. Curved surfaces are possible
if you allow sanding (although this is
difficult with polystyrene). Polystyrene
may be melted with a hot iron and
molded into virtually any shape.
However, this technique, does release
fumes and may create a small fire risk.
Therefore, it is not recommended
unless you have access to a shop with
appropriate venting and safety fea-
tures. Working with wood instead of
polystyrene is also an option if you
have access to appropriate tools and
work space.
Be sure students understand whatever
limits you have imposed on the fabri-
cation strategies before they begin the
Designer Problem activity.
Builder ProblemThere are two variables to consider in
the Builder Problem activity: surface
area and surface finish. Because the
previous activity dealt with surface
area, students will be largely concerned
65
MATERIALS
FOR EACH STUDENT
Student Activity SheetsOverviewDevelopmentDesigner Problem
Builder Problem
Prototype Construction
Evaluating Your Design
FOR EACH TEAM
Materialspolystyrene (hull)
9-volt battery
#22 AWG wire
fanbattery connector
binder clip
hot-glue
large paper clips
electrical tape
Tools
saw
pliers
wire strippers
wire cutter
sandpaper
hot-glue gun
electric iron (optional)
PREPARATION
Prepare tank test area.
Arrange for team work areas.
Prepare fire safety measuresif polystyrene will be heattreated.
Review Laboratory Journal
requirements.
CONSTRUCT-A-BOAT55

56
with surface finish for this activity.
Fabrication techniques are very impor-
tant for determining the range of
available options. The measurement of
surface drag has been left for students
to define. They may wish to measure
surface smoothness by feel or by
measuring the force needed to drag
some object across it. Alternatively,
they may choose to measure the drag
of the entire boat hull, a measurement
that combines surface smoothness and
surface area. If you feel this problem is
too open-ended for your students, you
may want to define the issue more
precisely.
Prototype Construction andEvaluating DesignThis last exercise should pull together
the concepts covered in all preceding
activities. On the one hand, student
teams should be given as much free-
dom as possible to design and build
the best boat they can. On the other
hand, students should understand that
they need to be using the knowledge
gained from previous activities and not
attempt to improve performance based
on completely new variables (such as a
large motor). Laboratory Journals
should be referenced on previous
activities and ideas.
NATIONAL SCIENCE TEACHERS ASSOCIATION
66

58
OVERVIEWCOMMUNICATION
You have met the challenge. You have redesigned a boat hull and youhave built and tested a model boat that has improved performance
over the Quick-Build. It has taken you some time and much effort, butuntil you communicate the importance of your work to the people whomatter, your efforts will have little meaning. Indeed, one of the mostcritical abilities today is to be able to communicate clearly, effectively,and persuasively.
As an engineer, scientist, or developer, you are dependent on fundingfrom private and public foundations. It is important to convince thosewith money why they should give support to the work you do. You maywant to present your ideas to local officials or create a Web page thatwould make your work accessible to the entire world. There are individualsand companies in the boat-building industry, who are very interested innew designs or marketing their boats to the consumers. Publications arealso important for communicating your findings to the greater scientificcommunity.
Think about the discoveries you have made with the Construct-a-Boatchallenge. Communicate the important parts of what you have done toseveral different audiences, including your classmates, a group of noviceboat builders, and most importantly, yourself. Think about the interestsyour audience might have in your work. Recognize that there are manypossible formats to communicate with your audience, and select one ormore formats to present your work.
Scope of Work:1/4) Create a project report that communicates the results of your work.
Your target audience may be executives of a boat-building companyor people attending a trade show.
'D Present your redesigned model boat, including the rationale, sub-stance, and outcomes of your effort.
10 Complete the post-challenge assessment, and reflect on what youhave learned in this challenge module.
NATIONAL SCIENCE TEACHERS ASSOCIATION 68
CREATING A PROJECT REPORT
Thefinal activity of this unit is for you to communicate the results of
your work in a project report. Your goal is to include information thatwill inform builders of full-sized boats about the capabilities of yourdesign.
An important skill for you to demonstrate in your project report is theability to communicate clearly in writing. The writing of each sectionshould be well organized and clear enough for someone unfamiliar withyour design to understand.
Have fun thinking about ways to creatively describe your model design.Consult the table of contents below for a list of the topics you shouldaddress in your project report.
Model Boat Project Report
I. Project Statement
II. System OverviewA. Physical SpecificationsB. Performance Specifications
III. Research
IV. Development
V. Supporting Data
Members of your team should divide the responsibility for each of thesections that need to be written. Before you do so, read the suggestionsbelow to obtain a clear idea of what each section is about.
69 CONSTRUCT-A-BOAT59

60
PRESENTATION
Tn meeting the Construct-a-Boat challenge, you redesigned a boat hulland built a model boat for improved performance. You have kept careful
records (perhaps even photographs) and you have the prototype model fordisplay. You are now asked to give an oral presention to an objectiveaudience on the rationale, substance, and outcomes of your effort. Youhave limited time for your presentation, so do some careful planning andrehearsal. This should be a team effort, with each team member respon-sible for communicating a key part of the presentation. Expect to fieldquestions from your teacher and audience. You may find visual aids usefulin presenting key data and in providing your audience with tools for quickand clear analyses.
Prepare an outline of key points to cover. Focus on capturing youraudience's interest, but clearly identify the strengths and distinguishingfeatures of your design, as compared with those in other team presenta-tions. Present the evidence that the design accomplished its purpose byquantitative and qualitative comparisons to the Quick-Build, using thecriteria developed previously by the class.
List your preliminary presentation outline with team member assignmentsbelow. Consult with your teacher as a resource in your planning.
Presentation OutlineTITLE:
I.
II.
IV.
NATIONAL SCIENCE TEACHERS ASSOCIATION7 0
Team Member Assigned

REFLECTION AND RECOMMENDATIONS
C et forth at least five prioritized factors to consider, design criteria, or.istatements of wisdom you would offer to others who would be inter-ested in designing and building a high-performance boat.
Make your recommendations based on the experience and knowledge youhave gained through research, development, and testing of your ownmodel boat, and through comparing your results with those of otherteams.
Using a model of causal relationships, describe two key factors youenhanced to improve performance.
What do you recommend about working with performance evaluationbefore beginning your important design work?
71CONSTRUCT-A-BOAT
61

62
hat I now know about models, systems, anddesign.
1. What are some of the factors that would have significant effects on thespeed and acceleration of a model boat?
2. Do these factors have any effect on each other? If so, what mightthose effects be?
3. What are models used for?
4. What is a system?
NATIONAL SCIENCE TEACHERS ASSOCIATION 7 2

5. Describe your project and list your major process stages from conceptto finish.
6. Describe an experiment that determines which of two boats has greateracceleration.
73CONSTRUCT-A-BOAT
63

n \ 4-e-Zif":"7:1frecher PagecActivity4
MATERIALS
FOR EACH STUDENT
Student Activity Sheets
OverviewCommunicationCreating a Project Report
Reflection and Recommen-
dations
Snapshot of Understanding
FOR EACH TEAM
Presentation aids (selectfrom options):
overhead projector
flip charts
computer displays
PREPARATION
Prepare a presentation event
plan, location, and agenda.
Consider offering spectator
invitations.
Provide students with examples
of project reports.
Arrange for use of word
processing/graphics (or CAD)
computer stations.
Prepare a grading plan for
your evaluation of the team
and individual effort.
Customize the project report
table of contents to fit thetime and educational
objectives for your class.
64
OVERVIEWCOMMUNICATION
Student teams summarize their
learning by creating a product
prospectus that includes information
about specific applications for their
model boat, its construction, hull
shape, factors influencing the perfor-
mance, and performance parameters.
In the final assessment, students
answer questions similar to those at
the very beginning of the unit by
retaking the Snapshot of Understand-
ing.
Time RequirementDevote one or more classes to team
preparation of the reports.
Presentation of the reports should be
strictly timed so that all teams can
report within the allotted time (one or
two days, depending on class size).
Devote one class to reflection on the
process and final self-assessment.
NATIONAL SCIENCE TEACHERS ASSOCIATION
74
TEACHING SUGGESTIONS
Preparing the ReportTeams should divide preparation and
i presentation responsibilities among
members so that effort and benefits of
the work and learning are distributed
equitably. An assessment rubric,
tailored to fit your class learning and
evaluation objectives, should be made
available to teams well in advance
possibly at the beginning of the
prototype development phasetoencourage maximum awareness,
planning, and preparation.
PresentationFitting a presentation into the time
allotted is a skill few speakers ever
master. You will need to warn all teams
of the importance of staying within
their time slot and you will need to be
strict in enforcing time limits. If you
invite visitors to the presentations,
they will need to be informed of your
time limits and of the kind of input
you would like them to provide.
Completing the Snapshot ofUnderstandingAfter students complete the final
Snapshot of Understanding (allow about
20 minutes), provide a brief period of
time for them to compare their new
answers with those on their pre-unit
Snapshot.

Side Roads
75CONSTRUCT-A-BOAT
T
65
66
SIDE ROADS
The material on the following pages is intended to support additional activities
that you may choose to add to those described in the core course. Many of these
are key activities, but they have been put in the Side Roads section because they can
fit in several different places in Construct-a-Boatyou can decide exactly when to use
them in response to student questions and feedback. Some activities may be used
(profitably) more than once. An analysis of the design process, for example, will
provide different insights when used in the research activities, than when used in the
development activities.
Two optional Snapshots of Understanding are included. One can be used to evaluate
students' grasp of the concept of a model; the other to evaluate student understand-
ing of control of variables. Construct-a-Boat assumes that students understand these
concepts. You will need additional materials if their understanding proves to be
weak.
In this section:Inquiry Process
(1 Modeling Design Solutions
Design Process
Charting a Mathematical Model
Simulating Model Calculations
Snapshot of Understanding: Models
E77 Snapshot of Understanding: Control of Variables
NATIONAL SCIENCE TEACHERS ASSOCIATION 7 6

INQUIRY PROCESS
The inquiry process isoften viewed as a cycle of
action that repeats until theCommunicate
investigators reach a satisfy-ing solution. It can be de-scribed with seven basic Identifyelements:
Identify and clarify questions.Understand the issue or Planproblem, and make a testablehypothesis.
Evaluate
Explain
Experiment
Research
Plan appropriate procedures. Brainstorm, draw and write ideas, clarifytheir ideas, and suggest possible strategies or methods.
Research major concepts. Learn what is known about the situation fromsources other than actual investigation, and obtain information frompreliminary experiments. Decide what technology, approach, equipment,and safety precautions are useful. Document your experiments and logyour data.
Experiment. Use tools and measuring devices to conduct experiments. Usecalculators and computers to store and present data.
Explain logical connections. Analyze your data. Formulate explanationsusing logic and evidence, and possibly by constructing a physical, con-ceptual, or mathematical model.
Evaluate alternatives. Compare your explanations to current scientificunderstanding and other plausible models. Identify what needs to berevised, and find the preferred solution.
Communicate new knowledge and methods. Communicate results of yourinquiry to your peers and others in the community. Construct a reasonedargument through writing, drawings, and oral presentations. Respondappropriately to critical comments.
77 CONSTRUCT-A-BOAT67

SC/LINKS.
Topic: scientific inquiryGo to: www.scilinks.orgCode: CABO8
68
Questions
Read the following questions, but do not answer them until after yourteam has experienced working together on the design challenge researchactivities.
1. Make your own checklist of team activities that correspond to steps inthe cycle described above:
2. Create your own version of the inquiry process using words and path-ways that fit your team's activity.
3. What shape is your inquiry pathway diagram (circle, spiral, cascade,other)?
4. How and where do the seven steps described above fit within yourprocess description?
NATIONAL SCIENCE TEACHERS ASSOCIATION
7 8

MODELING DESIGN SOLUTIONS
Defining ModelingModeling is the activity of imitating reality. You can use modeling tosimulate actual events, structures, or expected conditions to test, analyze,
and refine your design ideas. You also use models to focus on important
parts of the total problem.
In Construct-a-Boat, we use different types of models:
Graphic ModelsTypical graphic models are conceptual drawings, graphs, charts, and
diagrams. Conceptual drawings capture the designer's ideas of specific
details; graphs and charts display numerical information and help the
designer assess results; and schematic diagrams show relationshipsbetween components. You have already made and used several graphic
models.
Physical ModelsA physical model is a three-dimensional representation of an actual
object. You can construct a physical model with materials that are easyto work with, such as wood, clay, polystyrene, and paper. Because full-
size models are often impractical, people use scale models to show how
a product will look or to test the operation of a system. A scale modelis proportional to actual size by a ratio. Your Quick-Build is a physical
model.
Mathematical ModelsMathematical models show relationships in terms of formulas. Forexample, the formula for speed shows the relationship between thedistance traveled by a boat and the time it takes to travel that dis-tance:
Speed = DistanceTime
In general, you would need to use many formulas and inter-relate themto predict the results of more complex relationships.
CONSTRUCT-A-BOAT
7969

DESIGN PROCESS
The design process isoften viewed as a
cycle of action thatrepeats until the design-ers reach a satisfyingsolution. It can be de-scribed with seven basicelements:
Communicate
Identify
Create
Evaluate
Implement
Choose
InvestigateIdentify and clarify thesituation. Understand the challenge or problem, including the criteria forsuccess and constraints on the design.
Create solutions. Brainstorm, draw and write ideas, and suggest possiblestrategies or methods.
Investigate possibilities. Learn what is known about the situation, andwhat technology or approach could be useful. Conduct experiments to testyour ideas.
Choose a solution. List the solutions most likely to be successful, andmake decisions for how well each solution meets the design challenge orsolves the problem.
Implement the design. Learn that a successful design often depends ongood fabrication, whether it is a scaled or life-sized version of the prod-uct.
Evaluate the design. Perform tests to obtain the feedback that informsthem about the parts of the design that worked or needed improvement.
Communicate the solution. Present your designs to your peers and othersin the community, communicating your ideas through drawings, writing,formal presentations, informal discussions.
NATIONAL SCIENCE TEACHERS ASSOCIATION
00
Questions
After reading about the design process, answer the following questions:
1. What elements of the process have you already experienced?
2. What elements have you not yet experienced?
3. Where in the process do you think you are now?
4. What will your next steps be?
81CONSTRUCT-A-BOAT
71
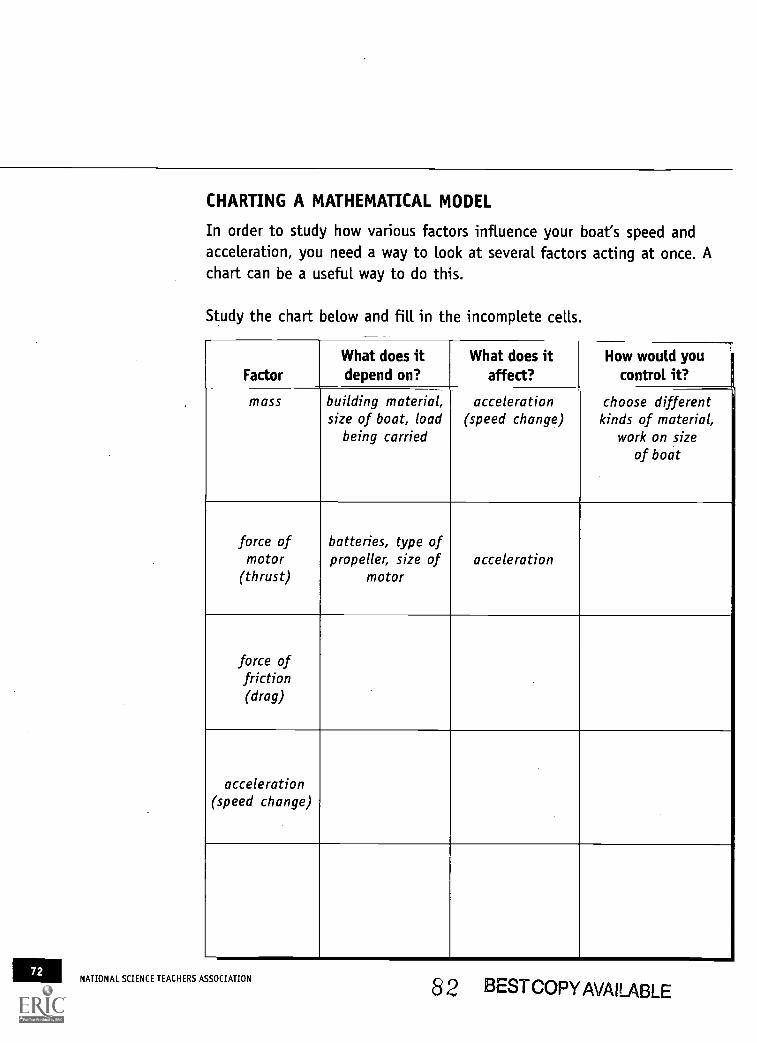
72
CHARTING A MATHEMATICAL MODEL
In order to study how various factors influence your boat's speed andacceleration, you need a way to look at several factors acting at once. Achart can be a useful way to do this.
Study the chart below and fill in the incomplete cells.
FactorWhat does itdepend on?
What does itaffect?
How would youcontrol it?
mass building material,size of boat, load
being carried
acceleration(speed change)
choose differentkinds of material,
work on sizeof boat
force ofmotor
(thrust)
batteries, type ofpropeller, size of
motoracceleration
force offriction(drag)
acceleration(speed change)
NATIONAL SCIENCE TEACHERS ASSOCIATION 8 2 BEST COPY AVAILABLE

Quantifying the ChartWith your factors now in place and with a qualitative feel for how they
relate to each other, you can start to see how they affect each other
quantitatively. Because the boat starts with no speed and must accelerate
up to its maximum speed, you need to examine acceleration. The funda-mental law for acceleration is Newton's Second Law: F = ma.
First, look carefully at the three components of this equation. There are
two main forces acting on our boat. The force of the motor and the resis-
tance or friction force of the water. There is one mass, the mass of the
boat. There is one acceleration, the acceleration of the boat.
The work sheet Fluid Friction Dynamics on page 41 described an equation
for the friction force, it was: Ffriction = k v2 where k is made up of two parts:
C, a measure of roughness; and A, the total surface area in the water.
Because neither C nor A changes as the boat moves through the water,
consider their product k as a constant number. (In hydroplanes, A does
change as the boat moves but you are not working with that kind of
boat.)
The equation for Ffriction has the value zero when the speed is zero.
You can now fill out the first column of the chart on the next page.
Use the letter M to stand for the mass of the boat; you will need to weigh
yours to get a number. Enter that mass (M) all across the row because it
will not change.
Use the letter F to stand for the force of the motor (see unit of measuring
the force of the motor). Enter that all across the row because it will notchange.
83 CONSTRUCT-A-BOAT73

74
Time in seconds 0 1 2 3 4
Mass _g _g 9 _g _g_Force of motor(thrust)
F F F F F
Force of friction(drag)
0
Total force F
Acceleration F/M
Speed 0
NATIONAL SCIENCE TEACHERS ASSOCIATION 84

SIMULATING MODEL CALCULATIONS
To fill in the second column of the table on page 74, it may be helpful towork in teams of five. Each person takes a turn at calculating a value forthe table. We will work up from the bottom row. Remember that the valuesyou are calculating are relationships in a mathematical model, not neces-
sarily numerical values.
1. The first person determines, from team data, the speed change:
The speed change value equals: (thrust - drag) x time intervalmass
2. The second person calculates the new speed:
new speed = old speed + speed change
Enter this result for the next value of speed.
3. The third person, using team data again and the calculations above,determines the new acceleration.
That value will equal: total forcemass
Enter this result for the new value of acceleration.
4. The fourth person calculates the friction of the water:
drag = friction coefficient x wet surface area x (speed)2 = k (speed)2
Enter this result for the next value of force of friction.
5. The fifth person calculates the total force:
The total force will be equal to: (thrust - drag)
Enter this result for the new value of total force.
85 CONSTRUCT-A-BOAT75

76
Now that you have the second column filled, it is time to move to thethird column. The first person repeats the calculation using numbers fromcolumn two.
Your group can continue this process until the boat reaches maximumspeed.
Checking Your IntuitionYou have completed one worksheet. This data should help you see howdesign changes might affect the performance of the boat. What wouldhappen if you made the boat lighter?
Use your intuition to complete the following sentences with one of thesechoices: increases, decreases, does not change.
1. As the mass of the boat increases, the top speed
2. As the mass of the boat decreases, the top speed
3. As the motor-force increases, the top speed
4. As the motor-force decreases, the top speed
5. As the wet surface area increases, the top speed
6. As the wet surface area decreases, the top speed
7. As the gliding surface roughness increases, the top speed
8. As the gliding surface roughness decreases, the top speed
NATIONAL SCIENCE TEACHERS ASSOCIATION 66

Predicting the Effects of Design ChangesUsing the chart calculation, you can see the effect of possible changes
you might make to your boat's design. You can actually determine how a
certain change will affect the time that it takes to reach top speed.
If you know how to use a spreadsheet program, you can use it do thework of the five people and create a chart that fills in automatically.
Here are some design changes to consider:
What happens when you make the gliding surface half as rough? How
would you use such information to help you redesign and build your boat
hull?
How big a change would you need to make in the wet surface area to get
as big an effect as you got cutting the roughness in half?
How much would you need to change the mass of the boat to get this
effect?
87 CONSTRUCT-A-BOAT

78
SHOTerstanding: MODELS
Give three different examples of models.
What are models used for?
What is important to include in a model?
Can there be more than one model for the same thing?
NATIONAL SCIENCE TEACHERS ASSOCIATION
BEST COPY AVAILABLE
88

CONTROL OF VARIABLES
Two companies are conducting experiments to understand how to build abetter canal system. Each company built two canals to learn how canalsaffect boat speed.
The first company built one canal that was narrow and shallow, and an-other canal that was wide and deep.
The second company built one canal that was narrow and deep and an-other canal that was wide and deep.
Which company designed the better experiment? Why?
89 CONSTRUCT-A-BOAT79

: I
r
\,
NATIONAL SCIENCE TEACHERS ASSOCIATION
Text Reconstruction Exercises
SO

TEXT RECONSTRUCTION
The jumbled paragraphs in the
following reading assignments are
examples of Text Reconstruction (TR).
This well-established technique for
reading and writing improvement has
roots going back to Benjamin Franklin
as well as a number of famous authors.
Many teachers find that including TR in
a reading assignment highly motivatesstudents and results in a much higher
rate of homework completion. We
suggest you read Chapter 5 of Why
Johnny Can't Write for complete instruc-
tions on how to design your ownexercises. Additional exercises can be
found in How to Analyze, Organize, &
Write Effectively.
An instructional process that uses
design or inquiry places great demands
on class time. It is impossible to cover
all essential content within the few
hours per week students spend in class.
Science and technology courses must
therefore insist that students learn
from reading. This means they must
also provide realistic opportunities forstudents to improve their ability tolearn from reading.
Text Reconstruction works as a method
of improving reading skills by focusingstudent attention on the most impor-tant elements of the reading task. First,
it changes the reader's perception of
his or her role from that of a passive
absorber of information to that of an
active agent who must sort out a
puzzle. This is probably the main
reason TR exercises are popular with
students. Secondly, TR forces students
to pay attention to the logic of aparagraph. In science, it is not the
separate ideas that are important, butrather the logic that ties them to-
gether. When passively reading a
paragraph, one can easily miss that
logic, but in TR it is impossible to
complete the task without thoroughlyunderstanding these interconnections.
A student who reconstructs a para-
graph will understand its structure andmeaning far more deeply than a
student who memorizes every word but
considers them only in their current
order.
In the Science by Design series, we
employ various techniques to encour-
age student reading and writing. These
are not extras, but rather essential
elements of the program. The exercises
included assume that your students are
relatively strong readers. If your
students are weak readers or are not
used to serious homework, then you
will need to increase the amount ofattention you pay to improving read-ing skills. Text Reconstruction can be
used to convert any kind of reading
assignment into a stimulating puzzle.
The more use you make of TR, the more
your students will read and the better
they will understand.
91
For more
information on
Text
Reconstruction
Across the
Curriculum
contact: The
Institute for TRAC
Research, P.O. Box
7336,
Albuquerque NM.
Tel. (505) 831-
2654 or visit the
New Intelligence
Web site at
http://www.newintel.corn
CONSTRUCT-A-BOAT81
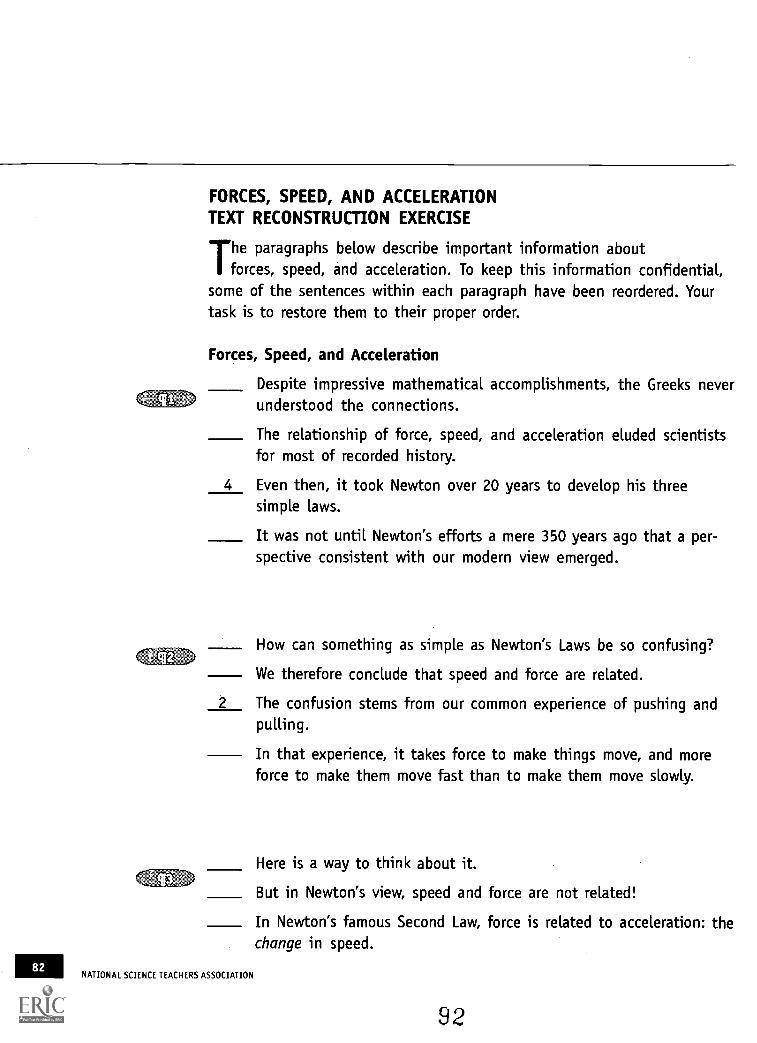
82
FORCES, SPEED, AND ACCELERATIONTEXT RECONSTRUCTION EXERCISE
The paragraphs below describe important information aboutforces, speed, and acceleration. To keep this information confidential,
some of the sentences within each paragraph have been reordered. Yourtask is to restore them to their proper order.
Forces, Speed, and Acceleration
Despite impressive mathematical accomplishments, the Greeks neverunderstood the connections.
The relationship of force, speed, and acceleration eluded scientistsfor most of recorded history.
4 Even then, it took Newton over 20 years to develop his threesimple Laws.
It was not until Newton's efforts a mere 350 years ago that a per-spective consistent with our modern view emerged.
NATIONAL SCIENCE TEACHERS ASSOCIATION
How can something as simple as Newton's Laws be so confusing?
We therefore conclude that speed and force are related.
The confusion stems from our common experience of pushing andpulling.
In that experience, it takes force to make things move, and moreforce to make them move fast than to make them move slowly.
Here is a way to think about it.
But in Newton's view, speed and force are not related!
In Newton's famous Second Law, force is related to acceleration: thechange in speed.
92
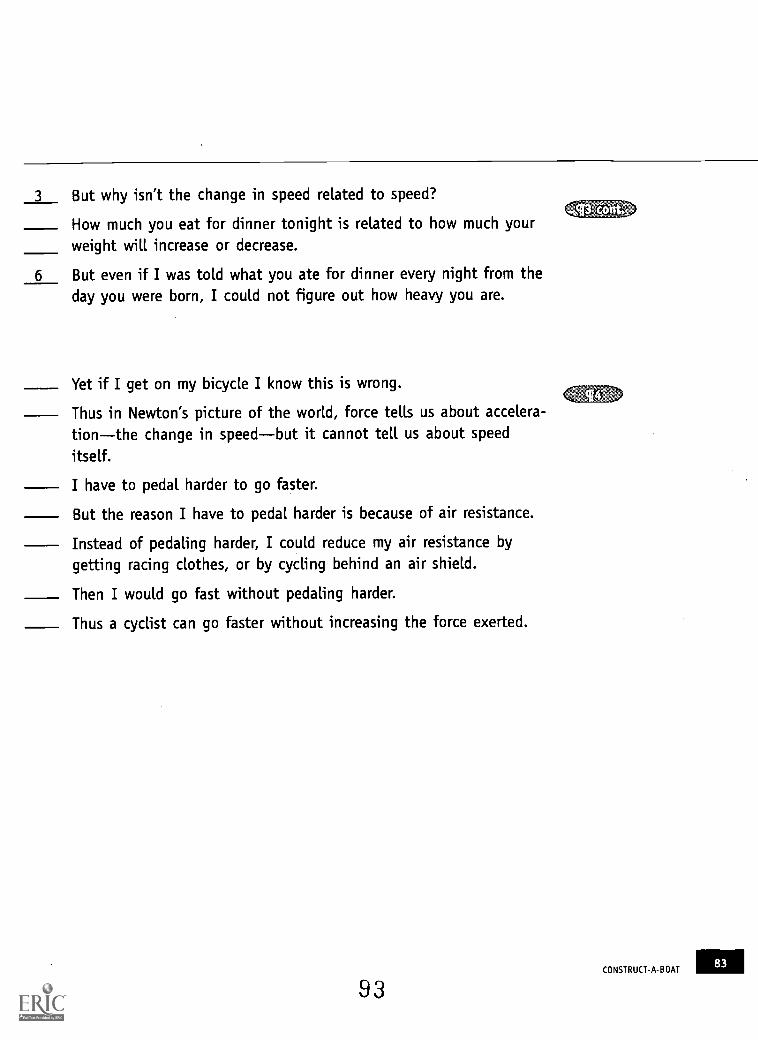
3 But why isn't the change in speed related to speed?
How much you eat for dinner tonight is related to how much yourweight will increase or decrease.
6 But even if I was told what you ate for dinner every night from theday you were born, I could not figure out how heavy you are.
Yet if I get on my bicycle I know this is wrong.
Thus in Newton's picture of the world, force tells us about accelera-tionthe change in speedbut it cannot tell us about speeditself.
I have to pedal harder to go faster.
But the reason I have to pedal harder is because of air resistance.
Instead of pedaling harder, I could reduce my air resistance bygetting racing clothes, or by cycling behind an air shield.
Then I would go fast without pedaling harder.
Thus a cyclist can go faster without increasing the force exerted.
93CONSTRUCT-A-BOAT
83

84
SYSTEMS TEXT RECONSTRUCTION EXERCISE
Systems
Understanding those effects and relations is called systems analysis.
Systems analysis and systems thinking are increasingly importantaspects of the modern world.
2 In any complex situation, there are many related parts which affecteach other.
The simplest kind of systems analysis involves understandingwhether an increase in one quantity will cause an increase, de-crease, or no change in another quantity.
If you increase what you eat for dinner, you will increase yourweight (unless you also exercise more, or do something equiva-lent).
Often the links in a systems analysis can be complicated and evencontradictory._ But when the weather gets colder, it also snows more and so yougo skiing and get more exercise.
2 If the weather gets colder, you play less baseball and get lessexercise.
In a simple case, we can tell what will happen without having tocalculate with numbers.
2 It snows and I will go skiing.
To calculate the exact amount of exercise for each case, I will needto use a mathematical model.
But will I get more exercise than I got back in July?
Here I will need to know how many times I played baseball, howmany times I went skiing and how much exercise I got each time.
NATIONAL SCIENCE TEACHERS ASSOCIATION
94
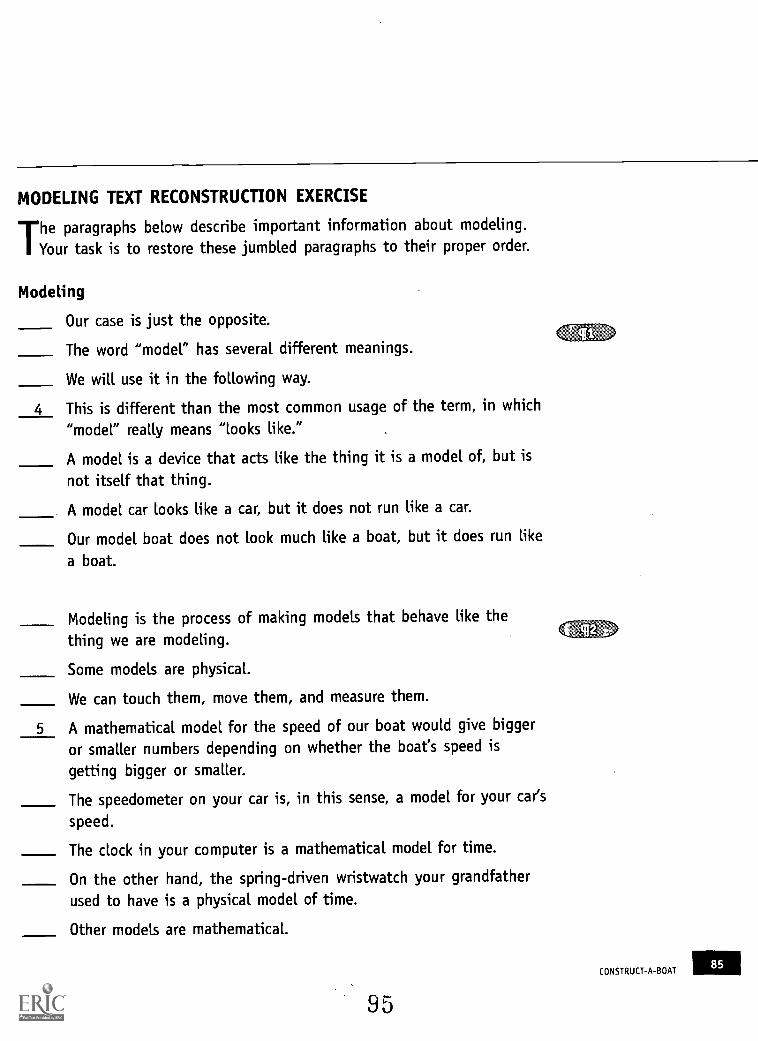
MODELING TEXT RECONSTRUCTION EXERCISE
The paragraphs below describe important information about modeling.I Your task is to restore these jumbled paragraphs to their proper order.
Modeling
Our case is just the opposite.
The word "model" has several different meanings.
We will use it in the following way.
4 This is different than the most common usage of the term, in which"model" really means "looks like."
A model is a device that acts like the thing it is a model of, but is
not itself that thing.
A model car looks like a car, but it does not run like a car.
Our model boat does not look much like a boat, but it does run like
a boat.
Modeling is the process of making models that behave like thething we are modeling.
Some models are physical.
We can touch them, move them, and measure them.
5 A mathematical model for the speed of our boat would give bigger
or smaller numbers depending on whether the boat's speed is
getting bigger or smaller.
The speedometer on your car is, in this sense, a model for your car's
speed.
The clock in your computer is a mathematical model for time.
On the other hand, the spring-driven wristwatch your grandfatherused to have is a physical model of time.
Other models are mathematical.
CONSTRUCT-A-BOAT

86
2 Computer modeling is becoming increasingly important to us be-cause in many cases, it is cheaper, quicker, and safer to make acomputer model than to make a physical model or to test the realobject.
In the 1950s and 1960s, many pilots were killed testing new kindsof airplanes.
Today, airplanes are tested as mathematical models before they areeven built, and far fewer pilots are killed testing them.
Building mathematical models using computers is called computermodeling.
NATIONAL SCIENCE TEACHERS ASSOCIATION.
96
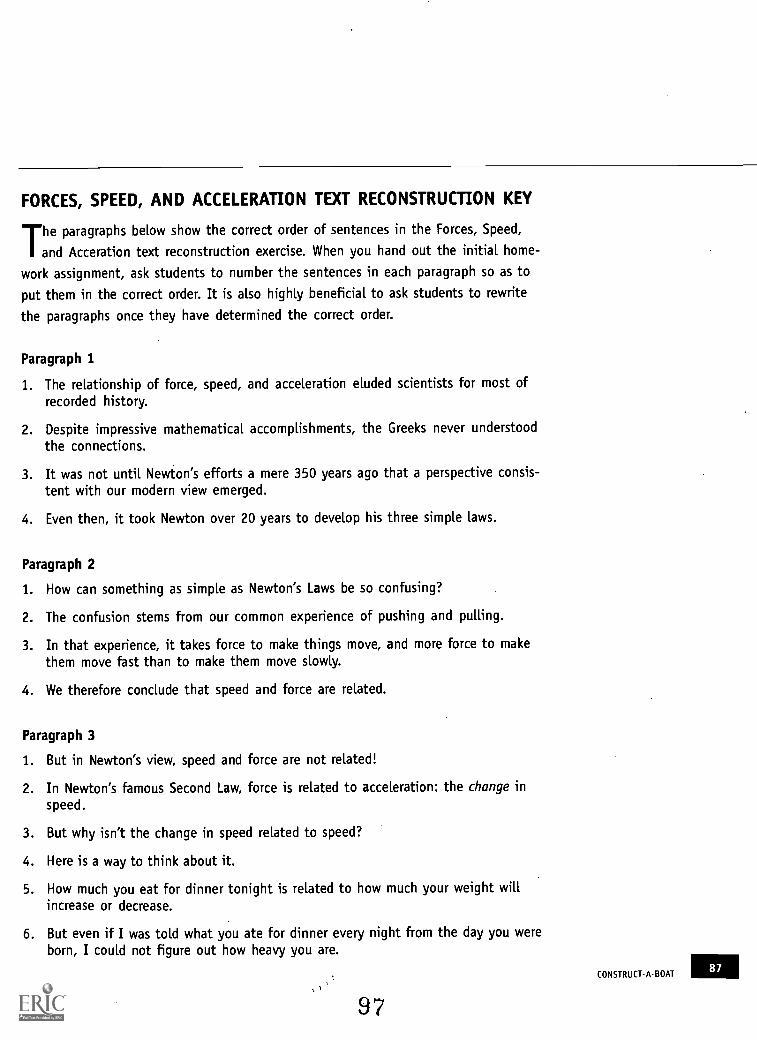
FORCES, SPEED, AND ACCELERATION TEXT RECONSTRUCTION KEY
The paragraphs below show the correct order of sentences in the Forces, Speed,
and Acceration text reconstruction exercise. When you hand out the initial home-
work assignment, ask students to number the sentences in each paragraph so as to
put them in the correct order. It is also highly beneficial to ask students to rewrite
the paragraphs once they have determined the correct order.
Paragraph 1
1. The relationship of force, speed, and acceleration eluded scientists for most ofrecorded history.
2. Despite impressive mathematical accomplishments, the Greeks never understoodthe connections.
3. It was not until Newton's efforts a mere 350 years ago that a perspective consis-tent with our modern view emerged.
4. Even then, it took Newton over 20 years to develop his three simple laws.
Paragraph 2
1. How can something as simple as Newton's Laws be so confusing?
2. The confusion stems from our common experience of pushing and pulling.
3. In that experience, it takes force to make things move, and more force to makethem move fast than to make them move slowly.
4. We therefore conclude that speed and force are related.
Paragraph 3
1. But in Newton's view, speed and force are not related!
2. In Newton's famous Second Law, force is related to acceleration: the change inspeed.
3. But why isn't the change in speed related to speed?
4. Here is a way to think about it.
5. How much you eat for dinner tonight is related to how much your weight willincrease or decrease.
6. But even if I was told what you ate for dinner every night from the day you wereborn, I could not figure out how heavy you are.
CONSTRUCT-A-BOAT
97
87

88
Paragraph 4
1. Thus in Newton's picture of the world, force tells us about accelerationthechange in speedbut it cannot tell us about speed itself.
2. Yet if I get on my bicycle I know this is wrong.
3. I have to pedal harder to go faster.
4. But the reason I have to pedal harder is because of air resistance.
5. Instead of pedaling harder, I could reduce my air resistance by getting racingclothes, or by cycling behind an air shield.
6. Then I would go fast without pedaling harder.
7. Thus a cyclist can go faster without increasing the force exerted.
NATIONAL SCIENCE TEACHERS ASSOCIATION
98

SYSTEMS TEXT RECONSTRUCTION KEY
Paragraph 1
1. Systems analysis and systems thinking are increasingly important aspects of themodern world.
2. In any complex situation, there are many related parts which affect each other.
3. Understanding those effects and relations is called systems analysis.
Paragraph 2
1. The simplest kind of systems analysis involves understanding whether an in-crease in one quantity will cause an increase, decrease, or no change in another
quantity.
2. If you increase what you eat for dinner, you will increase your weight (unless youalso exercise more, or do something equivalent).
Paragraph 3
1. Often the links in a systems analysis can be complicated and even contradictory.
2. If the weather gets colder, you play Less baseball and get less exercise.
3. But when the weather gets colder it also snows more and so you go skiing andget more exercise.
Paragraph 4
1. In a simple case, we can tell what will happen without having to calculate withnumbers.
2. It snows and I will go skiing.
3. But will I get more exercise than I got back in July?
4. Here I will need to know how many times I played baseball, how many times Iwent skiing and how much exercise I got each time.
5. To calculate the exact amount of exercise for each case, I will need to use a
mathematical model.
CONSTRUCT-A-BOAT
98

90
MODELING TEXT RECONSTRUCTION KEY
Paragraph 1
1. The word "model" has several different meanings.
2. We will use it in the following way.
3. A model is a device that acts like the thing it is a model of, but is not itself thatthing.
4. This is different than the most common usage of the term, in which "model"really means "looks like."
5. A model car looks like a car, but it does not run like a car.
6. Our case is just the opposite.
7. Our model boat does not look much like a boat, but it does run like a boat.
Paragraph 2
1. Modeling is the process of making models that behave like the thing we aremodeling.
2. Some models are physical.
3. We can touch them, move them, and measure them.
4. Other models are mathematical.
5. A mathematical model for the speed of our boat would give bigger or smallernumbers depending on whether the boat's speed is getting bigger or smaller.
6. The speedometer on your car is, in this sense, a model for your cat's speed.
7. The clock in your computer is a mathematical model for time.
8. On the other hand, the spring-driven wristwatch your grandfather used to have isa physical model of time.
Paragraph 3
1. Building mathematical models using computers is called computer modeling.
2. Computer modeling is becoming increasingly important to us because in manycases, it is cheaper, quicker, and safer to make a computer model than to make aphysical model or to test the real object.
3. In the 1950s and 1960s, many pilots were killed testing new kinds of airplanes.
4. Today, airplanes are tested as mathematical models before they are even built,
and far fewer pilots are killed testing them.NATIONAL SCIENCE TEACHERS ASSOCIATION
100

Co ApPeAdix
* a
*>1
Sample Answers
101
CONSTRUCT-A-BOAT

92
p, ORGANIZING THE DATA
Here is an example of recording and calculating data for the change of speed over
time.
Time onstopwatch
(in seconds)
Distance fromstarting point
(in meters)
Speed@ distance
(in m/s)
Speed change =1
speed- speed.,(in m/s)
0 (start) 0.00 0 0
3 .06
6 .22
9 .47
12 .75
15 1.07
18 1.39
21 1.72
Students should be encouraged to find their own way to calculate speed, but their
thinking needs to be pushed and challenged. Their first ideas are likely to be wrong.
Mindless use of speed vs. distance/time will generate incorrect answers!
Here are some approaches that work:
1. Graph the data for distance vs. time and calculate speed from the slope of the
graph. Graphing calculators work well here.
2. Calculate the average speed to that point in time. If the accelerations were
constant, speed at the end time would be twice the average speed over the
interval.
3. To improve on Method 2, calculate the average speed over the time interval.
Compare that to the speed at the end of the previous interval and use twice the
difference for the speed at the end of the interval. This method only assumes
constant acceleration over the time interval, and is quite accurate for small time
intervals.
NATIONAL SCIENCE TEACHERS ASSOCIATION
102

SCALE MODEL EXTENSIONS HOMEWORK
1. Use the Weight Scale Factor to calculate the weight for the model boat based on
the Design Brief data for a real boat with no cars or people.Scale factor = 12,167,000M/V Nantucket = 1150 tons = 2,300,000 lbsModel = 2,300,000/12,167,000 = 0.189 lbs = 80 gramsModel Boat Weight = 80 grams
2. Estimate the maximum weight of people and cars that the ferry carries.
1100 people x 125 lbs/person - 137,000 lbs60 cars x 3000 lbs/car = 180,000 lbsPeople and Cars Weight = 317,000 lbs
Determine the scale weight for people and cars in grams.317,000 lbs/12,167,000 = .026 lbs = 13 grams
People and Cars Scale Weight = 13 grams
MINIMIZING SURFACE AREAFill with SandQuestions 1-2 are procedural
3. Compute the total area of the inside surface that touched the sand. Note theunits you use for area.Method 1: Lay a grid over the "wet area" and count squares
Method 2: Divide "wet area' into geometric shapes and calculate area of each shapefrom length measurements and geometry
4. What is your conclusion about the relationship between volume and surface area?Some shapes have more volume per unit surface area; curved surfaces seem to havethe highest
5. How will this information help you in the design of the boat hull?
Can help design for reduced friction
CONSTRUCT-A-BOAT93

-SIY-4141- BUILDER PROBLEM
Propose two distinct methods to minimize fluid friction and describe them in thespace below. Use additional pages for sketches if that helps your explanation.
One involves reducing wet area; another involves reducing surface roughness.
94
Design and conduct a test to determine improvements in the friction coefficient forthe model boat. If you can, try using the computer model to understand better howthe friction coefficient affects the model boat performance. Describe your test below.
There are many solutions. One involves pulling the boat with a spring scale. But becareful: results depend on speed: It is difficult to pull a boat at a constant speed
PROTOTYPE CONSTRUCTION
ProposalReview student work to look for designs with reduced wet area and designs withsmoother finish. Check that their plans are consistent with available fabrication skillsand facilities.
MaterialsReview student lists for completeness and consistency with any material limitationsyouhave stated.
Comparing Performance Data1. top speed of Quick-Build = .5 m/sec
top speed of new model = .6 m/sec
2. acceleration time for Quick-Build = 10 secacceleration time for new model = 10 sec
3. Compare the performance of your new model to that of your Quick-Build. Providea brief qualitative description below.
Example: The new model is slightly faster, about 20%
4. How would you describe the improvement in performance quantitatively? Whatcalculations do you need to make?
Example: We will need to repeat baseline measurements and organize the data.We will need to devise a speed vs. time graph and compare it to the baselineoriginal.
5. Summarize your results and explain how you have achieved them.Example: We reduced water/friction, increasing both the average accelerationand the top speed. We did this by changing the hull shape and by reducing thesurface roughness.
NATIONAL SCIENCE TEACHERS ASSOCIATION 104

baseline data: data taken to determineconditions before an experiment is started
beam: the widest point of the hull at thewaterline
brainstorm: a group problem-solvingtechnique that involves the spontaneouscontribution of ideas from all members ofthe group
calibration: determining a measurementscale or aligning a device with a measure-ment scale
centerline: the line of a boat running foreand aft (see keel)
draft: the distance from the waterline tothe lowest part of the hull; the draftdetermines the shallowest depth in whichthe boat will still float
dynamics: a branch of physics related tothe effects of forces
energy conversion: energy in differentforms is often converted from one form toanother; heat is converted into light, lightinto heat, motion into heat, etc.
energy transfer: the movement of energyfrom one place to another or from one formto another
equilibrium: a balance between twoopposing processes such that the net effectof the two processes is no total change. Forexample, we breathe in about as much air aswe breathe out, so that over time, our lungsstay roughly the same size
factors: the different elements out of whicha whole object is made, often used todescribe the different causes that lead to aparticular outcome
forces: pushes and pulls
friction coefficient: a constant varyingwith the condition of surface that deter-mines the size of the force of friction. Thecoefficient is usually measured experimen-tally because it is too complicated todetermine from theory
frictional force: resistance caused by thepassage of water across the hull surface
hull: the outside wall of a ship that beginsat deck-level and goes down to the keel
keel: the centerline of a boat running foreand aft; the backbone of a vessel
prototype: an original model; the first full-scale and (usually) functional form of a newtype or design of a construction
residual resistance: all resistance affectinga body's motion through the water exceptthe frictional force. Includes air friction andwave-making
scaling: increasing or decreasing the size ofsomething in such a way that all parts are inthe same proportion as the original object
scale factor: a number that indicates howmuch smaller or larger one object is ascompared with a specific copy of it
scale model: a copy of an object (usuallysmaller) made so that all components are inproportion to one another
section: the shape of a plane passingthrough the hull perpendicular to thecenterline
section coefficient: the ratio of the area ofa section divided by the area of a rectangu-lar section having the same beam and draft.It is a measure of the relative fullness of asection, and permits the comparison of hullsof differing sizes and shapes
system: a collection of interacting compo-nents that work together as a unit
tolerance: the degree of accuracy de-manded in a construction
total displacement: the total weight of aboat including passengers and cargo
variable: an object or quality of changeablevalue
wetted surface: that part of the hull incontact with the water when the hull isloaded to its total displacement
1 0 5
air lossary/
CONSTRUCT-A-BOAT95

Referen4 CT
96
American Association for the Advancement ofScience. 1993. Project 2061: Benchmarks forScience Literacy. New York: Oxford UniversityPress.
Bennett, K. E., and W. C. Ward. 1993. Construc-tion versus Choice in Cognitive Measurement:Issues in Constructed Response, PerformanceTesting, and Portfolio Assessment. Hillsdale,NJ: L. Erlbaum Associates.
Bray, A., and C. Curtis. 1994. The Directory ofWooden Boat Builders & Designers: A Guide toBuilding and Repair Shops and Designers inNorth America. Wooden Boat Publication.
Chapelle, H. I., and J. Wilson. 1994. YachtDesigning and Planning. New York, London:W. W. Norton & Company.
Germann, P. J., Haskins, S., and S. Au ls. 1996.Analysis of nine high school biologylaboratory manuals: Promoting scientificinquiry. Journal of Research in ScienceTeaching 33(5):475-499.
Gitomer, D.H. 1988. Individual differences intechnical troubleshooting. Human Perfor-mance 1(2):111-131.
Gokhale, A. 1997. Writing in the technologydiscipline. The Technology Teacher 56(8):11-23.
Gross light, L., Unger, C., and E. Jay. 1991.Understanding models and their use inscience: Conceptions of middle and highschool students and experts. Journal ofResearch in Science Teaching 28(9):799-822.
Haas, N. and C. Boston. 1994. One schoolexperiments with performance-basedassessments. The Eric Review. 3:13-14.
International Technology Education Association.1996. Technology for All Americans: ARationale and Structure for the Study ofTechnology.
Keys, C. W. 1995. An Interpretive study ofstudents' use of scientific reasoning duringa collaborative report writing intervention inninth grade general science. ScienceEducation 79(4):415-435.
Linden, M.J. 1990. Why Johnny Can't Write: Howto Improve Writing Skills. Hillsdale, NJ: L.Erlbaum.
Naveh-Benjamine, M., and Y. Lin. 1991.Assessing student's origination of concepts: Amanual for measuring course-speaficknowledge structures. Ann Arbor: NationalCenter for Research to Improve Post-secondary Teaching and Learning, Universityof Michigan.
NATIONAL SCIENCE TEACHERS ASSOCIATION
106
National Council for Teachers of Mathematics.1991. Professional Standards for TeachingMathematics. Reston, VA: NCTM.
National Research Council. 1996. NationalScience Education Standards. WashingtonDC: National Academy Press.
Raizen, S. A., Sellwood, P., Todd, R. D., and M.Vickers. 1995. Technology Education in theClassroom: Understanding the Designed World.San Francisco: The National Center forImproving Science Education, Jossey-BassPublisher.
Roberts, N., Andersen, D., Deal, R., Garet, M.,and W. Shaffer. 1983. Introduction toComputer Simulation: A System DynamicsModeling Approach. Productivity Press.
Roth, W. M., and G. M. Bowen. 1995. Knowingand interacting: A study of culture,practices and resources in a grade 8 open-inquiry science classroom guided by acognitive apprenticeship metaphor.Cognition And Instruction 13(1):73-128.
Rudner, L., and C. Boston. 1994. PerformanceAssessment. The Eric Review 3:2-12.
Schaub le, L., Klopfer, L.E., and K. Raghavan.1991. Students' transition from an engi-neering model to a science model ofexperimentation. Journal of Research inScience Teaching 28(9):859-882.
Schuring, D. J. 1977. Scale Models in Engineer-ing. NY: Pergamon Press.
Snir, J. And C. Smith. 1995. Constructingunderstanding in the science classroom:Integrating laboratory experiments, studentand computer models, and class discussionin learning scientific concepts. In D.Perkins, J. Schwartz, M. West and S. Wiske(eds.), Software Goes to School, pp. 233-254. Oxford: Oxford University Press.
Stigler, J. and J. Hiebert. 1999. The TeachingGap. New York, NY: The Free Press.
Whimby, A. 1987. Analyze, Organize, Write: AStructured Program for Expository Writing.Hillsdale, NJ: L. Erlbaum.
Winters, J. 1997. The Shape of the Canoe. BulkFalls, Ontario.
Wong, E.D. 1993. Understanding the generativecapacity of analogies as a tool for explana-tion. Journal of Research in Science Teaching30(10):1259-1272.
BEST COPY AVAILABLE

water
Explore principles of buoyancy, hull design, scale modeling,
and seaworthiness with Construct-a-Boat.
,,tivConstruct-a-Boat. challenges high school students to
investigate the physics of boat performance and to work
with systems and modeling. Through the research. design,
testing, and evaluation of a model boat, students experience
the practical application of mass, speed, and acceleration
while applying the math and science necessary to build a
scale model.
Science by Design Series Because students learn by doing, the Science by Design series
offers a method for students to successfully formulate and carry out product design. These
teacher-tested units introduce the design process and sharpen student abilities to investigate,
build, test, and evaluate familiar products. All four volumes are keyed to the National Science
Education Standards, the Benchmarks for Science Literacy, and the International Technology
Education Standards.
Grades 9-12
BEST COPY AVAILABLE
NationalScienceTeachersAssociation
107
ISBN: 0-87355-178-8PB152X2
(9/92)
U.S. DEPARTMENT OF EDUCATIONOffice of Educational Research and Improvement (OERI)
Educational Resources Information Center (ERIC)
NOTICE
REPRODUCTION BASIS
e
IC
ri This document is covered by a signed "Reproduction Release(Blanket)" form (on file within the ERIC system), encompassing allor classes of documents from its source organization and, therefore,does not require a "Specific Document" Release form.
This document is Federally-funded, or carries its own permission toreproduce, or is otherwise in the public domain and, therefore, maybe reproduced by ERIC without a signed Reproduction Releaseform (either "Specific Document" or "Blanket").