Embed Size (px)
Citation preview
DOCUMENT RESUME
ED 461 480 SE 060 325
AUTHOR Bielefeld, Marilyn; Daniels, Sadie; Hall, Yolanda;McClendon, Cecil; Schlinger, Gary
TITLE Physics and Physical Science Units for Tech Prep.SPONS AGENCY Indiana Univ. Northwest, Gary.; Gary Community School Corp.,
IN.; Merrillville Community School Corp., IN.; Indiana StateCommission for Higher Education, Indianapolis.
PUB DATE 1997-05-00NOTE 36p.; A produce of the PACE Project.PUB TYPE Guides Classroom Teacher (052)EDRS PRICE MF01/PCO2 Plus Postage.DESCRIPTORS Chemical Industry; Chemistry; Curriculum Guides;
Electricity; High Schools; Integrated Curriculum;*Interdisciplinary Approach; Mathematical Concepts;Mathematics; Measurement; *Physical Sciences; Physics;Scientific Concepts; Teaching Guides; *Tech Prep; TechnicalEducation; *Technology
IDENTIFIERS Gary Public Schools In; Merrillville Community SchoolCorporation IN
ABSTRACTPromoting ACademic Excellence in Mathematics and Science for
Workers of the 21st Century (PACE) was a consortium project made up ofIndiana University Northwest, the Gary Community Schools, and theMerrillville Community Schools. The focus of this project was to prepareteachers and curricula for Tech Prep mathematics and science courses for thetwo school districts. The courses and course units prepared by the projectare intended to promote the Core 40 Competencies of the Indiana Department ofEducation for High School courses. This document contains units for Physicsand Physical Science designed to help students with a wide range ofbackgrounds and abilities learn physics. The Physics course includes thefollowing units: (1) The Mathematics of Physics and Measurement; (2) Newton'sLaws of Motion; (3) Electricity and Magnetism; and (4) Heat, Temperature, andEngines. The Physical Science course includes activities that link thetraditional English, math, and physical science classes. Units in this courseinclude: (1),Measure of Volume, Mass, Length; (2) Derived Measurements,Scalar Quantities; (3) The Chemical Industry; (4) Workplace Applications ofTriangle Math; and (5) Motion and Energy. (JRH)
Reproductions supplied by EDRS are the best that can be madefrom the original document.
Physics and
Physical Science
Units for Tech PrepPERMISSION TO REPRODUCE AND
DISSEMINATE THIS MATERIALH BEEN RANTED BY
r
TO THE EDUCATIONAL RESOURCESINFORMATION CENTER (ERIC)
PACE
U.S. DEPARTMENT OF EDUCATIONOffice of Educational Research and Improvement
EDUCATIONAL RESOURCES INFORMATIONCENTER (ERIC)
ii This document has been reproduced asrec ed from the person or organizationoriginating it.
0 Minor changes have been made toimprove reproduction quality.
Points of view or opinions stated in thisdocument do not necessarily representofficial OERI position or policy.
Promoting Academic Excellencein Mathematics, Science & Technologyfor Workers of the 21st Century.
Gary Community School CorporationMerrillville Community School CorporationIndiana University Northwest
Clyde Wiles, DirectorKenneth Schoon, Associate Director
BEST COPY AVAILABLE
Applied Units for Physics andPhysical Science
ContributorsMarilyn Bielefeld, Sadie Daniels, Yolanda Hall, Cecil McClendon, and Gary Schlinger
Section OnePhysics
An Applied ApproachUnit I The mathematics of physics and measurementUnit II Newtons laws of motionUnit III Electricity and magnetismUnit IV Heat, temperature, and engines
Section TwoPhysical Science
An Applied ApproachUnit I
Unit llUnit IIIUnit IV
Measure of volume, mass, length;derived measurements; scalar quantities
The chemical industryWorkplace applications of triangle math
Motion and energy
3
PACEPromoting ACademic Excellence in Mathematics and Science for Workers of the 21st Century
PACE was a consortium project of Indiana University Northwest, the Gary Community Schools, and theMerrillville Community Schools. It was supported by funds from the three institutions and byEisenhower grants from the Indiana Higher Education Commission.
The focus of the project was to prepare teachers and curricula for Tech Prep mathematics and sciencecourses for the two school districts. The effort took place over 1994 - 1996 and involved more than 70teachers from seven High Schools. The Director of the project was Dr. Clyde A. Wiles, and the AssociateDirector, Dr. Kenneth J. Schoon, both of Indiana University Northwest.
Part of the effort was the developing of units and course outlines for use in the first two years of a HighSchool Tech Prep program. Individual schools and faculty will be using these materials in a variety ofways from being a course guide to being a supplement to an already existing program.
We have taken the position that Tech Prep is not a program for the academically deficient. Rather it is anapplied approach to curriculum that has the goal of promoting competencies recommended by the Stateof Indiana for non-remedial high school courses, and which does so in a learning environment thatemphasizes applications. We would like students to find within these course materials and instructionalapproaches immediate and obvious responses to the questions: "What does this look like?" and, "Whywould anyone want to know?"
These courses and course units then are intended to promote Core 40 Competencies of the IndianaDepartment of Education for High School courses. For mathematics, we viewed this as beginning withAlgebra One and for science beginning with Biology. The Pre-Algebra course is not a Core 40 course,but does maintain the applied perspective.
Our efforts have had to accommodate to several factors. First there is an Indiana mandate that all highschools have a Tech Prep curriculum that targets the academic and school-to-work needs of the middle50% of the high school student population. There are on the other hand, persistent beliefs of counselors,teachers, administrators, students, and parents that something called "tech" anything, is just anothername for a program intended for "at risk" students who are not expected to acquire competencies at alevel that would enable them to pursue post secondary schooling at the college or university level. Thesebeliefs are often supported by admission policies at some universities. We have, therefore, attempted toposition Tech Prep courses as courses that meet exactly the same Core 40 competencies (as defined bythe Indiana Department of Education) as are to be met by college prep courses of the same name, but todo so in applications-based and problem-centered approaches.
Clyde Wiles, DirectorKenneth Schoon, Associate Director
Division of EducationIndiana University Northwest
Gary, IndianaMay, 1997
4
PhysicsAn Applied Approach
IntroductionThis Applied Physics Course is designed to help students with a wide range of backgrounds andabilities to learn physics . The philosophy of the course is that students learn best when theybecome involved the subject matter. To that end this course strikes a balance between emphasizingthe principles and concepts of physics to the solution of problems .
The main goal of this course is to make the physics experience more meaningful to high schoolstudents. By the end of this course, students should be able to apply their physics experience toreal life situations in the world around them, including the world of work. This will beaccomplished by brief lectures, skill demonstrations, cooperative learning, problem solvingactivities, hands-on laboratory experiments, and video media. Mathematical methods of laboratorymeasurement, scientific notation, significant digits, algebra manipulations, and graphicalrepresentations are used throughout this course.
Prerequisites for this course are: 1) A grade of 'C' or better in Algebra I, 2) A grade of 'C' orbetter in Geometry, and 3) Concurrent enrollment in Trigonometry.
Course Competencies:At the successful completion of this course the student will be able to:
1) Demonstrate an awareness of the fundamental constituents of matter.2) Measure or determine the physical properties including mass, charge, volume,
temperature, and density of an object.3) Use the concepts of temperature, thermal energy, transfer of thermal energy and the
mechanical equivalent of heat to predict the result of energy transfer. .4) Use appropriate vector and scalar quantities to solve problems in one or two dimensions.5) Describe and measure motion in terms of position, time, and the derived quantities of
velocity and acceleration.6) Use Newton's laws to predict the motion of an object.7) Describe the interaction between stationary charges using Coulomb's law.8) Analyze simple arrangements of electrical components in series and parallel circuits.9) Describe electric and magnetic forces in terms of the field concept and the relationship
between moving charge and magnetic fields.
Unit ListThis course is now grouped into four units:
1) The mathematics of physics and measurement;2) Newtons laws of motion;3) Electricity and magnetism;4) Heat, temperature, and engines.
More units will be written in PACE '96
PACE Applied Physics: An Applied Approach
Unit 1: The Mathematics of Physics and MeasurementThis introductory unit for Applied Physics will allow students with hands-on activities to observeand record measurement. They will interpret their data using graphs and finding the uncertainty oftheir measurements. This unit will prepare them for success in this Applied Physics course.
Objectives: The students will be able to:a. Demonstrate an ability to use metric instruments .
b. Perform arithmetic operations using significant digits and scientific notationsc. Learn prefixes used in the metric system and convert from one to anotherd. Recognize that all measured quantities have uncertaintiese. Demonstrate an ability to construct a graph and use a graphing calculator.
Workplace RelationshipsArchitects, Building contractors and subcontractorsDoctors, nurses and health techniciansEngineers, mechanics and craftsmenFood specialistsTailors and fashion designersQuality control personnel
Activities:I. Divide student into groups. Have each group prepare a report on items that they find in theirhomes using metric units (tools, foods, medicines etc.). Have them interview relatives andneighbors to find what kinds of work or businesses that use measurements or metric instrumentson a daily basis. Share answers with the rest of the class.
2. Each group will make several measurements using a metric ruler, balance and graduatedcylinder of everyday items.
a. Each student will choose a job role for their group.b. The students will:
- record their answers- discuss why their answers may vary- tell how many significant digits in each answer- practice arithmetic operations with significant digits
3. The students in each group will be given different size milk and juice cartons, they should marka point on the inside of each carton. They are to find the volume of the carton to the mark point incubic centimeters. They will fill the carton with water (up to the mark) and find the volume inmilliliters. They will also find the mass in grams of the water in each carton and record all of theirresults. (Find the mass of the beaker, then the beaker with water and subtract the final mass fromthe initial mass).
4. Each group will be asked to determine how many gallons of water it will take to fill an aquariumup to four centimeters from the top using only a metric ruler. The students will:
-determine a method for solving the problem-decide when the will convert from the metric to the English system
5. Each student will be given a map. As a group they will measure distances from various cities inmilliliters. They should change their answers to centimeters and using the scale on the map find theactual distances. Compare answers with other groups.
2

PACE Applied Physics: An Applied Approach
6. Each group should assume that they are to buy carpet and paint the classroom with the ceilingand walls a different color using only a meter stick and metric ruler. the carpet will be bought insquare yards. Each gallon of paint will cover 53 square yards. They will do the following:
-determine how many square yards of carpet they will need-decide how many gallons of paint they will need for the walls and ceiling-find the average for all groups and discuss why some answers deviate from the average.
7. Using a micrometer measure several different types of wires. Write their answers in scientificnotation retaining only significant digits.
8. Each group should receive three graphs Examples-mass/volume; time/distance;speed/distance). They will identify the dependent and independent variables. From any three pointson the independent variable they should find the dependent variable and vice versa for each graph.Have each group think of five questions for the other groups to answer.
9. The group should be given a set of data to graphed. They will label the independent and dependentvariables and determine the range. They should number and plot the points on the graph. The graphshould have an appropriate title. Each group should compare their answers to other groups anddiscuss their differences.
10. Have members of each group construct a launching ramp. Put one end of the ramp on a stack ofbooks and the other end on the floor. Mark off a distances 1,2,3,4,5 meters from the end of theramp Using several different types of toy cars or balls record the time it takes to travel to thedifferent distances and compute the speed. Make three recordings for each object and record theanswers . Make a graph to compare the distance to each marker to the speed of the object for eachcar or ball. Enter the results in a graphing calculator and compare.
11. Using the CPL.. graphing calculator (TI-82) and motion detector students will predict howthey have to move to show a straight line with a positive slope, etc. The Dynamics of Walking, UsingReal Data in the Tech Prep Classroom, Enriwue Gaindo, 1995
12. Use the VCR with laser disk and bar code to show mathemedia: Module 4, Dr. Kloosterman,Indiana University, Bloomington , Indiana. Have students work problem for measurement section asthey watch the video.
13. Have Students read "Physics and Society; Research dollars " (p. 7) and "To SI or Not to SI" (p16) in Physics, Principles and Problems, Merrill Publishing Co. and discuss with the rest of theclass.
Assessment:1. Written tests or quizzes (each week)2. Use CAP Generalized Cubic for:
0 containing laboratory and written reports.- oral questions-asked of students after each activity
3. Group participation and attendance.
3
PACE Applied Physics: An Applied Approach
Unit 2: Newton's Laws of MotionThe constancy theme, particularly stability and equilibrium, is developed and expanded by theintroduction of Newton's laws of motion. These laws unify a broad range of phenomena.
Objectives:a) Explain how force between objects interrelate.b) Develop a free body diagram of the forces operating on an object.c) Student will be able to apply newton's three laws to real life situations.d) Understand the difference between net force that causes acceleration and action reaction
pairs.e) Name the four basic force, their relative strength, and give some familiar examples.f) Distinguish between Weight and Mass.g) Demonstrate an understanding of frictional force and be able to use Newtons Laws in problem
solving.
Suggested Laboratory Activities:The following laboratory experiments are suggested from Physics; by Merrill.
1) Getting straight. P-282) The car race. P-503) The ball and the car race. P-704) The elevator ride. P-985) The paper river. P-1146) The softball throw. P-140
4

PACE Applied Physics: An Applied Approach
Unit 3: Electricity and MagnetismElectricity and magnetism is the foundation for various career choices from engineering to routineelectrical maintenance. This unit will prepare students to go on to further their studies inelectricity; whether these studies be in a traditional college setting, technical school, orapprenticeship training program. Through various experiments and activities utilizing actualequipment used by electricians, the students will learn the basics of electricity.
Objectives: Each student upon the completion of this unit will be able to:a. Charge an objectb. State the difference between conductors and insulatorsc. State Coulomb's law and the SI unit of charged. Solve problems using Coulomb's lawe. Explain the formation of electric and magnetic fields without chargesf. Show an understanding of Thomson's measurement of the charge-to-mass ratio of electronsg. Be able to explain the right hand rule as it applies to force and direction of currenth. Solve problems using various electrical formulasi. Describe a series circuit and parallel circuit, citing the difference between the twoj. Construct a combination parallel and series circuitk. Calculate voltage, current, or resistance using the formula V.1 R
Workplace Relationships:ElectricianElectrical EngineeringGeneral Appliance RepairComputer, Radio, and Television RepairTelephone LinemanElectric Meter Technician
ACTIVITIES:1. Electricity and safety (Merrill Physical Science Activities Workbook p. 25) In this activitystudents will discuss methods that may be used to increase the safety of ground level transformersand also determine whether the local utility company adequately labels all transformer boxes.
2. Identifying Electric Conductors and Insulators (Physical Science, D. C. Heath Chapter 8)Students use an electroscope to determine which objects conduct electricity.
3. Plastic Wrap and Static Cling. (Physical Science, D.C. Heath Ch. 8)In this exercise, students compare the cling strength of plastic wrap on different materials.
4. Dancing Paper (Teaching the Fun Of Physics, p. 100) Students charge a balloon and dem-onstrate that electric charge is strong enough to overcome the force of gravity to move paper.
5. Electromagnets (Teaching the Fun of Physics, p. 104) Students use two size D batteries alongwith a nail and aluminum foil to create a magnetic field.
6. How a Flashlight Works (Teaching the Fun of Physics, p. 104) Students use a battery andstrip of aluminum foil to light a small incandescent bulb.
7. Circuits (Physics: Principles and Problems, p. 479) Students construct series, parallel, andcombination circuits and determine current and resistance throughout the circuits.
8. Electric Motor (Physics: Principles and Problems p. 501) Students construct an electricmotor to demonstrate their knowledge of the right hand role.
(4
PACE Applied Physics: An Applied Approach
Unit 4: Heat Temperature and Engines
Objectives: The student will-
distinguish between heat and temperature.identify and demonstrate temperature conditions necessary for heat exchange between objects.demonstrate the relationships between friction and heat.describe the difference between Celsius and Fahrenheit temperature,describe the process of heat transfer by conduction, convection and radiation.describe and illustrate methods that man can use to conserve heat energy.
Skills to be acquiredMeasure temperature with a Celsius thermometer, measure temperature with a Fahrenheitthermometer, construct a graph, compare, measure volume, solve problems, define, explain,arrange, organize, group, list, convert, infer, submit, demonstrate, utilize, show and design.
Workplace relationshipsHeating and cooling specialist, large engine repair (automobile, truck repair), small enginerepair, building contractor (heating and cooling, insulation), fashion design (insulation), foodservice technician, laboratory technician, practical nurse, aircraft mechanic and ceramics.
Learning Activities / Teaching Strategies to use
HEAT and TEMPERATURE
OBJECTIVE: To be able to distinguish between heat and temperature.Students will be able to-
define heat and temperature.compare and contrast heat and temperaturetell what happens to change in water temperature as mass increases.
MATERIALS: Ring stand, ring, wire screen, water, graduated cylinder, beaker, heating source,paper, pencil, and graph paper.
ACTIVITY:1. Set up ring stand as modeled by teacher. Place over heat source.2. Use graduated cylinder to measure 50 milliliters of water and pour into a beaker.3. Using the scientific method, record under data the starting temperature for 50m1. Turn on
the heat source and stir for 30 seconds (without thermometer). Place thermometer in thewater without touching sides or bottom of beaker and after 60 seconds, record the finaltemperature.
4. Repeat the above steps with 150m1., 250m1., 350m1., and 500m1., of water and record theinformation.
5. Find the temperature change by subtracting the beginning temperature from the finaltemperature and record.
6. Construct a graph comparing the mass of the water with the temperature change.
6

PACE Applied Physics: An Applied Approach
Celsius and Fahrenheit ThermometersObjectives: To see the relationship between Celsius and Fahrenheit thermometers.Students will be able to-
know freezing and boiling points of water in Celsius, Fahrenheit and Kelvin degrees.be able to convert from one scale to another.
Materials: Celsius and Fahrenheit thermometers, water, beaker, ice, heat source, graph paper.Activity:
1. Using the scientific method, record under data the room temperature for both types ofthermometers.
2. Make a chart (also under data) to record the temperature for every minute until the waterboils for both Celsius and Fahrenheit.
3. Record the temperature using the Celsius thermometer until the water boils.4. Repeat the above steps using a Fahrenheit thermometer.5. Construct a graph (time vs. temperature) and show both sets of information.6. As a member of a group record the temperature from a bank clock twice a day for several
days in both Celsius and Fahrenheit degrees.7. Record the high and low temperatures from the weather report for several days and convert
to Celsius degrees using the formula C=5/9 (F-32).8. Take several temperatures that were recorded during the activity and change from
Fahrenheit to Celsius degrees and compare with data that they recorded.9. Take the Celsius temperatures as recorded in the chart and change to Kelvin by adding 273
degrees to each.
CONDUCTION, CONVECTION and RADIATION
Objective: The student will be able to describe the process of heat transfer by conduction,convection and radiation.Materials: Samples of copper, aluminum, glass, rubber, steel and wood strips, freezer (or ice),water, heat source and styrofoam cups.Activity: Conduction
1. Place samples in freezer (or with ice) and leave for at least an hour before doing activity,2. Using the scientific method, make a chart to record under data with numbers from 1 to 6 to
write in names of samples from coldest to warmest.3. Touch each sample with a different finger and rank with 1. being the coldest.4. Measure 5 centimeters down from the top of a cup and mark with a pencil.5. Fill cup to mark with hot water and record the time required (also under data) to feel the
heat for each sample.
Objectives: The student will:be able to give examples of conduction, convection and radiation.observe that some materials absorb or reflect radiation better than others.
Activity Convection and Radiation:1. Set up a ring stand as above with a beaker 3/4 full of water.2. Add a drop of food coloring to one side of beaker (do not stir).3. Gently warm the opposite side of the beaker and record observations.4. Define the words conduction, convection and radiation.5. Give examples of heat sources that keep you warm in cold weather and make a chart placing
them under the headings of conduction, convection, or radiation.6. Take two cups and make a lid for each, one with white and one with black construction paper.7. Place each cup near a light bulb and record the temperature of each at the end of the class
period. Compare the results.
7 11
PACE Applied Physics: An Applied Approach
Objective: To see how some materials conserve heat energy and are better insulators than others.Materials: Containers (glass jars, tin cans, plastics cups etc.)with lids, insulating materials(cotton, aluminum foil, various fabrics etc.), graduated cylinder, ice, watchActivity: INSULATION
1. Divide into groups of three or four people.2. Each group should take various containers and cover each with an insulating material (tape
if necessary).3. Add ice cubes to containers and seal with lid and tape if needed.4. Leave for at least 30 minutes.5. Pour water formed in a graduated cylinder and record amounts for different combinations.
Compare results.6. Tell which substances were the best insulators.
Objective: To see how engines use heat energy to do work.Activity: ENGINES
1. Have students divide into small groups.(three or four people)2. Each group should list all engines that they see or use in everyday life.3. Read their list to other members of the class.4. Take their lists and divide into three groups (electric, gasoline or steam engines)5. Each group should ask any family members who work with engines to tell them about their
work and write a short report on what they learned to be reported to the rest of the class.6. A visit should be arranged to the auto repair shop in the school if available.
OTHER SUGGESTED ACTIVITIES:1. Have a maintenance person show students the heating system of the school and explain to them
how it works.2. Arrange a visit to NIPSCO (Public Service Company) to see how heat gets to our homes.3. Visit a home that has solar heating and explain how it works.4. Have a speaker who works with heating and air conditioning to explain about various aspects of
their jobs and to illustrate various heating systems.5. Divide the students into small groups and let them pick a type of heating system to make a model
or drawings and make a presentation to the rest of the class.
Resources:VIDEOS:
The Heat is OnThe Effects of Global Warming , Solar Energy-- Hope for the Future ,Weatherization and Insulation, Energy Conservation (Home Improvement), How theAutomobile Works-- Irs Really Not Your Enemy, Car Care Series-- Get the Basics, 1993
Power Steam Show-(Steam Engines-History).BOOKS:
Modern Physical Science, Holt, Rinehart and Winston Inc., Harcourt, Brace, Javanoivich, Inc.;1991.
Focus on Physical Sciencea Heimler, Charles H. and Price, Jack; Merrill Publishing Co., 1987.Physical Sciencea Hurd, Dean and Silver, Myrna; Prentice-Hall, 1993.
Planning group membersMarilyn Bielefeld, Sadie Daniels, Yolanda Hall, Cecil McClendon, and Gary Schlinger
8 12

PHYSICAL SCIENCEAn Applied Approach
Introduction
PREREQUISITES: Algebra I, A or B. The students will be able to assemble simple labapparatus in order to carry out scientific investigations. The students will be able to organizesimple information into chart forms. The student will be able to do simple math operations using acalculator to help analyze data to make inferences. The students will understand the factor labelconversion method and will be able to solve simple algebraic equations. The students will be able todo exploratory reading to collect mathematical information.
Description of the Course
The activities described within this teaching component allows a link between the traditionalEnglish, Math, and Physical science classes. The student will identify physical science in use withinthe Physical plants within their community. The students will survey how chemicals are used in ourworld to provide the basic needs for survival. The student will research types of chemical productsproduced within the community, identify the physical and chemical properties of these products, andtheir positive and negative Biological impact upon their community. The students will have hands onexperience in collecting data using measurements with the concepts of science. They will discuss theinteractions of matter in Physical, Chemical, and Nuclear reactions as they learn about atomicstructure. The student will learn about the physical nature of matter through simple experimentsrelating motion, forces, and energy. They will also conduct experiments in an effort to understandhow electrons and magnetic fields are harvested for energy consumption.
The types of scientific careers that are available involving Biology, Chemistry, and Physics will beidentified and related to the basic scientific skills taught within the traditional Physical Sciencecourse. The educational level and skills needed to fulfill these jobs while learning the traditionalobjectives of a typical science curriculum will be used to setup a data base identifying agents thatwill provide post educational opportunities. Skills utilized by the students include; researching,experimenting, exploratory reading, organizing and sorting data, communicating through interviewslike electronic conferencing and chat rooms, technical writing skills using computers, and problemsolving skills flow charting through the cyberspace of a network in search of technical information.
The students will be assisted by the science teacher in surfing through the cyberspace of the WorldWide Web to access and comprehend scientific data about the Industrial Plants within their physicalcommunity. The Science teacher will identify the science and math skills necessary for the types ofscientific employment within the student's community, and expose the child to these skills usingcomputer based lab experiments involving Math and Science. The students will record mathematicaldata used in technical writing collected using CBL's and scientific measurement interfaces. (i.e.charts, graphs, straight line transgressions, graphing calculators, computer spreadsheets, etc.)
13
PACE Physical Science: An Applied Approach
Unit I: Measure of Volume, Mass, Length;Derived Measurements; Scalar Quantities
The students will learn how to use chemical apparatus to make simple measurement thatIndustries use in order to carry out their routine activities. The student will recognize theequipment, the calibration scales, and the appropriate units used to record data. With the use ofcharts, graphs, and diagrams; the students will be able to organize simple data recording physicalproperties and applying the data in making inferences. The students will report data using scientificmethod reporting numerical data with significant figures. Job simulations in product analysis,involving use of measurement to regulate the quantity of product output will provide practice inmeasuring length, volume, mass, and density. They will use collected data to calculate percent errorand percent composition. Within this unit the students will add, subtract, multiply, and dividenumbers. Throughout the unit the teacher will emphasize solving problems using the factor labortechnique, and make use to recording data using significant figures. Emphasize how scientist usesignificant figures to record data with the same degree of accuracy. Also, emphasize how data can bemanipulated using significant figures.
OBJECTIVES
1 The student will be able to engage in scientific inquiry with the ability to ask scientificquestions and suggest experimental approaches to provide possible answers.
2 The student will be able to use physical properties to identify common metals and liquids.3 Using standard safety techniques, the students will be able to observe and record scientific
information using computerized measurement devices as well as the standard laboratory equip-ment. The students will record physical data indicating the uncertainty of the measurement.
4 The students will determine the dimensions, mass and volume of objects within the acceptableerror of the apparatus. After measuring the mass and volume of an unidentified pure solid, thestudent will calculate density and use it to determine the identity of an unknown substance.
5 The student will understand the metric and mathematical relationship of length, mass andvolume.
6 The student will be able to use the CRC Handbook, suitable electronic data bases, and theappropriate reference material to obtain relevant information for making scientific inferences.
Workplace Applications:Method-Class Discussion
Time: I dayThe class will have a discussion identifying the different types of measurements that are
taken by technicians in various careers. Through a lecture discussion the students will be able todistinguish mass, weight, volume, length, and temperature. Guide the discussion to the followinginferences;
1. Technical engineers estimate volume and mass of quantities being used and produces toefficiently make money to run their companies.
2. Dentist use metric rulers to find the depth of gum tissue around the teeth.3. Pharmacist use measurement devices to determine the amount of medicine to dispense.4. Grocery store use measurement devices to sell produce.5. Hospitals use measurement devices to weigh patients and to dispense medicine appropriately.6. Manufacturers use measurements to save by following recipes when making their products.7. Doctors measure temperatures and vital signs to examine their patients.
2
14
PACE Physical Science: An Applied Approach
Activity OneLaboratory- Measuring Volume- Did You Buy What They Said?
Time: 3 DaysUsing a pint Rubbermaid servin saver; have the students observe how the metric volume
unit in milliliters is listed. Have the students pour water to the 100mL line on the Rubbermaidcontainer (record as expected). Using a graduate cylinder, have the student practice measuring thevolume of water at the marked level (record as observed). Repeat these steps for the 200mL and300mL lines. Have the student to make the same measurement using a small beaker, and then alarger beaker. The students will make up three charts to organize the three sets of data. Thestudents will calculate the error percentage of their observed measurement and the expectedmeasurement using the graduate cylinder, the small beaker, and the larger beaker. Have thestudent record the data collected from four other groups within the class to their charts. Have themcalculate the average volume expected and observed, and calculate the percent error of the averages.The student should infer that the graduate cylinder gives the most accurate measurements.
Workplace application:Have each group of students bring an unopened container of water. Have them measure the
volume of the water within the container. They should report of the accuracy of the label. Thestudents should discuss ways in which this information is useful to running a business effectively.The student should discuss way in which this information is useful to consumers.
Evaluation: Written explanation1. The students will explain why the three devices had different accuracies.2. The students will explain that each measuring instrument has a limit caused by the
inherent error in the construction of the instruments.3. The student will note that percent error represents the accuracy of the measurement.4. The student will discuss how measurements govern profits.
Activity Two: Measured Metric Volume is Calculated Volume3 Days
Remove the top of the juice container. The students will measure the length and the width ofa pint juice paper carton or a half quart juice carton. The students will then mark the inside to thecontainer 5cm and 7cm from the bottom (record this as the height of the container). Have studentscalculate the volume of the container at each mark( record this as the expected volume). Studentswill pour water to the 5cm mark and use the 50 ml graduate cylinder to measure the containedvolume of water(record this as the observed volume). Repeat this at the 7cm level. The studentswill calculate the error percentage of their observed measurement from the expected measurement.Have them calculate the average volume expected, the average observed volume that they measuredwith the graduate cylinder. Calculate the percent error of the averages. Have the student to graphthe expected volume verse the observed measurement. Have the students graph the observed waterheight verse the observed volume. Using this graph, have the students predict the volume of water at6cm. The student should then mark the carton at 6cm and add water to the mark. Measure thevolume using the graduate cylinder and see how their predictions compared to the measured volume.
Evaluation: Written explanation20 pts. Charts20 pts. Graphs
5 pts. for each measurement within 5% error10 pts. Inference that one cubic centimeter is the same as one milliliter10 pts. listing sources of error20 pts. Teacher test over volume calculations and graphing
3
PACE Physical Science: An Applied Approach
Activity Four: Mass Percentage (What part/ Whole X 100%)Laboratory: Measuring Mass-How Much Did Your Chip Cost!
Time: 3 daysUsing a triple beam balance, students will record the mass of an unopened bag of corn chips.
Students will then empty the contents of the bag and record the mass of the bag. The students shouldcalculate the mass percentage (percent composition) of the bag and the chips: using this numberthey will calculate the cost percentage of the bag and the chips. The students will record the mass ofthe chips within the container and compare that number to the expected mass indicated on the bag(calculate percent error). The students will count the number of chips within the container andrecord average mass of one chip. Using the mass of chip within the bag, the student will calculatethe percent of broken and unbroken chips.
BONUS: Using percent error of product output, mass percentage of unbroken chips, and the averagemass of one chip; the students estimate the number of chips in a larger bag of unopened chips.
Evaluation:Hots Graph of Mass verse quantity.Hots Sample calculations showing Average mass, Mass percentages, etc.2Opts Calculation for the Cost of the bag and the chips.4Opts Correctly estimate the number of chips in a larger bag by mass.
Activity Four: Method: Film Geometry ReviewTime: 3 days
Using any geometry review film, students will view several short lesson that have questionsat the end of each presentation. The students will view the lecture, stop the tape and discuss the filmwhile practicing how to take numerical notes. They will the complete a teacher prepared quiz.Backup the video to allow the student to review the concepts while taking the quiz. The studentsshould review, angles, shapes, area of shapes, volume of shapes, parallel lines, perpendicular lines,congruent angles, complements and supplements, angle and simple shape theories, spheres, radius,diameter, circumference, parameter, linear measurements. A laser Math interactive disc may alsobe used. Students will enter notes from the film into the Physical Science Notebook that they willwrite.
Evaluation: Interactive quiz on the video or laser disc.
Activity Five: Laboratory -Volume & Area of Geometric shapesTime: 3 days
Using the multi-shape liter set (clear plastic cube, box, and cylinders with horizontalcalibrations: the student will measure the dimensions of one box shaped container and one cylindershaped container. The student will record length, height, width, and radius in centimeters. Thestudent will choose two different calibration lines and calculate the volume for each container. Thestudent will then pour water to the indicated calibration lines and measure that volume using a 50mLgraduate cylinder. Calculate the percent error of the observed and calculated measurements.
Evaluation: Written explanation20 pts. Charts20 pts. Graphs
5 pts. for each measurement within 5% error10 pts. Inference that one cubic centimeter is the same as one milliliter10 pts. listing sources of error20 pts. Teacher test over volume calculations and graphing
4 16
PACE Physical Science: An Applied Approach
Activity SixLaboratory - Density: The Mass/Volume Relationship Of Liquids
Time- 3 dayMatter is defined as anything that has mass and occupies space. All substances are composed
of matter. All matter has properties or characteristics that allow specific substances to bedescribed and identified. Mass and volume are two of these general properties. Density is the ratioof mass to volume. It is often defined as the quantity of matter (mass) per unit of volume. Thedensity of a substance helps to identify it and to distinguish it from other substances.
Part A: Record the mass of an empty graduate cylinder using the electronic balance. To thecylinder add any amount of water, record this volume and record the mass. To get the mass of theliquid, subtract the two mass. Record the mass of the liquid in the chart in gram units. Calculatethe density of the liquid by dividing the mass by the volume. The density is the mass of 1 mL of asubstance and may be used to identify chemicals. Observe the density chart within the CRCHandbook to compare your calculations with the list of known chemicals. Have the students repeatthis procedure using a different amount of water. Record both sets of data, and a set of data fromanother group. Have the student graph mass verse volume and explain their observations. Thestudent should calculate the percent error for each measurement and the averages.
Part B: Using 4 different concentrations of salt water ranging from 1.5g/mL to 1.0g/mL, thestudents will calculate the density of the unknown liquid. The students will construct a chart, agraph, and have results within 5% error margin.
Evaluation:10pts10pts2Opts2Opts20 pt s2Opts
Written Report - Identification of an unknown liquidRecognize that the density was constant for all volumes of the samples.Recognize a direct proportional relationship between mass and volume.Construct a chart showing mass, volume, density, and % error.The student was able to graph mass verse volume.The student has percent errors less than 5%.Identified the unknown density of saline.
Activity Seven: Laboratory: Part A: Density of a Regular Shaped ObjectTime: 3 days
The volume of a wood block with a regular shape may be calculated by multiplying its length
height, width. (Volume = length X width X height= cubic units ( cm3 = 1 mL)). A solid may beweighed directly on the balance. Calculate the density of the wood block and compare yourmeasurements to the density chart for identification. The percent error should be within 5%.Construct a chart recording the results of 3 groups within the class. Graph the mass verse thevolume and find the best fit line. Calculate the slope of this line and compare it to the density of thewood. The student will compare the change in mass to the change in volume to establish aproportional relationship.
Using the value that the student calculated for the density of wood: have the students calculatethe volume of a new block of wood and use the density to predict the mass of the block. Have thestudent to then record the mass of the block and calculate their percent error.
Evaluation:20 pts. Calculation of the density of the wood showing all math calculations.20 pts. Construction of chart.20 pts. Graph showing mass verse volume.20 pts. Recognize that the density is always constant like the slope of the line in the graph.20 pts. Successfully estimate the mass of an unknown block of wood.
5
17
PACE Physical Science: An Applied Approach
Part B: Record the mass of a 10mL graduate cylinder with 5 ml of water using the balance. To thecylinder submerge one teaspoon of your irregular shaped solid metal recording the new volume. Toget the volume of the irregular solid, subtract the final volume from the initial volume. To get themass of the solid, determine the mass of the graduate cylinder with the solid in it. Subtract the massof the graduate with the water in it from the mass of the graduate with the water and metal. Recordthe mass of the solid in the chart in gram units.
Calculate the density of the solid by dividing the mass by the volume. The density is the massof 1 mL of a substance and may be used to identify chemicals. Observe the density chart to compareyour calculations with the list of known chemicals. The student should construct charts and graphs,writing a brief statement explaining how he identified the metal. (use Al or Cu shots). Repeat thesame procedure two more times using different volume of water each time.( use 4 mL, 6mL, or 7mL. The final volume with the sample should not exceed the limits of the cylinder.)
Evaluation:1 Opts1 Opts2Opts2Opts2Opts2Opts
Written Report- Identification of an unknown SolidUse mass and volume displacement method to indirectly make measurements.Recognize a direct proportional relationship between mass and volume.Construct a chart showing mass, volume, density, and % error.The student was able to graph mass verse volume.The student has percent errors less than 5%.Identified the unknown density of Aluminum or Copper
6 18
PACE Physical Science: An Applied Approach
UNIT II: The Chemical IndustryINTRODUCTION:
This unit provides students with an understanding of how chemical industries use theprinciples of chemistry to produce material goods and services. The function of the chemicalindustry is to chemically change natural materials into products that will make them more useful tosociety. Jobs today in this and related industries require people who have the ability to apply basicprinciples of chemistry. These principles include and understanding of: the composition andproperties of matter, changes in matter, nomenclature and notation of matter, and how energy isinvolved in these changes.
Students will experience, first hand, how technicians apply their basic understanding ofchemical principles. With a basic understanding of atoms, chemical and physical changes, states ofmatter, and recognition of chemical and physical properties; the students will discover howchemical technicians perform simple chemically related tasks required in manufacturing.
Objectives FOR Unit II
1 The students will be able to use appropriate nomenclature when naming and writing formulasto identify common natural and synthetic products.
2 The students will recognize the different forms of matter; liquid, solid, and gas. The studentwill be able to distinguish elements, compounds, mixtures.
3 The students will be able to use formulas and laboratory investigations to classify substancesaccording to the presence of common anions and cations. The students will test for thefollowing anions: phosphates, nitrates, and sulfates The students will test for the followingcations: Potassium, Ammonium, and Ferrous Ill.
4 The student will be able to diagram reactants and products of chemical changes using sketcheswith the appropriate chemical notations
5 The students will use the periodic table and electronegativity charts to compare attractions thatatoms have for their valence electrons, and the attraction that atoms have for electrons bondedin other compounds. The students will identify the atomic number, atomic, mass, chemicalfamilies and oxidation number of elements.
6 The students will recognize the indicators of a chemical change. The students will observecolor change, temperature change, precipitation, bubbling, emitted light, ph change and energychanges as chemical change indicators.
7 The student will describe solutions in appropriate concentration units such as molarity, ppm,ppb, or percentage by mass or volume.
8 The student will make use of Colorimetric techniques used by analytical chemists to recognizecolor indicators of chemical changes as an indication of ion concentrations. The student will beable to quantify phosphate content in fertilizer samples
9 The students will predict how a reaction rate will be affected by changes of temperature,concentration, surface area, and use of catalysts.
1 0 The students will write lab reports using computer spread sheet programs.
7
1&'

PACE Physical Science: An Applied Approach
Activity OneMethod- Laboratory- Physical Properties
Time: 2 Days
Using a table with several element spread out, the teacher will lead a discussion aboutdistinguishing things by their physical appearance. Spread out aluminum, zinc , lead, and copper.Have each element in several different forms; a sheet, powder, shots, wire and granules. Have abottle of mercury, carbon powder, iodine crystals and tincture of iodine. Guide the discussion usingthe words, hard, soft, shinny, liquid, solid, heavy, light; and as many other properties that can bedistinguished by the eye or touch. Have the student list the different properties on the blackboard.Have the students look up the names of the elements on the table in the periodic table and note theirsymbols.
Evaluation:EssayThe students will write a one page essay defining physical properties and how they are used
to distinguish matter. The student should be awarded 5pts for every property that is discussed.
Activity TwoMethod-Laboratory- Physical Changes By Change in Energy
Time: 2 days
Have a brief discussion about matter being changed from one form to another by a change intemperature, or pressure, or both. Discuss the following words; melt, condense, freeze, sublima-tion, boil, and evaporation. Also discuss how the kinetic energy of the molecules increases withtemperature causing the forces holding the ice molecules together weakens. Using a thermometer,and beaker of ice in a small amount of water, plot the temperature change verse time as the beakeris heated slowly. First, stir the ice water until the temperature reaches 0 to 3 degrees Celsius, andplace the beaker on a hot plate. Graph temperature verse time. Lead a discussion to make inferenceson why the temperature remained the same at certain time periods.
Evaluation:2Opts Graph10 pts Data chart1 Opts Indicate on the graph where melting took place10pts Indicate on the graph where boiling took place10pts Indicate on the graph where heating took place2Opts Discuss how kinetic energy is related to phase of matter
Activity ThreeMethod-Laboratory-Indicators of Chemical Changes
Time: 4 days
Students will learn how to recognize the indicators that tell you a chemical reaction has occurred.The students will carryout several chemical reactions that may be classed as decomposition,displacement, combination, or combustion. The student will observe gas formation, color changes,heat formation, formation of precipitates, light production, or ph changes. The student will alsopractice writing simple chemical equations that represent the chemical mechanism that took place.
Part A:, Using a strip of Magnesium, the student will record its' physical properties and then holdit in a flame and observe what happens.
8
20

PACE Physical Science: An Applied Approach
Part B: The students will crush up some bread, and chop up a potato and drop some iodine on it.The student will observe a chemical change by dropping iodine on carbohydrates and observing acolor change which indicate that a chemical reaction has taken place.
Part C: Using sulfuric acid and iron filings; the students will observe bubbling when Irondisplaces Hydrogen within the sulfuric acid solution.
Part D: Using sugar in a test tube, the students will decompose it with heat and observe the gas(water vapor) escaping as the sugar molecules go through combustion.
Part E: Using a 0.1M Barium chloride and 0.2M Sodium Hydroxide, the student will observe aprecipitate when 5mL of Barium chloride is mixed with 5mL of sodium hydroxide.
Evaluation:Essay and chart10pts Awarded for each chemical change indicator mentioned2Opts Chart organizing the data
Activity FourMethod-Worksheet and MECC computer Simulation- The Atom
Time: 1 dayUsing the periodic table and the Planetary model of an atom, the students will model the first
18 elements placing the electrons in the appropriate energy shells. The student will identify theshells as K, L, M, N, 0, and P. The student will indicate the atomic mass as the number of protonsand neutrons in the nucleus. Using the MECC computer simulation- The Atom, the students willanswer question about atomic structure.
Evaluation: 75% score on the MECC Atom program using the models that the students made.
Activity FiveMethod-Acids, Bases and Salts
Time: 1 dayUsing Litmus paper, Calcium hydroxide, Sodium hydroxide, Acetic acid, Hydrochloric Acid,
eye wash, mouthwash, lemon juice, orange juice, and sulfuric acid; the student will test to see ifthe chemicals are acids or bases. The litmus paper should be inserted into the chemical. The colorof the litmus paper should be used to interpret the chemical as an acid or a base. Before the labdiscuss polyatomic and monatomic ions. The student will understand the an acid is a substancewhich in water releases the positive charged monatomic ion hydrogen. Bases in the presence ofwater release the polyatomic hydroxide ion.
Have the students put 20mL of water into 10 test tubes. To the first test tube add one dropof dilute acid, to the second add two drops, to the third add three drops and so on until you have 10drops of acid in the tenth test tube. Repeat the same procedure using any dilute base. Using phHydion paper find the ph of each of the base and acid Solution. To all of the test tubes add two dropsof red cabbage juice and observe the variation in color as the solutions become more concentrated.Assign a color that the cabbage juice will turn for each ph level of the base and acid. The teacherwill then give you an acid_and base of unknown concentration to you. Using the red cabbage juice,find the ph of you unknown acid and base.
Evaluation:2Opts Charts organizing data2Opts Color code ph chart2Opts Essay explaining how you arrived at the ph color code chart.4Opts Identification of the unknown base and acid ph
9
2 3.
PACE Physical Science: An Applied Approach
Activity Six: Preparing Solutions and Molarity calculationsMethod: Lecture Demonstration - Lab participation
Time: One to Two Days
The teacher should equate Molarity of solutions as Concentration of solutions according tomoles per unit of volume. Discuss weak and strong Kool-aide, using Sugar and Kool-aide as thesolute. Review Solute, Solvent, and the mole conversions. Introduce Molarity as Moles per litervolume, and have the student do several math problems solving the 3 variable equation.
1. Have the students get 3 large beakers with 500m1 of water.2. To the first one add 1 scoop of sand; to the second 2 scoops of sand; and to the third 3 scoops of
sand.3. Explain that one scoop of sand represents one mole of compound XX. Have them record the mass
of one mole of compound XX in grams.(molecular mass of compound XX=mass of one scoop of sand on the balance)
4. Using our 3 variable equation, have the student to calculate the molarity of the three solutionsof sand.(ans. 2M, 4M, and 6M)
Molarity = moVvolume = #of scoops / 0.5 L5. Have the students determine the volume of one scoop of water using a 10m !graduate cylinder.
Scoop volume = Sample volume6. Stir solution A and remove one scoop of the well mixed water- sand suspension.
Place the sample on a preweighed piece of filter paper (practice proper filtration techniques).Place it in the oven to dehydrate the water. Weigh the dried filter paper with sand. Subtract themass of the filter paper to get the mass of the retrieved sand.Sand mass = (Mass of filter paper + sand) Mass of filter paper
7. Calculate the moles of sand that should be on the filter paper, by multiplying the calculatemolarity (Step 4) by the volume of the scoop (step 5)
Moles of sand= Molarity X Sample volume (L)8. convert the moles of recovered sand to grams by multiplying the molecular mass of compounds
XX (step 3) by the number of moles of sand (step 7).calculated grams of sand = Moles of sand X Molecular mass of Compound XX
9. Compare the calculated mass of recovered sand (step 8) to the observed amount of sand(step 6). Calculate the percent error. The student should be amazed to find that the numberscompare within 10% accuracy.
SAND MASS = CALCULATED GRAMS OF SAND
Alternatives:Repeat same procedures....substitute salt or sugar and have the student to pour the sample
into a small beaker.
Evaluation:Have the student repeat the procedure on solution B, and C and let the filter paper dry over-
night within their lab drawers. Have them calculate how much sand or salt should be recovered thenext day, using steps 7 and 8. They should turn in the results before they leave class. When theyreturn, they should complete step 6 and compare their number to that they turned in the previousday. They should be within the 10 % error range or they should repeat the procedure. (1 try A, 1try with math errors B, 2 trys C, more F)
1 0 22
PACE Physical Science: An Applied Approach
Activity Seven:Method: Laboratory-Classifying Anion and Cation By Chemical Procedures
Time: One Week (Part A, B, C)
Work Place Applications:In the next few experiments, the students will act as both as analytical chemists helping a
farmer determine fertilizer content, and as a forester who will determine the soil ion content as itrelates to the mutual relationship of plant survival and earth. The students will make the stocksolution in part A; Test the known solutions and make the Expected reaction data chart in part B; andTest an unknown solution in part C. Have the students formulate a chart for recording data in partB, as a pre-lab group activity. Discuss the need for follow up testing for the presence of ions thatmay react in more than one test. Discuss how these skills may be important in the work ofanalytical chemists. Ask students to identify companies within the activity 1 database, that mayemploy analytical chemists. Relate how a farmer may need such help in determining the ingredientsneeded for their soil. Relate how the analytical chemist are important in environmentalconservation.
Part A- Making solutions (evaluation of Sand activity)Time: One DayMethod: Laboratory
Divide the class up into groups (up into 4 students). Have each make up one stock testsolution for the ion testing lab, and one known solution.
Calculate the moles of solute needed to make the solution by multiplying the given molarity by thevolume of desired solution. Moles = Molarity X Solute volume (L)Convert the moles of solute to grams by multiplying the molecular mass of the solute by the numberof calculated moles. grams = Moles X Molecular mass of Solute formulaHave the students pour this amount of solute into the indicated volume of water to make the indicatedsolutions.
Test solutions100 mL 6.0 M Hydrochloric acid100 mL 3.0 M sodium hydroxide100 mL concentrated sulfuric acid100 mL 0.1M iron (I1)sulfate100 mL 0.1 M barium chloride
Known solutions100mL 0.1M sodium phosphate100 mL 0.1M sodium nitrate100 mL 0.1M sodium sulfate100 mL 0.1M potassium nitrate100 mL 0.1M ammonium nitrate100 mL 0.1M iron (111) nitrate
Evaluation:The students will calculate the number of moles of solute required to make the known volume
of solution. The student will then convert this number to grams. The student will be award 25points for the following tasks.
Evaluation:25pts.25pts.25pts.25pts,100 pts.
number of moles illustrated in proper math formatnumber of grams illustrated in proper math formatpour 100mL in the graduate cylinderobtain the mass required on the balance and mix properly
PACE Physical Science: An Applied Approach
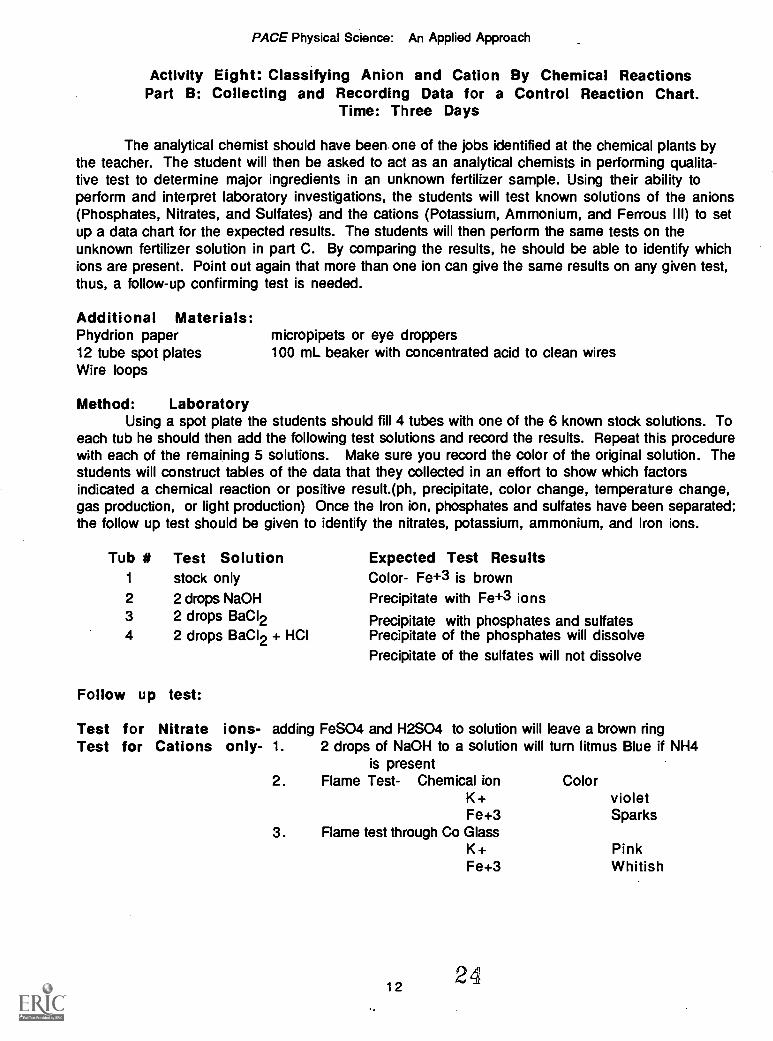
Activity Eight: Classifying Anion and Cation By Chemical ReactionsPart B: Collecting and Recording Data for a Control Reaction Chart.
Time: Three Days
The analytical chemist should have been one of the jobs identified at the chemical plants bythe teacher. The student will then be asked to act as an analytical chemists in performing qualita-tive test to determine major ingredients in an unknown fertilizer sample. Using their ability toperform and interpret laboratory investigations, the students will test known solutions of the anions(Phosphates, Nitrates, and Sulfates) and the cations (Potassium, Ammonium, and Ferrous III) to setup a data chart for the expected results. The students will then perform the same tests on theunknown fertilizer solution in part C. By comparing the results, he should be able to identify whichions are present. Point out again that more than one ion can give the same results on any given test,thus, a follow-up confirming test is needed.
Additional Materials:Phydrion paper12 tube spot platesWire loops
micropipets or eye droppers100 mL beaker with concentrated acid to clean wires
Method: LaboratoryUsing a spot plate the students should fill 4 tubes with one of the 6 known stock solutions. To
each tub he should then add the following test solutions and record the results. Repeat this procedurewith each of the remaining 5 solutions. Make sure you record the color of the original solution. Thestudents will construct tables of the data that they collected in an effort to show which factorsindicated a chemical reaction or positive result.(ph, precipitate, color change, temperature change,gas production, or light production) Once the Iron ion, phosphates and sulfates have been separated;the follow up test should be given to identify the nitrates, potassium, ammonium, and Iron ions.
Tub # Test Solution Expected Test Results1 stock only Color- Fe+3 is brown2 2 drops NaOH Precipitate with Fe+3 ions3 2 drops BaCl2 Precipitate with phosphates and sulfates4 2 drops BaCl2 + HCI Precipitate of the phosphates will dissolve
Precipitate of the sulfates will not dissolve
Follow up test:
Test for NitrateTest for Cations
ions- adding FeSO4 and H2SO4 to solution will leave a brown ringonly- 1. 2 drops of NaOH to a solution will turn litmus Blue if NH4
is present2. Flame Test- Chemical ion Color
K + violetFe+3 Sparks
3. Flame test through Co GlassK + PinkFe+3 Whitish
1 224
PACE Physical Science: An Applied Approach
ActivIty Nine: Classifying Anion and Cation By Chemical ReactionsPart C: Evaluation- Identification of an Unknown Fertilizer solution
Time: Three Days (Part A, B, C)
The teacher will make up the unknown test solutions according to the following specifications.The test solution should be binary compounds with a minimum of one anion [Phosphate, nitrate, orsulfate] and one cation [potassium, ammonium, or iron (II)]. The test solution should be 0.1Molarity. Examples of solutions are; potassium phosphate, potassium nitrate, potassium sulfate,ammonium phosphate, ammonium nitrate, ammoniun sulfate, Iron (II) phosphate, iron (II) nitrate,or iron (II) sulfate. The students will repeat the same procedures unassisted by the teacher. Makesure that each group has a different unknown solution. Tell the student to be very careful incomparing their results with other teams. Stress to them the importance of keeping track of thesolutions within the depressions on the spot plates.
Evaluation:40 pts. for each of the correct recorded data (8 Test x 5pts each)10 pts. for making the appropriate charts10 pts. for correctly identifying the unknown anion present10 pts. for correctly identifying the unknown cation present
5 pts. for writing the correct formula25 pts. for writing up the proper lab report.
100 pts. total
Ref.(Chem Corn, Industry, Part C, page 245-247 Teachers resource book.)
Activity Ten : Colorimetric techniquesMethod: Laboratory - HOW MANY DROPS DEFINES CONCENTRATION
Time: One DayThe students will discover that color can be used to indicate concentration of particles within
a solution. The student will fill 10 test tubes with 20 ml of water and number them 1 to 10. Thestudent will then put one drop of milk in the first, 2 drops of milk in the second, 3 in the third, andso on until the tenth has ten drops. The student should then explain how the transparency of eachmilk solution varies with the increasing number of drops of milk per solution. Have the studentsput each tube in a spectrophotometer and record the data. Using the Pasco 65 Mac Interface systemand the Temperature sensor for Macintosh, or the TI-82 Interface CBL optic probe; the studentwill electronically measure the relative light intensity
Method: Laboratory - HOW MANY DROPS DEFINES CONCENTRATIONflowing through each tube. Have the students graph drops of milk versus the spectrophotometermeter reading, and/or the lux, and make inferences about the various opaques of milk and concen-tration of milk particles. The students should infer that concentration is the number of particleswithin a given volume. The teacher should relate ppm, and ppb after the experiment and tell howtest for phosphates, carbon dioxide, and ph are used to read concentration of ions present usingcolorimetric techniques.
Evaluation: ( Total 100 pts.)25pts observation chart25pts graph25pts Interpretation relating number of drops to increased concentration of particles25pts Lab report
1 3
PACE Physical Science: An Applied Approach
Activity Eleven : Colorimetric techniques Indicating PhosphateConcentration In Natural Soil and Water Samples
Activity Three Field Project- PRACTICALTime: Three Days
Method: Laboratory (Part A-one day in the field)The students will act like foresters who will determine the soil ion content as it relates to
the mutual relationship of plant survival on earth. At the Deep River facility, the students willperform test on the soil and water at selected sites: the dam, the stream, and the lake. The studentswill compare the ph levels, phosphates levels, carbon dioxide levels, and nitrate levels present inthe soil and water samples collected using commercial testing kits that make use of colorimetrictechniques. The students will be put in groups of three. Each group will test a different area andion. They will formulate charts in the field that will allow them to keep track of their data from thedifferent test sites. The students will use colorimetric charts that will allow them to determine therange of concentration in ppb, or ppm. The students will compare the test data on graphs to showthe relationship of levels on ions at the dam, the lake, and in the stream. Without teacher input, thestudents will formulate a hypothesis that will explain why the levels may vary at each site.
Part B- Two days in the lab, computer lab, or libraryMethod: Class Discussion, Lecture Participation, or Library
The first day in class the students should recheck their results using samples that werecollected and transported to the classroom. They will be allowed additional time to research the usesof the tested ions within an ecosystem in an effort to understand why the ion concentrations levelmay vary. References: Chemistry books, library, or computer reference materials). Exploratoryreading and surfing through the WWW and Computer MUSIC village will allow the student to connectto Comptom's encyclopedia, Universities and Environmental agencies in an effort to analyze thelevels of ions that were found within the tested ecosystems. This will also help them to understandhow the health of the community is affected by the products and pollution of industries.
The second day in class the students will discuss how the ion concentrations varied from thedam, the lake and the stream. The students will discuss how these levels are necessary for thesurvival of the organisms that live within each ecosystem. The students will discuss the nitrogencycles to determine how atmospheric nitrogen gas is converted into the nitrogen compounds that canbe used by plant life. They will also infer that the high levels of nitrogen in the soil is also a resultof decomposing dead plants and animals. The students should understand that the nitrogen isrecycled by bacteria back into atmospheric nitrogen. Note that nitrogen is 80% of the atmosphericgases.
Evaluation: ( Total 100 pts.)25pts observation charts25pts graphs25pts Interpretation of charts diagramed by the graphs25pts Lab report
Activity Twelve- Chemical Energy and Electrical Energy ThermodynamicsMethod- Laboratory
Time: 1 Week
The vast amount of energy needed to power industrial and domestic units is supplied bychemical reactions that release energy as heat. Compounds are held together by electrostatic bondsthat store energy. Energy is required to break these bonds, but energy is released when these bonds
1 4
26
PACE Physical Science: An Applied Approach
are broken and reformed. Products of Industrial companies are a results of chemical reactionsbreaking bonds of raw materials and forming new arrangements of bonds with different elements.The reactants and the products of these reactions have a different level of stored potential energyreferred to as chemical energy. The nature of the chemical energy is the overall result of the typeof bond, positions of the bonds, and the form of the elements in the chemical combination. Somechemical reactions release energy, while other absorb energy. We will investigate the nature ofendothermic and exothermic reactions in supplying energy for our everyday living purposes. Thestudent will observe how heat transfers from hotter to cooler surfaces until thermal equilibrium isachieved. The students will observe that molecules within a chemical system move from higherconcentration to lower concentration in an effort to achieve chemical and thermal equilibrium justlike heat. We will discover ways that we can regulate the reaction rate. The students will predicthow a reaction rate will be affected by changes of temperature, ion concentrations, surface area, orcatalysts while using Computer and calculator interfaces to collect experimental data. Pasco 65 MacInterface system and the Temperature sensor, or the TI-82 Interface CBL . The first steps tounderstanding thermodynamics or Kinetics is to collect experimental data under a variety ofconditions.
Activity Thirteen: Heat Transfer Achieving Thermal EquilibriumTime: 2 days
Method: LaboratoryUsing the Pasco 65 Mac Interface system and the Temperature sensor, or the TI-82
Interface CBL temperature probe; the student will electronically measure the initial and finaltemperature of a cold beaker of water before and after a piece of iron heated in a flame isintroduced. The student will measure the hotness of the cold beaker of water, and then heat an ironbar in a flame. The student will then take the temperature sensor and put it in the beaker of water.The student will plot the heat change (temperature) verse time on the computer or CBL devise ofthe bar entry creating temperature changes as equilibrium is achieved. The student will then get abeaker of water chilled with ice cubes, and a beaker of boiling water. The student will add to each ofthese beakers one drop of food coloring and make observations. The student will then relate thebehavior of the temperature changes to that of the motion of the food coloring dyes. Have the studentresearch the following topics in an effort to explain what happened within each experiment;Principle of the conservation of energy, Heat, Thermal energy, Radiant and electrical energy,nuclear energy, and thermochemistry. Ask students to research computer data bases to see thetypes of energy sources used industrially today, and the examine the choices of the future.
Evaluation: Formal Lab Report(10 pts charts, 20 pts report, 70 pts inferences)(10 Points will be awarded for each of the following inferences)
1. Thermal energy is associated with the motion of atoms or molecules in solids, gases, andliquids speeding up chemical reactions. Temperature is a catalyst.
2. Heat is a form of energy associated with changing the temperature of a substance.3. The Higher the temperature, the greater the motions of the atoms in materials.4. Electrical energy can be harvested form mechanical devices and chemical reactions.5. Chemical sources are currently of considerable interest in replacing oil and coal driven
mechanical generators.6. Energy and molecules move from higher concentration to lower concentrations to reach
equilibrium.7. The students will identify the exothermic fuel-burning reactions releasing thermal
energy, or heat as the main source of energy on earth.
1 5 27
PACE Physical Science: An Applied Approach
Activity Fourteen: Catalyst Initiated Endothermic / Exothermic EnthalpyPart A :Method: Laboratory-Demonstration
Time: I day
The students will observe the temperature change associated with the heating device "The HeatSolution"(heating pad) and the cold compress used at a Hospital. For the hot and cold compresses,there should be a large and a smaller one. Using the Pasco 65 Mac Interface system and theTemperature sensor, or the TI-82 Interface CBL temperature probe; the student will electronicallymeasure the initial and final temperature of both systems. They will discover the difference betweenendothermic and exothermic chemical reactions, while observing a catalyst starting the reaction inthe heating solution system. The student will sense the heat transfer from the plastic bag containingcrystallizing sodium acetate (the system) to their hands (the surroundings). The crystallizingprocess will also give a visual of the concept of heat transfer. The phase change of liquid sodiumacetate to solid sodium acetate crystals is exothermic. Using the commercial specific heat of Sodiumacetate, the student will attempt to calculate the heat transferred to their hands. The Cold ComfortInstant compress containing ammonium nitrate is an endothermic reaction absorbing heat from itssurroundings making it very cold. The bags will simulate a cell, the student will relate that cellularreactions usually occur at constant pressure; therefore, the heat trans-ferred into or out of asystem at constant pressure is defined as a change in enthalpy. At constant pressure enthalpy isequal to heat transfer. Armed only with the information that Heat Capacity is the amount of heatenergy needed to change the temperature of 1.0g of a substance by 1 degree Celsius, the mass of thesystem, and the temperature data; the students will calculate the enthalphy on both systems.
Activity Fifteen: Spontaneous Endothermic and Exothermic Reaction KineticsPart A :Method-Laboratory Ammonium nitrate readily dissolves in water. This solutionprocess is endothermic, the enthalpy change in forming a solution is +26.4kJ/mol. The solutionprocess of sodium hydroxide is exothermic, the enthalpy change in forming a solution is44.48kJ/mol. Have the students dissolve 5g of Ammonium nitrate into 100 mL of water, anddissolve 5g of sodium hydroxide into 100 mL of water. Using the Pasco 65 Mac Interface system andthe temperature sensor, or the TI-82 Interface CBL temperature probe; the student willelectronically measure the initial and final temperature of both systems. Have the students repeatthe experiment using 109 of sodium hydroxide and ammonium nitrate. Students will determine anexperimental value for the specific heat of each sample and compare the temperature change for eachsystem. The students will calculate the percent error using the commercial value from achemistry handbook. The students will also calculate the molarity of each experiments and comparehow each system varied. Have the students propose sources of error. ( Use a calorimeter constructedfrom two polystyrene cups. The cork or cardboard top must fit into the cup having a central hole forthe sensor probe.)
Part B: Method- Laboratory: Kinetics: Have students calculate the Calorimeter constant forthe calorimeter used. They then drop 1g of aluminum into each of the sodium hydroxide solutions andobserve what happens. Have students observe the motion of popcorn in a microwave as thetemperature increases. The students will get 2 beakers and put crush one ice cube and 100 mL ofroom temperature water into each. Label the A control and A stir Then get two more beakers and
label them B control and B stir In each put one ice cube and 100mL of room temperature water.
Using the Pasco 65 Mac Interface system and the temperature sensor, or the TI-82 Interface CBLtemperature probe; students will electronically measure the temperature change after stirring theeach systems for 2 minutes. After the 2 minutes students will observe the amount of undissolved ice.They will predict how a reaction rate will be affected by changes of temperature, ion concentrations,surface area, and use of catalysts.
1 628
PACE Physical Science: An Applied Approach
UNIT III: Workplace Applications of Triangle MathThe student will first learn the simple math functions that involve right triangles. The
simple algebra and geometry principle involving measuring triangles such as angle measure,recognition of triangular patterns in everyday life, adding angles, measuring perimeter, calculatingarea, and applications of Pythagorean's theorem will first be reviewed. The student will also coverSin, Cos, and Tangent laws. After viewing a geometry interactive film, the students will performseveral experiments that will give them practical experience as a carpenter building a house. Theywill discover how carpenters use triangle math to build houses and estimate distances. The studentswill examine how crystals naturally grow in triangular and cuboidal patterns. Using a CAD drawingprogram, the students will discover how architects use triangles, squares, and circles to designhouses, cars, and tools of everyday life. However; upon the completion of the model house that theywill build and illustrate, they will discover that the math for add vectors in physics is the same. Themath for the applications in adding vectors, forces, velocity, displacement, and roof pitch is thesame. The only difference is that the adjacent side, the opposite side, and the hypotenuse side willhave different names.
OBJECTIVES1. Students will be able to use the appropriate vector and scalar quantities to solve problems in one
and two dimensions.2. Students will be able to apply Sin, Cosine, and Tangent laws to solve two dimensional problems
as they relate to displacement, velocity, and force.3. Students will be able to apply Pythagorean's theorem ( that the square of the hypotenuse of a
right triangle is equal to the sum of the squares of the other two sides)to solve displacement,velocity, and force problems. The student will be able to graph these vector quantities.
4. Students will measure angles, force, mass, distance, time, area, and weight; diagraming them asthey relate to the results of interactions between objects.
5. Students will express vectors in horizontal and vertical components in order to graph them, addvectors, and use this information with simple algebra and trigonometry to solve problems.
Activity One:Laboratoryflow Lapidaries Use Triangles and Squares
Time: 3 DaysUsing mineral samples: students will examine how minerals are made up of one or more kinds
of atoms arranged in a definite pattern called a crystal. Have students examine crystals of salt,calcite, quartz, topaz, halite, galena, pyrite, and gold; students should make the inference that therepeating patterns of triangles and squares make up the faces of most crystal. Have students drawand cut out planar shapes of crystals diagramed and glue them together to make the three dimensionalshapes. Give students the dimensions of the squares and triangles that make the shapes. Studentswill reproduce a model at the scale that the teacher indicates. The figures should be at least 5cm.The students will measure the angles that make the shapes and identify parallel and perpendicularlines. Have students make charts and classify the minerals according to their crystal shapes.
Evaluation: Constructed models (Principles of Science, Book one, Merrill, 1979, pg. 65)10 pts for each model assembled neatly10 pts for correctly measuring the sides and angles of each model20 pts for correctly identifying the mineral shapes
hexagonal: calcite and quartzorthorhombic: topaz and sulfurcubic: galena, halite, pyriteoctahedral: gold, fluorite
1 7
29
PACE Physical Science: An Applied Approach
Activity Two: Pre-Math for Vector and Scalar Unit IIILaboratory: Pitch of a Roof - A simple ratio of two sides of a Triangle
Time: 3 days in computer room- Carpenter's applications
Using pictures of various roof, the students will use a CAD computer drawing program todiagram simple cubical houses and roofs. The student should draw the houses at the scale such thatthe floor will be 4 inches X 8 inches with a ceiling 5 inches high. The roof should be the pitch of1/2, with a run of 2 inches. Using the simple geometric shapes within the CAD program, the studentwill make use of squares and triangles to draw any two of the types of roofs indicated. (1)lean-to,2)saddle, 3)hip, 4)gambre1,5) mansard, or 6)ogee roof). The students will indicate all linearmeasurements , angles and functions used to make the scaled models. Recognizing that pitch is theratio of the triangle height to its base as a fraction, the student will calculate the appropriate pitchesof the indicated diagrams.
Evaluation: Computer CAD Drawing (ref. Webster Dictionary)2Opts Calculation of the pitch of model 1 and model 2 roof.60 pts Use of the CAD program to reproduce the 6 houses.2Opts Brief description of the use of the computer functions to reproduce the drawings.
Activity Three: ENGINEERS MAKE PAPER MODELS FIRSTLaboratory: Paper Saddle or Gamble roof House
Time: 3 daysThe students will make a paper model using the method that they used to make the paper
crystal models. The students should use squares, and triangles with glue tabs and draw a planardiagram of the model they will scale. The student construct the houses at the scale such that thefloor will be 4 inches X 8 inches with a ceiling 5 inches high. The roof should be the pitch of 1/2,with a run of 2 inches. Encourage the students to use the crystal shapes as a model for theirschematics of the models.
Evaluation: Construction of a paper house10Opts neat sharp corners, straight edges, proper dimensions.8Opts corners don't fit sharply, proper dimensions6Opts sloppy with uneven sides
The students should pass with 8Opts. (All others should try again.)
Activity Four: CONSTRUCTION HIP-RAFTERS-VECTORSLABORATORY: Pythagorean's Triangle Math in Carpentry
Time: 3 daysThe student will use Pythagorean's theorem ( that the square of the hypotenuse of a right
triangle is equal to the sum of the squares of the other two sides) to decide what length to cut the hip-rafters of a model roof. The student will measure the rise and the run of a triangle.Using Pythagorean's theorem calculate the hypotenuse formed by a right triangle whose inner side A
is 2.5 units and side B is 3.75 units. Cut a piece of wood splint the length that was calculated.Using Trigonometric functions calculate the resultant angles that each end of the hip-rafter must be.Calculate Tan theta and then use the inverse Tan law to get the degree measurement of angle b.
The student will use the sums of the angles of a triangle to find the expected measurement forangle a. ( Angles a+b+c= 180A) Using a pair of scissors cut the ends of the hypotenuse themeasurements that you calculated for angle a and angle b. Glue all of the piece of wood together on apiece of centimeter scaled graph paper. Using a centimeter ruler measure the length of C to see how
1 8 30
PACE Physical Science: An Applied Approach
it compares to the value that you calculated for the hypotenuse. Count the block enclosed by thetriangle on the graph paper and estimate the area of this surface. Using the equation for the area of atriangle, compare the block that you counted to the number that you calculated. In all instancescalculate the percent error between the expected calculated values for the hypotenuse and angles tothat of the measured values. Repeat this procedure using 1/8 and 1/4 inch craft wood.
Evaluation:Chart and Hip-rafter construction2Opts Calculations showing the Hypotenuse2Opts Calculations showing the measure of angle b2Opts Calculations showing the measure of angle a2Opts Calculations showing the pitch2Opts The wooden triangle with tight fitting corners and % errors less than 5%.
Activity FiveLABORATORY: DISPLACEMENT, VELOCITY AND FORCE FOLLOW TRIANGLE MATH
Time: 3 day- Lecture Participation Adding Velocity Vectors
Take two large metal balls of equal mass and roll them slowly toward each other at a 90degree angle; observe the path of the balls at the point of their collision. Each ball has its ownmagnitude and direction but the resultant path is the vector sum of the two vectors acting at thesame point. The system makes a Y schematic at the instant of impact and then they separate on apath different from the original at a common angle at the point of impact.Using the Relationships of Triangles, the resultant vector's angular direction should always be inreference to the positive "X" axis. The complement of supplement angle is sometimes used. Give thestudents velocity vector additions problems using vectors at right angles; have them repeat thesame type of calculation that they had to do for displacement problems making the hip-rafters.
Sample Problem: An airplane was flying due east at 300mph. If a wind at 50mph blew the planedue north, what would be the resultant flight of the plane.
Activity SixLABORATORY: DISPLACEMENT, VELOCITY AND FORCE FOLLOW TRIANGLE MATH
The student will be able to diagram the vectors on graph paper. Working on the board, havethe students diagram vectors using sample problems. Use for instance: the boat crossing theflowing stream, the airplane being pushed up or down by wind, or a child pushing a lawn mower,
Evaluation:Quiz - Vector Addition DiagramsThe students will be given 2 vector problems to solve.2Opts Calculations showing the Hypotenuse2Opts Calculations showing the measure of angle B
Activity Seven:LABORATORY: FORCE VECTOR AND TRIANGULAR MATH
TIME: 3 DAYS
Using a force board with three scales, place the scales so that two scales that are 90 degreesfrom each other. These scales represent vector A and B. Position the third scale so that the tensionon that scale balances the other two that are at 90 degrees; this scale represents the resultant
1 9
31
PACE Physical Science: An Applied Approach
vector C. Record the value on the scales. Trace the path of the intersecting lines recording angles.(You should draw a Y pattern.) Use Pythagorean's theorem to calculate the resultant force usingforce A and B. This calculated force should be within 5% of the measurement read off the resultantscale (vector C). Repeat this procedure two more times changing the tension on each scale bytightening the support strings. Calculate the % error between the observed and calculatedresultants. The student will practice the same calculations as the displacement, and velocityexperiments. Have the students graph the force vectors, making the right triangle using A, B, and C.The students should observe that the Vector connecting sides A and B has the same units on the ruleras the digits on the scale.
Evaluation: Graph and Calculations with a Short Quiz2Opts(each) Calculations showing the resultant vector for 3 trials.10pts Inference that Force is a vector quantity following Triangle Math rules.10pts Calculations within 5% error.10pts The student will make the inference that a vector may be represented
with an "X" and "Y" component.
Activity Eight: THE RESULTANT VECTORLaboratory: Arithmetic- Vector Addition
TIME:3 days
Using the scale, weigh a wooden block. The student will take the wooden block with a loop oneach side and attach to it two equal masses. Place the block on a platform table such that the weightshang off the platform ( use a board supported by a table). To cut down the frictional force createdby the table, put the block on top of 5 pencils so that it can roll freely. The student will recordwhat happens. The student will then put weights of unequal mass on the block and repeat the sameprocedure varying the masses. The student should record the results using 100g, 200g, 500g, and1kg masses. The student should explain what causes a change in horizontal motion?
Using a Helium balloon, have the student to tie the balloon to a 0.59 mass. Increase the massin small increments and record the results in an effort to find a mass that would suspend the balloonin mid air. Push the suspended balloon in one direction and observe its path. Now repeat the sameprocedure pushing the suspended balloon in the path of a fan and observe the resultant path createdby two forces. Once that is achieved, find the mass necessary to weight the balloons down.
Workplace application-How is this information helpful to a person running a balloon shop that weights balloons
with candy? How does a Helium or hot air balloon work? If two nine year old children and an adulthad to move a table, how should they position themselves around a table?
Evaluation:10 ptslOpts
15 pts
5pts5pts
2Opts2Opts
Written statements after discussion with valid numerical dataThe student makes the inference that balanced forces cause no motion.The student makes the inference that the force created by the pull ofgravity on the attached mass must be exceeded to cause motion.The student understands that vertical and horizontal opposite forcesare subtracted or added to find the resultant force.
Gravity is identified as a vertical downward force acting on mass.Bonus if the student can suspend the balloon.Chart containing organized numerical data.Explain the workplace applications.
2 0 32
PACE Physical Science: An Applied Approach
Activity Nine: GRAVITY IS A VERTICAL DOWNWARD FORCELaboratory: Calculate the Acceleration of Gravity
Time: 2 daysUsing a scale, suspend a 50g, 100g, 200g, 400g mass from a spring scale and record its
downward force. Then select any 4 objects within the classroom and measure its mass on thebalance, and its downward force using the force scale. The student will then graph mass verseforce, and force verse mass. The students should determine the math ratio of mass and force bydividing the two numbers. Have them divide both mass by force, and force by mass. In both casesthe students will see that the ratio will be the same for each set of data. Have the student to calculatethe slope of the lines formed on both graphs and compare this number to their graph. Then writethe acceleration of gravity on the board. Ask the student to explain how this number compareswithin their experiment. Have the students make up a formula for calculating weight using massand gravity.
Evaluation:40 pts Chart of data and supporting graphs for mass vs force, and force vs mass.10 pts Inference that the graph's slope represents the ratio of two numbers.10pts Inference that mass has weight because gravity pulls it down.20 pts Math showing the calculation of the slope for each graph.2Opts Accurately predict that w=mg.
Activity Ten: VECTOR X & Y COMPONENTSLaboratory: Feeling Components of Vectors?
Time: 3 daysUsing a ring stand, a scale, string, and a 1/2 meter stick. Have the student to set up the
following apparatus. Attach a short string to the loop in the spring scale and attach it to the top ofthe ring stand. Take a long knotted string and attach a 200g mass to one end and the hook of the scaleto the other end. Take a 1/2 meter stick and balance it between the stand and the string, forming a90 degree angle with the stand. Using a protractor, measure the indicated angle Theta. Using Sin ofangle theta and the known suspended force of the 200g mass as the y component; the student willcalculate the expected resultant force. Read the scale and record the observed Resultant force. Howdoes this number compare to the number they calculated (record the % error). Have the studentspush downward slightly on the meter stick where the weight is suspended and then release it. Havethe student to pull the meter stick slightly away from the ring stand and let it go. The studentshould observe a spring back effect in both the horizontal and vertical directions? In their labreport they should recognize these forces asthe X and Y components for the tension within the spring attached to the scale. With a rulermeasure all sides formed by the triangle formed by the spring, the meter, and the stand. UsingPythagorean's theorem, calculate the hypotenuse and calculate the percent error of what wasmeasured. Using the Tan law, calculate the degrees of theta and see how it compares to the angle thatyou measured.
The students will graph X and Y components for the length of each side of the triangularsystem and for the force vectors produced accordingly. Using a ruler, the students should measurethe resultant vectors on the graph, and compare this number to the observed length of the string andreading on the scale.
Calculator Skills:Sin b= opposite side / hypotenuse = Y/RCosine b= adjacent side / hypotenuse = X/RTAN b = opposite side / adjacent side = Rise / Run = Y/XTan -1 (Rise/Run) = Degree of Theta
21
PACE Physical Science: An Applied Approach
UNIT IV: Motion and EnergyAll matter on earth is effected by the force of gravity giving it weight. This force of gravity
may also cause motion of matter. A force is a pull or push on matter which can cause a change in itsposition. This unit will examine how matter changes motion. We will investigate velocity, displace-ment, and force vectors. The student will infer that force created by a change in motion can be use toharvest energy. Energy is the ability to do work and the work cause by moving objects can be calcu-lated. Energy is transformed from one form to another and is conserved as all matter and energy isconserved. With several practical labs the student will see how force, motion, velocity andacceleration are related to each other.
Reference: MacMillan Physical Science, Denise Eby and Robert Horton Teacher Resource, 1986
OBJECTIVES1. The students will be able to describe and measure motion in terms of position, time, and the
derived quantities of velocity and acceleration.2. The students will understand the relationships between motion, force, and acceleration.3. The students will be able to construct force schematics in an effort to predict the motion of an
object according to Newton's Laws.4. The students will be able to use the conservation of energy and the conservation of momentum
laws to predict conceptually and quantitatively, the results of the interactions between objects.
Activity One: Reference: MacMillan Physical Science, page 91Laboratoryflow Fast Did It Roll?
Time: 3 days
The class should lead a brief discussion on how a car gauges speed. They should all identifyvelocity as a vector understanding that all previous math may be related to Triangle Math. Using abook, a grooved ruler, a stopwatch and masking tape; the student will make a ramp with the rulerusing the book and mark the path the marble will travel with the masking tape. Place two marks onthe masking tape 5 dm apart. (Have the student to use metric conversions to infer that 5 dm is equalto 50 cm- Do not help them!! Let the class help itself discover this!1) Measure the ramp height ofone book. Release the marble from the top of the ramp. When the marble reaches the first mark onthe masking tape, start the clock. When the marble reaches the second mark, stop the stopwatch andrecord the data. Repeat this two more times and use the average results.
Repeat the procedures using two, three, and four stacked books. Record the height and timefor the marble to travel 5 dm. Have the student to account for a theory that explains why the timewere different. Graph the ramp height versus average speed.
Evaluation:2Opts Recognize the relationship of the average speed to ramp height.2Opts Recognize that the ball was accelerated by the pull of gravity more as the
ramp became more vertical.2Opts Chart showing data and organized to show relationship of all Calculations.2Opts Sample calculations
22 34
PACE Physical Science: An Applied Approach
Activity Two: Laboratory: Change Speed - Accelerate!Time: 3 days
Reference: MacMillan Physical Science, page 97
The students will lead a class discussion inferring that gravity is a force acting on all bodiesaccelerating them toward the center of the earth. The student will then infer that when a forcechanges the speed of an object it is accelerated. With the initial speed, the final speed and the timeneeded to change it; you can calculate the acceleration of a marble as it rolls down a ramp. Make atrack using 2 meter sticks separated by a wooden spacer held by a rubber band. arrange thissystem as the ruler in activity seventeen. At the beginning and end of the meter stick mark two setsof 2 dm markers with tape. These areas will be used for calculating the initial and final velocityusing the procedures from Activity Sixteen. Have one student to record the path of a marble as itrolls smoothly down the beginning portion of the track, and have another student record the timetraveled during the end of the journey with a stopwatch. Use the average of four trials.
Make a mark with a pencil halfway between each set of markers and record the time it takesthe marble to travel between the two pencil marRs. Use the average of 5 times to calculate theaverage time it took the marble to change from the initial to the final speed. With this informationcalculate the acceleration of the marble. Record the mass of the marble. Repeat this same proce-dure using a Metal ball. Have the student to account for any differences in their data. Also have thestudents vary the height of the ramp and explain what would happen to the acceleration of the ballcompared to the marble. The student should infer that gravity supplied the force to move the ball.
Evaluation10 pts.10 pts.20 pts.10 pts.10 pts.20 pts.
10 pts.
Calculation of Initial and final velocityCalculation of AccelerationChart showing data for velocitiesChart for Calculating average time of accelerationInfer that gravity is the factor that causes the acceleration.Support their theory with numerical data that a change in height morevertical will cause a greater acceleration due to the pull of gravity.Explain how gravity effects all matter independent to mass.
Activity Three: Gravity Systems Increase Momentum by Accelerating MassTime: 2 days
The students will drop a tennis ball and a super ball from their hands, at several differentheights. They should then use a balance and measure the mass of the tennis ball. Using a springscale, the students will measure the weight.(downward force) that caused each object to drop fromtheir hands. Through a guided discussion, the students should infer that weight is created by theacceleration of gravity on a mass. Thus, introduce the equation, F=ma; have the students calculatethe weight of the object by multiplying its' mass by the acceleration of gravity. The students willthen graph weight on the vertical axis and the measured force along the horizontal axis. The slope ofthe resultant line should be calculated. ( there should be a one to one ratio)
Take masking tape and vertically mark the wall 2 meters up the wall. Mark the tape everycentimeter. The student will drop the ball out of their hand and measure the time for the ball to hitthe floor. Hold the ball at increasing heights and measure the highest height that the ball bounces onthe first bounce. The student should then throw the ball downward and see how hard they have toforce the ball to achieve the same heights; record as 1) small energy, 2) medium energy, 3)highenergy. Have the student to calculate the final velocity of the ball when it hits the floor (V= at,initial velocity is zero), use this velocity to calculate the momentum that is transferred from theball to the floor.( momentum = maSs X velocity= initial momentum = final momentum) GraphInitial height verse final height, initial height verse momentum, and initial height verse velocity.
23
PACE Physical Science: An Applied Approach
After a group discussion the student should infer that the faster velocity going downward or theincreased kinetic energy of the tennis ball is what caused the ball to recoil to the various heights.They should infer that the floor pushed the ball upward with the same force as it initially hit thefloor. The student should infer that the increased height of the tennis ball when it was dropped,caused it to have more momentum which pushed it increasingly higher off the floor
Evaluation10 pts. Inference that gravity is acceleration because is causes masses to move at
a special constant rate.20 pts. Infer that the faster velocity going downward increased momentum10 pts. Infer that momentum before equal momentum afterward.20 pts. Infer that increased kinetic energy, energy of motion increased momentum20 pts. Graphs
Activity Four: Laboratory: Forces Can Create EnergyTime: 3 days
(MacMillan Physical Science, page 103)
Using a large rubber band, a block of wood with three nails, and a spring scale; after makinga sling shot apparatus, measure the amount of force required to pull the rubber band backward 1 dm.Measure the several times and use the average force. The work required to move the rubber bandbackward will exert and equal force on a ball as the rubber band is released and moves 1 dm back toits original position. Using a ping pong ball, shot the ball across the floor. Pull the rubber bandback 0.1m and 0.05 m and compare the distance traveled across the floor. Have the student form atheory explaining why the ball moved different distances. Ask the students to identify when the ballhas potential energy and when it has kinetic energy. The students should make the inference that thegreater the displacement of the rubber band, the greater the energy that was exerted on the ball.This caused the ball to have different velocities as it is pushed by the rubber band, which results indifferent kinetic energies.
Have the students tie a sting to the ball and attach it to a ring stand. This time when the ballis propelled by the rubber band, the student should record the highest point that the ball travelsthrough until it fall into a pendular motion. Through a guided discussion, the students will infer thatfor every action there is an equal and opposite reactions. Thus, the potential energy as a result of thehighest vertical distance of the ball at V=0 rn/s is equal to or less than the work put on the ball bythe rubber band. Have the students calculate the work exerting kinetic energy by multiplying thedistance traveled by the rubber band by the force exerted on the spring scale. Compare this to thecalculated potential energy at the highest point by multiplying the mass of the ball, gravity, and therecorded height in meters.
Have the students graph the Work of the rubber band on the vertical axis and the potentialenergy of the ball on the horizontal axis. The student should calculate the slope of the resultant line.If their theory is correct, this number should be close to one. The students should make theinference that their is a one to one ratio for potential and work supplying the kinetic energy.
Evaluation:20 pts Graph showing the resultant line and its slope.20 pts Calculations showing potential energy and work.10 pts Inference that Kinetic energy should equal potential energy.10 pts Inference that work can be done by both kinetic and potential energy.20 pts Charts showing all collected data.10 pts Inference that the greater the force the greater the kinetic energy that is produced.10 pts Inference that the ball moved difference distances because the greater force
produced higher velocities for the ball to travel through.
24 36
JUN- 5-97 THU 14:41
U.S. Department of EducationOffice of Educational Research end Improvement (OERI)
Educattonal Resources Information Center (ERIC)
REPRODUCTION RELEASE
I. DOCUMENT IDENTIFICATION:
(Specific Document)
P.03
L)Lo-15--6vi:411
Itzai I Nt,_,Lo
Title: 704 / t PAisical s'etrie Yet,13 A /ge-jsa. re7, r ,,, ''''' "'"
4.1.
4. so'''''' ...
Publication Date:
btlf
Author(s):
Corporate Source:/0-14 t-t fdlov s
II. REPRODUCTION RELEASE:
In order to cfisseminate as widely as possible timely and significant materials of Interest to the educational community, documents announced
in the monthly abstract pumal of the ERIC system, Resources in Education (RIE), are usually made available to users in microfiche, reproduced
paper copy, and electronic/optical made, and sold through the ERIC Document Reproduction Service (EDRS) or other ERIC vendors. Credit is
given to the source of each document, and, if reproduction release Is granted, one of the following notices is affixed to the document
0,46(,971 19i7
II permission is granted to reproduce and disseminate the identified document, please CHECK ONE of the following two options and sign at
the bottom ol the page.
Check hereFor Level 1 Release:Permitting reproduction inmicrofiche (4 x 6' film) orother ERIC archive) media(e.g., electronlo or optical)and paper copy.
Signhere)please
The sample slicker shown below wil be The sample sticker shown below will be
affixed to all Level I documentsaffixed to all Level 2 documents
PERMISSION TO REPRODUCE ANDDISSEMINATE THIS MATERIAL
HAS BEEN GRANTED BY
TO THE EDUCATIONAL RESOURCESINFORMATION CENTER (ERIC)
way......
Level 1
PERMISSION TO REPRODUCE ANDDISSEMINATE THIS
MATERIAL IN OTHER THAN PAPERCOPY HAS BEEN GRANTED BY
S0' -9TO THE EDUCATIONAL RESOURCES
INFORMATION CENTER (ERIC)
Level 2
Documents will be processed as indicated provided reproduction quality permits. If permission
to reproduce is granted, but neither box is checked, documents will be processed at Level I.
Check hereFor Level 2 Release:Pemtitfing reproduction Inmicrofiche (4' x 6" film) orother ERIC archival media(e.g., electronic or optical),but not In paper copy.
Vgnat
'I hereby grant to the Educational Resources Information Center (ERic) nonexclusive permission to reproduce and disseminate
this document as indicated above. Reproduction from the ERIC microfiche or electronic/optical media by parsons other than
ERIC employees and its system contractors requires permission from the copyright holdw. Exception is made for non-profit
reproduction by librettos and otherserWce agencies to satisfy information needs of edualtors in response to discrete Inquiries.'
re:
15715'anv
3 y Az./ 6-7
Into amel
eno eu J.,54 0 ofii 5s)./- gocesso,_
/ - 76411:MitIf 'Address:
-i<5,1,,c, un 111
cl
Ce)-6/0,1-/
5 7