Embed Size (px)
Citation preview
The Holocene2016, Vol. 26(1) 3 –16© The Author(s) 2015
Reprints and permissions:sagepub.co.uk/journalsPermissions.navDOI: 10.1177/0959683615596835hol.sagepub.com
IntroductionCaspian Sea (CS) water level has fluctuated repeatedly with an amplitude of larger than 25 m during the Holocene without any link with the eustatic sea level. During the last millennium, Cas-pian Sea level (CSL) experienced two significant changes: a poorly identified drop and a slightly better known rise during the Medieval Climatic Anomaly (MCA; AD 950–1250) and the ‘Lit-tle Ice Age’ (LIA; AD 1350–1850), respectively (dates defining these periods from Ruddiman (2008) and Mann et al. (2009)) (Kroonenberg et al., 2007; Leroy et al., 2011). More recently, the CS has also experienced a c. 3-m rise and fall during the last century, while the global sea level has fluctuated approximately 2 mm/yr in the same period (Kroonenberg et al., 2007). These dramatic sea level changes have affected the surrounding popula-tions and their activities. The Italian traveller Marin Sanudo already documented that the early 14th-century water-level rise destroyed many important cities around the CS (see Naderi Beni et al., 2013a). The recent and rapid CSL changes have directly affected tens of thousands of people in the lowlands of Iran, Azer-baijan, Dagestan and the Volga Delta (Rucevska et al., 2006). The most important problems to be highlighted are urban facilities flooding, roads and railways destruction, industrial infrastructure damage (including oil and gas exploitation and fish farms) as well as salinisation of agricultural land and destruction of beaches
(Dolotov and Kaplin, 2005; Kosarev, 2005; Kroonenberg et al., 2007; Leroy et al., 2010; Naderi Beni et al., 2013a; Rucevska et al., 2006).
The importance of the effects of CSL rapid fluctuation on population and human activities requires research on prediction of future CSL changes. Although current models suggest that pre-cipitation and evaporation seem to be the main factors influencing the CS hydrological budget (Arpe et al., 2000, 2012, 2014), mechanisms behind CSL changes are not still completely under-stood. Consequently, since the instrumental records hardly pro-vide information for periods older than two centuries, a palaeo-environmental approach is required for unravelling past
An early ‘Little Ice Age’ brackish water invasion along the south coast of the Caspian Sea (sediment of Langarud wetland) and its wider impacts on environment and people
Safiyeh Haghani,1 Suzanne AG Leroy,1 Sarkar Khdir,1,2 Keivan Kabiri,3 Abdolmajid Naderi Beni3 and Hamid Alizadeh Ketek Lahijani3
AbstractCaspian Sea level has undergone significant changes through time with major impacts not only on the surrounding coasts but also on offshore. This study reports a brackish water invasion on the southern coast of the Caspian Sea constructed from a multi-proxy analysis of sediment retrieved from the Langarud wetland. The ground surface level of wetland is >6 m higher than the current Caspian Sea level (at −27.41 m in 2014) and located >11 km far from the coast. A sequence covering the last millennium was dated by three radiocarbon dates. The results from this new study suggest that Caspian Sea level rose up to at least −21.44 m (i.e. >6 m above the present water level) during the early ‘Little Ice Age’. Although previous studies in the southern coast of the Caspian Sea have detected a high-stand during the Little Ice Age period, this study presents the first evidence that this high-stand reached so far inland and at such a high altitude. Moreover, it confirms one of the very few earlier estimates of a high-stand at −21 m for the second half of the 14th century. The effects of this large-scale brackish water invasion on soil properties would have caused severe disruption to regional agriculture, thereby destabilising local dynasties and facilitating a rapid Turko-Mongol expansion of Tamerlane’s armies from the east.
KeywordsCaspian Sea, ‘Little Ice Age’, palaeo-environment, palynology, sea level change, sedimentology
Received 25 February 2015; revised manuscript accepted 26 May 2015
1Environmental Science, Brunel University London, UK2Geography Department, University of Raparin, Iraq3 Iranian National Institute for Oceanography and Atmospheric Science (INIOAS), Iran
Corresponding author:Safiyeh Haghani, Environmental Science, Brunel University London, London UB8 3PH, UK. Email: [email protected]; [email protected]
596835 HOL0010.1177/0959683615596835The HoloceneHaghani et al.research-article2015
Research paper
at Brunel University London on January 4, 2016hol.sagepub.comDownloaded from
4 The Holocene 26(1)
water-level changes in order to compile useful data for future modelling and forecasting.
Reconstruction of the past CSL oscillations and its driving forces is the subject of many studies. Rychagov (1997) recon-structed the Holocene CSL curve based on altitude of several river terraces in mouth areas. His proposed curve is one of the most cited curves in the literature. Hoogendoorn et al. (2005) have studied the sedimentary sequences of Kura delta in west coast of the CS and concluded that the CSL dropped to −38 m b.s.l. during Derbent regression during MCA. Offshore deposits of the CS were studied by Leroy et al. (2007) to indicate salinity changes of the CS during the Holocene because of major river avulsion of Amu Darya from Aral Sea into the CS. A combination of historical, archaeological and geological data was implemented by some researchers to reconstruct the past sea level changes (e.g. Karpychev, 2001; Naderi Beni et al., 2013a; Varushchenko et al., 1987). In the last attempt, Naderi Beni et al. (2013a) found that the CSL rose up to −19 m b.s.l. during the early LIA. However, the reconstructed curves are discontinuous, and compilations show that they are often contradictory even for the last millennium. Therefore, palaeo-environmental reconstruction even in one location is useful to contribute in the reconstruction of CSL curve.
Strong longshore drift, river avulsion, tectonic movement, meandering rivers and rivers with high sediment supply have cre-ated suitable conditions for coastal lagoon and inland wetland development in the southern CS coast. These water bodies and their sedimentary infill are ideal archives for the reconstruction of CSL fluctuations. Previous studies have focused on the palaeo-environmental reconstruction of the last millennia using current coastal lagoons such as Amirkola, Kiashahr and Anzali (Kazancı et al., 2004; Lahijani et al., 2009; Leroy et al., 2011; Naderi Beni et al., 2013a). This study focuses on an inland wetland on the eastern edge of the Sefidrud Delta (term ‘Sefid’ means white and term ‘rud’ means river), located at a distance of 11.5 km from the current coastline and at a higher altitude. Its high elevation offers a unique opportunity to evaluate the significance of the water-level rise during the LIA.
We have performed a multi-proxy palaeo-environmental reconstruction using the Langarud wetland sediments. The aims are (1) to investigate the significance of CSL rise during the LIA in the study area in order to contribute to the reconstruction of past level changes and (2) to provide palaeo-coastline positions for the study area, which are relevant for the CS. Additionally, due to adequate precipitation, natural water potential and favourable climate, the area between the coastline and foothills of the Elburz Mountains has always been an agricultural centre for Iran and therefore vital for the Iran’s economy. Of great importance, mod-ern rice production on the coastal plain in north of Iran is large, on which much of the country depends on. Therefore, the environ-mental and historical impacts of CSL changes on past populations are briefly examined.
Study areaGeneral geographical locationThe CS is known as the largest closed water body in the entire world (Figure 1a). Its surface area is ~390,000 km2 with a water volume of 78,000 km3, and its catchment area, 3.5 million km2, is large especially in the north (Arpe et al., 2012). Its salinity in the middle and southern basin is brackish, around 13 practical salinity unit (psu), while it is nearly fresh in the northern basin, especially near the Volga Delta (Kroonenberg et al., 1997). Although most of the freshwater (80%) is provided by Volga River and it has a significant impact on water level of the CS (Arpe et al., 2014; Kroonenberg et al., 1997), the south-western rivers such as the Sefidrud, Kura and Terek Rivers supply ~79% of sediment to the
CS (41%, 22% and 15%, respectively; Lahijani et al., 2008). The Sefidrud with its significant contribution in sediment supply for the CS has developed a large delta in the south of the CS (Lahijani et al., 2008).
Langarud settingThe Langarud wetland is located 11.5 km inland from the CS coastline in the province of Gilan. Its name is variously spelled Langerud, Langroud, Langrood, Langarood and Langaroud, but in this text it is standardised as Langarud. This wetland is also known as the Kiakolayeh wetland. It is a freshwater wetland located in the south-east of Langarud town. It is not known when the town of Langarud appeared. However, the name of Langarud was already used in AD 1118 in historical books (Setudeh, 1970). The name itself is a compound name of two Persian words, Lan-gar means harbour and Rud means river. Thus, it has been argued that Langarud was a harbour during the past and was connected to the sea through a river. During Nader Shah’s empire (i.e. AD 1736–1747), Langarud became the centre of the Iranian Navy in the north of Iran and shipbuilding industry was developed in AD 1743 (Setudeh, 1970). In July 1744, a ship which had been built was ready, but the launching went wrong, due to a sudden sea level fall. This sudden sea level change between AD 1743 and 1744 was not documented in Naderi Beni et al. (2013a). But it shows that sudden CSL changes may occur in short time periods and that they may have a large impact on industries and people.
Langarud town is now an agricultural and touristic area. As a result of poor land management, the size of wetland has been reduced by dumping tons of waste every year. However, a part of the wetland is drained in order to create agricultural land. Two small rivers flow into the CS near the Langarud wetland (Figure 1c). The first is the Langarud River with a length of ~54 km and catchment area of 260 km2 located in the west of the Langarud wetland, which is only 700 m far away from the coring location used in this study. The second river is the Shalmanrud with a length of ~54 km and catchment area of 390 km2 located ~6 km east of the wetland. However, at the present time, the wetland is not under direct influence of these rivers.
Geology of the regionThe southern CS coast is surrounded by the Elburz Mountains that are composed of various lithologies such as volcanic, meta-morphic and sedimentary rocks from the Palaeozoic to the Ceno-zoic Eras. The study area is situated at the foot of the middle parts of Elburz belt which is known as coastal lowlands. The latter con-sists of Palaeocene to Quaternary intertwined marine and flood-plain deposits. The rate of vertical movement (uplift/subsidence) on the coastal lowlands is negligible during the last millennium (Djamour et al., 2010). According to the instrumental and histori-cal records of earthquakes, the southern region of the CS is seis-mically active. Large-magnitude inland or sea-based earthquakes can be responsible for unexpected sudden sea level changes (Naderi Beni et al., 2013a; Ozyavas et al., 2010). The Khazar Fault and the Lahijan Fault are the major tectonic features in the study area, and Langarud is located in the north of these faults (Figure 1b and c). The Rudbar Fault and the Mosha Fault are located further south of the study area (Figure 1b) and caused two large-magnitude earthquakes in AD 1990 and 958, respectively. The latter blocked rivers and formed lakes in the area (Berberian and Yeats, 1999).
The origin of the depression for the Langarud wetland could be a sag pond created by collapse during the AD 958 earthquake or an oxbow lake created due to river avulsion caused by rapid sea level rise or earthquake (Berberian and Yeats, 1999; Naderi Beni et al., 2013b). The lithofacies map of Kazancı and Gulbabazadeh
at Brunel University London on January 4, 2016hol.sagepub.comDownloaded from
Haghani et al. 5
(2013) shows the Langarud wetland on a c. >25-km-long coastal ridge with a NW and SE orientation. It is probably an old feature unrelated to the present orientation of the modern coastline.
Climate and vegetation of the regionThe climate of Langarud wetland is categorised as warm temper-ate and high precipitation. Based on the meteorological data recorded at the Lahijan station, the nearest synoptic station, the annual precipitation in the study area is ~1450 mm and the mean annual temperature is ~16.0°C (Molavi-Arabshahi et al., in press).
The Langarud wetland plays a vital environmental role, and it shelters many endemic species of plants and is also a refuge for many migratory birds (Seighali et al., 2011). The local vegetation in the Langarud wetland is dominated by aquatic plants such as Phragmites australis, while Sparganium neglectum and Typha australis are also present. In the surrounding plain, some rem-nants of alder swamps with Alnus glutinosa spp. barbata still occur. Extensive stands of alder swamps are locally called ‘jun-gles’. An open mesophilous forest with Carpinus betulus, Zelkova
carpinifolia and Ulmus remains on slightly drier places, espe-cially in the south and south-east of the wetland (Ghamgosar et al., 2011; Seighali et al., 2011). The northern slopes of Elburz Mountains are parts of the Hyrcanian (Caspian mixed forest) phy-togeographical territory (Zohary, 1973). It may be found on the slopes of the Elburz Mountains, which are only a few kilometres to the south-west of Langarud (Ghamgosar et al., 2011). The Hyr-canian area has been recognised as an important glacial refugium during the Quaternary (Arpe et al., 2011; Leroy and Arpe, 2007).
The surrounding areas of the wetland are intensively culti-vated, not only on dry lands but also as rice paddies (Ghamgosar et al., 2011). Indeed in the region, human impact has strongly modified the natural vegetation, as the lowland coastal areas are almost entirely cultivated, with patches only of preserved natural habitats (Kazancı et al., 2004). The natural dense forests have been destroyed and replaced by tea plantations, citrus trees and rice paddies. The damage done to the local vegetation is espe-cially consequential for the coastal plain and the first hundreds of metres of the northern slopes of the Elburz Mountains because of the high biodiversity of these zones (Emberger and Sabeti, 1962).
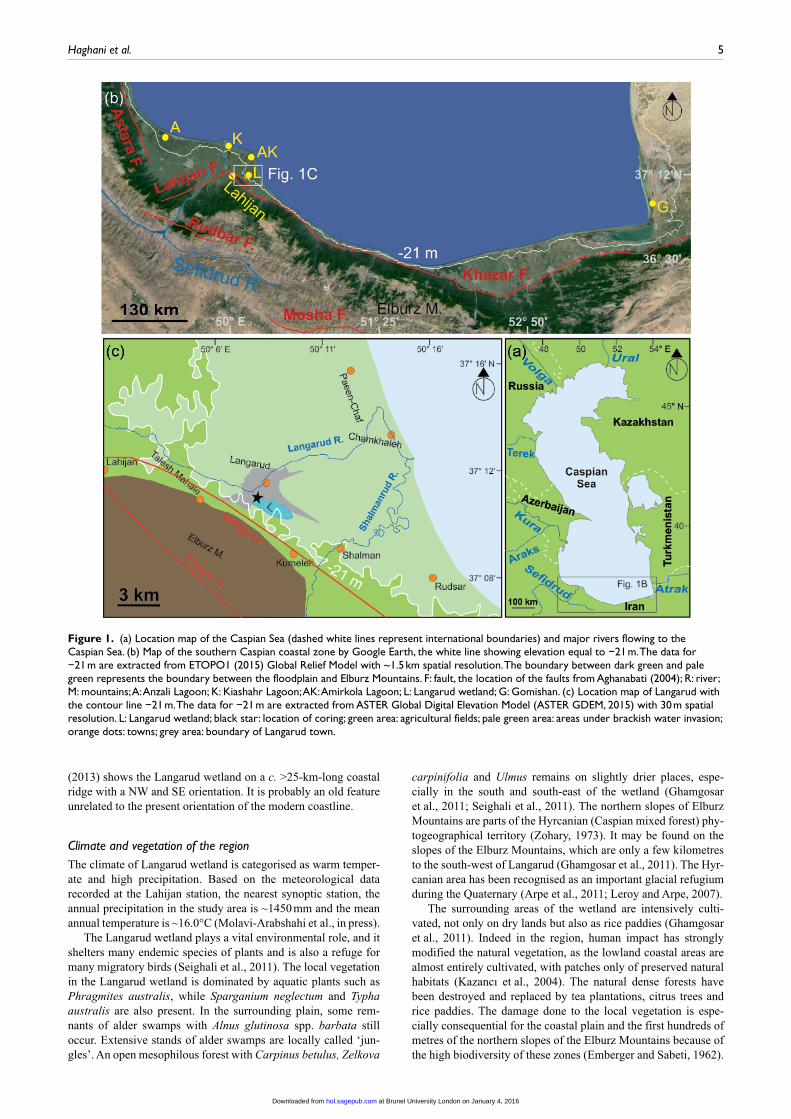
Figure 1. (a) Location map of the Caspian Sea (dashed white lines represent international boundaries) and major rivers flowing to the Caspian Sea. (b) Map of the southern Caspian coastal zone by Google Earth, the white line showing elevation equal to −21 m. The data for −21 m are extracted from ETOPO1 (2015) Global Relief Model with ~1.5 km spatial resolution. The boundary between dark green and pale green represents the boundary between the floodplain and Elburz Mountains. F: fault, the location of the faults from Aghanabati (2004); R: river; M: mountains; A: Anzali Lagoon; K: Kiashahr Lagoon; AK: Amirkola Lagoon; L: Langarud wetland; G: Gomishan. (c) Location map of Langarud with the contour line −21 m. The data for −21 m are extracted from ASTER Global Digital Elevation Model (ASTER GDEM, 2015) with 30 m spatial resolution. L: Langarud wetland; black star: location of coring; green area: agricultural fields; pale green area: areas under brackish water invasion; orange dots: towns; grey area: boundary of Langarud town.
at Brunel University London on January 4, 2016hol.sagepub.comDownloaded from
6 The Holocene 26(1)
MethodsCoringThe coring location is situated at 37°11′8.70″N and 50°8′51.00″E (Figure 1c). The absolute elevation of the coring location equal to 21.44 m b.s.l. was surveyed precisely. Two parallel, but offset, 1-m-long sections, cores LL13V A and B with maximum compos-ite depths of 665 and 578 cm were retrieved from the drained part of the Langarud wetland. The cores were taken using a percussion corer (gasoline-powered percussion hammer Cobra TT) during the field campaign organised by the Iranian National Institute for Oceanography and Atmospheric Science (INIOAS) in January 2013. These offset core sections were used to cover gaps between the sections, but due to good coverage of section A, section B was only used to check the boundary between sedimentary facies. A PVC pipe with an internal diameter of 5 cm was used as a core liner. Thereafter, the cores were transferred and stored in a cold room at 5°C, at Brunel University London (UK).
At 14 months after the coring campaign, the accurate elevation of the coring location was surveyed using a Leica Sprinter 150M Electronic Level in relation to a benchmark in Langarud town (prepared by the National Cartographic Centre of Iran). A pollen surface sample was taken in a nearby rice paddy on the same occasion. The data to calculate absolute sea level for the year 2014 are extracted from USDA (2015). Based on this, the CSL in the year 2014 was −27.41 m (USDA, 2015).
Sedimentology and chronologyMagnetic susceptibility (MS) measurements were performed using a Bartington MS2C core logging sensor at 2 cm intervals. MS is an indicator of depositional environments and may vary considerably with particle size and sediment origin (Thompson and Morton, 1979; Yim et al., 2004).
After core splitting, photographs were taken immediately using a high-quality camera. A standard visual core description was performed on both the working and the archive halves imme-diately after photography. An Ocean Drilling Programme (ODP) standard barrel-sheet format using symbols (Mazzullo et al., 1988) was used to document visual description: graphic log, grain size, colour, physical structures, type of contacts (e.g. sharp or gradual) and coring disturbance. The grain size was first based on the visual description and was then compared with the result of a grain size analyser and corrected, if required. Sediment colour was determined by placing a Munsell Colour Chart over the sedi-ment and finding the best match.
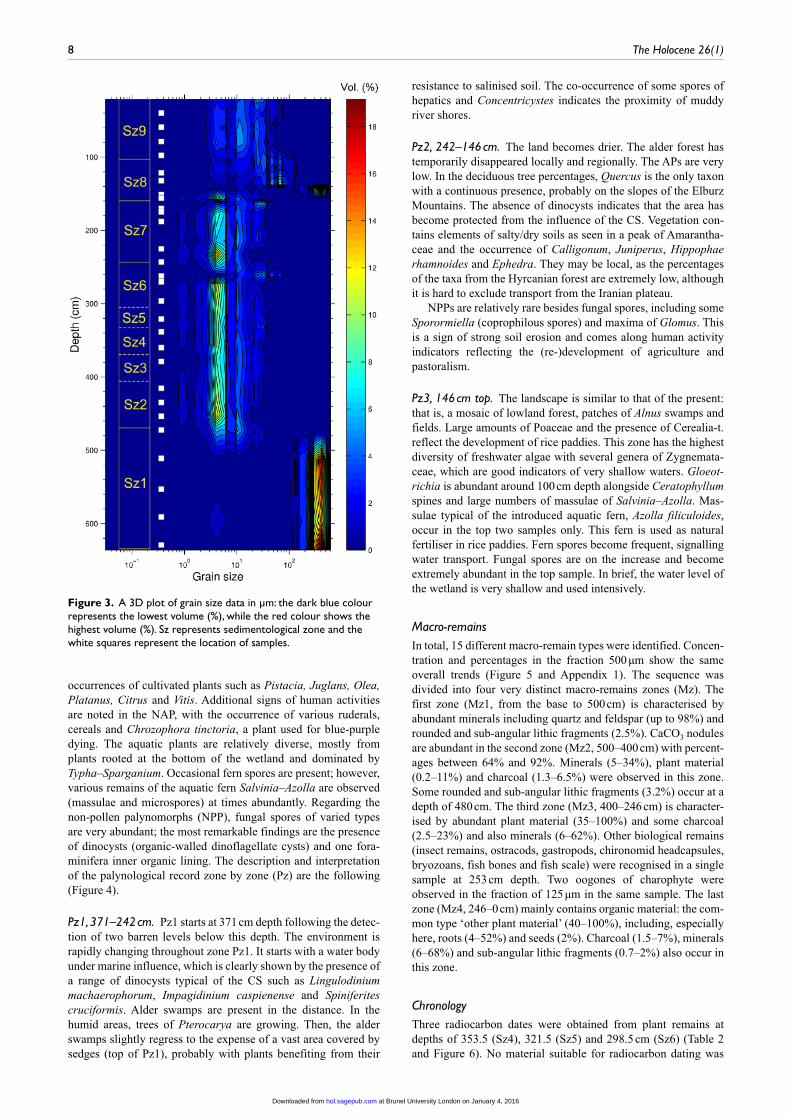
The grain size was determined using a CILAS 1180 particle size analyser on homogenised and representative subsamples. Grain size analysis provides important evidence of depositional conditions (Folk and Ward, 1957) and, together with MS, reflects physical condition of depositional environment (Bloemendal et al., 1992; Oldfield, 1991). Therefore, 28 samples were taken from different facies along the sequence in order to cover the entire depositional environments and to obtain a representative grain size column. Soaking the samples in 10% tetra-sodium pyrophosphate solution and 20 s of ultrasound were used to pre-vent flocculation. Granulometric data were processed using the GRADISTAT program. The sand–silt–clay triangular diagram suggested by Folk (1974) was used for naming textural group of the sediments. In addition, the particle size results have also been presented on a three-dimensional (3D) plot using MATLAB soft-ware version 7.1 to provide a detailed overview of changes over depth.
Organic matter (OM) and calcium carbonate (CaCO3) were determined on 28 samples through loss on ignition (LOI; Heiri et al., 2001). Three radiocarbon dates were obtained on rootlets at the Chrono Centre, Queen’s University Belfast, UK. The dates
were calibrated with the IntCal13 curve (Reimer et al., 2013) using CALIB 7.0.
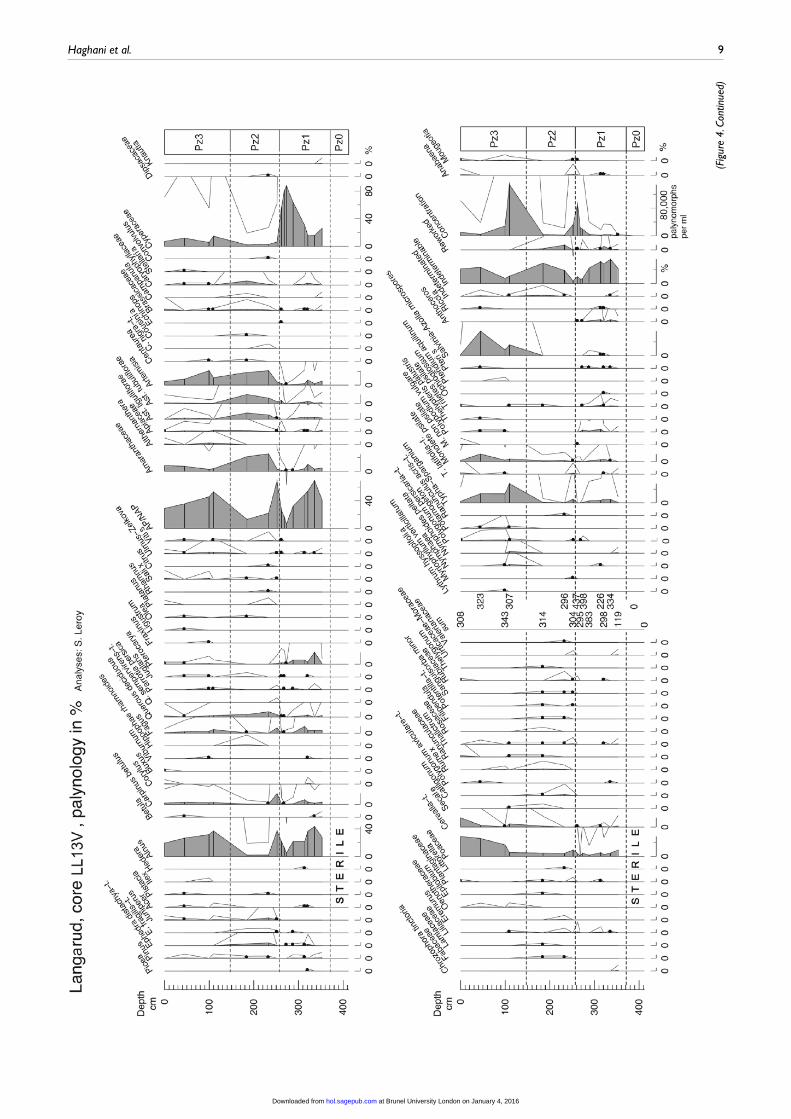
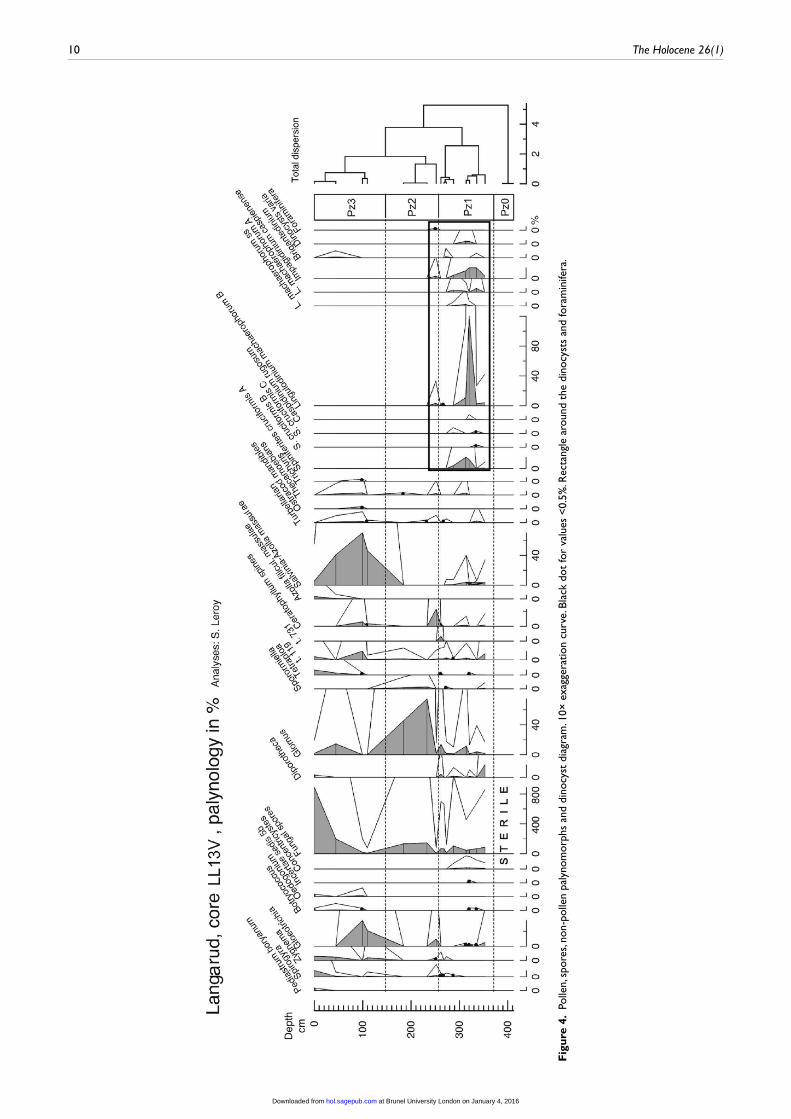
PalynologyIn all, 17 samples from 0.5 to 4.5 mL (16 from the core and 1 surface sample) were soaked in 10% tetra-sodium pyrophosphate solution to deflocculate the sediment. The samples were then treated with cold hydrochloric acid (first at 10% and then pure) and cold hydrofluoric acid (32%), followed by a repeated cold hydrochloric acid treatment, in order to eliminate carbonates, quartz and fluorosilicate gels, respectively. Finally, the samples were sieved through 125 and 10 µm nylon meshes, and the resi-dues were mounted on glass slides in glycerol. A light microscope at 400× magnification and at 1000× for special identifications was used to count the palynomorphs. The addition of Lycopodium tablets allowed the estimation of concentrations (number of paly-nomorphs per millilitre of wet sediment). Pollen atlases and the pollen reference collection at Brunel University London were used to identify pollen and spores, while dinocysts were identified using the studies of Marret et al. (2004) and Leroy et al. (2006, 2010). Percentages were calculated on the terrestrial sum (median of 308 terrestrial pollen grains), which represents pollen from plants growing on land, and the diagrams were plotted using the Psimpoll software, version 4.27 (Bennett, 2007). A zonation by cluster analysis (CONISS) after square-root transformation of the percentage data was applied to the main terrestrial taxa.
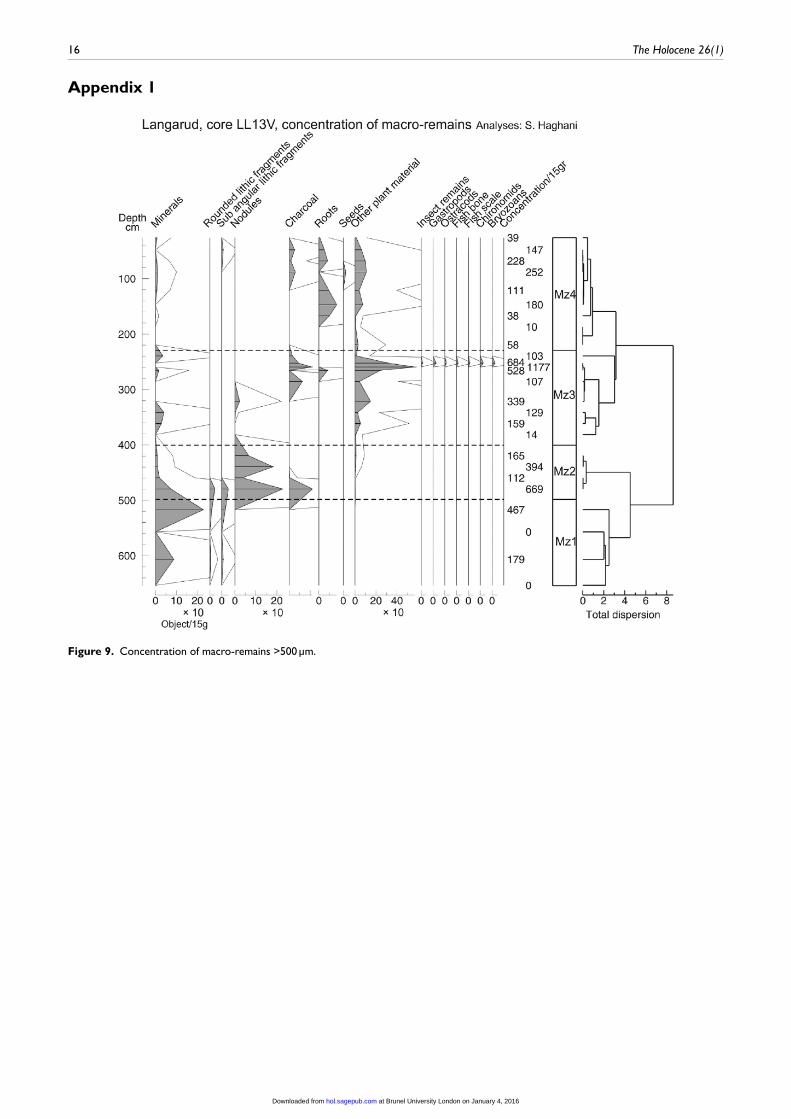
Macro-remainsFollowing Birks (2001), 26 samples with a weight of 15–20 g from different facies were deflocculated using 10% tetra-sodium pyrophosphate solution. The samples were then washed through a column of sieves with a mesh diameter of 500, 125 and 53 µm. The finest fraction (53 µm) was used to retrieve small fossils such as any foraminifera (Leroy et al., 2013b). The residue from each sieve was studied using a stereo-microscope (magnifications up to 90×). All the fractions were scanned, but because of the great scarcity of macrofossils in the smaller fractions, only the samples above 500 µm were counted. The results are presented in percent-age and concentration diagrams using the Psimpoll software, ver-sion 4.27 (Bennett, 2007). A zonation by CONISS after square-root transformation of the percentages and concentration data was applied.
The mineralogy of the minerals found in the macro-remains was checked either by x-ray diffraction (XRD) or by dissolution in HCl. XRD analysis was carried out at the Experimental Techniques Cen-tre (ETC), Brunel University London, using a Bruker D8 Advance equipped with a Lynx-eye position sensitive detector.
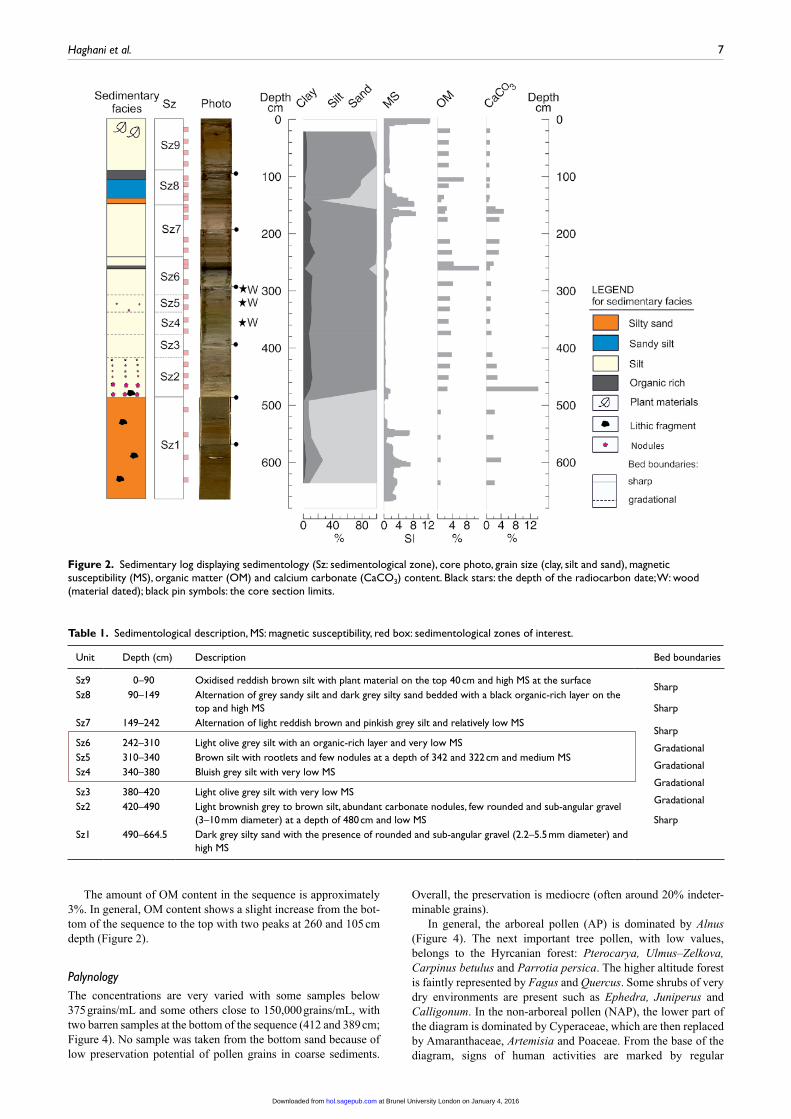
ResultsSedimentologyGenerally, the Langarud sequence consists of silty sand (bottom), sandy silt and silt (top). These range in colour from frequently red-dish brown to more rarely bluish grey (Figure 2 and Table 1). One-third of the samples show uni-modality, and the rest of the samples are bi-modal and poly-modal. No coring disturbance was observed in the sequence. From the bottom to top, the sequence is divided into nine sedimentological zones (Sz) based on visual description including colour, grain size, MS, OM and carbonate content that are detailed in Table 1 and represented in Figures 2 and 3.
The carbonate content has a background of 2% with a slight decrease from the bottom to the top of the core with one large peak at 471 cm depth and two small increases at 595 and 161 cm depth. The sharp peak of CaCO3 can be roughly related to the presence of carbonate nodules (Figure 2).
at Brunel University London on January 4, 2016hol.sagepub.comDownloaded from
Haghani et al. 7
Figure 2. Sedimentary log displaying sedimentology (Sz: sedimentological zone), core photo, grain size (clay, silt and sand), magnetic susceptibility (MS), organic matter (OM) and calcium carbonate (CaCO3) content. Black stars: the depth of the radiocarbon date; W: wood (material dated); black pin symbols: the core section limits.
The amount of OM content in the sequence is approximately 3%. In general, OM content shows a slight increase from the bot-tom of the sequence to the top with two peaks at 260 and 105 cm depth (Figure 2).
PalynologyThe concentrations are very varied with some samples below 375 grains/mL and some others close to 150,000 grains/mL, with two barren samples at the bottom of the sequence (412 and 389 cm; Figure 4). No sample was taken from the bottom sand because of low preservation potential of pollen grains in coarse sediments.
Overall, the preservation is mediocre (often around 20% indeter-minable grains).
In general, the arboreal pollen (AP) is dominated by Alnus (Figure 4). The next important tree pollen, with low values, belongs to the Hyrcanian forest: Pterocarya, Ulmus–Zelkova, Carpinus betulus and Parrotia persica. The higher altitude forest is faintly represented by Fagus and Quercus. Some shrubs of very dry environments are present such as Ephedra, Juniperus and Calligonum. In the non-arboreal pollen (NAP), the lower part of the diagram is dominated by Cyperaceae, which are then replaced by Amaranthaceae, Artemisia and Poaceae. From the base of the diagram, signs of human activities are marked by regular
Table 1. Sedimentological description, MS: magnetic susceptibility, red box: sedimentological zones of interest.
Unit Depth (cm) Description Bed boundaries
Sz9 0–90 Oxidised reddish brown silt with plant material on the top 40 cm and high MS at the surface Sharp Sharp Sharp Gradational Gradational Gradational Gradational Sharp
Sz8 90–149 Alternation of grey sandy silt and dark grey silty sand bedded with a black organic-rich layer on the top and high MS
Sz7 149–242 Alternation of light reddish brown and pinkish grey silt and relatively low MS
Sz6 242–310 Light olive grey silt with an organic-rich layer and very low MSSz5 310–340 Brown silt with rootlets and few nodules at a depth of 342 and 322 cm and medium MSSz4 340–380 Bluish grey silt with very low MS
Sz3 380–420 Light olive grey silt with very low MSSz2 420–490 Light brownish grey to brown silt, abundant carbonate nodules, few rounded and sub-angular gravel
(3–10 mm diameter) at a depth of 480 cm and low MSSz1 490–664.5 Dark grey silty sand with the presence of rounded and sub-angular gravel (2.2–5.5 mm diameter) and
high MS
at Brunel University London on January 4, 2016hol.sagepub.comDownloaded from
8 The Holocene 26(1)
occurrences of cultivated plants such as Pistacia, Juglans, Olea, Platanus, Citrus and Vitis. Additional signs of human activities are noted in the NAP, with the occurrence of various ruderals, cereals and Chrozophora tinctoria, a plant used for blue-purple dying. The aquatic plants are relatively diverse, mostly from plants rooted at the bottom of the wetland and dominated by Typha–Sparganium. Occasional fern spores are present; however, various remains of the aquatic fern Salvinia–Azolla are observed (massulae and microspores) at times abundantly. Regarding the non-pollen palynomorphs (NPP), fungal spores of varied types are very abundant; the most remarkable findings are the presence of dinocysts (organic-walled dinoflagellate cysts) and one fora-minifera inner organic lining. The description and interpretation of the palynological record zone by zone (Pz) are the following (Figure 4).
Pz1, 371–242 cm. Pz1 starts at 371 cm depth following the detec-tion of two barren levels below this depth. The environment is rapidly changing throughout zone Pz1. It starts with a water body under marine influence, which is clearly shown by the presence of a range of dinocysts typical of the CS such as Lingulodinium machaerophorum, Impagidinium caspienense and Spiniferites cruciformis. Alder swamps are present in the distance. In the humid areas, trees of Pterocarya are growing. Then, the alder swamps slightly regress to the expense of a vast area covered by sedges (top of Pz1), probably with plants benefiting from their
resistance to salinised soil. The co-occurrence of some spores of hepatics and Concentricystes indicates the proximity of muddy river shores.
Pz2, 242–146 cm. The land becomes drier. The alder forest has temporarily disappeared locally and regionally. The APs are very low. In the deciduous tree percentages, Quercus is the only taxon with a continuous presence, probably on the slopes of the Elburz Mountains. The absence of dinocysts indicates that the area has become protected from the influence of the CS. Vegetation con-tains elements of salty/dry soils as seen in a peak of Amarantha-ceae and the occurrence of Calligonum, Juniperus, Hippophae rhamnoides and Ephedra. They may be local, as the percentages of the taxa from the Hyrcanian forest are extremely low, although it is hard to exclude transport from the Iranian plateau.
NPPs are relatively rare besides fungal spores, including some Sporormiella (coprophilous spores) and maxima of Glomus. This is a sign of strong soil erosion and comes along human activity indicators reflecting the (re-)development of agriculture and pastoralism.
Pz3, 146 cm top. The landscape is similar to that of the present: that is, a mosaic of lowland forest, patches of Alnus swamps and fields. Large amounts of Poaceae and the presence of Cerealia-t. reflect the development of rice paddies. This zone has the highest diversity of freshwater algae with several genera of Zygnemata-ceae, which are good indicators of very shallow waters. Gloeot-richia is abundant around 100 cm depth alongside Ceratophyllum spines and large numbers of massulae of Salvinia–Azolla. Mas-sulae typical of the introduced aquatic fern, Azolla filiculoides, occur in the top two samples only. This fern is used as natural fertiliser in rice paddies. Fern spores become frequent, signalling water transport. Fungal spores are on the increase and become extremely abundant in the top sample. In brief, the water level of the wetland is very shallow and used intensively.
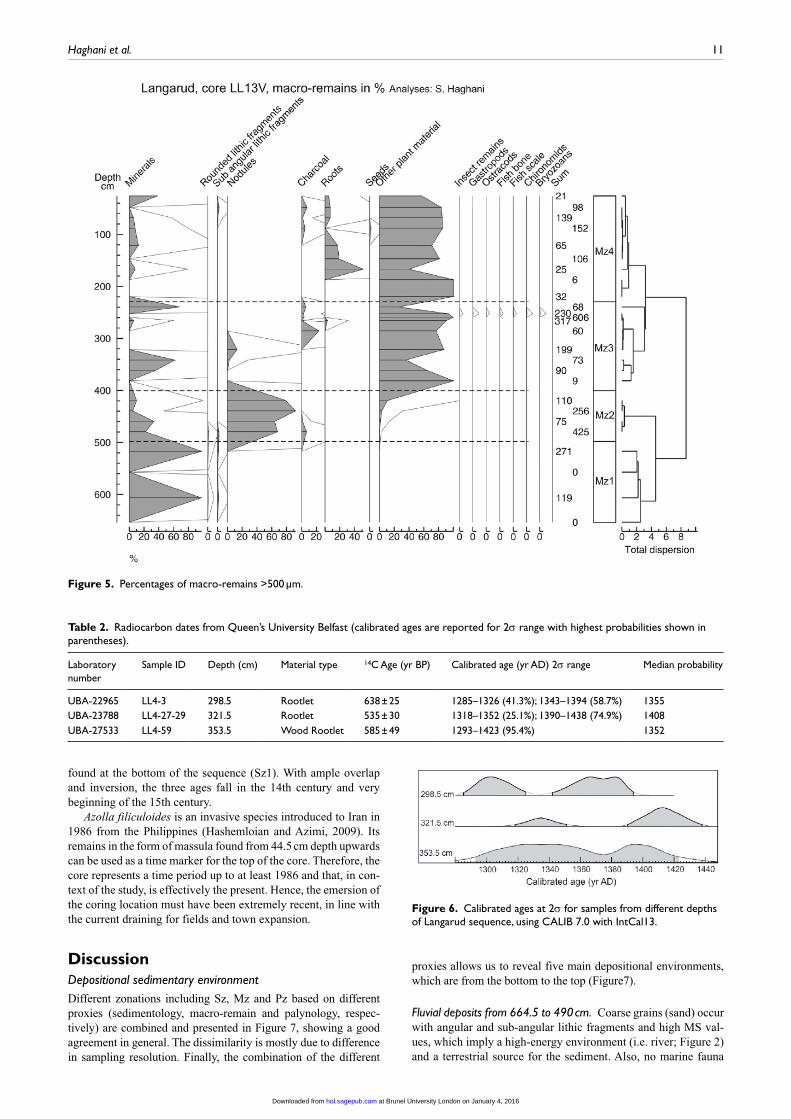
Macro-remainsIn total, 15 different macro-remain types were identified. Concen-tration and percentages in the fraction 500 µm show the same overall trends (Figure 5 and Appendix 1). The sequence was divided into four very distinct macro-remains zones (Mz). The first zone (Mz1, from the base to 500 cm) is characterised by abundant minerals including quartz and feldspar (up to 98%) and rounded and sub-angular lithic fragments (2.5%). CaCO3 nodules are abundant in the second zone (Mz2, 500–400 cm) with percent-ages between 64% and 92%. Minerals (5–34%), plant material (0.2–11%) and charcoal (1.3–6.5%) were observed in this zone. Some rounded and sub-angular lithic fragments (3.2%) occur at a depth of 480 cm. The third zone (Mz3, 400–246 cm) is character-ised by abundant plant material (35–100%) and some charcoal (2.5–23%) and also minerals (6–62%). Other biological remains (insect remains, ostracods, gastropods, chironomid headcapsules, bryozoans, fish bones and fish scale) were recognised in a single sample at 253 cm depth. Two oogones of charophyte were observed in the fraction of 125 µm in the same sample. The last zone (Mz4, 246–0 cm) mainly contains organic material: the com-mon type ‘other plant material’ (40–100%), including, especially here, roots (4–52%) and seeds (2%). Charcoal (1.5–7%), minerals (6–68%) and sub-angular lithic fragments (0.7–2%) also occur in this zone.
ChronologyThree radiocarbon dates were obtained from plant remains at depths of 353.5 (Sz4), 321.5 (Sz5) and 298.5 cm (Sz6) (Table 2 and Figure 6). No material suitable for radiocarbon dating was
Figure 3. A 3D plot of grain size data in μm: the dark blue colour represents the lowest volume (%), while the red colour shows the highest volume (%). Sz represents sedimentological zone and the white squares represent the location of samples.
at Brunel University London on January 4, 2016hol.sagepub.comDownloaded from
Haghani et al. 9
(Fig
ure
4. C
ontin
ued)
at Brunel University London on January 4, 2016hol.sagepub.comDownloaded from
10 The Holocene 26(1)
Fig
ure
4. P
olle
n, s
pore
s, no
n-po
llen
paly
nom
orph
s an
d di
nocy
st d
iagr
am. 1
0× e
xagg
erat
ion
curv
e. B
lack
dot
for
valu
es <
0.5%
. Rec
tang
le a
roun
d th
e di
nocy
sts
and
fora
min
ifera
.
at Brunel University London on January 4, 2016hol.sagepub.comDownloaded from
Haghani et al. 11
found at the bottom of the sequence (Sz1). With ample overlap and inversion, the three ages fall in the 14th century and very beginning of the 15th century.
Azolla filiculoides is an invasive species introduced to Iran in 1986 from the Philippines (Hashemloian and Azimi, 2009). Its remains in the form of massula found from 44.5 cm depth upwards can be used as a time marker for the top of the core. Therefore, the core represents a time period up to at least 1986 and that, in con-text of the study, is effectively the present. Hence, the emersion of the coring location must have been extremely recent, in line with the current draining for fields and town expansion.
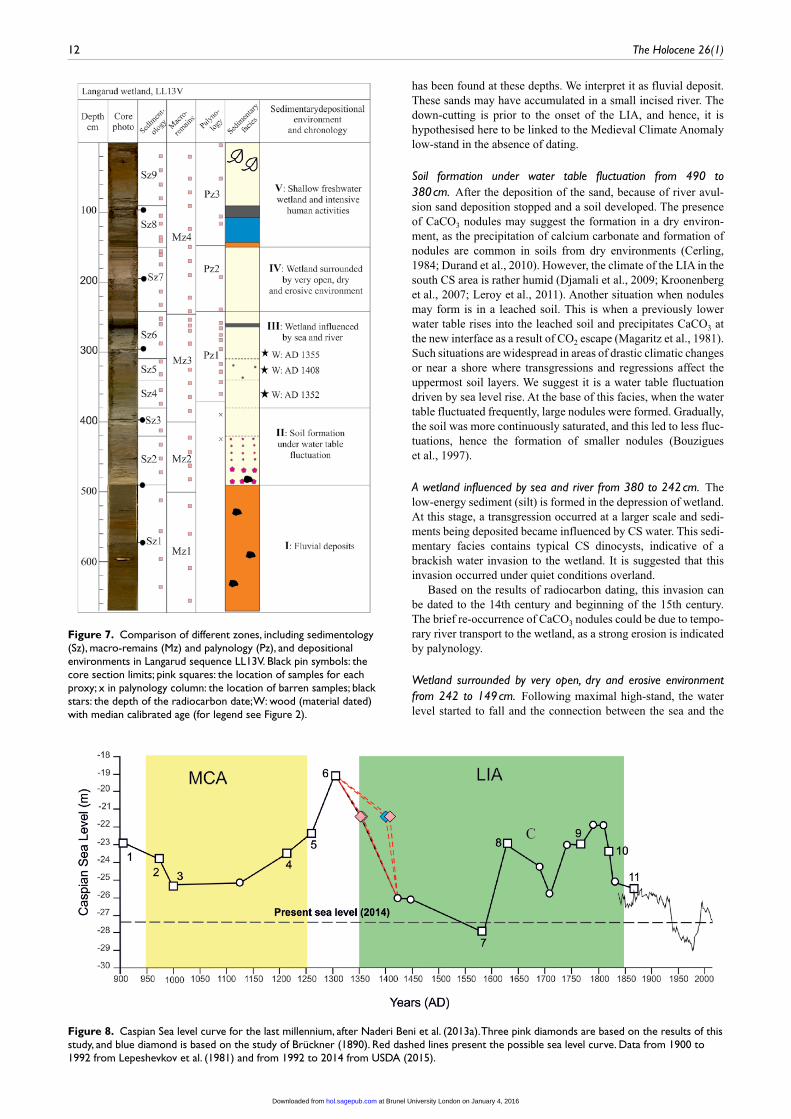
DiscussionDepositional sedimentary environmentDifferent zonations including Sz, Mz and Pz based on different proxies (sedimentology, macro-remain and palynology, respec-tively) are combined and presented in Figure 7, showing a good agreement in general. The dissimilarity is mostly due to difference in sampling resolution. Finally, the combination of the different
proxies allows us to reveal five main depositional environments, which are from the bottom to the top (Figure7).
Fluvial deposits from 664.5 to 490 cm. Coarse grains (sand) occur with angular and sub-angular lithic fragments and high MS val-ues, which imply a high-energy environment (i.e. river; Figure 2) and a terrestrial source for the sediment. Also, no marine fauna
Figure 5. Percentages of macro-remains >500 µm.
Table 2. Radiocarbon dates from Queen’s University Belfast (calibrated ages are reported for 2σ range with highest probabilities shown in parentheses).
Laboratory number
Sample ID Depth (cm) Material type 14C Age (yr BP) Calibrated age (yr AD) 2σ range Median probability
UBA-22965 LL4-3 298.5 Rootlet 638 ± 25 1285–1326 (41.3%); 1343–1394 (58.7%) 1355UBA-23788 LL4-27-29 321.5 Rootlet 535 ± 30 1318–1352 (25.1%); 1390–1438 (74.9%) 1408UBA-27533 LL4-59 353.5 Wood Rootlet 585 ± 49 1293–1423 (95.4%) 1352
Figure 6. Calibrated ages at 2σ for samples from different depths of Langarud sequence, using CALIB 7.0 with IntCal13.
at Brunel University London on January 4, 2016hol.sagepub.comDownloaded from
12 The Holocene 26(1)
has been found at these depths. We interpret it as fluvial deposit. These sands may have accumulated in a small incised river. The down-cutting is prior to the onset of the LIA, and hence, it is hypothesised here to be linked to the Medieval Climate Anomaly low-stand in the absence of dating.
Soil formation under water table fluctuation from 490 to 380 cm. After the deposition of the sand, because of river avul-sion sand deposition stopped and a soil developed. The presence of CaCO3 nodules may suggest the formation in a dry environ-ment, as the precipitation of calcium carbonate and formation of nodules are common in soils from dry environments (Cerling, 1984; Durand et al., 2010). However, the climate of the LIA in the south CS area is rather humid (Djamali et al., 2009; Kroonenberg et al., 2007; Leroy et al., 2011). Another situation when nodules may form is in a leached soil. This is when a previously lower water table rises into the leached soil and precipitates CaCO3 at the new interface as a result of CO2 escape (Magaritz et al., 1981). Such situations are widespread in areas of drastic climatic changes or near a shore where transgressions and regressions affect the uppermost soil layers. We suggest it is a water table fluctuation driven by sea level rise. At the base of this facies, when the water table fluctuated frequently, large nodules were formed. Gradually, the soil was more continuously saturated, and this led to less fluc-tuations, hence the formation of smaller nodules (Bouzigues et al., 1997).
A wetland influenced by sea and river from 380 to 242 cm. The low-energy sediment (silt) is formed in the depression of wetland. At this stage, a transgression occurred at a larger scale and sedi-ments being deposited became influenced by CS water. This sedi-mentary facies contains typical CS dinocysts, indicative of a brackish water invasion to the wetland. It is suggested that this invasion occurred under quiet conditions overland.
Based on the results of radiocarbon dating, this invasion can be dated to the 14th century and beginning of the 15th century. The brief re-occurrence of CaCO3 nodules could be due to tempo-rary river transport to the wetland, as a strong erosion is indicated by palynology.
Wetland surrounded by very open, dry and erosive environment from 242 to 149 cm. Following maximal high-stand, the water level started to fall and the connection between the sea and the
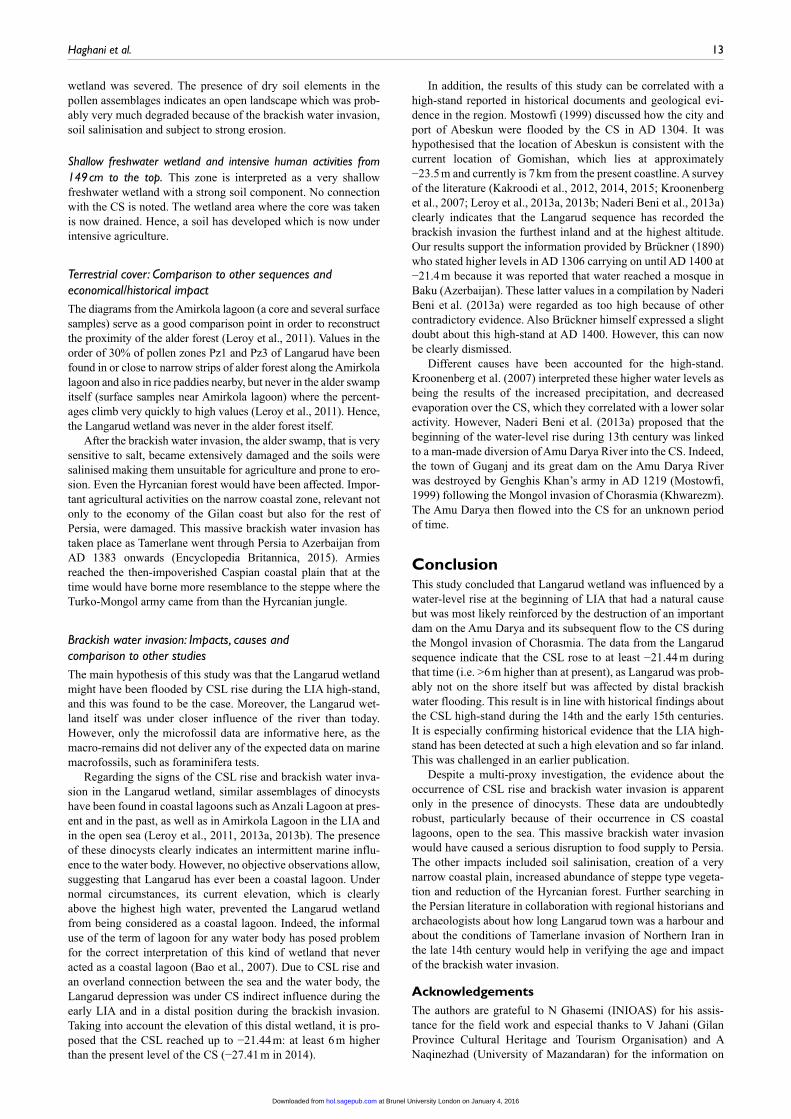
Figure 8. Caspian Sea level curve for the last millennium, after Naderi Beni et al. (2013a). Three pink diamonds are based on the results of this study, and blue diamond is based on the study of Brückner (1890). Red dashed lines present the possible sea level curve. Data from 1900 to 1992 from Lepeshevkov et al. (1981) and from 1992 to 2014 from USDA (2015).
Figure 7. Comparison of different zones, including sedimentology (Sz), macro-remains (Mz) and palynology (Pz), and depositional environments in Langarud sequence LL13V. Black pin symbols: the core section limits; pink squares: the location of samples for each proxy; x in palynology column: the location of barren samples; black stars: the depth of the radiocarbon date; W: wood (material dated) with median calibrated age (for legend see Figure 2).
at Brunel University London on January 4, 2016hol.sagepub.comDownloaded from
Haghani et al. 13
wetland was severed. The presence of dry soil elements in the pollen assemblages indicates an open landscape which was prob-ably very much degraded because of the brackish water invasion, soil salinisation and subject to strong erosion.
Shallow freshwater wetland and intensive human activities from 149 cm to the top. This zone is interpreted as a very shallow freshwater wetland with a strong soil component. No connection with the CS is noted. The wetland area where the core was taken is now drained. Hence, a soil has developed which is now under intensive agriculture.
Terrestrial cover: Comparison to other sequences and economical/historical impactThe diagrams from the Amirkola lagoon (a core and several surface samples) serve as a good comparison point in order to reconstruct the proximity of the alder forest (Leroy et al., 2011). Values in the order of 30% of pollen zones Pz1 and Pz3 of Langarud have been found in or close to narrow strips of alder forest along the Amirkola lagoon and also in rice paddies nearby, but never in the alder swamp itself (surface samples near Amirkola lagoon) where the percent-ages climb very quickly to high values (Leroy et al., 2011). Hence, the Langarud wetland was never in the alder forest itself.
After the brackish water invasion, the alder swamp, that is very sensitive to salt, became extensively damaged and the soils were salinised making them unsuitable for agriculture and prone to ero-sion. Even the Hyrcanian forest would have been affected. Impor-tant agricultural activities on the narrow coastal zone, relevant not only to the economy of the Gilan coast but also for the rest of Persia, were damaged. This massive brackish water invasion has taken place as Tamerlane went through Persia to Azerbaijan from AD 1383 onwards (Encyclopedia Britannica, 2015). Armies reached the then-impoverished Caspian coastal plain that at the time would have borne more resemblance to the steppe where the Turko-Mongol army came from than the Hyrcanian jungle.
Brackish water invasion: Impacts, causes and comparison to other studiesThe main hypothesis of this study was that the Langarud wetland might have been flooded by CSL rise during the LIA high-stand, and this was found to be the case. Moreover, the Langarud wet-land itself was under closer influence of the river than today. However, only the microfossil data are informative here, as the macro-remains did not deliver any of the expected data on marine macrofossils, such as foraminifera tests.
Regarding the signs of the CSL rise and brackish water inva-sion in the Langarud wetland, similar assemblages of dinocysts have been found in coastal lagoons such as Anzali Lagoon at pres-ent and in the past, as well as in Amirkola Lagoon in the LIA and in the open sea (Leroy et al., 2011, 2013a, 2013b). The presence of these dinocysts clearly indicates an intermittent marine influ-ence to the water body. However, no objective observations allow, suggesting that Langarud has ever been a coastal lagoon. Under normal circumstances, its current elevation, which is clearly above the highest high water, prevented the Langarud wetland from being considered as a coastal lagoon. Indeed, the informal use of the term of lagoon for any water body has posed problem for the correct interpretation of this kind of wetland that never acted as a coastal lagoon (Bao et al., 2007). Due to CSL rise and an overland connection between the sea and the water body, the Langarud depression was under CS indirect influence during the early LIA and in a distal position during the brackish invasion. Taking into account the elevation of this distal wetland, it is pro-posed that the CSL reached up to −21.44 m: at least 6 m higher than the present level of the CS (−27.41 m in 2014).
In addition, the results of this study can be correlated with a high-stand reported in historical documents and geological evi-dence in the region. Mostowfi (1999) discussed how the city and port of Abeskun were flooded by the CS in AD 1304. It was hypothesised that the location of Abeskun is consistent with the current location of Gomishan, which lies at approximately −23.5 m and currently is 7 km from the present coastline. A survey of the literature (Kakroodi et al., 2012, 2014, 2015; Kroonenberg et al., 2007; Leroy et al., 2013a, 2013b; Naderi Beni et al., 2013a) clearly indicates that the Langarud sequence has recorded the brackish invasion the furthest inland and at the highest altitude. Our results support the information provided by Brückner (1890) who stated higher levels in AD 1306 carrying on until AD 1400 at −21.4 m because it was reported that water reached a mosque in Baku (Azerbaijan). These latter values in a compilation by Naderi Beni et al. (2013a) were regarded as too high because of other contradictory evidence. Also Brückner himself expressed a slight doubt about this high-stand at AD 1400. However, this can now be clearly dismissed.
Different causes have been accounted for the high-stand. Kroonenberg et al. (2007) interpreted these higher water levels as being the results of the increased precipitation, and decreased evaporation over the CS, which they correlated with a lower solar activity. However, Naderi Beni et al. (2013a) proposed that the beginning of the water-level rise during 13th century was linked to a man-made diversion of Amu Darya River into the CS. Indeed, the town of Guganj and its great dam on the Amu Darya River was destroyed by Genghis Khan’s army in AD 1219 (Mostowfi, 1999) following the Mongol invasion of Chorasmia (Khwarezm). The Amu Darya then flowed into the CS for an unknown period of time.
ConclusionThis study concluded that Langarud wetland was influenced by a water-level rise at the beginning of LIA that had a natural cause but was most likely reinforced by the destruction of an important dam on the Amu Darya and its subsequent flow to the CS during the Mongol invasion of Chorasmia. The data from the Langarud sequence indicate that the CSL rose to at least −21.44 m during that time (i.e. >6 m higher than at present), as Langarud was prob-ably not on the shore itself but was affected by distal brackish water flooding. This result is in line with historical findings about the CSL high-stand during the 14th and the early 15th centuries. It is especially confirming historical evidence that the LIA high-stand has been detected at such a high elevation and so far inland. This was challenged in an earlier publication.
Despite a multi-proxy investigation, the evidence about the occurrence of CSL rise and brackish water invasion is apparent only in the presence of dinocysts. These data are undoubtedly robust, particularly because of their occurrence in CS coastal lagoons, open to the sea. This massive brackish water invasion would have caused a serious disruption to food supply to Persia. The other impacts included soil salinisation, creation of a very narrow coastal plain, increased abundance of steppe type vegeta-tion and reduction of the Hyrcanian forest. Further searching in the Persian literature in collaboration with regional historians and archaeologists about how long Langarud town was a harbour and about the conditions of Tamerlane invasion of Northern Iran in the late 14th century would help in verifying the age and impact of the brackish water invasion.
AcknowledgementsThe authors are grateful to N Ghasemi (INIOAS) for his assis-tance for the field work and especial thanks to V Jahani (Gilan Province Cultural Heritage and Tourism Organisation) and A Naqinezhad (University of Mazandaran) for the information on
at Brunel University London on January 4, 2016hol.sagepub.comDownloaded from
14 The Holocene 26(1)
Langarud history. The publication is a contribution to the INQUA QuickLakeH project (no. 1227) and to the European project Ma-rie Curie, CLIMSEAS-PIRSES-GA-2009-247512. This paper benefitted from discussions with K Arpe (Brunel University Lon-don). T Hoyle (Brunel University London) has kindly checked the English of the manuscript.
FundingThis research is part of the PhD of the first author (S Haghani) entitled ‘Evaluation of Sefidrud Delta during the last millennia, south west of the Caspian Sea’ and was funded by Brunel Univer-sity London. Provision for open access publication was made available by the Institute for the Environment, Brunel University London.
ReferencesAghanabati A (2004) Geology of Iran. Tehran: Geological Survey
of Iran.Arpe K, Leroy SAG and Mikolajewicz U (2011) A comparison of
climate simulations for the last glacial maximum with three different versions of the ECHAM model and implications for summer-green tree refugia. Climate of the Past 7: 91–114.
Arpe K, Bengtsson L, Golitsyn GS et al. (2000) Connection between Caspian Sea level variability and ENSO. Geophysi-cal Research Letters 27: 2693–2696.
Arpe K, Leroy SAG, Lahijani H et al. (2012) Impact of the European Russia drought in 2010 on the Caspian Sea level. Hydrology and Earth System Sciences 16: 19–27.
Arpe K, Leroy S, Wetterhall F et al. (2014) Prediction of the Cas-pian Sea level using ECMWF seasonal forecasts and reanaly-sis. Theoretical and Applied Climatology 117: 41–60.
ASTER GDEM (2015) http://www.jspacesystems.or.jp/ersdac/GDEM/E/4.htm (accessed 2 February 2015).
Bao R, Alonso A, Delgado C et al. (2007) Identification of the main driving mechanisms in the evolution of a small coastal wetland (Traba, Galicia, NW Spain) since its origin 5700 cal yr BP. Palaeogeography, Palaeoclimatology, Palaeoecology 247(3): 296–312.
Bennett K (2007) Psimpoll and pscomb programs for pand analy-sis (version 4.27). Available at: http://www.chrono.qub.ac.uk/psimpoll/psimpoll.html (accessed 16 January 2015).
Berberian M and Yeats RS (1999) Patterns of historical earth-quake rupture in the Iranian Plateau. Bulletin of the Seismo-logical Society of America 89(1): 120–139.
Birks HH (2001) Plant macrofossils. In: Smol JP, Birks HJB and Last WM (eds) Tracking Environmental Change Using Lake Sediments. Dordrecht: Springer, pp. 49–74.
Bloemendal J, King JW, Hall FR et al. (1992) Rock magnetism of Late Neogene and Pleistocene deep sea sediments: Relation-ship to sediment source, diagenetic processes, and sediment lithology. Journal of Geophysical Research: Solid Earth 97: 4361–4375.
Bouzigues R, Ribolzi O, Favrot JC et al. (1997) Carbonate redis-tribution and hydrogeochemical processes in two calcare-ous soils with groundwater in a Mediterranean environment. European Journal of Soil Science 48(2): 201–211.
Brückner E (1890) Climate fluctuations since 1700, along with comments about the climatic fluctuations of the Diluvial period. Vienna: E. Hölzel (in German).
Cerling TE (1984) The stable isotopic composition of modern soil carbonate and its relationship to climate. Earth and Planetary Science Letters 71: 229–240.
Djamali M, de Beaulieu J-L, Miller N et al. (2009) A late Holo-cene pollen record from Lake Almalou in NW Iran: Evidence for changing land-use in relation to some historical events during the last 3700 years. Journal of Archaeological Science 36: 1364–1375.
Djamour Y, Vernant P, Bayer R et al. (2010) GPS and gravity constraints on continental deformation in the Alborz moun-tain range, Iran. Geophysical Journal International 183: 1287–1301.
Dolotov Y and Kaplin P (2005) Black and Caspian Seas, coastal ecology and geomorphology. In: Schwartz ML (ed.) Encyclopedia of Coastal Science. Dordrecht: Springer, pp. 194–203.
Durand N, Monger HC and Canti MG (2010) Calcium carbonate features. In: Stoops G, Marcelino V and Mees F (eds) Inter-pretation of Micromorphological Features of Soils and Rego-liths. Amsterdam: Elsevier, pp. 149–194.
Emberger L and Sabeti H (1962) Forêts denses intertropicales et forêts Caspiennes humides. Naturalia Monspeliensia: Serie botanique 14: 55–61.
Encyclopedia Britannica (2015) Available at: http://www.britan-nica.com (accessed 16 January 2015).
ETOPO1 (2015) http://www.ngdc.noaa.gov/mgg/global/global.html (accessed 2 February 2015).
Folk RL (1974) Petrology of Sedimentary Rocks. Austin, TX: Hemphill Publishing Company.
Folk RL and Ward WC (1957) Brazos River bar: A study in the significance of grain size parameters. Journal of Sedimentary Research 27(1): 3–26.
Ghamgosar M, Haghyghy M, Mehrdoust F et al. (2011) Multicri-teria decision making based on analytical hierarchy process (AHP) in GIS for tourism. Middle-East Journal of Scientific Research 4: 501–507.
Hashemloian BD and Azimi AA (2009) Alien and exotic Azolla in northern Iran. African Journal of Biotechnology 8: 187–190.
Heiri O, Lotter AF and Lemcke G (2001) Loss on ignition as a method for estimating organic and carbonate content in sedi-ments: Reproducibility and comparability of results. Journal of Paleolimnology 25: 101–110.
Hoogendoorn RM, Boels JF, Kroonenberg SB et al. (2005) Devel-opment of the Kura delta, Azerbaijan; a record of Holocene Caspian sea level changes. Marine Geology 222: 359–380.
Kakroodi AA, Kroonenberg SB, Goorabi A et al. (2014) Shoreline response to rapid 20th century sea-level change along the Iranian Caspian coast. Journal of Coastal Research 30: 1243–1250.
Kakroodi AA, Kroonenberg SB, Hoogendoorn RM et al. (2012) Rapid Holocene sea-level changes along the Iranian Caspian coast. Quaternary International 263: 93–103.
Kakroodi AA, Leroy SAG, Kroonenberg SB et al. (2015) Late Pleistocene and Holocene sea-level change and coastal pal-aeoenvironment evolution along the Iranian Caspian shore. Marine Geology 361: 111–125.
Karpychev YA (2001) Variations in the Caspian Sea level in the historic epoch. Water Resources 28(1): 1–14.
Kazancı N and Gulbabazadeh T (2013) Sefidrud delta and quater-nary evolution of the southern Caspian Lowland, Iran. Marine and Petroleum Geology 44: 120–139.
Kazancı N, Gulbabazadeh T, Leroy SAG et al. (2004) Sedimen-tary and environmental characteristics of the Gilan–Mazen-deran plain, northern Iran: Influence of long- and short-term Caspian water level fluctuations on geomorphology. Journal of Marine Systems 46: 145–168.
Kosarev AN (2005) Physico-geographical conditions of the Cas-pian Sea. In: Kostianoy A and Kosarev A (eds) The Caspian Sea Environment. Berlin, Heidelberg: Springer, pp. 5–31.
Kroonenberg SB, Rusakov GV and Svitoch AA (1997) The wan-dering of the Volga delta: A response to rapid Caspian sea-level change. Sedimentary Geology 107(3): 189–209.
Kroonenberg SB, Abdurakhmanov GM, Badyukova EN et al. (2007) Solar-forced 2600 BP and Little Ice Age highstands of the Caspian Sea. Quaternary International 173: 137–143.
at Brunel University London on January 4, 2016hol.sagepub.comDownloaded from
Haghani et al. 15
Lahijani HAK, Tavakoli V and Amini AH (2008) South Caspian river mouth configuration under human impact and sea level fluctuations. Environmental Sciences 5: 65–86.
Lahijani HAK, Rahimpour-Bonab H, Tavakoli V et al. (2009) Evidence for late Holocene highstands in central Guilan–East Mazanderan, south Caspian coast, Iran. Quaternary Interna-tional 197: 55–71.
Lepeshevkov IN, Buynevich DV, Buynevich NA et al. (1981) Perspectives of Use of Salt Resources of Kara-Bogaz-Gol. Moscow: Academia Nauka, p. 273 (in Russian).
Leroy SAG and Arpe K (2007) Glacial refugia for summer-green trees in Europe and S-W Asia as proposed by ECHAM3 time-slice atmospheric model simulations. Journal of Biogeogra-phy 34: 2115–2128.
Leroy SAG, Kakroodi AA, Kroonenberg SB et al. (2013a). Holo-cene vegetation history and sea level changes in the SE corner of the Caspian Sea: Relevance to SW Asia climate. Quater-nary Science Reviews 70: 28–47.
Leroy SAG, Lahijani H, Reyss J et al. (2013b). A two-step expan-sion of the dinocyst Lingulodinium machaerophorum in the Caspian Sea: The role of changing environment. Quaternary Science Reviews 77: 31–45.
Leroy SAG, Marret F, Giralt S et al. (2006) Natural and anthro-pogenic rapid changes in the Kara-Bogaz Gol over the last two centuries reconstructed from palynological analyses and a comparison to instrumental records. Quaternary Interna-tional 150: 52–70.
Leroy SAG, Marret F, Gibert E et al. (2007) River inflow and salinity changes in the Caspian Sea during the last 5500 years. Quaternary Science Reviews 26: 3359–3383.
Leroy SAG, Tavakoli V, Habibi P et al. (2011) Late Little Ice Age palaeoenvironmental records from the Anzali and Amirkola Lagoons (south Caspian Sea): Vegetation and sea level changes. Palaeogeography, Palaeoclimatology, Palaeoecol-ogy 302: 415–434.
Leroy SAG, Warny S, Lahijani HAK et al. (2010) The role of geosciences in the mitigation of natural disasters: Five case studies. In: Beer T (ed.) Geophysical Hazards. Dordrecht: Springer, pp. 115–147.
Magaritz M, Kaufman A and Yaalon DH (1981) Calcium carbon-ate nodules in soils: 13O/16O and 13C/12C ratios and 14C con-tents. Geoderma 25: 157–172.
Mann ME, Zhang Z, Rutherford S et al. (2009) Global signatures and dynamical origins of the Little Ice Age and Medieval Cli-mate Anomaly. Science 326: 1256–1260.
Marret F, Leroy SAG, Chalié F et al. (2004) New organic-walled dinoflagellate cysts from recent sediments of Central Asian seas. Review of Palaeobotany and Palynology 129: 1–20.
Mazzullo JM, Meyer A and Kidd R (1988) New sediment classifi-cation scheme for the Ocean Drilling Program. In: Mazzullo JM and Graham AG (eds) Handbook for Shipboard Sedimen-tologists (ODP technical notes no. 8). College Station, TX: Ocean Drilling Program, Texas A&M University, pp. 45–67.
Molavi-Arabshahi M, Arpe K, Leroy SAG et al. (in press) Pre-cipitation and temperature of the Southwest Caspian Sea dur-ing the last 56 years, their trends and teleconnections with large-scale atmospheric phenomena. International Journal of Climatology.
Mostowfi H (1999) Noz’hat Al-Gholub. Qazvin: Taha Publica-tion.
Naderi Beni A, Lahijani HAK, Harami RM et al. (2013a) Caspian Sea level changes during the last millennium: Historical and geological evidences from the south Caspian Sea. Climate of the Past 9: 1645–1665.
Naderi Beni A, Lahijani HAK, Harami RM et al. (2013b) Devel-opment of spit–lagoon complexes in response to Little Ice Age rapid sea-level changes in the central Guilan coast, South Caspian Sea, Iran. Geomorphology 187: 11–26.
Oldfield F (1991) Environmental magnetism – A personal per-spective. Quaternary Science Reviews 10(1): 73–85.
Ozyavas A, Khan SD and Casey JF (2010) A possible connection of Caspian Sea level fluctuations with meteorological factors and seismicity. Earth and Planetary Science Letters 299(1): 150–158.
Reimer PJ, Bard E, Bayliss A et al. (2013) IntCal13 and Marine13 radiocarbon age calibration curves 0–50,000 years cal BP. Radiocarbon 55: 1869–1887.
Rucevska I, Herberlin C, Rekacewicz P et al. (2006) Vital Cas-pian Graphics: Challenges beyond Caviar. Arendal: UNEP/GRID.
Ruddiman WF (2008) Earth Climate, past and Future. New York: W.H. Freeman.
Rychagov GI (1997) Holocene oscillations of the Caspian Sea, and forecasts based on palaeogeographical reconstructions. Quaternary International 41: 167–172.
Seighali N, Ghomi M, Zaker S et al. (2011) Medicinal plants diversity in the flora of Langaroud of Iran. Advances in Envi-ronmental Biology 5: 413–417.
Setudeh M (1970) Historical Geography of Langarud, in Anon-ymous from Astara to Astarabad. Tehran: Society for the Appreciation of Cultural Works.
Thompson R and Morton DJ (1979) Magnetic susceptibility and particle-size distribution in recent sediments of the Loch Lomond drainage basin, Scotland. Journal of Sedimentary Research 49(3): 801–812.
USDA (2015) http://www.pecad.fas.usda.gov/cropexplorer/global_reservoir (accessed 10 February 2015).
Varushchenko S, Varushchenko A and Klige R (1987) Changes in the Regime of the Caspian Sea and Closed Basins in Time. Moscow: Nauka (in Russian).
Yim WS, Huang G and Chan LS (2004) Magnetic susceptibility study of Late Quaternary inner continental shelf sediments in the Hong Kong SAR, China. Quaternary International 117(1): 41–54.
Zohary M (1973) Geobotanical Foundations of the Middle East. Stuttgart: G. Fischer Verlag.
at Brunel University London on January 4, 2016hol.sagepub.comDownloaded from
16 The Holocene 26(1)
Appendix 1
Figure 9. Concentration of macro-remains >500 µm.
at Brunel University London on January 4, 2016hol.sagepub.comDownloaded from


![with the financial support of - AQUA-TNET · Web view[Abstract] [Full Text] [Supplemental material] [Reprints and Permissions] Random Mutagenesis of Clostridium cellulolyticum by](https://img.pdfslide.us/doc/110x75/5e766ee47bb4e1539578e572/with-the-financial-support-of-aqua-web-view-abstract-full-text-supplemental.jpg)