Embed Size (px)
Citation preview

Reprint 606
Use of GPS Signal Delay for Real-time Atmospheric
Water Vapour Estimation and Rainfall Nowcast in Hong Kong
P.W. Li, X.Y. Wang*, Y.Q. Chen* & S.T. Lai
The First International Symposium on
Cloud-prone & Rainy Areas Remote Sensing,
Chinese University of Hong Kong, 6-8 October 2005
* Hong Kong Polytechnic University

USE OF GPS SIGNAL DELAY FOR REAL-TIME ATMOSPHERIC WATER VAPOUR ESTIMATION AND RAINFALL NOWCAST IN HONG KONG
P.W. Li*, X.Y. Wang� , Y.Q. Chen� and S.T. Lai *
*Hong Kong Observatory, 134A Nathan Road, Kowloon, Hong Kong � Department of Lands Surveying and Geo-Informatics, Hong Kong Polytechnic University,
Hunghom, Kowloon, Hong Kong [email protected]
ABSTRACT The delay of the Global Positioning System (GPS) signal has high correlation with the water vapour content in the atmosphere. By studying the zenith delay of the GPS data, we can estimate the vertically integrated precipitable water (PWV). As abundant water vapour is a necessary condition for the occurrence of rainstorm, by monitoring the real-time changes of PWV, forecasters can assess the probability of rainstorm and make “nowcasts” for the next couple of hours. In a project jointly undertaken by the Hong Kong Observatory and the Hong Kong Polytechnic University, a software application has been developed for analyzing in real-time the GPS/PWV over a number of local GPS ground receiving stations. The software was put into operational trial at the Central Forecasting Office of the Observatory in the rain season of 2004, with an update frequency of 15 minutes but increased to 10 minutes in 2005, to produce real-time PWV values. This paper discusses the design principles of the software, evaluates its performance in terms of rainstorm nowcasting, and explores further research and development directions.
INTRODUCTION
The water vapour content in the atmosphere is a very important parameter in monitoring the state of the atmosphere. The amount of water vapour can be measured by radiosonde balloon or microwave radiometer. However, as the radiosonde is only available every 6 or 12 hours, it is not an efficient instrument for monitoring moisture changes associated with the rapidly evolving small and mesoscale convective weather systems. While the radiometer can provide continuous measurement, the signals could be very noisy during rainy weather as microwave is absorbed and scattered by raindrops. Furthermore, it is also a rather expensive instrument to operate and can only provide single-point measurement; hence its use in daily operations is rather limited.
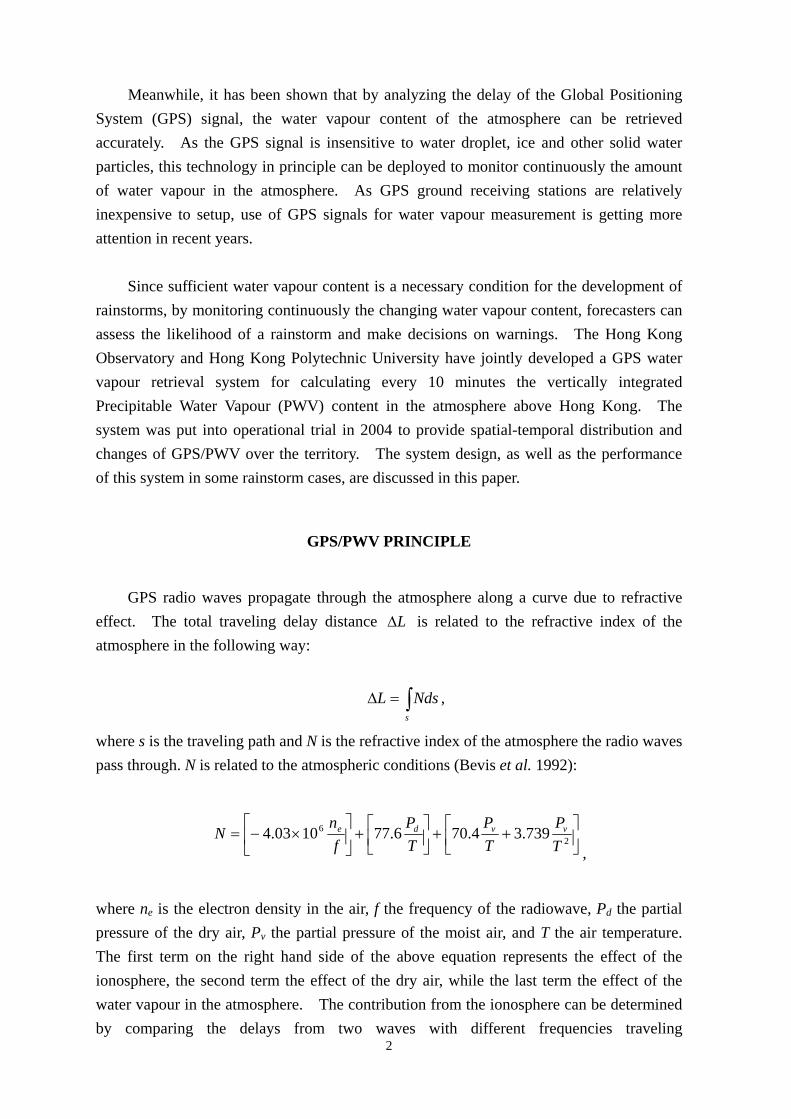
Meanwhile, it has been shown that by analyzing the delay of the Global Positioning System (GPS) signal, the water vapour content of the atmosphere can be retrieved accurately. As the GPS signal is insensitive to water droplet, ice and other solid water particles, this technology in principle can be deployed to monitor continuously the amount of water vapour in the atmosphere. As GPS ground receiving stations are relatively inexpensive to setup, use of GPS signals for water vapour measurement is getting more attention in recent years.
Since sufficient water vapour content is a necessary condition for the development of
rainstorms, by monitoring continuously the changing water vapour content, forecasters can assess the likelihood of a rainstorm and make decisions on warnings. The Hong Kong Observatory and Hong Kong Polytechnic University have jointly developed a GPS water vapour retrieval system for calculating every 10 minutes the vertically integrated Precipitable Water Vapour (PWV) content in the atmosphere above Hong Kong. The system was put into operational trial in 2004 to provide spatial-temporal distribution and changes of GPS/PWV over the territory. The system design, as well as the performance of this system in some rainstorm cases, are discussed in this paper.
GPS/PWV PRINCIPLE
GPS radio waves propagate through the atmosphere along a curve due to refractive
effect. The total traveling delay distance LΔ is related to the refractive index of the atmosphere in the following way:
∫=Δs
NdsL ,
where s is the traveling path and N is the refractive index of the atmosphere the radio waves pass through. N is related to the atmospheric conditions (Bevis et al. 1992):
⎥⎦⎤
⎢⎣⎡ ++⎥⎦
⎤⎢⎣⎡+⎥
⎦
⎤⎢⎣
⎡×−= 2
6 739.34.706.771003.4TP
TP
TP
fn
N vvde
,
2
where ne is the electron density in the air, f the frequency of the radiowave, Pd the partial pressure of the dry air, Pv the partial pressure of the moist air, and T the air temperature. The first term on the right hand side of the above equation represents the effect of the ionosphere, the second term the effect of the dry air, while the last term the effect of the water vapour in the atmosphere. The contribution from the ionosphere can be determined by comparing the delays from two waves with different frequencies traveling
simultaneously through the atmosphere. The contribution from the dry air can be determined by a hydrostatic model (Bevis et al. 1992). By subtracting these two terms from the right hand side of the above equation, we obtain the total wet delay . The total Zenith Wet Delay (ZWD) is related to the total wet delay by the following relation:
wLΔ
θcscwLZWD Δ= ,
where θ is the elevation angle from the zenith direction. By definition, the vertically (z) integrated total precipitable water vapour is related to the water vapour density ρv in the following way
∫= dzPWV vρ .
Bevis et al. (1994) proved that ZWD and PWV have the following relationship
ZWDPWV ×Π= , (1) where the mapping function is given by
⎥⎦
⎤⎢⎣
⎡−+
=Π
123
610
wkkTkR
mvρ
. (2)
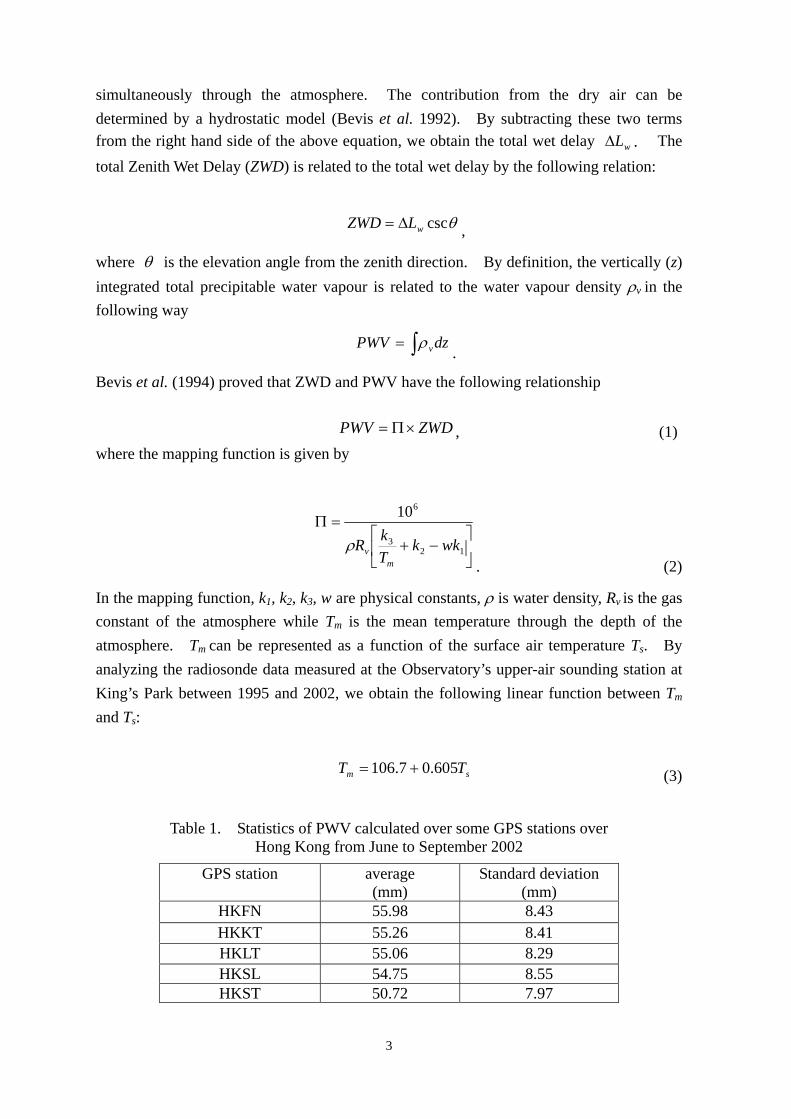
In the mapping function, k1, k2, k3, w are physical constants, ρ is water density, Rv is the gas constant of the atmosphere while Tm is the mean temperature through the depth of the atmosphere. Tm can be represented as a function of the surface air temperature Ts. By analyzing the radiosonde data measured at the Observatory’s upper-air sounding station at King’s Park between 1995 and 2002, we obtain the following linear function between Tm and Ts:
sm TT 605.07.106 += (3)
Table 1. Statistics of PWV calculated over some GPS stations over
Hong Kong from June to September 2002
GPS station average (mm)
Standard deviation (mm)
HKFN 55.98 8.43 HKKT 55.26 8.41 HKLT 55.06 8.29 HKSL 54.75 8.55 HKST 50.72 7.97
3

GPS/PWV REAL-TIME RETRIEVAL SYSTEM
The Lands Department of Hong Kong has been operating a number of dual-frequency GPS ground receiving stations over Hong Kong since 2002. The number of receiving stations has increased from 5 in 2002 to 12 in 2005. The GPS satellite navigational, orbital and meteorological data recorded by the ground receiving stations are transmitted in real-time to the Observatory every 10 minutes. The real-time GPS/PWV retrieval system jointly developed by the Observatory and the Polytechnic University uses the MIT GAMIT package (GAMIT) to pre-process the data and calculate the ZWD. By using Equations (1)-(3), the system calculates every 10 minutes the PWV over each GPS stations and disseminates the results via a webpage to weather forecasters. Figure 1 shows the distribution of the GPS receiving stations over Hong Kong, as well as sample outputs of the time series of GPS/PWV over some of the GPS stations. The reliability of the GPS/PWV is assessed by comparing against the radiosonde data. Figure 2 is the scattered diagram of the GPS/PWV and radiosonde/PWV recorded daily at 00 UTC from June to September in 2002. It can be seen that the GPS/PWV are in general consistent with the radiosonde/PWV, with correlation coefficient as high as 0.93, RMS less than 2.9 mm, results that are similar to other studies (Liou et al. 2001).
Figure 1. Distribution of GPS ground receiving stations over Hong Kong and sample time series of the PWV over some stations (small diagram to the left).
4

Figure 2. GPS/PWV versus radiosonde/PWV (00UTC)
during Jun – Sep 2002.
GPS vs Radiosode PWV
(Jun - Sep 02, HKFN vs 00UTC sonde)
y = 1.0045x
R2 = 0.8825
0
10
20
30
40
50
60
70
80
0 10 20 30 40 50 60 70 80
Radiosonde/PWV (mm)
GP
S/P
WV
(m
m)
RELATIONSHIP BETWEEN GPS/PWV AND RAINFALL
Since the GPS receiving stations are located at different heights above the sea level (varying from 20 to 260 meters), there are systematic differences inherent in the PWV’s derived by these stations, making any direct comparison impractical. To resolve this problem, we have carried out a statistical study on each of the station. Table 1 shows the long-term average and standard deviation (April till September 2002) of the GPS/PWV at individual stations. Results show that most of the GPS stations have average PWV value of around 55 mm, except HKST with only 50 mm. Meanwhile, the associated standard deviations range from 8.0 to 8.5 mm. Based on these statistics, we define a normalized parameter called GPS/PWV anomaly (PWV*) for each station:
PWVPWVPWVPWV δ/)(* −=
where PWV is the long-term averaged value of GPS/PWV and PWVδ the respective standard deviation. The advantage of PWV* is that it not only removes the systematic differences among the stations, but also depicts the changes of PWV with respect to its normal level. A positive value PWV* means that the water vapour is higher than normal while a negative value represents a value below normal. By reading the changes of PWV*, forecasters can readily appreciate whether local water vapour is accumulating or reducing, giving hints to the possibility on intensifying or weakening of rainstorms. 5

By plotting side-by-side the PWV* data with the rainfall data recorded by a raingauge near that station, we can study the correlation between PWV* and rainfall. Data between May and September 2002 are used in this study. In Figure 3, X-axis is the PWV* and Y-axis is the hourly rainfall value recorded at a nearby station. Study results show that under light or moderate rain conditions, PWV* remained at some low values. However, as heavy rainfall occurred (over 30 mm per hour or above), PWV* were generally higher than 1.0. This implies a heightened risk of heavy rain when the water vapour content in the atmosphere increases and exceeds one standard deviation of normal.
Figure 3. The relationship between GPS/PWV anomaly PWV* and hourly
accumulated rainfall. The hatched area in top-right of the figure indicates those cases where accumulated rainfall are over 30 mm.
PERFORMANCE OF THE SYSTEM IN REAL-TIME OPERATIONS
6
Figure 4 shows the PWV* time series and the corresponding 3-km CAPPI radar reflectivity image for a rainstorm case on 8 May 2004. In the evening of 7 May, PWV* increased gradually to 0.8 and 0.9, yet no significant radar echo was found on the radar. However, PWV* kept increasing with time and exceeded 1.0 after midnight as the radar started to pick up more and more intense rain echoes. At 4:00 a.m. HKT (Hong Kong Time), PWV* reached 1.5. Heavy rain with a rate exceeding 30 mm/hr was generally recorded over the territory around that time and the Amber Rainstorm Warning was issued at 4:10 a.m. Meanwhile, PWV* remained at a high level, indicating that water vapour supply remained abundant. PWV* over Shatin (HKST) continued to increase and exceeded 2.0 at around 7 a.m. Less that half an hour later, very heavy rain with a rate exceeding 70 mm/hr was recorded over most parts of the territory, leading to the issuance of the Black Rainstorm Warning. An hour later, PWV* began to drop, the radar echoes dissipated, and surface rainfall moderated gradually.
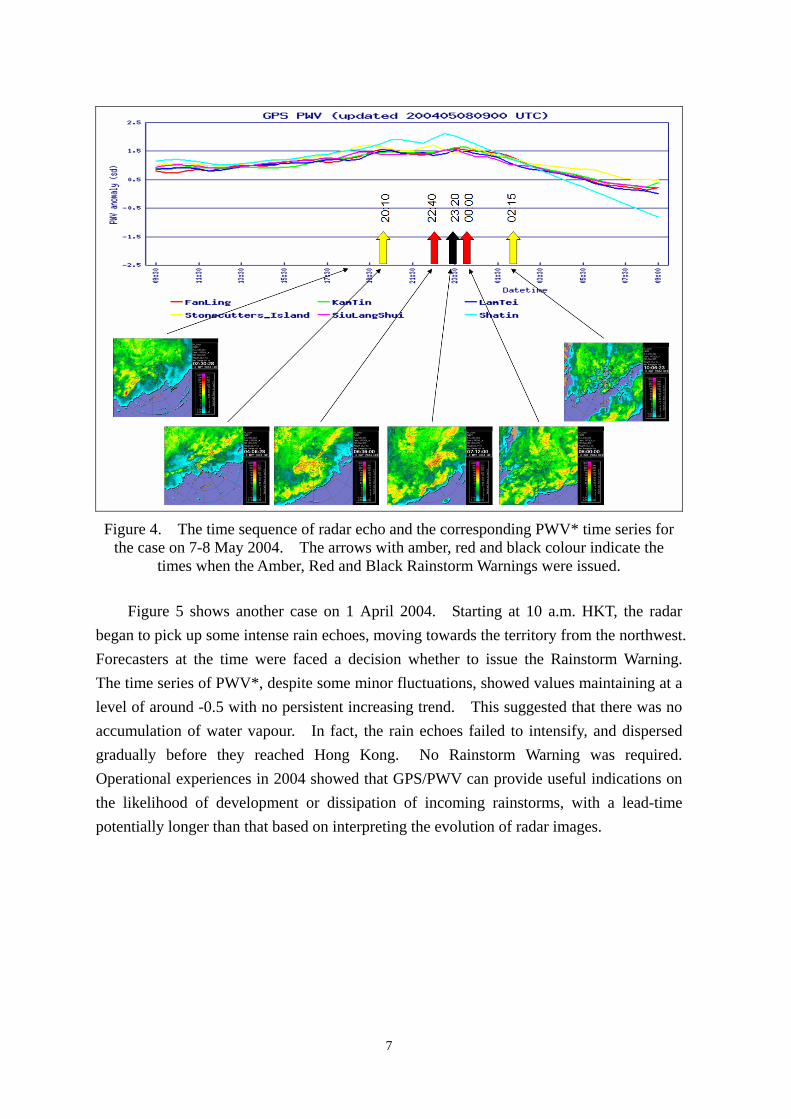
Figure 4. The time sequence of radar echo and the corresponding PWV* time series for the case on 7-8 May 2004. The arrows with amber, red and black colour indicate the
times when the Amber, Red and Black Rainstorm Warnings were issued.
Figure 5 shows another case on 1 April 2004. Starting at 10 a.m. HKT, the radar began to pick up some intense rain echoes, moving towards the territory from the northwest. Forecasters at the time were faced a decision whether to issue the Rainstorm Warning. The time series of PWV*, despite some minor fluctuations, showed values maintaining at a level of around -0.5 with no persistent increasing trend. This suggested that there was no accumulation of water vapour. In fact, the rain echoes failed to intensify, and dispersed gradually before they reached Hong Kong. No Rainstorm Warning was required. Operational experiences in 2004 showed that GPS/PWV can provide useful indications on the likelihood of development or dissipation of incoming rainstorms, with a lead-time potentially longer than that based on interpreting the evolution of radar images.
7

Figure 5. Same legend as in Figure 4 but for the case of 1 April 2004.
CONCLUSIONS
A system to retrieve the PWV information based on the delay of GPS signal was put
into trial operation since 2004. The GPS/PWV values derived are consistent with those derived from radiosonde data. Case studies demonstrate that the data can provide reliable guidance about the development/dissipation of rainstorms in the vicinity of Hong Kong.
It should be pointed out that abundant water vapour in the atmosphere is only one of the
necessary conditions for rainstorm. Other ingredients, including dynamical and thermodynamical mechanisms, are just as important in the occurrence of rainstorms. As such, further development should work towards an assimilation of all such information to develop a more robust and reliable system in the nowcast of rainstorms.
Along this line of thinking, the Observatory and the Hong Kong Polytechnic University
are carrying out another study aiming at a 3-dimensional water vapour retrieval system based on GPS data. These data can then be ingested into numerical weather prediction models to further improve the initial field of water vapour and hence leading to more accurate rainfall forecasts (Seko 2004).
8
9
ACKNOWLEDGEMENT The authors wish to thank Lands Department of Hong Kong for sharing the GPS data, Mr KH Yeung and Dr MC Wong for providing valuable comments to the manuscript. The Project has been supported by HK RGC grant (PolyU A/C BQ-609).
REFERENCES
Bevis, M., S. Businger, T.A. Herring, C. Rocken, R.A. Anthes, and R.H. Ware (1992), GPS Meteorology: Remote Sensing of Atmospheric Water Vapour Using the Global Positioning System. J. Geophys. Research, 97, 15787-15801.
Bevis, M., S. Businger, S. Chiswell, T.A. Herring, R.A. Anthes, C. Rocken and R.H. Ware (1994), GPS Meteorology: Mapping Zenith Wet Delays onto Precipitation Water. J. Appl. Meteor., 33, 379-386.
GAMIT website http://www-gpsg.mit.edu/~simon/gtgk. Liou Y.A., Y.T. Teng, T.V. Hove and J.C. Liljegren (2001), Comparison of
Precipitable Water Observations in the Near Tropics by GPS, Microwave Radiometer, and Radiosondes, J. Appl. Meteor., 40, 5-15.
Seko, H., T. Kawabata, T. Tsuyuki, H. Nakamura, K. Koizumi and T. Iwabuchi (2004), Impacts of GPS-derived Water Vapor and Radial Wind Measured by Doppler Radar on Numerical Prediction of Precipitation, J. Meteor. Soc. Japan, 82, 473-489.