Embed Size (px)
Citation preview
Representation of Change in GIS: From Theory to Practice
Tony Turner, University of Redlands, [email protected], 1200 East Colton Avenue, P.O. Box 3080, Redlands, CA 92373-0999 Tel: 408-230-4449 Fax: 909-793-2029.
Hamid Ekbia University of Redlands, [email protected], 1200 East Colton Avenue, P.O. Box 3080, Redlands, CA 92373-0999 Tel: 909-473-2121 x3127 Fax: 909-793-2029.
0
Abstract Today, GIS have limited capabilities in modeling and visualizing time-varying phenomena such as moving objects, changing shapes and field values. The limits are partly conceptual, partly methodological and partly technical. Conceptually, they derive from the epistemological view of representations as static and passive reflections of a given reality. Methodologically, they are effects of the cartographical view of change as the difference between snapshots, rather than the continual accrual of change from state to state. Technically, they have emerged with the technical origins and transitions of GIS which utilize sequences of tools to apply changes within static collections according to the rules and constraints of geometric, topological, network and relational models rather than dynamic scenes or situations governed by natural law and individual animate pursuit. This presentation explores and demonstrates prototype workarounds that enhance GIS capabilities by drawing upon ideas, techniques and components from agent-based modeling and visualization software, and proposes shifts at the conceptual, methodological and technical levels.
The workarounds and demonstrations presented here are four-dimensional visualizations, representing changes and behaviors of different types of entities such as live creatures, mobile artifacts, features, structures and surfaces, using GIS, agent-based, and animation techniques. We will present examples of change in location, orientation, shape, visual attributes, viewpoint, scale, and speed in applications representing predator-prey, search and destroy, sense and locate and urban sprawl. We discuss the implications of these examples for the representation of change in GIS.
Examples of representation of change in GIS are presented as short movies in a PowerPoint presentation called Kinetic Exhibits.
1. Introduction This paper recasts and extends work done to satisfy requirements for a Masters in Science at the University of Redlands (Turner, 2006). That work set about to discover and experiment with as many aspects of geographic change representation as the author could imagine in a finite period. The initial context emerged in a pair of Michael Goodchild colloquiums and a keynote address (Goodchild, 2003, 2005, 1999). No claim is made here that his remarks were correctly apprehended, or that this paper accurately represents them. Nonetheless, they are very useful.
Goodchild suggested that GIS are entering a period of transition in which people will use GIS to relate to geographic phenomena in increasingly dynamic ways, and that phenomena will be represented in GIS by a more varied array of entity types than today. Many of these entities will be able to change in time.
At some phase in the transition, the perceived relationship of a GIS user to a phenomenon will shift from observation and analysis of one or more given states to that of an interactive participant in a dynamic phenomenon; in effect, the user becomes a pilot. Having envisioned the paradigm, Goodchild named it User-Centric Geographic Cosmology. The name is hard to shorten, or acronymize and still retain the essence of the original. Nonetheless it is uncannily representative of the vision, and worth carrying along for the first part of this paper, where ontological, epistemological and methodological matters are discussed.
1
1.1. Ontology, Epistemology, and Methodology Dynamic natural phenomena are far too complex to represent in any model that runs on a Von Neumann machine. Natural law is applied concurrently and continually to infinitely granular space and time across all space and time: meta-hyperoo parallel processing, even in the tiniest phenomenon imaginable. Models claiming to represent phenomena make gigantic approximations and assumptions. For example, GIS assume that entities don’t change. Transaction processing systems assume that debit credit is sufficient to represent the world’s affairs. Finite particle and element models are severely limited in the numbers of entities, properties, and relationships that are solvable in a finite amount of time. Computer game models represent imagined rather than real phenomena.
GIS, while extendable via workarounds, are stretched thin as temporal and spatial granularity move toward continuity. A map, in concept, is a representation of a state in time. The state can be either a snapshot of the given state, or a confection containing the accumulation of changes to component geographic entities that have occurred over time. A map is, thus, the balance sheet of cartography. In the GIS base model, features in a layer are knit together by geometry and network, and layers by topology. They can be further linked by application rules, some of which are enforced manually. Implementing the transaction model is difficult in GIS. It is possible to make new maps as changes occur, but the process of representing and reconciling a single change is similar to that of making an entire new map layer and map each time. It can be done, but it is like using a steam shovel to pick oranges.
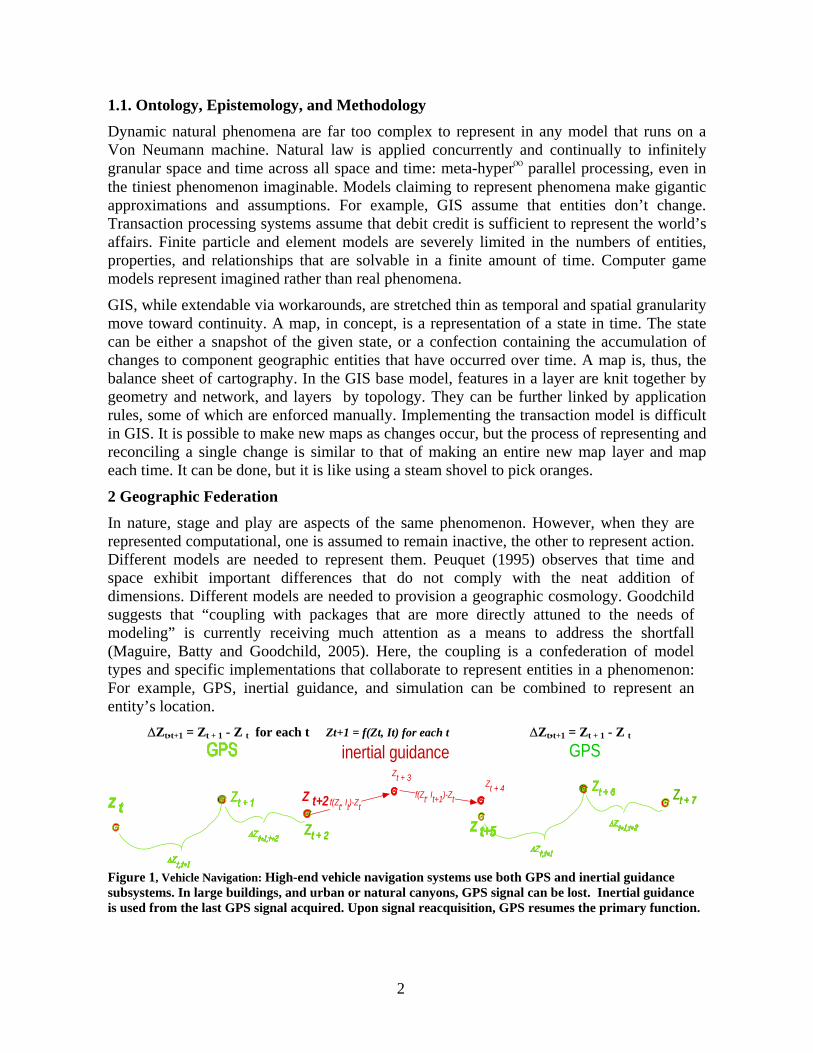
2 Geographic Federation In nature, stage and play are aspects of the same phenomenon. However, when they are represented computational, one is assumed to remain inactive, the other to represent action. Different models are needed to represent them. Peuquet (1995) observes that time and space exhibit important differences that do not comply with the neat addition of dimensions. Different models are needed to provision a geographic cosmology. Goodchild suggests that “coupling with packages that are more directly attuned to the needs of modeling” is currently receiving much attention as a means to address the shortfall (Maguire, Batty and Goodchild, 2005). Here, the coupling is a confederation of model types and specific implementations that collaborate to represent entities in a phenomenon: For example, GPS, inertial guidance, and simulation can be combined to represent an entity’s location. ∆Zt,t+1 = Zt + 1 - Z t for each t Zt+1 = f(Zt, It) for each t ∆Zt,t+1 = Zt + 1 - Z t
Z t+2
Zt + 3 Zt + 4f(Zt, It)-Zt
f(Zt, It+1)-Zt
inertial guidance GPS
Figure 1, Vehicle Navigation: High-end vehicle navigation systems use both GPS and inertial guidance subsystems. In large buildings, and urban or natural canyons, GPS signal can be lost. Inertial guidance is used from the last GPS signal acquired. Upon signal reacquisition, GPS resumes the primary function.
2
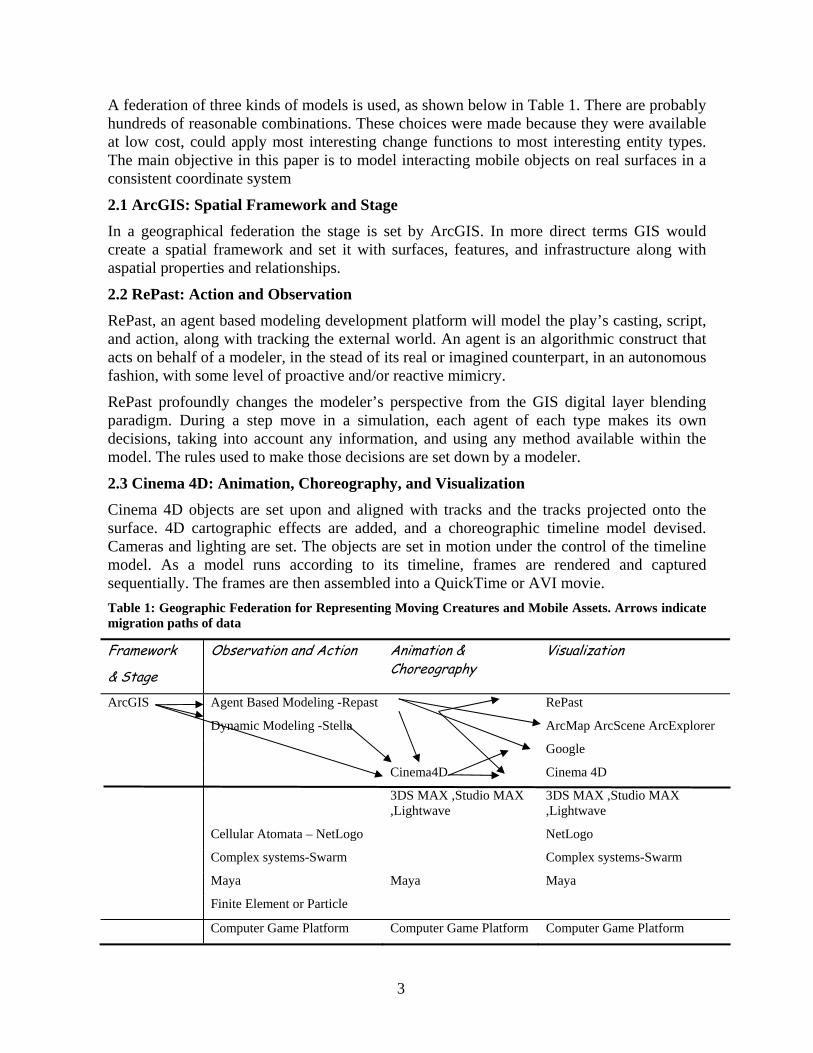
A federation of three kinds of models is used, as shown below in Table 1. There are probably hundreds of reasonable combinations. These choices were made because they were available at low cost, could apply most interesting change functions to most interesting entity types. The main objective in this paper is to model interacting mobile objects on real surfaces in a consistent coordinate system
2.1 ArcGIS: Spatial Framework and Stage In a geographical federation the stage is set by ArcGIS. In more direct terms GIS would create a spatial framework and set it with surfaces, features, and infrastructure along with aspatial properties and relationships.
2.2 RePast: Action and Observation RePast, an agent based modeling development platform will model the play’s casting, script, and action, along with tracking the external world. An agent is an algorithmic construct that acts on behalf of a modeler, in the stead of its real or imagined counterpart, in an autonomous fashion, with some level of proactive and/or reactive mimicry.
RePast profoundly changes the modeler’s perspective from the GIS digital layer blending paradigm. During a step move in a simulation, each agent of each type makes its own decisions, taking into account any information, and using any method available within the model. The rules used to make those decisions are set down by a modeler.
2.3 Cinema 4D: Animation, Choreography, and Visualization Cinema 4D objects are set upon and aligned with tracks and the tracks projected onto the surface. 4D cartographic effects are added, and a choreographic timeline model devised. Cameras and lighting are set. The objects are set in motion under the control of the timeline model. As a model runs according to its timeline, frames are rendered and captured sequentially. The frames are then assembled into a QuickTime or AVI movie. Table 1: Geographic Federation for Representing Moving Creatures and Mobile Assets. Arrows indicate migration paths of data
Framework
& Stage
Observation and Action Animation & Choreography
Visualization
ArcGIS Agent Based Modeling -Repast RePast
Dynamic Modeling -Stella ArcMap ArcScene ArcExplorer
Cinema4D Cinema 4D
3DS MAX ,Studio MAX ,Lightwave
3DS MAX ,Studio MAX ,Lightwave
Cellular Atomata – NetLogo NetLogo
Complex systems-Swarm Complex systems-Swarm
Maya Maya Maya
Finite Element or Particle
Computer Game Platform Computer Game Platform Computer Game Platform
3
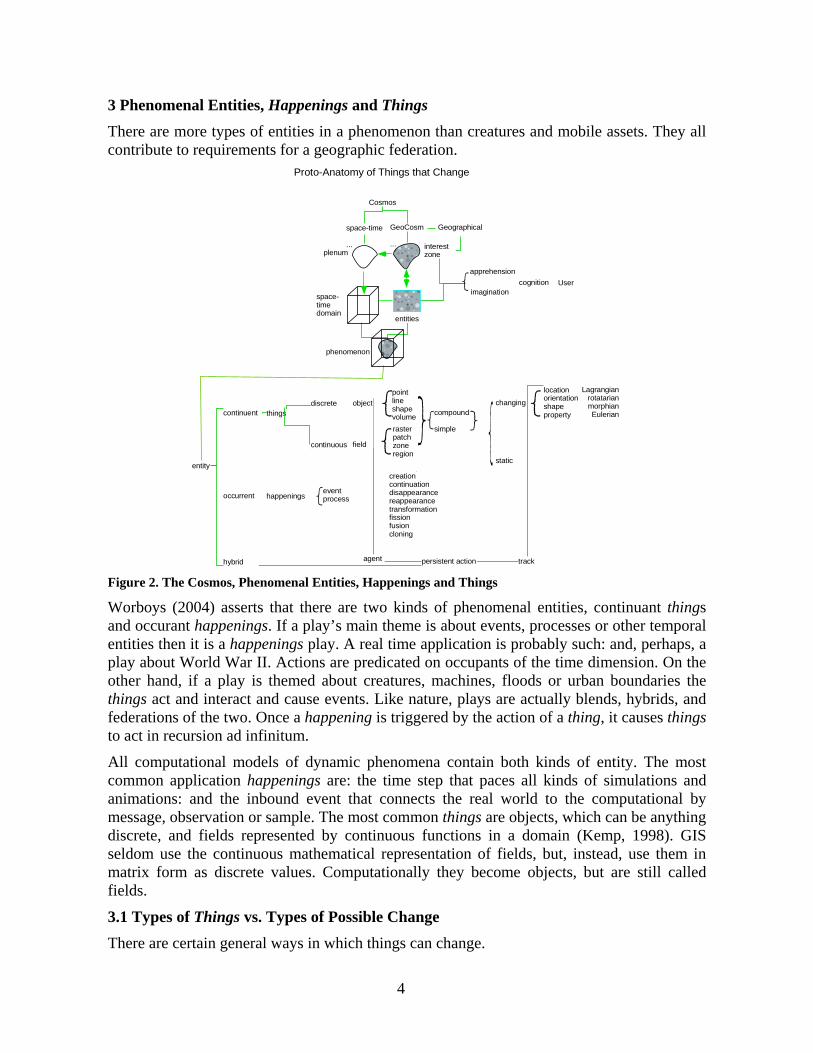
3 Phenomenal Entities, Happenings and Things There are more types of entities in a phenomenon than creatures and mobile assets. They all contribute to requirements for a geographic federation.
things
happenings
continuent
occurrent
hybrid
entity
object
field
discrete
continuous
eventprocess{
changing
static
pointlineshapevolume
persistent action
rasterpatchzoneregion
{{
locationorientationshapeproperty{
LagrangianrotatarianmorphianEulerian
Proto-Anatomy of Things that Change
compound
simple{ }
creationcontinuationdisappearancereappearancetransformationfissionfusioncloning
Cosmos
space-time
...plenum
entities
imagination
interestzone
space-timedomain
apprehension
{ cognition
GeoCosm
...
User
Geographical
phenomenon
trackagent Figure 2. The Cosmos, Phenomenal Entities, Happenings and Things
Worboys (2004) asserts that there are two kinds of phenomenal entities, continuant things and occurant happenings. If a play’s main theme is about events, processes or other temporal entities then it is a happenings play. A real time application is probably such: and, perhaps, a play about World War II. Actions are predicated on occupants of the time dimension. On the other hand, if a play is themed about creatures, machines, floods or urban boundaries the things act and interact and cause events. Like nature, plays are actually blends, hybrids, and federations of the two. Once a happening is triggered by the action of a thing, it causes things to act in recursion ad infinitum.
All computational models of dynamic phenomena contain both kinds of entity. The most common application happenings are: the time step that paces all kinds of simulations and animations: and the inbound event that connects the real world to the computational by message, observation or sample. The most common things are objects, which can be anything discrete, and fields represented by continuous functions in a domain (Kemp, 1998). GIS seldom use the continuous mathematical representation of fields, but, instead, use them in matrix form as discrete values. Computationally they become objects, but are still called fields.
3.1 Types of Things vs. Types of Possible Change There are certain general ways in which things can change.
4
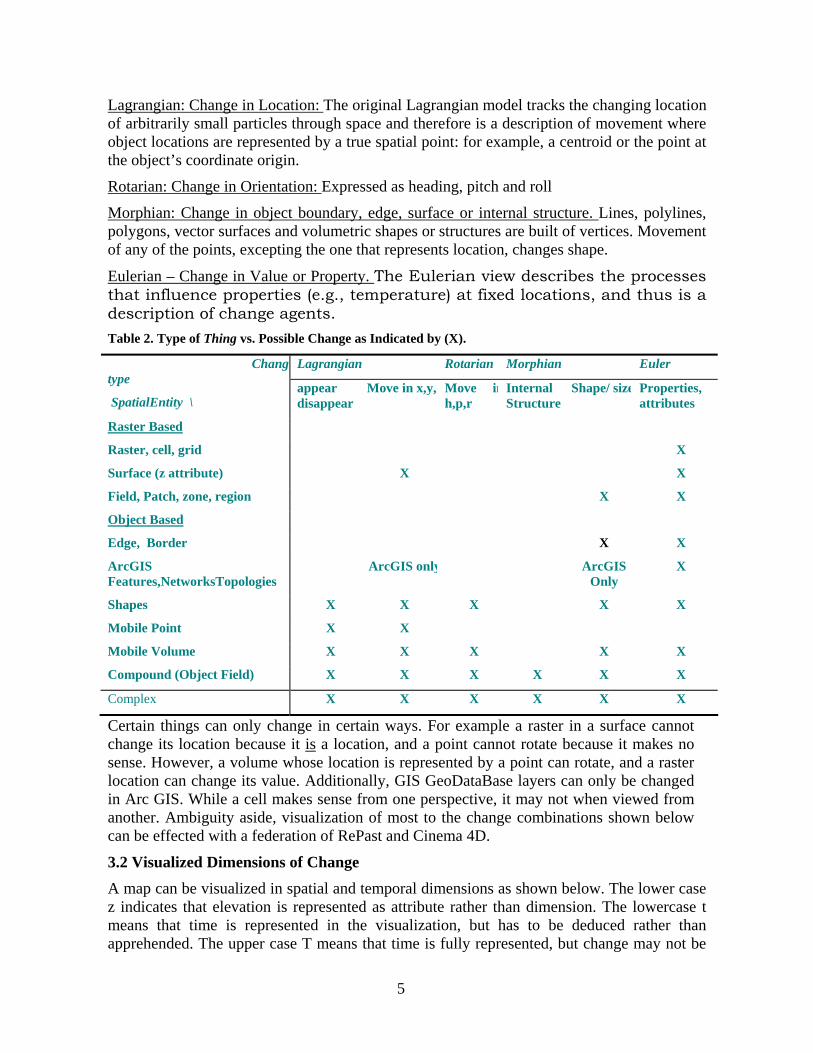
Lagrangian: Change in Location: The original Lagrangian model tracks the changing location of arbitrarily small particles through space and therefore is a description of movement where object locations are represented by a true spatial point: for example, a centroid or the point at the object’s coordinate origin.
Rotarian: Change in Orientation: Expressed as heading, pitch and roll
Morphian: Change in object boundary, edge, surface or internal structure. Lines, polylines, polygons, vector surfaces and volumetric shapes or structures are built of vertices. Movement of any of the points, excepting the one that represents location, changes shape.
Eulerian – Change in Value or Property. The Eulerian view describes the processes that influence properties (e.g., temperature) at fixed locations, and thus is a description of change agents. Table 2. Type of Thing vs. Possible Change as Indicated by (X).
Lagrangian Rotarian Morphian Euler Changetype
SpatialEntity \ appear disappear
Move in x,y,z Move inh,p,r
Internal Structure
Shape/ size Properties, attributes
Raster Based
Raster, cell, grid X
Surface (z attribute) X X
Field, Patch, zone, region X X
Object Based
Edge, Border X X
ArcGIS Features,NetworksTopologies
ArcGIS only ArcGIS Only
X
Shapes X X X X X
Mobile Point X X
Mobile Volume X X X X X
Compound (Object Field) X X X X X X
Complex X X X X X X
Certain things can only change in certain ways. For example a raster in a surface cannot change its location because it is a location, and a point cannot rotate because it makes no sense. However, a volume whose location is represented by a point can rotate, and a raster location can change its value. Additionally, GIS GeoDataBase layers can only be changed in Arc GIS. While a cell makes sense from one perspective, it may not when viewed from another. Ambiguity aside, visualization of most to the change combinations shown below can be effected with a federation of RePast and Cinema 4D.
3.2 Visualized Dimensions of Change A map can be visualized in spatial and temporal dimensions as shown below. The lower case z indicates that elevation is represented as attribute rather than dimension. The lowercase t means that time is represented in the visualization, but has to be deduced rather than apprehended. The upper case T means that time is fully represented, but change may not be
5
readily apprehended due to inadequate choreography. The k subscript indicates that change is kinetic and visually apprehensible. Table 3, Dimensions of Change
Plane Surface Volume
Spatial
Temporal behavior
2D = X,Y plane 2 1/2 D = X,Y + z =attribute surface
3D - X, Y, Z volume
0 static- X,Y ArcMap X,Y + z ArcScene X,Y,Z Cinema 4D
t multiple snapshot X,Y + t ArcMap X,Y + z + t ArcScene X,Y,Z + t Cinema 4D
T action sequence X,Y + T RePast X,Y + z + T TrackingAnalyst on ArcScene
X,Y,Z + T Cinema 4D
Tk- animated sequence inkinetic range
X,Y + Tk Repast X,Y + z + TGeoProcessing, Cinema4D
X,Y,Z + Tk = 4D Cinema4D
4. Model Entities
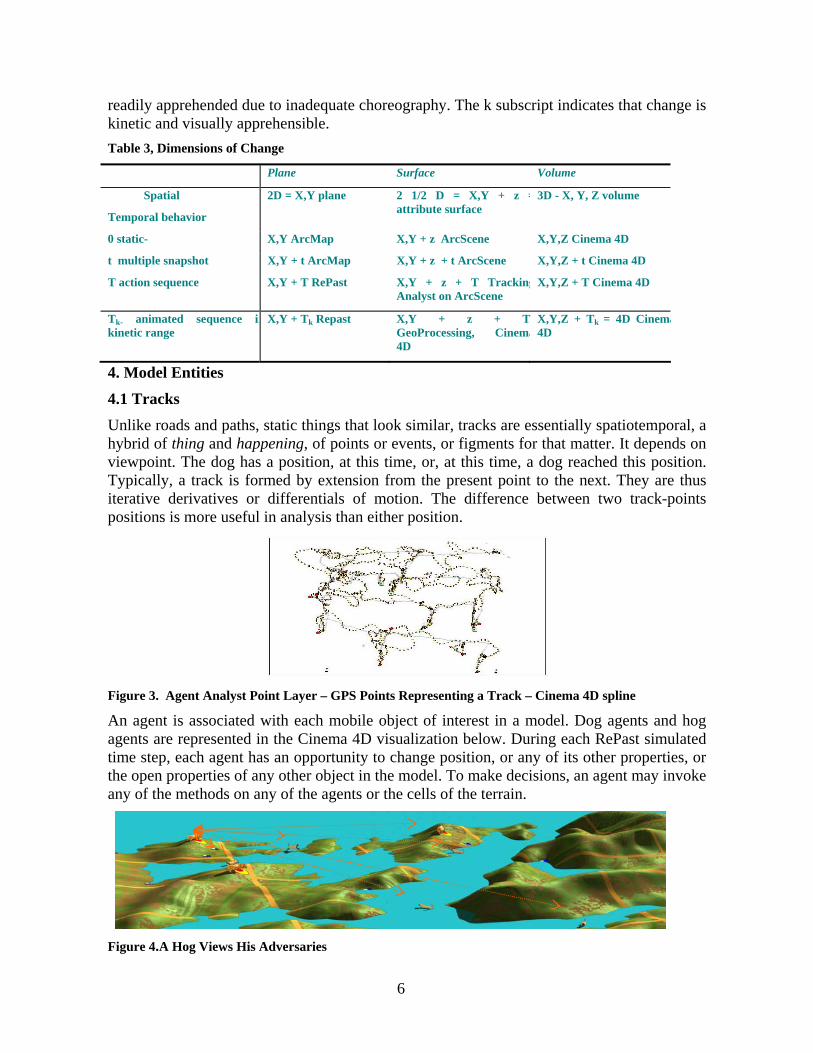
4.1 Tracks Unlike roads and paths, static things that look similar, tracks are essentially spatiotemporal, a hybrid of thing and happening, of points or events, or figments for that matter. It depends on viewpoint. The dog has a position, at this time, or, at this time, a dog reached this position. Typically, a track is formed by extension from the present point to the next. They are thus iterative derivatives or differentials of motion. The difference between two track-points positions is more useful in analysis than either position.
Figure 3. Agent Analyst Point Layer – GPS Points Representing a Track – Cinema 4D spline
An agent is associated with each mobile object of interest in a model. Dog agents and hog agents are represented in the Cinema 4D visualization below. During each RePast simulated time step, each agent has an opportunity to change position, or any of its other properties, or the open properties of any other object in the model. To make decisions, an agent may invoke any of the methods on any of the agents or the cells of the terrain.
Figure 4.A Hog Views His Adversaries
6
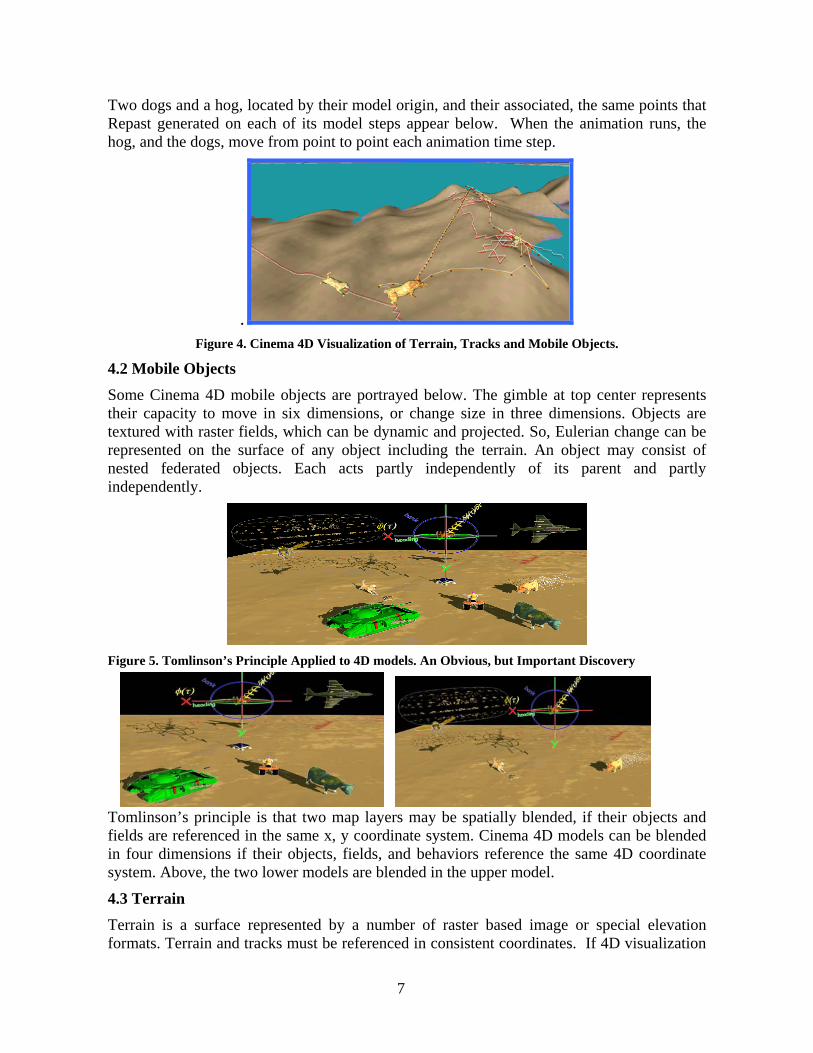
Two dogs and a hog, located by their model origin, and their associated, the same points that Repast generated on each of its model steps appear below. When the animation runs, the hog, and the dogs, move from point to point each animation time step.
.
Figure 4. Cinema 4D Visualization of Terrain, Tracks and Mobile Objects.
4.2 Mobile Objects Some Cinema 4D mobile objects are portrayed below. The gimble at top center represents their capacity to move in six dimensions, or change size in three dimensions. Objects are textured with raster fields, which can be dynamic and projected. So, Eulerian change can be represented on the surface of any object including the terrain. An object may consist of nested federated objects. Each acts partly independently of its parent and partly independently.
Figure 5. Tomlinson’s Principle Applied to 4D models. An Obvious, but Important Discovery
Tomlinson’s principle is that two map layers may be spatially blended, if their objects and fields are referenced in the same x, y coordinate system. Cinema 4D models can be blended in four dimensions if their objects, fields, and behaviors reference the same 4D coordinate system. Above, the two lower models are blended in the upper model.
4.3 TerrainTerrain is a surface represented by a number of raster based image or special elevation formats. Terrain and tracks must be referenced in consistent coordinates. If 4D visualization
7
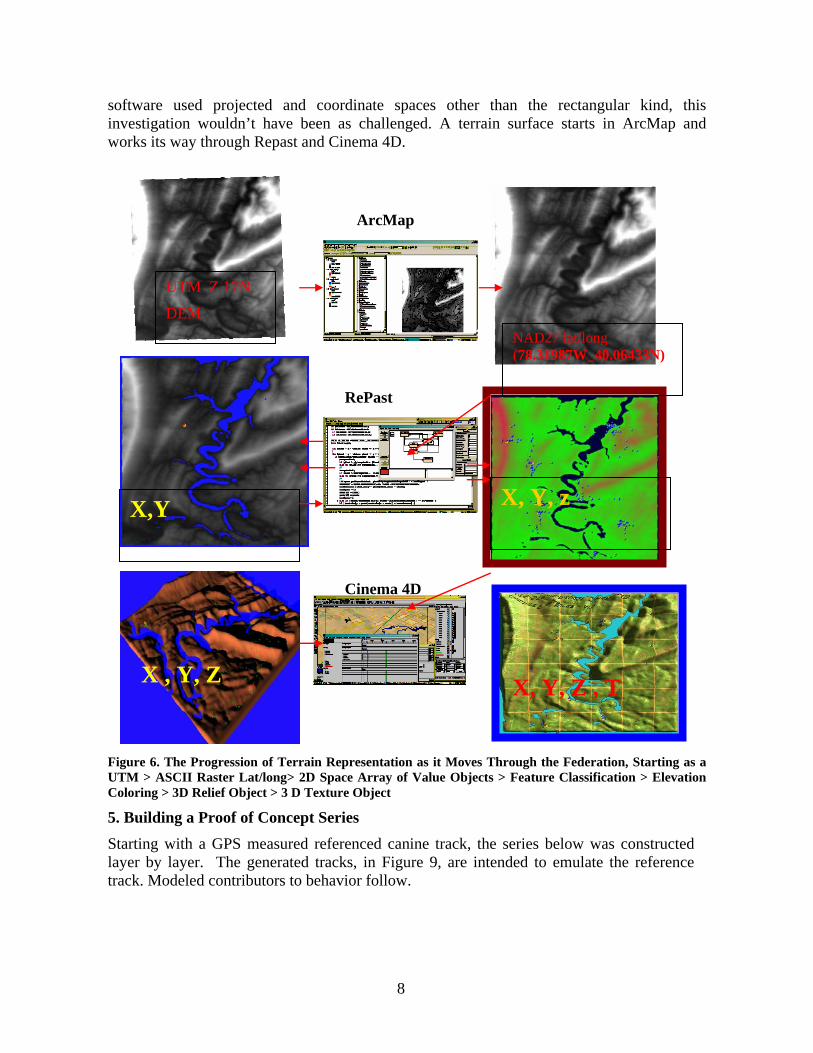
software used projected and coordinate spaces other than the rectangular kind, this investigation wouldn’t have been as challenged. A terrain surface starts in ArcMap and works its way through Repast and Cinema 4D.
X, Y, z X,Y
NAD27 lat/long (78.31987W_40.06433N)
UTM Z 17N
DEM
X, Y, Z , T
FiguUTMColo
5. BStarlayetrack
X , Y, Z
re 6. The Progression of Terrain Rep > ASCII Raster Lat/long> 2D Space
ring > 3D Relief Object > 3 D Texture
uilding a Proof of Concept Serieting with a GPS measured referer by layer. The generated tracks. Modeled contributors to behavi
ArcMap
RePast
Cinema 4D
resentation as it Moves Through the Federation, Starting as a Array of Value Objects > Feature Classification > Elevation
Object
s nced canine track, the series below was constructed , in Figure 9, are intended to emulate the reference
or follow.
8
GPS reference
Random
Derivative
Newtonian
GPS
Derivative
Newtonian
IV Vp Track
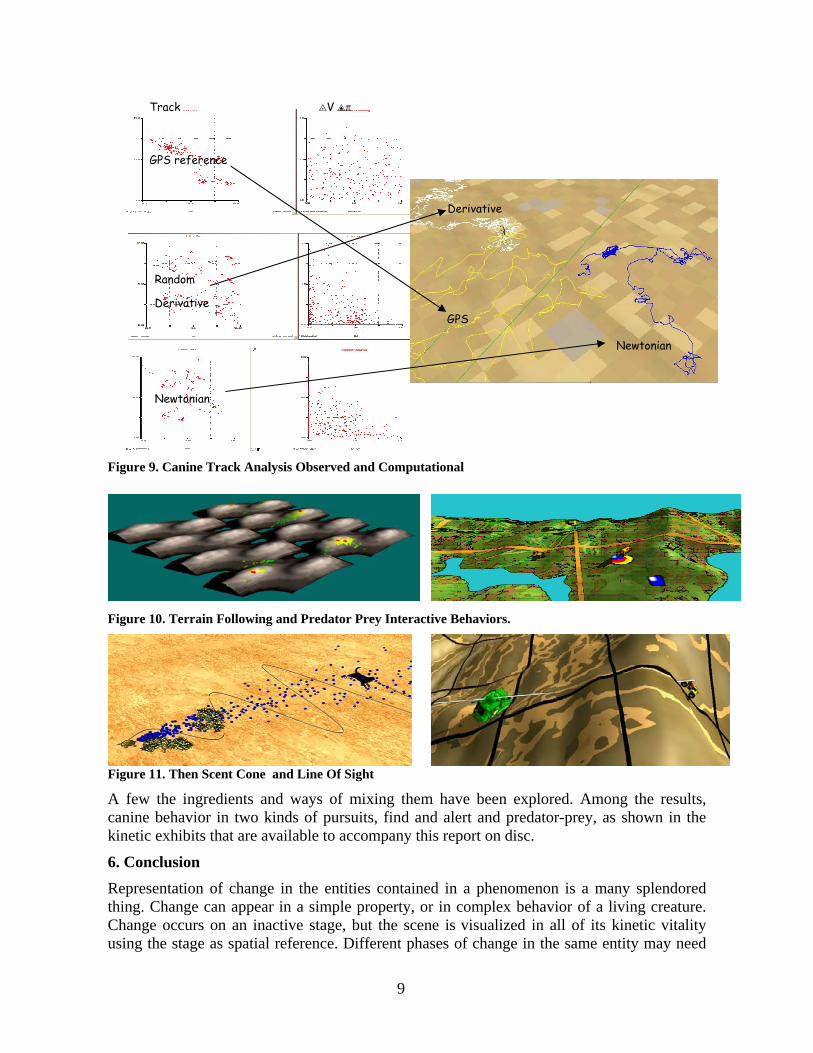
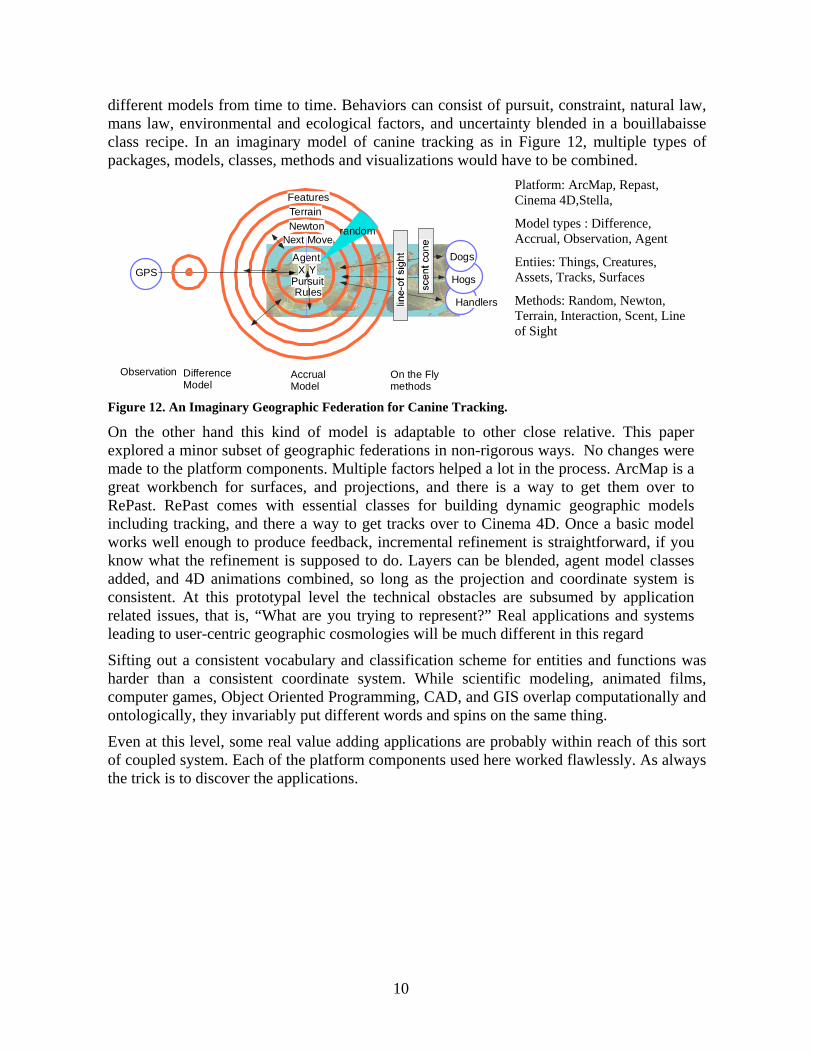
Figure 9. Canine Track Analysis Observed and Computational
Figure 10. Terrain Following and Predator Prey Interactive Behaviors.
g them have been explored. Among the results,
f change in the entities contained in a phenomenon is a many splendored
Figure 11. Then Scent Cone and Line Of Sight
A few the ingredients and ways of mixincanine behavior in two kinds of pursuits, find and alert and predator-prey, as shown in the kinetic exhibits that are available to accompany this report on disc.
6. Conclusion Representation othing. Change can appear in a simple property, or in complex behavior of a living creature. Change occurs on an inactive stage, but the scene is visualized in all of its kinetic vitality using the stage as spatial reference. Different phases of change in the same entity may need
9
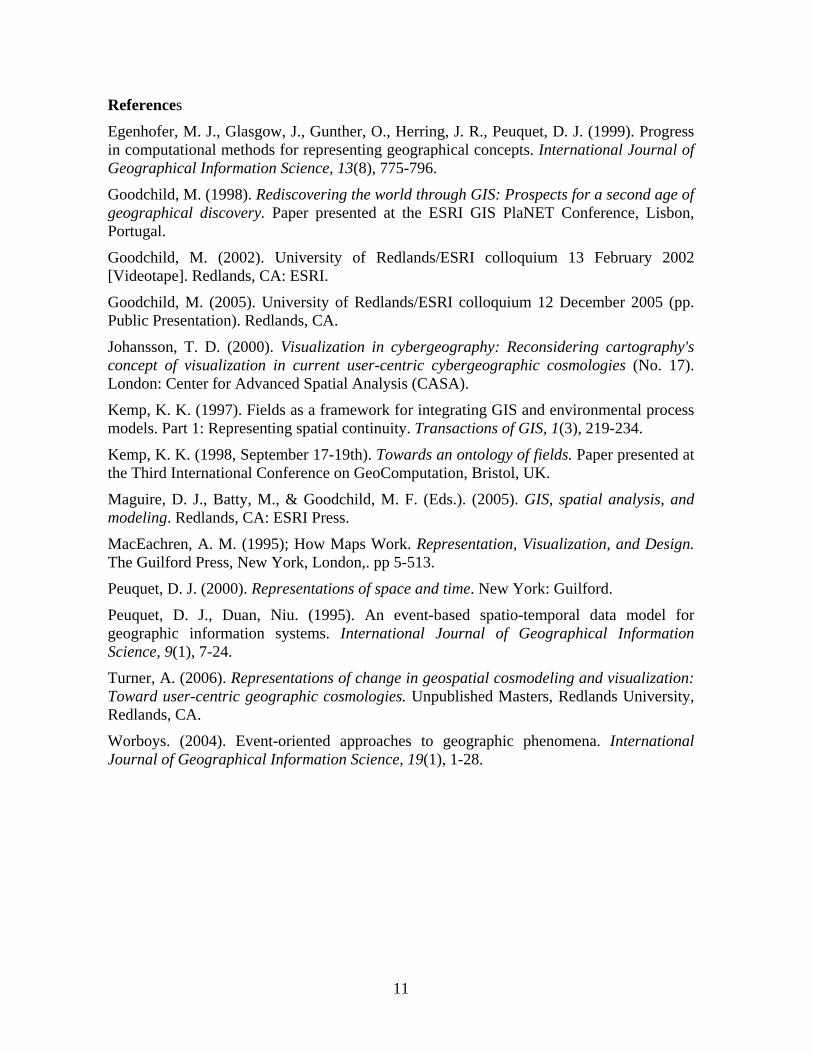
different models from time to time. Behaviors can consist of pursuit, constraint, natural law, mans law, environmental and ecological factors, and uncertainty blended in a bouillabaisse class recipe. In an imaginary model of canine tracking as in Figure 12, multiple types of packages, models, classes, methods and visualizations would have to be combined.
Platform: ArcMap, Repast, Cinema 4D,Stella,
Model types : Difference, Accrual, Observation, Agent
t, Line
Fi .
us ways. No changes were
films,
y. As always
Pursuit
Next Move
AgentX Y
randomNewtonTerrain
Rules
Dogs
Hogs
Handlers
Features
GPS
AccrualModel
On the Flymethods
Observation DifferenceModel
Entiies: Things, Creatures, Assets, Tracks, Surfaces
Methods: Random, Newton, Terrain, Interaction, Scenof Sight
gure 12. An Imaginary Geographic Federation for Canine Tracking
On the other hand this kind of model is adaptable to other close relative. This paper explored a minor subset of geographic federations in non-rigoromade to the platform components. Multiple factors helped a lot in the process. ArcMap is a great workbench for surfaces, and projections, and there is a way to get them over to RePast. RePast comes with essential classes for building dynamic geographic models including tracking, and there a way to get tracks over to Cinema 4D. Once a basic model works well enough to produce feedback, incremental refinement is straightforward, if you know what the refinement is supposed to do. Layers can be blended, agent model classes added, and 4D animations combined, so long as the projection and coordinate system is consistent. At this prototypal level the technical obstacles are subsumed by application related issues, that is, “What are you trying to represent?” Real applications and systems leading to user-centric geographic cosmologies will be much different in this regard
Sifting out a consistent vocabulary and classification scheme for entities and functions washarder than a consistent coordinate system. While scientific modeling, animated computer games, Object Oriented Programming, CAD, and GIS overlap computationally and ontologically, they invariably put different words and spins on the same thing.
Even at this level, some real value adding applications are probably within reach of this sort of coupled system. Each of the platform components used here worked flawlesslthe trick is to discover the applications.
10
References
Egenhofer, M. J., Glasgow, J., Gunther, O., Herring, J. R., Peuquet, D. J. (1999). Progress in computational methods for representing geographical concepts. International Journal of Geographical Information Science, 13(8), 775-796.
Goodchild, M. (1998). Rediscovering the world through GIS: Prospects for a second age of geographical discovery. Paper presented at the ESRI GIS PlaNET Conference, Lisbon, Portugal.
Goodchild, M. (2002). University of Redlands/ESRI colloquium 13 February 2002 [Videotape]. Redlands, CA: ESRI.
Goodchild, M. (2005). University of Redlands/ESRI colloquium 12 December 2005 (pp. Public Presentation). Redlands, CA.
Johansson, T. D. (2000). Visualization in cybergeography: Reconsidering cartography's concept of visualization in current user-centric cybergeographic cosmologies (No. 17). London: Center for Advanced Spatial Analysis (CASA).
Kemp, K. K. (1997). Fields as a framework for integrating GIS and environmental process models. Part 1: Representing spatial continuity. Transactions of GIS, 1(3), 219-234.
Kemp, K. K. (1998, September 17-19th). Towards an ontology of fields. Paper presented at the Third International Conference on GeoComputation, Bristol, UK.
Maguire, D. J., Batty, M., & Goodchild, M. F. (Eds.). (2005). GIS, spatial analysis, and modeling. Redlands, CA: ESRI Press.
MacEachren, A. M. (1995); How Maps Work. Representation, Visualization, and Design. The Guilford Press, New York, London,. pp 5-513.
Peuquet, D. J. (2000). Representations of space and time. New York: Guilford.
Peuquet, D. J., Duan, Niu. (1995). An event-based spatio-temporal data model for geographic information systems. International Journal of Geographical Information Science, 9(1), 7-24.
Turner, A. (2006). Representations of change in geospatial cosmodeling and visualization: Toward user-centric geographic cosmologies. Unpublished Masters, Redlands University, Redlands, CA.
Worboys. (2004). Event-oriented approaches to geographic phenomena. International Journal of Geographical Information Science, 19(1), 1-28.
11