Embed Size (px)
Citation preview

1
repoVizz tutorial
About repoVizz repoVizz1 is an integrated online system capable of structural formatting and remote storage, browsing, exchange, annotation, and visualization of synchronous multi-modal, time-aligned data. Motivated by a growing need for data-driven collaborative research, repoVizz aims to resolve commonly encountered difficulties in sharing or browsing large collections of multi-modal data. At its current state, repoVizz is designed to hold time-aligned streams of heterogeneous data: audio, video, motion capture, physiological signals, extracted descriptors, annotations, et cetera. Most popular formats for audio and video are supported, while CSV formats are adopted for streams other than audio or video (e.g., motion capture or physiological signals). The data itself is structured via customized XML files, allowing the user to (re-) organize multi-modal data in any hierarchical manner, as the XML structure only holds metadata and pointers to data files. Datasets are stored in an online database, allowing the user to interact with the data remotely through a powerful HTML5 visual interface accessible from any standard web browser; this feature can be considered a key aspect of repoVizz since data can be explored, annotated, or visualized from any location or device. Data exchange and upload/download is made easy and secure via a number of data conversion tools and a user/permission management system.
About this tutorial Through this tutorial, the user can familiarize themselves with the procedure of uploading multimodal data to repoVizz. It includes designing a datapack structure, learning the different formats that repovizz is compatible with, generating the datapack, uploading it to repoVizz, visualize it using the html5 web based tool and sharing it with other users. The research leading to the repoVizz results has been partially funded by the European Commission through the SIEMPRE FET Open Project. This tutorial has been produced thanks to the financial support of the TECNIO network of ACC1Ó, the Catalan agency for Competitiveness
1 http://repovizz.upf.edu/

2
1 The toy dataset
This tutorial is accompanied by a “toy example”2, the toy example is a zip file containing a small collection of data with which one can try out the most common operations required for uploading multi-modal data to repoVizz. Inside the toy example, a folder named ToyDataset contains a list of all the data included in the “toy dataset” that can be seen in Table 1; all data originate from a brief string quartet recording (audio, mocap and video).
Category Filename Description
Audio pickup1.wav pickup2.wav pickup3.wav pickup4.wav ambbi.mp3
Pickup recording of violin 1 Pickup recording of violin 2 Pickup recording of viola Pickup recording of cello Ambient recording with binaural stereo microphone
MoCap (marker data) qualisys.tsv Qualisys marker data
MoCap (marker labels) qualisyslabels.txt Qualisys marker labels
Video video.mp4 Frontal video of the entire quartet
Descriptor (repoVizz CSV)
bowdisplacement1.csv bowdisplacement2.csv bowdisplacement3.csv bowdisplacement4.csv
Bow displacement of violin 1 Bow displacement of violin 2 Bow displacement of viola Bow displacement of cello
Annotation (Note segmentation)
segmentation1.notes segmentation2.notes segmentation3.notes segmentation4.notes
Note segmentation (alignment) of violin 1 Note segmentation (alignment) of violin 2 Note segmentation (alignment) of viola Note segmentation (alignment) of cello
Table 1: List of filenames and descriptions for the files inside the toy dataset.
Besides the toy dataset, this tutorial also includes the “toy datapack” (included in the toy example within folder ToyDatapack), it is an example of how these data should look like when they are ready to be uploaded to repoVizz. If you want to learn how to prepare data for upload, continue to the next steps; if not, you can skip directly to section 5 ’Uploading a Datapack to repoVizz’.
2 http://repovizz.upf.edu/misc/ToyExample.zip

3
2 Data formatting and structuring
This section is included for the reader to understand better the structuring of data and have an idea of the kind of data that can be uploaded and visualized in repoVizz. A detailed explanation of the different types of supported data types and it’s corresponding attributes, as well as how the data is organized is explained. For those users that like "to go fast" you can skip to section 3 "Creating an XML structure with the repoVizz Datapack Designer" but you may want to return to this section to resolve some doubts that may arise while following the tutorial or when dealing with other custom data (not the one in the toy dataset). repoVizz data entities are constituted as collections of time-synchronous multi-modal data files (signals or annotations) organized in a tree structure that holds pointers to such files, associated metadata, text-based descriptions, and pointers to supplementary files. The tree structure is implemented by means of a customary XML file, the repoVizz Struct, which is hierarchically formed by different types of nodes with functions ranging from organizing data or holding text descriptions to holding pointers to data files of different types. The logical entity formed by a repoVizz Struct and all files pointed by its nodes is a repoVizz Datapack. A schematic representation of a repoVizz Datapack is found in Figure 0. Color coding is used for the different types of nodes. Further details on node types and data formats is provided in subsequent sections.
Figure 1: (Left) Overview of the repoVizz Struct nodes types and corresponding attributes. (Right) Schematic illustration of a repoVizz Datapack: a tree structure (repoVizz
Struct) in which nodes are used either for describing and organizing data or for holding pointers to data files.
2.1 The repoVizz Struct A repoVizz Struct is a standard XML file that semantically organizes the different data

4
streams that are contained inside a Datapack. A set of nodes (in a tree structure) with their corresponding attributes form a structure where some nodes have pointers to data files and other nodes contain text descriptions. Figure 2 shows a excerpt of a Datapack Struct XML file containing audio and video files. Although a Struct could be manually generated creating a raw XML file, a tool is available ( repoVizz Datapack Designer) to build it using an intuitive graphical user interface (it’s not mandatory but more than recommended using this tool when creating a datapack struct). Instructions on the usage of this tool to create a datapack can be found in section 3.
2.2 Node types and data formats Seven main types of nodes are available: GENERIC, DESCRIPTION, AUDIO, VIDEO, SIGNAL, ANNOTATION, and FILE. The first two are used for structural and description purposes and do not hold pointers to data. The rest of nodes do hold pointers to data, and each node points only to one file. AUDIO, VIDEO, and SIGNAL nodes respectively hold references to audio streams, video streams, and signals other than audio or video. ANNOTATION nodes hold text-based time-referred annotation data, e.g. segmentations or event annotations. For all AUDIO, VIDEO, SIGNAL, and ANNOTATION nodes, it is assumed that all data pointed by them are time-synchronous. FILE nodes can be used to embed any other type of file (documents, images, etc.) that is relevant to the dataset. <ROOT>
<DESCRIPTION Category="Information"
Text="Test Datapack" />
<GENERIC Category="AudioGroup"
Name="Audio Tracks" >
<AUDIO Category="Ambient"
Name="Cardioid microphone"
Filename="ambient.wav"
FRAMERATE="44100.0"
OFFSETTIME="0.0" />
<AUDIO Category="Ambient"
Name="Binaural stereo microphone"
Filename="binaural.wav"
FRAMERATE="44100.0"
OFFSETTIME="0.0" />
</GENERIC>
<GENERIC Category="VideoGroup"
Name="Video" >
<VIDEO Category="HQ"
Name="HQ Video Camera"
Filename="videoHQ.mp4"
OFFSETTIME="0.0" />
</GENERIC>
<GENERIC Category="AnnotationGroup"
Name="Annotations" >
<ANNOTATION Category="EventList"
Name="Note Onsets"
Filename="onsets.csv"
OFFSETTIME="0.0" />
</GENERIC>
<GENERIC Category="BioSignalsGroup"
Name="Bio Signals" >
<SIGNAL Category="EKG"

5
Name="EKG Sensor"
Filename="ekg.wav"
FRAMERATE="240.0"
OFFSETTIME="12.35"
MAXVAL="100.0"
MINVAL="0.0" />
<SIGNAL Category="EMG"
Name="EMG Sensor"
Filename="emg.csv"
FRAMERATE="2000.0"
OFFSETTIME="7.23"
MAXVAL="10.0"
MINVAL="0.0" />
</GENERIC>
</ROOT>
Figure 2: XML file containing an excerpt of a Datapack Struct
Most node types own an attribute called Category and another attribute called Name. While the Name attribute holds text meant to be a placeholder for the user to provide a name for the node, the Category attribute is used as means for (semantic) classification purposes. As an example use of the Category attribute, one might have two SIGNAL nodes respectively containing EEG and EKG time-series, and use the tags “EEG” and “EKG” as their respetive Category attribute. A visual overview of the node types and their attributes is found in Figure 0.
2.2.1 GENERIC nodes GENERIC nodes (white color) constitute the basic building block to organize and structure the data. They do not hold any type of pointer to data files, but can accept any other node type as children. The attributes of a GENERIC node are the following:
• Category. Holds a category tag, which helps in identifying the type or significance of the contents of the node when navigating the data structure. For example, if a GENERIC node is used to group three one-dimensional data streams corresponding to the signals of a 3DOF sensor, a possibility would be to set “3DOF” as Category.
• Name. User-defined text attribute to specify a name for the node.
It is recommended to use GENERIC nodes for (a) grouping nodes that hold the same type of data, (b) grouping nodes that share a semantic or logical characteristic or (c) grouping sub-nodes (each structured by means of a GENERIC node). Below we provide a couple of small conceptual examples, each corresponding to one of the uses just mentioned.
Example 1. If nodes or node groups contained in a GENERIC node hold the same
nature of data (for example, all audio data streams acquired through a microphone array), we recommend to set as Category a tag formed by a word identiying such nature plus the word “Group”, like for instance “AudioGroup,” “VideoGroup,” or “MoCapGroup.” Regarding the Name attribute, one may want to specify peculiarities about the data streams or their acquisition process (e.g., hardware used, etc.).

6
Example 2. If nodes or node groups contained in a GENERIC node share a given
semantic or logic characteristic (for instance, all data corresponding to a given subject in an experiment recording), we recommend to set that characteristic (for instance, “Subject,” “Take,” or “Instrument”) as Category. The Name attribute could contain the details or value of such characteristic (i.e., “Antonio,” “001,” or “violin”).
Although the tags used for the Category attribute can be freely defined by the user, a number of predefined tags are available. A list with currently available categories is made available during the creation of the repoVizz Struct via the repoVizz Datapack Designer as described in Section 3. This applies to all node types.
2.2.2 DESCRIPTION nodes DESCRIPTION nodes (grey color) are nodes whose only purpose is to allow for insertion of user-defined text information at any level in the tree structure. They do not hold any type of pointer to data files, and cannot accept any node as children. The attributes of a DESCRIPTION node are:
• Category. Holds a category tag, as in GENERIC nodes. For example, if a DESCRIPTION node is created to hold information about the manufacturer of the device used to acquire a set of data streams, a possibility would be to set “Manufacturer” as Category.
• Text. User-defined text attribute (longer than the Name attribute present for the rest of node types), meant for embedding any required description or additional information. To follow the manufacturer example, the actual manufacturer would be added as text here.
2.2.3 AUDIO nodes AUDIO nodes (green color) hold audio streams. Each node will point to an audio file. Most popular audio formats (e.g., Microsoft WAVE (PCM), MP3, OGG, or FLAC) are supported, and a maximum of two channels per file are allowed. Only DESCRIPTION or ANNOTATION nodes are allowed as children of AUDIO nodes. The attributes of an AUDIO node are:
• Category. Holds a category tag (idem as above). For example, if an AUDIO node points to an audio file that contains a recording obtained through a cardiod microphone, one may set “Cardiod” as Category.
• Name. User-defined text attribute, idem as in previously described node types.
• Filename. This attribute holds a pointer (text-based) to the audio file. When creating the Struct, this attribute can be set to “Default” if no files are yet available, or setmanually by browsing the file system when using the repoVizz Datapack Designer.

7
• OFFSETTIME. This attribute holds a numerical value (text-based, in decimal format) indicating the offset start time of the audio stream with respect to the Datapack start, the latter assumed to be always 0.0 (seconds). By default, the OFFSETTIME attribute is set to 0.0 (seconds). (not yet implemented)
2.2.4 VIDEO nodes VIDEO nodes (yellow color) hold video streams. Video files (pointed by VIDEO nodes) need to be in one of the formats (compressed or not) supported by latest FFmpeg library3. Only DESCRIPTION or ANNOTATION nodes are allowed as children of VIDEO nodes. The attributes of a VIDEO node are:
• Category. Idem as in AUDIO node. For example, if a VIDEO node points to a video file that contains a thermographic recording, one may set “Thermal” as Category.
• Name. User-defined text, idem as for previously described node types.
• Filename. Pointer to the video file,
• OFFSETTIME. Idem as for AUDIO nodes. (not yet implemented)
2.2.5 SIGNAL nodes SIGNAL nodes (blue color) constitute the most elemental repoVizz data container when it comes to signals that are not audio or video. Each SIGNAL node contains a one-dimensional signal stream stored either as a CSV file or in Broadcast Wave Format4, which is an extension of the popular Microsoft WAVE audio format with the addition of an XML header chunk. Data streams in SIGNAL nodes can be at any sample rate. The repoVizz CSV format is recommended for data files within a SIGNAL node because its simplicity, it consists in a text file with comma-separated-values representing all the data samples of the signal with the addition of a header in the first line specifying the sampling rate of the signal (FRAMERATE) plus other optional attributes (OFFSETTIME, MINVAL, MAXVAL). See figure 6 in section 3 for an example of a repoVizz CSV file.
When using BWF files, the data values need to be linearly normalized between 1 and 1 and the XML chunk is used for storing metadata associated with each file. In repoVizz,
some attributes are stored within the XML chunk: OFFSETTIME, FRAMERATE, MINVAL, MAXVAL. These attributes coincide wih those included as part of SIGNAL nodes. The advantage of using a binary format like BWF is that while memory requirements are reduced with respect to CSV, time seeking is allowed and can be opened by many audio editors (only for visualization) and also by numerical computing softwares like PyLab,
3 http://www.ffmpeg.org/ 4 http://tech.ebu.ch/docs/tech/tech3285.pdf

8
Octave or Matlab. The repoVizz portal offers tools for converting back and forth between BWF, CSV, and Matlab/Octave arrays. Internally, after uploading the data to repoVizz, it transparently converts all data streams to BWF for efficiency reasons. So there is no need by the user to upload data in BWF format to improve efficiency.
Only DESCRIPTION or ANNOTATION nodes are allowed as children of SIGNAL nodes. The attributes of a SIGNAL node are:
• Category. Idem as above. For example, if a SIGNAL node points to a data file containing an EEG time series, one may set “EEG” as Category.
• Name. Idem as for previously described node types.
• Filename. Pointer to the CSV or BWF file, idem as for previously described node types.
• OFFSETTIME. Idem as for previously described node types. (not yet implemented)
• FRAMERATE. Frame rate (Hz); can be non-integer. This attribute is used in repoVizz
for data visualization and processing. This attribute can be left to “Default”, as it will be automatically filled by the repoVizz Datapack Designer by reading the XML chunk or the CSV header at the time of loading the BWF file, or (alternatively) in the server when uploading a Datapack.
• MINVAL. Lower bound used when normalizing (linearly) the data; can be non-integer.
This attribute is used in repoVizz for data visualization and processing. This attribute can be left to “Default”, as it will be automatically filled by the repoVizz Datapack Designer by reading the XML chunk at the time of loading the BWF file or the CSV header, or (alternatively) calculated in the server when uploading a Datapack.
• MAXVAL. Upper bound used when normalizing (linearly) the data; can be
non-integer. This attribute is used in repoVizz for data visualization and processing. This attribute can be left to “Default”, as it will be automatically filled by the repoVizz Datapack Designer by reading the XML chunk at the time of loading the BWF file or the CSV header, or (alternatively) calculated in the server when uploading a Datapack.
It is common, for instance, to deal with signals that have more than one dimensions by grouping several SIGNAL nodes together. For that case, it is recommended to group the different dimensions through a GENERIC node. A good example of this is the case of working with 3D Motion Capture data, which will be explained in Section 2.2.8.
2.2.6 ANNOTATION nodes ANNOTATION nodes (pink color) hold annotation data in the form of time points and

9
labels forming lists stored in CSV files. ANNOTATION nodes only accept DESCRIPTION nodes as children. The attributes of ANNOTATION nodes are:
• Category. Holds a category tag, with only two choices: “EventList” or “SegmentList”:
– “EventList" refers to event annotations (only one time point per label). The CSV file pointed by the Filename attribute must present a pair <time,label> per line, with <time> expressed in seconds and relative to the beginning of the dataset, or alternatively to the time defined by the attribute OFFSET (described below):
0.22,label_1
1.38,label_2
5.156,label_3
...
– “SegmentList" refers to segment annotations (two time points per label). The CSV file pointed by the Filename attribute must present a trio <startTime, endTime,label> per line, with <startTime> and <endTime> expressed in seconds and relative to the beginning of the dataset, or alternatively to the time defined by the attribute OFFSET (desribed below):
0.22,1.38,label_1
1.38,2.532,label_2
2.532,5.156,label_3
...
There is an special case used for representing musical notes where ".notes" is used as the file extension of the CSV file containing a trio <startTime, endTime,label> per line where label will be a string representing a note name (e.g. A3, C#2, Bb5, etc) and these labels will be taken into account to visualize accordingly in a nice way each note in the repoVizz visualizer.
• Name. Idem as for previously described node types.
• Filename. Pointer to the CSV file, idem as for previously described node types.
• OFFSETTIME. Idem as for previously described node types.
Once annotations are on the server, they can be edited (or even create new ones) via the repoVizz Visualizer (see Section 6).
2.2.7 FILE nodes FILE nodes (orange color) allow to embed any type of additional file into the Datapack.

10
Examples are .PDF, .DOC, or text files providing relevant documentation, images (e.g., pictures related to the data capture), MusicXML files for musical scores, etc. FILE nodes accept DESCRIPTION and ANNOTATION as children. The attributes of a FILE node are:
• Category
Idem as for previously described node types.
• Name
Idem as for previously described node types.
• Filename
Pointer to the actual file. Idem as for previously described node types.
There is one specific use for which may be required to use a FILE node. When working and visualizing 3DOF Motion Capture data, it is often useful to visualize the physical connections (bones or polygons) between the different markers. These connections can be specified in a text CSV file included in the skeleton by means of a FILE node. This is explained below.
2.2.8 Working with 3DOF motion capture data In order to store and appropriately visualize 3DOF MoCap data in repoVizz, it is necessary to structure data in a specific way. 3DOF MoCap data is organized in repoVizz by 3DOF markers and 3DOF marker groups. Some examples of MoCap Data can be the high level skeleton body markers that can be extracted using a low-cost Kinect device or the set of 3DOF markers captured using a Qualisys or Vicon Motion Capture professional devices.
3DOF markers For each 3DOF marker, three SIGNAL nodes need to be used; each for one of the three dimensions X, Y, Z. These three SIGNAL nodes need to be grouped together by means of a GENERIC node with category MoCapMarker. Such a structure, depicted in Figure 3 , needs to fulfill two requirements:
1. The Category and Name attributes of the three SIGNAL nodes need to be set, respectively, to
- Category: X | Name: <ID>
- Category: Y | Name: <ID>
- Category: Z | Name: <ID>,
where <ID> is the identifier or tag used for the 3DOF marker.
2. The Category and Name attributes of the GENERIC node that groups the three SIGNAL nodes need to be set to
- Category: MoCapMarker | Name: <ID>,

11
where <ID> is the identifier or tag of the 3DOF marker.
It is possible to make use of templates in order to speed up the process, or to even use automatic tools (see the repoVizz portal for a utility that can be used to export motion capture data from Qualisys 5 and convert it to a ready-to-use repoVizz Struct). Once the above process has been repeated for all markers, we are ready to store and visualize individual 3DOF markers (see Section 6 for a description of how 3DOF motion capture data is handled in the repoVizz visualizer). However, it is recommended to appropriately group markers so that the handling and visualization of large sets of markers (including marker-marker connections) becomes more handy.
Figure 3: Schematic illustration of the substructure needed for each 3DOF motion capture marker.
3DOF Marker Groups To jointly store and visualize a set of 3DOF markers, it is required to group them by means of a GENERIC node with category MoCapGroup. The attributes of such GENERIC node (which groups any number of GENERIC MoCapMarker nodes) need to be set to
• Category: MoCapGroup | Name: <groupName>,
where <groupName> is the identifier or name given to the group of 3DOF markers. As it happens with individual 3DOF markers, any GENERIC MoCapGroup node is easily visualized (see Section 6).
3DOF Metadata repoVizz offers the possibily to configure the appearance of 3DOF markers and to define marker connections as “bones”. For doing so it is necessary to include, as a first-level child of the GENERIC MoCapGroup node, a FILE node with category MoCapLinks that points to a text file (CSV) with the extension “bones” in which details on colors, sizes, and marker-to-marker connections are specified. The attributes of such FILE MoCapLinks node need to be set to:
5 http://www.qualisys.com

12
• Category: MoCapLinks | Name: <groupName>,
where <groupName> is the identifier or name given to the group of 3DOF markers. The MoCap metadata is specified in a CSV file (“.bones”) where each line must contain one of the following directives (blank linkes are allowed):
Markers
Lines that start with M define the appearance of a marker, identified by its name. They must have the following format:
M,<ID>,<R>,<G>,<B>,(<S>)
Where <ID> is the name of the marker, <R> <G> <B> is its color in RGB format (0 to 255) and <S>, which is optional, is its size, where 1 is the whole scene.
Bones
Bones are connections between pairs of markers, that appear as a line joining them. They must be specified with the following format:
B,<ID_1>,<ID_2>,(<R>,<G>,<B>,(<A>))
Where <ID_1> and <ID_2> are the names of the markers, <R> <G> <B> the color of the bone and <A> its transparency (0 is fully opaque, 255 fully transparent). Transparency or both transparency and color can be omitted.
13
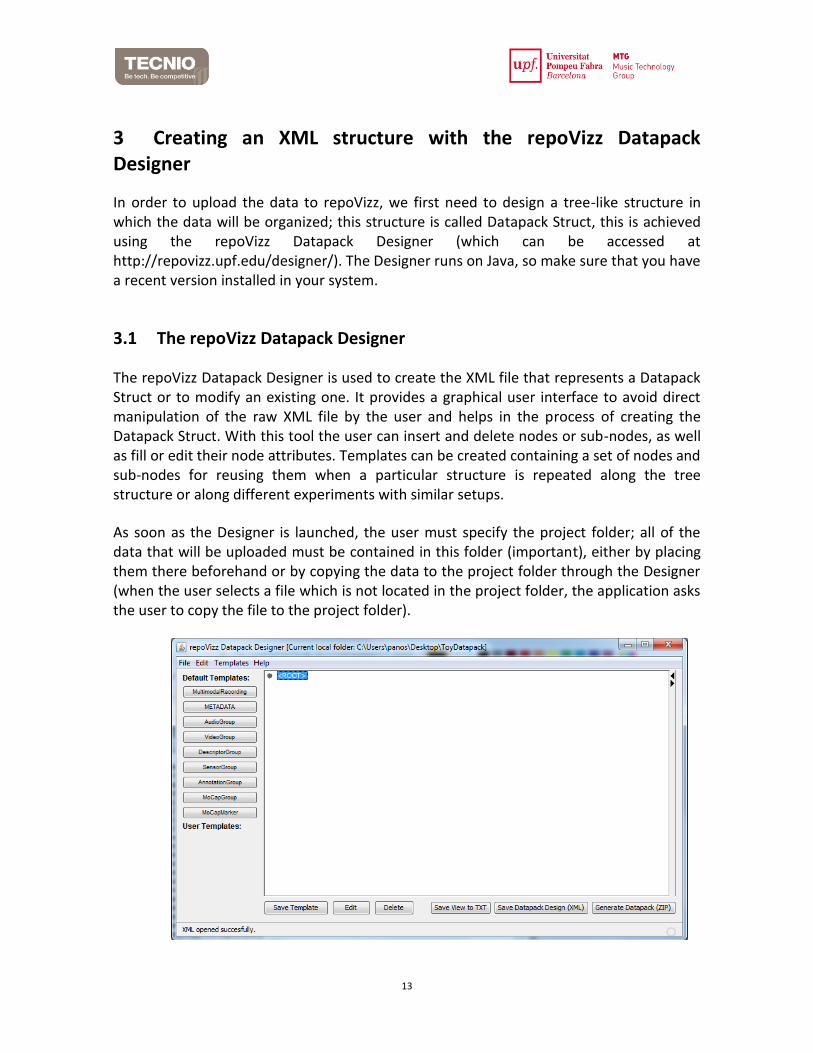
3 Creating an XML structure with the repoVizz Datapack Designer
In order to upload the data to repoVizz, we first need to design a tree-like structure in which the data will be organized; this structure is called Datapack Struct, this is achieved using the repoVizz Datapack Designer (which can be accessed at http://repovizz.upf.edu/designer/). The Designer runs on Java, so make sure that you have a recent version installed in your system.
3.1 The repoVizz Datapack Designer
The repoVizz Datapack Designer is used to create the XML file that represents a Datapack Struct or to modify an existing one. It provides a graphical user interface to avoid direct manipulation of the raw XML file by the user and helps in the process of creating the Datapack Struct. With this tool the user can insert and delete nodes or sub-nodes, as well as fill or edit their node attributes. Templates can be created containing a set of nodes and sub-nodes for reusing them when a particular structure is repeated along the tree structure or along different experiments with similar setups.
As soon as the Designer is launched, the user must specify the project folder; all of the data that will be uploaded must be contained in this folder (important), either by placing them there beforehand or by copying the data to the project folder through the Designer (when the user selects a file which is not located in the project folder, the application asks the user to copy the file to the project folder).

14
Figure 4: The repoVizz Datapack Designer
After choosing a folder, the main window of the Designer is opened (Figure 4). Starting from the main <ROOT> node, the user can add sub-nodes of different types by right clicking on a node and choosing Insert. A selection of different node types will appear from a drop-down menu; for detailed information about each node type and its properties, please see the previous section. Besides adding nodes via the Insert menu option, the user can also copy and paste nodes using either keyboard shortcuts (Ctrl+C and Ctrl+V) or by right-clicking on a node and choosing Copy or Paste. Nodes can also be deleted with the Del key.
An important feature of the Designer is the use of Templates: sub-structures of nodes that correspond to typical arrangements encountered in data collections. As an example, the AudioGroup template consists of a Generic parent node with a couple of Audio nodes. There is a number of built-in templates (found in the left panel of the Designer under the label ’Default templates’), but the user can create and save their own templates. In order to save a new user template, the user must right click on a node (which will serve as the root/parent node for the template) and choose the Save as Template option. This will generate a template (.sut) file in the project folder and add the new template in the left panel under the ’User Templates’ label. For using this user template with future datapacks, the user will need to copy this file to the working folder of each datapack. Finally, the user can manage the existing templates and/or re-scan the project folder for template files via the ’Templates’ option in the menu bar.

15
Figure 5: An example of a structure created for the toy dataset.
Figure 5 shows a finalized datapack structure generated for the toy dataset example provided with this tutorial.
3.2 Data file formats repoVizz is compatible with several different types of data; in this section we’ll go through the main supported data formats (especially for the ones used in the toy dataset). You can refer to the previous section “Data formatting and Structuring” for more details on data formats.
3.2.1 Audio/Video repoVizz supports all audio and video file formats that are compatible with FFmpeg. For a complete list, see http://ffmpeg.org/general.html. The toy dataset contains 4 WAV audios and an MP3 audio that can be found in the Audio Folder and 1 MP4 video file that can be found in the Video Folder.
3.2.2 repoVizz CSV For time series data, the most convenient format is the repoVizz CSV. It is essentially a text file that consists of comma-separated values with an additional header in the first line, specifying the sampling rate of the signal6. Figure 6 shows an example of a repoVizz CSV
6 Besides the sampling rate, the user can optionally specify the minimum and maximum value range for the signal, in order to ensure that the signal will be visualized correctly.

16
file. The toy dataset contains 4 CSV signal files that need to be converted by the user to repoVizz CSV files adding the header line, they can be found in the Descriptor Folder.
Figure 6: An example of a repoVizz CSV file.
In order to create a repoVizz CSV file from scratch, you can simply write your data as a .csv file and manually add the header line; the only mandatory fields of the header line are the repovizz flag in the beginning, and the framerate parameter. The minval and maxval parameters are optional - they can also be specified as properties of the corresponding SIGNAL node in the Designer. If the minimum and maximum values are not specified in neither the .csv header or the node properties, they will be automatically computed on the repoVizz server. It is useful to specify the minval and maxval if you know the range of your data, because these values will be used in the visualizer to define the range of values for each signal y-axis, if you have multiple signals that you might want to visualize together in the same canvas to compare them (using the same scale), then it’s mandatory to specify these parameters, otherwise each signal will be normalized with its current min and max values. There are some things that need to be considered when setting these parameters, maxval needs to be always a positive number and minval needs to be either 0 or -maxval.
3.2.3 3D Motion Capture data There are some built-in templates in the repoVizz Datapack Designer for MoCap data, it’s more than recommended to use these templates when dealing with 3DOF Motion Capture data where you have a set of markers defined by their position in space with X, Y and Z variables. The MoCap templates already define the required structure for a Motion Capture object and its categories:
– The "MoCapMarker" template defines a 3DOF sensor, with its corresponding X, Y and Z signals. Each signal (X,Y,Z) is a SIGNAL node (see section 2.2.5) containing the time series values of each dimension of the position marker.
– The "MoCapGroup" template defines a group of 3DOF sensors, with its

17
corresponding sample markers and the metadata node (MoCapLinks). For more information about the contents of the MoCapLinks FILE node see section 2.2.8 "Working with 3DOF motion caopture data".
The toy dataset contains a TSV file and a TXT file containing MoCap markers and associated metada, they can be found in the MoCap folder. This TSV is the output from a recording of a String Quartet using the “Qualisys Track Manager" motion tracking software, it has been converted to the repoVizz format and the result is included in the ToyDatapack folder inside the toy example. In figure 7, we can see an excerpt of the MoCapLinks file of the MoCapGroup included in the toy example:
M, C7.violin1, 0, 255, 0
M, RSHO.violin1, 0, 255, 0
M, RELB.violin1, 0, 255, 0
M, RWRA.violin1, 0, 255, 0
M, RWRB.violin1, 0, 255, 0
M, RFIN.violin1, 0, 255, 0
M, LSHO.violin1, 0, 255, 0
M, LELB.violin1, 0, 255, 0
M, LWRA.violin1, 0, 255, 0
M, LWRB.violin1, 0, 255, 0
M, LFIN.violin1, 0, 255, 0
M, TFHD.violin1, 0, 255, 0
M, RFHD.violin1, 0, 255, 0
M, LFHD.violin1, 0, 255, 0
...
B, C7.violin1, RSHO.violin1
B, C7.violin1, LSHO.violin1
B, RSHO.violin1, RELB.violin1
B, RELB.violin1, RWRA.violin1
B, RELB.violin1, RWRB.violin1
B, RWRA.violin1, RWRB.violin1
B, RWRA.violin1, RFIN.violin1
B, RWRB.violin1, RFIN.violin1
B, LSHO.violin1, LELB.violin1
B, LELB.violin1, LWRA.violin1
B, LELB.violin1, LWRB.violin1
B, LWRA.violin1, LWRB.violin1
B, LWRA.violin1, LFIN.violin1
B, LWRB.violin1, LFIN.violin1
B, TFHD.violin1, RFHD.violin1
B, TFHD.violin1, LFHD.violin1
B, RFHD.violin1, LFHD.violin1

18
...
Figure 7: Excerpt of a MoCapLinks Node with the name of markers and bones (connections) of a MoCapGroup Node
3.2.4 Annotations Annotation files are text documents, with each line of text representing a single annotation/label with an onset time, (an offset time), and the label itself. There are two different types of annotations:
– “EventList" refers to event annotations (only one time point per label). The file pointed by the annotation node must present a pair <time,label> per line, with <time> expressed in seconds and relative to the beginning of the dataset:
0.22,label_1
1.38,label_2
5.156,label_3
...
– “SegmentList" refers to segment annotations (two time points per label). The file pointed by the annotation node must present a trio <startTime, endTime,label> per line, with <startTime> and <endTime> expressed in seconds and relative to the beginning of the dataset:
0.22,1.38,label_1
1.38,2.532,label_2
2.532,5.156,label_3
...
There is an special case used for representing musical notes (like in the example in the toy dataset) where ".notes" is used as the extension of the file containing a trio <startTime, endTime,label> per line where label will be a string representing a note name (e.g. A3, C#2, Bb5, etc). The note name label will be taken into account to visualize accordingly in a nice way each note in the repoVizz visualizer. The toy dataset contains 4 files containing annotations (note segmentations), they can be found in the Annotation folder.
3.2.5 Binary data (BWF) In addition to the repoVizz CSV format, any time series data can be also written as binary data files, following the Broadcast WAVE format (BWF) specification. A number of Python and MATLAB scripts are available for writing to/reading from a BWF binary file; a detailed

19
list can be found in the repoVizz user manual7 (under construction). For this tutorial we don’t recommend using this format.
7 http://repovizz.upf.edu/SIEMPRERepository/helpindex.jsp

20
4 Generating a datapack
Having created the XML data structure through the Designer, the last step to generating the datapack is linking the nodes containing files inside the structure to the actual data files to be uploaded. This can be achieved by right clicking on the node and choosing Edit Node. Clicking on the ’Filename’ field of the node properties window (Fig. 8) will launch a file browser window through which you can select the file you want to be associated with that node.
Figure 8: Choosing the file path of an AUDIO node.
This procedure must be carried out for all nodes containing a link to a file (FILE, SIGNAL, AUDIO, VIDEO, ANNOTATION). If a node is not yet associated with a file on the disk, or the file can not found in the project folder, a red ’X’ symbol will be shown over the node icon (Fig. 9). For big datapacks with a large number of files we can avoid this manual task by setting the Filename attribute of each node to default and the Datapack Designer will create a unique filename for each file based on the structure of the datapack, then the user can use an external xml parser to get the filenames for each node and rename the data files accordingly before generating the datapack.
Figure 9: AUDIO nodes correctly associated to a file vs. a node that is not yet associated to a file.
Once all the files are linked, the datapack can be generated by clicking on the Generate datapack button. It will create a zip file containing the XML Datapack Struct and all linked files. This zip file is ready to be uploaded to the repoVizz repository.

21
5 Uploading a Datapack to repoVizz
Note: If you skipped the previous chapters and/or just want to use the toy datapack, do the following (please use Chrome web browser):
1. Unzip the toy example to a folder on your computer.
2. Open the repoVizz Datapack Designer (from http://repovizz.upf.edu/designer/) and choose the unzipped ToyDatapack folder as your project folder.
3. Go to File - Open Datapack Design... and choose the file ToyDatapack.xml which is located inside the ToyDatapack folder.
4. Click the Generate Datapack button.
5. Go to http://repovizz.upf.edu/ and login as guest/guest.
6. Select the UPLOAD tab in the menu.
7. Select a folder where you want to upload your datapack into or specify a new name and it will create a new folder, enter a description of your datapack, select wether you want or not to compute audio descriptors on your uploaded audio files and choose the file containing your datapack (.zip).
8. Click on the upload button.
The process will take some time depending on the size of the datapack and the type of files that it contains (audios and videos are slow to process because they need to be converted to a web friendly format). Once this process ends you are ready to browse and visualize the files in the datapack. A message will tell you when the datapack is ready for visualization.

22
6 Visualizing a datapack
To visualize a datapack using the html5 visualizer, do the following (please use Chrome web browser):
1. Go to http://repovizz.upf.edu/ and login as guest/guest.
2. Select the BROWSE tab in the menu.
3. Open the folder where your datapack is located, click on the Datapack that you want to visualize and press the button in the lower part of the screen Show datapack.
4. A window with details of the Datapack (Name, Description, Author, Folder, Duration, Date) will appear.
5. Then click on the button View to open the html5 visualizer.
6. Once the visualizer is opened and the datapack loaded you can drag the nodes in the left Tree (Datapack Struct) to the canvases on the right and the signals are loaded and displayed accordingly.
23
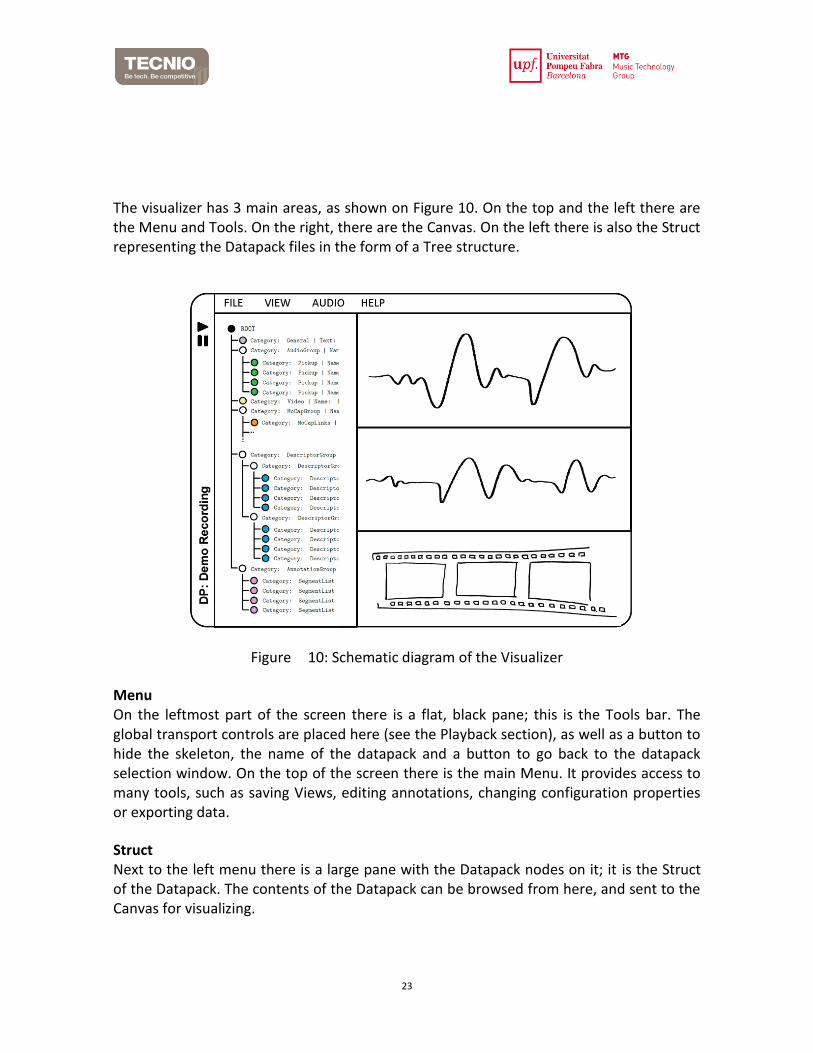
The visualizer has 3 main areas, as shown on Figure 10. On the top and the left there are the Menu and Tools. On the right, there are the Canvas. On the left there is also the Struct representing the Datapack files in the form of a Tree structure.
Figure 10: Schematic diagram of the Visualizer
Menu On the leftmost part of the screen there is a flat, black pane; this is the Tools bar. The global transport controls are placed here (see the Playback section), as well as a button to hide the skeleton, the name of the datapack and a button to go back to the datapack selection window. On the top of the screen there is the main Menu. It provides access to many tools, such as saving Views, editing annotations, changing configuration properties or exporting data.
Struct
Next to the left menu there is a large pane with the Datapack nodes on it; it is the Struct of the Datapack. The contents of the Datapack can be browsed from here, and sent to the Canvas for visualizing.

24
Canvas and Tabs On the right, there are many panes on top of each other; these are the Canvas. The Canvas provide a sort of timelines where data files are actually visualized. The waveform or signal of choice will drawn on one of them, with full zoom and translation support. Each Canvas can hold a number of Tabs, and each Tab corresponds to a file from the Datapack being visualized. Annotations are drawn and edited also from the Canvas.
Floating windows Some files, such as videos or Motion Capture data, are visualized on independent windows, that float on top of the applications and can be dragged freely.
6.1 Browsing the data A common workflow on the visualizer is to drag nodes from the Struct onto a Canvas to open them, and then operate on the Canvas or the created window to explore the data they contain. This exploration can consist of visual exploration, as well as actual synchronous playback of audio and video files. When an area of interest is found, it can be directly shared with anybody through a unique link, or downloaded locally for further analysis.
Navigating the tree The nodes with a plus sign (+) on the left contain children, which can be shown by clicking on the sign or double-clicking anywhere on the node.
Exploring data To visualize the data that nodes contain, drag them to one of the canvas. A new tab will be created, and the data will be attached to it. Only nodes with data associated to them can be dragged (audio, signal, video, annotations, file). Generic nodes that contain MoCap data, which feature a triangle inside the icon, will be opened as MoCap visualizers; other generic nodes will span all of their subnodes in different tabs with different colors.
Context Menu If you right-click on a displayable node (in the tree), a context menu will pop out. There you can select the canvas to send the data to; this can be used for opening, moving and closing tabs. You can also select the color of the signal (or border in the case of floating windows, and the width (thickness) of the signal.
6.2 Playback All nodes with a little triangle on their icon (that is, audio, video and Motion Capture) can be played back. Since the RepoVizz is made for managing amounts of synchronous data, we have carefully designed the playback system so it’s easy to play many streams at the

25
same time and to select which ones to play. There are 3 play modes: local, grouped and global. When a canvas is being played, its play button is substituted by a stop button that starts blinking. Pressing any stop button will globally stop playback.
Local playback With Local Playback, all playable tabs from the canvas being played are reproduced. To play data in local mode, press the play button at the left bottom corner of the desired canvas or press Shift + Space when the mouse pointer is on the desired canvas.
Group playback Below the play button of each canvas there is a chain that allows defining groups of linked canvas. Press Space or press the play button on the main menu to play all linked canvases (that is, all canvases with the green chain). Click on the chain to link or unlink its canvas.
Global playback To play every playback file that is displayed on the canvas, press Control + Space or click the play button on the main menu while holding Shift.
6.3 Navigation In order to increase performance, data is not fully loaded at once but in chunks. The size of the chunks, in seconds, can be specified in the datapack selection window (below the View button). During the visualization, only a chunk of the selected size (in seconds) is available. To load the next or previous one, click on the dark grey arrows that appear at the sides of the canvas. The single arrow jumps “half of the duration of the chunk” seconds and the double arrows jumps to the next or previous starting/ending at the end/beginning of the current chunk. Chunk selection is canvas-wise; each canvas can be on a different chunk, but synchronized canvas always go together.
Canvas Time series data can be zoomed both horizontally and vertically. Scroll the mouse wheel to zoom horizontally, or press the [+]/[-] signs on the right of the scroll bar. Drag the scroll bar to explore within the current chunk of data. To zoom vertically, press Shift while scrolling the mouse or press the [+]/[-] buttons on the top of the scroll bar. Vertical zoom is a bit special; we have carfully designed it to help working with multiple signals at once. The [ALL] tab, which highlights no signal, can be used to establish the global zoom and offset levels. The other tabs allow extra zoom, but the offset is fixed. There are many ways to close a tab. Apart from the tree, tabs can be closed by clicking on the cross that appears on their right when hovering the mouse over them. Floating windows have a cross as well on the top right corner.

26
6.4 3D Motion Capture Data To visualize 3D data (such as the markers from motion capture systems), the user can drag a Generic node containing 3D points inside it into a canvas. 3D points, which are generic nodes with Signal nodes named X, Y and Z inside them, can also be dragged individually. Additional data can be added dragging more nodes into the window that will open and display the points. To skip the animation and load the data a bit faster, press the Ctrl key during the dragging.
The window will be synchronized with the canvas it has been dragged into, as happens with video windows. Navigation through the scene is very easy: pressing the Ctrl key while dragging the mouse rotates the camera and pressing Shift moves it. Scrolling the mouse wheel zooms in and out. To close the window, click on the button that appears on the top right, close the tab that appears on the canvas or set the canvas of main node to none.
6.5 Editing annotations Annotations can be manually created or edited by the user and the changes made can then be commited to the repository. (To save annotations is still experimental so you can

27
expect bugs when saving changes to the server)
Editing existing annotations To edit an existing annotation:
1. Open a datapack in the repoVizz Visualizer.
2. Drag the annotation node that you want to edit/change to a canvas on the right.
3. Make the new annotation node active by clicking on the tab on the top of the canvas where you have dragged the node into. The tab will be highlighted.
4. Now, clicking with the right mouse button on the canvas, a context menu will show up with some options on it. Depending where you click different options will be displayed in the menu.
5. Generic context menu options will allow you to ’Save annotation to server’ and ’Export annotation’ as a text file.
6. If you click outside the boundaries of a segment or event the following additional option will appear: ’Add event/segment’. This option allows to add new event/segments to the current annotation node.
7. If you click inside a segment or on top of an event the following additional options will appear: ’Edit event/segment’ and ’Delete event/segment’. These options allow to change the name of the event/segment or delete them.
8. Mouse hovering the boundaries (dotted lines) of a segment/event annotation will highlight them and if you left click on the boundary (or in the middle of a segment) and move the mouse cursor, the boundaries will be changed and so the start end time of the event/segment annotation.
9. Existing annotations can be saved into the datapack with a different name or overwritting the current annotation.

28
Creating New Annotations To create a new annotation:
1. Open a datapack in the repoVizz Visualizer.
2. Select a parent node (A generic node is recommended) in the left panel (Datapack Struct) where you want to insert the new annotation node.
3. Select the option in the top main menu: File Add node Annotation SegmentList / Event List
4. Choose a name for the new annotation node.
5. The new node will appear in the tree with a red message that says ’(not in server yet)’, now you can drag the new node to a canvas on the right.
6. Make the new annotation node active by clicking on the tab on the top of the canvas where you have dragged the node into. The tab will be highlighted.
7. Now, clicking with the right mouse button on the canvas, a context menu will show with some options on it: ’Add event/segment’, ’Save annotation to server’ and ’Export annotation’ as a text file.
8. Follow the instructions on the previous section ’Editing existing annotations’ (from point 6 onwards).

29
7 Sharing / Downloading a Datapack
There are two ways of exporting data from a datapack; creating a public link to the datapack visualization, or downloading chunks of data to your computer.
7.1 Sharing a Datapack (public link) Users can generate unique URL links that allow other people to directly access the datapack. This is very handy to work collaboratively with remote colleagues, or to put a reference in publications related to the data. The link will open the Visualizer displaying a concrete datapack, enabling an interactive overview of it instead of just displaying static plots or screenshots.
To do so, click on the ’Share’ option of the top main menu and select the “Create shareable link...” menu option. A popup will apperar with the link, that can be copy-pasted wherever needed. The access is granted through a key embedded on the link that gives exclusive access to that individual datapack. The link is only valid while the user that generated it has access to the datapack; if the access is revoked, the link will be automatically disabled.
7.2 Downloading a Datapack When downloading data from repoVizz, there are two options:
• Downloading the entire datapack, or
• Downloading only a specific segment of the datapack
In order to download the entire datapack, the user can either click on the ’Download’ button from the datapack list, or choose one of the two download options available from the ’Share’ menu item on the top main menu of the Visualizer window (Fig. 11). The two available options are either downloading all streams in the datapack or downloading only the streams that are being visualized.

30
Figure 11: Downloading an entire datapack.
Downloading a specific segment from a Datapack is achieved in the following way:
1. Click on one of the canvases on the time point you want to be the start of your downloaded segment and press the ’B’ key on your keyboard.
2. Click on one of the canvases on the time point you want to be the end of your downloaded segment and press the ’E’ key on your keyboard; you’ll notice that this highlights the chosen segment (fig. 12). Notice that the selection boundaries will be quantized to the nearest second.
3. Right-click on the highlighted segment and choose Download segment in the context menu that will appear.
Figure 12: Downloading a specific segment.