Embed Size (px)
Citation preview

CONTENTS
PART A: GENERAL INFORMATION 2Department General Information 3
Glossary of Acronyms 4
Foreword by the Minister 6
Deputy Minister’s Statement 8
Report of the Accounting Officer 10
Statement of responsibility and confirmation of accuracy of the Annual Report 18
Strategic overview 19
legislative and other mandates 20
Organisational structure 21
Entities Reporting to the Minister 22
PART B: PERFORMANCE INFORMATION 23Auditor General’s Report: Pre-Determined Objectives 24
Overview of Departmental Performance 24
Strategic Outcome Oriented Goals 26
Performance Information by Programme 33
Transfer Payments 66
PART C: GOVERNANCE 68Introduction 69
Risk Management 69
Fraud And Corruption 69
Minimising Conflict Of Interest 70
Code Of Conduct 70
Health Safety and Environmental Issues 70
Portfolio Committee 70
Scopa Resolutions 75
Prior Modifications to Audit Reports 75
Internal Control Unit 75
Internal Audit and Audit Committees 75
Audit Committee Report 78
PART D: HUMAN RESOURCE MANAGEMENT 80Overview Of Human Resources 81
Human Resources Oversight Statistics 82
PART E: FINANCIAL INFORMATION 103Report of the Auditor-General 104
Annual Appropriation 108
Notes to the Appropriation Statement 118
Statement of Financial Performance 120
Statement of Financial Position 121
Statement of Changes in Net Assets 122
Cash Flow Statement 123
Accounting Policies 124
Notes to the Annual Financial Statements (including Accounting policies) 128
Annexures 150

PART AGENERAL INFORMATION
Page 3
1. DEPARTMENT GENERAL INFORMATION
Physical Address: Suite 301 Infotech Building 1090 Arcadia Street
Postal Address: Private Bag X15 Hatfield 0028
Telephone Number/S: 027 12 431 1000Fax Number: 027 086 501 2624Email Address: [email protected] Address: www.dpe.gov.za
Page 4
2. GLOSSARY OF ACRONYMS
Below is a glossary of acronyms used in the Department of Public Enterprises.
AFDB African Development Bank
AGM Annual General Meeting
BB-BEE Broad Based Black Economic Empowerment
CAPEX Capital Expenditure
CFO Chief Financial Officer
CS Corporate Services
CSI Corporate Social Investment
CSDP Competitive Supplier Development Programme
DAFF Department of Agriculture, Forestry and Fisheries
DCT Durban Container Terminal
DEA Department of Environmental Affairs
DDG Deputy Director-General
DG Director-General
DHET Department of Higher Education and Training
DM Deputy Minister
DMR Department of Mineral Resources
DOC Department of Communications
DOD Department of Defence
DOE Department of Energy
DOT Department of Transport
DPE Department of Public Enterprises
DRDLR Department of Rural Development & Land Reform
DTI Department of Trade and Industry
EDI Electricity Distribution Industry
EE Economic Equity
EIA Environmental Impact Assessments
EMP Environmental Management Plan
EXCO Executive Committee
FET Further Education and Training
FOSAD Foundations of Security Analysis and Design
FSN Full Services Network
HR Human Resources
ICASA Independent Communications Authority of South Africa
ICT Information and Communication Technology
IGR Inter-Governmental Relations
IP Intellectual Property
Page 5
IPO Initial Public Offering
IPP Independent Power Producers
IRP Integrated Resource Plan
ISMO Independent System and Market Operator
EIPA Economic Impact Policy Alignment
JV Joint Venture
KLF Komatiland Forests
KPI Key Performance Indicator
MISS Minimum Information Security Standards
MOU Memorandum of Understanding
MTEF Medium-Term Expenditure Framework
MYPD Multi-Year Price Determination
NCPM National Corridor Performance Measurement
NDP National Development Plan
NEDLAC National Economic Development and Labour Council
NERSA National Energy Regulator
NGP New Growth Path
NT National Treasury
PAIA Promotion of Access to Information Act
PBMR Pebble Bed Modular Reactor
PFMA Public Finance Management Act
PICC Presidential Infrastructure Coordinating Commission
PPP Public-Private Partnerships
PSJV Pooling and Sharing Joint Venture
PSP Private Sector Participation
R&D Research and development
RMC Richtersveld Mining Company
SAA South African Airways
SAAT South African Airways Technical
SAFCOL South African Forestry Company Ltd
SAQA South African Qualification Authority
SAX South African Express Airways
SCM Supply Chain Management
SIP Strategic Integrated Programme
SLA Service Level Agreement
SOC State Owned Company
SSA State Security Agency
TNPA Transnet National Ports Authority
TOR Terms of Reference
TFR Transnet Freight Rail
WACS West Coast Submarine Cable
Page 6
3. FOREWORD BY THE MINISTER
It is a pleasure to report on the work of the Shareholder Representative and the Department of Public Enterprises in relation to the work of State-Owned Companies (SOC).
In general, while there is much to do, the report features some extraordinary achievements.
The Department of Public Enterprises exists to support the Shareholder Representative in playing her role, performing her duties, exercising her responsibilities and discharging her obligations. In doing so, I require the Department to operate at four levels.• To distil government policy and strategy into
a Shareholder’s Compact, or performance agreement, with each of the Companies and to provide careful, incisive and detailed scrutiny of the way in which each Company performs against the agreed targets.
• To assist and support the Companies to achieve the targets and help remove blockages in their operating environment.
• To undertake interventions to harness the combined capacities and capabilities of all the Companies and other key players to unlock inclusive growth, drive industrialisation, create jobs, develop skills and “deracialise” the economy.
• To join me in engaging other relevant players in the policy and regulatory terrain to obtain certainty and secure the most conducive circumstances for the Companies within which to operate and succeed.
This report reflects the extent to which the Department is already well on its way to deliver against these expectations.
Above all I have expectations for the 2014/15 financial year. For me, it is critical that SOC get the basics right to ensure optimal use of available and limited resources. Those with direct interface with citizens and business must deliver quality, affordable and accessible services consistently.
They must also continue to serve as effective strategic instruments of industrial policy and economic inclusion; contribute substantially towards accelerating and sustaining inclusive economic growth beyond five percent; ensuring much higher levels of employment creation and decent work
Ms. Lynne Brown, MPMinister
Page 7
procurement as a percentage of total spend. This is an exceptionally good performance against the annual target of 70%. Transnet also exceeded the supplier development target.
Skills development is also a critical area in addressing the shortage of artisans. The SOC collectively committed to enrol 2 764 new artisan trainees.
Finally, let me address the issue of funding for Eskom. This SOC needs to adapt to the changing environment and be agile. The long-term resolution of the electricity situation will require, inter alia: • Agreement on what future energy mix is optimal
for the country;• Agreement on the optimal industry structure;• A major boost to capacity to undertake
successful future build programmes; and• Decisions on the extent to which future build
projects will be undertaken by the private sector, if at all.
In conclusion I would like to thank my predecessor, Minister Malusi Gigaba, Deputy Minister, Bulelani Magwanishe, the Director-General, Tshediso Matona, and the dynamic team of Deputy Directors-General and their staff for their unwavering support and dedication to the Department and Government. Their commitment over the past year has contributed to the Department achieving a clean audit.
Ms. Lynne Brown, MPMinister of Public Enterprises
and rapidly reducing inequality, including the deracialisation of the economy as outlined in the National Development Plan.
It is against this background that I challenge SOC to do things differently and become critical role-players in pushing back the triple challenges of poverty, inequality and unemployment.
For me the critical challenges for this year will be to ensure that the build-programme and Transnet’s capital expenditure programme form the core of Government’s infrastructure investment strategy.
Therefore significant achievements are expected with regard to the synchronisation of Medupi’s unit 6; the commissioning of the Sere Wind Farm and Market Demand Strategy that is underwritten by a rolling capital programme of over R312-billion.Another critical challenge is to bring stability to the Boards and thereby ensuring that they are paragons of strong, visionary and strategic leadership and exemplary governance.
Furthermore, the State’s airlines must be restructured to ensure better usage of the taxpayers’ assets. I intend to commission a study of the three airlines, SAA, SAX and Mango, and ensure that by the end of the financial year proper guidelines are in place.It is anticipated that some recommendations of the Presidential Review Commission Report on SOC would be implemented and it is expected that Broadband Infraco will be handed to the Department of Postal Services and Telecommunications and this process should be completed before the end of the financial year.
We have incorporated localization targets into the shareholder compacts of the SOC to ensure that their procurement expenditures advance the industrialization programme of Government.
Eskom’s capital expansion programme continues to support Broad-Based BEE and transformation. The SOC awarded 547 contracts, worth R5.6-billion, during the financial year as part of the capital expansion programme, of which the “local content committed” amounted to R3.1-billion or just under 55% of the contract values.
Another SOC, Transnet achieved 92% local content
Page 8
Mr. Bulelani Gratitude Magwanishe, MP Deputy Minister
4. DEPUTY MINISTER’S STATEMENT
Major strides were made over the past year towards ensuring that SOCs have a meaningful impact on communities through a consolidated Corporate Social Investment (CSI) programme. This follows the Department’s realization that the SOC silo mentality in driving CSI programmes led to duplication of projects, thus resulting in minimal impact.
Through the CSI Forum, we have seen SOCs coming together and agreeing on an integrated CSI programme. The Bhekimfundo Primary School in Mpumalanga is an example of how the broader community benefited from this new approach. SAFCOL built six classrooms using timber-frame structures. Eskom ensured that the school was properly electrified as it is located in a rural area.Transnet used a container structure to provide an office for the school principal and which was adequately furnished by Denel. We are looking forward to SOCs collaborating on more projects beyond the year 2014.
It has been acknowledged that we need more learners to study subjects such as Mathematics and Physical Science. Our contribution has been the installation of the telematics facility in schools identified by SOCs themselves. Two schools in the Eastern Cape and one in Limpopo benefitted from this project and their computer centres were formally opened. We are hopeful that this intervention will go a long way in ensuring that there is improvement in results, particularly, where the two subjects are concerned. More schools have been identified in the other provinces by SOCs through their CSI Foundations. The schools that were visited in the past year also received Maths dictionaries for their libraries. The 2014/15 financial year will allow us to assess the impact of this intervention.
Recently, we held the first CSI Summit at the University of Fort Hare in the Eastern Cape. This summit emanated from the CSI Forum that we launched in 2013. The purpose of the summit was to provide a platform for our SOCs and their suppliers to deliberate on the nuances of CSI. Through this summit, we engaged suppliers and were able to determine how best we can direct both private companies and public companies to collaborate in advancing their respective CSI projects. SOC have
Page 9
been mandated to hold regular meetings with their suppliers to give life to our intention and provide impetus to this CSI programme.
Collaboration was not only confined to SOCs, but included the DPE collaborating with other departments in areas of common interest. Similarly, this is intended to maximise impact in areas where Government intervenes. The former Minister Hon. Malusi Gigaba instructed SOCs to increase the training of more recruits than they can absorb. As a result, we are in discussion with the Department of Cooperative Governance and Traditional Affairs (through their Municipal Infrastructure Support Agency) to develop a concept that will see the mobilization of trained artisans to discharge their services for the benefit of municipalities through the Train of Hope programme. Great progress has been made towards the realization of this vision. We believe this will go a long way in creating employment and ensuring that trainees are absorbed in the mainstream economy.
We have engaged with provinces and municipalities as we endeavor to align our programmes. Out of these, we had Expos for both the youth and the business community. We are confident that the information shared with these sectors will serve to equip them for betterment of themselves and their communities. The engagement included: an information-sharing session with the business community of Nelson Mandela Bay in Port Elizabeth; collaboration with the Ekurhuleni Municipality on youth opportunities; which attracted more than five thousand young people; a session with both business and youth at the Oasis Church and a session with the business community of the King Sabata Dalindyebo Municipality in Umtata. However, we are concerned that we have not been able to ascertain the extent of impact our intervention. Moving forward, we will require a mechanism that will allow us to measure how many youth benefitted from the engagement.
The youth camp with Denel went very well. The 100 learners were exposed to discussions on respect for the flag, national pride and leadership. They were also given insight into the importance of artisan training. The need to have this camp on a continuous basis has been considered and will accommodate all provinces.
I wish to thank the former Minister Hon. Malusi Gigaba for his leadership. I wish to thank the Director General, Mr Tshediso Matona, for management of the Department and the DDGs for always ensuring that we all work towards achieving the goals contained in the vision of the Department.
Mr. Gratitude Magwanishe Deputy Minister of the Department of Public Enterpises
Page 10
Mr. Tshediso MatonaAccounting Officer
5. REPORT OF THE ACCOUNTING OFFICER
5.1 Overview of Performance and Challenges
In 2009, the administration took over during one of the biggest global economic crisis post the 1929 Great Depression. The MTSF prioritised the need to stabilize the economy and push it to a growth path that would deliver better employment outcomes. In this regard, economic infrastructure investment driven by SOCs was identified as a major intervention to turning the economy around.
Since 2010, the economy has turned around and job recovery has begun. This has been a direct result of a number of policy interventions introduced to stabilize the economy, such as the New Growth Path (NGP) and the Industrial Policy Action Plan (IPAP). The NGP recognised the significance of economic infrastructure investment and state ownership in driving the developmental agenda. This was further affirmed in the adoption of the National Development Plan by government in 2013.
Since 2009, there has been increased focus on the role of SOCs to support the objectives and outcomes outlined in the Medium Term Strategic Framework (MTSF). This has required the Department to strengthen its oversight related activities to ensure that SOCs are not only aligned to the government’s objectives, but also play a leading role. The state entities within the Department’s portfolio have been in the forefront in the implementation of the government’s economic strategy that identified infrastructure investment as one of the key job drivers.
During the year under review, the Department continued to support SOCs within its portfolio to ensure that they are financially stable and strongly advocated for a supportive policy framework. A supportive policy framework is crucial to allow SOCs to expand investment in the economy and support other outcomes such as skills development, industrialisation and transformation. The initial assessment of SOCs’ performance during the 2013/14 financial year shows that the upward trend in term of infrastructure investment,
Page 11
skills development and industrialisation through localisation has been sustained.
However, there are some challenges that have affected how the Department executes its mandate. Most of these challenges are structural in nature and will require reform in the current policy landscape to legislate the mandate of the Department.
Furthermore, the Department was established initially as a privatisation and corporatisation office. This reflected the government’s policy to restructure its ownership and participation in the economy. The disposal or privatisation of state assets was also leveraged to encourage participation of the historically disadvantaged in the economy. As an Office, limited resources (both financial and human) were provided to oversee the disposal of the state’s assets. The process of privatisation was largely informed by the need to reduce government debt, as most of the state companies were incurring losses. As the government introduced and implemented transformative policies, the role of SOCs in driving the developmental agenda strongly emerged. As a result, the mandate of the Department has evolved to reflect the change if the policy approach.
The evolution of the mandate has exerted extreme pressure on the capacity of the Department and has exposed some weaknesses in the current operational model. As a government Department, the DPE operates within the Public Service Act and Regulations. This constrains the Department’s ability to effectively compete in the labour market. This has resulted in relatively high staff turnover at senior management level and inability to attract high calibre individuals.
Despite the highlighted challenges, the Department has remained functional with strong institutional structures that oversee implementation and compliance. This has been reflected in the clean audit record achieved by the Department over the past 8 years, with the exception of the 2012/13 external audit, on which the Department achieved an unqualified audit opinion. This was as a result of a
technical error on the Department’s annual financial statements, rather than a collapse of controls.
5.2 2013/14 Litigation Report
Nabera vs Alexkor & Government (represented by DPE)
Nabera instituted legal action against Alexkor and the National Government (represented by the Department of Public Enterprises) in 2004 for amounts (R119m for value addition and R4m for management fees) allegedly owed to Nabera arising from a contract in terms of which Nabera managed Alexkor’s mining assets and operations for a period of two years (1999-2001). Alexkor and the Department opposed the claims and to date Nabera has not set the matter down for hearing. Therefore, the matter is still pending.
Equity Alliance (Pty) Ltd vs Government of RSA
Equity Alliance instituted a claim against Government in April 2009 relating to the purchase of shares from Transnet in 2002. The claim is for R572m. The claim is based on an alleged oral assurance and guarantee said to be given by former officials of the Department, who stated that the ramp handling agreement between Equity Alliance and Airports Company of South Africa (ACSA) would be extended on termination. ACSA did not extend the agreement and consequently, Equity Alliance and the Serco Group instituted legal action claiming to have suffered damages as a result of the termination of the ramp handling agreement. The matter is at the stage of being set down for hearing.
Ronny Mohapi vs Public Enterprises, Trade and Industry and National Treasury
Mr Mohapi approached the Equality Court to complain that Government (represented by Public Enterprises, Trade and Industry and National Treasury) discriminated against him in his endeavour
Page 12
to join Government’s internship programme. He sought to be placed on an internship programme at either National Treasury (NT) or Trade and Industry or, alternatively, receive compensation from Public Enterprises in an amount of R800 000.00. The Department filed an opposing affidavit with the Equality Court in January 2012 and there have been no further developments.
By Choice Caterers vs Department of Public Enterprises
The Plaintiff claimed damages against the Department in an amount of R119 574.60 for alleged breach of contract, or, alternatively, R75 245.70 for alleged loss of profit on 18 November 2009. The Department is defending the matter. The matter was set down for hearing in May 2013, but did not proceed due to unavailability of a presiding officer.
Sable Hills vs Aventura and the Minister of Public Enterprises
Sable Hills (Pty) Ltd instituted action against Aventura, Mikanto Trading and the Minister. Summons was received on 28 June 2011. The claim is for rectification of the sale agreement and transfer of properties allegedly sold by Government and Aventura to Sable Hills in 2002, but later transferred to Mikanto. At the time of the sale, the value of the property was estimated at R18 million.
The relief that Sable Hills seeks is that the Minister and Aventura should be ordered to transfer the properties claimed to Sable Hills. The matter is still pending. However, given that Aventura is currently in liquidation, the matter will be resolved by the liquidator.
Aventura and Government vs Mikanto Properties
Mikanto launched application proceedings in the High Court of South Africa in October 2002, seeking to interdict Aventura from effecting transfer of eight properties to Forever Resorts. The Department and Aventura lodged opposing affidavits. Mikanto did not take the matter any further and Mikanto’s attorneys on record withdrew. Aventura is currently under liquidation; therefore this matter will be resolved by the liquidator.
Phaharpur/Londoloza Consortium vs SAFCOL and the Department
This was a claim that arose in March 2009 for damages against Government and SAFCOL by the Consortium for out-of-pocket expenses in the preparation of a tender, which was subsequently
withdrawn by Government. The parties have reached an out-of-court settlement, resulting in the Phaharpur/Londoloza Consortium withdrawing its claim. Comair vs Public Enterprises, National Treasury, Transport and SAA
Comair brought an application against SAA, and the Ministers of Public Enterprises, NT, and Transport, challenging the granting of a R5 billion Guarantee issued by Government on behalf of SAA. Comair is contending that the granting of such a Guarantee was both unconstitutional and unlawful and that it should therefore be reviewed and set aside. Government and SAA are opposing the matter and the matter is set down for hearing in August 2014.
Vuyisile Kona vs Public Enterprises, SAA and Trade and Industry
Mr Kona is a former Non-Executive Director and Chairperson of SAA, whose services were terminated in February 2013. Mr Kona is challenging the validity of the termination of his services and he seeks that the decision should be reviewed and set aside. The Department is opposing the matter and has filed an answering/opposing affidavit.
Messrs Pretorius and Kruger vs Transnet, Transnet Pension Funds, Ministers of Public Enterprise and Finance and Government of RSA
Messrs Pretorius and Kruger, pensioners of the Transnet Pension Funds, have served the Department with court papers, regarding their intention to bring a class action against Transnet Pension Funds. The applicants are contesting the adequacy of benefits received by pensioners from Transnet Pension Funds. They attribute the alleged inadequacy to mismanagement of such Pension Funds by Transnet, Transnet Pension Funds and Government. The Department is currently seeking the court’s indulgence to oppose the matter. The Minister is the 5th respondent in this matter.
Thompson vs Transnet, Transnet Pension Funds, National Treasury, Public Enterprises and others. Mr Thompson, a former employee of Transnet, has brought an application on the inadequacy of pension benefits received from Transnet Pension Funds. Transnet, the Transnet Pension Fund and Government are opposing the matter. The Minister is the 4th respondent in this matter.
An assessment was carried out to identify contingent liabilities that could arise from the above litigation. Refer to Annexure 3B of the Annual Financial Statements.
Page 13
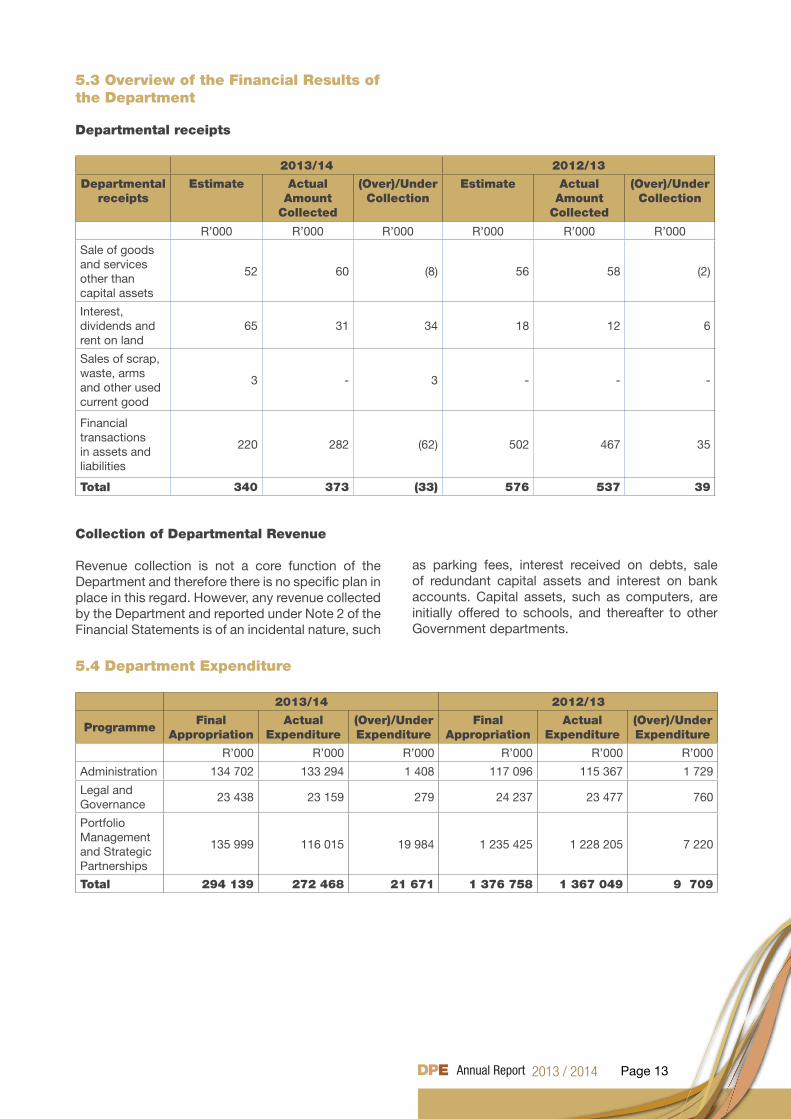
5.3 Overview of the Financial Results of the Department
Departmental receipts
2013/14 2012/13
Departmental receipts
Estimate Actual Amount
Collected
(Over)/Under Collection
Estimate Actual Amount
Collected
(Over)/Under Collection
R’000 R’000 R’000 R’000 R’000 R’000
Sale of goods and services other than capital assets
52 60 (8) 56 58 (2)
Interest, dividends and rent on land
65 31 34 18 12 6
Sales of scrap, waste, arms and other used current good
3 - 3 - - -
Financial transactions in assets and liabilities
220 282 (62) 502 467 35
Total 340 373 (33) 576 537 39
Collection of Departmental Revenue
Revenue collection is not a core function of the Department and therefore there is no specific plan in place in this regard. However, any revenue collected by the Department and reported under Note 2 of the Financial Statements is of an incidental nature, such
as parking fees, interest received on debts, sale of redundant capital assets and interest on bank accounts. Capital assets, such as computers, are initially offered to schools, and thereafter to other Government departments.
5.4 Department Expenditure
2013/14 2012/13
Programme Final
AppropriationActual
Expenditure(Over)/Under Expenditure
Final Appropriation
ActualExpenditure
(Over)/Under Expenditure
R’000 R’000 R’000 R’000 R’000 R’000
Administration 134 702 133 294 1 408 117 096 115 367 1 729
Legal and Governance
23 438 23 159 279 24 237 23 477 760
Portfolio Management and Strategic Partnerships
135 999 116 015 19 984 1 235 425 1 228 205 7 220
Total 294 139 272 468 21 671 1 376 758 1 367 049 9 709
Page 14
The decrease of R1.073 billion in the annual appropriation (from R1.377 billion to R294.1 million) is as a result of a decrease in payments for financial assets and transfer payments to SOCs.
Under-spending amounting to R21.671 million was recorded in the 2013/14 financial year. This amount is mainly made up of current expenditure in the operational budget. An amount of R3.862 (2.9%) was not spent under Compensation of Employees budget item as a result of some posts not having been filled within a space of 3 months due to scarcity of specialist skills in the market. Under-spending on Goods and Services amounting to R17.657 million (17.4% of budget) arose, partly, due to some projects being delayed or postponed as a result of changes in the internal and external policy environment. Examples of these are major projects such as the NCPM, the telecoms benchmarking study, harmonising procurement policies and planning frameworks in Eskom and Transnet linked to optimisation of supplier development and the transformation initiative. A number of projects commenced late in the year, e.g. the review of the Rooivalk Programme and Denel’s Strategic Equity Partnership Study. The Department has requested rollovers from the 2013/14 Goods and Services budget from National Treasury for nine projects/contracts amounting to R5.012 million, in order for them to be completed in the new financial year. The Department spent 92.6% of its budget, which was not within its 2% spending target.
PROGRAMME 1: Administration: Provides over-arching management and key supporting functions and processes in order for the Department to achieve its strategic objectives. The programme consists of the Ministry, Management (Office of the Director-General and the Deputy Director-General Corporate Management), Corporate Services (Information Management and Technology and Security and Facilities Management), Human Resources, Communications, Office of the Chief Financial Officer, Inter-governmental and International Relations, Strategic Planning, Monitoring and Evaluation, Internal Audit and Office Accommodation.
Expenditure in this programme amounted to R133.294 million in 2013/14, compared to R115.367 million in 2012/13. This increase was mainly due to, inter alia, the fully functional Inter-Governmental Relations sub-programme that was established in 2012/13, the appointment of the DDG: Corporate Management in the Management sub-programme, a number of large projects undertaken by Human Resources, audit fees, office accommodation, further alterations to office premises, furniture
and equipment to accommodate the increased staff complement and travel costs for provincial engagement.
PROGRAMME 2: Legal and Governance: provides systems that align state owned companies with corporate governance best practice and Government’s strategic intent.
Expenditure in the programme amounted to R23.159 million in 2013/14, compared to R23.477 million in 2012/13. There was no substantive change to expenditure on this programme during the period under review.
PROGRAMME 3: Portfolio Management and Strategic Partnerships: This programme consists of 5 sub-programmes and overall expenditure for the programme was as follows:
Expenditure in this programme amounted to R116.015 in 2013/14, compared to R1.228 billion in 2012/13. The decrease was mainly due to payment for financial assets disbursed to Alexkor and Denel, amounting to R1.050 billion, as well as an amount of R118.313 million paid in respect of an indemnity claim to Denel/SAAB Aerostructures in 2012/13 financial year. An amount of R57.250 million was disbursed to Denel Aerostructures in 2013/14 for payment of the eighth indemnity claim. Under-spending on this programme is attributed to delays in the implementation of some major projects, as reflected in overall expenditure of the Department above.
A breakdown of expenditure per sub-programme is provided below.
SUB-PROGRAMME: Energy and Broadband Enterprises: aligns the corporate strategies and performance of Eskom, Pebble Bed Modular Reactor (PBMR) and Broadband Infraco with Government’s strategic intent and performance targets.
Expenditure in this programme amounted to R15.990 million in 2013/14, compared to R13.944 million in 2012/13. The increase in expenditure in this sub-programme was mainly due to the unit being fully resourced. However, two planned projects were not finalised, due to the Terms of Reference being revised subsequent to a review of the business requirements of the SOC, which resulted in the under-spending in this unit. The projects will be rolled out in the 2014/15 financial year.
Page 15
SUB-PROGRAMME: Manufacturing Enterprises: aligns the corporate strategies and performance of Denel, SAFCOL and Alexkor with Government’s strategic intent and performance targets. It develops proposals for SOCs’ role in advanced manufacturing.
Expenditure in the sub-programme amounted to R68.097 million in 2013/14, compared to R1.178 billion in 2012/13. The decrease in expenditure in this sub-programme was mainly due to payment for financial assets disbursed to Alexkor and Denel amounting to R1.050 billion, as well as an amount of R118.313 million paid to Denel in 2012/13 in respect of an indemnity claim due to Denel/SAAB Aerostructures. An amount of R57.250 million was disbursed to Denel in December 2013 in respect of the eighth indemnity claim. Under-spending in this sub-programme was as a result of delays in the commissioning of a number of projects, such as the Review of the Rooivalk Programme and Denel’s Strategic Equity Partnership Study, which only commenced late in the year and which will be finalised in 2014/15.
SUB-PROGRAMME: Transport Enterprises: aligns the corporate strategies and performance of South African Airways (SAA), South African Express (SAX) and Transnet with Government’s strategic intent and performance targets.
Expenditure in the sub-programme amounted to R14.985 million in 2013/14, compared to R20.030 million in 2012/13. The decrease in expenditure inthis sub-programme was due to a delay in a number of planned projects, such as the NCPM and a review of logistics costs in the economy, which were postponed until the next financial year. The
NCPM project required alignment to Transnet’s Corridor Framework.
SUB-PROGRAMME: Economic Impact and Policy Alignment: aligns shareholder oversight of SOC in relation to overarching government economic, social and environmental policies; and implements strategic interventions in order to contribute towards achievement of national objectives in support of economic growth and transformation.
Expenditure in the sub-programme amounted to R9.686 million in 2013/14, compared to R9.990 million in 2012/13. There was no substantial difference in expenditure in this unit: the under-spending was mainly due to delays in the commission of some projects that had a total allocated budget of R5 million.
SUB-PROGRAMME: Strategic Partnerships: establishes and builds focused strategic partnerships between SOCs, strategic customers, suppliers and financial institutions.
Expenditure in the sub-programme amounted to R7.256 million in 2013/14, compared to R5.973 million in 2012/13. The increase in expenditure inthis sub-programme is attributed to expansion in the human resources as well as additional projects being undertaken by the project. Under-spending in the sub-programme is attributed to projects that were planned to be outsourced, but were implemented internally. The project on harmonising procurement policies and the planning framework at Eskom and Transnet (to enable collaboration and to optimise the supplier development and transformation initiative) was postponed.
5.5 Virements and Roll Overs Virements per Programme
ProgrammeAdjusted
AppropriationR’000
VirementsR’000
Final Appropriation
R’000
Actual Expenditure
R’000
VarianceR’000
1: Administration 131 032 3 670 134 702 133 294 1 408
2. Legal and Governance 22 338 1 100 23 438 23 159 279
3: Portfolio Management and Strategic Partnerships
140 769 (4 770) 135 999 116 015 19 984
Total 294 139 - 294 139 272 468 21 671
Page 16
Virements were effected as follows:
Compensation of EmployeesAn amount of R600 000 was viremented from Programme 3 to Programme 1:• R200 000 to Communications• R5000 to Ministry • R395 000 to Human Resources
Goods and Services and Capital Expenditure R3.070 million was viremented from Programme 3 to Programme 1:• R1.7 million to Chief Financial Officer for audit
fees and travel administration costs • R510 000 to Strategic Planning, Monitoring
and Evaluation for project funding • R860 000 to IT for software and computer
equipment (CAPEX)
Goods and Services• R1.1 million was viremented from Programme
3 to Programme 2 for projects.
5.6 Fruitless Expenditure In the 2013/14 financial year the Department incurred fruitless expenditure amounting to R530 000.00.
The transactions are as follows:In March 2013, a Senior Officials Dialogue Forum was arranged to precede the 5th BRICS summit hosted by South Africa. The Director-General was to host the event. Accordingly, the Department secured a venue for the event which was to take place on 25th March 2013. A suitable venue had to be secured and with the guidance of the Department of International Relations and Cooperation (DIRCO) for an event of this magnitude, the Department booked the venue. On 18 March 2013, the Department was informed that the event had been cancelled after consultation with DIRCO. The Department informed the venue of this cancellation. The Department was informed that a full cancellation fee would be payable. The Department requested that the service provider re-consider the amount claimed and reached a final settlement of R55 863.81, this amount also included the travel agent’s service fees and tourism levies. The transaction was concluded in April 2013.
A report was submitted to the Director-General and it was found that no official had acted negligently or recklessly and therefore no action was taken against them. South Africa hosted the 5th BRICS summit in March 2013. Following this Summit, it was agreed that the State Owned Companies (SOC) should explore ways
of cooperation, exchange of information and best practices as reflected in the eThekweni Declaration. In order to implement the outcome of the eThekweni Plan of Action, a BRICS Ministerial Dialogue Forum was arranged to take place in December 2013, hosted by the Minister of Public Enterprises. This Forum was to be attended by his counterparts from the BRICS countries. Confirmation was received from all relevant parties and accordingly arrangements were made with for interpreters, accommodation, a suitable venue as well as other contingent logistical arrangements. The event was due to take place on 03 December, 2013. Two days before and also on the eve of the summit, the Department was informed that representatives from three of the BRICS countries would not be able to attend the Summit. The event had to be cancelled. The service providers that had been engaged to render various services had to be paid. The total disbursement to service providers amounted to R470 969.19.
A report was submitted to the Director-General and it was found that no official had acted negligently or recklessly and therefore no action was taken against them.
The cancellation of these events could not be foreseen by the Department at the time, The Department will in future avoid hosting events of this nature as there are key variables beyond the control of the Department.
The remaining amount of R3 000 is made up of traffic fines and a “no show” for accommodation both of which are still to be resolved.
5.7 Irregular Expenditure
In the period under review, the Department incurred irregular expenditure amounting to R 711,000. The Department has dismissed an official that was found guilty of misconduct. Further investigations have been instituted to address the root causes and ensure that there is 100 percent compliance to the PFMA.
5.8 Future Plans of the Department
The Department has concluded the process of developing its Strategic Plan, which will inform its programmes over the new administration period, beginning in 2014. The Strategic Plan seeks to build on the progress that has been made in aligning SOCs’ objectives to the priorities of Government. This will ensure that the outcomes contained in the new administration’s MTSF are internalised and inform the development and implementation of programmes going forward.
Page 17
The Department will also be working on the development of legislation that will provide a comprehensive and coherent framework for exercising shareholder oversight. The Department will continue to advocate for a stable policy framework that will allow SOCs to drive investment in the economy and contribute to the outcomes. This will be accompanied by development of a comprehensive framework for funding SOCs projects.
The Department will continue to support the implementation of Strategic Integrated Projects (SIPs) and ensure that the capacity that exists within its SOCs is better leveraged to support SIPs that are coordinated by its SOCs.
5.9 Public-Private Partnerships
The Department did not enter into any Public-Private Partnership (PPP) agreements during the 2013/14 financial year.
5.10 Discontinued Activities / Activities to be Discontinued
There were no activities that were discontinued during the period under review.
5.11 New or Proposed Activities
There are no proposed new activities.
5.12 Supply Chain Management
The Department did not conclude any unsolicited bids during the year under review.
The Department adheres to all prescribed supply chain management (SCM) processes. The Department’s Procurement Policy and procedure manual is structured in accordance with these prescripts and it is regularly updated in order to accommodate any changes in legislation that may take place from time to time or any new instruction notes that are issued.
Transactions are not captured on the system if supporting documentation is not in order at each level of procurement.
5.13 Gifts and Donations Received in Kind from Non-related Parties
Deloittes - Sponsorship of the Department’s Budget Vote Business Breakfast (R296 361.45).
McKinsey – Pro Bono Study on the Long Term Turn-around Strategy for South African Airways (R350 000).
5.14 Exemptions and Deviations Received from National Treasury
No exemptions or deviations were requested or received from National Treasury
5.15 Events after the reporting date
On 26th May 2014 Ms Lynne Brown was appointed as Minister of the Department of Public Enterprises to replace former Minister Melusi Gigaba who is now Minister of Home Affairs.
The Department was notified on 29 May 2014 that Broadband Infraco will be transferred to the Department of Telecommunications and Postal Services at a date still to be established through a proclamation by the President.
Mr. Tshediso Matona Accounting Officer Department of Public Enterprises
Page 18
6. STATEMENT OF RESPONSIBILITY AND CONFIRMATION OF ACCURACY OF THE ANNUAL REPORT
To the best of my knowledge and belief, I confirm the following:
• All information and amounts disclosed throughout the annual report are consistent. • The annual report is complete, accurate and free from any omissions. • The annual report has been prepared in accordance with the guidelines for annual reports issued by
National Treasury. • The Annual Financial Statements (Part E) have been prepared in accordance with the modified cash
standard and the relevant frameworks and guidelines issued by National Treasury. • The Accounting Officer is responsible for the preparation of the annual financial statements and for the
judgements made in this information. • The Accounting Officer is responsible for establishing, and implementing a system of internal control that
has been designed to provide reasonable assurance as to the integrity and reliability of the performance information, the human resources information and the annual financial statements.
The external auditors are engaged to express an independent opinion on the annual financial statements.
In my opinion, the annual report fairly reflects the operations, the performance information, the human resources information and the financial affairs of the department for the financial year ended 31 March 2014.
Yours faithfully
Mr. Tshediso Matona Accounting Officer Date: 31 July 2014
Page 19
7. STRATEGIC OVERVIEW
7.1 VISION
To drive investment, productivity and transformation in the Department’s portfolio of SOCs, their customers and suppliers so as to unlock growth, drive industrialisation, create jobs and develop skills.
7.2 MISSION
To provide decisive strategic direction to the SOC, so that the businesses are aligned with the national growth strategies arising out of the NGP.
7.3 VALUES
Professional – we must deliver work that reflects a professional level of care and skill.
Caring – this must be expressed in how we watch over and support the Department’s people.
Integrity – we must do the right thing irrespective of implications.
Fun – create an environment where people look forward to coming to work.
Passion – we are out to make the South African economy competitive. This requires high passion. Batho Pele principles guide our engagement with our clients and other stakeholders.
Page 20
8. LEGISLATIVE AND OTHER MANDATES
The Department exercises shareholder oversight of eight SOCs. All the SOCs are incorporated as companies, in accordance with the provisions of the Companies Act, 2008. Except for Denel, all the SOCs are established in terms of their own enabling legislation, which sets out the purpose, mandate, and objectives for which they were founded. DPE is both the founder and the administrator/custodian of all legislation relating to the establishment of SOCs. In terms of section 63(2) of the Public Finance Management Act 1 of 1999, as amended (PFMA), the Minister of Public Enterprises has, inter alia, the responsibility of ensuring that SOCs comply with PFMA legislation and policies of the Department.
As the shareholder Ministry that acts on behalf of Government, the Department’s mandate continues to evolve to ensure that SOCs within its portfolio are clearly directed towards prioritised outcomes in order to serve the Government’s strategic objectives. This evolution is underpinned by an over-arching shareholder management process aimed at providing enduring strategic rationale for SOCs. Expansion of the role of SOCs within the current economic management framework has required the Department to introduce measures to ensure that SOCs contribute to the developmental outcomes, as outlined in the NDP.
Page 21
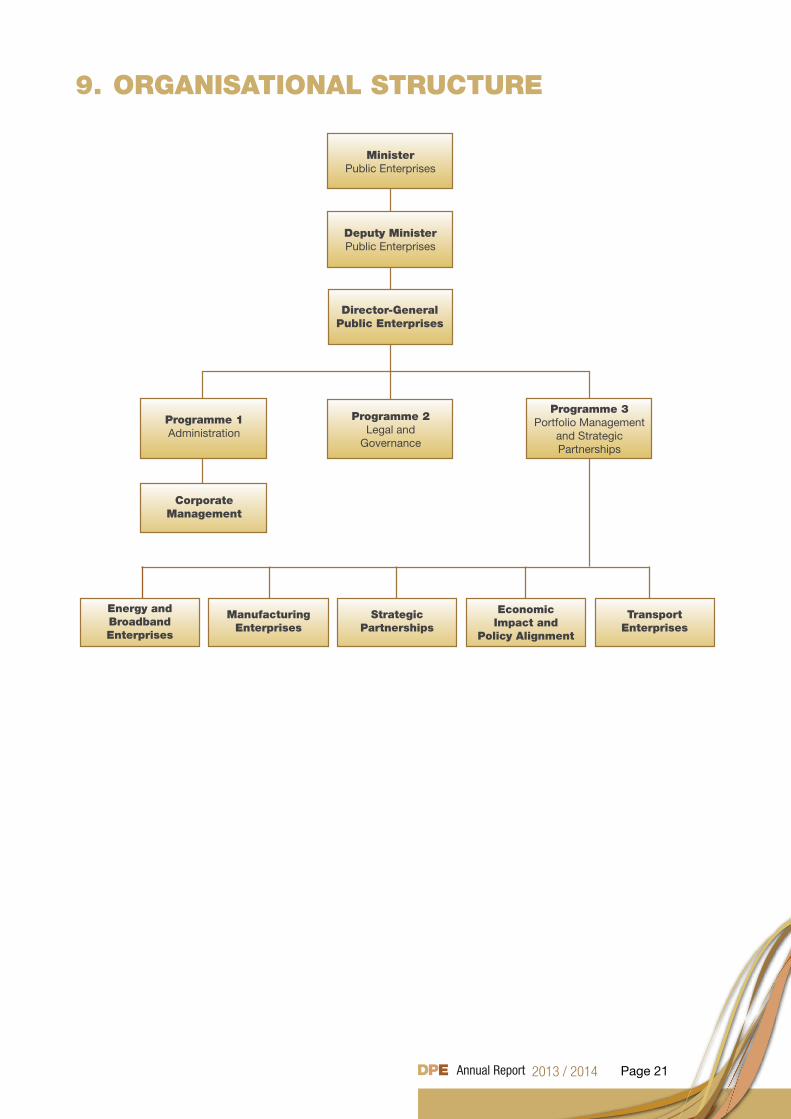
9. ORGANISATIONAL STRUCTURE
MinisterPublic Enterprises
Deputy MinisterPublic Enterprises
Director-GeneralPublic Enterprises
Programme 2Legal and
Governance
Programme 3Portfolio Management
and StrategicPartnerships
Corporate Management
Programme 1Administration
Energy and BroadbandEnterprises
ManufacturingEnterprises
Strategic Partnerships
Economic Impact and
Policy Alignment
TransportEnterprises
Page 22
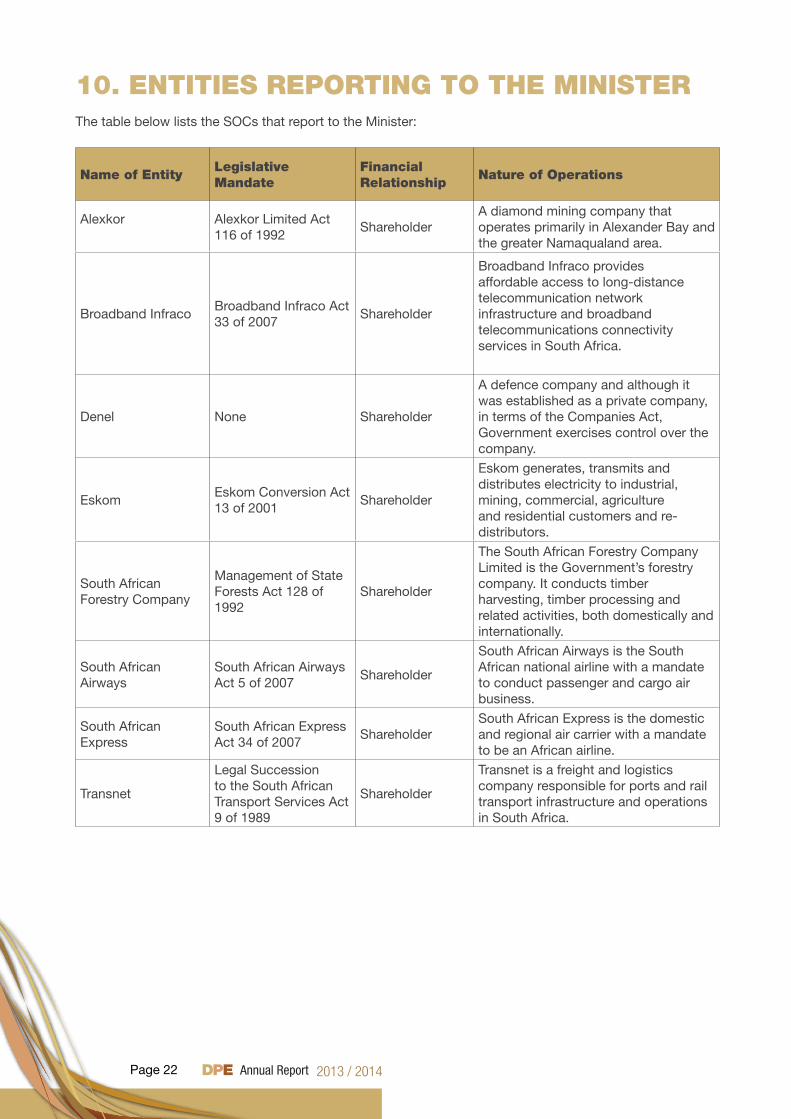
10. ENTITIES REPORTING TO THE MINISTERThe table below lists the SOCs that report to the Minister:
Name of EntityLegislative Mandate
Financial Relationship
Nature of Operations
Alexkor Alexkor Limited Act 116 of 1992
Shareholder A diamond mining company that operates primarily in Alexander Bay and the greater Namaqualand area.
Broadband InfracoBroadband Infraco Act 33 of 2007
Shareholder
Broadband Infraco provides affordable access to long-distance telecommunication network infrastructure and broadband telecommunications connectivity services in South Africa.
Denel None Shareholder
A defence company and although it was established as a private company, in terms of the Companies Act, Government exercises control over the company.
EskomEskom Conversion Act 13 of 2001
Shareholder
Eskom generates, transmits and distributes electricity to industrial, mining, commercial, agriculture and residential customers and re-distributors.
South African Forestry Company
Management of State Forests Act 128 of 1992
Shareholder
The South African Forestry Company Limited is the Government’s forestry company. It conducts timber harvesting, timber processing and related activities, both domestically and internationally.
South African Airways
South African Airways Act 5 of 2007
Shareholder
South African Airways is the South African national airline with a mandate to conduct passenger and cargo air business.
South African Express
South African Express Act 34 of 2007
Shareholder South African Express is the domestic and regional air carrier with a mandate to be an African airline.
Transnet
Legal Succession to the South African Transport Services Act 9 of 1989
Shareholder
Transnet is a freight and logistics company responsible for ports and rail transport infrastructure and operations in South Africa.
PART BPERFORMANCE INFORMATION
Page 24
1. AUDITOR GENERAL’S REPORT: PRE-DETERMINED OBJECTIVES
The AGSA currently performs certain audit procedures on the performance information, in order to provide reasonable assurance in the form of an audit conclusion. The audit conclusion on performance against predetermined objectives is included in the report to management, with material findings being reported under the Predetermined Objectives heading in the Report on Other Legal and Regulatory Requirements section of the Auditor’s Report.
Refer to page 140 of the Report of the Auditor General, published as Part E: Financial Information.
2. OVERVIEW OF DEPARTMENTAL PERFORMANCE
2.1 Performance Delivery Environment
In 2009, the exiting administration adopted the MTSF that outlined Government’s priorities over the 5 year administration period. This was done at a time when the economy was declining and shedding jobs. At the core of the MTSF was stabilisation of the economy to eliminate further job losses and to begin introducing fundamental reforms that would support shifting the economy to a different growth path. With regards to the implementation of key programmes that fall within the ambit of the Department, the roll-out of the capital expenditure programme has continued to gain momentum. Both Transnet and Eskom are accelerating the roll-out of their build programmes to create the necessary network capacity to support growth.
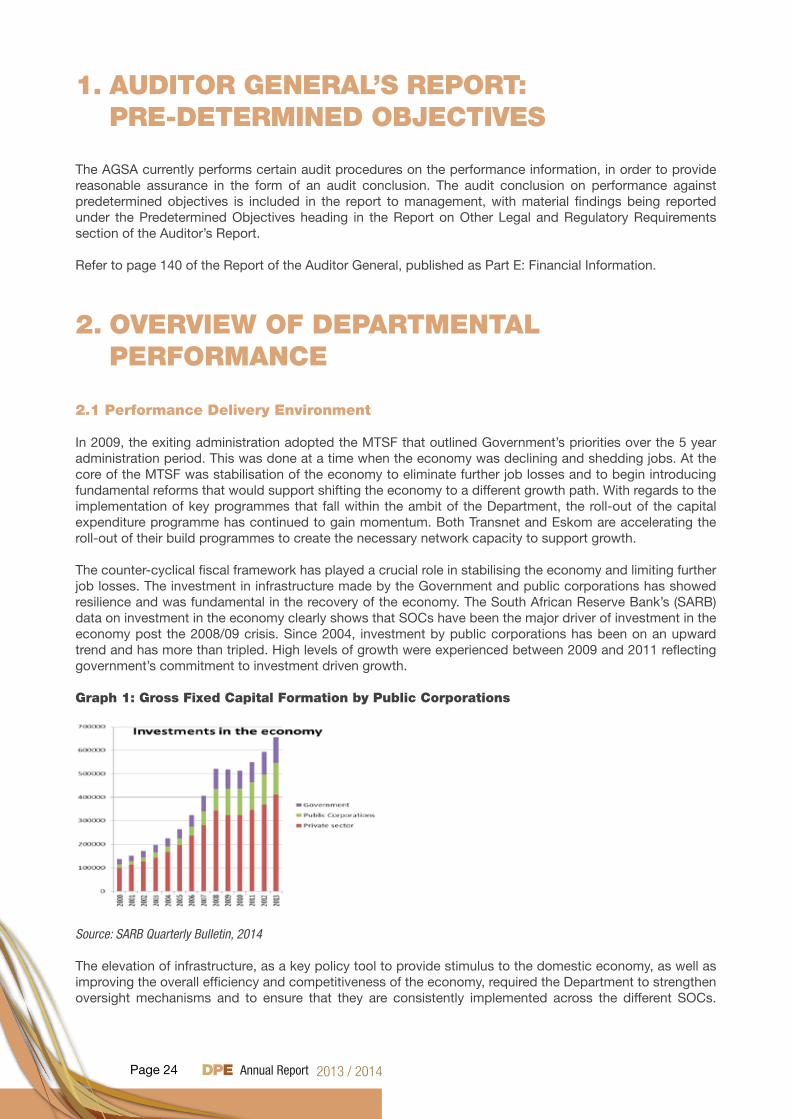
The counter-cyclical fiscal framework has played a crucial role in stabilising the economy and limiting further job losses. The investment in infrastructure made by the Government and public corporations has showed resilience and was fundamental in the recovery of the economy. The South African Reserve Bank’s (SARB) data on investment in the economy clearly shows that SOCs have been the major driver of investment in the economy post the 2008/09 crisis. Since 2004, investment by public corporations has been on an upward trend and has more than tripled. High levels of growth were experienced between 2009 and 2011 reflecting government’s commitment to investment driven growth.
Graph 1: Gross Fixed Capital Formation by Public Corporations
Source: SARB Quarterly Bulletin, 2014
The elevation of infrastructure, as a key policy tool to provide stimulus to the domestic economy, as well as improving the overall efficiency and competitiveness of the economy, required the Department to strengthen oversight mechanisms and to ensure that they are consistently implemented across the different SOCs.
Page 25
These developments and the introduction of the Presidential Infrastructure Coordination Committee (PICC) require the Department to carefully assess its capacity and prioritise programmes that will have significant impact on the implementation of SIPs.
The NDP has been approved and will inform the Government’s programmes designed to achieve the 2030 vision. The NDP recognises the challenges that currently exist in the infrastructure sector and proposes a wide range of action that will need to be implemented to achieve the desired outcomes.
In this regard, the Department has prioritised the following action: • Strengthening the oversight function of key SOCs (in particular, Transnet and Eskom) in order to align
their business and investment activities to contributing towards achieving the objectives outlined in the NDP.
• Creating a closer working relationship with the policy department to ensure that policy certainty is created to allow for effective planning and delivery of key investments.
2.2 Service Delivery Improvement Plan
Over the past years, the Department did not have a clear Service Delivery Improvement Plan (SDIP). This was largely as a result of the Department’s initial mandate of being tasked to manage the disposal of certain state assets. This culminated in limited focus on the services rendered by the Department to its SOCs and on engagement with the public at large. Over the past two years, the Department has reversed this trend and introduced new programmes designed to enhance its interaction with other Departments as well as the public at large. This has enhanced interaction between the Department and other spheres of government and, more importantly, the public at large.
In the current financial year, the Department concluded its first SDIP that began to scope the services provided by the Department and how these will be improved over time. In the year ahead, the Department will increase its focus on the introduction of quantifiable targets to ensure that it remains responsive to service delivery expectations. This will largely include: • Sustaining progress that has been made in the payment of invoices within 30 days, as required by
legislation. • Decrease turnaround time on the decisions required by SOCs from the shareholder focusing on PFMA
applications. • Shortening the period for moderation and awarding of tenders and improving communication to
unsuccessful bidders. • Improving recruitment processes to allow easy access as well as reducing costs related to applying for
vacancies (E-recruitment). • Improving turnaround times for responding to Presidential Hotline queries.
2.3 Organisational Environment
In the 2011/12 financial year, the Department underwent a process to review its establishment, in order to ensure that it was properly structured and capacitated to carry out its mandate. From this process, it was clear that additional human resources were required to ensure that the Department is appropriately and sufficiently capacitated. Extensive engagement with National Treasury was undertaken to explore options to capacitate the Department in light of the constrained fiscus and the need to increase capacity within Government to oversee the build programme. In 2012/13, National Treasury approved an additional 12 critical posts and a further 17 posts over the MTEF to augment the capacity of the Department. In the 2013/14 financial year, the Department continued to experience high attrition rates, resulting in a loss of key staff at top management level. This was as a result of better conditions of employment that the private sector (including SOCs) was able to offer these highly skilled individuals. The limitations in the remuneration framework within the public service require the Department to explore alternative options and the Department will focus on the following as part of its strategy to develop the required capacity: • Expansion of the graduate programme to ensure a talent pool that the Department can tap into in order
to fill critical positions. • Enhancement of training programmes that will ensure improvement of skills for levels below SMS.• Continued marketing of the Department as an employer of choice for young talent.
Page 26
2.4 Key Policy Developments and Legislative Changes
In the 2013/14 financial year, a number of policies were introduced that had an impact on the operational environment of some SOCs. The most prominent was the National Broadband Policy, also known as South Africa Connect. The policy seeks to alter the current broadband industry structure in order to drive investment to enhance connectivity. The policy has a direct impact on Infraco’s operational environment as one of the State entities that operate within the ICT sector.
3. STRATEGIC OUTCOME ORIENTED GOALSIn relation to Government’s 12 Outcomes, the Department is primarily contributing to creating an efficient, competitive and responsive economic infrastructure network (Outcome 6), which forms the basis of the delivery agreement signed in October 2010. This delivery agreement forms the core of the performance agreement between the President and the Minister. Furthermore, the Department, through the activities of its SOCs, contribute to other outcomes such as decent employment through inclusive growth, skills development and rural development.
The following is the Department’s contribution towards achieving the outcomes that have been prioritised by government:
3.1 Creating an efficient, competitive and responsive economic infrastructure network (Outcome 6)
The MTSF was adopted during the recession. One of the key objectives was to stabilise the economy and place it on a different growth trajectory. At the centre of this objective was: implementation of the capital expenditure programme that would address the capacity constraints experienced by the economy during high growth periods between 2005 and 2007; to act as a stimulus to jump-start the economy. In this regard, Eskom’s build programme, as well as the Transnet capital expenditure programme, formed the core of the government’s infrastructure investment strategy.
The progress that has been made to accelerate infrastructure investment in the economy is highlighted below.
ESKOM
Funding of the build programme up to 2018 Funding of the build programme emerged as one of the major challenges with roll-out of the build programme in the electricity sector. This is as a results of tariffs not being sufficient to cover operational costs as well as provide a reasonable return on investment to allow the utility to fund investment in additional generating capacity. Over the past five years, the Department has supported Eskom to secure tariff adjustments that will support its financial sustainability as well as provision of guarantees to keep the financing cost lower. As at 31 March 2014, R271.6 billion (90.5%) of the R300 billion borrowing programme had been secured. The R300 billion borrowing programme is based on the original funding requirements as at April 2010 and covers the period 1 April 2010 to 31 March 2017.
It should be noted that additional funding requirements, including those resulting from the lower than expected MYPD 3 tariff determination, are not included in this borrowing programme. The drawdowns for the year ending 31 March 2014 against the R300 billion funding plan is R44.7 billion, bringing the cumulative amount that has been drawn to execute the build programme to R188.7 billion.
Additional funding for the period until 31 March 2018, as a result of the MYPD3 decision amounts to R301 billion which still needs to be secured.
Page 27
Progress on delivery of build programme (Medupi, Kusile, Ingula, Transmission Lines and Renewable Projects)
Eskom spent R58.2 billion on capital expenditure in 2013/14, reflecting a sustained increase in the capital expenditure in support of Government outcomes.
The following are the key achievements of the build programme: • Eskom completed the return-to-service project during the reporting period. All three power stations
(Camden, Grootvlei and Komati) are fully operational. The last unit of this project – Komati Power Station’s Unit 3 – was commissioned in September 2013. This brought the total amount of generating capacity for return-to-service added to the grid since 2005 to 3 731MW. This has been one of the factors that have played a crucial role in averting the collapse of the national electricity grid.
• The refurbishment projects have made good progress, despite the ongoing challenge of outage constraints. All the Kriel units have now been refurbished, with the final unit (Unit 5) being synchronised on load on 15 March 2014. Furthermore, three of the six Matla units have been refurbished, with the third unit (Unit 5) synchronised on load on 25 March 2014. Delays were experienced at Duvha due to outage movements.
• As at 31 March 2014, Medupi had a day variance of 24.48 days (within the target of 30 days late variance). Eskom remains on track for synchronisation during the second half of 2014. Commissioning of the first unit has started and Eskom is working with contractors to ensure that agreed schedules and processes are adhered to. Key challenges include finding solutions for the control systems.
• Kusile achieved a day variance of 12.9 days (within the target of 30 days late variance). The station is scheduled for synchronisation by the end of 2015. The key challenge is finding a solution for control systems to avoid a repetition of the delays experienced at Medupi. Four medium term contracts have been signed for coal supply to Kusile Power Station during the commissioning phase. The conclusion of long term coal and limestone supply agreements for Kusile Power Station remains a focus area.
• Work continues at Ingula, but the tragic incident that cost the lives of six contractors has affected the schedule. The delay has been estimated at 18 months. At the end of the reporting period, Ingula had a day variance of 11.6 days (within the target of 30 days late variance). Work to install turbines and generators will begin soon.
• Construction of the 100MW Sere Wind Farm is progressing well, with 69% of the tower foundations and 17% of the turbines completed.
• Approximately 811km of power lines and 3 790MVA of sub-station capacity were also commissioned during the course of the year.
• Mega Generation Projects reported construction progress as follows as at 31 March 2014” Medupi - 60%; Kusile - 30%; Ingula - 72%; and Sere Wind Farm - 47%.
IPP contracts that have been signedThe electricity industry is undergoing reforms targeted at: enhancing participation of the private sector; attracting additional investment to address current capacity challenges; enhance the use of renewable energy. The first project under the Department of Energy (DOE) renewable independent power producers (RE-IPP) programme was connected to the grid on 27 September 2013 and the first IPP was commissioned on 15 November 2013. A total of 467.3MW is currently available to the system from these independent power producers (IPPs). The DOE approved an additional 1 457MW, pursuant to the third window submissions. No contracts have yet been signed for this capacity.
Further PPAs, totalling 1 005MW, for DOE Peaker Plants were entered into on 3 June 2013 and became effective on 29 August 2013 (DOE Peaker Programme). Commissioning of these plants is expected during the 2015/6 financial year.
TRANSNET
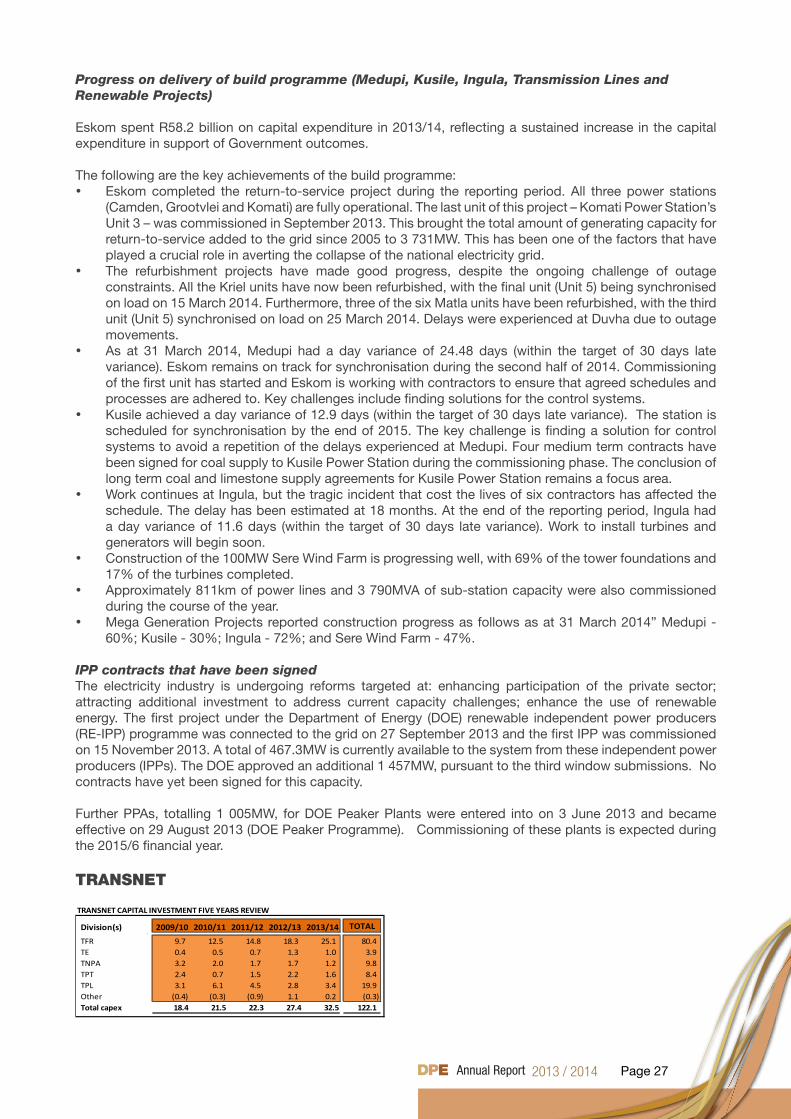
TRANSNET CAPITAL INVESTMENT FIVE YEARS REVIEW
Division(s) 2009/10 2010/11 2011/12 2012/13 2013/14 TOTAL
TFR 9.7 12.5 14.8 18.3 25.1 80.4TE 0.4 0.5 0.7 1.3 1.0 3.9TNPA 3.2 2.0 1.7 1.7 1.2 9.8TPT 2.4 0.7 1.5 2.2 1.6 8.4TPL 3.1 6.1 4.5 2.8 3.4 19.9Other (0.4) (0.3) (0.9) 1.1 0.2 (0.3)Total capex 18.4 21.5 22.3 27.4 32.5 122.1
Page 28
The 2014/15 financial year is the third year of Transnet’s roll-out of the Market Demand Strategy (MDS) that is underwritten by a rolling capital programme worth over R300bn. In the past five years, Transnet has invested over R120bn in infrastructure and capital projects, most of which has been committed to the rail business. This is crucial to enhance the efficiency of the logistics system and to reduce the cost to move goods, which will contribute to the overall competitiveness of the economy.
Key projects executed by the company over the past five years included the following:
GFB locomotivesDuring the 2013/14 financial year, Transnet awarded a R50 billion contract for acquisition of 1 064 locomotives (599 new dual-voltage electric locomotives and 465 diesel locomotives) – this makes it the largest locomotive acquisition contract in the history of South Africa. Not only will this acquisition of locomotives enable Transnet to increase its rail volume capacity, but the procurement process has been structured in such a way as to allow for maximisation of localisation benefits. The transaction is expected to boost the country’s manufacturing capacity while also transforming the rail industry.
Nine of the 95 electric locomotives were delivered in the 2013/14 financial year. Local assembly of the locomotives commenced on 4 February 2014 at Transnet Engineering in Koedoespoort. The remaining 23 of the 43 Class 43 diesel locomotives were received in the 2013/14 financial year.
Iron ore line expansion up to 60,0mtThe last 26 of the 32 locomotives needed to facilitate the increase in iron ore capacity to 60,0mt were tested and accepted into operations during the 2013/14 financial year. The pre-feasibility study to expand capacity from 61mt to 82,5mt has been completed. Phase 1D (being the addition of a 3rd tippler and associated rail works) has been approved by the Transnet Board of Directors, at a cost of approximately R1,6 billion. The 3rd tippler will ensure that 60mt can be exported on a sustainable basis, as the existing two tipplers currently do not allow for any down time.
Coal line expansion up to 81,0mtInfrastructure work required to expand the coal line from 68mt to 81mt commenced during the 2013/14 financial year. The work is expected to gain momentum during the 2014/15 financial year, with construction of the consolidation yards at Saaiwater and Blackhill yards.
Durban Container Terminal (DCT)Transnet has commenced with the reconstruction and deepening of seven steel sheet piled berths at Maydon Wharf, in the Port of Durban. Construction of the first berth was successfully completed and is now fully operational. The contract for the remaining six berths was awarded recently and on-site construction is expected to commence in the near future.
Durban Dig-Out PortThe Durban International Airport (DIA) site acquisition from ACSA was concluded during the 2012/13 financial year at a total cost of R1,85 billion. The DIA site is proposed to be developed into a dig-out port to address demand requirements in the container, liquid bulk and automotive sectors up to 2040.
Cape Town Container TerminalExpansion of the Cape Town Container Terminal aims to increase capacity from 0.9 million TEUs to 1,4 million TEUs to address growth in demand for containers in the Western Cape region. The capital project to deepen berths and increase container handling capacity to 900 000 TEUs has been completed. Consideration is now being given to increasing the container handling capacity to 1, 4 million TEUs.
Ngqura Container TerminalThe Nqgura Container Terminal was launched in 2012. The port is positioned as a trans-shipment hub and a gateway for container traffic into Southern Africa. The second phase A of the project, to expand capacity from 800 000 TEUs to 1.5 million TEUs, has commenced and is expected to be completed during the 7 year MDS period.
New Multi-Product Pipeline (NMPP)Significant progress has been made on the NMPP with favourable weather conditions having enabled accelerated construction work to take place. The project has, however, faced some challenges with regard
Page 29
to industrial action and tank construction work. In spite of these challenges, the project is expected to be completed during 2015.
Ports productivity
DurbanDuring the period under review, ship turnaround time was slightly below the target of 59, largely due to inclement weather. The gross crane moves per hour (GCH) on Pier 1 and Pier 2 are below target, with Pier 1 at 24 moves (target is 28) and Pier 2 at 25 moves (target is 30). Anchorage waiting time was also below target, at 57 hrs (target is 46). Infrastructure upgrades are being implemented to improve functioning of the port.
Cape TownThe ship turn-around time was 29,6hrs better than the set target of 30hrs. The gross crane moves per hour were better than target, at 34 moves against a target of 32. Anchorage waiting time was below target at 57 hrs (target was 46 hrs).
Average ship turn-around time in Cape Town and Durban improved from the previous year. The Port of Durban improved anchorage waiting time from the previous year, which is important for customer satisfaction. Cape Town’s performance was marginally lower than in the previous year.
Volumes Transported by Rail Transnet has continued to move volumes above 200 mt per annum, despite the lacklustre performance of the economy. During the period under review, 210.43 mt were showing a 1.3% increase in volumes compared to the previous financial year.
The volume growth was attributable to the following: • General freight (GFB) volumes of 88mt reflected a positive growth of 6% compared to the previous year.• Export coal volumes of 68.2mt were 11% below budget and 1% below the previous year.• Export iron ore volumes of 54.3mt were 12% below budget and 3% below the previous year.
The 8.4% shortfall on the budgeted volume of 229.72mt was mainly due to export coal and export iron ore.
Key reasons for the deviation of a 19mt (88.4%) shortfall on total rail volumes were as follows:• A 7.3mt shortfall on export iron ore due to customer production problems and a decline in export iron
prices due to slow global economic growth.• The 8.8mt export coal volume shortfall was partly due to a decline in export coal prices, customer
related equipment failure, as well as internal and external operational constraints (such as locomotive failure and power failure, including RBCT cable failure and cable theft).
• The GFB sector accounted for the remaining shortfall of 3.2mt. A range of factors affected volume performance, including slow domestic growth, industrial strikes, customer loading and offloading challenges and wet weather conditions.
Migration of transportation of coal fromroad to rail The coal business under-achieved on its annual target of 95.151mt. The actual achievement for coal was 83,13mt in 2014, which represents a 12.6% under-achievement.
Road to rail migration efforts are as follows:• Freight Rail’s market development initiatives target retention and growth of traditional rail customers in
the mining and heavy manufacturing sectors (e.g. export coal and iron ore), including companies that beneficiate mining commodities. Other major customers are in the fuel, chemicals, agricultural and timber sectors.
• The business is targeting new customers in the FMCG, textile and light manufacturing industries, where there are opportunities for ‘rail friendly’ commodity types to be shifted from road to rail.
• The rail migration programme that focuses on Eskom coal is progressing well in support of the road to rail programme.
GFB ProductivityOn-time train departures improved by 24% compared to the previous year and by 5% compared to budget;
Page 30
this was due to diligent monitoring and follow-up on the root causes of deviations. On-time arrivals also improved by 4.5% compared to the previous year, but declined by 31% compared to budget, partly due to en-route system-failures. Diligent monitoring and follow-up on the root causes of departure and arrival problems will continue.
The gradual delivery of 43 Class diesel locomotives for General Freight and focused attention on operational efficiency and volume growth resulted in an 8% improvement in asset utilization, compared to both the prior year and budget.
3.2 Outcome 4: Decent employment through inclusive growth
The Department was identified as one of the contributors required to support implementation of the outcome 4 delivery agreement. Infrastructure investment was identified as one of the job drivers in the NGP. The industrial capabilities that exist within SOC such as Denel are being leveraged to support the development of advanced manufacturing in the South African economy, in line with IPAP.
DENEL
The turnaround of Denel has been crucial to preserve advanced industrial capabilities within the State’s portfolio. The company has continued to support the needs of the South African Defence Force, which has played a crucial role in developing capability to secure other markets. In June 2013, the company reported a R21 billion order book, which increased to R30 billion by December 2013. This will enable the business to meet its plan of doubling revenues to R8 billion by 2018/19. One significant order secured by the SOC in the 2013/14 financial year was a R10 billion contract by the South African Department of Defence to produce 238 Hoefyster infantry fighting vehicles (IFV) for the South African Army. The programme is critical in maintaining the country’s advanced defence manufacturing capabilities. Importantly, 70% of the components for the vehicles will be developed and manufactured in South Africa, with 2 000 jobs to be created at Denel and in the related South African defence industry.
In 2013/14 Denel revived its space and satellite capabilities, after entering into a collaborative relationship with the South African National Space Agency (SANSA). This will not only ensure that the country’s space and satellite capabilities are enhanced, but will provide local industry with the opportunity to tap into the growing and strategic global space and satellite industry.
The SOC has delivered and supported the deployment of the Rooivalk combat support helicopter in combat operations in the Democratic Republic of Congo (DRC). The deployments were done under the United Nations Organisation Stabilisation Mission (MONUSCO) and have proven to be a game changer in peace enforcement operations.
Localisation and transformation The Department has continued to monitor implementation of the Supplier Development Plans of both Eskom and Transnet. Furthermore, the Department has incorporated localization targets into the shareholder compacts of these entities; to ensure that their procurement expenditures advance the industrialization programme of Government. The proportion of both components and services sourced locally by these SOCs has gradually increased since the introduction of the Competitive Supplier Development Programme (CSDP).
In the 2013/14 financial year, Transnet achieved 92% local content procurement as a percentage of total spend. This is an exceptionally good performance for the year, especially if you take into consideration that the local content target was only 70% of total spend.
Transnet also exceeded the supplier development target by achieving 37% commitment of contract value to be invested in the country: the target was only 35%. Transnet’s performance in regard to supplier development would have been significantly higher if the SOC was not bound by the Preferential Procurement Policy Framework Act (PPPFA). Engagement with National Treasury on the PPPFA is ongoing in order to find a solution that will allow SOCs to maximize their procurement spend.
Page 31
BBBEE spend amounted to 94% of Total Measurable Procurement Spend (TMPS); this was against a target of 70%. Spend on Black Women Owned and Black Youth Owned remains low. The Department is, however, continuing to engage Transnet to find ways to improve spend on these two groups.
3.3 Outcome 5: A skilled and capable workforce to support an inclusive growth path
SOCs within the DPE portfolio committed to support the National Skills Agenda through implementation of various skills initiatives, with a specific focus on scarce and critical skills. These initiatives include alignment of skills development programmes to the National Skills Development Strategy (NSDS) and National Skills Accord in support of the New Growth Path (NGP) and the National Development Plan (NDP). To ensure alignment to these interventions, the Department has established partnerships with the Department of Higher Education and Training (DHET), the Economic Development Department (EDD) and the Department of Trade and Industries (DTI). This is crucial to ensure that the skills development capacity of SOCs is leveraged to develop core and critical skills to meet the economy’s requirements.
The commitments made by SOCs and partnerships with relevant government departments has resulted in the enhancement of provisioning of scarce and critical skills by SOCs to address skills gaps within SOCs, as well as closing the national scarce and critical skills gaps. Thus SOCs’ alignment to the National Skills Accord focuses on the following commitments:
• Commitment 1: Expand the level of training using existing facilities more fully.• Commitment 2: Make internships and placement opportunities available within workplaces.• Commitment 5: Improve funding of training and the use of funds available for training and incentives.• Commitment 8: Improve the role and performance of FET Colleges.
These commitments have been translated to form part of the targets that are included in the shareholder compacts concluded with the Executive Authority. In the 2013/14 financial year, and in line with the National Skills Accord, SOCs collectively committed to enrol 2 764 new artisan trainees of which: 1 040 trainees were to be enrolled at Eskom; 1 550 were to be enrolled at Transnet; and the remainder were to be enrolled at South African Airways, South African Airways Express (SAX), Alexkor and SAFCOL.
Transnet’s enrolment includes 1000 additional artisan trainees funded through the R175 million from the National Skills Fund (NSF) to be trained over a period of three years, which will optimise their training facilities in addressing the national skills gaps and with a special focus on supporting SIPs. To this end, a Memorandum of Understanding (MoU) was concluded between the Department and the DHET in October 2013.
Other commitments made by SOC include: training of technicians and engineers supported through bursary schemes and internship programmes; enrolment for training of cadet pilots; and training of learners in scarce and critical skills in areas such as train drivers at Transnet, energy field workers at Eskom, forestry workers at SAFCOL and airport crew members at both SAA and SAX.
In addition, Eskom has also committed to ensuring that at least 2 500 matriculants and 2 500 graduates in the pipeline are trained in artisan trade skills and supported in work experiential learning programmes through Eskom and its supplier network.
As at 31 March 2014, a total of 2 109 new artisan trainees were enrolled at SOCs in the Department’s portfolio, of which: 1 569 artisans were enrolled at Transnet; 94 new artisan were enrolled at Eskom; 306 new artisan trainees enrolled at Denel (237 of the trainees enrolled for training through Denel Technical Academy partnerships with private companies); 147 artisan trainees enrolled at SAA; 36 artisan trainees enrolled at SAX; 4 and 6 artisan trainees enrolled at Alexkor and SAFCOL, respectively.
A total of 459 technician trainees (Transnet – 339; Eskom – 100; Denel – 12; Broadband Infraco – 6; SAFCOL - 2) and 367 engineering trainees (Transnet – 138; Eskom – 179; Denel – 41; Broadband Infraco – 4; and SAFCOL - 4) were enrolled in various programmes supported through bursary schemes and internship programmes. Other SOCs scarce and critical skills enrolments include 55 new cadet pilots enrolled for training at SAA (34) and SAX (21), with 2 176 new learners enrolled in sector specific scarce and critical skills learning programmes to address sector skills shortages.
Page 32
In addition, Eskom has enrolled 172 matriculants in artisan trade skills and 195 graduates in various work experiential learning programmes within Eskom and its supplier network. Thus, as at March 2014, Eskom and its suppliers had 2 718 matriculants and 1 607 graduates in the pipeline, who are being trained and placed in various learning programmes.
3.4 Outcome 7: Vibrant, equitable and sustainable rural communities with foodsecurity for all
ALEXKOR
The SOC has delivered on government obligations to the Richtersveld community, with a R120 million upgrade of the Alexander Bay Township infrastructure (roads, electrical and water reticulation and waste water treatment) being completed on 31 March 2013 and the town’s registration confirmed on 22 November 2013. This means that the town, which was previously a mining compound, is one of the new towns in South Africa and part of the Richtersveld Local Municipality. The value of property in the town that will be transferred to the community is estimated at R200 million.
The jointly-owned mine, which had previously seen its diamond production decrease substantially due to the land restitution process, has seen an improvement in carat production from 35 000 carats to over 50 000 carats. This has been on the back of a newly commissioned R50 million processing plant at Muisvlak near Port Nolloth, which has created 200 jobs for the community.
During the period under review, the Minister approved the strategy for the SOC to become a diversified mining company; this will include coal supply in support of the national energy security imperative. The Department is working closely with the SOC to ensure success of the strategy and significant projects will be announced in 2014/15.
SAFCOL
In 2012/13, the Department revised the SOC mandate to enable product diversification and further vertical integration. The SOC will announce the new corporate strategy within the ambits of the revised role in 2014/15. As at the end of the financial year, SAFCOL spent R6,591 million on socio-economic development initiatives. This represents 3.3% of the Net Profit After Tax (NPAT) - a significant achievement compared to the Shareholder Compact (SHC) target of 1%. SAFCOL continues to create jobs in communities surrounding its plantations through the Extended Public Works Programme (EPWP).
SAFCOL completed 11 socio-economic development initiative projects during the 2013/14 financial year.
Details of the completed projects are as follows:• Emhlabaneni Primary School (classroom and ablution block)• Esihlengeni Combined School (supplied 20 new computers and installed table tops, ICT burglar proofing
and electrical work)• Mayflower Disability Centre (retaining walls and burglar proofing)• Dinethemba and Daviddale ECD centres (wash basins and ablution blocks)• Tshitavhadulu Community Hall (new building)• Mantjolo Market Stalls (market stalls and ablution facility)• Ntabamhlophe Primary School (3 ablution blocks)• Thathe-Vondo Guest House (renovations)• Leroro Shelter (burglar proofing)• Diepdale Youth Centre (site establishment has been completed and excavation of trenches is 90%
complete)• Desk Manufacturing Project (industrial machines and tools have been procured)
Page 33
4. PERFORMANCE INFORMATION BY PROGRAMME
4.1 Programme 1 - Administration
PURPOSE: The programme provides strategic management, direction and administrative support to the Department, which enables the Department to meet its strategic objectives.
PROGRAMME OVERVIEW:The programme includes the Ministry, the Office of the Director-General and Support Services.
THE FOLLOWING UNITS FALL UNDER PROGRAMME 1:The programme is currently made up of the following sub-programmes: Ministry; Management; Corporate Services; Chief Financial Officer; Human Resources; Communications; Strategic Planning, Monitoring and Evaluation; Inter-Governmental and Stakeholder Relations; Internal Audit and Office Accommodation.
Office of the Director-General is responsible for Corporate Management.
CORPORATE SERVICES IS RESPONSIBLE FOR: Security and Facilities Management – Provide a safe and secure environment and internal administration and facilities and services to internal customers.
Information Management and Technology – IT infrastructure and support, Records Management and Library Services.
Office of the Chief Financial Officer is responsible for Financial Management Services to ensure: compliance with the PFMA and Treasury Regulations; and efficient and effective supply chain management services
Human Resources is responsible to partner with line management to achieve operational excellence and its human capital for the achievement of the departmental strategic objectives.
Communications is responsible for: repositioning the DPE as an activist shareholder; making the DPE brand relevant and meaningful to ordinary South Africans; impacting media relations and media communication; and improving employee engagement.
Strategic Planning, Monitoring and Evaluation is responsible for: co-ordination, management and oversight of outcomes-based performance reporting of the Department; implementation of performance monitoring and evaluation processes for individual programmes and business units, as a mechanism for measuring delivery of our strategic objectives; and reporting to various stakeholders.
Inter-Governmental and Stakeholder Relations is responsible for coordination, support and provision of advice to the Minister, the Deputy Minister, the Director-General and the Department on matters related to Inter-governmental, International and Stakeholder Relations.
Internal Audit is responsible for the preparation of a three-year strategic audit plan and a one-year internal audit plan based on its assessment of key risks for the Department, in consultation with and for approval by the Audit Committee.
Office Accommodation is required for the devolution of funds from the Department of Public Works for the DPE’s premises.
Page 34
4.1.1 Strategic Objective Annual Targets for 2013/14 for Administration
Office of the Director-General• Provide strategic direction and leadership to the Department.
Corporate Services• Information Management and Technology.• Security and facilities management.
Office of the Chief Financial Officer• Sound financial management policies and practices.
• An efficient and effective Supply Chain Management function.
Human Resources• Develop and implement talent management intervention • Drive high performance culture.• Effective, efficient and timeous recruitment and selection to ensure an adequately capacitated
Department.• Build internal talent pool through stuff development intervention and career management to ensure
continuous supply of human capital.
Communications• Provide strategic communication support that aligns with DPE goals and objectives to the executive
leadership and the Department.• Provide internal communication services, based on the Departmental mandate to ensure awareness,
understanding and acceptance of strategic and operational priorities of the Department.• Provide strategic stakeholder support on matters that are important to the Department. • Adhere to Government’s communication protocol and policy guidelines, and align with the strategic
priorities contained in the Government Communication Strategy.
Inter-Governmental Relations• Foster closer relations and co-operation between DPE and other departments to advance DPE’s mandate
and objectives. • Manage DPE International Relations’ responsibilities, ensuring alignment to South Africa’s Foreign
Policy. • Establish and maintain mutually beneficial relations with strategic stakeholders.
Strategic Planning, Monitoring and Evaluation• Co-ordination, management and oversight of outcomes-based performance reporting; performance
monitoring and evaluation and reporting to stakeholders.• Oversee strategic planning within the Department and ensure its alignment to Medium Term Strategic
Framework priorities. • Development and implementation of tools to support outcomes-based planning, monitoring and
reporting.
Internal Audit• Provide independent and objective assurance and consulting Internal Audit services that are designed
to add value and improve the Department’s operations.• Assist the Department to accomplish its objectives by bringing a systematic, disciplined approach to
evaluate and improve the effectiveness of risk management, control and governance processes.
4.1.2 Strategic objectives:
• Continued strengthening of financial management tools to maintain the clean audit record.• Strengthen the monitoring and evaluation function through review of the policy on management of
performance information. • Payment of invoices within 30 days.
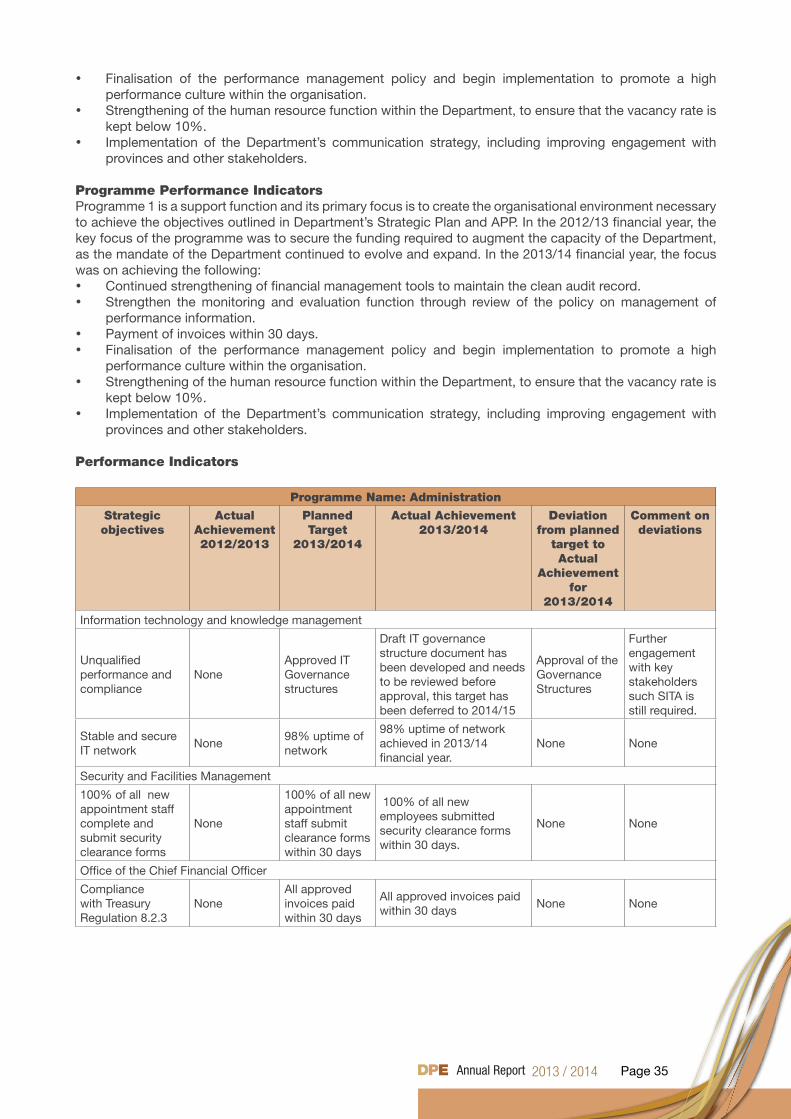
Page 35
• Finalisation of the performance management policy and begin implementation to promote a high performance culture within the organisation.
• Strengthening of the human resource function within the Department, to ensure that the vacancy rate is kept below 10%.
• Implementation of the Department’s communication strategy, including improving engagement with provinces and other stakeholders.
Programme Performance Indicators Programme 1 is a support function and its primary focus is to create the organisational environment necessary to achieve the objectives outlined in Department’s Strategic Plan and APP. In the 2012/13 financial year, the key focus of the programme was to secure the funding required to augment the capacity of the Department, as the mandate of the Department continued to evolve and expand. In the 2013/14 financial year, the focus was on achieving the following: • Continued strengthening of financial management tools to maintain the clean audit record.• Strengthen the monitoring and evaluation function through review of the policy on management of
performance information. • Payment of invoices within 30 days. • Finalisation of the performance management policy and begin implementation to promote a high
performance culture within the organisation. • Strengthening of the human resource function within the Department, to ensure that the vacancy rate is
kept below 10%. • Implementation of the Department’s communication strategy, including improving engagement with
provinces and other stakeholders.
Performance Indicators
Programme Name: Administration
Strategic objectives
Actual Achievement 2012/2013
Planned Target
2013/2014
Actual Achievement2013/2014
Deviation from planned
target to Actual
Achievement for
2013/2014
Comment on deviations
Information technology and knowledge management
Unqualified performance and compliance
NoneApproved IT Governance structures
Draft IT governance structure document has been developed and needs to be reviewed before approval, this target has been deferred to 2014/15
Approval of the Governance Structures
Further engagement with key stakeholders such SITA is still required.
Stable and secure IT network
None98% uptime of network
98% uptime of network achieved in 2013/14 financial year.
None None
Security and Facilities Management
100% of all new appointment staff complete and submit security clearance forms
None
100% of all new appointment staff submit clearance forms within 30 days
100% of all new employees submitted security clearance forms within 30 days.
None None
Office of the Chief Financial Officer
Compliance with Treasury Regulation 8.2.3
NoneAll approved invoices paid within 30 days
All approved invoices paid within 30 days
None None
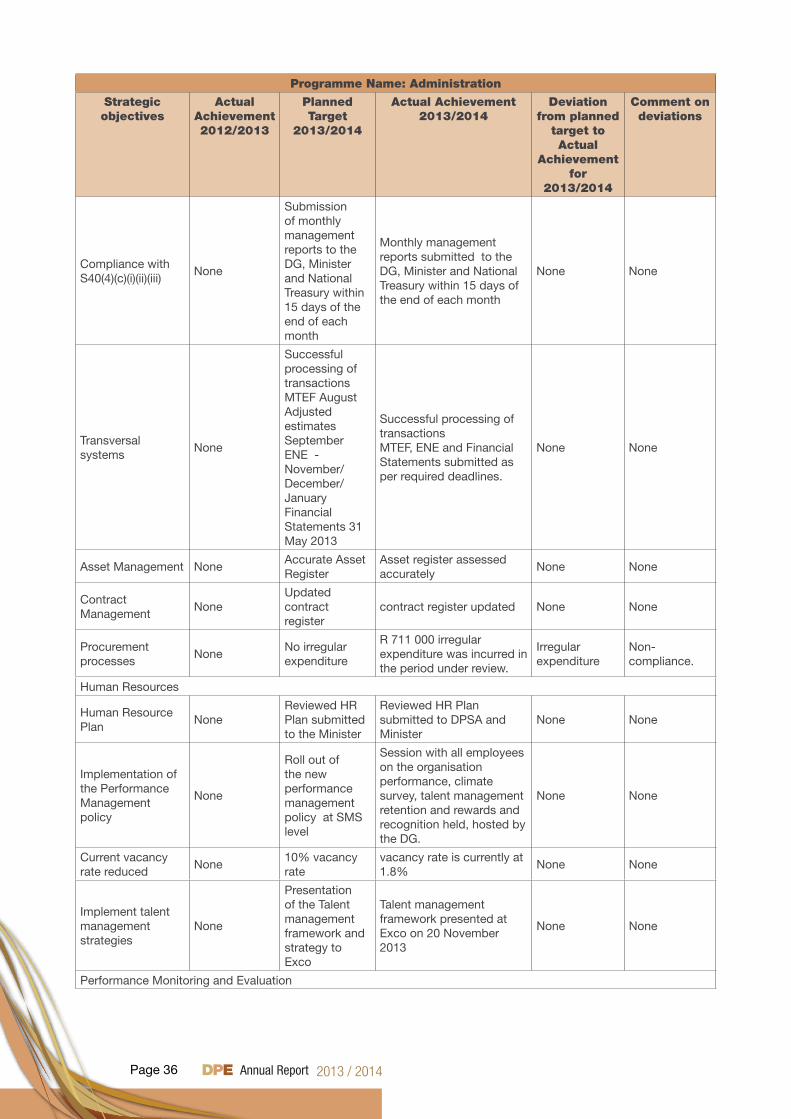
Page 36
Programme Name: Administration
Strategic objectives
Actual Achievement 2012/2013
Planned Target
2013/2014
Actual Achievement2013/2014
Deviation from planned
target to Actual
Achievement for
2013/2014
Comment on deviations
Compliance with S40(4)(c)(i)(ii)(iii)
None
Submission of monthly management reports to the DG, Minister and National Treasury within 15 days of the end of each month
Monthly management reports submitted to the DG, Minister and National Treasury within 15 days of the end of each month
None None
Transversal systems
None
Successful processing of transactions MTEF August Adjusted estimates September ENE - November/December/JanuaryFinancial Statements 31 May 2013
Successful processing of transactions MTEF, ENE and Financial Statements submitted as per required deadlines.
None None
Asset Management NoneAccurate Asset Register
Asset register assessed accurately
None None
Contract Management
NoneUpdated contract register
contract register updated None None
Procurement processes
NoneNo irregular expenditure
R 711 000 irregular expenditure was incurred in the period under review.
Irregular expenditure
Non-compliance.
Human Resources
Human Resource Plan
NoneReviewed HR Plan submitted to the Minister
Reviewed HR Plan submitted to DPSA and Minister
None None
Implementation of the Performance Management policy
None
Roll out of the new performance management policy at SMS level
Session with all employees on the organisation performance, climate survey, talent management retention and rewards and recognition held, hosted by the DG.
None None
Current vacancy rate reduced
None10% vacancy rate
vacancy rate is currently at 1.8%
None None
Implement talent management strategies
None
Presentation of the Talent management framework and strategy to Exco
Talent management framework presented at Exco on 20 November 2013
None None
Performance Monitoring and Evaluation
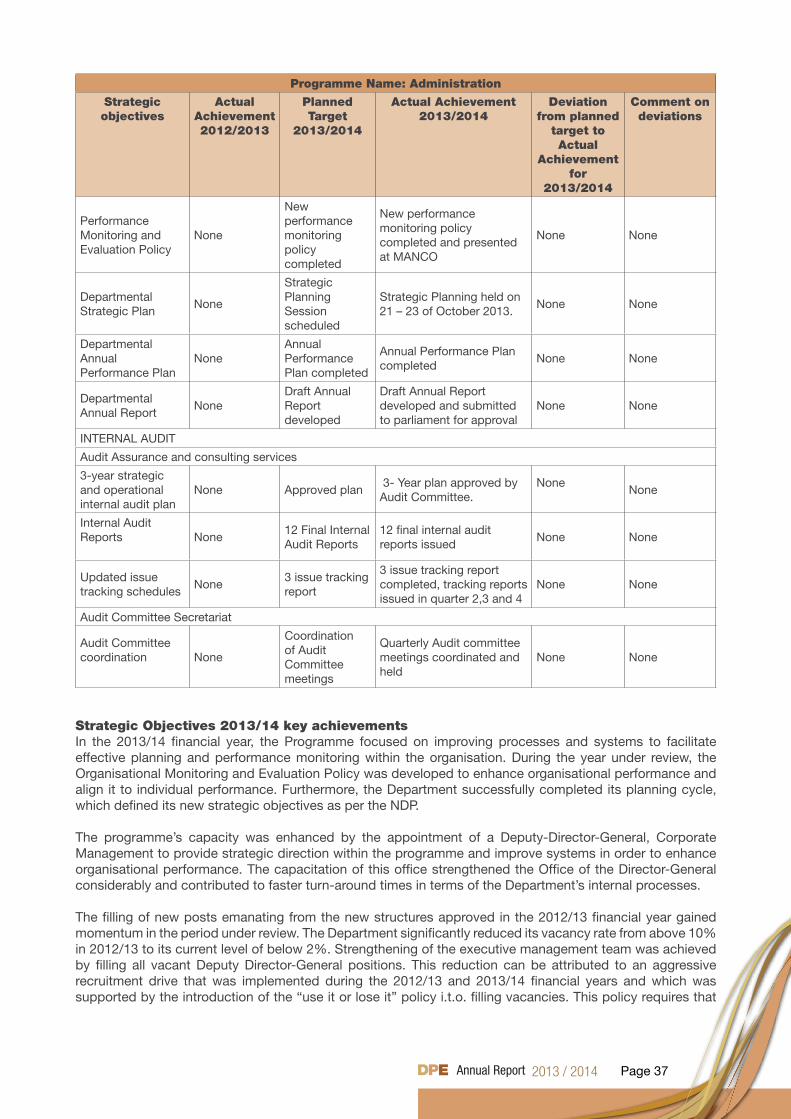
Page 37
Programme Name: Administration
Strategic objectives
Actual Achievement 2012/2013
Planned Target
2013/2014
Actual Achievement2013/2014
Deviation from planned
target to Actual
Achievement for
2013/2014
Comment on deviations
Performance Monitoring and Evaluation Policy
None
New performance monitoring policy completed
New performance monitoring policy completed and presented at MANCO
None None
Departmental Strategic Plan
None
Strategic Planning Session scheduled
Strategic Planning held on 21 – 23 of October 2013.
None None
Departmental Annual Performance Plan
NoneAnnual Performance Plan completed
Annual Performance Plan completed
None None
Departmental Annual Report
NoneDraft Annual Report developed
Draft Annual Report developed and submitted to parliament for approval
None None
INTERNAL AUDIT
Audit Assurance and consulting services
3-year strategic and operational internal audit plan
None Approved plan 3- Year plan approved by Audit Committee.
NoneNone
Internal Audit Reports None
12 Final Internal Audit Reports
12 final internal audit reports issued
None None
Updated issue tracking schedules
None3 issue tracking report
3 issue tracking report completed, tracking reports issued in quarter 2,3 and 4
None None
Audit Committee Secretariat
Audit Committee coordination None
Coordination of Audit Committee meetings
Quarterly Audit committee meetings coordinated and held
None None
Strategic Objectives 2013/14 key achievements In the 2013/14 financial year, the Programme focused on improving processes and systems to facilitate effective planning and performance monitoring within the organisation. During the year under review, the Organisational Monitoring and Evaluation Policy was developed to enhance organisational performance and align it to individual performance. Furthermore, the Department successfully completed its planning cycle, which defined its new strategic objectives as per the NDP.
The programme’s capacity was enhanced by the appointment of a Deputy-Director-General, Corporate Management to provide strategic direction within the programme and improve systems in order to enhance organisational performance. The capacitation of this office strengthened the Office of the Director-General considerably and contributed to faster turn-around times in terms of the Department’s internal processes.
The filling of new posts emanating from the new structures approved in the 2012/13 financial year gained momentum in the period under review. The Department significantly reduced its vacancy rate from above 10% in 2012/13 to its current level of below 2%. Strengthening of the executive management team was achieved by filling all vacant Deputy Director-General positions. This reduction can be attributed to an aggressive recruitment drive that was implemented during the 2012/13 and 2013/14 financial years and which was supported by the introduction of the “use it or lose it” policy i.t.o. filling vacancies. This policy requires that
Page 38
a vacant position is filled within three months by a unit or the post is transferred to a unit where a need for additional capacity exists.
The Department initiated a project to identify its strategic capabilities and skills gaps relating to its ability to deliver on the set objectives. This project will be anchored by a Talent Management Programme aimed at identifying core and critical skills needed by the Department to deliver on its strategic objectives. These processes will ensure that high performers in critical positions are retained, in line with the developed Attraction and Retention Policy. SMS members’ contract positions in the Department were converted to permanent positions to support the attraction and retention of talent
The Programme continued to manage the Department’s image and mitigate against reputational risks that arose during the financial year under review. The Programme heightened its efforts to position the DPE as an activist shareholder with a positive brand profile through targeted media events. The Programme maintained consistent visibility in the different media and this broadened the distribution of messages from the Department to all corners of the country.
The use of different media platforms, especially new media and social media, became a regular feature. The Department’s global interface website, www.dpe.gov.za, was re-launched with updated information and accessible navigation features. Stakeholder management was boosted with the successful revival of the SOC Communicator’s Forum and through this structure regular events were held throughout the country.
Internal communication programmes also became a regular feature of the Department’s activities, with its schedule of events involving staff including the launch of the Learning Forum, to which external experts are invited to discuss topics, including the NDP.
The Department hosted a BRICS senior officials meeting in Pretoria, which was chaired by the Director-General. This meeting emanated from the BRICS summit held earlier in Durban, at which member countries agreed to enjoin BRICS Ministers responsible for shareholder oversight over SOCs to explore ways of cooperation and the exchange of information and best practices. A Joint Declaration was agreed on and it will be considered by the BRICS Ministers in the 2014/15 financial year. Another milestone was the MoU signed between the Department and the State-Owned Assets Supervision and Administration Commission of the State Council of China, the scope being to enhance information sharing efforts regarding shareholder management practices and other matters of mutual interest.
The Department has continued to strengthen its inter-governmental programme through its provincial engagement programme. Meetings were held with seven Provincial Governments, i.e.: Gauteng, Northern Cape, Eastern Cape, North West, Free State, KwaZulu-Natal and Limpopo. These engagement sessions were held to establish task teams, led by the Deputy Minister and relevant MECs, which are to: enhance alignment between the investment plans of SOCs and the Provincial Growth and Development Strategies; enhance the quality and scale of relationships between SOCs and provincial stakeholders.
The Internal Audit unit completed all planned audits as per the approved Annual Operational Plan. Audit reports were issued to management, with comprehensive recommendations provided to address identified internal control weaknesses. The Internal Audit unit communicated results for the completed audits to the Audit Committee and the Department’s Executive. This was targeted to strengthen internal controls.
Vetting of staff has been strengthened and currently 90% of all staff (new and old) have completed and submitted their security vetting forms to the State Security Agency for vetting. All candidates shortlisted for interviews were subjected to pre-employment screening. Information security audits were conducted by all the units in the Department.
The establishment of the ICT Steering Committee has made the Department compliant with the ICT Corporate Governance environment.ICT was also successfully transformed from an outsourced function to a fully in-sourced function.
Changes to Planned Targets The Department continuously reviews the relevance of its APP to ensure that it remains relevant and appropriate to support the government outcomes. In the period under review, the Department undertook a review of its
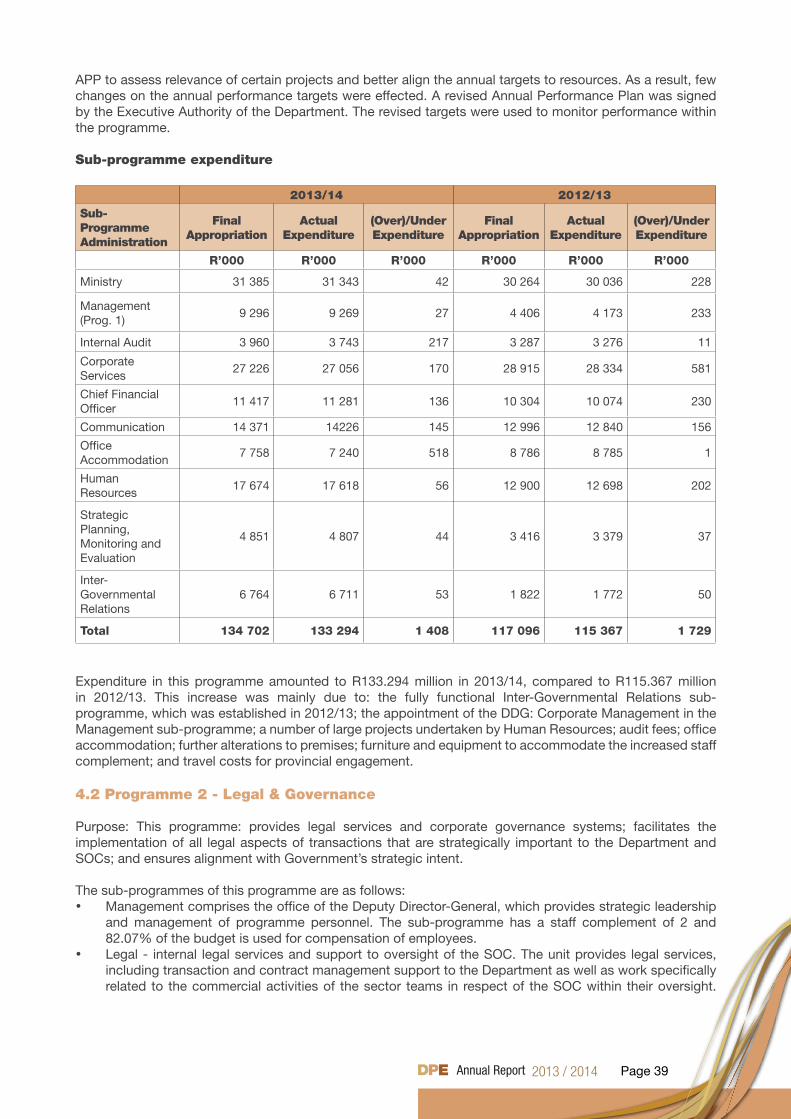
Page 39
APP to assess relevance of certain projects and better align the annual targets to resources. As a result, few changes on the annual performance targets were effected. A revised Annual Performance Plan was signed by the Executive Authority of the Department. The revised targets were used to monitor performance within the programme. Sub-programme expenditure
2013/14 2012/13
Sub-Programme Administration
Final Appropriation
ActualExpenditure
(Over)/Under Expenditure
Final Appropriation
ActualExpenditure
(Over)/Under Expenditure
R’000 R’000 R’000 R’000 R’000 R’000
Ministry 31 385 31 343 42 30 264 30 036 228
Management (Prog. 1)
9 296 9 269 27 4 406 4 173 233
Internal Audit 3 960 3 743 217 3 287 3 276 11
Corporate Services
27 226 27 056 170 28 915 28 334 581
Chief Financial Officer
11 417 11 281 136 10 304 10 074 230
Communication 14 371 14226 145 12 996 12 840 156
Office Accommodation
7 758 7 240 518 8 786 8 785 1
Human Resources
17 674 17 618 56 12 900 12 698 202
Strategic Planning, Monitoring and Evaluation
4 851 4 807 44 3 416 3 379 37
Inter-Governmental Relations
6 764 6 711 53 1 822 1 772 50
Total 134 702 133 294 1 408 117 096 115 367 1 729
Expenditure in this programme amounted to R133.294 million in 2013/14, compared to R115.367 million in 2012/13. This increase was mainly due to: the fully functional Inter-Governmental Relations sub-programme, which was established in 2012/13; the appointment of the DDG: Corporate Management in the Management sub-programme; a number of large projects undertaken by Human Resources; audit fees; office accommodation; further alterations to premises; furniture and equipment to accommodate the increased staff complement; and travel costs for provincial engagement.
4.2 Programme 2 - Legal & Governance
Purpose: This programme: provides legal services and corporate governance systems; facilitates the implementation of all legal aspects of transactions that are strategically important to the Department and SOCs; and ensures alignment with Government’s strategic intent.
The sub-programmes of this programme are as follows:• Management comprises the office of the Deputy Director-General, which provides strategic leadership
and management of programme personnel. The sub-programme has a staff complement of 2 and 82.07% of the budget is used for compensation of employees.
• Legal - internal legal services and support to oversight of the SOC. The unit provides legal services, including transaction and contract management support to the Department as well as work specifically related to the commercial activities of the sector teams in respect of the SOC within their oversight.
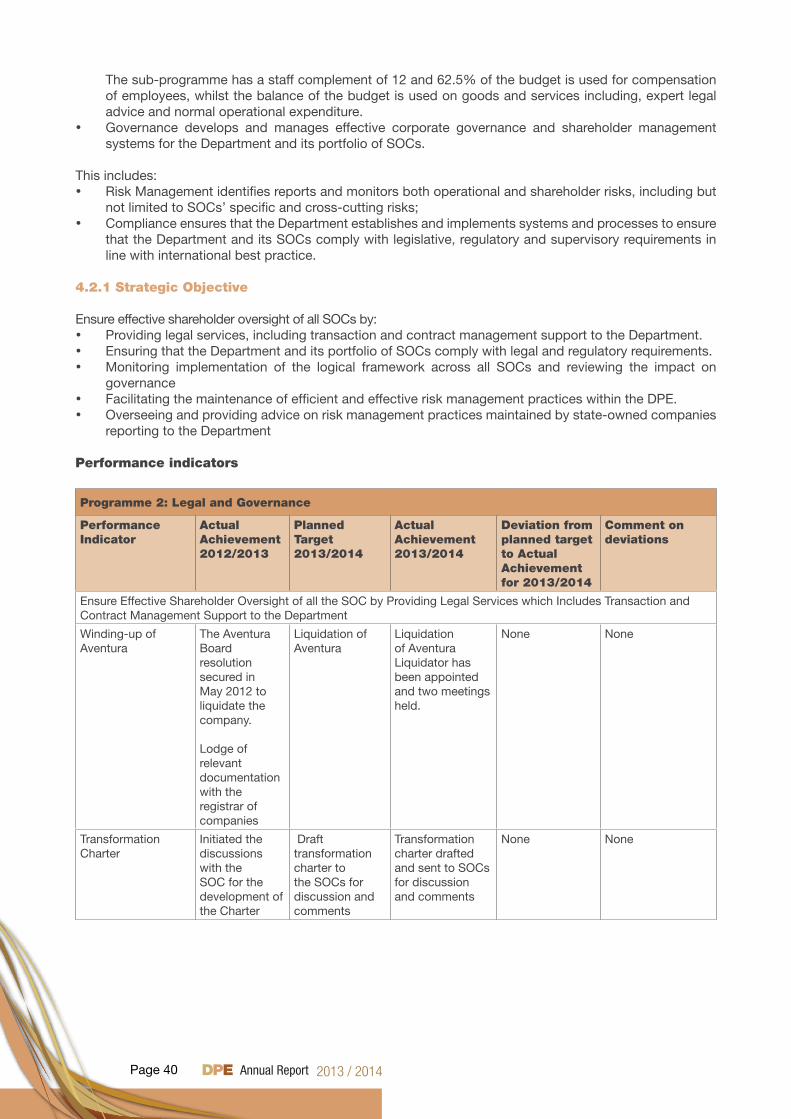
Page 40
The sub-programme has a staff complement of 12 and 62.5% of the budget is used for compensation of employees, whilst the balance of the budget is used on goods and services including, expert legal advice and normal operational expenditure.
• Governance develops and manages effective corporate governance and shareholder management systems for the Department and its portfolio of SOCs.
This includes:• Risk Management identifies reports and monitors both operational and shareholder risks, including but
not limited to SOCs’ specific and cross-cutting risks;• Compliance ensures that the Department establishes and implements systems and processes to ensure
that the Department and its SOCs comply with legislative, regulatory and supervisory requirements in line with international best practice.
4.2.1 Strategic Objective
Ensure effective shareholder oversight of all SOCs by:• Providing legal services, including transaction and contract management support to the Department.• Ensuring that the Department and its portfolio of SOCs comply with legal and regulatory requirements.• Monitoring implementation of the logical framework across all SOCs and reviewing the impact on
governance • Facilitating the maintenance of efficient and effective risk management practices within the DPE. • Overseeing and providing advice on risk management practices maintained by state-owned companies
reporting to the Department
Performance indicators
Programme 2: Legal and Governance
Performance Indicator
Actual Achievement 2012/2013
Planned Target2013/2014
Actual Achievement2013/2014
Deviation from planned target to Actual Achievement for 2013/2014
Comment on deviations
Ensure Effective Shareholder Oversight of all the SOC by Providing Legal Services which Includes Transaction and Contract Management Support to the Department
Winding-up of Aventura
The Aventura Board resolution secured in May 2012 to liquidate the company.
Lodge of relevant documentation with the registrar of companies
Liquidation of Aventura
Liquidation of Aventura Liquidator has been appointed and two meetings held.
None None
Transformation Charter
Initiated the discussions with the SOC for the development of the Charter
Draft transformation charter to the SOCs for discussion and comments
Transformation charter drafted and sent to SOCs for discussion and comments
None None
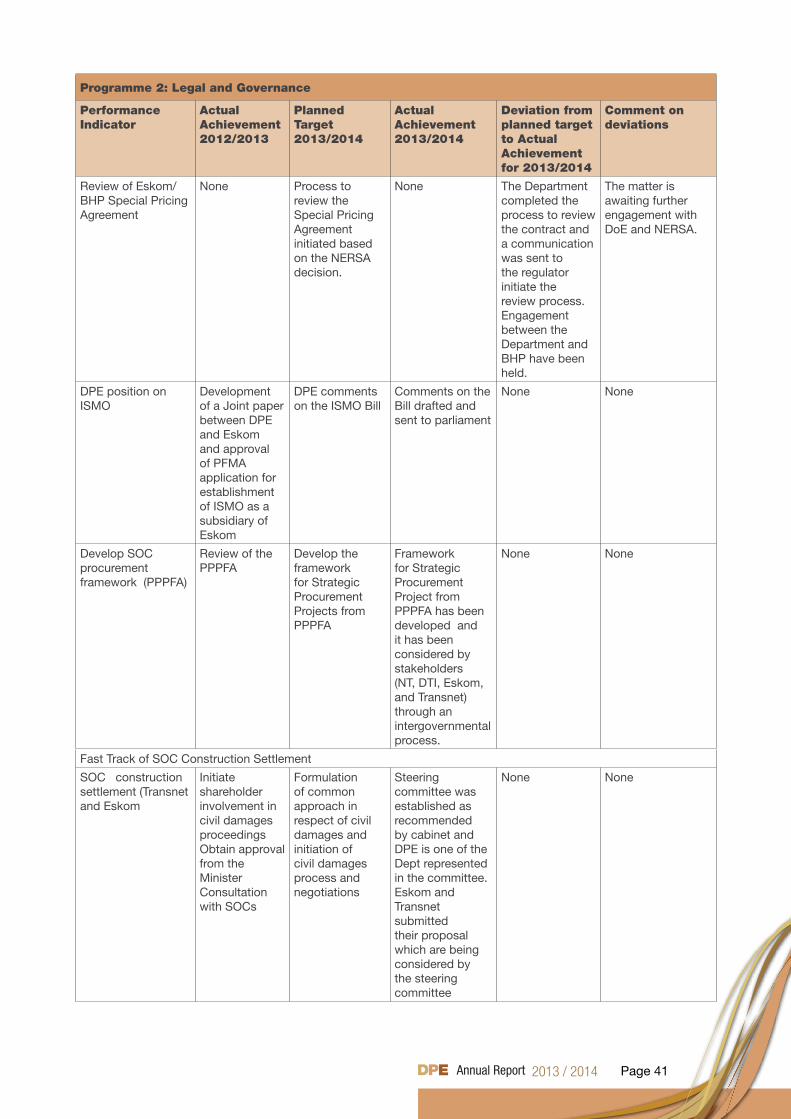
Page 41
Programme 2: Legal and Governance
Performance Indicator
Actual Achievement 2012/2013
Planned Target2013/2014
Actual Achievement2013/2014
Deviation from planned target to Actual Achievement for 2013/2014
Comment on deviations
Review of Eskom/BHP Special Pricing Agreement
None Process to review the Special Pricing Agreement initiated based on the NERSA decision.
None The Department completed the process to review the contract and a communication was sent to the regulator initiate the review process. Engagement between the Department and BHP have been held.
The matter is awaiting further engagement with DoE and NERSA.
DPE position on ISMO
Development of a Joint paper between DPE and Eskom and approval of PFMA application for establishment of ISMO as a subsidiary of Eskom
DPE comments on the ISMO Bill
Comments on the Bill drafted and sent to parliament
None None
Develop SOC procurement framework (PPPFA)
Review of the PPPFA
Develop the framework for Strategic Procurement Projects from PPPFA
Framework for Strategic Procurement Project from PPPFA has been developed and it has been considered by stakeholders (NT, DTI, Eskom, and Transnet) through an intergovernmental process.
None None
Fast Track of SOC Construction Settlement
SOC construction settlement (Transnet and Eskom
Initiate shareholder involvement in civil damages proceedingsObtain approval from the MinisterConsultation with SOCs
Formulation of common approach in respect of civil damages and initiation of civil damages process and negotiations
Steering committee was established as recommended by cabinet and DPE is one of the Dept represented in the committee. Eskom and Transnet submitted their proposal which are being considered by the steering committee
None None
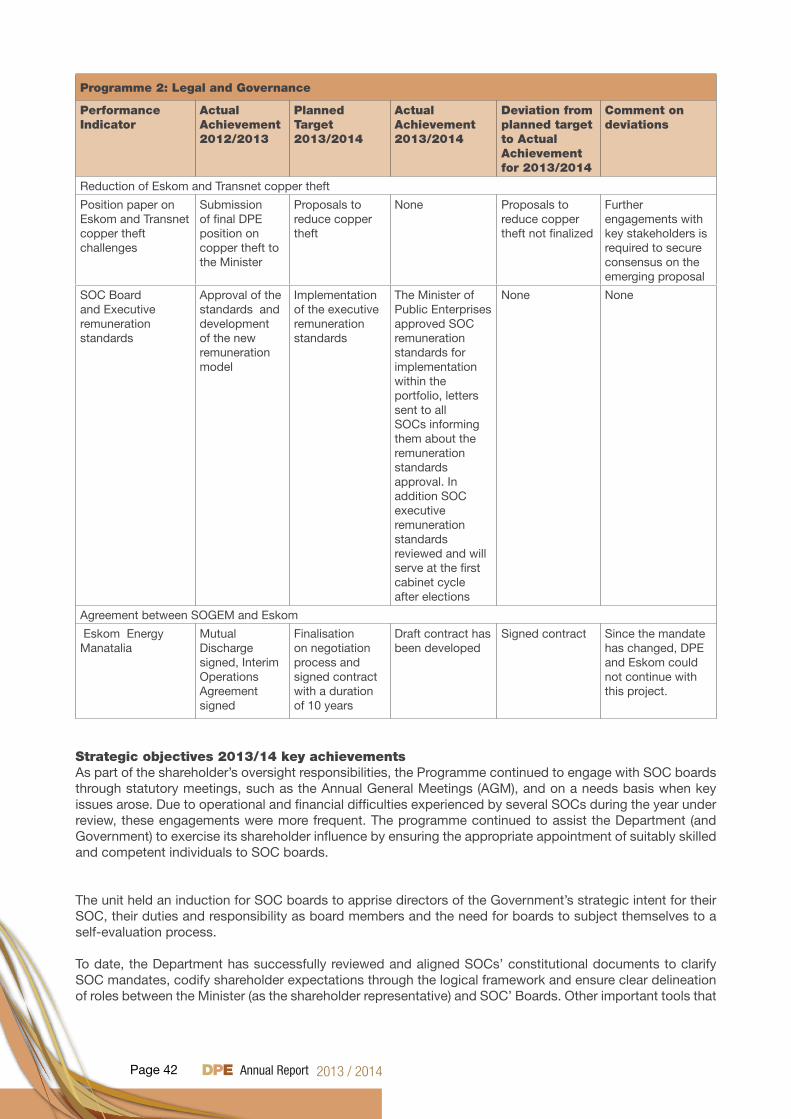
Page 42
Programme 2: Legal and Governance
Performance Indicator
Actual Achievement 2012/2013
Planned Target2013/2014
Actual Achievement2013/2014
Deviation from planned target to Actual Achievement for 2013/2014
Comment on deviations
Reduction of Eskom and Transnet copper theft
Position paper on Eskom and Transnet copper theft challenges
Submission of final DPE position on copper theft to the Minister
Proposals to reduce copper theft
None Proposals to reduce copper theft not finalized
Further engagements with key stakeholders is required to secure consensus on the emerging proposal
SOC Board and Executive remuneration standards
Approval of the standards and development of the new remuneration model
Implementation of the executive remuneration standards
The Minister of Public Enterprises approved SOC remuneration standards for implementation within the portfolio, letters sent to all SOCs informing them about the remuneration standards approval. In addition SOC executive remuneration standards reviewed and will serve at the first cabinet cycle after elections
None None
Agreement between SOGEM and Eskom
Eskom Energy Manatalia
Mutual Discharge signed, Interim Operations Agreement signed
Finalisation on negotiation process and signed contract with a duration of 10 years
Draft contract has been developed
Signed contract Since the mandate has changed, DPE and Eskom could not continue with this project.
Strategic objectives 2013/14 key achievementsAs part of the shareholder’s oversight responsibilities, the Programme continued to engage with SOC boards through statutory meetings, such as the Annual General Meetings (AGM), and on a needs basis when key issues arose. Due to operational and financial difficulties experienced by several SOCs during the year under review, these engagements were more frequent. The programme continued to assist the Department (and Government) to exercise its shareholder influence by ensuring the appropriate appointment of suitably skilled and competent individuals to SOC boards.
The unit held an induction for SOC boards to apprise directors of the Government’s strategic intent for their SOC, their duties and responsibility as board members and the need for boards to subject themselves to a self-evaluation process.
To date, the Department has successfully reviewed and aligned SOCs’ constitutional documents to clarify SOC mandates, codify shareholder expectations through the logical framework and ensure clear delineation of roles between the Minister (as the shareholder representative) and SOC’ Boards. Other important tools that
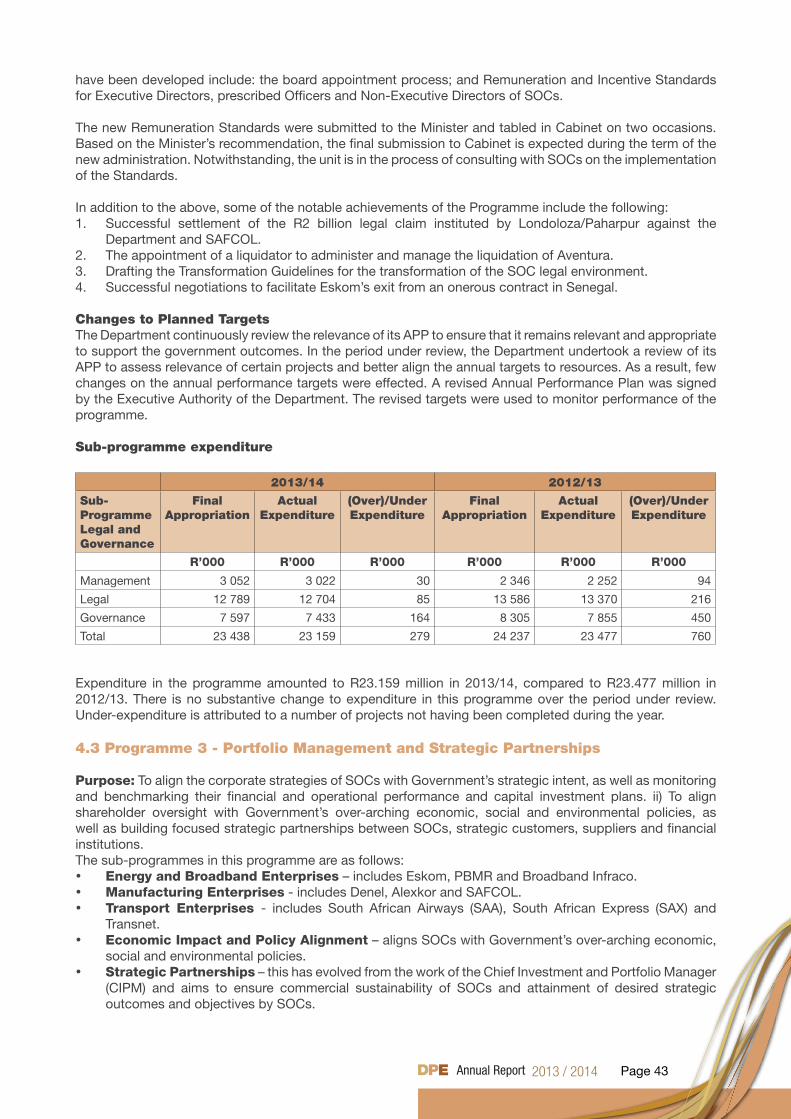
Page 43
have been developed include: the board appointment process; and Remuneration and Incentive Standards for Executive Directors, prescribed Officers and Non-Executive Directors of SOCs.
The new Remuneration Standards were submitted to the Minister and tabled in Cabinet on two occasions. Based on the Minister’s recommendation, the final submission to Cabinet is expected during the term of the new administration. Notwithstanding, the unit is in the process of consulting with SOCs on the implementation of the Standards.
In addition to the above, some of the notable achievements of the Programme include the following:1. Successful settlement of the R2 billion legal claim instituted by Londoloza/Paharpur against the
Department and SAFCOL.2. The appointment of a liquidator to administer and manage the liquidation of Aventura.3. Drafting the Transformation Guidelines for the transformation of the SOC legal environment.4. Successful negotiations to facilitate Eskom’s exit from an onerous contract in Senegal.
Changes to Planned Targets The Department continuously review the relevance of its APP to ensure that it remains relevant and appropriate to support the government outcomes. In the period under review, the Department undertook a review of its APP to assess relevance of certain projects and better align the annual targets to resources. As a result, few changes on the annual performance targets were effected. A revised Annual Performance Plan was signed by the Executive Authority of the Department. The revised targets were used to monitor performance of the programme.
Sub-programme expenditure
2013/14 2012/13
Sub- Programme Legal and Governance
Final Appropriation
ActualExpenditure
(Over)/Under Expenditure
Final Appropriation
ActualExpenditure
(Over)/Under Expenditure
R’000 R’000 R’000 R’000 R’000 R’000
Management 3 052 3 022 30 2 346 2 252 94
Legal 12 789 12 704 85 13 586 13 370 216
Governance 7 597 7 433 164 8 305 7 855 450
Total 23 438 23 159 279 24 237 23 477 760
Expenditure in the programme amounted to R23.159 million in 2013/14, compared to R23.477 million in 2012/13. There is no substantive change to expenditure in this programme over the period under review. Under-expenditure is attributed to a number of projects not having been completed during the year.
4.3 Programme 3 - Portfolio Management and Strategic Partnerships
Purpose: To align the corporate strategies of SOCs with Government’s strategic intent, as well as monitoring and benchmarking their financial and operational performance and capital investment plans. ii) To align shareholder oversight with Government’s over-arching economic, social and environmental policies, as well as building focused strategic partnerships between SOCs, strategic customers, suppliers and financial institutions.The sub-programmes in this programme are as follows:• Energy and Broadband Enterprises – includes Eskom, PBMR and Broadband Infraco.• Manufacturing Enterprises - includes Denel, Alexkor and SAFCOL.• Transport Enterprises - includes South African Airways (SAA), South African Express (SAX) and
Transnet.• Economic Impact and Policy Alignment – aligns SOCs with Government’s over-arching economic,
social and environmental policies.• Strategic Partnerships – this has evolved from the work of the Chief Investment and Portfolio Manager
(CIPM) and aims to ensure commercial sustainability of SOCs and attainment of desired strategic outcomes and objectives by SOCs.
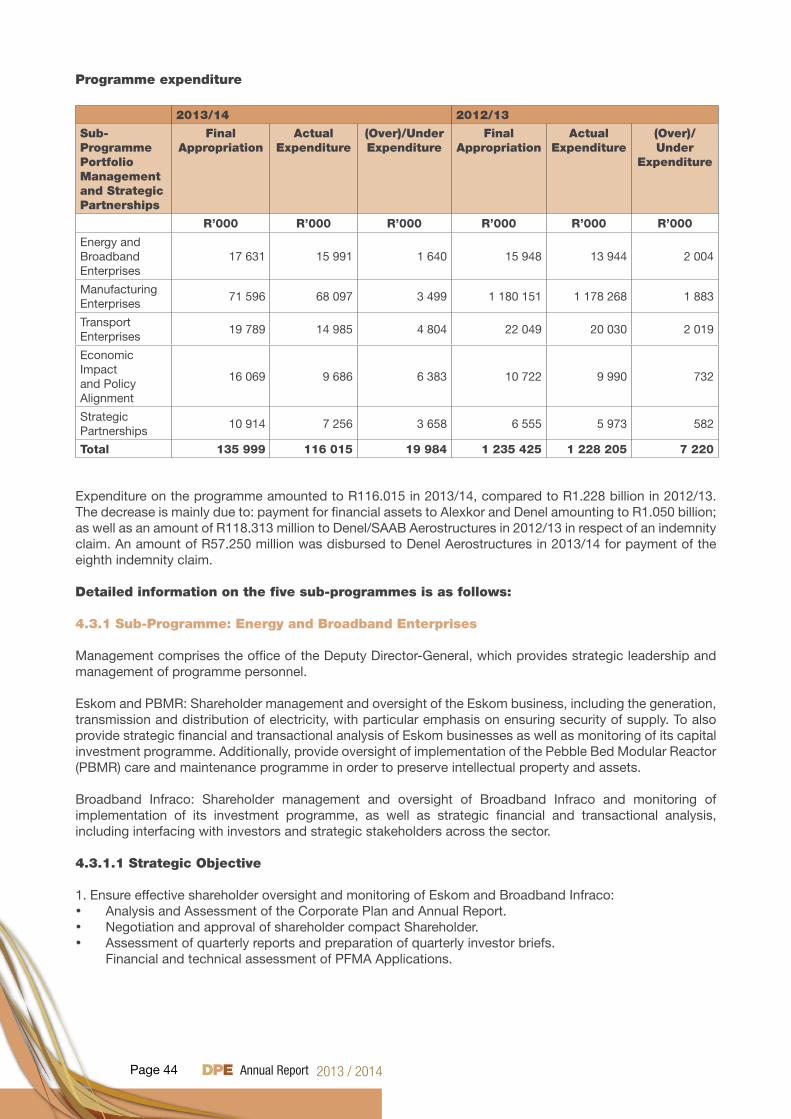
Page 44
Programme expenditure
2013/14 2012/13
Sub-Programme Portfolio Management and Strategic Partnerships
Final Appropriation
ActualExpenditure
(Over)/Under Expenditure
Final Appropriation
ActualExpenditure
(Over)/Under
Expenditure
R’000 R’000 R’000 R’000 R’000 R’000
Energy and Broadband Enterprises
17 631 15 991 1 640 15 948 13 944 2 004
Manufacturing Enterprises
71 596 68 097 3 499 1 180 151 1 178 268 1 883
Transport Enterprises
19 789 14 985 4 804 22 049 20 030 2 019
Economic Impact and Policy Alignment
16 069 9 686 6 383 10 722 9 990 732
Strategic Partnerships
10 914 7 256 3 658 6 555 5 973 582
Total 135 999 116 015 19 984 1 235 425 1 228 205 7 220
Expenditure on the programme amounted to R116.015 in 2013/14, compared to R1.228 billion in 2012/13. The decrease is mainly due to: payment for financial assets to Alexkor and Denel amounting to R1.050 billion; as well as an amount of R118.313 million to Denel/SAAB Aerostructures in 2012/13 in respect of an indemnity claim. An amount of R57.250 million was disbursed to Denel Aerostructures in 2013/14 for payment of the eighth indemnity claim.
Detailed information on the five sub-programmes is as follows:
4.3.1 Sub-Programme: Energy and Broadband Enterprises
Management comprises the office of the Deputy Director-General, which provides strategic leadership and management of programme personnel.
Eskom and PBMR: Shareholder management and oversight of the Eskom business, including the generation, transmission and distribution of electricity, with particular emphasis on ensuring security of supply. To also provide strategic financial and transactional analysis of Eskom businesses as well as monitoring of its capital investment programme. Additionally, provide oversight of implementation of the Pebble Bed Modular Reactor (PBMR) care and maintenance programme in order to preserve intellectual property and assets.
Broadband Infraco: Shareholder management and oversight of Broadband Infraco and monitoring of implementation of its investment programme, as well as strategic financial and transactional analysis, including interfacing with investors and strategic stakeholders across the sector.
4.3.1.1 Strategic Objective
1. Ensure effective shareholder oversight and monitoring of Eskom and Broadband Infraco: • Analysis and Assessment of the Corporate Plan and Annual Report. • Negotiation and approval of shareholder compact Shareholder.• Assessment of quarterly reports and preparation of quarterly investor briefs. Financial and technical assessment of PFMA Applications.
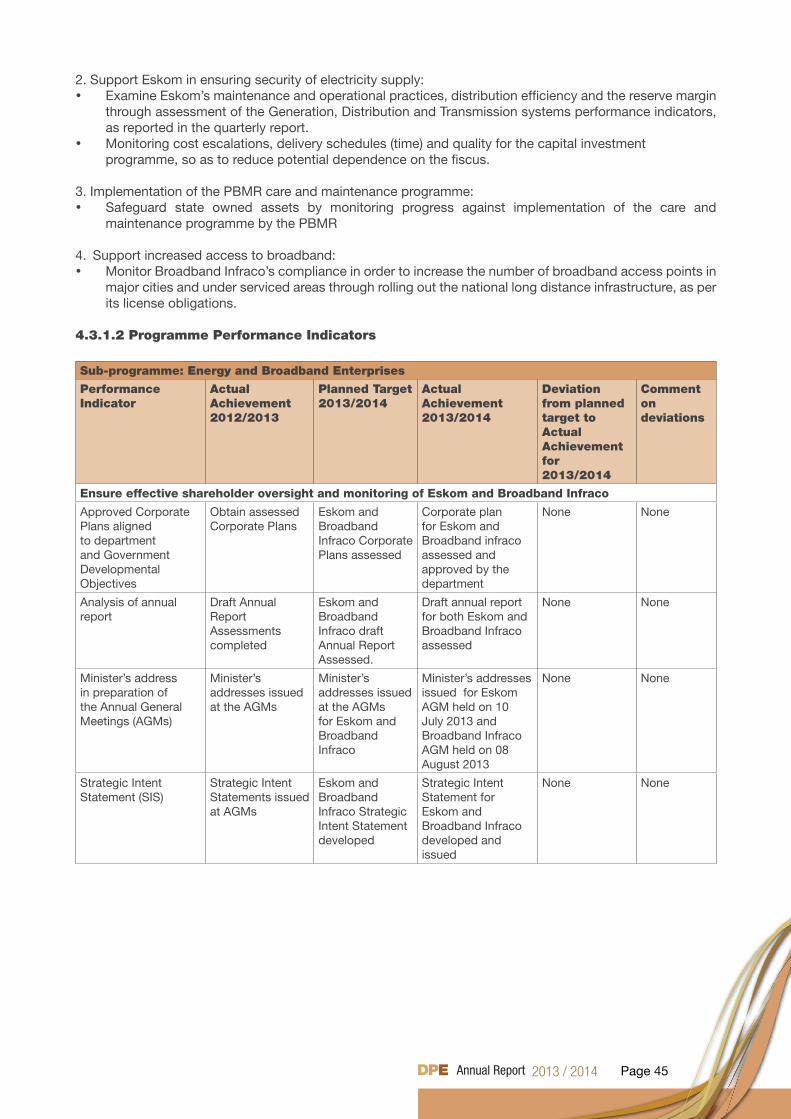
Page 45
2. Support Eskom in ensuring security of electricity supply:• Examine Eskom’s maintenance and operational practices, distribution efficiency and the reserve margin
through assessment of the Generation, Distribution and Transmission systems performance indicators, as reported in the quarterly report.
• Monitoring cost escalations, delivery schedules (time) and quality for the capital investment programme, so as to reduce potential dependence on the fiscus.
3. Implementation of the PBMR care and maintenance programme: • Safeguard state owned assets by monitoring progress against implementation of the care and
maintenance programme by the PBMR
4. Support increased access to broadband:• Monitor Broadband Infraco’s compliance in order to increase the number of broadband access points in
major cities and under serviced areas through rolling out the national long distance infrastructure, as per its license obligations.
4.3.1.2 Programme Performance Indicators
Sub-programme: Energy and Broadband Enterprises
Performance Indicator
Actual Achievement 2012/2013
Planned Target2013/2014
Actual Achievement2013/2014
Deviation from planned target to Actual Achievement for 2013/2014
Comment on deviations
Ensure effective shareholder oversight and monitoring of Eskom and Broadband Infraco
Approved Corporate Plans aligned to department and Government Developmental Objectives
Obtain assessed Corporate Plans
Eskom and Broadband Infraco Corporate Plans assessed
Corporate plan for Eskom and Broadband infraco assessed and approved by the department
None None
Analysis of annual report
Draft Annual Report Assessments completed
Eskom and Broadband Infraco draft Annual Report Assessed.
Draft annual report for both Eskom and Broadband Infraco assessed
None None
Minister’s address in preparation of the Annual General Meetings (AGMs)
Minister’s addresses issued at the AGMs
Minister’s addresses issued at the AGMs for Eskom and Broadband Infraco
Minister’s addresses issued for Eskom AGM held on 10 July 2013 and Broadband Infraco AGM held on 08 August 2013
None None
Strategic Intent Statement (SIS)
Strategic Intent Statements issued at AGMs
Eskom and Broadband Infraco Strategic Intent Statement developed
Strategic Intent Statement for Eskom and Broadband Infraco developed and issued
None None
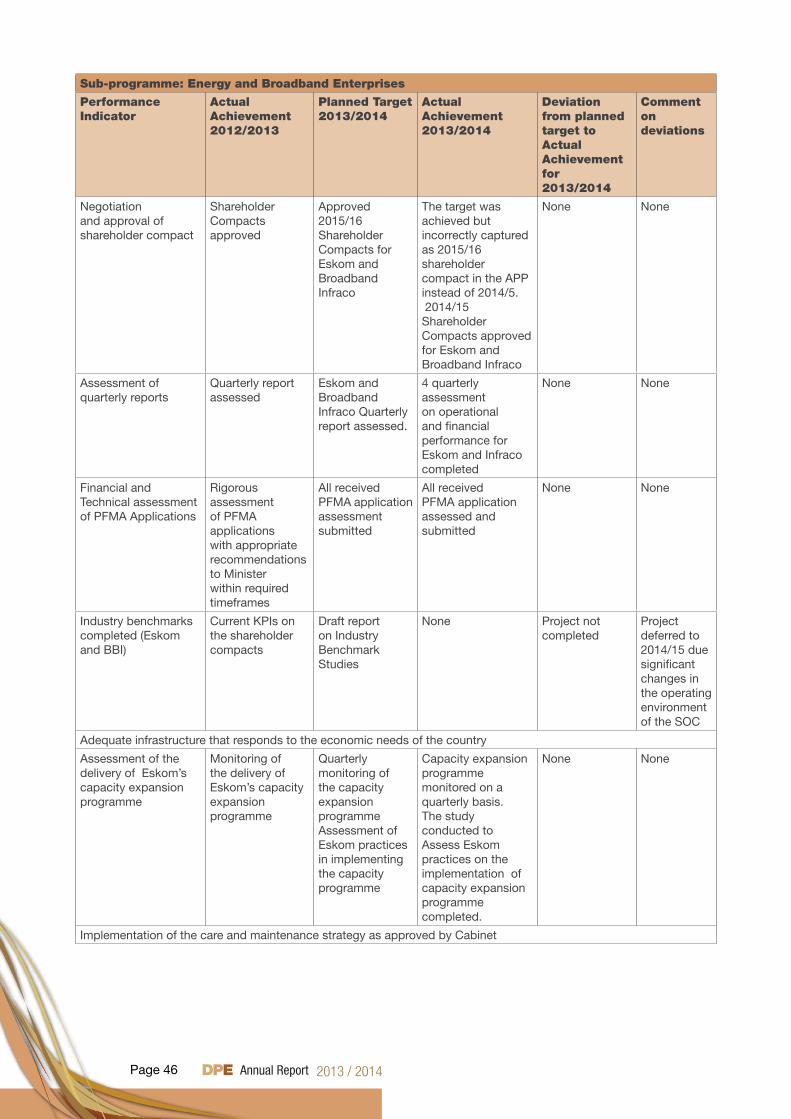
Page 46
Sub-programme: Energy and Broadband Enterprises
Performance Indicator
Actual Achievement 2012/2013
Planned Target2013/2014
Actual Achievement2013/2014
Deviation from planned target to Actual Achievement for 2013/2014
Comment on deviations
Negotiation and approval of shareholder compact
Shareholder Compacts approved
Approved 2015/16 Shareholder Compacts for Eskom and Broadband Infraco
The target was achieved but incorrectly captured as 2015/16 shareholder compact in the APP instead of 2014/5. 2014/15 Shareholder Compacts approved for Eskom and Broadband Infraco
None None
Assessment of quarterly reports
Quarterly report assessed
Eskom and Broadband Infraco Quarterly report assessed.
4 quarterly assessment on operational and financial performance for Eskom and Infraco completed
None None
Financial and Technical assessment of PFMA Applications
Rigorous assessment of PFMA applications with appropriate recommendations to Minister within required timeframes
All received PFMA application assessment submitted
All received PFMA application assessed and submitted
None None
Industry benchmarks completed (Eskom and BBI)
Current KPIs on the shareholder compacts
Draft report on Industry Benchmark Studies
None Project not completed
Project deferred to 2014/15 due significant changes in the operating environment of the SOC
Adequate infrastructure that responds to the economic needs of the country
Assessment of the delivery of Eskom’s capacity expansion programme
Monitoring of the delivery of Eskom’s capacity expansion programme
Quarterly monitoring of the capacity expansion programmeAssessment of Eskom practices in implementing the capacity programme
Capacity expansion programme monitored on a quarterly basis.The study conducted to Assess Eskom practices on the implementation of capacity expansion programme completed.
None None
Implementation of the care and maintenance strategy as approved by Cabinet
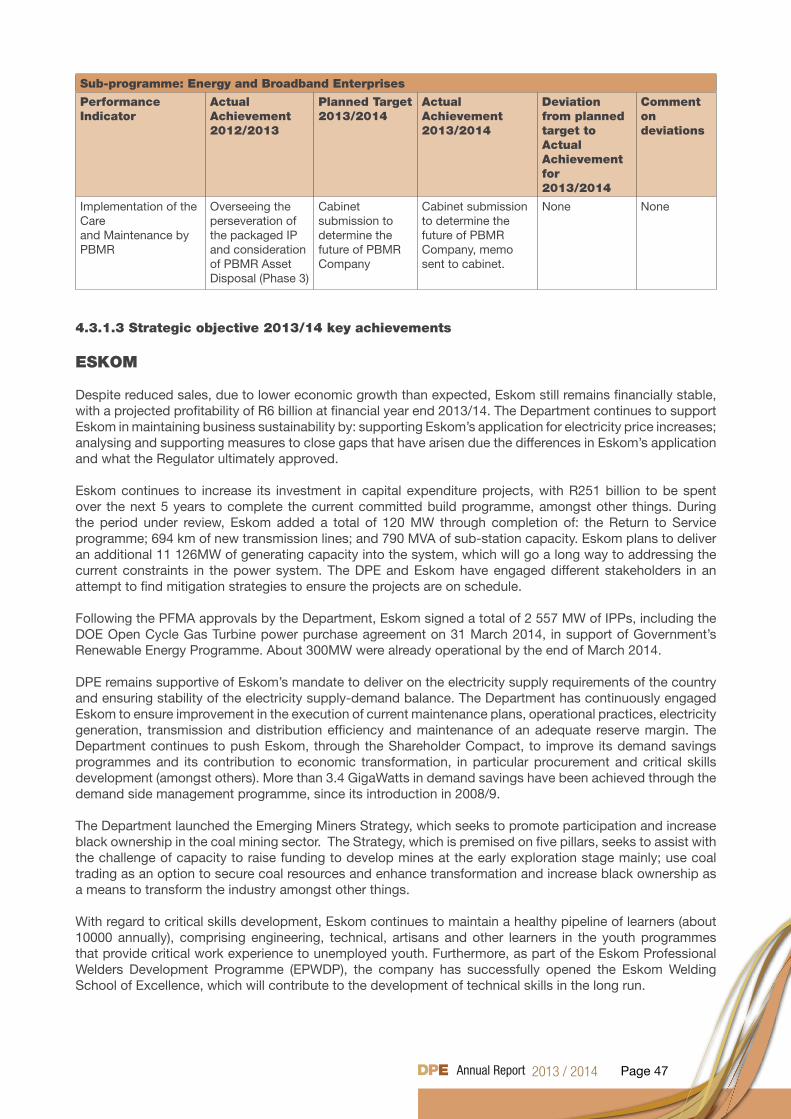
Page 47
Sub-programme: Energy and Broadband Enterprises
Performance Indicator
Actual Achievement 2012/2013
Planned Target2013/2014
Actual Achievement2013/2014
Deviation from planned target to Actual Achievement for 2013/2014
Comment on deviations
Implementation of the Careand Maintenance by PBMR
Overseeing the perseveration of the packaged IP and consideration of PBMR Asset Disposal (Phase 3)
Cabinet submission to determine the future of PBMR Company
Cabinet submission to determine the future of PBMR Company, memo sent to cabinet.
None None
4.3.1.3 Strategic objective 2013/14 key achievements
ESKOM
Despite reduced sales, due to lower economic growth than expected, Eskom still remains financially stable, with a projected profitability of R6 billion at financial year end 2013/14. The Department continues to support Eskom in maintaining business sustainability by: supporting Eskom’s application for electricity price increases; analysing and supporting measures to close gaps that have arisen due the differences in Eskom’s application and what the Regulator ultimately approved.
Eskom continues to increase its investment in capital expenditure projects, with R251 billion to be spent over the next 5 years to complete the current committed build programme, amongst other things. During the period under review, Eskom added a total of 120 MW through completion of: the Return to Service programme; 694 km of new transmission lines; and 790 MVA of sub-station capacity. Eskom plans to deliver an additional 11 126MW of generating capacity into the system, which will go a long way to addressing the current constraints in the power system. The DPE and Eskom have engaged different stakeholders in an attempt to find mitigation strategies to ensure the projects are on schedule.
Following the PFMA approvals by the Department, Eskom signed a total of 2 557 MW of IPPs, including the DOE Open Cycle Gas Turbine power purchase agreement on 31 March 2014, in support of Government’s Renewable Energy Programme. About 300MW were already operational by the end of March 2014.
DPE remains supportive of Eskom’s mandate to deliver on the electricity supply requirements of the country and ensuring stability of the electricity supply-demand balance. The Department has continuously engaged Eskom to ensure improvement in the execution of current maintenance plans, operational practices, electricity generation, transmission and distribution efficiency and maintenance of an adequate reserve margin. The Department continues to push Eskom, through the Shareholder Compact, to improve its demand savings programmes and its contribution to economic transformation, in particular procurement and critical skills development (amongst others). More than 3.4 GigaWatts in demand savings have been achieved through the demand side management programme, since its introduction in 2008/9.
The Department launched the Emerging Miners Strategy, which seeks to promote participation and increase black ownership in the coal mining sector. The Strategy, which is premised on five pillars, seeks to assist with the challenge of capacity to raise funding to develop mines at the early exploration stage mainly; use coal trading as an option to secure coal resources and enhance transformation and increase black ownership as a means to transform the industry amongst other things.
With regard to critical skills development, Eskom continues to maintain a healthy pipeline of learners (about 10000 annually), comprising engineering, technical, artisans and other learners in the youth programmes that provide critical work experience to unemployed youth. Furthermore, as part of the Eskom Professional Welders Development Programme (EPWDP), the company has successfully opened the Eskom Welding School of Excellence, which will contribute to the development of technical skills in the long run.
Page 48
BROADBAND INFRACO
Broadband Infraco plays a critical role of providing backhaul connectivity for national long distance and international connectivity and providing broadband services to under-serviced areas. Over the years, the company has been operating in an environment dogged by policy uncertainty due to the lack of a coherent national broadband policy. This uncertainty and other factors, such as the lack of an electronic communications service (ECS) and reliance on a single customer (Neotel), have impacted negatively on the company’s sustainability. This has prompted the Department to be very active in raising the policy issues faced by Infraco with the Department of Communications (DoC) and also in assisting the company to diversify its revenue stream in order to improve sustainability.
The Department contributed substantially to the development of the Broadband Policy, with a focus on ensuring an efficient way of rolling out broadband and realizing the true potential of SOCs, in particular Broadband Infraco. In December 2013, Cabinet approved the National Broadband Policy, which included the inputs from the Department, thereby giving a clear role to Broadband Infraco in the South African broadband sector.
The Department has been working closely with Infraco to assist the company to diversify its customer base, improve its revenues and reduce operational costs by improving maintenance of the national long distance network.
Broadband Infraco invested in the international undersea cable – Western Africa Cable System - which was launched in 2012 and will contribute to the increased capacity of linking South Africa and Europe and increase the state’s ability to provide broadband infrastructure to national projects, such as SKA. In this regard, the Department assisted the company to conclude the sale of WACS capacity to the Department of Science and Technology to the value of R600 million. Broadband connectivity with SADC countries has also increased through the completion of the cross border Points of Presence (PoPs) connections that link South Africa to Zimbabwe, Botswana, Lesotho, Swaziland, Namibia and Mozambique.
PBMR
The Department consulted other government departments on the various possible options to preserve PBMR’s assets going forward. This is due to the fact that a number of PBMR assets present possible research-related opportunities and broader consultation on the possibility of donating these assets to universities is currently being facilitated. A Cabinet briefing was prepared on progress regarding the PBMR project and a recommendation was also made on what to do with the project going forward. This will require that it be presented to one of the first Cabinet meetings of the new administration.
Changes to Planned Targets
The Department continuously review the relevance of its APP to ensure that it remains relevant and appropriate to support the government outcomes. In the period under review, the Department undertook a review of its APP to assess relevance of certain projects and better align the annual targets to resources. As a result, few changes on the annual performance targets were effected. A revised Annual Performance Plan was signed by the Executive Authority of the Department. The revised targets were used to monitor performance within the programme.
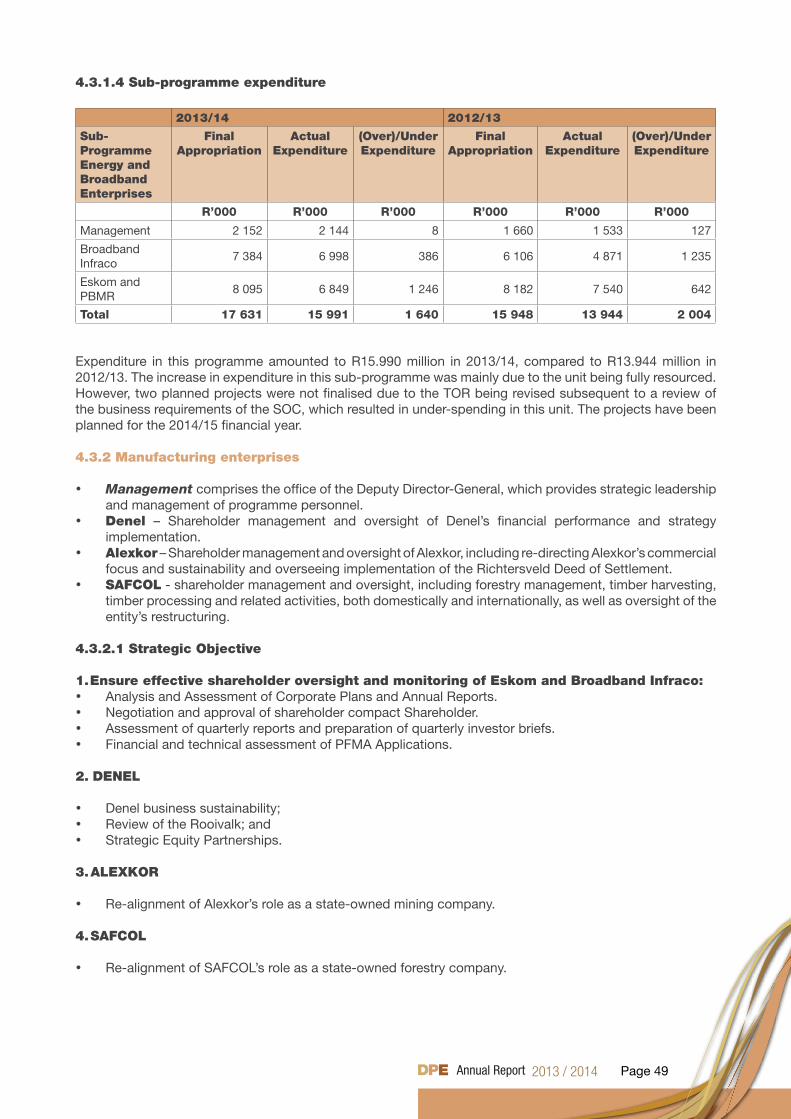
Page 49
4.3.1.4 Sub-programme expenditure
2013/14 2012/13
Sub- Programme Energy and Broadband Enterprises
Final Appropriation
ActualExpenditure
(Over)/Under Expenditure
Final Appropriation
ActualExpenditure
(Over)/Under Expenditure
R’000 R’000 R’000 R’000 R’000 R’000
Management 2 152 2 144 8 1 660 1 533 127
Broadband Infraco
7 384 6 998 386 6 106 4 871 1 235
Eskom and PBMR
8 095 6 849 1 246 8 182 7 540 642
Total 17 631 15 991 1 640 15 948 13 944 2 004
Expenditure in this programme amounted to R15.990 million in 2013/14, compared to R13.944 million in 2012/13. The increase in expenditure in this sub-programme was mainly due to the unit being fully resourced. However, two planned projects were not finalised due to the TOR being revised subsequent to a review of the business requirements of the SOC, which resulted in under-spending in this unit. The projects have been planned for the 2014/15 financial year.
4.3.2 Manufacturing enterprises
• Management comprises the office of the Deputy Director-General, which provides strategic leadership and management of programme personnel.
• Denel – Shareholder management and oversight of Denel’s financial performance and strategy implementation.
• Alexkor – Shareholder management and oversight of Alexkor, including re-directing Alexkor’s commercial focus and sustainability and overseeing implementation of the Richtersveld Deed of Settlement.
• SAFCOL - shareholder management and oversight, including forestry management, timber harvesting, timber processing and related activities, both domestically and internationally, as well as oversight of the entity’s restructuring.
4.3.2.1 Strategic Objective
1. Ensure effective shareholder oversight and monitoring of Eskom and Broadband Infraco: • Analysis and Assessment of Corporate Plans and Annual Reports. • Negotiation and approval of shareholder compact Shareholder.• Assessment of quarterly reports and preparation of quarterly investor briefs.• Financial and technical assessment of PFMA Applications. 2. DENEL
• Denel business sustainability;• Review of the Rooivalk; and • Strategic Equity Partnerships.
3. ALEXKOR
• Re-alignment of Alexkor’s role as a state-owned mining company.
4. SAFCOL
• Re-alignment of SAFCOL’s role as a state-owned forestry company.
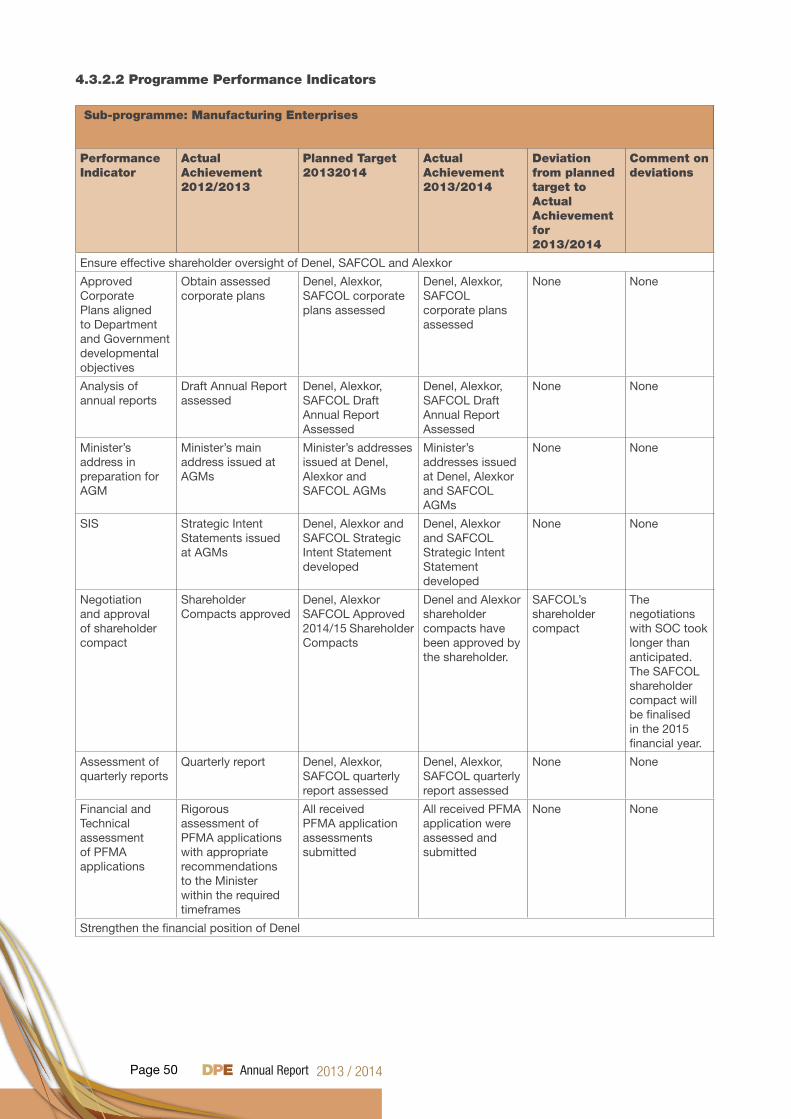
Page 50
4.3.2.2 Programme Performance Indicators
Sub-programme: Manufacturing Enterprises
Performance Indicator
Actual Achievement 2012/2013
Planned Target20132014
Actual Achievement2013/2014
Deviation from planned target to Actual Achievement for 2013/2014
Comment on deviations
Ensure effective shareholder oversight of Denel, SAFCOL and Alexkor
Approved Corporate Plans aligned to Department and Government developmental objectives
Obtain assessed corporate plans
Denel, Alexkor, SAFCOL corporate plans assessed
Denel, Alexkor, SAFCOL corporate plans assessed
None None
Analysis of annual reports
Draft Annual Report assessed
Denel, Alexkor, SAFCOL Draft Annual Report Assessed
Denel, Alexkor, SAFCOL Draft Annual Report Assessed
None None
Minister’s address in preparation for AGM
Minister’s main address issued at AGMs
Minister’s addresses issued at Denel, Alexkor and SAFCOL AGMs
Minister’s addresses issued at Denel, Alexkor and SAFCOL AGMs
None None
SIS Strategic Intent Statements issued at AGMs
Denel, Alexkor and SAFCOL Strategic Intent Statement developed
Denel, Alexkor and SAFCOL Strategic Intent Statement developed
None None
Negotiation and approval of shareholder compact
Shareholder Compacts approved
Denel, Alexkor SAFCOL Approved 2014/15 Shareholder Compacts
Denel and Alexkor shareholder compacts have been approved by the shareholder.
SAFCOL’s shareholder compact
The negotiations with SOC took longer than anticipated. The SAFCOL shareholder compact will be finalised in the 2015 financial year.
Assessment of quarterly reports
Quarterly report Denel, Alexkor, SAFCOL quarterly report assessed
Denel, Alexkor, SAFCOL quarterly report assessed
None None
Financial and Technical assessment of PFMA applications
Rigorous assessment of PFMA applications with appropriate recommendations to the Minister within the required timeframes
All received PFMA application assessments submitted
All received PFMA application were assessed and submitted
None None
Strengthen the financial position of Denel
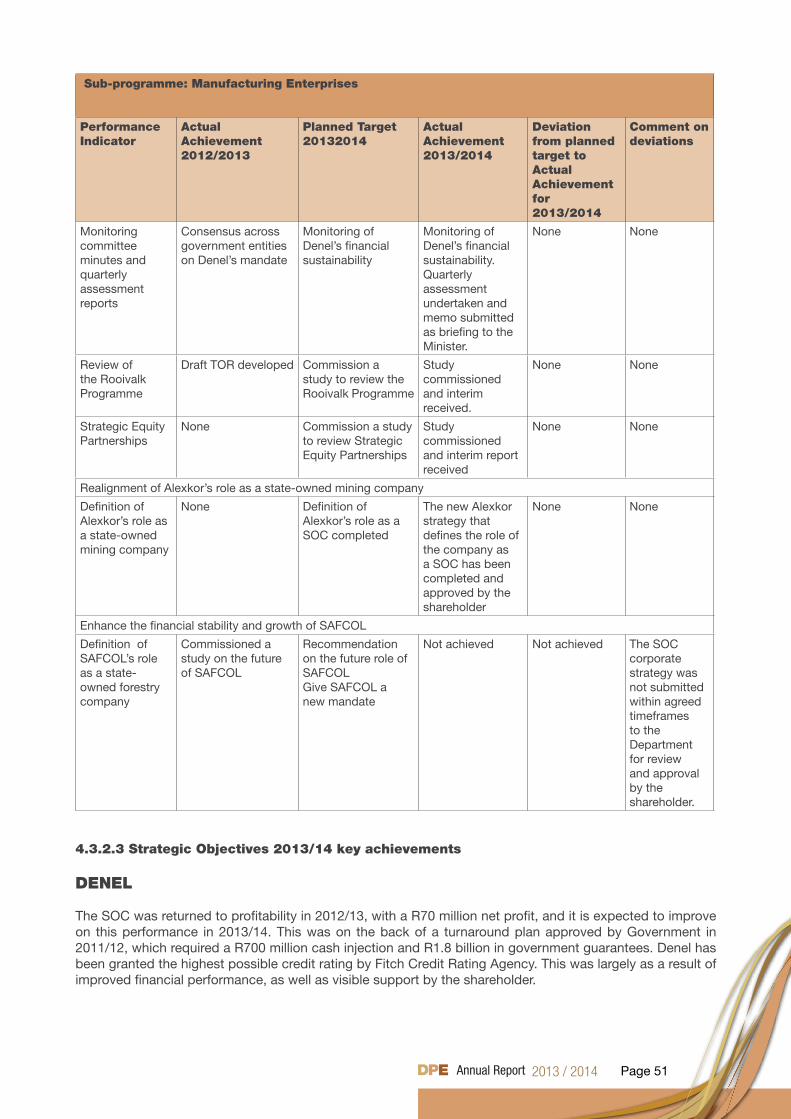
Page 51
Sub-programme: Manufacturing Enterprises
Performance Indicator
Actual Achievement 2012/2013
Planned Target20132014
Actual Achievement2013/2014
Deviation from planned target to Actual Achievement for 2013/2014
Comment on deviations
Monitoring committee minutes and quarterly assessment reports
Consensus across government entities on Denel’s mandate
Monitoring of Denel’s financial sustainability
Monitoring of Denel’s financial sustainability. Quarterly assessment undertaken and memo submitted as briefing to the Minister.
None None
Review of the Rooivalk Programme
Draft TOR developed Commission a study to review the Rooivalk Programme
Study commissioned and interim received.
None None
Strategic Equity Partnerships
None Commission a study to review Strategic Equity Partnerships
Study commissioned and interim report received
None None
Realignment of Alexkor’s role as a state-owned mining company
Definition of Alexkor’s role as a state-owned mining company
None Definition of Alexkor’s role as a SOC completed
The new Alexkor strategy that defines the role of the company as a SOC has been completed and approved by the shareholder
None None
Enhance the financial stability and growth of SAFCOL
Definition of SAFCOL’s role as a state-owned forestry company
Commissioned a study on the future of SAFCOL
Recommendation on the future role of SAFCOLGive SAFCOL a new mandate
Not achieved Not achieved The SOC corporate strategy was not submitted within agreed timeframes to the Department for review and approval by the shareholder.
4.3.2.3 Strategic Objectives 2013/14 key achievements
DENEL
The SOC was returned to profitability in 2012/13, with a R70 million net profit, and it is expected to improve on this performance in 2013/14. This was on the back of a turnaround plan approved by Government in 2011/12, which required a R700 million cash injection and R1.8 billion in government guarantees. Denel has been granted the highest possible credit rating by Fitch Credit Rating Agency. This was largely as a result of improved financial performance, as well as visible support by the shareholder.
Page 52
The business reported a R21 billion order book in June 2013 and showed a 50% improvement to R30 billion by December 2013. This will enable the business to meet its plan of doubling revenues to R8 billion by 2018/19. One significant order secured by the SOC in the 2013/14 financial year was a R10 billion contract by the South African Department of Defence to produce 238 Hoefyster infantry fighting vehicles (IFV) for the South African Army. The programme is critical in maintaining the country’s advanced manufacturing capabilities in the defence sector. In order to support the industrialisation programme of government, 70% of components for the vehicle will be sourced locally, which will support the creation of 2 000 jobs at Denel as well as the South African defence related industry.
In 2013/14 Denel revived its space and satellite capabilities, after entering into a collaborative relationship with the South African National Space Agency (SANSA). This will not only ensure that the country’s space and satellite capabilities are enhanced, but will provide local industry with the opportunity to tap into the growing and strategic global space and satellite industry.
The SOC has delivered and supported the deployment of the Rooivalk combat support helicopter in combat operations in the DRC. Deployments were under MONUSCO and they have proven to be a game changer in peace enforcement operations.
ALEXKOR
The SOC has delivered on government obligations to the Richtersveld Community, with a R120 million upgrade of the Alexander Bay Township infrastructure (roads, electrical and water reticulation, and waste water treatment) being completed in 31 March 2013 and the town’s registration confirmed by 22 November 2013. This means that the town, which was previously a mining compound, is one of the new towns in South Africa and part of the Richtersveld Local Municipality. The value of property in the town that will be transferred to the community is estimated at R200 million.
The mine owned jointly with the Richtersveld Community, which had previously seen diamond production decrease substantially due to the land restitution process, has seen an improvement in carat production from 35 000 carats to over 50 000 carats. This has been on the back of a newly commissioned R50 million processing plant at Muisvlak near Port Nolloth, which has created 200 jobs for the community.
In the 2013/14 financial year, the Minister approved the strategy for the SOC to become a diversified mining company to include coal supply in support of the national energy security imperative. The Department is working closely with the SOC to ensure success of the strategy and significant projects will be announced in 2014/15.
SAFCOL
The 2013/14 period has proven to be challenging for the SOC, with cost management being an area of focus. Reliance by the SOC on the mining and construction industries has proven to be a major obstacle towards profitability, due to slow recovery of these sectors. The Department revised the SOC mandate in 2012/13 to enable product diversification and further vertical integration. The SOC will announce the new corporate strategy within the ambits of the revised role in 2014/15.
4.3.2.3 Changes to Planned Targets
The Department continuously review the relevance of it’s APP to ensure that it remains relevant and appropriate to support the government outcomes. In the period under review, the Department undertook a review of its APP to assess relevance of certain projects and better align the annual targets to resources. As a result, few changes on the annual performance targets were effected. A revised Annual Performance Plan was signed by the Executive Authority of the Department. The revised targets were used to monitor performance within the programme.
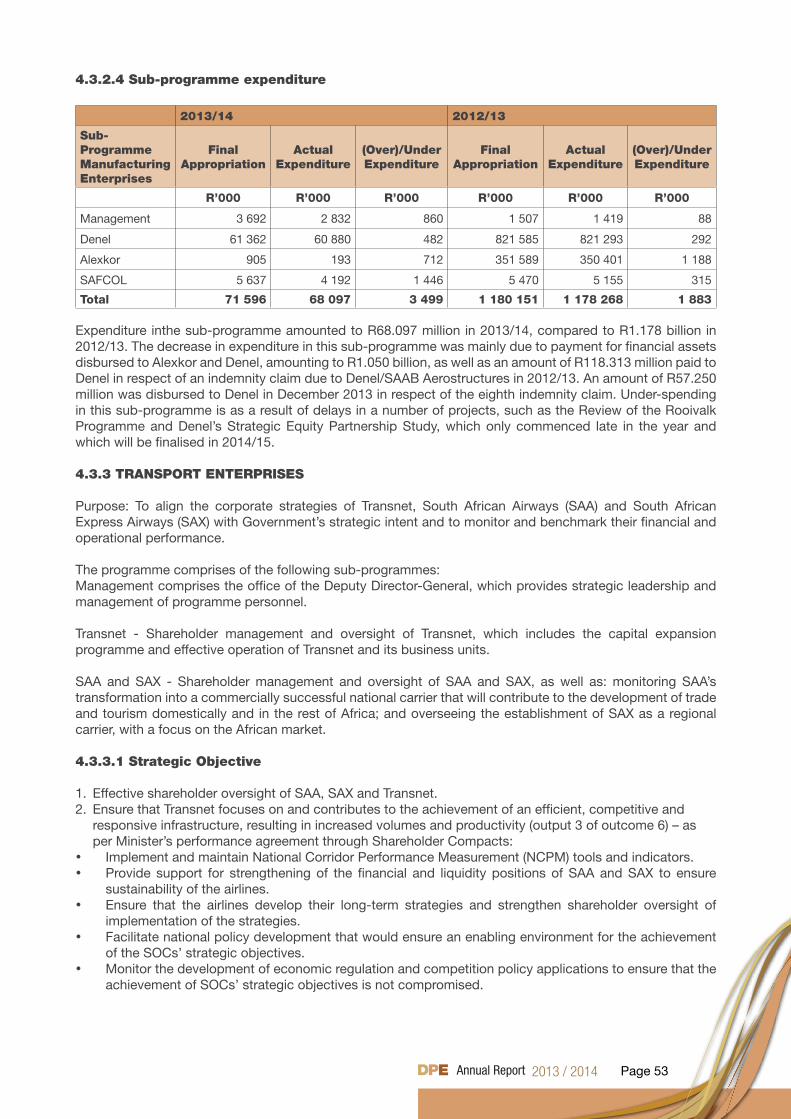
Page 53
4.3.2.4 Sub-programme expenditure
2013/14 2012/13
Sub- Programme Manufacturing Enterprises
Final Appropriation
ActualExpenditure
(Over)/Under Expenditure
Final Appropriation
ActualExpenditure
(Over)/Under Expenditure
R’000 R’000 R’000 R’000 R’000 R’000
Management 3 692 2 832 860 1 507 1 419 88
Denel 61 362 60 880 482 821 585 821 293 292
Alexkor 905 193 712 351 589 350 401 1 188
SAFCOL 5 637 4 192 1 446 5 470 5 155 315
Total 71 596 68 097 3 499 1 180 151 1 178 268 1 883
Expenditure inthe sub-programme amounted to R68.097 million in 2013/14, compared to R1.178 billion in 2012/13. The decrease in expenditure in this sub-programme was mainly due to payment for financial assets disbursed to Alexkor and Denel, amounting to R1.050 billion, as well as an amount of R118.313 million paid to Denel in respect of an indemnity claim due to Denel/SAAB Aerostructures in 2012/13. An amount of R57.250 million was disbursed to Denel in December 2013 in respect of the eighth indemnity claim. Under-spending in this sub-programme is as a result of delays in a number of projects, such as the Review of the Rooivalk Programme and Denel’s Strategic Equity Partnership Study, which only commenced late in the year and which will be finalised in 2014/15.
4.3.3 TRANSPORT ENTERPRISES
Purpose: To align the corporate strategies of Transnet, South African Airways (SAA) and South African Express Airways (SAX) with Government’s strategic intent and to monitor and benchmark their financial and operational performance.
The programme comprises of the following sub-programmes:Management comprises the office of the Deputy Director-General, which provides strategic leadership and management of programme personnel.
Transnet - Shareholder management and oversight of Transnet, which includes the capital expansion programme and effective operation of Transnet and its business units.
SAA and SAX - Shareholder management and oversight of SAA and SAX, as well as: monitoring SAA’s transformation into a commercially successful national carrier that will contribute to the development of trade and tourism domestically and in the rest of Africa; and overseeing the establishment of SAX as a regional carrier, with a focus on the African market.
4.3.3.1 Strategic Objective
1. Effective shareholder oversight of SAA, SAX and Transnet.2. Ensure that Transnet focuses on and contributes to the achievement of an efficient, competitive and responsive infrastructure, resulting in increased volumes and productivity (output 3 of outcome 6) – as per Minister’s performance agreement through Shareholder Compacts:• Implement and maintain National Corridor Performance Measurement (NCPM) tools and indicators.• Provide support for strengthening of the financial and liquidity positions of SAA and SAX to ensure
sustainability of the airlines.• Ensure that the airlines develop their long-term strategies and strengthen shareholder oversight of
implementation of the strategies.• Facilitate national policy development that would ensure an enabling environment for the achievement
of the SOCs’ strategic objectives.• Monitor the development of economic regulation and competition policy applications to ensure that the
achievement of SOCs’ strategic objectives is not compromised.
Page 54
4.3.3.2 Sub: Performance Indicator
Sub-programme: Transport Enterprises
Performance Indicator
Actual Achievement 2012/2013
Planned Target2013/2014
Actual Achievement2013/2014
Deviation from planned target to Actual Achievement for 2013/2014
Comment on deviations
Effective shareholder oversight of SAA, SAX and Transnet
Approved Corporate Plans aligned to Department and Government Developmental Objectives
Obtain assessed Corporate Plans
SAA, SAX and Transnet Corporate Plans assessed
SAA, SAX and Transnet Corporate Plans assessed
None None
Analysis of Annual Report
Draft Annual Report assessment completed
SAA, SAX and Transnet Draft Annual Report assessed
SAA, SAX and Transnet Draft Annual Report assessed
None None
Minister’s address in preparation of the Annual General Meeting (AGMS)
Strategic Intent Statements issued at the AGMs
SAA, SAX and Transnet Minister’s address issued at the AGMs
SAA, SAX and Transnet Minister’s address issued at the AGMs
None None
Strategic Intent Statement (SIS)
Strategic Intent Statements issued at AGMs
SAA, SAX and Transnet Strategic Intent Statement developed
SAX, SAA and Transnet SIS still valid untill 2015/16 financial year
None None
Negotiation and approval of Shareholder Compacts
Approved Shareholder Compacts
SAA, SAX and Transnet 2014/15 Approved Shareholder Compacts
SAA, SAX and Transnet 2014/15 shareholder compact approved by the minister.
None None
Assessment of quarterly reports
Quarterly report assessed
Quarterly report assessed
4 quarterly financial and operational performance report assessed
None None
Financial and Technical assessment of PFMA Applications
Rigorous assessment of PFMA applications with appropriate recommendations to Minister within required timeframes
All received PFMA applications assessments submitted
All PFMA applications received were assessed and signed by the Minister.
None None
Ensure the contribution of Transnet to achieving an efficient , competitive and responsive infrastructure (output 3 of outcome 6)- as per Minister’s performance agreement
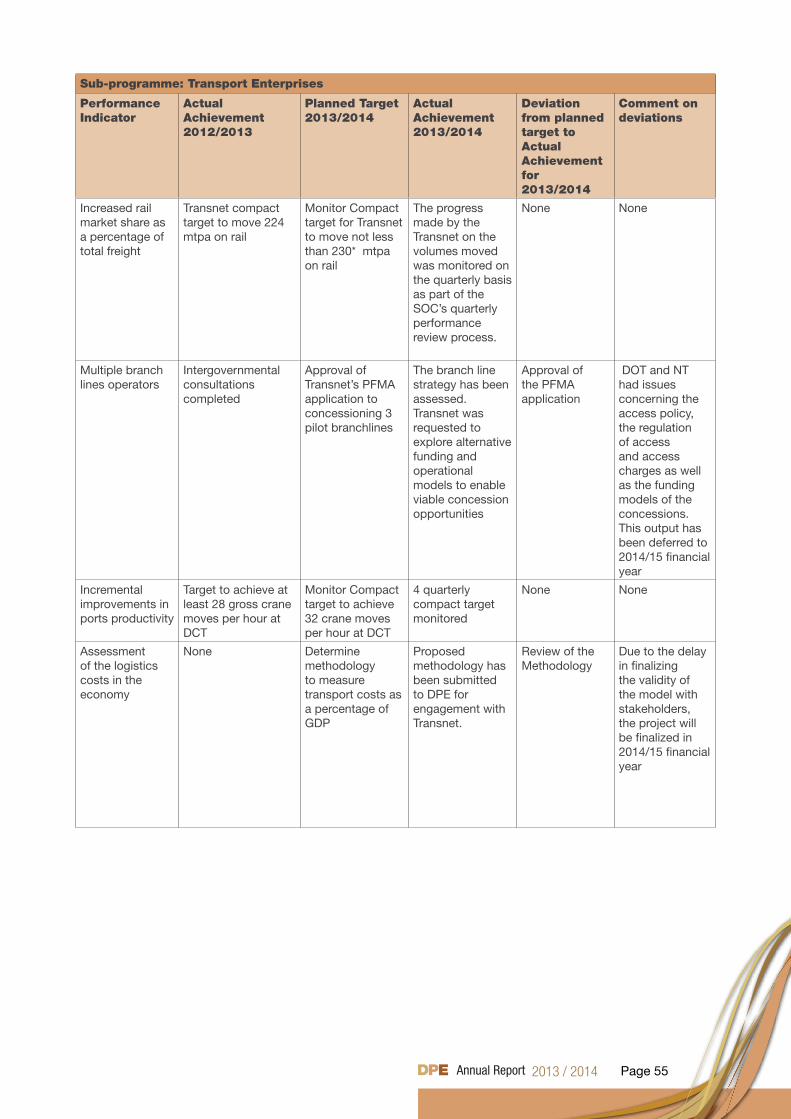
Page 55
Sub-programme: Transport Enterprises
Performance Indicator
Actual Achievement 2012/2013
Planned Target2013/2014
Actual Achievement2013/2014
Deviation from planned target to Actual Achievement for 2013/2014
Comment on deviations
Increased rail market share as a percentage of total freight
Transnet compact target to move 224 mtpa on rail
Monitor Compact target for Transnet to move not less than 230* mtpa on rail
The progress made by the Transnet on the volumes moved was monitored on the quarterly basis as part of the SOC’s quarterly performance review process.
None None
Multiple branch lines operators
Intergovernmental consultations completed
Approval of Transnet’s PFMA application to concessioning 3 pilot branchlines
The branch line strategy has been assessed. Transnet was requested to explore alternative funding and operational models to enable viable concession opportunities
Approval of the PFMA application
DOT and NT had issues concerning the access policy, the regulation of access and access charges as well as the funding models of the concessions. This output has been deferred to 2014/15 financial year
Incremental improvements in ports productivity
Target to achieve at least 28 gross crane moves per hour at DCT
Monitor Compact target to achieve 32 crane moves per hour at DCT
4 quarterly compact target monitored
None None
Assessment of the logistics costs in the economy
None Determine methodology to measure transport costs as a percentage of GDP
Proposed methodology has been submitted to DPE for engagement with Transnet.
Review of the Methodology
Due to the delay in finalizing the validity of the model with stakeholders, the project will be finalized in 2014/15 financial year
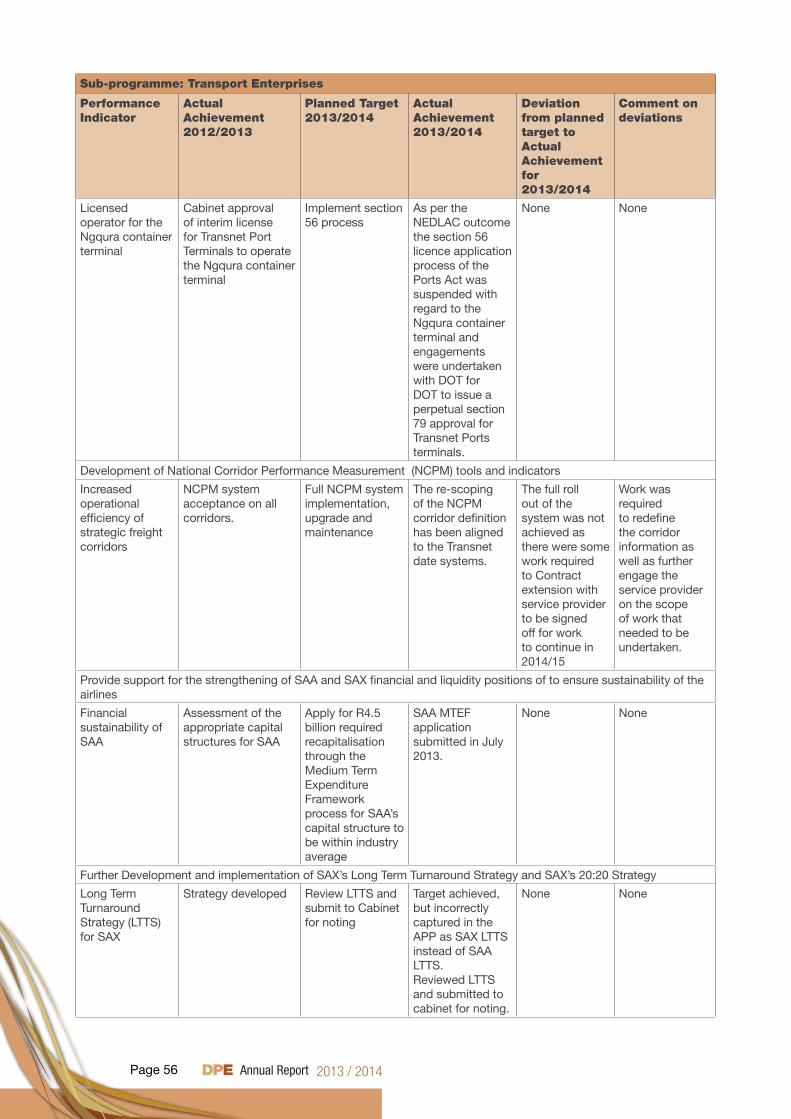
Page 56
Sub-programme: Transport Enterprises
Performance Indicator
Actual Achievement 2012/2013
Planned Target2013/2014
Actual Achievement2013/2014
Deviation from planned target to Actual Achievement for 2013/2014
Comment on deviations
Licensed operator for the Ngqura container terminal
Cabinet approval of interim license for Transnet Port Terminals to operate the Ngqura container terminal
Implement section 56 process
As per the NEDLAC outcome the section 56 licence application process of the Ports Act was suspended with regard to the Ngqura container terminal and engagements were undertaken with DOT for DOT to issue a perpetual section 79 approval for Transnet Ports terminals.
None None
Development of National Corridor Performance Measurement (NCPM) tools and indicators
Increased operational efficiency of strategic freight corridors
NCPM system acceptance on all corridors.
Full NCPM system implementation, upgrade and maintenance
The re-scoping of the NCPM corridor definition has been aligned to the Transnet date systems.
The full roll out of the system was not achieved as there were some work required to Contract extension with service provider to be signed off for work to continue in 2014/15
Work was required to redefine the corridor information as well as further engage the service provider on the scope of work that needed to be undertaken.
Provide support for the strengthening of SAA and SAX financial and liquidity positions of to ensure sustainability of the airlines
Financial sustainability of SAA
Assessment of the appropriate capital structures for SAA
Apply for R4.5 billion required recapitalisation through the Medium Term Expenditure Framework process for SAA’s capital structure to be within industry average
SAA MTEF application submitted in July 2013.
None None
Further Development and implementation of SAX’s Long Term Turnaround Strategy and SAX’s 20:20 Strategy
Long Term Turnaround Strategy (LTTS) for SAX
Strategy developed Review LTTS and submit to Cabinet for noting
Target achieved, but incorrectly captured in the APP as SAX LTTS instead of SAA LTTS.Reviewed LTTS and submitted to cabinet for noting.
None None
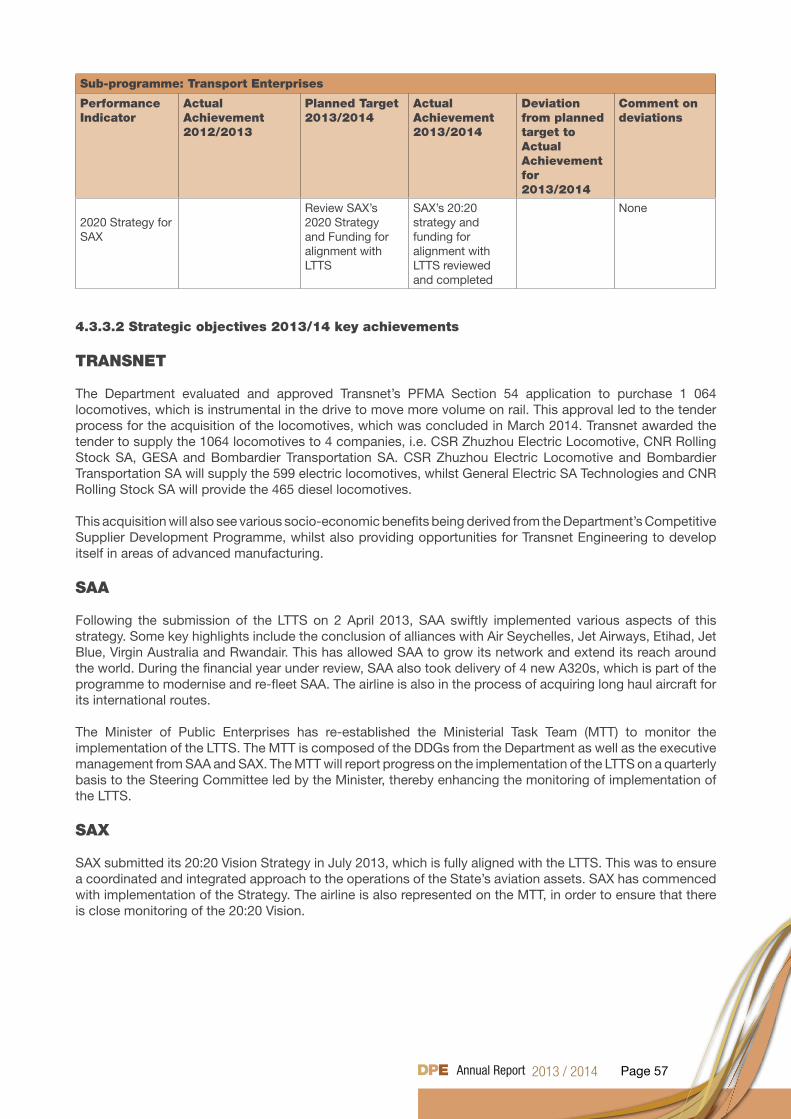
Page 57
Sub-programme: Transport Enterprises
Performance Indicator
Actual Achievement 2012/2013
Planned Target2013/2014
Actual Achievement2013/2014
Deviation from planned target to Actual Achievement for 2013/2014
Comment on deviations
2020 Strategy for SAX
Review SAX’s 2020 Strategy and Funding for alignment with LTTS
SAX’s 20:20 strategy and funding for alignment with LTTS reviewed and completed
None
4.3.3.2 Strategic objectives 2013/14 key achievements
TRANSNET
The Department evaluated and approved Transnet’s PFMA Section 54 application to purchase 1 064 locomotives, which is instrumental in the drive to move more volume on rail. This approval led to the tender process for the acquisition of the locomotives, which was concluded in March 2014. Transnet awarded the tender to supply the 1064 locomotives to 4 companies, i.e. CSR Zhuzhou Electric Locomotive, CNR Rolling Stock SA, GESA and Bombardier Transportation SA. CSR Zhuzhou Electric Locomotive and Bombardier Transportation SA will supply the 599 electric locomotives, whilst General Electric SA Technologies and CNR Rolling Stock SA will provide the 465 diesel locomotives.
This acquisition will also see various socio-economic benefits being derived from the Department’s Competitive Supplier Development Programme, whilst also providing opportunities for Transnet Engineering to develop itself in areas of advanced manufacturing.
SAA
Following the submission of the LTTS on 2 April 2013, SAA swiftly implemented various aspects of this strategy. Some key highlights include the conclusion of alliances with Air Seychelles, Jet Airways, Etihad, Jet Blue, Virgin Australia and Rwandair. This has allowed SAA to grow its network and extend its reach around the world. During the financial year under review, SAA also took delivery of 4 new A320s, which is part of the programme to modernise and re-fleet SAA. The airline is also in the process of acquiring long haul aircraft for its international routes.
The Minister of Public Enterprises has re-established the Ministerial Task Team (MTT) to monitor the implementation of the LTTS. The MTT is composed of the DDGs from the Department as well as the executive management from SAA and SAX. The MTT will report progress on the implementation of the LTTS on a quarterly basis to the Steering Committee led by the Minister, thereby enhancing the monitoring of implementation of the LTTS.
SAX
SAX submitted its 20:20 Vision Strategy in July 2013, which is fully aligned with the LTTS. This was to ensure a coordinated and integrated approach to the operations of the State’s aviation assets. SAX has commenced with implementation of the Strategy. The airline is also represented on the MTT, in order to ensure that there is close monitoring of the 20:20 Vision.
Page 58
4.3.3.3 Changes to Planned Targets
The Department continuously review the relevance of it’s APP to ensure that it remains relevant and appropriate to support the government outcomes. In the period under review, the Department undertook a review of its APP to assess relevance of certain projects and better align the annual targets to resources. As a result, few changes on the annual performance targets were effected. A revised Annual Performance Plan was signed by the Executive Authority of the Department. The revised targets were used to monitor performance within the programme.
4.3.3.4 Sub-programme expenditure
2013/14 2012/13
Sub- Programme Transport Enterprises
Final Appropriation
ActualExpenditure
(Over)/Under Expenditure
Final Appropriation
ActualExpenditure
(Over)/Under Expenditure
R’000 R’000 R’000 R’000 R’000 R’000
Management 2 997 2 845 152 2 536 2 263 273
Transnet 11 587 7 098 4 489 13 639 12 048 1 591
SAA & SA Express
5 205 5 042 162 5 874 5 719 155
Total 19 789 14 985 4 804 22 049 20 030 2 019
Expenditure in the sub-programme amounted to R14.985 million in 2013/14, compared to R20.030 million in 2012/13. The decrease in expenditure inthis sub-programme was due to a delay in a number of planned projects, such as the NCPM and review of the logistics cost which were postponed to the next financial year. The NCPM project required alignment to the Transnet Corridor Framework.
4.3.4 ECONOMIC IMPACT AND POLICY ALIGNMENT (EIPA)
EIPA has been re-aligned from a function as a consulting facility (previously in Programme 6: Joint Project Facility) and comprises. The current purpose is: to align Shareholder oversight of SOCs in relation to Government’s over-arching economic, social and environmental policies; and to implement strategic interventions to contribute towards achievement of national objectives in support of economic growth and transformation.
Management comprises the office of the DDG, which provides strategic leadership and management of the programme personnel. This sub-programme comprises:
Environmental Policy Alignment - oversee alignment and implementation of SOCs’ Strategically Important Developments (SIDs), with a special focus on Eskom’s and Transnet’s Build Programmes. Oversight and alignment of the Climate Change Policy Framework for SOCs in support of national policies and the green economy.
Economic Policy Alignment – this focuses on appropriate macro-economic modeling and research to enhance the links between industrial policy, macro-economic policy and the role of SOCs. Economic modeling will be outsourced to relevant institutions to determine the impact of SOC investment and operations on the economy, including the impact on customers and suppliers.
Transformation, Skills and Youth Development - this focus on the provision of scarce and critical skills by SOCs in support of the National Skills Agenda, the NGP and the NDP, as well as optimize SOC skills training facilities through the National Skills Funding (amongst others). Transformation and youth development areas will form new areas for incorporation into SOC Shareholder Compacts. This includes overseeing alignment and implementation of the SOC transformation agendas in support of national policies and the NGP Framework, with a focus on: job creation; youth development and the development of targeted groups (i.e. women, people with disabilities, co-operatives, etc); Broad–Based Black Economic Empowerment (B-BBEE); Employment Equity (EE); and disposal of non-core property.
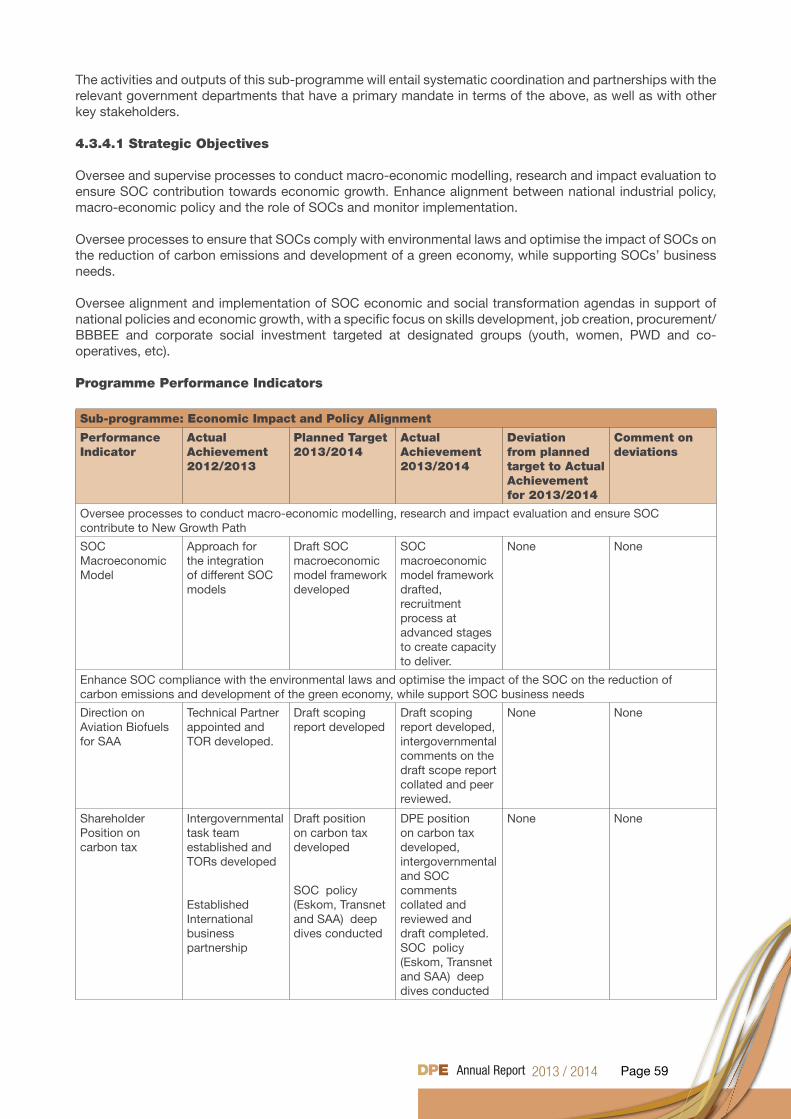
Page 59
The activities and outputs of this sub-programme will entail systematic coordination and partnerships with the relevant government departments that have a primary mandate in terms of the above, as well as with other key stakeholders.
4.3.4.1 Strategic Objectives
Oversee and supervise processes to conduct macro-economic modelling, research and impact evaluation to ensure SOC contribution towards economic growth. Enhance alignment between national industrial policy, macro-economic policy and the role of SOCs and monitor implementation.
Oversee processes to ensure that SOCs comply with environmental laws and optimise the impact of SOCs on the reduction of carbon emissions and development of a green economy, while supporting SOCs’ business needs.
Oversee alignment and implementation of SOC economic and social transformation agendas in support of national policies and economic growth, with a specific focus on skills development, job creation, procurement/BBBEE and corporate social investment targeted at designated groups (youth, women, PWD and co-operatives, etc).
Programme Performance Indicators
Sub-programme: Economic Impact and Policy Alignment
Performance Indicator
Actual Achievement 2012/2013
Planned Target2013/2014
Actual Achievement2013/2014
Deviation from planned target to Actual Achievement for 2013/2014
Comment on deviations
Oversee processes to conduct macro-economic modelling, research and impact evaluation and ensure SOC contribute to New Growth Path
SOC Macroeconomic Model
Approach for the integration of different SOC models
Draft SOC macroeconomic model framework developed
SOC macroeconomic model framework drafted, recruitment process at advanced stages to create capacity to deliver.
None None
Enhance SOC compliance with the environmental laws and optimise the impact of the SOC on the reduction of carbon emissions and development of the green economy, while support SOC business needs
Direction on Aviation Biofuels for SAA
Technical Partner appointed and TOR developed.
Draft scoping report developed
Draft scoping report developed, intergovernmental comments on the draft scope report collated and peer reviewed.
None None
Shareholder Position on carbon tax
Intergovernmental task team established and TORs developed
Established International business partnership
Draft position on carbon tax developed
SOC policy (Eskom, Transnet and SAA) deep dives conducted
DPE position on carbon tax developed, intergovernmental and SOC comments collated and reviewed and draft completed. SOC policy (Eskom, Transnet and SAA) deep dives conducted
None None
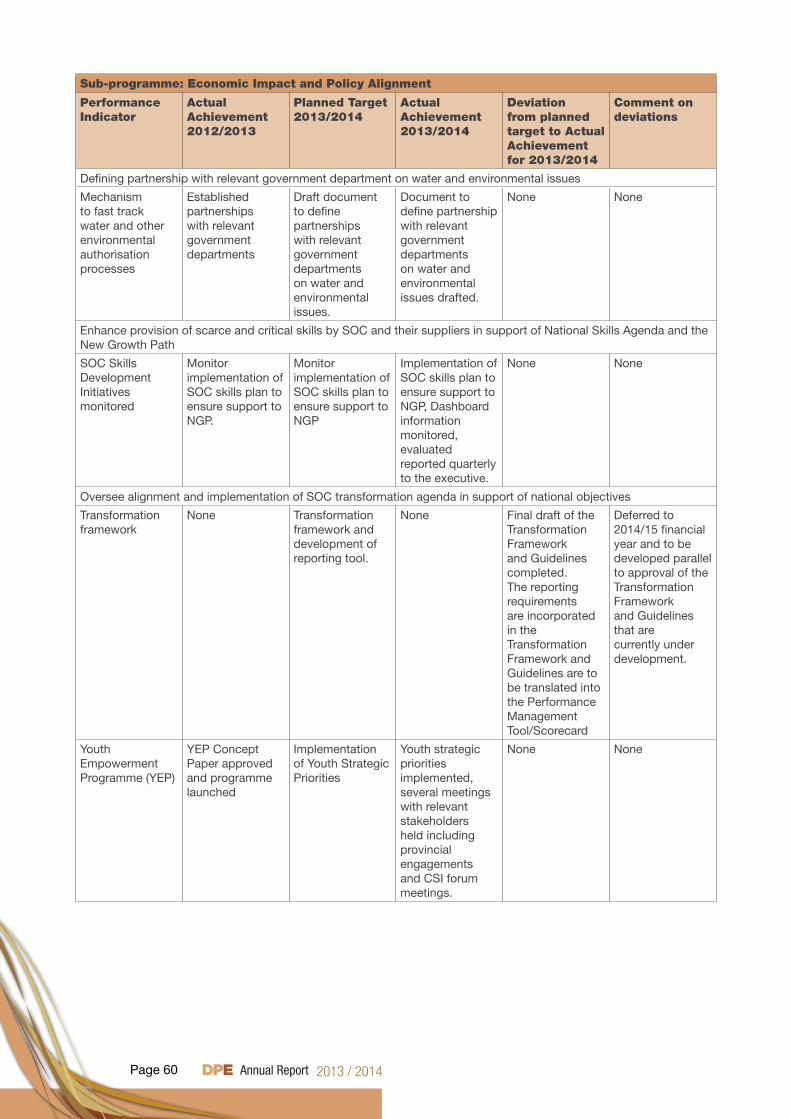
Page 60
Sub-programme: Economic Impact and Policy Alignment
Performance Indicator
Actual Achievement 2012/2013
Planned Target2013/2014
Actual Achievement2013/2014
Deviation from planned target to Actual Achievement for 2013/2014
Comment on deviations
Defining partnership with relevant government department on water and environmental issues
Mechanism to fast track water and other environmental authorisation processes
Established partnerships with relevant government departments
Draft document to define partnerships with relevant government departments on water and environmental issues.
Document to define partnership with relevant government departments on water and environmental issues drafted.
None None
Enhance provision of scarce and critical skills by SOC and their suppliers in support of National Skills Agenda and the New Growth Path
SOC Skills Development Initiatives monitored
Monitor implementation of SOC skills plan to ensure support to NGP.
Monitor implementation of SOC skills plan to ensure support to NGP
Implementation of SOC skills plan to ensure support to NGP, Dashboard information monitored, evaluated reported quarterly to the executive.
None None
Oversee alignment and implementation of SOC transformation agenda in support of national objectives
Transformation framework
None Transformation framework and development of reporting tool.
None Final draft of the Transformation Framework and Guidelines completed. The reporting requirements are incorporated in the Transformation Framework and Guidelines are to be translated into the Performance Management Tool/Scorecard
Deferred to 2014/15 financial year and to be developed parallel to approval of the Transformation Framework and Guidelines that are currently under development.
Youth Empowerment Programme (YEP)
YEP Concept Paper approved and programme launched
Implementation of Youth Strategic Priorities
Youth strategic priorities implemented, several meetings with relevant stakeholders held including provincial engagements and CSI forum meetings.
None None
Page 61
4.3.4.2 Strategic objective 2013/14 key achievements
Climate change, aviation biofuels and carbon tax issuesWWF (World Wide Fund) was appointed as technical partner to DPE on climate change. It assisted in the work towards developing the DPE position on carbon tax, as well as helping with the aviation biofuels work, particularly in terms of the socio-economic impact of aviation biofuels – this in preparation for the stakeholder work. It facilitated various multi-stakeholder workshops with industry experts from South Africa and globally, which were held to explore options for feedstock pathways as well as technology pathways for aviation biofuels in South Africa. Various multi-stakeholder workshops were held to shape the DPE position on carbon tax. EIPA enhanced the Department’s international business partnerships and a briefing memo and the scoping report (including a clear work plan for SAA’s Aviation Biofuels Programme) was approved by the DG. The Unit: improved the Department’s relationship; successfully negotiated with DOE to collaborate on aviation biofuels work going forward to ensure SAA sustainability’ and recommended formalisation of this working arrangement to the DOE and DPE Ministers. Relations have been forged with international experts in the aviation biofuels technologies industry to supplement DPE capacity, such as with expertise on aviation biofuels technologies that are not available in South Africa. Benchmarking on carbon tax was completed, SOC policy deep dives conducted, and the DPE position on carbon tax was completed.
Government Department Collaboration on Water and Environmental issues A revised MoU with 7 other relevant government departments was successfully concluded and signed to collaborate and align environmental, water and other policy matters that affect SOCs and Strategic Infrastructure Programmes. The MoU was signed on 25 March 2014. The Department has enhanced its partnership with DEA and other environmental authorities at local and provincial government level. Furthermore, it provided leadership and support to Eskom in its engagement to resolve the SOC’s environmental compliance challenges at various power stations, which could potentially lead to partial closure. Certain amendments to Eskom’s new Atmospheric Emission Licenses (AELs) were successfully negotiated and recommendations made to the Minister regarding Eskom’s required initiatives, therefore reducing the risk of further significant non-compliance by various coal-fired power stations in the Eskom generation portfolio.
SOC skills development monitoringCollaboration was enhanced with DHET, EDD, DTI and SOCs to ensure alignment of SOC interventions to the national skills agenda. In addition, an MOU was concluded between DPE and DHET to formalise collaboration between the two departments in order to optimise SOC training facilities. This is coordinated through the DPE/DHET-led SOC Skills Development Steering Committee, which is co-chaired by the Department and DHET.
Collaboration between the two departments resulted in DPE assisting Transnet to secure R175 million in funding from the NSF for optimisation of Transnet Engineering training facilities to train an additional 1000 artisan learners in various trades over a period of 3 years. This project was launched by Minister at the Saltriver facility in the Western Cape on 31 of October 2013. During the launch, Transnet signed partnership agreements with three (3) FET colleges in the province, as part of its efforts in strengthening Further Education and Training (FET) college support.
The Department successfully negotiated with the NSF to earmark a pool of funding for optimisation of training facilities of Denel, SAA and Eskom. In addition, a Funding Proposal was developed and submitted to Energy and Water Sector Education and Training Authority (EWSETA) to source funding for the Eskom Law Graduate Employment Scheme project.
Youth Empowerment Programme
Corporate Social Investment (CSI) DPE-SOC: The CSI Forum, chaired by Deputy Minister, was established to coordinate SOC CSI initiatives. The CSI Forum & Working Group held a workshop and approved SOC CSI Flagships Project and a roll-out plan in the area of Education & Health, including Enterprise Development/Socio-Economic Development.
Through collaboration with the University of Stellenbosch and provinces, the Telematics satellite-based system (a subject improvement learner/teacher based support system) was rolled out at rural schools.
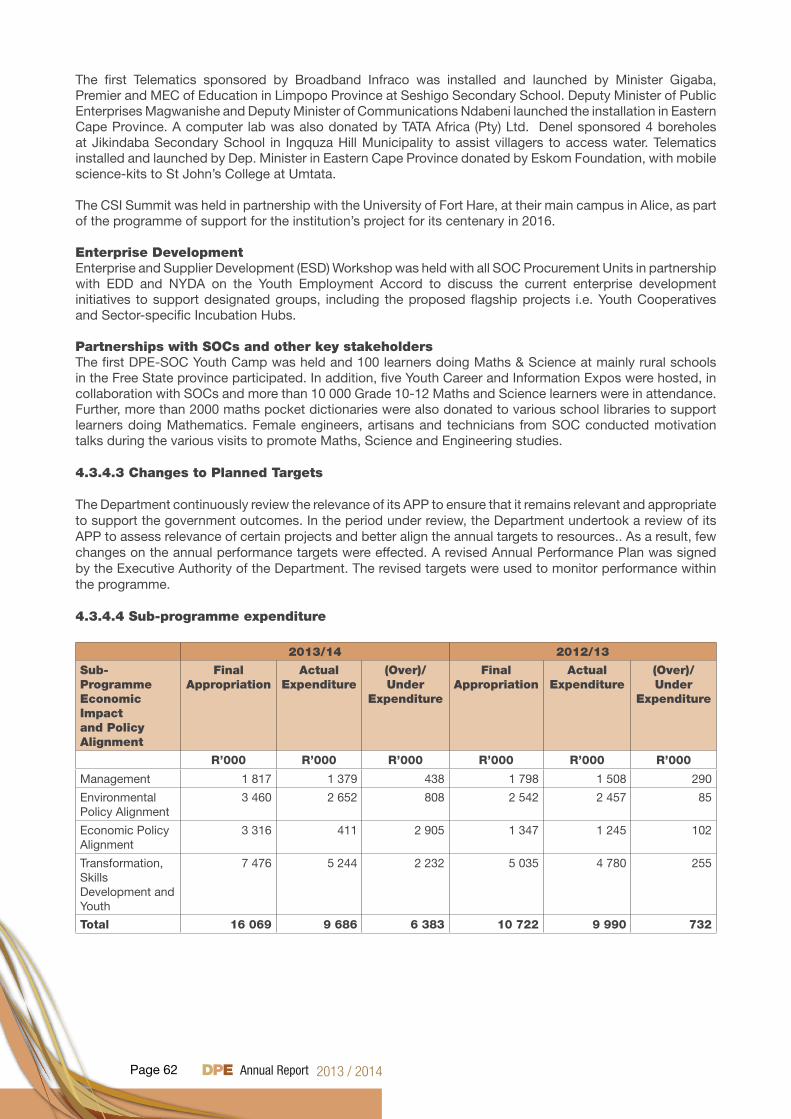
Page 62
The first Telematics sponsored by Broadband Infraco was installed and launched by Minister Gigaba, Premier and MEC of Education in Limpopo Province at Seshigo Secondary School. Deputy Minister of Public Enterprises Magwanishe and Deputy Minister of Communications Ndabeni launched the installation in Eastern Cape Province. A computer lab was also donated by TATA Africa (Pty) Ltd. Denel sponsored 4 boreholes at Jikindaba Secondary School in Ingquza Hill Municipality to assist villagers to access water. Telematics installed and launched by Dep. Minister in Eastern Cape Province donated by Eskom Foundation, with mobile science-kits to St John’s College at Umtata.
The CSI Summit was held in partnership with the University of Fort Hare, at their main campus in Alice, as part of the programme of support for the institution’s project for its centenary in 2016.
Enterprise Development Enterprise and Supplier Development (ESD) Workshop was held with all SOC Procurement Units in partnership with EDD and NYDA on the Youth Employment Accord to discuss the current enterprise development initiatives to support designated groups, including the proposed flagship projects i.e. Youth Cooperatives and Sector-specific Incubation Hubs.
Partnerships with SOCs and other key stakeholdersThe first DPE-SOC Youth Camp was held and 100 learners doing Maths & Science at mainly rural schools in the Free State province participated. In addition, five Youth Career and Information Expos were hosted, in collaboration with SOCs and more than 10 000 Grade 10-12 Maths and Science learners were in attendance. Further, more than 2000 maths pocket dictionaries were also donated to various school libraries to support learners doing Mathematics. Female engineers, artisans and technicians from SOC conducted motivation talks during the various visits to promote Maths, Science and Engineering studies.
4.3.4.3 Changes to Planned Targets
The Department continuously review the relevance of its APP to ensure that it remains relevant and appropriate to support the government outcomes. In the period under review, the Department undertook a review of its APP to assess relevance of certain projects and better align the annual targets to resources.. As a result, few changes on the annual performance targets were effected. A revised Annual Performance Plan was signed by the Executive Authority of the Department. The revised targets were used to monitor performance within the programme.
4.3.4.4 Sub-programme expenditure
2013/14 2012/13
Sub- Programme Economic Impact and Policy Alignment
Final Appropriation
ActualExpenditure
(Over)/Under
Expenditure
Final Appropriation
ActualExpenditure
(Over)/Under
Expenditure
R’000 R’000 R’000 R’000 R’000 R’000
Management 1 817 1 379 438 1 798 1 508 290
Environmental Policy Alignment
3 460 2 652 808 2 542 2 457 85
Economic Policy Alignment
3 316 411 2 905 1 347 1 245 102
Transformation, Skills Development and Youth
7 476 5 244 2 232 5 035 4 780 255
Total 16 069 9 686 6 383 10 722 9 990 732
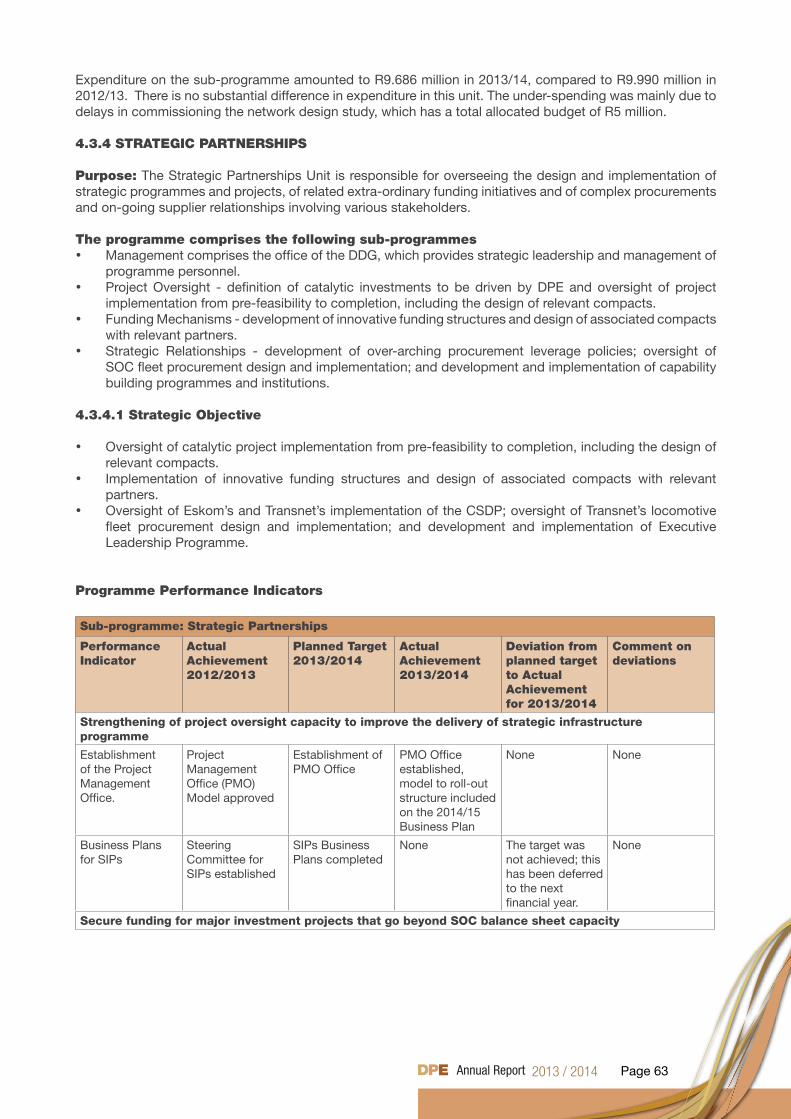
Page 63
Expenditure on the sub-programme amounted to R9.686 million in 2013/14, compared to R9.990 million in 2012/13. There is no substantial difference in expenditure in this unit. The under-spending was mainly due to delays in commissioning the network design study, which has a total allocated budget of R5 million.
4.3.4 STRATEGIC PARTNERSHIPS
Purpose: The Strategic Partnerships Unit is responsible for overseeing the design and implementation of strategic programmes and projects, of related extra-ordinary funding initiatives and of complex procurements and on-going supplier relationships involving various stakeholders. The programme comprises the following sub-programmes• Management comprises the office of the DDG, which provides strategic leadership and management of
programme personnel. • Project Oversight - definition of catalytic investments to be driven by DPE and oversight of project
implementation from pre-feasibility to completion, including the design of relevant compacts. • Funding Mechanisms - development of innovative funding structures and design of associated compacts
with relevant partners. • Strategic Relationships - development of over-arching procurement leverage policies; oversight of
SOC fleet procurement design and implementation; and development and implementation of capability building programmes and institutions.
4.3.4.1 Strategic Objective
• Oversight of catalytic project implementation from pre-feasibility to completion, including the design of relevant compacts.
• Implementation of innovative funding structures and design of associated compacts with relevant partners.
• Oversight of Eskom’s and Transnet’s implementation of the CSDP; oversight of Transnet’s locomotive fleet procurement design and implementation; and development and implementation of Executive Leadership Programme.
Programme Performance Indicators
Sub-programme: Strategic Partnerships
Performance Indicator
Actual Achievement 2012/2013
Planned Target2013/2014
Actual Achievement2013/2014
Deviation from planned target to Actual Achievement for 2013/2014
Comment on deviations
Strengthening of project oversight capacity to improve the delivery of strategic infrastructure programme
Establishment of the Project Management Office.
Project Management Office (PMO)Model approved
Establishment of PMO Office
PMO Office established, model to roll-out structure included on the 2014/15 Business Plan
None None
Business Plans for SIPs
Steering Committee for SIPs established
SIPs Business Plans completed
None The target was not achieved; this has been deferred to the next financial year.
None
Secure funding for major investment projects that go beyond SOC balance sheet capacity
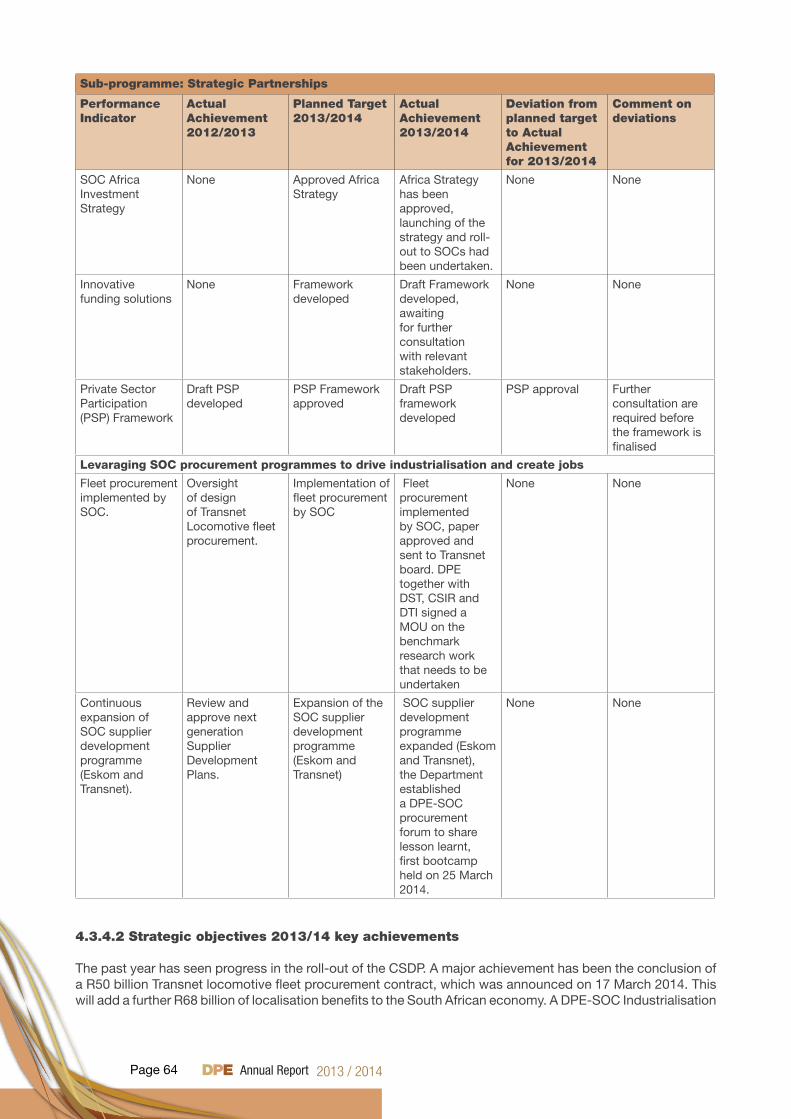
Page 64
Sub-programme: Strategic Partnerships
Performance Indicator
Actual Achievement 2012/2013
Planned Target2013/2014
Actual Achievement2013/2014
Deviation from planned target to Actual Achievement for 2013/2014
Comment on deviations
SOC Africa Investment Strategy
None Approved Africa Strategy
Africa Strategy has been approved, launching of the strategy and roll-out to SOCs had been undertaken.
None None
Innovative funding solutions
None Framework developed
Draft Framework developed, awaiting for further consultation with relevant stakeholders.
None None
Private Sector Participation (PSP) Framework
Draft PSP developed
PSP Framework approved
Draft PSP framework developed
PSP approval Further consultation are required before the framework is finalised
Levaraging SOC procurement programmes to drive industrialisation and create jobs
Fleet procurement implemented by SOC.
Oversight of design of Transnet Locomotive fleet procurement.
Implementation of fleet procurement by SOC
Fleet procurement implemented by SOC, paper approved and sent to Transnet board. DPE together with DST, CSIR and DTI signed a MOU on the benchmark research work that needs to be undertaken
None None
Continuous expansion of SOC supplier development programme (Eskom and Transnet).
Review and approve next generation Supplier Development Plans.
Expansion of the SOC supplier development programme (Eskom and Transnet)
SOC supplier development programme expanded (Eskom and Transnet), the Department established a DPE-SOC procurement forum to share lesson learnt, first bootcamp held on 25 March 2014.
None None
4.3.4.2 Strategic objectives 2013/14 key achievements
The past year has seen progress in the roll-out of the CSDP. A major achievement has been the conclusion of a R50 billion Transnet locomotive fleet procurement contract, which was announced on 17 March 2014. This will add a further R68 billion of localisation benefits to the South African economy. A DPE-SOC Industrialisation
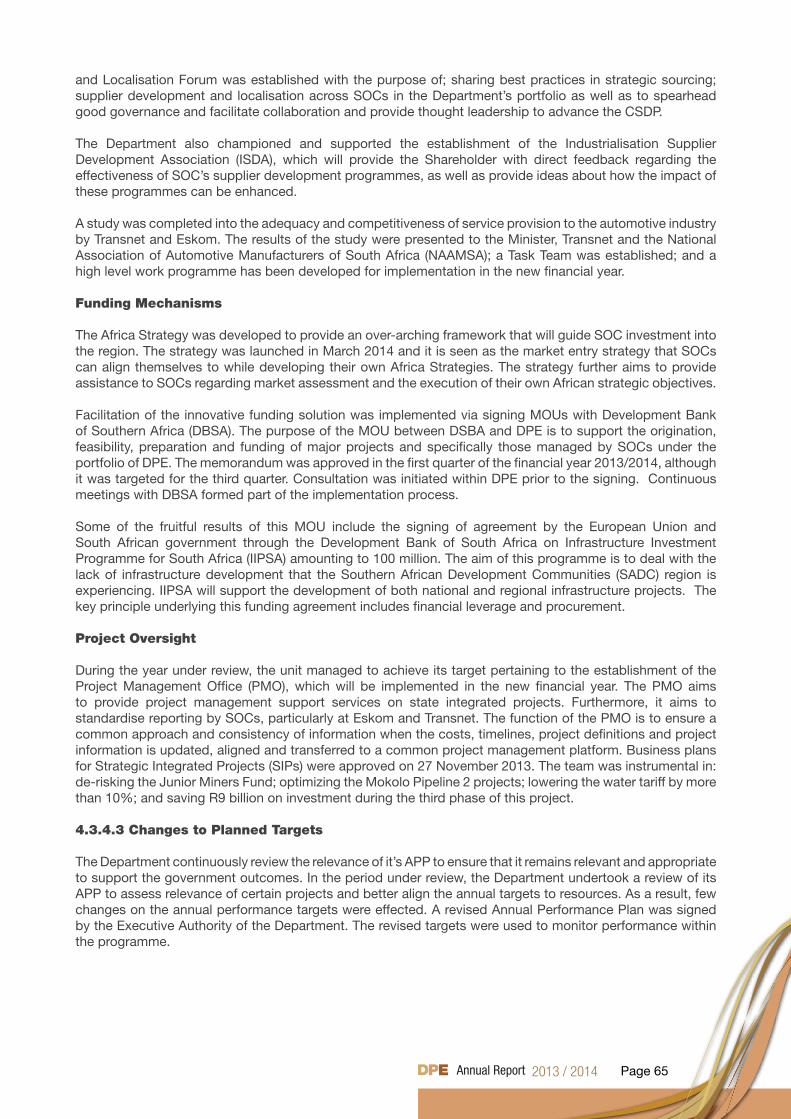
Page 65
and Localisation Forum was established with the purpose of; sharing best practices in strategic sourcing; supplier development and localisation across SOCs in the Department’s portfolio as well as to spearhead good governance and facilitate collaboration and provide thought leadership to advance the CSDP.
The Department also championed and supported the establishment of the Industrialisation Supplier Development Association (ISDA), which will provide the Shareholder with direct feedback regarding the effectiveness of SOC’s supplier development programmes, as well as provide ideas about how the impact of these programmes can be enhanced.
A study was completed into the adequacy and competitiveness of service provision to the automotive industry by Transnet and Eskom. The results of the study were presented to the Minister, Transnet and the National Association of Automotive Manufacturers of South Africa (NAAMSA); a Task Team was established; and a high level work programme has been developed for implementation in the new financial year.
Funding Mechanisms
The Africa Strategy was developed to provide an over-arching framework that will guide SOC investment into the region. The strategy was launched in March 2014 and it is seen as the market entry strategy that SOCs can align themselves to while developing their own Africa Strategies. The strategy further aims to provide assistance to SOCs regarding market assessment and the execution of their own African strategic objectives.
Facilitation of the innovative funding solution was implemented via signing MOUs with Development Bank of Southern Africa (DBSA). The purpose of the MOU between DSBA and DPE is to support the origination, feasibility, preparation and funding of major projects and specifically those managed by SOCs under the portfolio of DPE. The memorandum was approved in the first quarter of the financial year 2013/2014, although it was targeted for the third quarter. Consultation was initiated within DPE prior to the signing. Continuous meetings with DBSA formed part of the implementation process.
Some of the fruitful results of this MOU include the signing of agreement by the European Union and South African government through the Development Bank of South Africa on Infrastructure Investment Programme for South Africa (IIPSA) amounting to 100 million. The aim of this programme is to deal with the lack of infrastructure development that the Southern African Development Communities (SADC) region is experiencing. IIPSA will support the development of both national and regional infrastructure projects. The key principle underlying this funding agreement includes financial leverage and procurement.
Project Oversight
During the year under review, the unit managed to achieve its target pertaining to the establishment of the Project Management Office (PMO), which will be implemented in the new financial year. The PMO aims to provide project management support services on state integrated projects. Furthermore, it aims to standardise reporting by SOCs, particularly at Eskom and Transnet. The function of the PMO is to ensure a common approach and consistency of information when the costs, timelines, project definitions and project information is updated, aligned and transferred to a common project management platform. Business plans for Strategic Integrated Projects (SIPs) were approved on 27 November 2013. The team was instrumental in: de-risking the Junior Miners Fund; optimizing the Mokolo Pipeline 2 projects; lowering the water tariff by more than 10%; and saving R9 billion on investment during the third phase of this project.
4.3.4.3 Changes to Planned Targets
The Department continuously review the relevance of it’s APP to ensure that it remains relevant and appropriate to support the government outcomes. In the period under review, the Department undertook a review of its APP to assess relevance of certain projects and better align the annual targets to resources. As a result, few changes on the annual performance targets were effected. A revised Annual Performance Plan was signed by the Executive Authority of the Department. The revised targets were used to monitor performance within the programme.
Page 66
4.3.4.4 Sub-programme expenditure
2013/14 2012/13
Sub- Programme Strategic Partnerships
Final Appropriation
ActualExpenditure
(Over)/Under Expenditure
Final Appropriation
ActualExpenditure
(Over)/Under Expenditure
R’000 R’000 R’000 R’000 R’000 R’000
Management 4 398 3 697 700 4 496 4 364 132
Project Oversight
2 309 1 559 750 416 328 88
Funding Mechanisms
1 192 215 979 100 - 100
Supplier Relationships
3 015 1 785 1 230 1 543 1 281 262
Total 10 914 7 256 3 658 6 555 5 973 582
Expenditure in the sub-programme amounted to R7.256 million in 2013/14, compared to R5.973 million in 2012/13. The increase in expenditure in this sub-programme is attributed to the fact that this unit was established in the 2012/13 financial year, when limited funding was available. Under-spending is attributed to projects that were planned to be outsourced, but which were implemented internally. The project on harmonising procurement policies and the planning framework at Eskom and Transnet (to enable collaboration and optimise supplier development and transformation initiative) was postponed.
5. TRANSFER PAYMENTS
5.1 Transfer payments to public entities
ENTITY TOTAL BUDGET
R’000
EXPENDITURE R’000
REMAINING BUDGET
R’000
% OF TOTAL BUDGET
USED
Denel (indemnity claim) 57 250 57 250 0 100%
The transfer to Denel amounting to R57.250 million in respect of the eighth indemnity claim was disbursed in December 2013. Refer Annexure 1A of the Annual Financial Statements.
Transfer payments to all organisations other than public entitiesThe Department did not effect any transfer payments to any organisations, other than public entities.
5.2.1 Donor Funds Received
Donor funding in kind is reported on in the Accounting Officer’s Report.
Page 67
6. CAPITAL INVESTMENT
Capital investment, maintenance and asset management plan.
The Department does not have any major capital and/or investment infrastructure projects.
The Department conducted two full asset counts, one of which was conducted by independent officials, during the period under review.
All assets are captured on LOGIS on a personnel inventory basis to ensure control assets.
All assets in the Department are purchased and accounted for on LOGIS.The Department has complied with the Asset Management Reform milestones.
Capital Assets:During the year under review the Department disposed of unserviceable and redundant assets as well as writing off theft and losses and donations to other State Institutions at original cost value as per the asset register amount to R1 203 984.00. Refer note 29.2 respectively to the Annual Financial Statements for disposal of capital assets.
Minor AssetsDuring the year under review the Department disposed of unserviceable and redundant assets as well as writing off thefts and losses and donations to other State institutions at original cost value as per the asset register amounting to R220 549.00 Refer note 29.4 to the Annual Financial Statements for disposal of minor assets.
InventoriesThe Department has one store that consists mainly of stationery. The inventories on hand as at 31 March 2014 are value at the weighted average price amounting to R28 016.11.
During the year under review the Department continued to apply its strategy of procuring consumables and stationery on a needs basis. The amount reflected at year end, R28 016.00 has increased slightly, relative to the previous year’s closing balance of R23 012.94 due to the distribution to units on receipt of stationery and consumables. Refer to Annexure 6 of the Annual Financial Statements.

PART CGOVERNANCE
Page 69
1. INTRODUCTIONThe Department has established systems and governance structures to oversee its processes to improve accountability. These systems and structures are crucial in promoting good governance within the Department and ensuring that the Department complies with legislative requirements.
2. RISK MANAGEMENTThe Department has managed to establish and maintain a system of risk management that is consistent with various statutory provisions, including, but not limited to, the Public Finance Management Act, Treasury Regulations and the Public Sector Risk Management Framework. The Department continued to enhance its risk management practices in line with: the approved Enterprise Risk Management Framework; the Enterprise Risk Management Policy; and Level 3 of the Risk Management sub-set of the Public Sector Risk Management Capability Maturity Model published by National Treasury.
The Department also enhanced its risk management practices in line with findings and recommendations of the Management Performance Assessment Tool issued by the Department of Performance Monitoring and Evaluation.
A Strategic Risk Register was established, maintained and updated with emerging risks. Risks were also removed from the register as relevant projects and/or activities were completed. The strategic risks were also linked to programme risks, in order to ensure that all risks are addressed holistically and receive attention at all levels of management. The increased attention on risk enabled implementation of planned mitigations, which directly correlated with programme delivery. Shareholder risks also continue to be identified, monitored and mitigated on an on-going basis.
In an effort to ensure that risk exposure is confined to approved risk tolerance levels established for the Department, the Audit Committee, EXCO and relevant Risk Owners monitored the effectiveness of controls and facilitated improvement in mitigating against risks considered material to attaining the Department’s objectives.
Furthermore, the Department developed a Policy Development Framework, Standard Policy Template, Policy Development Checklist and Policy Consultation Guidelines in order to enhance its compliance management practices. The aforementioned Guidelines will improve mitigation of compliance risks and the general functioning of the risk management system.
3. FRAUD AND CORRUPTION The Department has initiated efforts geared to ensure that its fraud risk management practices are consistent with the Minimum Anti-Corruption Capacity (MACC) requirements applicable to government departments. To date, the Department maintains and implements an approved fraud and corruption framework that is supported by the following guidelines: • Fraud and Corruption Prevention Policy;• Fraud and Corruption Prevention Plan;• Standard Operating Procedures on Internal Investigations; and• Fraud and Corruption Prevention Implementation Schedule.
The guidelines have been established to:• enhance controls designed to prevent, detect, investigate and resolve illegal acts (actual or potential)
that the Department faces;• bring clarity to various role players involved in the Department’s spectrum of fraud prevention; and• ensure independence regarding the treatment of fraud incidents; and • enhance incident reporting mechanisms and ensure the protection of whistle-blowers, in line with the
Protected Disclosures Act.
Page 70
4. MINIMISING CONFLICT OF INTEREST The Department engaged the offices of the Public Service Commission to present two compulsory workshops on Managing Conflict of Interest, which ran on 25 September 2013 and 2 October 2013. Before all bid evaluation processes, nominated panellists are required to complete a form, confirming that they do not have any conflict of interest relating to the items under consideration in the bid evaluation process. There have been no cases of conflict of interest reported to HR.
5. CODE OF CONDUCT The Department does not have an independent code of conduct, but adheres fully to the Public Service Code of Conduct. In the event of a breach, depending on the seriousness of the alleged breach, an investigation is conducted to establish whether or not a prima facie case can be established. Thereafter, the alleged offender is: called in, with his/her union representative, and served with a notice of intention to institute disciplinary action; given an opportunity to file a response to the allegations, should he or she so wish.
Where the matter can be dealt with by issuing a warning, to ensure that discipline remains corrective and progressive in nature, such warnings are issued and employees advised of their right to appeal (if not SMS). Where the offences are repeated or of a serious nature, external presiding officers are sourced, to ensure complete impartiality to the process, as the Department is quite small and finding an individual within the Department to chair the enquiry, who has not heard about the allegations, has proven to be difficult, as the entire Department sits over only two floors. The presiding officer’s decision is final and HR implements the findings on PERSAL. To date there has only been 1 formal disciplinary enquiry, which is still awaiting sentencing.
6. HEALTH SAFETY AND ENVIRONMENTAL ISSUES• The department is compliant with the Health & Safety Act: there is a committee in place to oversee all
matters of health & safety within the department.• There are OHS representatives trained in health & safety matters.• Health & safety equipment is fully serviceable & fire drills are also conducted• Environmentally, the department is currently located in a very congested space. The nature of the work
environment is not conducive to effective productivity and this may impact on service delivery to some extent.
• However, processes are currently under way for the department to acquire suitable alternative office accommodation.
7. PORTFOLIO COMMITTEEPortfolio Committee meeting dates were as follows: • 13 April 2013• 25-26 July 2013• 1-2 August 2013• 8 October 2013• 4-6 February 2014
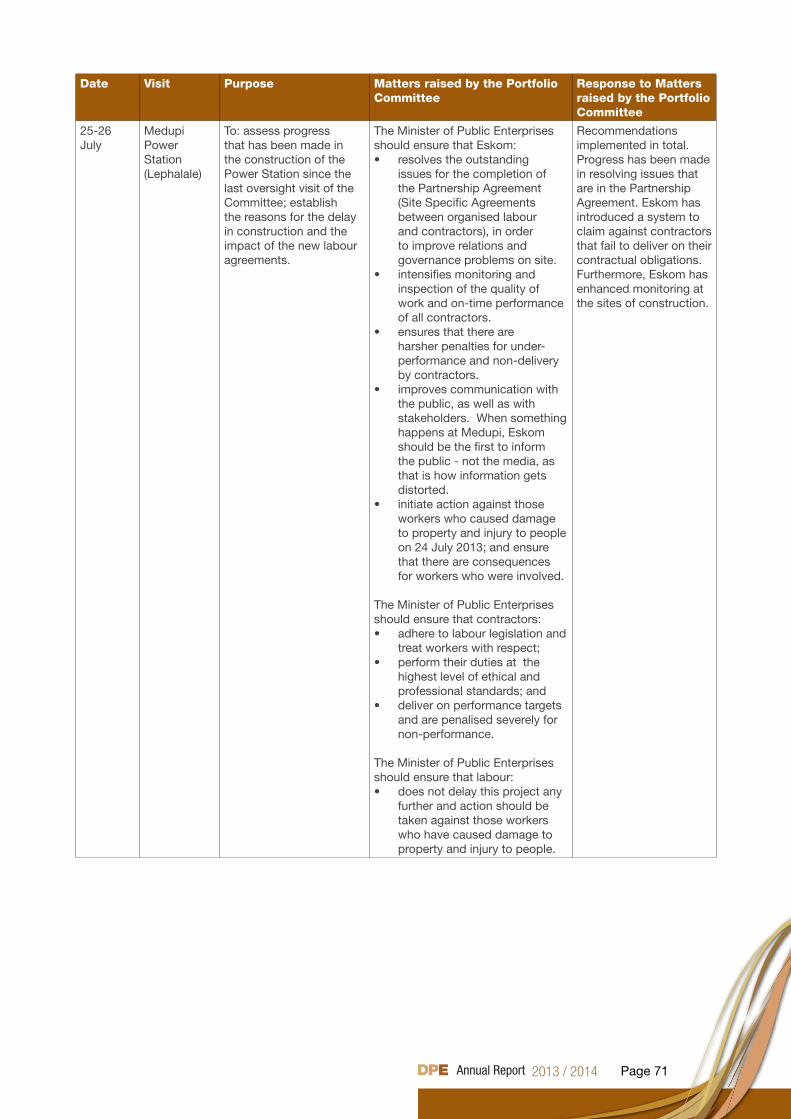
Page 71
Date Visit Purpose Matters raised by the Portfolio Committee
Response to Matters raised by the Portfolio Committee
25-26 July
Medupi Power Station(Lephalale)
To: assess progress that has been made in the construction of the Power Station since the last oversight visit of the Committee; establish the reasons for the delay in construction and the impact of the new labour agreements.
The Minister of Public Enterprises should ensure that Eskom:• resolves the outstanding
issues for the completion of the Partnership Agreement (Site Specific Agreements between organised labour and contractors), in order to improve relations and governance problems on site.
• intensifies monitoring and inspection of the quality of work and on-time performance of all contractors.
• ensures that there are harsher penalties for under-performance and non-delivery by contractors.
• improves communication with the public, as well as with stakeholders. When something happens at Medupi, Eskom should be the first to inform the public - not the media, as that is how information gets distorted.
• initiate action against those workers who caused damage to property and injury to people on 24 July 2013; and ensure that there are consequences for workers who were involved.
The Minister of Public Enterprises should ensure that contractors:• adhere to labour legislation and
treat workers with respect;• perform their duties at the
highest level of ethical and professional standards; and
• deliver on performance targets and are penalised severely for non-performance.
The Minister of Public Enterprises should ensure that labour:• does not delay this project any
further and action should be taken against those workers who have caused damage to property and injury to people.
Recommendations implemented in total. Progress has been made in resolving issues that are in the Partnership Agreement. Eskom has introduced a system to claim against contractors that fail to deliver on their contractual obligations. Furthermore, Eskom has enhanced monitoring at the sites of construction.
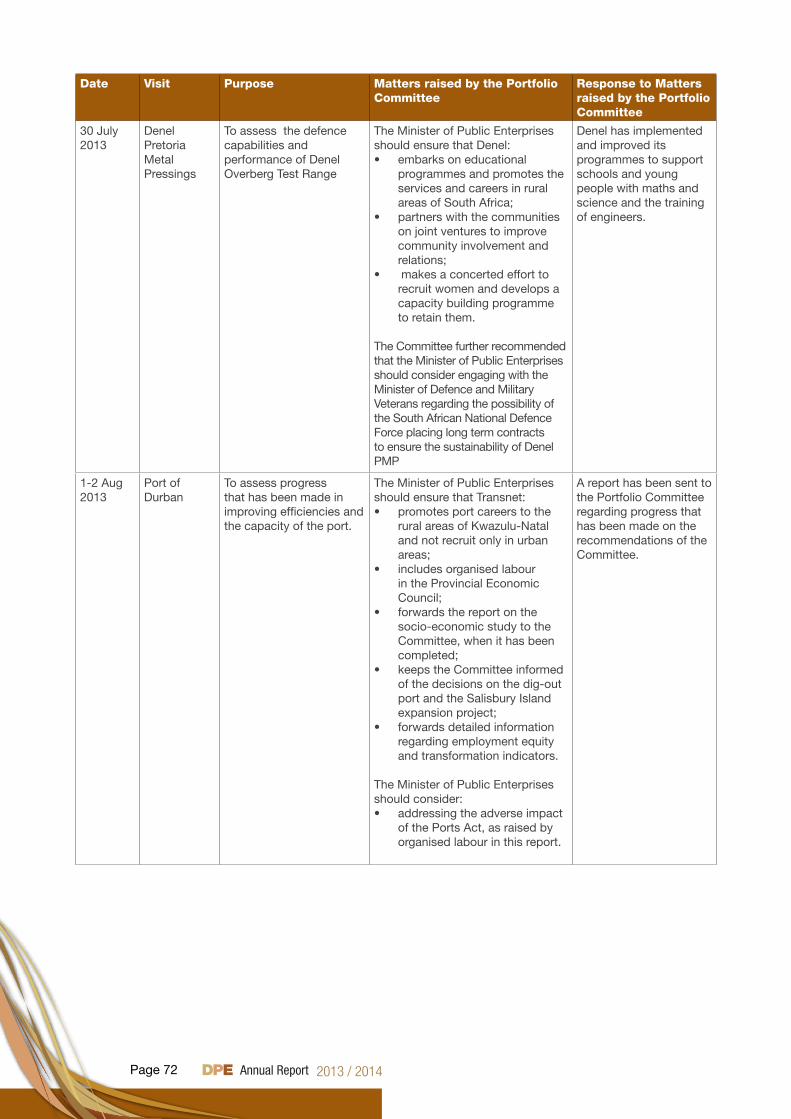
Page 72
Date Visit Purpose Matters raised by the Portfolio Committee
Response to Matters raised by the Portfolio Committee
30 July 2013
Denel Pretoria Metal Pressings
To assess the defence capabilities and performance of Denel Overberg Test Range
The Minister of Public Enterprises should ensure that Denel:• embarks on educational
programmes and promotes the services and careers in rural areas of South Africa;
• partners with the communities on joint ventures to improve community involvement and relations;
• makes a concerted effort to recruit women and develops a capacity building programme to retain them.
The Committee further recommended that the Minister of Public Enterprises should consider engaging with the Minister of Defence and Military Veterans regarding the possibility of the South African National Defence Force placing long term contracts to ensure the sustainability of Denel PMP
Denel has implemented and improved its programmes to support schools and young people with maths and science and the training of engineers.
1-2 Aug 2013
Port of Durban
To assess progress that has been made in improving efficiencies and the capacity of the port.
The Minister of Public Enterprises should ensure that Transnet:• promotes port careers to the
rural areas of Kwazulu-Natal and not recruit only in urban areas;
• includes organised labour in the Provincial Economic Council;
• forwards the report on the socio-economic study to the Committee, when it has been completed;
• keeps the Committee informed of the decisions on the dig-out port and the Salisbury Island expansion project;
• forwards detailed information regarding employment equity and transformation indicators.
The Minister of Public Enterprises should consider:• addressing the adverse impact
of the Ports Act, as raised by organised labour in this report.
A report has been sent to the Portfolio Committee regarding progress that has been made on the recommendations of the Committee.
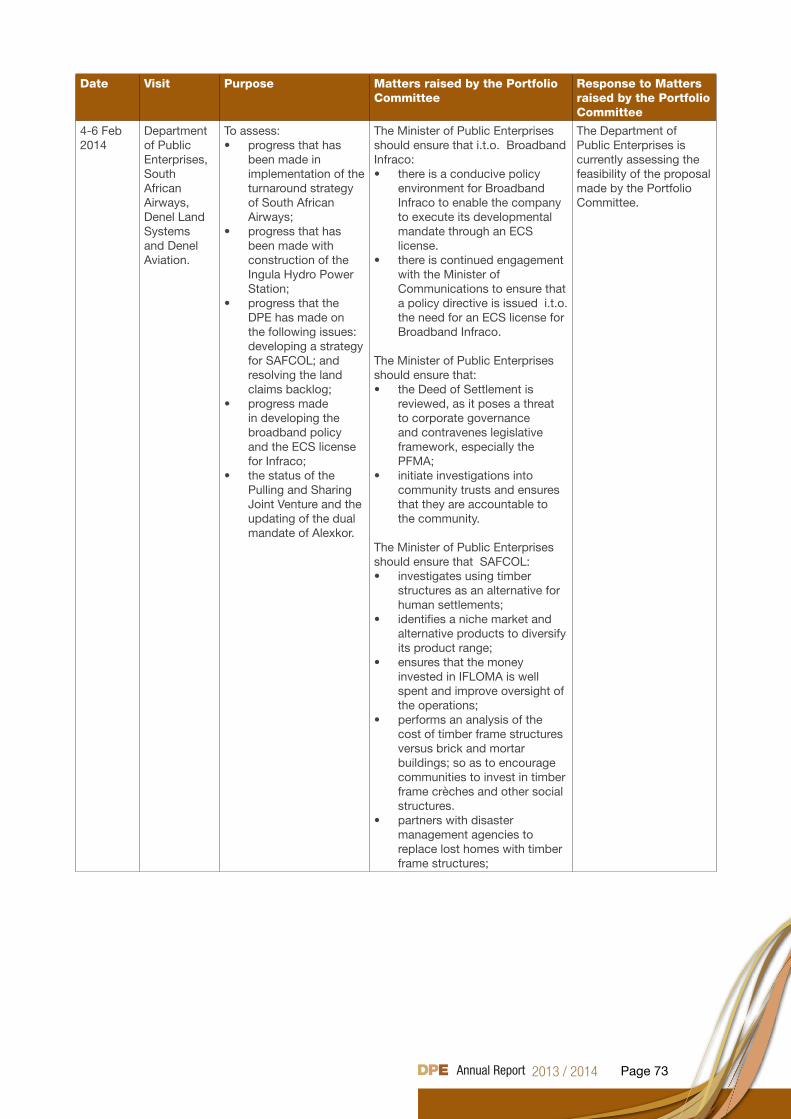
Page 73
Date Visit Purpose Matters raised by the Portfolio Committee
Response to Matters raised by the Portfolio Committee
4-6 Feb 2014
Department of Public Enterprises, South African Airways, Denel Land Systems and Denel Aviation.
To assess:• progress that has
been made in implementation of the turnaround strategy of South African Airways;
• progress that has been made with construction of the Ingula Hydro Power Station;
• progress that the DPE has made on the following issues: developing a strategy for SAFCOL; and resolving the land claims backlog;
• progress made in developing the broadband policy and the ECS license for Infraco;
• the status of the Pulling and Sharing Joint Venture and the updating of the dual mandate of Alexkor.
The Minister of Public Enterprises should ensure that i.t.o. Broadband Infraco:• there is a conducive policy
environment for Broadband Infraco to enable the company to execute its developmental mandate through an ECS license.
• there is continued engagement with the Minister of Communications to ensure that a policy directive is issued i.t.o. the need for an ECS license for Broadband Infraco.
The Minister of Public Enterprises should ensure that:• the Deed of Settlement is
reviewed, as it poses a threat to corporate governance and contravenes legislative framework, especially the PFMA;
• initiate investigations into community trusts and ensures that they are accountable to the community.
The Minister of Public Enterprises should ensure that SAFCOL:• investigates using timber
structures as an alternative for human settlements;
• identifies a niche market and alternative products to diversify its product range;
• ensures that the money invested in IFLOMA is well spent and improve oversight of the operations;
• performs an analysis of the cost of timber frame structures versus brick and mortar buildings; so as to encourage communities to invest in timber frame crèches and other social structures.
• partners with disaster management agencies to replace lost homes with timber frame structures;
The Department of Public Enterprises is currently assessing the feasibility of the proposal made by the Portfolio Committee.
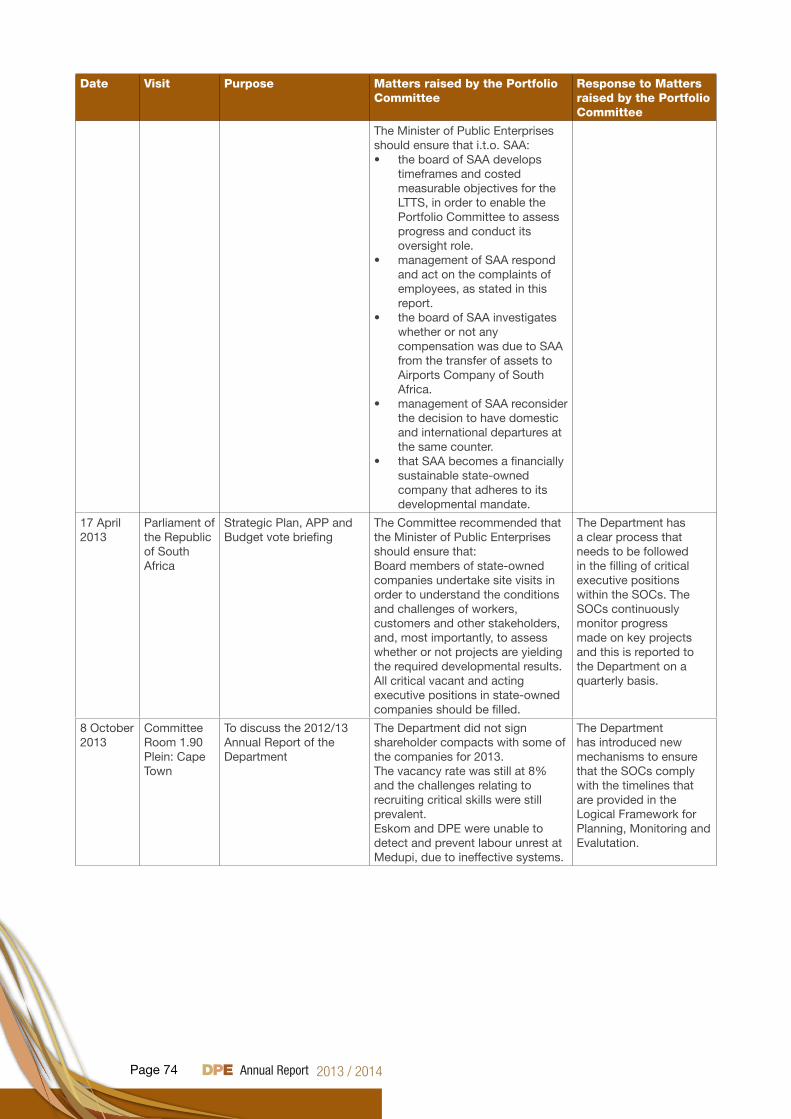
Page 74
Date Visit Purpose Matters raised by the Portfolio Committee
Response to Matters raised by the Portfolio Committee
The Minister of Public Enterprises should ensure that i.t.o. SAA: • the board of SAA develops
timeframes and costed measurable objectives for the LTTS, in order to enable the Portfolio Committee to assess progress and conduct its oversight role.
• management of SAA respond and act on the complaints of employees, as stated in this report.
• the board of SAA investigates whether or not any compensation was due to SAA from the transfer of assets to Airports Company of South Africa.
• management of SAA reconsider the decision to have domestic and international departures at the same counter.
• that SAA becomes a financially sustainable state-owned company that adheres to its developmental mandate.
17 April 2013
Parliament of the Republic of South Africa
Strategic Plan, APP and Budget vote briefing
The Committee recommended that the Minister of Public Enterprises should ensure that:Board members of state-owned companies undertake site visits in order to understand the conditions and challenges of workers, customers and other stakeholders, and, most importantly, to assess whether or not projects are yielding the required developmental results. All critical vacant and acting executive positions in state-owned companies should be filled.
The Department has a clear process that needs to be followed in the filling of critical executive positions within the SOCs. The SOCs continuously monitor progress made on key projects and this is reported to the Department on a quarterly basis.
8 October 2013
Committee Room 1.90 Plein: Cape Town
To discuss the 2012/13 Annual Report of the Department
The Department did not sign shareholder compacts with some of the companies for 2013.The vacancy rate was still at 8% and the challenges relating to recruiting critical skills were still prevalent. Eskom and DPE were unable to detect and prevent labour unrest at Medupi, due to ineffective systems.
The Department has introduced new mechanisms to ensure that the SOCs comply with the timelines that are provided in the Logical Framework for Planning, Monitoring and Evalutation.
Page 75
8. SCOPA RESOLUTIONSThe Department did not have any resolutions issued by SCOPA.
9. PRIOR MODIFICATIONS TO AUDIT REPORTSThe following finding was reported in the Auditor-General’s Report for the year ended 31 March 2013.
Financial Management The financial statements submitted for auditing were not prepared in accordance with the prescribed financial reporting framework and/or supported by full and proper records, as required by section 40(1) (a) of the Public Finance Management Act. Material mis-statements on key management personnel, impairments, investments and litigations were identified by the auditors in the submitted financial statement and were subsequently corrected, resulting in the financial statements receiving an unqualified audit opinion.
The Department has designed and implemented a Financial Management Plan, as well as a review of the processes and controls for the compilation of the Annual Financial Statements, to prevent a recurrence of this finding.
10. INTERNAL CONTROL UNITThe Department does not have a dedicated unit that is responsible for internal control. This function is performed by a number of Units such as Strategic Planning, Monitoring and Evaluation in Programme 1 and Compliance Unit in Programme 2. This has allowed the Department to develop controls which are continuously tested by the Internal Audit. In the period ahead, the Department will explore the viability of creating an independent unit that will focus on internal control. This will be dependent on the availability of resources as the capacity of the Department remains constrained.
11. INTERNAL AUDIT AND AUDIT COMMITTEES
INTERNAL AUDIT
The Department has an Internal Audit unit, which reports administratively to the Accounting Officer and functionally to the Audit Committee. The Internal Audit unit consists of a Chief Audit Executive and a Deputy Director and there is a co-sourcing arrangement with a registered firm of accountants and auditors. Internal Audit’s activities and responsibilities are governed by the Internal Audit Charter that is in line with the International Standards for the Professional Practice of Internal Auditing, Public Finance Management Act and the National Treasury Internal Audit Framework.
Internal Audit Objective and Key Activities:The objective of the Internal Audit unit is to provide independent, objective assurance and consulting services designed to add value and improve the Department’s operations. It helps the Department accomplish its objectives by bringing a systematic, disciplined approach to evaluating and improving the effectiveness of risk management, internal controls and governance processes.
Amongst the unit’s key activities, Internal Audit is responsible for:• Developing an Internal Audit Rolling Three-year Strategic and Annual Operation plan, using appropriate
risk-based methodology that takes into account any risks or control concerns identified on the Strategic Risk Register and by management, for approval by the Audit Committee;
• Executing planned audits, as per the Internal Audit Operational Plan, as approved, including, and where appropriate, any special tasks or projects requested by management and the Audit Committee;
Page 76
• Following up and reporting on all internal and external audit findings and recommendations for all reported issues; and
• Issuing periodic reports to the Audit Committee and management that effectively summarise the results of audit activities; and updating the Audit Committee on emerging trends and successful practices in internal auditing.
Summary of Internal Audit Work DoneThe Internal Audit Rolling Three-year Strategic and Annual Operation Plan was in line with the risk-based approach that takes into account the Department’s Strategic Risk Register. It was approved by the Audit Committee. The Internal Audit unit completed all planned audits as per the approved Annual Operational Plan. Audit reports were issued to management, with comprehensive recommendations to address identified internal control weaknesses. The Internal Audit unit reported the results for the completed audits to the Audit Committee and the Department’s Executive.
Ad-hoc projects requested by management were completed and relevant recommendations were provided for improvement where appropriate. The Internal Audit unit also tracked implementation of management action plans to address identified internal control weaknesses and reported the results to the Executive Committee as well as the Audit Committee on a quarterly basis.
For combined assurance, the Internal Audit unit worked rigorously with management and in consultation with other assurance providers, in order to pro-actively monitor and assess progress on implementation of controls for the Department’s strategic risks. The Internal Audit unit co-ordinated its work with those of other assurance providers and ensured the adequacy and effectiveness of quarterly reporting on combined assurance.
AUDIT COMMITTEES
The Audit Committee is an independent and objective body that reports to the Executive Authority through the Accounting Officer. The Audit Committee’s activities and responsibilities are governed by the Audit Committee Charter, which is in line with the International Standards for the Professional Practice of Internal Auditing, Public Finance Management Act and the National Treasury Internal Audit Framework.
Audit Committee Objective and Key ActivitiesThe overall objective and key activities of the Audit Committee are to support the Accounting Officer and Executive Management in fulfilling oversight responsibilities for the financial reporting process, the audit process, the system of internal control, governance and risk management, including:• The integrity of the Department’s financial reporting;• Compliance with legal and regulatory obligations;• The effectiveness of the Department’s enterprise-wide risk management and internal control system;
and• Oversight of the effectiveness and efficiency of the internal auditors, as well as the independence of the
internal and external auditors.
Membership and AttendanceThe Audit Committee consists of the four members listed below. All Audit Committee members, including the Chairperson, are independent, which is in line with corporate governance practice. During the year under review, the Audit Committee held four (4) meetings, as per the approved Audit Committee Charter.
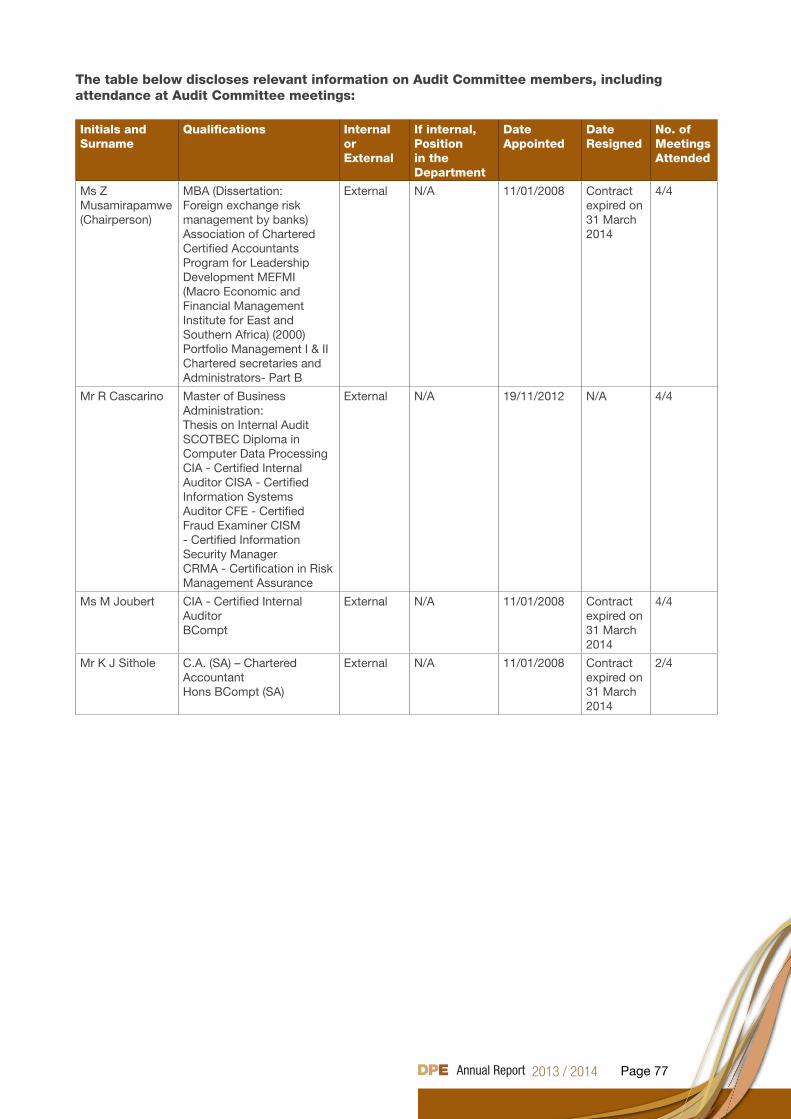
Page 77
The table below discloses relevant information on Audit Committee members, including attendance at Audit Committee meetings:
Initials and Surname
Qualifications Internal or External
If internal, Position in the Department
Date Appointed
Date Resigned
No. of Meetings Attended
Ms Z Musamirapamwe(Chairperson)
MBA (Dissertation: Foreign exchange risk management by banks) Association of Chartered Certified Accountants Program for Leadership Development MEFMI (Macro Economic and Financial Management Institute for East and Southern Africa) (2000)Portfolio Management I & II Chartered secretaries and Administrators- Part B
External N/A 11/01/2008 Contract expired on 31 March 2014
4/4
Mr R Cascarino Master of Business Administration: Thesis on Internal AuditSCOTBEC Diploma in Computer Data Processing CIA - Certified Internal Auditor CISA - Certified Information Systems Auditor CFE - Certified Fraud Examiner CISM - Certified Information Security ManagerCRMA - Certification in Risk Management Assurance
External N/A 19/11/2012 N/A 4/4
Ms M Joubert CIA - Certified Internal AuditorBCompt
External N/A 11/01/2008 Contract expired on 31 March 2014
4/4
Mr K J Sithole C.A. (SA) – Chartered AccountantHons BCompt (SA)
External N/A 11/01/2008 Contract expired on 31 March 2014
2/4
Page 78
12. AUDIT COMMITTEE REPORTWe are pleased to present our report for the financial year ended 31 March 2014.
Audit Committee Responsibility.
The Audit Committee reported that it complied with its responsibilities arising from Section 38 (1) (a) (ii) of the Public Finance Management Act and Treasury Regulation 3.1.13. The Audit Committee also reported that it adopted appropriate formal terms of reference as its Audit Committee Charter. The Audit Committee has regulated its affairs in compliance with this charter and has discharged all its responsibilities as contained therein, except in instances where the committee has not reviewed changes in accounting policies and practices.
The Effectiveness of Internal Control.Our review of the findings of the Internal Audit work, which was based on the risk assessments conducted in the Department, revealed certain weaknesses, which were then raised with the Department. The following internal audit work was completed during the year under review:• Enterprise Risk Management (ERM)• Performance Information Review (Alignment of the Strategic Plan and Annual Performance {lan) • Fraud prevention and detection • Annual Report Review• Human Resource Management & Development • PERSAL payroll• Business continuity management including IT continuity/DRP • Key financial reporting controls (Financial Management)• Shareholder Oversight Audit• Performance Information Review (Completeness, accuracy and validity of supporting evidence for
achievement)• Supply Chain and Asset Management (Procure-to pay including Fixed Assets)• Information Technology General Controls (ITGC)
The following were areas of concern based on Internal Audit Quarterly Reports:• In quarter 2, reviews of the Human Resources function indicated some compliance issues which required
addressing. • In quarter 3, reviews of Compliance monitoring processes over Manufacturing Enterprises and Energy
and Broadband Enterprises indicated areas where ongoing assessment would be required.• In quarter 4, some compliance issues were noted in the reviews of Supply Chain Management.In all of these areas follow-up to ensure the implementation of effective corrective action, is required.
In-Year Management and Monthly/Quarterly Report.
The Department reported monthly and quarterly to the Treasury as required by the PFMA. The Audit Committee is satisfied with the content and quality of monthly and quarterly reports prepared and issued by the Accounting Officer of the Department during the year under review. Following the departure of the Chief Audit Executive in the second quarter, the position was filled in quarter 4.
Evaluation of Financial Statements.
We have reviewed the annual financial statements prepared by the department.
The Audit Committee concurs and accepts the conclusions of the Auditor-General on the annual financial statements and is of the opinion that the audited annual financial statements be accepted and read together with the report of the Auditor-General.
Auditor General’s Report.
We have reviewed the department’s implementation plan for audit findings raised in the previous year and we are satisfied that the issues have been adequately resolved. Management has accepted and implemented all audit recommendations in the prior year. Alternative actions were taken which resolved the prior year audit findings.
The Audit Committee concurs and accepts the conclusions of the Auditor-General in the Auditor General’s Report.
Mr Richard CascarinoChairperson of the Audit CommitteeDepartment of Public Enterprises
12. AUDIT COMMITTEE REPORTWe are pleased to present our report for the financial year ended 31 March 2014.
Audit Committee Responsibility.
The Audit Committee reported that it complied with its responsibilities arising from Section 38 (1) (a) (ii) of the Public Finance Management Act and Treasury Regulation 3.1.13. The Audit Committee also reported that it adopted appropriate formal terms of reference as its Audit Committee Charter. The Audit Committee has regulated its affairs in compliance with this charter and has discharged all its responsibilities as contained therein, except in instances where the committee has not reviewed changes in accounting policies and practices.
The Effectiveness of Internal Control.Our review of the findings of the Internal Audit work, which was based on the risk assessments conducted in the Department, revealed certain weaknesses, which were then raised with the Department. The following internal audit work was completed during the year under review:• Enterprise Risk Management (ERM)• Performance Information Review (Alignment of the Strategic Plan and Annual Performance {lan) • Fraud prevention and detection • Annual Report Review• Human Resource Management & Development • PERSAL payroll• Business continuity management including IT continuity/DRP • Key financial reporting controls (Financial Management)• Shareholder Oversight Audit• Performance Information Review (Completeness, accuracy and validity of supporting evidence for
achievement)• Supply Chain and Asset Management (Procure-to pay including Fixed Assets)• Information Technology General Controls (ITGC)
The following were areas of concern based on Internal Audit Quarterly Reports:• In quarter 2, reviews of the Human Resources function indicated some compliance issues which required
addressing. • In quarter 3, reviews of Compliance monitoring processes over Manufacturing Enterprises and Energy
and Broadband Enterprises indicated areas where ongoing assessment would be required.• In quarter 4, some compliance issues were noted in the reviews of Supply Chain Management.In all of these areas follow-up to ensure the implementation of effective corrective action, is required.
In-Year Management and Monthly/Quarterly Report.
The Department reported monthly and quarterly to the Treasury as required by the PFMA. The Audit Committee is satisfied with the content and quality of monthly and quarterly reports prepared and issued by the Accounting Officer of the Department during the year under review. Following the departure of the Chief Audit Executive in the second quarter, the position was filled in quarter 4.
Evaluation of Financial Statements.
We have reviewed the annual financial statements prepared by the department.
The Audit Committee concurs and accepts the conclusions of the Auditor-General on the annual financial statements and is of the opinion that the audited annual financial statements be accepted and read together with the report of the Auditor-General.
PART DHUMAN RESOURCEMANAGEMENT
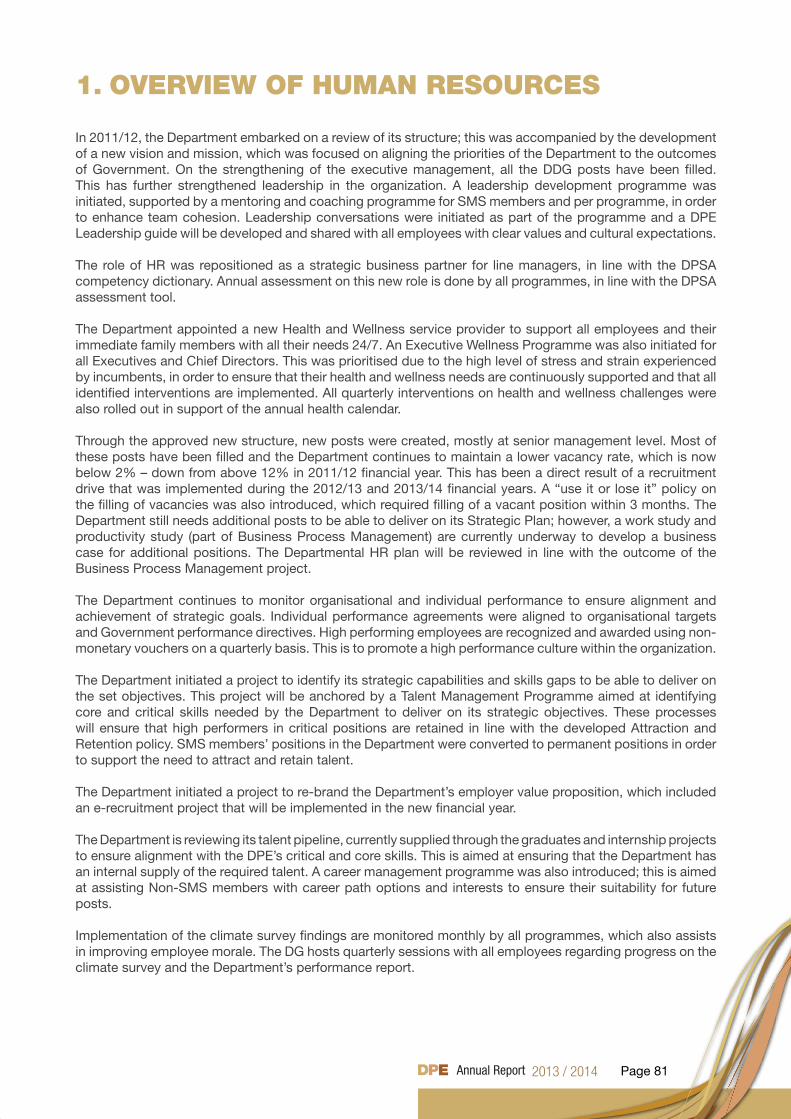
Page 81
1. OVERVIEW OF HUMAN RESOURCES
In 2011/12, the Department embarked on a review of its structure; this was accompanied by the development of a new vision and mission, which was focused on aligning the priorities of the Department to the outcomes of Government. On the strengthening of the executive management, all the DDG posts have been filled. This has further strengthened leadership in the organization. A leadership development programme was initiated, supported by a mentoring and coaching programme for SMS members and per programme, in order to enhance team cohesion. Leadership conversations were initiated as part of the programme and a DPE Leadership guide will be developed and shared with all employees with clear values and cultural expectations.
The role of HR was repositioned as a strategic business partner for line managers, in line with the DPSA competency dictionary. Annual assessment on this new role is done by all programmes, in line with the DPSA assessment tool.
The Department appointed a new Health and Wellness service provider to support all employees and their immediate family members with all their needs 24/7. An Executive Wellness Programme was also initiated for all Executives and Chief Directors. This was prioritised due to the high level of stress and strain experienced by incumbents, in order to ensure that their health and wellness needs are continuously supported and that all identified interventions are implemented. All quarterly interventions on health and wellness challenges were also rolled out in support of the annual health calendar.
Through the approved new structure, new posts were created, mostly at senior management level. Most of these posts have been filled and the Department continues to maintain a lower vacancy rate, which is now below 2% – down from above 12% in 2011/12 financial year. This has been a direct result of a recruitment drive that was implemented during the 2012/13 and 2013/14 financial years. A “use it or lose it” policy on the filling of vacancies was also introduced, which required filling of a vacant position within 3 months. The Department still needs additional posts to be able to deliver on its Strategic Plan; however, a work study and productivity study (part of Business Process Management) are currently underway to develop a business case for additional positions. The Departmental HR plan will be reviewed in line with the outcome of the Business Process Management project.
The Department continues to monitor organisational and individual performance to ensure alignment and achievement of strategic goals. Individual performance agreements were aligned to organisational targets and Government performance directives. High performing employees are recognized and awarded using non-monetary vouchers on a quarterly basis. This is to promote a high performance culture within the organization.
The Department initiated a project to identify its strategic capabilities and skills gaps to be able to deliver on the set objectives. This project will be anchored by a Talent Management Programme aimed at identifying core and critical skills needed by the Department to deliver on its strategic objectives. These processes will ensure that high performers in critical positions are retained in line with the developed Attraction and Retention policy. SMS members’ positions in the Department were converted to permanent positions in order to support the need to attract and retain talent.
The Department initiated a project to re-brand the Department’s employer value proposition, which included an e-recruitment project that will be implemented in the new financial year.
The Department is reviewing its talent pipeline, currently supplied through the graduates and internship projects to ensure alignment with the DPE’s critical and core skills. This is aimed at ensuring that the Department has an internal supply of the required talent. A career management programme was also introduced; this is aimed at assisting Non-SMS members with career path options and interests to ensure their suitability for future posts.
Implementation of the climate survey findings are monitored monthly by all programmes, which also assists in improving employee morale. The DG hosts quarterly sessions with all employees regarding progress on the climate survey and the Department’s performance report.
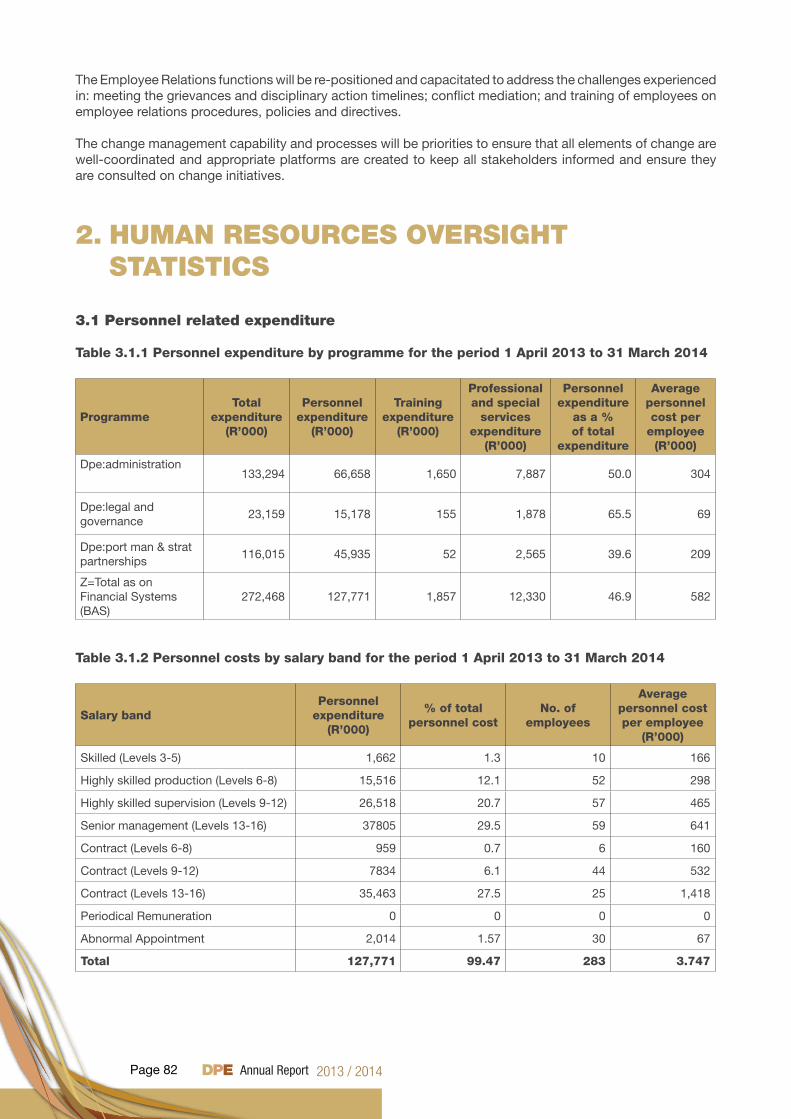
Page 82
The Employee Relations functions will be re-positioned and capacitated to address the challenges experienced in: meeting the grievances and disciplinary action timelines; conflict mediation; and training of employees on employee relations procedures, policies and directives.
The change management capability and processes will be priorities to ensure that all elements of change are well-coordinated and appropriate platforms are created to keep all stakeholders informed and ensure they are consulted on change initiatives.
2. HUMAN RESOURCES OVERSIGHT STATISTICS
3.1 Personnel related expenditure
Table 3.1.1 Personnel expenditure by programme for the period 1 April 2013 to 31 March 2014
ProgrammeTotal
expenditure (R’000)
Personnel expenditure
(R’000)
Training expenditure
(R’000)
Professional and special
services expenditure
(R’000)
Personnel expenditure
as a % of total
expenditure
Average personnel cost per
employee (R’000)
Dpe:administration 133,294 66,658 1,650 7,887 50.0 304
Dpe:legal and governance
23,159 15,178 155 1,878 65.5 69
Dpe:port man & strat partnerships
116,015 45,935 52 2,565 39.6 209
Z=Total as on Financial Systems (BAS)
272,468 127,771 1,857 12,330 46.9 582
Table 3.1.2 Personnel costs by salary band for the period 1 April 2013 to 31 March 2014
Salary bandPersonnel
expenditure (R’000)
% of total personnel cost
No. of employees
Average personnel cost per employee
(R’000)
Skilled (Levels 3-5) 1,662 1.3 10 166
Highly skilled production (Levels 6-8) 15,516 12.1 52 298
Highly skilled supervision (Levels 9-12) 26,518 20.7 57 465
Senior management (Levels 13-16) 37805 29.5 59 641
Contract (Levels 6-8) 959 0.7 6 160
Contract (Levels 9-12) 7834 6.1 44 532
Contract (Levels 13-16) 35,463 27.5 25 1,418
Periodical Remuneration 0 0 0 0
Abnormal Appointment 2,014 1.57 30 67
Total 127,771 99.47 283 3.747
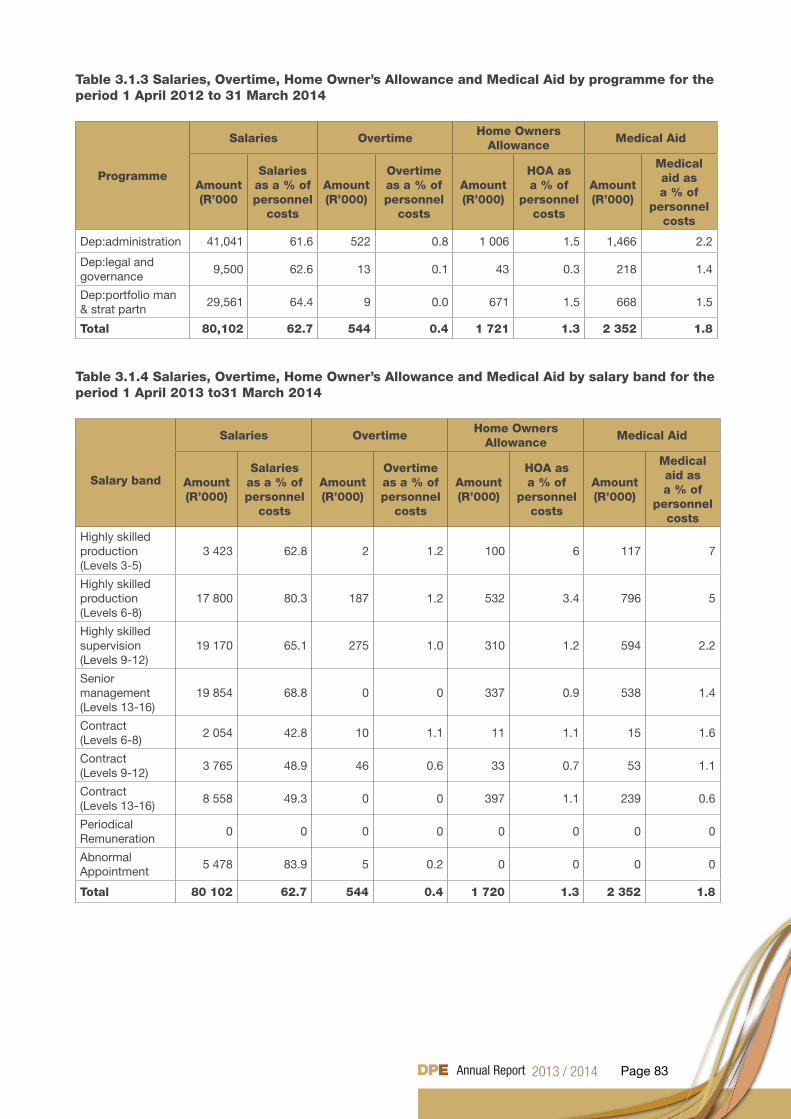
Page 83
Table 3.1.3 Salaries, Overtime, Home Owner’s Allowance and Medical Aid by programme for the period 1 April 2012 to 31 March 2014
Programme
Salaries OvertimeHome Owners
AllowanceMedical Aid
Amount (R’000
Salaries as a % of personnel
costs
Amount (R’000)
Overtime as a % of personnel
costs
Amount (R’000)
HOA as a % of
personnel costs
Amount (R’000)
Medical aid as a % of
personnel costs
Dep:administration 41,041 61.6 522 0.8 1 006 1.5 1,466 2.2
Dep:legal and governance
9,500 62.6 13 0.1 43 0.3 218 1.4
Dep:portfolio man & strat partn
29,561 64.4 9 0.0 671 1.5 668 1.5
Total 80,102 62.7 544 0.4 1 721 1.3 2 352 1.8
Table 3.1.4 Salaries, Overtime, Home Owner’s Allowance and Medical Aid by salary band for the period 1 April 2013 to31 March 2014
Salary band
Salaries OvertimeHome Owners
AllowanceMedical Aid
Amount (R’000)
Salaries as a % of personnel
costs
Amount (R’000)
Overtime as a % of personnel
costs
Amount (R’000)
HOA as a % of
personnel costs
Amount (R’000)
Medical aid as a % of
personnel costs
Highly skilled production (Levels 3-5)
3 423 62.8 2 1.2 100 6 117 7
Highly skilled production (Levels 6-8)
17 800 80.3 187 1.2 532 3.4 796 5
Highly skilled supervision (Levels 9-12)
19 170 65.1 275 1.0 310 1.2 594 2.2
Senior management (Levels 13-16)
19 854 68.8 0 0 337 0.9 538 1.4
Contract (Levels 6-8)
2 054 42.8 10 1.1 11 1.1 15 1.6
Contract (Levels 9-12)
3 765 48.9 46 0.6 33 0.7 53 1.1
Contract (Levels 13-16)
8 558 49.3 0 0 397 1.1 239 0.6
Periodical Remuneration
0 0 0 0 0 0 0 0
Abnormal Appointment
5 478 83.9 5 0.2 0 0 0 0
Total 80 102 62.7 544 0.4 1 720 1.3 2 352 1.8
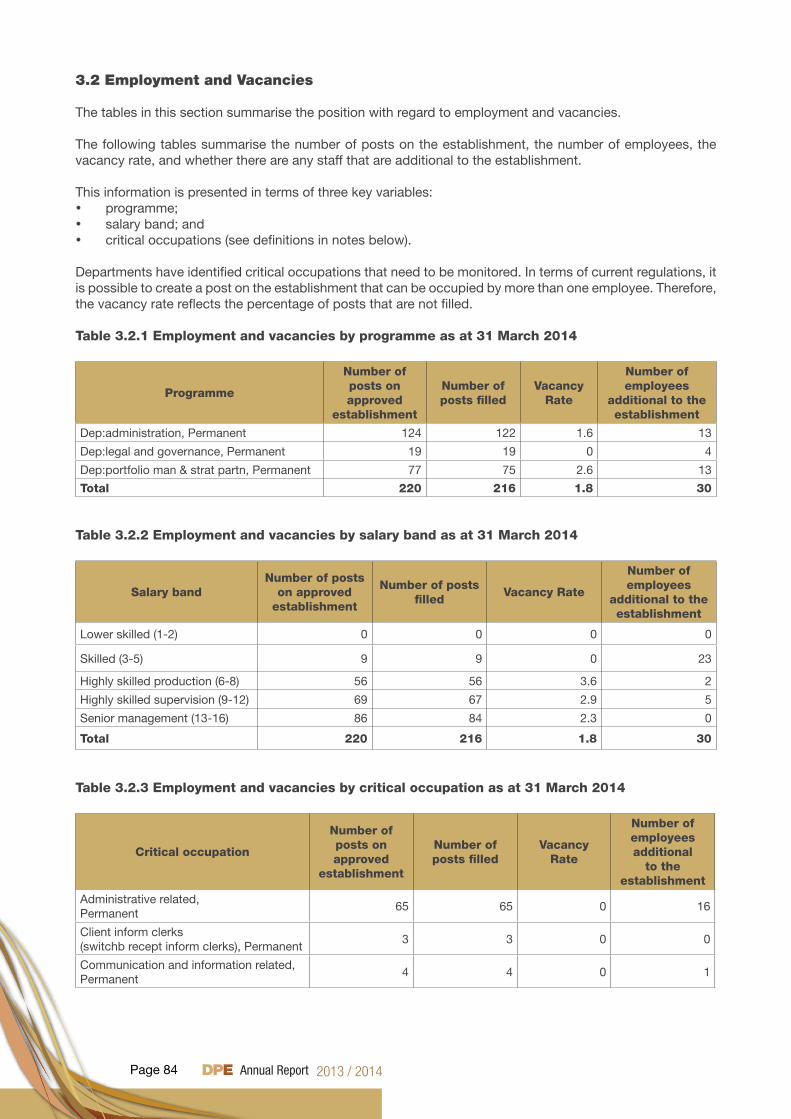
Page 84
3.2 Employment and Vacancies
The tables in this section summarise the position with regard to employment and vacancies.
The following tables summarise the number of posts on the establishment, the number of employees, the vacancy rate, and whether there are any staff that are additional to the establishment.
This information is presented in terms of three key variables:• programme;• salary band; and • critical occupations (see definitions in notes below).
Departments have identified critical occupations that need to be monitored. In terms of current regulations, it is possible to create a post on the establishment that can be occupied by more than one employee. Therefore, the vacancy rate reflects the percentage of posts that are not filled.
Table 3.2.1 Employment and vacancies by programme as at 31 March 2014
Programme
Number of posts on approved
establishment
Number of posts filled
Vacancy Rate
Number of employees
additional to the establishment
Dep:administration, Permanent 124 122 1.6 13
Dep:legal and governance, Permanent 19 19 0 4
Dep:portfolio man & strat partn, Permanent 77 75 2.6 13
Total 220 216 1.8 30
Table 3.2.2 Employment and vacancies by salary band as at 31 March 2014
Salary bandNumber of posts
on approved establishment
Number of posts filled
Vacancy Rate
Number of employees
additional to the establishment
Lower skilled (1-2) 0 0 0 0
Skilled (3-5) 9 9 0 23
Highly skilled production (6-8) 56 56 3.6 2
Highly skilled supervision (9-12) 69 67 2.9 5
Senior management (13-16) 86 84 2.3 0
Total 220 216 1.8 30
Table 3.2.3 Employment and vacancies by critical occupation as at 31 March 2014
Critical occupation
Number of posts on approved
establishment
Number of posts filled
Vacancy Rate
Number of employees additional
to the establishment
Administrative related, Permanent
65 65 0 16
Client inform clerks (switchb recept inform clerks), Permanent
3 3 0 0
Communication and information related, Permanent
4 4 0 1
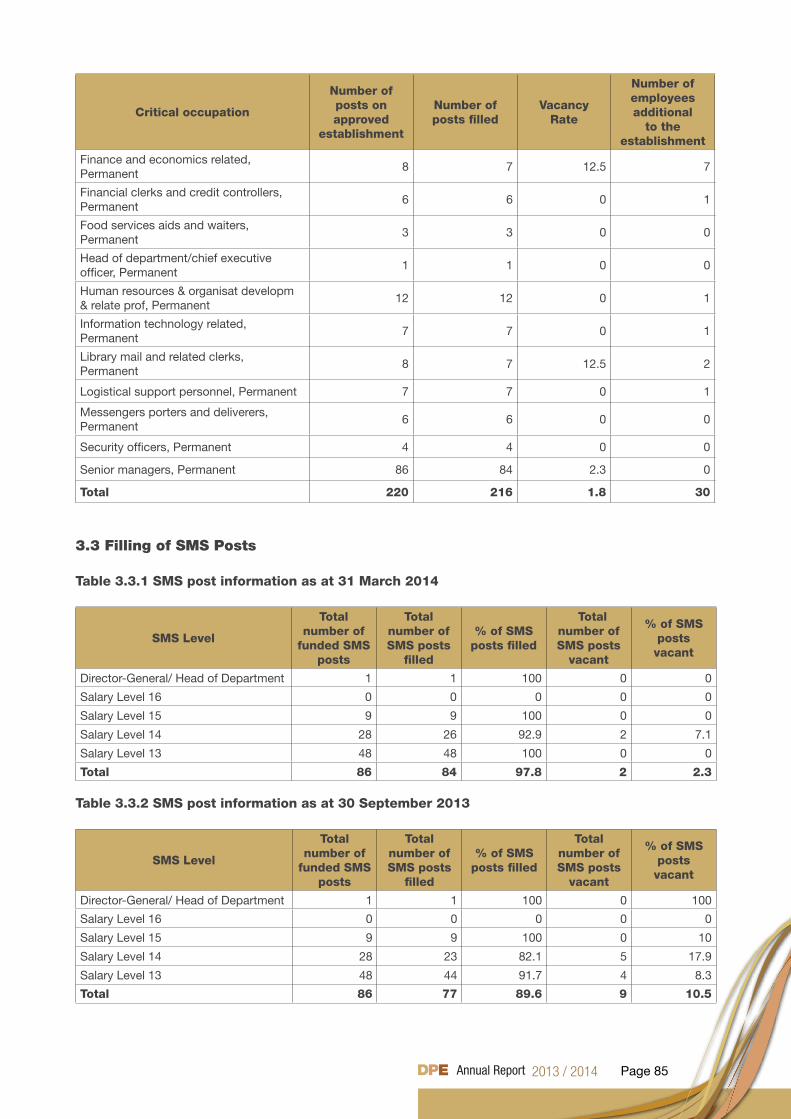
Page 85
Critical occupation
Number of posts on approved
establishment
Number of posts filled
Vacancy Rate
Number of employees additional
to the establishment
Finance and economics related, Permanent
8 7 12.5 7
Financial clerks and credit controllers, Permanent
6 6 0 1
Food services aids and waiters, Permanent
3 3 0 0
Head of department/chief executive officer, Permanent
1 1 0 0
Human resources & organisat developm & relate prof, Permanent
12 12 0 1
Information technology related, Permanent
7 7 0 1
Library mail and related clerks, Permanent
8 7 12.5 2
Logistical support personnel, Permanent 7 7 0 1
Messengers porters and deliverers, Permanent
6 6 0 0
Security officers, Permanent 4 4 0 0
Senior managers, Permanent 86 84 2.3 0
Total 220 216 1.8 30
3.3 Filling of SMS Posts
Table 3.3.1 SMS post information as at 31 March 2014
SMS Level
Total number of
funded SMS posts
Total number of SMS posts
filled
% of SMS posts filled
Total number of SMS posts
vacant
% of SMS posts vacant
Director-General/ Head of Department 1 1 100 0 0
Salary Level 16 0 0 0 0 0
Salary Level 15 9 9 100 0 0
Salary Level 14 28 26 92.9 2 7.1
Salary Level 13 48 48 100 0 0
Total 86 84 97.8 2 2.3
Table 3.3.2 SMS post information as at 30 September 2013
SMS Level
Total number of
funded SMS posts
Total number of SMS posts
filled
% of SMS posts filled
Total number of SMS posts
vacant
% of SMS posts vacant
Director-General/ Head of Department 1 1 100 0 100
Salary Level 16 0 0 0 0 0
Salary Level 15 9 9 100 0 10
Salary Level 14 28 23 82.1 5 17.9
Salary Level 13 48 44 91.7 4 8.3
Total 86 77 89.6 9 10.5
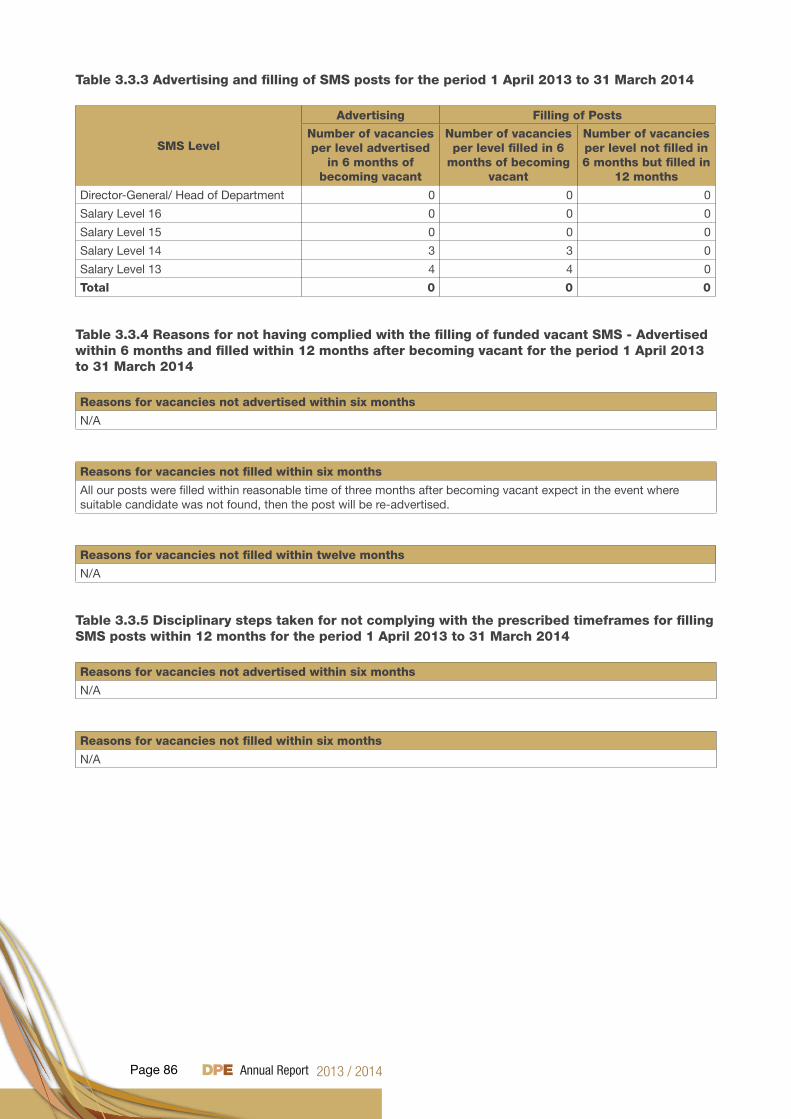
Page 86
Table 3.3.3 Advertising and filling of SMS posts for the period 1 April 2013 to 31 March 2014
SMS Level
Advertising Filling of Posts
Number of vacancies per level advertised
in 6 months of becoming vacant
Number of vacancies per level filled in 6
months of becoming vacant
Number of vacancies per level not filled in 6 months but filled in
12 months
Director-General/ Head of Department 0 0 0
Salary Level 16 0 0 0
Salary Level 15 0 0 0
Salary Level 14 3 3 0
Salary Level 13 4 4 0
Total 0 0 0
Table 3.3.4 Reasons for not having complied with the filling of funded vacant SMS - Advertised within 6 months and filled within 12 months after becoming vacant for the period 1 April 2013 to 31 March 2014
Reasons for vacancies not advertised within six months
N/A
Reasons for vacancies not filled within six months
All our posts were filled within reasonable time of three months after becoming vacant expect in the event where suitable candidate was not found, then the post will be re-advertised.
Reasons for vacancies not filled within twelve months
N/A
Table 3.3.5 Disciplinary steps taken for not complying with the prescribed timeframes for filling SMS posts within 12 months for the period 1 April 2013 to 31 March 2014
Reasons for vacancies not advertised within six months
N/A
Reasons for vacancies not filled within six months
N/A
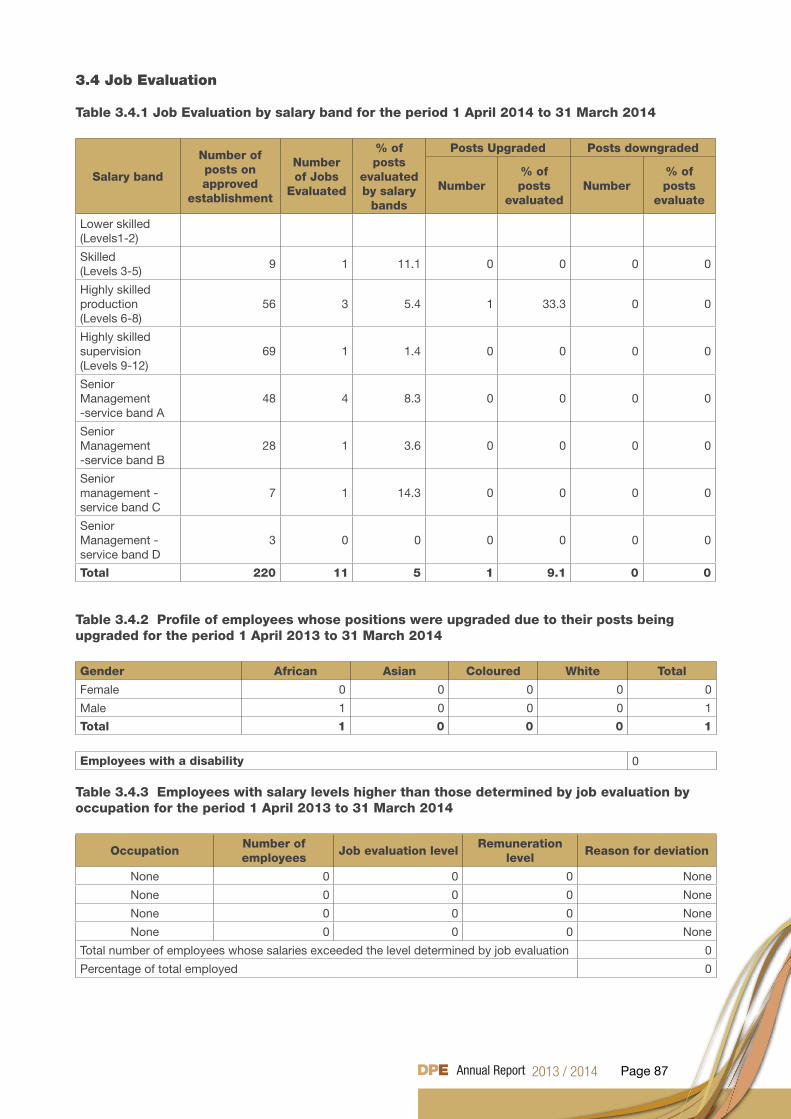
Page 87
3.4 Job Evaluation
Table 3.4.1 Job Evaluation by salary band for the period 1 April 2014 to 31 March 2014
Salary band
Number of posts on approved
establishment
Number of Jobs
Evaluated
% of posts
evaluated by salary
bands
Posts Upgraded Posts downgraded
Number% of posts
evaluatedNumber
% of posts
evaluate
Lower skilled (Levels1-2)
Skilled (Levels 3-5)
9 1 11.1 0 0 0 0
Highly skilled production (Levels 6-8)
56 3 5.4 1 33.3 0 0
Highly skilled supervision(Levels 9-12)
69 1 1.4 0 0 0 0
Senior Management -service band A
48 4 8.3 0 0 0 0
Senior Management -service band B
28 1 3.6 0 0 0 0
Senior management - service band C
7 1 14.3 0 0 0 0
Senior Management - service band D
3 0 0 0 0 0 0
Total 220 11 5 1 9.1 0 0
Table 3.4.2 Profile of employees whose positions were upgraded due to their posts being upgraded for the period 1 April 2013 to 31 March 2014
Gender African Asian Coloured White Total
Female 0 0 0 0 0
Male 1 0 0 0 1
Total 1 0 0 0 1
Employees with a disability 0
Table 3.4.3 Employees with salary levels higher than those determined by job evaluation by occupation for the period 1 April 2013 to 31 March 2014
OccupationNumber of employees
Job evaluation levelRemuneration
levelReason for deviation
None 0 0 0 None
None 0 0 0 None
None 0 0 0 None
None 0 0 0 None
Total number of employees whose salaries exceeded the level determined by job evaluation 0
Percentage of total employed 0
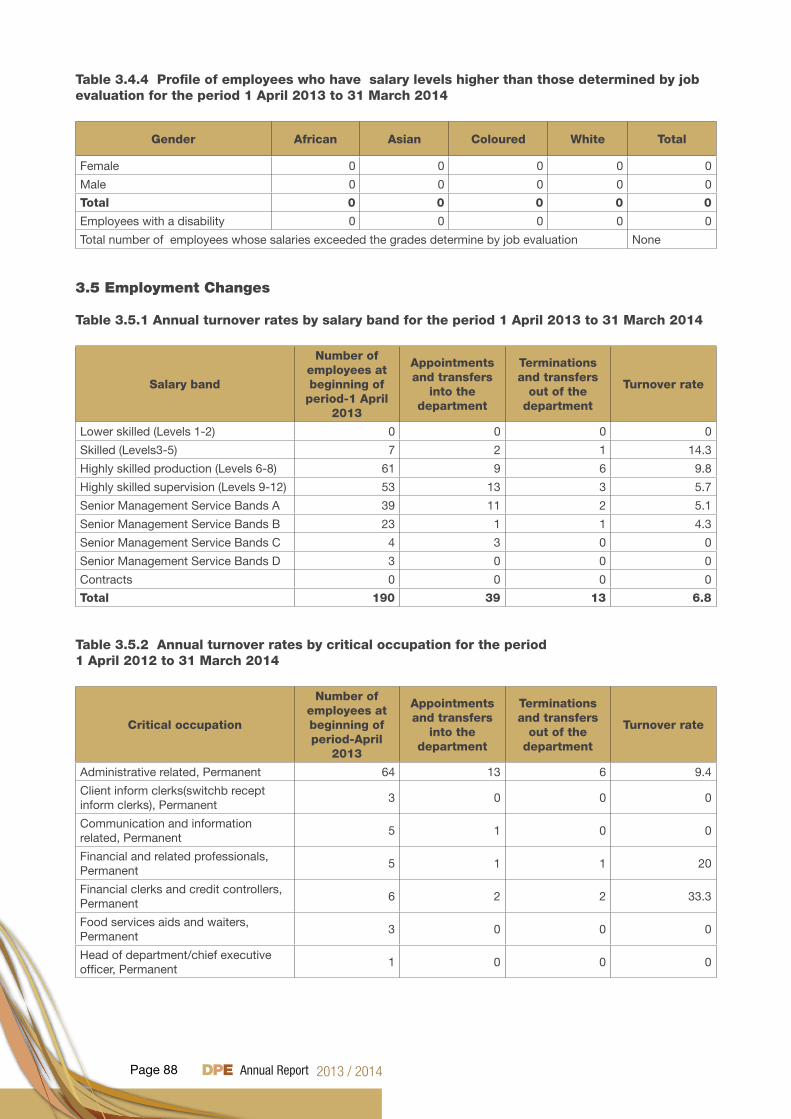
Page 88
Table 3.4.4 Profile of employees who have salary levels higher than those determined by job evaluation for the period 1 April 2013 to 31 March 2014
Gender African Asian Coloured White Total
Female 0 0 0 0 0
Male 0 0 0 0 0
Total 0 0 0 0 0
Employees with a disability 0 0 0 0 0
Total number of employees whose salaries exceeded the grades determine by job evaluation None
3.5 Employment Changes Table 3.5.1 Annual turnover rates by salary band for the period 1 April 2013 to 31 March 2014
Salary band
Number of employees at beginning of
period-1 April 2013
Appointments and transfers
into the department
Terminations and transfers
out of the department
Turnover rate
Lower skilled (Levels 1-2) 0 0 0 0
Skilled (Levels3-5) 7 2 1 14.3
Highly skilled production (Levels 6-8) 61 9 6 9.8
Highly skilled supervision (Levels 9-12) 53 13 3 5.7
Senior Management Service Bands A 39 11 2 5.1
Senior Management Service Bands B 23 1 1 4.3
Senior Management Service Bands C 4 3 0 0
Senior Management Service Bands D 3 0 0 0
Contracts 0 0 0 0
Total 190 39 13 6.8
Table 3.5.2 Annual turnover rates by critical occupation for the period 1 April 2012 to 31 March 2014
Critical occupation
Number of employees at beginning of period-April
2013
Appointments and transfers
into the department
Terminations and transfers
out of the department
Turnover rate
Administrative related, Permanent 64 13 6 9.4
Client inform clerks(switchb recept inform clerks), Permanent
3 0 0 0
Communication and information related, Permanent
5 1 0 0
Financial and related professionals, Permanent
5 1 1 20
Financial clerks and credit controllers, Permanent
6 2 2 33.3
Food services aids and waiters, Permanent
3 0 0 0
Head of department/chief executive officer, Permanent
1 0 0 0
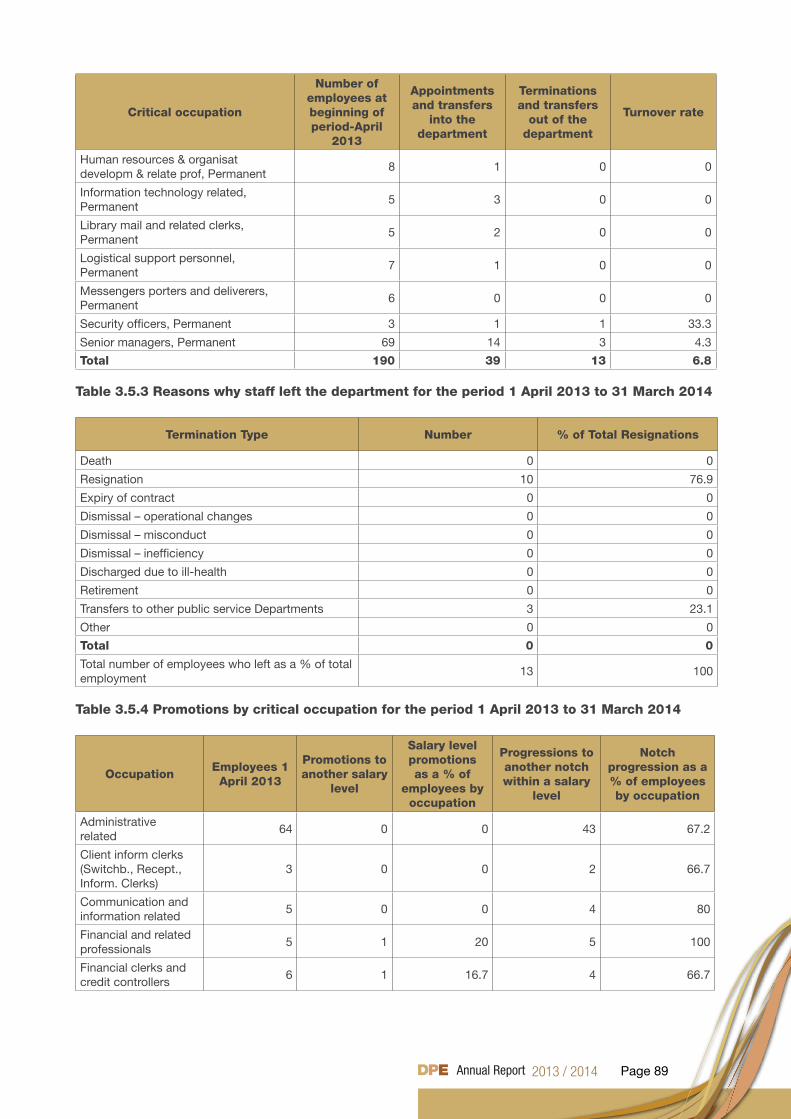
Page 89
Critical occupation
Number of employees at beginning of period-April
2013
Appointments and transfers
into the department
Terminations and transfers
out of the department
Turnover rate
Human resources & organisat developm & relate prof, Permanent
8 1 0 0
Information technology related, Permanent
5 3 0 0
Library mail and related clerks, Permanent
5 2 0 0
Logistical support personnel, Permanent
7 1 0 0
Messengers porters and deliverers, Permanent
6 0 0 0
Security officers, Permanent 3 1 1 33.3
Senior managers, Permanent 69 14 3 4.3
Total 190 39 13 6.8
Table 3.5.3 Reasons why staff left the department for the period 1 April 2013 to 31 March 2014
Termination Type Number % of Total Resignations
Death 0 0
Resignation 10 76.9
Expiry of contract 0 0
Dismissal – operational changes 0 0
Dismissal – misconduct 0 0
Dismissal – inefficiency 0 0
Discharged due to ill-health 0 0
Retirement 0 0
Transfers to other public service Departments 3 23.1
Other 0 0
Total 0 0
Total number of employees who left as a % of total employment
13 100
Table 3.5.4 Promotions by critical occupation for the period 1 April 2013 to 31 March 2014
OccupationEmployees 1 April 2013
Promotions to another salary
level
Salary level promotions as a % of
employees by occupation
Progressions to another notch within a salary
level
Notch progression as a % of employees by occupation
Administrative related
64 0 0 43 67.2
Client inform clerks (Switchb., Recept., Inform. Clerks)
3 0 0 2 66.7
Communication and information related
5 0 0 4 80
Financial and related professionals
5 1 20 5 100
Financial clerks and credit controllers
6 1 16.7 4 66.7
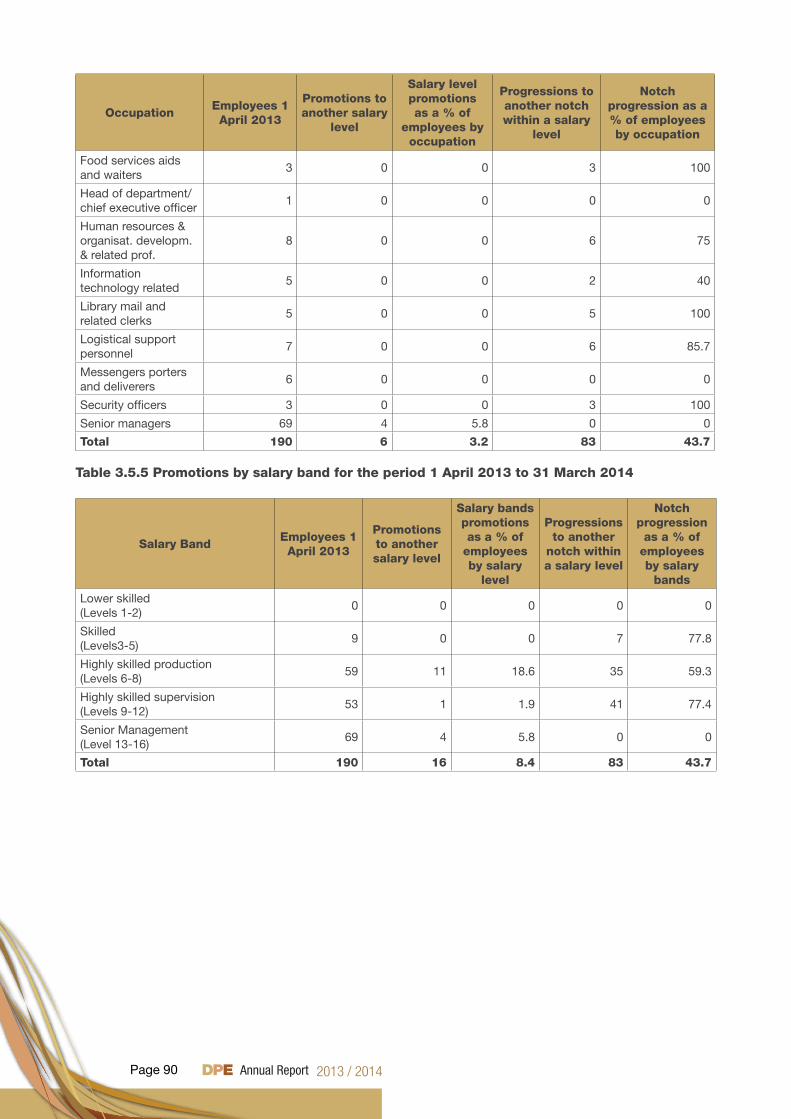
Page 90
OccupationEmployees 1 April 2013
Promotions to another salary
level
Salary level promotions as a % of
employees by occupation
Progressions to another notch within a salary
level
Notch progression as a % of employees by occupation
Food services aids and waiters
3 0 0 3 100
Head of department/chief executive officer
1 0 0 0 0
Human resources & organisat. developm. & related prof.
8 0 0 6 75
Information technology related
5 0 0 2 40
Library mail and related clerks
5 0 0 5 100
Logistical support personnel
7 0 0 6 85.7
Messengers porters and deliverers
6 0 0 0 0
Security officers 3 0 0 3 100
Senior managers 69 4 5.8 0 0
Total 190 6 3.2 83 43.7
Table 3.5.5 Promotions by salary band for the period 1 April 2013 to 31 March 2014
Salary BandEmployees 1 April 2013
Promotions to another salary level
Salary bands promotions as a % of
employees by salary
level
Progressions to another
notch within a salary level
Notch progression as a % of
employees by salary
bands
Lower skilled (Levels 1-2)
0 0 0 0 0
Skilled (Levels3-5)
9 0 0 7 77.8
Highly skilled production (Levels 6-8)
59 11 18.6 35 59.3
Highly skilled supervision (Levels 9-12)
53 1 1.9 41 77.4
Senior Management (Level 13-16)
69 4 5.8 0 0
Total 190 16 8.4 83 43.7
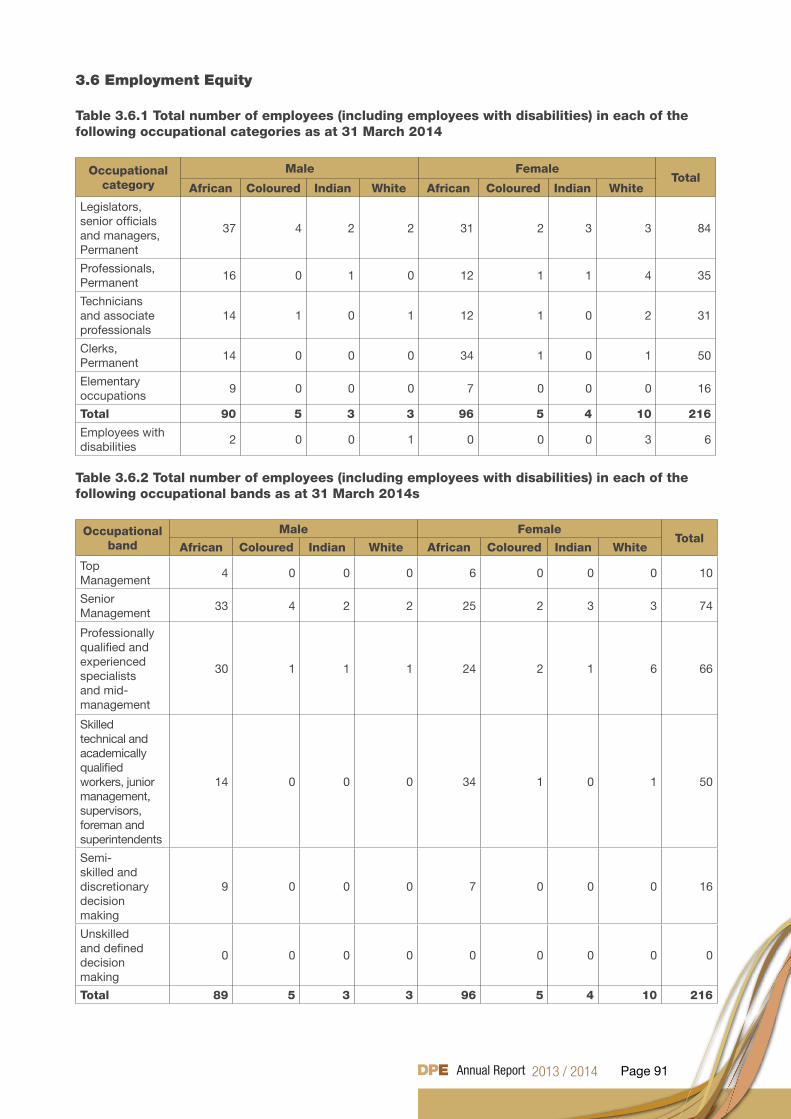
Page 91
3.6 Employment Equity
Table 3.6.1 Total number of employees (including employees with disabilities) in each of the following occupational categories as at 31 March 2014
Occupational category
Male FemaleTotal
African Coloured Indian White African Coloured Indian White
Legislators, senior officials and managers, Permanent
37 4 2 2 31 2 3 3 84
Professionals, Permanent
16 0 1 0 12 1 1 4 35
Technicians and associate professionals
14 1 0 1 12 1 0 2 31
Clerks, Permanent
14 0 0 0 34 1 0 1 50
Elementary occupations
9 0 0 0 7 0 0 0 16
Total 90 5 3 3 96 5 4 10 216
Employees with disabilities
2 0 0 1 0 0 0 3 6
Table 3.6.2 Total number of employees (including employees with disabilities) in each of the following occupational bands as at 31 March 2014s
Occupational band
Male FemaleTotal
African Coloured Indian White African Coloured Indian White
Top Management
4 0 0 0 6 0 0 0 10
Senior Management
33 4 2 2 25 2 3 3 74
Professionally qualified and experienced specialists and mid-management
30 1 1 1 24 2 1 6 66
Skilled technical and academically qualified workers, junior management, supervisors, foreman and superintendents
14 0 0 0 34 1 0 1 50
Semi-skilled and discretionary decision making
9 0 0 0 7 0 0 0 16
Unskilled and defined decision making
0 0 0 0 0 0 0 0 0
Total 89 5 3 3 96 5 4 10 216
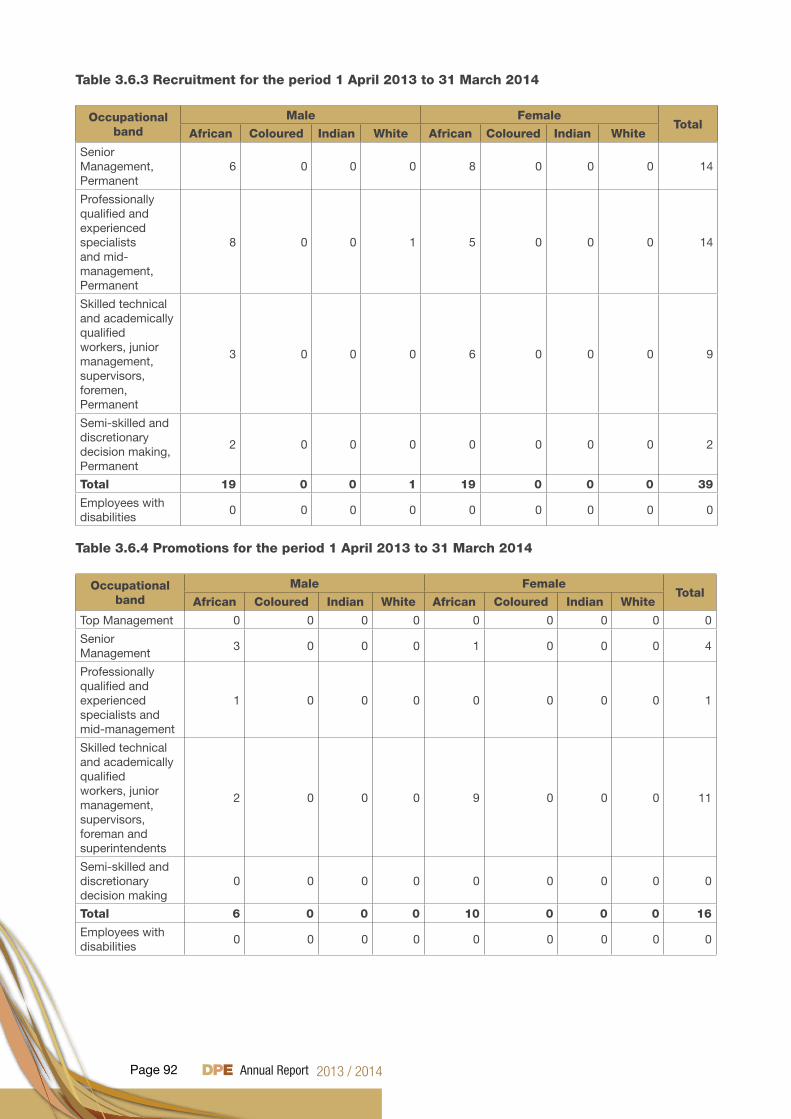
Page 92
Table 3.6.3 Recruitment for the period 1 April 2013 to 31 March 2014
Occupational band
Male FemaleTotal
African Coloured Indian White African Coloured Indian White
Senior Management, Permanent
6 0 0 0 8 0 0 0 14
Professionally qualified and experienced specialists and mid-management, Permanent
8 0 0 1 5 0 0 0 14
Skilled technical and academically qualified workers, junior management, supervisors, foremen, Permanent
3 0 0 0 6 0 0 0 9
Semi-skilled and discretionary decision making, Permanent
2 0 0 0 0 0 0 0 2
Total 19 0 0 1 19 0 0 0 39
Employees with disabilities
0 0 0 0 0 0 0 0 0
Table 3.6.4 Promotions for the period 1 April 2013 to 31 March 2014
Occupational band
Male FemaleTotal
African Coloured Indian White African Coloured Indian White
Top Management 0 0 0 0 0 0 0 0 0
Senior Management
3 0 0 0 1 0 0 0 4
Professionally qualified and experienced specialists and mid-management
1 0 0 0 0 0 0 0 1
Skilled technical and academically qualified workers, junior management, supervisors, foreman and superintendents
2 0 0 0 9 0 0 0 11
Semi-skilled and discretionary decision making
0 0 0 0 0 0 0 0 0
Total 6 0 0 0 10 0 0 0 16
Employees with disabilities
0 0 0 0 0 0 0 0 0
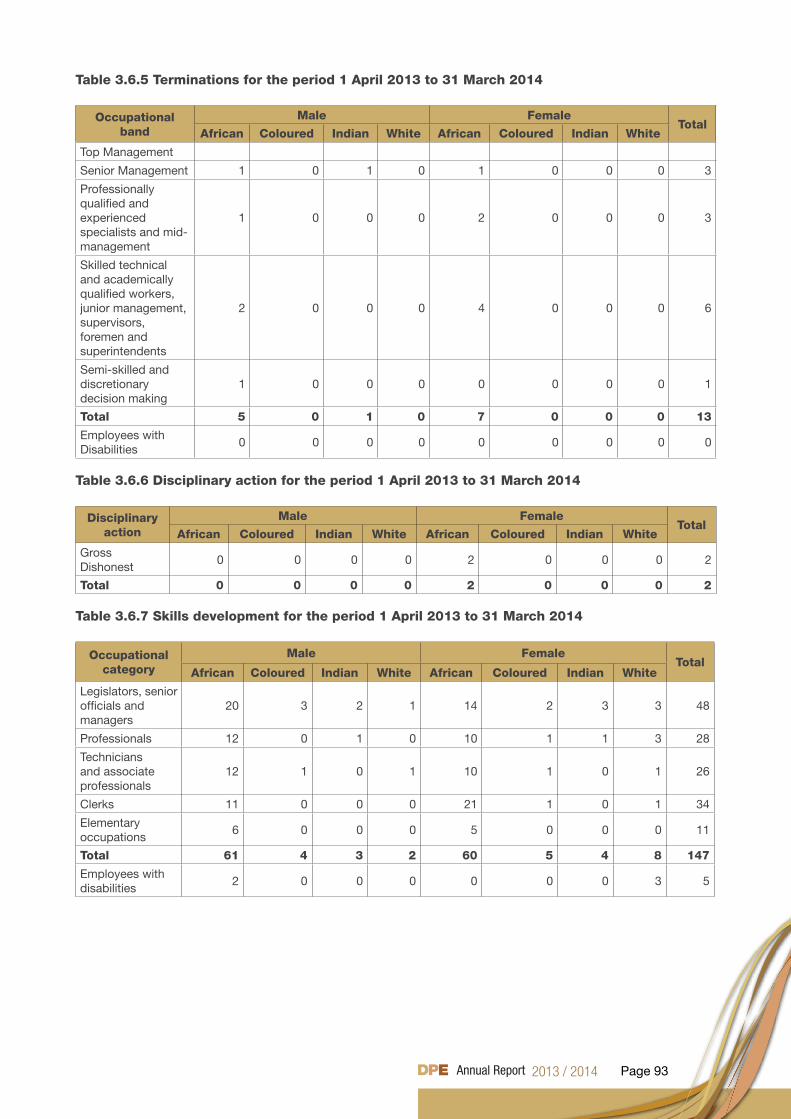
Page 93
Table 3.6.5 Terminations for the period 1 April 2013 to 31 March 2014
Occupational band
Male FemaleTotal
African Coloured Indian White African Coloured Indian White
Top Management
Senior Management 1 0 1 0 1 0 0 0 3
Professionally qualified and experienced specialists and mid-management
1 0 0 0 2 0 0 0 3
Skilled technical and academically qualified workers, junior management, supervisors, foremen and superintendents
2 0 0 0 4 0 0 0 6
Semi-skilled and discretionary decision making
1 0 0 0 0 0 0 0 1
Total 5 0 1 0 7 0 0 0 13
Employees with Disabilities
0 0 0 0 0 0 0 0 0
Table 3.6.6 Disciplinary action for the period 1 April 2013 to 31 March 2014
Disciplinary action
Male FemaleTotal
African Coloured Indian White African Coloured Indian White
Gross Dishonest
0 0 0 0 2 0 0 0 2
Total 0 0 0 0 2 0 0 0 2
Table 3.6.7 Skills development for the period 1 April 2013 to 31 March 2014
Occupational category
Male FemaleTotal
African Coloured Indian White African Coloured Indian White
Legislators, senior officials and managers
20 3 2 1 14 2 3 3 48
Professionals 12 0 1 0 10 1 1 3 28
Technicians and associate professionals
12 1 0 1 10 1 0 1 26
Clerks 11 0 0 0 21 1 0 1 34
Elementary occupations
6 0 0 0 5 0 0 0 11
Total 61 4 3 2 60 5 4 8 147
Employees with disabilities
2 0 0 0 0 0 0 3 5
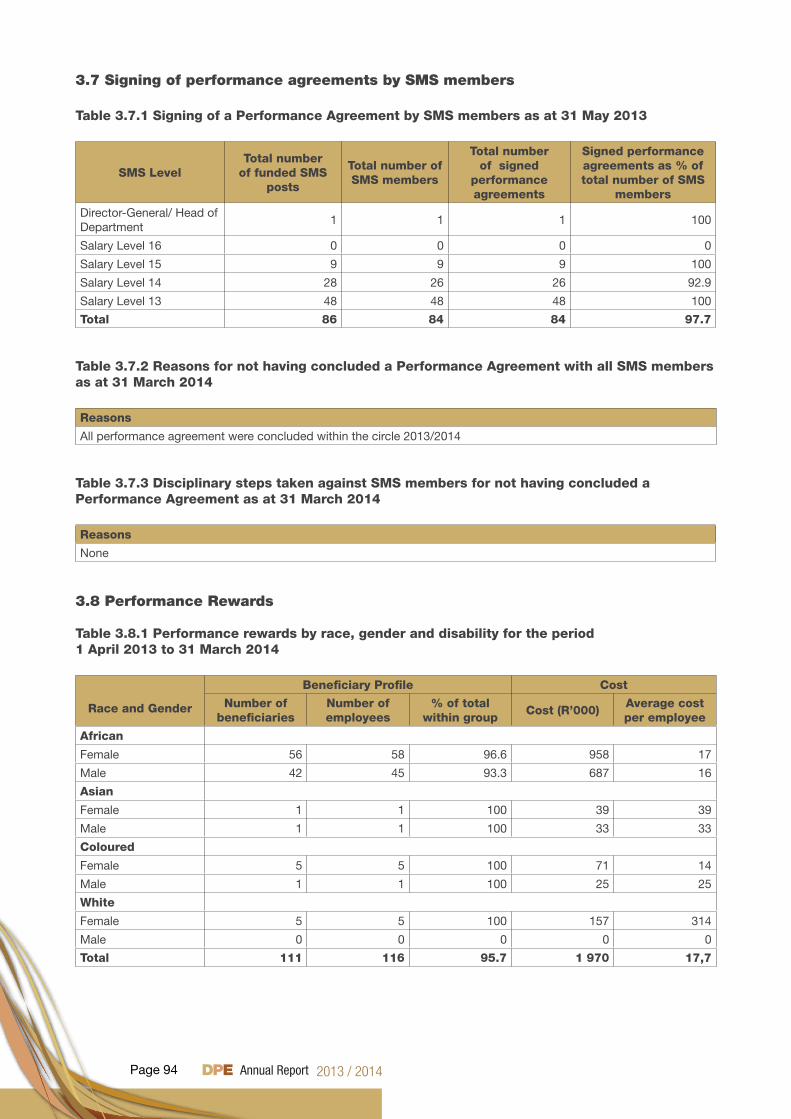
Page 94
3.7 Signing of performance agreements by SMS members
Table 3.7.1 Signing of a Performance Agreement by SMS members as at 31 May 2013
SMS LevelTotal number
of funded SMS posts
Total number of SMS members
Total number of signed
performance agreements
Signed performance agreements as % of total number of SMS
members
Director-General/ Head of Department
1 1 1 100
Salary Level 16 0 0 0 0
Salary Level 15 9 9 9 100
Salary Level 14 28 26 26 92.9
Salary Level 13 48 48 48 100
Total 86 84 84 97.7
Table 3.7.2 Reasons for not having concluded a Performance Agreement with all SMS members as at 31 March 2014
Reasons
All performance agreement were concluded within the circle 2013/2014
Table 3.7.3 Disciplinary steps taken against SMS members for not having concluded a Performance Agreement as at 31 March 2014
Reasons
None
3.8 Performance Rewards
Table 3.8.1 Performance rewards by race, gender and disability for the period 1 April 2013 to 31 March 2014
Race and Gender
Beneficiary Profile Cost
Number of beneficiaries
Number of employees
% of total within group
Cost (R’000)Average cost per employee
African
Female 56 58 96.6 958 17
Male 42 45 93.3 687 16
Asian
Female 1 1 100 39 39
Male 1 1 100 33 33
Coloured
Female 5 5 100 71 14
Male 1 1 100 25 25
White
Female 5 5 100 157 314
Male 0 0 0 0 0
Total 111 116 95.7 1 970 17,7
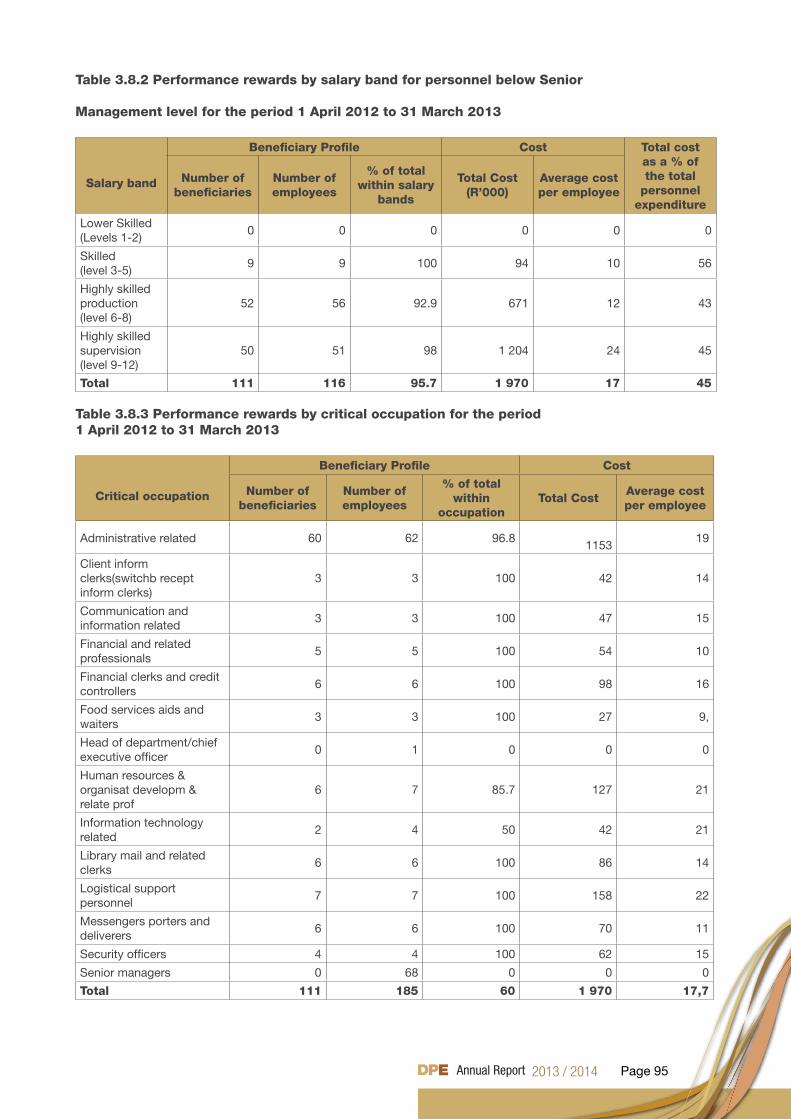
Page 95
Table 3.8.2 Performance rewards by salary band for personnel below Senior
Management level for the period 1 April 2012 to 31 March 2013
Salary band
Beneficiary Profile Cost Total cost as a % of the total
personnel expenditure
Number of beneficiaries
Number of employees
% of total within salary
bands
Total Cost (R’000)
Average cost per employee
Lower Skilled (Levels 1-2)
0 0 0 0 0 0
Skilled (level 3-5)
9 9 100 94 10 56
Highly skilled production (level 6-8)
52 56 92.9 671 12 43
Highly skilled supervision (level 9-12)
50 51 98 1 204 24 45
Total 111 116 95.7 1 970 17 45
Table 3.8.3 Performance rewards by critical occupation for the period 1 April 2012 to 31 March 2013
Critical occupation
Beneficiary Profile Cost
Number of beneficiaries
Number of employees
% of total within
occupationTotal Cost
Average cost per employee
Administrative related 60 62 96.81153
19
Client inform clerks(switchb recept inform clerks)
3 3 100 42 14
Communication and information related
3 3 100 47 15
Financial and related professionals
5 5 100 54 10
Financial clerks and credit controllers
6 6 100 98 16
Food services aids and waiters
3 3 100 27 9,
Head of department/chief executive officer
0 1 0 0 0
Human resources & organisat developm & relate prof
6 7 85.7 127 21
Information technology related
2 4 50 42 21
Library mail and related clerks
6 6 100 86 14
Logistical support personnel
7 7 100 158 22
Messengers porters and deliverers
6 6 100 70 11
Security officers 4 4 100 62 15
Senior managers 0 68 0 0 0
Total 111 185 60 1 970 17,7
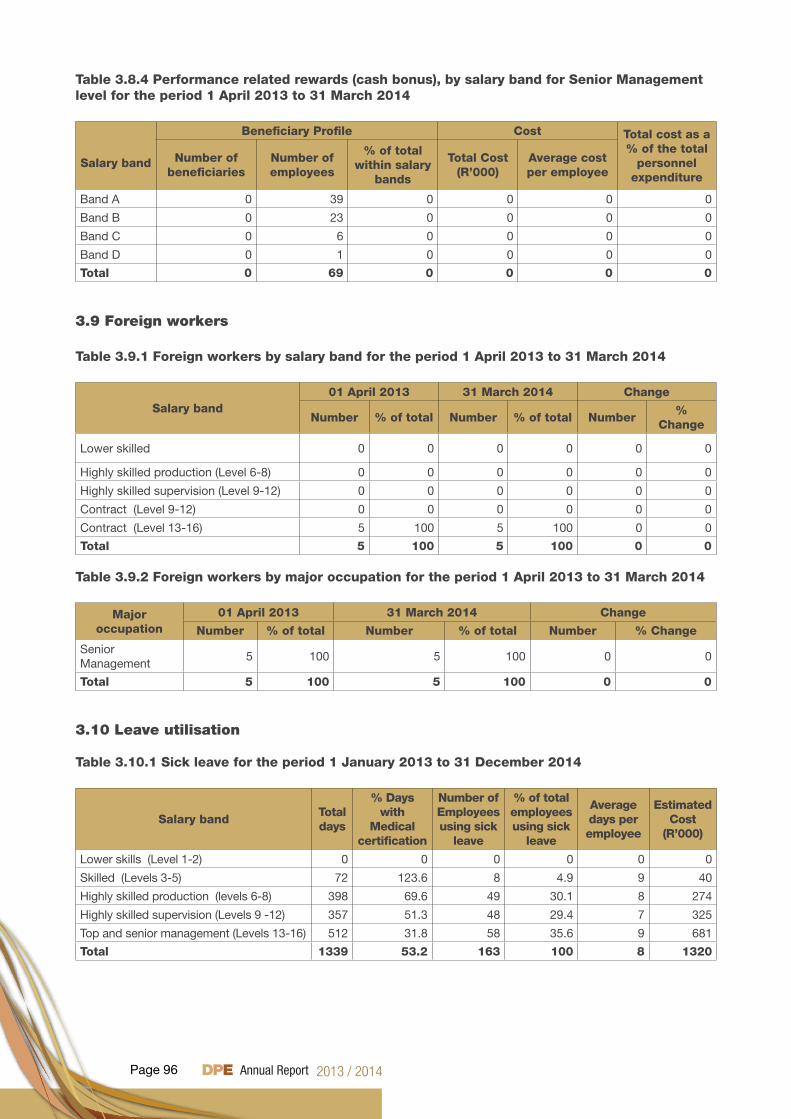
Page 96
Table 3.8.4 Performance related rewards (cash bonus), by salary band for Senior Management level for the period 1 April 2013 to 31 March 2014
Salary band
Beneficiary Profile Cost Total cost as a % of the total
personnel expenditure
Number of beneficiaries
Number of employees
% of total within salary
bands
Total Cost (R’000)
Average cost per employee
Band A 0 39 0 0 0 0
Band B 0 23 0 0 0 0
Band C 0 6 0 0 0 0
Band D 0 1 0 0 0 0
Total 0 69 0 0 0 0
3.9 Foreign workers
Table 3.9.1 Foreign workers by salary band for the period 1 April 2013 to 31 March 2014
Salary band01 April 2013 31 March 2014 Change
Number % of total Number % of total Number%
Change
Lower skilled 0 0 0 0 0 0
Highly skilled production (Level 6-8) 0 0 0 0 0 0
Highly skilled supervision (Level 9-12) 0 0 0 0 0 0
Contract (Level 9-12) 0 0 0 0 0 0
Contract (Level 13-16) 5 100 5 100 0 0
Total 5 100 5 100 0 0
Table 3.9.2 Foreign workers by major occupation for the period 1 April 2013 to 31 March 2014
Major occupation
01 April 2013 31 March 2014 Change
Number % of total Number % of total Number % Change
Senior Management
5 100 5 100 0 0
Total 5 100 5 100 0 0
3.10 Leave utilisation
Table 3.10.1 Sick leave for the period 1 January 2013 to 31 December 2014
Salary bandTotal days
% Days with
Medical certification
Number of Employees using sick
leave
% of total employees using sick
leave
Average days per employee
Estimated Cost
(R’000)
Lower skills (Level 1-2) 0 0 0 0 0 0
Skilled (Levels 3-5) 72 123.6 8 4.9 9 40
Highly skilled production (levels 6-8) 398 69.6 49 30.1 8 274
Highly skilled supervision (Levels 9 -12) 357 51.3 48 29.4 7 325
Top and senior management (Levels 13-16) 512 31.8 58 35.6 9 681
Total 1339 53.2 163 100 8 1320
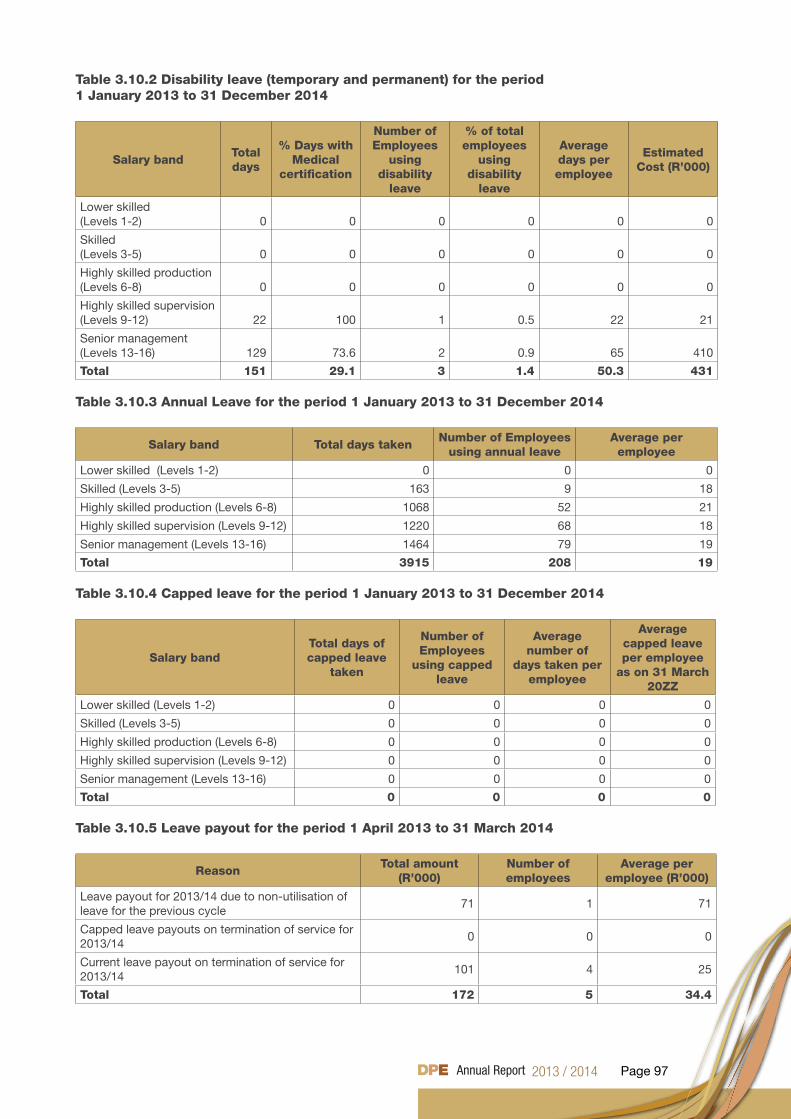
Page 97
Table 3.10.2 Disability leave (temporary and permanent) for the period 1 January 2013 to 31 December 2014
Salary bandTotal days
% Days with Medical
certification
Number of Employees
using disability
leave
% of total employees
using disability
leave
Average days per employee
Estimated Cost (R’000)
Lower skilled (Levels 1-2) 0 0 0 0 0 0
Skilled (Levels 3-5) 0 0 0 0 0 0
Highly skilled production (Levels 6-8) 0 0 0 0 0 0
Highly skilled supervision (Levels 9-12) 22 100 1 0.5 22 21
Senior management (Levels 13-16) 129 73.6 2 0.9 65 410
Total 151 29.1 3 1.4 50.3 431
Table 3.10.3 Annual Leave for the period 1 January 2013 to 31 December 2014
Salary band Total days takenNumber of Employees
using annual leaveAverage per employee
Lower skilled (Levels 1-2) 0 0 0
Skilled (Levels 3-5) 163 9 18
Highly skilled production (Levels 6-8) 1068 52 21
Highly skilled supervision (Levels 9-12) 1220 68 18
Senior management (Levels 13-16) 1464 79 19
Total 3915 208 19
Table 3.10.4 Capped leave for the period 1 January 2013 to 31 December 2014
Salary bandTotal days of capped leave
taken
Number of Employees
using capped leave
Average number of
days taken per employee
Average capped leave per employee
as on 31 March 20ZZ
Lower skilled (Levels 1-2) 0 0 0 0
Skilled (Levels 3-5) 0 0 0 0
Highly skilled production (Levels 6-8) 0 0 0 0
Highly skilled supervision (Levels 9-12) 0 0 0 0
Senior management (Levels 13-16) 0 0 0 0
Total 0 0 0 0
Table 3.10.5 Leave payout for the period 1 April 2013 to 31 March 2014
ReasonTotal amount
(R’000)Number of employees
Average per employee (R’000)
Leave payout for 2013/14 due to non-utilisation of leave for the previous cycle
71 1 71
Capped leave payouts on termination of service for 2013/14
0 0 0
Current leave payout on termination of service for 2013/14
101 4 25
Total 172 5 34.4
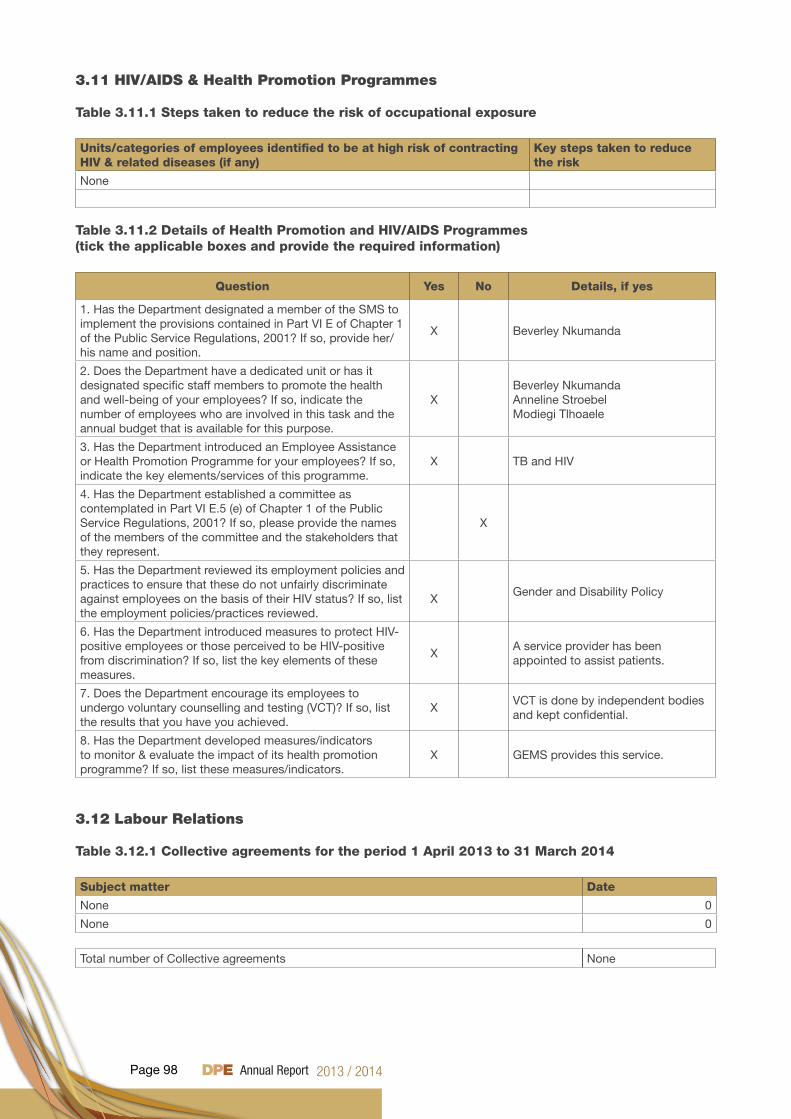
Page 98
3.11 HIV/AIDS & Health Promotion Programmes
Table 3.11.1 Steps taken to reduce the risk of occupational exposure
Units/categories of employees identified to be at high risk of contracting HIV & related diseases (if any)
Key steps taken to reduce the risk
None
Table 3.11.2 Details of Health Promotion and HIV/AIDS Programmes (tick the applicable boxes and provide the required information)
Question Yes No Details, if yes
1. Has the Department designated a member of the SMS to implement the provisions contained in Part VI E of Chapter 1 of the Public Service Regulations, 2001? If so, provide her/his name and position.
X Beverley Nkumanda
2. Does the Department have a dedicated unit or has it designated specific staff members to promote the health and well-being of your employees? If so, indicate the number of employees who are involved in this task and the annual budget that is available for this purpose.
XBeverley NkumandaAnneline StroebelModiegi Tlhoaele
3. Has the Department introduced an Employee Assistance or Health Promotion Programme for your employees? If so, indicate the key elements/services of this programme.
X TB and HIV
4. Has the Department established a committee as contemplated in Part VI E.5 (e) of Chapter 1 of the Public Service Regulations, 2001? If so, please provide the names of the members of the committee and the stakeholders that they represent.
X
5. Has the Department reviewed its employment policies and practices to ensure that these do not unfairly discriminate against employees on the basis of their HIV status? If so, list the employment policies/practices reviewed.
XGender and Disability Policy
6. Has the Department introduced measures to protect HIV-positive employees or those perceived to be HIV-positive from discrimination? If so, list the key elements of these measures.
XA service provider has been appointed to assist patients.
7. Does the Department encourage its employees to undergo voluntary counselling and testing (VCT)? If so, list the results that you have you achieved.
XVCT is done by independent bodies and kept confidential.
8. Has the Department developed measures/indicators to monitor & evaluate the impact of its health promotion programme? If so, list these measures/indicators.
X GEMS provides this service.
3.12 Labour Relations
Table 3.12.1 Collective agreements for the period 1 April 2013 to 31 March 2014
Subject matter Date
None 0
None 0
Total number of Collective agreements None
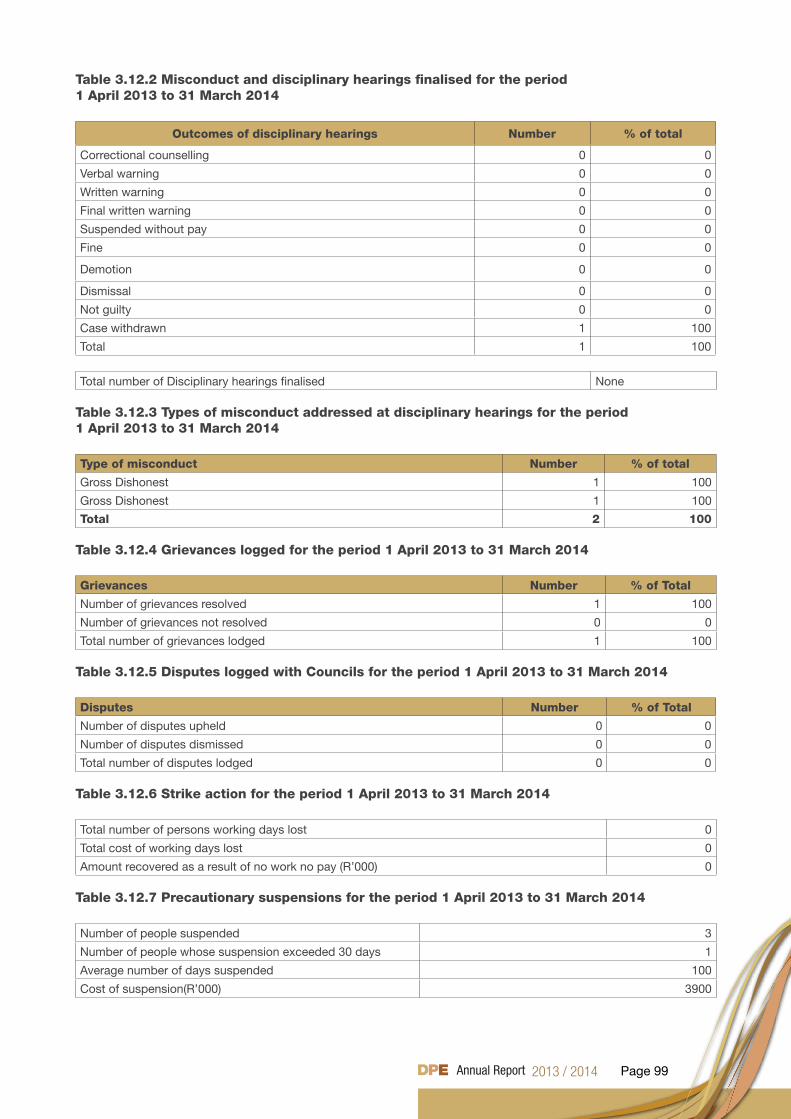
Page 99
Table 3.12.2 Misconduct and disciplinary hearings finalised for the period 1 April 2013 to 31 March 2014
Outcomes of disciplinary hearings Number % of total
Correctional counselling 0 0
Verbal warning 0 0
Written warning 0 0
Final written warning 0 0
Suspended without pay 0 0
Fine 0 0
Demotion 0 0
Dismissal 0 0
Not guilty 0 0
Case withdrawn 1 100
Total 1 100
Total number of Disciplinary hearings finalised None
Table 3.12.3 Types of misconduct addressed at disciplinary hearings for the period 1 April 2013 to 31 March 2014
Type of misconduct Number % of total
Gross Dishonest 1 100
Gross Dishonest 1 100
Total 2 100
Table 3.12.4 Grievances logged for the period 1 April 2013 to 31 March 2014
Grievances Number % of Total
Number of grievances resolved 1 100
Number of grievances not resolved 0 0
Total number of grievances lodged 1 100
Table 3.12.5 Disputes logged with Councils for the period 1 April 2013 to 31 March 2014
Disputes Number % of Total
Number of disputes upheld 0 0
Number of disputes dismissed 0 0
Total number of disputes lodged 0 0
Table 3.12.6 Strike action for the period 1 April 2013 to 31 March 2014
Total number of persons working days lost 0
Total cost of working days lost 0
Amount recovered as a result of no work no pay (R’000) 0
Table 3.12.7 Precautionary suspensions for the period 1 April 2013 to 31 March 2014
Number of people suspended 3
Number of people whose suspension exceeded 30 days 1
Average number of days suspended 100
Cost of suspension(R’000) 3900
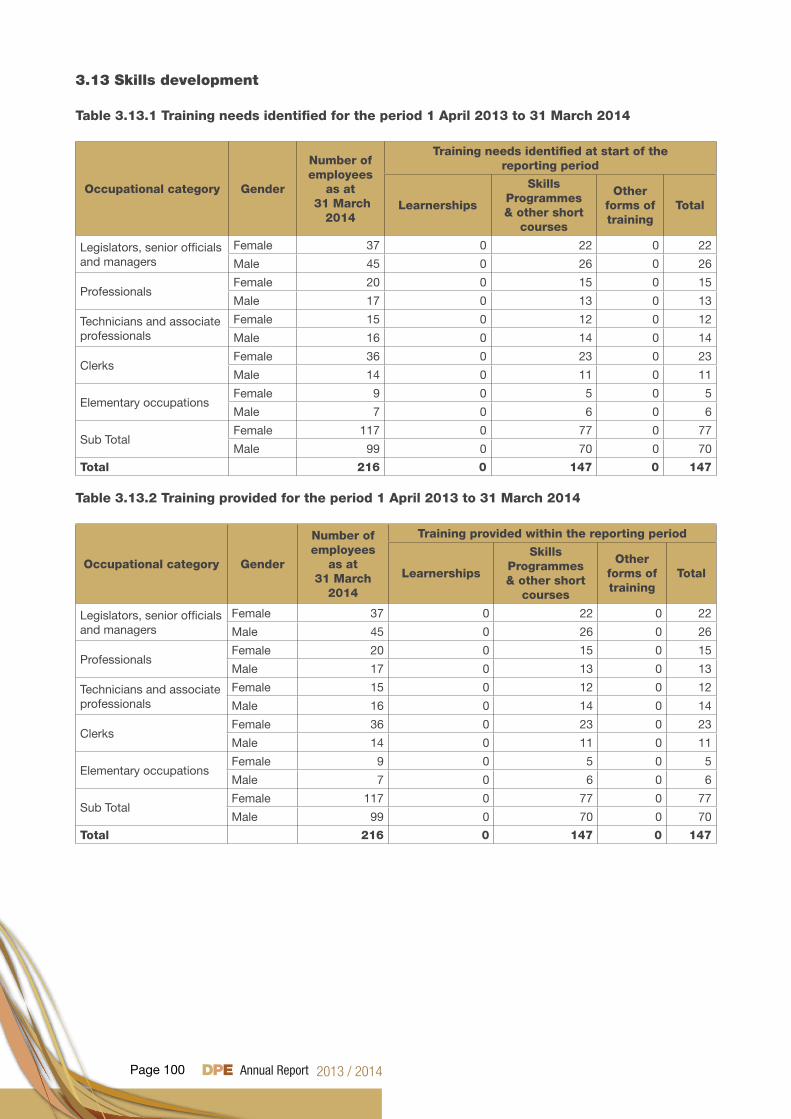
Page 100
3.13 Skills development
Table 3.13.1 Training needs identified for the period 1 April 2013 to 31 March 2014
Occupational category Gender
Number of employees
as at 31 March
2014
Training needs identified at start of the reporting period
Learnerships
Skills Programmes & other short
courses
Other forms of training
Total
Legislators, senior officials and managers
Female 37 0 22 0 22
Male 45 0 26 0 26
ProfessionalsFemale 20 0 15 0 15
Male 17 0 13 0 13
Technicians and associate professionals
Female 15 0 12 0 12
Male 16 0 14 0 14
Clerks Female 36 0 23 0 23
Male 14 0 11 0 11
Elementary occupationsFemale 9 0 5 0 5
Male 7 0 6 0 6
Sub TotalFemale 117 0 77 0 77
Male 99 0 70 0 70
Total 216 0 147 0 147
Table 3.13.2 Training provided for the period 1 April 2013 to 31 March 2014
Occupational category Gender
Number of employees
as at 31 March
2014
Training provided within the reporting period
Learnerships
Skills Programmes & other short
courses
Other forms of training
Total
Legislators, senior officials and managers
Female 37 0 22 0 22
Male 45 0 26 0 26
ProfessionalsFemale 20 0 15 0 15
Male 17 0 13 0 13
Technicians and associate professionals
Female 15 0 12 0 12
Male 16 0 14 0 14
Clerks Female 36 0 23 0 23
Male 14 0 11 0 11
Elementary occupationsFemale 9 0 5 0 5
Male 7 0 6 0 6
Sub TotalFemale 117 0 77 0 77
Male 99 0 70 0 70
Total 216 0 147 0 147
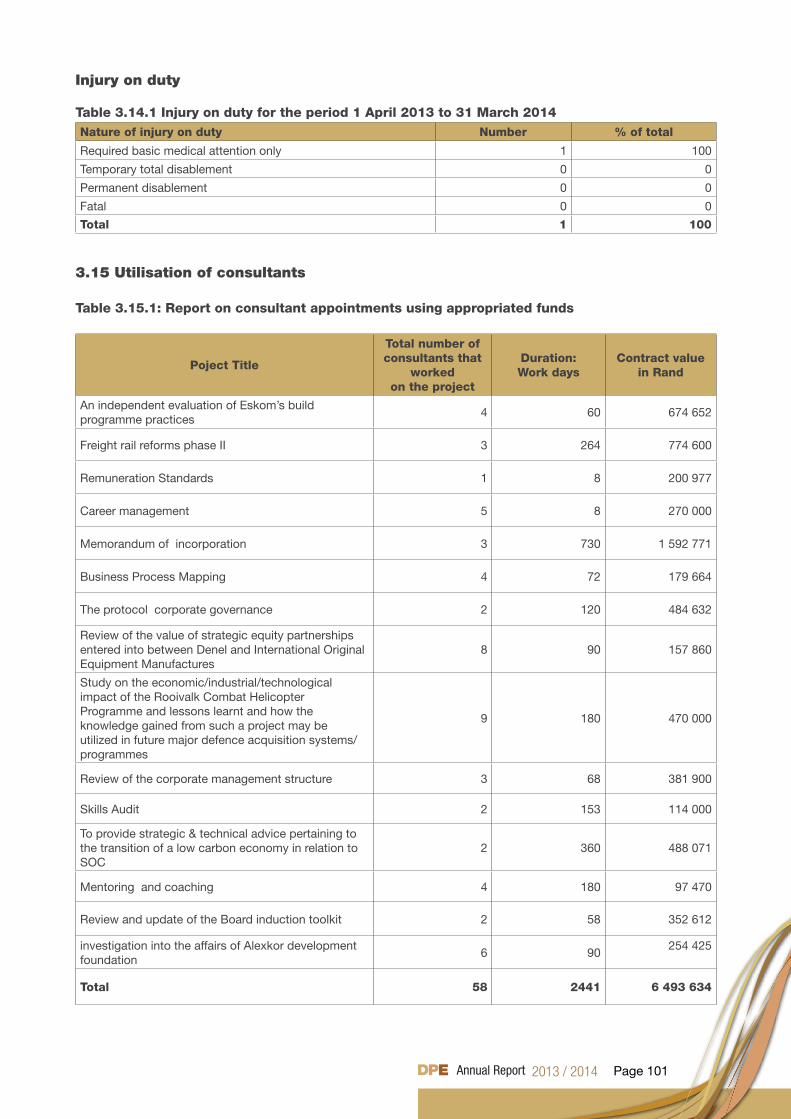
Page 101
Injury on duty
Table 3.14.1 Injury on duty for the period 1 April 2013 to 31 March 2014Nature of injury on duty Number % of total
Required basic medical attention only 1 100
Temporary total disablement 0 0
Permanent disablement 0 0
Fatal 0 0
Total 1 100
3.15 Utilisation of consultants
Table 3.15.1: Report on consultant appointments using appropriated funds
Poject Title
Total number of consultants that
workedon the project
Duration:Work days
Contract value in Rand
An independent evaluation of Eskom’s build programme practices
4 60 674 652
Freight rail reforms phase II 3 264 774 600
Remuneration Standards 1 8 200 977
Career management 5 8 270 000
Memorandum of incorporation 3 730 1 592 771
Business Process Mapping 4 72 179 664
The protocol corporate governance 2 120 484 632
Review of the value of strategic equity partnerships entered into between Denel and International Original Equipment Manufactures
8 90 157 860
Study on the economic/industrial/technological impact of the Rooivalk Combat Helicopter Programme and lessons learnt and how the knowledge gained from such a project may be utilized in future major defence acquisition systems/programmes
9 180 470 000
Review of the corporate management structure 3 68 381 900
Skills Audit 2 153 114 000
To provide strategic & technical advice pertaining to the transition of a low carbon economy in relation to SOC
2 360 488 071
Mentoring and coaching 4 180 97 470
Review and update of the Board induction toolkit 2 58 352 612
investigation into the affairs of Alexkor development foundation
6 90254 425
Total 58 2441 6 493 634
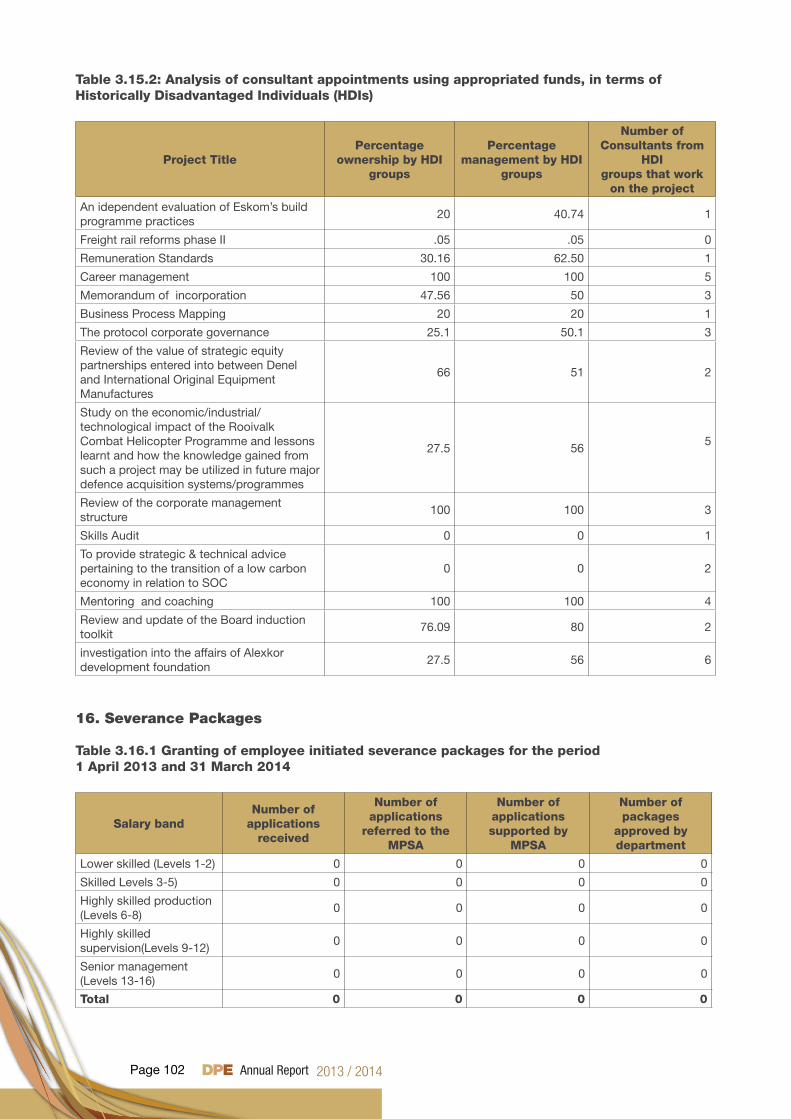
Page 102
Table 3.15.2: Analysis of consultant appointments using appropriated funds, in terms of Historically Disadvantaged Individuals (HDIs)
Project TitlePercentage
ownership by HDIgroups
Percentage management by HDI
groups
Number of Consultants from
HDIgroups that work
on the project
An idependent evaluation of Eskom’s build programme practices
20 40.74 1
Freight rail reforms phase II .05 .05 0
Remuneration Standards 30.16 62.50 1
Career management 100 100 5
Memorandum of incorporation 47.56 50 3
Business Process Mapping 20 20 1
The protocol corporate governance 25.1 50.1 3
Review of the value of strategic equity partnerships entered into between Denel and International Original Equipment Manufactures
66 51 2
Study on the economic/industrial/technological impact of the Rooivalk Combat Helicopter Programme and lessons learnt and how the knowledge gained from such a project may be utilized in future major defence acquisition systems/programmes
27.5 565
Review of the corporate management structure
100 100 3
Skills Audit 0 0 1
To provide strategic & technical advice pertaining to the transition of a low carbon economy in relation to SOC
0 0 2
Mentoring and coaching 100 100 4
Review and update of the Board induction toolkit
76.09 80 2
investigation into the affairs of Alexkor development foundation
27.5 56 6
16. Severance Packages
Table 3.16.1 Granting of employee initiated severance packages for the period 1 April 2013 and 31 March 2014
Salary bandNumber of
applications received
Number of applications
referred to the MPSA
Number of applications supported by
MPSA
Number of packages
approved by department
Lower skilled (Levels 1-2) 0 0 0 0
Skilled Levels 3-5) 0 0 0 0
Highly skilled production (Levels 6-8)
0 0 0 0
Highly skilled supervision(Levels 9-12)
0 0 0 0
Senior management (Levels 13-16)
0 0 0 0
Total 0 0 0 0
PART EFINANCIAL INFORMATION
Page 104
REPORT OF THE AUDITOR-GENERAL TO PARLIAMENT ON VOTE NO. 11: DEPARTMENT OF PUBLIC ENTERPRISES
REPORT ON THE FINANCIAL STATEMENTS
Introduction1. I have audited the financial statements of the Department of Public Enterprises set out on pages 107 to
149, which comprise the appropriation statement, the statement of financial position as at 31 March 2014, the statement of financial performance, statement of changes in net assets, and cash flow statement for the year then ended, as well as the notes, comprising a summary of significant accounting policies and other explanatory information.
Accounting officer’s responsibility for the financial statements2. The accounting officer responsible for the preparation and fair presentation of these financial statements
in accordance with the Modified Cash Standard prescribed by National Treasury and the requirements of the Public Finance Management Act of South Africa, 1999 (Act No.1 of 1999) (PFMA), and for such internal control as the accounting officer determines is necessary to enable the preparation of financial statements that are free from material misstatement, whether due to fraud or error.
Auditor-general’s responsibility3. My responsibility is to express an opinion on these financial statements based on my audit. I conducted
my audit in accordance with the Public Audit Act of South Africa, 2004 (Act No. 25 of 2004) (PAA), the general notice issued in terms thereof and International Standards on Auditing. Those standards require that I comply with ethical requirements, and plan and perform the audit to obtain reasonable assurance about whether the financial statements are free from material misstatement.
4. An audit involves performing procedures to obtain audit evidence about the amounts and disclosures in the financial statements. The procedures selected depend on the auditor’s judgement, including the assessment of the risks of material misstatement of the financial statements, whether due to fraud or error. In making those risk assessments, the auditor considers internal control relevant to the entity’s preparation and fair presentation of the financial statements in order to design audit procedures that are appropriate in the circumstances, but not for the purpose of expressing an opinion on the effectiveness of the entity’s internal control. An audit also includes evaluating the appropriateness of accounting policies used and the reasonableness of accounting estimates made by management, as well as evaluating the overall presentation of the financial statements.
5. I believe that the audit evidence I have obtained is sufficient and appropriate to provide a basis for my audit opinion.
Page 105
Opinion 6. In my opinion, the financial statements present fairly, in all material respects, the financial position of the
Department of Public Enterprises as at 31 March 2014 and its financial performance and cash flows for the year then ended, in accordance with the Modified Cash Standard prescribed by National Treasury and the requirements of the Public Finance Management Act of South Africa, 1999 (Act No.1 of 1999) (PFMA).
EMPHASIS OF MATTER PARAGRAPHS
The following emphasis of matter paragraphs will be included in our auditor’s report to draw the users’ attention to matters presented or disclosed in the financial statements:
Restatement of corresponding figures 7. As disclosed in note 27 to the financial statements, the corresponding figures for the 2012/13 financial
year disclosure note have been restated as a result of an error discovered during 2013/2014 in the financial statements of the Department of Public Enterprises for the year ended 31 March 2013.
ADDITIONAL MATTER PARAGRAPHS
8. I draw attention to the matter below. My opinion is not modified in respect of this matter:
Unaudited supplementary schedules 9. The supplementary information set out on pages 150 to 161 does not form part of the financial statements
and is presented as additional information. I have not audited these schedules and, accordingly, I do not express an opinion thereon.
REPORT ON OTHER LEGAL AND REGULATORY REQUIREMENTS
10. In accordance with the PAA and the general notice issued in terms thereof, I report the following findings on the reported performance information against predetermined objectives for selected programmes presented in the annual performance report, non-compliance with legislation as well as internal control. The objective of my tests was to identify reportable findings as described under each subheading but not to gather evidence to express assurance on these matters. Accordingly, I do not express an opinion or conclusion on these matters.
Predetermined objectives11. I performed procedures to obtain evidence about the usefulness and reliability of the reported performance
information for the following selected sub-programmes in Programme 3 – Portfolio Management and Strategic Partnerships presented on pages 43 to 66 in the annual performance report of the Department of Public Enterprises for the year ended 31 March 2014:
a. Sub Programme - Energy and Broadband Enterprises b. Sub Programme - Manufacturing Enterprises c. Sub Programme - Transport Enterprises
Page 106
12. I evaluated the reported performance information against the overall criteria of usefulness and reliability.
13. I evaluated the usefulness of the reported performance information to determine whether it was presented in accordance with the National Treasury’s annual reporting principles and whether the reported performance was consistent with the planned programmes and objectives. I further performed tests to determine whether indicators and targets were well defined, verifiable, specific, measurable, time bound and relevant, as required by the National Treasury’s Framework for Managing Programme Performance Information (FMPPI).
14. I assessed the reliability of the reported performance information to determine whether it was valid, accurate and complete.
15. I did not raise any material findings on the usefulness and reliability of the reported performance information for the selected programmes and objectives.
Compliance with legislation16. I performed procedures to obtain evidence that the entity had complied with applicable legislation
regarding financial matters, financial management and other related matters. I did not identify any instances of material non-compliance with specific matters in key legislation, as set out in the general notice issued in terms of the PAA.
Internal control17. I considered internal control relevant to my audit of the financial statements, Report on Predetermined
Objectives and compliance with legislation. I did not identify any significant deficiencies in internal control.
Pretoria31 July 2014
Page 107
TABLE OF CONTENTS
Appropriation Statement 108
Notes to the Appropriation Statement 118 Statement of Financial Performance 120 Statement of Financial Position 121 Statement of Changes in Net Assets 122 Cash Flow Statement 123 Notes to the Annual Financial Statements (including Accounting policies) 128 Annexures 150
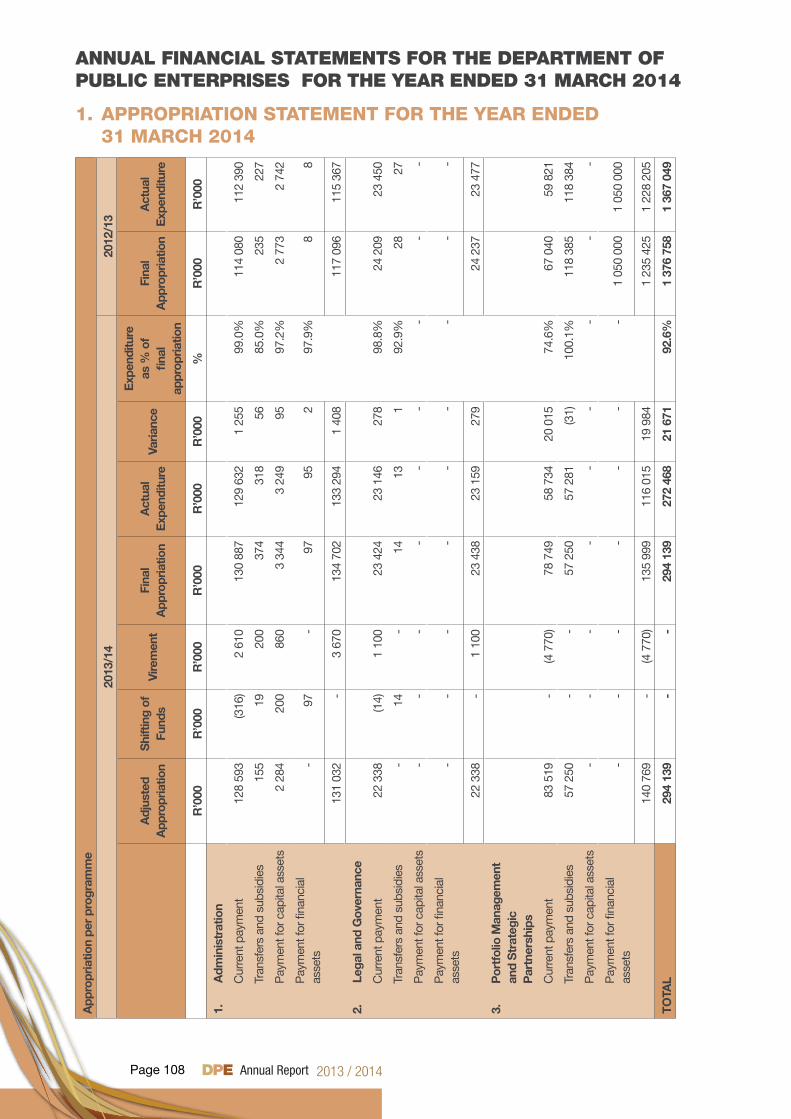
Page 108
App
ropr
iatio
n pe
r pr
ogra
mm
e
2013
/14
2012
/13
Adj
uste
d
App
ropr
iatio
nS
hift
ing
of
Fund
sVi
rem
ent
Fina
l A
ppro
pria
tion
Act
ual
Exp
endi
ture
Varia
nce
Exp
endi
ture
as
% o
f fin
al
appr
opria
tion
Fina
l A
ppro
pria
tion
Act
ual
Exp
endi
ture
R’0
00R
’000
R’0
00R
’000
R’0
00R
’000
%R
’000
R’0
00
1.
A
dmin
istr
atio
n
Cur
rent
pay
men
t12
8 59
3 (3
16)
2 61
013
0 88
712
9 63
21
255
99.0
%11
4 08
011
2 39
0
Tran
sfer
s an
d su
bsid
ies
155
1920
037
431
856
85.0
%23
522
7
Pay
men
t for
cap
ital a
sset
s2
284
200
860
3 34
43
249
9597
.2%
2 77
32
742
Pay
men
t for
fina
ncia
l as
sets
-97
-97
952
97.9
%8
8
131
032
-3
670
134
702
133
294
1 40
811
7 09
611
5 36
7
2.
L
egal
and
Gov
erna
nce
Cur
rent
pay
men
t 22
338
(14)
1 10
023
424
23 1
4627
898
.8%
24 2
0923
450
Tran
sfer
s an
d su
bsid
ies
-14
-14
131
92.9
%28
27
Pay
men
t for
cap
ital a
sset
s-
--
--
--
--
Pay
men
t for
fina
ncia
l as
sets
--
--
--
--
-
22 3
38-
1 10
023
438
23 1
5927
924
237
23 4
77
3.
Por
tfol
io M
anag
emen
t an
d S
trat
egic
P
artn
ersh
ips
Cur
rent
pay
men
t 83
519
-(4
770
)78
749
58 7
3420
015
74.6
%67
040
59 8
21
Tran
sfer
s an
d su
bsid
ies
57 2
50-
-57
250
57 2
81(3
1)10
0.1%
118
385
118
384
Pay
men
t for
cap
ital a
sset
s-
--
--
--
--
Pay
men
t for
fina
ncia
l as
sets
--
--
--
-1
050
000
1 05
0 00
0
140
769
-(4
770
)13
5 99
911
6 01
519
984
1 23
5 42
51
228
205
TOTA
L29
4 13
9-
-29
4 13
927
2 46
821
671
92.6
%1
376
758
1 36
7 04
9
1. APPROPRIATION STATEMENT FOR THE YEAR ENDED 31 MARCH 2014
ANNUAL FINANCIAL STATEMENTS FOR THE DEPARTMENT OF PUBLIC ENTERPRISES FOR THE YEAR ENDED 31 MARCH 2014
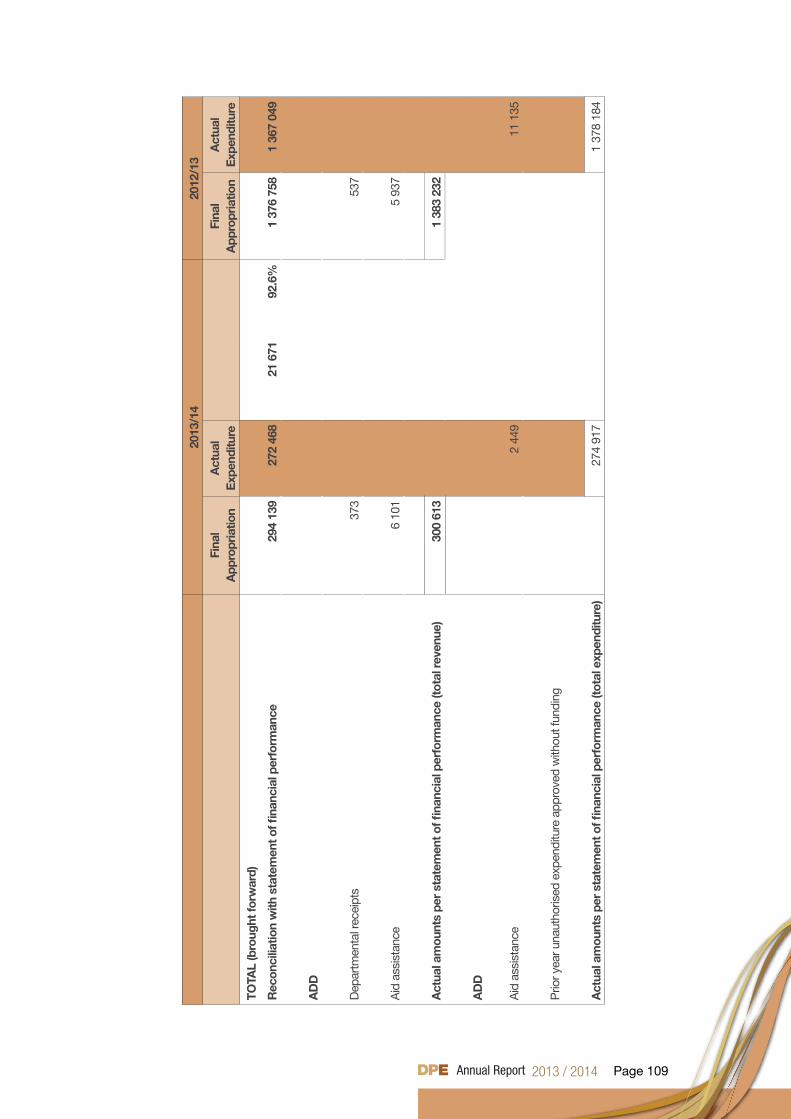
Page 109
2013
/14
2012
/13
Fina
l A
ppro
pria
tion
Act
ual
Exp
endi
ture
Fi
nal
App
ropr
iatio
nA
ctua
l E
xpen
ditu
re
TOTA
L (b
roug
ht fo
rwar
d)
Rec
onci
liatio
n w
ith s
tate
men
t of fi
nanc
ial p
erfo
rman
ce29
4 13
927
2 46
821
671
92.6
%1
376
758
1 36
7 04
9
AD
D
Dep
artm
enta
l rec
eipt
s37
353
7
Aid
ass
ista
nce
6 10
15
937
Act
ual a
mou
nts
per
stat
emen
t of fi
nanc
ial p
erfo
rman
ce (t
otal
reve
nue)
300
613
1 38
3 23
2
AD
D
Aid
ass
ista
nce
2 44
911
135
Prio
r yea
r una
utho
rised
exp
endi
ture
app
rove
d w
ithou
t fun
ding
Act
ual a
mou
nts
per
stat
emen
t of fi
nanc
ial p
erfo
rman
ce (t
otal
exp
endi
ture
)27
4 91
71
378
184
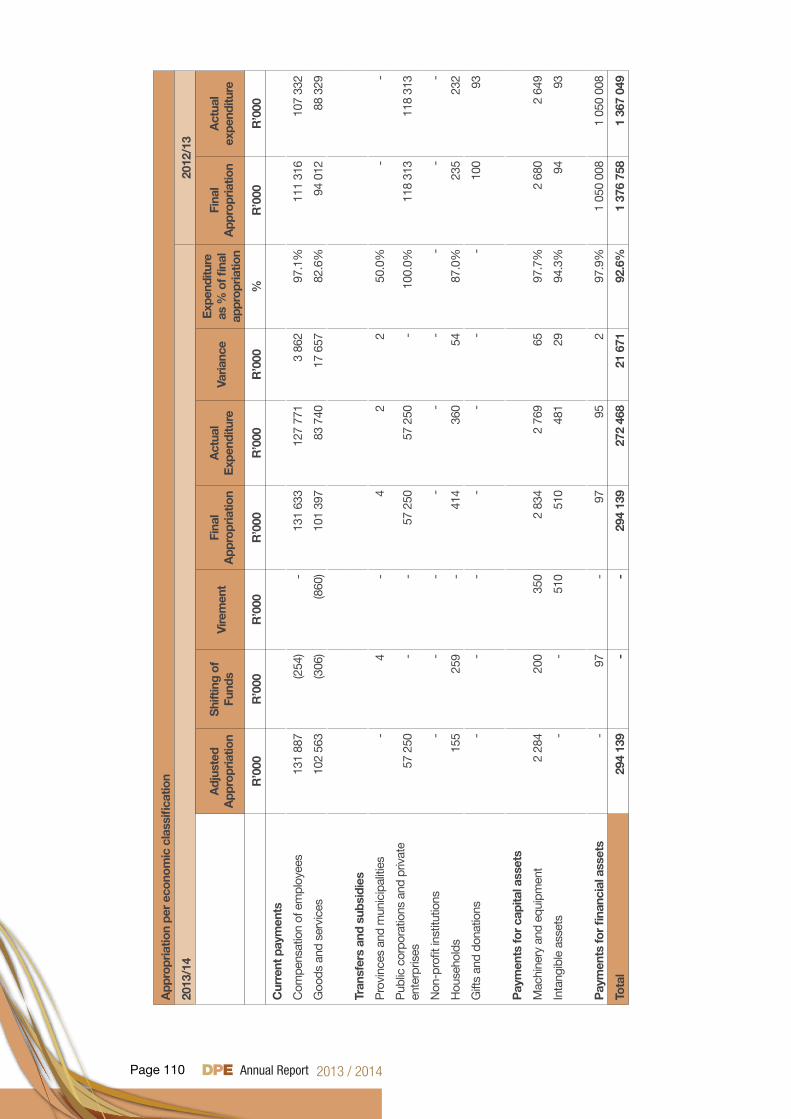
Page 110
App
ropr
iatio
n pe
r ec
onom
ic c
lass
ifica
tion
2013
/14
2012
/13
Adj
uste
d
App
ropr
iatio
nS
hift
ing
of
Fund
sVi
rem
ent
Fina
l A
ppro
pria
tion
Act
ual
Exp
endi
ture
Varia
nce
Exp
endi
ture
as
% o
f fina
l ap
prop
riatio
n
Fina
l A
ppro
pria
tion
Act
ual
expe
nditu
re
R’0
00R
’000
R’0
00R
’000
R’0
00R
’000
%R
’000
R’0
00
Cur
rent
pay
men
ts
Com
pens
atio
n of
em
ploy
ees
131
887
(254
)-
131
633
127
771
3 86
297
.1%
111
316
107
332
Goo
ds a
nd s
ervi
ces
102
563
(306
)(8
60)
101
397
83 7
4017
657
82.6
%94
012
88 3
29
Tran
sfer
s an
d su
bsid
ies
Pro
vinc
es a
nd m
unic
ipal
ities
-4
-4
22
50.0
%-
-
Pub
lic c
orpo
ratio
ns a
nd p
rivat
e en
terp
rises
57 2
50-
-57
250
57 2
50-
100.
0%11
8 31
311
8 31
3
Non
-pro
fit in
stitu
tions
-
--
--
--
--
Hou
seho
lds
155
259
-41
436
054
87.0
%23
523
2
Gift
s an
d do
natio
ns-
--
--
--
100
93
Pay
men
ts fo
r ca
pita
l ass
ets
Mac
hine
ry a
nd e
quip
men
t2
284
200
350
2 83
42
769
6597
.7%
2 68
02
649
Inta
ngib
le a
sset
s-
-51
051
048
129
94.3
%94
93
Pay
men
ts fo
r fin
anci
al a
sset
s-
97-
9795
297
.9%
1 05
0 00
81
050
008
Tota
l29
4 13
9-
-29
4 13
927
2 46
821
671
92.6
%1
376
758
1 36
7 04
9
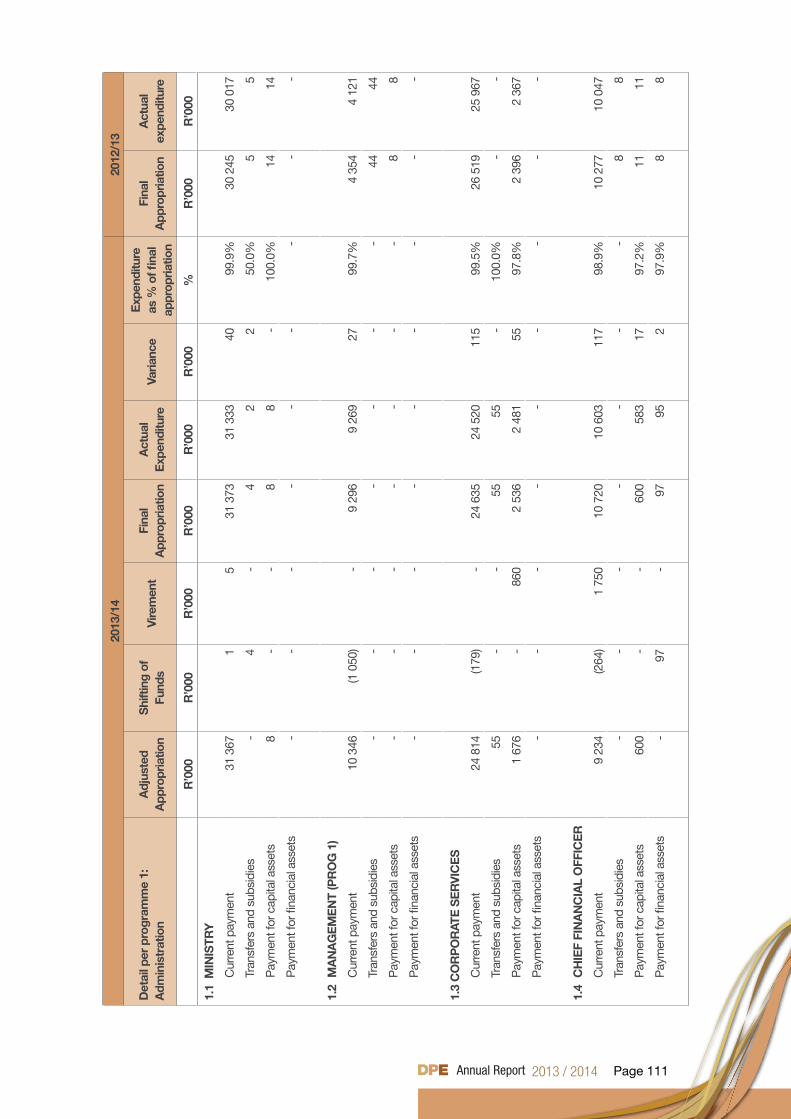
Page 111
2013
/14
2012
/13
Det
ail p
er p
rogr
amm
e 1:
A
dmin
istr
atio
n
Adj
uste
d
App
ropr
iatio
nS
hift
ing
of
Fund
sVi
rem
ent
Fina
l A
ppro
pria
tion
Act
ual
Exp
endi
ture
Varia
nce
Exp
endi
ture
as
% o
f fina
l ap
prop
riatio
n
Fina
l A
ppro
pria
tion
Act
ual
expe
nditu
re
R’0
00R
’000
R’0
00R
’000
R’0
00R
’000
%R
’000
R’0
00
1.1
MIN
ISTR
Y
Cur
rent
pay
men
t31
367
15
31 3
7331
333
4099
.9%
30 2
4530
017
Tran
sfer
s an
d su
bsid
ies
-4
-4
22
50.0
%5
5
Pay
men
t for
cap
ital a
sset
s8
--
88
-10
0.0%
1414
Pay
men
t for
fina
ncia
l ass
ets
--
--
--
--
-
1.2
MA
NA
GE
ME
NT
(PR
OG
1)
Cur
rent
pay
men
t10
346
(1 0
50)
-9
296
9 26
927
99.7
%4
354
4 12
1
Tran
sfer
s an
d su
bsid
ies
--
--
--
-44
44
Pay
men
t for
cap
ital a
sset
s-
--
--
--
88
Pay
men
t for
fina
ncia
l ass
ets
--
--
--
--
-
1.3
CO
RP
OR
ATE
SE
RV
ICE
S
Cur
rent
pay
men
t24
814
(179
)-
24 6
3524
520
115
99.5
%26
519
25 9
67
Tran
sfer
s an
d su
bsid
ies
55-
-55
55-
100.
0%-
-
Pay
men
t for
cap
ital a
sset
s1
676
-86
02
536
2 48
155
97.8
%2
396
2 36
7
Pay
men
t for
fina
ncia
l ass
ets
--
--
--
--
-
1.4
CH
IEF
FIN
AN
CIA
L O
FFIC
ER
Cur
rent
pay
men
t9
234
(264
)1
750
10 7
2010
603
117
98.9
%10
277
10 0
47
Tran
sfer
s an
d su
bsid
ies
--
--
--
-8
8
Pay
men
t for
cap
ital a
sset
s60
0-
-60
058
317
97.2
%11
11
Pay
men
t for
fina
ncia
l ass
ets
-97
-97
952
97.9
%8
8
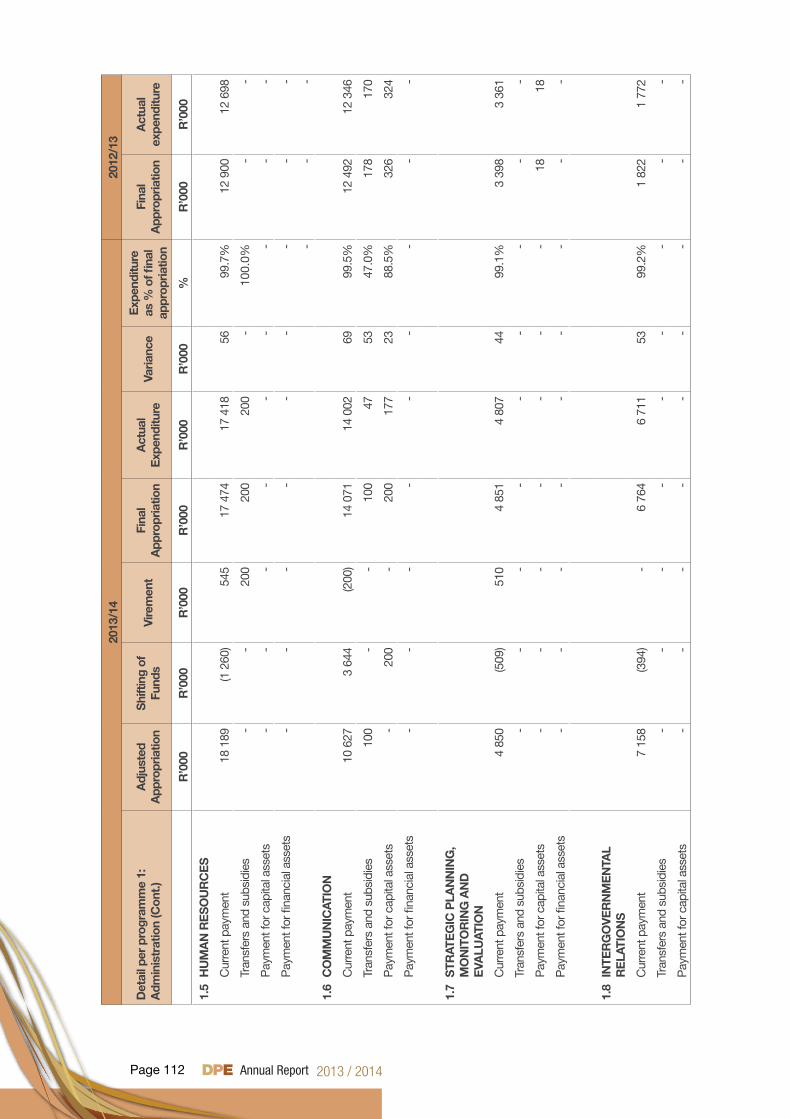
Page 112
2013
/14
2012
/13
Det
ail p
er p
rogr
amm
e 1:
A
dmin
istr
atio
n (C
ont.)
A
djus
ted
A
ppro
pria
tion
Shi
ftin
g of
Fu
nds
Vire
men
tFi
nal
App
ropr
iatio
nA
ctua
l E
xpen
ditu
reVa
rianc
eE
xpen
ditu
re
as %
of fi
nal
appr
opria
tion
Fina
l A
ppro
pria
tion
Act
ual
expe
nditu
re
R’0
00R
’000
R’0
00R
’000
R’0
00R
’000
%R
’000
R’0
00
1.5
HU
MA
N R
ES
OU
RC
ES
Cur
rent
pay
men
t18
189
(1 2
60)
545
17 4
7417
418
5699
.7%
12 9
0012
698
Tran
sfer
s an
d su
bsid
ies
--
200
200
200
-10
0.0%
--
Pay
men
t for
cap
ital a
sset
s-
--
--
--
--
Pay
men
t for
fina
ncia
l ass
ets
--
--
--
--
-
--
-
1.6
CO
MM
UN
ICAT
ION
Cur
rent
pay
men
t10
627
3 64
4(2
00)
14 0
7114
002
6999
.5%
12 4
9212
346
Tran
sfer
s an
d su
bsid
ies
100
--
100
4753
47.0
%17
817
0
Pay
men
t for
cap
ital a
sset
s-
200
-20
017
723
88.5
%32
632
4
Pay
men
t for
fina
ncia
l ass
ets
--
--
--
--
-
1.7
STR
ATE
GIC
PLA
NN
ING
, M
ON
ITO
RIN
G A
ND
E
VALU
ATIO
N
Cur
rent
pay
men
t4
850
(509
)51
04
851
4 80
744
99.1
%3
398
3 36
1
Tran
sfer
s an
d su
bsid
ies
--
--
--
--
-
Pay
men
t for
cap
ital a
sset
s-
--
--
--
1818
Pay
men
t for
fina
ncia
l ass
ets
--
--
--
--
-
1.8
INTE
RG
OV
ER
NM
EN
TAL
RE
LATI
ON
S
Cur
rent
pay
men
t7
158
(394
)-
6 76
46
711
5399
.2%
1 82
21
772
Tran
sfer
s an
d su
bsid
ies
--
--
--
--
-
Pay
men
t for
cap
ital a
sset
s-
--
--
--
--
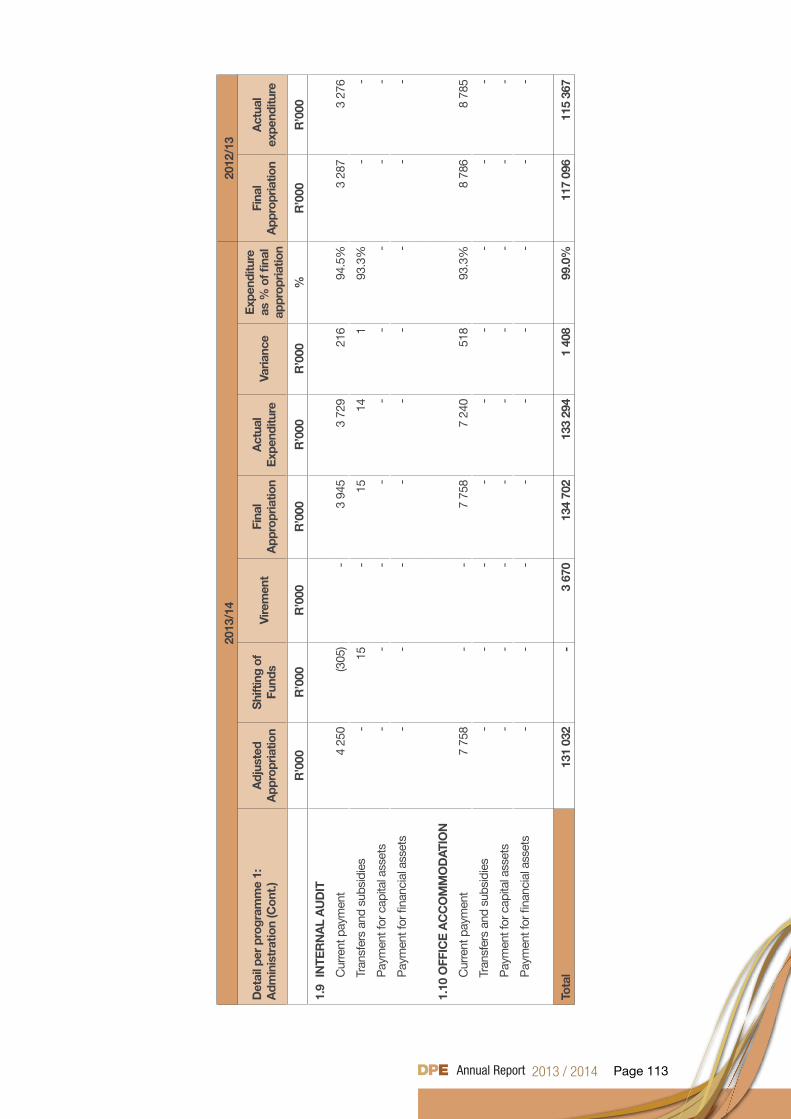
Page 113
2013
/14
2012
/13
Det
ail p
er p
rogr
amm
e 1:
A
dmin
istr
atio
n (C
ont.)
A
djus
ted
A
ppro
pria
tion
Shi
ftin
g of
Fu
nds
Vire
men
tFi
nal
App
ropr
iatio
nA
ctua
l E
xpen
ditu
reVa
rianc
eE
xpen
ditu
re
as %
of fi
nal
appr
opria
tion
Fina
l A
ppro
pria
tion
Act
ual
expe
nditu
re
R’0
00R
’000
R’0
00R
’000
R’0
00R
’000
%R
’000
R’0
00
1.9
INTE
RN
AL
AU
DIT
Cur
rent
pay
men
t4
250
(305
)-
3 94
53
729
216
94.5
%3
287
3 27
6
Tran
sfer
s an
d su
bsid
ies
-15
-15
141
93.3
%-
-
Pay
men
t for
cap
ital a
sset
s-
--
--
--
--
Pay
men
t for
fina
ncia
l ass
ets
--
--
--
--
-
1.10
OFF
ICE
AC
CO
MM
OD
ATIO
N
Cur
rent
pay
men
t7
758
--
7 75
87
240
518
93.3
%8
786
8 78
5
Tran
sfer
s an
d su
bsid
ies
--
--
--
--
-
Pay
men
t for
cap
ital a
sset
s-
--
--
--
--
Pay
men
t for
fina
ncia
l ass
ets
--
--
--
--
-
Tota
l13
1 03
2-
3 67
013
4 70
213
3 29
41
408
99.0
%11
7 09
611
5 36
7
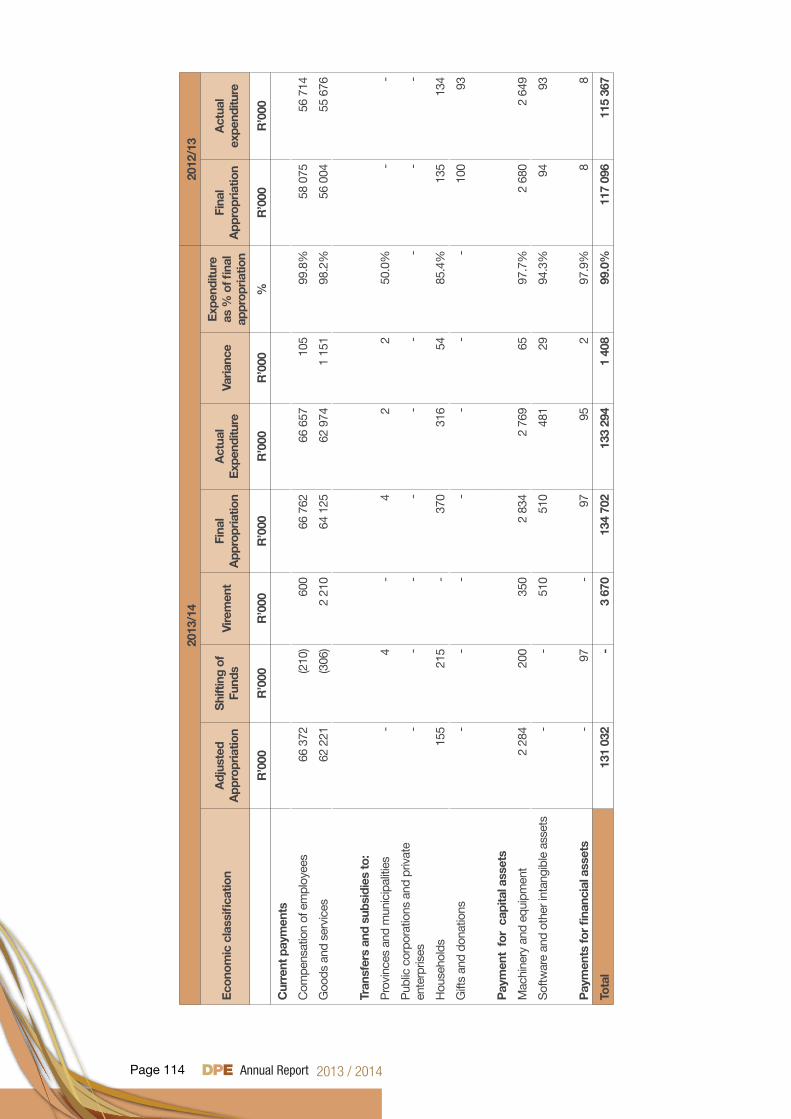
Page 114
2013
/14
2012
/13
Eco
nom
ic c
lass
ifica
tion
Adj
uste
d
App
ropr
iatio
nS
hift
ing
of
Fund
sVi
rem
ent
Fina
l A
ppro
pria
tion
Act
ual
Exp
endi
ture
Varia
nce
Exp
endi
ture
as
% o
f fina
l ap
prop
riatio
n
Fina
l A
ppro
pria
tion
Act
ual
expe
nditu
re
R’0
00R
’000
R’0
00R
’000
R’0
00R
’000
%R
’000
R’0
00
Cur
rent
pay
men
ts
Com
pens
atio
n of
em
ploy
ees
66 3
72(2
10)
600
66 7
6266
657
105
99.8
%58
075
56 7
14
Goo
ds a
nd s
ervi
ces
62 2
21(3
06)
2 21
064
125
62 9
741
151
98.2
%56
004
55 6
76
Tran
sfer
s an
d su
bsid
ies
to:
Pro
vinc
es a
nd m
unic
ipal
ities
-4
-4
22
50.0
%-
-
Pub
lic c
orpo
ratio
ns a
nd p
rivat
e en
terp
rises
--
--
--
--
-
Hou
seho
lds
155
215
-37
031
654
85.4
%13
513
4
Gift
s an
d do
natio
ns-
--
--
--
100
93
Pay
men
t fo
r c
apita
l ass
ets
Mac
hine
ry a
nd e
quip
men
t2
284
200
350
2 83
42
769
6597
.7%
2 68
02
649
Sof
twar
e an
d ot
her i
ntan
gibl
e as
sets
--
510
510
481
2994
.3%
9493
Pay
men
ts fo
r fin
anci
al a
sset
s-
97-
9795
297
.9%
88
Tota
l13
1 03
2-
3 67
013
4 70
213
3 29
41
408
99.0
%11
7 09
611
5 36
7
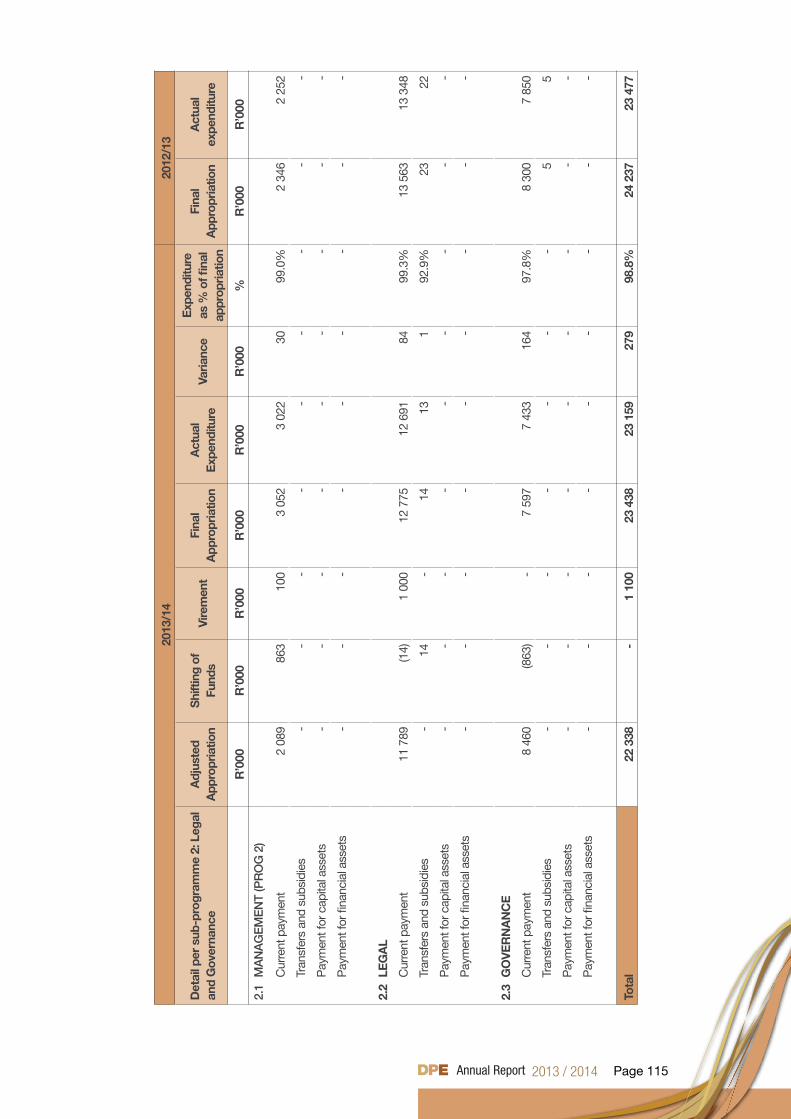
Page 115
2013
/14
2012
/13
Det
ail p
er s
ub-p
rogr
amm
e 2:
Leg
al
and
Gov
erna
nce
Adj
uste
d
App
ropr
iatio
nS
hift
ing
of
Fund
sVi
rem
ent
Fina
l A
ppro
pria
tion
Act
ual
Exp
endi
ture
Varia
nce
Exp
endi
ture
as
% o
f fina
l ap
prop
riatio
n
Fina
l A
ppro
pria
tion
Act
ual
expe
nditu
re
R’0
00R
’000
R’0
00R
’000
R’0
00R
’000
%R
’000
R’0
00
2.1
MA
NA
GE
ME
NT
(PR
OG
2)
Cur
rent
pay
men
t2
089
863
100
3 05
23
022
3099
.0%
2 34
62
252
Tran
sfer
s an
d su
bsid
ies
--
--
--
--
-
Pay
men
t for
cap
ital a
sset
s-
--
--
--
--
Pay
men
t for
fina
ncia
l ass
ets
--
--
--
--
-
2.2
LEG
AL
Cur
rent
pay
men
t11
789
(14)
1 00
012
775
12 6
9184
99.3
%13
563
13 3
48
Tran
sfer
s an
d su
bsid
ies
-14
-14
131
92.9
%23
22
Pay
men
t for
cap
ital a
sset
s-
--
--
--
--
Pay
men
t for
fina
ncia
l ass
ets
--
--
--
--
-
2.3
GO
VE
RN
AN
CE
Cur
rent
pay
men
t8
460
(863
)-
7 59
77
433
164
97.8
%8
300
7 85
0
Tran
sfer
s an
d su
bsid
ies
--
--
--
-5
5
Pay
men
t for
cap
ital a
sset
s-
--
--
--
--
Pay
men
t for
fina
ncia
l ass
ets
--
--
--
--
-
Tota
l22
338
-1
100
23 4
3823
159
279
98.8
%24
237
23 4
77
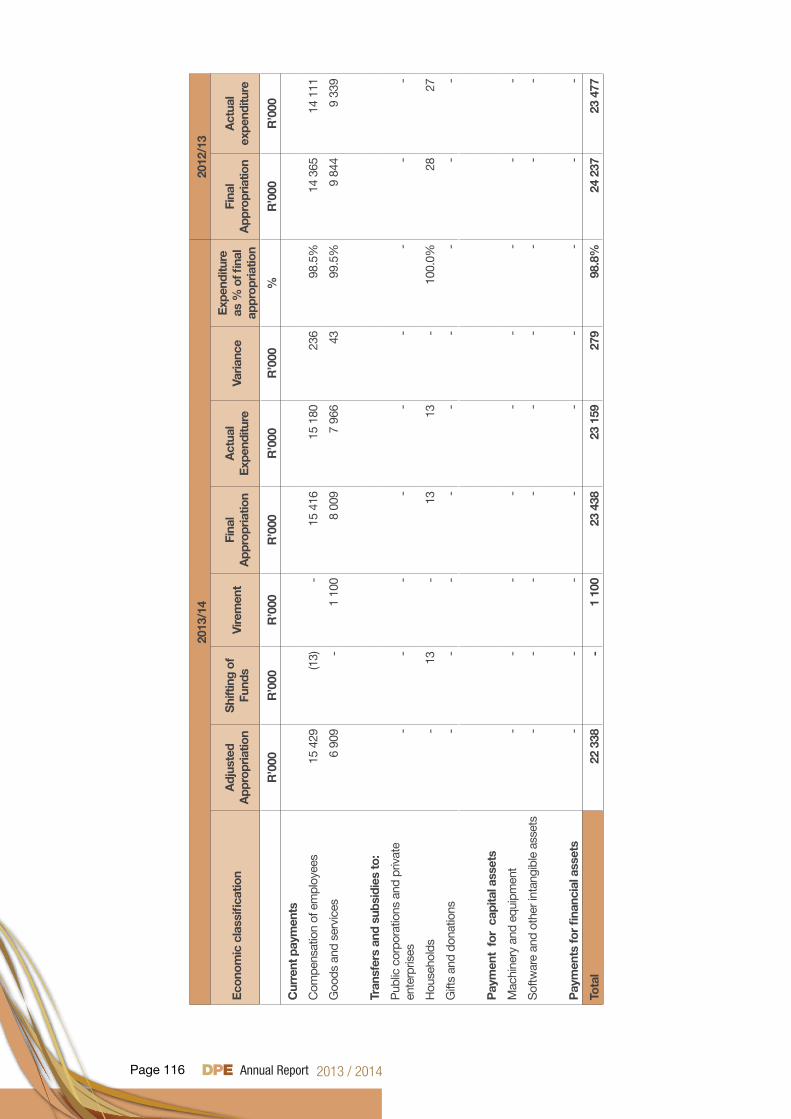
Page 116
2013
/14
2012
/13
Eco
nom
ic c
lass
ifica
tion
Adj
uste
d
App
ropr
iatio
nS
hift
ing
of
Fund
sVi
rem
ent
Fina
l A
ppro
pria
tion
Act
ual
Exp
endi
ture
Varia
nce
Exp
endi
ture
as
% o
f fina
l ap
prop
riatio
n
Fina
l A
ppro
pria
tion
Act
ual
expe
nditu
re
R’0
00R
’000
R’0
00R
’000
R’0
00R
’000
%R
’000
R’0
00
Cur
rent
pay
men
ts
Com
pens
atio
n of
em
ploy
ees
15 4
29(1
3)-
15 4
1615
180
236
98.5
%14
365
14 1
11
Goo
ds a
nd s
ervi
ces
6 90
9-
1 10
08
009
7 96
643
99.5
%9
844
9 33
9
Tran
sfer
s an
d su
bsid
ies
to:
Pub
lic c
orpo
ratio
ns a
nd p
rivat
e en
terp
rises
--
--
--
--
-
Hou
seho
lds
-13
-13
13-
100.
0%28
27
Gift
s an
d do
natio
ns-
--
--
--
--
Pay
men
t fo
r c
apita
l ass
ets
Mac
hine
ry a
nd e
quip
men
t-
--
--
--
--
Sof
twar
e an
d ot
her i
ntan
gibl
e as
sets
--
--
--
--
-
Pay
men
ts fo
r fin
anci
al a
sset
s-
--
--
--
--
Tota
l22
338
-1
100
23 4
3823
159
279
98.8
%24
237
23 4
77
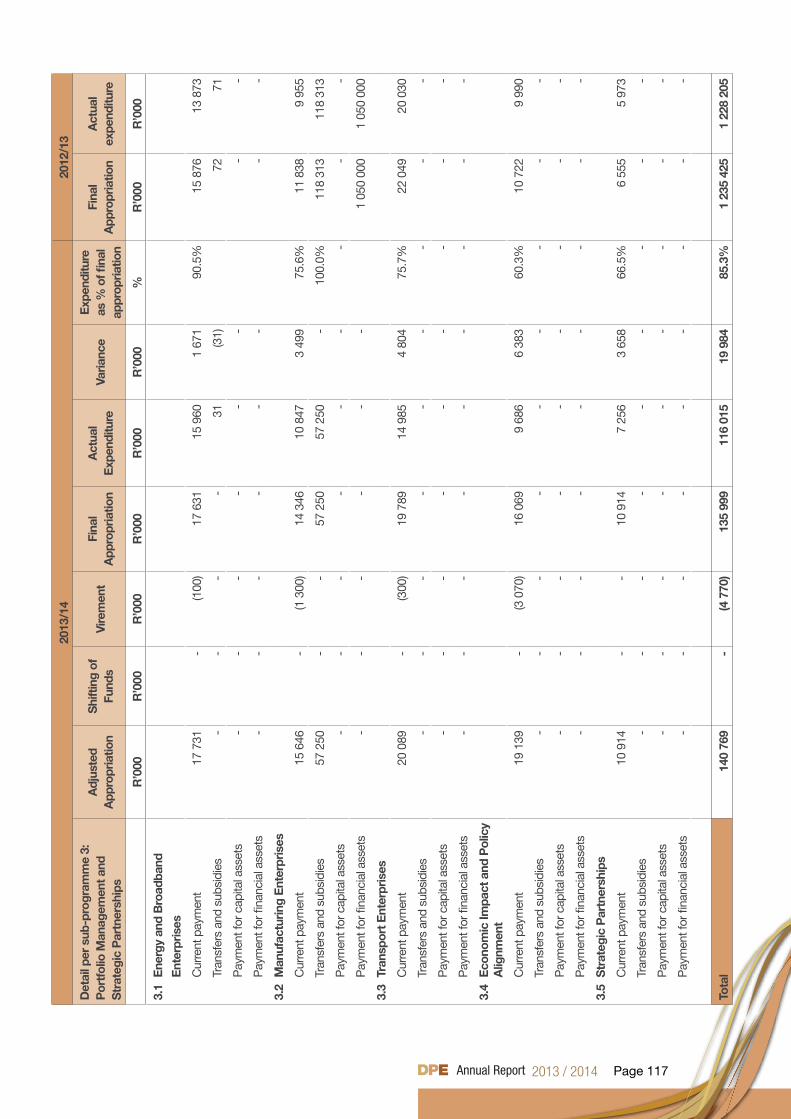
Page 117
2013
/14
2012
/13
Det
ail p
er s
ub-p
rogr
amm
e 3:
P
ortf
olio
Man
agem
ent a
nd
Str
ateg
ic P
artn
ersh
ips
Adj
uste
d
App
ropr
iatio
nS
hift
ing
of
Fund
sVi
rem
ent
Fina
l A
ppro
pria
tion
Act
ual
Exp
endi
ture
Varia
nce
Exp
endi
ture
as
% o
f fina
l ap
prop
riatio
n
Fina
l A
ppro
pria
tion
Act
ual
expe
nditu
re
R’0
00R
’000
R’0
00R
’000
R’0
00R
’000
%R
’000
R’0
00
3.1
Ene
rgy
and
Bro
adba
nd
E
nter
pris
es
Cur
rent
pay
men
t17
731
-(1
00)
17 6
3115
960
1 67
190
.5%
15 8
7613
873
Tran
sfer
s an
d su
bsid
ies
--
--
31(3
1)72
71
Pay
men
t for
cap
ital a
sset
s-
--
--
--
-
Pay
men
t for
fina
ncia
l ass
ets
--
--
--
--
3.2
Man
ufac
turin
g E
nter
pris
es
Cur
rent
pay
men
t15
646
-(1
300
)14
346
10 8
47 3
499
75.6
%11
838
9 95
5
Tran
sfer
s an
d su
bsid
ies
57 2
50-
-57
250
57 2
50-
100.
0%11
8 31
311
8 31
3
Pay
men
t for
cap
ital a
sset
s-
--
--
--
--
Pay
men
t for
fina
ncia
l ass
ets
--
--
--
1 05
0 00
01
050
000
3.3
Tran
spor
t Ent
erpr
ises
Cur
rent
pay
men
t20
089
-(3
00)
19 7
8914
985
4 80
475
.7%
22 0
4920
030
Tran
sfer
s an
d su
bsid
ies
--
--
--
--
-
Pay
men
t for
cap
ital a
sset
s-
--
--
--
--
Pay
men
t for
fina
ncia
l ass
ets
--
--
--
--
-
3.4
Eco
nom
ic Im
pact
and
Pol
icy
Alig
nmen
t
Cur
rent
pay
men
t19
139
-(3
070
)16
069
9 68
66
383
60.3
%10
722
9 99
0
Tran
sfer
s an
d su
bsid
ies
--
--
--
--
-
Pay
men
t for
cap
ital a
sset
s-
--
--
--
--
Pay
men
t for
fina
ncia
l ass
ets
--
--
--
--
-
3.5
Str
ateg
ic P
artn
ersh
ips
Cur
rent
pay
men
t10
914
--
10 9
147
256
3 65
866
.5%
6 55
55
973
Tran
sfer
s an
d su
bsid
ies
--
--
--
--
-
Pay
men
t for
cap
ital a
sset
s-
--
--
--
--
Pay
men
t for
fina
ncia
l ass
ets
--
--
--
--
-
Tota
l14
0 76
9-
(4 7
70)
135
999
116
015
19 9
8485
.3%
1 23
5 42
51
228
205
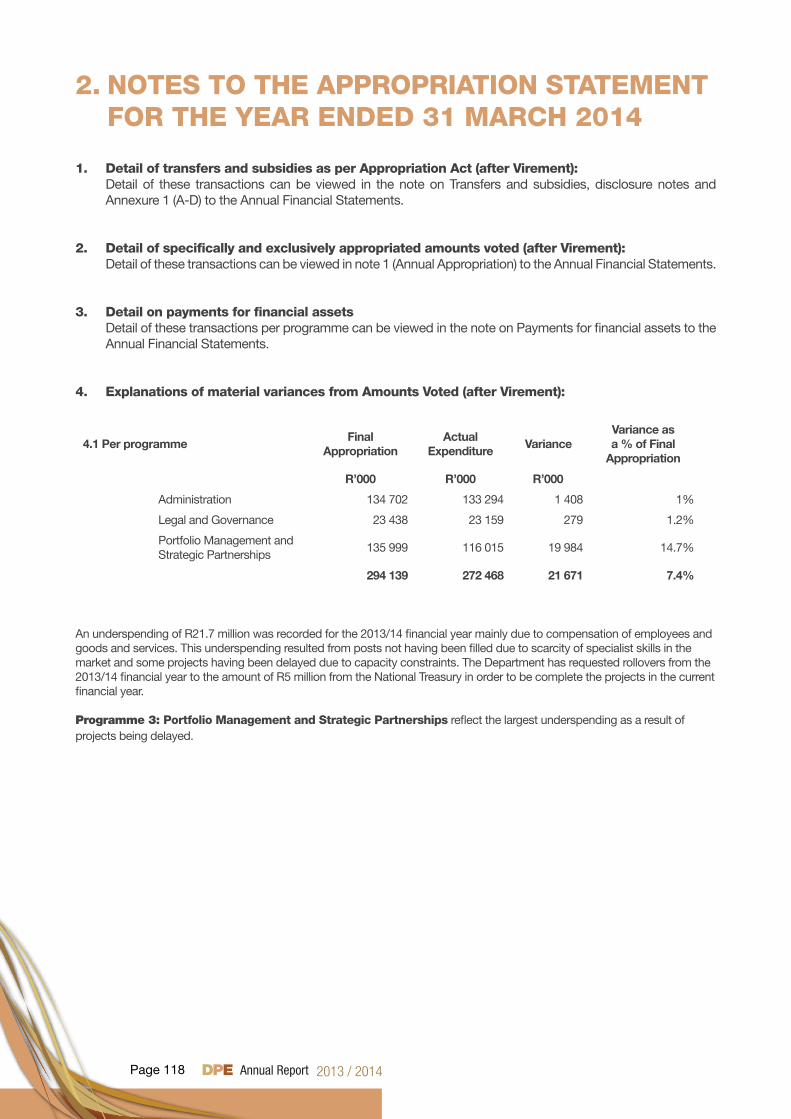
Page 118
2. NOTES TO THE APPROPRIATION STATEMENT FOR THE YEAR ENDED 31 MARCH 2014
1. Detail of transfers and subsidies as per Appropriation Act (after Virement): Detail of these transactions can be viewed in the note on Transfers and subsidies, disclosure notes and
Annexure 1 (A-D) to the Annual Financial Statements.
2. Detail of specifically and exclusively appropriated amounts voted (after Virement): Detail of these transactions can be viewed in note 1 (Annual Appropriation) to the Annual Financial Statements.
3. Detail on payments for financial assets Detail of these transactions per programme can be viewed in the note on Payments for financial assets to the
Annual Financial Statements.
4. Explanations of material variances from Amounts Voted (after Virement):
4.1 Per programmeFinal
AppropriationActual
ExpenditureVariance
Variance as a % of Final
Appropriation
R’000 R’000 R’000
Administration 134 702 133 294 1 408 1%
Legal and Governance 23 438 23 159 279 1.2%
Portfolio Management and Strategic Partnerships
135 999 116 015 19 984 14.7%
294 139 272 468 21 671 7.4%
An underspending of R21.7 million was recorded for the 2013/14 financial year mainly due to compensation of employees and goods and services. This underspending resulted from posts not having been filled due to scarcity of specialist skills in the market and some projects having been delayed due to capacity constraints. The Department has requested rollovers from the 2013/14 financial year to the amount of R5 million from the National Treasury in order to be complete the projects in the current financial year.
Programme 3: Portfolio Management and Strategic Partnerships reflect the largest underspending as a result of projects being delayed.
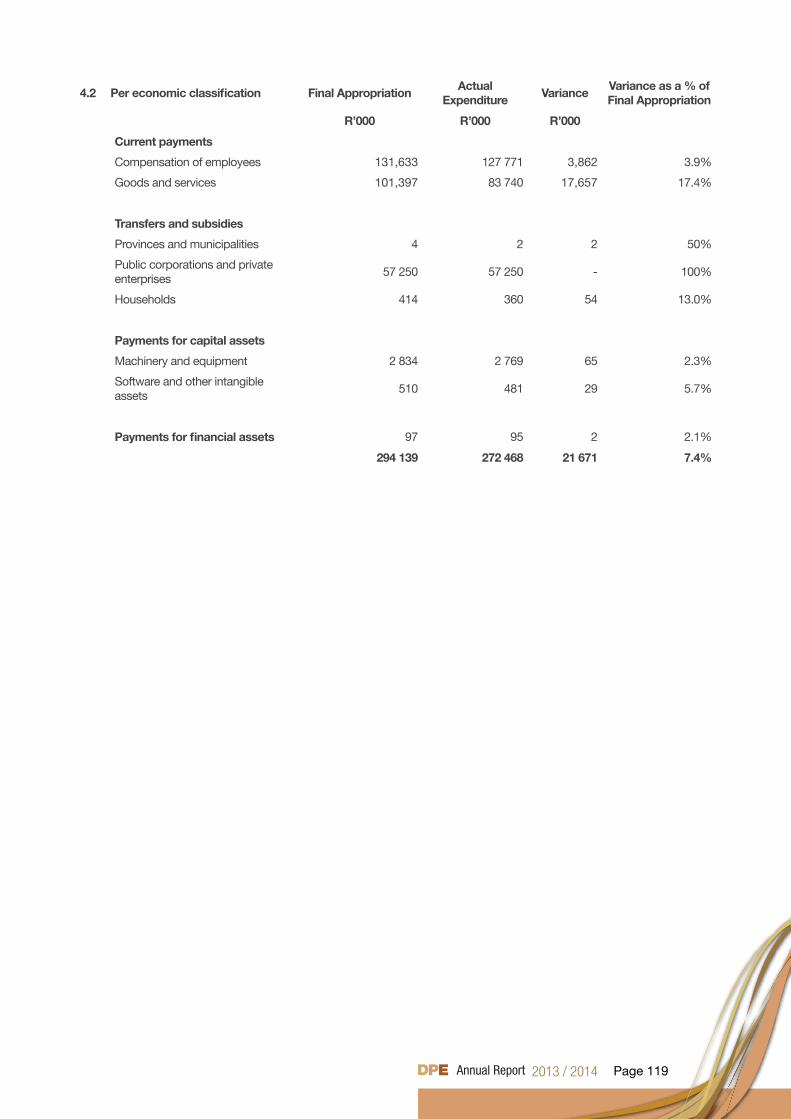
Page 119
4.2 Per economic classification Final AppropriationActual
ExpenditureVariance
Variance as a % of Final Appropriation
R’000 R’000 R’000
Current payments
Compensation of employees 131,633 127 771 3,862 3.9%
Goods and services 101,397 83 740 17,657 17.4%
Transfers and subsidies
Provinces and municipalities 4 2 2 50%
Public corporations and private enterprises
57 250 57 250 - 100%
Households 414 360 54 13.0%
Payments for capital assets
Machinery and equipment 2 834 2 769 65 2.3%
Software and other intangible assets
510 481 29 5.7%
Payments for financial assets 97 95 2 2.1%
294 139 272 468 21 671 7.4%
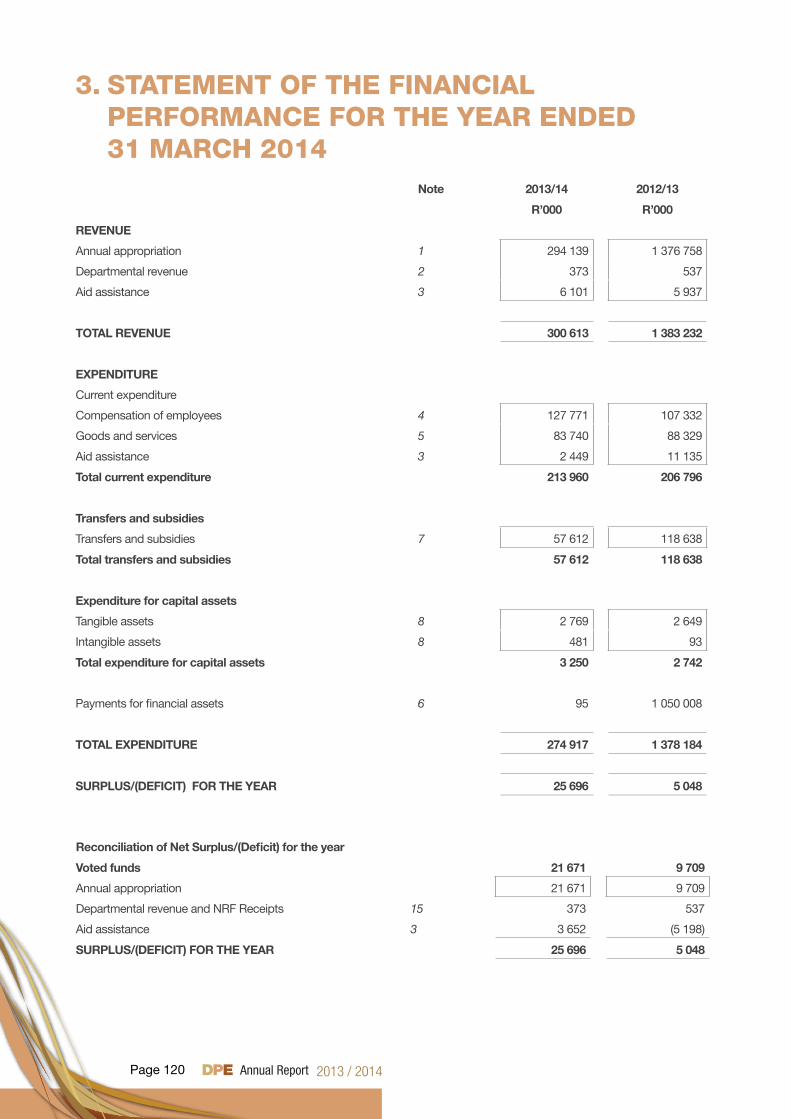
Page 120
3. STATEMENT OF THE FINANCIAL PERFORMANCE FOR THE YEAR ENDED 31 MARCH 2014
Note 2013/14 2012/13
R’000 R’000
REVENUE
Annual appropriation 1 294 139 1 376 758
Departmental revenue 2 373 537
Aid assistance 3 6 101 5 937
TOTAL REVENUE 300 613 1 383 232
EXPENDITURE
Current expenditure
Compensation of employees 4 127 771 107 332
Goods and services 5 83 740 88 329
Aid assistance 3 2 449 11 135
Total current expenditure 213 960 206 796
Transfers and subsidies
Transfers and subsidies 7 57 612 118 638
Total transfers and subsidies 57 612 118 638
Expenditure for capital assets
Tangible assets 8 2 769 2 649
Intangible assets 8 481 93
Total expenditure for capital assets 3 250 2 742
Payments for financial assets 6 95 1 050 008
TOTAL EXPENDITURE 274 917 1 378 184
SURPLUS/(DEFICIT) FOR THE YEAR 25 696 5 048
Reconciliation of Net Surplus/(Deficit) for the year
Voted funds 21 671 9 709
Annual appropriation 21 671 9 709
Departmental revenue and NRF Receipts 15 373 537
Aid assistance 3 3 652 (5 198)
SURPLUS/(DEFICIT) FOR THE YEAR 25 696 5 048
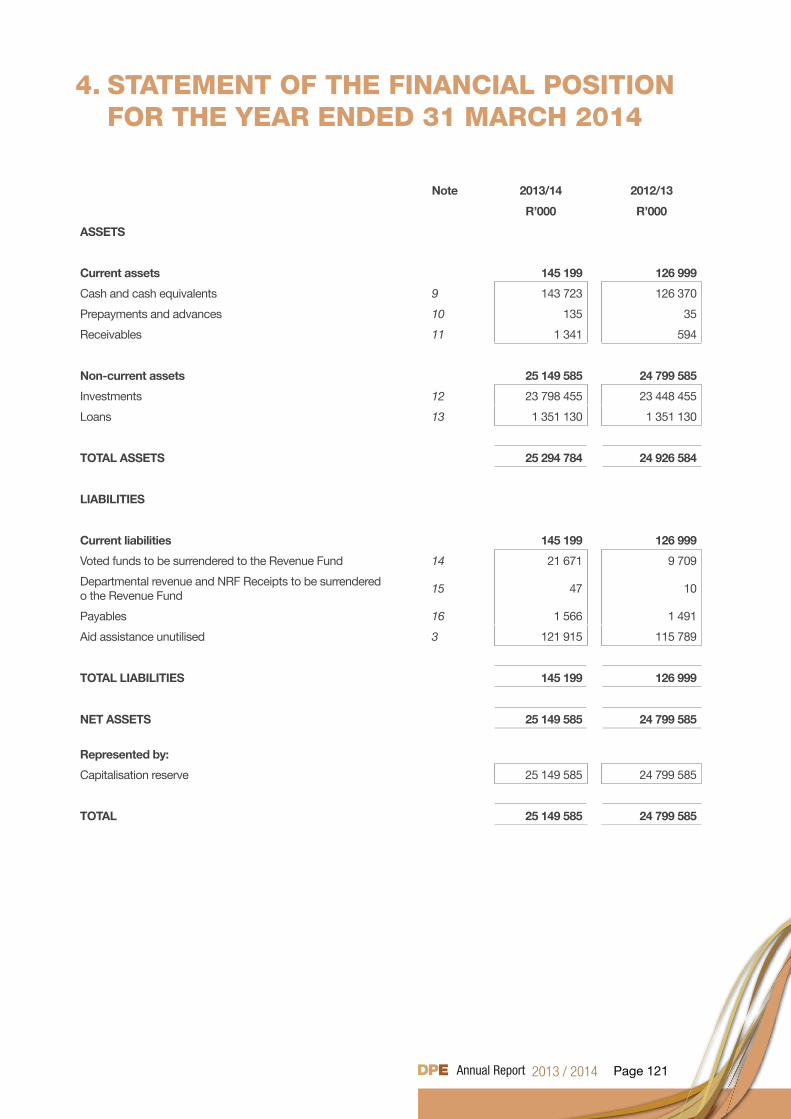
Page 121
4. STATEMENT OF THE FINANCIAL POSITION FOR THE YEAR ENDED 31 MARCH 2014
Note 2013/14 2012/13
R’000 R’000
ASSETS
Current assets 145 199 126 999
Cash and cash equivalents 9 143 723 126 370
Prepayments and advances 10 135 35
Receivables 11 1 341 594
Non-current assets 25 149 585 24 799 585
Investments 12 23 798 455 23 448 455
Loans 13 1 351 130 1 351 130
TOTAL ASSETS 25 294 784 24 926 584
LIABILITIES
Current liabilities 145 199 126 999
Voted funds to be surrendered to the Revenue Fund 14 21 671 9 709
Departmental revenue and NRF Receipts to be surrendered o the Revenue Fund
15 47 10
Payables 16 1 566 1 491
Aid assistance unutilised 3 121 915 115 789
TOTAL LIABILITIES 145 199 126 999
NET ASSETS 25 149 585 24 799 585
Represented by:
Capitalisation reserve 25 149 585 24 799 585
TOTAL 25 149 585 24 799 585
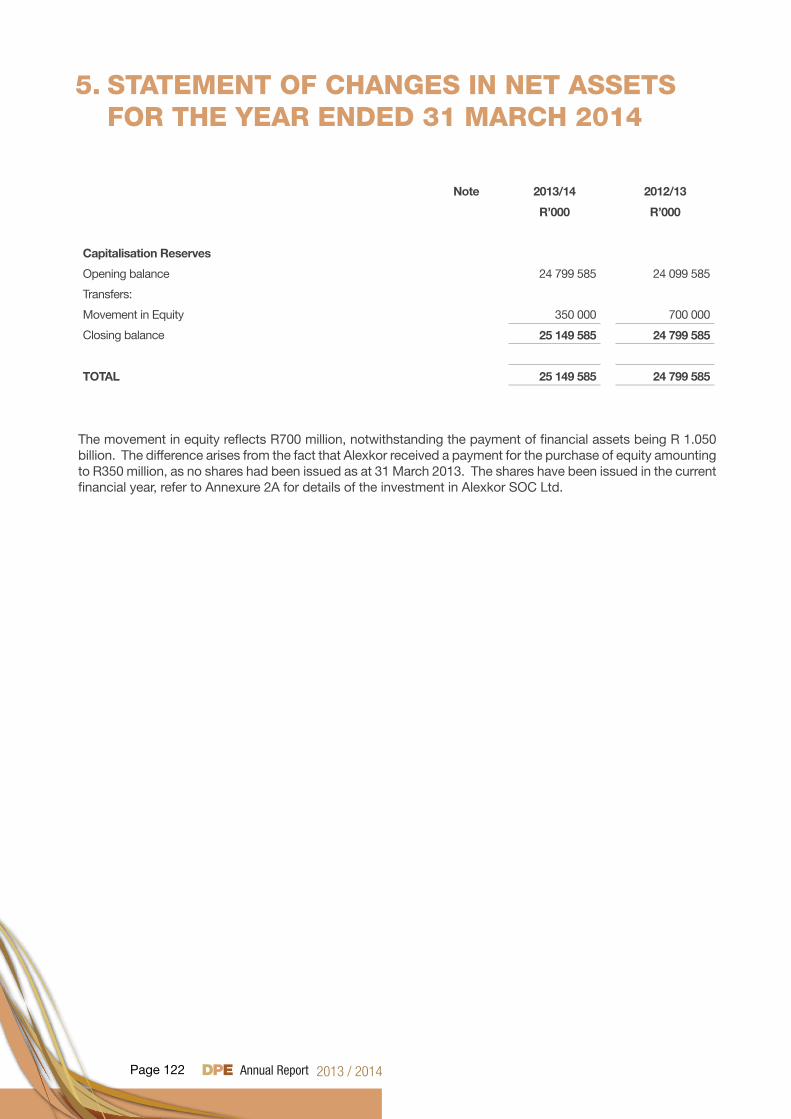
Page 122
5. STATEMENT OF CHANGES IN NET ASSETS FOR THE YEAR ENDED 31 MARCH 2014
Note 2013/14 2012/13
R’000 R’000
Capitalisation Reserves
Opening balance 24 799 585 24 099 585
Transfers:
Movement in Equity 350 000 700 000
Closing balance 25 149 585 24 799 585
TOTAL 25 149 585 24 799 585
The movement in equity reflects R700 million, notwithstanding the payment of financial assets being R 1.050 billion. The difference arises from the fact that Alexkor received a payment for the purchase of equity amounting to R350 million, as no shares had been issued as at 31 March 2013. The shares have been issued in the current financial year, refer to Annexure 2A for details of the investment in Alexkor SOC Ltd.
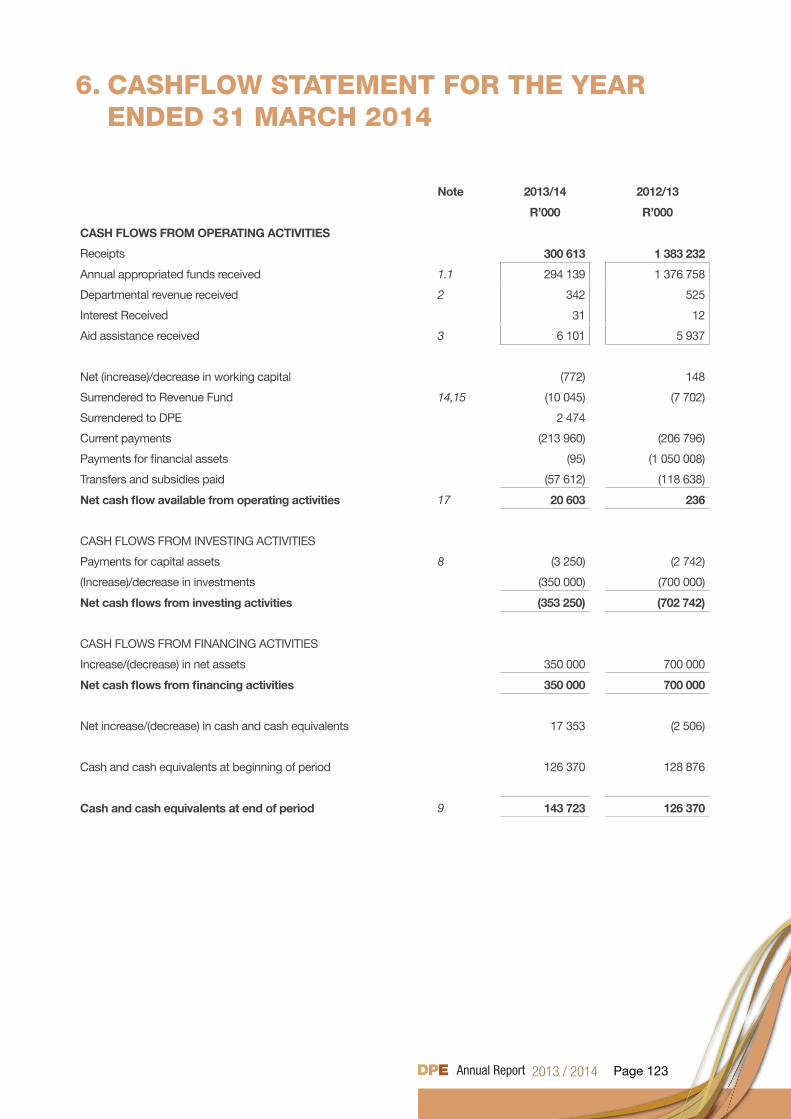
Page 123
6. CASHFLOW STATEMENT FOR THE YEAR ENDED 31 MARCH 2014
Note 2013/14 2012/13
R’000 R’000
CASH FLOWS FROM OPERATING ACTIVITIES
Receipts 300 613 1 383 232
Annual appropriated funds received 1.1 294 139 1 376 758
Departmental revenue received 2 342 525
Interest Received 31 12
Aid assistance received 3 6 101 5 937
Net (increase)/decrease in working capital (772) 148
Surrendered to Revenue Fund 14,15 (10 045) (7 702)
Surrendered to DPE 2 474
Current payments (213 960) (206 796)
Payments for financial assets (95) (1 050 008)
Transfers and subsidies paid (57 612) (118 638)
Net cash flow available from operating activities 17 20 603 236
CASH FLOWS FROM INVESTING ACTIVITIES
Payments for capital assets 8 (3 250) (2 742)
(Increase)/decrease in investments (350 000) (700 000)
Net cash flows from investing activities (353 250) (702 742)
CASH FLOWS FROM FINANCING ACTIVITIES
Increase/(decrease) in net assets 350 000 700 000
Net cash flows from financing activities 350 000 700 000
Net increase/(decrease) in cash and cash equivalents 17 353 (2 506)
Cash and cash equivalents at beginning of period 126 370 128 876
Cash and cash equivalents at end of period 9 143 723 126 370
Page 124
7. ACCOUNTING POLICIES FOR THE YEAR ENDED 31 MARCH 2014
Summary of significant accounting policies
The financial statements have been prepared in accordance with the following policies, which have been applied consistently in all material aspects, unless otherwise indicated.
The historical cost convention has been used, except where otherwise indicated. Management has used assessments and estimates in preparing the annual financial statements. These are based on the best information available at the time of preparation.
Where appropriate and meaningful, additional information has been disclosed to enhance the usefulness of the financial statements and to comply with the statutory requirements of the Public Finance Management Act (PFMA), Act 1 of 1999 (as amended by Act 29 of 1999), and the Treasury Regulations issued in terms of the PFMA and the annual Division of Revenue Act.
1 Basis of preparation The financial statements have been prepared in accordance with the Modified Cash Standard. Under this basis, the effects of transactions and other events are recognised in the financial records
when the resulting cash is received or paid. The “modification” results from the recognition of certain near-cash balances in the financial statements as well as the revaluation of foreign investments and loans and the recognition of resulting revaluation gains and losses.
In addition supplementary information is provided in the disclosure notes to the financial statements where it is deemed to be useful to the users of the financial statements.
2 Going concern The financial statements have been prepared on a going concern basis.
3 Presentation currency Amounts have been presented in the currency of the South African Rand (R) which is also the functional
currency of the department. 4 Rounding Unless otherwise stated financial figures have been rounded to the nearest one thousand Rand
(R’000). 5 Foreign currency translation Cash flows arising from foreign currency transactions are translated into South African Rands using the
exchange rates prevailing at the date of payment / receipt. 6 Current year comparison with budget A comparison between the approved, final budget and actual amounts for each programme and
economic classification is included in the appropriation statement.
7 Revenue 7.1 Appropriated funds Appropriated funds comprises of departmental allocations as well as direct charges against the
revenue fund (i.e. statutory appropriation).
Page 125
Appropriated funds are recognised in the statement of financial performance on the date the appropriation becomes effective. Adjustments made in terms of the adjustments budget process are recognised in the statement of financial performance on the date the adjustments become effective.
The net amount of any appropriated funds due to / from the relevant revenue fund at the reporting date is recognised as a payable / receivable in the statement of financial position.
7.2 Departmental revenue All departmental revenue is recognised in the statement of financial performance when received
and is subsequently paid into the relevant revenue fund, unless stated otherwise.
Any amount owing to the relevant revenue fund at the reporting date is recognised as a payable in the statement of financial position.
7.3 Accrued departmental revenue Accruals in respect of departmental revenue (excluding tax revenue) are recorded in the notes to
the financial statements when:• it is probable that the economic benefits or service potential associated with the transaction will
flow to the department; and• the amount of revenue can be measured reliably.
The accrued revenue is measured at the fair value of the consideration receivable. Accrued tax revenue (and related interest and / penalties) is measured at amounts receivable from
collecting agents. 8 Expenditure
8.1 Compensation of employees 8.1.1 Salaries and wages Salaries and wages are recognised in the statement of financial performance on the date of
payment. 8.1.2 Social contributions Social contributions made by the department in respect of current employees are recognised in
the statement of financial performance on the date of payment.
Social contributions made by the department in respect of ex-employees are classified as transfers to households in the statement of financial performance on the date of payment.
8.2 Other expenditure Other expenditure (such as goods and services, transfers and subsidies and payments for
capital assets) is recognised in the statement of financial performance on the date of payment. The expense is classified as a capital expense if the total consideration paid is more than the capitalisation threshold.
8.3 Accrued expenditure payable Accrued expenditure payable is recorded in the notes to the financial statements when the
goods are received or, in the case of services, when they are rendered to the department. Accrued expenditure payable is measured at cost. 8.4 Leases 8.4.1 Operating leases Operating lease payments made during the reporting period are recognised as current
expenditure in the statement of financial performance on the date of payment. The operating lease commitments are recorded in the notes to the financial statements.
Page 126
9 Aid Assistance 9.1 Aid assistance received Aid assistance received in cash is recognised in the statement of financial performance when
received.In-kind aid assistance is recorded in the notes to the financial statements on the date of receipt and is measured at fair value.
Aid assistance not spent for the intended purpose and any unutilised funds from aid assistance that are required to be refunded to the donor are recognised as a payable in the statement of financial position.
10 Cash and cash equivalents Cash and cash equivalents are stated at cost in the statement of financial position. Bank overdrafts are shown separately on the face of the statement of financial position. For the purposes of the cash flow statement, cash and cash equivalents comprise cash on hand,
deposits held, other short-term highly liquid investments and bank overdrafts. 11 Prepayments and advances Prepayments and advances are recognised in the statement of financial position when the department
receives or disburses the cash. Prepayments and advances are initially and subsequently measured at cost. 12 Loans and receivables Loans and receivables are recognised in the statement of financial position at cost plus accrued interest,
where interest is charged, less amounts already settled or written-off. 13 Investments Investments are recognised in the statement of financial position at cost.
14 Impairment of financial assets Where there is an indication of impairment of a financial asset, an estimation of the reduction in the
recorded carrying value, to reflect the best estimate of the amount of the future economic benefits expected to be received from that asset, is recorded in the notes to the financial statements.
15 Capital Assets
15.1 Movable capital assets Movable capital assets are initially recorded in the notes to the financial statements at cost. Movable
capital assets acquired through a non-exchange transaction is measured at fair value as at the date of acquisition.
Where the cost of movable capital assets cannot be determined accurately, the movable capital assets are measured at fair value and where fair value cannot be determined; the movable assets are measured at R1.
All assets acquired prior to 1 April 2002 (or a later date as approved by the OAG) are recorded at R1. Movable capital assets are subsequently carried at cost and are not subject to depreciation or
impairment. Subsequent expenditure that is of a capital nature is added to the cost of the asset at the end of the
capital project unless the movable asset is recorded by another department/entity in which case the completed project costs are transferred to that department.
15.2 Intangible assets Intangible assets are initially recorded in the notes to the financial statements at cost. Intangible
assets acquired through a non-exchange transaction are measured at fair value as at the date of acquisition.
Internally generated intangible assets are recorded in the notes to the financial statements when the department commences the development phase of the project.
Where the cost of intangible assets cannot be determined accurately, the intangible capital assets are measured at fair value and where fair value cannot be determined; the intangible assets are measured at R1.
Page 127
All assets acquired prior to 1 April 2002 (or a later date as approved by the OAG) are recorded at R1. Intangible assets are subsequently carried at cost and are not subject to depreciation or impairment. Subsequent expenditure that is of a capital nature is added to the cost of the asset at the end of the
capital project unless the intangible asset is recorded by another department/entity in which case the completed project costs are transferred to that department.
16 Contingents
16.1 Provisions Provisions are recorded in the notes to the financial statements when there is a present legal or
constructive obligation to forfeit economic benefits as a result of events in the past and it is probable that an outflow of resources embodying economic benefits or service potential will be required to settle the obligation and a reliable estimate of the obligation can be made. The provision is measured as the best estimate of the funds required to settle the present obligation at the reporting date
16.2 Contingent liabilities Contingent liabilities are recorded in the notes to the financial statements when there is a possible
obligation that arises from past events, and whose existence will be confirmed only by the occurrence or non-occurrence of one or more uncertain future events not within the control of the department or when there is a present obligation that is not recognised because it is not probable that an outflow of resources will be required to settle the obligation or the amount of the obligation cannot be measured reliably.
16.3 Commitments Commitments are recorded at cost in the notes to the financial statements when there is a
contractual arrangement or an approval by management in a manner that raises a valid expectation that the department will discharge its responsibilities thereby incurring future expenditure that will result in the outflow of cash
17 Fruitless and wasteful expenditure Fruitless and wasteful expenditure is recorded in the notes to the financial statements when confirmed.
The amount recorded is equal to the total value of the fruitless and or wasteful expenditure incurred. Fruitless and wasteful expenditure is removed from the notes to the financial statements when it is
resolved or transferred to receivables for recovery. Fruitless and wasteful expenditure receivables are measured at the amount that is expected to be
recoverable and are de-recognised when settled or subsequently written-off as irrecoverable.
18 Irregular expenditure Irregular expenditure is recorded in the notes to the financial statements when confirmed. The amount
recorded is equal to the total value of the irregularity unless it is impracticable to determine, in which case reasons are therefore provided in the note.
Irregular expenditure is removed from the note when it is either condoned by the relevant authority or transferred to receivables for recovery.
Irregular expenditure receivables are measured at the amount that is expected to be recoverable and are de-recognised when settled or subsequently written-off as irrecoverable.
19 Prior period errors The impairment amounts were restated to an impairment loss limited to the cost of investment.
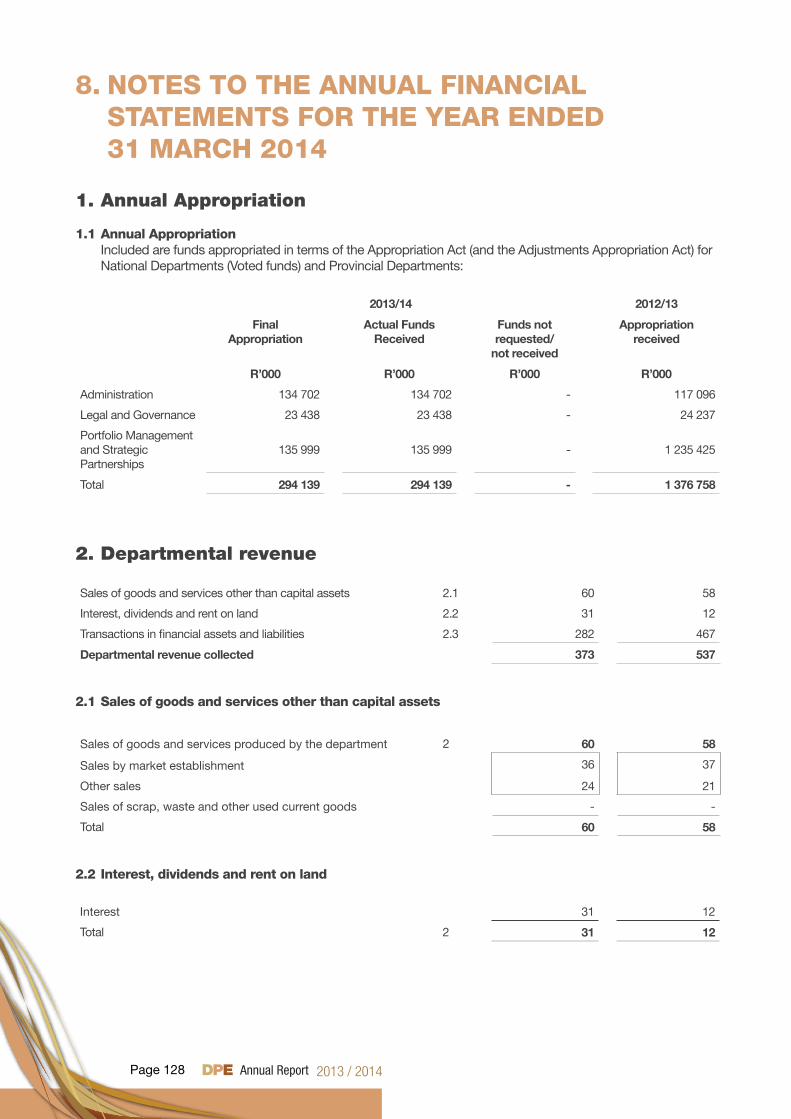
Page 128
8. NOTES TO THE ANNUAL FINANCIAL STATEMENTS FOR THE YEAR ENDED 31 MARCH 2014
1. Annual Appropriation
1.1 Annual Appropriation Included are funds appropriated in terms of the Appropriation Act (and the Adjustments Appropriation Act) for National Departments (Voted funds) and Provincial Departments:
2013/14 2012/13
Final Appropriation
Actual Funds Received
Funds not requested/
not received
Appropriationreceived
R’000 R’000 R’000 R’000
Administration 134 702 134 702 - 117 096
Legal and Governance 23 438 23 438 - 24 237
Portfolio Management and Strategic Partnerships
135 999 135 999 - 1 235 425
Total 294 139 294 139 - 1 376 758
2. Departmental revenue
Sales of goods and services other than capital assets 2.1 60 58
Interest, dividends and rent on land 2.2 31 12
Transactions in financial assets and liabilities 2.3 282 467
Departmental revenue collected 373 537
2.1 Sales of goods and services other than capital assets
Sales of goods and services produced by the department 2 60 58
Sales by market establishment 36 37
Other sales 24 21
Sales of scrap, waste and other used current goods - -
Total 60 58
2.2 Interest, dividends and rent on land
Interest 31 12
Total 2 31 12
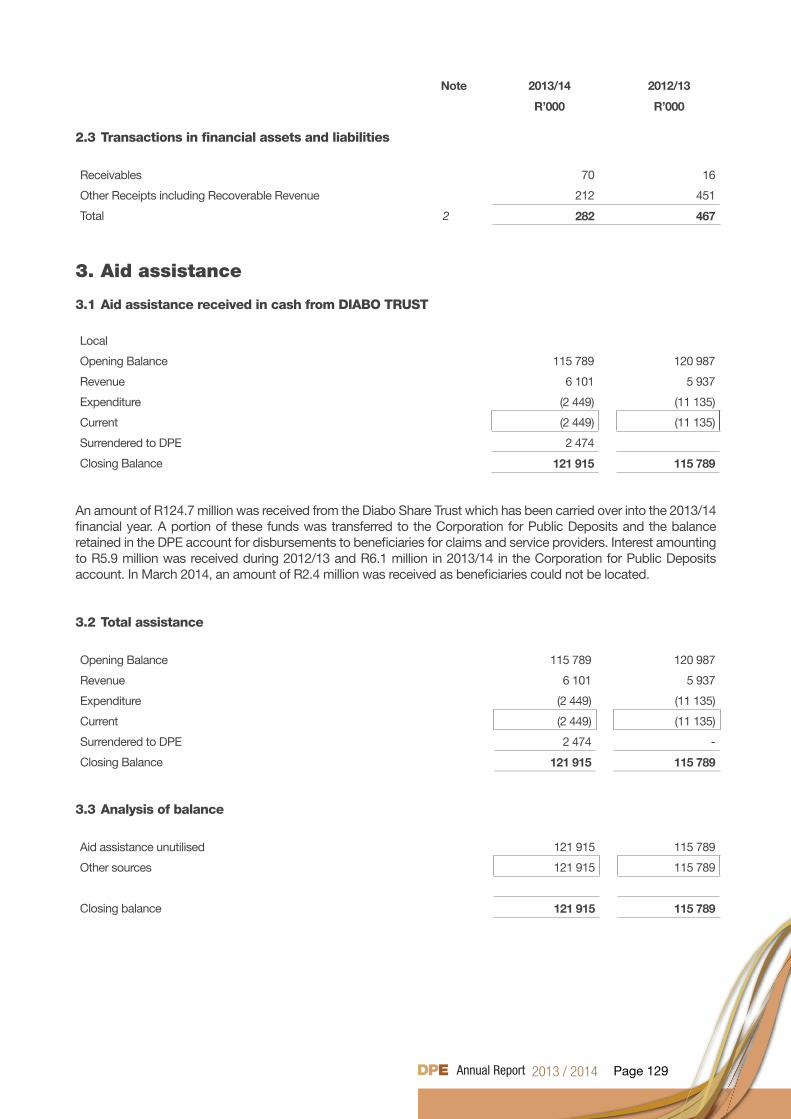
Page 129
Note 2013/14 2012/13
R’000 R’000
2.3 Transactions in financial assets and liabilities
Receivables 70 16
Other Receipts including Recoverable Revenue 212 451
Total 2 282 467
3. Aid assistance
3.1 Aid assistance received in cash from DIABO TRUST
Local
Opening Balance 115 789 120 987
Revenue 6 101 5 937
Expenditure (2 449) (11 135)
Current (2 449) (11 135)
Surrendered to DPE 2 474
Closing Balance 121 915 115 789
An amount of R124.7 million was received from the Diabo Share Trust which has been carried over into the 2013/14 financial year. A portion of these funds was transferred to the Corporation for Public Deposits and the balance retained in the DPE account for disbursements to beneficiaries for claims and service providers. Interest amounting to R5.9 million was received during 2012/13 and R6.1 million in 2013/14 in the Corporation for Public Deposits account. In March 2014, an amount of R2.4 million was received as beneficiaries could not be located.
3.2 Total assistance
Opening Balance 115 789 120 987
Revenue 6 101 5 937
Expenditure (2 449) (11 135)
Current (2 449) (11 135)
Surrendered to DPE 2 474 -
Closing Balance 121 915 115 789
3.3 Analysis of balance
Aid assistance unutilised 121 915 115 789
Other sources 121 915 115 789
Closing balance 121 915 115 789
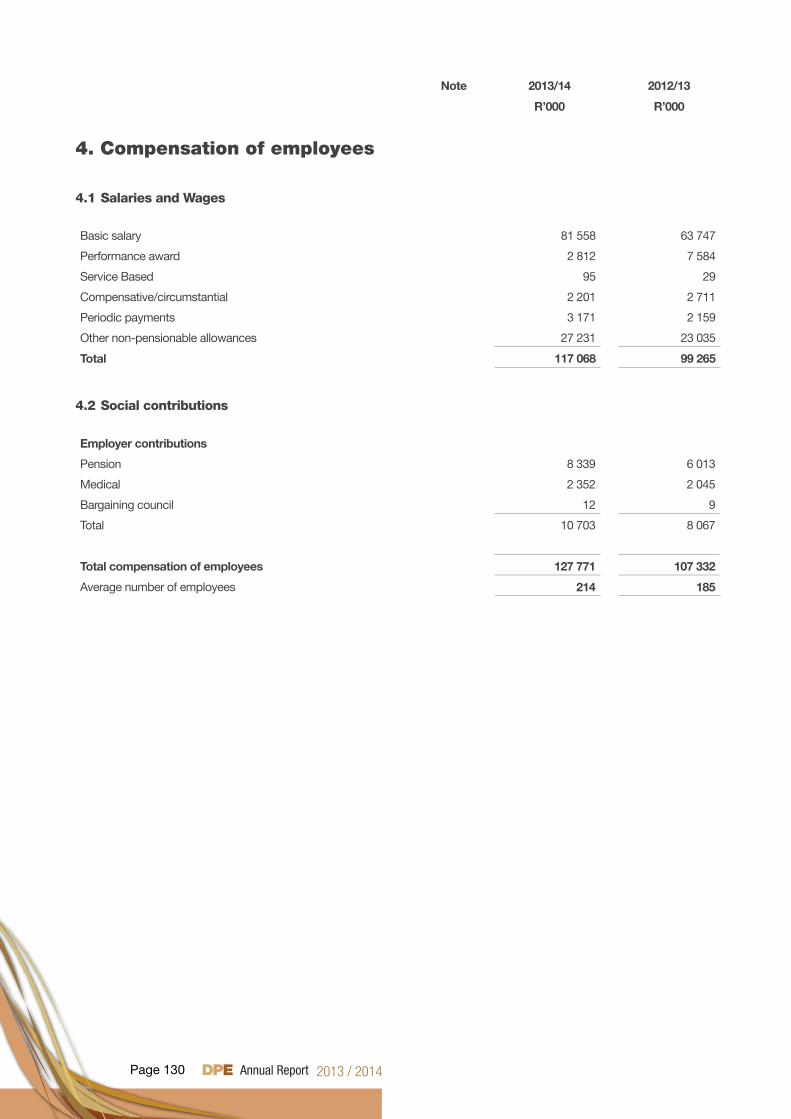
Page 130
Note 2013/14 2012/13
R’000 R’000
4. Compensation of employees
4.1 Salaries and Wages
Basic salary 81 558 63 747
Performance award 2 812 7 584
Service Based 95 29
Compensative/circumstantial 2 201 2 711
Periodic payments 3 171 2 159
Other non-pensionable allowances 27 231 23 035
Total 117 068 99 265
4.2 Social contributions
Employer contributions
Pension 8 339 6 013
Medical 2 352 2 045
Bargaining council 12 9
Total 10 703 8 067
Total compensation of employees 127 771 107 332
Average number of employees 214 185
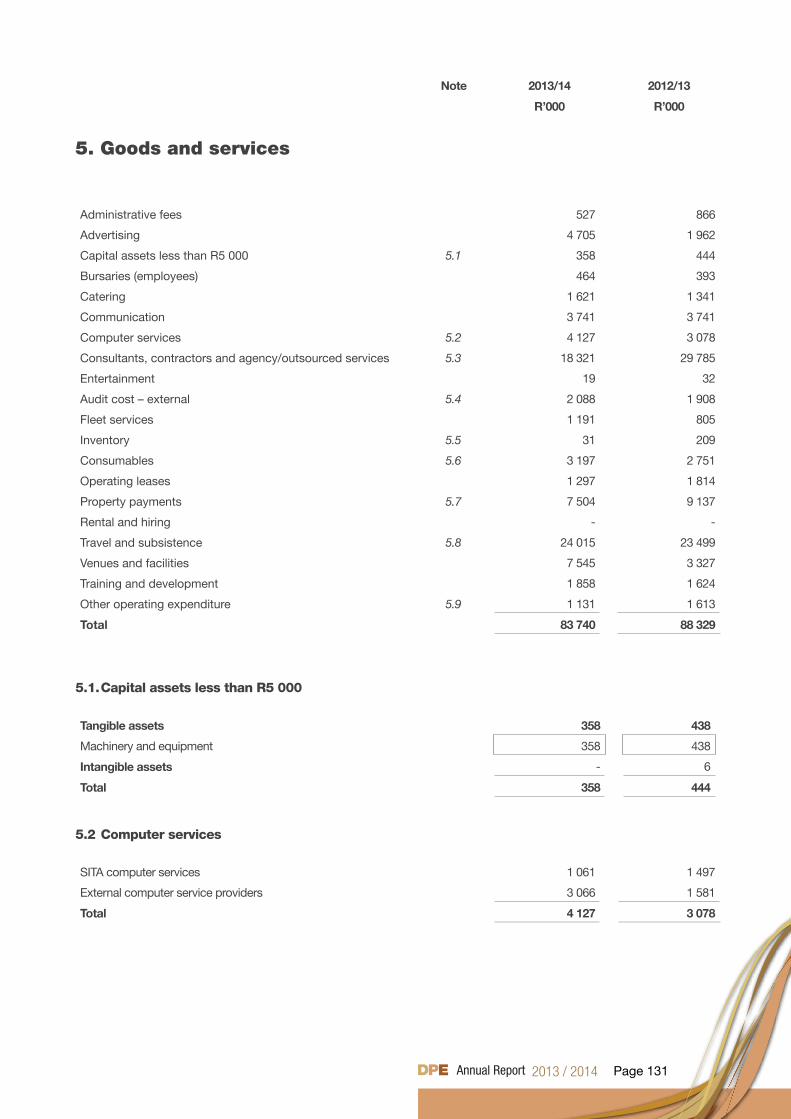
Page 131
Note 2013/14 2012/13
R’000 R’000
5. Goods and services
Administrative fees 527 866
Advertising 4 705 1 962
Capital assets less than R5 000 5.1 358 444
Bursaries (employees) 464 393
Catering 1 621 1 341
Communication 3 741 3 741
Computer services 5.2 4 127 3 078
Consultants, contractors and agency/outsourced services 5.3 18 321 29 785
Entertainment 19 32
Audit cost – external 5.4 2 088 1 908
Fleet services 1 191 805
Inventory 5.5 31 209
Consumables 5.6 3 197 2 751
Operating leases 1 297 1 814
Property payments 5.7 7 504 9 137
Rental and hiring - -
Travel and subsistence 5.8 24 015 23 499
Venues and facilities 7 545 3 327
Training and development 1 858 1 624
Other operating expenditure 5.9 1 131 1 613
Total 83 740 88 329
5.1. Capital assets less than R5 000
Tangible assets 358 438
Machinery and equipment 358 438
Intangible assets - 6
Total 358 444
5.2 Computer services
SITA computer services 1 061 1 497
External computer service providers 3 066 1 581
Total 4 127 3 078
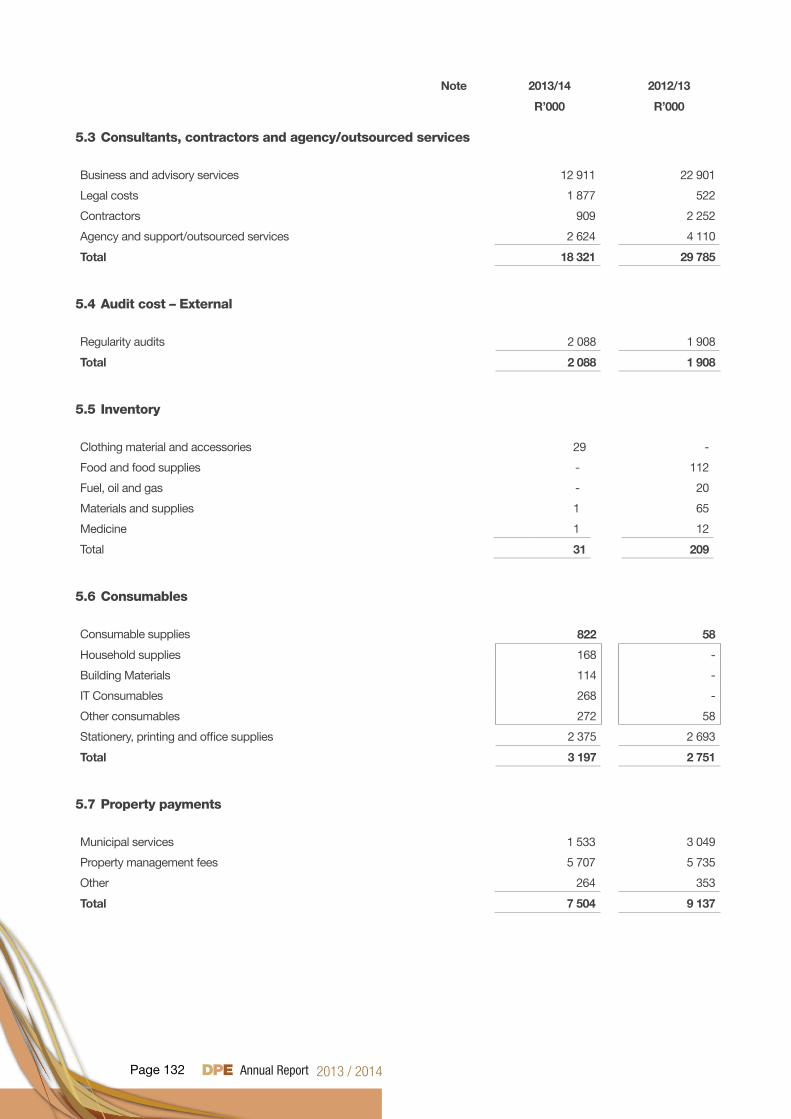
Page 132
Note 2013/14 2012/13
R’000 R’000
5.3 Consultants, contractors and agency/outsourced services
Business and advisory services 12 911 22 901
Legal costs 1 877 522
Contractors 909 2 252
Agency and support/outsourced services 2 624 4 110
Total 18 321 29 785
5.4 Audit cost – External
Regularity audits 2 088 1 908
Total 2 088 1 908
5.5 Inventory
Clothing material and accessories 29 -
Food and food supplies - 112
Fuel, oil and gas - 20
Materials and supplies 1 65
Medicine 1 12
Total 31 209
5.6 Consumables
Consumable supplies 822 58
Household supplies 168 -
Building Materials 114 -
IT Consumables 268 -
Other consumables 272 58
Stationery, printing and office supplies 2 375 2 693
Total 3 197 2 751
5.7 Property payments
Municipal services 1 533 3 049
Property management fees 5 707 5 735
Other 264 353
Total 7 504 9 137
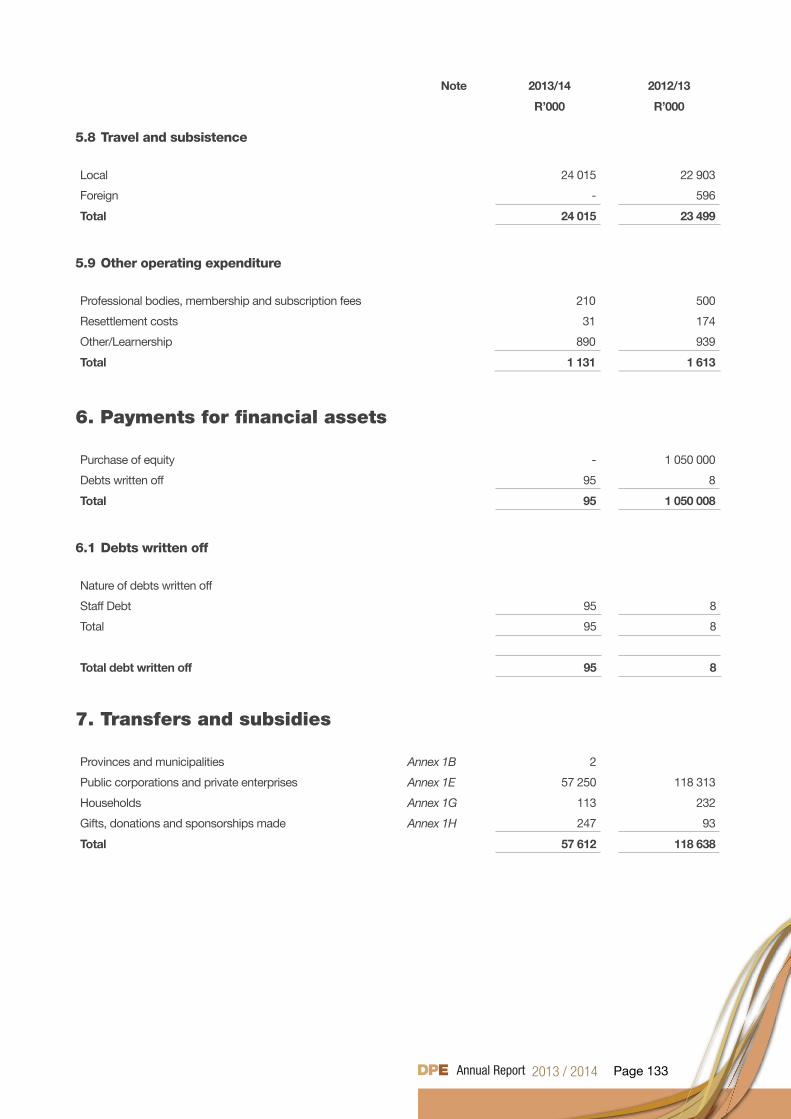
Page 133
Note 2013/14 2012/13
R’000 R’000
5.8 Travel and subsistence
Local 24 015 22 903
Foreign - 596
Total 24 015 23 499
5.9 Other operating expenditure
Professional bodies, membership and subscription fees 210 500
Resettlement costs 31 174
Other/Learnership 890 939
Total 1 131 1 613
6. Payments for financial assets
Purchase of equity - 1 050 000
Debts written off 95 8
Total 95 1 050 008
6.1 Debts written off
Nature of debts written off
Staff Debt 95 8
Total 95 8
Total debt written off 95 8
7. Transfers and subsidies
Provinces and municipalities Annex 1B 2
Public corporations and private enterprises Annex 1E 57 250 118 313
Households Annex 1G 113 232
Gifts, donations and sponsorships made Annex 1H 247 93
Total 57 612 118 638
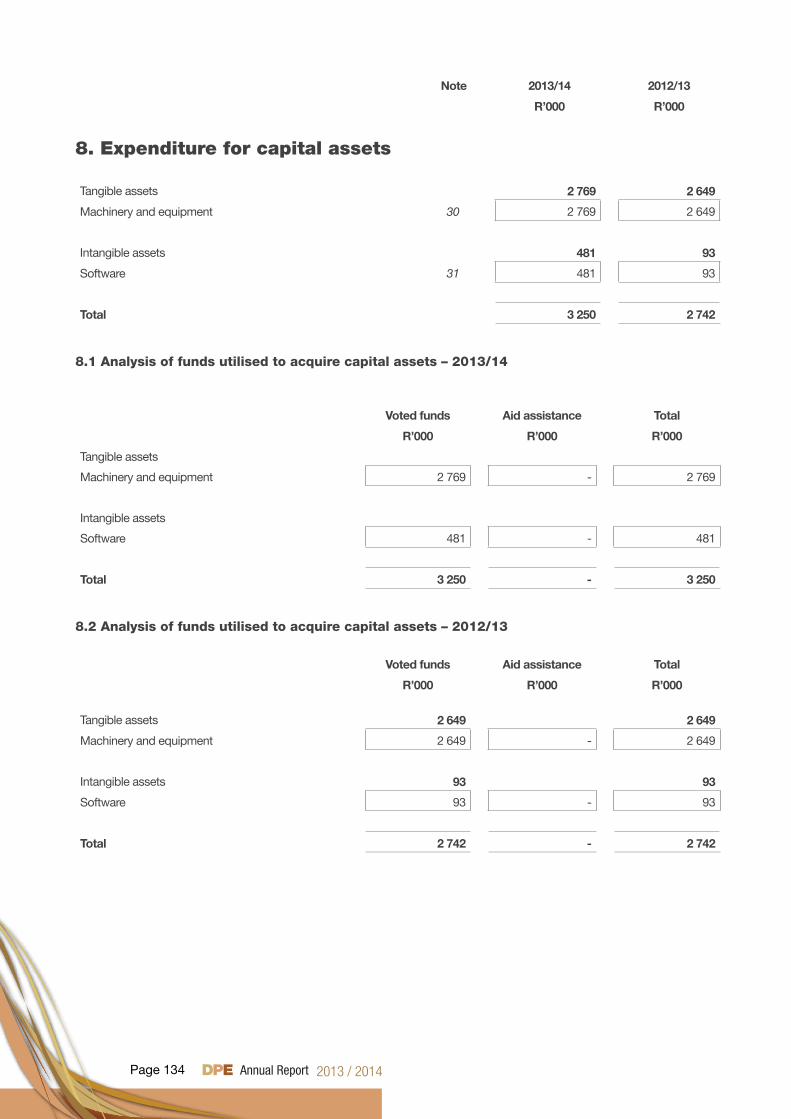
Page 134
Note 2013/14 2012/13
R’000 R’000
8. Expenditure for capital assets
Tangible assets 2 769 2 649
Machinery and equipment 30 2 769 2 649
Intangible assets 481 93
Software 31 481 93
Total 3 250 2 742
8.1 Analysis of funds utilised to acquire capital assets – 2013/14
Voted funds Aid assistance Total
R’000 R’000 R’000
Tangible assets
Machinery and equipment 2 769 - 2 769
Intangible assets
Software 481 - 481
Total 3 250 - 3 250
8.2 Analysis of funds utilised to acquire capital assets – 2012/13
Voted funds Aid assistance Total
R’000 R’000 R’000
Tangible assets 2 649 2 649
Machinery and equipment 2 649 - 2 649
Intangible assets 93 93
Software 93 - 93
Total 2 742 - 2 742
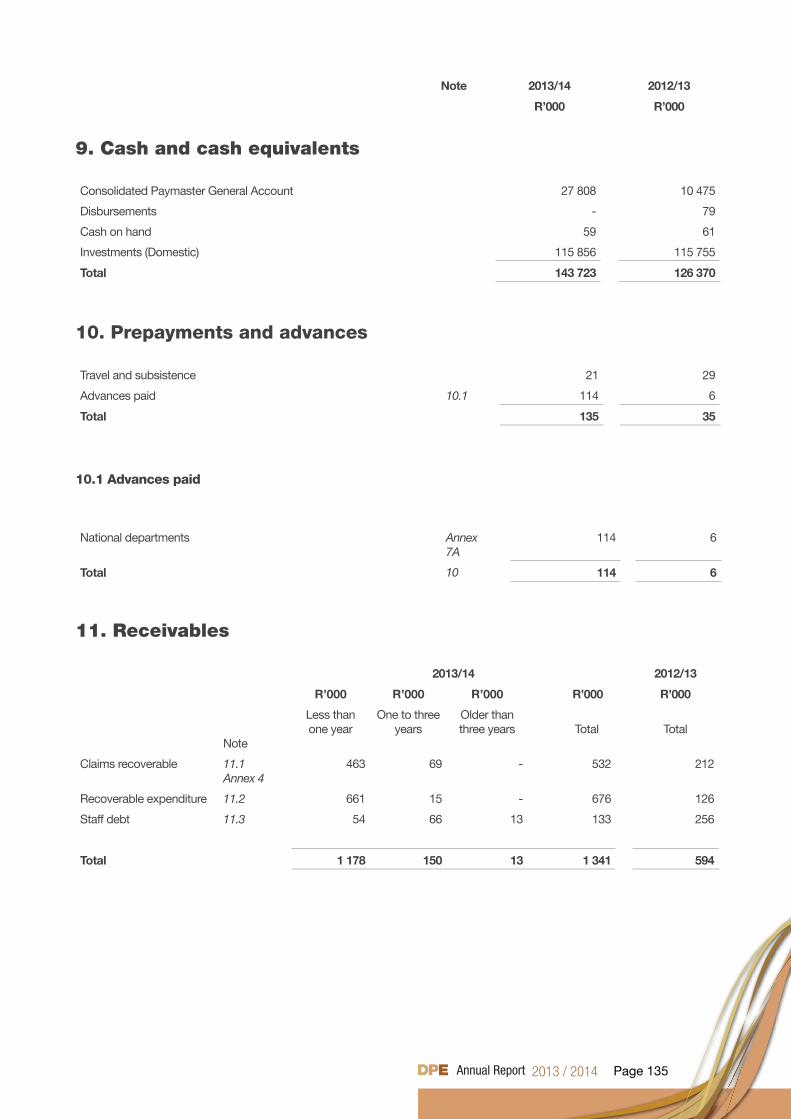
Page 135
Note 2013/14 2012/13
R’000 R’000
9. Cash and cash equivalents
Consolidated Paymaster General Account 27 808 10 475
Disbursements - 79
Cash on hand 59 61
Investments (Domestic) 115 856 115 755
Total 143 723 126 370
10. Prepayments and advances
Travel and subsistence 21 29
Advances paid 10.1 114 6
Total 135 35
10.1 Advances paid
National departments Annex7A
114 6
Total 10 114 6
11. Receivables
2013/14 2012/13
R’000 R’000 R’000 R’000 R’000
Note
Less than one year
One to three years
Older than three years Total Total
Claims recoverable 11.1Annex 4
463 69 - 532 212
Recoverable expenditure 11.2 661 15 - 676 126
Staff debt 11.3 54 66 13 133 256
Total 1 178 150 13 1 341 594
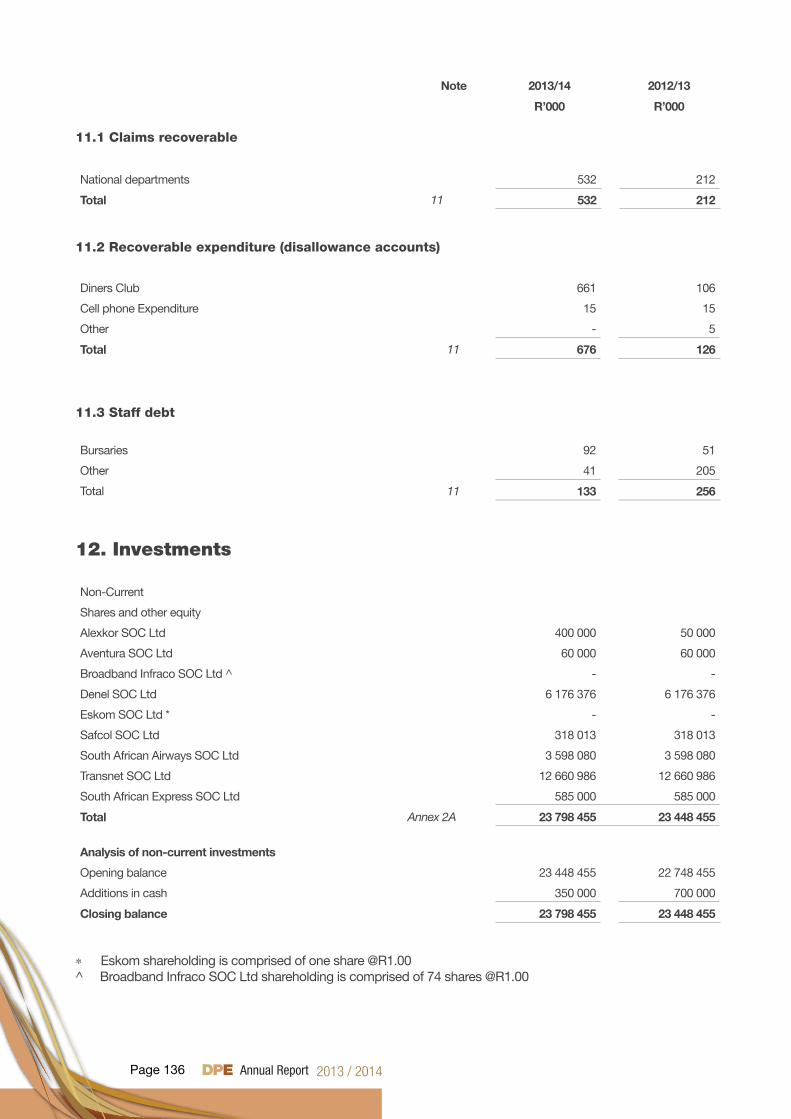
Page 136
Note 2013/14 2012/13
R’000 R’000
11.1 Claims recoverable
National departments 532 212
Total 11 532 212
11.2 Recoverable expenditure (disallowance accounts)
Diners Club 661 106
Cell phone Expenditure 15 15
Other - 5
Total 11 676 126
11.3 Staff debt
Bursaries 92 51
Other 41 205
Total 11 133 256
12. Investments
Non-Current
Shares and other equity
Alexkor SOC Ltd 400 000 50 000
Aventura SOC Ltd 60 000 60 000
Broadband Infraco SOC Ltd ^ - -
Denel SOC Ltd 6 176 376 6 176 376
Eskom SOC Ltd * - -
Safcol SOC Ltd 318 013 318 013
South African Airways SOC Ltd 3 598 080 3 598 080
Transnet SOC Ltd 12 660 986 12 660 986
South African Express SOC Ltd 585 000 585 000
Total Annex 2A 23 798 455 23 448 455
Analysis of non-current investments
Opening balance 23 448 455 22 748 455
Additions in cash 350 000 700 000
Closing balance 23 798 455 23 448 455
* Eskom shareholding is comprised of one share @R1.00^ Broadband Infraco SOC Ltd shareholding is comprised of 74 shares @R1.00
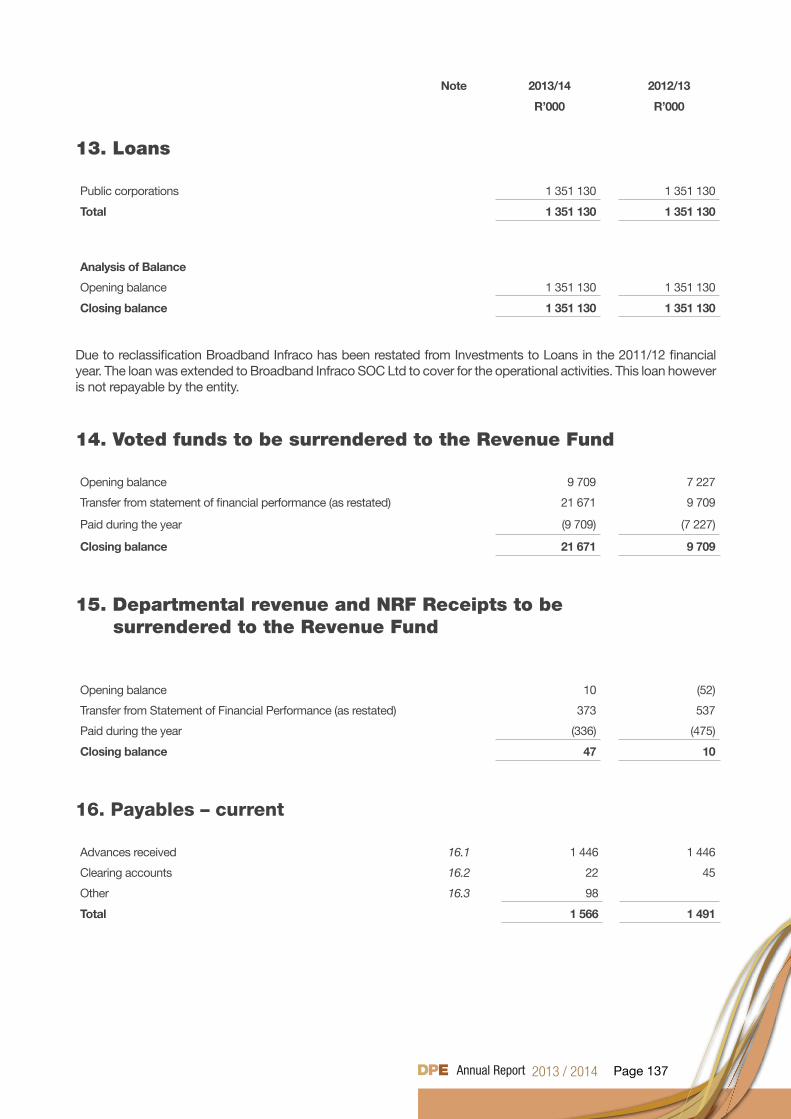
Page 137
Note 2013/14 2012/13
R’000 R’000
13. Loans
Public corporations 1 351 130 1 351 130
Total 1 351 130 1 351 130
Analysis of Balance
Opening balance 1 351 130 1 351 130
Closing balance 1 351 130 1 351 130
Due to reclassification Broadband Infraco has been restated from Investments to Loans in the 2011/12 financial year. The loan was extended to Broadband Infraco SOC Ltd to cover for the operational activities. This loan however is not repayable by the entity.
14. Voted funds to be surrendered to the Revenue Fund
Opening balance 9 709 7 227
Transfer from statement of financial performance (as restated) 21 671 9 709
Paid during the year (9 709) (7 227)
Closing balance 21 671 9 709
15. Departmental revenue and NRF Receipts to be surrendered to the Revenue Fund
Opening balance 10 (52)
Transfer from Statement of Financial Performance (as restated) 373 537
Paid during the year (336) (475)
Closing balance 47 10
16. Payables – current
Advances received 16.1 1 446 1 446
Clearing accounts 16.2 22 45
Other 16.3 98
Total 1 566 1 491
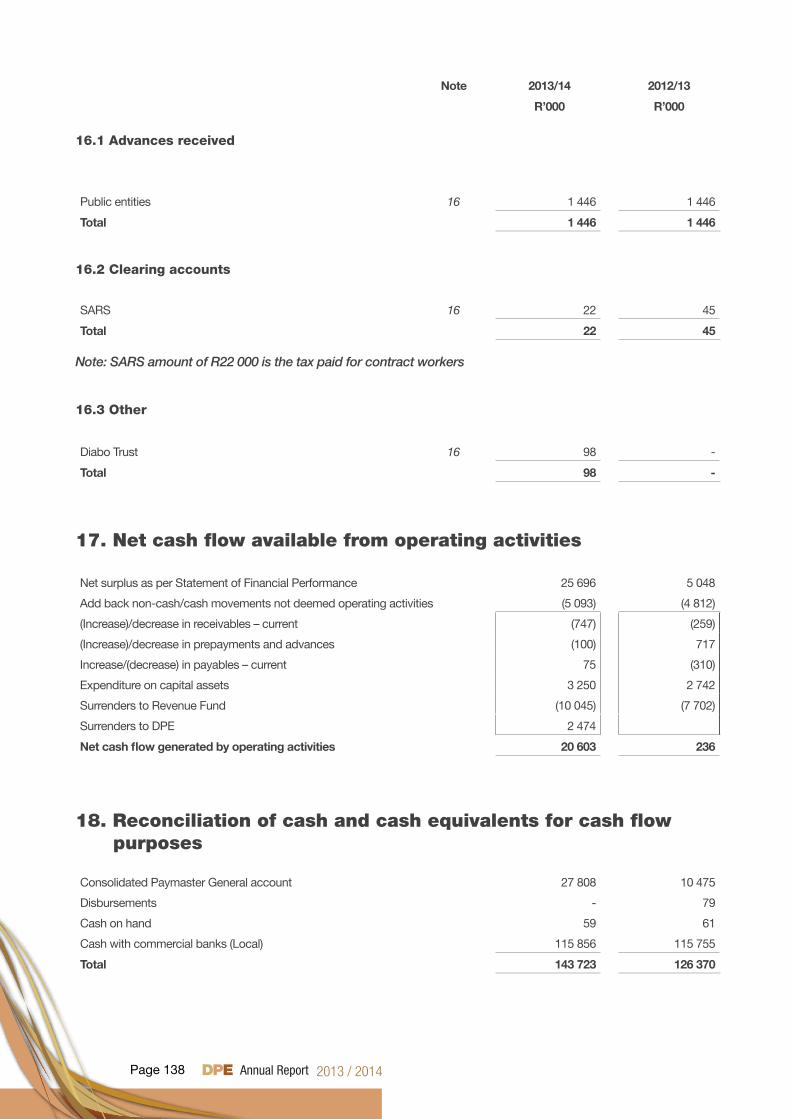
Page 138
Note 2013/14 2012/13
R’000 R’000
16.1 Advances received
Public entities 16 1 446 1 446
Total 1 446 1 446
16.2 Clearing accounts
SARS 16 22 45
Total 22 45
Note: SARS amount of R22 000 is the tax paid for contract workers
16.3 Other
Diabo Trust 16 98 -
Total 98 -
17. Net cash flow available from operating activities
Net surplus as per Statement of Financial Performance 25 696 5 048
Add back non-cash/cash movements not deemed operating activities (5 093) (4 812)
(Increase)/decrease in receivables – current (747) (259)
(Increase)/decrease in prepayments and advances (100) 717
Increase/(decrease) in payables – current 75 (310)
Expenditure on capital assets 3 250 2 742
Surrenders to Revenue Fund (10 045) (7 702)
Surrenders to DPE 2 474
Net cash flow generated by operating activities 20 603 236
18. Reconciliation of cash and cash equivalents for cash flow purposes
Consolidated Paymaster General account 27 808 10 475
Disbursements - 79
Cash on hand 59 61
Cash with commercial banks (Local) 115 856 115 755
Total 143 723 126 370
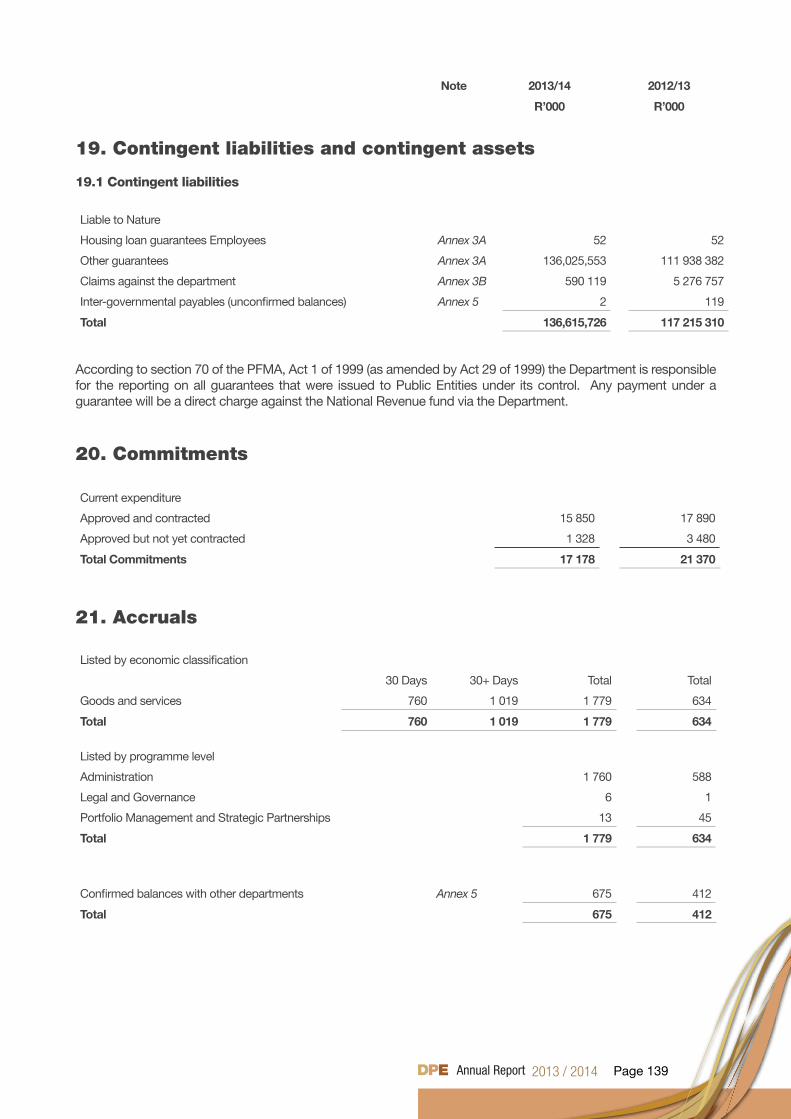
Page 139
Note 2013/14 2012/13
R’000 R’000
19. Contingent liabilities and contingent assets
19.1 Contingent liabilities
Liable to Nature
Housing loan guarantees Employees Annex 3A 52 52
Other guarantees Annex 3A 136,025,553 111 938 382
Claims against the department Annex 3B 590 119 5 276 757
Inter-governmental payables (unconfirmed balances) Annex 5 2 119
Total 136,615,726 117 215 310
According to section 70 of the PFMA, Act 1 of 1999 (as amended by Act 29 of 1999) the Department is responsible for the reporting on all guarantees that were issued to Public Entities under its control. Any payment under a guarantee will be a direct charge against the National Revenue fund via the Department.
20. Commitments
Current expenditure
Approved and contracted 15 850 17 890
Approved but not yet contracted 1 328 3 480
Total Commitments 17 178 21 370
21. Accruals
Listed by economic classification
30 Days 30+ Days Total Total
Goods and services 760 1 019 1 779 634
Total 760 1 019 1 779 634
Listed by programme level
Administration 1 760 588
Legal and Governance 6 1
Portfolio Management and Strategic Partnerships 13 45
Total 1 779 634
Confirmed balances with other departments Annex 5 675 412
Total 675 412
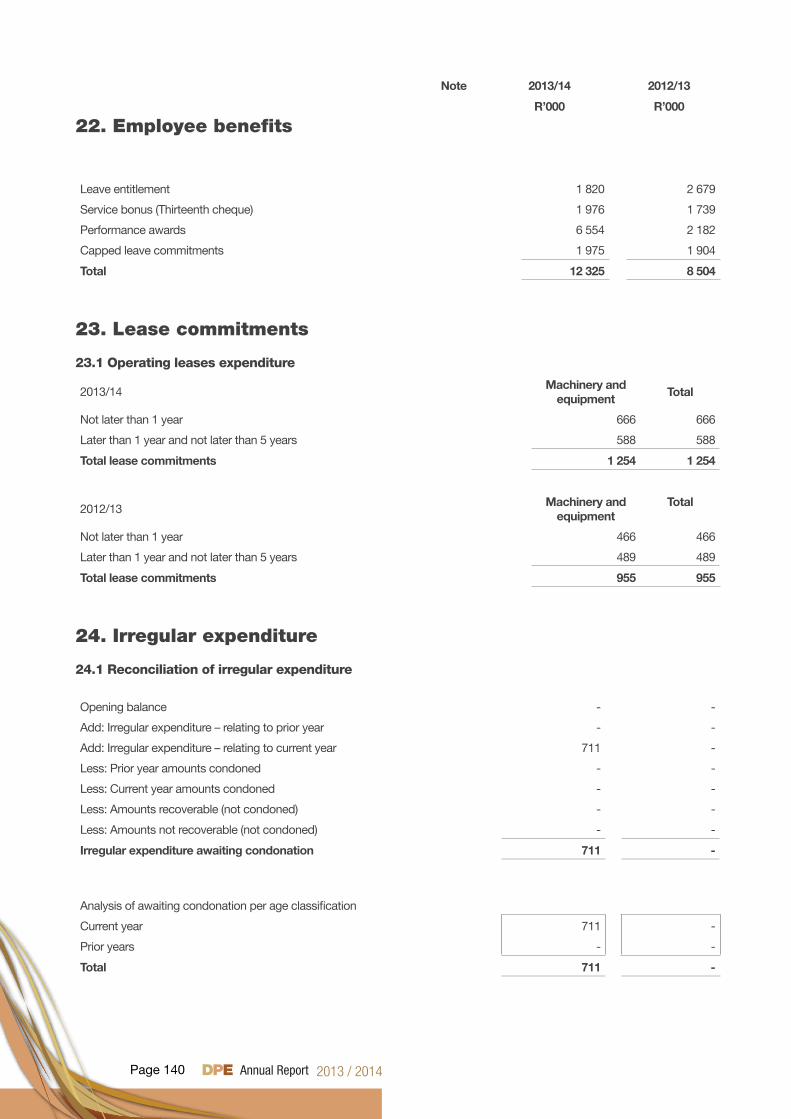
Page 140
Note 2013/14 2012/13
R’000 R’000
22. Employee benefits
Leave entitlement 1 820 2 679
Service bonus (Thirteenth cheque) 1 976 1 739
Performance awards 6 554 2 182
Capped leave commitments 1 975 1 904
Total 12 325 8 504
23. Lease commitments
23.1 Operating leases expenditure
2013/14Machinery and
equipmentTotal
Not later than 1 year 666 666
Later than 1 year and not later than 5 years 588 588
Total lease commitments 1 254 1 254
2012/13Machinery and
equipmentTotal
Not later than 1 year 466 466
Later than 1 year and not later than 5 years 489 489
Total lease commitments 955 955
24. Irregular expenditure
24.1 Reconciliation of irregular expenditure
Opening balance - -
Add: Irregular expenditure – relating to prior year - -
Add: Irregular expenditure – relating to current year 711 -
Less: Prior year amounts condoned - -
Less: Current year amounts condoned - -
Less: Amounts recoverable (not condoned) - -
Less: Amounts not recoverable (not condoned) - -
Irregular expenditure awaiting condonation 711 -
Analysis of awaiting condonation per age classification
Current year 711 -
Prior years - -
Total 711 -
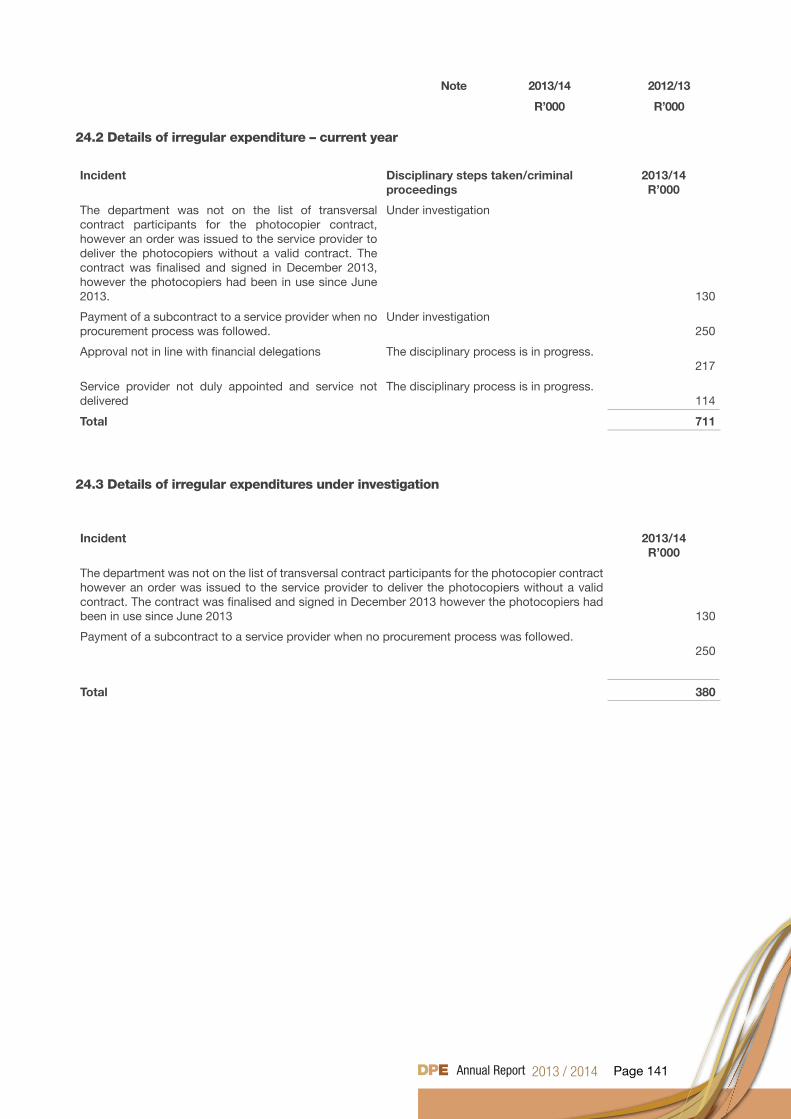
Page 141
Note 2013/14 2012/13
R’000 R’000
24.2 Details of irregular expenditure – current year
Incident Disciplinary steps taken/criminal proceedings
2013/14R’000
The department was not on the list of transversal contract participants for the photocopier contract, however an order was issued to the service provider to deliver the photocopiers without a valid contract. The contract was finalised and signed in December 2013, however the photocopiers had been in use since June 2013.
Under investigation
130
Payment of a subcontract to a service provider when no procurement process was followed.
Under investigation250
Approval not in line with financial delegations The disciplinary process is in progress.217
Service provider not duly appointed and service not delivered
The disciplinary process is in progress.114
Total 711
24.3 Details of irregular expenditures under investigation
Incident 2013/14R’000
The department was not on the list of transversal contract participants for the photocopier contract however an order was issued to the service provider to deliver the photocopiers without a valid contract. The contract was finalised and signed in December 2013 however the photocopiers had been in use since June 2013 130
Payment of a subcontract to a service provider when no procurement process was followed.250
Total 380
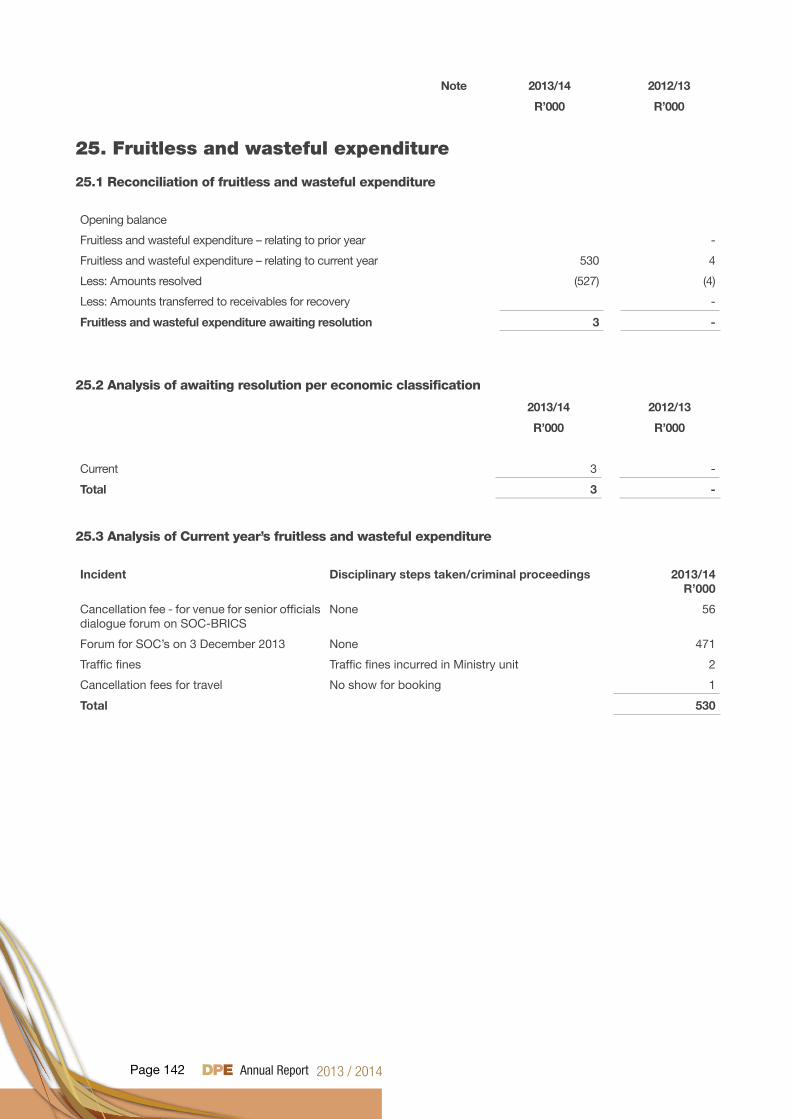
Page 142
Note 2013/14 2012/13
R’000 R’000
25. Fruitless and wasteful expenditure
25.1 Reconciliation of fruitless and wasteful expenditure
Opening balance
Fruitless and wasteful expenditure – relating to prior year -
Fruitless and wasteful expenditure – relating to current year 530 4
Less: Amounts resolved (527) (4)
Less: Amounts transferred to receivables for recovery -
Fruitless and wasteful expenditure awaiting resolution 3 -
25.2 Analysis of awaiting resolution per economic classification
2013/14 2012/13
R’000 R’000
Current 3 -
Total 3 -
25.3 Analysis of Current year’s fruitless and wasteful expenditure
Incident Disciplinary steps taken/criminal proceedings 2013/14R’000
Cancellation fee - for venue for senior officials dialogue forum on SOC-BRICS
None 56
Forum for SOC’s on 3 December 2013 None 471
Traffic fines Traffic fines incurred in Ministry unit 2
Cancellation fees for travel No show for booking 1
Total 530
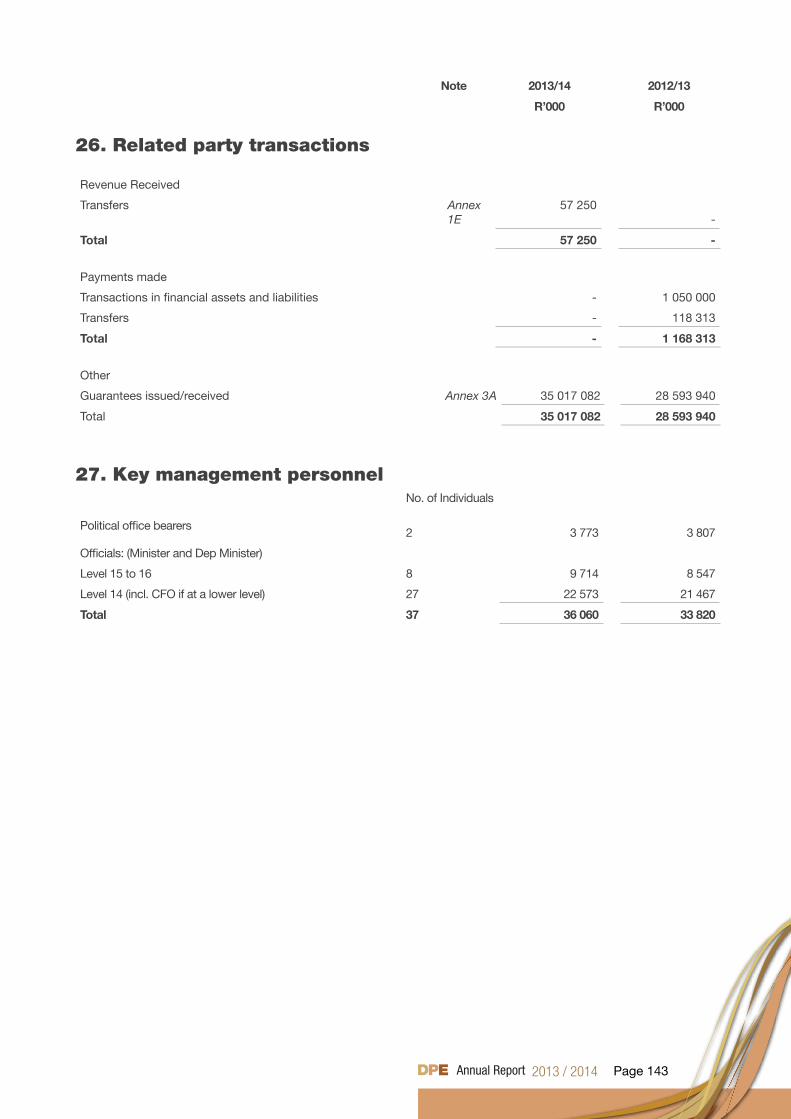
Page 143
Note 2013/14 2012/13
R’000 R’000
26. Related party transactions
Revenue Received
Transfers Annex 1E
57 250-
Total 57 250 -
Payments made
Transactions in financial assets and liabilities - 1 050 000
Transfers - 118 313
Total - 1 168 313
Other
Guarantees issued/received Annex 3A 35 017 082 28 593 940
Total 35 017 082 28 593 940
27. Key management personnelNo. of Individuals
Political office bearers 2 3 773 3 807
Officials: (Minister and Dep Minister)
Level 15 to 16 8 9 714 8 547
Level 14 (incl. CFO if at a lower level) 27 22 573 21 467
Total 37 36 060 33 820
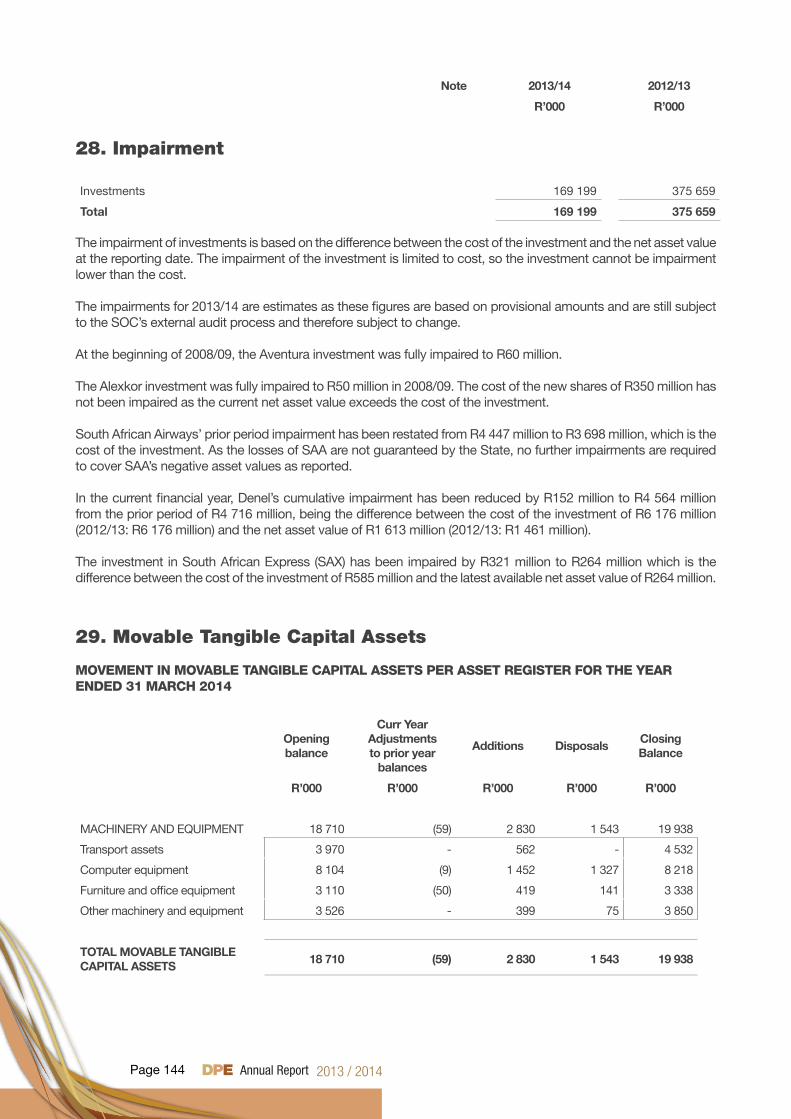
Page 144
Note 2013/14 2012/13
R’000 R’000
28. Impairment
Investments 169 199 375 659
Total 169 199 375 659
The impairment of investments is based on the difference between the cost of the investment and the net asset value at the reporting date. The impairment of the investment is limited to cost, so the investment cannot be impairment lower than the cost.
The impairments for 2013/14 are estimates as these figures are based on provisional amounts and are still subject to the SOC’s external audit process and therefore subject to change.
At the beginning of 2008/09, the Aventura investment was fully impaired to R60 million.
The Alexkor investment was fully impaired to R50 million in 2008/09. The cost of the new shares of R350 million has not been impaired as the current net asset value exceeds the cost of the investment.
South African Airways’ prior period impairment has been restated from R4 447 million to R3 698 million, which is the cost of the investment. As the losses of SAA are not guaranteed by the State, no further impairments are required to cover SAA’s negative asset values as reported.
In the current financial year, Denel’s cumulative impairment has been reduced by R152 million to R4 564 million from the prior period of R4 716 million, being the difference between the cost of the investment of R6 176 million (2012/13: R6 176 million) and the net asset value of R1 613 million (2012/13: R1 461 million).
The investment in South African Express (SAX) has been impaired by R321 million to R264 million which is the difference between the cost of the investment of R585 million and the latest available net asset value of R264 million.
29. Movable Tangible Capital Assets
MOVEMENT IN MOVABLE TANGIBLE CAPITAL ASSETS PER ASSET REGISTER FOR THE YEAR ENDED 31 MARCH 2014
Opening balance
Curr Year Adjustments to prior year
balances
Additions DisposalsClosing Balance
R’000 R’000 R’000 R’000 R’000
MACHINERY AND EQUIPMENT 18 710 (59) 2 830 1 543 19 938
Transport assets 3 970 - 562 - 4 532
Computer equipment 8 104 (9) 1 452 1 327 8 218
Furniture and office equipment 3 110 (50) 419 141 3 338
Other machinery and equipment 3 526 - 399 75 3 850
TOTAL MOVABLE TANGIBLE CAPITAL ASSETS
18 710 (59) 2 830 1 543 19 938
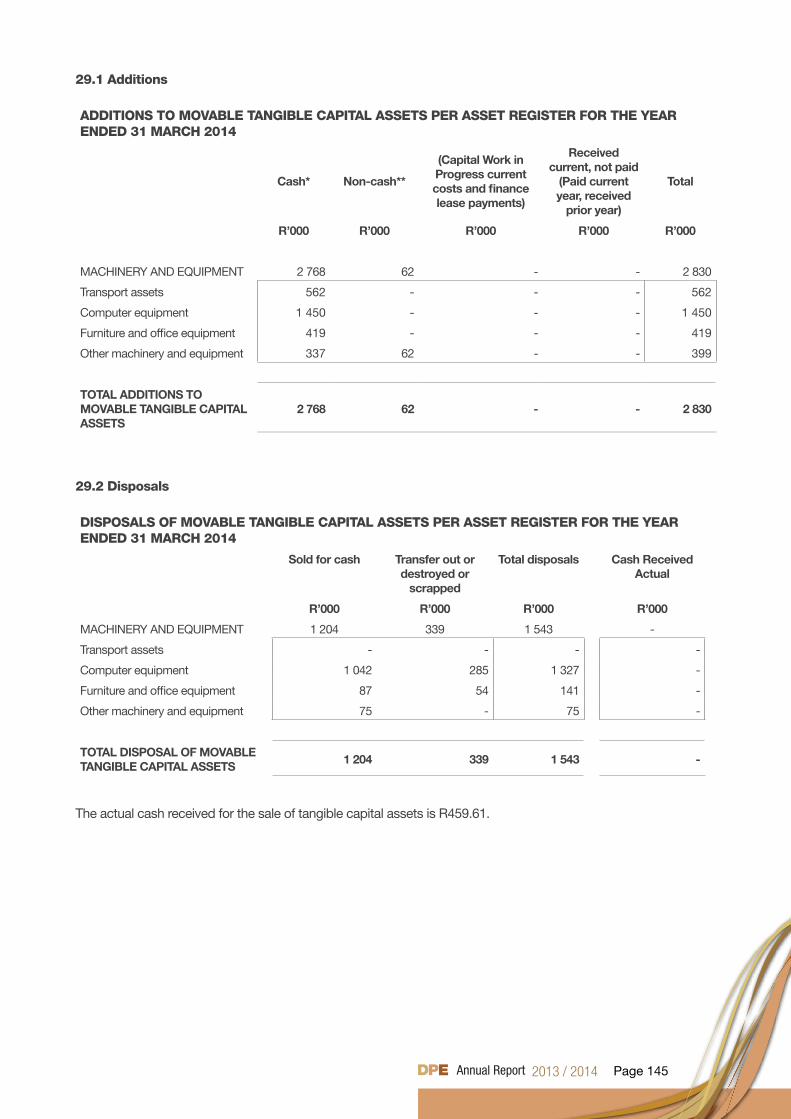
Page 145
29.1 Additions
ADDITIONS TO MOVABLE TANGIBLE CAPITAL ASSETS PER ASSET REGISTER FOR THE YEAR ENDED 31 MARCH 2014
Cash* Non-cash**
(Capital Work in Progress current costs and finance lease payments)
Received current, not paid
(Paid current year, received
prior year)
Total
R’000 R’000 R’000 R’000 R’000
MACHINERY AND EQUIPMENT 2 768 62 - - 2 830
Transport assets 562 - - - 562
Computer equipment 1 450 - - - 1 450
Furniture and office equipment 419 - - - 419
Other machinery and equipment 337 62 - - 399
TOTAL ADDITIONS TO MOVABLE TANGIBLE CAPITAL ASSETS
2 768 62 - - 2 830
29.2 Disposals
DISPOSALS OF MOVABLE TANGIBLE CAPITAL ASSETS PER ASSET REGISTER FOR THE YEAR ENDED 31 MARCH 2014
Sold for cash Transfer out or destroyed or
scrapped
Total disposals Cash Received Actual
R’000 R’000 R’000 R’000
MACHINERY AND EQUIPMENT 1 204 339 1 543 -
Transport assets - - - -
Computer equipment 1 042 285 1 327 -
Furniture and office equipment 87 54 141 -
Other machinery and equipment 75 - 75 -
TOTAL DISPOSAL OF MOVABLE TANGIBLE CAPITAL ASSETS
1 204 339 1 543 -
The actual cash received for the sale of tangible capital assets is R459.61.
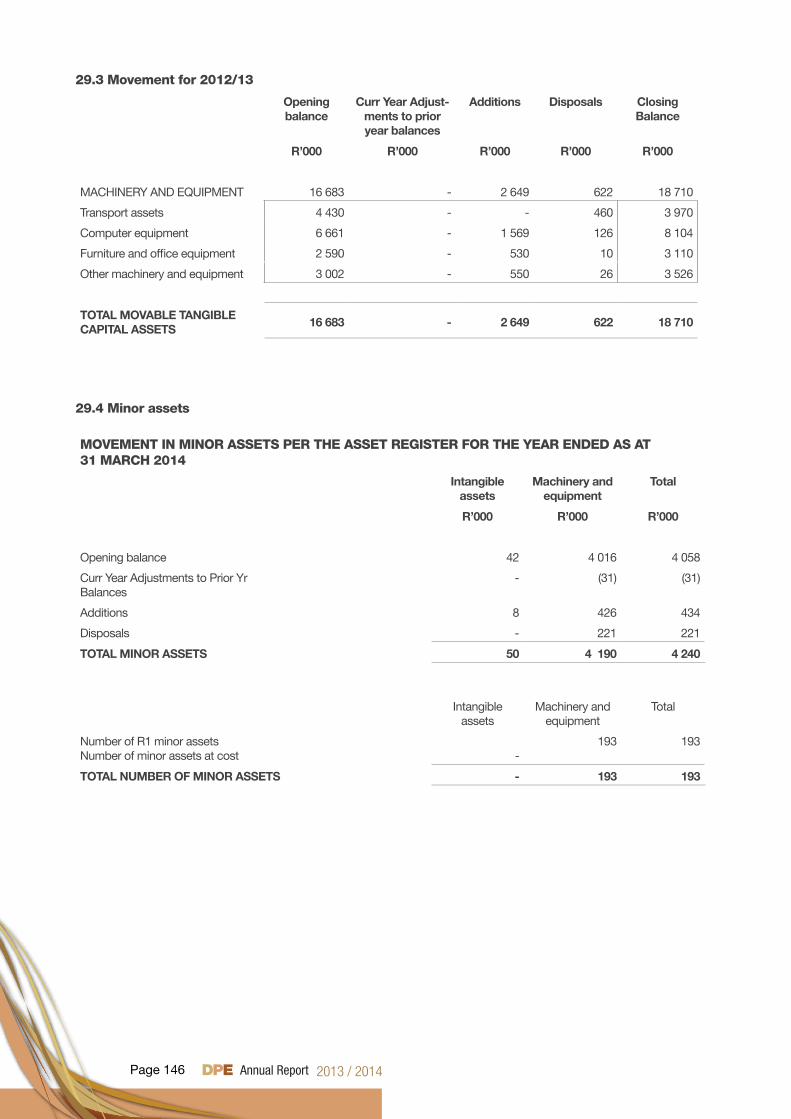
Page 146
29.3 Movement for 2012/13
Opening balance
Curr Year Adjust-ments to prior year balances
Additions Disposals Closing Balance
R’000 R’000 R’000 R’000 R’000
MACHINERY AND EQUIPMENT 16 683 - 2 649 622 18 710
Transport assets 4 430 - - 460 3 970
Computer equipment 6 661 - 1 569 126 8 104
Furniture and office equipment 2 590 - 530 10 3 110
Other machinery and equipment 3 002 - 550 26 3 526
TOTAL MOVABLE TANGIBLE CAPITAL ASSETS
16 683 - 2 649 622 18 710
29.4 Minor assets
MOVEMENT IN MINOR ASSETS PER THE ASSET REGISTER FOR THE YEAR ENDED AS AT 31 MARCH 2014
Intangible assets
Machinery and equipment
Total
R’000 R’000 R’000
Opening balance 42 4 016 4 058
Curr Year Adjustments to Prior Yr Balances
- (31) (31)
Additions 8 426 434
Disposals - 221 221
TOTAL MINOR ASSETS 50 4 190 4 240
Intangible assets
Machinery and equipment
Total
Number of R1 minor assetsNumber of minor assets at cost -
193 193
TOTAL NUMBER OF MINOR ASSETS - 193 193
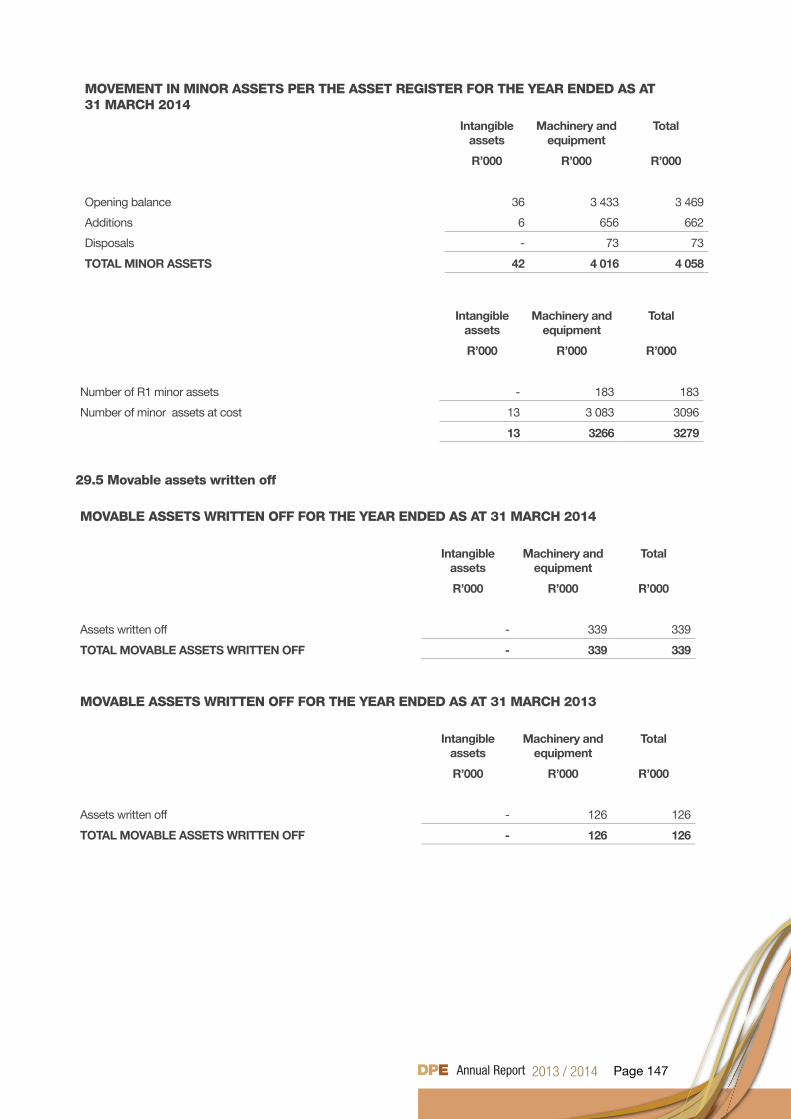
Page 147
MOVEMENT IN MINOR ASSETS PER THE ASSET REGISTER FOR THE YEAR ENDED AS AT 31 MARCH 2014
Intangible assets
Machinery and equipment
Total
R’000 R’000 R’000
Opening balance 36 3 433 3 469
Additions 6 656 662
Disposals - 73 73
TOTAL MINOR ASSETS 42 4 016 4 058
Intangible assets
Machinery and equipment
Total
R’000 R’000 R’000
Number of R1 minor assets - 183 183
Number of minor assets at cost 13 3 083 3096
13 3266 3279
29.5 Movable assets written off
MOVABLE ASSETS WRITTEN OFF FOR THE YEAR ENDED AS AT 31 MARCH 2014
Intangible assets
Machinery and equipment
Total
R’000 R’000 R’000
Assets written off - 339 339
TOTAL MOVABLE ASSETS WRITTEN OFF - 339 339
MOVABLE ASSETS WRITTEN OFF FOR THE YEAR ENDED AS AT 31 MARCH 2013
Intangible assets
Machinery and equipment
Total
R’000 R’000 R’000
Assets written off - 126 126
TOTAL MOVABLE ASSETS WRITTEN OFF - 126 126
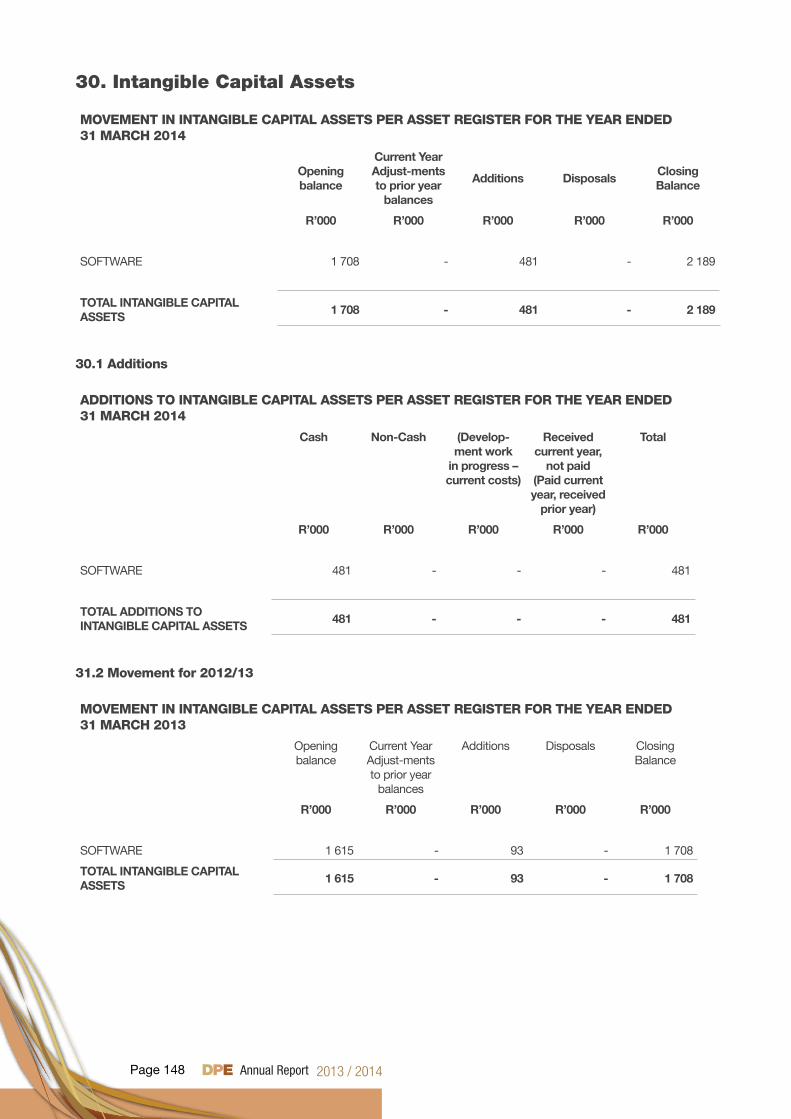
Page 148
30. Intangible Capital Assets
MOVEMENT IN INTANGIBLE CAPITAL ASSETS PER ASSET REGISTER FOR THE YEAR ENDED 31 MARCH 2014
Opening balance
Current Year Adjust-ments to prior year
balances
Additions DisposalsClosing Balance
R’000 R’000 R’000 R’000 R’000
SOFTWARE 1 708 - 481 - 2 189
TOTAL INTANGIBLE CAPITAL ASSETS
1 708 - 481 - 2 189
30.1 Additions
ADDITIONS TO INTANGIBLE CAPITAL ASSETS PER ASSET REGISTER FOR THE YEAR ENDED31 MARCH 2014
Cash Non-Cash (Develop-ment work
in progress – current costs)
Received current year,
not paid(Paid current year, received
prior year)
Total
R’000 R’000 R’000 R’000 R’000
SOFTWARE 481 - - - 481
TOTAL ADDITIONS TO INTANGIBLE CAPITAL ASSETS
481 - - - 481
31.2 Movement for 2012/13
MOVEMENT IN INTANGIBLE CAPITAL ASSETS PER ASSET REGISTER FOR THE YEAR ENDED 31 MARCH 2013
Opening balance
Current Year Adjust-ments to prior year
balances
Additions Disposals Closing Balance
R’000 R’000 R’000 R’000 R’000
SOFTWARE 1 615 - 93 - 1 708
TOTAL INTANGIBLE CAPITAL ASSETS
1 615 - 93 - 1 708

Page 149
31. Prior period errors
31.1 Correction of prior period error for secondary information
Note 2013/14 2012/13
R’000 R’000
The comparative amounts in Note 28 were restated as follows:
Impairment - (849)
Net effect on the note - (849)
The impairment for the prior year was restated as the investment was impaired below cost.
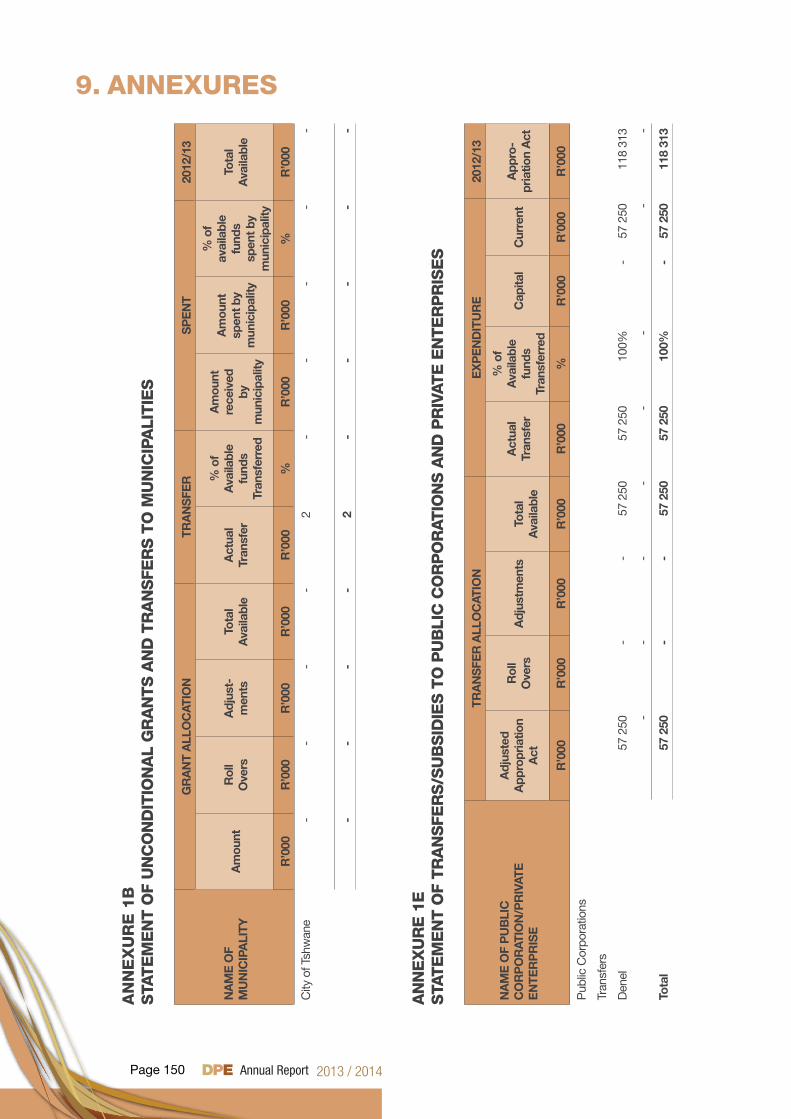
Page 150
AN
NE
XU
RE
1B
STA
TE
ME
NT O
F U
NC
ON
DIT
ION
AL
GR
AN
TS
AN
D T
RA
NS
FER
S T
O M
UN
ICIP
ALI
TIE
S
NA
ME
OF
MU
NIC
IPA
LITY
GR
AN
T A
LLO
CAT
ION
TRA
NS
FER
SP
EN
T20
12/1
3
Am
ount
Rol
l O
vers
Adj
ust-
men
tsTo
tal
Ava
ilabl
eA
ctua
l Tr
ansf
er
% o
f A
vaila
ble
fund
s Tr
ansf
erre
d
Am
ount
re
ceiv
ed
by
mun
icip
ality
Am
ount
sp
ent b
y m
unic
ipal
ity
% o
f av
aila
ble
fund
s sp
ent b
y m
unic
ipal
ity
Tota
l A
vaila
ble
R’0
00R
’000
R’0
00R
’000
R’0
00%
R’0
00R
’000
%R
’000
City
of T
shw
ane
--
--
2-
--
--
--
--
2-
--
--
AN
NE
XU
RE
1E
STA
TE
ME
NT O
F TR
AN
SFE
RS
/SU
BS
IDIE
S T
O P
UB
LIC
CO
RP
OR
ATIO
NS
AN
D P
RIV
ATE
EN
TE
RP
RIS
ES
NA
ME
OF
PU
BLI
C
CO
RP
OR
ATIO
N/P
RIV
ATE
E
NTE
RP
RIS
E
TRA
NS
FER
ALL
OC
ATIO
NE
XP
EN
DIT
UR
E20
12/1
3
Adj
uste
dA
ppro
pria
tion
Act
Rol
l O
vers
Adj
ustm
ents
Tota
l A
vaila
ble
Act
ual
Tran
sfer
% o
f A
vaila
ble
fund
s Tr
ansf
erre
d
Cap
ital
Cur
rent
App
ro-
pria
tion
Act
R’0
00R
’000
R’0
00R
’000
R’0
00%
R’0
00R
’000
R’0
00
Pub
lic C
orpo
ratio
ns
Tran
sfer
s
Den
el57
250
--
57 2
5057
250
100%
-57
250
118
313
--
--
--
--
Tota
l57
250
--
57 2
5057
250
100%
-57
250
118
313
9. ANNEXURES
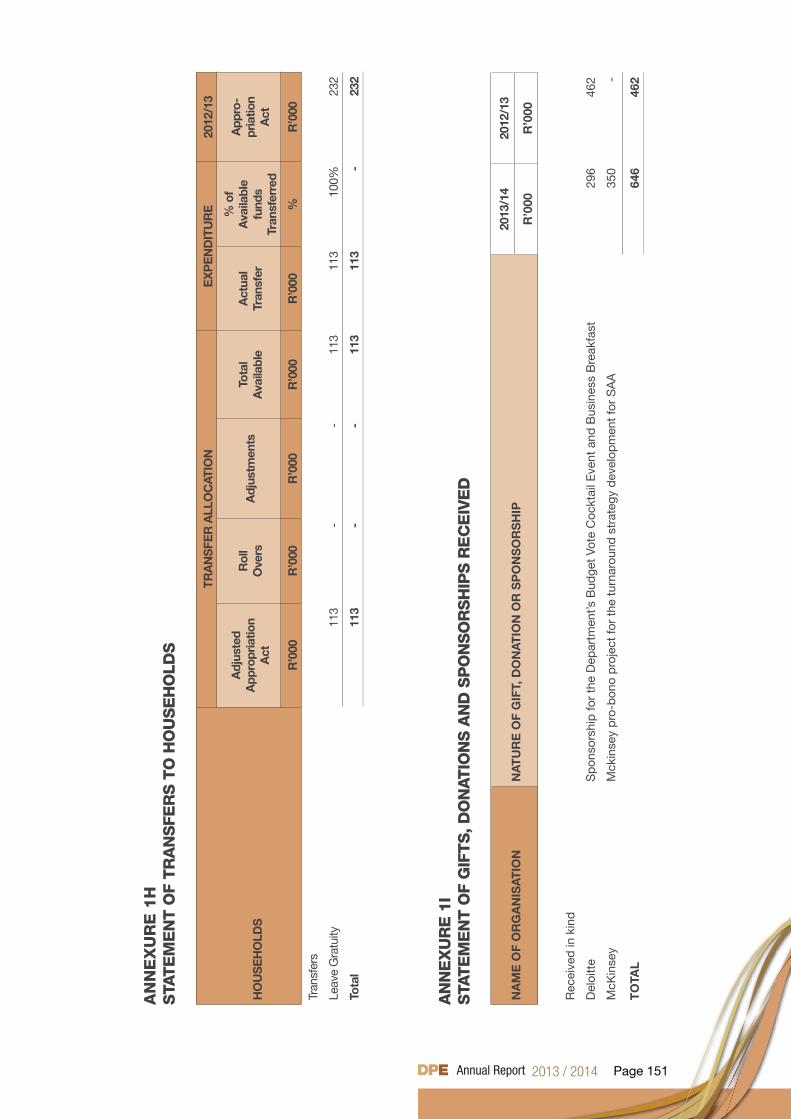
Page 151
AN
NE
XU
RE
1H
STA
TE
ME
NT O
F TR
AN
SFE
RS
TO
HO
US
EH
OLD
S
HO
US
EH
OLD
S
TRA
NS
FER
ALL
OC
ATIO
NE
XP
EN
DIT
UR
E20
12/1
3
Adj
uste
dA
ppro
pria
tion
Act
Rol
l O
vers
Adj
ustm
ents
Tota
l A
vaila
ble
Act
ual
Tran
sfer
% o
f A
vaila
ble
fund
s Tr
ansf
erre
d
App
ro-
pria
tion
Act
R’0
00R
’000
R’0
00R
’000
R’0
00%
R’0
00
Tran
sfer
s
Leav
e G
ratu
ity11
3-
-11
311
310
0%23
2
Tota
l11
3-
-11
311
3-
232
AN
NE
XU
RE
1I
STA
TE
ME
NT O
F G
IFTS
, DO
NAT
ION
S A
ND
SP
ON
SO
RS
HIP
S R
EC
EIV
ED
NA
ME
OF
OR
GA
NIS
ATIO
NN
ATU
RE
OF
GIF
T, D
ON
ATIO
N O
R S
PO
NS
OR
SH
IP20
13/1
420
12/1
3
R’0
00R
’000
Rec
eive
d in
kin
d
Del
oitt
eS
pon
sors
hip
for
the
Dep
artm
ent’s
Bud
get
Vote
Coc
ktai
l Eve
nt a
nd B
usin
ess
Bre
akfa
st29
646
2
McK
inse
yM
ckin
sey
pro
-bon
o p
roje
ct fo
r th
e tu
rnar
ound
str
ateg
y d
evel
opm
ent
for
SA
A35
0-
TO
TAL
646
462
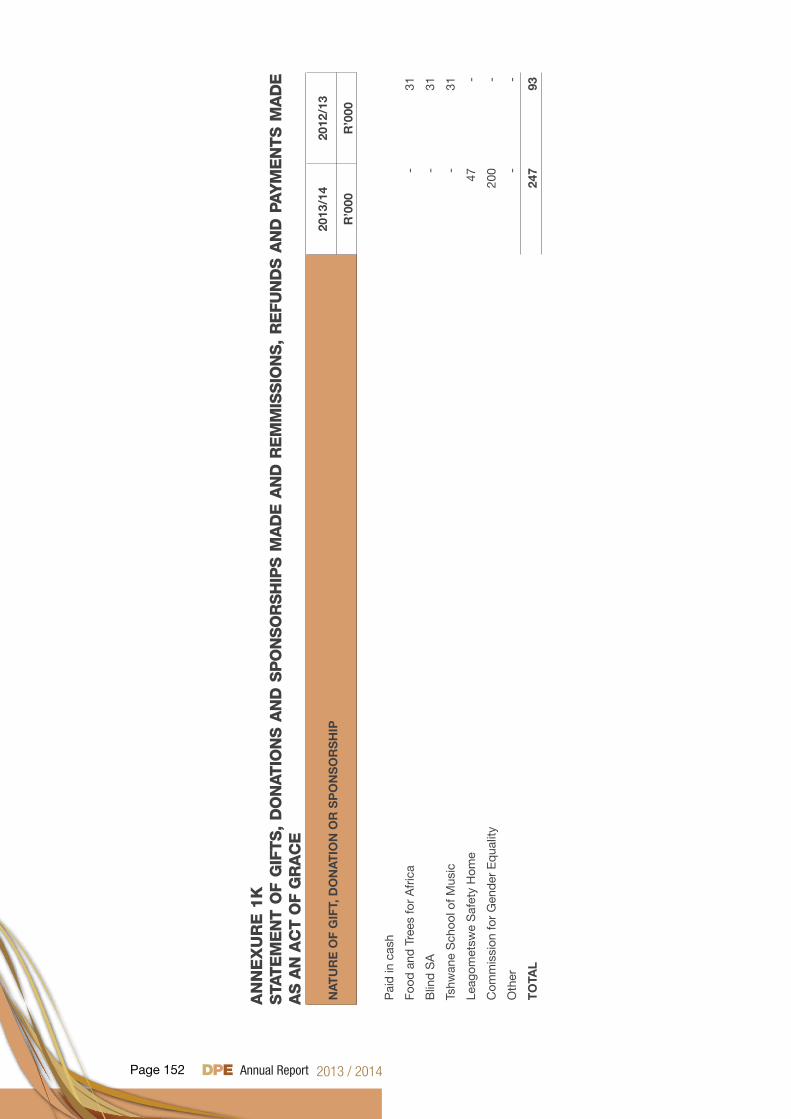
Page 152
AN
NE
XU
RE
1K
STA
TE
ME
NT O
F G
IFTS
, D
ON
ATIO
NS
AN
D S
PO
NS
OR
SH
IPS
MA
DE
AN
D R
EM
MIS
SIO
NS
, R
EFU
ND
S A
ND
PAY
ME
NTS
MA
DE
A
S A
N A
CT O
F G
RA
CE
NAT
UR
E O
F G
IFT,
DO
NAT
ION
OR
SP
ON
SO
RS
HIP
2013
/14
2012
/13
R’0
00R
’000
Pai
d in
cas
h
Food
and
Tre
es fo
r A
fric
a-
31
Blin
d S
A-
31
Tshw
ane
Sch
ool o
f Mus
ic-
31
Leag
omet
swe
Saf
ety
Hom
e47
-
Com
mis
sion
for
Gen
der
Eq
ualit
y20
0-
Oth
er-
-
TO
TAL
247
93
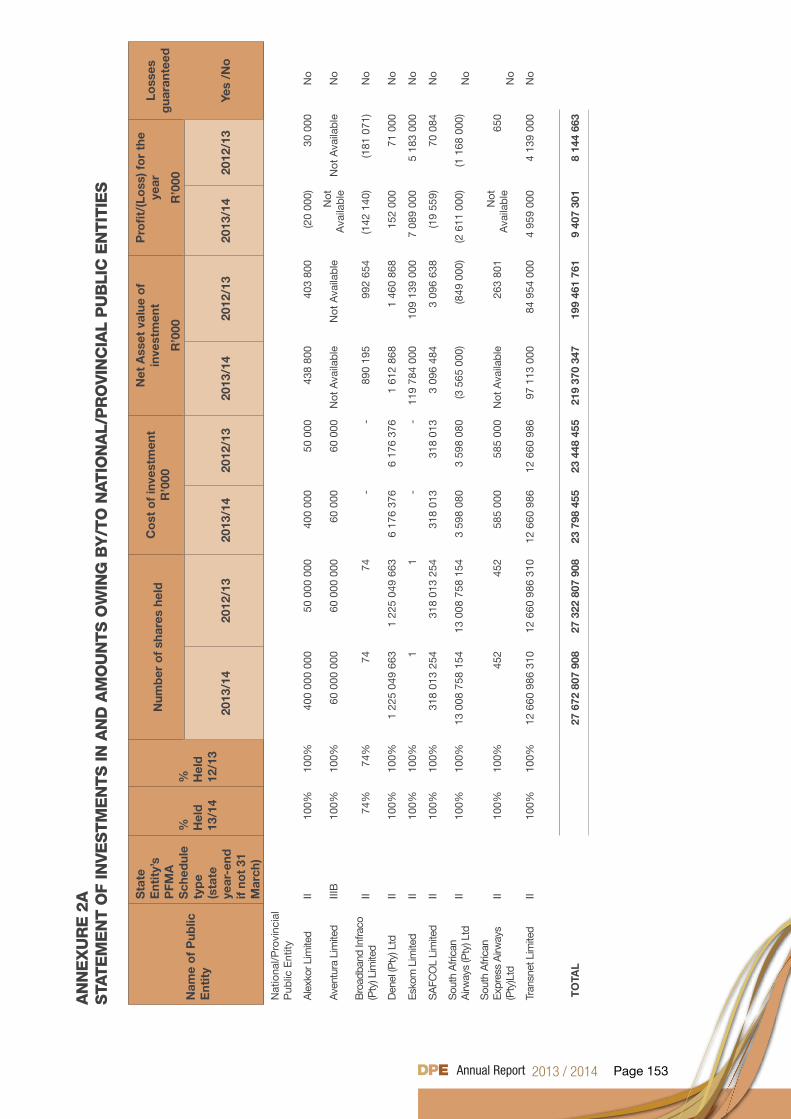
Page 153
AN
NE
XU
RE
2A
STA
TE
ME
NT O
F IN
VE
STM
EN
TS
IN A
ND
AM
OU
NTS
OW
ING
BY
/TO
NAT
ION
AL/
PR
OVIN
CIA
L P
UB
LIC
EN
TIT
IES
Nam
e o
f P
ublic
E
ntit
y
Sta
te
Ent
ity’
s P
FMA
S
ched
ule
typ
e (s
tate
ye
ar-e
nd
if no
t 31
M
arch
)
%
Hel
d
13/1
4
%
Hel
d
12/1
3
Num
ber
of
shar
es h
eld
Co
st o
f in
vest
men
tR
’000
Net
Ass
et v
alue
of
inve
stm
ent
Pro
fit/
(Lo
ss) f
or
the
year
Loss
es
gua
rant
eed
R’0
00R
’000
2013
/14
2012
/13
2013
/14
2012
/13
2013
/14
2012
/13
2013
/14
2012
/13
Yes
/No
Nat
iona
l/Pro
vinc
ial
Pub
lic E
ntity
Ale
xkor
Lim
ited
II10
0%10
0%40
0 00
0 00
050
000
000
400
000
50 0
0043
8 80
040
3 80
0(2
0 00
0)30
000
No
Ave
ntur
a Li
mite
dIII
B10
0%10
0%60
000
000
60 0
00 0
0060
000
60 0
00N
ot A
vaila
ble
Not
Ava
ilab
leN
ot
Ava
ilab
leN
ot A
vaila
ble
No
Bro
adba
nd In
fraco
(P
ty) L
imite
dII
74%
74%
7474
--
890
195
992
654
(142
140
)(1
81 0
71)
No
Den
el (P
ty) L
tdII
100%
100%
1 22
5 04
9 66
31
225
049
663
6 17
6 37
66
176
376
1 61
2 86
81
460
868
152
000
71 0
00N
o
Esko
m L
imite
dII
100%
100%
11
--
119
784
000
109
139
000
7 08
9 00
05
183
000
No
SA
FCO
L Li
mite
dII
100%
100%
318
013
254
318
013
254
318
013
318
013
3 09
6 48
43
096
638
(19
559)
70 0
84N
o
Sou
th A
frica
n A
irway
s (P
ty) L
tdII
100%
100%
13 0
08 7
58 1
5413
008
758
154
3 59
8 08
03
598
080
(3 5
65 0
00)
(849
000
)(2
611
000
)(1
168
000
)N
o
Sou
th A
frica
n Ex
pres
s A
irway
s (P
ty)L
tdII
100%
100%
452
452
585
000
585
000
Not
Ava
ilab
le26
3 80
1N
ot
Ava
ilab
le65
0N
o
Tran
snet
Lim
ited
II
100%
100%
12 6
60 9
86 3
1012
660
986
310
12 6
60 9
8612
660
986
97 1
13 0
0084
954
000
4 95
9 00
04
139
000
No
TO
TAL
27 6
72 8
07 9
0827
322
807
908
23 7
98 4
5523
448
455
219
370
347
199
461
761
9 40
7 30
18
144
663
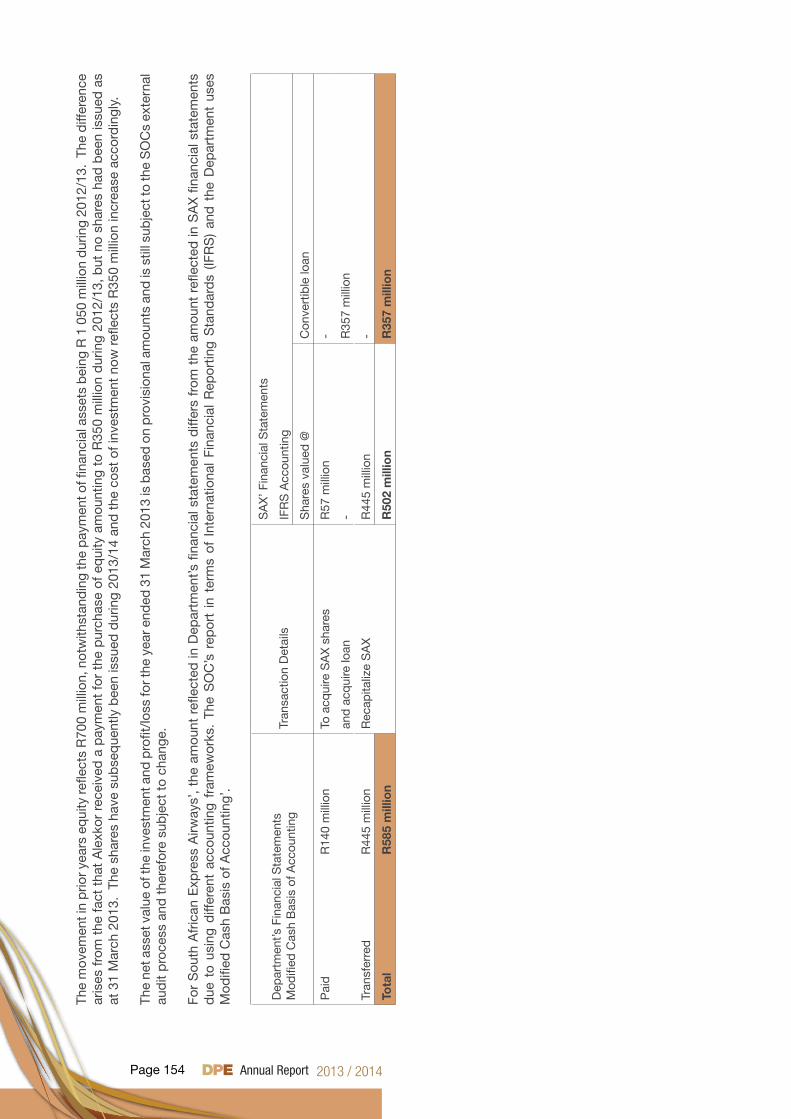
Page 154
The
mov
emen
t in
prio
r yea
rs e
qui
ty re
flect
s R
700
mill
ion,
not
with
stan
din
g th
e p
aym
ent o
f fina
ncia
l ass
ets
bei
ng R
1 0
50 m
illio
n d
urin
g 20
12/1
3. T
he d
iffer
ence
ar
ises
fro
m t
he f
act
that
Ale
xkor
rec
eive
d a
pay
men
t fo
r th
e p
urch
ase
of e
qui
ty a
mou
ntin
g to
R35
0 m
illio
n d
urin
g 20
12/1
3, b
ut n
o sh
ares
had
bee
n is
sued
as
at 3
1 M
arch
201
3. T
he s
hare
s ha
ve s
ubse
que
ntly
bee
n is
sued
dur
ing
2013
/14
and
the
cos
t of
inve
stm
ent
now
refl
ects
R35
0 m
illio
n in
crea
se a
ccor
din
gly.
The
net a
sset
val
ue o
f the
inve
stm
ent a
nd p
rofit
/loss
for t
he y
ear e
nded
31
Mar
ch 2
013
is b
ased
on
pro
visi
onal
am
ount
s an
d is
stil
l sub
ject
to th
e S
OC
s ex
tern
al
aud
it p
roce
ss a
nd t
here
fore
sub
ject
to
chan
ge.
For
Sou
th A
fric
an E
xpre
ss A
irway
s’,
the
amou
nt r
eflec
ted
in D
epar
tmen
t’s fi
nanc
ial s
tate
men
ts d
iffer
s fr
om t
he a
mou
nt r
eflec
ted
in S
AX
fina
ncia
l sta
tem
ents
d
ue t
o us
ing
diff
eren
t ac
coun
ting
fram
ewor
ks.
The
SO
C’s
rep
ort
in t
erm
s of
Int
erna
tiona
l Fi
nanc
ial
Rep
ortin
g S
tand
ard
s (IF
RS
) an
d t
he D
epar
tmen
t us
es
Mod
ified
Cas
h B
asis
of A
ccou
ntin
g’.
Dep
artm
ent’s
Fin
anci
al S
tate
men
tsM
odifi
ed C
ash
Bas
is o
f Acc
ount
ing
Tran
sact
ion
Det
ails
SA
X’ F
inan
cial
Sta
tem
ents
IFR
S A
ccou
ntin
g
Sha
res
valu
ed @
Con
vert
ible
loan
Pai
d
R14
0 m
illio
nTo
acq
uire
SA
X s
hare
sR
57 m
illio
n-
and
acq
uire
loan
-R
357
mill
ion
Tran
sfer
red
R44
5 m
illio
nR
ecap
italiz
e S
AX
R44
5 m
illio
n-
Tota
l
R
585
mill
ion
R50
2 m
illio
nR
357
mill
ion
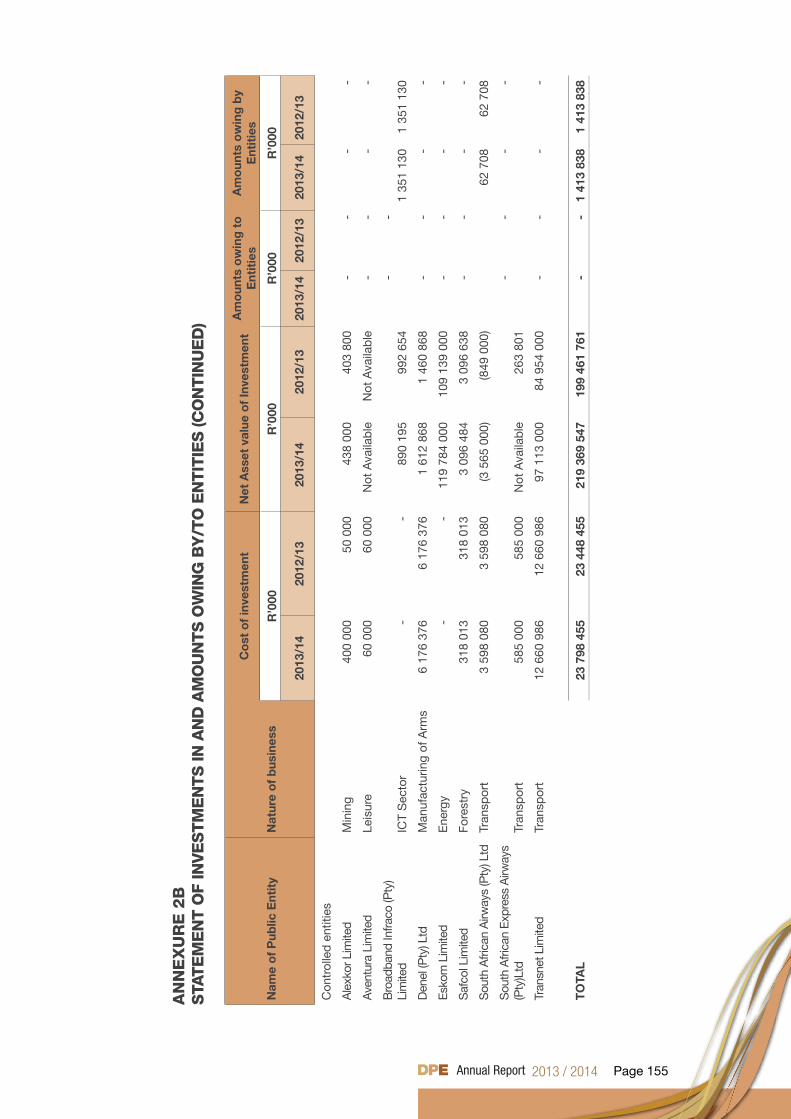
Page 155
AN
NE
XU
RE
2B
STA
TE
ME
NT O
F IN
VE
STM
EN
TS
IN A
ND
AM
OU
NTS
OW
ING
BY
/TO
EN
TIT
IES
(CO
NTIN
UE
D)
Nam
e o
f P
ublic
Ent
ity
Nat
ure
of
bus
ines
s
Co
st o
f in
vest
men
tN
et A
sset
val
ue o
f In
vest
men
tA
mo
unts
ow
ing
to
E
ntit
ies
Am
oun
ts o
win
g b
y E
ntit
ies
R’0
00R
’000
R’0
00R
’000
2013
/14
2012
/13
2013
/14
2012
/13
2013
/14
2012
/13
2013
/14
2012
/13
Con
trol
led
ent
ities
Ale
xkor
Lim
ited
Min
ing
400
000
50 0
0043
8 00
040
3 80
0-
--
-
Ave
ntur
a Li
mite
dLe
isur
e60
000
60 0
00N
ot A
vaila
ble
Not
Ava
ilab
le-
--
-
Bro
adba
nd In
fraco
(Pty
) Li
mite
dIC
T S
ecto
r-
-89
0 19
599
2 65
4-
-1
351
130
1 35
1 13
0
Den
el (P
ty) L
tdM
anuf
actu
ring
of A
rms
6 17
6 37
66
176
376
1 61
2 86
81
460
868
--
--
Esk
om L
imite
dE
nerg
y-
-11
9 78
4 00
010
9 13
9 00
0-
--
-
Saf
col L
imite
dFo
rest
ry31
8 01
331
8 01
33
096
484
3 09
6 63
8-
--
-
Sou
th A
frica
n A
irway
s (P
ty) L
tdTr
ansp
ort
3 59
8 08
03
598
080
(3 5
65 0
00)
(849
000
)62
708
62 7
08
Sou
th A
frica
n E
xpre
ss A
irway
s (P
ty)L
tdTr
ansp
ort
585
000
585
000
Not
Ava
ilab
le26
3 80
1-
--
-
Tran
snet
Lim
ited
Tr
ansp
ort
12 6
60 9
8612
660
986
97 1
13 0
0084
954
000
--
--
TO
TAL
23
798
455
23 4
48 4
5521
9 36
9 54
719
9 46
1 76
1-
-1
413
838
1 41
3 83
8
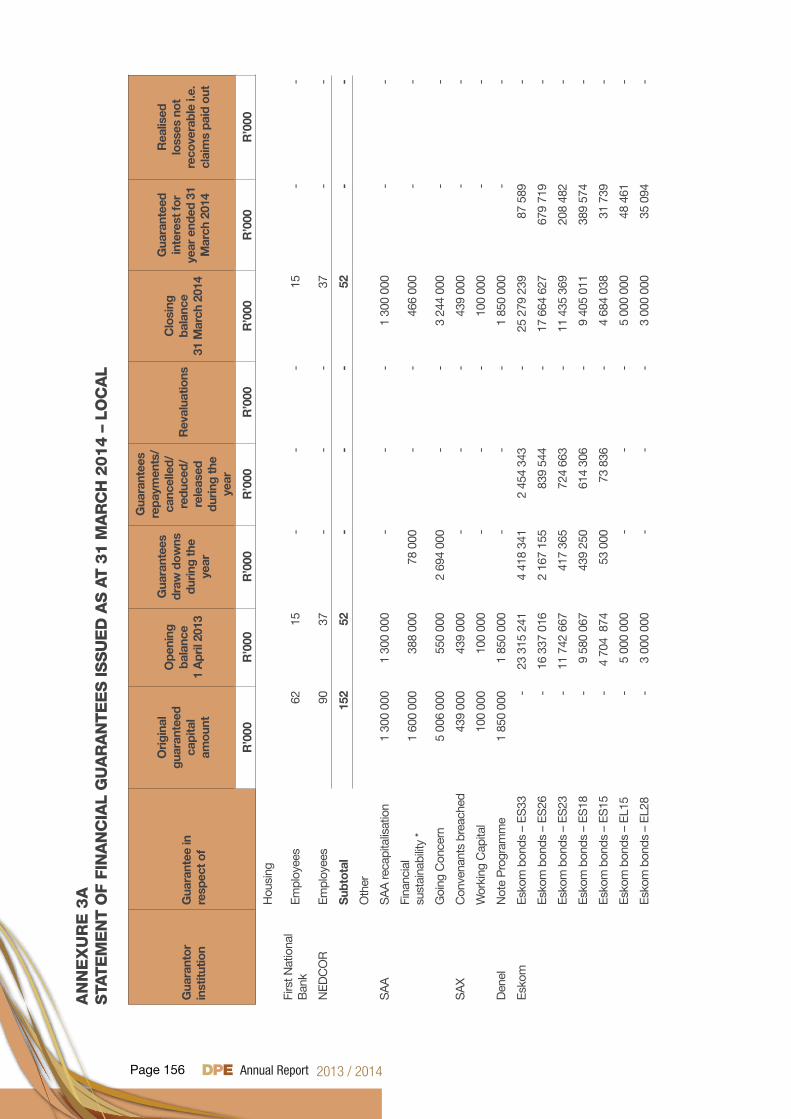
Page 156
AN
NE
XU
RE
3A
STA
TE
ME
NT O
F FI
NA
NC
IAL
GU
AR
AN
TE
ES
ISS
UE
D A
S A
T 3
1 M
AR
CH
2014 –
LO
CA
L
Gua
rant
or
inst
itutio
nG
uara
ntee
in
resp
ect o
f
Ori
gina
l gu
aran
teed
ca
pita
l am
ount
Ope
ning
ba
lanc
e 1
Apr
il 20
13
Gua
rant
ees
draw
dow
nsdu
ring
the
year
Gua
rant
ees
repa
ymen
ts/
canc
elle
d/
redu
ced/
re
leas
ed
duri
ng th
e ye
ar
Rev
alua
tions
Clo
sing
ba
lanc
e31
Mar
ch 2
014
Gua
rant
eed
in
tere
st fo
r ye
ar e
nded
31
Mar
ch 2
014
Rea
lised
lo
sses
not
re
cove
rabl
e i.e
. cl
aim
s pa
id o
ut
R’0
00R
’000
R’0
00R
’000
R’0
00R
’000
R’0
00R
’000
Hou
sing
Firs
t Nat
iona
l B
ank
Em
ploy
ees
6215
--
-15
--
NE
DC
OR
Em
ploy
ees
9037
--
-37
--
Sub
tota
l15
252
--
-52
--
Oth
er
SA
AS
AA
reca
pita
lisat
ion
1 30
0 00
01
300
000
--
-1
300
000
--
Fina
ncia
l su
stai
nabi
lity
*1
600
000
388
000
78 0
00-
-46
6 00
0-
-
Goi
ng C
once
rn5
006
000
550
000
2 69
4 00
0-
-3
244
000
--
SA
XC
onve
nant
s br
each
ed43
9 00
043
9 00
0-
--
439
000
--
Wor
king
Cap
ital
100
000
100
000
--
-10
0 00
0-
-
Den
elN
ote
Pro
gram
me
1 85
0 00
01
850
000
--
-1
850
000
--
Esk
omE
skom
bon
ds –
ES
33-
23 3
15 2
414
418
341
2 45
4 34
3-
25 2
79 2
3987
589
-
Esk
om b
onds
– E
S26
-16
337
016
2 16
7 15
583
9 54
4-
17 6
64 6
2767
9 71
9-
Esk
om b
onds
– E
S23
-11
742
667
417
365
724
663
-11
435
369
208
482
-
Esk
om b
onds
– E
S18
-9
580
067
439
250
614
306
-9
405
011
389
574
-
Esk
om b
onds
– E
S15
-4
704
874
53 0
0073
836
-4
684
038
31 7
39-
Esk
om b
onds
– E
L15
-5
000
000
--
-5
000
000
48 4
61-
Esk
om b
onds
– E
L28
-3
000
000
--
-3
000
000
35 0
94-
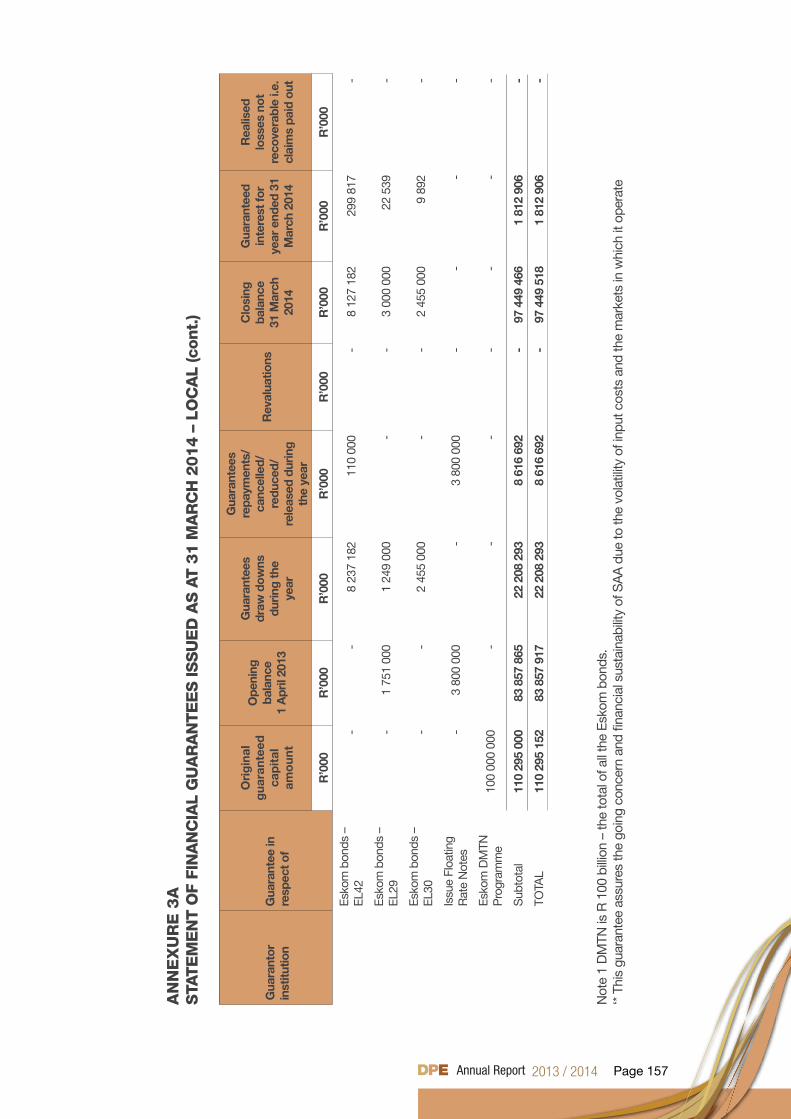
Page 157
AN
NE
XU
RE
3A
STA
TE
ME
NT O
F FI
NA
NC
IAL
GU
AR
AN
TE
ES
ISS
UE
D A
S A
T 3
1 M
AR
CH
2014 –
LO
CA
L (c
ont.
)
Gua
rant
or
inst
itutio
nG
uara
ntee
in
resp
ect o
f
Ori
gin
al
gua
rant
eed
ca
pit
al
amo
unt
Ope
ning
ba
lanc
e 1
Apr
il 20
13
Gua
rant
ees
draw
dow
nsdu
ring
the
year
Gua
rant
ees
repa
ymen
ts/
canc
elle
d/
redu
ced/
re
leas
ed d
urin
g
the
year
Rev
alua
tions
Clo
sing
ba
lanc
e31
Mar
ch
2014
Gua
rant
eed
in
tere
st fo
r ye
ar e
nded
31
Mar
ch 2
014
Rea
lised
lo
sses
not
re
cove
rabl
e i.e
. cl
aim
s pa
id o
ut
R’0
00R
’000
R’0
00R
’000
R’0
00R
’000
R’0
00R
’000
Esk
om b
onds
–
EL4
2-
-8
237
182
110
000
-8
127
182
299
817
-
Esk
om b
onds
–
EL2
9-
1 75
1 00
01
249
000
--
3 00
0 00
022
539
-
Esk
om b
onds
–
EL3
0-
-2
455
000
--
2 45
5 00
09
892
-
Issu
e Fl
oatin
g R
ate
Not
es-
3 80
0 00
0-
3 80
0 00
0-
--
-
Esk
om D
MTN
P
rogr
amm
e10
0 00
0 00
0-
--
--
--
Sub
tota
l11
0 29
5 00
083
857
865
22 2
08 2
938
616
692
-97
449
466
1 81
2 90
6-
TOTA
L11
0 29
5 15
283
857
917
22 2
08 2
938
616
692
-97
449
518
1 81
2 90
6-
Not
e 1
DM
TN is
R 1
00 b
illio
n –
the
tota
l of a
ll th
e E
skom
bon
ds.
‘* Th
is g
uara
ntee
ass
ures
the
goin
g co
ncer
n an
d fin
anci
al s
usta
inab
ility
of S
AA
due
to th
e vo
latil
ity o
f inp
ut c
osts
and
the
mar
kets
in w
hich
it o
pera
te
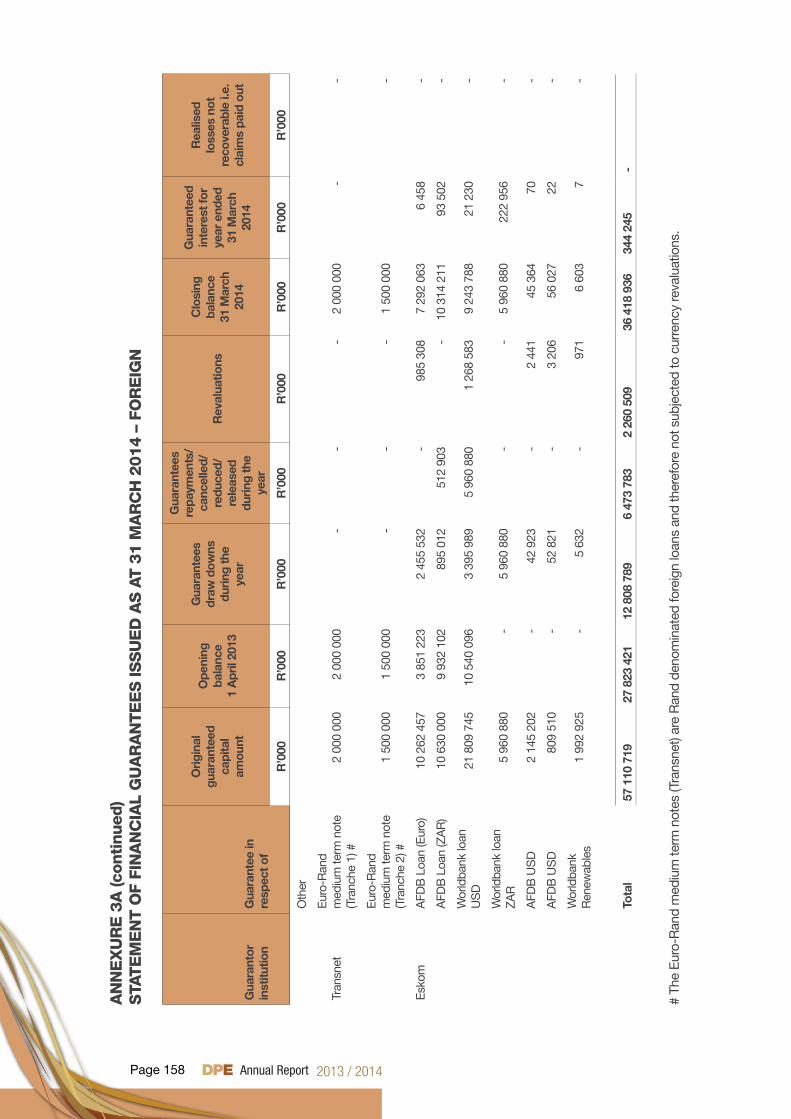
Page 158
AN
NE
XU
RE
3A
(con
tinued
)S
TATE
ME
NT O
F FI
NA
NC
IAL
GU
AR
AN
TE
ES
ISS
UE
D A
S A
T 3
1 M
AR
CH
2014 –
FO
RE
IGN
Gua
rant
or
inst
itutio
nG
uara
ntee
in
resp
ect o
f
Ori
gina
l gu
aran
teed
ca
pita
l am
ount
Ope
ning
ba
lanc
e 1
Apr
il 20
13
Gua
rant
ees
draw
dow
nsdu
ring
the
year
Gua
rant
ees
repa
ymen
ts/
canc
elle
d/
redu
ced/
re
leas
ed
duri
ng th
e ye
ar
Rev
alua
tions
Clo
sing
ba
lanc
e31
Mar
ch
2014
Gua
rant
eed
in
tere
st fo
r ye
ar e
nded
31
Mar
ch
2014
Rea
lised
lo
sses
not
re
cove
rabl
e i.e
. cl
aim
s pa
id o
ut
R’0
00R
’000
R’0
00R
’000
R’0
00R
’000
R’0
00R
’000
Oth
er
Tran
snet
Eur
o-R
and
m
ediu
m te
rm n
ote
(Tra
nche
1) #
2 00
0 00
02
000
000
--
-2
000
000
--
Eur
o-R
and
m
ediu
m te
rm n
ote
(Tra
nche
2) #
1 50
0 00
01
500
000
--
-1
500
000
-
Esk
omA
FDB
Loa
n (E
uro)
10 2
62 4
573
851
223
2 45
5 53
2-
985
308
7 29
2 06
36
458
-
AFD
B L
oan
(ZA
R)
10 6
30 0
009
932
102
895
012
512
903
-10
314
211
93 5
02-
Wor
ldba
nk lo
an
US
D21
809
745
10 5
40 0
963
395
989
5 96
0 88
01
268
583
9 24
3 78
821
230
-
Wor
ldba
nk lo
an
ZA
R5
960
880
-5
960
880
--
5 96
0 88
022
2 95
6-
AFD
B U
SD
2
145
202
-42
923
-2
441
45 3
6470
-
AFD
B U
SD
80
9 51
0-
52 8
21-
3 20
656
027
22-
Wor
ldba
nk
Ren
ewab
les
1 99
2 92
5-
5 63
2-
971
6 60
37
-
Tota
l57
110
719
27 8
23 4
2112
808
789
6 47
3 78
32
260
509
36 4
18 9
3634
4 24
5-
# Th
e E
uro-
Ran
d m
ediu
m te
rm n
otes
(Tra
nsne
t) ar
e R
and
deno
min
ated
fore
ign
loan
s an
d th
eref
ore
not s
ubje
cted
to c
urre
ncy
reva
luat
ions
.
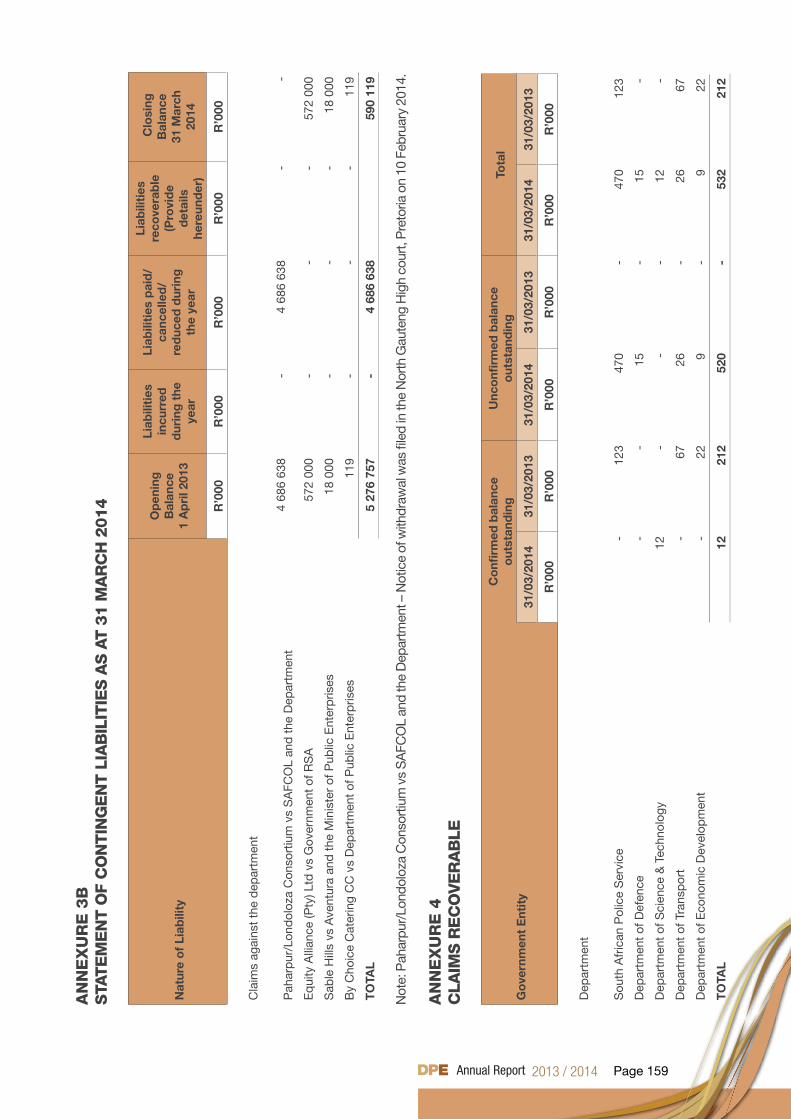
Page 159
AN
NE
XU
RE
3B
STA
TE
ME
NT O
F C
ON
TIN
GE
NT L
IAB
ILIT
IES
AS
AT 3
1 M
AR
CH
2014
Nat
ure
of
Liab
ility
Op
enin
gB
alan
ce1
Ap
ril 2
013
Liab
iliti
es
incu
rred
d
urin
g t
he
year
Liab
iliti
es p
aid
/ca
ncel
led
/re
duc
ed d
urin
g
the
year
Liab
iliti
es
reco
vera
ble
(P
rovi
de
det
ails
he
reun
der
)
Clo
sing
Bal
ance
31 M
arch
20
14
R’0
00R
’000
R’0
00R
’000
R’0
00
Cla
ims
agai
nst
the
dep
artm
ent
Pah
arp
ur/L
ond
oloz
a C
onso
rtiu
m v
s S
AFC
OL
and
the
Dep
artm
ent
4 68
6 63
8-
4 68
6 63
8-
-
Eq
uity
Alli
ance
(Pty
) Ltd
vs
Gov
ernm
ent
of R
SA
572
000
--
-57
2 00
0
Sab
le H
ills
vs A
vent
ura
and
the
Min
iste
r of
Pub
lic E
nter
pris
es18
000
--
-18
000
By
Cho
ice
Cat
erin
g C
C v
s D
epar
tmen
t of
Pub
lic E
nter
pris
es11
9-
--
119
TO
TAL
5 27
6 75
7-
4 68
6 63
8 5
90 1
19
Not
e: P
ahar
pur/
Lond
oloz
a C
onso
rtiu
m v
s S
AFC
OL
and
the
Dep
artm
ent –
Not
ice
of w
ithdr
awal
was
file
d in
the
Nor
th G
aute
ng H
igh
cour
t, P
reto
ria o
n 10
Feb
ruar
y 20
14.
AN
NE
XU
RE
4C
LAIM
S R
EC
OVE
RA
BLE
Go
vern
men
t E
ntit
y
Co
nfirm
ed b
alan
ce
out
stan
din
gU
nco
nfirm
ed b
alan
ce
out
stan
din
gTo
tal
31/0
3/20
1431
/03/
2013
31/0
3/20
1431
/03/
2013
31/0
3/20
1431
/03/
2013
R’0
00R
’000
R’0
00R
’000
R’0
00R
’000
Dep
artm
ent
Sou
th A
fric
an P
olic
e S
ervi
ce-
123
470
-47
012
3
Dep
artm
ent
of D
efen
ce-
-15
-15
-
Dep
artm
ent
of S
cien
ce &
Tec
hnol
ogy
12-
--
12-
Dep
artm
ent
of T
rans
por
t-
6726
-26
67
Dep
artm
ent
of E
cono
mic
Dev
elop
men
t-
229
-9
22
TO
TAL
1221
252
0-
532
212
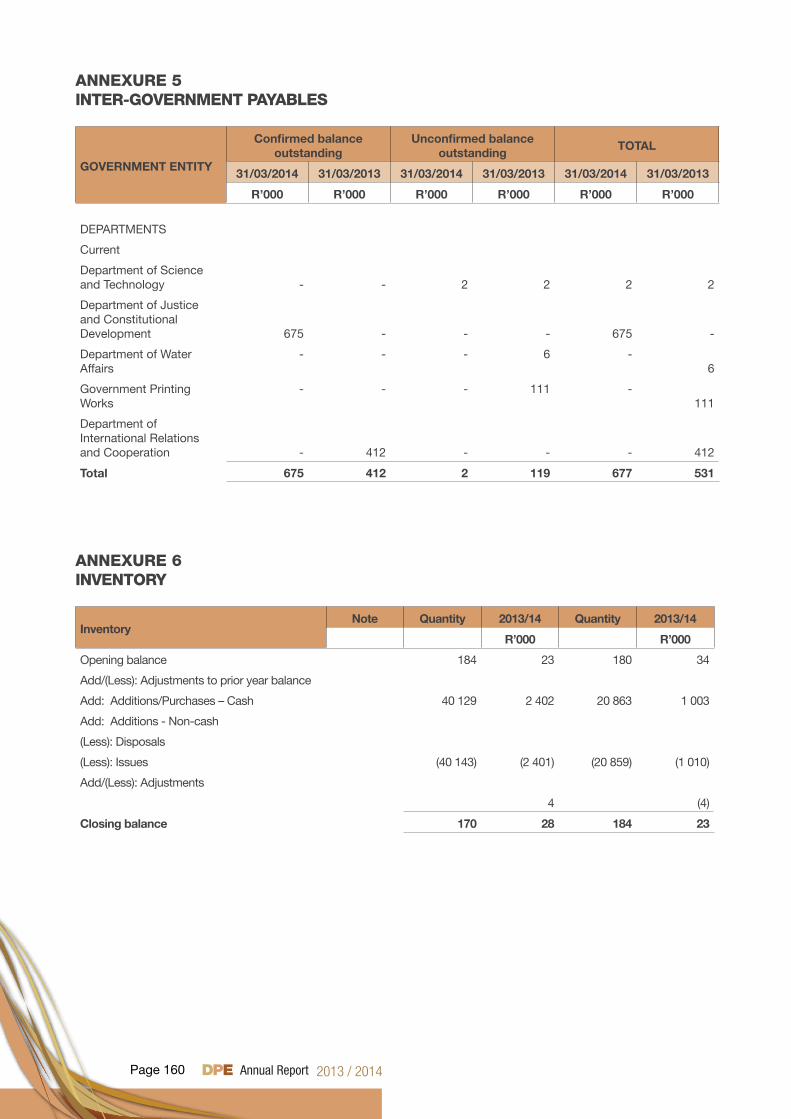
Page 160
ANNEXURE 5INTER-GOVERNMENT PAYABLES
GOVERNMENT ENTITY
Confirmed balance outstanding
Unconfirmed balance outstanding
TOTAL
31/03/2014 31/03/2013 31/03/2014 31/03/2013 31/03/2014 31/03/2013
R’000 R’000 R’000 R’000 R’000 R’000
DEPARTMENTS
Current
Department of Science and Technology - - 2 2 2 2
Department of Justice and Constitutional Development 675 - - - 675 -
Department of Water Affairs
- - - 6 -6
Government Printing Works
- - - 111 -111
Department of International Relations and Cooperation - 412 - - - 412
Total 675 412 2 119 677 531
ANNEXURE 6INVENTORY
InventoryNote Quantity 2013/14 Quantity 2013/14
R’000 R’000
Opening balance 184 23 180 34
Add/(Less): Adjustments to prior year balance
Add: Additions/Purchases – Cash 40 129 2 402 20 863 1 003
Add: Additions - Non-cash
(Less): Disposals
(Less): Issues (40 143) (2 401) (20 859) (1 010)
Add/(Less): Adjustments
4 (4)
Closing balance 170 28 184 23
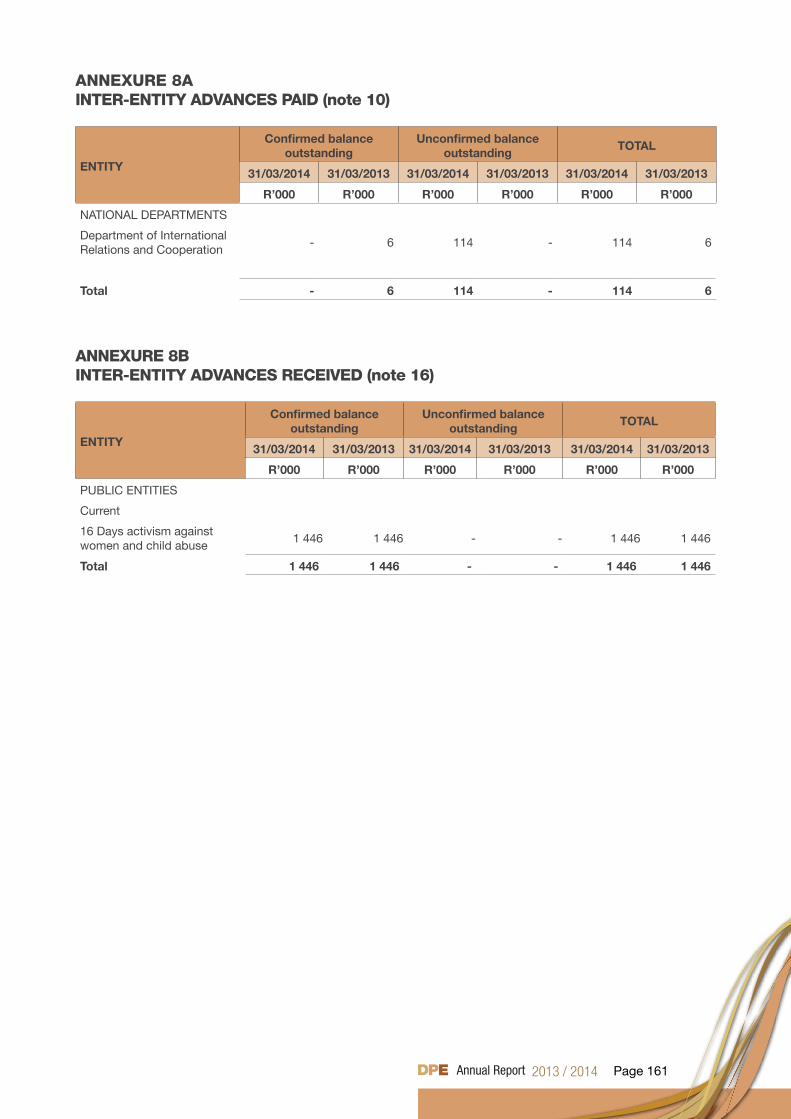
Page 161
ANNEXURE 8AINTER-ENTITY ADVANCES PAID (note 10)
ENTITY
Confirmed balance outstanding
Unconfirmed balance outstanding
TOTAL
31/03/2014 31/03/2013 31/03/2014 31/03/2013 31/03/2014 31/03/2013
R’000 R’000 R’000 R’000 R’000 R’000
NATIONAL DEPARTMENTS
Department of International Relations and Cooperation
- 6 114 - 114 6
Total - 6 114 - 114 6
ANNEXURE 8BINTER-ENTITY ADVANCES RECEIVED (note 16)
ENTITY
Confirmed balance outstanding
Unconfirmed balance outstanding
TOTAL
31/03/2014 31/03/2013 31/03/2014 31/03/2013 31/03/2014 31/03/2013
R’000 R’000 R’000 R’000 R’000 R’000
PUBLIC ENTITIES
Current
16 Days activism against women and child abuse
1 446 1 446 - - 1 446 1 446
Total 1 446 1 446 - - 1 446 1 446

NOTES

NOTES

NOTES
RP207/2014 ISBN: 978-0-621-42910-7
Suite 301, Infotech Building, 090 Arcadia Street, 0083, Private Bag X15Hatfield0028
Pretoria Tel: 012 431 1000 Fax: 086 501 2624
Cape Town Tel: 021 469 6760 Fax: 021 461 1741
www.dpe.gov.za