Embed Size (px)
Citation preview

Rue de la Loi 200, B-1049 Bruxelles/Wetstraat 200, B-1049 Brussel - Belgium - Office: B-232/6/21.
Telephone: direct line (+32-2)295 82 57, switchboard 299.11.11. Fax: 2994891.
EUROPEAN COMMISSIONHEALTH & CONSUMER PROTECTION DIRECTORATE-GENERAL
Directorate C - Scientific OpinionsC3 - Management of scientific committees II; scientific co-operation and networks
Reports on tasks
for scientific cooperation
Report of experts participating in Task 3.2.5
7 June 2000
Assessment of dietary intake of dioxins
and related PCBs by the population of
EU Member States

Report SCOOP Task 3.2.5 (Dioxins) Page 2 of 115Final Report, 7 June, 2000
CONTENTS
PageForeword 3Glossary 4Participants 6Executive summary 81 Introduction 132 Background 15
2.1 PCDDs and PCDFs 152.2 Dioxin related compounds 16
2.2.1 PCBs 162.2.2 Other compounds 18
2.3 Background exposure 182.4 Accidental and occupational exposure 192.5 Toxic equivalency factors 192.6 Risk assessment 202.7 Present regulations 222.8 Report structure 23
3 Methodological Aspects 253.1 Objective 253.2 Compilation of data 25
4 Results and Discussion 284.1 Occurrence in foods 284.2 Occurrence in human milk 434.3 Food consumption data and dietary intake estimates 45
5 Conclusions and Recommendations 535.1 Conclusions 535.2 Recommendations 55
Acknowledgements 56References 57
Annex 1 Congeners of PCDDs, PCDFs and PCBs selected for compilation 60of occurrence and exposure data in the framework of SCOOPTask 3.2.5 (Dioxins)
Annex 2 Comments from countries participating in SCOOP Task 3.2.5 (Dioxins) 61Annex 3 Occurrence data for dioxins and related PCBs (concentrations in pg/g) 93
in different food products reported by the participating countriesAnnex 4 Dietary intake of dioxins and PCBs 113Annex 5 Dietary exposure of breast fed infants to dioxins and PCBs 115
Report SCOOP Task 3.2.5 (Dioxins) Page 3 of 115Final Report, 7 June, 2000
Foreword
Scientific Co-operation on Questions Relating to Food
The scope and limitations of this report
Council Directive 93/5/EEC “on the assistance to the Commission and co-operation by the MemberStates in the scientific examination of questions relating to food” was adopted on 25 February 1993.It lays down a procedure whereby Member States of the European Union can focus their scientificresources in a co-ordinated manner on problems facing the Commission in the area of food. Theindividual tasks to be undertaken are agreed in consultation with the Member States who alsodetermine in which tasks they wish to participate and the extent of their participation. Directive93/5/EEC requires that an inventory of tasks be published at least every six months. Thispublication, which takes the form of a Commission Decision, specifies the participating MemberStates, the Member State that provides co-ordination and the time limit for completion of the task.
In general terms, tasks undertaken under scientific co-operation are designed to provide a factualbasis to support a Commission action in the area of food. Such support may involve the provisionof information as may be required, for example, by the Scientific Committee for Food (SCF) for itsevaluation and advisory work or by the Commission’s own services for the development ofproposals for Community action.
The tasks themselves are carried out by a group of experts nominated by the National Authoritiesresponsible for Scientific Co-operation in the Member States (the National Designated Authorities).
Although the scope of reports generated under the scientific co-operation procedure is restricted toessentially factual matters, presentation of inherently complex information without some reasonedinterpretation and summary by specialists would be of limited value and even open to misleadingconclusions. Such interpretation necessarily involves a degree of expert judgement.
It is therefore stressed that the interpretation and views expressed in this report are notnecessarily those of the participating Member States or those of the European Commission.
Report SCOOP Task 3.2.5 (Dioxins) Page 4 of 115Final Report, 7 June, 2000
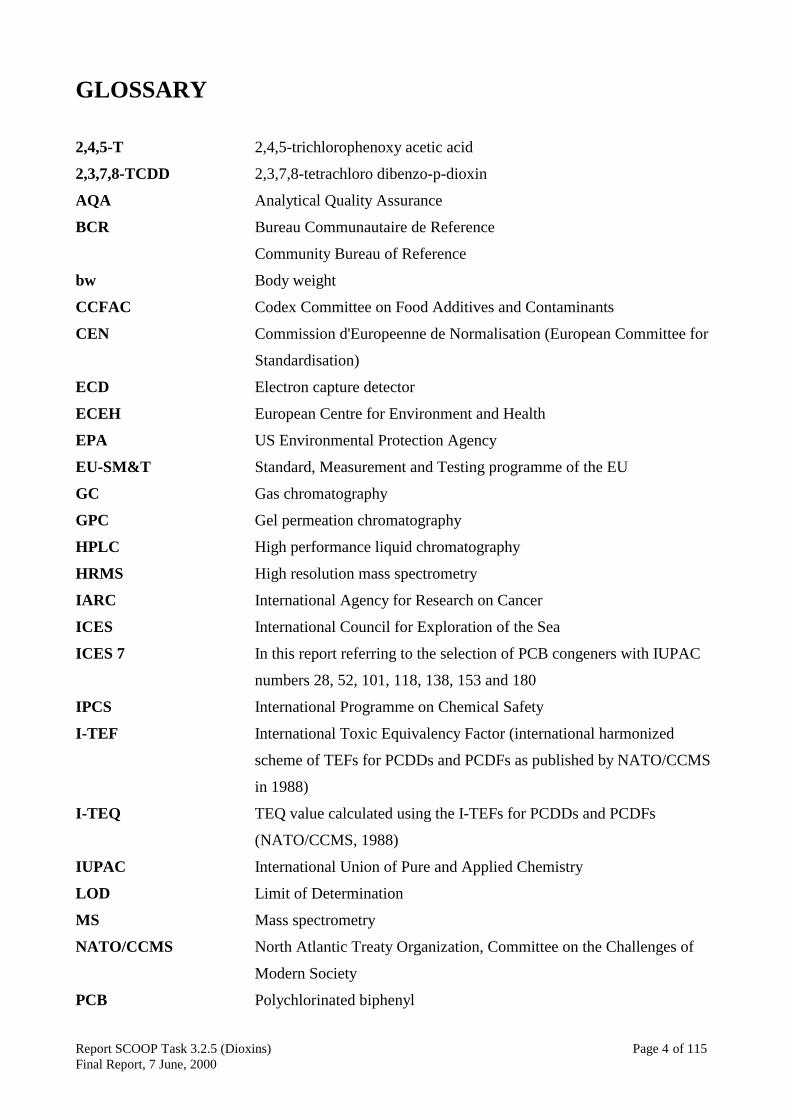
GLOSSARY
2,4,5-T 2,4,5-trichlorophenoxy acetic acid
2,3,7,8-TCDD 2,3,7,8-tetrachloro dibenzo-p-dioxin
AQA Analytical Quality Assurance
BCR Bureau Communautaire de Reference
Community Bureau of Reference
bw Body weight
CCFAC Codex Committee on Food Additives and Contaminants
CEN Commission d'Europeenne de Normalisation (European Committee for
Standardisation)
ECD Electron capture detector
ECEH European Centre for Environment and Health
EPA US Environmental Protection Agency
EU-SM&T Standard, Measurement and Testing programme of the EU
GC Gas chromatography
GPC Gel permeation chromatography
HPLC High performance liquid chromatography
HRMS High resolution mass spectrometry
IARC International Agency for Research on Cancer
ICES International Council for Exploration of the Sea
ICES 7 In this report referring to the selection of PCB congeners with IUPAC
numbers 28, 52, 101, 118, 138, 153 and 180
IPCS International Programme on Chemical Safety
I-TEF International Toxic Equivalency Factor (international harmonized
scheme of TEFs for PCDDs and PCDFs as published by NATO/CCMS
in 1988)
I-TEQ TEQ value calculated using the I-TEFs for PCDDs and PCDFs
(NATO/CCMS, 1988)
IUPAC International Union of Pure and Applied Chemistry
LOD Limit of Determination
MS Mass spectrometry
NATO/CCMS North Atlantic Treaty Organization, Committee on the Challenges of
Modern Society
PCB Polychlorinated biphenyl
Report SCOOP Task 3.2.5 (Dioxins) Page 5 of 115Final Report, 7 June, 2000
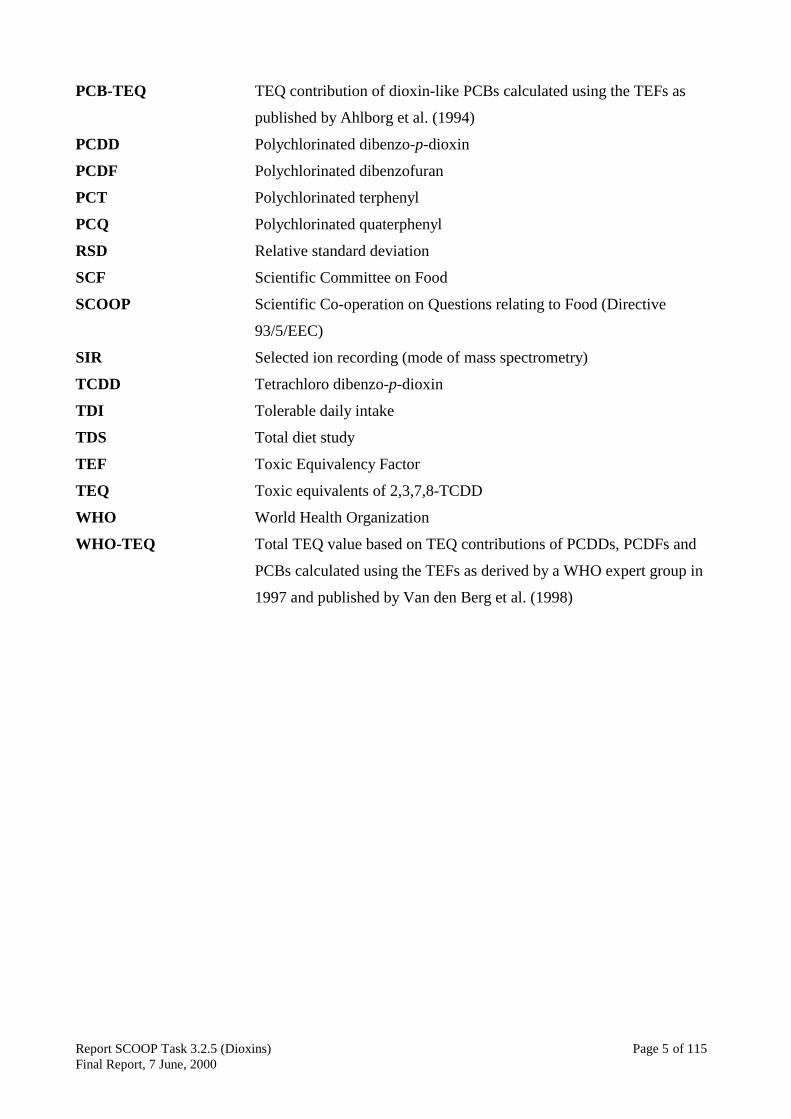
PCB-TEQ TEQ contribution of dioxin-like PCBs calculated using the TEFs as
published by Ahlborg et al. (1994)
PCDD Polychlorinated dibenzo-p-dioxin
PCDF Polychlorinated dibenzofuran
PCT Polychlorinated terphenyl
PCQ Polychlorinated quaterphenyl
RSD Relative standard deviation
SCF Scientific Committee on Food
SCOOP Scientific Co-operation on Questions relating to Food (Directive
93/5/EEC)
SIR Selected ion recording (mode of mass spectrometry)
TCDD Tetrachloro dibenzo-p-dioxin
TDI Tolerable daily intake
TDS Total diet study
TEF Toxic Equivalency Factor
TEQ Toxic equivalents of 2,3,7,8-TCDD
WHO World Health Organization
WHO-TEQ Total TEQ value based on TEQ contributions of PCDDs, PCDFs and
PCBs calculated using the TEFs as derived by a WHO expert group in
1997 and published by Van den Berg et al. (1998)

Report SCOOP Task 3.2.5 (Dioxins) Page 6 of 115Final Report, 7 June, 2000
PARTICIPANTS
All EU Member States and EFTA States were invited to participate in this project. The following
institutes and persons were nominated by their national authorities to co-ordinate the collection of
the data on behalf of their countries:
Country Participating Institute
BELGIUM Federaal Ministerie van Sociale Zaken, Volksgezondheid en Leefmilieu -
Algemene Eetwareninspectie
C. VINKX
Scientific Institute of Public Health - Louis Pasteur
S. SREBRNIK
DENMARK Danish Veterinary and Food Administration
T. CEDERBERG
FINLAND National Food Administration
A. HALLIKAINEN
National Public Health Institute
H. KIVIRANTA
FRANCE Institut National Agronomique Paris-Grignon (INAP-G)
J.-C. LEBLANC
INRA, Scientific Directorate on Human Nutrition and Food Safety
P. VERGER
Centre National d’Études et de Recommendations sur la Nutrition et
l’Alimentation (CNERNA)
F. DECLOITRE
GERMANY Bundesinstitut für gesundheitlichen Verbraucherschutz und
Veterinärmedizin (BgVV)
B. VIETH and W. MATHAR

Report SCOOP Task 3.2.5 (Dioxins) Page 7 of 115Final Report, 7 June, 2000
ITALY Istituto Superiore di Sanitá
E. DE FELIP and A. PICCIOLI BOCCA
NETHERLANDS National Institute of Public Health and the Environment (RIVM)
Laboratory for Organic-analytical Chemistry
A.K.D. LIEM, S.M. GORT and R. HOOGERBRUGGE
NORWAY Norwegian Food Control Authority
C. BERGSTEN, M.L. WIBORG and G. ERIKSEN
SWEDEN National Food Administration
S. ATUMA, P.O. DARNERUD and W. BECKER
UNITED KINGDOM Ministry of Agriculture, Fisheries and Foods (MAFF)
Department of Health - Joint Food Safety and Standards Group
A. GLEADLE and M. GEM
Report SCOOP Task 3.2.5 (Dioxins) Page 8 of 115Final Report, 7 June, 2000
EXECUTIVE SUMMARY
This report describes the results of Scientific Co-operation (SCOOP) Task 3.2.51. The objective of
this specific task was to provide the European Commission with information on dietary exposure to
PCDDs, PCDFs and dioxin-like PCBs in participating countries. The project was co-ordinated by
the National Institute of Public Health and the Environment (RIVM) in Bilthoven, the Netherlands,
and the National Food Administration in Uppsala, Sweden. Ten countries, i.e. Belgium, Denmark,
Finland, France, Germany, Italy, Netherlands, Norway, Sweden and United Kingdom, delivered
available data on the occurrence of PCDDs, PCDFs and dioxin-like PCBs in food products and
human milk. Wherever available or possible, data on the consumption of these foods and data on
the dietary exposure of the general population to these compounds were provided. The data were
reported in a given format and relevant supporting information was collected on the quality of the
data together with an evaluation of whether the data were considered to be representative of the
country and so relevant for use in calculating dietary intake estimates. There were large differences
in the amount, detail and quality of the data from the participating countries. The judgement of
whether the occurrence data were representative or not, and so useful for intake estimations, was
done by the participating countries for their own data.
Occurrence data
The SCOOP task resulted in a comprehensive database with information on concentrations of
PCDDs, PCDFs and/or dioxin-like PCBs in samples of food products and human milk. Samples
were taken from various sites, including rural and industrial sites, and were collected in different
years covering the period 1982 - 1999. The data resulting from some studies were considered
representative for the country and suitable for use in intake estimates.
It is widely known that the determination of PCDDs, PCDFs and dioxin-like PCBs requires
special expertise and sophisticated instrumentation. Consequently, broad field surveys based on a
large number of samples are rare. Nevertheless, the current database can be considered relatively
complete for PCDDs and PCDFs, but rather incomplete for dioxin-like PCBs.
1 Commission Decision 98/177/EC of 19 February 1998 amending Commission Decision 94/652/EC establishing the
inventory and distribution of tasks to be undertaken within the framework of cooperation by Member States in the
scientific examination of questions relating to food.
Report SCOOP Task 3.2.5 (Dioxins) Page 9 of 115Final Report, 7 June, 2000
The current database shows national average concentrations2 of PCDDs and PCDFs in eggs, fats
and oils, meat (products) and milk (products) of generally less than 1 up to 2-3 picogram (pg) I-
TEQ3 per gram (g) of fat. PCDD and PCDF levels in fish ranged between 0.25 and 10-20 pg I-
TEQ/g on product basis. Concentrations in fruits, vegetables and cereals were found to be relatively
low, and were generally close to the limits of determination. Concentrations in meat (products) and
fish (products) seem to vary between the various sample types (e.g. higher levels on a fat basis in
liver than in adipose) and between the different animal species (e.g. lower concentrations on a fat
basis in pork than in beef, poultry or mutton). A decreasing trend in the concentration of PCDDs
and PCDFs in foods has been reported for a few countries. This decline is most likely for consumer
milk and some types of meat. The available information is insufficient and incomplete to draw a
general conclusion on temporal trends for other types of foods.
The information, although limited with respect to concentrations of dioxin-like PCBs,
indicates average TEQ4 contributions of one to two times the TEQ contribution of PCDDs and
PCDFs. It has been noted that some PCB congeners (such as PCBs 126 and 118) may contribute
more significantly to the total TEQ content of foods than do the PCDDs and PCDFs. This situation
results both from the relatively high concentrations and, in some cases, from the relatively high TEF
value for some of the dioxin-like PCB congeners compared to other PCB congeners.
A considerable amount of data exists for concentrations of PCDDs and PCDFs in human milk. For
the period before 1995, the national averages ranged between 10 and 34 pg I-TEQ/g fat. For the
period 1995-1999 the national average concentrations ranged between 8 and 16 pg I-TEQ/g fat, for
some countries clearly indicating a downward trend.
The database for human milk is not sufficiently complete to draw a firm conclusion about
the TEQ contribution of dioxin-like PCBs. The few studies reported have been performed in the
period 1990-1994 and indicate a mean PCB-TEQ concentration varying from comparable to three
times the I-TEQ contribution of PCDDs and PCDFs (7-29 pg PCB-TEQ/g fat).
2 Most concentrations represent upper bound estimates assuming nondetects equal the limits of determination (see notes
in Annex 3).3 TEQ of PCDDs and PCDFs calculated using International TEFs according to NATO/CCMS (1988).4 TEQ of dioxin-like PCBs calculated using PCB-TEFs according to Ahlborg et al. (1994).

Report SCOOP Task 3.2.5 (Dioxins) Page 10 of 115Final Report, 7 June, 2000
Food consumption data
The consumption data from the participating countries are generally produced from studies
performed rather recently. The survey methods differ, including consumption record studies (2-28
days) as well as 24 h recall, household budget and food frequency questionnaire studies. The study
populations were generally adults (from teenagers to elderly) but UK and Germany have also
studied separate groups of consumers, including breast-fed infants, toddlers, schoolchildren and
adults. The food consumption data reveals variations between countries in consumption of different
food groups, a mirror of the country-specific food traditions and habits.
Dietary intakes
The estimates of dietary intakes of dioxins and related PCBs in this report are based on a limited
amount of data and there are uncertainties related to the methods used to estimate dietary intakes. It
was decided on basis of the known limitations in amount and quality of the data to concentrate on
an estimate of the mean dietary intake of dioxins and related PCBs by combination of mean
concentrations with average consumption of food groups. In addition, some countries also submitted
data on the 95-percentile (or 97.5-percentile) of the dietary intake based on mean concentrations
and high consumption of food groups.
Eight countries gave an estimate of mean dietary intake for an average adult person based on
dioxin occurrence in food and food consumption data. For the period after 1995, the average dietary
intakes of PCDDs and PCDFs ranged between 29 and 97 pg I-TEQ/day, which on a body weight
basis would correspond to approximately 0.4-1.5 pg I-TEQ/kg bw/day. For surveys based on
chemical analyses of foods collected in the 1970s and 1980s, intakes were estimated to be higher,
ranging from 127 to 314 pg I-TEQ/day (approx. 1.7-5.2 pg I-TEQ/kg bw/day). The 95-percentile (or
97.5-percentile) intake, based on data from the Netherlands and United Kingdom was 2-3 times the
mean intake.
For the TEQ contribution of dioxin-like PCBs, the average intakes were between 48 and 110
pg PCB-TEQ/day (approx. 0.8-1.8 pg PCB-TEQ/kg bw/day). In studies investigating both dietary
intakes of PCDDs/PCDFs and PCBs, the TEQ contribution of dioxin-like PCBs was estimated to be
almost equal (e.g. Finland, Netherlands, Sweden, United Kingdom) to approximately four times
(Norway) the TEQ contribution of the PCDDs and PCDFs.
The main contributors to the average daily intake of dioxins (I-TEQ) in the participating countries
are milk and dairy products (contributions ranged from 16-39%), meat and meat products (6-32%)
Report SCOOP Task 3.2.5 (Dioxins) Page 11 of 115Final Report, 7 June, 2000
and fish and fish products (2-63%). Other products, mainly of plant origin such as vegetables,
cereals, contributed 6-45% in those countries for which data were available. In this regard, it should
be noted that the relative contribution of the food groups to the total intake of I-TEQ differed from
country to country. These differences may result from different food consumption habits in the
participating countries. On the other hand, other factors may also be involved. These include factors
related to the applied sampling strategy (e.g. differences in the coverage of products collected to
represent the whole food group) and the large variations in concentrations of dioxin related
substances in some of the food groups (e.g. vegetables and fruits, eggs and fish).
In most countries, young children will have a higher intake per kg body weight than adults.
This is especially true during the breast-feeding period. On a body weight basis, the intake of breast-
fed infants has been estimated to be 1 to 2 orders of magnitude higher than the average adult intake.
For high level consumers of one or more of the dioxin-containing products the contribution from
these products could be of significant importance for the total dietary intake of dioxins and dioxin-
like PCBs.
A few countries (i.e. Finland, Germany, Netherlands, Sweden and the United Kingdom)
reported sufficient data for the establishment of time trends. These data clearly reveal that the
exposure of the general population to dioxins is declining. For Germany, Finland, Netherlands and
Sweden this decline is also noted for concentrations in human milk.
Recommendations
The participants in this SCOOP task recommend to repeat this collation of occurrence and food
consumption data every 5 or 10 years because it is extremely valuable to compare and to follow
temporal trends in the exposure of the populations of different European countries to dioxin and
related compounds. In this regard, European countries other than those that took part in SCOOP
Task 3.2.5 are strongly encouraged to add their information into the established SCOOP database,
and to take part in any future EU scale dioxin project.
Future studies should not only focus on national average concentrations but also on the
distribution of these concentrations. Wherever possible, the sources most likely to lead to the
occurrence of these compounds should be identified. In order to allow these type of investigations,
analytical data should become available on a congener specific basis rather than on a TEQ basis
only. In order to improve the comparability of information on dioxin-like PCBs, it is strongly
recommended to include the whole selection of dioxin-like PCB congeners as recommended by
WHO (Van den Berg et al., 1998). Furthermore, interlaboratory comparison studies should be

Report SCOOP Task 3.2.5 (Dioxins) Page 12 of 115Final Report, 7 June, 2000
conducted in EU or other international framework in order to be able to assess the between-lab
comparability of the chemical information included in the database.
Report SCOOP Task 3.2.5 (Dioxins) Page 13 of 115Final Report, 7 June, 2000
1 INTRODUCTION
This project has been carried out at the request of the Commission of the European Communities as
a SCOOP project. The task was co-ordinated by the Dutch and Swedish authorities. The objectives
of the specific task were to provide a scientific basis for the evaluation and management of risks to
public health arising from exposure to dioxin and related compounds as contaminants in food,
including human milk, in all participating countries.
Emphasis was put on the occurrence of PCDDs, PCDFs and related PCBs in foods, and the resulting
dietary exposure of the general population. The PCBs were those with dioxin-like toxicity, i.e. PCB
congeners with the same mechanism of action and resulting in biochemical and toxic responses in
animals and humans comparable to that of 2,3,7,8-tetrachlorodibenzo-p-dioxin (2,3,7,8-TCDD).
The present selection of dioxin-like PCBs includes the 3,3',4,4'-chlorine substituted non-ortho
(planar) PCB congeners, and the mono-ortho PCB congeners with a planar or nearly planar
conformation, and a geometrical size similar to 2,3,7,8-substituted dioxins and furans. As the
toxicity of the different substances varies, toxic equivalency factors (TEFs) were used to express
concentrations and exposures in toxic equivalents of 2,3,7,8-TCDD (TEQ).
It should be noted that the compilation of data on the human exposure to dioxins and related
compounds has been the subject of various international studies conducted in the past few years. For
instance, a very informative document containing an extensive compilation of data on
concentrations of PCDDs and PCDFs in foods and human milk, and resulting intakes for the general
population, has been published in Volume 69 of IARC’s Monographs on the Evaluation of
Carcinogenic Risks to Humans (IARC, 1997). In October 1999, AEA Technology presented a
comprehensive report in the framework of a project entitled “Compilation of EU Dioxin Exposure
and Health Data” (AEA Technology, 1999). A significant part of the SCOOP database will compile
the same information as published in the above mentioned reports. However, it will also contain
more recent material resulting from studies conducted until the end of 1999. In addition, it will
contain information on dioxin-like PCBs, which were not taken into consideration in the other
reports.

Report SCOOP Task 3.2.5 (Dioxins) Page 14 of 115Final Report, 7 June, 2000
Ten countries (Belgium, Denmark, Finland, France, Germany, Italy, Netherlands, Norway, Sweden
and United Kingdom) announced an interest to take part in this task. The task was started in June
1998, and has been coordinated by the National Institute of Public Health and the Environment
(RIVM) in Bilthoven, the Netherlands, and the National Food Administration (NFA) in Uppsala,
Sweden. Four meetings with all the delegates participating in this project and several preparatory
meetings took place to elaborate the present report.
Report SCOOP Task 3.2.5 (Dioxins) Page 15 of 115Final Report, 7 June, 2000
2 BACKGROUND
2.1 PCDDs and PCDFs
The term ‘dioxins’ refers to a group of polychlorinated, planar aromatic compounds with similar
structures, chemical and physical properties. This group of compounds consists of 75 dibenzo-p-
dioxins (PCDDs) and 135 dibenzofurans (PCDFs), of which 2,3,7,8-TCDD is the most toxic and
most studied congener. Dioxins are lipophilic compounds that bind to sediment and organic matter
in the environment and tend to be absorbed in animal and human fatty tissue. The seventeen 2,3,7,8-
chlorine substituted PCDD and PCDF congeners in particular are extremely resistant towards
chemical and biological degradation processes and, consequently, persist in the environment and
accumulate in the food chain.
Dioxins are not produced commercially and have no applications, other than for preparation
of analytical standards and research materials. They are formed during combustion processes in, for
example, waste incinerators or as unwanted by-products of industrial processes. Evaporation from
chlorophenol wood preservatives, emission by sinter industries, the use of defoliants, the
preparation of herbicides, traffic and bleaching of paper pulp using chlorine are also known to
contribute to environmental contamination with dioxins. The incineration of municipal, industrial
and hazardous waste is generally considered as the major contributor of dioxin emissions into air.
At the end of 1980s, various countries took a number of regulatory measures to reduce the
emissions of dioxins. Since then, the environmental release of dioxin-like compounds has been
reported to have decreased as a result of changes in industrial practices and because of the ban on
the production or use of products containing these compounds. Several studies on PCDDs and
PCDFs in sediment cores have shown that highest dioxin levels occurred in the 1960s and 1970s,
and that a gradual decrease in these levels can be observed since the 1980s (Beurskens et al., 1991;
Rappe, 1992; Basler, 1994; Liem and Van Zorge, 1995).
Most of the dioxins enter the environment by emission to air, due to which deposition may occur
both near and far away from the source. In industrialized countries, dioxins have been identified in
almost all environmental compartments. Relatively little is known about the fate of dioxins released
into the environment, i.e. transport, distribution and transformation. Based on the available
occurrence data, evidence has grown that environmental residence times are in the order of many
years (WHO/IPCS, 1989; Fiedler et al., 1990; IARC, 1997; Liem and Theelen, 1997).
A broad spectrum of toxic and biochemical effects has been reported for PCDDs and PCDFs
in laboratory animals. For laboratory animals the most sensitive endpoints are endometriosis,
Report SCOOP Task 3.2.5 (Dioxins) Page 16 of 115Final Report, 7 June, 2000
developmental neurobehavioral (cognitive) effects, developmental reproductive (sperm counts,
female urogenital malformations) effects and immunotoxic effects. TCDD has been shown to be
carcinogenic in several species at multiple sites. Short-term studies, however, have shown a lack of
direct DNA-damaging effects, illustrating that TCDD is not an initiator but a promoter of
carcinogenesis.
A few well-known accidents and incidents revealed human health problems probably related
to exposure to high levels of dioxin related compounds. In general, co-exposure to dioxins, PCBs
and possible other contaminants can not be excluded in these accidents. Therefore, the observed
effects can not be exclusively associated with exposure to either dioxin or PCB congeners. Cloracne
correlates consistently with high exposure of humans to TCDD.
Epidemiological evidence from the most highly 2,3,7,8-TCDD exposed cohorts studied
produces the strongest evidence of increased risks for all cancers combined, along with less strong
evidence of increased risks for cancers of particular sites. Such associations have become apparent
after a latency period of more than 5 years in accidentally highly exposed people in Seveso or after
more than 20 years in occupationally exposed people.
Non-cancer endpoints were evaluated among groups exposed to dioxins, dioxin-like and
non-dioxin-like polychlorinated aromatic compounds with a variety of exposure scenarios. A WHO-
ECEH and IPCS consultation has observed that among children exposed in utero to background
levels, subtle endocrine and developmental alterations may occur that could persist for long times.
Of the many effects evaluated in highly exposed adult populations, many were transient effects
disappearing after the end of the high exposure (WHO, 1999; CCFAC, 2000).
2.2 Dioxin related compounds
In the last few years the extent to which other compounds structurally related to the group of
2,3,7,8-substituted PCDD and PCDF congeners exert biochemical and toxic responses similar to
that of 2,3,7,8-TCDD has been repeatedly questioned. It is obvious that a number of different
classes of halogenated compounds might belong to this group (also referred to as 'dioxin related' or
'dioxin-like' compounds), but the strongest evidence has been shown for some of the
polychlorinated biphenyls with a planar or nearly planar conformation.
2.2.1 PCBs
The group of polychlorinated biphenyls (PCBs) consists of 209 congeners of which 130 are likely to
occur in commercial products. PCBs have been produced commercially under various product

Report SCOOP Task 3.2.5 (Dioxins) Page 17 of 115Final Report, 7 June, 2000
names such as Aroclor, Clophen and Kanechlor. These products are PCB mixtures containing both
coplanar and non-planar congeners and have been used in various technical applications. The
marketing and use of PCBs has been very restricted in the EU through Directive 85/467/EC, and
some European countries, as Sweden, had even banned the use of PCBs as early as 1973. An
international convention, the POPs (Persistent Organic Pollutants) Convention, currently in
negotiation, aims to ban the production and use of PCBs worldwide. Today, PCBs are widely
spread. They are largely present in transformers and capacitors where they were used as dielectric
fluids, but also in building material, carbon less copy paper, lubricants, surface coatings, adhesives,
plasticizers, and inks among other uses. Council Directive 96/59/EC of 16 September 1996 on the
disposal of PCBs and polychlorinated terphenyls (PCTs) lays down provisions for the
decontamination and/or disposal of equipment containing these chemicals. According to this
Directive, Member States have to establish inventories of equipment with more than 5 litres of
PCB/PCTs and have to submit plans for the decontamination and/or disposal of equipment
containing PCBs to the Commission by September 1999. Since most Member States have not
fulfilled their duties yet, the Commission is examining whether infringement procedures should be
started against those Member States. Although immediate decontamination and/or disposal of
contaminated equipment is aimed at, the deadline for the decontamination/disposal of equipment
containing more than 5 litres of PCBs is 2010. However, some Member States, especially northern
countries, have established earlier deadlines at national level.
The earliest symptoms of high PCB exposure are reversible dermal and ocular effects.
Respiratory complaints could be persistent for some years. Recent data indicate that fetal exposure
to PCBs may be associated with cognitive deficits in infants and young children. These effects were
measured in infants from mothers exposed to relatively high levels of PCBs due to a prolonged
consumption of contaminated fish. In addition to the cognitive effects, an increase in tumour
incidence and neurological, endocrine, hepatotoxic and immunotoxic effects were observed in
populations in Yusho, Japan (1969) and Yu-Cheng, Taiwan (1979) that were accidentally exposed
to rice oil contaminated with high levels of PCBs, PCDFs and polychlorinated quaterphenyls
(PCQs).
For PCBs, almost all the available epidemiological data originate from studies in workers
occupationally exposed to PCBs. The studies reported thus far do not support a causal association
for PCBs and human cancer. Study limitations and inconsistent findings among studies cause
inconclusive results. Based on animal carcinogenicity data, both IARC and US-EPA classified
PCBs as probably carcinogenic to humans (CCFAC, 2000).

Report SCOOP Task 3.2.5 (Dioxins) Page 18 of 115Final Report, 7 June, 2000
In summary, there are many biological and toxic effects reported for the group of PCBs. Some PCB
congeners may adopt a planar 'dioxin-like' chemical structure and have indeed been found to
resemble TCDD in its biochemical and toxicological properties. Other PCBs elicit effects that are
probably not or only partly related to a dioxin-like mechanism of action (Van den Berg et al., 1998).
2.2.2 Other compounds
Besides PCBs, other structurally related compounds have been demonstrated to elicit dioxin-like
activity. These include any or all of the following classes of polyhalogenated compounds: benzenes,
naphthalenes, diphenyl ethers, diphenyl toluenes, phenoxy anisoles, biphenyl anisoles, xanthenes,
xanthones, anthracenes, fluorenes, dihydroanthracenes, biphenyl methanes, phenylxylylethanes,
dibenzothiophenes, quaterphenyls, quaterphenyl ethers, and biphenylenes. However, due to the lack
of information on environmental occurrence and the limited data to compare their toxicity relative
to that of 2,3,7,8-TCDD, no international agreement has yet been reached to derive TEFs for
compounds other than the group of dioxin-like PCBs (Van den Berg et al., 1998).
2.3 Background exposure
For the general human population, the major pathway of exposure to dioxins and PCBs is food.
Over 90 percent of human exposure is estimated to occur through the diet, with foods of animal
origin usually being the predominant sources. Contamination of food is primarily caused by
deposition of emissions of various sources (e.g. waste incineration, production of chemicals, metal
industry) and a subsequent accumulation in the food chain in which they are particularly associated
with fat. Other sources may include contaminated feed, improper application of sewage sludge,
flooding of pastures, waste effluents and certain types of food processing (Fürst et al., 1992;
Malisch, 1998; McLachlan and Riechter, 1998; Rappe et al., 1998; Bernard et al., 1999).
Within the general population, some sub-populations may be exposed to higher amounts of
dioxins and PCBs as a result of particular consumption habits (e.g. nursing infants, high level
consumers of fish from contaminated areas). The high exposures of nursing infants during periods
of breastfeeding has led to a worldwide concern and to many studies to evaluate the presence of
dioxin related compounds in human milk in different countries (WHO/ECEH, 1996).

Report SCOOP Task 3.2.5 (Dioxins) Page 19 of 115Final Report, 7 June, 2000
2.4 Accidental and occupational exposure
As mentioned before, several accidents have been reported to cause excess human exposure to
dioxins and PCBs. Well-known examples of accidental exposure of the local population to PCDDs,
PCDFs and PCBs include the explosion of the 2,4,5-trichlorophenol factory at Seveso, and fires in
PCB filled electrical equipment. High exposure may also be caused by food items accidentally
contaminated. Known examples are the extremely high contamination of edible rice oils, such as the
Yusho (1968) and Yu-Cheng (1978) food poisoning episodes.
In the last few years, a few cases occurred of dioxin (and PCB) contamination of animal
feeds and foods. This includes the dioxin contamination of Brazilian citrus pulp pellets (an
ingredient for feeding stuffs) in 1997-1998 (Malisch, 1998), the contamination of animal feeds with
PCBs and dioxins in Belgium in the spring of 1999 (Bernard et al., 1999), and the dioxin
contamination of kaolinitic clay (a feed additive) from some mines in the USA (Rappe, 1998) and
Germany (Jobst, 1999). In each of these cases preventive measures were taken to avoid a further
distribution of contaminated products and to protect the consumer against foods with elevated levels
of dioxins and PCBs.
Occupational activities, such as at waste incineration plants or during the manufacture of
chlorinated compounds (e.g. chlorophenols, chlorophenoxy herbicides) may also result in elevated
exposures (WHO/IPCS, 1989, IARC, 1997). This is not only true for the chemical(s) produced but
also for impurities formed during the manufacture like 2,3,7,8-TCDD as by-product in formulations
of 2,4,5-T (2,4,5-trichlorophenoxy acetic acid). It is important to note that for occupational exposure
to chemicals other pathways such as exposure through inhalation of air may become much more
relevant than exposure from food. It should also be taken into consideration that the general
population is currently exposed to levels of dioxins, which are several orders of magnitude lower
than those experienced by the accidentally or occupationally exposed cohorts.
2.5 Toxic Equivalency Factors
TCDD is the most potent and most studied dioxin congener. Because environmental and biological
samples in general contain complex mixtures of different dioxin congeners, the concept of Toxic
Equivalency Factors (TEFs) has been developed to facilitate risk assessment. These TEFs have been
established to express concentrations of mixtures of 2,3,7,8-substituted PCDDs and PCDFs, and
more recently, some planar non-ortho and mono-ortho chlorine substituted PCBs in toxic
equivalents (TEQs) of 2,3,7,8-TCDD. The concentrations of the individual substances in a given

Report SCOOP Task 3.2.5 (Dioxins) Page 20 of 115Final Report, 7 June, 2000
sample are multiplied by their respective TEF and subsequently summed to give total concentration
of dioxin-like compounds expressed in TEQs (see Annex 1). The sum of all these individual TEQ
contributions represents the total content of dioxin-like compounds in the sample expressed in
TEQs.
In 1988, Nordic experts recommended a standardized set of TEF values (N-TEFs) for the
PCDDs and PCDFs (Ahlborg et al., 1988). In the same year, an internationally harmonized scheme
of TEFs for PCDDs and PCDFs (I-TEFs) was published by NATO/CCMS (1988). In 1994 this was
followed by a WHO recommended list of PCB-TEFs for a selection of non-, mono- and di-ortho
PCBs (Ahlborg et al., 1994). In 1997, a WHO-consultation re-evaluated the TEFs for PCDDs,
PCDFs and dioxin-like PCBs on the basis of an improved database of toxicological information
(Van den Berg et al., 1998). Revisions were made in the list of I-TEFs of NATO/CCMS (1988) and
in the list of PCB-TEFs published by Ahlborg et al. (1994). These TEF schemes are presented in
Annex 1. The use of the new WHO-TEFs instead of the old set of I-TEFs and PCB-TEFs will
certainly lead to changes in the TEQ values calculated. The extent of these shifts will, however,
depend on the concentrations of the congeners with a revised TEF. The change in the TEF value for
1,2,3,7,8-PeCDD from 0.5 to 1, for instance, will lead to a slight increase in the TEQ value
(estimates range between a few % up to 20%)5, whereas the exclusion of the di-ortho substituted
PCBs 170 and 180 will lead to a lower TEQ value. Differences can be expected in the occurrence of
dioxins and PCBs in foods between the various countries. Therefore, it is considered too speculative
to provide a general estimate of the effects on the TEQ values for foods and dietary intakes resulting
from use of the new WHO-TEFs instead of the previous I-TEFs and PCB-TEFs.
2.6 Risk assessment
Several international expert groups in the field of the health risk assessment of dioxins and related
compounds have been convened. A Nordic expert group proposed a tolerable daily intake (TDI) of 5
pg/kg body weight (bw) for TCDD and structurally similar chlorinated PCDDs and PCDFs, based
on experimental studies on cancer, reproduction and immuno-toxicity. At a WHO meeting in 1990,
a TDI of 10 pg/kg bw for TCDD was established, based on liver toxicity, reproductive effects and
immunotoxicity, and making use of kinetic data in humans and experimental animals. Since then
5 Based on a large dataset of concentrations of PCDDs and PCDFs in human milk from Germany (n=1732, period 1989-
1998), the PCDD/F-WHO-TEQ appeared to be on average 16% higher than the corresponding dioxin level expressed in
I-TEQ (see contribution of Germany in Annex 2).
Report SCOOP Task 3.2.5 (Dioxins) Page 21 of 115Final Report, 7 June, 2000
new epidemiological and toxicological data have emerged, in particular with respect to
neurodevelopmental and endocrinological effects.
In May 1998, a consultation convened by the WHO-ECEH and IPCS re-evaluated the
available information and established a TDI range of 1-4 pg TEQ/kg bw for dioxins and dioxin-like
PCBs. The consultation focused on the most sensitive effects which are considered adverse
(hormonal, reproductive and developmental effects) seen at low doses in animal studies. These
effects occur at body burdens in rats and monkeys in the range of 10-50 ng/kg bw. Human daily
intakes corresponding with body burdens similar to those associated with adverse effects in animals
can be estimated to be in the range of 10-40 pg/kg bw/day. Since body burdens have been used to
scale doses across species, the WHO-consultation concluded that the use of an uncertainty factor to
account for interspecies differences in toxicokinetics is not required. However, the estimated human
intake was based on Lowest Observed Adverse Effect Level (LOAELs) and not on No Observed
Adverse Effect Level (NOAELs). Although for many parameters humans might be less sensitive
than animals, uncertainty still remains regarding animal to human susceptibilities. Furthermore,
differences exist in the half lives of elimination for the different components of a TEQ mixture. To
account for all these uncertainties, a composite uncertainty factor of 10 was recommended. The
WHO-consultation recognised that subtle effects might already be occurring in the general
population in developed countries at current background levels of exposure to dioxins and related
compounds. It therefore recommended that every effort should be made to reduce exposure to the
lower end of the advised range of 1-4 pg TEQ/kg bw/day (WHO, 1999).
When compared to adults, breast-fed infants are exposed to higher intakes of PCDDs,
PCDFs and PCBs on a body weight basis, although for a limited time only. This subject was also
discussed at the same WHO consultation on re-evaluation of the TDI. The consultation noted that in
studies of infants, breastfeeding was associated with beneficial effects, in spite of the contaminants
present. The subtle effects noted in the studies were found to be associated with transplacental,
rather than lactational exposure. The consultation therefore reiterated conclusions of previous WHO
meetings on the health significance of contamination of breast milk with dioxin-like compounds,
namely, that the current evidence does not support an alteration of WHO recommendations which
promote and support breast feeding (WHO, 1999).
In several other countries, TDIs have been established for TCDD ranging from 1 to 10 pg
TCDD/kg bw. The U.S. Environmental Protection Agency (EPA) calculated a safe dose applying
the Linear Multistage Model to liver tumour data observed in female rats after chronic exposure to
TCDD. In this model TCDD is treated as a genotoxic carcinogen, with the assumption that no
Report SCOOP Task 3.2.5 (Dioxins) Page 22 of 115Final Report, 7 June, 2000
threshold dose exists. They arrived at a lowest safe dose of 0.006 pg TCDD/kg bw/day,
corresponding to an acceptable lifetime tumour risk of 10-6. This risk assessment of dioxin is
currently under re-evaluation (EPA, 1994).
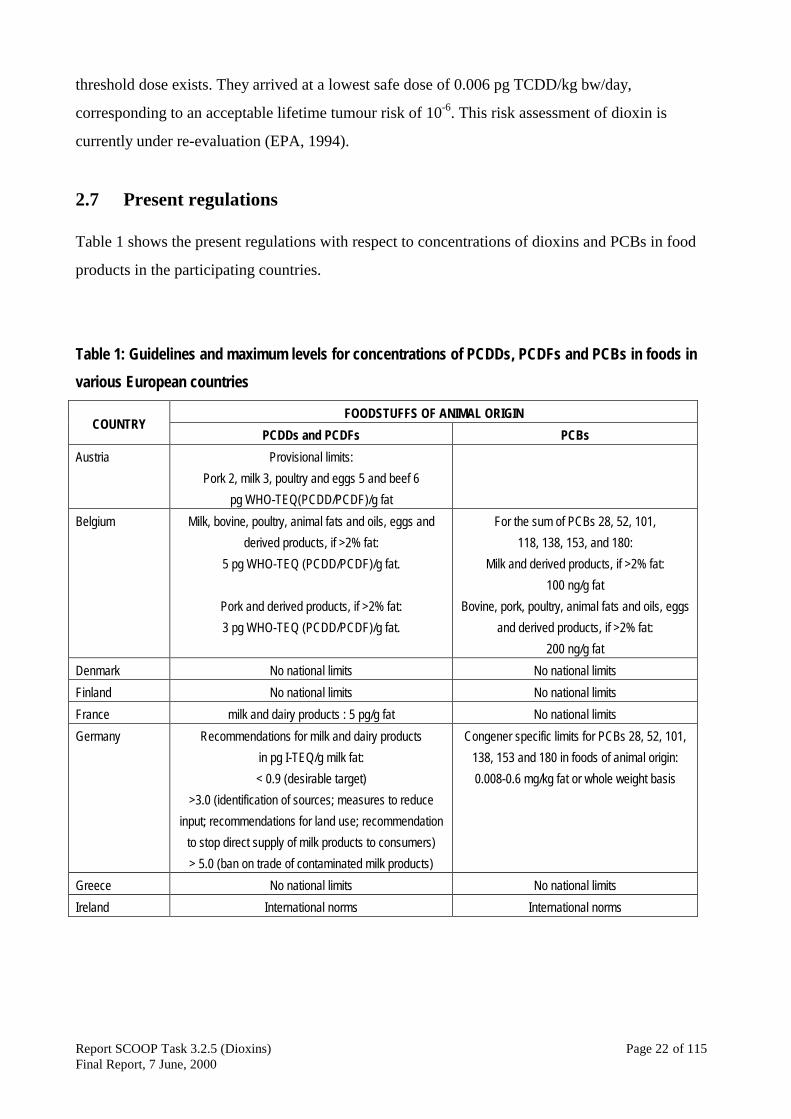
2.7 Present regulations
Table 1 shows the present regulations with respect to concentrations of dioxins and PCBs in food
products in the participating countries.
Table 1: Guidelines and maximum levels for concentrations of PCDDs, PCDFs and PCBs in foods invarious European countries
FOODSTUFFS OF ANIMAL ORIGINCOUNTRY
PCDDs and PCDFs PCBsAustria Provisional limits:
Pork 2, milk 3, poultry and eggs 5 and beef 6pg WHO-TEQ(PCDD/PCDF)/g fat
Belgium Milk, bovine, poultry, animal fats and oils, eggs andderived products, if >2% fat:
5 pg WHO-TEQ (PCDD/PCDF)/g fat.
Pork and derived products, if >2% fat:3 pg WHO-TEQ (PCDD/PCDF)/g fat.
For the sum of PCBs 28, 52, 101,118, 138, 153, and 180:
Milk and derived products, if >2% fat:100 ng/g fat
Bovine, pork, poultry, animal fats and oils, eggsand derived products, if >2% fat:
200 ng/g fatDenmark No national limits No national limitsFinland No national limits No national limitsFrance milk and dairy products : 5 pg/g fat No national limitsGermany Recommendations for milk and dairy products
in pg I-TEQ/g milk fat:< 0.9 (desirable target)
>3.0 (identification of sources; measures to reduceinput; recommendations for land use; recommendation
to stop direct supply of milk products to consumers)> 5.0 (ban on trade of contaminated milk products)
Congener specific limits for PCBs 28, 52, 101,138, 153 and 180 in foods of animal origin:0.008-0.6 mg/kg fat or whole weight basis
Greece No national limits No national limitsIreland International norms International norms
Report SCOOP Task 3.2.5 (Dioxins) Page 23 of 115Final Report, 7 June, 2000
Table 1. Cont'd
FOODSTUFFS OF ANIMAL ORIGINCOUNTRY
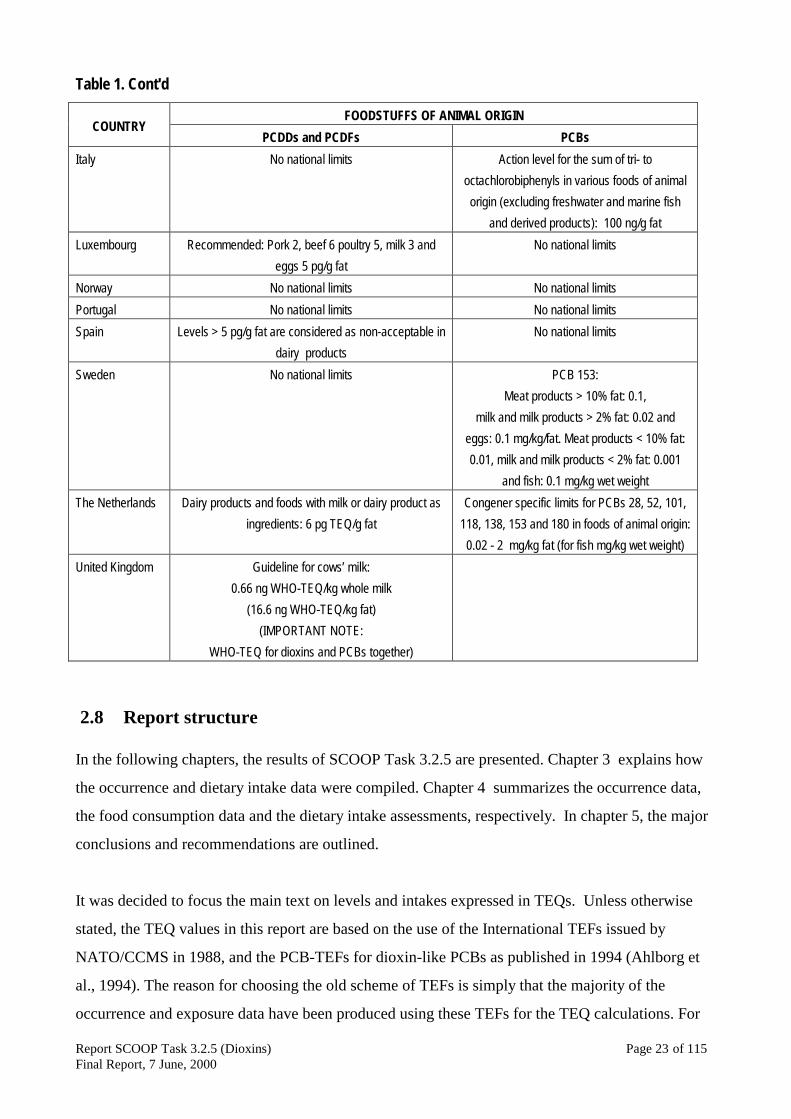
PCDDs and PCDFs PCBsItaly No national limits Action level for the sum of tri- to
octachlorobiphenyls in various foods of animalorigin (excluding freshwater and marine fish
and derived products): 100 ng/g fatLuxembourg Recommended: Pork 2, beef 6 poultry 5, milk 3 and
eggs 5 pg/g fatNo national limits
Norway No national limits No national limitsPortugal No national limits No national limitsSpain Levels > 5 pg/g fat are considered as non-acceptable in
dairy productsNo national limits
Sweden No national limits PCB 153:Meat products > 10% fat: 0.1,
milk and milk products > 2% fat: 0.02 andeggs: 0.1 mg/kg/fat. Meat products < 10% fat:0.01, milk and milk products < 2% fat: 0.001
and fish: 0.1 mg/kg wet weightThe Netherlands Dairy products and foods with milk or dairy product as
ingredients: 6 pg TEQ/g fatCongener specific limits for PCBs 28, 52, 101,
118, 138, 153 and 180 in foods of animal origin:0.02 - 2 mg/kg fat (for fish mg/kg wet weight)
United Kingdom Guideline for cows’ milk:0.66 ng WHO-TEQ/kg whole milk
(16.6 ng WHO-TEQ/kg fat)(IMPORTANT NOTE:
WHO-TEQ for dioxins and PCBs together)
2.8 Report structure
In the following chapters, the results of SCOOP Task 3.2.5 are presented. Chapter 3 explains how
the occurrence and dietary intake data were compiled. Chapter 4 summarizes the occurrence data,
the food consumption data and the dietary intake assessments, respectively. In chapter 5, the major
conclusions and recommendations are outlined.
It was decided to focus the main text on levels and intakes expressed in TEQs. Unless otherwise
stated, the TEQ values in this report are based on the use of the International TEFs issued by
NATO/CCMS in 1988, and the PCB-TEFs for dioxin-like PCBs as published in 1994 (Ahlborg et
al., 1994). The reason for choosing the old scheme of TEFs is simply that the majority of the
occurrence and exposure data have been produced using these TEFs for the TEQ calculations. For
Report SCOOP Task 3.2.5 (Dioxins) Page 24 of 115Final Report, 7 June, 2000
the congener specific data underlying the TEQ values presented in this report, the reader should
contact the contact persons of the participating countries (see list on pages 6 and 7). These contact
persons have access to the complete database with detailed accounts of all information that was
submitted in the framework of this task.

Report SCOOP Task 3.2.5 (Dioxins) Page 25 of 115Final Report, 7 June, 2000
3 METHODOLOGICAL ASPECTS
3.1 Objective
The methodological aspects and the instructions to be followed to compile the occurrence and
exposure data were discussed at a meeting held on 21 October, 1998 in Amsterdam. In order to
achieve a sound scientific basis, the SCOOP Working Group agreed that the report should cover an
evaluation of dietary intakes of PCDDs, PCDFs and dioxin-like PCBs for the general population of
participating countries. In addition, it was considered relevant to include information on sub-
populations with higher intakes (e.g. breast-fed infants, high level consumers of fish) as well as
information, wherever available, on temporal trends in the dietary exposure to these compounds.
3.2 Compilation of data
General
Participating institutes were asked to provide the following information for their country:
- The occurrence of PCDDs, PCDFs and dioxin-like PCBs (list of requested compounds is
attached as Annex 1) in foods and, if available, in human milk.
- Relevant information including sampling and analytical procedures used for the determination
of the compounds analysed in the foods.
- Consumption data of the relevant foods.
- Dietary intake and other relevant exposure data available for their country.
- Summaries of the available information for their country. To this end, an electronic version of a
common table format was distributed to all participants by the co-ordinating institutes to ease
the comparison of data from different Member States.
Occurrence data
Each institute was asked to provide data on concentrations of PCDDs, PCDFs and (dioxin-like)
PCBs in foods and human milk on a lipid adjusted basis (pg/g fat) together with the (mean) fat
content of the sample(s) analysed. If the data were only available on a product basis, the respective
value in combination with the fat content of the sample analysed was requested. For each food
product or food group investigated, the mean (median, if available), the range of concentrations
found and the number of samples analysed was also requested. In the case of analysis of pooled
samples, participants were asked to indicate the average number of samples comprising the pool.

Report SCOOP Task 3.2.5 (Dioxins) Page 26 of 115Final Report, 7 June, 2000
The following information was requested:
- Accurate description of the foods analysed including the origin of the samples, a description of
the sampling area (e.g. industrial, waste incineration, rural, random) and the period of collection
(month/year). If there were more periods in which these foods have been investigated, these data
had to be recorded separately to allow an evaluation of temporal trends.
- Sampling procedures (number of batches, sub-samples, etc.).
- Point of sampling (e.g. port, production sites, retail outlet, etc.)
- Treatment of samples (preparation prior to storage, storage conditions, etc.)
- Information on sample preparation, details of the analytical method, limits of determination
(LOD) and validation of the method (reproducibility, repeatability, analytical recovery etc.).
- Evidence for Analytical Quality Assurance.
- Reference to the published data to allow compilation of an overall bibliography.
Food Consumption Data
Where available, participants were requested to provide representative estimates of the consumption
of the food items for which occurrence data were available. The difficulties in obtaining food
consumption data that are exactly relevant to the particular food are well known. Therefore, it was
suggested that the participants provide any available information, together with sufficient
information to allow the limitations of the data to be assessed. This data was used in an attempt to
identify the main dietary sources of PCDDs, PCDFs and dioxin-like PCBs in each country.
For each of the food items (or groups of foods) and population sub-groups, participants were asked
to give:
- The best estimate of the average consumption (expressed as g/day) for whole populations and
any relevant subgroup (e.g. infants, toddlers, children, adolescents, adults, etc.), with a
specification of age (or age range, if applicable).
- The best estimate of high consumption (90th, 95th or 97.5th%ile, to be stated).
- A reference to the source of the consumption data.
For each source of consumption data, the following information was requested, as available:
Report SCOOP Task 3.2.5 (Dioxins) Page 27 of 115Final Report, 7 June, 2000
- Survey population: for example, information on the individual (specify mean, median and range
of age, sex, body weight, other characteristics), household (specify scope e.g. all, single persons
excluded).
- Survey method: dietary record/diary, duplicate diet (specify period and frequency, weighted
intake, interview, purchase records etc.).
- Period of data collection. Seasonal influences.
- Geographical level, national, regional, urban, rural (specify geographical region covered).
- Sample size (number of participants).
- Scope of data (all foods and beverages consumed, food intake, purchase records, home grown
foods, foods eaten outside the home etc.).
- Other variables (e.g. socio-economic data).
Dietary intake estimates
Participants were asked where possible to provide estimates of intakes of dioxins and dioxin-like
PCBs for each population group, including any previously published data. The procedure used to
estimate mean/median and high level intake had to be clearly described. Intakes had to be expressed
both in pg/person/day and pg/kg bw/day (with body weight clearly stated). If possible the food
sources most contributing to the dietary intake of dioxin related compounds had to be identified.
Description of the database
The database has been set up in Microsoft Excel and Access. The participants were asked to
provide the information in a common format. A workbook containing different worksheets was used
to enter the occurrence, food consumption and intake data.

Report SCOOP Task 3.2.5 (Dioxins) Page 28 of 115Final Report, 7 June, 2000
4 RESULTS AND DISCUSSION
4.1 Occurrence in foods
The collation of occurrence data resulted in a database containing almost 500 entries. Each entry
represented a study revealing concentrations of PCDDs, PCDFs or (dioxin-like) PCBs in individual
or pooled samples from one of the following seven food groups: cereal and cereal products, eggs,
fats and oils, fish and fish products, fruits and vegetables, meat and meat products, and milk and
milk products. A description of the studies resulting in the occurrence data for each of the ten
countries participating in this SCOOP project are presented in Annex 2. The occurrence data are
presented in Annex 3. Some explanation is given below.
Presentation of results
Annex 3 provides information on concentrations of PCDDs, PCDF and dioxin-like PCBs expressed
in pg TEQ/g, on a fat or wet weight basis. Unless otherwise stated, the TEQs presented are upper
bound estimates assuming the concentrations of non-detected congeners equal the limits of
determination (LOD) (for further explanation see the notes at the end of Annex 3).
The number of samples collected, within a pool, and analysed are presented, together with
the fat content, the basis for the concentrations presented (i.e. ‘fat’ or ‘product’ basis) and a
description of the site where the samples were collected. Importantly, each entry has a unique code
(ID) and samples analysed have been designated as ‘representative for the country’ (‘rep’) or as
‘selective sampling’ (‘sel’).
Annex 3 should be considered as a complete overview containing all information considered
relevant for inclusion in the SCOOP database. The study specific ID has been used as a key to a
more detailed account of the study underlying the data incorporated in Annex 3.
General remarks
Analysis of food products for the presence of dioxins and dioxin-like PCBs is generally undertaken
for two purposes, either to enforce current maximum limits, or to assess human exposure to the
compounds concerned. For control purposes, the problem of sampling is large. However, the
sampling problems related to estimation of dietary intakes are even larger. In addition to the
problem related to sampling every single batch or lot of a food product, the samples collected must
be representative. This is so that the mean level of the total number of samples collected represents

Report SCOOP Task 3.2.5 (Dioxins) Page 29 of 115Final Report, 7 June, 2000
a good estimate of the average content in the food product on the market in the particular
geographical area where it is intended to estimate the dietary intake.
Many factors influence how representative surveys of dioxins and related PCBs are: the
actual sampling from every batch, the total number of samples, the number of sampling years,
knowledge about the market in relation to the distribution of samples (for example, knowledge
about the number of producers or farmers, distribution between imported and domestic food
products, etc). These factors are important to consider when mean dietary intake over longer periods
of time is to be estimated. For example a survey of occurrence of dioxins in milk with relatively few
samples and samples from only one season will normally not be representative for the overall
situation in a country. As there are many important factors to be considered when determining how
representative a survey is, it is not possible to set clear objective rules for the judgement of whether
survey data are representative and comprehensive enough for a given country and so relevant for use
in estimating dietary intakes. However, consulting all data in this report and the general scientific
literature, it is often obvious if it is not relevant or scientifically reasonable to use a set of food
occurrence data to estimate dietary intake.
The occurrence data shown in Annex 3 represent measurements performed on samples
collected from various sites, including rural and industrial sites in the vicinity of sources that may or
may not have led to a local contamination with dioxin and related compounds. The samples were
collected in the period 1982-1999. In most cases the reported concentrations appear to be fairly
comparable and fall in the same order of magnitude. Cases of elevated concentrations appear to be
clearly associated with samples originating from specific contaminated sites. Most of the TEQ
concentrations presented in Annex 3 represent an average value resulting from chemical analysis of
a number of individual or pooled samples. This means that the range of concentrations as presented
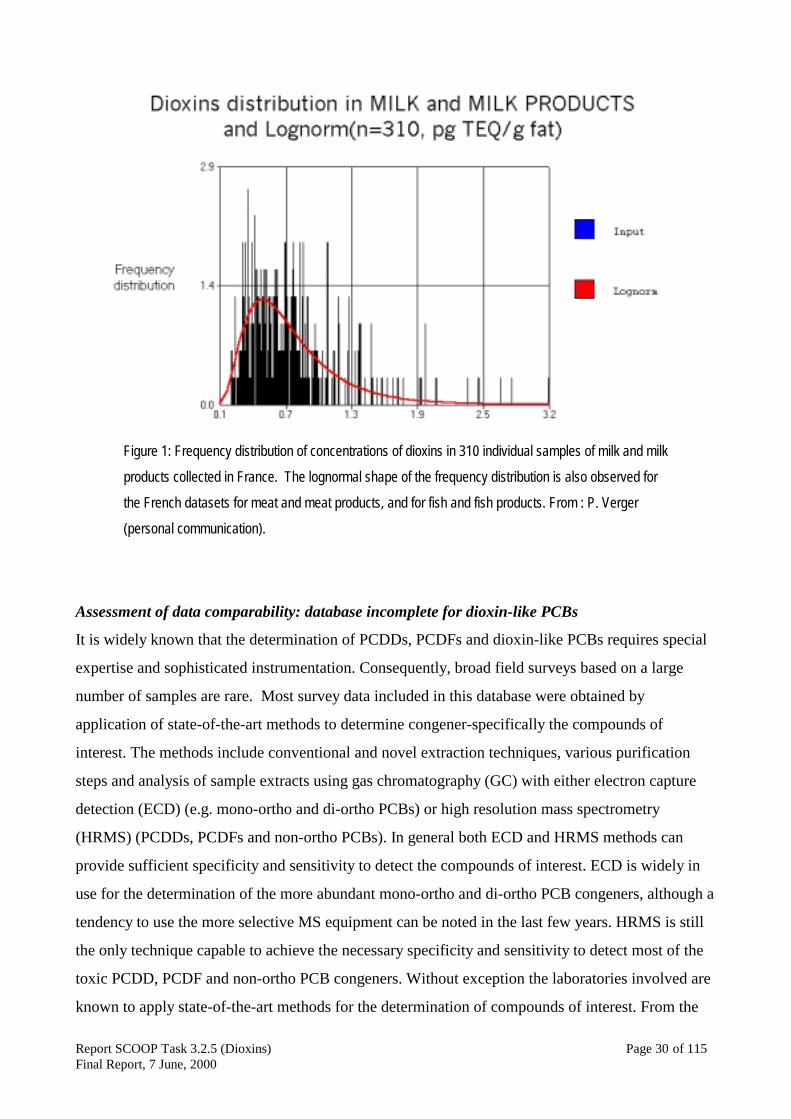
should be considered as a distribution of means. The real distribution of dioxin levels in food
products is illustrated by the French data set for milk and milk products in Figure 1. The lognormal
shape of the frequency distribution is also observed for other food groups.
Report SCOOP Task 3.2.5 (Dioxins) Page 30 of 115Final Report, 7 June, 2000
Figure 1: Frequency distribution of concentrations of dioxins in 310 individual samples of milk and milk
products collected in France. The lognormal shape of the frequency distribution is also observed for
the French datasets for meat and meat products, and for fish and fish products. From : P. Verger
(personal communication).
Assessment of data comparability: database incomplete for dioxin-like PCBs
It is widely known that the determination of PCDDs, PCDFs and dioxin-like PCBs requires special
expertise and sophisticated instrumentation. Consequently, broad field surveys based on a large
number of samples are rare. Most survey data included in this database were obtained by
application of state-of-the-art methods to determine congener-specifically the compounds of
interest. The methods include conventional and novel extraction techniques, various purification
steps and analysis of sample extracts using gas chromatography (GC) with either electron capture
detection (ECD) (e.g. mono-ortho and di-ortho PCBs) or high resolution mass spectrometry
(HRMS) (PCDDs, PCDFs and non-ortho PCBs). In general both ECD and HRMS methods can
provide sufficient specificity and sensitivity to detect the compounds of interest. ECD is widely in
use for the determination of the more abundant mono-ortho and di-ortho PCB congeners, although a
tendency to use the more selective MS equipment can be noted in the last few years. HRMS is still
the only technique capable to achieve the necessary specificity and sensitivity to detect most of the
toxic PCDD, PCDF and non-ortho PCB congeners. Without exception the laboratories involved are
known to apply state-of-the-art methods for the determination of compounds of interest. From the
Report SCOOP Task 3.2.5 (Dioxins) Page 31 of 115Final Report, 7 June, 2000
national contributions included in Annex 2 it also appears that the respective laboratories frequently
participate in intercalibration studies. It can therefore be expected that at least for the seventeen
toxic PCDDs and PCDFs, the non-ortho PCBs 77, 126 and 169, and the selection of PCBs 138, 153
and 1806, there was no doubt about the comparability of the occurrence data.
A problem was however identified in the assessment of the comparability of the occurrence
data for the selection of mono-ortho PCBs. As a matter of fact, the database is rather incomplete
(i.e. too many gaps) to allow an exposure assessment for the total of dioxin-like PCBs on this
supranational scale. The problem is caused by differences between the selections of congeners
measured to assess the total TEQ contribution of the non- and mono-ortho PCBs. It was therefore
decided to extend Annex 3 with information on the selection of congeners determined. In order to
provide consistency, the following rules were defined to sort the information provided in the tables.
1. In order to rank the information on the occurrence of dioxin-like PCBs, three different
classes of PCBs were distinguished, i.e. the non-ortho ('nor_PCBs'), mono-ortho
('mor_PCBs'), non-ortho and mono-ortho PCBs ('All_PCBs'), and 'ICES 7' congeners (see
Annex 3).
2. To justify inclusion of specific data in Annex 3, it was the opinion of the SCOOP Working
Group that the reported data should at least be based on a few important congeners. Selected
on the basis of their general occurrence in foods, and their relative contributions to the total
TEQ, it was decided to use the following congeners as a marker to establish whether or not a
study was to be included:
PCB 126 for non-ortho PCBs,
PCBs 118, 156 and 157 for mono-ortho PCBs, and
PCBs 138, 153 and 180 for the ICES 7 PCBs.
3. In order to justify the inclusion of reported data in the summary tables 2 to 5 (presented
elsewhere in this report), the respective study should at least provide data on PCB congeners
126, 118, 156 and 157. These congeners are known to contribute most to the TEQ
contribution of dioxin-like PCBs.
6 PCB congeners 138, 138 and 180 belong to the selection of PCBs commonly referred to as ICES-7 (see Glossary) or
indicator PCBs. These PCBs have been selected for inclusion in the legislation of many countries.
Report SCOOP Task 3.2.5 (Dioxins) Page 32 of 115Final Report, 7 June, 2000
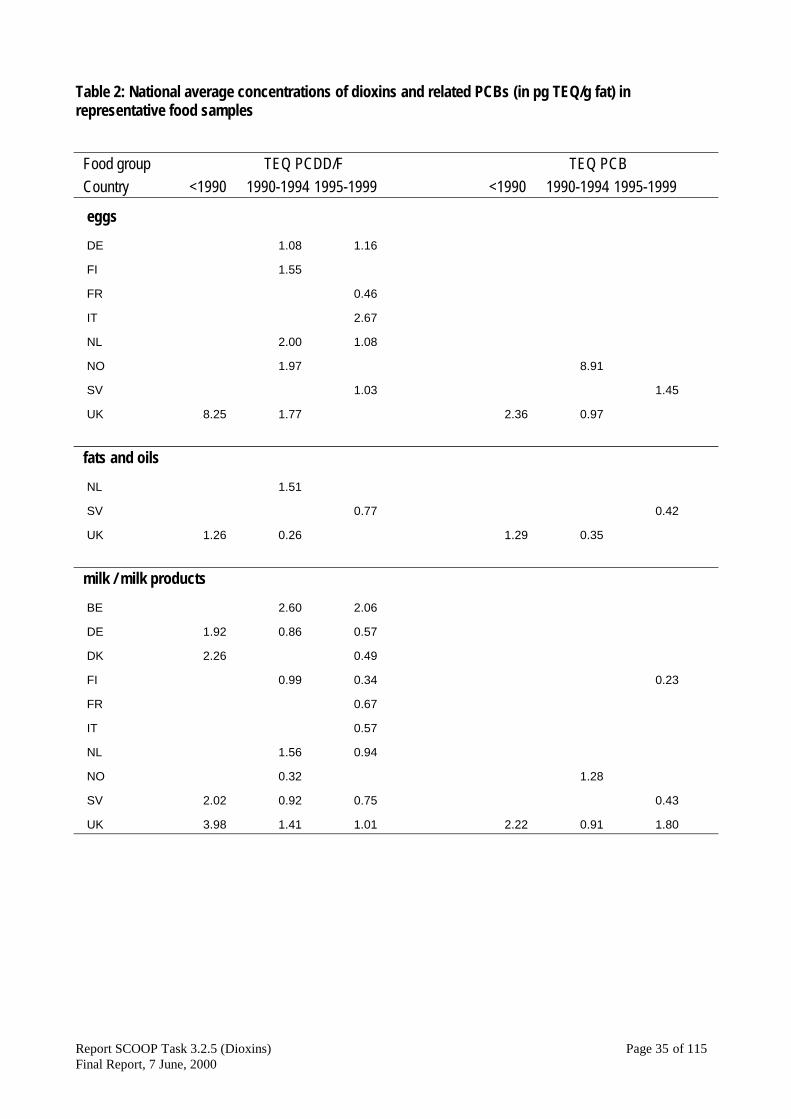
Comparison of national average concentrations
The data resulting from some studies were considered representative for the country and for use in
dietary intake estimates. The judgement of whether the information were representative or not, and
so relevant for intake calculations, was made by the participating countries for their own data. In
order to compare the concentrations observed in these national representative studies, tables 2 to 5
have been composed. Because some influence of source reducing measures in the participating
countries was expected, reported values were aggregated into three consecutive periods and
subsequently averaged to evaluate temporal trends. The resulting national averages are listed in
table 2 for those food groups the concentrations of which are most often expressed on a fat basis
(e.g. eggs, fats and oils, milk and milk products). Table 3 shows the national average concentrations
on a product basis for the cereals, fruit and vegetables food groups. The food groups meat and fish
comprised various sample types and different species. Therefore it was decided to present the
various meats and fish separately in tables 4 and 5, respectively.
Eggs
The most recent surveys on concentrations of dioxins in eggs revealed a range of means between 0.5
and 2.7 pg I-TEQ/g fat. Older studies tend to give a similar picture suggesting that concentrations
have not substantially changed. German studies have shown that dioxin levels in eggs will depend
on the type of housing (cage, ground, field). Lower levels can be expected for eggs from hens
housed in elevated wire cages, while higher levels can be found in eggs from hens that may ingest
dioxins from soil (see German contribution in Annex 2 and data in Annex 3). There are only a few
studies giving information on levels of dioxin-like PCBs. The limited information shows PCB-TEQ
contributions in the same range as for the I-TEQs. A relatively high PCB-TEQ value was reported in
a Norwegian study.
Fats and oils
There are many different types of fats and oils of either vegetable or animal origin (e.g. fish oils)
that are used in the food industry in the manufacture of different types of food products. A few
studies have been reported by the Netherlands, Sweden and the United Kingdom providing national
average estimates of the dioxin and PCB content of these fats and oils. I-TEQ and PCB-TEQ
concentrations have both been found to be around or below 1 pg TEQ/g fat. Levels are likely to be
higher in fish oils compared to other oils. The studies reported indicate concentrations in vegetable
oils to be around the limits of determination, and varying levels in fish oils. It is important to note

Report SCOOP Task 3.2.5 (Dioxins) Page 33 of 115Final Report, 7 June, 2000
that reported levels in fats and oils may or may not represent the levels in food products brought
onto the market by the food industry. Geographical origin, the effect of different refinery methods
(which has been shown to reduce the level of contaminants) and the actual price of those fats and
oils on the (international) market are important determinants for concentrations of dioxins and PCBs
in the composition of fats and oils incorporated in food products (Liem and Theelen, 1997).
Milk and dairy products
The various reports on the occurrence of elevated dioxin levels in the neighbourhood of waste
incinerators and other point sources has possibly led to the rather comprehensive database for
concentrations of dioxins and PCBs in milk fat as we have it today. The most recent surveys show
national average concentrations within the range of 0.3-2.1 pg I-TEQ/g and 0.2-1.8 pg PCB-TEQ/g
fat for PCDD/Fs and dioxin-like PCBs respectively.
Many factors should be considered to explain the concentrations of dioxins and PCBs in
milk and derived products. At present it is obvious that the deposition on farmland of dioxins
emitted through either point or diffuse sources (Fürst et al., 1992; Liem and Theelen, 1997), as well
as concentrations present in animal feedstuffs (e.g. Malisch, 1998; Bernard, 1999) are important
routes of exposure for cattle. Some effect might therefore be expected from all regulatory measures
implemented in the last decade to reduce the dioxin emissions into the environment (Liem and Van
Zorge, 1995). As a matter of fact, the national average dioxin levels as presented in table 2 indeed
clearly indicate a declining trend in concentrations of dioxins in milk products.
Cereals, fruit and vegetables
The results from the most recent surveys show relatively low concentrations in cereals, fruit and
vegetables, mostly around or below the limits of determination (around 0.05-0.1 pg TEQ/g product).
The underlying congener specific data often showed non-detects, implying that the upper bound
estimates presented in table 2 may overestimate the true concentrations to some extent. It should
however be noted that the foods belonging to these food groups are generally consumed in relatively
high amounts. Some caution should therefore be taken into account when the results are interpreted
in terms of contributions to intake (see chapter 4.3).
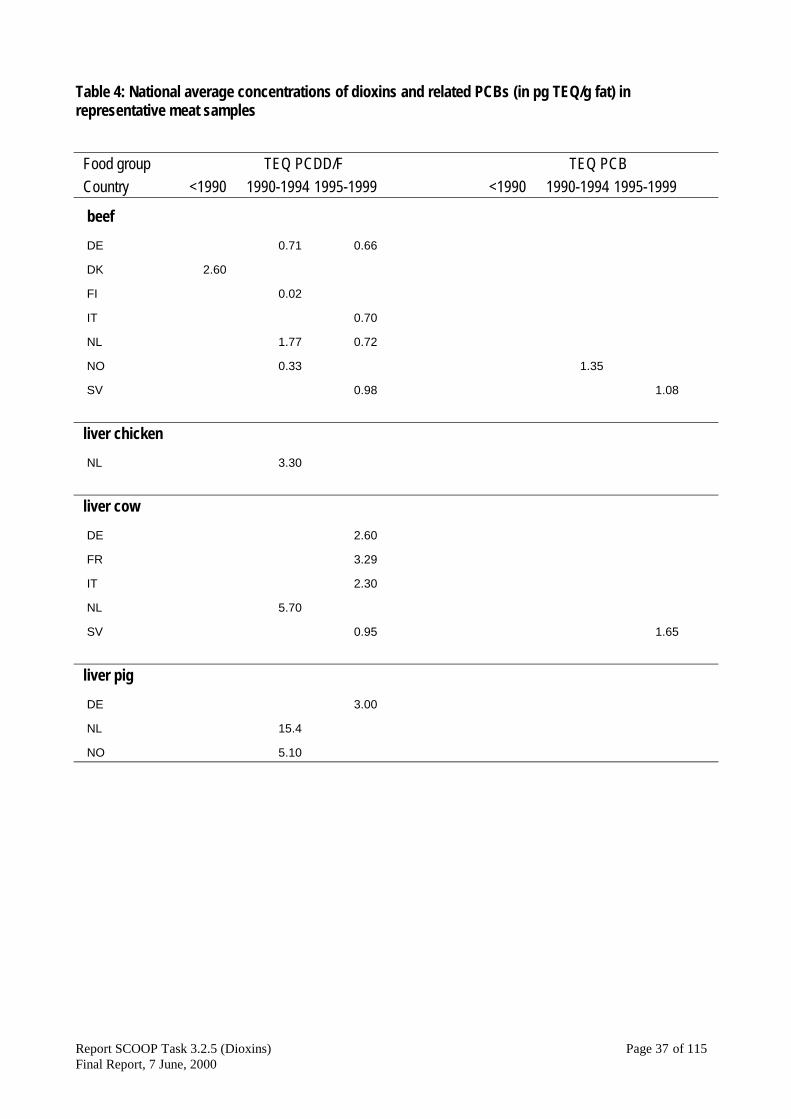
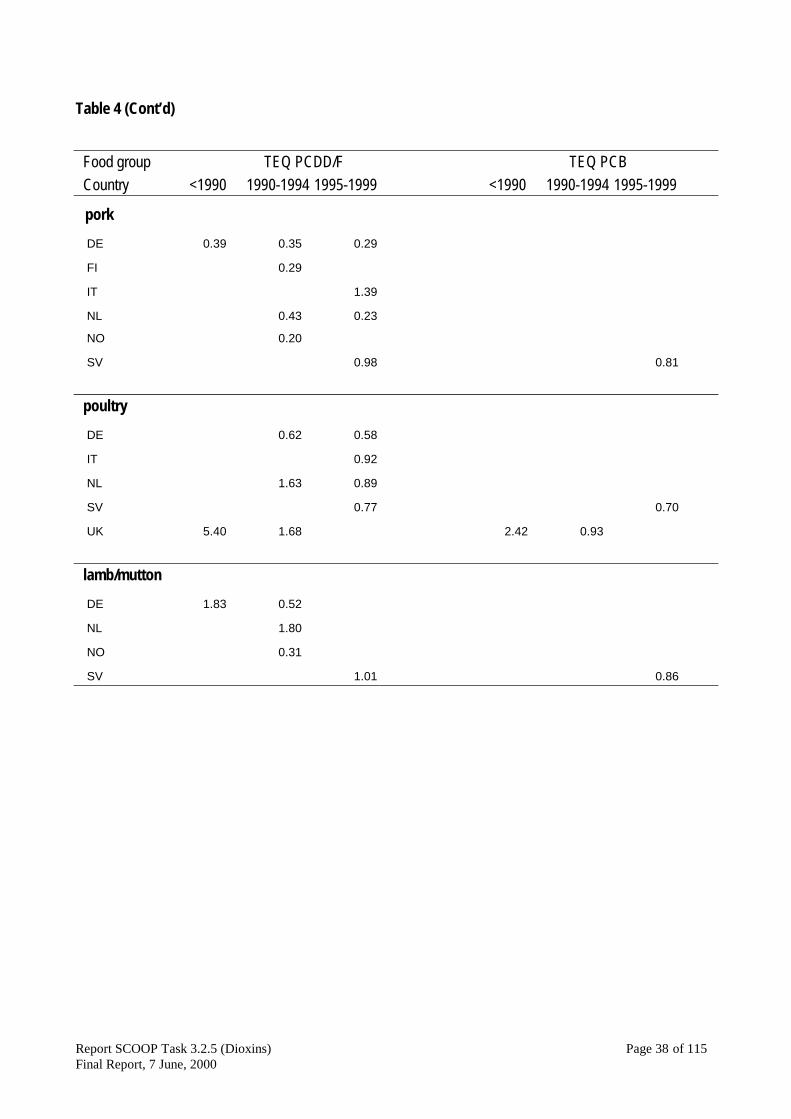
Meat and meat products
A large database also exists for levels of dioxins in different types of meat. The food groups most
commonly consumed across Europe include beef, pork, poultry and to some extent also mutton. The

Report SCOOP Task 3.2.5 (Dioxins) Page 34 of 115Final Report, 7 June, 2000
studies providing information on national average concentrations are presented in table 4. If the
levels are expressed on a fat basis, mean dioxin levels in pork are in most cases lower than those
reported for beef, poultry and mutton. In addition, concentrations on fat basis in animal livers are
without exception relatively higher than the concentrations in the fat tissue of the same animal
species. For beef, poultry and mutton, the mean dioxin concentration is in the range of 0.6 to 1.0 pg
I-TEQ/g fat. For pork, most studies show levels of below 0.4 pg I-TEQ/g fat. Unfortunately, there
are only a few studies were all relevant dioxin-like PCBs have been determined in different types of
meats. The limited database shows that TEQ contributions of dioxin-like PCBs are almost similar to
those of the PCDDs and PCDFs.
Some studies indicate an inconsistency with the general ranking that 'levels in pork are lower
than in other types of meat', and this is in particular the case for the Italian and Swedish data. The
reported average dioxin concentrations for pork appeared to be equal to (Sweden) or higher than
(Italy) the national averages for beef. The Italian data represents imported meat (Annex 2). The
Swedish data is probably a result of relatively high limits of determination leading to large
difference between the lower and upper bound estimate (0.4 vs. 1.0 pg I-TEQ/g fat, respectively).
Although it is still unclear why the Italian and Swedish data differ from those reported by other
countries, it illustrates that certain variations may occur in the dioxin concentrations in foods
consumed across Europe. Besides, in view of the growing European food market, a certain influence
on the national average concentrations can not be excluded in the near future.
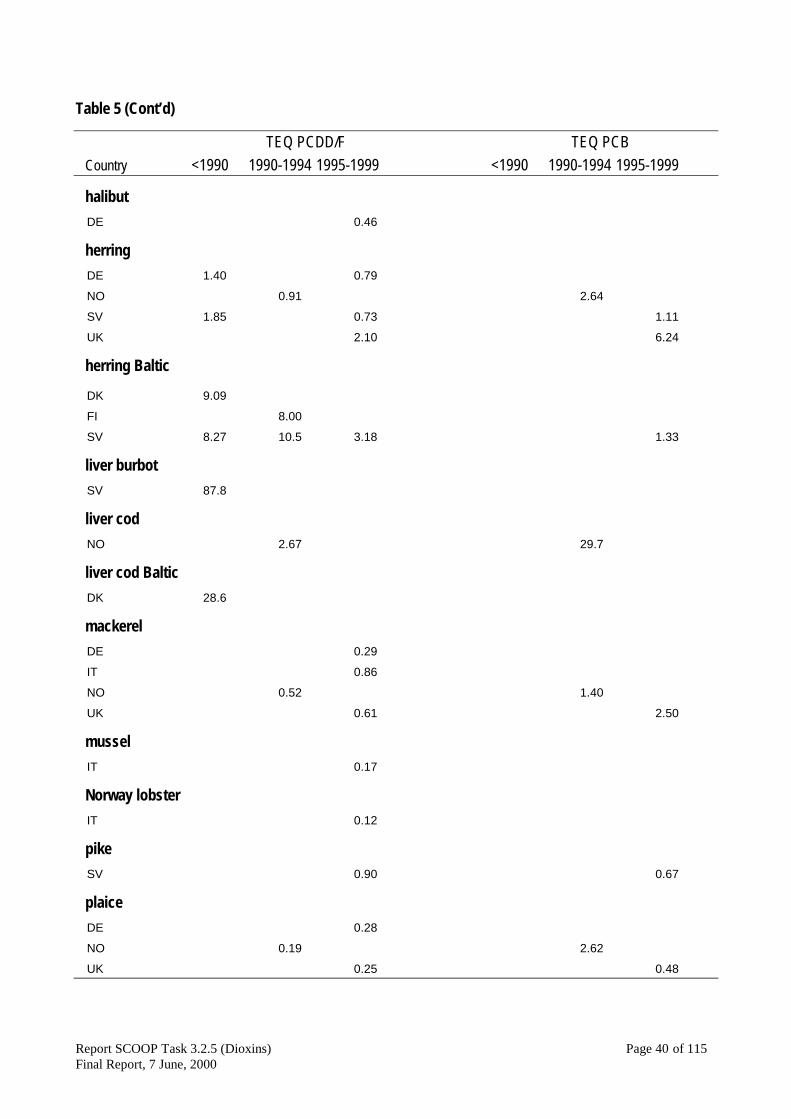
Fish and fish products
The most inhomogeneous food group is formed by the fish and fish products (table 5). This is not
only due to the large number of different fish species, but also to the geographical differences in the
level of contamination of the various fishing grounds from which these fish originate. The
concentrations of dioxins and PCBs vary considerably. Many species contain dioxins and dioxin-
like PCBs at levels below 1 pg I-TEQ/g and 1 pg PCB-TEQ/g wet weight, respectively. In some fish
species such as crab, eel, and whitefish, higher concentrations should be taken into consideration.
The same holds for fish caught in relatively higher polluted areas such as Baltic herring, and fish
products (e.g. cod liver) from the same region.
Report SCOOP Task 3.2.5 (Dioxins) Page 35 of 115Final Report, 7 June, 2000
Table 2: National average concentrations of dioxins and related PCBs (in pg TEQ/g fat) inrepresentative food samples
Food group TEQ PCDD/F TEQ PCBCountry <1990 1990-1994 1995-1999 <1990 1990-1994 1995-1999
eggsDE 1.08 1.16
FI 1.55
FR 0.46
IT 2.67
NL 2.00 1.08
NO 1.97 8.91
SV 1.03 1.45
UK 8.25 1.77 2.36 0.97
fats and oilsNL 1.51
SV 0.77 0.42
UK 1.26 0.26 1.29 0.35
milk / milk productsBE 2.60 2.06
DE 1.92 0.86 0.57
DK 2.26 0.49
FI 0.99 0.34 0.23
FR 0.67
IT 0.57
NL 1.56 0.94
NO 0.32 1.28
SV 2.02 0.92 0.75 0.43
UK 3.98 1.41 1.01 2.22 0.91 1.80

Report SCOOP Task 3.2.5 (Dioxins) Page 36 of 115Final Report, 7 June, 2000
Table 3: National average concentrations of dioxins and related PCBs (in pg TEQ/g product) inrepresentative food samples
Food group TEQ PCDD/F TEQ PCBCountry <1990 1990-1994 1995-1999 <1990 1990-1994 1995-1999
cereals / cereal productsFI 0.02 0.00
FR 0.02
NL 0.01
SV 0.17 0.11
UK 0.08 0.11 0.08 0.02
fruit and vegetablesDE 0.01 0.01
FI 0.02 0.01
FR 0.06
Report SCOOP Task 3.2.5 (Dioxins) Page 37 of 115Final Report, 7 June, 2000
Table 4: National average concentrations of dioxins and related PCBs (in pg TEQ/g fat) inrepresentative meat samples
Food group TEQ PCDD/F TEQ PCBCountry <1990 1990-1994 1995-1999 <1990 1990-1994 1995-1999
beefDE 0.71 0.66
DK 2.60
FI 0.02
IT 0.70
NL 1.77 0.72
NO 0.33 1.35
SV 0.98 1.08
liver chickenNL 3.30
liver cowDE 2.60
FR 3.29
IT 2.30
NL 5.70
SV 0.95 1.65
liver pigDE 3.00
NL 15.4
NO 5.10
Report SCOOP Task 3.2.5 (Dioxins) Page 38 of 115Final Report, 7 June, 2000
Table 4 (Cont’d)
Food group TEQ PCDD/F TEQ PCBCountry <1990 1990-1994 1995-1999 <1990 1990-1994 1995-1999
porkDE 0.39 0.35 0.29
FI 0.29
IT 1.39
NL 0.43 0.23
NO 0.20
SV 0.98 0.81
poultryDE 0.62 0.58
IT 0.92
NL 1.63 0.89
SV 0.77 0.70
UK 5.40 1.68 2.42 0.93
lamb/muttonDE 1.83 0.52
NL 1.80
NO 0.31
SV 1.01 0.86

Report SCOOP Task 3.2.5 (Dioxins) Page 39 of 115Final Report, 7 June, 2000
Table 5: National average concentrations of dioxins and related PCBs (in pg TEQ/g product) inrepresentative samples of fish and fish products
TEQ PCDD/F TEQ PCBCountry <1990 1990-1994 1995-1999 <1990 1990-1994 1995-1999
Alaska pollockDE 0.01
anchovyIT 0.35
burbotSV 0.87
carpDE 0.74
catfishDE 0.52
clamIT 0.10
coalfishDE 0.07
codDE 0.05
NO 0.12 0.20
SV 0.13 0.23
UK 0.03 0.07
crabNO 10.2
dietary supplementsUK 5.55 3.55 10.1 14.2
eelDE 1.64
UK 1.55 8.39
haddockDE 0.04
UK 0.03 0.03
hakeDE 0.03
Report SCOOP Task 3.2.5 (Dioxins) Page 40 of 115Final Report, 7 June, 2000
Table 5 (Cont’d)
TEQ PCDD/F TEQ PCBCountry <1990 1990-1994 1995-1999 <1990 1990-1994 1995-1999
halibutDE 0.46
herringDE 1.40 0.79
NO 0.91 2.64
SV 1.85 0.73 1.11
UK 2.10 6.24
herring Baltic
DK 9.09
FI 8.00
SV 8.27 10.5 3.18 1.33
liver burbotSV 87.8
liver codNO 2.67 29.7
liver cod BalticDK 28.6
mackerelDE 0.29
IT 0.86
NO 0.52 1.40
UK 0.61 2.50
musselIT 0.17
Norway lobsterIT 0.12
pikeSV 0.90 0.67
plaiceDE 0.28
NO 0.19 2.62
UK 0.25 0.48

Report SCOOP Task 3.2.5 (Dioxins) Page 41 of 115Final Report, 7 June, 2000
Table 5 (Cont’d)
TEQ PCDD/F TEQ PCBCountry <1990 1990-1994 1995-1999 <1990 1990-1994 1995-1999
red mulletIT 0.44
redfishDE 0.23
salmonUK 0.71 2.39
salmon BalticSV 7.04 9.12
salmon farmedDE 0.43
NO 0.95 3.99
SV 1.04 1.16
sardineDE 0.43
squidIT 0.18
troutDE 0.33 0.43
trout farmedDE 0.26
FI 1.79 0.74 1.49
SV 0.81 1.14
UK 0.24 0.87
tunaDE 0.01
whitefishSV 7.40
whitingUK 0.03 0.11
Report SCOOP Task 3.2.5 (Dioxins) Page 42 of 115Final Report, 7 June, 2000
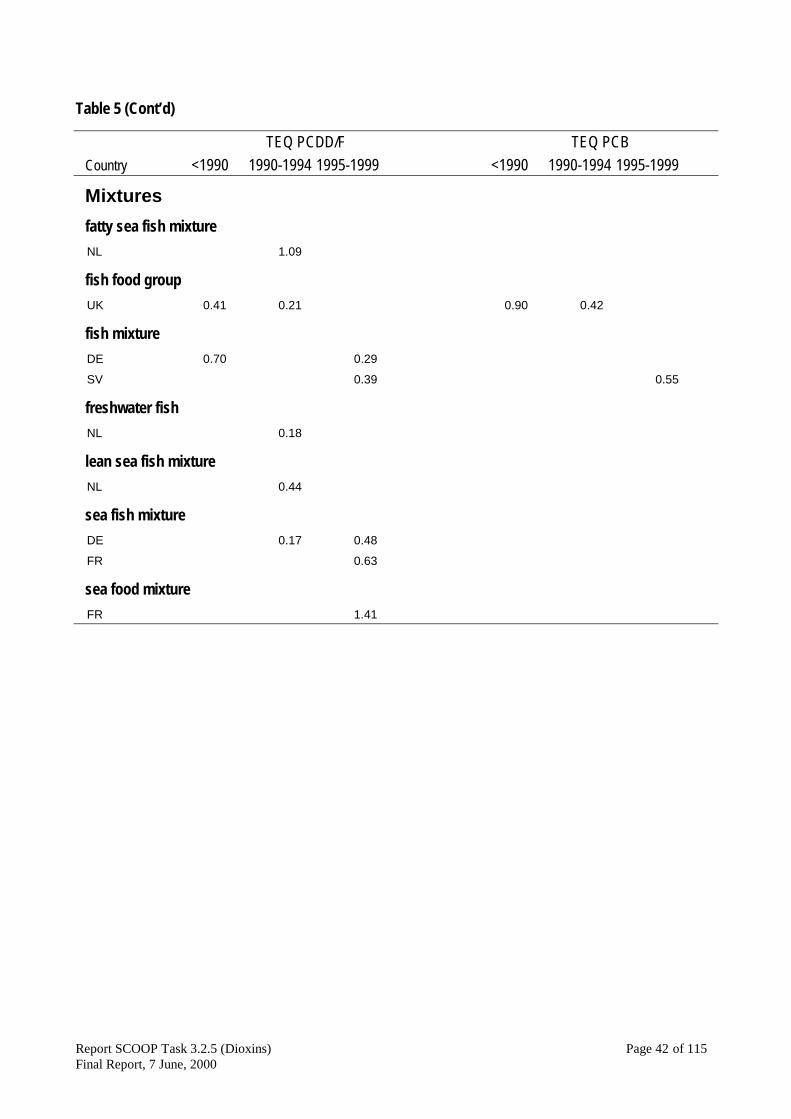
Table 5 (Cont’d)
TEQ PCDD/F TEQ PCBCountry <1990 1990-1994 1995-1999 <1990 1990-1994 1995-1999
Mixturesfatty sea fish mixtureNL 1.09
fish food groupUK 0.41 0.21 0.90 0.42
fish mixtureDE 0.70 0.29
SV 0.39 0.55
freshwater fishNL 0.18
lean sea fish mixtureNL 0.44
sea fish mixtureDE 0.17 0.48
FR 0.63
sea food mixtureFR 1.41

Report SCOOP Task 3.2.5 (Dioxins) Page 43 of 115Final Report, 7 June, 2000
4.2 Occurrence in human milk
A considerable amount of data exists for concentrations of PCDDs and PCDFs in human milk. The
national average concentrations of PCDDs, PCDFs and dioxin-like PCBs, expressed in I-TEQs and
PCB-TEQs respectively, are presented in table 6. For the period 1995-1999 the current database
shows national average concentrations between 8 and 16 pg I-TEQ/g fat. For the period before
1995, the national averages ranged between 10 and 34 pg I-TEQ/g fat. The database is too
incomplete to draw a firm conclusion about the TEQ contribution of dioxin-like PCBs. The few
studies conducted have been performed in the period 1990-1994 and indicate a mean PCB-TEQ
concentration varying from comparable to three times the I-TEQ contribution of PCDDs and PCDFs
(7-29 pg PCB-TEQ/g fat).
Table 6: National average concentrations of dioxins and related PCBs (in pg TEQ/g fat) inrepresentative human milk samples
human milk TEQ PCDD/F TEQ PCBCountry <1990 1990-1994 1995-1999 <1990 1990-1994 1995-1999
BE 24.8 6.63
DE 30.7 20.6 13.8
DK 18.1 16.7 18.0
FI 20.0 13.2 25.3 12.0
FR 16.4
IT 25.0
NL 34.2 23.5 20.9
NO 10.4 29.1
SV 13.3 7.90 19.4
Range of means 18-34 10-25 8-16 25 7-29 no data
General remarks
Since the first report on the presence of 2,3,7,8-substituted PCDDs and PCDFs in human milk
levels of European origin (WHO, 1985; Nygren et al., 1986), numerous studies have been
performed showing that these compounds accumulate in human adipose tissues and can be excreted
in human breast milk resulting in exposure of the nursing infant (Jensen and Slorach, 1991;
WHO/ECEH, 1996). It is nowadays clear that the concentrations observed in human milk reflect the
accumulation by the mothers during their life. The exposure starts in utero and proceeds after birth

Report SCOOP Task 3.2.5 (Dioxins) Page 44 of 115Final Report, 7 June, 2000
through the ingestion of breastmilk and foods. The level of exposure during the mother's life, as
well as the number of previously breastfed children, residential factors, personal characteristics (e.g.
age, particular food consumption habits, occupational factors) and various toxicokinetic factors will
finally lead to the level observed in human milk. Besides, several methodological factors such as
methods for sample collection (e.g. time after delivery), storage and transportation of samples have
been found to be relevant. All these factors may lead to differences between the mean
concentrations of dioxins and PCBs as observed in the various studies on human milk. It should be
noted, however, that these differences can be even larger when the levels in individual samples from
the same population are compared (Fürst et al., 1994; Koopman-Esseboom et al., 1994; Liem and
Theelen, 1997). The latest WHO field study on human milk revealed a coefficient of variation of
30-40% for variations in the I-TEQ level of individual samples (WHO/ECEH, 1996). So, both
methodological as well as population and individual characteristics should be taken into account to
explain the differences occurring in table 6.
Time trends
The current database generally demonstrates a downward trend with respect to human milk
concentrations of PCDDs and PCDFs. The database is too limited to assess a time trend for dioxin-
like PCBs. The most complete time course has been reported for Germany. The German database
represents studies comprising in total more than 1732 individual samples collected in various
German ‘Bundesländer’ in the period 1985-1998 (results presented in Annex 2). The German
database shows a 60% decline in the average as well as in the highest dioxin levels found in human
milk between the late 1980s and 1998.

Report SCOOP Task 3.2.5 (Dioxins) Page 45 of 115Final Report, 7 June, 2000
4.3 Food consumption data and dietary intake estimates
Food consumption data derived from various studies were used to calculate the intake of dioxins
and PCBs. Details of the surveys are given in table 7. Most countries had access to national
representative dietary surveys, with the exception of Belgium. For infants, data on breast milk
intake were available for some countries. The period of collection of the data ranged from 1985 to
1999. The food consumption data were combined with occurrence data for dioxins and PCBs. The
coverage of foods generally included foods of animal origin, while foods of vegetable origin were
less represented in many countries. For some countries analytical data from various periods were
used. In addition, some data based on analysis of duplicate or total diets (Germany, the Netherlands,
Sweden, UK) were available. More information on the methods of collection is given in Annex 2.
Infants and children
Intakes of dioxins and PCBs from breast milk among infants were available for United Kingdom
and Germany (see Annex 5). Intakes were calculated combining occurrence data for dioxins and
PCBs in breast milk with observed breast milk consumption during the first year. Fig. 2 shows the
intakes among British infants 2-10 months old. The decrease in intake after 3 months is a reflection
of the decrease in milk consumption. Intakes from other foods are not included. The time trend of
German data on human milk shows a clear decline of dioxin intake of infants by breast-feeding
during the last 10 years (Fig. 3).
Few data were also available for children. Table 8 gives recent average intakes of dioxins
and PCBs among children and adolescents 1.2-18 years old. Intakes of dioxins ranged from ca. 22
pg/d among German toddlers to ca. 78 pg/d among British school children and French adolescents.
Expressed per kg body weight the intakes were higher among the younger than among adolescents.
Besides, the mean daily intake per kg body weight is for children about 2-4 fold higher than for
adults. This is a consequence of the lower body weight of the children. In addition, other
consumption habits have to be taken into account.

Report SCOOP Task 3.2.5 (Dioxins) Page 46 of 115Final Report, 7 June, 2000
0
100
200
300
400
500
600
2 mo 3 mo 4 mo 5 mo 6 mo 7 mo 8 mo 10 mo
(PCDD/F)PCB
Fig 2. Daily intakes of dioxins and PCBs from breast milk among British infants. Data from MAFF (1997).
Adults or total population
The mean intakes of adults obtained from the most recent surveys are shown in table 8. Data for
older surveys are, together with the recent ones, listed in Annex 4. For the period after 1995 the
average intakes of dioxins, expressed as I-TEQs, varied between 29 pg/d in Norway and 97 pg/d in
France. Expressed per kg body weight the intakes ranged from ca. 0.4-1.5 pg/d. For surveys for
which analytical data were from the 1970s and 1980s, intakes were higher, ranging from 127 pg/d to
300 pg/d (see Annex 4).
The data for dioxin-like PCBs are more incomplete. Finland, the Netherlands, Norway,
Sweden and the United Kingdom provided data. Average intakes ranged from 57-110 pg PCB-
TEQ/d. The coverage of the dioxin-like PCB congeners in the analyses is not complete, and for
Finland PCB data for some animal foods (eggs, meat) were missing which means that the intake is
somewhat under-estimated.
Data for the total intake of TEQs were available for 4 countries (Finland, Norway, Sweden
and UK) and were very similar, 111-145 pg TEQ/d. In Norway PCBs provided the major part of the
total TEQs, while the dioxins were more important in the other three countries (table 8).

Report SCOOP Task 3.2.5 (Dioxins) Page 47 of 115Final Report, 7 June, 2000
Dietary sources of dioxins
Table 9 lists the average sources of dioxins in the diets of adults or total population. Dairy products
contributed 16-39%, meat 6-32% and fish 2-63% of the average daily intake. Other products, mainly
of plant origin such as vegetables, fruit, cereals and vegetable fats, contributed 6-45% in those
countries for which data were available. The data have to be interpreted with some caution, since for
some countries intake data do not cover all food groups consumed, e.g. plant foods. In addition,
estimates for plant products are often based on non-detectable levels using LOD as the value. For
UK the data for other foods, e.g. cereal products, include ingredients such as fats. In addition, the
dietary and occurrence data are from different time periods.
High intakes
The data in table 8 refer to average intakes for the specified population groups. These estimations
also include subjects with no consumption of the specified foods. The intake by “high” consumers,
defined as the upper 5% of the population (95-percentile intake) can be 2-3 fold higher than the
average, depending on the degree of contamination of various foods. In the British and Dutch
surveys of adults or total population the 95-percentile intake of dioxins was about 1.6-2.9 times the
average intake. Using the same approach, high consumers of specific foods or food groups can also
exceed average dioxin intakes considerably, depending on the contamination level. Data from, e.g.
Norway, Sweden and UK, show that dioxin intakes among high consumers of margarine fat, dairy
fat or fish can be estimated to be 1.5-2 times higher than the average intake. In special groups, such
as anglers and fishermen in the Nordic countries with a high consumption of fatty fish, the intake of
dioxins and PCBs can be considerably higher.

Report SCOOP Task 3.2.5 (Dioxins) Page 48 of 115Final Report, 7 June, 2000
Table 7. Dietary survey data
Country Survey Sex/Age Sample size Period Survey method Region Reference* Repre-sentative
ChildrenGermany Breast fed infants M&F 4 mo 1992-98 Breast milk consumption all Germany Wallgren (1945) yesGermany Toddlers, duplicate diets M&F 22 mo-5 yr 14 1995 3 d record NR Westphalia Schrey et al. (1996) yesGermany Toddlers, duplicate diets M&F 14-47 mo 42 1998 7 d record NR Westphalia Wittsiepe et al. (1999) yesUnited Kingdom British Schoolchildren's study M&F 10/11,14/15 2697 1983 7d record all UK DH/COMA (1988) noUnited Kingdom British Toddlers study M&F 1.5-4.5 1675 1992/93 4d record all UK Gregory (1995) yesUnited Kingdom Breast fed infants M&F 2-10 mo 48 1978/80 Breast milk consumption Cambridge Paul et al. (1988) noAdultsFinland Finnrisk 1992 M&F 25-64 1861 1992 3d record four regions Kleemola et al. (1994) yesFinland Finsurvey 1997 M&F 25-64 2862 1997 24 h recall five regions KTL Publication B8/1998 yesFrance Dietary survey M&F 2-75 3003 1998-99 7d record all France INCA - OCA/CREDOC (1998/1999) yesGermany Report of Nutrition M&F 4->65 23209 1985-89 7d record all Germany Kübler (1994 and 1995) yesGermany Duplicate diets M&F 24-64 14 1994-95 3 d record NR Westphalia Schrey et al. (1995) yesGermany Duplicate diets M&F 12 1994 28 d record Saxony-Anhalt Grün et al. (1995) yesItaly INN-CA 1995 M&F 1-92 3000 1994-1996 HBS all Italy Conforti P. et al. (1996) yesNetherlands DNFCS 1987/1988 M&F 1-85 5898 1987-1988 2d record all Netherlands DNFCS (1988) yesNetherlands DNFCS 1992 M&F 1-85 6218 1992 2d record all Netherlands DNFCS (1992) yesNetherlands DNFCS 1998 M&F 1-85 5958 1997-1998 2d record all Netherlands DNFCS (1998) yesNetherlands Duplicate diets M&F 21-60 93 1978 24 h DD one region Liem and Theelen (1997) yesNetherlands Duplicate diets M&F 18-74 109 1984-85 24 h DD one region Liem and Theelen (1997) yesNetherlands Duplicate diets M&F 18-74 121 1994 24 h DD one region Liem and Theelen (1997) yesNorway NORKOST 1997 M&F 16-79 2672 1997 FFQ all Norway Johansson et al. 1997 yesSweden Riksmaten 1997-98 M&F 18-74 1215 1997-98 7d record all Sweden Becker (1999) yesSweden Market Basket 100 foods 1999 MB 4 major towns unpublished yesUK British Adult Study M&F 16-64 2197 1986/87 7d record all UK Gregory et al. (1990) yes
* Full references are given in Annex 2.
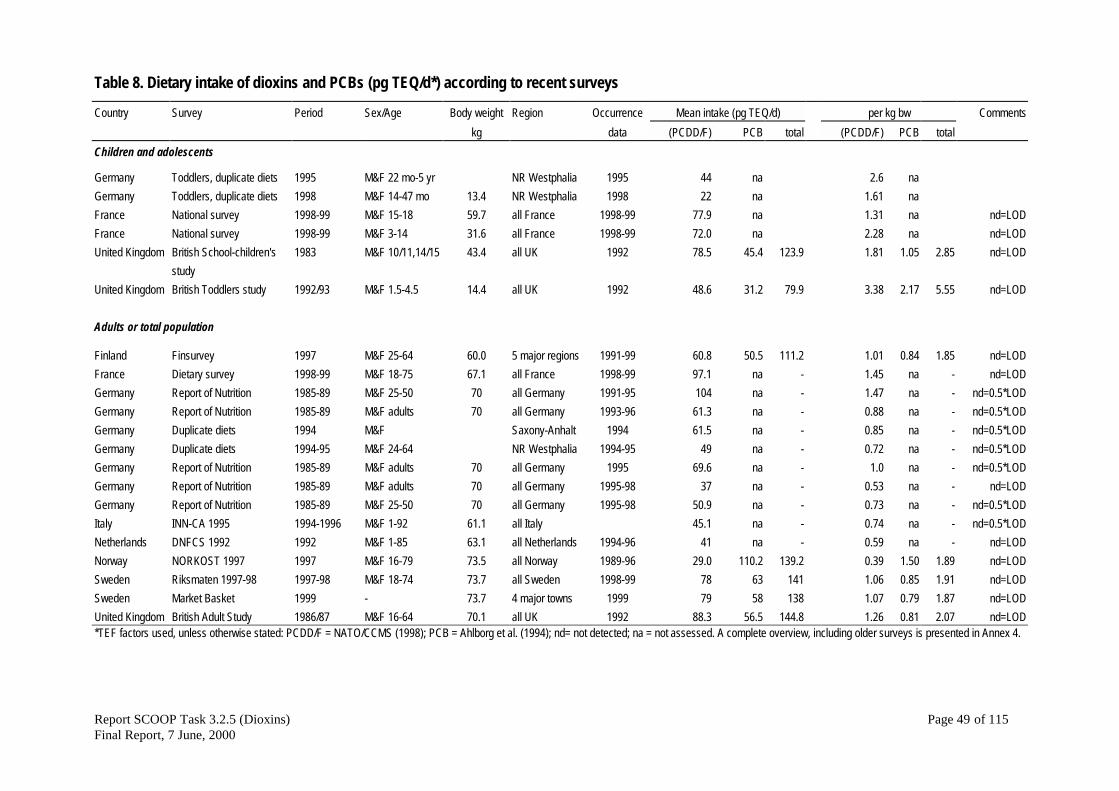
Report SCOOP Task 3.2.5 (Dioxins) Page 49 of 115Final Report, 7 June, 2000
Table 8. Dietary intake of dioxins and PCBs (pg TEQ/d*) according to recent surveys
Country Survey Period Sex/Age Body weight Region Occurrence Mean intake (pg TEQ/d) per kg bw Commentskg data (PCDD/F) PCB total (PCDD/F) PCB total
Children and adolescents
Germany Toddlers, duplicate diets 1995 M&F 22 mo-5 yr NR Westphalia 1995 44 na 2.6 naGermany Toddlers, duplicate diets 1998 M&F 14-47 mo 13.4 NR Westphalia 1998 22 na 1.61 naFrance National survey 1998-99 M&F 15-18 59.7 all France 1998-99 77.9 na 1.31 na nd=LODFrance National survey 1998-99 M&F 3-14 31.6 all France 1998-99 72.0 na 2.28 na nd=LODUnited Kingdom British School-children's
study1983 M&F 10/11,14/15 43.4 all UK 1992 78.5 45.4 123.9 1.81 1.05 2.85 nd=LOD
United Kingdom British Toddlers study 1992/93 M&F 1.5-4.5 14.4 all UK 1992 48.6 31.2 79.9 3.38 2.17 5.55 nd=LOD
Adults or total population
Finland Finsurvey 1997 M&F 25-64 60.0 5 major regions 1991-99 60.8 50.5 111.2 1.01 0.84 1.85 nd=LODFrance Dietary survey 1998-99 M&F 18-75 67.1 all France 1998-99 97.1 na - 1.45 na - nd=LODGermany Report of Nutrition 1985-89 M&F 25-50 70 all Germany 1991-95 104 na - 1.47 na - nd=0.5*LODGermany Report of Nutrition 1985-89 M&F adults 70 all Germany 1993-96 61.3 na - 0.88 na - nd=0.5*LODGermany Duplicate diets 1994 M&F Saxony-Anhalt 1994 61.5 na - 0.85 na - nd=0.5*LODGermany Duplicate diets 1994-95 M&F 24-64 NR Westphalia 1994-95 49 na - 0.72 na - nd=0.5*LODGermany Report of Nutrition 1985-89 M&F adults 70 all Germany 1995 69.6 na - 1.0 na - nd=0.5*LODGermany Report of Nutrition 1985-89 M&F adults 70 all Germany 1995-98 37 na - 0.53 na - nd=LODGermany Report of Nutrition 1985-89 M&F 25-50 70 all Germany 1995-98 50.9 na - 0.73 na - nd=0.5*LODItaly INN-CA 1995 1994-1996 M&F 1-92 61.1 all Italy 45.1 na - 0.74 na - nd=0.5*LODNetherlands DNFCS 1992 1992 M&F 1-85 63.1 all Netherlands 1994-96 41 na - 0.59 na - nd=LODNorway NORKOST 1997 1997 M&F 16-79 73.5 all Norway 1989-96 29.0 110.2 139.2 0.39 1.50 1.89 nd=LODSweden Riksmaten 1997-98 1997-98 M&F 18-74 73.7 all Sweden 1998-99 78 63 141 1.06 0.85 1.91 nd=LODSweden Market Basket 1999 - 73.7 4 major towns 1999 79 58 138 1.07 0.79 1.87 nd=LODUnited Kingdom British Adult Study 1986/87 M&F 16-64 70.1 all UK 1992 88.3 56.5 144.8 1.26 0.81 2.07 nd=LOD*TEF factors used, unless otherwise stated: PCDD/F = NATO/CCMS (1998); PCB = Ahlborg et al. (1994); nd= not detected; na = not assessed. A complete overview, including older surveys is presented in Annex 4.
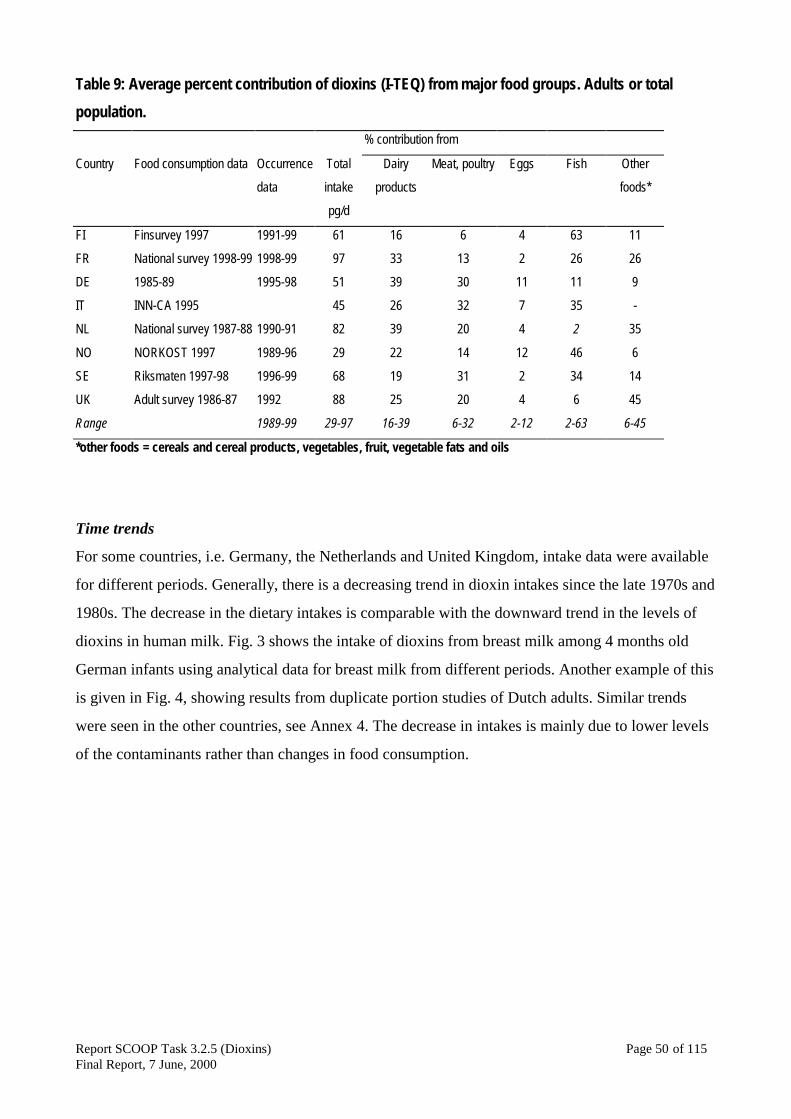
Report SCOOP Task 3.2.5 (Dioxins) Page 50 of 115Final Report, 7 June, 2000
Table 9: Average percent contribution of dioxins (I-TEQ) from major food groups. Adults or totalpopulation.
% contribution from
Country Food consumption data Occurrence
data
Total
intake
pg/d
Dairy
products
Meat, poultry Eggs Fish Other
foods*
FI Finsurvey 1997 1991-99 61 16 6 4 63 11
FR National survey 1998-99 1998-99 97 33 13 2 26 26
DE 1985-89 1995-98 51 39 30 11 11 9
IT INN-CA 1995 45 26 32 7 35 -
NL National survey 1987-88 1990-91 82 39 20 4 2 35
NO NORKOST 1997 1989-96 29 22 14 12 46 6
SE Riksmaten 1997-98 1996-99 68 19 31 2 34 14
UK Adult survey 1986-87 1992 88 25 20 4 6 45
Range 1989-99 29-97 16-39 6-32 2-12 2-63 6-45
*other foods = cereals and cereal products, vegetables, fruit, vegetable fats and oils
Time trends
For some countries, i.e. Germany, the Netherlands and United Kingdom, intake data were available
for different periods. Generally, there is a decreasing trend in dioxin intakes since the late 1970s and
1980s. The decrease in the dietary intakes is comparable with the downward trend in the levels of
dioxins in human milk. Fig. 3 shows the intake of dioxins from breast milk among 4 months old
German infants using analytical data for breast milk from different periods. Another example of this
is given in Fig. 4, showing results from duplicate portion studies of Dutch adults. Similar trends
were seen in the other countries, see Annex 4. The decrease in intakes is mainly due to lower levels
of the contaminants rather than changes in food consumption.

Report SCOOP Task 3.2.5 (Dioxins) Page 51 of 115Final Report, 7 June, 2000
0
100
200
300
400
500
600
700
800
900
1000
1986-90 1992 1994 1996 1998
Fig 3. Calculated daily intakes of dioxins from breast milk among German infants 4 months old using analytical
data from different time periods. Data from Annex 3 and 5.
0
1
2
3
4
5
6
7
8
1978 1984-85 1994
(PCDD/F)PCB
Fig 4. Average intake of dioxins and PCBs (expressed per kg bw and day) in Dutch adults according to
duplicate diet studies. Data from Liem&Theelen (1997).
Report SCOOP Task 3.2.5 (Dioxins) Page 52 of 115Final Report, 7 June, 2000
Comments
The comparability of the intake estimations for the various countries are hampered by several
factors, e.g. period of collection of dietary and analytical data, coverage of dioxin and PCB
congeners, handling of levels below the limit of determination in the calculation of TEQs, survey
method and missing data.
The method used to estimate TEQ levels when individual congeners are below the limit of
determination can influence the intake estimations significantly. It was agreed, as far as possible, to
use a value equal to the limit of determination (LOD) when congener levels were not detectable
(nd). The impact of using LOD instead of zero on the intake estimates was generally moderate,
dioxin intakes increased by 10-20%. Larger differences were observed for estimates from Sweden
and Norway. The estimated mean dioxin intake in Sweden was 78 pg/d using nd equal to LOD and
39 pg/d using nd equal to zero. The estimated mean intake of dioxin-like PCBs in Norway was 110
pg/d using nd equal to LOD and 66 pg/d using nd equal to zero. These larger differences might be
due to the degree of sensitivity of the analytical procedures.
The method used for measuring food consumption influences the quality and reliability of
data and also affects the interpretation of intake estimations. In many instances food consumption is
underestimated, when methods such as dietary records, 24 h recall and fixed food frequency
questionnaires are used. The number of days the method covers will influence the assessment of
high and low intakes and the proportion of consumers and non-consumers. Methods covering 1-2
days (used in the Netherlands) or food frequency questionnaires (used in Norway) will tend to
overestimate the extreme intakes. Most methods are able to give a fair estimate of the average food
consumption in a population. Ideally 1-2 weeks are needed to obtain reliable data on average intake
at the individual level and to provide a fair picture of the distribution within the population.
Household budget surveys, used by Italy, measure the acquisition of food by households. They
provide data on the average availability of foods as purchased for the entire household and do not
give the actual intake.
For many countries, occurrence data for some foods consumed by the population are
missing. Most of the analytical data refer to animal foods since these were generally regarded to be
the main contributors of dietary dioxins and PCBs. Data for plant foods such as bread and other
cereals, fruit and vegetables are more scarce. In those countries for which occurrence data were
available, these products generally provided a relatively small part of the daily intake. In addition,
estimates for many plant products are often based on non-detectable levels of the individual
congeners using LOD as the value, which might result in an overestimation of the actual intake.
Report SCOOP Task 3.2.5 (Dioxins) Page 53 of 115Final Report, 7 June, 2000
5 CONCLUSIONS AND RECOMMENDATIONS
5.1 Conclusions
The numerous studies conducted so far have resulted in a comprehensive database to compare the
levels and the intakes of the seventeen toxic 2,3,7,8-substituted PCDDs and PCDFs in foodstuffs,
and in tissues of animals and humans. Unfortunately this is in general not yet the case for the
dioxin-like PCBs.
The available information on the occurrence of dioxins in foods consumed in the participating
countries shows national average concentrations7 of PCDDs and PCDFs in eggs, fats and oils, meat
(products) and milk (products) of generally less than 1 up to 2-3 picogram (pg) I-TEQ8 per gram (g)
of fat. PCDD and PCDF levels in fish ranged between 0.25 and 10-20 pg I-TEQ/g on product basis.
Concentrations in fruits, vegetables and cereals were found to be relatively low, and were generally
close to the limits of determination. The limited information with respect to concentrations of
dioxin-like PCBs indicates average TEQ9 contributions of one to two times the TEQ contribution of
PCDDs and PCDFs.
A considerable amount of data exists for concentrations of PCDDs and PCDFs in human milk. For
the period before 1995, the national averages ranged between 10 and 34 pg I-TEQ/g fat. For the
period 1995-1999 the national average concentrations ranged between 8 and 16 pg I-TEQ/g fat, for
some countries clearly indicating a downward trend.
The database is not sufficiently complete to draw a firm conclusion about the TEQ contribution of
dioxin-like PCBs. The few studies conducted have been performed in the period 1990-1994 and
indicate a mean PCB-TEQ concentration varying from comparable to three times the I-TEQ
contribution of PCDDs and PCDFs (7-29 pg PCB-TEQ/g fat).
For the period after 1995, the average dietary intake of PCDDs and PCDFs for an adult person has
been estimated to be between 29 and 97 pg I-TEQ/day, which on a body weight (bw) basis
corresponds to approximately 0.4-1.5 pg I-TEQ/kg bw/day. For surveys based on chemical analyses
7 All concentrations represent upper bound estimates assuming nondetects equal the limits of determination.8 TEQ contribution of PCDDs and PCDFs calculated using International TEFs according to NATO/CCMS (1988).9 TEQ contribution of dioxin-like PCBs calculated using WHO-TEFs according to Ahlborg et al. (1994).

Report SCOOP Task 3.2.5 (Dioxins) Page 54 of 115Final Report, 7 June, 2000
of foods collected in the 1970s and 1980s, intakes were estimated to be higher, ranging from 127 to
314 pg I-TEQ/day (approx. 1.7-5.2 pg I-TEQ/kg bw/day). The 95-percentile intake, based on data
from the United Kingdom and the Netherlands was 2-3 times the mean intake.
If the TEQ contribution of dioxin-like PCBs is considered, the average intakes were between 48 and
110 pg PCB-TEQ/day (approx. 0.8-1.8 pg PCB-TEQ/kg bw/day). In studies investigating both
dietary intakes of PCDDs/PCDFs and PCBs, the TEQ contribution of dioxin-like PCBs was
estimated to be almost equal (e.g. Finland, Netherlands, Sweden, United Kingdom) to
approximately four times (Norway) the TEQ contribution of the PCDDs and PCDFs.
The main contributors to the average daily intake of dioxins (I-TEQ) in the participating countries
are milk and dairy products (contributions ranged from 16-39%), meat and meat products (6-32%)
and fish and fish products (2-63%). Other products, mainly of plant origin such as vegetables,
cereals, contributed 6-45% in those countries for which data were available. In this regard, it should
be noted that the ranking of the food groups in their contribution to the total intake of I-TEQ
differed from country to country. These differences may result from different food consumption
habits in the participating countries. On the other hand, other factors may also be involved. These
include factors related to the applied sampling strategy (e.g. differences in the coverage of products
collected to represent the whole food group) and the large variations in concentrations of dioxin
related substances in some of the food groups (e.g. vegetables and fruits, eggs and fish).
In most countries young children will have a higher intake per kg body weight than adults. This is
especially true during the breast-feeding period. On a body weight basis, the intake of breast-fed
infants has been estimated to be 1 to 2 orders of magnitude higher than the average adult intake. For
high level consumers of one or more of the dioxin-containing products the contribution from these
products could be of significant importance for the total dietary intake of dioxins and related PCBs.
A few countries (i.e. Finland, Germany, Netherlands, Sweden and the United Kingdom) reported
sufficient data for the establishment of time trends in the dietary exposure and levels in human milk.
These data reveal clearly that the exposure of the general population to dioxins is declining. For
Germany, Finland, Netherlands and Sweden this decline is also noted for concentrations in human
milk.

Report SCOOP Task 3.2.5 (Dioxins) Page 55 of 115Final Report, 7 June, 2000
5.2 Recommendations
A regular collation of occurrence and food consumption data is extremely valuable in order to
compare and to follow temporal trends in the exposure of the populations of different European
countries to dioxin and related compounds. These compilations should be ideally performed on a 5
or 10 year basis.
European countries other than those that took part in SCOOP Task 3.2.5 are strongly encouraged to
add their information into the established SCOOP database, and to take part in any future EU scale
dioxin project.
Future studies should not only focus on national average concentrations but also on the distribution
of these concentrations. Wherever possible, the sources most likely to lead to the occurrence of
these compounds should be identified. In order to allow these type of investigations, analytical data
should become available on a congener specific basis rather than on a TEQ basis only.
The available database is insufficient to assess the current situation with respect to dioxin-like
PCBs. It is strongly recommended to include the selection of dioxin-like PCB congeners as
recommended by WHO (Van den Berg et al., 1998) in future monitoring activities. Especially
because the available information shows that TEQ contributions of dioxin-like PCBs are at least
comparable with the contribution of PCDDs and PCDFs.
Interlaboratory comparison studies should be conducted in EU framework in order to be able to
assess the between-lab comparability of the chemical information included in the database.
Report SCOOP Task 3.2.5 (Dioxins) Page 56 of 115Final Report, 7 June, 2000
Acknowledgements
The co-ordinators would like to thank the Enterprise Directorate-General of the European
Commission and the Public Health Department of the Dutch Ministry of Health, Welfare and Sports
for their financial support of this SCOOP Project. In addition, the co-ordinators would like to thank
all participating countries and contact persons for their co-operation and their contributions to the
report and discussions at the meetings in Amsterdam, Uppsala, and Venice. Professor O. Rohte, Dr.
G. Schreiber, Dr. R. van der Heide and Dr. J. M. de Stoppelaar are gratefully acknowledged for their
guidance during this project and for all their help during the preparation of this report.

Report SCOOP Task 3.2.5 (Dioxins) Page 57 of 115Final Report, 7 June, 2000
REFERENCES
AEA Technology (1999). Compilation of EU Dioxin Exposure and Health Data. Summary Report.Report AEAT/EEQC/0016, AEA Technology, Oxfordshire
Ahlborg, U.G., Hakansson, H., Wærn, F., and Hanberg, A. (1988). Nordisk dioxinriskbedomning.Nordic Council of Ministers, Copenhagen, Denmark, Miljorapport 1988:7
Ahlborg, U.G., Becking, G.C., Birnbaum, L.S., Brouwer, A., Derks, H.J.G.M., Feeley, M., Golor,G., Hanberg, A., Larsen, J.C., Liem, A.K.D., Safe, S.H., Schlatter, C., Wærn, F., Younes, M.,and Yrjänheikki, E. (1994a). Toxic equivalency factors for dioxin-like PCBs. Report on aWHO-ECEH and IPCS consultation, december 1993. Chemosphere, 28, 1049-1067
Basler, A. (1994). Regulatory measures in the Federal Republic of Germany to reduce the exposureof man and the environment to dioxins. Organohalogen Compounds, 20, 567-570
Bernard, A., Hermans, C., Broeckaert, F., de Poorter, G., de Cock, A., Houins, G. (1999). Foodcontamination by PCBs and dioxins. Nature, 401, 231-232
Beurskens, J.E.M., Mol, G.A.J., Barreveld, H.L., Van Munster, B., and Winkels, H.J. (1993).Geochronology of priority pollutants in a sedimentation area of the Rhine River. Environ.Toxicol. & Chem., 12, 1549-1566
CCFAC (Codex Committee on Food Additives and Contaminants) (2000). Discussion paper ondioxins and PCBs. CX/FAC 99/23-Add.1, February 1998 (revised 2000)
EPA (1994). Health Assessment Document for 2,3,7,8-Tetrachlorodibenzo-p-dioxin (TCDD) andRelated Compounds. United States Environmental Protection Agency, Washington, DC,EPA/600/BP-92/001a-c
Fiedler, H., Hutzinger, O. and Timms, C. (1990). Dioxins: sources of environmental load andhuman exposure. Toxicol. Environ. Chem., 29, 157-234
Fürst, P., Beck, H. and Theelen, R.M.C. (1992). Assessment of human intake of PCDDs and PCDFsfrom different environmental sources. Toxic Subst. J., 12, 133-150
Fürst, P., Fürst, C., and Wilmers, K. (1994). Human milk as a bioindicator for body burden ofPCDDs, PCDFs, organochlorine pesticides, and PCBs. Environ. Health Perspect., Suppl. 1,187-193
IARC (1997). IARC Monographs on the Evaluation of Carcinogenic Risks to Humans, Vol. 69,Polychlorinated dibenzo-para-dioxins and polychlorinated dibenzofurans, Lyon, 666 pp
Jensen, A.A., and Slorach, S.A. (1991). Chemical Contaminants in Human Milk. CRC Press, Inc.,Boca Raton
Jobst, H. and Aldag, R. (1999). Dioxine in Lagerstätten-Tonen. UWSF – Z. Umweltchem. Ökotox.12, 2-4
Koopman-Esseboom, C., Huisman, M., Weisglas-Kuperus, N., Van der Paauw, C.G., Tuinstra,L.G.M.Th., Boersma, E.R., and Sauer, P.J.J. (1994). PCB and dioxin levels in plasma andhuman milk of 418 Dutch women and their infants. Predictive value of PCB congener levels inmaternal plasma for fetal and infant’s exposure to PCBs and dioxins. Chemosphere, 28, 1721-

Report SCOOP Task 3.2.5 (Dioxins) Page 58 of 115Final Report, 7 June, 2000
1732Liem, A.K.D., and Van Zorge, J.A. (1995). Dioxins and Related Compounds: Status and Regulatory
Aspects in Selected Countries. ESPR - Environ. Sci. & Pollut. Res., 2, 46-56Liem, A.K.D., and Theelen, R.M.C. (1997). Dioxins: Chemical Analysis, Exposure and Risk
Assessment. PhD Thesis, Utrecht UniversityMalisch, R (1998). Increase of PCDD/F-contamination of milk and butter in Germany by use of
contaminated citrus pulps as component in feed. Organohalogen Compounds, 38, 65MAFF (1997). Dioxins and polychlorinated biphenyls in foods and human milk. Food Surveillance
Information Sheet No. 105, Ministry of Agriculture, Fisheries and Food, 1997McLachlan, M.S., and Riechter, W. (1998). Uptake and transfer of PCDD/Fs by cattle fed naturally
contaminated feedstuffs and feed contaminated as a result of sewage sludge application. I.Lactating cows. J. Agric. Food Chem., 46, 1166-1172
NATO/CCMS (North Atlantic Treaty Organization, Committee on the Challenges of ModernSociety) (1988). International toxicity equivalency factors (I-TEF) method of risk assessment forcomplex mixtures of dioxins and related compounds. North Atlantic Treaty Organization,Brussels, report no. 176
Nygren, M., Rappe, C., Lindström, G., Hansson, M., Bergqvist, P.-A., Marklund, S., Domellöf, L.,Hardell, L., and Olsson, M. (1986). Identification of 2,3,7,8-substituted polychlorinated dioxinsand dibenzofurans in environmental and human samples. In: Chlorinated Dioxins andDibenzofurans in Perspective, Vol. III (Rappe, C., Choudhary, G., Keith, L.H., Eds.), Lewis,Chelsea, MI, 17-34
Rappe, C. (1992). Sources of PCDDs and PCDFs. Introduction, reactions, levels, patterns, profilesand trends. Chemosphere, 25, 41-44
Rappe, C., Bergek, S., Fiedler, H., and Cooper, K.R. (1998). PCDD and PCDF contamination incatfish feed from Arkansas, USA. Chemosphere, 36, 2705-2720
Van den Berg, M. , Birnbaum, L.S., Bosveld, A.T.C., Brunström, B., Cook, Ph., Feeley, M., Giesy,J.P., Hanberg, A., Hasegawa, R., Kennedy, S.W., Kubiak, T., Larsen, J.C., van Leeuwen,F.X.R., Liem, A.K.D., Nolt, C., Peterson, R.E., Poellinger, L., Safe, S., Schrenk, D., Tillitt, D.,Tysklind, M., Younes, M., Wærn, F., and Zacharewski, T. (1998). Toxic Equivalency Factors(TEFs) for PCBs, PCDDs, PCDFs for humans and wildlife. Env. Health Persp., 106, 775-792
WHO (1999). Consultation on assessment of the health risk of dioxins; Re-evaluation of thetolerable daily intake (TDI). Executive Summary. Document EHBI 010201, September 1999,WHO European Centre for Environment and Health, Bilthoven Division
WHO/ECEH (WHO European Centre for Environment and Health) (1996). Levels of PCBs,PCDDs and PCDFs in human milk. Second Round of WHO-coordinated exposure study.Environmental Health in Europe 3, World Health Organization, European Centre forEnvironment and Health, Bilthoven-Nancy-Rome
WHO/EURO (World Health Organization/Regional Office for Europe) (1985). OrganohalogenCompounds in human milk and related hazards. Report on a WHO Consultation. World Health
Report SCOOP Task 3.2.5 (Dioxins) Page 59 of 115Final Report, 7 June, 2000
Organization, Copenhagen, ICP/CEH 501/m 05WHO/IPCS (WHO International Programme on Chemical Safety) (1989). Environmental Health
Criteria 88: Polychlorinated dibenzo-para-dioxins and dibenzofurans. World HealthOrganization, Geneva

Annexes to Report SCOOP Task 3.2.5 (Dioxins) Page 60 of 115Final Report, 7 June, 2000
ANNEX 1Congeners of PCDDs, PCDFs and PCBs selected for compilation of occurrence andexposure data in the framework of SCOOP Task 3.2.5 (Dioxins)
PCDDs and PCDFs Toxic Equivalency Factor (TEF)I-TEF (NATO/CCMS, 1988) WHO-TEF (Van den Berg et al., 1998)
2,3,7,8-TCDD 1 11,2,3,7,8-PeCDD 0.5 11,2,3,4,7,8-HxCDD 0.1 0.11,2,3,6,7,8-HxCDD 0.1 0.11,2,3,7,8,9-HxCDD 0.1 0.11,2,3,4,6,7,8-HpCDD 0.01 0.01OCDD 0.001 0.00012,3,7,8-TCDF 0.1 0.11,2,3,7,8-PeCDF 0.05 0.052,3,4,7,8-PeCDF 0.5 0.51,2,3,4,7,8-HxCDF 0.1 0.11,2,3,6,7,8-HxCDF 0.1 0.11,2,3,7,8,9-HxCDF 0.1 0.12,3,4,6,7,8-HxCDF 0.1 0.11,2,3,4,6,7,8-HpCDF 0.01 0.011,2,3,4,7,8,9-HpCDF 0.01 0.01OCDF 0.001 0.0001
PCBs Toxic Equivalency Factor (TEF)PCB-TEF (Ahlborg et al., 1994) WHO-TEF (Van den Berg et al., 1998)
Non-ortho PCBs3,3',4,4'-CB(77) 0.0005 0.00013,4,4',5-CB(81) - 0.00013,3',4,4',5-CB(126) 0.1 0.13,3',4,4',5,5'-CB(169) 0.01 0.01
Mono-ortho PCBs2,3,3',4,4'-CB(105) 0.0001 0.00012,3,4,4',5-CB(114) 0.0005 0.00052,3',4,4',5-CB(118) 0.0001 0.00012,3,4,4'5-CB(123) 0.0001 0.00012,3,3',4,4',5-CB(156) 0.0005 0.00052,3,3',4,4',5'-CB(157) 0.0005 0.00052,3',4,4',5,5'-CB(167) 0.00001 0.000012,3,3'4,4'5,5'-CB(189) 0.0001 0.0001
Other PCBs*2,2',3,3',4,4'-CB(138) - -2,2',4,4',5,5'-CB(153) - -2,2'3,4,4'5,5'CB(180) 0.00001 -* The list of PCB-TEFs for dioxin-like PCBs as published by Ahlborg et al. (1994) also contained a TEF value for 2,2',3,3',4,4',5-
chlorobiphenyl, or PCB congener with IUPAC no. 170 (PCB-TEF = 0.0001).
Annexes to Report SCOOP Task 3.2.5 (Dioxins) Page 61 of 115Final Report, 7 June, 2000
ANNEX 2Comments from countries participating in SCOOP Task 3.2.5 (Dioxins)In this annex comments from the participating countries are given on their own sampling procedures, analyticalmethodology, quality assurance and food consumption data on dioxins and related PCBs.
BELGIUM
Sampling ProceduresHuman milk was collected in 1993 in the south of Belgium as described by the WHO project [1].For dioxins in food sampling was done by the Ministry of Agriculture in cooperation with the Ministry of Health. Ineach region of Belgium a pooled sample was made with subsamples from three (1994-1997) or nine (1998-1999)different milk collector trucks (once or twice a year). In 1995 and 1996 half of the samples were milk productssampled in factories from all over the country (consumer milk, butter, cheese and milk powder).For PCB’s sampling was done by the Ministry of Health (Institute of Veterinarian Inspection and Food InspectionService). Samples of meat were taken in slaughteries, samples of fish in fish markets and fish farms, samples ofmilk and milk products in retail, samples of eggs in egg packaging plants. The samples of meat were: 274 beef,193 pork, 103 veal, 88 chicken (45 boiler and 43 broiler), 40 turkey, 10 rabbit, 10 ostrich, 8 horsemeat, and 6mutton. The fish samples consisted of 52 marine fish and 102 freshwater fish. The milk and milk productsconsisted of 106 samples of butter and 36 samples of milk.
Analytical methodology and Quality AssuranceThe method of analysis for dioxins in milk and milk products starts with freeze drying, then milling using Na2SO4and silica, soxhlet extraction, purification using gel permeation chromatography, HPLC over a carbon column andclean up over alumina, detection with GC-HRMS (selective ion) and quantification according to the isotope dilutionmethod. The laboratory is accredited since 1998 for this analysis and participated in former years in internationalring tests.Of the list of PCB’s for which data were requested in this project, only PCB 118, PCB 138, PCB 153 and PCB180were included in the method of analysis. The method of analysis for PCBs resembles CEN method prEN 1528-1à4of 1996. The fat is extracted from the sample with appropriate solvent. The fat is then eliminated by partitioningbetween dimethylformamide and hexane. This extract is purified on a partially deactivated alumina column. ThePCBs are determined by gas chromatography with ECD detector.
Food consumption dataIn early 1997 a 7-day food record was done with 129 boys and 212 girls from 14 to 18 years old, selected fromschools in the city of Ghent (Flanders). These are recent data of high quality. The study is, however, notrepresentative for whole Begium as not all ages are included and as e.g. the consumption of butter is known to besignificantly higher in the south of the country. Mean body weight was 59.7 kg.Consumption data were combined with data on fat content (Belgian food composition table [2]). In this waygrouping was done of all foods containing milk fat (all kinds of consumption milk, all kinds of cheese, yoghurt, icecream, cream and butter). So grouping was done for consumption data and concentration data separately, on a fatbasis, after which they were combined to obtain intake data. The mean intake of milkfat was distributed as follows:24% due to milk and yoghurt, 54% due to cheese consumption, 14% for butter and 8% for ice cream.
Remarks and conclusionsData on human milk show that dioxin and dioxin like PCB concentrations were high in comparison to other food,reflecting the accumulation by the mothers during their life.

Annexes to Report SCOOP Task 3.2.5 (Dioxins) Page 62 of 115Final Report, 7 June, 2000
A decreasing temporal trend can be observed for intake of dioxins from dairy foods. In 1999, the intake was twothirds of the intake of 1994.Belgium also disposes of data of milk on farm level near to waste incinerators and other dioxin sources. Since1990 a monitoring is carried out. These data cannot be used to estimate a dietary intake, but it can be mentionedhere that in 1999, the milk of ten farms was withdrawn from the market because of a level of dioxins slightlyexceeding the legal level of 5 pg TEQ/g fat (three sources of dioxin emission were identified: a waste incinerator inFrance near to the Belgian border, a waste incinerator near to Charleroi and a metal industry near to Ghent).Source directed measures have been taken. Levels are declining. Early 2000, the number of blocked farmsdecreased to four.It can also be mentioned that, of course, Belgium has a lot of data of the incident in 1999. As this exposure wastemporary, such data cannot be used in this study. In July 1999 pooled samples were collected for eggs. Althoughall 5 results were below 5 pg TEQ/g fat, an influence of the recent incident was suspected and so the results werenot considered representative. Recently, an extensive random monitoring of dioxins has started especially formeat and fish and data will be available in the near future.Data on PCBs are not adequate to allow a good estimate of TEQ intake, as the PCBs with the highest TEF valueswere not included in the analytical method used. Upper bound estimates of PCB TEQs could be largeunderestimates, as in case of “mean ND = LOD”, zero was still used for PCBs which were not included in themethod of analysis (the seven indicator PCBs were analysed and not the set of dioxin-like PCBs). However, asmost samples had concentrations below the LOD, upper bound estimates could also be large overestimates. Weconclude that it was not possible to make an estimate of PCB TEQ intake.Consumption data are not representative for whole Belgium. Cheese was the most important contributor of intakeof milk fat for teenagers of Ghent.
References1. WHO/ECEH (1996). Levels of PCBs, PCDDs and PCDFs in human milk. Second round of WHO-coordinated
exposure study. Environmental Health in Europe No. 3., WHO, Copenhagen2. NUBEL (1995). Belgian food composition table. 1995.
DENMARK
Dioxins and dioxin-like PCB have not been a part of regular national monitoring programs for contaminants inDenmark. Human milk was analysed for dioxins in 1986 and selected food items were analysed in 1987. It wasthen decided to follow the Danish human exposure mainly by monitoring the time trend in the levels of human milk.These analyses have been performed at the same intervals as the WHO's coordinated study on human milk. Thelast time was in 1993/94. Private institutions have on individual basis obtained results for dioxins in certain fooditems, and a recent study on cow's milk has been included in the database.
Sampling proceduresFood items: In 1987 a small number of samples were collected to give an overview of the contamination withdioxins in fatty food items (1). Cow's milk, yoghurt, butter and cheese were bought in retail stores in Copenhagen.Meat samples were collected at slaughterhouses. Fish samples of herring and cod liver were collected atBornholm (Baltic Sea). In 1999 cow's milk samples were collected at bulk tanks. Samples within 10 regions werecombined and the 10 pools which represent the whole of Denmark, were analysed for dioxins (2).
Human milk: Two surveys have been conducted. In 1986, samples from 6 regions were obtained. 10 individualsamples and 1 pooled sample were analysed for dioxins (3). In 1993/94 human milk was collected from 8 regionsin Denmark. 10 individual samples were analysed for both dioxins and PCB and 37 for PCB (4, 5).
Annexes to Report SCOOP Task 3.2.5 (Dioxins) Page 63 of 115Final Report, 7 June, 2000
Analytical methodology and Quality AssuranceAll data were generated from generally accepted analytical methodologies for dioxin and dioxin-like PCB analyses.After fat extraction the cleanup included fat removal and fractionation on columns packed with different adsorbentssuch as silica, alumina, Florisil and carbon. The samples were spiked with carbon-13 isotope labelled standardsfor recovery and quantification purposes. The detection was performed on high resolution mass spectrometer afterseparation by gas chromatography, except for some of the mono- and di-ortho PCB analyses in which case EC-detectors were used after dual column gas chromatography.The dioxin analyses of food items in 1987 were carried out at the Danish Veterinary and Food Administration, theformer National Food Agency of Denmark. In addition to internal validation of the analytical procedures, standardswere compared and calibrated with other international laboratories.
Analyses of a subset of the collected human milk samples from 1993/94 for both dioxins and PCB were conductedat RIVM, The Netherlands. Additional samples were analysed for PCB at the Danish Veterinary and FoodAdministration. In conjunction with the analyses the laboratories participated in interlaboratory comparison studiesorganised by WHO. The human milk analyses from 1987 were carried by the Danish Environmental ProtectionAgency. The laboratory is now a part of the National Environmental Research Institute. The laboratory participatedin a proficiency test organised by the Nordic countries.
The recent cow's milk analyses from 1999 were arranged by the Danish Dairy Board and carried out by acommercial laboratory in Germany. No information on quality assurance was specified but it is believed to becomparable to current standards.
Food consumption dataThe food consumption data supplied are derived from two national dietary surveys in 1985 (6) and in 1995 (7). In1995 the method of the survey was a combination of a personal interview and selfadministered diet records.Dietary data were recorded for 7 consecutive days in supplied booklets with preprinted fixed answering categoriessupplemented with open categories. In the 1985 survey the dietary data were based on personal interviewscovering a typical 1 month diet.The data refer to males and females between 15 and 80 years old. In 1985 the number of persons participatingwas 2042 and in 1995 the number was 1837.
References1. Büchert, A. Dioxiner i danske levnedsmidler. Danish Veterinary and Food Administration. Publication no. 170,
1988.2. Danish Dairy Board. Unpublished data from 1999.3. Dioxiner i modermælk. Modermælks indhold i 1986 af dioxiner, furaner, PCB og visse chlorerede pesticider.
Hygiejnemeddelelser: 7. Danish National Board of Health, Danish Veterinary & Food Administration andDanish Environmental Protection Agency, 1987.
4. WHO/ECEH (1996). Levels of PCBs, PCDDs and PCDFs in human milk. Second round of WHO-coordinatedexposure study. Environmental Health in Europe No. 3. WHO, Copenhagen, 1996.
5. Indhold af dioxiner, PCB, visse chlorholdige pesticider, kviksølv og selen i modermælk hos danske kvinder1993-94. Danish National Board of Health and Danish Veterinary & Food Administration, 1999.
6. Danskernes kostvaner 1985 (Danish dietary habits 1985). Danish Veterinary and Food Administration.Publication no. 136, 1986.
7. Danskernes kostvaner 1995 (Danish dietary habits 1995). Danish Veterinary and Food Administration.Publication no. 235, 1996.
Annexes to Report SCOOP Task 3.2.5 (Dioxins) Page 64 of 115Final Report, 7 June, 2000
FINLAND
The following report contains detailed information about the samples analysed by the National Public HealthInstitute, Kuopio, Finland.
Sampling procedures
Description of the samplesAll the samples were of Finnish origin, with the exception of orange juices. As for cereals, it is un-clear whetherthey were domestic or imported. More detailed information about the sampling area and time is provided in thetables.
Sampling procedureCereals, vegetables and orange juices were collected from grocers, eggs from hen-houses, meat from slaughterhouses and milk from dairies, all at random. Fish samples were collected from fish farms or from the main fishingareas. The sampling procedures were planned in co-opera-tion with the National Food Administration. Mother'smilk sampling from two areas in Finland was carried out according to the instructions of WHO.
Sampling sitesCereals: grocers, origin unknownVegetables: grocers, produced in different parts of FinlandFish: fish farms, fishing areasDairy products: packaging dairiesEggs: henhousesMeat: slaughterhousesMother's milk: with the help of maternity clinics
Treatment of the samples prior to analysisCereals: homogenized and stored at room temperatureVegetables: stored in refrigerator, homogenized prior to analysisFish: stored as frozen and homogenized prior to analysisDairy products: stored in refrigerator prior to analysisEggs: stored in refrigerator prior to analysisMeat: stored as frozen and homogenized prior to analysisMother milk: stored as frozen until analysis
Analytical methodology and quality assuranceAfter homogenization the fat content was measured gravimetrically from the fatty samples. Thereafter the sampleswere extracted with Soxhlet and defatted on a silica column. PCDD/Fs and PCBs were fractionated on a carboncolumn and purified on an alumina column. After the analysis of mono- and di ortho PCBs, the non ortho PCBswere fractionated on a carbon column. The analysis was performed with HRGC/HRMS, using SIR and a 10 000resolution. The detection limits for PCDD/Fs in the fatty samples ranged from 0.05 to 0.5 pg/g and in the wholeweight samples from 0.005 to 0.05 pg/g, depending upon the food. As for PCBs, the detection limits in the fattysamples varied from 0.1 to 10 pg/g and in the whole weight samples from 0.005 to 10 pg/g, depending upon thefood. The repeatability of the analytical results was below 10 %, and recoveries for internal standards were betterthan 60% for all congeners.
The laboratory is an accredited testing laboratory (No. T77) in Finland (SFS-EN 45001 and ISO/IEC Guide 25).The scope of accreditation covers PCDD/Fs, PCBs, and non ortho PCBs from soil, sediment, water, ash, serum,
Annexes to Report SCOOP Task 3.2.5 (Dioxins) Page 65 of 115Final Report, 7 June, 2000
tissue and milk samples. The laboratory has parti-cipated in international quality control studies. Below are listedonly those including serum, tissue or milk samples.- PCDD/Fs in cow’s milk samples organized by EU/BCR project in 1993- WHO: second, third and fourth round of interlaboratory quality assessment studies on levels of PCBs, PCDDs
and PCDFs in human milk and blood (the third round also included fish and cow milk samples)- Second round of IUPAC/CFC/WG-HHEC project 650/80/94: Determination of toxicologically relevant
chlorobiphenyls in two fish oils and an analytical solution.- On going study: IUPAC/CFC/WG-HHEC project 650/90/97: Collaborative study on novel and conventional
analytical techniques for the determination of toxicologically relevant PCB congeners in fish and humanadipose tissue
In the third round of WHO interlaboratory quality assessment studies on levels of PCBs, PCDDs and PCDFs thelaboratory was accepted for analysis of a) PCDD/Fs in fish, b) non ortho PCBs in blood, c) non ortho PCBs in fish,and other PCBs in fish. The report on the fourth round of WHO interlaboratory quality assessment studies has notbeen published. In the second round of IUPAC/CFC/WG-HHEC project 650/80/94 the laboratory was among thebest in both categories within-lab repeatability and between-lab reproducibility on both fish oils and an analytesolution.
Food Consumption dataThe food consumption data used in the intake calculations consist of the average consumption figures taken fromthe 1992 and 1997 Dietary Survey of Finnish Adults. The whole population, aged 25-64 years, was included(n=1861 in 1992, n=2862 in 1997). The intake calculations were based on the average consumptions of the foodsand average concentrations of dioxins and furans. High intake or high consumers were not included (1997),because the dietary data consisted of a 24-hour recall; only one day per each study subject. Data for both menand women are given, but not for children. It is impossible to separate risk groups from a dietary material coveringonly one day. Infants were also excluded.
ConclusionsFor eggs, Baltic herring, bovine and pork, dioxin concentration data from the beginning of the 1990’s were used.The trend in dioxin concentrations has been downwards in the 1990’s, and that is why the share of these abovementioned food groups may be somewhat overestimated in the intake calcu-lations of I-TEQ. On the other hand,there are no comparable PCB results available for the above food groups, so the intake calculations of PCB-TEQsand of total TEQs are clearly under-estimated.According to Hallikainen and Vartiainen, the daily intake of PCDD/Fs was 95 pg /day (1.6 pg/bw/day) in 1995. Inthe present study dioxin intake was 48.3 pg/day (0.81 pg/bw/day), which means a decline of 49 % in the dailyintake within five years.In 1995, 33 % of the dioxin intake originated from milk and dairy products, and 63 % from fish and fish products(Hallikainen and Vartiainen, 1997). According to the present study, 79,3 % of the dioxin intake now comes fromfish and fish products, 13 % from meat and eggs, 7.3 % from milk and milk products, and 0.4 % from fruits andvegetables (when congeners not detected were considered as 0 and not as LODs).The time trend for PCDD/Fs in Finnish cow milk has been downwards. The concentrations have fallen by 88 %from 1991 to 1998. In 1991 the I-TEQ value for cow milk was 0.99 pg/g fat, in 1998 it was only 0.12 pg/g fat. In thecase of rainbow trout the downward trend between 1993 and 1999 is not so clear (1.79 pg/g wet weight and 0.74pg/g wet weight, respectively).Although there are no intake calculations for breastfed infants, we have the time trend for PCDD/F and PCBconcentrations between 1987 and 1994. In 1987, the I-TEQ concentration of PCDD/Fs was 20.1 pg/g fat, in 1994 itwas 13.2 pg/g fat. For PCB-TEQ, the value was 28.4 pg/g fat in 1987 and 12.0 pg/g fat in 1994. This means adecline of 34 % in PCDD/F and of 58% in PCB. The difference in these declines is still being investigated.

Annexes to Report SCOOP Task 3.2.5 (Dioxins) Page 66 of 115Final Report, 7 June, 2000
References1. T. Vartiainen and A. Hallikainen. Polychlorodibenzo-p-dioxin and polychlorodibenzofuran (PCDD/F) levels in
cow milk samples, egg samples and meat in Finland. Fresenius J of Analytical Chemistry 348; 1994: 150-153.2. A. Hallikainen, A. Mustaniemi and T. Vartiainen. Dioxin intake from food. Research Notes, National Food
administration 1/1995 (Abstract in English).3. M. Korhonen, J. Mannio, T. Vartiainen and P. Porvari. Concentrations of selected PCB congeners in pike
(Esox lucius, L.) and arctic char (Salvelinus alpinus,L.) in Finland. Chemosphere 34; 1997: 1255-1262.4. T. Vartiainen, J.J.K. Jaakkola, S. Saarikoski and J. Tuomisto. Birth weight and sex of children in correlation to
the body burden of PCDD/F and PCB of the mother. Environmental Health Perspectives 106; 1998: 61-66.5. H. Kiviranta, R. Purkunen and T. Vartiainen. Levels and Trends of PCDD/Fs and PCBs in Human Milk in
Finland. Chemosphere 38 (2); 1999: 311-323.6. A. Hallikainen and T. Vartiainen. Food control surveys of polychlorinated dibenzo- p-dioxins and
dibenzofurans and intake estimates. Food Additives and Contaminants 14 (4); 1997: 355-366.7. T. Vartiainen, A. Hallikainen. Accumulation of polychlorinated dibenzo-p-dioxins and polychlorinated
dibenzofuranes (PCDD/F) and of PCB in rainbow trout using Baltic herring and dry fish feed. Helsinki 1995.National Food Adminidtration/Research Notes 1/ 1995, 9 pp.+append.
8. T. Vartiainen, S. Saarikoski, J. Jaakkola and J. Tuomisto. PCDD, PCDF and PCB concentrations in humanmilk from two areas of Finland. Chemosphere 34 (12); 1997: 2571-2583.
9. T. Vartiainen and A. Hallikainen. Polychlorodibenzo-p-dioxin and polychloro-di-benzofuran (PCDD/F) levels inBaltic herr-ing and rainbow trout samples in Finland. Organo-halo-gen Compounds 9; 1992: 305-308.
10. M. Korhonen, J. Mannio and T. Vartiainen. The Levels of PCBs in aquatic biota in Finland. OrganohalogenCompounds 24; 1995: 453-456.
11. T. Vartiainen, J. Mannio and T. Strandman. Concentrations of PCDDs, PCDFs and coplanar PCBs in Fishfrom Subarctic Lakes in Finland. Dioxin`96. Amsterdam, August 13-16,1996, Organohalogen Compounds 28;1996: 340-343.
12. M. Korhonen and T. Vartiainen. Concentrations of PCDDs and PCDFs in Baltic herring (Clupea harengus)and Northern pike (Esox lucius) in Finnish coastal area from 1989-1993. Organohalogen Compounds 32;1997: 299-304.
13. M. Korhonen, M. Verta and T. Vartiainen. Contamination of Fish by PCDDs and PCDFs in the Kymijoki Riverand its Estuary. Organohalogen Compounds 32; 1997: 305-310.
14. H. Kiviranta, R. Purkunen and T. Vartiainen. Levels of PCDD/Fs and PCBs in Human Milka in 1994 inFinland: Decrease in Concentrations from 1987 to 1994. Organohalogen Compounds 38; 1998: 121-124.
15. T. Rymen. History of the BCR work on dioxins. Fresenius J. Anal. Chem. 348; 1994: 9-22.16. H. Schimmel, B. Griepink, E.A. Maier, G.N. Kramer, A.H. Roos and L.G.M.T. Tuinstra. Intercomparison study
on milk powder fortified with PCDD and PCDF. Fresenius J. Anal. Chem. 348; 1994: 37-46.17. WHO/EURO (1991). Levels of PCBs, PCDDs and PCDFs in human milk and blood, second round of quality
control studies. Ed. E.J. Yrjänheikki. WHO Regional Office for Europe. FADL 1991.18. WHO/ECEH (1996). Levels of PCBs, PCDDs and PCDFs in human milk, second round of WHO-coordinated
ezposure study. WHO European Centre for Environment and Health. Environmental Health in Europe No.3,1996.
19. A.K.D. Liem, G.U.M. Lindström, M. Schlabach, S.M. Gort and R. Hoogerbrugge. Second round ofIUPAC/CFC/WG-HHEC Project 650/80/94: Determination of toxicologically relevant chlorobiphenyls in twofish oils and an analyte solution- Report of the evaluation meeting at the National Institute of Public Health,Oslo, Norway, 30-31 August, 1996. March 1998.
20. P. Kleemola, M. Virtanen and P. Pietinen. The 1992 Dietary Survey of Finnish Adults, National Public HealthInstitute B2/1994, Helsinki, Finland
21. The 1997 Dietary Survey of Finnish Adults, Department of Nutrition, National Public Health Institute B8/1998,Helsinki, Finland.

Annexes to Report SCOOP Task 3.2.5 (Dioxins) Page 67 of 115Final Report, 7 June, 2000
FRANCE
The following explanatory notes throw some light to the summary spreadsheets and relate to studies carried out inpart by French administation (Ministry of Economy and Finances, Ministry of Agriculture and Fisheries and Ministryof Health) and another part by milk and meat industry.All the samples reported in this SCOOP task were only analysed for the dioxins/furans. All samples were taken inthe period 1998-1999.
Sampling procedures
Mothers’ milkThis study was realised in 1998 and 1999 in French lactarium. Samples from 244 healthy women, younger than 35years were collected. The sampling procedure was similar to those used in 1993 in the WHO program. Thesamples were collected in different regions of France, nevertheless, it is not possible to consider the subjects asrepresentative of the French population of women feeding at the breast. The subjects were overrepresented inrural regions and had higher incomes than the general population of pregnant women.
Cows’ milkFrom April until June 1998, 149 semi-skimmed milk samples were collected by French veterinary service. Sampleshave been collected from bulk tanks of the milk industry in different regions of France (2 L by samples). Analysedof the 298 L of semi-skimmed milk correspond to more 15 millions L of collected milk. Samples were realised,when cattle were in pasture. Samples were packaged in plastic bottle or in cardboard and sent frozen to thelaboratory for analysis.
Cow’s milk products126 milk products samples, include cream, cheese, butter and yoghurt were collected by French veterinaryservice.They were obtained randomly from various market of France regions. Final samples : 500 g were sentfrozen to the analysis laboratory.
Fish56 samples include all kinds of Sea fish like fresh salmon, smoked salmon, tuna, sardine, cod, hake, herring, etc…came from near the French coasts and have been collected by French veterinary service. They were obtainedrandomly from various market of France regions. Final samples : 200-1300 g were sent frozen to the analysislaboratory.The analyses were carried out on the muscle parts.
Sea foods (molluscs and crustaceans)13 samples include Oysters, mussels, praw & crab have been collected by French veterinary service. They wereobtained randomly and came from various market near the French coasts. Final samples : 200-700 g were sentfrozen to the analysis laboratory.The analyses were carried out on the muscle parts.
Meat50 samples, include beef, lamb, poultry and pork meat come from various areas of France. 6 samples out of 50are collected from meat imported from the European Union (4 samples) and from the United States (2 samples).They were obtained randomly from various market of France regions. Final samples : 200-1400 g were sent frozento the analysis laboratories.The analyses were carried out on the muscle parts. Analysis done for 24 samples bythe laboratory ERGO (Germany) & by CARSO (France) for the others.

Annexes to Report SCOOP Task 3.2.5 (Dioxins) Page 68 of 115Final Report, 7 June, 2000
Meat products (pork and poultry delicatessen)15 samples include poultry and pork meat. All the samples have been collected by French veterinary service. Theywere obtained randomly from various market of France regions. Final samples : 200-700 g were sent frozen to theanalysis laboratory.
Offals6 samples include majority bovine liver and have been collected by French veterinary service. They were obtainedrandomly from various market of France regions. Final samples : 400 g were sent frozen to the analysis laboratory.
Eggs5 samples have been collected by French veterinary service in 5 differents regions in FranceOne sample was concocted by 6 eggs. Final samples : 200 g were sent frozen to the analysis laboratory.
Fruits5 samples include orange, raisin and apple have been collected by French control service in differents regions inFrance. Final samples : 100 g were sent frozen to the analysis laboratory.
Cereals and cereals products13 samples include cereals, bread, rice and pasta, have been collected by French control service in differentsregions in France. Final samples : 200-700 g were sent frozen to the analysis laboratory.
Vegetables35 samples including leafy, brassica, kale, spinach, potatoes and others vegetables come from several areas ofFrance and have been collected by French control service. Two types of samples : 15 samples are collected in thevicinity of incinerators (around few kms) ; 17 samples are collected apart from incinerators. Samples are generallycollected at market gardening or available for the consumer ; 2 samples at marketing come from an other region ofFrance. Sampling has been done according to method used for the official control of pesticide residues in fruitsand legumes. Treatment of samples : External leaves, soil and vegetable residues are removed. Final samples :1000g were sent frozen to the analysis laboratory.
Analytical methodology and quality AssuranceThe chemical analysis of 24 meat samples was performed at ERGO in Hamburg (Germany) and all the otheranalyses were carried out at CARSO (Lyon, France), which is one of the French national laboratories for theanalysis of dioxins and furans in food. All samples were frozen, lyophilised and analysed according to validatedprocedures, including sample extraction, clean-up, and identification and quantification of the analytes by highresolution gas chromatography with high resolution mass spectrometry.Both laboratories participated in interlaboratory trials of measurement of dioxins and PCBs in various biologicalmaterials as organised by WHO, ICES and IUPAC and have recognised expertise in the analysis of foods fordioxins and PCBs. The quality control criteria included the use of certified standards, continuous monitoring ofblank samples and recovery qualification criteria.
Food consumption dataThe food consumption data used in the intake calculations are derived from last national individuals foodconsumption survey, representative of French whole population (INCA, CREDOC, 1999). The methodology usedwas a precoded 7-d records and data refer to food as consumed with weight of food using photographs of foodsitems. This survey was realised in France in 1998/1999, next to 3003 consummers of to 2 years old and more (>75years old) ; 1985 persons aged 15 and more and 1018 infants and children aged 3-14.
Body weights for the study populations are as follows:

Annexes to Report SCOOP Task 3.2.5 (Dioxins) Page 69 of 115Final Report, 7 June, 2000
Sex/Age group n Body weightMean (kg/person)
Males & females 18 years old and more (>75 years old) 1339 67.1Males & females 15-18 years old 135 59.7Males & females 3-14 years old 1018 31.6
ReferencesCREDOC (1999). Enquête Individuelle Nationale Consommation Alimentaire (INCA), 1999.
GERMANY
General remarksIn Germany most data about dioxins in human milk and food were recorded by the food control laboratories of thefederal Länder. Furthermore, three federal institutes belonging to the Federal Ministry for Agriculture submitteddata on meat, milk and fish under the aspect of representativity.The human milk data are collected in the data bank for residues in human milk and dioxins in other human tissuesat the BgVV (Bundesinstitut für gesundheitlichen Verbraucherschutz und Veterinärmedizin, Federal Institute forHealth Protection of Consumers and Veterinary Medicine).In Annex 3, 1732 results for human milk and about 3000 for food have been summarized. It is obvious that not allthe data are representative of Germany as a whole, but the overall number of samples analyzed permits asubstantial overview of the dioxin levels in human milk and food. Data on food from 1995-1999 are of highestrelevance and therefore they were used for the calculation of the present daily intake, but not all data reportedcould be included in the table. It was not always possible to derive representative levels of dioxin concentrations ina certain food for the calculation of the daily intake but rather to use expert assessments. At present, noinformation on the median and the 95th percentile can be derived from the data on food. Some reports showed the95th percentile to be about the double of the mean for certain foods.For human milk actual levels refer to the data from 1998.To give an impression of the time course of levels data from 1986-1995 for food and 1986-1997 for human milkhave been added in Annex 3, too. For that reason, all data must be comparable and therefore it is necessary thatthey were calculated with the same TEFs. Since the beginning of the nineties until now, I-TEFs have beengenerally used. Some of the data recorded before that period and using other TEFs were converted. Differences inthe results for I-TEQ using upper or lower bound calculations are - as far it can be seen - in most casesneglectable (see Annex 3).Data on dioxin-like PCBs are scarce and incomplete since some but not all dioxin-like PCBs from the list of theWHO report (van den Berg et al., 1998) were included. So these results which are not comparable with oneanother are not suitable as a basis for calculation of the daily intake of these compounds at present. Therefore,only data on PCDDs and PCDFs (dioxins) are used for this report.
Sampling procedures
Human milk
Annexes to Report SCOOP Task 3.2.5 (Dioxins) Page 70 of 115Final Report, 7 June, 2000
Analysis of dioxins in human milk from Germany has been performed since 1985 (Fürst, 1986). Data on 383samples (including two pools) from 1987 were published in the Environmental Health Series by WHO (Yrjänheikki,1989).Two examinations within the framework of the WHO field study were performed by BgVV (Yrjänheikki, 1989,WHO, 1996) . Sampling was performed on the basis of the criteria established by WHO (Yrjänheikki, 1989).The examinations reported by the federal Länder were conducted on the request of the mothers; i.e. sampleselection was not subject to specific criteria but rather accidental.The data shown in the table originate from different regions of Germany. They are representative of thebackground body burden of this population in Germany with dioxins and furans.
Milk and milk productsAnalysis of dioxins in cow’s milk has been performed since 1986 (Beck, 1987 b). As cow’s milk and milk productsare the main contributor to the human dioxin burden and are seen as a bio-indicator, samples from farms, dairies(consumer milk) and tanker lorries collecting milk from several farms (bulk milk) were analyzed in most cases. Dueto seasonal changes in animal feeding stuffs, differences in dioxin levels in cow’s milk amount to up to 25 % duringthe year (Fürst, 1998). The differences between certain regions are even higher (Ruoff, 1999, LUA Südbayern,1998, Fürst, 1998). Contamination of cow’s milk with dioxins by card-board containers was established in 1989(Beck, 1990). After alterations of the procedure of bleeching, dioxin levels in cow’s milk were not influenced bycard board containers any more (Fürst, 1991). At the end of 1997, Malisch found increasing levels of dioxins incow’s milk (Malisch 1998 a) in Baden-Württemberg. During an intensive study, contaminated citrus pulp, acomponent of feeding stuff, was found to be the cause of elevated dioxin levels (Malisch 1998 a). Also in otherfederal Länder of Germany, an increase of dioxin levels caused by this feeding component was established (seeAnnex 3). For the calculation of the daily intake, these slightly elevated concentrations were not considered.In general, consumer milk is most suitable for the calculation of the daily intake. But also milk from tanker lorriessupplying dairies with cow’s milk from many farms (bulk milk) of a certain region is acceptable. Since cow’s milkfrom single farms reflects the background contamination of the farms and the animal feeding stuffs bought fromelsewere, these samples should not be included in the calculation of the daily intake if high numbers of othersamples are available. Data from samples which had been taken near industrial pollutants are excluded in order toensure that the data reflect the normal background and not hot spots.The data on milk and butter are, in general, similar. The results found by Ruoff (Ruoff, 1999) seem to be relativelylow. Considering the limits of detection and that the I-TEQs were calculated with ND=0 for none detectedcongeners, these data are in agreement with the other data calculated with ND=1/2LOD.For milk products (e. g. cheese), the number of samples analyzed is low and representative sampling was notperformed. In contrast to milk, a high share of the milk products has been imported to Germany from other EUmember states.
Meat and meat productsFor animal fat, it is required to distinguish between different types of meat. For pork, the lowest levels were found.Differences between certain regions can be recognized for beef and poultry (Hecht, 1998). As sausages mainlycontain pork their dioxin concentrations are similar (Hecht, 1998) but slightly higher than those of pork. This can beexplained by the fact that sausage contains some of beef and liver and by the effect of smoking (Hecht, 1998).As to meat and meat products, we did not include the levels reported by Hecht (Hecht, 1998), because thislaboratory calculated I-TEQs with ND=0 for none detected congeners. If this is taken account, these data are inagreement with the other data calculated with ND=1/2LOD. Nevertheless, we assume that the quotient of dioxinconcentrations in pork and sausage (1.4) is as a reasonable factor (Hecht, 1998) to estimate dioxin levels insausage, i. e. on the basis of data on pork as no other data for sausages are available.

Annexes to Report SCOOP Task 3.2.5 (Dioxins) Page 71 of 115Final Report, 7 June, 2000
Because of low intakes and uncomplete consumption data, animal fat other than from pork, beef and poultry is notconsidered.
EggsFor eggs, the dependence of the dioxin levels on the type of housing (cage, ground, field) has to be consired.Higher levels were found for eggs from hens which can take up dioxins from soil. Lower levels were established foreggs from hens housed in elevated wire cages. It seems that these dependencies decreased for recent samples(Fürst, 1993, LUA Südbayern, 1994, Malisch, 1994, CLUA Freiburg, 1997, SLUA Oldenburg, 1998). But the database for this food item is inhomogenous. It has to be considered that about 90 % of eggs are layed from henshoused in wire cages.
Fish and fish productsIt is problematic to generate representative data on dioxin levels in fish, as a lot of fish species and fishing groundsexist. In this connection, a recent representative study (Karl, 1999) including 184 samples of fish and fish productsis of high importance. Sampling was based on the real intake according to the share of different species (FIZ,1998) and fishing grounds. Because of great differences in the fat content of fish, levels on a whole weight basiswere preferred.
Fruit and vegetableAll dioxin data on fruit and vegetable were combined.For vegetable oil/margarine, no recent data for dioxin levels was available. Therefore levels from literature (Fürst,1998) were used.
Analytical quality assuranceAll laboratories involved participated in different interlaboratory control studies. The following matrices wereoffered:eggs (Malisch, 1994); kale (Malisch, 1997); butter and milk (Malisch, 1998 b); human milk and blood as well ascow’s milk (P. Fürst/Chemisches Landes- und Staatliches Veterinäruntersuchungsamt, Münster: AnalytischeQualitätssicherung 1995); liver (Husseinpour/Ökometrik GmbH, Bayreuth: June and November 1996); human milk,blood, cow’s milk and fish (first, second, third and fourth round of WHO interlaboratory control studies, Yrjänheikki,1989 and 1991 and Nygren, 1993); fish oil (IUPAC project 650/80/94).
Food Consumption dataThe Report on nutrition (Kübler, 1994) and its supplement (national food consumption survey, Kübler, 1995)served as a basis for representative data on intake of different fats (meat, meat products, milk, butter, milkproducts, eggs, vegetable oil/margarine, bread/bakery products, sweets). The amounts of fat were calculated onthe basis of the mean intakes for male and female consumers of 25-50 years age. As different kinds of fat for meatwere not considered in the studies, additional data were needed for meat and taken from Honikel and Hecht(Honikel, 1994, Hecht, 1998). For meat products (sausage), the procedure is already described above.The kind of fat in bread/bakery products is not known. We asssume that 20 % is derived from butter, 70 % fromvegetable oil/margarine and 10 % from eggs.In sweets, we assume fat to consist of 50 % butter and of 50 % vegetable oil/margarine.The group of fruit and vegetables includes their products, rice, flour, potatoes and marmelade.For the consumption of fish and fish products, we used data from 1997 published in an annual report of theGerman Ministry for Agriculture (BMELF, 1998).

Annexes to Report SCOOP Task 3.2.5 (Dioxins) Page 72 of 115Final Report, 7 June, 2000
Daily intake and time trends
Human milkThe dioxin concentrations in human milk were calculated from the data received from the federal Länder and havebeen summarized in the table A for I-TEQs and PCDD/F-WHO-TEQs (WHO-TEQs):
Table A: Time course of PCDD/PCDF in human milk (pg I-TEQ/g fat and WHO-TEQ/g fat)Sampling No. of
Samples Remarks Minimum Mean Value Median value Maximum
I-TEQ WHO-TEQ I-TEQ WHO-TEQ I-TEQ WHO-TEQ I-TEQ WHO-TEQ1986-90 728 average 5.6 30.6 35.7 29.2 33.0 87.11991 191 average 6.4 7.4 24.1 27.8 23.4 27.2 58.1 64.91992 171 average 4.9 5.7 21.0 24.0 20.6 24.1 47.8 53.81993 141 weighted average 4.1 4.2 18.9 22.0 20.9 24.2 37.61994 90 average 6.1 7.1 17.5 20.4 17.2 20.1 43.9 50.31995 135 average 5.4 6.2 17.9 20.9 16.5 19.1 39.0 45.81996 81 average 4.9 5.7 14.0 16.2 13.7 16.1 30.5 35.41997 126 weighted average 6.0 7.0 11.6 13.5 12.4 14.4 28.7 32.81998 69 weighted average 4.7 5.3 12.9 14.9 12.0 14.2 28.9 31.9
The table shows PCDD/F-WHO-TEQs to be 16 % higher than I-TEQs.The mean levels as well as the maximum levels of PCDD/PCDF in human milk samples have decreased by about60 % between the late eighties (mean: 30.6 pg I-TEQ/g fat) and 1998 (mean: 12.9 pg I-TEQ/g fat). This decreaseof the body burden is in the same range as the decrease of the dioxin intake and the decrease of dioxinconcentrations in foods observed.The regional distribution of the levels of the samples indicates that there are no or minor differences in the dioxinconcentrations. As food intake accounts for the main proportion of the body burden of humans and food inGermany is uniformly distributed, no dependence of the levels on the geographic residence of mothers should beexpected, which also includes the similarity of the congener pattern.Breast feeding for a long time results in a body burden of infants with PCDD/PCDF which is distinctly higher ascompared to the mothers (up to a factor of 2) (Mathar, 1998).For the breast fed infant, an average daily dioxin intake of 57.0 pg I-TEQ/kg body weight (66.1 pg PCDD/F-WHO-TEQ/kg body weight) is calculated from the 1998 data [assumptions: age of the baby = 4 month; mean bodyweight = 6.5 kg (Brandt, 1979); mean daily milk intake = 821 ml (Wallgren, 1945); average fat content in humanmilk = 3.5 %) ; average daily intake of milk fat = 4.42 g/kg body weight].Thus, the TDI derived by WHO is clearly exceeded during the short period of breast-feeding. Nevertheless, theWHO (WHO 1988 and 1998), the Deutsche Gesellschaft für Pharmakologie und Toxikologie (DGPT, 1992,German Society for Pharmacology and Toxicology) and the German National Breast-feeding Committee (1995)have stated that there are no indications of a health risk for a breast-fed infant from mother's milk contaminatedwith PCDD/PCDF in the concentrations found and recommend breast-feeding.
Food
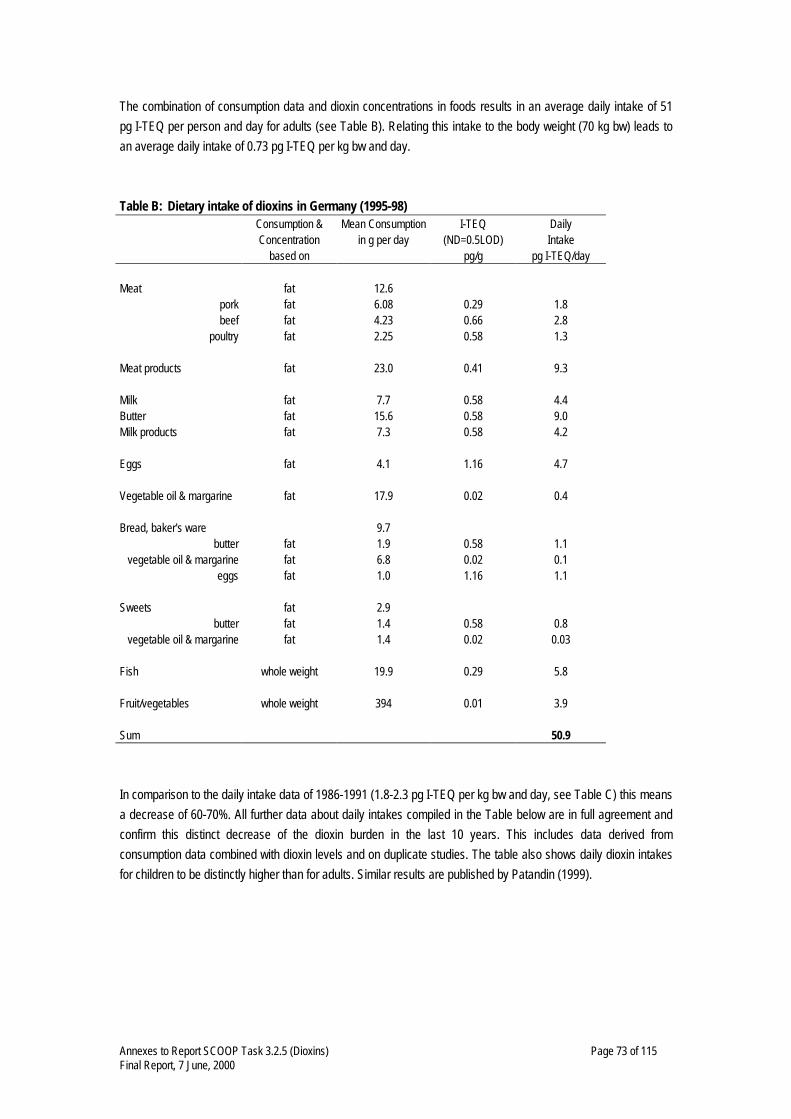
Annexes to Report SCOOP Task 3.2.5 (Dioxins) Page 73 of 115Final Report, 7 June, 2000
The combination of consumption data and dioxin concentrations in foods results in an average daily intake of 51pg I-TEQ per person and day for adults (see Table B). Relating this intake to the body weight (70 kg bw) leads toan average daily intake of 0.73 pg I-TEQ per kg bw and day.
Table B: Dietary intake of dioxins in Germany (1995-98)Consumption &Concentration
based on
Mean Consumptionin g per day
I-TEQ(ND=0.5LOD)
pg/g
DailyIntake
pg I-TEQ/day
Meat fat 12.6pork fat 6.08 0.29 1.8beef fat 4.23 0.66 2.8
poultry fat 2.25 0.58 1.3
Meat products fat 23.0 0.41 9.3
Milk fat 7.7 0.58 4.4Butter fat 15.6 0.58 9.0Milk products fat 7.3 0.58 4.2
Eggs fat 4.1 1.16 4.7
Vegetable oil & margarine fat 17.9 0.02 0.4
Bread, baker's ware 9.7butter fat 1.9 0.58 1.1
vegetable oil & margarine fat 6.8 0.02 0.1eggs fat 1.0 1.16 1.1
Sweets fat 2.9butter fat 1.4 0.58 0.8
vegetable oil & margarine fat 1.4 0.02 0.03
Fish whole weight 19.9 0.29 5.8
Fruit/vegetables whole weight 394 0.01 3.9
Sum 50.9
In comparison to the daily intake data of 1986-1991 (1.8-2.3 pg I-TEQ per kg bw and day, see Table C) this meansa decrease of 60-70%. All further data about daily intakes compiled in the Table below are in full agreement andconfirm this distinct decrease of the dioxin burden in the last 10 years. This includes data derived fromconsumption data combined with dioxin levels and on duplicate studies. The table also shows daily dioxin intakesfor children to be distinctly higher than for adults. Similar results are published by Patandin (1999).

Annexes to Report SCOOP Task 3.2.5 (Dioxins) Page 74 of 115Final Report, 7 June, 2000
Table C: Daily intakes of dioxins (pg I-TEQ/(kg bw * d) from food in Germany since 1986Year of Sampling Method of calculation Daily Intake References
1986-89 Levels in foods (n=22) and consumption data 2.3 Beck, 19891987-90 Levels in foods (n=107) and consumption data 1.7-2.0 Fürst, 19901987-90 Levels in foods (n>=100) and consumption data 1.9 Beck, 1991a1986-91 Levels in foods (n>500) and consumption data 1.8 BMU, 19931991-95 Levels in foods and consumption data 1.47 Wesp, 19961994 Duplicate study (6 female / 6 male) 0.79/0.91 Grün, 19951994-95 Duplicate study (7 female / 7 male) 0.72 Schrey, 19951993-96 Levels in foods (n=1414) and consumption data 0.88 Malisch, 1998a1995 Duplicate study (7 female / 7 male children, age: 22 months – 5 years) 2.6 Schrey, 19961995 Levels in foods (several hundred) and consumption data 1.0 Fürst, 19971995-98 Levels in foods (several hundred) and consumption data 0.53 Karl, 19991995-98 Levels in foods (n≈3000) and consumption data 0.73 this report1998 Duplicate study (21 female / 21 male children, age: 14 - 47 months) 1.61 Wittsiepe, 1999
When summarizing the data on daily intakes from food for this report, there are four groups which account for 10or more % each of the body burden. These are• milk and milk products (39 %, including milk fat from bread/bakery products and sweets)• meat, meat products (30 %)• fish and fish products (11 %)• eggs (11 %, including bread/bakery products).Fruits, vegetables, and vegetable oils (including vegetable oils/margarine in bread/bakery products and sweets)account for 9 % of the PCDD/F intake via food.
Large differences between PCDD/F levels in fish lead to a broader variation of the PCDD/F intakes from this food.For 1995, Fürst established a similar intake from fish (Fürst, 1997) as found by Karl (Karl, 1999) and used for thisreport. In contrast, the Freiburg data on fish (CLUA Freiburg, 1997) would lead to an dioxin intake from fish whichis higher by 66% in comparison with the representative data according to the market share used by Karl (Karl,1999). As in the Freiburg report a difference is made only between salt water and fresh water fish we preferred thedata reported by Karl and included them in our calculations. Other data concerning fish (see Annex 3) were alsonot considered in the calculation of the daily intakes as most data relate to fish of minor importance.The share of the daily dioxin intake from fish found to be 11 % at present (see also Fürst, 1997), is distinctlyreduced in comparison to calculations based on levels found around 1990 (about 30 %, see Fürst, 1990, Beck,1989 and 1991a, BMU, 1993). Decreases of dioxin levels in fish can be attributed to reduction of the mean age offish and changes in the fishing grounds in addition to a decrease of environmental dioxin levels. Presumably non-representative sampling at the beginning of dioxin analysis in fish in Germany and recording of levels on a fatweight basis, which is problematic for fish (Ende, 1992, Fürst, 1998), prevent clear statements concerning thereasons for the strong decline. On the basis of the most representative data on fish for 1988-1991 reported byEnde (Ende, 1992), a decline of 59 % which is close to that found for other foods (see table below) can becalculated since that period.
The decreases of dioxin levels in other foods starting in the late eighties can only be estimated, because data fromthe late eighties are rare:

Annexes to Report SCOOP Task 3.2.5 (Dioxins) Page 75 of 115Final Report, 7 June, 2000
Table D: Decrease of dioxin levels in some foodsFood I-TEQ, pg/g fat
(before 1989)I-TEQ, pg/g fat
at presentDecrease
%Milk 1.8 0.58 68Pork 0.4 0.29 28Beef 3 0.66 78
Poultry 2.3 0.58 75
The data base for eggs is inhomogeneous. Therefore, a decline of dioxin levels is not proved, but an increase is unlikely.
Data on dioxin levels in fruits and vegetables are limited. As levels are very low and a multitude of different kinds of fruits andvegetables exist, it is not possible to make any clear statements. However, it is generally accepted that the decrease issubstantial and at least in the range reported for other foods.
The effect of smoking on dioxin levels in meat, sausage and fish is unknown, because there are no systematic studies on thissubject. Altogether, the additional dioxin contamination caused by smoking does not seem to be important (Hecht, 1998, Karl,1999, Körner, 1990), although some high levels were reported for samples of the outer parts of smoked ham (Mayer, 1998).This can be explained by an inadequate technology of smoking in some cases, because the median levels in unsmoked andsmoked ham are the same (Mayer, 1998).
Maximum residue levelsIn 1993, a Joint Working Group on DIOXINS (federal and Länder authorities) submitted its second report (BMU, 1993 andBasler 1994). Concerning milk and dairy products, reference values and recommendations for action were given:
pg I-TEQ/g milk fat Proposed action<0.9 Desirable target;
achievable in the long run only by measures to reduce the dioxin input into the environment.>3.0 Identification of dioxin sources and initiation of measures to reduce input. Change of land use
patterns recommended for affected farms, if emission-reducing measures are not feasible inthe forseeable future or would not result in reduced contamination.Recommendation to stop direct supply of milk and dairy products to consumers.
>5.0 Ban on trade of contaminated milk and dairy products.
These recommendations were not included in any legal regulations.
In order to take protective measures with regard to the contamination by dioxins of certain food from Belgium in 1999, the EUCommission decided, in view of the absence of limits for dioxins, to use data on background levels as a reference for Memberstates. For Germany, the following reference levels were issued and compared with the mean levels derived in this report:

Annexes to Report SCOOP Task 3.2.5 (Dioxins) Page 76 of 115Final Report, 7 June, 2000
FoodReference levels for a special case
pg PCDD/F-WHO-TEQ/g fatmean level
pg I-TEQ/g fatEggs 5 1.16
Poultry 5 0.58Pork 2 0.29Milk 3 0.58Beef 6 0.66
Although PCDD/F-WHO-TEQ are somewhat higher in comparison to I-TEQ, it is obvious that the reference levelsare distinctly higher than the 95th percentile, which is about the double of the mean for most foods. When fixingthe reference levels it was not considered that the contamination of certain foods from Belgium by dioxinscoincided with a high contamination by PCBs resulting in an additional increase of WHO-TEQs.
ReferencesBasler, A.: Regulatory measures in the Federal Republic of Germany to reduce the exposure of man and the
environment to dioxins. Organohalogen Compounds 20 (1994) 567-570Beck, H., Eckart, K., Mathar, W., Rühl, Ch. S. and Wittkowski, R.: Isomerenspezifische Bestimmung von PCDD
und PCDF in Human- und Lebensmittelproben. VDI-Bericht 634 (1987a) 359-382Beck, H., Eckart, K., Kellert, M., Mathar, W., Rühl, Ch. S. and Wittkowski, R.: Levels of PCDFs and PCDDs in
Samples of Human Origin and Food in the Federal Republic of Germany. Chemosphere 16 (1987b) 1977-1982
Beck, H., Eckart, K., Mathar, W. and Wittkowski, R.: PCDD and PCDF Body Burden from Food Intake in theFederal Republic of Germany. Chemosphere 18 (1989) 417-424
Beck, H., Droß, A., Eckart, K., Mathar, W. and Wittkowski, R.: Influence of different regional emissions andcardboard containers on levels of PCDD, PCDF and related compounds in cow milk. Chemosphere 21 (1990)789-798
Beck, H., Droß, A. and Mathar, W.: PCDDs, PCDFs and related Contaminants in the German food supply.Organohalogen Compounds 6 (1991a) 133-144.
Beck, H., Droß, A., Ende, M., Fürst, Chr., Fürst, P., Hille, A., Mathar, W. and Wilmers, K.: PolychlorierteDibenzofurane und -dioxine in Frauenmilch. Bundesgesundhbl. 34 (1991b) 564-568
Beck, H., Droß, A. and Mathar, W.: Dependence of PCDD and PCDF levels in human milk on various parametersin Germany II. Chemosphere 25 (1992) 1015-1020
BMELF, Bundesministerium für Ernährung, Landwirtschaft und Forsten: Jahresbericht über die DeutscheFischwirtschaft 1998. Bonn 1998.
BMU, Bundesministerium für Umwelt, Naturschutz und Reaktorsicherheit: 2. Bericht der Bund/Länder-Arbeitsgruppe "DIOXINE" Stand: November 1993.
Brandt, I.: Perzentilkurven für die Gewichtsentwicklung bei Früh- und Reifgeborenen in den ersten fünf Jahren.Der Kinderarzt 10 (1979) 713-718
CLUA Freiburg, Chemische Landesuntersuchungsanstalt Freiburg, Germany: Jahrebericht 1997CLUA Münster, Chemisches Landes- und Staatliches Veterinäruntersuchungsamt Münster, GermanyData bank, BgVV: Data bank for residues in human milk and dioxins in other human tissues at the Bundesinstitut
für gesundheitlichen Verbraucherschutz und Veterinärmedizin (Federal Institute for Health Protection ofConsumers and Veterinary Medicine)
DGPT-Mitteilungen 1992, 31: Stellungnahme der Beratungskommission Toxikologie der DGPT zur toxikologischenBedeutung der Dioxin-Gehalte in der Muttermilch
Annexes to Report SCOOP Task 3.2.5 (Dioxins) Page 77 of 115Final Report, 7 June, 2000
Ende, M.: PCDD/PCDF Levels in Fish. Current Views on the Impact of Dioxins and Furans on Human Health andthe Environment, Proceedings of The Toxicology Forum (Berlin, 9.-11.11.1992) 364-382
FIZ (Fisch-Informationsdienst e. V.): Daten und Fakten. Berlin, 1998Fürst, P., Meemken, H.-A. and Groebel, W. Determination of polychlorinatd Dibenzodioxins and Dibenzofurans in
Human Milk, Chemosphere 15 (1986), 1977-1980.Fürst, P., Fürst, C. and Groebel, W. Levels of PCCDs and PCDFs in food-stuffs from the Federal Republic of
Germany, Chemosphere 20 (1990), 787-792.Fürst, P., Fürst C. and Wilmers, K., Body burden with PCCD and PCDF from Food, In Gallo, M., Scheuplein, R.J.
and van der Heijden, C.A. (eds.) Banbury Report 35, Cold Spring Harbor Laboratory Press, 1991, 133-142,ISSN 0198-0068.
Fürst, P., Fürst, C. and Wilmers, K.: PCDD/PCDF in Commercial Chicken Eggs - Depending on the Type ofHousing, Organohalogen Compounds. 13 (1993), 31-34.
Fürst, P. and Wilmers, K., Decline of PCDD/F intake by humans between 1989 and 1995, OrganohalogenCompounds 33 (1997), 116-121.
Fürst, P.: Dioxine in Lebensmitteln. in: Handbuch Dioxine: Quellen, Vorkommen, Analytik / Oehme, M. (Ed.).Heidelberg, 1998.
Fürst, P. and Wilmers, K., PCDD/PCDF levels in dairy products from North Rhine-Westphalia 1990 - 1998,Organohalogen Compounds 43 (1999 a), 325-328.
Fürst, P.: personal communication. 1999 bGerman National Breast-feeding Committee (1995): Rückstände in Frauenmilch, Beschluß der Nationalen
Stillkommission vom 20.11.1995. Bundesgesundhbl. 39 (1996) 87Grün, M., Päpke, O., Weißbrodt, M., Lis, A., Ball, M. and Schubert, A., PCDD/PCDF-Intake of humans - a
duplicate study in a contaminated area, Organohalogen Compounds 26 (1995), 151-154.Hecht, H. and Blüthgen, A.: Polychlorierte Dibenzo-p-dioxine und -furane in Fleisch und Fleischerzeugnissen.
Bericht der Bundesanstalt für Fleischforschung und der Bundesanstalt für Milchforschung. 1998Honikel, K. O.: Fleisch und Fleischverzehr. Fleischwirtschaft 46 (1994) 130-150Karl, H., Blüthgen, A. and Ruoff, U.: Polychlorierte Dibenzo-p-dioxine und -furane in Fisch und Fischerzeugnissen.
Bericht der Bundesforschungsanstalt für Fischerei und der Bundesanstalt für Milchforschung. 1999Kersting, M., Ness, B., Schöch, G., Das Baukastensystem der Beikost zur Realisierung der Empfehlung für die
Nährstoffzufuhr im 5.-12. Lebensmonat. Akt. Ernähr.-Med. 19 (1994) 160-169Körner, W. and Hagenmaier, H., PCDD/PCDF Formation in Smoked, Fried and Broiled Meat and Fish,
Organohalogen Compounds 4 (1990), 243-248.Kübler, W., Anders, H. J. and Heeschen, W. (Ed.): Lebensmittel- und Nährstoffaufnahme in der Bundesrepublik
Deutschland. Ergänzungsband zum Ernährungsbericht 1992 auf der Basis der Nationalen Verzehrsstudie.Band XII der VERA-Schriftenreihe, ISBN 3-930600-13-7, Niederkleen, 1994
Kübler, W., Anders, H. J. and Heeschen, W. (Ed.): Ergebnisse der Nationalen Verzehrsstudie (1985-1988) überdie Lebensmittel- und Nährstoffaufnahme in der Bundesrepublik Deutschland. Band XI der VERA-Schriftenreihe, ISBN 3-930600-28-5, Niederkleen, 1995
LANU Schleswig-Holstein, Landesamt für Natur und Umwelt, Flintbek, GermanyLUA Südbayern, Landesuntersuchungsamt für das Gesundheitswesen Südbayern, Germany: Polychlorierte
Dibenzo-p-dioxine und Dibenzofurane in Hühnereiern. Abschlußbericht und Untersuchungsergebnisse, April1994
LUA Südbayern, Landesuntersuchungsamt für das Gesundheitswesen Südbayern, Germany: Jahrebericht 1995LUA Südbayern, Landesuntersuchungsamt für das Gesundheitswesen Südbayern, Germany: Jahrebericht 1996LUA Südbayern, Landesuntersuchungsamt für das Gesundheitswesen Südbayern, Germany: Jahrebericht 1997LUA Südbayern, Landesuntersuchungsamt für das Gesundheitswesen Südbayern, Germany: Jahrebericht 1998
Annexes to Report SCOOP Task 3.2.5 (Dioxins) Page 78 of 115Final Report, 7 June, 2000
Malisch, R, Schmid, P., Frommberger, R. and Fürst, P., Collaborative Study of different analytical methods fordetermination of PCDD/PCDF in Eggs, Organohalogen Compounds 19 (1994), 255-260.
Malisch, R. et al, Results of a quality control study of different analytical methods for determination of PCCD/PCDFin kale samples, Organohalogen Compounds 31 (1997), 83-88.
Malisch, R., Update of PCDD/PCDF-Intake from Food in Germany, Chemosphere, Vol. 37, Nos 9-12, (1998a),1687-1698.
Malisch, R. et al, Confirmation of a PCDD/PCDF contamination of milk and butter samples by an "EmergencyCollaborative Study", Organohalogen Compounds 35 (1998b), 131-135.
Mathar, W., Palavinskas, R. and Kleemann, W. J.: „Polychlorinated dibenzo-p-dioxins (PCDDs), dibenzofurans(PCDFs) and biphenyls (PCBs) in organs of infants.“ 4th World Congress Foodborne Infections andIntoxications, 7-12 June 1998, Berlin, Germany, Proceedings (Vol. II), 1105-1112
Mayer, R., Low Levels of Polychlorinated Dibenzo-p-dioxins and Dibenzofurans in Cow’s Milk from SouthGermany, Organohalogen Compounds 26 (1995), 109-111.
Mayer, R., Polychlorinated Dibenzo-p-dioxins and Dibenzofurans in Smoked Meat Products, OrganohalogenCompounds 38 (1998), 139-142.
Nygren, M. et al, World Health Organization 3rd International Intercalibration Study on PCBs, Dioxins and Furansin Human Milk, Blood, Cows' Milk and Fish, Organohalogen Compounds 11 (1993), 27-30.
Patandin, S. et al.:Dietary Exposure to Polychlorinated Biphenyls and Dioxins from Infancy until Adulthood: AComparison between Breast-feeding, Toddler, and Long-term Exposure. Environmental Health Perspectives107 (1999) 45-51
Ruoff, U., Ubben, E.-H., and Blüthgen, A.: Polychlorierte Dibenzo-p-dioxine und -furane (PCDD/F) in Milchfett inder Bundesrepublik Deutschland. Bericht der Bundesanstalt für Milchforschung. 1999
Schrey, P., Mackrodt, P., Wittsiepe, J. and Selenka, F., Dietary intake of PCDD/F measured by the duplicatemethod, Organohalogen Compounds 26 (1995), 147-150.
Schrey, P., Wittsiepe, J. and Selenka, F., Dietary intake of PCDD/F by small children measured by the duplicatemethod, Organohalogen Compounds 30 (1996), 166-171.
SLUA Oldenburg, Staatliches Lebensmitteluntersuchungsamt Oldenburg, Germany: Jahresbericht 1997SLUA Oldenburg, Staatliches Lebensmitteluntersuchungsamt Oldenburg, Germany: Jahresbericht 1998Van den Berg, M. et al, Toxic Equivalency Factors (TEFs) for PCBs, PCDDs, PCDFs for Humans and Wildlife,
Environmental Health Perspectives, Vol. 106, No 12 (1998), 775-792.Wallgren: Acta Paediatr. 32 (1945) 778Wesp, H. F. and Rippen, G.: Aktualisierung von Verzehrsdaten und Aufnahme Polychlorierter Dibenzo-p-dioxine
und Dibenzofurane durch den Menschen. Deutsche Lebensmittel-Rundschau 92 (1996) 375-381WHO (1988), Regional Office of Europe: PCBs, PCDDs and PCDFs in Breast Milk: Assessment of Health Risk.
Copenhagen 1988, Environmental Health 29WHO (1996): Levels of PCBs, PCDDs and PCDFs in human milk. Bilthoven, World Health Organization, European
Centre for Environment and Health (Environmental Health in Europe No. 3).WHO (1998): Assessment of the health risk of dioxins: re-evaluation of the Tolerable Daily Intake (TDI). Executive
summary. WHO Consultation, May 25-29 1998, GenevaWittsiepe, J., Schrey, P. and Wilhelm, M., Dietary intake of PCDD/F by small children with different food
consumption measured by the duplicate method, Organohalogen Compounds 44 (1999), 289-293.Yrjänheikki, E. (Ed.) Levels of PCBs, PCDDs and PCDFs in human milk. World Health Organization, Regional
Office for Europe by FADL (Environmental Health Series No. 34), Copenhagen, 1989.Yrjänheikki, E. (Ed.): Levels of PCBs, PCDDs,and PCDFs in human milk and Blood. Second round of quality
control studies. World Health Organization. Environment and Health in Europe 37, FADL, Copenhagen, 1991

Annexes to Report SCOOP Task 3.2.5 (Dioxins) Page 79 of 115Final Report, 7 June, 2000
ITALY
Sampling procedures
Mothers’ Milk. Human milk samples were collected according to the WHO protocol (1).
Milk. A large proportion of the milk consumed in Italy is imported. Consumer milk is by and large a pool of nationaland imported milk, though proportions in pools may vary considerably from a manufacturer to another. Samplesanalyzed are not of domestic origin and have been collected from tankers as soon as they arrived at themanufacturers.
Butter and Cheese. Samples were taken in foodstores and were Italian brands.
Meat and Eggs. Data produced mostly refer to imported products. In particular, the pork products are imported toa large extent and widely distributed throughout the Italian markets.
Fish and Molluscs. Samples of marine species with high commercial value were obtained in two samplingcampaigns from the northern, central and southern areas of the Adriatic sea. All samples were analyzed by theItalian National Institute of Health.
Analytical Methodology and Quality AssuranceMost of the analyses were carried out at the Italian National Institute of Health by the Laboratory of ComparativeToxicology and Ecotoxicology. The Laboratory has participated in interlaboratory trials of analysis of dioxins andPCBs in various matrices and has recognised expertise in the analysis of foods for dioxins and PCBs. Theanalytical methodologies currently used and the quality control criteria, including the use of certified materials andcontinous monitoring of blank samples, have been published (2-7).
Food Consumption DataData here produced derived from the INN-CA 1994-96 food consumption survey (8).The survey design was as follows.- Sample. The total sample was composed of 1,200 households randomly selected from registry lists. They
were representative of the four main geographical areas North West, North East, Centre and South. Withineach area, households were selected taking into account the demographical size of municipalities. For eachselected household (main), three substitutes were extracted in order to maintain the randomness. Thenumber of individuals involved was over 3,000 ranging from 0 to 94 years, 48% males, 52% females.
- Period. The survey was carried out from October 1994 to February 1996. The households were divided intofour groups in order to cover the four seasons.
- Duration. 7 days.- Measurement of food consumption. Precise scales were provided in order to weigh food quantities (initial and
final inventory, purchase, wastage, recipes and individual quantities whenever possible). Only for individualquantities, portion size was recorded instead of weighing, especially for outdoor consumption.
- Ancillary information (explicative factors). One household questionnaire, compiled by the person in charge ofalimentation, to collect data on food-related activities, main purchase habits, changes in dietary habits, etc.One individual questionnaire about basic information such as age, gender, weight, height, marital status,education, job, health, special diets, life style habits. One individual questionnaire about attitudes towardsfoods rich in fats (Fishbein-Ajzen model).
- Data check. Completeness and data quality have been checked at single household level. Particularly, thefood section validity was verified by considering that: food quantities had to be expressed as single food
Annexes to Report SCOOP Task 3.2.5 (Dioxins) Page 80 of 115Final Report, 7 June, 2000
items, raw and edible part only; therefore mixed dishes were split into single components according to thecollected recipes "if prepared at home" or standard recipes "if consumed outside". In some cases conversionfactors were applied; each food item was coded by utilising an ad hoc system, to identify single food itemsand aggregate into food groups; for each food item consumed at home, the weekly intake should be equal tothe sum of individual consumptions plus wastage; for each ingredient in a household recipe, the initial rawquantity should be equal to the sum of individual consumptions plus wastage.
- Post-selection of the subjects. A subsample of 1978 individuals was selected by excluding outliers andsuspected underreporting subjects. The selection was performed by calculating, for each individual, the dailyenergy requirement for an average life style and the corresponding daily energy intake (kcal) by theapplication of the Italian food composition table to the consumption quantities. The comparison of the twoestimates provided the group of consumers assuming a habitual diet. The validity of the selection has beentested by calculating the ratio between the daily energy intake and the Basal Metabolic Rate (BMR)(FAO/WHO/UNU, 1985).
- Numerical expression and food groups. Food intakes are expressed in net weight (excluded left-over andwastage) of raw quantities of ingredients.
References1. WHO (1989). Levels of PCBs, PCDDs and PCDFs in breast milk. Environ.Health Ser. 29.2. Larsen B.R., Turrio Baldassarri L., Nilsson T., Iacovella N., di Domenico A., Montagna M., and Facchetti S.
(1994): Toxic PCB Congeners and Organochlorine Pesticides in Italian Human Milk. Ecotoxicology andEnvironmental Safety 28, 1-13.
3. Schecter A., di Domenico A., Turrio Baldassarri L., and Ryan J.J. (1992). Dioxin and Dibenzofuran Levels inthe Milk of Women from Four Geographical Regions in Italy as Compared to Levels in Other Countries.Organohalogen Compounds 9, 227-230.
4. Bayarri S., Turrio Baldassarri L., Iacovella N.,Rodriguez F., and di Domenico A. (1999): Toxic OrganicMicrocontaminants in Edible Marine Species from the Adriatic Sea. Organohalogen Compounds 43, 289-294.
5. Turrio Baldassarri L., Bayarri S., di Domenico A., Iacovella N., La Rocca C. (1999): Supercritical FluidExtraction of Mollusc Samples for Simultaneous GC-MS Determination of Polychlorobiphenyls and PolyciclicAromatic Hydrocarbons. International Journal of Environmental Analytical Chemistry, in press.
6. Turrio Baldassarri L., di Domenico A., La Rocca C., Iacovella N. (1998). Microchemical Journal 59, 144-153.7. di Domenico et al.(1998): Priority Microcontaminants in Biota Samples from the Venice Lagoon: A Selection
of Concentration Data and Elements of Risk Analysis. Organohalogen Compounds 39, 199-204.8. Turrini A., Leclercq C., D’Amicis A. (1999): Pattern of Food Intakes in Italy and their Application to the
Development of Food-based Dietary Guidelines. British Journal of Nutrition 81, Suppl.2, S83-S89
NETHERLANDS
This information relates in most cases to studies carried out on behalf of the Ministry of Health, Welfare andSports, the Ministry of Agriculture, Nature Management and Fisheries,. and the Ministry of Housing, SpatialPlanning and the Environment.
Sampling procedures
Fats and oils. The selection of oils and fats was based on data from the Dutch Commodity Board Margarine, Fatsand Oils (MVO) on the amounts of the main oils and fats used by the food industry in products for domesticconsumption. In 1990-1991, the following fats and oils (number of different batches between brackets) weresampled in the food industry: palm oil, soybean oil (2x), coconut fat, palm oil, rape-seed oil, sunflower oil (2x) and
Annexes to Report SCOOP Task 3.2.5 (Dioxins) Page 81 of 115Final Report, 7 June, 2000
fish oil (5x). The selected types represented 98% of the total amount of oils and fats incorporated in products fromthe food industry, based on the consumption figures over the period 1987-1988 (1).Incoming oils and fats in food industry are refined before use. To assure the representativity of resulting intakedata, the food industry was asked to supply samples from the refined flows of oils and fats, directly prior to use inthe manufacture of food products. This succeeded for most of the collected oils and fats. However, for some of thefish oils, only partly refined oils were collected. Therefore, a follow-up study was initiated to improve therepresentativity of the data and to study the influence of refining steps. To this end, a second sampling programmewas carried out in the period September - December 1994, in which another twenty samples of both unrefined andrefined batches of fish oils were analysed (2).
Consumer milk. The milk that reaches the majority of consumers in the Netherlands is produced by four (two since1998) major manufacturers each of those having factories distributed over the country. Milk produced by thesefactories (further referred to as ‘consumer milk’) represent pooled samples of milk produced by dairy farmsdistributed all over the country. From time to time, Dutch consumer milk may even comprise supplies from abroad.Only minor fractions are bought directly at individual dairy farms. Using this information, it was chosen to collectsamples of milk at super markets, retail outlets and milk factories, to collect representative data on levels ofPCDDs, PCDFs and non-ortho planar PCBs in consumer milk. Two national composite samples of consumer milkhave been prepared in the spring of 1991. To this end, four packages of cartoned milk of 1 liter each were boughtat local stores on the same in areas near Groningen (north), Weert (south), Delft (west) and Utrecht (centre). Bymixing equal weight amounts of the four regional samples, a national representative pooled sample was obtained.The same procedure was repeated one month later.A follow-up to investigate levels in consumer milk over a longer period of time have been carried out in the periodOctober 1992 - September 1993. A similar sampling campaign is carried out since October 1997 (is at present stillongoing). In these monitoring programs, cartons of whole milk are collected at regular intervals (at least onesample per week) from the major manufacturers in several regions distributed over the country. In the 1992-1993study, ‘quarterly averaged’ samples were prepared from four manufacturers located in the north, east, west andsouth of the Netherlands by mixing equal weight amounts of samples taken over a period of a quarter of a year.Finally, eleven quarterly averaged samples were taken into analysis (2). In the on-going programme, 'monthlyaveraged' samples are prepared from the four (since 1999 two) major manufacturers in the country by mixingequal weight amounts of samples taken over a period of one month.
Farm milk. Additional information on local variations in levels in cow’s milk has been obtained in a monitoringprogramme (3). The programme included the measurement of dioxin levels in samples of cow’s milk collected fromstorage containers at selected dairy farms in the neighbourhood of waste incinerators and a metal reclamationplant. The main purpose of this programme was to check dioxin levels in suspected areas in the framework of theCommodities Act Dioxins in Milk, active as of July 1989. If the standard of 6 pg (i)-TEQ/g of fat is exceeded, milkfrom that area is collected and destroyed. Since 1989, hundreds of samples of cow’s milk have been collectedaround dioxin sources in the Netherlands. In 1989, this programme also included samples taken from dairy farmsin ‘rural areas’, i.e. farms remote from urban/industrial areas. Initially, samples representing the daily production ofeach selected farm were analysed. Due to observed day-to-day variations it was decided late 1989 to preparecomposite samples (‘monthly averaged samples’) of 150 ml each by mixing six samples of 25 ml taken from thesame farm at regular time intervals over a period of one month (3).
Animal fat and liver. For the category with one type of animal fat, both fat and liver samples were collected inslaughterhouses in four different regions (North, West, East and South) in the Netherlands. At regular timeintervals in the period July-September 1990, samples of liver and fat were collected in each region from tenanimals of the following species: cow, pig, horse, sheep, goat and chicken. During sampling, amounts of at least10 g of subcutaneous neck or intestinal fat (or tail fat of chicken) and 250 g of liver were collected. Only animalsintended for domestic consumption were selected. Next, two independent regionally pooled samples were made

Annexes to Report SCOOP Task 3.2.5 (Dioxins) Page 82 of 115Final Report, 7 June, 2000
by mixing equal weight amounts of five of the ten samples for the first (”A”) and the other five for the secondregional sample (”B”). This resulted in eight regional composite samples (four regions, two composites for eachregion, five individual samples pooled to one regional sample). Finally, national composite samples were made bymixing equal weight amounts of one of the two regional samples from each region (2).
Cereals. Samples of wheat flour, wheat and rye were collected at the three largest flour mills in the Netherlands inthe fall of 1991. Next, composite samples of wheat flour, wheat and rye were prepared each by mixing of the threesamples collected (2).
Butter, cheese, meat products, nuts, eggs, fish and game. Categories ‘butter and cheese’, ‘meat products’, ‘nuts’,‘eggs’, ‘fish’ and ‘game’ were sampled using a proportional technique. These samples were prepared from amixture of different food products, with each item added in weight proportional to its average consumption, asdetermined in the Dutch National Food Consumption Survey, held in 1987-1988 (4). The selection of food items tobe mixed had to cover at least 95% of the intake of the respective category according to the Dutch National FoodConsumption Survey. The items themselves were collected in four different regions in the Netherlands. In eachregion, two different inspectors of a Regional Inspectorate for Health Protection collected independently from eachother the complete set of requested food items at stores of their own choice. Similar to the category of animal fats,eight regional samples and two nation-wide composite samples were finally obtained (2).A similar sampling strategy is used in the most recent food study, which is started in 1998. A full report on thefindings is expected in the spring of 2000. In this study, various food products from the Dutch food supply werecollected at super markets or other outlets in five different regions of the Netherlandsin the month March 1999. Asfor the 1990-1991 study, a database of the Dutch National Food Consumption Survey was used for the selectionof the food products, and to aggregate the various food products into nation wide composites (in Annex 3 referredto as 'mixed-DNFCS') for each of the various food groups (eighteen in total). For this study the database of thethird Dutch National Food ConsumptionSurvey held in 1997-1998 (DNFCS 1997-1998) was used.
Curly kale. In the design of the food study carried out in 1990-1991, it was assumed that 98% of the humanexposure occurs through consumption of foods from animal origin (5). Therefore it was decided to exclude thecategory of vegetables from the sampling programme. However, to allow a rough estimate of the additionalexposure through the consumption of vegetables, the results from a separate study on dioxin levels in curly kale(Brassica oleracea var. acephala) have been included.Curly kale is a crop grown in the open field with a large and fatty leaf surface and demands, compared to otherleafy vegetables, a relatively long growth season (fall and winter). Fourteen samples of curly kale were collectedfrom allotments in the neighbourhood of two municipal waste incinerators (Lickebaert area, Duiven), a metalreclamation plant (Culemborg) and two reference locations (Bergambacht and Texel) at the end of the growingseason in February 1991. The levels of dioxins and furans in the samples were subsequently analysed.
Duplicate diets. The analytical programme consisted of samples of 24-hour duplicate diets collected by adults inthe period January-March 1978, in October 1984 and March 1985, and in March and October 1994. The sampleswere stored in freeze-dried state at -20°C until analysis. Information on original weights and the percentage of dryweight after lyophilization was available. In addition, personal characteristics (e.g. age, length, body weight, sex) ofthe consumer were known. The study design was optimized to acquire information on the temporal trend in theaverage dietary intake expressed per kg body weight per day. In order to minimize the number of nondetects, itwas chosen to perform the analyses on composite samples. These composites were prepared by mixing aliquotsof the freeze-dried duplicate diets of about 10 (25 for 1978) individuals in each pool. Of each duplicate, an equalweight fraction was aggregated into the respective pool. Finally, each composite (i.e. 4 samples from 1978, tensamples from 1984-1985 and 10 samples from 1994) was subsequently analysed on the levels of PCDDs, PCDFsand an extensive selection of PCBs (2).
Annexes to Report SCOOP Task 3.2.5 (Dioxins) Page 83 of 115Final Report, 7 June, 2000
Human Milk. The human milk data refer to studies performed by the RIVM and as reported by Koopman-Esseboom and coworkers (6). The Koopman-Esseboom study included 195 individual samples of mothersrecruited between June 1990 and June 1992. The human milk surveys performed by RIVM are performed at fiveyears intervals to study trends in human exposure to polychlorinated organic compounds (7, 8). The two latestsurveys also included congener-specific determinations of the PCDDs and PCDFs (pooled samples in 1988 andindividual samples in 1993) and dioxin-like PCBs (individual samples in 1993). In September 1998, the samples forthe most recent RIVM campaign were collected. Results will become available in the summer-fall of 2000.
Analytical methodology and Quality AssuranceThe analyses were carried out at the Laboratory for Organic-analytical Chemistry of the RIVM, Bilthoven, or at theState Institute for Quality Control of Agricultural Products (RIKILT) in Wageningen (Koopman-Esseboom study).The analytical methodologies of both laboratories have been published (9-12).The laboratories have participated in inter-laboratory trials of measurement of dioxins and PCBs in biologicaltissues organised by the WHO, EU-SM&T, IUPAC and QUASIMEME and have recognised expertise in theanalysis of foods for dioxins and PCBs.Where available, reference materials are used and the agreement achieved is between specified ranges betweenactual and measured concentrations for individual congeners. Based on a number of studies, the coefficients ofvariation for the determination of TEQs were approximately 100% for samples of vegetable oils and fats andapproximately 5% for the other foods including human milk. For individual congeners, coefficients of variation werearound 20% for levels above 1 pg/g fat, and less than 50% for levels between 0.1 and 1 pg/g fat. Below 0.1 pg/gfat, higher variations should be taken into account (2).
Food consumption dataFor the selection of foods and the calculation of dietary intakes, the databases of the Dutch National FoodConsumption Survey (DNFCS) have been used. The surveys have been carried out and have been describedelsewhere (4, 13, 14). Briefly, 2203 (2475 in 1992, and 2564 in 1997-1998) households participated resulting in asample of 5898 (6218 in 1992, and 5958 in 1997-1998) subjects. Food consumption was assessed by a 2-daydietary record method, equally distributed over the seven days of the week and over a whole year. For eachsubject, data on age, sex, body weight and a series of other characteristics were available. The population groupranged from 1 to 85 years in age. For each person, the quantities of various ingested food items over the day wererecorded. Of each food product, a comprehensive description of the food items, including percentage total fat, wasavailable from the Netherlands Nutrient databank (15, 16). The average body weight for the total population of theDNFCS held in 1987-1988, 1992 and 1997-1998 were 61.87, 63.05 and 65.48 kg, respectively.
References1. MVO (Commodity Board for Margarine, Fats and Oils) (1988). Annual report 1988. Commodity Board for
Margarine, Fats and Oils, The Hague2. Liem, A.K.D., and Theelen, R.M.C. (1997). Dioxins: Chemical Analysis, Exposure and Risk Assessment.
Ph.D. Dissertation, Utrecht University, October 1997, ISBN 90-393-2012-83 Liem, A.K.D., Hoogerbrugge, R., Kootstra, P.R., Van der Velde, E.G., and De Jong, A.P.J.M. (1991).
Occurrence of dioxins in cow’s milk in the vicinity of municipal waste incinerators and a metal reclamationplant in the Netherlands. Chemosphere, 23, 1675-1684
4. DNFCS (1988). Results of the Dutch National Food Consumption Survey 1987-1988 [Wat eet Nederland.Resultaten van de voedselconsumptiepeiling 1987-1988. Ministerie van WVC en LNV, Rijswijk]
5. Travis, C. and Hattemer-Frey, H. (1987). Human exposure to 2,3,7,8-TCDD. Chemosphere, 16, 2331-2342.6. Koopman-Esseboom, C., Huisman, M., Weisglas-Kuperus, N., Van der Paauw, C.G., Tuinstra, L.G.M.Th.,
Boersma, E.R., and Sauer, P.J.J. (1994). PCB and dioxin levels in plasma and human milk of 418 Dutchwomen and their infants. Predictive value of PCB congener levels in maternal plasma for fetal and infant’sexposure to PCBs and dioxins. Chemosphere, 28, 1721-1732

Annexes to Report SCOOP Task 3.2.5 (Dioxins) Page 84 of 115Final Report, 7 June, 2000
7. Liem, A.K.D., Albers, J.M.C., Baumann, R.A., Beuzekom, A.C. van, Hartog, R.S. den, Hoogerbrugge, R.,Jong, A.P.J.M. de, and Marsman, J.A. (1995). PCBs, PCDDs, PCDFs and organochlorine pesticides inhuman milk in the Netherlands, levels and trends. Organohalogen Compounds, 26, 69-74
8. Albers, J.M.C., Kreis, I.A., Liem, A.K.D., and Van Zoonen, P. (1996). Factors that influence the level ofcontamination of human milk with poly-chlorinated organic compounds. Arch. Environ. Contam. Toxicol., 30,285-291
9. Liem, A.K.D., De Jong, A.P.J.M., Marsman, J.A., Den Boer, A.C., Groenemeijer, G.S., Den Hartog, R.S., DeKorte, G.A.L., Hoogerbrugge, R., Kootstra, P.R., and Van ‘t Klooster, H.A. (1990). A rapid clean-upprocedure for the analysis of polychlorinated dibenzo-p-dioxins and dibenzofurans in milk samples.Chemosphere, 20, 843-850
10. Van Rhijn, J.A., Traag, W.A., Kulik, W., and Tuinstra, L.G.M.Th. (1992). Automated clean-up procedure forthe gas chromatographic high-resolution mass spectromic determination of polychlorinated dibenzo-p-dioxins and dibenzofurans in milk. J. Chromatogr., 595, 289-299
11. Van der Velde, E.G., Marsman, J.A., De Jong, A.P.J.M., Hoogerbrugge, R., and Liem, A.K.D. (1994).Analysis and occurrence of toxic planar PCBs, PCDDs and PCDFs in milk by use of Carbosphere activatedcarbon. Chemosphere, 28, 693-702
12. Van der Velde, E.G., Hijman, W.C., Linders, S.H.M.A., and Liem, A.K.D. (1996). SFE as clean-up techniquefor ppt-levels of PCBs in fatty samples. Organohalogen Compounds, 27, 247-252
13. DNFCS (1992). Results of the Dutch National Food Consumption Survey 1992 [Zo eet Nederland, 1992.Resultaten van de Voedselconsumptiepeiling 1992. Voorlichtingsbureau voor de Voeding, Den Haag, ISBN90 5177 027 8
14. DNFCS (1998). Results of the Dutch National Food Consumption Survey 1998 [Zo eet Nederland, 1998.Resultaten van de Voedselconsumptiepeiling 1998. Voedingscentrum, Den Haag, ISBN 90 5177 036 7
15. NEVO (NEVO-Table Dutch Nutrient Database) (1988). NEVO-tabel. Nederlands Voedingsstoffen-bestand1986-1987. Stichting NEVO, Voorlichtingsbureau voor de Voeding, Den Haag
16. NEVO (NEVO-Table Dutch Nutrient Database) (1993). NEVO-tabel. Nederlands Voedinsgstoffen-bestand89/90 en 93. Zeist, 1993
NORWAY
Sampling procedures
Most of the information included in this report relates to studies initiated by the Norwegian Food Control Authority(SNT). The analyses of dioxins and dioxin-like PCBs were carried out at the National Institute of Public Health, theNorwegian College of Veterinary Medicine and the Norwegian Institute for Air Research. Some of the data arecollected in collaboration with other institutes such as the Norwegian Institute for Water Research (NIVA) and TheDirectorate of Fisheries.The Norwegian Pollution Control Authority (SFT) has since the middle of the 1980’s carried out monitoringprograms in industrially contaminated areas. Because of industrial emissions to some fjords and harbours, fish andshellfish are heavily contaminated with dioxins, PCBs, PAH and for heavy metals. The Norwegian Food ControlAuthority recommends restrictions on seafood consumption and bans sale of seafood from certain contaminatedareas. Data obtained on levels of dioxins and dioxin-like PCBs in biota from these special monitoring programs arenot included in this report since they are not considered to be representative for food on the market, but they canbe made available if needed.Data used in this report are from areas considered as uncontaminated. The samples are considered to berepresentative for foods on the market.

Annexes to Report SCOOP Task 3.2.5 (Dioxins) Page 85 of 115Final Report, 7 June, 2000
Eggs and Milk productsThe Local Food Control Authorities in Oslo, Trondheim and Stavanger collected samples of eggs and butter atretail outlets. Each egg and butter sample contained eggs or butter from 10 different packages, respectively.All estimates of intake from milk products are based on the levels of dioxins and PCBs found in butter since nodata from non-ortho PCB in milk were available. This assumption is justified by comparing the analytical results ofdioxins and other PCBs in milk and butter. According to expectation the results are very similar when expressedon a fat weight basis.
Margarine based on marine oilsIn 1989, two pooled samples from the two largest producers of hard margarine were collected at retail outlets bythe Local Food Control Authorities in Oslo and Trondheim. At that time it was common to use marine oils asingredients in margarine. Today all margarins sold to the consumers are based on vegetable oils, but marine oilsare still to a certain extent used in food production.
FishSamples of commercially important fish species were caught in the coastal waters of Northern Norway during1994. The fish samples of muscle, liver or roe were collected from commercial catches delivered to local fishingplants, and from research catches on board the research vessel «Oscar Sund», Department of Fisheries anNatural Science, Bodø College. The samples of salmon were collected at fish farms. Most of the fish samplesconsisted of 25 individuals. The samples were packaged, frozen and transported to the laboratories. Specialprecautions were taken to avoid contamination of the fish samples.The Directorate of Fisheries collected the samples of cod muscle in 1989.
CrabThe Norwegian Institute for Water Research (NIVA) caught 10-20 male crabs considered representative ofcommercial fishing sites in September-November 1996.
Cod liver oilIn 1996, three samples from the largest producers of cod liver oil were collected at retail outlets by the Local FoodControl Authorities in Oslo. The pooled samples consisted of oil from 5 different bottles.These cod liver oils had gone through a cleaning process for removing organic contaminants. The producers ofcod liver oil did not have such cleaning procedures for organic contaminants before 1988-90, and dioxins levels upto 16 TEQ (pg/g) were at that time found in products. Results from 1994 show that the levels of dioxins havedeclined to 0.53 TEQ. This illustrates that it is possible to clean oils that are contaminated with organiccontaminants.
MeatThe meat analyses were performed on fat and not on meat muscle. The pooled samples of meat fat were taken atslaughterhouses and each sample consisted of fat from at least 10 individuals. The local Food Control Authoritiesin some of the main cities of Norway (Oslo, Trondheim and Stavanger) collected the samples from cattle and pigs,while the sheep samples were taken by the slaughterhouses in Stavanger, Tynset and Gol.
Human MilkStudy from 1991 (Johansen et al. 1994). A total of 28 Norwegian mothers (26.2 ± 2,7 years of age) participated inthe study. The milk samples were analysed individually. The women were giving birth to their first child during theperiod April-July 1991 at the City Hospital of Oslo, Ullevål Sykehus. They had lived in the Oslo area during thepreceding 3 years, immigrants to Norway were excluded. All samples were taken from healthy donors with normaland healthy babies. Apart from these selection criteria, mothers were selected at random. Samples of colostrumand milk (10-20 ml) were obtained 3-5 days postpartum. The milk was expressed manually or by a furnished
Annexes to Report SCOOP Task 3.2.5 (Dioxins) Page 86 of 115Final Report, 7 June, 2000
breast pump that had been tested for adsorption and contamination. The milk samples were immediately frozen inglass bottles (cleaned with ethanol and hexane) and kept frozen at -20°C until analysed. A questionnaire includingbackground data on mothers and child, such as sex, length, and weight of the infant, and age, weight, height,smoking habits, occupation, dietary habits, and health status of the mother was completed by each donor andmade it possible to ensure that mother/infant pairs agreed with the selection criteria used. Such data would alsoreveal any «extreme» mother/infant pairs in the sample.Study from 1992/1993 (Becher et al. 1995). Milk from mothers living for at least 5 years in the three different areaswas collected and pooled (10 mothers per pool). The areas comprised a coastal non-industrialised, a rural, and anindustrial/urban area. The selection criteria for mothers developed by WHO/EURO were used. Each mother hadgiven birth to her first child and had a single birth. Both mother and child were apparently healthy, and thepregnancy had been normal. The sampling was carried out between 2 weeks and 5 months after delivery. Onlyexclusively breast-feeding mothers were included. Apart from these criteria, mothers were selected at random, andparticipation was voluntary. The milk was expressed by a furnished breast pump that had been tested for lack ofadsorption and contamination.
A volume of about 60 ml was collected within 24 h. The milk samples were immediately frozen in glass bottles freeof contamination and kept -20°C until pooling. For pooling, milk samples from each area were thoroughlyhomogenised by shaking in an incubator at 37°C. Then 50 ml of human milk from each of 10 mothers was mixedto give a single pooled sample for analysis of PCDDs and PCDFs, non-ortho PCBs, and other PCBs and stored at-20 until analysed. Laboratory reagent equipment blanks were analysed prior to series of samples to test forpresence of background contamination. Detection limits for GC-ECD were between 5 and 20 pg/g milk dependingon the congener, 3-15 fg/g milk for GC-MS of PCDDs/PCDFs, and 1-7 fg/g milk for non-ortho PCBs.
Analytical methodology and Quality AssuranceThe analyses of dioxins and dioxin-like PCBs were carried out at the National Institute of Public Health, theNorwegian College of Veterinary Medicine and the Norwegian Institute for Air Research.Participation in an interlaboratory analytical quality assurance test organised by Swedish environmental ProtectionAgency (SEPA) confirmed good analytical quality for determination of non-ortho-substituted PCBs in fish oilsamples. The laboratories had participated successfully in international quality control studies for analysis of majorPCB congeners in human milk organised by WHO/UNEP in 1982 an 1992 (Norwegian College of VeterinaryMedicine, Oslo) and the analysis of PCDDs and PCDFs in human milk organised by WHO/EURO in 1993 (NationalInstitute of Public Health, Oslo).
Toxic Equivalency FactorsFor the human milk studies levels expressed in 2,3,7,8-TCDD toxic equivalent (TEQs) were calculated by usingthe international equivalency factors (ITEQs) for PCDDs and PCDFs (NATO/CCMS,1988) and the WHO TEFs fordioxin-like PCBs (Ahlborg et al., 1994). For the different food items TEQs for dioxins are calculated according tothe Nordic model (Ahlborg et al., 1988), while the WHO model (Ahlborg et al., 1994) was used for PCBs. Generallya reporting limit is applied which is the limit of determination (LOD) of the analytical method (except the humanmilk study from 1991 were the reporting limit is 0.5 LOD).
Food consumption dataThe Norwegian consumption data are from the national dietary survey NORKOST 1997 (The National Council onNutrition and Physical Activity, 1999), which includes 2672 persons in the age of 16 to 79 years. The method usedin the NORKOST surveys is a quantitative food frequency questionnaire. The results from the survey describe theusual diet among the participants.There is a tendency that surveys using food frequency questionnaires overestimate the food consumption inrelation to food records measures. The average energy intake among men aged 16 to 19 years who participated inNORKOST 1993/94 was above the reference values for boys aged 15 to 18 years. This may indicate that this age

Annexes to Report SCOOP Task 3.2.5 (Dioxins) Page 87 of 115Final Report, 7 June, 2000
group overestimates their consumption to some degree. However, the average energy intake among men in theage group 30 to 79 years old were within the reference values. Female participants reported energy intakes belowthe reference values which indicates that the women may underestimate their consumption (Johansson et al.1997).The statistical values of food consumption are based on all participants, i.e. both consumers and non-consumersof the foods. This means that the intake estimates will be spread also on those participants who do not haveconsumed the particular food. This will lead to a lower intake estimate than if only the consumers were to beconsidered.In the food composition data base similar types of certain foods have been aggregated into one food code. Forinstance, plaice is aggregated into a food code that also consists of other kinds of fish. In the data base a «recipe»is connected to such a food code with information about the assumed percentage of each fish type. Thisinformation was used when calculating the amount of plaice that was consumed by the participants.Since only the PCB and dioxins content in meat-, margarine- and butter fat have been analysed and not in theproducts as such, the consumption data refer to fat coming from meat, milk, butter and margarine. Data from thefood composition database for the fat content in these foods have been used. The consumption of milk fat includesfat from milk, cream, cheese and ice cream.The contribution from cakes and biscuits to the total intake of different kinds of fat and eggs, were calculated byusing standard recipes laid down in the food composition data base. Recipes from this data base were also usedwhen calculating the contribution from fish products made of cod to the total intake of cod.Some of the questions asked in NORKOST were about the consumption of meat dishes. The participants were notasked to specify the kind of meat used in these dishes. When calculating the consumption of various meats it wasassumed that certain fractions consisted of pork, cattle and sheep respectively.The Norwegian intake estimates are subject to some uncertainties. There were few analytical data available. As aconsequence of this the intake calculation did not cover all sources to the total dietary intake of PCB and dioxins.There were also difficulties in finding data for the consumption of specific foods. Therefore assumptions had to bemade about the consumption of some of the relevant foods.It should also be notified that almost all margarine used in Norway nowadays consists of vegetable fat. Asmentioned earlier the analytical data for the content of PCB and dioxins in margarine are from the time when thisproduct still contained fish oils. This may have resulted in estimated intakes of the substances which are higherthan the actual levels.
The average body weights for the human material are as follows:
Sex/age group n Body weight (mean)Males 16-79 years old 1246 80.6 kgFemales 16-79 years old 1319 66.3 kg
References1. Becher G., Skaare J.U., Eriksen G. S., and Lund-Larsen, K. (1997). «Dioksiner og dioksinliknende PCB i
næringsmidler i Norge». SNT-rapport 9.2. Becher G., Skaare J.U., Polder A., Sletten B., Rossland O.J. Hansen H.K. and Ptashekas J. (1995). PCDDs,
PCDFs, and PCBs in human milk from different parts of Norway and Lithuania. J. Toxicol. Environ. Health46:133-148.
3. Eriksen G. S.(1993). Miljøgifter i næringsmidler. Innsamling av data og prioritering av analyser. SNT-rapport7.
4. Færden K. (1991). Dioksiner i næringsmidler. Oppsummering av dioksinanalyser i 1989 og 1990 SNT-rapport4.

Annexes to Report SCOOP Task 3.2.5 (Dioxins) Page 88 of 115Final Report, 7 June, 2000
5. Johansen H.R., Becher G., Polder A., and Skaare J.U.(1994).Congener-specific determination ofpolychlorinated biphenyls and organochlorine pesticides in human milk from Norwegian mothers living inOslo. J. Toxicol. Environ. Health 42:157:171.
6. Johansson, L, Solvoll, K, Bjørneboe, G-E Aa, Drevon, CA: Dietary Habits among Norwegian Men andWomen. Scand J Nutr 41:63-70, 1997.
7. National Council on Nutrition and Physical Activity: NORKOST 1997. Landsomfattendekostholdsundersøkelse blant menn og kvinner i alder 16-79 år. Rapport nr. 2, 1999. (In Norwegian).
8. Knutzen J., Becher G., Berglind L., Brevik E.M., Schlabach M. and Skaare J.U. (1999). Organiske miljøgifter itaskekrabbe (Cancer pagurus) fra norske referanselokaliteter 1996. Undersøkelser av polyklorertedibenzofuraner/dibenzo-p-dioksiner (PCDF/PCDD), andre persistente klororganiske stoffer og polysykliskearomatiske hydrokarboner (PAH). Statlig program for forurensningsovervåking nr. 773/99, TA-nr. 1663/1999.
9. Solberg T., Becher G., Berg V. and S. Eriksen G.S.1997. «Kartlegging av miljøgifter i fisk og skalldyr fra nord-områdene». SNT-rapport 4.
SWEDEN
The following explanatory notes throw some light to the summary spreadsheets and relate to studies carried out inpart on behalf of the Swedish Environmental Protection Agency (EPA) and in part at the National FoodAdministration (NFA).Regular environmental monitoring of persistent organic pollutants is carried out primarily, where possible, withinthe framework of the national environmental monitoring programme operated by the Swedish EnvironmentalProtection Agency. It includes amongst other things programme for surveying dioxins and dioxin-like compoundsand their sources. The main emphasis of the programme is on the marine sector where high levels are usuallyfound.The NFA gives priority to surveillance of foods of animal origin and vegetables and thus provides some data onfood items to supplement the Swedish EPA programme.
Sampling procedures
Cows’ milk. Until 1998 milk samples were collected either from individual farms or from retail outlets from time totime and analysed. Since 1998 samples have been collected from bulk tanks. Composite samples are preparedregionwise and frozen until analysis. In 1988-1990 samples were only analysed for the dioxins/furans.
Fish. Samples of herring have been monitored by the National Environmental Protection Agency for many yearsthrough a number of laboratories. Other fishes analysed but not on a regular basis include salmon, whitefish, eeletc. They were obtained randomly from the fish market or through professional fishermen. The analyses werecarried out on the muscle parts.
Mothers’ milk. Human milk surveys have been carried out by Norén et al between 1972 - 1992 in pooled samples(1) and by Atuma et al at the National Food Administration, 1994 - 1998 (2,5). The NFA’s survey for PCDD/Fs andthe dioxin-like PCBs included 10 and 63 individual samples in 1994 and 1997/1998 respectively.
Meat. The meat samples analysed for the dioxin-like substances were mainly from pigs, cows, sheep and chickenand were very few in number. These were carried out in 1989 and just recently (1998, 1999) more samples havebeen analysed for both PCBs and dioxins.

Annexes to Report SCOOP Task 3.2.5 (Dioxins) Page 89 of 115Final Report, 7 June, 2000
Eggs. Eggs have been analysed only in two occasions, 1993 and 1999. They were obtained from different foodstores and represented different producers. Samples from 1993 comprised of 84 eggs subdivided into 7 pools. In1999 there were 4 pooled samples consisting of 8 eggs each.
Market basket survey. Mixtures of different food products, comprising of different fish type, meat products, eggs,milk and milk products were prepared in various categories, with each item added in weight proportional to theaverage consumption. The items were collected mainly from four locations in Sweden (Gothenburg, Uppsala,Malmö and Sundsvall).
Analytical methodology and Quality AssuranceMost of the analyses were carried out at the Department of Environmental Chemistry, University of Umeå, Institutefor Applied Environmental Research (ITM), University of Stockholm, Department of Medical Biochemistry andBiophysics, Karolinska Institute, Stockholm and National Food Administration, Uppsala. Some of the dioxinanalyses were carried out at RIVM, The Netherlands and Dr. Wessling Laboratory in Altenberge. All samples wereanalysed according to validated procedures, including sample extraction, clean-up, separation on silica gel oralumina column, identification and quantification of the analytes by gas chromatography with ecd or high resolutionmass spectrometry.The laboratories involved have at different occasions participated in interlaboratory trials of measurement ofdioxins and PCBs in various biological materials organised by the WHO, ICES and IUPAC and have recognisedexpertise in the analysis of foods for dioxins and PCBs. The quality control criteria included the use of certifiedstandards, continuous monitoring of blank samples and recovery qualification criteria of 50-150% for the dioxins.
Food consumption dataThe food consumption data used in the intake calculations are derived from the national dietary survey carried outin 1997-98 (Riksmaten).The methodology used was a precoded 7-d records and data refer to food as consumed,i.e. no back-calculation to recipe ingredients has been done. The data refer to males and females 18-74 year old.The consumption data for individual fish species are derived from a food frequency questionnaire included in thesurvey covering consumption during the previous year. Standard portions have been used to estimate the averagedaily fish consumption. Analytical data are available for a few fish species, and these data have been matched withthe appropriate fish category in the questionnaire.
Body weights for the study populations are as follows:
Riksmaten 1997-98Males 80.8Females 66.6Average 73.7
References1. Lundén Å and K. Norén. Polychlorinated naphthalenes and other organochlorine contaminants in Swedish
human milk, 1972-1992; Arch. Environ. Contam. Toxicol. 24, 414-423 (1993)2. Atuma S., L. Hansson, H. Johnsson, S. Slorach, C. de Wit and G. Lindström. Organochlorine pesticides,
polychlorinated biphenyls and dioxins in human milk from Swedish mothers; Food Additives and Contaminants15, 142-150 (1998).
3. de Wit C. and M. Strandell. The Swedish Dioxin Survey: Levels, sources and trends of dioxins and dioxin-likesubstances in the Swedish environment; manuscript under preparation.
4. Atuma S., C.E. Linder, A. Wicklund-Glynn, Ö. Andersson and L. Larsson. Survey of consumption fish fromSwedish waters for chlorinated pesticides and polychlorinated biphenyls; Chemosphere 33, 791-799 (1996)
Annexes to Report SCOOP Task 3.2.5 (Dioxins) Page 90 of 115Final Report, 7 June, 2000
5. National Food Administration; Unpublished data6. Lindström G. Doctoral thesis 1988.7. Rappe C, G. Lindström. B. Glas and K. Lundström. Levels of PCDDs and PCDFs in milk cartons and in
commercial milk; Chemosphere 20, 1649-1656 (1990).8. Atuma S., A. Bergh, L. Hansson, A. Wicklund-Glynn and H. Johnsson; Non-ortho PCB levels in various fish
species from the east and west coast of Sweden; Chemosphere 37, 2451-2457 (1998).9. Atuma S., M. Aune, A. Bergh, A. Wicklund-Glynn, P.O. Darnerud, L. Larsson, M. Olsson and O. Sandström.
Polychlorinated biphenyls in salmon (Salmo salar) from the Swedish east coast; Organohalogen compounds39, 153-156 (1998).
10. Lindström G., and Rappe C. Analytical method for analysis of polychlorinated dibenzo-p-dioxins anddibenzofurans in milk, Chemosphere 17, 921-935 (1988).
11. Becker W. Befolkningens kostvanor och näringsintag i Sverige 1989. Metod- och resultatanalys (Dietaryhabits in Sweden 1989). Statens livsmedelsverk, Uppsala 1994.
12. Becker W. Riksmaten 1997-98. Svenskarna äter nyttigare - allt fler väljer grönt. Vår Föda nr 1, s. 24-27(1999).
UNITED KINGDOM
This information relates only to those studies carried out on behalf of the Ministry of Agriculture, Fisheries andFood (MAFF). Other occurrence data have been provided by the Department of Agriculture in Northern Ireland(DANI) and the University of Lancaster.
Sampling Procedures and Sample Treatment
Total Diet Study (TDS). Samples consist of retail food products, prepared as for consumption, and then combinedinto composite samples in amounts reflecting their relative importance in the typical UK diet in a particular year.Each composite sample represents a defined food group. 1982 and 1992 TDS samples of for each of the foodgroups included were collected from 24 locations in the UK for each year and pooled into single samples foranalysis. All TDS samples are stored under stable conditions.
Retail cows’ milk. Samples were collected from retail outlets and doorstep deliveries. Milk contained variously inglass bottles or in paperboard cartons have been studied. Samples were frozen for transportation and, on arrival,were pooled and homogenised to produce a single bulk sample for each region. Subsequent treatment as givenabove.
Farmed trout. Samples of edible trout flesh were obtained during the period October-December 1995, from troutfarms across England and Wales by Fish Health Inspectors. Each sample consisted of several fillets of muscletaken from different fish of similar age and size at each location. The samples were packaged, deep-frozen andtransported to the laboratory. Samples were not prepared as for consumption prior to analysis. Fish tissue wasthawed, homogenised and subdivided into smaller portions, which were weighed, re-frozen and freeze dried toconstant pressure. Moisture loss was determined gravimetrically. The portions were recombined, ground togetherto ensure thorough mixing, and stored in tightly-capped glass containers. An aliquot of the powder was taken foranalysis and another for fat determination, whilst the remainder was stored at -20°C.
Marine fish. The sampling plan for marine fish was designed to provide a range of species and ports, or countries,of landing. Samples were also obtained at different times of the year to cover any seasonal variations. Primarysamples were taken from a major fish market and consisted of a minimum of 3 whole fish or, in the case of largespecies such as cod or haddock, fillets taken from at least 3 fish. Samples made up of whole fish were filleted,
Annexes to Report SCOOP Task 3.2.5 (Dioxins) Page 91 of 115Final Report, 7 June, 2000
skinned and homogenised before being subdivided into smaller portions. Where samples arrived as large fillets,each fillet was skinned, sub-sampled and homogenised together before subdivision. Fish finger samples weretaken from retail outlets and were thawed, removed from all packaging and homogenised (complete withbreadcrumb coating) before subdivision. The smaller portions were then weighed, frozen and freeze dried toconstant pressure. Moisture loss was determined gravimetrically. The portions were recombined, homogenisedand stored in tightly capped glass containers. An aliquot of the powder was taken for analysis, whilst theremainder was stored at -20°C.
Fish oil dietary supplements. Samples were purchased from shops or supplied by the manufacturer and/or by theMedicines Control Agency. The survey covered the leading brands on the market only and was not acomprehensive survey of all brands available. Samples included pure cod liver oils, halibut liver oils and fish bodyoils in bottles and/or in capsules and bottled mixtures of cod liver oil enriched with fish oil and cod liver oil withsyrup.
Cows’ milk from individual farms. Milk samples were taken from individual cows or more usually from the bulktanks of dairy farms after thorough mixing of the contents. The milk was placed in chemically clean glass bottlesprovided by the laboratory and frozen before despatch by commercial carrier. Frozen milk was thawed slowly andsubdivided into smaller portions, which were weighed, re-frozen and freeze-dried to constant pressure. Moistureloss was determined gravimetrically. The portions were recombined, homogenised and stored in tightly cappedglass containers. An aliquot of the powder was taken for analysis, whilst the remainder was stored at -20°C.
Analytical methodology and AQA
The analyses undertaken on behalf of MAFF were carried out at the Central Science Laboratory, Food ScienceLaboratory, Norwich. The analytical methodology currently used for the determining dioxin and PCBconcentrations in food has been published (1).The laboratory has participated in inter-laboratory trials of measurement of dioxins and PCBs in human milk andhuman blood organised by the WHO and has recognised expertise in the analysis of foods for dioxins and PCBs.Generally a reporting limit is applied which is the limit of determination (LOD) of the analytical method. Where thetarget LOD is not achieved, the reporting limit is the prevailing limit of determination, set by the level and variabilityin the analytical batch blanks, rather than instrumental sensitivity. Analytical data are assessed for compliancewith published acceptance criteria (2).Where available, reference materials are used and the agreement achieved is between specified ranges betweenactual and measured concentrations for individual congeners. Based on a number of studies, the coefficients ofvariation for the analyses were approximately 10% for dioxins and non-ortho-PCBs and up to 5% for ortho-PCBs.
Food Consumption data
Adults The 1986/7 British Adults Survey was a seven day weighed diary study of 2197 adults aged between 16and 65 chosen to be representative of the general population and living in private households. The data havebeen averaged over 7 days for consumption estimates. Mean and 97.5th percentile consumption figures weregiven by consumer. Mean and 95th percentile consumption figures by population were later supplied followingagreement by participants that only population exposure estimates would be included in the report. Consumptiondata are generally considered to be representative of an average UK adult but the figures are not targeted towardsparticular ethnic groups (3). The average bodyweight of the survey population was 70.1kg.
Schoolchildren The 1986/7 Schoolchildren Study was also a 7 day weighed dietary survey of 3367 schoolchildren[aged 10/11 (2071) and 14/15 (1296) year old] from Local Authority schools where school meals were provided.All food and drink consumed in the home was weighed and recorded in a diary by the children, while food outside

Annexes to Report SCOOP Task 3.2.5 (Dioxins) Page 92 of 115Final Report, 7 June, 2000
the home, where weighing was not possible, were recorded in a pocket notebook by each child. The food wasthen traced by fieldworkers at a later date. Weights of schoolchildren were not measured, so that average valuesare used to express consumption or intake data by bodyweight. The data cannot be considered as trulyrepresentative of a population of schoolchildren in the UK because (i) there was over-sampling of Scottish children(aged 10/11) and (ii) over-sampling has occurred of children from lower class families. For this reason suchfigures should be viewed with some caution (4). The average bodyweight of the survey population was 43.4kg.
Toddlers. The 1992/3 Toddler Survey was a 4-day weighed diary study of 1675 children aged 1.5 to 4.5 years.Average bodyweights were 12.3 kg for toddlers aged 1.5 to 2.5 years, 14.6 kg for toddlers aged 2.5 to 3.5 yearsand 16.5 kg for toddlers aged 3.5 to 4.5 years. The overall bodyweight of the study population was 14.4kg (5).
Breast fed infants. A study which tracked the consumption of human milk by 48 infants over an eight month periodwas used to give estimates of the mean consumption of human milk by nursing infants between 2 and 10 monthsof age (6).
References1. Krokos, F., Creaser, C.S., Wright, C. and Startin, J.R. (1997) Congener-specific method for the determination
of ortho- and non-ortho polychlorinated biphenyls, polychlorinated dibenzo-p-dioxins and polychlorinateddibenzofurans in foods by carbon-column fractionation and gas chromatography-isotope dilution massspectrometry. Fresenius Journal of Analytical Chemistry 357, 732-742
2. P.F Ambidge, E.A. Cox, C.S. Creaser, M. Greenberg, M.G. de M. Gem, J. Gilbert, P.W. Jones, M.G.Kibblewhite, J. Levey, S.G. Lisseter, T.J. Meredith, L. Smith, P. Smith, J.R. Startin, I. Stenhouse and M.Whitworth, 1990, Acceptance criteria for analytical data on polychlorinated dibenzo-p-dioxins andpolychlorinated dibenzofurans, Chemosphere, 21, 999-1006
3. Gregory, J., Foster, K., Tyler, H. and Wiseman, M. (1990) Dietary and nutritional survey of British adults,publ. HMSO, London
4. Department of Health, Committee on Medical Aspects of Food Policy (1989) The diets of Britishschoolchildren. Report on Health and Social Subjects No. 36. publ HMSO
5. Gregory, J. R., Collins, D.L., Davies, P.S.W., Hughes, J.M. and Clarke, P.M. (1995) National dietary andnutritional survey: children aged 1.5 to 4.5 years. Volume 1: report of the diet and nutritional study. Publ.HMSO.
6. Paul, A.A., Black, A.E., Evans, J., Cole, T.J. and Whitehead, R.G. (1988) Breastmilk intake and growth ininfants from two to ten months. Journal of Human Nutrition and Dietetics 1, 437-450

Annexes to Report SCOOP Task 3.2.5 (Dioxins) Page 93 of 115Final Report, 7 June, 2000
Annex 3: Occurrence data for dioxins and related PCBs (concentrations in pg/g) in different food products reported by the participating countries
No. of Samples Fat TEQ pg/g Handling PCBof nd's selection
ID Food Country rep/sel Origin Description Year #coll. /pool #anal % basis PCDD/F PCBcereals / cereal products
173 bread food group UK rep Whole of UK total diet study 1982 24 24 1 1.9 fat 1.28 1.00 nd=LOD All_PCBs174 bread food group UK rep Whole of UK total diet study 1992 24 24 1 2.2 fat 1.37 0.73 nd=LOD All_PCBs279 bread, rice, pasta FR rep various regions in France rural 1998 9 1 9 1.3 whole 0.02 nd=LOD none171 cereals food group UK rep Whole of UK total diet study 1982 24 24 1 7.5 fat 1.76 1.76 nd=LOD All_PCBs172 cereals food group UK rep Whole of UK total diet study 1992 24 24 1 7.1 fat 2.67 0.37 nd=LOD All_PCBs343 pastry SV rep National market basket 1999 8 4 2 24.0 fat 0.72 0.44 nd=LOD All_PCBs102 rye NL rep 3 largest flour mills average 1991 3 3 1 1.3 fat 0.77 0.60 nd=LOD nor_PCBs58 rye flour FI rep shop unknown 1998 1 1 1 whole 0.02 0.00 nd=LOD All_PCBs103 wheat NL rep 3 largest flour mills average 1991 3 3 1 1.9 fat 0.74 0.19 nd=LOD nor_PCBs104 wheat flour NL rep 3 largest flour mills average 1991 3 3 1 1.7 fat 0.85 1.20 nd=LOD nor_PCBs59 wheat flour FI rep shop unknown 1998 1 1 1 whole 0.01 0.00 nd=LOD All_PCBs
eggs412 eggs DE sel 1987 10 10 1 fat 1.52 nd=0.5LOD none105 eggs NL rep nation-wide mixed (DNFCS) 1990 8 4 2 10.0 fat 2.00 1.80 nd=LOD nor_PCBs40 eggs NO rep Norway shops 1990 30 10 3 9.7 whole 0.19 0.86 nd=LOD All_PCBs4 eggs FI rep 16 largest egg farms 1991 20 5 4 fat 1.55 nd=Zero none274 eggs UK sel Derbyshire farm near industrial site 1991 18 3 6 whole 2.19 nd=LOD none414 eggs DE rep Bavaria chickens in wire cages 1992 230 10 23 fat 0.81 nd=0.5LOD none413 eggs DE sel Bavaria chickens raised on fields 1992 370 10 37 fat 3.20 nd=0.5LOD none273 eggs UK sel Derbyshire farm near industrial site 1992 6 1 6 12.1 whole 0.81 nd=LOD none419 eggs DE sel chickens kept on ground 1993 410 10 41 fat 1.51 nd=0.5LOD none420 eggs DE sel chickens raised on fields 1993 530 10 53 fat 4.39 nd=0.5LOD none415 eggs DE rep chickens in wire cages 1993 200 10 20 fat 1.16 nd=0.5LOD none418 eggs DE rep chickens in wire cages 1993 1130 10 113 fat 1.28 nd=0.5LOD none417 eggs DE sel chickens raised on fields 1993 230 10 23 fat 1.91 nd=0.5LOD none416 eggs DE sel chickens kept on ground 1993 110 10 11 fat 1.81 nd=0.5LOD none

Annexes to Report SCOOP Task 3.2.5 (Dioxins) Page 94 of 115Final Report, 7 June, 2000
Annex 3: Occurrence data for dioxins and related PCBs (concentrations in pg/g) in different food products reported by the participating countries
No. of Samples Fat TEQ pg/g Handling PCBof nd's selection
ID Food Country rep/sel Origin Description Year #coll. /pool #anal % basis PCDD/F PCB1 eggs SV sel National mixed 1993 84 12 7 9.3 fat 1.31 1.82 nd=LOD nor_PCBs421 eggs DE rep chickens in wire cages 1997 310 10 31 fat 0.99 nd=0.5LOD none422 eggs DE sel chickens kept on ground or raised 1997 350 10 35 fat 1.72 nd=0.5LOD none
on fields423 eggs DE rep chickens in wire cages 1997 290 10 29 fat 0.97 nd=0.5LOD none
89 eggs BE rep whole Belgium 1998 24 1 24 whole 0.03 nd=LOD ICES7426 eggs DE sel Lower Saxony chickens in wire cages 1998 10 10 1 fat 7.32 nd=0.5LOD none425 eggs DE sel Lower Saxony chickens kept on ground 1998 60 10 6 fat 1.28 nd=0.5LOD none424 eggs DE sel Lower Saxony chickens raised on fields 1998 80 10 8 fat 0.75 nd=0.5LOD none427 eggs DE rep Lower Saxony chickens in wire cages 1998 60 10 6 fat 1.53 nd=0.5LOD none282 eggs FR rep various in France rural 1998 5 1 5 17.5 fat 0.46 nd=LOD none292 eggs NL rep nation wide average 1999 100 50 2 12.1 fat 1.08 0.44 nd=LOD nor_PCBs323 eggs SV rep National market basket 1999 32 8 4 10.6 fat 1.03 1.45 nd=LOD All_PCBs162 eggs food group UK rep Whole of UK total diet study 1982 24 24 1 11.1 fat 8.25 2.36 nd=LOD All_PCBs178 eggs food group UK sel Scotland and Wales total diet study 1988 2 1 2 whole 0.19 nd=LOD none163 eggs food group UK rep Whole of UK total diet study 1992 24 24 1 9.6 fat 1.77 0.97 nd=LOD All_PCBs254 pastorized IT rep Imported chicken farms 1999 1 1 1 9.0 fat 3.30 nd=0.5LOD none255 yolk dried IT rep Imported chicken farms 1999 1 1 1 56.5 fat 1.00 nd=0.5LOD none253 yolk dried IT rep Imported chicken farms 1999 1 1 1 55.0 fat 3.70 nd=0.5LOD none
fats and oils324 cooking fats and oils SV rep National market basket 1999 8 4 2 69.8 fat 0.77 0.42 nd=LOD All_PCBs166 fats and oils UK rep Whole of UK total diet study 1982 24 24 1 100.0 fat 1.26 1.29 nd=LOD All_PCBs168 fats and oils UK sel Scotland and Wales total diet study 1988 2 1 2 whole 0.65 nd=LOD none167 fats and oils UK rep Whole of UK total diet study 1992 24 24 1 78.3 fat 0.26 0.35 nd=LOD All_PCBs114 fish oil NL rep various countries raw (food industry) 1990 10 1 10 100.0 fat 3.36 4.06 nd=LOD nor_PCBs115 fish oil NL rep various countries refined (food industry) 1990 7 1 7 100.0 fat 0.99 1.27 nd=LOD nor_PCBs

Annexes to Report SCOOP Task 3.2.5 (Dioxins) Page 95 of 115Final Report, 7 June, 2000
Annex 3: Occurrence data for dioxins and related PCBs (concentrations in pg/g) in different food products reported by the participating countries
No. of Samples Fat TEQ pg/g Handling PCBof nd's selection
ID Food Country rep/sel Origin Description Year #coll. /pool #anal % basis PCDD/F PCB39 margarine (based on NO sel whole of Norway retail 1989 40 10 4 81.0 whole 1.62 nd=LOD none
marine oils)130 vegetable oils NL rep various countries food industry 1990 8 1 8 100.0 fat 0.17 0.03 nd=LOD nor_PCBs
fish / fish products467 alaska pollock DE rep Alaska 1997 60 15 4 whole 0.01 nd=Zero none311 anchovy IT rep Northern Adriatic sea retail 1997 8 8 1 3.3 whole 0.47 nd=0.5LOD none319 anchovy IT rep Southern Adriatic sea retail 1997 6 6 1 1.8 whole 0.23 nd=0.5LOD none218 anchovy IT rep Central Adriatic sea retail 1997 7 7 1 3.1 whole 0.34 nd=0.5LOD none12 burbot, liver SV rep Bothnian Bay 1989 15 5 3 45.6 whole 87.89 13.70 nd=LOD nor_PCBs13 burbot, muscle SV rep Bothnian Bay 1989 15 5 3 0.7 whole 0.87 0.33 nd=LOD nor_PCBs468 carp DE rep Bavaria 1996 11 1 11 whole 1.30 nd=0.5LOD none469 carp, farmed DE rep Bavaria 1996 4 1 4 whole 0.73 nd=0.5LOD none470 carp, farmed DE rep Bavaria 1997 11 1 11 whole 0.19 nd=0.5LOD none471 catfish DE rep 1997 45 15 3 whole 0.52 nd=Zero none212 clam IT rep Central Adriatic sea fishing harbors/ retail 1997 7 7 1 1.1 whole 0.10 nd=0.5LOD none305 clam IT rep Northern Adriatic sea fishing harbors/retail 1997 10 10 1 1.0 whole 0.14 nd=0.5LOD none313 clam IT rep Southern Adriatic sea fishing harbors/ retail 1997 3 3 1 0.9 whole 0.07 nd=0.5LOD none472 coalfish DE rep Norway, North Sea 1997 105 15 7 whole 0.07 nd=Zero none473 cod DE rep retail 1987 1 1 1 fat 42.70 nd=0.5LOD none261 cod UK rep UK landed fish market 1995 30 1 30 0.5 fat 6.83 14.00 nd=LOD All_PCBs474 cod DE rep Norway, North Sea 1997 195 15 13 whole 0.05 nd=Zero none35 cod liver NO rep Nothern Norway open sea 1994 75 25 3 59.8 whole 4.80 56.87 nd=LOD All_PCBs232 cod liver baltic DK rep Baltic, Bornholm 1987 6 1 6 69.9 fat 40.93 nd=Zero none198 cod liver oil UK rep England retail (bottled) 1994 4 1 4 100.0 fat 6.52 15.40 nd=LOD All_PCBs200 cod liver oil UK rep England retail (bottled) 1996 5 1 5 100.0 fat 4.36 16.61 nd=LOD All_PCBs32 cod liver oil (processed) NO rep Norway production site 1994 15 5 3 100.0 whole 0.53 2.56 nd=LOD All_PCBs33 cod muscle NO rep Norway open sea 1989 50 25 2 0.3 whole 0.12 nd=LOD none

Annexes to Report SCOOP Task 3.2.5 (Dioxins) Page 96 of 115Final Report, 7 June, 2000
Annex 3: Occurrence data for dioxins and related PCBs (concentrations in pg/g) in different food products reported by the participating countries
No. of Samples Fat TEQ pg/g Handling PCBof nd's selection
ID Food Country rep/sel Origin Description Year #coll. /pool #anal % basis PCDD/F PCB327 cod muscle SV rep National market basket 1999 8 8 1 0.3 whole 0.13 0.23 nd=LOD All_PCBs34 cod roe NO rep Nothern Norway open sea 1994 25 25 1 2.8 whole 0.20 3.49 nd=LOD nor_PCBs511 crab hepatopancreas NO rep Southern and Western coast of background areas 1996 165 15 11 14.8 whole 10.24 7.64 nd=LOD nor_PCBs
Norway17 eel SV sel Baltic Sea 1992 5 1 5 19.9 whole 13.41 nd=LOD nor_PCBs203 eel UK rep Whole of UK commercial fisheries 1996 10 1 10 21.1 whole 1.55 8.39 nd=LOD All_PCBs475 eel DE rep Bavaria 1996 10 1 10 whole 1.30 nd=0.5LOD none476 eel DE rep Lower Saxony 1997 5 1 5 whole 1.98 nd=0.5LOD none118 fatty sea fish NL rep nation-wide mixed (DNFCS) 1990 8 4 2 16.1 fat 6.77 10.51 nd=LOD nor_PCBs489 fish DE rep representative, market share 1988 52 1 52 whole 0.70 nd=0.5LOD none87 fish BE rep whole Belgium 1995 - 1998 1995 164 1 164 whole 0.53 nd=LOD ICES7492 fish DE rep representative, market share 1997 2760 15 184 whole 0.29 nd=Zero none164 fish food groop UK rep Whole of UK total diet study 1982 24 24 1 7.8 fat 5.30 11.53 nd=LOD All_PCBs169 fish food group UK sel Scotland and Wales total diet study 1988 2 1 2 whole 0.39 nd=LOD none165 fish food group UK rep Whole of UK total diet study 1992 24 24 1 7.8 fat 2.71 5.32 nd=LOD All_PCBs201 fish oils UK rep England retail (capsules) 1996 10 1 10 100.0 fat 2.73 11.77 nd=LOD All_PCBs269 fishfingers UK sel England (one region) retail 1995 12 1 12 8.0 fat 0.63 1.61 nd=LOD All_PCBs117 freshwater fish NL rep nation-wide mixed (DNFCS) 1990 8 4 2 7.6 fat 2.39 4.50 nd=LOD nor_PCBs262 haddock UK rep UK landed fish market 1995 26 1 26 0.5 fat 5.21 6.71 nd=LOD All_PCBs477 haddock DE rep Norway 1997 30 15 2 whole 0.04 nd=Zero none478 hake DE rep Biskaya, Chile, Argentinia 1997 60 15 4 whole 0.03 nd=Zero none199 halibut liver oil UK rep England retail (capsules) 1994 4 1 4 100.0 fat 4.58 4.88 nd=LOD All_PCBs479 halibut, black DE rep Atlantic, North Sea 1997 375 15 25 whole 0.74 nd=Zero none480 halibut, white DE rep Greenland 1997 15 15 1 whole 0.18 nd=Zero none231 herring DK rep Baltic, Bornholm 1987 7 1 7 15.6 fat 58.28 nd=Zero none481 herring DE sel 1987 1 1 1 fat 33.70 nd=0.5LOD none
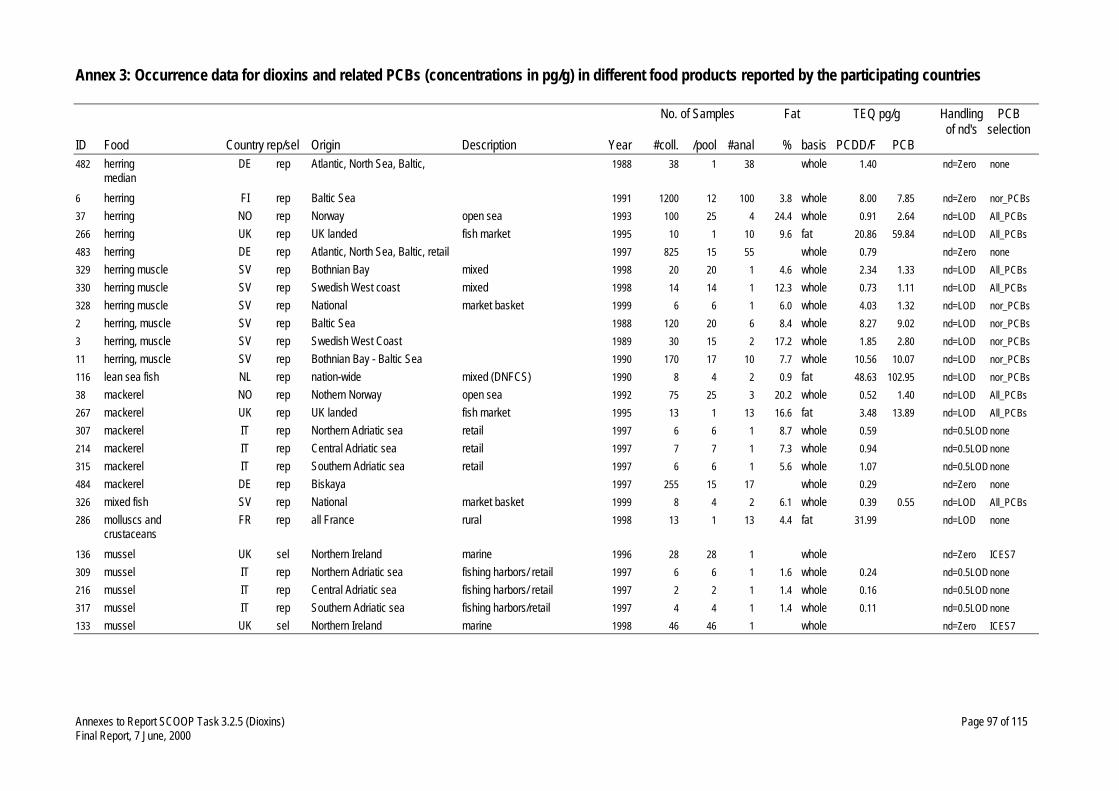
Annexes to Report SCOOP Task 3.2.5 (Dioxins) Page 97 of 115Final Report, 7 June, 2000
Annex 3: Occurrence data for dioxins and related PCBs (concentrations in pg/g) in different food products reported by the participating countries
No. of Samples Fat TEQ pg/g Handling PCBof nd's selection
ID Food Country rep/sel Origin Description Year #coll. /pool #anal % basis PCDD/F PCB482 herring DE rep Atlantic, North Sea, Baltic, 1988 38 1 38 whole 1.40 nd=Zero none
median6 herring FI rep Baltic Sea 1991 1200 12 100 3.8 whole 8.00 7.85 nd=Zero nor_PCBs37 herring NO rep Norway open sea 1993 100 25 4 24.4 whole 0.91 2.64 nd=LOD All_PCBs266 herring UK rep UK landed fish market 1995 10 1 10 9.6 fat 20.86 59.84 nd=LOD All_PCBs483 herring DE rep Atlantic, North Sea, Baltic, retail 1997 825 15 55 whole 0.79 nd=Zero none329 herring muscle SV rep Bothnian Bay mixed 1998 20 20 1 4.6 whole 2.34 1.33 nd=LOD All_PCBs330 herring muscle SV rep Swedish West coast mixed 1998 14 14 1 12.3 whole 0.73 1.11 nd=LOD All_PCBs328 herring muscle SV rep National market basket 1999 6 6 1 6.0 whole 4.03 1.32 nd=LOD nor_PCBs2 herring, muscle SV rep Baltic Sea 1988 120 20 6 8.4 whole 8.27 9.02 nd=LOD nor_PCBs3 herring, muscle SV rep Swedish West Coast 1989 30 15 2 17.2 whole 1.85 2.80 nd=LOD nor_PCBs11 herring, muscle SV rep Bothnian Bay - Baltic Sea 1990 170 17 10 7.7 whole 10.56 10.07 nd=LOD nor_PCBs116 lean sea fish NL rep nation-wide mixed (DNFCS) 1990 8 4 2 0.9 fat 48.63 102.95 nd=LOD nor_PCBs38 mackerel NO rep Nothern Norway open sea 1992 75 25 3 20.2 whole 0.52 1.40 nd=LOD All_PCBs267 mackerel UK rep UK landed fish market 1995 13 1 13 16.6 fat 3.48 13.89 nd=LOD All_PCBs307 mackerel IT rep Northern Adriatic sea retail 1997 6 6 1 8.7 whole 0.59 nd=0.5LOD none214 mackerel IT rep Central Adriatic sea retail 1997 7 7 1 7.3 whole 0.94 nd=0.5LOD none315 mackerel IT rep Southern Adriatic sea retail 1997 6 6 1 5.6 whole 1.07 nd=0.5LOD none484 mackerel DE rep Biskaya 1997 255 15 17 whole 0.29 nd=Zero none326 mixed fish SV rep National market basket 1999 8 4 2 6.1 whole 0.39 0.55 nd=LOD All_PCBs286 molluscs and FR rep all France rural 1998 13 1 13 4.4 fat 31.99 nd=LOD none
crustaceans136 mussel UK sel Northern Ireland marine 1996 28 28 1 whole nd=Zero ICES7309 mussel IT rep Northern Adriatic sea fishing harbors/ retail 1997 6 6 1 1.6 whole 0.24 nd=0.5LOD none216 mussel IT rep Central Adriatic sea fishing harbors/ retail 1997 2 2 1 1.4 whole 0.16 nd=0.5LOD none317 mussel IT rep Southern Adriatic sea fishing harbors/retail 1997 4 4 1 1.4 whole 0.11 nd=0.5LOD none133 mussel UK sel Northern Ireland marine 1998 46 46 1 whole nd=Zero ICES7

Annexes to Report SCOOP Task 3.2.5 (Dioxins) Page 98 of 115Final Report, 7 June, 2000
Annex 3: Occurrence data for dioxins and related PCBs (concentrations in pg/g) in different food products reported by the participating countries
No. of Samples Fat TEQ pg/g Handling PCBof nd's selection
ID Food Country rep/sel Origin Description Year #coll. /pool #anal % basis PCDD/F PCB316 norway lobster IT rep Southern Adriatic sea retail 1997 6 6 1 0.7 whole 0.12 nd=0.5LOD none308 norway lobster IT rep Northern Adriatic sea retail 1997 5 5 1 0.6 whole 0.14 nd=0.5LOD none215 norway lobster IT rep Central Adriatic sea retail 1997 7 7 1 0.5 whole 0.09 nd=0.5LOD none135 oyster UK sel Northern Ireland marine 1996 6 6 1 whole nd=Zero ICES7134 oyster UK sel Northern Ireland marine 1997 11 11 1 whole nd=Zero ICES7132 oyster UK sel Northern Ireland marine 1998 11 11 1 whole nd=Zero ICES7332 pike muscle SV rep National market basket 1999 8 8 1 0.4 whole 0.90 0.67 nd=LOD All_PCBs36 plaice NO rep Nothern Norway open sea 1994 25 25 1 0.6 whole 0.19 2.62 nd=LOD All_PCBs263 plaice UK rep UK landed fish market 1995 13 1 13 1.3 fat 21.20 40.30 nd=LOD All_PCBs485 plaice DE rep North Sea 1997 45 15 3 whole 0.28 nd=Zero none15 plaice, muscle SV sel Swedish West Coast 1989 45 15 3 0.8 whole 0.36 0.39 nd=LOD nor_PCBs325 rainbow trout (farmed) SV rep National mixed 1998 5 5 1 2.9 whole 0.81 1.14 nd=LOD All_PCBs265 red fish UK sel UK landed fish market 1995 2 1 2 3.5 fat 12.96 43.57 nd=LOD All_PCBs314 red mullet IT rep Southern Adriatic sea retail 1997 6 6 1 4.3 whole 0.38 nd=0.5LOD none213 red mullet IT rep Central Adriatic sea retail 1997 7 7 1 4.4 whole 0.37 nd=0.5LOD none306 red mullet IT rep Northern Adriatic sea retail 1997 5 5 1 4.9 whole 0.56 nd=0.5LOD none486 redfish DE rep retail 1987 1 1 1 fat 30.70 nd=0.5LOD none487 redfish DE rep Atlantic, North Sea 1997 225 15 15 whole 0.23 nd=Zero none20 salmon SV sel Baltic Sea mixed 1992 10 1 10 22.5 whole 19.19 nd=LOD nor_PCBs31 salmon NO rep Nothern Norway fish farms 1994 75 25 3 16.7 whole 0.95 3.99 nd=LOD All_PCBs268 salmon UK rep UK landed fish market 1995 12 1 12 13.6 fat 5.54 18.45 nd=LOD All_PCBs22 salmon SV rep Baltic Sea mixed 1996 57 19 3 6.2 whole 7.04 9.12 nd=LOD All_PCBs331 salmon (farmed) SV rep Norway market basket 1999 8 8 1 11.7 whole 1.04 1.16 nd=LOD All_PCBs488 salmon, farmed DE rep Norway, retail 1997 135 15 9 whole 0.43 nd=Zero none490 salt water fish DE rep retail 1993 42 1 42 whole 0.17 nd=0.5LOD none491 salt water fish DE rep 1997 26 1 26 whole 0.48 nd=0.5LOD none493 sardine DE rep Biskaya, retail 1997 100 20 5 whole 0.43 nd=Zero none

Annexes to Report SCOOP Task 3.2.5 (Dioxins) Page 99 of 115Final Report, 7 June, 2000
Annex 3: Occurrence data for dioxins and related PCBs (concentrations in pg/g) in different food products reported by the participating countries
No. of Samples Fat TEQ pg/g Handling PCBof nd's selection
ID Food Country rep/sel Origin Description Year #coll. /pool #anal % basis PCDD/F PCB285 sea fish FR rep all France rural 1998 56 1 56 8.8 fat 7.17 nd=LOD none217 squid IT rep Central Adriatic sea retail 1997 7 7 1 1.8 whole 0.17 nd=0.5LOD none318 squid IT rep Southern Adriatic sea retail 1997 6 6 1 1.2 whole 0.12 nd=0.5LOD none310 squid IT rep Northern Adriatic sea retail 1997 8 8 1 1.9 whole 0.25 nd=0.5LOD none494 trout DE rep mainly Black Forest 1993 61 1 61 whole 0.33 nd=0.5LOD none202 trout UK rep England and Wales fish farm 1995 40 1 40 4.8 fat 5.08 18.75 nd=LOD All_PCBs495 trout DE rep Bavaria 1996 19 1 19 whole 0.46 nd=0.5LOD none498 trout DE rep Lower Saxony 1997 9 1 9 whole 0.61 nd=0.5LOD none496 trout DE rep 1997 10 1 10 whole 0.38 nd=0.5LOD none500 trout DE rep retail 1997 5 1 5 whole 0.27 nd=Zero none5 trout (rainbow) FI rep unknown hatching station 1993 5 5 1 9.2 whole 1.79 0.53 nd=Zero nor_PCBs260 trout (rainbow) FI rep Southern Finland 1999 40 5 8 8.3 whole 0.74 1.49 nd=LOD All_PCBs497 trout, farmed DE rep Bavaria 1996 32 1 32 whole 0.44 nd=0.5LOD none499 trout, farmed DE rep Lower Saxony 1997 3 1 3 whole 0.07 nd=0.5LOD none501 tuna/bonite DE rep retail 1997 70 7 10 whole 0.01 nd=Zero none14 whitefish, muscle SV rep Bothnian Bay 1989 42 14 3 4.4 whole 7.40 4.66 nd=LOD nor_PCBs16 whitefish, muscle SV sel Baltic Sea 1992 6 2 3 2.5 whole 3.44 nd=LOD nor_PCBs264 whiting UK rep UK landed fish market 1995 14 1 14 0.5 fat 7.23 23.70 nd=LOD All_PCBs
fruit and vegetables75 cabbage FI rep Central Finland 1998 1 1 1 whole 0.01 0.00 nd=LOD All_PCBs74 carrot FI rep Central Finland 1998 1 1 1 whole 0.01 0.00 nd=LOD All_PCBs69 cucumber FI rep Central Finland 1998 1 1 1 whole 0.01 0.00 nd=LOD All_PCBs131 curly kale NL sel various regions in NL industrial and rural 1991 14 1 14 whole 0.88 nd=LOD none161 fresh fruit food group UK sel Scotland and Wales total diet study 1988 2 1 2 whole 0.05 nd=LOD none502 fruit and vegetables DE rep 1993 57 1 57 whole 0.01 nd=0.5LOD none503 fruit and vegetables DE rep 1997 30 1 30 whole 0.01 nd=0.5LOD none281 fruits orange,apple,raisin FR rep various regions in France rural 1999 5 1 5 0.3 whole 0.03 nd=LOD none

Annexes to Report SCOOP Task 3.2.5 (Dioxins) Page 100 of 115Final Report, 7 June, 2000
Annex 3: Occurrence data for dioxins and related PCBs (concentrations in pg/g) in different food products reported by the participating countries
No. of Samples Fat TEQ pg/g Handling PCBof nd's selection
ID Food Country rep/sel Origin Description Year #coll. /pool #anal % basis PCDD/F PCB158 green vegetable food UK sel Scotland and Wales total diet study 1988 2 1 2 whole 0.02 nd=LOD none
group504 kale DE sel Lower Saxony 1998 9 1 9 whole 0.06 nd=0.5LOD none68 lettuce FI rep Southern Finland head lettuce 1998 1 1 1 whole 0.05 0.12 nd=LOD All_PCBs67 lettuce FI rep Southern Finland ice lettuce 1998 1 1 1 whole 0.01 0.03 nd=LOD All_PCBs66 lettuce FI rep Central Finland pot lettuce 1998 1 1 1 whole 0.02 0.00 nd=LOD All_PCBs73 onion FI rep Central Finland 1998 1 1 1 whole 0.01 0.00 nd=LOD All_PCBs65 orange juice FI rep import unknown 1998 1 1 1 whole 0.00 0.00 nd=LOD All_PCBs159 other vegetables food UK sel Scotland and Wales total diet study 1988 2 1 2 whole 0.09 nd=LOD none
group76 paprika FI rep Central Finland 1998 1 1 1 whole 0.01 0.00 nd=LOD All_PCBs71 potato FI rep Central Finland old potato 1998 1 1 1 whole 0.01 0.00 nd=LOD All_PCBs70 potato FI rep Central Finland new potato 1998 1 1 1 whole 0.01 0.00 nd=LOD All_PCBs160 potato food group UK sel Scotland and Wales total diet study 1988 2 1 2 whole 0.04 nd=LOD none64 strawberry FI rep Central Finland rural 1998 1 1 1 whole 0.01 0.00 nd=LOD All_PCBs72 tomato FI rep Central Finland 1998 1 1 1 whole 0.01 0.00 nd=LOD All_PCBs280 vegetables FR rep various regions in France rural 1998 34 1 34 0.7 whole 0.09 nd=LOD none
human milk344 human milk DE rep whole country 1986 - 1990 1986 728 1 728 fat 30.72 nd=0.5LOD none508 human milk DK rep Whole of Denmark 1986 8 1 8 4.2 fat 18.10 nd=LOD none205 human milk FI rep Finland primi- and multiparae 1987 167 1 167 3.4 fat 20.00 25.30 nd=LOD All_PCBs301 human milk IT rep Milan town 1987 14 14 1 2.3 fat 18.00 nd=0.5LOD nor_PCBs302 human milk IT rep Florence town + rural 1987 27 27 1 3.3 fat 29.00 nd=0.5LOD nor_PCBs303 human milk IT rep Rome town 1987 9 9 1 3.5 fat 22.00 nd=0.5LOD nor_PCBs304 human milk IT rep Pavia rural villages 1987 9 9 1 3.7 fat 31.00 16.00 nd=0.5LOD nor_PCBs138 human milk UK sel England and Scotland primiparae 1987 80 40 2 3.1 fat 33.00 nd=LOD none119 human milk NL rep whole country primi- and multiparae 1988 120 12 10 3.0 fat 34.20 d=Zero none
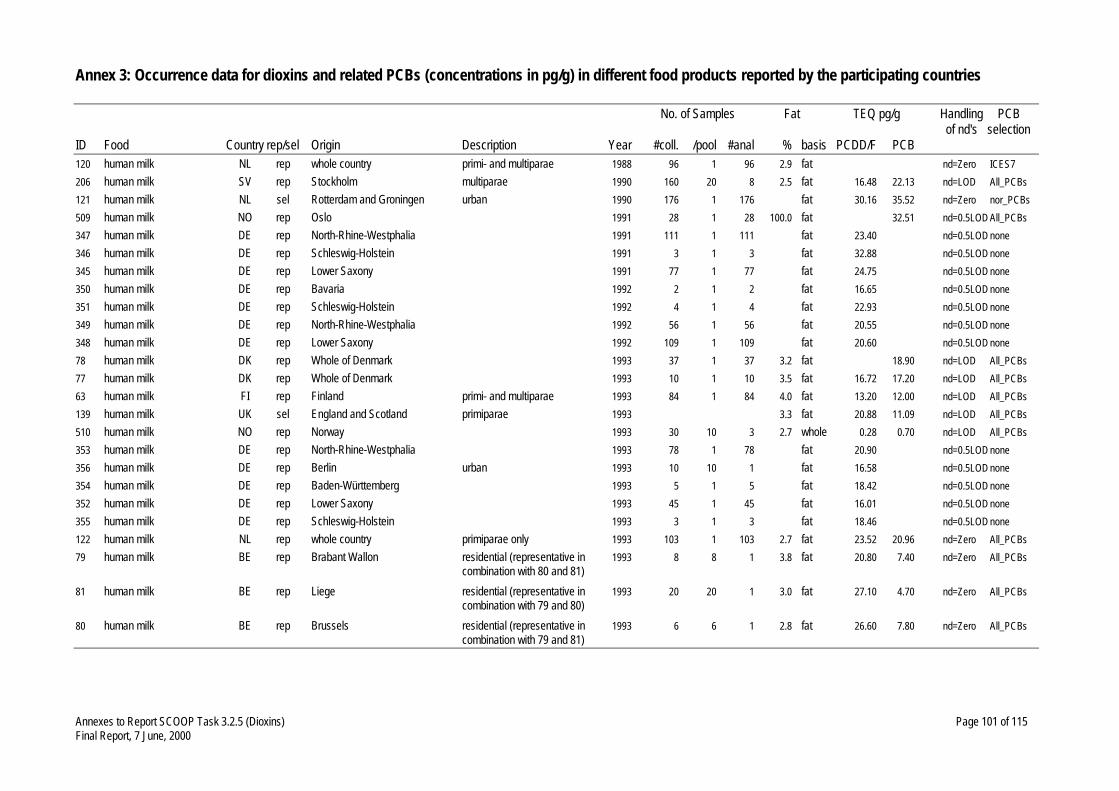
Annexes to Report SCOOP Task 3.2.5 (Dioxins) Page 101 of 115Final Report, 7 June, 2000
Annex 3: Occurrence data for dioxins and related PCBs (concentrations in pg/g) in different food products reported by the participating countries
No. of Samples Fat TEQ pg/g Handling PCBof nd's selection
ID Food Country rep/sel Origin Description Year #coll. /pool #anal % basis PCDD/F PCB120 human milk NL rep whole country primi- and multiparae 1988 96 1 96 2.9 fat nd=Zero ICES7206 human milk SV rep Stockholm multiparae 1990 160 20 8 2.5 fat 16.48 22.13 nd=LOD All_PCBs121 human milk NL sel Rotterdam and Groningen urban 1990 176 1 176 fat 30.16 35.52 nd=Zero nor_PCBs509 human milk NO rep Oslo 1991 28 1 28 100.0 fat 32.51 nd=0.5LOD All_PCBs347 human milk DE rep North-Rhine-Westphalia 1991 111 1 111 fat 23.40 nd=0.5LOD none346 human milk DE rep Schleswig-Holstein 1991 3 1 3 fat 32.88 nd=0.5LOD none345 human milk DE rep Lower Saxony 1991 77 1 77 fat 24.75 nd=0.5LOD none350 human milk DE rep Bavaria 1992 2 1 2 fat 16.65 nd=0.5LOD none351 human milk DE rep Schleswig-Holstein 1992 4 1 4 fat 22.93 nd=0.5LOD none349 human milk DE rep North-Rhine-Westphalia 1992 56 1 56 fat 20.55 nd=0.5LOD none348 human milk DE rep Lower Saxony 1992 109 1 109 fat 20.60 nd=0.5LOD none78 human milk DK rep Whole of Denmark 1993 37 1 37 3.2 fat 18.90 nd=LOD All_PCBs77 human milk DK rep Whole of Denmark 1993 10 1 10 3.5 fat 16.72 17.20 nd=LOD All_PCBs63 human milk FI rep Finland primi- and multiparae 1993 84 1 84 4.0 fat 13.20 12.00 nd=LOD All_PCBs139 human milk UK sel England and Scotland primiparae 1993 3.3 fat 20.88 11.09 nd=LOD All_PCBs510 human milk NO rep Norway 1993 30 10 3 2.7 whole 0.28 0.70 nd=LOD All_PCBs353 human milk DE rep North-Rhine-Westphalia 1993 78 1 78 fat 20.90 nd=0.5LOD none356 human milk DE rep Berlin urban 1993 10 10 1 fat 16.58 nd=0.5LOD none354 human milk DE rep Baden-Württemberg 1993 5 1 5 fat 18.42 nd=0.5LOD none352 human milk DE rep Lower Saxony 1993 45 1 45 fat 16.01 nd=0.5LOD none355 human milk DE rep Schleswig-Holstein 1993 3 1 3 fat 18.46 nd=0.5LOD none122 human milk NL rep whole country primiparae only 1993 103 1 103 2.7 fat 23.52 20.96 nd=Zero All_PCBs79 human milk BE rep Brabant Wallon residential (representative in 1993 8 8 1 3.8 fat 20.80 7.40 nd=Zero All_PCBs
combination with 80 and 81)81 human milk BE rep Liege residential (representative in 1993 20 20 1 3.0 fat 27.10 4.70 nd=Zero All_PCBs
combination with 79 and 80)80 human milk BE rep Brussels residential (representative in 1993 6 6 1 2.8 fat 26.60 7.80 nd=Zero All_PCBs
combination with 79 and 81)

Annexes to Report SCOOP Task 3.2.5 (Dioxins) Page 102 of 115Final Report, 7 June, 2000
Annex 3: Occurrence data for dioxins and related PCBs (concentrations in pg/g) in different food products reported by the participating countries
No. of Samples Fat TEQ pg/g Handling PCBof nd's selection
ID Food Country rep/sel Origin Description Year #coll. /pool #anal % basis PCDD/F PCB357 human milk DE rep Baden-Württemberg 1994 6 1 6 fat 23.89 nd=0.5LOD none359 human milk DE rep North-Rhine-Westphalia 1994 50 1 50 fat 17.20 nd=0.5LOD none358 human milk DE rep Lower Saxony 1994 34 1 34 fat 16.78 nd=0.5LOD none18 human milk SV rep Uppsala/Sundsvall primiparae 1994 10 1 10 2.5 fat 10.18 16.71 nd=LOD All_PCBs362 human milk DE rep North-Rhine-Westphalia 1995 38 1 38 fat 16.10 nd=0.5LOD none361 human milk DE rep Lower Saxony 1995 83 1 83 fat 18.74 nd=0.5LOD none360 human milk DE rep Baden-Württemberg 1995 14 1 14 fat 17.53 nd=0.5LOD none364 human milk DE rep Lower Saxony 1996 18 1 18 fat 16.64 nd=0.5LOD none363 human milk DE rep Baden-Württemberg 1996 41 5 9 fat 12.76 nd=0.5LOD none365 human milk DE rep North-Rhine-Westphalia 1996 22 1 22 fat 14.07 nd=0.5LOD none19 human milk SV rep Uppsala primiparae 1997 63 1 63 3.3 fat 7.90 9.90 nd=LOD nor_PCBs366 human milk DE rep Baden-Württemberg 1997 82 7 11 fat 11.02 nd=0.5LOD none371 human milk DE rep Bavaria 1997 1 1 1 fat 14.99 nd=0.5LOD none369 human milk DE rep Bavaria primimarae 1997 9 9 1 4.6 fat 14.16 nd=0.5LOD none368 human milk DE rep North-Rhine-Westphalia 1997 11 1 11 fat 11.90 nd=0.5LOD none367 human milk DE rep Lower Saxony 1997 15 1 15 fat 12.74 nd=0.5LOD none370 human milk DE rep Bavaria multiparae 1997 8 8 1 3.4 fat 10.98 nd=0.5LOD none373 human milk DE rep Lower Saxony 1998 25 1 25 fat 12.32 nd=0.5LOD none375 human milk DE rep Bavaria primiparae 1998 6 6 1 3.9 fat 10.50 nd=0.5LOD none374 human milk DE rep North-Rhine-Westphalia 1998 15 1 15 fat 13.83 nd=0.5LOD none372 human milk DE rep Baden-Württemberg 1998 23 4 6 fat 13.52 nd=0.5LOD none505 human milk FR rep France 1998 244 1 244 3.0 fat 16.47 nd=LOD none
meat / meat products137 UK selNorthern Ireland rural 1993 650 650 1 fat nd=Zero ICES786 BE repwhole Belgium 1995 - 1998 1995 732 1 732 fat 0.60 nd=LOD ICES7428 beef DE sel 1987 1 1 1 fat 2.59 nd=0.5LOD none429 beef DE sel 1989 3 1 3 fat 3.50 nd=0.5LOD none

Annexes to Report SCOOP Task 3.2.5 (Dioxins) Page 103 of 115Final Report, 7 June, 2000
Annex 3: Occurrence data for dioxins and related PCBs (concentrations in pg/g) in different food products reported by the participating countries
No. of Samples Fat TEQ pg/g Handling PCBof nd's selection
ID Food Country rep/sel Origin Description Year #coll. /pool #anal % basis PCDD/F PCB23 beef SV sel national rural (cow fat) 1989 2 1 2 83.2 fat 1.29 1.16 nd=LOD nor_PCBs60 beef FI rep from four biggest bovine beef 1991 20 5 4 fat 0.02 nd=Zero none
slaughterhouses430 beef DE rep 1993 14 1 14 fat 0.71 nd=0.5LOD none431 beef DE rep Bavaria 1995 15 1 15 fat 0.50 nd=0.5LOD none432 beef DE rep nation-wide 1996 32 1 32 fat 0.46 nd=Zero none433 beef DE rep 1997 21 1 21 fat 0.76 nd=0.5LOD none434 beef DE rep Bavaria 1997 9 1 9 fat 0.72 nd=0.5LOD none336 beef SV rep National mixed (cow fat) 1998 20 10 2 85.0 fat 0.98 1.08 nd=LOD All_PCBs289 beef NL rep nation wide mixed (DNFCS) 1999 10 5 2 13.1 fat 0.72 0.97 nd=LOD nor_PCBs96 beef, fat NL rep nation-wide average 1990 80 40 2 100.0 fat 1.77 2.40 nd=LOD nor_PCBs234 beef, ground meat DK rep Copenhagen 1987 4 1 4 19.7 fat 2.39 nd=Zero none233 beef, kidney fat DK rep Copenhagen 1987 3 1 3 85.2 fat 2.82 nd=Zero none141 carcase meat food group UK rep Whole of UK total diet study 1982 24 24 1 17.4 fat 2.79 1.93 nd=LOD All_PCBs154 carcase meat food group UK sel Scotland and Wales 1988 2 1 2 whole 0.70 nd=LOD none142 carcase meat food group UK rep Whole of UK total diet study 1992 24 24 1 13.7 fat 0.94 0.87 nd=LOD All_PCBs45 cattle fat NO rep Norway rural 1991 30 10 3 100.0 fat 0.33 1.35 nd=LOD All_PCBs448 chicken DE sel 1987 1 1 1 fat 2.25 nd=0.5LOD none449 chicken DE sel 1989 2 1 2 fat 2.30 nd=0.5LOD none455 chicken DE rep Bavaria 1998 15 1 15 fat 0.38 nd=0.5LOD none242 chicken IT rep Imported chicken farm 1999 1 1 1 10.2 fat 0.93 nd=0.5LOD none241 chicken IT rep Imported chicken farm 1999 1 1 1 7.6 fat 1.40 nd=0.5LOD none240 chicken IT rep Imported chicken farm 1999 1 1 1 11.0 fat 0.44 nd=0.5LOD none290 chicken NL rep nation wide mixed (DNFCS) 1999 10 5 2 6.2 fat 0.89 0.59 nd=LOD nor_PCBs97 chicken, fat NL rep nation-wide average 1990 80 40 2 100.0 fat 1.63 1.60 nd=LOD nor_PCBs91 chicken, liver NL rep nation-wide average 1990 80 40 2 5.5 fat 3.30 2.10 nd=LOD nor_PCBs90 cow, liver NL rep nation-wide average 1990 80 40 2 6.1 fat 5.70 3.70 nd=LOD nor_PCBs
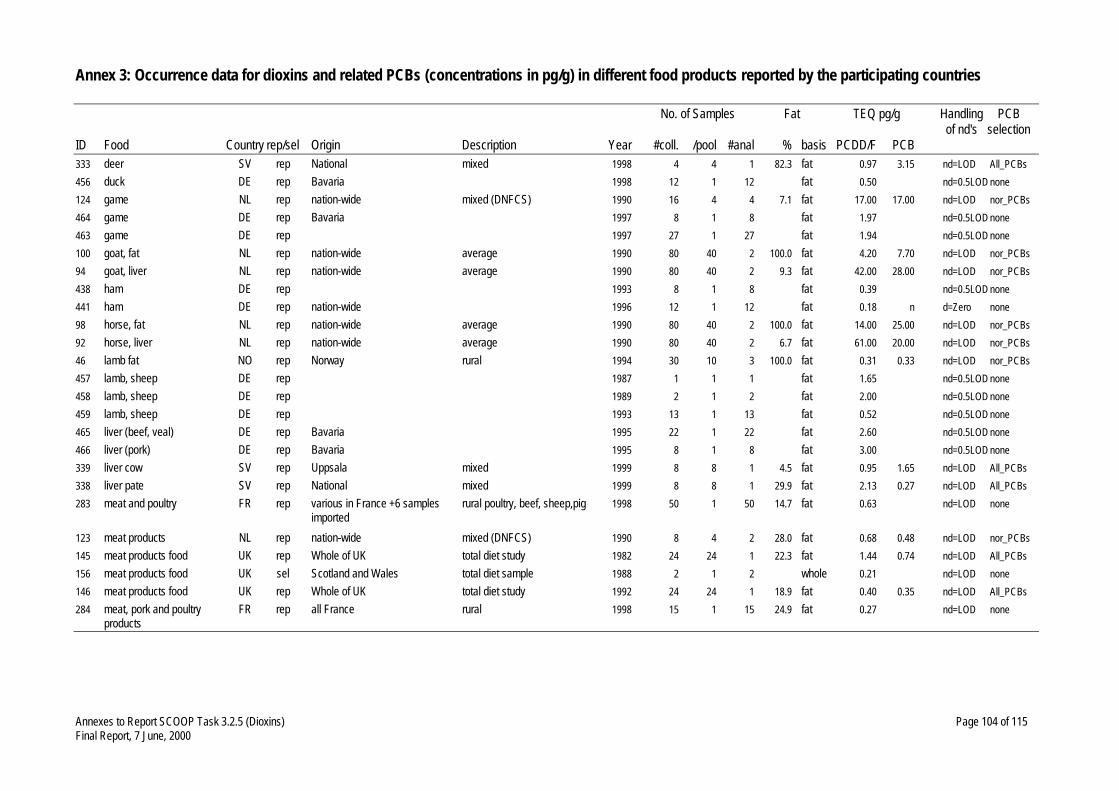
Annexes to Report SCOOP Task 3.2.5 (Dioxins) Page 104 of 115Final Report, 7 June, 2000
Annex 3: Occurrence data for dioxins and related PCBs (concentrations in pg/g) in different food products reported by the participating countries
No. of Samples Fat TEQ pg/g Handling PCBof nd's selection
ID Food Country rep/sel Origin Description Year #coll. /pool #anal % basis PCDD/F PCB333 deer SV rep National mixed 1998 4 4 1 82.3 fat 0.97 3.15 nd=LOD All_PCBs456 duck DE rep Bavaria 1998 12 1 12 fat 0.50 nd=0.5LOD none124 game NL rep nation-wide mixed (DNFCS) 1990 16 4 4 7.1 fat 17.00 17.00 nd=LOD nor_PCBs464 game DE rep Bavaria 1997 8 1 8 fat 1.97 nd=0.5LOD none463 game DE rep 1997 27 1 27 fat 1.94 nd=0.5LOD none100 goat, fat NL rep nation-wide average 1990 80 40 2 100.0 fat 4.20 7.70 nd=LOD nor_PCBs94 goat, liver NL rep nation-wide average 1990 80 40 2 9.3 fat 42.00 28.00 nd=LOD nor_PCBs438 ham DE rep 1993 8 1 8 fat 0.39 nd=0.5LOD none441 ham DE rep nation-wide 1996 12 1 12 fat 0.18 n d=Zero none98 horse, fat NL rep nation-wide average 1990 80 40 2 100.0 fat 14.00 25.00 nd=LOD nor_PCBs92 horse, liver NL rep nation-wide average 1990 80 40 2 6.7 fat 61.00 20.00 nd=LOD nor_PCBs46 lamb fat NO rep Norway rural 1994 30 10 3 100.0 fat 0.31 0.33 nd=LOD nor_PCBs457 lamb, sheep DE rep 1987 1 1 1 fat 1.65 nd=0.5LOD none458 lamb, sheep DE rep 1989 2 1 2 fat 2.00 nd=0.5LOD none459 lamb, sheep DE rep 1993 13 1 13 fat 0.52 nd=0.5LOD none465 liver (beef, veal) DE rep Bavaria 1995 22 1 22 fat 2.60 nd=0.5LOD none466 liver (pork) DE rep Bavaria 1995 8 1 8 fat 3.00 nd=0.5LOD none339 liver cow SV rep Uppsala mixed 1999 8 8 1 4.5 fat 0.95 1.65 nd=LOD All_PCBs338 liver pate SV rep National mixed 1999 8 8 1 29.9 fat 2.13 0.27 nd=LOD All_PCBs283 meat and poultry FR rep various in France +6 samples rural poultry, beef, sheep,pig 1998 50 1 50 14.7 fat 0.63 nd=LOD none
imported123 meat products NL rep nation-wide mixed (DNFCS) 1990 8 4 2 28.0 fat 0.68 0.48 nd=LOD nor_PCBs145 meat products food UK rep Whole of UK total diet study 1982 24 24 1 22.3 fat 1.44 0.74 nd=LOD All_PCBs156 meat products food UK sel Scotland and Wales total diet sample 1988 2 1 2 whole 0.21 nd=LOD none146 meat products food UK rep Whole of UK total diet study 1992 24 24 1 18.9 fat 0.40 0.35 nd=LOD All_PCBs284 meat, pork and poultry FR rep all France rural 1998 15 1 15 24.9 fat 0.27 nd=LOD none
products

Annexes to Report SCOOP Task 3.2.5 (Dioxins) Page 105 of 115Final Report, 7 June, 2000
Annex 3: Occurrence data for dioxins and related PCBs (concentrations in pg/g) in different food products reported by the participating countries
No. of Samples Fat TEQ pg/g Handling PCBof nd's selection
ID Food Country rep/sel Origin Description Year #coll. /pool #anal % basis PCDD/F PCB337 mixed meat SV rep National mixed 1999 8 4 2 13.0 fat 0.76 0.43 nd=LOD All_PCBs99 mutton, fat NL rep nation-wide average 1990 80 40 2 100.0 fat 1.80 2.00 nd=LOD nor_PCBs288 offals (bovine liver) FR rep all France rural 1998 6 1 6 13.6 fat 3.29 nd=LOD none143 offals food group UK rep Whole of UK total diet study 1982 24 24 1 8.2 fat 19.17 3.33 nd=LOD All_PCBs155 offals food group UK sel Scotland and Wales total diet study 1988 2 1 2 whole 0.46 nd=LOD none144 offals food group UK rep Whole of UK total diet study 1992 24 24 1 6.1 fat 9.75 2.90 nd=LOD All_PCBs24 pig fat SV sel national 1989 2 1 2 82.5 fat 1.38 1.18 nd=LOD nor_PCBs335 pig fat SV rep National mixed 1998 17 17 1 83.7 fat 0.98 0.81 nd=LOD All_PCBs95 pig, liver NL rep nation-wide average 1990 80 40 2 5.2 fat 15.40 2.00 nd=LOD nor_PCBs435 pork DE rep 1987 1 1 1 fat 0.28 nd=0.5LOD none436 pork DE rep 1989 3 1 3 fat 0.50 nd=0.5LOD none101 pork NL rep nation-wide average 1990 80 40 2 100.0 fat 0.43 0.16 nd=LOD nor_PCBs61 pork FI rep from four biggest 1991 20 5 4 fat 0.29 nd=Zero none
slaugtherhouses437 pork DE rep 1993 33 1 33 fat 0.31 nd=0.5LOD none439 pork DE rep Bavaria 1995 10 1 10 fat 0.40 nd=0.5LOD none440 pork DE rep nation-wide 1996 46 1 46 fat 0.17 nd=Zero none442 pork DE rep 1997 28 1 28 fat 0.37 nd=0.5LOD none443 pork DE rep Bavaria 1997 8 1 8 fat 0.13 nd=0.5LOD none444 pork DE rep Bavaria 1998 13 1 13 fat 0.25 nd=0.5LOD none237 pork IT rep Imported not specified 1999 1 1 1 56.3 fat 0.40 nd=0.5LOD none291 pork NL rep nation wide mixed (DNFCS) 1999 10 5 2 23.2 fat 0.23 0.09 nd=LOD nor_PCBs247 pork ground meat IT rep Imported wholesale 1999 1 1 1 9.4 fat 0.70 nd=0.5LOD none248 pork meat IT rep Imported wholesale 1999 1 1 1 9.7 fat 0.40 nd=0.5LOD none251 pork prosciutto IT rep Imported wholesale 1999 1 1 1 20.8 fat 3.60 nd=0.5LOD none250 pork salami (loin) IT rep Imported wholesale 1999 1 1 1 13.9 fat 1.20 nd=0.5LOD none249 pork salami (loin) IT rep Imported wholesale 1999 1 1 1 14.3 fat 0.20 nd=0.5LOD none

Annexes to Report SCOOP Task 3.2.5 (Dioxins) Page 106 of 115Final Report, 7 June, 2000
Annex 3: Occurrence data for dioxins and related PCBs (concentrations in pg/g) in different food products reported by the participating countries
No. of Samples Fat TEQ pg/g Handling PCBof nd's selection
ID Food Country rep/sel Origin Description Year #coll. /pool #anal % basis PCDD/F PCB239 pork, salami IT rep Imported wholesale 1999 1 1 1 29.0 fat 0.43 nd=0.5LOD none245 pork,ham IT rep Imported wholesale 1999 1 1 1 2.5 fat 3.80 nd=0.5LOD none244 pork,ham IT rep Imported wholesale 1999 1 1 1 11.0 fat 2.30 nd=0.5LOD none243 pork,ham IT rep Imported wholesale 1999 1 1 1 35.0 fat 0.80 nd=0.5LOD none246 pork,meat IT rep Imported wholesale 1999 1 1 1 6.2 fat 1.50 nd=0.5LOD none450 poultry DE rep 1993 19 1 19 fat 0.62 nd=0.5LOD none451 poultry DE rep nation-wide 1996 17 1 17 fat 0.37 nd=Zero none452 poultry DE rep 1997 5 1 5 fat 1.08 nd=0.5LOD none453 poultry DE rep Bavaria 1997 8 1 8 fat 0.37 nd=0.5LOD none26 poultry (fat) SV sel national 1989 2 1 2 74.4 fat 1.30 1.55 nd=LOD nor_PCBs340 poultry fat SV rep National mixed 1998 9 9 1 73.0 fat 0.77 0.70 nd=LOD All_PCBs147 poultry food group UK rep Whole of UK total diet study 1982 24 24 1 9.2 fat 5.40 2.42 nd=LOD All_PCBs157 poultry food group UK sel Scotland and Wales total diet study 1988 2 1 2 whole 0.33 nd=LOD none148 poultry food group UK rep Whole of UK total diet study 1992 24 24 1 7.5 fat 1.68 0.93 nd=LOD All_PCBs446 salami DE rep nation-wide 1996 20 1 20 fat 0.16 nd=Zero none447 sausage, boiled DE rep nation-wide 1996 12 1 12 fat 0.40 nd=Zero none445 sausage, Frankfurter DE rep nation-wide 1996 40 1 40 fat 0.17 nd=Zero none334 sheep SV rep National mixed 1998 10 10 1 86.1 fat 1.01 0.86 nd=LOD All_PCBs25 sheep (fat) SV sel national 1989 2 1 2 73.2 fat 1.26 1.12 nd=LOD nor_PCBs93 sheep, liver NL rep nation-wide average 1990 80 40 2 7.3 fat 30.00 15.00 nd=LOD nor_PCBs43 swine fat NO rep Norway rural 1991 30 10 3 100.0 fat 0.20 0.71 nd=LOD nor_PCBs44 swine liver NO rep Norway rural 1994 30 10 3 4.9 whole 0.25 0.27 nd=LOD mor_PCBs454 turkey DE rep Bavaria 1998 6 1 6 fat 0.56 nd=0.5LOD none460 veal DE rep 1993 11 1 11 fat 0.95 nd=0.5LOD none461 veal DE rep 1997 9 1 9 fat 0.93 nd=0.5LOD none252 veal fat IT rep Imported retail 1999 1 1 1 74.0 fat 0.38 nd=0.5LOD none236 veal fat IT rep Imported retail 1999 1 1 1 100.0 fat 1.10 nd=0.5LOD none

Annexes to Report SCOOP Task 3.2.5 (Dioxins) Page 107 of 115Final Report, 7 June, 2000
Annex 3: Occurrence data for dioxins and related PCBs (concentrations in pg/g) in different food products reported by the participating countries
No. of Samples Fat TEQ pg/g Handling PCBof nd's selection
ID Food Country rep/sel Origin Description Year #coll. /pool #anal % basis PCDD/F PCB235 veal fat IT rep Imported retail 1999 1 1 1 100.0 fat 0.61 nd=0.5LOD none238 veal/liver IT rep Imported retail 1999 1 1 1 2.8 fat 2.30 nd=0.5LOD none462 venison DE rep 1993 6 1 6 fat 1.41 nd=0.5LOD none
milk / milk products228 butter DK rep Copenhagen 1987 3 1 3 79.2 fat 0.47 nd=Zero none377 butter DE rep Germany 1987 1 1 1 fat 0.81 nd=0.5LOD none379 butter DE rep 1989 10 1 10 fat 1.90 nd=0.5LOD none127 butter NL rep nation-wide mixed (DNFCS) 1990 8 4 2 84.7 fat 1.79 2.11 nd=LOD nor_PCBs41 butter NO rep Norway retail 1991 30 10 3 81.5 whole 0.26 1.04 nd=LOD All_PCBs275 butter UK sel Norwich retail 1991 1 1 1 whole 1.22 nd=LOD none272 butter UK sel Derbyshire Retail and dairies near industrial 1991 1 1 1 whole 0.94 nd=LOD none383 butter DE rep 1993 27 1 27 fat 0.83 nd=0.5LOD none387 butter DE rep Netherlands 1993 11 1 11 fat 0.97 nd=0.5LOD none388 butter DE rep Germany 1993 196 1 196 fat 0.63 nd=0.5LOD none386 butter DE rep Ireland 1993 13 1 13 fat 0.51 nd=0.5LOD none384 butter DE rep 1994 37 1 37 fat 0.68 nd=0.5LOD none390 butter DE rep nation-wide 1995 184 1 184 fat 0.64 nd=Zero none393 butter DE rep Netherlands 1995 13 1 13 fat 0.74 nd=Zero none392 butter DE rep Ireland 1995 17 1 17 fat 0.40 nd=Zero none391 butter DE rep Denmark 1995 6 1 6 fat 0.52 nd=Zero none389 butter DE rep 1995 92 1 92 fat 0.64 nd=0.5LOD none395 butter DE rep 1996 66 1 66 fat 0.55 nd=0.5LOD none400 butter DE rep 1997 55 1 55 fat 0.56 nd=0.5LOD none259 butter IT rep Italy retail 1999 1 1 1 16.0 fat 1.50 nd=0.5LOD none258 butter IT rep Italy retail 1999 1 1 1 28.5 fat 0.90 nd=0.5LOD none296 butter NL rep nation wide average 1999 10 5 2 91.8 fat 0.62 0.78 nd=LOD nor_PCBs341 butter SV rep national market basket 1999 8 8 1 85.0 fat 0.71 0.38 nd=LOD All_PCBs

Annexes to Report SCOOP Task 3.2.5 (Dioxins) Page 108 of 115Final Report, 7 June, 2000
Annex 3: Occurrence data for dioxins and related PCBs (concentrations in pg/g) in different food products reported by the participating countries
No. of Samples Fat TEQ pg/g Handling PCBof nd's selection
ID Food Country rep/sel Origin Description Year #coll. /pool #anal % basis PCDD/F PCB230 cheese DK rep Copenhagen 1987 3 1 3 21.3 fat 2.16 nd=Zero none380 cheese DE rep 1989 5 1 5 fat 1.20 nd=0.5LOD none128 cheese NL rep nation-wide average 1990 8 4 2 27.2 fat 1.41 1.63 nd=LOD nor_PCBs276 cheese UK sel Norwich retail 1991 2 1 2 whole 0.14 nd=LOD none402 cheese DE sel 1997 1 1 1 fat 0.70 nd=0.5LOD none256 cheese IT rep Italy retail 1999 1 1 1 30.0 fat 0.30 d=0.5LOD none257 cheese IT rep Italy retail 1999 1 1 1 30.0 fat 0.60 nd=0.5LOD none297 cheese NL rep nation wide composites mixed (DNFCS) 1999 10 5 2 32.2 fat 0.57 0.71 nd=LOD nor_PCBs376 consumer milk DE rep whole of Germany rural areas 1986 8 1 8 fat 1.79 nd=0.5LOD none175 consumer milk UK rep England (9 locations) retail 1990 150 10 15 whole 0.07 nd=LOD none125 consumer milk NL rep nation-wide average 1991 8 4 2 3.5 fat 1.54 1.32 nd=LOD nor_PCBs382 consumer milk DE rep Bavaria 1992 27 1 27 fat 0.87 nd=0.5LOD none126 consumer milk NL rep whole country supermarkets 1992 132 12 11 3.2 fat 1.50 1.44 nd=LOD nor_PCBs176 consumer milk UK rep England (12 locations) retail 1995 108 9 12 3.5 fat 1.01 1.80 nd=LOD All_PCBs394 consumer milk DE rep Bavaria 1995 62 1 62 fat 0.55 nd=0.5LOD none396 consumer milk DE rep Bavaria 1996 39 1 39 fat 0.51 nd=0.5LOD none293 consumer milk NL rep nation-wide largest factories 1997 55 5 11 fat 1.97 nd=LOD none399 consumer milk DE sel retail, tanker lorries, indiv. farms, 1997 36 1 36 fat 0.89 nd=0.5LOD none
partly elevated levels due to citruspulp
398 consumer milk DE rep retail, tanker lorries, indiv. farms 1997 76 1 76 fat 0.62 nd=0.5LOD none294 consumer milk NL rep nation-wide largest factories 1998 180 4 45 fat 1.01 nd=LOD none287 consumer milk FR rep all France (rural) semi-skimmed 1998 149 1 149 1.8 fat 0.66 nd=LOD none408 consumer milk DE rep Bavaria 1998 15 1 15 fat 0.46 nd=0.5LOD none300 consumer milk IT rep imported 1999 1 1 1 3.5 fat 1.00 nd=0.5LOD none299 consumer milk IT rep imported 1999 1 1 1 3.5 fat 0.60 nd=0.5LOD none295 consumer milk NL rep nation-wide supermarkets 1999 48 4 12 fat 0.51 nd=LOD none

Annexes to Report SCOOP Task 3.2.5 (Dioxins) Page 109 of 115Final Report, 7 June, 2000
Annex 3: Occurrence data for dioxins and related PCBs (concentrations in pg/g) in different food products reported by the participating countries
No. of Samples Fat TEQ pg/g Handling PCBof nd's selection
ID Food Country rep/sel Origin Description Year #coll. /pool #anal % basis PCDD/F PCB381 consumer milk, butter, DE rep North-Rhine-Westphalia dairy 1990 168 1 168 fat 1.35 nd=0.5LOD none
cheese, cream385 consumer milk, butter, DE rep North-Rhine-Westphalia dairy 1994 120 1 120 fat 1.02 nd=0.5LOD none
cheese, cream411 consumer milk, butter, DE rep North-Rhine-Westphalia dairy 1998 54 1 54 fat 0.67 nd=0.5LOD none
cheese, cream410 consumer milk, butter, DE sel North-Rhine-Westphalia dairy, Farms, partly elevated 1998 111 1 111 fat 0.78 nd=0.5LOD none
cheese, cream levels due to citrus pulp194 cow's milk UK rep Northern Ireland individual farms 20 1 20 3.8 fat 1.21 nd=LOD none227 cow's milk DK rep Copenhagen consumer milk 1987 7 1 7 2.7 fat 2.58 nd=Zero none27 cow's milk SV rep national 1988 10 1 10 2.8 fat 2.02 nd=LOD none196 cow's milk UK sel urban/ industrial areas individual farms 1989 9 1 9 4.0 fat 4.99 nd=LOD none195 cow's milk UK sel England (rural areas) individual farms 1989 8 1 8 3.8 fat 1.27 nd=LOD none378 cow's milk DE rep North-Rhine-Westphalia individual farms 1989 10 1 10 fat 3.90 nd=0.5LOD none106 cow's milk NL sel near waste incineration industrial 1989 91 1 91 fat 4.79 nd=Zero none112 cow's milk NL sel near metal reclamation plant industrial 1990 20 1 20 fat 5.03 nd=Zero none
113 cow's milk NL sel Bommelerwaard former mushroom cultivation site 1990 40 5 8 fat 1.97 nd=Zero none107 cow's milk NL sel near waste incineration industrial 1990 555 5 111 fat 5.21 nd=Zero none28 cow's milk SV rep national 1990 5 1 5 3.0 fat 0.92 nd=LOD none197 cow's milk UK sel Hampshire urban/industrial area individual 1990 9 1 9 whole 0.15 nd=LOD none10 cow's milk UK sel Derbyshire ind. farms near industrial site 1990 11 1 11 4.1 whole 0.48 nd=LOD none204 cow's milk FI rep from 12 largest dairies 1991 20 5 4 3.4 fat 0.99 nd=Zero none186 cow's milk UK sel Derbyshire indiv. farms near industrial site 1991 40 1 40 4.1 whole 0.27 nd=LOD none271 cow's milk UK sel Derbyshire retail (semi-skimmed) 1991 3 1 3 whole 0.05 nd=LOD none270 cow's milk UK sel Derbyshire Retail and from dairies near 1991 8 1 8 whole 0.10 nd=LOD none
industrial site (full fat)179 cow's milk UK sel Derbyshire individual animals in suckler herd, 1991 3 1 3 5.3 whole 5.05 nd=LOD none
near industrial site
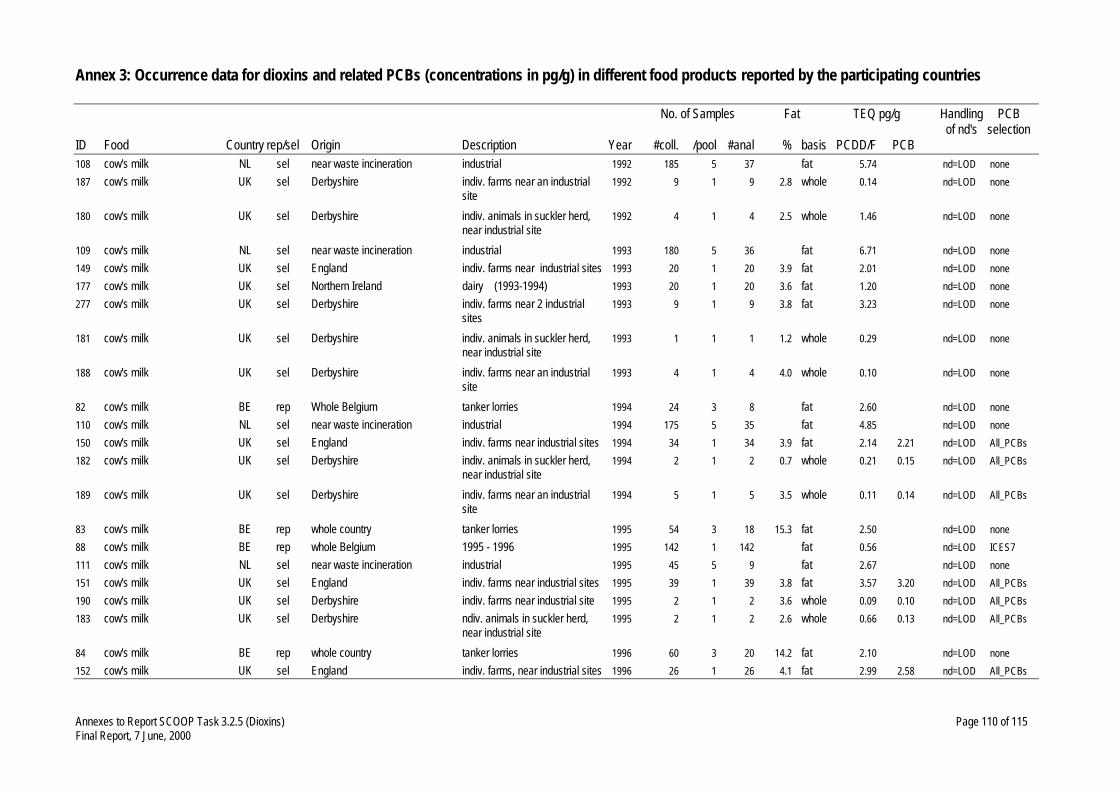
Annexes to Report SCOOP Task 3.2.5 (Dioxins) Page 110 of 115Final Report, 7 June, 2000
Annex 3: Occurrence data for dioxins and related PCBs (concentrations in pg/g) in different food products reported by the participating countries
No. of Samples Fat TEQ pg/g Handling PCBof nd's selection
ID Food Country rep/sel Origin Description Year #coll. /pool #anal % basis PCDD/F PCB108 cow's milk NL sel near waste incineration industrial 1992 185 5 37 fat 5.74 nd=LOD none187 cow's milk UK sel Derbyshire indiv. farms near an industrial 1992 9 1 9 2.8 whole 0.14 nd=LOD none
site180 cow's milk UK sel Derbyshire indiv. animals in suckler herd, 1992 4 1 4 2.5 whole 1.46 nd=LOD none
near industrial site109 cow's milk NL sel near waste incineration industrial 1993 180 5 36 fat 6.71 nd=LOD none149 cow's milk UK sel England indiv. farms near industrial sites 1993 20 1 20 3.9 fat 2.01 nd=LOD none177 cow's milk UK sel Northern Ireland dairy (1993-1994) 1993 20 1 20 3.6 fat 1.20 nd=LOD none277 cow's milk UK sel Derbyshire indiv. farms near 2 industrial 1993 9 1 9 3.8 fat 3.23 nd=LOD none
sites181 cow's milk UK sel Derbyshire indiv. animals in suckler herd, 1993 1 1 1 1.2 whole 0.29 nd=LOD none
near industrial site188 cow's milk UK sel Derbyshire indiv. farms near an industrial 1993 4 1 4 4.0 whole 0.10 nd=LOD none
site82 cow's milk BE rep Whole Belgium tanker lorries 1994 24 3 8 fat 2.60 nd=LOD none110 cow's milk NL sel near waste incineration industrial 1994 175 5 35 fat 4.85 nd=LOD none150 cow's milk UK sel England indiv. farms near industrial sites 1994 34 1 34 3.9 fat 2.14 2.21 nd=LOD All_PCBs182 cow's milk UK sel Derbyshire indiv. animals in suckler herd, 1994 2 1 2 0.7 whole 0.21 0.15 nd=LOD All_PCBs
near industrial site189 cow's milk UK sel Derbyshire indiv. farms near an industrial 1994 5 1 5 3.5 whole 0.11 0.14 nd=LOD All_PCBs
site83 cow's milk BE rep whole country tanker lorries 1995 54 3 18 15.3 fat 2.50 nd=LOD none88 cow's milk BE rep whole Belgium 1995 - 1996 1995 142 1 142 fat 0.56 nd=LOD ICES7111 cow's milk NL sel near waste incineration industrial 1995 45 5 9 fat 2.67 nd=LOD none151 cow's milk UK sel England indiv. farms near industrial sites 1995 39 1 39 3.8 fat 3.57 3.20 nd=LOD All_PCBs190 cow's milk UK sel Derbyshire indiv. farms near industrial site 1995 2 1 2 3.6 whole 0.09 0.10 nd=LOD All_PCBs183 cow's milk UK sel Derbyshire ndiv. animals in suckler herd, 1995 2 1 2 2.6 whole 0.66 0.13 nd=LOD All_PCBs
near industrial site84 cow's milk BE rep whole country tanker lorries 1996 60 3 20 14.2 fat 2.10 nd=LOD none152 cow's milk UK sel England indiv. farms, near industrial sites 1996 26 1 26 4.1 fat 2.99 2.58 nd=LOD All_PCBs

Annexes to Report SCOOP Task 3.2.5 (Dioxins) Page 111 of 115Final Report, 7 June, 2000
Annex 3: Occurrence data for dioxins and related PCBs (concentrations in pg/g) in different food products reported by the participating countries
No. of Samples Fat TEQ pg/g Handling PCBof nd's selection
ID Food Country rep/sel Origin Description Year #coll. /pool #anal % basis PCDD/F PCB191 cow's milk UK sel Derbyshire indiv. farms, near industrial site 1996 1 1 1 4.1 fat 6.03 5.38 nd=LOD All_PCBs184 cow's milk UK sel Derbyshire indiv. animals in suckler herd, 1996 4 1 4 0.7 fat 62.13 11.14 nd=LOD All_PCBs
near industrial site85 cow's milk BE rep whole country tanker lorries 1997 60 3 20 4.1 fat 1.90 nd=LOD none397 cow's milk DE rep Schleswig-Holstein tanker lorries 1997 36 1 36 fat 0.39 nd=Zero none403 cow's milk DE rep Lower Saxony indiv. farms 1997 16 1 16 fat 0.45 nd=0.5LOD none404 cow's milk DE sel Lower Saxony tanker lorries, farms, partly 1997 25 1 25 fat 0.91 nd=0.5LOD none
elevated levels due to citrus pulp153 cow's milk UK sel Yorkshire indiv. farms, near industrial sites 1997 17 1 17 4.0 fat 2.05 2.78 nd=LOD All_PCBs192 cow's milk UK sel Derbyshire indiv. farms, near industrial site 1997 20 1 20 3.8 fat 1.82 2.47 nd=LOD All_PCBs185 cow's milk UK sel Derbyshire indiv. animals in suckler herd, 1997 8 1 8 1.0 fat 19.43 4.27 nd=LOD All_PCBs
near industrial site62 cow's milk FI rep nation wide 1998 15 3 5 3.2 fat 0.34 0.23 nd=LOD All_PCBs29 cow's milk SV rep southern Sweden 1998 2 1 2 3.5 fat 0.29 0.55 nd=LOD nor_PCBs30 cow's milk SV rep national 1998 14 14 1 4.8 fat 1.10 0.53 nd=0.5LOD All_PCBs409 cow's milk DE sel Schleswig-Holstein tanker lorries, farms, partly 1998 74 1 74 fat 0.52 nd=Zero none
elevated levels due to citrus pulp405 cow's milk DE rep Lower Saxony indiv. farms 1998 14 1 14 fat 0.48 nd=0.5LOD none406 cow's milk DE rep Lower Saxony tanker lorries 1998 29 1 29 fat 0.60 nd=0.5LOD none407 cow's milk DE sel Lower Saxony indiv. farms, farms, partly 1998 24 1 24 fat 1.14 nd=0.5LOD none
elevated levels due to citrus pulp220 cow's milk IT rep Germany tanker lorries 1998 1 1 1 3.4 fat 0.34 nd=0.5LOD none223 cow's milk IT rep Germany tanker lorries 1998 1 1 1 3.7 fat 0.33 nd=0.5LOD none224 cow's milk IT rep Germany tanker lorries 1998 1 1 1 3.7 fat 0.33 nd=0.5LOD none221 cow's milk IT rep Germany tanker lorries 1998 1 1 1 4.1 fat 0.42 nd=0.5LOD none222 cow's milk IT rep Germany tanker lorries 1998 1 1 1 4.5 fat 0.26 nd=0.5LOD none219 cow's milk IT sel France tanker lorries 1998 1 1 1 3.9 fat 0.33 nd=0.5LOD none225 cow's milk IT rep Germany tanker lorries 1998 1 1 1 3.7 fat 0.27 nd=0.5LOD none226 cow's milk DK rep Whole of Denmark bulk tanks 1999 90 9 10 fat 0.49 nd=LOD none
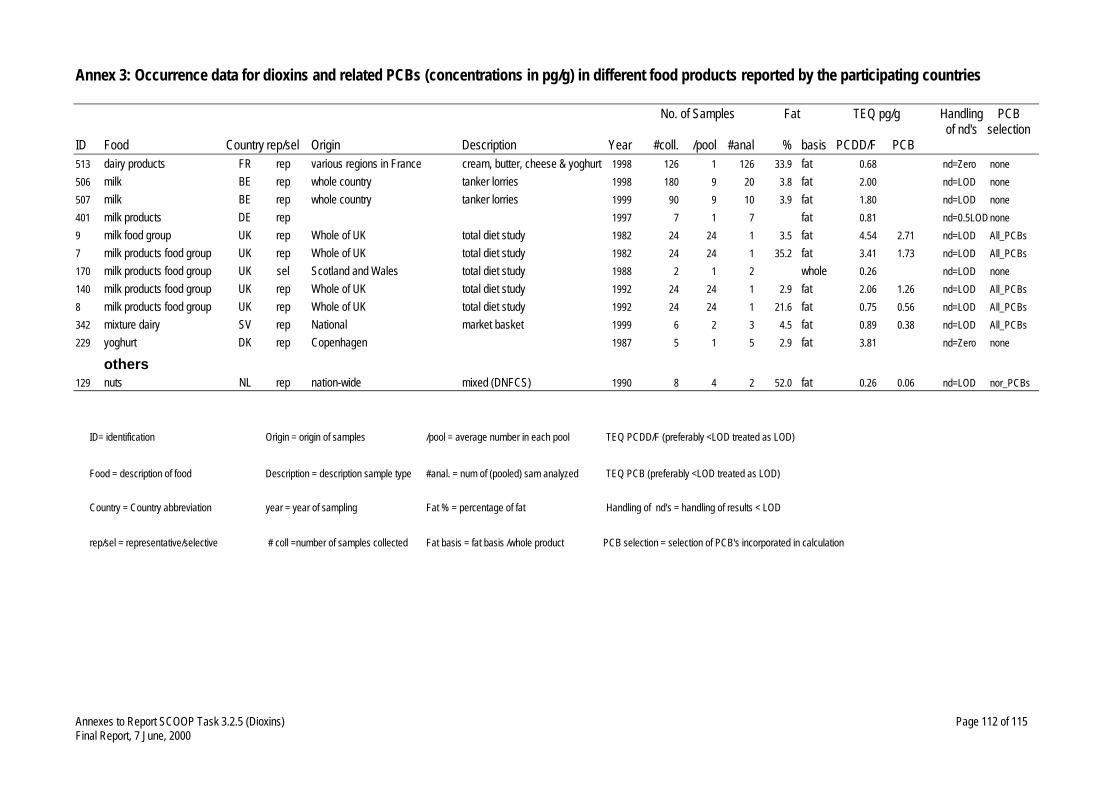
Annexes to Report SCOOP Task 3.2.5 (Dioxins) Page 112 of 115Final Report, 7 June, 2000
Annex 3: Occurrence data for dioxins and related PCBs (concentrations in pg/g) in different food products reported by the participating countries
No. of Samples Fat TEQ pg/g Handling PCBof nd's selection
ID Food Country rep/sel Origin Description Year #coll. /pool #anal % basis PCDD/F PCB513 dairy products FR rep various regions in France cream, butter, cheese & yoghurt 1998 126 1 126 33.9 fat 0.68 nd=Zero none506 milk BE rep whole country tanker lorries 1998 180 9 20 3.8 fat 2.00 nd=LOD none507 milk BE rep whole country tanker lorries 1999 90 9 10 3.9 fat 1.80 nd=LOD none401 milk products DE rep 1997 7 1 7 fat 0.81 nd=0.5LOD none9 milk food group UK rep Whole of UK total diet study 1982 24 24 1 3.5 fat 4.54 2.71 nd=LOD All_PCBs7 milk products food group UK rep Whole of UK total diet study 1982 24 24 1 35.2 fat 3.41 1.73 nd=LOD All_PCBs170 milk products food group UK sel Scotland and Wales total diet study 1988 2 1 2 whole 0.26 nd=LOD none140 milk products food group UK rep Whole of UK total diet study 1992 24 24 1 2.9 fat 2.06 1.26 nd=LOD All_PCBs8 milk products food group UK rep Whole of UK total diet study 1992 24 24 1 21.6 fat 0.75 0.56 nd=LOD All_PCBs342 mixture dairy SV rep National market basket 1999 6 2 3 4.5 fat 0.89 0.38 nd=LOD All_PCBs229 yoghurt DK rep Copenhagen 1987 5 1 5 2.9 fat 3.81 nd=Zero none
others129 nuts NL rep nation-wide mixed (DNFCS) 1990 8 4 2 52.0 fat 0.26 0.06 nd=LOD nor_PCBs
ID= identification Origin = origin of samples /pool = average number in each pool TEQ PCDD/F (preferably <LOD treated as LOD)
Food = description of food Description = description sample type #anal. = num of (pooled) sam analyzed TEQ PCB (preferably <LOD treated as LOD)
Country = Country abbreviation year = year of sampling Fat % = percentage of fat Handling of nd's = handling of results < LOD
rep/sel = representative/selective # coll =number of samples collected Fat basis = fat basis /whole product PCB selection = selection of PCB's incorporated in calculation

Annexes to Report SCOOP Task 3.2.5 (Dioxins) Page 113 of 115Final Report, 7 June, 2000
Annex 4: Dietary intake of dioxins and PCBs, pg TEQ/day*
Country Survey Period Sex/Age Region Occurrence Mean intake (pg TEQ/d) per kg bw Commentsdata PCDD/F PCB total PCDD/F PCB total
Children and adolescentsBE Teenagers 1997 M&F 14-18 City of Ghent only milk fatDE Toddlers 1995 M&F 22 mo-5 yr North-Rhine Westphalia 1995 44.0 na 2.6 na Duplicate studyDE Toddlers 1998 M&F 14-47 mo North-Rhine Westphalia 1998 22 na 1.61 na Duplicate studyFR National survey 1998-99 M&F 15-18 all France 1998-99 77.9 na 1.31 na nd=LODFR National survey 1998-99 M&F 3-14 all France 1998-99 72.0 na 2.28 na nd=LODUK British School-children's study 1983 M&F 10/11,14/15 all UK 1982 216.0 134.2 351 4.98 3.09 8.09UK British School-children's study 1983 M&F 10/11,14/15 all UK 1992 78.5 45.4 123.9 1.81 1.05 2.85UK British Toddlers study 1992/93 M&F 1.5-4.5 all UK 1982 136.4 88.8 225 9.47 6.17 15.63UK British Toddlers study 1992/93 M&F 1.5-4.5 all UK 1992 48.6 31.2 79.9 3.38 2.17 5.55*TEF factors used, if not other stated: PCDD/F = NATO/CCMS (1988); PCB = Ahlborg et al. (1994); nd = not detected; na = not assessed

Annexes to Report SCOOP Task 3.2.5 (Dioxins) Page 114 of 115Final Report, 7 June, 2000
Annex 4: Dietary intake of dioxins and PCBs, pg TEQ/d*Country Survey Period Sex/Age Region Occurrence Mean intake (pg TEQ/d) per kg bw Comments
data PCDD/F PCB total PCDD/F PCB totalAdults or total populationDK Danish dietary habits 1985 M&F 15-80 all Denmark 1987 313.8 na nd=0FI Finnrisk 1992 M&F 25-64 4 major regions 1991 95 na nd=0FI Finsurvey 1997 M&F 25-64 5 major regions 1991-99 60.8 50.5 111.2 1.01 0.84 1.85 nd=LODFR Dietary survey 1998-99 M&F 18-75 all France 1998-99 97.1 na 1.45 nd=LODIT INN-CA 1995 1994-1996 M&F 1-92 all Italy 45.1 na 0.74 nd=0.5*LODDE Report of Nutrition 1985-89 M&F adults all Germany 1986-89 160 na 2.3 nd=0.5*LODDE Report of Nutrition 1985-89 M&F adults all Germany 1987-90 120-140 na 1.7-2.0 nd=0.5*LODDE Report of Nutrition 1985-89 M&F adults all Germany 1987-90 130 na 1.9 nd=0.5*LODDE Report of Nutrition 1985-89 M&F adults all Germany 1986-91 127 na 1.8 nd=0.5*LODDE Report of Nutrition 1985-89 M&F 25-50 all Germany 1991-95 104 na 1.47 nd=0.5*LODDE Report of Nutrition 1985-89 M&F adults all Germany 1993-96 61.3 na 0.88 nd=0.5*LODDE Duplicate diet study 1994 M&F adults Saxony-Anhalt 1994 61.5 na 0.85 nd=0.5*LODDE Duplicate diet study 1994-95 M&F24-64 North-Rhine Westphalia 1994-95 49 na 0.72 nd=0.5*LODDE Report of Nutrition 1985-89 M&F adults all Germany 1995 69.6 na 1.0 nd=0.5*LODDE Report of Nutrition 1985-89 M&F adults all Germany 1995-98 37 na 0.53 nd=LODDE Report of Nutrition 1985-89 M&F 25-50 all Germany 1996-98 50.9 na 0.73 nd=0.5*LODNL DNFCS 1987/1988 1987-1988 M&F 1-85 all Netherlands 1990-91 81.9 80.5 nd=LODNL DNFCS 1992 1992 M&F 1-85 all Netherlands 1990-91 67 na nd=LODNL DNFCS 1992 1992 M&F 1-85 all Netherlands 1994-96 41 na nd=LODNL Duplicate diet 1978 M&F 21-60 one region 1978 300 491 791 4.19 6.85 11.04 nd=LODNL Duplicate diet 1984-85 M&F 18-74 one region 1984-85 127 184 311 1.82 2.93 4.23 nd=LODNL Duplicate diet 1994 M&F 18-74 one region 1994 40 69 109 0.53 0.92 1.45 nd=LODNO NORKOST 1997 1997 M&F 16-79 all Norway 29.0 110.2 139.2 nd=LODSE Riksmaten 1997-98 1997-98 M&F 18-74 all Sweden 1998-99 78 63 141 1.06 0.85 1.91 nd=LODSE Market Basket 1999 79 58 138 1.07 0.79 1.87 nd=LODUK British Adult Study 1986/87 M&F 16-64 all UK 1982 247.2 160.8 408 3.52 2.29 5.82 nd=LODUK British Adult Study 1986/87 M&F 16-64 all UK 1992 88.3 56.5 144.8 1.26 0.81 2.07 nd=LOD* TEF factors used, if not other stated: PCDD/F = NATO/CCMS (1988); PCB = Ahlborg et al. (1994); nd= not detected; na = not assessed** Intake estimate based on the assumption that all fish consumed originated from the Baltic.

Annexes to Report SCOOP Task 3.2.5 (Dioxins) Page 115 of 115Final Report, 7 June, 2000
Annex 5: Dietary exposure of breast fed infants to dioxins and PCBs in pg TEQ/dayCountry Survey Period Sex Age Region Occurrence Mean intake (pg TEQ/day) per kg bw Comments
data PCDD/F PCB total PCDD/F PCB total
DE Breast fed infants M&F 1 mo all Germany 1998 291 70 fully breastfed*DE Breast fed infants M&F 2 mo all Germany 1998 338 68 fully breastfed*DE Breast fed infants M&F 3 mo all Germany 1998 360 62 fully breastfed*DE Breast fed infants M&F 4 mo all Germany 1998 370 57 fully breastfed*DE Breast fed infants M&F 6 mo all Germany 1998 369 48 fully breastfed*DE Breast fed infants M&F 5 mo all Germany 1998 271 38 partly breastfed**DE Breast fed infants M&F 6 mo all Germany 1998 180 24 partly breastfed**DE Breast fed infants M&F 7-9 mo all Germany 1998 108 13 partly breastfed**
DE Breast fed infants M&F 4 mo all Germany 1986-90 879 135 fully breastfed*DE Breast fed infants M&F 4 mo all Germany 1992 604 93 fully breastfed*DE Breast fed infants M&F 4 mo all Germany 1994 502 77 fully breastfed*DE Breast fed infants M&F 4 mo all Germany 1996 402 62 fully breastfed*
UK Breast fed infants 1978/80 M&F2 mo Cambridge 1993/4 503 268 fully breastfedUK Breast fed infants 1978/80 M&F3 mo Cambridge 1993/4 533 284 fully breastfedUK Breast fed infants 1978/80 M&F4 mo Cambridge 1993/4 531 283 fully breastfedUK Breast fed infants 1978/80 M&F5 mo Cambridge 1993/4 487 259 partly breastfedUK Breast fed infants 1978/80 M&F6 mo Cambridge 1993/4 396 211 partly breastfedUK Breast fed infants 1978/80 M&F7 mo Cambridge 1993/4 335 178 partly breastfedUK Breast fed infants 1978/80 M&F8 mo Cambride 1993/4 238 127 partly breastfedUK Breast fed infants 1978/80 M&F10 mo Cambridge 1993/4 218 116 partly breastfed* Dioxin intakes have been calculated on the basis of the mean body weight, the average intake of breast milk depending on the age of the infants, and assuming a fat content of human milk to be 3.5%.** Dioxin intake calculated using the German nutritional recommendations for infants, and assuming that the recommended amount of milk is breast milk.