Embed Size (px)
Citation preview

Does the Hydrated ElectronOccupy a Cavity?Ross E. Larsen,*† William J. Glover,‡ Benjamin J. Schwartz*
Since the discovery of the hydrated electron more than 40 years ago, a general consensushas emerged that the hydrated electron occupies a quasispherical cavity in liquid water.We simulated the electronic structure and dynamics of the hydrated electron using a rigorouslyderived pseudopotential to treat the electron-water interaction, which incorporates attractiveoxygen and repulsive hydrogen features that have not been included in previous pseudopotentials.What emerged was a hydrated electron that did not reside in a cavity but instead occupieda ~1-nanometer-diameter region of enhanced water density. Both the calculated ground-stateabsorption spectrum and the excited-state spectral dynamics after simulated photoexcitationof this noncavity hydrated electron showed excellent agreement with experiment. The relaxationpathway involves a rapid internal conversion followed by slow ground-state cooling, the opposite ofthe mechanism implicated by simulations in which the hydrated electron occupies a cavity.
The nature of excess electrons in liquid wa-ter has been of continuing interest due totheir important role in radiation chemistry
and charge-transfer reactions. Excess electronscan be created directly by pulse radiolysis, or theycan be formed after ionization of a solute if thedetached electron resides in the liquid far from itsparent cation. When liquid water locally containsone more electron than is needed to maintainelectrical neutrality, the metastable localized speciesthat is created has been termed the hydrated elec-tron (e−aq). The hydrated electron has attractedconsiderable theoretical interest, in part becauseit poses the intriguing question of how a polarsolvent acts to localize an object whose size andshape is determined self-consistently by interac-tion with its surroundings. Thus, although thehydrated electron is nominally a simple single-electron species, the many-body nature of its inter-actions with the surrounding water molecules hasmade this a nontrivial problem in statistical me-chanics and quantum chemistry that can directlyconfront experiment.
Early continuum and semicontinuum mod-els treated the hydrated electron as a sphericalcharge distribution with a radius determined self-consistently by polarization of the surroundingsolvent. Such models provided insight into themechanism by which electrons may be localizedbut did not give a microscopic picture for thestructure of the solvent in the presence of thee−aq. Subsequent studies used molecular simu-lations to address such structural questions; insuch simulations, the excess electron was treatedquantum-mechanically, the surrounding watermolecules were treated classically, and the electron-water interaction was described by what is known
formally as a pseudopotential (1–3). Althoughalternatives have been proposed (4), the consen-sus picture that emerged from such simulationswas that a hydrated electron excludes water froma small region, so that the e−aq occupies a nearlyspherical void that is surrounded by water mol-ecules whose O-H bonds point toward the cavity(5). This picture is known as the cavity modelof the hydrated electron, and because simu-lations in which the electron occupies a cavityagree reasonably well with experiment, the cav-ity model has come to dominate both experi-mental and theoretical discussions of the e−aq (6).
Despite this well-accepted view, importantquestions still remain about the properties of thehydrated electron. One ongoing controversy is themechanism by which the e−aq relaxes to equilibri-um after photoexcitation. The debate is whetherrelaxation occurs by rapid internal conversion tothe ground state followed by slow reequilibrationof the surrounding water molecules (7–9) or byslow internal conversion followed by rapid re-equilibration on the ground state (10, 11). An-other concern is that the cavity model predictsa strong anisotropy in polarized transient hole-burning experiments (12, 13), but this predictedsignature is not seen experimentally (14, 15).
Here, we describe the results of molecular dy-namics simulations based on a new, rigorouslyderived electron-water pseudopotential. The re-sults of our calculations suggest that the hydratedelectron does not occupy a cavity but instead en-compasses a region of enhanced water density inwhich the electronic wavefunction overlaps ~37water molecules. We calculated several distinctground- and excited-state properties of this non-cavity electron and, in every case, have found thatour predictions are consistent with experiment. Forcertain properties, our simulations offer a bettermatch to experiment than simulations in whichthe electron resides in a cavity. Thus, we suggestthat previous claims that the hydrated electronoccupies a cavity may have been premature andthat a different physical picture of this importantspecies may be more appropriate.
A key element in any simulation of the hy-drated electron is the electron-water interac-tion specified by the pseudopotential. Althoughthere is a formalism for deriving pseudopoten-tials using information from quantum chemistrycalculations (16), the challenge lies in represent-ing such pseudopotentials in a functional formthat is convenient for molecular simulation. Thus,most bulk hydrated electron simulations havebeen based on ad hoc electron-water interactions(6, 17) or have used pseudopotentials that wereconstrained to have a simple functional formthat neglected important details in the molecular-core region (2). Recently, however, we haveshown that it is possible to generate rigorousmolecular pseudopotentials directly from theorbitals obtained in quantum chemistry calcula-tions (16). Thus, we decided to reexamine theproperties of the hydrated electron using a rig-orously derived electron-water pseudopotential(18), a two-dimensional contour plot of whichis shown in the left panels of Fig. 1. Some ofthe notable features of our pseudopotential arethe presence of deep attractive wells on eachhydrogen atom, a substantial repulsion of theelectron between the two hydrogen atoms, and
Department of Chemistry and Biochemistry, University ofCalifornia, Los Angeles, Los Angeles, CA 90095–1569, USA.
*To whom correspondence should be addressed. E-mail:[email protected] (R.E.L.); [email protected] (B.J.S.)†Present address: National Renewable Energy Laboratory,Golden, CO 80401–3305, USA.‡Present address: Department of Chemistry, Stanford Uni-versity, Stanford, CA 94305–5080, USA.
2 1 0 1 2
2
1
0
1
2
z / Åy
/ Å2 1 0 1 2
z / Å
2 1 0 1 2
2
1
0
1
2
z / Å
x / Å
2 1 0 1 2z / Å
2 1 0 1 2
2
1
0
1
2
y / Å
x / Å
2 1 0 1 2y / Å
Exact, smoothed Fit
-0.2
0
0.2
--
--
- -
- - - -
- -
- - - -
--
Energy (hartree)
Fig. 1. Cuts of the full smoothed electron-waterpseudopotential (left panels) and our fit to the fullsmoothed pseudopotential (right panels, eq. S5, andtable S1); the energy scale is in Hartree. The watermolecule lies in the y-z plane with the dipolepointing along the z axis. The O atom is at positiony = 0.0, z = 0.11663 Å, and the H atoms are at y =T0.76001, z=−0.46654Å. The upper panels show acut parallel to the molecular y-z plane with x =0.0260 Å; the middle panels show a cut perpendic-ular to the plane of the molecule with y = 0.0260 Å(which is the closest plane to the principal axis of themolecule given our finite grid sampling); the bottompanels show a cut perpendicular to the molecularplane through the two H atoms.
www.sciencemag.org SCIENCE VOL 329 2 JULY 2010 65
REPORTS
on
July
1, 2
010
ww
w.s
cien
cem
ag.o
rgD
ownl
oade
d fr
om

an attractive feature near the oxygen atom op-posite the hydrogens. Although the presence ofthe latter two features has been noted in work ex-amining water-cluster anions (3, 19), these featureshave not been incorporated into the pseudopoten-tials in previous bulk e−aq simulations (1, 2), so theirimportance to the behavior of the bulk hydratedelectron has not been explored. Thus, to accountfor the presence of these features, we have fittedour potential to a sum of hydrogen- and oxygen-centered terms, plus a sum of terms centered mid-way between the two hydrogen atoms; the fit isshown in the right panels of Fig. 1, and the fittingparameters and functional form of our pseudopo-tential are given in table S1.
Using our rigorously determined potential,we have run extensive mixed quantum/classicalmolecular dynamics (MD) simulations of hun-dreds of water molecules confined with a singleexcess electron in a cubic box. The water-waterinteractions were governed by a flexible simplepoint charge model (18), and the simulation timestep was 0.5 fs. The adiabatic eigenstates of theelectron were found at every time step on a 32by 32 by 32 cubic grid that was 18.17 Å on a sideusing the Lanczos algorithm in the manner de-scribed in (20); we verified that the eigenstates didnot change by more than 0.03 eV when a 643 gridwas used. The equilibrium (ground state) resultsdisplayed here come from 30 ps of dynamics with499 water molecules in a box 24.64 Å on a side inthe microcanonical ensemble (constant number ofmolecules, volume, and total energy) at an aver-age temperature of ~300 K. The nonadiabatic,excited-state trajectories were performed with200 water molecules in a box the same size as thecubic grid. A comparison of the spectroscopic andother properties found with 200 and 499 watermolecules is given in figs. S3 and S4.
Figure 2 displays structural and electronicproperties of the e−aq computed from these sim-ulations. The black dashed and solid curves inFig. 2A display average values of the hydratedelectron’s charge density and r2 times this den-sity, respectively, relative to the electron’s aver-age position, or center-of-mass (COM). Thesecurves show that the hydrated electron is clearlynot a point-particle but instead has charge dis-tributed over a ~2.6 Å radius of gyration, ingood agreement with the experimental value of~2.5 Å obtained from spectral moment analysis(21). Fig. 2A also shows radial distribution func-tions (RDFs), which give the probability offinding either H atoms (red dashed curve) or Oatoms (solid blue curve) on the surrounding wa-ter molecules relative to the electron’s COM.Clearly, the electron’s charge density has con-siderable overlap with regions containing a highdensity of water molecules: A major fractionof the charge density of the e−aq is found be-tween the first hydrogen and oxygen peaks inthe RDFs. This is seen explicitly in the snap-shots shown in Fig. 2, B and C, which show thatmany water molecules reside inside the volumeoccupied by the hydrated electron.
The radial distribution functions (RDFs) inFig. 2A make clear that the hydrated electrondoes not exclude a discrete volume about itself,so that a description of the e−aq as residing in acavity is inappropriate. Although the RDFs be-come small at distances close to the electron’sCOM, the fall-off is gradual, more akin to thesolvation structure around a soft sphere ratherthan a hard excluded volume. Moreover, theRDFs do not reach zero at the origin, indicatingthat solvent fluctuations occasionally allow wa-ter oxygen atoms to penetrate all the way to thehydrated electron’s COM. The fact that there isa higher probability for H atoms to be close tothe electron’s COM than O atoms indicates thatthe electron induces a net orientational orderingof the water molecules inside the electron (anordering that can also be seen in Fig. 2, B andC), although the preference for water O-H bondsto point toward the COM is reduced from thatseen in cavity models of the electron (2, 5, 10).
The slight maxima and minima in the RDFsshow that the electron also induces some transla-tional structural organization of the nearby watermolecules, but even the slight minimum in theoxygen RDF at ~3.5 A lies above 1. Integration ofthe RDF gives an average number of moleculeswithin 6 A of the electron COM of ~37, whereas
only ~30 water molecules would be expected with-in this distance if the average local density werethat of neat water. Thus, rather than pushing wateraway from the region of maximum electron den-sity, as in the cavity model, our simulations showthat the hydrated electron occupies a region ofenhanced water density extending out ~6 A. Thisresult implies that the net interaction of the electronwith water is attractive, inducing an electrostric-tion effect, in direct contrast to the overall repulsiveinteraction necessary to produce a cavity. The ef-fect that the hydrated electron has on the structureof the nearby water molecules is summarized inFig. 2D, which shows water-water RDFs for watermolecules inside the electron (within 3.25 A of theelectron’s COM, middle curves) and those in purewater at both normal (1.00 g/cm3, lower curves)and higher (1.23 g/cm3, upper curves) densities.Clearly, the water molecules inside the electron arepacked together more like water at high densitythan like water at normal density.
Figure 3 shows various energetic and spec-troscopic properties of the hydrated electroncalculated with our potential. As expected, thetime-dependent adiabatic energy levels shownin Fig. 3A fluctuate in response to water mo-tions, but the energy levels differ in two ways fromthose calculated in simulations in which the elec-
0
0.5
1
1.5
2
2.5
0 2 4 6 8 10 12
e¯–w
ater
g(r
)
r (Å)
HydrogenOxygen
r 2|ψ|2|ψ|2
e¯ to:COM
B
C
0
1
2
3
4
5
6
7
8
1.5 2 2.5 3 3.5
Hydrogen-HydrogenHydrogen-OxygenOxygen-Oxygen
r (Å)
wat
er–w
ater
g(r
)
water “in” eaq
1.23 g/cc water
1.00 g/cc water
A
D
Fig. 2. (A) Electron COM-to-water site radial distribution functions (colored curves). The dashed curve isthe square of the wavefunction as a function of distance from the COM, calculated as a time-averageover 12.5 ps of dynamics, and the solid curve is this quantity multiplied by r2 (both in arbitrary units).(B) All water molecules within 6.0 Å of the COM of the electron for a representative configuration. Thewire mesh outer contour encloses 90% of the electron’s charge density, and the opaque inner contourencloses 50%. (C) Expanded version of the configuration in (B), with the 50% contour represented by amesh. (D) Water-water radial distribution functions for pure water at density 1.00 g/cm3 (lower curves),1.23 g/cm3 (upper curves), and for water molecules located within 3.25 Å of the electron center of mass(middle curves). The three sets of curves have been shifted vertically for clarity.
2 JULY 2010 VOL 329 SCIENCE www.sciencemag.org66
REPORTS
on
July
1, 2
010
ww
w.s
cien
cem
ag.o
rgD
ownl
oade
d fr
om
tron resides in a cavity. First, in our calculationsthe excited states form a continuous band, unlikecavity models that have three low-lying excitedstates and then an energy gap below the higher-lying, so-called continuum states. Second, in ourmodel, the solvent induces greater fluctuations inthe ground-state energy than in the excited-stateenergies. In calculationswith approximate pseudo-potentials where the electron resides in a cavity,the fluctuations of the ground- and excited-stateenergies are of similar magnitude (1, 2, 10).
We calculated the optical absorption spec-trum of the e−aq from our simulations by binningthe energy gaps weighted by the square of theappropriate transition dipole moment for thelowest seven transitions from configurations takenevery 10 fs (18), as shown by the red dotted curvein Fig. 3B. The agreement with the Gaussian-Lorentzian fit to the experimental spectrum (solidblack curve) is remarkable: The spectrum cal-culated with our model matches the experimen-tal spectrum more closely than calculations withpseudopotentials that lead to a cavity-based hy-drated electron (1, 2, 10). Moreover, shifting theexperimental spectrum 0.15 eV lower in ener-gy (dashed black curve) shows that the shapeof the low-energy edge of the calculated spec-trum is correct. We do not expect to reproducethe high-energy tail of the spectrum in thesecalculations, both because of the small number ofexcited states we have included (calculations with20 states on a few configurations show that the taildoes begin to fill in) and because we have notaccounted for quantum effects in the solvent (22).Fig. 3C shows a decomposition of the calculatedabsorption spectrum of the e−aq into sub-bands as-sociated with transitions from the ground state toeach of the lowest seven excited states. As in thecavitymodel, the bulk of the spectrum comes fromtransitions to the lowest three excited states. How-ever, because there is no gap between the firstthree excited states and the higher-lying states, ourcomputed spectrum does not show the unphys-ical dip between the bright states and the high-energy tail typically seen in spectra predicted bycavity models (1, 2, 6, 10, 17, 22).
The three lowest excited states that contrib-ute the most to the absorption spectrum in our
model of the e−aq each have a positive and a neg-ative lobe, as shown for a representative configu-ration in fig. S1, although the lobes are typicallyof different sizes. These three lowest-lying quasi-p-like states are substantially larger than theground state of the hydrated electron, havingaverage radii of gyration of 4.6(0.3), 5.0(0.5),and 5.4(0.6) A, in increasing order of energy(root-mean-squared deviations given in parenthe-ses). These radii match well with the estimatesfrom excited-state scavenging experiments (23).Perhaps more interestingly, the three low-lyingquasi-p-like states do not point in rigorouslyorthogonal directions: Dot products between thenormalized transition dipoles from the ground tothe three quasi-p-like states, cos q ¼ →
ui ⋅→uj, are
distributed roughly as exp(−cosq/0.1), as shownin fig. S2. These deviations from strict orthogo-nality occur because small fluctuations in thepositions of water molecules far from the electronCOM can alter the orientation of one of the ex-cited states without greatly affecting the othertwo. This is in sharp contrast to what occurswhen the electron occupies a cavity: In that case,the cavity’s shape strictly determines the relativeorientations of the transition dipoles (supportingonline text) (12, 24).
In the cavity model, the width of the elec-tron’s absorption spectrum reflects fluctuationsin the shape of the cavity that change the split-ting of three relatively well-separated sub-bands,representing transitions to the three bright p-likeexcited states (24). In contrast, our calculationssuggest that the spectrum is broadened by largefluctuations in the ground-state energy, so theunderlying individual absorption sub-bands over-lap substantially and are not distinct, as shownin Fig. 3C. Each of the three bright sub-spectraspans roughly 3/4 of the width of the entireband, consistent with experimental estimates ofthe magnitude of homogeneous broadening inthe hydrated electron spectrum (25). The fact thatthe transitions to the different excited states over-lap in energy and have transition dipoles that arenot strictly orthogonal suggests that there shouldbe no detectable anisotropy in polarized pump-probe hole-burning measurements on the hydratedelectron (15). This is a very different prediction
from the strong polarized anisotropy that emergesin simulations based on the cavity model (12, 13).Thus, unlike the cavity model, our calculationsare consistent with the experimental observationsthat polarized hole-burning experiments on thee−aq show no anisotropy (14, 15).
In addition to the ground-state electronicstructure, a sound model for the e−aq should alsobe able to correctly predict the relaxation dy-namics after photoexcitation to one of the low-lying optically accessible excited states. Thus, wechose to compute the relaxation dynamics of aphotoexcited hydrated electron with our modelby running 20 nonadiabatic, nonequilibrium tra-jectories in which the electron is instantane-ously resonantly excited by light of energy 1.55 T.01 eV (~800 nm) (18). For probe wavelengthsnear the excitation wavelength, the red curvein Fig. 4C shows that the calculated transient dy-namics of the e−aq involve bleach recovery on bothfast (150 fs, 75% amplitude) and slow (1.1 ps,25% amplitude) time scales (black curve). Thetransient dynamics in this region resemble thetime traces of Barbara and co-workers (at a~740-nm pump wavelength, to account for theslight red shift of our calculated spectrum) (7).At wavelengths longer than the excitation pulse,our calculations predict an initial bleach followedby a delayed transient absorption (blue and greencurves in Fig. 4C), also similar to the experimen-tal data (11). We note that the magnitude of thedelayed absorption should be slightly underes-timated by our calculations because we computetransitions only to the lowest seven excited states.Figure 4D shows that this means that the agree-ment between our calculated transient absorptionspectra and experiment is at least as good as—and possibly better than—that with the cavitymodel (dotted blue curve at t = 1 ps), whichrequires the calculated spectra to be red-shiftedby nearly 0.7 eV to come close to matching theexperimental data (dashed blue curve at t = 1 ps)(2, 12).
Simulations in which the electron resides ina cavity suggest that the transient absorption dy-namics are governed primarily by solvation ofthe excited state, with a slow internal conversionfollowed by fast equilibration of the ground state
0.5 1 1.5 2 2.5 3 3.5
I(E
) (a
rb. u
nits
)
Energy (eV)
Current resultsExperiment
Exp. (shifted)
0.5 1 1.5 2 2.5 3
I(E
) (a
rb. u
nits
)
Energy (eV)
Total
-6.5
-6
-5.5
-5
-4.5
-4
-3.5
-3
0 0.2 0.4 0.6 0.8 1.0 1.2 1.4 1.6
Ene
rgy
(eV
)
Time (ps)
A B C
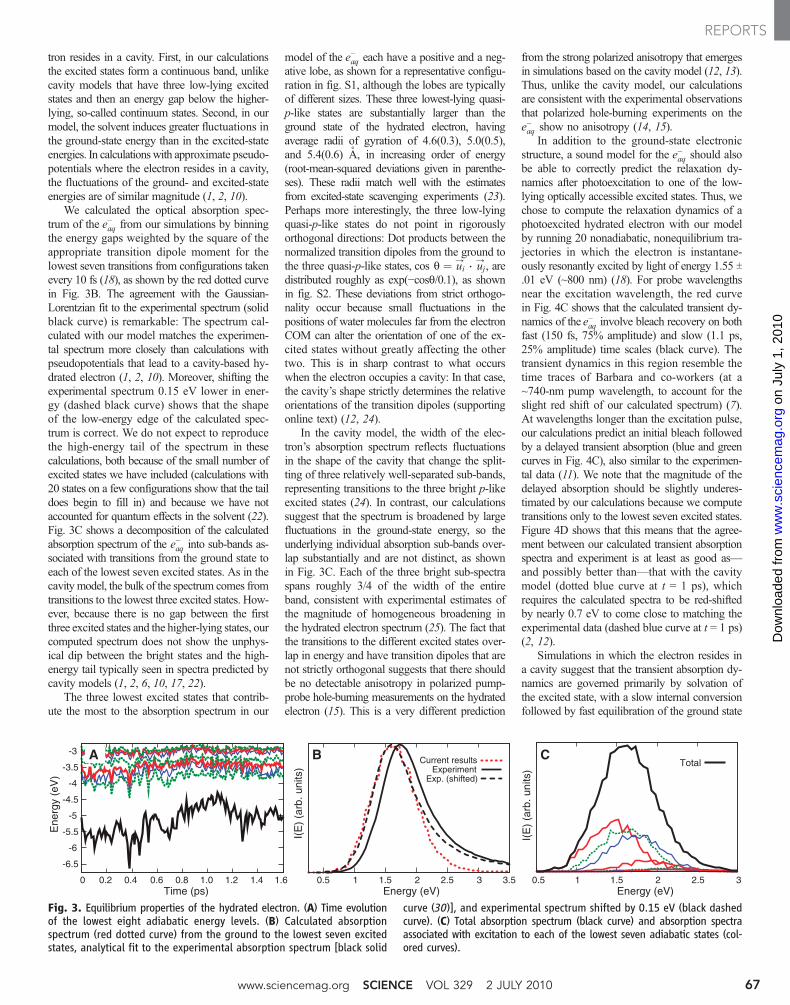
Fig. 3. Equilibrium properties of the hydrated electron. (A) Time evolutionof the lowest eight adiabatic energy levels. (B) Calculated absorptionspectrum (red dotted curve) from the ground to the lowest seven excitedstates, analytical fit to the experimental absorption spectrum [black solid
curve (30)], and experimental spectrum shifted by 0.15 eV (black dashedcurve). (C) Total absorption spectrum (black curve) and absorption spectraassociated with excitation to each of the lowest seven adiabatic states (col-ored curves).
www.sciencemag.org SCIENCE VOL 329 2 JULY 2010 67
REPORTS
on
July
1, 2
010
ww
w.s
cien
cem
ag.o
rgD
ownl
oade
d fr
om

(10, 12, 13). This adiabatic picture, however, isnot the only way to interpret the observed spectralbehavior. Early pump-probe measurements on thee−aq were explained in terms of a nonadiabaticmodel involving rapid internal conversion followedby slow cooling of a nonequilibrium ground state(7, 8). Moreover, more recent experiments studyingthe excitation of water cluster anions also stronglysuggest that relaxation occurs by rapid internalconversion followed by slow ground-state cooling(9). The experimental literature on the relaxationof the bulk hydrated electron seems to be aboutevenly divided between the adiabatic and non-adiabatic relaxation mechanisms.
Figure 4A shows a representative excited-state trajectory of the hydrated electron simu-lated with our model. The salient features arethat the ground-to-occupied energy gap closesvery rapidly [an observation that is consistent
with photon echo experiments on the hydratedelectron (26)]; the electron then makes a transitionto the ground state rapidly, in ~280 fs; and afterthe transition, the ground-state energy returns toits equilibrium value slowly, in a time ≥ 1 ps.Figure 4B shows the probability of the hydratedelectron remaining excited as a function of timeafter excitation for our 20-trajectory ensemble;the average excited-state lifetime is ~280 fs witha root-mean-squared deviation of ~150 fs. Takentogether, our calculations predict that photoex-cited hydrated electrons return to the ground statemuch faster than suggested by calculations inwhich the e−aq resides in a cavity (10, 20).
Because the underlying relaxation mechanismin our simulations is different, it is important tocontrast our assignment of the delayed near-IRtransient absorption to those from simulations inwhich the electron resides in a cavity. In our sim-
ulations, the induced absorption results from tran-sitions originating from a nonequilibrated groundstate of the e−aq, produced after rapid internal con-version. In the cavity model, the delayed absorp-tion comes from so-called p-to-p transitions fromthe occupied first excited state to higher-lying ex-cited states; both the energy gap and the transitiondipole magnitudes of these transitions increaseover the first few hundred fs (10). Thus, althoughboth models appear to describe the pump-probedata roughly equally well, provided that an em-pirical shift of the predicted spectra is used forthe cavity model, the interpretation of the dy-namics underlying the spectral transients in thetwo models is completely different.
Finally, we note that our results also appearconsistent with resonance Raman measurementson the hydrated electron (27), which showed thatwaters near the e−aq have both their bend andstretch frequencies red-shifted relative to those inpure water. Our model suggests that the watermolecules that are strongly coupled to the electronare at an effectively higher density than watermolecules in the bulk. It is well known that theRaman spectrum of high-density water under pres-sure shows down-shifts of both the bending andstretching modes, a result of the fact that O-Hbonds are weakened when protons can be moreequally shared between the O atoms of watermolecules that are closer together (28). Thus, partof the major features seen in the Raman spectros-copy of the hydrated electron may result from thechange in local water density and structure inducedby the presence of the electron. In addition, thestrong overlap of the electronic charge density withantibonding molecular orbitals on multiple watermolecules also likely plays a role in weakeningthe OH bonds (25). The slight orientational order-ing of the water molecules inside the electron isalso consistent with the Raman spectroscopy,which shows that the two O-H bonds of the watermolecules coupled to the electron experience dif-ferent average environments (27).
How should recent ab initio simulations ofthe e−aq be viewed in light of our new model?Boero et al. have performed a DFT-based Car-Parrinello (CP) study of an excess electron amidst32 water molecules, which predicted that the hy-drated electron occupied a cavity (29), albeit onesmaller than those seen in previous cavity-modelcalculations (1, 2, 10). The cavity in this CP sim-ulation was transient, however, with a very shortlifetime (29). We found that simulations withour model using smaller numbers of water mol-ecules gave larger fluctuations in properties suchas the electron’s radius of gyration (supportingonline text), so it is possible that with only 32 wa-ter molecules, the transient cavities Boero et al.observed were due to such fluctuations. Thus, wedo not see any inconsistencies between our re-sults and the CP simulations.
References and Notes1. J. Schnitker, P. J. Rossky, J. Chem. Phys. 86, 3462 (1987).2. L. Turi, D. Borgis, J. Chem. Phys. 117, 6186 (2002).
-5
-4.5
-4
-3.5
-3
-2.5
-2
0 0.2 0.4 0.6 0.8 1.0 1.2 1.4
Ene
rgy
(eV
)
Time (ps)
Occupied state
0
0.2
0.4
0.6
0.8
1
0 100 200 300 400 500 600
Exc
ited-
stat
e pr
obab
ility
Time (fs)
-0.5 0 0.5 1.0 1.5 2.0 2.5Time (ps)
800 nm 880 nm1240 nm
400 600 800 1000 1200
OD
(ar
b. u
nits
)
OD
(ar
b. u
nits
)
Probe Wavelength (nm)
0 ps
1 ps
2.5 ps0
0
0
0
0
0
0800-nm fit
A
B
C D
This Work
Experiment
0.5 ps
Cavity Model(shifted by 0.7 eV)
Fig. 4. Nonadiabatic excited-state relaxation dynamics of the hydrated electron. (A) Adiabatic energylevels (colored curves) as a function of time after excitation by 1.55 eV, with the heavy black curveindicating the occupied state. (B) The probability for the electron to remain in an excited state as afunction of time after excitation for our 20 trajectories. (C) Calculated transient absorption dynamics at130-fs time resolution for the wavelengths indicated; the curves have been offset vertically for clarity. Theblack curve shows a fit of our predicted results to a double-exponential decay with time scales of 150 fsand 1100 fs with a ~3:1 amplitude ratio, respectively, in excellent agreement with experimental data (7).(D) Simulated transient absorption spectra (solid curves) for the indicated times after excitation, with thecurves offset vertically for clarity. Error bars are T1 SD of the mean. The dashed blue curve shows theexperimental transient spectrum at 1 ps (11). The dotted blue curve shows the cavity model’s simulatedtransient spectrum at 1 ps, shifted by −0.68 eV to aid comparison to the experiment (13).
2 JULY 2010 VOL 329 SCIENCE www.sciencemag.org68
REPORTS
on
July
1, 2
010
ww
w.s
cien
cem
ag.o
rgD
ownl
oade
d fr
om

3. L. D. Jacobson, C. F. Williams, J. M. Herbert, J. Chem.Phys. 130, 124115 (2009).
4. A. L. Sobolewski, W. Domcke, Phys. Chem. Chem. Phys. 4,4 (2002).
5. L. Kevan, Acc. Chem. Res. 14, 138 (1981).6. J. Schnitker, P. J. Rossky, J. Chem. Phys. 131, 037102
(2009).7. Y. Kimura, J. C. Alfano, P. K. Walhout, P. F. Barbara,
J. Phys. Chem. 98, 3450 (1994).8. M. S. Pshenichnikov, A. Baltuska, D. A. Wiersma,
Chem. Phys. Lett. 389, 171 (2004).9. A. E. Bragg, J. R. R. Verlet, A. Kammrath, O. Cheshnovsky,
D. M. Neumark, Science 306, 669 (2004).10. B. J. Schwartz, P. J. Rossky, J. Chem. Phys. 101, 6902
(1994).11. K. Yokoyama, C. Silva, D. H. Son, P. K. Walhout,
P. F. Barbara, J. Phys. Chem. A 102, 6957 (1998).12. B. J. Schwartz, P. J. Rossky, Phys. Rev. Lett. 72, 3282
(1994).13. B. J. Schwartz, P. J. Rossky, J. Chem. Phys. 101, 6917 (1994).14. A. Baltuska, M. F. Emde, M. Pshenichnikov, D. A. Wiersma,
J. Phys. Chem. A 103, 10065 (1999).15. M. C. Cavanagh, I. Martini, B. J. Schwartz, Chem. Phys.
Lett. 396, 359 (2004).
16. C. J. Smallwood, R. E. Larsen, W. J. Glover, B. J. Schwartz,J. Chem. Phys. 125, 074102 (2006).
17. R. E. Larsen, W. J. Glover, B. J. Schwartz, J. Chem. Phys.131, 037101, author reply 037102 (2009).
18. Materials and methods are available as supportingmaterial on Science Online.
19. T. Sommerfeld, A. DeFusco, K. D. Jordan, J. Phys. Chem. A112, 11021 (2008).
20. R. E. Larsen, M. J. Bedard-Hearn, B. J. Schwartz, J. Phys.Chem. B 110, 20055 (2006).
21. D. M. Bartels, K. Takahashi, J. A. Cline, T. W. Marin,C. D. Jonah, J. Phys. Chem. A 109, 1299 (2005).
22. L. Turi, G. Hantal, P. J. Rossky, D. Borgis, J. Chem. Phys.131, 024119 (2009).
23. T. W. Kee, D. H. Son, P. Kambhampati, P. F. Barbara,J. Phys. Chem. A 105, 8434 (2001).
24. J. Schnitker, K. Motakabbir, P. J. Rossky, R. A. Friesner,Phys. Rev. Lett. 60, 456 (1988).
25. M. J. Tauber, R. A. Mathies, J. Phys. Chem. A 105, 10952(2001).
26. S. J. Rosenthal, B. J. Schwartz, P. J. Rossky, Chem. Phys.Lett. 229, 443 (1994).
27. M. J. Tauber, R. A. Mathies, J. Am. Chem. Soc. 125, 1394(2003).
28. G. E. Walrafen, J. Soln. Chem. 2, 159 (1973).29. M. Boero, M. Parrinello, K. Terakura, T. Ikeshoji, C. C. Liew,
Phys. Rev. Lett. 90, 226403 (2003).30. F.-Y. Jou, G. R. Freeman, J. Phys. Chem. 83, 2383
(1979).31. This research was funded by NSF under grant
CHE-0908548. We thank M. C. Larsen and A. E. Bragg forhelpful discussions, C. N. Mejia for performing thepreliminary Hartree-Fock calculations that we used togenerate the new electron-water pseudopotential,and K. D. Jordan for a critical reading ofthe manuscript.
Supporting Online Materialwww.sciencemag.org/cgi/content/full/329/5987/65/DC1Materials and MethodsSOM TextFigs. S1 to S4Table S1References
15 March 2010; accepted 14 May 201010.1126/science.1189588
Experimental Results for H2Formation from H− and H andImplications for First Star FormationH. Kreckel,1*† H. Bruhns,1‡ M. Čížek,2 S. C. O. Glover,3 K. A. Miller,1 X. Urbain,4 D. W. Savin1
During the epoch of first star formation, molecular hydrogen (H2) generated via associative detachment(AD) of H− and H is believed to have been the main coolant of primordial gas for temperatures below104 kelvin. The uncertainty in the cross section for this reaction has limited our understanding ofprotogalaxy formation during this epoch and of the characteristic masses and cooling times for the firststars. We report precise energy-resolved measurements of the AD reaction, made with the use of aspecially constructed merged-beams apparatus. Our results agreed well with the most recent theoreticallycalculated cross section, which we then used in cosmological simulations to demonstrate how the reducedAD uncertainty improves constraints of the predicted masses for Population III stars.
More than 40 years ago, Saslaw andZipoy (1) proposed that the formationof neutral molecular hydrogen played a
central role in the cooling of primordial gas. Col-lisions of atomic H with molecular H2 transferkinetic energy from the H into internal energy ofthe H2 through ro-vibrational excitation of themolecule. Subsequently, the molecule can radia-tively relax and the emitted photon may escapefrom the cloud, thereby cooling the gas. Recentnumerical models for the formation of the first(Population III) stars have demonstrated the im-portance of primordial H2 as a coolant (2–4).
During the epoch of first star formation, H2
was formed primarily via the associative detach-ment (AD) reaction (3),
H− þ H → H−2 → H2 þ e− ð1Þ
Although this is the simplest anion-neutral chem-ical reaction, theory and experiment have failedto reach consensus for both the magnitude andenergy dependence of the rate coefficient (5).This uncertainty severely limits our ability tomodel protogalaxies and metal-free stars formingfrom initially ionized gas, such as in H II regionscreated by earlier Population III stars (5, 6). Forexample, it limits our ability to predict whether agiven protogalactic halo can cool and condenseon a sufficiently short time scale before it isgravitationally disrupted through a collision withanother protogalactic halo (5). Additionally, thecosmological simulations we have performed forthis work show that for gas in free fall, the re-sulting spread in theminimumgas temperature—and in the gas density at which this minimum isreached—leads to a factor of >20 difference inthe Jeans mass. Finally, for shocked gas under-
going isobaric collapse, the time required to reachthe cosmic microwave background tempera-ture can differ by up to a factor of 3. This affectsthe likelihood that such gas will cool and col-lapse to form a star before undergoing anothershock (6).
The three most recent theoretical calculationsfor Eq. 1 have not converged, although they allused the same potential for the intermediate H2
−
anion. The results of Sakimoto (7) andČížek et al.(8) are in good agreement with one another butnot with the calculations of Launay et al. (9). Theroom-temperature flowing afterglow results of(10–12), however, are discrepant with the cal-culations of Sakimoto and Čížek et al. but are inreasonable agreement with those of Launay et al.See (13) for a brief review. Unfortunately, theexisting experimental work provides no con-straint on the temperature dependence for Eq. 1,which limits the ability of these measurements tobenchmark theory. Considering all these issues,we have designed and built a dedicated merged-beams apparatus in order to perform energy-resolved AD measurements spanning the entirerelevant collision energy range.
An overview of the experiment is shown inFig. 1; a detailed description is given in (14). Inthe first leg of the apparatus, we extract an H−
beam from a negatively biased ion source toachieve a beam energy eUs of ~10 keV. We col-limate it via standard ion beam technology. Theatomic H beam is generated in the central portionof the second leg of the apparatus, where ~7.4%of the H− is neutralized by photodetachment(PD) with a laser diode array at 975 nm withcontinuous-wave power of 1.4 kW.At the photonenergy (1.25 eV) and power density used, the PDprocess produces exclusively ground-state Hatoms. The PD occurs in the center of a drift tube,1.2 m in length, used to control the relative energybetween theH− andH beams.When a voltage−Uf
is applied to the tube, the H− ions are deceleratedas they enter the tube and are then accelerated
1Columbia Astrophysics Laboratory, Columbia University,New York, NY 10027, USA. 2Charles University Prague,Faculty of Mathematics and Physics, Institute of TheoreticalPhysics, 180 00 Praha 8, Czech Republic. 3Zentrum für As-tronomie der Universität Heidelberg, Institut für TheoretischeAstrophysik, 69120 Heidelberg, Germany. 4Institute of Con-densed Matter and Nanosciences, Université Catholique deLouvain, Louvain-la-Neuve B-1348, Belgium.
*Present address: Department of Chemistry, University ofIllinois, Urbana, IL 61801, USA.†To whom correspondence should be addressed. E-mail:[email protected]‡Present address: INFICON GmbH, D-50968 Cologne, Germany.
www.sciencemag.org SCIENCE VOL 329 2 JULY 2010 69
REPORTS
on
July
1, 2
010
ww
w.s
cien
cem
ag.o
rgD
ownl
oade
d fr
om