Embed Size (px)
Citation preview
Liquefied Petroleum Gas Market Analysis And Forecast
U n i v e r s i t y O f P e t r o l e u m A n d E n e r g y S t u d i e s
Page 1
LPG Market Analysis And Forecasts
Report Submitted In Partial Fulfillment Of
Requirements
For
MBA (Energy Trading)
Batch 2013-2015
University of Petroleum and Energy Studies
Dehradun
SUBMITTED TO:
Mr. Somya Sharma
College of Management Studies
University of Petroleum and Energy Studies
SUMITTED BY
Vindyanchal Kumar (R590213042)
MBA Energy Trading 2013-2015
Liquefied Petroleum Gas Market Analysis And Forecast
U n i v e r s i t y O f P e t r o l e u m A n d E n e r g y S t u d i e s
Page 2
Acknowledgement
Completing a task is never a solo effort. It is often the result of invaluable contributions
by a number of individuals in a direct or indirect manner, which helps in the shaping and
achievement of success.
Firstly, I would like to express my sincere gratitude to Mr. Charanjeet Ailsinghani,
Managing Director, for granting me the opportunity to undertake an internship at the
Grandview research.
I am extremely grateful to my project guides, Mr. Anshuman Bahuguna, senior
research analysis for their encouragement and patience throughout the duration of this
project. Without their vision, guidance and support this report would not have
materialized.
I would also like to deeply thank the other people at Grandview research, which during
the period of my internship, provided me with useful and helpful assistance. Without their
care and consideration this report would not have been completed.
I am thankful to the Internship Coordinators at University of Petroleum And Energy
Studies Mr. Anubhav Sharma for their invaluable support and guidance during the
internship period.
Last but not the least; I would like to thank my parents for their inestimable love, support
and encouragement which gave me the confidence and determination to carry out this
project.
Signature of Student
Vindyanchal Kumar
Place:
Date:
Liquefied Petroleum Gas Market Analysis And Forecast
U n i v e r s i t y O f P e t r o l e u m A n d E n e r g y S t u d i e s
Page 3
Certificate of Originality This is to certify that the project titled “LPG Market Analysis And Forecasts” is an original
work of the student and is being submitted in partial fulfillment of master degree in
business administration (MBA Energy trading) of University of Petroleum and Energy
Studies, Dehradun for the fulfillment of requirement of the course of study. This report
has not been submitted earlier to any other university/institution for the requirement of a
course of study.
Signature of Student
Vindyanchal Kumar
Place:
Date
Liquefied Petroleum Gas Market Analysis And Forecast
U n i v e r s i t y O f P e t r o l e u m A n d E n e r g y S t u d i e s
Page 4
Abstract Project Title: LPG Market Analysis This report is an outcome of the exercise I conducted during my internship which was
of 13 weeks at "Grandview Research”, which is a research and consultation company.
Liquefied petroleum gas (LPG) is a hydrocarbon which is produced during processing
of crude oil and natural gas production. It is a clean form of energy which is used in
various applications. Along with this LPG environment friendly as produce 50% less
carbon dioxide than coal and 20% less carbon dioxide than heating oil.
The global LPG industry has increased rapidly over the past decade and experienced
several significant changes such as improvement in channel of distribution, development
of new light-weight metal and/or composite cylinders coupled with development of
telemetry (remote management systems), constitute significant improvements in terms of
safety, and facility of use. Emergence of LPG for various applications around the world
has contributed to the growth of its demand in the past. Application of LPG as fuel in
commercial and residential market is booming in many developing countries owing to
government relaxation and subsidy grant.
The projections for the global LPG industry continue to seem favorable. Markets for LPG
in emerging countries such as China, India and Brazil will expand as more people are
getting aware of LPG coupled with efficient infrastructure are added to proficiently
distribute and market the product. Global LPG consumption grew across various regional
markets such as Asia Pacific and Latin America owing to improvement in per capita LPG
consumption in some sector such as residential, commercial and industrial. In addition
rowing demand from automobile industry where it is used as auto-gas due to stringent
carbon dioxide (CO2) emission norms and government regulations expected to boom
market growth.
Owing to high calorific value, LPG is significantly used in household, commercial,
agricultural, industrial and manufacturing application. In addition LPG can also be used
for lighting, powering vehicles and cogeneration. Growing government initiative to
promote LPG as cooking fuel primarily in emerging economies such as India, China,
Indonesia and South Africa has been one of the key factors driving the global demand
for LPG. However, fluctuation in LPG raw material price such as pentane, butane and
ethane, insufficient CNG and LPG service stations infrastructure and a poor refueling
station network in developing nation expected as resistant for LPG market growth. In
addition capital-intensive nature of LPG projects coupled with long gestation period
Liquefied Petroleum Gas Market Analysis And Forecast
U n i v e r s i t y O f P e t r o l e u m A n d E n e r g y S t u d i e s
Page 5
considered to be another resistant for the market due to which investors are reluctant to
invest in LPG projects.
Table of Contents
CHAPTER 1 EXECUTIVE SUMMARY ............................................................................................... 10
CHAPTER 2 SCOPE AND RESEARCH METHODOLOGY .................................................................... 16
2.1 RESEARCH OBJECTIVE ......................................................................................................................... 16
2.1.1 Primary .................................................................................................................................... 16
2.1.2 Secondary objectives: .............................................................................................................. 16
2.2 RESEARCH SCOPE & ASSUMPTIONS ...................................................................................................... 17
2.3 LIST OF DATA SOURCES ...................................................................................................................... 17
2.4 LITERATURE REVIEW .......................................................................................................................... 17
2.4.1 LPG Industry Road Map ........................................................................................................... 18
2.4.2 World LPG Market Outlook ...................................................................................................... 18 2.4.2.1 Finding ............................................................................................................................................ 18
2.4.3 Oil in charge ............................................................................................................................. 18 2.4.3.1 Finding ............................................................................................................................................ 19
2.4.4 Natural gas: Analysis of change in market price ..................................................................... 19 2.4.4.1 GAO undertook a study to ............................................................................................................. 19 2.4.4.2 Finding ............................................................................................................................................ 19
2.4.5 Oil price volatility and U.S macroeconomic activity ................................................................. 20 2.4.5.1 Result: ............................................................................................................................................ 20
2.5 LIMITATION ..................................................................................................................................... 20
CHAPTER 3 LPG: INDUSTRY ANALYSIS .......................................................................................... 21
3.1 MARKET SEGMENTATION ................................................................................................................... 21
3.2 VALUE CHAIN ................................................................................................................................... 22
3.3 LIQUEFIED PETROLEUM GAS (LPG) – MARKET DYNAMICS ........................................................................ 23
3.4 MARKET DRIVER ANALYSIS .................................................................................................................. 24
3.4.1 Increasing demand for natural gas vehicles (NGV) .................................................................. 25
3.4.2 Shift towards replacing coal and wood as a domestic fuel ...................................................... 26
3.5 MARKET RESTRAINT ANALYSIS .............................................................................................................. 28
3.5.1 Volatility in raw material prices ............................................................................................... 28
3.1 INDUSTRY ANALYSIS – PORTER’S .......................................................................................................... 29
3.1.1 Bargaining power of suppliers ................................................................................................. 30
3.1.2 Bargaining power of buyers ..................................................................................................... 30
3.1.3 Threat of substitutes ................................................................................................................ 30
3.1.4 Threat of new entrants ............................................................................................................ 31
3.1.5 Degree of competition ............................................................................................................. 31
3.2 COMPANY MARKET SHARE ANALYSIS ..................................................................................................... 32
3.1 LPG INDUSTRY – PESTEL ANALYSIS ..................................................................................................... 33
CHAPTER 4 LPG :DATA ANALYSIS BY SOURCE ............................................................................... 34
4.1 LPG MARKET VOLUME SHARE BY SOURCE, 2013 & 2020 ........................................................................ 34
4.2 REFINERY ........................................................................................................................................ 35
Liquefied Petroleum Gas Market Analysis And Forecast
U n i v e r s i t y O f P e t r o l e u m A n d E n e r g y S t u d i e s
Page 6
4.2.1 Global refinery market volume and revenue, 2012-2020 ........................................................ 35
4.2.2 Global refinery market volume and revenue by region, 2012-2020 ........................................ 36
4.3 ASSOCIATED GAS .............................................................................................................................. 37
4.3.1 Global associated gas market volume and revenue, 2012-2020 ............................................. 37
4.3.2 Global associated gas market volume and revenue by region, 2012-2020 ............................ 38
4.4 NON ASSOCIATED GAS ........................................................................................................................ 39
4.4.1 Global non associated gas market volume and revenue, 2012-2020 ...................................... 39
4.4.2 Global Non associated gas market volume and revenue by region, 2012-2020...................... 40
CHAPTER 5 LPG : DATA ANALYSIS BY APPLICATION...................................................................... 41
5.1 LPG MARKET VOLUME SHARE BY APPLICATION, 2013 & 2020 ................................................................. 41
5.2 RESIDENTIAL/COMMERCIAL ................................................................................................................ 42
5.2.1 Global demand for LPG market from Residential/Commercial 2013-2020 ............................ 42
5.2.2 Global demand for LPG market from Residential/Commercial, by region, 2012-2020 .......... 43
5.3 CHEMICAL ....................................................................................................................................... 44
5.3.1 Global demand for LPG market from Chemical , 2012-2020 .................................................. 44
5.3.2 Global demand for LPG market from Chemical, by region, 2012-2020 .................................. 45
5.4 INDUSTRIAL ...................................................................................................................................... 46
5.4.1 Global demand for LPG market from Industrial, 2012-2020................................................... 46
5.4.2 Global demand for LPG market from Industrial, by region, 2012-2020 .................................. 47
5.5 AUTO FUEL ...................................................................................................................................... 48
5.5.1 Global demand for LPG market from auto fuel, 2012-2020 ................................................... 48
5.5.2 Global demand for LPG market from auto fuel, by region, 2012-2020 .................................. 49
5.6 REFINERY ........................................................................................................................................ 50
5.6.1 Global demand for LPG market from refinery, 2012-2020 ..................................................... 50
5.6.2 Global demand for LPG market from refinery, by region, 2012-2020 ..................................... 51
5.7 OTHER ............................................................................................................................................ 52
5.7.1 Global demand for LPG market from others, 2012-2020 ........................................................ 52
5.7.2 Global demand for LPG market from others, by region, 2012-2020 ....................................... 53
CHAPTER 6 LPG: DATA ANALYSIS BY REGIONAL ........................................................................... 54
6.1 LPG MARKET VOLUME SHARE BY REGION, 2013 & 2020 ........................................................................ 54
6.2 NORTH AMERICA .............................................................................................................................. 55
6.2.1 North America LPG market estimates and forecast, 2012-2020 ............................................ 55
6.2.2 North America LPG market estimate and forecast by source, 2012 – 2020 ........................... 55
6.2.3 North America LPG market, by application, 2012 – 2020 ....................................................... 56
6.3 EUROPE .......................................................................................................................................... 58
6.3.1 Europe LPG market estimates and forecast, 2012-2020 ........................................................ 58
6.3.1 Europe LPG market estimate and forecast by source, 2012 – 2020 ....................................... 59
6.3.2 Europe LPG market, by application, 2012 – 2020 ................................................................... 59
6.4 ASIA PACIFIC .................................................................................................................................... 61
6.4.1 Asia Pacific LPG market estimates and forecast, 2012-2020 .................................................. 61
6.4.2 Asia Pacific LPG market, by source, 2012 – 2020.................................................................... 62
6.4.3 Asia Pacific LPG market, by application, 2012 – 2020 ............................................................ 62
6.5 MIDDLE EAST & AFRICA ..................................................................................................................... 64
6.5.1 Middle East & Africa LPG market estimates and forecast, 2012-2020 ................................... 64
6.5.2 Middle East & Africa LPG market, by source, 2012 – 2020 ..................................................... 66
6.5.3 Middle East & Africa LPG market, by application, 2012 – 2020 ............................................. 67
Liquefied Petroleum Gas Market Analysis And Forecast
U n i v e r s i t y O f P e t r o l e u m A n d E n e r g y S t u d i e s
Page 7
6.6 LATIN AMERICA ................................................................................................................................ 68
6.6.1 Latin America LPG market estimates and forecast, 2012-2020 .............................................. 68
6.6.2 Latin America LPG market, by source, 2012 – 2020 ............................................................... 69
6.6.3 Latin America LPG market, by application, 2012 – 2020 ........................................................ 70
CHAPTER 7 COMPANY PROFILES .................................................................................................. 71
7.1 EXXONMOBIL ................................................................................................................................... 71
7.1.1 Company Overview .................................................................................................................. 71
7.1.2 Financial Performance ............................................................................................................. 71
7.1.3 Product Benchmarking ............................................................................................................ 71
7.1.4 Strategic Initiatives .................................................................................................................. 71
7.2 VALERO ENERGY CORPORATION........................................................................................................... 72
7.2.1 Company Overview .................................................................................................................. 72
7.2.2 Financial Performance ............................................................................................................. 72
7.2.3 Strategic Initiatives .................................................................................................................. 72
7.3 SINOPEC .......................................................................................................................................... 73
7.3.1 Company Overview .................................................................................................................. 73
7.3.2 Financial Performance ............................................................................................................. 73
7.3.3 Strategic Initiative .................................................................................................................... 73
7.4 BP PLC ........................................................................................................................................... 74
7.4.1 Company Overview .................................................................................................................. 74
7.4.2 Financial Performance ............................................................................................................. 74
7.4.3 Product Benchmarking ............................................................................................................ 74
7.4.4 Strategic Initiatives .................................................................................................................. 74
7.5 INDIAN OIL CORPORATION (IOCL) ....................................................................................................... 75
7.5.1 Company Overview .................................................................................................................. 75
7.5.2 Financial Performance ............................................................................................................. 75
7.5.3 Product Benchmarking ............................................................................................................ 75
7.5.4 Strategic Initiatives .................................................................................................................. 75
CHAPTER 8 CONCLUSION ............................................................................................................. 76
SHIFT TOWARDS REPLACING COAL AND WOOD AS A DOMESTIC FUEL ......................................................................... 76
Volatility in raw material prices ............................................................................................................ 76
CHAPTER 9 LIMITATION ............................................................................................................... 79
CHAPTER 10 BIBLIOGRAPHY ........................................................................................................... 80
List of Tables
TABLE 1 LIQUEFIED PETROLEUM GAS (LPG) – INDUSTRY SUMMARY & CRITICAL SUCCESS FACTORS (CSFS) ................... 10
TABLE 2 GLOBAL LIQUEFIED PETROLEUM GAS (LPG) MARKET: VOLUME, REVENUE, 2012 – 2020 ............................. 10
TABLE 3 GLOBAL LPG SOURCE MARKET: VOLUME (MILLION TONS), 2012 - 2020 .................................................. 11
TABLE 4 GLOBAL LPG SOURCE MARKET: REVENUE (USD BILLION) ......................................................................... 12
TABLE 5 GLOBAL LPG APPLICATION MARKET: VOLUME (MILLION TONS) ................................................................. 13
TABLE 6 GLOBAL LPG REGION MARKET: VOLUME (MILLION TONS), 2012 – 2020 .................................................. 14
TABLE 7 GLOBAL LPG REGION MARKET :REVENUE, (USD BILLION), 2012 – 2020 ................................................... 14
TABLE 8 LIQUEFIED PETROLEUM GAS (LPG) – KEY MARKET DRIVER IMPACT ............................................................. 24
TABLE 9 GLOBAL REFINERY MARKET: VOLUME(MILLION TONS) REVENUE(USD BILLION) ........................................... 35
Liquefied Petroleum Gas Market Analysis And Forecast
U n i v e r s i t y O f P e t r o l e u m A n d E n e r g y S t u d i e s
Page 8
TABLE 10 GLOBAL REFINERY MARKET BY REGION: VOLUME (MILLION TONS) ......................................................... 36
TABLE 11 GLOBAL REFINERY MARKET BY REGION : REVENUE(USD BILLION) ........................................................... 36
TABLE 12 GLOBAL ASSOCIATED GAS : VOLUME (MILLION TONS) AND REVENUE(USD BILLION) .................................. 37
TABLE 13 GLOBAL ASSOCIATED GAS BY REGION :VOLUME, (MILLION TONS) .......................................................... 38
TABLE 14 GLOBAL ASSOCIATED GAS BY REGION : REVENUE (USD BILLION) ............................................................ 38
TABLE 15 GLOBAL NON ASSOCIATED GAS :VOLUME (MILLION TONS) AND REVENUE(USD BILLION) ........................... 39
TABLE 16 GLOBAL NON ASSOCIATED GAS MARKET BY REGION: VOLUME(MILLION TONS) ......................................... 40
TABLE 17 GLOBAL NON ASSOCIATED GAS MARKET REVENUE BY REGION, 2012 – 2020 (USD BILLION) ...................... 40
TABLE 18 GLOBAL LPG APPLICATION RESIDENTIAL/COMMERCIAL........................................................................ 42
TABLE 19 GLOBAL APPLICATION OF LPG IN RESIDENTIAL/COMMERCIAL :VOLUME (MILLION TONS) ........................... 43
TABLE 20 GLOBAL APPLICATION OF LPG IN RESIDENTIAL/COMMERCIAL MARKET BY REGION: REVENUE (USD BILLION) . 43
TABLE 21 GLOBAL APPLICATION OF LPG IN CHEMICAL: VOLUME(MILLION TONS),REVENUE (USD BILLION) ................ 44
TABLE 22 GLOBAL APPLICATION OF LPG IN CHEMICAL INDUSTRY BY REGION: VOLUME (MILLION TONS) ..................... 45
TABLE 23 GLOBAL LPG MARKET REVENUE FROM CHEMICAL BY REGION, (USD BILLION) ......................................... 46
TABLE 24 GLOBAL APPLICATION OF LPG IN INDUSTRIAL (MILLION TONS) (USD BILLION) ....................................... 46
TABLE 25 GLOBAL LPG MARKET BY REGION: VOLUME (MILLION TONS) ............................................................. 47
TABLE 26 GLOBAL APPLICATION OF LPG IN INDUSTRY: REVENUE BY REGION (USD BILLION) ..................................... 47
TABLE 27 GLOBAL APPLICATION FOR LPG IN AUTO FUEL: VOLUME(MILLION TONS) REVENUE(USD BILLION ............... 48
TABLE 28 GLOBAL APPLICATION OF LPG IN AUTO FUEL : VOLUME BY REGION (MILLION TONS) ................................. 49
TABLE 29 GLOBAL APPLICATION IN LPG IN AUTO FUEL : REVENUE BY REGION (USD BILLION) ................................... 49
TABLE 30 GLOBAL APPLICATION OF LPG IN REFINERY: VOLUME (MILLION TONS) REVENUE(USD BILLION) ................. 50
TABLE 31 GLOBAL APPLICATION OF LPG IN REFINERY : VOLUME BY REGION, (MILLION TONS) ................................... 51
TABLE 32 GLOBAL LPG MARKET REVENUE FOR REFINERY BY REGION, 2012 – 2020 (USD BILLION) ......................... 51
TABLE 33 GLOBAL APPLICATION OF LPG IN OTHERS INDUSTRY: VOLUME (MILLION TONS) REVENUE(USD BILLION) ... 52
TABLE 34 GLOBAL APPLICATION LPG IN OTHERS INDUSTRY : VOLUME BY REGION, (MILLION TONS) .......................... 53
TABLE 35 GLOBAL APPLICATION OF LPG IN OTHERS INDUSTRY: REVENUE BY REGION (USD BILLION) ........................ 53
TABLE 36 NORTH AMERICA LPG DEMAND: VOLUME (MILLION TONS), REVENUE, (USD BILLION) ............................ 55
TABLE 37 NORTH AMERICA LPG MARKET BY SOURCE: VOLUME (MILLION TONS) .................................................. 55
TABLE 38 NORTH AMERICA LPG MARKET REVENUE BY SOURCE, (USD BILLION) .................................................... 56
TABLE 39 NORTH AMERICA LPG APPLICATION: VOLUME (MILLION TONS) ............................................................ 56
TABLE 40 NORTH AMERICA LPG APPLICATION: REVENUE (USD BILLION) ............................................................. 57
TABLE 41 EUROPE LPG MARKET DEMAND: VOLUME (MILLION TONS) AND REVENUE, (USD BILLION) ........................ 58
TABLE 42 EUROPE LPG SOURCE: VOLUME (MILLION TONS) .............................................................................. 59
TABLE 43 EUROPE LPG BY SOURCE: REVENUE (USD BILLION) ........................................................................... 59
TABLE 44 EUROPE LPG VOLUME BY APPLICATION, (MILLION TONS) .................................................................... 59
TABLE 45 EUROPE LPG MARKET REVENUE BY APPLICATION, (USD BILLION) .......................................................... 60
TABLE 46 ASIA PACIFIC LPG MARKET DEMAND IN VOLUME (MILLION TONS) AND REVENUE, (USD BILLION) ............... 61
TABLE 47 ASIA PACIFIC LPG SOURCE: VOLUME (MILLION TONS) ........................................................................ 62
TABLE 48 ASIA PACIFIC LPG SOURCE :REVENUE (USD BILLION) .......................................................................... 62
TABLE 49 ASIA PACIFIC LPG VOLUME BY APPLICATION, (MILLION TONS) ............................................................. 62
TABLE 50 ASIA PACIFIC LPG APPLICATION: REVENUE (USD BILLION) .................................................................. 63
TABLE 51 MIDDLE EAST & AFRICA LPG MARKET DEMAND, VOLUME (MILLION TONS) AND REVENUE, (USD BILLION) . 64
TABLE 52 MIDDLE EAST & AFRICA LPG SOURCE: VOLUME (MILLION TONS) ......................................................... 66
TABLE 53 MIDDLE EAST & AFRICA LPG SOURCE: REVENUE (USD BILLION) ......................................................... 66
TABLE 54 MIDDLE EAST & AFRICA LPG APPLICATION : VOLUME (MILLION TONS), ................................................. 67
TABLE 55 MIDDLE EAST & AFRICA LPG APPLICATION :REVENUE (USD BILLION) .................................................... 67
TABLE 56 LATIN AMERICA LPG MARKET DEMAND, VOLUME (MILLION TONS) AND REVENUE, (USD BILLION) 2012 –
2020, 68
Liquefied Petroleum Gas Market Analysis And Forecast
U n i v e r s i t y O f P e t r o l e u m A n d E n e r g y S t u d i e s
Page 9
TABLE 57 LATIN AMERICA LPG SOURCE : VOLUME (MILLION TONS) .................................................................... 69
TABLE 58 LATIN AMERICA LPG SOURCE : REVENUE (USD BILLION) .................................................................... 69
TABLE 59 LATIN AMERICA LPG APPLICATION: VOLUME (MILLION TONS) .............................................................. 70
TABLE 60 LATIN AMERICA LPG APPLICATION : REVENUE (USD BILLION) ............................................................... 70
List of Figures
FIG. 1 LPG MARKET SEGMENTATION ............................................................................................................. 21
FIG. 2 LPG MARKET-VALUE CHAIN ............................................................................................................... 22
FIG. 3 LPG MARKET-MARKET DYNAMICS ........................................................................................................ 23
FIG. 4 GLOBAL AUTO GAS VEHICLES, 2008-2012 (MILLION UNITS) ..................................................................... 26
FIG. 5 GLOBAL BLACK CARBON EMISSION, BY SECTOR ........................................................................................ 27
FIG. 6 HISTORICAL AND FORECAST VALUE(1970-2035) .................................................................................... 28
FIG. 7 LPG MARKET-PORTER’S ANALYSIS ....................................................................................................... 29
FIG. 8 LPG MARKET-COMPANY SHARE ANALYSIS ............................................................................................. 32
FIG. 9 LPG MARKET-PESTEL ANALYSIS ......................................................................................................... 33
FIG. 10 LPG MARKET VOLUME SHARE BY SOURCE, 2013 & 2020 ........................................................................ 34
FIG. 11 LPG MARKET VOLUME SHARE BY APPLICATION, 2013 & 2020 ................................................................ 41
FIG. 12 LPG CONSUMPTION IN PETROCHEMICAL PLANT ....................................................................................... 44
FIG. 13 LPG MARKET VOLUME SHARE BY REGION, 2013 & 2020 ........................................................................ 54
FIG. 14 LPG PRODUCTION FROM NON-ASSOCIATED GAS WELL .............................................................................. 64
FIG. 15 NATURAL GAS PRODUCTION ................................................................................................................ 65
Liquefied Petroleum Gas Market Analysis And Forecast
U n i v e r s i t y O f P e t r o l e u m A n d E n e r g y S t u d i e s
Page 10
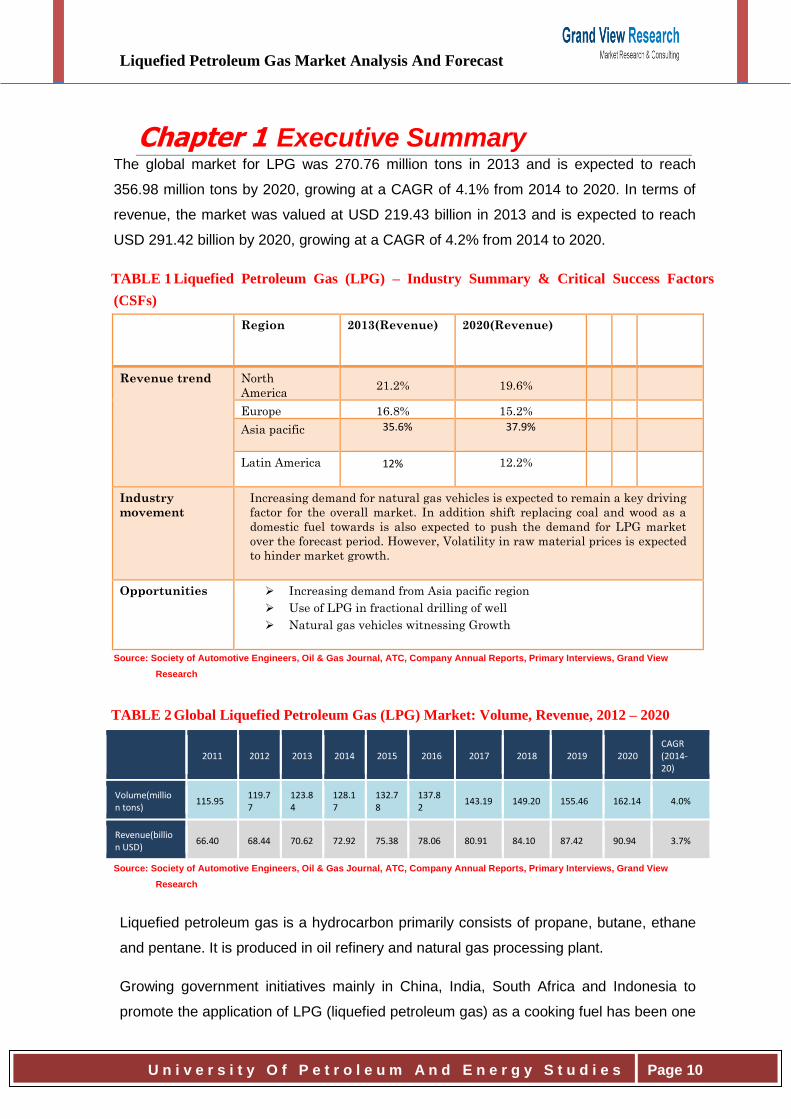
Chapter 1 Executive Summary The global market for LPG was 270.76 million tons in 2013 and is expected to reach
356.98 million tons by 2020, growing at a CAGR of 4.1% from 2014 to 2020. In terms of
revenue, the market was valued at USD 219.43 billion in 2013 and is expected to reach
USD 291.42 billion by 2020, growing at a CAGR of 4.2% from 2014 to 2020.
TABLE 1 Liquefied Petroleum Gas (LPG) – Industry Summary & Critical Success Factors
(CSFs)
Region 2013(Revenue) 2020(Revenue)
Revenue trend North
America 21.2% 19.6%
Europe 16.8% 15.2%
Asia pacific 35.6%
37.9%
Latin America
12%
12.2%
Industry
movement
Increasing demand for natural gas vehicles is expected to remain a key driving
factor for the overall market. In addition shift replacing coal and wood as a
domestic fuel towards is also expected to push the demand for LPG market
over the forecast period. However, Volatility in raw material prices is expected
to hinder market growth.
Opportunities Increasing demand from Asia pacific region
Use of LPG in fractional drilling of well
Natural gas vehicles witnessing Growth
Source: Society of Automotive Engineers, Oil & Gas Journal, ATC, Company Annual Reports, Primary Interviews, Grand View
Research
TABLE 2 Global Liquefied Petroleum Gas (LPG) Market: Volume, Revenue, 2012 – 2020
2011 2012 2013 2014 2015 2016 2017 2018 2019 2020
CAGR (2014-20)
Volume(million tons)
115.95 119.77
123.84
128.17
132.78
137.82
143.19 149.20 155.46 162.14 4.0%
Revenue(billion USD)
66.40 68.44 70.62 72.92 75.38 78.06 80.91 84.10 87.42 90.94 3.7%
Source: Society of Automotive Engineers, Oil & Gas Journal, ATC, Company Annual Reports, Primary Interviews, Grand View
Research
Liquefied petroleum gas is a hydrocarbon primarily consists of propane, butane, ethane
and pentane. It is produced in oil refinery and natural gas processing plant.
Growing government initiatives mainly in China, India, South Africa and Indonesia to
promote the application of LPG (liquefied petroleum gas) as a cooking fuel has been one
Liquefied Petroleum Gas Market Analysis And Forecast
U n i v e r s i t y O f P e t r o l e u m A n d E n e r g y S t u d i e s
Page 11
of the major factors driving the global demand for LPG. Coal is a majorly used fuel used
for cooking in developing and underdeveloped countries owing to its availability and low
price. LPG is consider to be a clean cooking fuel when compared with coal and in order
to reduce harmful emission caused due ignition of coal, governments of various nations
including India are offering LPG cylinders at subsidized rates to the consumers. In
addition to increasing usage of LPG as a cooking fuel, LPG is also gaining popularity as
a transportation fuel. LPG as a transportation fuel offer low cost and environmental
friendly solution when compared with gasoline and diesel. With increase in oil and gas
demand, LPG production is also rising, making it available in surplus amount. In addition,
shale gas development especially in the U.S. and China is leading to oversupply of LPG
in the global market. LPG production is expected to increase majorly from processing of
non-associated conventional gas, while production from associated gas is expected to
grow at a comparatively slower rate.
LPG market expected to excel and possess a lot of key opportunity as use of LPG as
auto fuel is widely in use. The several factor driving the demand for natural gas powered
vehicle. The first and most is high cost of petroleum based fuels, such as petrol and
diesel. An individual can reduce their annual fuel costs by switching to natural gas. The
second factor promoting demand of NGVs is growing importance toward maintaining
national security and saving economy from global oil price risks. The third factor
promoting NGVs demand is that NGVs is environment friendly owing to natural gas is
clean burning gas than gasoline and HSD. Therefore vehicles using natural as their fuel
produce less nitrogen oxide, particulates and carbon dioxide per mile traveled.
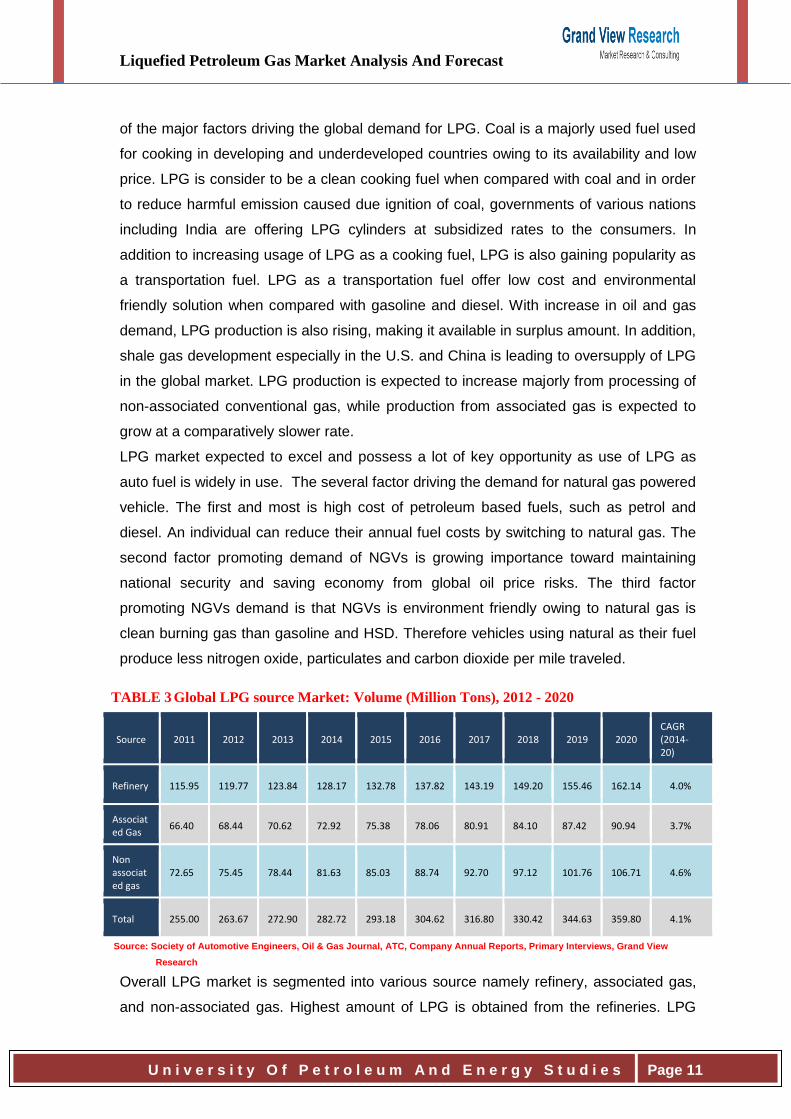
TABLE 3 Global LPG source Market: Volume (Million Tons), 2012 - 2020
Source 2011 2012 2013 2014 2015 2016 2017 2018 2019 2020 CAGR (2014-20)
Refinery 115.95 119.77 123.84 128.17 132.78 137.82 143.19 149.20 155.46 162.14 4.0%
Associated Gas
66.40 68.44 70.62 72.92 75.38 78.06 80.91 84.10 87.42 90.94 3.7%
Non associated gas
72.65 75.45 78.44 81.63 85.03 88.74 92.70 97.12 101.76 106.71 4.6%
Total 255.00 263.67 272.90 282.72 293.18 304.62 316.80 330.42 344.63 359.80 4.1%
Source: Society of Automotive Engineers, Oil & Gas Journal, ATC, Company Annual Reports, Primary Interviews, Grand View
Research
Overall LPG market is segmented into various source namely refinery, associated gas,
and non-associated gas. Highest amount of LPG is obtained from the refineries. LPG
Liquefied Petroleum Gas Market Analysis And Forecast
U n i v e r s i t y O f P e t r o l e u m A n d E n e r g y S t u d i e s
Page 12
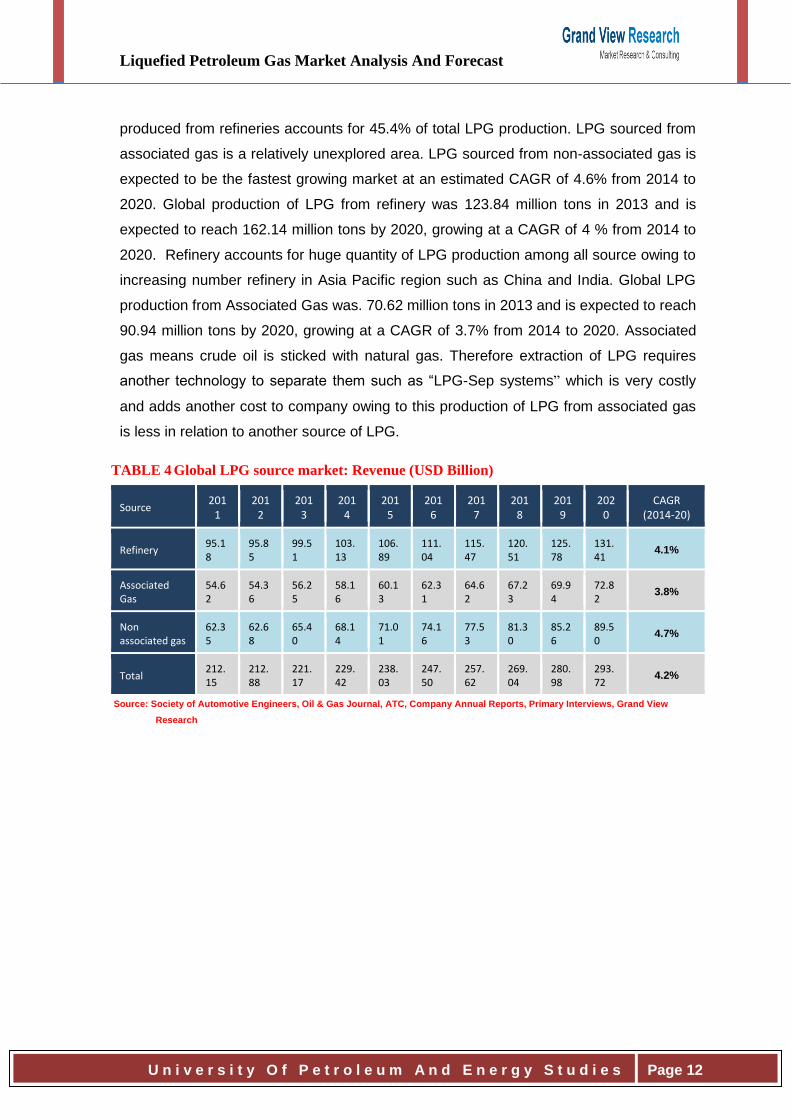
produced from refineries accounts for 45.4% of total LPG production. LPG sourced from
associated gas is a relatively unexplored area. LPG sourced from non-associated gas is
expected to be the fastest growing market at an estimated CAGR of 4.6% from 2014 to
2020. Global production of LPG from refinery was 123.84 million tons in 2013 and is
expected to reach 162.14 million tons by 2020, growing at a CAGR of 4 % from 2014 to
2020. Refinery accounts for huge quantity of LPG production among all source owing to
increasing number refinery in Asia Pacific region such as China and India. Global LPG
production from Associated Gas was. 70.62 million tons in 2013 and is expected to reach
90.94 million tons by 2020, growing at a CAGR of 3.7% from 2014 to 2020. Associated
gas means crude oil is sticked with natural gas. Therefore extraction of LPG requires
another technology to separate them such as “LPG-Sep systems” which is very costly
and adds another cost to company owing to this production of LPG from associated gas
is less in relation to another source of LPG.
TABLE 4 Global LPG source market: Revenue (USD Billion)
Source 201
1 201
2 201
3 201
4 201
5 201
6 201
7 201
8 201
9 202
0 CAGR
(2014-20)
Refinery 95.18
95.85
99.51
103.13
106.89
111.04
115.47
120.51
125.78
131.41
4.1%
Associated Gas
54.62
54.36
56.25
58.16
60.13
62.31
64.62
67.23
69.94
72.82
3.8%
Non associated gas
62.35
62.68
65.40
68.14
71.01
74.16
77.53
81.30
85.26
89.50
4.7%
Total 212.15
212.88
221.17
229.42
238.03
247.50
257.62
269.04
280.98
293.72
4.2%
Source: Society of Automotive Engineers, Oil & Gas Journal, ATC, Company Annual Reports, Primary Interviews, Grand View
Research
Liquefied Petroleum Gas Market Analysis And Forecast
U n i v e r s i t y O f P e t r o l e u m A n d E n e r g y S t u d i e s
Page 13
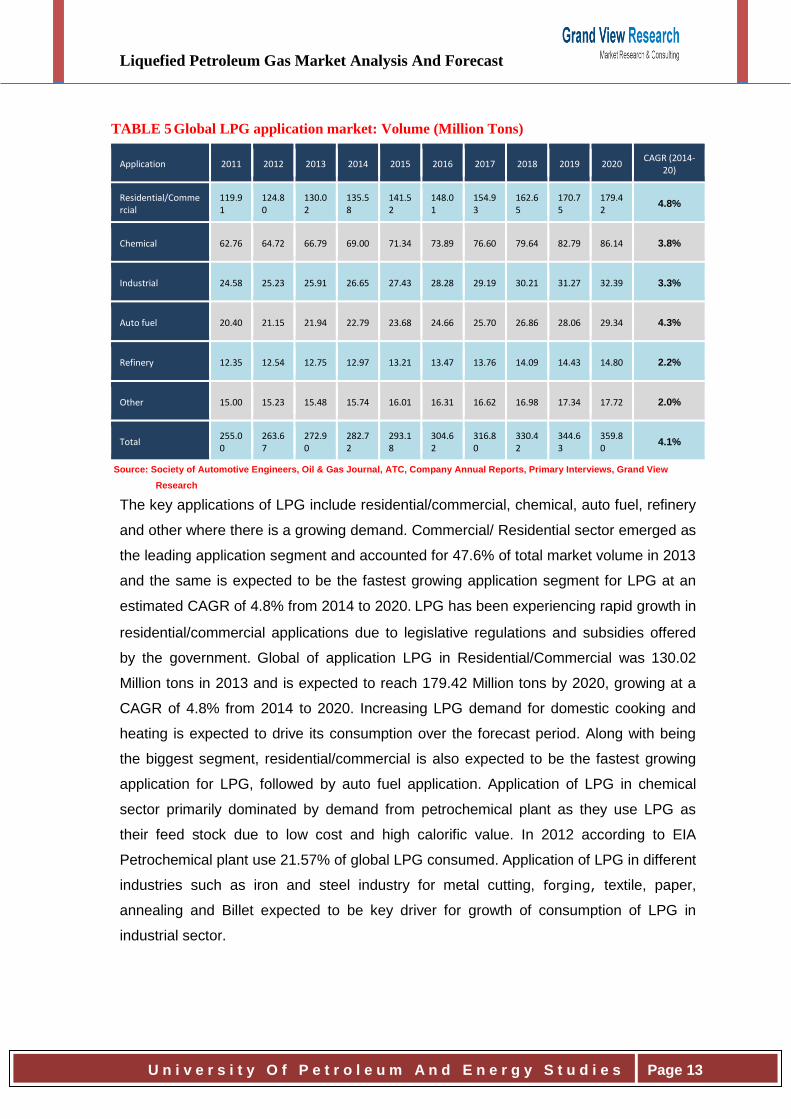
TABLE 5 Global LPG application market: Volume (Million Tons)
Application 2011 2012 2013 2014 2015 2016 2017 2018 2019 2020 CAGR (2014-
20)
Residential/Commercial
119.91
124.80
130.02
135.58
141.52
148.01
154.93
162.65
170.75
179.42
4.8%
Chemical 62.76 64.72 66.79 69.00 71.34 73.89 76.60 79.64 82.79 86.14 3.8%
Industrial 24.58 25.23 25.91 26.65 27.43 28.28 29.19 30.21 31.27 32.39 3.3%
Auto fuel 20.40 21.15 21.94 22.79 23.68 24.66 25.70 26.86 28.06 29.34 4.3%
Refinery 12.35 12.54 12.75 12.97 13.21 13.47 13.76 14.09 14.43 14.80 2.2%
Other 15.00 15.23 15.48 15.74 16.01 16.31 16.62 16.98 17.34 17.72 2.0%
Total 255.00
263.67
272.90
282.72
293.18
304.62
316.80
330.42
344.63
359.80
4.1%
Source: Society of Automotive Engineers, Oil & Gas Journal, ATC, Company Annual Reports, Primary Interviews, Grand View
Research
The key applications of LPG include residential/commercial, chemical, auto fuel, refinery
and other where there is a growing demand. Commercial/ Residential sector emerged as
the leading application segment and accounted for 47.6% of total market volume in 2013
and the same is expected to be the fastest growing application segment for LPG at an
estimated CAGR of 4.8% from 2014 to 2020. LPG has been experiencing rapid growth in
residential/commercial applications due to legislative regulations and subsidies offered
by the government. Global of application LPG in Residential/Commercial was 130.02
Million tons in 2013 and is expected to reach 179.42 Million tons by 2020, growing at a
CAGR of 4.8% from 2014 to 2020. Increasing LPG demand for domestic cooking and
heating is expected to drive its consumption over the forecast period. Along with being
the biggest segment, residential/commercial is also expected to be the fastest growing
application for LPG, followed by auto fuel application. Application of LPG in chemical
sector primarily dominated by demand from petrochemical plant as they use LPG as
their feed stock due to low cost and high calorific value. In 2012 according to EIA
Petrochemical plant use 21.57% of global LPG consumed. Application of LPG in different
industries such as iron and steel industry for metal cutting, forging, textile, paper,
annealing and Billet expected to be key driver for growth of consumption of LPG in
industrial sector.
Liquefied Petroleum Gas Market Analysis And Forecast
U n i v e r s i t y O f P e t r o l e u m A n d E n e r g y S t u d i e s
Page 14
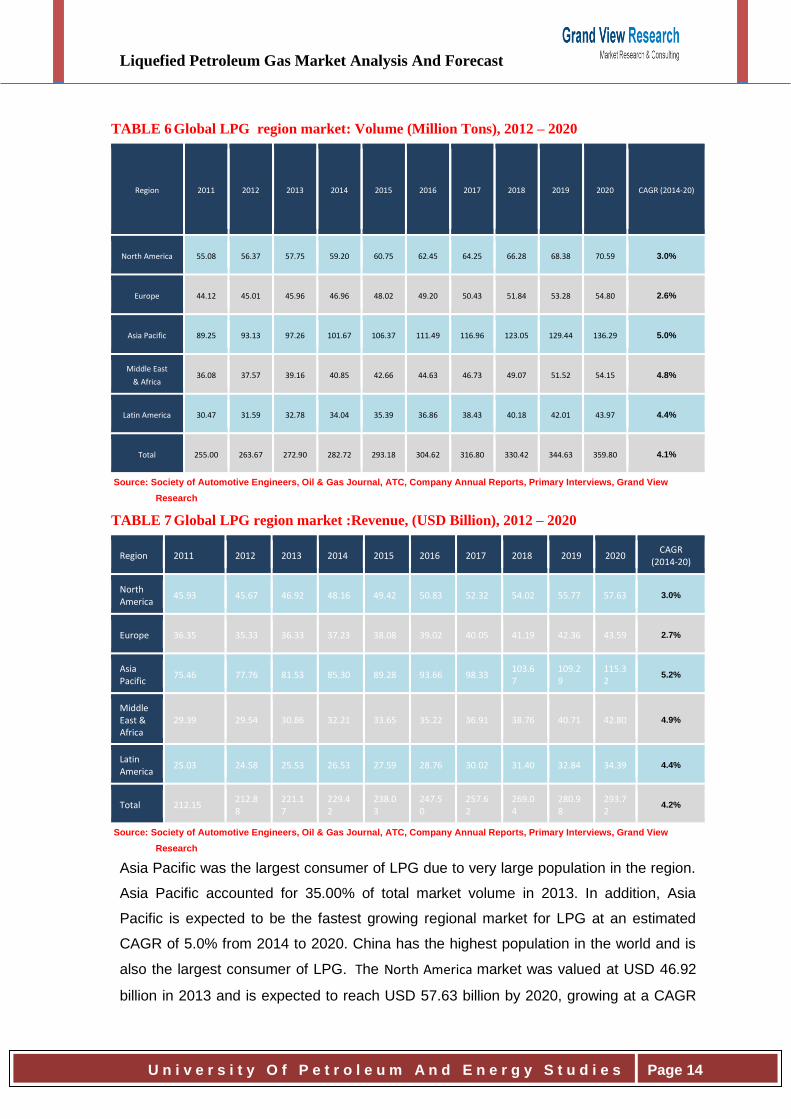
TABLE 6 Global LPG region market: Volume (Million Tons), 2012 – 2020
Region 2011 2012 2013 2014 2015 2016 2017 2018 2019 2020 CAGR (2014-20)
North America 55.08 56.37 57.75 59.20 60.75 62.45 64.25 66.28 68.38 70.59 3.0%
Europe 44.12 45.01 45.96 46.96 48.02 49.20 50.43 51.84 53.28 54.80 2.6%
Asia Pacific 89.25 93.13 97.26 101.67 106.37 111.49 116.96 123.05 129.44 136.29 5.0%
Middle East
& Africa 36.08 37.57 39.16 40.85 42.66 44.63 46.73 49.07 51.52 54.15 4.8%
Latin America 30.47 31.59 32.78 34.04 35.39 36.86 38.43 40.18 42.01 43.97 4.4%
Total 255.00 263.67 272.90 282.72 293.18 304.62 316.80 330.42 344.63 359.80 4.1%
Source: Society of Automotive Engineers, Oil & Gas Journal, ATC, Company Annual Reports, Primary Interviews, Grand View
Research
TABLE 7 Global LPG region market :Revenue, (USD Billion), 2012 – 2020
Region 2011 2012 2013 2014 2015 2016 2017 2018 2019 2020 CAGR
(2014-20)
North America
45.93 45.67 46.92 48.16 49.42 50.83 52.32 54.02 55.77 57.63 3.0%
Europe 36.35 35.33 36.33 37.23 38.08 39.02 40.05 41.19 42.36 43.59 2.7%
Asia Pacific
75.46 77.76 81.53 85.30 89.28 93.66 98.33 103.67
109.29
115.32
5.2%
Middle East & Africa
29.39 29.54 30.86 32.21 33.65 35.22 36.91 38.76 40.71 42.80 4.9%
Latin America
25.03 24.58 25.53 26.53 27.59 28.76 30.02 31.40 32.84 34.39 4.4%
Total 212.15 212.88
221.17
229.42
238.03
247.50
257.62
269.04
280.98
293.72
4.2%
Source: Society of Automotive Engineers, Oil & Gas Journal, ATC, Company Annual Reports, Primary Interviews, Grand View
Research
Asia Pacific was the largest consumer of LPG due to very large population in the region.
Asia Pacific accounted for 35.00% of total market volume in 2013. In addition, Asia
Pacific is expected to be the fastest growing regional market for LPG at an estimated
CAGR of 5.0% from 2014 to 2020. China has the highest population in the world and is
also the largest consumer of LPG. The North America market was valued at USD 46.92
billion in 2013 and is expected to reach USD 57.63 billion by 2020, growing at a CAGR
Liquefied Petroleum Gas Market Analysis And Forecast
U n i v e r s i t y O f P e t r o l e u m A n d E n e r g y S t u d i e s
Page 15
of 3.0% from 2014 to 2020. Production of LPG in the US has been growing owing to
evolution of shale gas coupled with development in domestic natural gas resource base.
It is estimated by EIA that US has largest reserve of Shale gas and first time in 40 year.
The USA becomes net exporter of LPG. Therefore in the first 11 months of 2012, the
daily LPG shipments were 194,000 barrels in comparison to imports which stood at
169,700 barrels. In addition the US has largest number of refinery which is a big source
of propane. . Among all regional market Europe has least consumption of LPG in 2013
and expected to show slowest CAGR growth rate in 2020. However, Implementation of
stringent environmental regulation coupled with aim of European counties to deduce
pollution level up to 20% till 2020 expected to increase the demand of LPG. Additionally
in order to excel the LPG based vehicle in Europe many European cities such as Milan,
London provide exemption from congestion charges. In terms of revenue, the market
was valued at USD 30.86 billion in 2013 and is expected to reach USD 42.80billion by
2020, growing at a CAGR of 4.9% from 2014 to 2020. In Middle East and Africa LPG
production primarily comes from non-associated gas key counties such as Qatar and
UAE has largest reserve of natural gas. The Middle East is a key source of LPG and
produces ~54 MTPA in 2013
Liquefied Petroleum Gas Market Analysis And Forecast
U n i v e r s i t y O f P e t r o l e u m A n d E n e r g y S t u d i e s
Page 16
Chapter 2 Scope And Research Methodology My entire report is based on secondary research which comprises extensive data mining,
referring to verified data sources such as independent studies, government and
regulatory published material, technical journals, oil and gas magazines paid data
sources such as IHS and so on.
2.1 Research objective
2.1.1 Primary
To estimate and forecast expected market size and growth trends for 2014 to
2020
To know companies which were leaders in 2012 and their respective strategic
initiatives taken by them.
To understand and estimates opportunities available to LPG companies and
other contender in this space.
To know the barriers and opportunities in the LPG market
To know top performing source segment in 2013 and forecast performance of
these segment in 2020.
To know top performing application segment in 2013 and forecast performance
of these segment in 2020
To know top-performing regional markets in 2013 and forecast performance of
different region in 2020.
2.1.2 Secondary objectives:
Gain professional experience
To learn skills such as: Analytical skill, Formatting, Data interpretation etc.
Liquefied Petroleum Gas Market Analysis And Forecast
U n i v e r s i t y O f P e t r o l e u m A n d E n e r g y S t u d i e s
Page 17
2.2 Research Scope & Assumptions
The report provides market volume and revenue for base year 2013 and a yearly
forecast to 2020 in terms of volume (Million Tons) and revenue (USD billion). Market for
each application has been provided on a regional basis for the above mentioned forecast
period.
Key industry dynamics, regulatory scenario, major technological trends and application
markets are evaluated to understand their impact on demand for the forecast period.
Growth rates are estimated using correlation, regression and time-series analysis.
We have used a bottom-up approach for market sizing, analyzing key regional markets,
dynamics and trends for various applications. Global market is estimated by integrating
regional markets.
All market estimates and industry analysis is then validated through exhaustive primary
research with key industry participants and consumers.
2.3 List of Data Sources
List of secondary sources include but are not limited to:
Oil and Gas Journal
ICIS
World LP Gas Association
Platts
U.S. Energy Information Administration
U.S. Department of Energy (DOE)x
2.4 Literature Review
There is adequate literature available in relating to the report. Extensive usage has been
made of all the available literature for the information. The books on oil and gas
understanding published by UPES, Energy hedging in Asia by PETER C. FUSARO and
others provide me great help in understanding the concept of petroleum extraction
methodology and forecasting of pricing. In addition to this various report published by
EIA, Argus, ICF International and OPIS Europe has been extensively used. For further
understanding of the concept many research papers both international as well as
national will be studied. These research papers are very helpful as they bring the clarity
about the topics. They help in showing the correct direction for the project work and how
Liquefied Petroleum Gas Market Analysis And Forecast
U n i v e r s i t y O f P e t r o l e u m A n d E n e r g y S t u d i e s
Page 18
one shall proceed with it. Over the study of different research papers, it has been found
that every paper has different aspect to work out, as the papers are written on problems
faced by importers, refiners, producers due to price volatility.
2.4.1 LPG Industry Road Map
Date- 2009
Published by the AEGPL
This report primarily focus on European energy mix in which LPG’s advantages play an
increasingly significant role. In addition, this report identifies impact of LPG on
environment and health of human being, contribution of LPG in social and economic
development of Europe, area of high growth for LPG and lastly it discuss some of the
concrete measure to ensures that LPG potential turn into reality
2.4.2 World LPG Market Outlook
Published by: IHS (Purvin & Gertz)
This report provides an in-depth analysis of the world and regional LPG markets,
detailed market analysis and cover more than 50 major country markets, detailed
analysis of Profitability relating to various segments of the LPG industry which is
compared on regional basis considering few key countries. The report studies and
forecast LPG supply by source and location, LPG by end-use application, global/regional
trade and LPG pricing. The outlook for future international LPG supplies is developed
both on a source (natural gas, refineries) and a regional basis.
2 . 4 . 2 . 1 F i n d i n g
Demand of LPG in south East Asia has grown than LPG supplies in the region.
The outlook for future international LPG supplies is developed both on a source
(natural gas, refineries) and a regional basis.
2.4.3 Oil in charge
Author- ABE COFNAS
This research paper is about effect of price volatility in oil exporting and
importing countries.
Effect of price volatility on developing and developed countries.
Analysis of “Impact of high oil price on the global economy ‘in May 2004
Liquefied Petroleum Gas Market Analysis And Forecast
U n i v e r s i t y O f P e t r o l e u m A n d E n e r g y S t u d i e s
Page 19
2 . 4 . 3 . 1 F i n d i n g
Economy of developing countries like Asia, Africa is affected because their
economy depend more on imported oil.
Oil importing countries uses more than twice petroleum product to produce
one unit of output than developed countries.
US economy less effected by price hike because one and another way there
dollar return to them.
The elements of energy markets likely to impact future price volatility, and
forecast expected energy price volatility between today and 2020 is discussed
2.4.4 Natural gas: Analysis of change in market price
Author –GAO
Date – Dec 2002
No .of page- 97
Why did GAO do this survey?
During the winter of 2000-2001, the wholesale price of natural gas peaked at a level four
times greater than its usual level.
Responding to the congressional interest and concern caused by these high prices,
2 . 4 . 4 . 1 G A O u n d e r t o o k a s t u d y t o
Factors that influence natural gas price volatility and the high prices of 2000-
2001;
Federal government’s role in ensuring that natural gas prices are determined in a
competitive, informed market place
Choices available to gas utility companies that want to mitigate the effects of
price spikes on their residential customers.
2 . 4 . 4 . 2 F i n d i n g
Price spikes occur periodically in natural gas markets because supplies cannot
quickly adjust to demand changes.
While market forces make natural gas prices susceptible to price volatility,
investigations are underway to determine if natural gas prices were manipulated
in the Western United States during the winter of 2000-2001.
Liquefied Petroleum Gas Market Analysis And Forecast
U n i v e r s i t y O f P e t r o l e u m A n d E n e r g y S t u d i e s
Page 20
2.4.5 Oil price volatility and U.S macroeconomic activity
Author- Hui GUA and Kevin L. Kliesen
Place- St. Lousis
No of pages-16
This research paper distinguishes two most important channel through which change in
oil price affect aggregate economic activities.
I. The change in the dollar price of crude oil
II. The uncertain future price.
2 . 4 . 5 . 1 R e s u l t :
Oil price volatility has negative and significant effect on future GDP growth.
This volatility effect becomes more significant after we control oil price change.
Both the oil price change and its volatility lose their significance after we control
nonlinear oil shock measure
2.5 Limitation
1. Data is collected from secondary sources so there are chances of error.
2. The strategies have to be implemented in real market conditions to find out their
efficacy.
3. Availability of time and budget constraints.
4. Technical analysis is used to forecast LPG prices but sometimes it may not yield
effective results.
Liquefied Petroleum Gas Market Analysis And Forecast
U n i v e r s i t y O f P e t r o l e u m A n d E n e r g y S t u d i e s
Page 21
Chapter 3 LPG: Industry Analysis
3.1 Market Segmentation
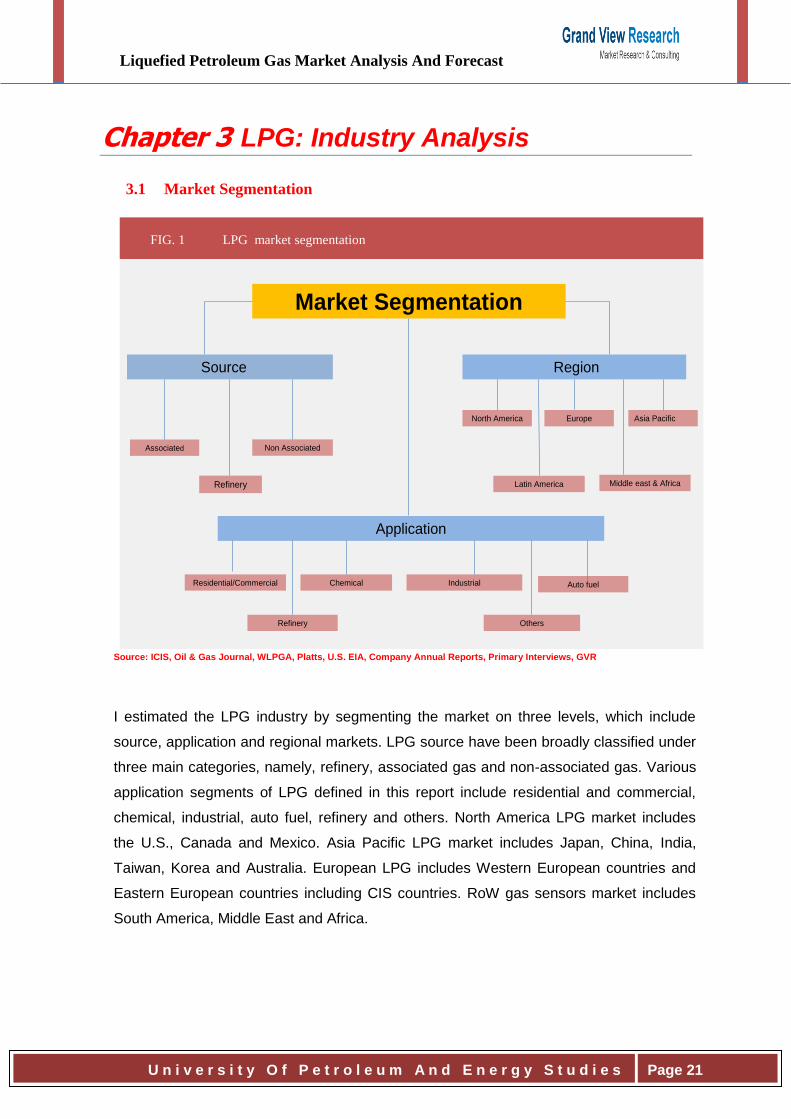
FIG. 1 LPG market segmentation
Source: ICIS, Oil & Gas Journal, WLPGA, Platts, U.S. EIA, Company Annual Reports, Primary Interviews, GVR
I estimated the LPG industry by segmenting the market on three levels, which include
source, application and regional markets. LPG source have been broadly classified under
three main categories, namely, refinery, associated gas and non-associated gas. Various
application segments of LPG defined in this report include residential and commercial,
chemical, industrial, auto fuel, refinery and others. North America LPG market includes
the U.S., Canada and Mexico. Asia Pacific LPG market includes Japan, China, India,
Taiwan, Korea and Australia. European LPG includes Western European countries and
Eastern European countries including CIS countries. RoW gas sensors market includes
South America, Middle East and Africa.
Auto fuel
Market Segmentation
Source Region
Application
Non Associated
Refinery
Associated
Asia PacificEuropeNorth America
Chemical
Others
Industrial
Middle east & AfricaLatin America
Refinery
Residential/Commercial
Liquefied Petroleum Gas Market Analysis And Forecast
U n i v e r s i t y O f P e t r o l e u m A n d E n e r g y S t u d i e s
Page 22
3.2 Value Chain
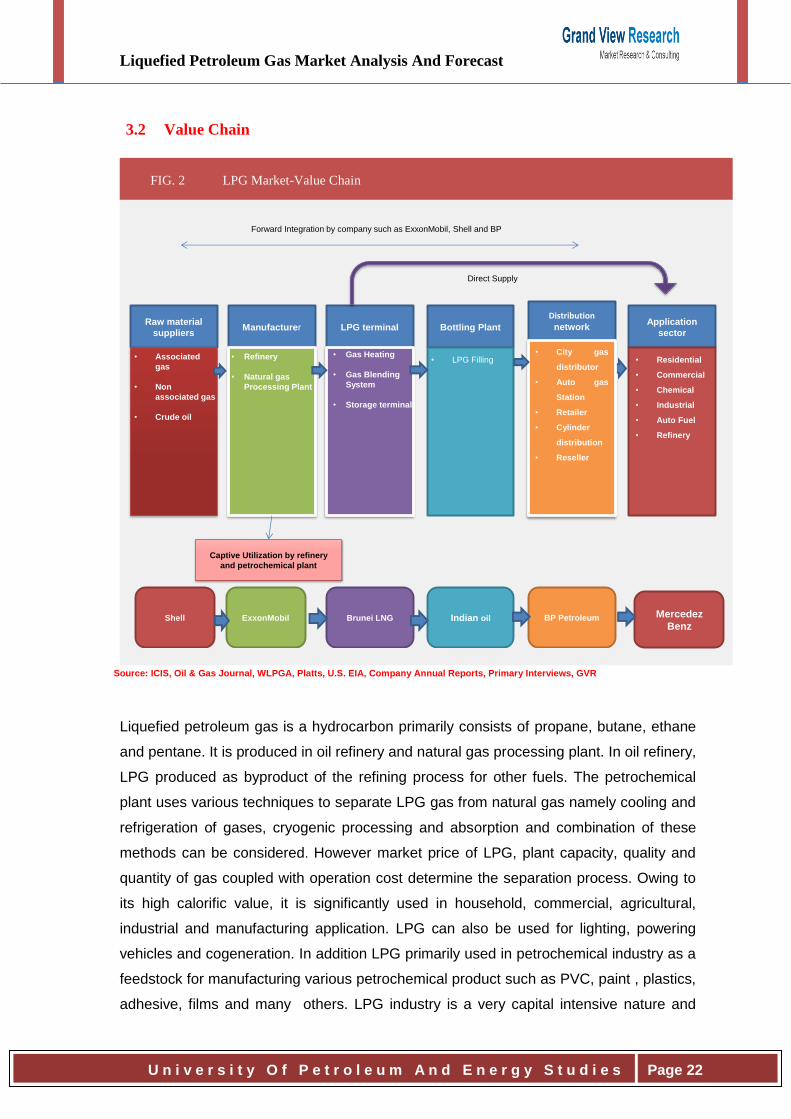
FIG. 2 LPG Market-Value Chain
Source: ICIS, Oil & Gas Journal, WLPGA, Platts, U.S. EIA, Company Annual Reports, Primary Interviews, GVR
Liquefied petroleum gas is a hydrocarbon primarily consists of propane, butane, ethane
and pentane. It is produced in oil refinery and natural gas processing plant. In oil refinery,
LPG produced as byproduct of the refining process for other fuels. The petrochemical
plant uses various techniques to separate LPG gas from natural gas namely cooling and
refrigeration of gases, cryogenic processing and absorption and combination of these
methods can be considered. However market price of LPG, plant capacity, quality and
quantity of gas coupled with operation cost determine the separation process. Owing to
its high calorific value, it is significantly used in household, commercial, agricultural,
industrial and manufacturing application. LPG can also be used for lighting, powering
vehicles and cogeneration. In addition LPG primarily used in petrochemical industry as a
feedstock for manufacturing various petrochemical product such as PVC, paint , plastics,
adhesive, films and many others. LPG industry is a very capital intensive nature and
ExxonMobil
Raw material
suppliersManufacturer LPG terminal Bottling Plant
Application
sector
Shell Brunei LNG Indian oil BP Petroleum
Direct Supply
• Refinery
• Natural gas
Processing Plant
• Associated
gas
• Non
associated gas
• Crude oil
• LPG Filling • Residential
• Commercial
• Chemical
• Industrial
• Auto Fuel
• Refinery
Distribution network
• City gas
distributor
• Auto gas
Station
• Retailer
• Cylinder
distribution
• Reseller
• Gas Heating
• Gas Blending
System
• Storage terminal
Forward Integration by company such as ExxonMobil, Shell and BP
Captive Utilization by refinery
and petrochemical plant
Mercedez
Benz
Liquefied Petroleum Gas Market Analysis And Forecast
U n i v e r s i t y O f P e t r o l e u m A n d E n e r g y S t u d i e s
Page 23
majorly dominated by big players such as ExxonMobil, Chevron, BP, Indian Oil
Corporation and shell. These are some companies present across the value chain as
well as uses LPG for their captive consumption.
Transportation of LPG is broadly classified into two segment namely upstream
transportation and downstream transportation. Upstream transportation includes
transportation of LPG from refinery to filling center or storage center. The downstream
transportation comprises transportation of LPG from storage center to bottling center.
The selection of mode of transportation depends on quantity, time and connectivity mode
available. Usually train, ships, trucks and pipeline are use as mode of transportation.
Companies such as Indian Oil, Shell are available at all level of transportation.
3.3 Liquefied Petroleum Gas (LPG) – Market Dynamics
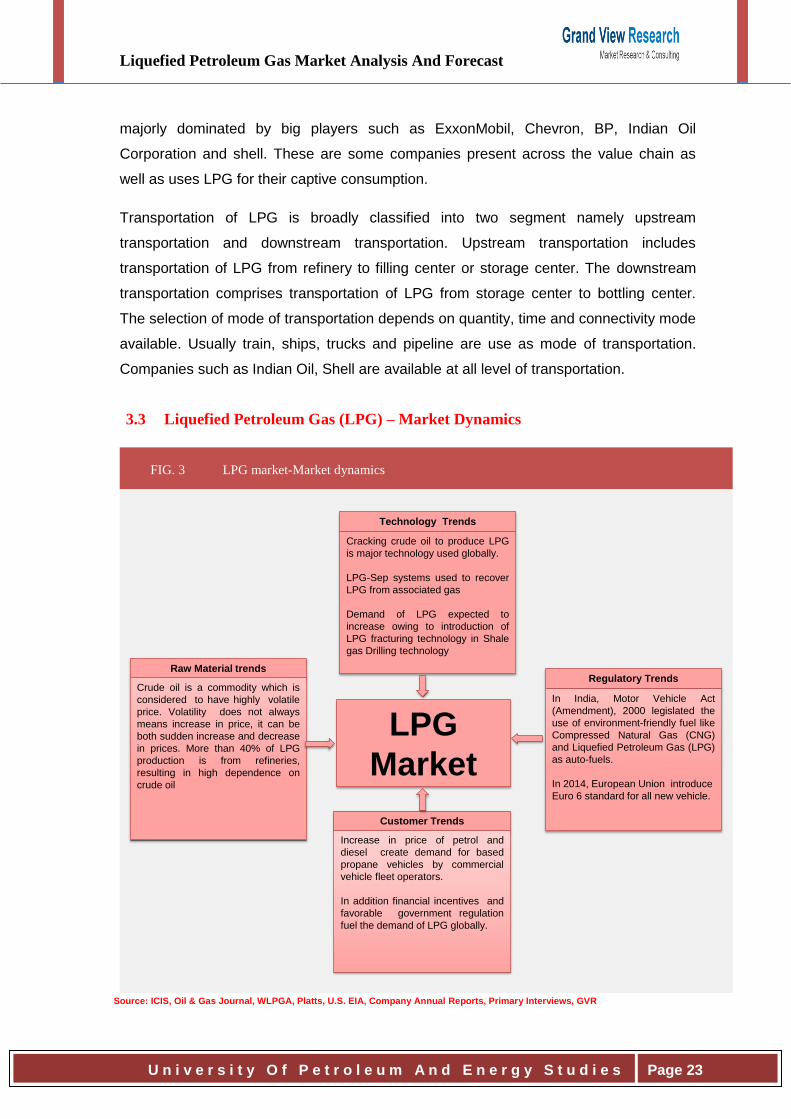
FIG. 3 LPG market-Market dynamics
Source: ICIS, Oil & Gas Journal, WLPGA, Platts, U.S. EIA, Company Annual Reports, Primary Interviews, GVR
Technology Trends
Cracking crude oil to produce LPG
is major technology used globally.
LPG-Sep systems used to recover
LPG from associated gas
Demand of LPG expected to
increase owing to introduction of
LPG fracturing technology in Shale
gas Drilling technology
Raw Material trends
Crude oil is a commodity which is
considered to have highly volatile
price. Volatility does not always
means increase in price, it can be
both sudden increase and decrease
in prices. More than 40% of LPG
production is from refineries,
resulting in high dependence on
crude oil
Regulatory Trends
In India, Motor Vehicle Act
(Amendment), 2000 legislated the
use of environment-friendly fuel like
Compressed Natural Gas (CNG)
and Liquefied Petroleum Gas (LPG)
as auto-fuels.
In 2014, European Union introduce
Euro 6 standard for all new vehicle.
Customer Trends
LPG
Market
Increase in price of petrol and
diesel create demand for based
propane vehicles by commercial
vehicle fleet operators.
In addition financial incentives and
favorable government regulation
fuel the demand of LPG globally.
Liquefied Petroleum Gas Market Analysis And Forecast
U n i v e r s i t y O f P e t r o l e u m A n d E n e r g y S t u d i e s
Page 24
Growing government initiatives mainly in China, India, South Africa and Indonesia to
promote the application of LPG (liquefied petroleum gas) as a cooking fuel has been one
of the major factors driving the global demand for LPG. Coal is a majorly used fuel used
for cooking in developing and underdeveloped countries owing to its availability and low
price.
However, LPG is consider to be a clean cooking fuel when compared with coal and in
order to reduce harmful emission caused due ignition of coal, governments of various
nations including India are offering LPG cylinders at subsidized rates to the consumers.
In addition to increasing usage of LPG as a cooking fuel, LPG is also gaining popularity
as a transportation fuel. LPG as a transportation fuel offer low cost and environmental
friendly solution when compared with gasoline and diesel. With increase in oil and gas
demand, LPG production is also rising, making it available in surplus amount. In addition,
shale gas development especially in the U.S. and China is leading to oversupply of LPG
in the global market. LPG production is expected to increase majorly from processing of
non-associated conventional gas, while production from associated gas is expected to
grow at a comparatively slower rate.
The Middle East, North America, and Northern Africa are the major LPG producers with
a large number of crude oil refineries and natural gas processing plants. LPG has been
replacing a number of fuels in different applications due to its environmental and
operational benefits. It is used as a refrigerant instead of chlorofluorocarbon and hydro
fluorocarbon, as it has negligible ozone depletion potential. It is also used instead of
gasoline and diesel as an automobile fuel owing to rising prices of conventional fuel.
LPG used in automobiles is popularly known as auto gas (automobile liquefied petroleum
gas). However, major application of LPG around the globe is in domestic and
commercial space heating and cooking.
3.4 Market driver analysis
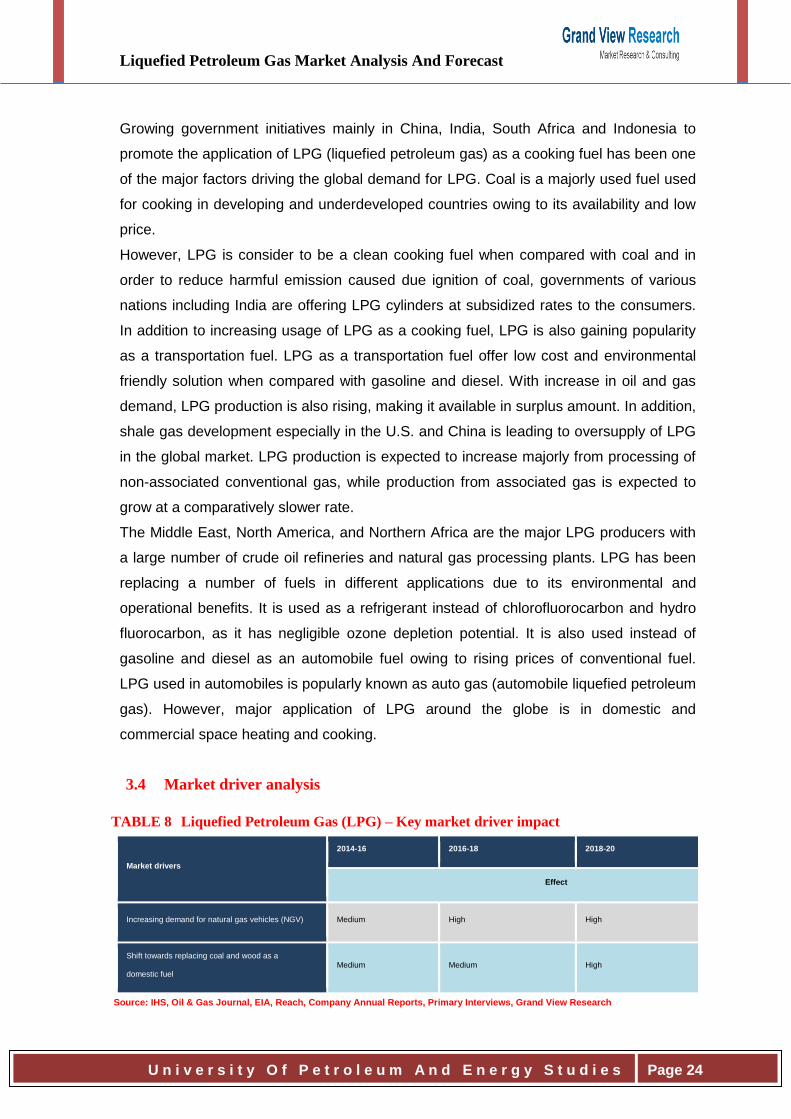
TABLE 8 Liquefied Petroleum Gas (LPG) – Key market driver impact
Market drivers
2014-16 2016-18 2018-20
Effect
Increasing demand for natural gas vehicles (NGV) Medium High High
Shift towards replacing coal and wood as a
domestic fuel Medium Medium High
Source: IHS, Oil & Gas Journal, EIA, Reach, Company Annual Reports, Primary Interviews, Grand View Research
Liquefied Petroleum Gas Market Analysis And Forecast
U n i v e r s i t y O f P e t r o l e u m A n d E n e r g y S t u d i e s
Page 25
3.4.1 Increasing demand for natural gas vehicles (NGV)
Use of natural gas in transportation sector is still in its early stage. However, natural gas
powered vehicle possess huge opportunity. The several factor driving the demand for
natural gas powered vehicle. The first and most is high cost of petroleum based fuels,
such as petrol and diesel. An individual can reduce their annual fuel costs by switching to
natural gas. The second factor promoting demand of NGVs is growing importance
toward maintaining national security and saving economy from global oil price risks. The
third factor promoting NGVs demand is that NGVs is environment friendly owing to
natural gas is clean burning gas than gasoline and HSD. Therefore vehicles using
natural as their fuel produce less nitrogen oxide, particulates, and carbon dioxide per
mile traveled.
Automotive liquefied petroleum gas, also known as autogas, is used as fuel in
automobiles in many regions worldwide. Autogas has high energy content and burns
easily compared to other energy sources or fuels. Consumption of autogas has been
rapidly increasing from the last few years, majorly due to its environmental benefits.
National governments have been promoting use of autogas through various initiatives. In
the U.S. fuelling equipments (for LPG, electricity, E85 or diesel fuel blended with
biodiesel) installed between 1st January of 2006 to 31st December, 2013 is eligible for
30% tax credits. Similarly government of few other countries such as Algeria, Australia
and other have been pushing the local public to use autogas vehicles. In addition, focus
on autogas is increasing due to its functional and cost benefits over oil based fuels such
as gasoline or diesel. The operational and performance characteristics of autogas
vehicles are favorable as compared to other fuels. Autogas provides various operational
benefits such as low maintenance, less soot formation, and reduced frequency of
changing the spark plug and oil. Compared to other fuels such as gasoline and diesel,
autogas and CNG are greener fuels, out of which autogas is preferred due to its storage
benefits, availability, and low cost
Liquefied Petroleum Gas Market Analysis And Forecast
U n i v e r s i t y O f P e t r o l e u m A n d E n e r g y S t u d i e s
Page 26
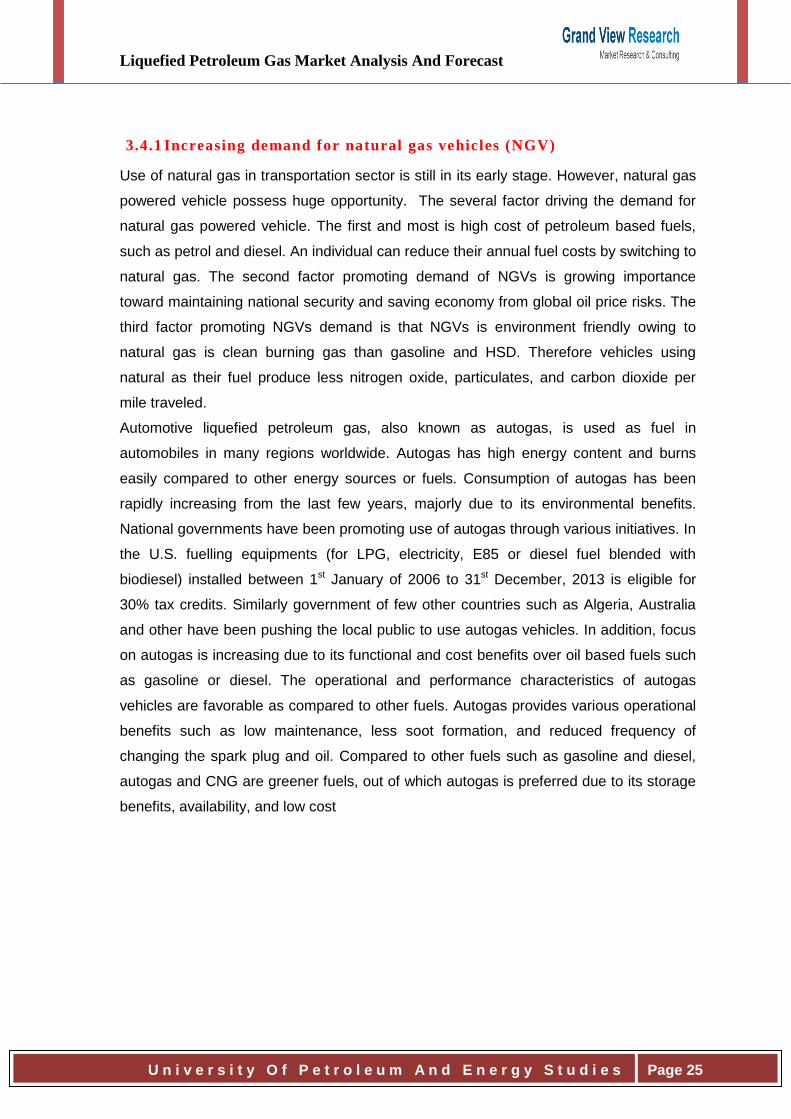
FIG. 4 Global auto gas vehicles, 2008-2012 (million units)
SOURCE: UN STATISTICS DIVISION, BOND ET, 2007
Autogas vehicles cover 90% of the gasoline vehicles while CNG vehicles cover only 40%
to 50% of the gasoline vehicle range. Compared to gasoline, autogas and CNG reduce
carbon emissions by 20%, but autogas vehicles do it in a more cost efficient way.
On account of the benefits of autogas, various government initiatives and increase in the
number of autogas vehicles, autogas consumption has been growing each year.
Countries having the highest number of autogas vehicles are Turkey, Poland, and Korea.
Global number of autogas vehicles has been increasing significantly every year, primarily
due to introduction of vehicle models running on natural gas by major automobile players
in the market
3.4.2 Shift towards replacing coal and wood as a domestic fuel
Black carbon is one of the major contributors to climate change and cause pollution to
environment. According to estimate of United nation, 2004 approximately 26% of global
co2 are attributed from residential sector.
0.00
5.00
10.00
15.00
20.00
25.00
2008 2009 2010 2011 2012
Au
to g
as
ve
hic
les
(M
illi
on
u
nit
s)
Year
Liquefied Petroleum Gas Market Analysis And Forecast
U n i v e r s i t y O f P e t r o l e u m A n d E n e r g y S t u d i e s
Page 27
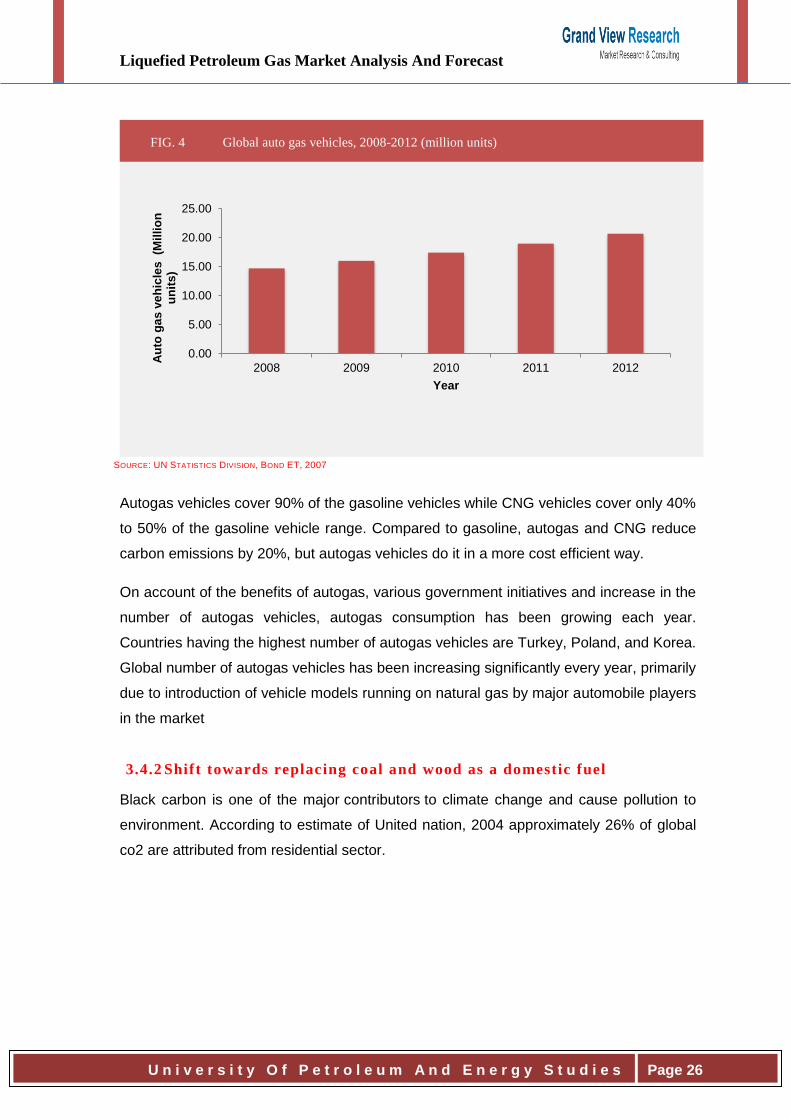
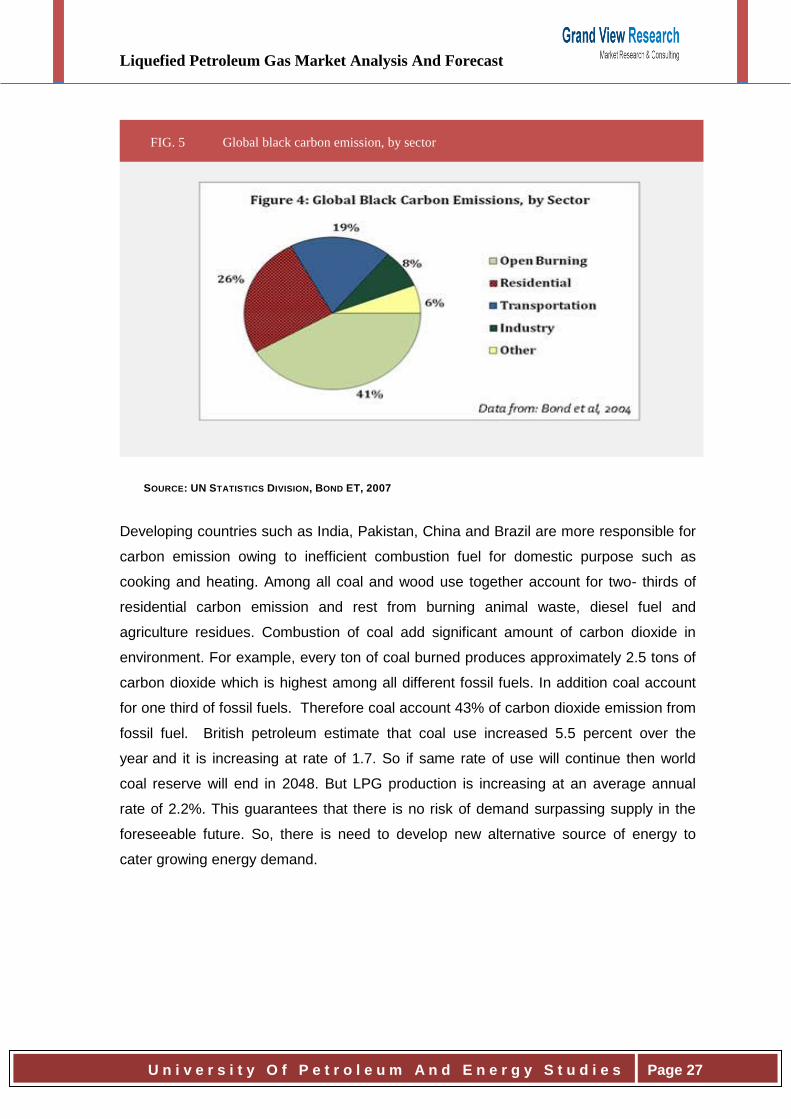
FIG. 5 Global black carbon emission, by sector
SOURCE: UN STATISTICS DIVISION, BOND ET, 2007
Developing countries such as India, Pakistan, China and Brazil are more responsible for
carbon emission owing to inefficient combustion fuel for domestic purpose such as
cooking and heating. Among all coal and wood use together account for two- thirds of
residential carbon emission and rest from burning animal waste, diesel fuel and
agriculture residues. Combustion of coal add significant amount of carbon dioxide in
environment. For example, every ton of coal burned produces approximately 2.5 tons of
carbon dioxide which is highest among all different fossil fuels. In addition coal account
for one third of fossil fuels. Therefore coal account 43% of carbon dioxide emission from
fossil fuel. British petroleum estimate that coal use increased 5.5 percent over the
year and it is increasing at rate of 1.7. So if same rate of use will continue then world
coal reserve will end in 2048. But LPG production is increasing at an average annual
rate of 2.2%. This guarantees that there is no risk of demand surpassing supply in the
foreseeable future. So, there is need to develop new alternative source of energy to
cater growing energy demand.
Liquefied Petroleum Gas Market Analysis And Forecast
U n i v e r s i t y O f P e t r o l e u m A n d E n e r g y S t u d i e s
Page 28
3.5 Market restraint analysis
Market Drivers
2014-16 2016-18 2018-20
Effect
Volatility in raw material prices High High High
Source: IHS, Oil & Gas Journal, EIA, Reach, Company Annual Reports, Primary Interviews, Grand View Research
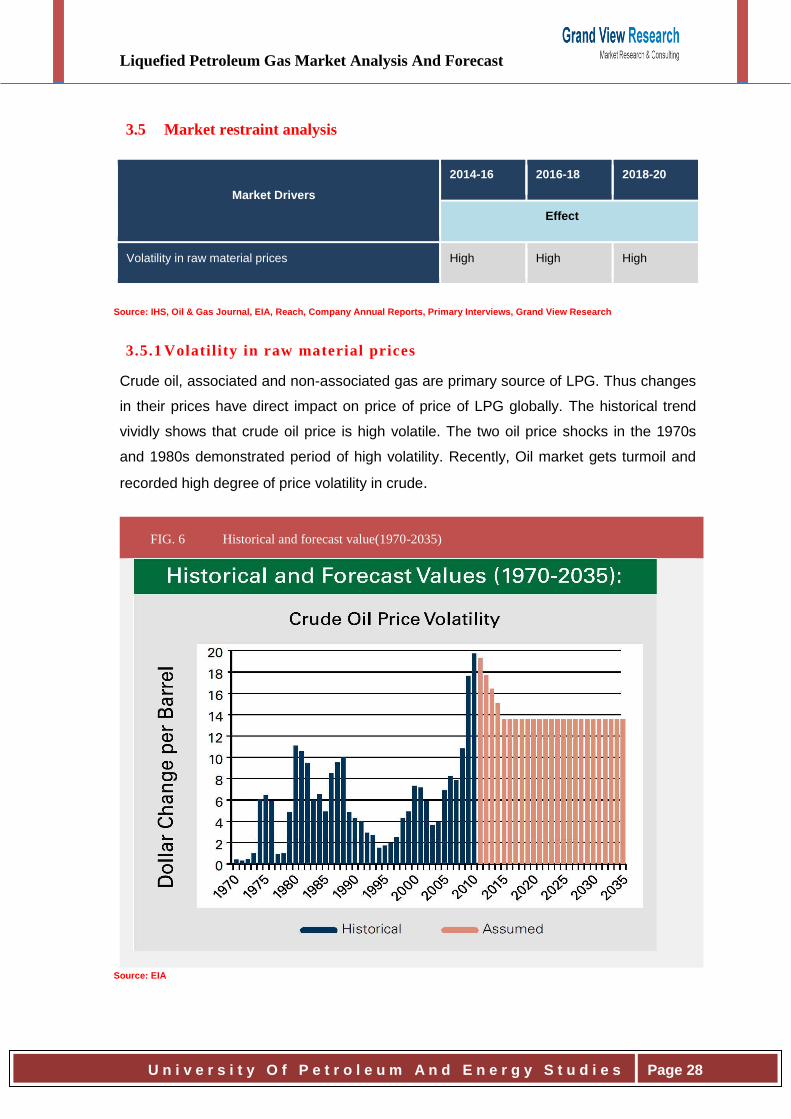
3.5.1 Volatility in raw material prices
Crude oil, associated and non-associated gas are primary source of LPG. Thus changes
in their prices have direct impact on price of price of LPG globally. The historical trend
vividly shows that crude oil price is high volatile. The two oil price shocks in the 1970s
and 1980s demonstrated period of high volatility. Recently, Oil market gets turmoil and
recorded high degree of price volatility in crude.
FIG. 6 Historical and forecast value(1970-2035)
Source: EIA
Liquefied Petroleum Gas Market Analysis And Forecast
U n i v e r s i t y O f P e t r o l e u m A n d E n e r g y S t u d i e s
Page 29
During 2010 and 2011 world oil market experience significantly volatility in crude oil
owing to unrest in Middle East, Military Upheavals in Libya and Egypt coupled with
boycott of Iranian Crude oil as reply to nuclear weapons program. However, it is
expected that volatility of crude oil price will be stagnate over the forecasted period due
to enormous production from politically stable countries such as the United States and
Canada.
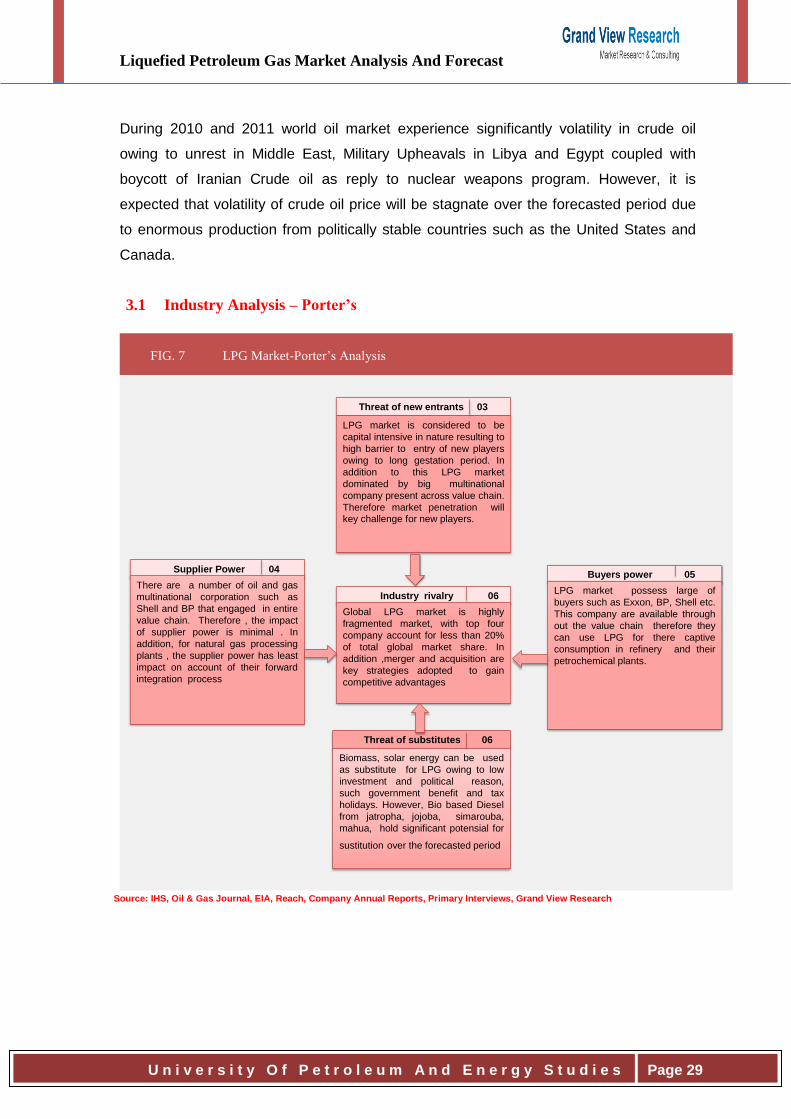
3.1 Industry Analysis – Porter’s
FIG. 7 LPG Market-Porter’s Analysis
Source: IHS, Oil & Gas Journal, EIA, Reach, Company Annual Reports, Primary Interviews, Grand View Research
Threat of new entrants 03
LPG market is considered to be
capital intensive in nature resulting to
high barrier to entry of new players
owing to long gestation period. In
addition to this LPG market
dominated by big multinational
company present across value chain.
Therefore market penetration will
key challenge for new players.
Supplier Power 04
There are a number of oil and gas
multinational corporation such as
Shell and BP that engaged in entire
value chain. Therefore , the impact
of supplier power is minimal . In
addition, for natural gas processing
plants , the supplier power has least
impact on account of their forward
integration process
Buyers power 05
LPG market possess large of
buyers such as Exxon, BP, Shell etc.
This company are available through
out the value chain therefore they
can use LPG for there captive
consumption in refinery and their
petrochemical plants.
Threat of substitutes 06
Industry rivalry 06
Global LPG market is highly
fragmented market, with top four
company account for less than 20%
of total global market share. In
addition ,merger and acquisition are
key strategies adopted to gain
competitive advantages
Biomass, solar energy can be used
as substitute for LPG owing to low
investment and political reason,
such government benefit and tax
holidays. However, Bio based Diesel
from jatropha, jojoba, simarouba,
mahua, hold significant potensial for
sustitution over the forecasted period
Liquefied Petroleum Gas Market Analysis And Forecast
U n i v e r s i t y O f P e t r o l e u m A n d E n e r g y S t u d i e s
Page 30
3.1.1 Bargaining power of suppliers
There are a number of oil and gas multinational corporations such as Shell, BP, etc. that
are engaged in extraction of crude oil, refining, and hence also in LPG production. These
companies have forward integrated their process and are present across the value
chain, crude oil extraction, refining, LPG manufacturing, filling and storage and all levels
of distribution. Hence, the impact of supplier power is considered negligible for them. In
addition, for natural gas processing plants, the supplier power has least impact on
account of their forward integrated process. On the other hand, some of the refineries
that are dependent on other companies for crude oil supply are affected by volatility in
crude oil prices. As a result of the existing high number of oil and gas reserves, oil
refineries, and natural gas plants, supply of LPG has been available at surplus in the
market. In addition, increasing investments in shale gas resources and offshore oil and
gas resources especially in the U.S. promises abundant supply of LPG in the near future.
Hence, the bargaining power of suppliers is expected to be medium throughout the
forecast period of the next five years.
3.1.2 Bargaining power of buyers
The market includes large number of suppliers including oil and gas companies, natural
gas wells and refineries, leading to surplus amount of LPG. Supply demand gap of LPG
has been affecting its prices globally. Large number of buyers including residential,
commercial, industrial, agriculture and automobiles are present in the market. Other
buyers such as resellers and third-party service stations pose negligible threat of
backward integration, as it is a capital intensive industry.. Third-party service stations
and resellers form long term agreements with suppliers, which lowers the risk for both
buyers and suppliers. Due to increasing awareness of LPG in rural areas, its
environmental benefits and low cost, its demand is expected to grow especially in
developing nations.
Hence, the bargaining power of buyers is expected to be medium throughout the
forecast period.
3.1.3 Threat of substitutes
Use of LPG as cooking, heating, and automobile fuel has been supported by
governments in countries such as South Africa, India, Australia, etc. These governments
are supporting LPG against other fuels such as coal, diesel, petrol and electricity, due to
Liquefied Petroleum Gas Market Analysis And Forecast
U n i v e r s i t y O f P e t r o l e u m A n d E n e r g y S t u d i e s
Page 31
its environmental and cost benefits. On account of few operational drawbacks and
transport issues, the shift from other fuels to LPG is expected to be slow. On the other
hand, demand for fuels such as Compressed Natural Gas (CNG) is expected to increase
in the future, which may act as a credible threat to LPG.
Hence, the threat of substitutes is expected to go from low to medium over the forecast
period of the next five years.
3.1.4 Threat of new entrants
LPG is produced at crude oil refineries and natural gas wells, which are capital intensive
and require achieving economies of scale to operate in the market. The market is
dominated by top oil & gas multinational companies such as Shell, BO, ExxonMobil, etc.
which are present across the value chain. These companies have been operating in the
market from a very long time and hence capture major market share, raising the entry
barrier for new participants. In addition, the industry has a high degree of regulatory
intervention and is highly impacted by geopolitical issues, creating uncertainty risks for
new entrants in the market.
Thus, the threat of new entrants is expected to go from low to medium over the forecast
period of next five years.
3.1.5 Degree of competition
The global LPG market is highly capital intensive and is dominated by few large
multinational oil & gas companies the top four companies accounted for 18.5% share of
the global market in 2012. Increasing investment in shale gas resources and other
unconventional gases especially in the U.S. and Canada is increasing, which is further
expected to add significant amount of LPG in global supply. Constant fluctuations in
crude oil prices affect the prices of LPG, specifically for refineries, as raw material
constitutes the bulk of the product cost. The key players are constantly striving to
increase their profit margins by minimizing their utility costs by achieving economies of
scale. Major companies such as Shell, ExxonMobil, British Petroleum, etc. are present
across value chain, starting from crude oil extraction to different level of distribution to
the buyers.
Thus, the degree of competition is considered to be high and is expected to remain the
same till the next five years.
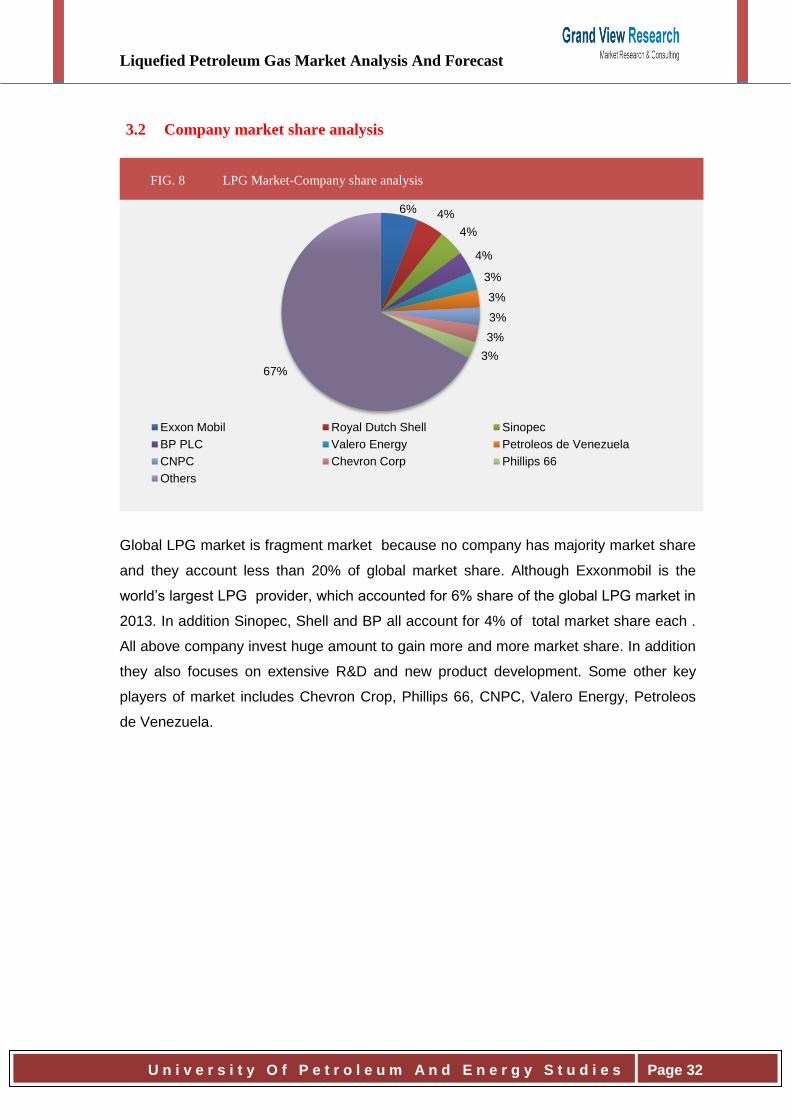
Liquefied Petroleum Gas Market Analysis And Forecast
U n i v e r s i t y O f P e t r o l e u m A n d E n e r g y S t u d i e s
Page 32
3.2 Company market share analysis
FIG. 8 LPG Market-Company share analysis
Global LPG market is fragment market because no company has majority market share
and they account less than 20% of global market share. Although Exxonmobil is the
world’s largest LPG provider, which accounted for 6% share of the global LPG market in
2013. In addition Sinopec, Shell and BP all account for 4% of total market share each .
All above company invest huge amount to gain more and more market share. In addition
they also focuses on extensive R&D and new product development. Some other key
players of market includes Chevron Crop, Phillips 66, CNPC, Valero Energy, Petroleos
de Venezuela.
6% 4%
4%
4%
3%
3%
3%
3%
3%
67%
Exxon Mobil Royal Dutch Shell Sinopec
BP PLC Valero Energy Petroleos de Venezuela
CNPC Chevron Corp Phillips 66
Others
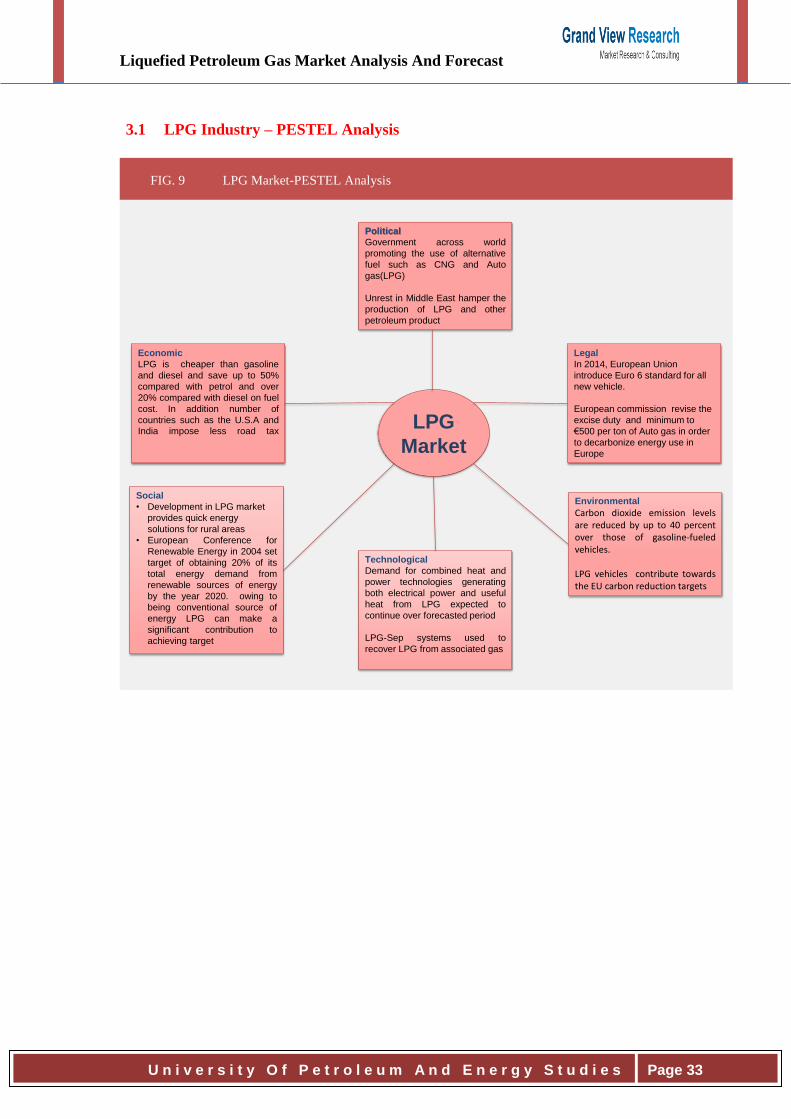
Liquefied Petroleum Gas Market Analysis And Forecast
U n i v e r s i t y O f P e t r o l e u m A n d E n e r g y S t u d i e s
Page 33
3.1 LPG Industry – PESTEL Analysis
FIG. 9 LPG Market-PESTEL Analysis
Political
Government across world
promoting the use of alternative
fuel such as CNG and Auto
gas(LPG)
Unrest in Middle East hamper the
production of LPG and other
petroleum product
Environmental
Carbon dioxide emission levelsare reduced by up to 40 percentover those of gasoline-fueledvehicles.
LPG vehicles contribute towardsthe EU carbon reduction targets
Social
• Development in LPG market
provides quick energy
solutions for rural areas
• European Conference for
Renewable Energy in 2004 set
target of obtaining 20% of its
total energy demand from
renewable sources of energy
by the year 2020. owing to
being conventional source of
energy LPG can make a
significant contribution to
achieving target
Technological
Demand for combined heat and
power technologies generating
both electrical power and useful
heat from LPG expected to
continue over forecasted period
LPG-Sep systems used to
recover LPG from associated gas
Legal
In 2014, European Union
introduce Euro 6 standard for all
new vehicle.
European commission revise the
excise duty and minimum to
€500 per ton of Auto gas in order
to decarbonize energy use in
Europe
Economic
LPG is cheaper than gasoline
and diesel and save up to 50%
compared with petrol and over
20% compared with diesel on fuel
cost. In addition number of
countries such as the U.S.A and
India impose less road taxLPG
Market
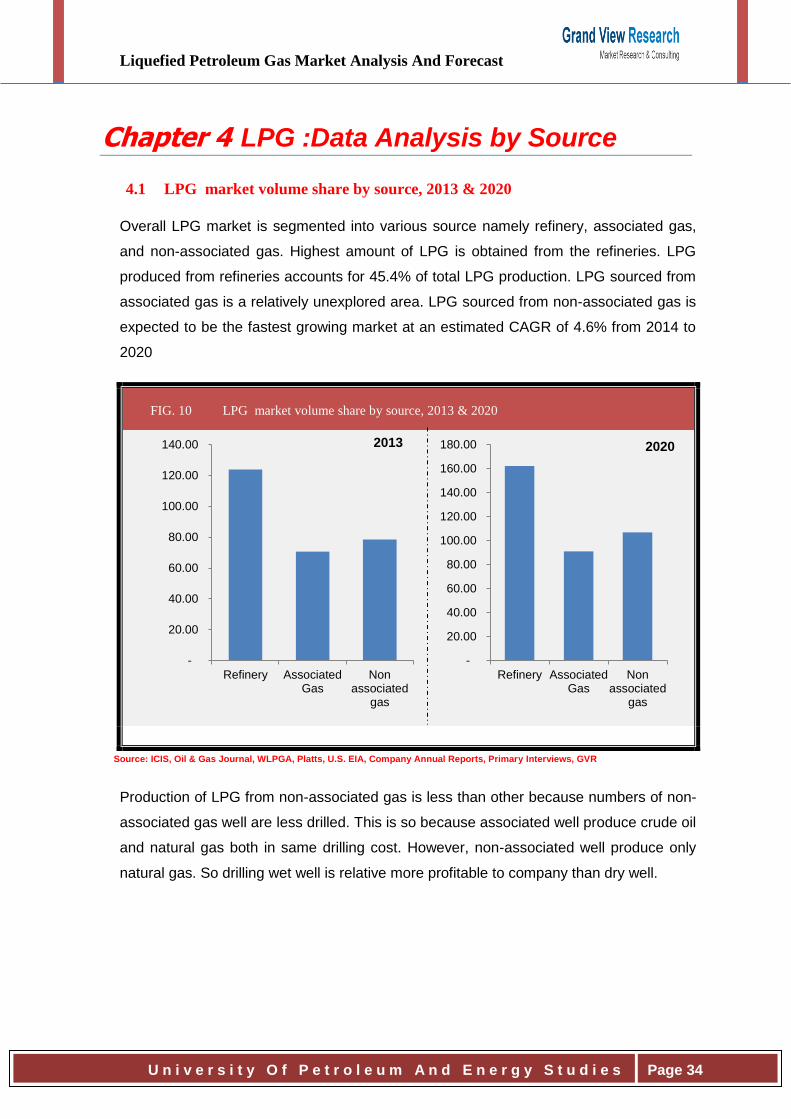
Liquefied Petroleum Gas Market Analysis And Forecast
U n i v e r s i t y O f P e t r o l e u m A n d E n e r g y S t u d i e s
Page 34
Chapter 4 LPG :Data Analysis by Source
4.1 LPG market volume share by source, 2013 & 2020
Overall LPG market is segmented into various source namely refinery, associated gas,
and non-associated gas. Highest amount of LPG is obtained from the refineries. LPG
produced from refineries accounts for 45.4% of total LPG production. LPG sourced from
associated gas is a relatively unexplored area. LPG sourced from non-associated gas is
expected to be the fastest growing market at an estimated CAGR of 4.6% from 2014 to
2020
FIG. 10 LPG market volume share by source, 2013 & 2020
Source: ICIS, Oil & Gas Journal, WLPGA, Platts, U.S. EIA, Company Annual Reports, Primary Interviews, GVR
Production of LPG from non-associated gas is less than other because numbers of non-
associated gas well are less drilled. This is so because associated well produce crude oil
and natural gas both in same drilling cost. However, non-associated well produce only
natural gas. So drilling wet well is relative more profitable to company than dry well.
Refinery AssociatedGas
Nonassociated
gas
-
20.00
40.00
60.00
80.00
100.00
120.00
140.00
Refinery AssociatedGas
Nonassociated
gas
-
20.00
40.00
60.00
80.00
100.00
120.00
140.00
160.00
180.002013 2020
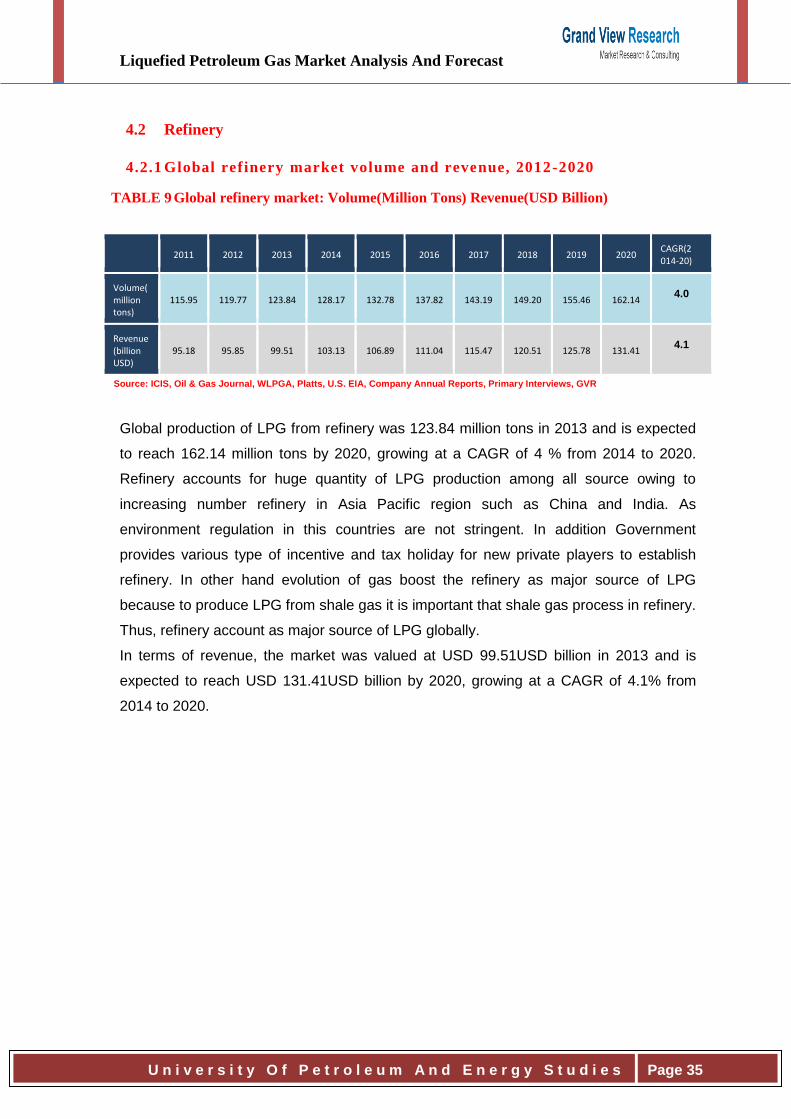
Liquefied Petroleum Gas Market Analysis And Forecast
U n i v e r s i t y O f P e t r o l e u m A n d E n e r g y S t u d i e s
Page 35
4.2 Refinery
4.2.1 Global refinery market volume and revenue, 2012-2020
TABLE 9 Global refinery market: Volume(Million Tons) Revenue(USD Billion)
2011 2012 2013 2014 2015 2016 2017 2018 2019 2020
CAGR(2014-20)
Volume(million tons)
115.95 119.77 123.84 128.17 132.78 137.82 143.19 149.20 155.46 162.14 4.0
%
Revenue(billion USD)
95.18 95.85 99.51 103.13 106.89 111.04 115.47 120.51 125.78 131.41 4.1
%
Source: ICIS, Oil & Gas Journal, WLPGA, Platts, U.S. EIA, Company Annual Reports, Primary Interviews, GVR
Global production of LPG from refinery was 123.84 million tons in 2013 and is expected
to reach 162.14 million tons by 2020, growing at a CAGR of 4 % from 2014 to 2020.
Refinery accounts for huge quantity of LPG production among all source owing to
increasing number refinery in Asia Pacific region such as China and India. As
environment regulation in this countries are not stringent. In addition Government
provides various type of incentive and tax holiday for new private players to establish
refinery. In other hand evolution of gas boost the refinery as major source of LPG
because to produce LPG from shale gas it is important that shale gas process in refinery.
Thus, refinery account as major source of LPG globally.
In terms of revenue, the market was valued at USD 99.51USD billion in 2013 and is
expected to reach USD 131.41USD billion by 2020, growing at a CAGR of 4.1% from
2014 to 2020.
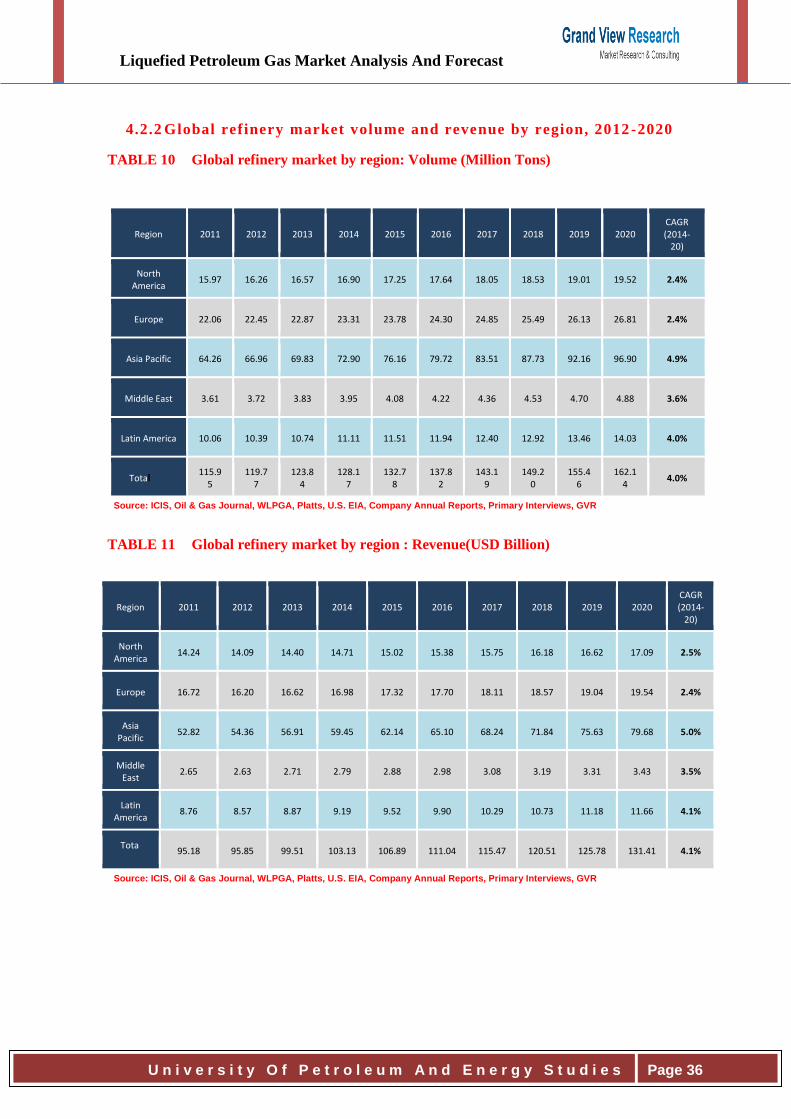
Liquefied Petroleum Gas Market Analysis And Forecast
U n i v e r s i t y O f P e t r o l e u m A n d E n e r g y S t u d i e s
Page 36
4.2.2 Global refinery market volume and revenue by region, 2012 -2020
TABLE 10 Global refinery market by region: Volume (Million Tons)
Region 2011 2012 2013 2014 2015 2016 2017 2018 2019 2020 CAGR (2014-
20)
North America
15.97 16.26 16.57 16.90 17.25 17.64 18.05 18.53 19.01 19.52 2.4%
Europe 22.06 22.45 22.87 23.31 23.78 24.30 24.85 25.49 26.13 26.81 2.4%
Asia Pacific 64.26 66.96 69.83 72.90 76.16 79.72 83.51 87.73 92.16 96.90 4.9%
Middle East 3.61 3.72 3.83 3.95 4.08 4.22 4.36 4.53 4.70 4.88 3.6%
Latin America 10.06 10.39 10.74 11.11 11.51 11.94 12.40 12.92 13.46 14.03 4.0%
Total 115.9
5 119.7
7 123.8
4 128.1
7 132.7
8 137.8
2 143.1
9 149.2
0 155.4
6 162.1
4 4.0%
Source: ICIS, Oil & Gas Journal, WLPGA, Platts, U.S. EIA, Company Annual Reports, Primary Interviews, GVR
TABLE 11 Global refinery market by region : Revenue(USD Billion)
Region 2011 2012 2013 2014 2015 2016 2017 2018 2019 2020 CAGR (2014-
20)
North America
14.24 14.09 14.40 14.71 15.02 15.38 15.75 16.18 16.62 17.09 2.5%
Europe 16.72 16.20 16.62 16.98 17.32 17.70 18.11 18.57 19.04 19.54 2.4%
Asia Pacific
52.82 54.36 56.91 59.45 62.14 65.10 68.24 71.84 75.63 79.68 5.0%
Middle East
2.65 2.63 2.71 2.79 2.88 2.98 3.08 3.19 3.31 3.43 3.5%
Latin America
8.76 8.57 8.87 9.19 9.52 9.90 10.29 10.73 11.18 11.66 4.1%
Total
95.18 95.85 99.51 103.13 106.89 111.04 115.47 120.51 125.78 131.41 4.1%
Source: ICIS, Oil & Gas Journal, WLPGA, Platts, U.S. EIA, Company Annual Reports, Primary Interviews, GVR
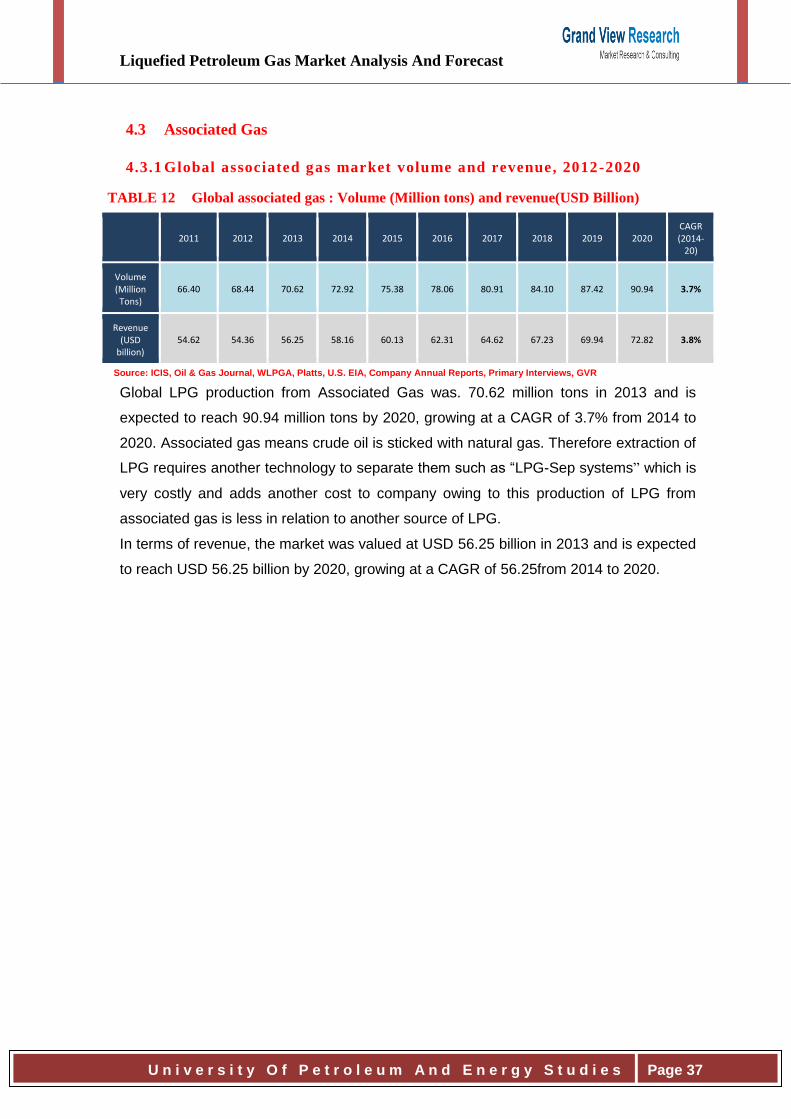
Liquefied Petroleum Gas Market Analysis And Forecast
U n i v e r s i t y O f P e t r o l e u m A n d E n e r g y S t u d i e s
Page 37
4.3 Associated Gas
4.3.1 Global associated gas market volume and revenue, 2012-2020
TABLE 12 Global associated gas : Volume (Million tons) and revenue(USD Billion)
2011 2012 2013 2014 2015 2016 2017 2018 2019 2020
CAGR (2014-
20)
Volume (Million Tons)
66.40 68.44 70.62 72.92 75.38 78.06 80.91 84.10 87.42 90.94 3.7%
Revenue (USD
billion) 54.62 54.36 56.25 58.16 60.13 62.31 64.62 67.23 69.94 72.82 3.8%
Source: ICIS, Oil & Gas Journal, WLPGA, Platts, U.S. EIA, Company Annual Reports, Primary Interviews, GVR
Global LPG production from Associated Gas was. 70.62 million tons in 2013 and is
expected to reach 90.94 million tons by 2020, growing at a CAGR of 3.7% from 2014 to
2020. Associated gas means crude oil is sticked with natural gas. Therefore extraction of
LPG requires another technology to separate them such as “LPG-Sep systems” which is
very costly and adds another cost to company owing to this production of LPG from
associated gas is less in relation to another source of LPG.
In terms of revenue, the market was valued at USD 56.25 billion in 2013 and is expected
to reach USD 56.25 billion by 2020, growing at a CAGR of 56.25from 2014 to 2020.
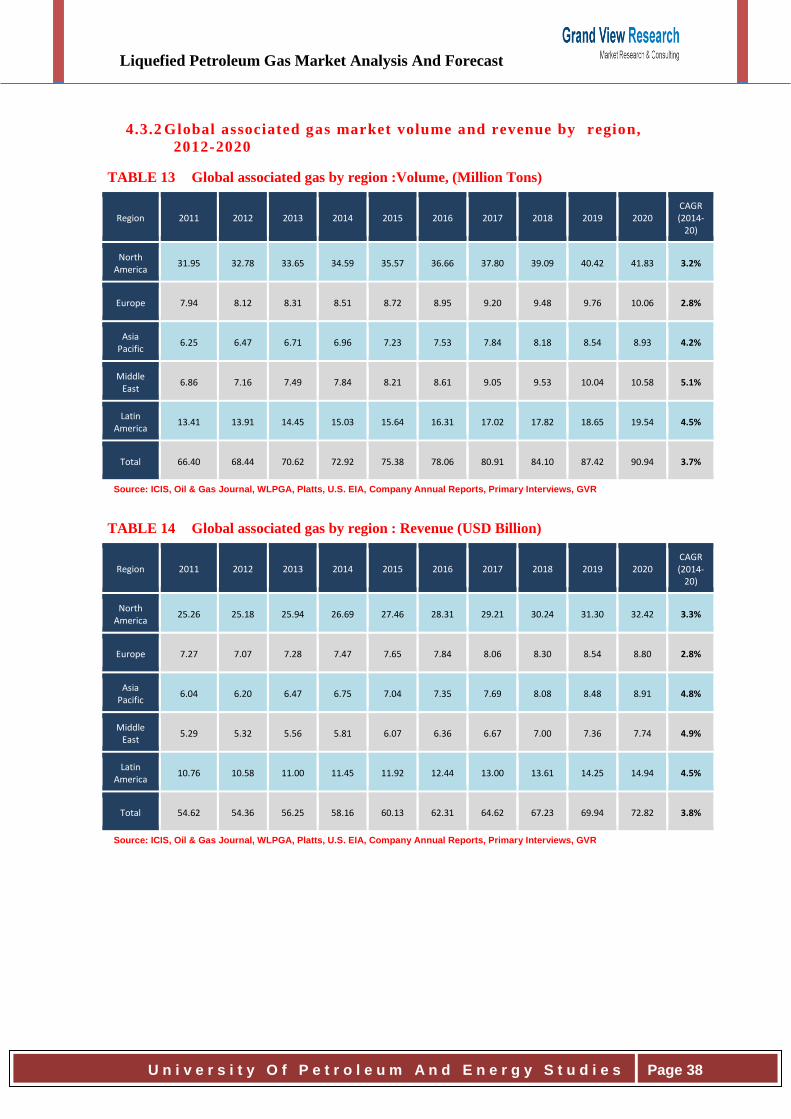
Liquefied Petroleum Gas Market Analysis And Forecast
U n i v e r s i t y O f P e t r o l e u m A n d E n e r g y S t u d i e s
Page 38
4.3.2 Global associated gas market volume and revenue by region,
2012-2020
TABLE 13 Global associated gas by region :Volume, (Million Tons)
Region 2011 2012 2013 2014 2015 2016 2017 2018 2019 2020 CAGR (2014-
20)
North America
31.95 32.78 33.65 34.59 35.57 36.66 37.80 39.09 40.42 41.83 3.2%
Europe 7.94 8.12 8.31 8.51 8.72 8.95 9.20 9.48 9.76 10.06 2.8%
Asia Pacific
6.25 6.47 6.71 6.96 7.23 7.53 7.84 8.18 8.54 8.93 4.2%
Middle East
6.86 7.16 7.49 7.84 8.21 8.61 9.05 9.53 10.04 10.58 5.1%
Latin America
13.41 13.91 14.45 15.03 15.64 16.31 17.02 17.82 18.65 19.54 4.5%
Total 66.40 68.44 70.62 72.92 75.38 78.06 80.91 84.10 87.42 90.94 3.7%
Source: ICIS, Oil & Gas Journal, WLPGA, Platts, U.S. EIA, Company Annual Reports, Primary Interviews, GVR
TABLE 14 Global associated gas by region : Revenue (USD Billion)
Region 2011 2012 2013 2014 2015 2016 2017 2018 2019 2020 CAGR (2014-
20)
North America
25.26 25.18 25.94 26.69 27.46 28.31 29.21 30.24 31.30 32.42 3.3%
Europe 7.27 7.07 7.28 7.47 7.65 7.84 8.06 8.30 8.54 8.80 2.8%
Asia Pacific
6.04 6.20 6.47 6.75 7.04 7.35 7.69 8.08 8.48 8.91 4.8%
Middle East
5.29 5.32 5.56 5.81 6.07 6.36 6.67 7.00 7.36 7.74 4.9%
Latin America
10.76 10.58 11.00 11.45 11.92 12.44 13.00 13.61 14.25 14.94 4.5%
Total 54.62 54.36 56.25 58.16 60.13 62.31 64.62 67.23 69.94 72.82 3.8%
Source: ICIS, Oil & Gas Journal, WLPGA, Platts, U.S. EIA, Company Annual Reports, Primary Interviews, GVR
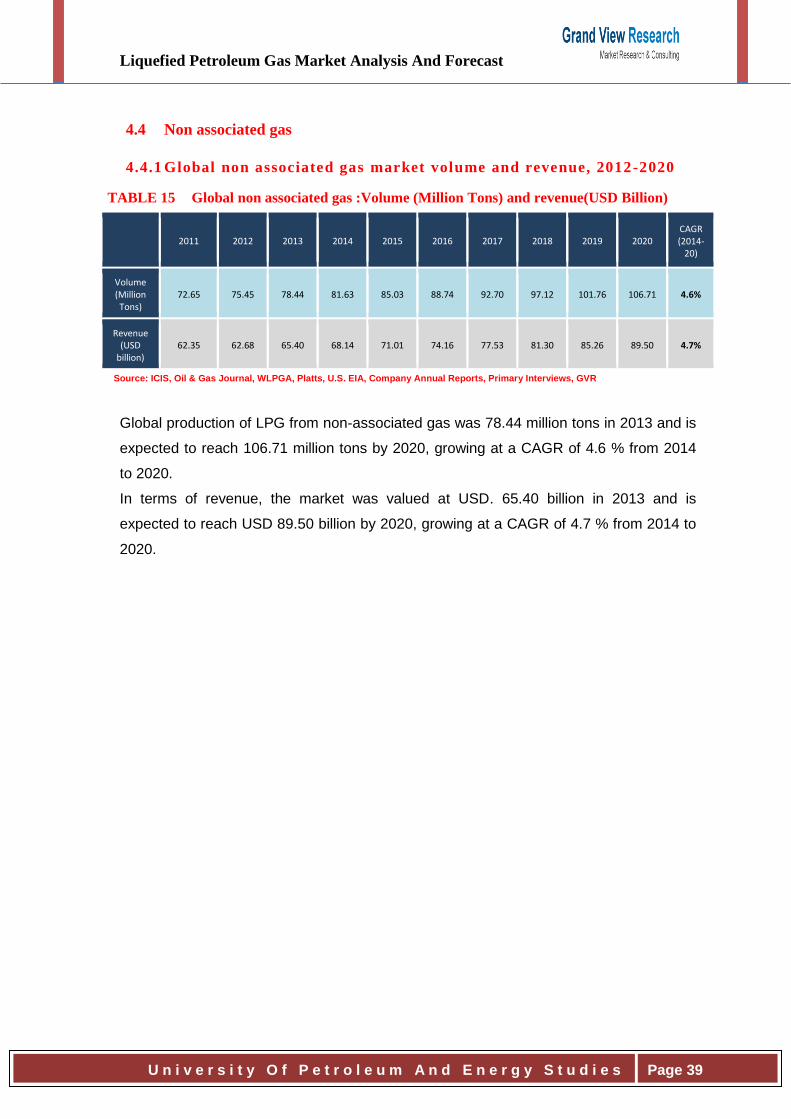
Liquefied Petroleum Gas Market Analysis And Forecast
U n i v e r s i t y O f P e t r o l e u m A n d E n e r g y S t u d i e s
Page 39
4.4 Non associated gas
4.4.1 Global non associated gas market volume and revenue, 2012-2020
TABLE 15 Global non associated gas :Volume (Million Tons) and revenue(USD Billion)
2011 2012 2013 2014 2015 2016 2017 2018 2019 2020 CAGR (2014-
20)
Volume (Million Tons)
72.65 75.45 78.44 81.63 85.03 88.74 92.70 97.12 101.76 106.71 4.6%
Revenue (USD
billion) 62.35 62.68 65.40 68.14 71.01 74.16 77.53 81.30 85.26 89.50 4.7%
Source: ICIS, Oil & Gas Journal, WLPGA, Platts, U.S. EIA, Company Annual Reports, Primary Interviews, GVR
Global production of LPG from non-associated gas was 78.44 million tons in 2013 and is
expected to reach 106.71 million tons by 2020, growing at a CAGR of 4.6 % from 2014
to 2020.
In terms of revenue, the market was valued at USD. 65.40 billion in 2013 and is
expected to reach USD 89.50 billion by 2020, growing at a CAGR of 4.7 % from 2014 to
2020.
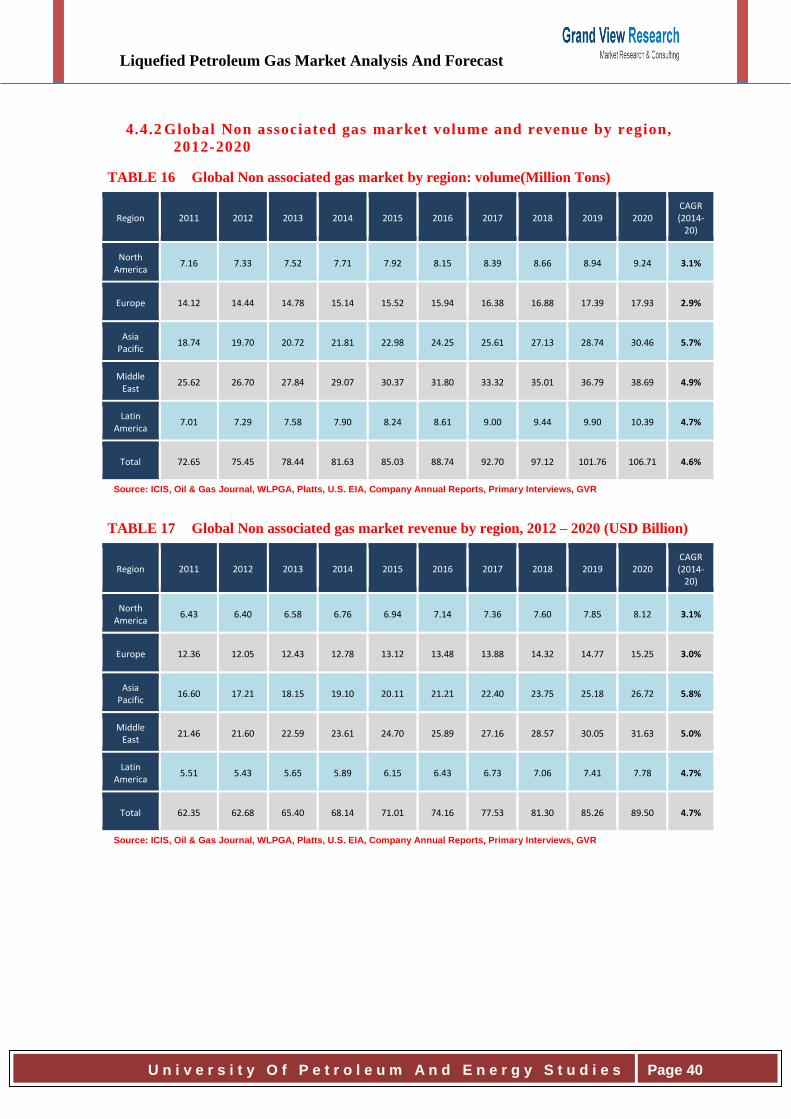
Liquefied Petroleum Gas Market Analysis And Forecast
U n i v e r s i t y O f P e t r o l e u m A n d E n e r g y S t u d i e s
Page 40
4.4.2 Global Non associated gas market volume and revenue by region,
2012-2020
TABLE 16 Global Non associated gas market by region: volume(Million Tons)
Region 2011 2012 2013 2014 2015 2016 2017 2018 2019 2020 CAGR (2014-
20)
North America
7.16 7.33 7.52 7.71 7.92 8.15 8.39 8.66 8.94 9.24 3.1%
Europe 14.12 14.44 14.78 15.14 15.52 15.94 16.38 16.88 17.39 17.93 2.9%
Asia Pacific
18.74 19.70 20.72 21.81 22.98 24.25 25.61 27.13 28.74 30.46 5.7%
Middle East
25.62 26.70 27.84 29.07 30.37 31.80 33.32 35.01 36.79 38.69 4.9%
Latin America
7.01 7.29 7.58 7.90 8.24 8.61 9.00 9.44 9.90 10.39 4.7%
Total 72.65 75.45 78.44 81.63 85.03 88.74 92.70 97.12 101.76 106.71 4.6%
Source: ICIS, Oil & Gas Journal, WLPGA, Platts, U.S. EIA, Company Annual Reports, Primary Interviews, GVR
TABLE 17 Global Non associated gas market revenue by region, 2012 – 2020 (USD Billion)
Region 2011 2012 2013 2014 2015 2016 2017 2018 2019 2020 CAGR (2014-
20)
North America
6.43 6.40 6.58 6.76 6.94 7.14 7.36 7.60 7.85 8.12 3.1%
Europe 12.36 12.05 12.43 12.78 13.12 13.48 13.88 14.32 14.77 15.25 3.0%
Asia Pacific
16.60 17.21 18.15 19.10 20.11 21.21 22.40 23.75 25.18 26.72 5.8%
Middle East
21.46 21.60 22.59 23.61 24.70 25.89 27.16 28.57 30.05 31.63 5.0%
Latin America
5.51 5.43 5.65 5.89 6.15 6.43 6.73 7.06 7.41 7.78 4.7%
Total 62.35 62.68 65.40 68.14 71.01 74.16 77.53 81.30 85.26 89.50 4.7%
Source: ICIS, Oil & Gas Journal, WLPGA, Platts, U.S. EIA, Company Annual Reports, Primary Interviews, GVR
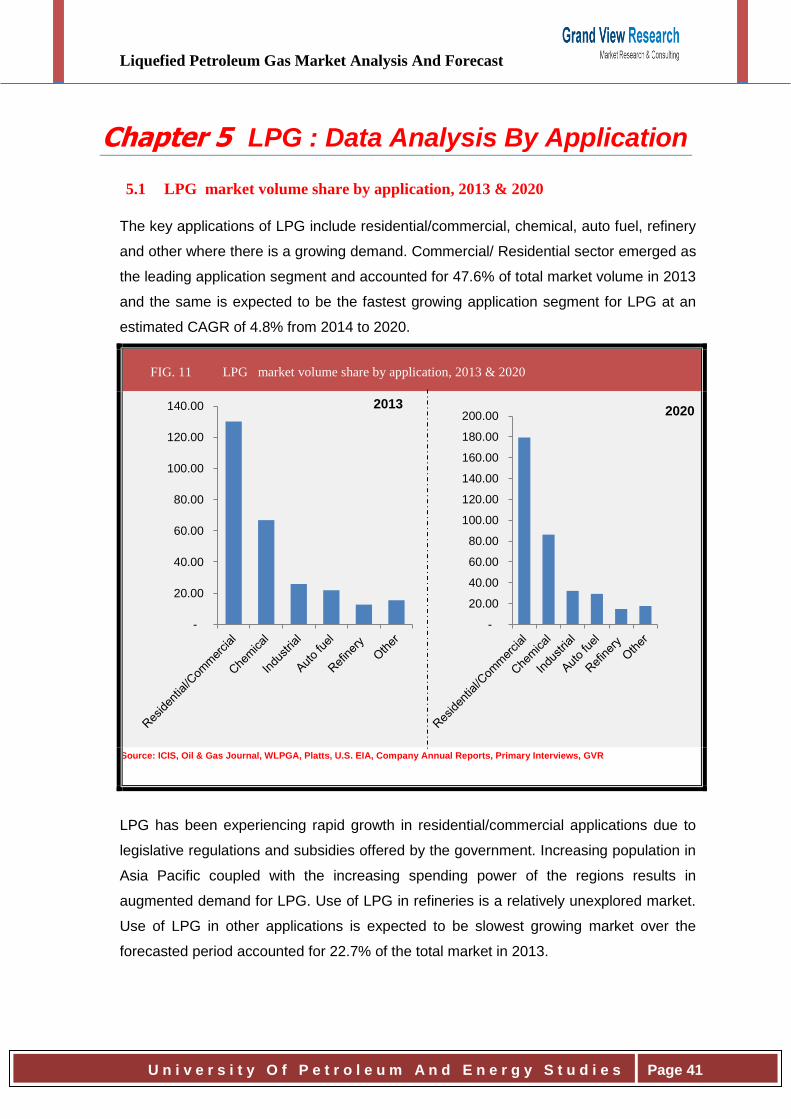
Liquefied Petroleum Gas Market Analysis And Forecast
U n i v e r s i t y O f P e t r o l e u m A n d E n e r g y S t u d i e s
Page 41
Chapter 5 LPG : Data Analysis By Application
5.1 LPG market volume share by application, 2013 & 2020
The key applications of LPG include residential/commercial, chemical, auto fuel, refinery
and other where there is a growing demand. Commercial/ Residential sector emerged as
the leading application segment and accounted for 47.6% of total market volume in 2013
and the same is expected to be the fastest growing application segment for LPG at an
estimated CAGR of 4.8% from 2014 to 2020.
FIG. 11 LPG market volume share by application, 2013 & 2020
Source: ICIS, Oil & Gas Journal, WLPGA, Platts, U.S. EIA, Company Annual Reports, Primary Interviews, GVR
LPG has been experiencing rapid growth in residential/commercial applications due to
legislative regulations and subsidies offered by the government. Increasing population in
Asia Pacific coupled with the increasing spending power of the regions results in
augmented demand for LPG. Use of LPG in refineries is a relatively unexplored market.
Use of LPG in other applications is expected to be slowest growing market over the
forecasted period accounted for 22.7% of the total market in 2013.
-
20.00
40.00
60.00
80.00
100.00
120.00
140.00
-
20.00
40.00
60.00
80.00
100.00
120.00
140.00
160.00
180.00
200.002013
2020
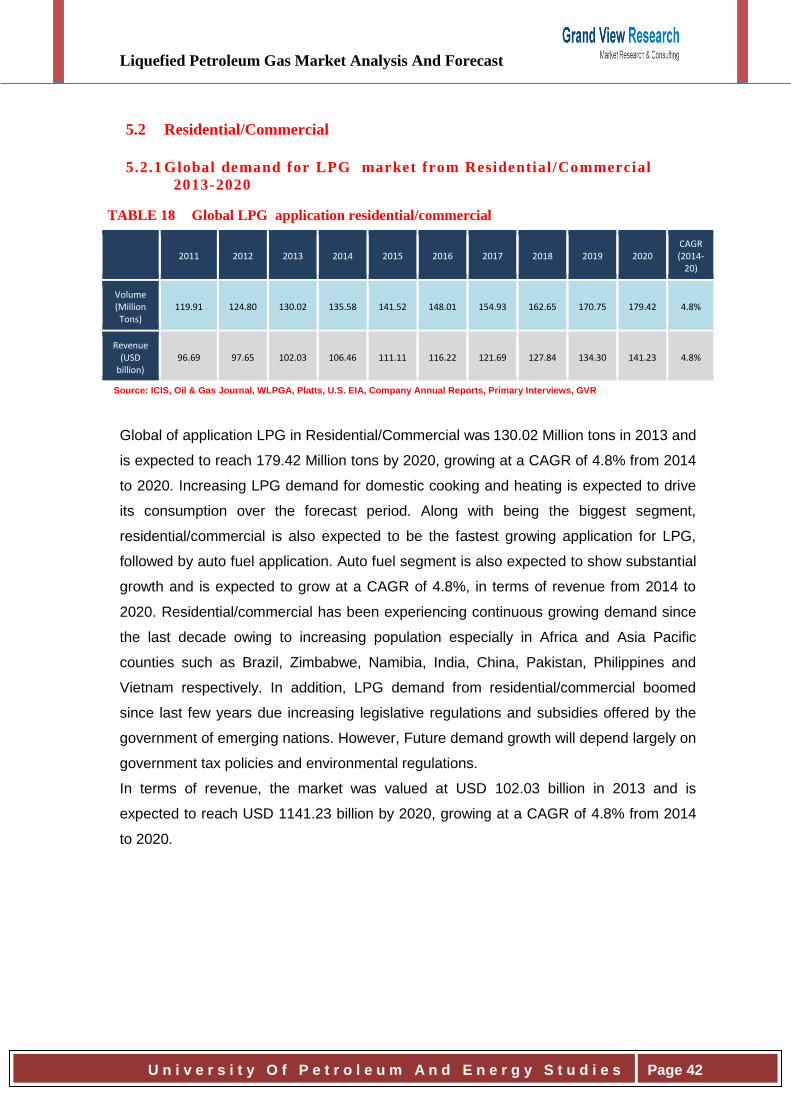
Liquefied Petroleum Gas Market Analysis And Forecast
U n i v e r s i t y O f P e t r o l e u m A n d E n e r g y S t u d i e s
Page 42
5.2 Residential/Commercial
5.2.1 Global demand for LPG market from Residential/Commercial
2013-2020
TABLE 18 Global LPG application residential/commercial
2011 2012 2013 2014 2015 2016 2017 2018 2019 2020
CAGR (2014-
20)
Volume (Million Tons)
119.91 124.80 130.02 135.58 141.52 148.01 154.93 162.65 170.75 179.42 4.8%
Revenue (USD
billion) 96.69 97.65 102.03 106.46 111.11 116.22 121.69 127.84 134.30 141.23 4.8%
Source: ICIS, Oil & Gas Journal, WLPGA, Platts, U.S. EIA, Company Annual Reports, Primary Interviews, GVR
Global of application LPG in Residential/Commercial was 130.02 Million tons in 2013 and
is expected to reach 179.42 Million tons by 2020, growing at a CAGR of 4.8% from 2014
to 2020. Increasing LPG demand for domestic cooking and heating is expected to drive
its consumption over the forecast period. Along with being the biggest segment,
residential/commercial is also expected to be the fastest growing application for LPG,
followed by auto fuel application. Auto fuel segment is also expected to show substantial
growth and is expected to grow at a CAGR of 4.8%, in terms of revenue from 2014 to
2020. Residential/commercial has been experiencing continuous growing demand since
the last decade owing to increasing population especially in Africa and Asia Pacific
counties such as Brazil, Zimbabwe, Namibia, India, China, Pakistan, Philippines and
Vietnam respectively. In addition, LPG demand from residential/commercial boomed
since last few years due increasing legislative regulations and subsidies offered by the
government of emerging nations. However, Future demand growth will depend largely on
government tax policies and environmental regulations.
In terms of revenue, the market was valued at USD 102.03 billion in 2013 and is
expected to reach USD 1141.23 billion by 2020, growing at a CAGR of 4.8% from 2014
to 2020.
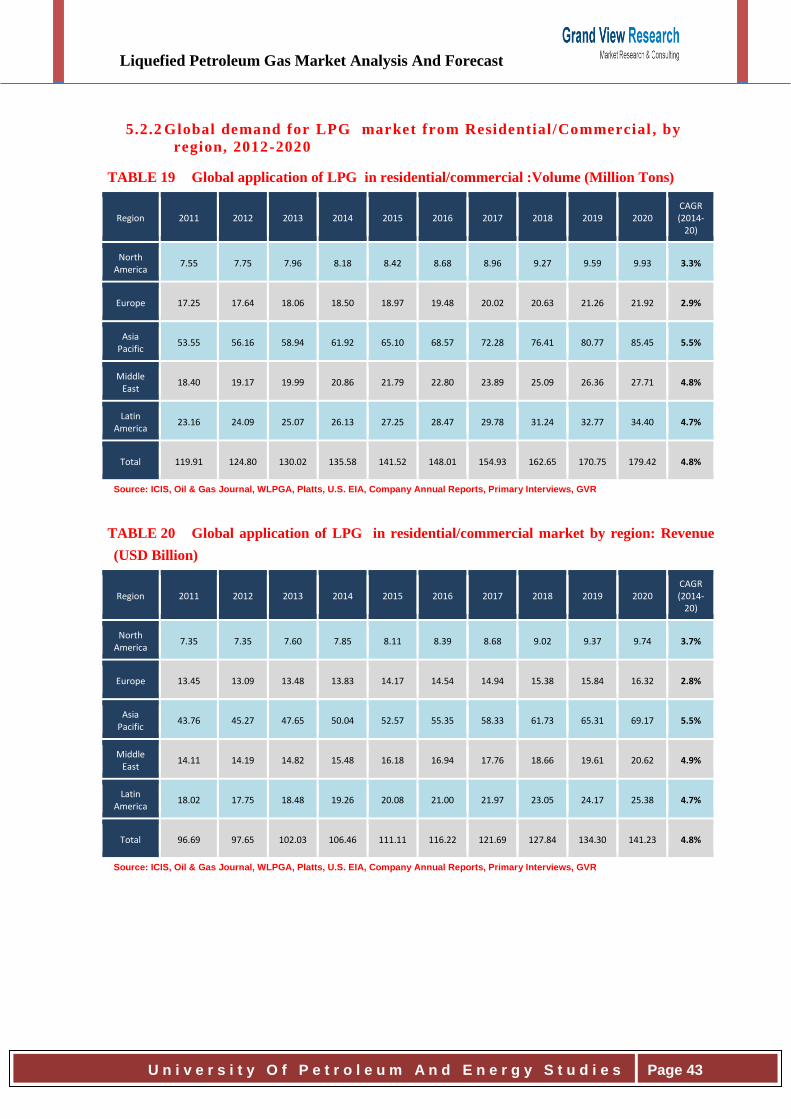
Liquefied Petroleum Gas Market Analysis And Forecast
U n i v e r s i t y O f P e t r o l e u m A n d E n e r g y S t u d i e s
Page 43
5.2.2 Global demand for LPG market from Residential/Commercial , by
region, 2012-2020
TABLE 19 Global application of LPG in residential/commercial :Volume (Million Tons)
Region 2011 2012 2013 2014 2015 2016 2017 2018 2019 2020 CAGR (2014-
20)
North America
7.55 7.75 7.96 8.18 8.42 8.68 8.96 9.27 9.59 9.93 3.3%
Europe 17.25 17.64 18.06 18.50 18.97 19.48 20.02 20.63 21.26 21.92 2.9%
Asia Pacific
53.55 56.16 58.94 61.92 65.10 68.57 72.28 76.41 80.77 85.45 5.5%
Middle East
18.40 19.17 19.99 20.86 21.79 22.80 23.89 25.09 26.36 27.71 4.8%
Latin America
23.16 24.09 25.07 26.13 27.25 28.47 29.78 31.24 32.77 34.40 4.7%
Total 119.91 124.80 130.02 135.58 141.52 148.01 154.93 162.65 170.75 179.42 4.8%
Source: ICIS, Oil & Gas Journal, WLPGA, Platts, U.S. EIA, Company Annual Reports, Primary Interviews, GVR
TABLE 20 Global application of LPG in residential/commercial market by region: Revenue
(USD Billion)
Region 2011 2012 2013 2014 2015 2016 2017 2018 2019 2020 CAGR (2014-
20)
North America
7.35 7.35 7.60 7.85 8.11 8.39 8.68 9.02 9.37 9.74 3.7%
Europe 13.45 13.09 13.48 13.83 14.17 14.54 14.94 15.38 15.84 16.32 2.8%
Asia Pacific
43.76 45.27 47.65 50.04 52.57 55.35 58.33 61.73 65.31 69.17 5.5%
Middle East
14.11 14.19 14.82 15.48 16.18 16.94 17.76 18.66 19.61 20.62 4.9%
Latin America
18.02 17.75 18.48 19.26 20.08 21.00 21.97 23.05 24.17 25.38 4.7%
Total 96.69 97.65 102.03 106.46 111.11 116.22 121.69 127.84 134.30 141.23 4.8%
Source: ICIS, Oil & Gas Journal, WLPGA, Platts, U.S. EIA, Company Annual Reports, Primary Interviews, GVR
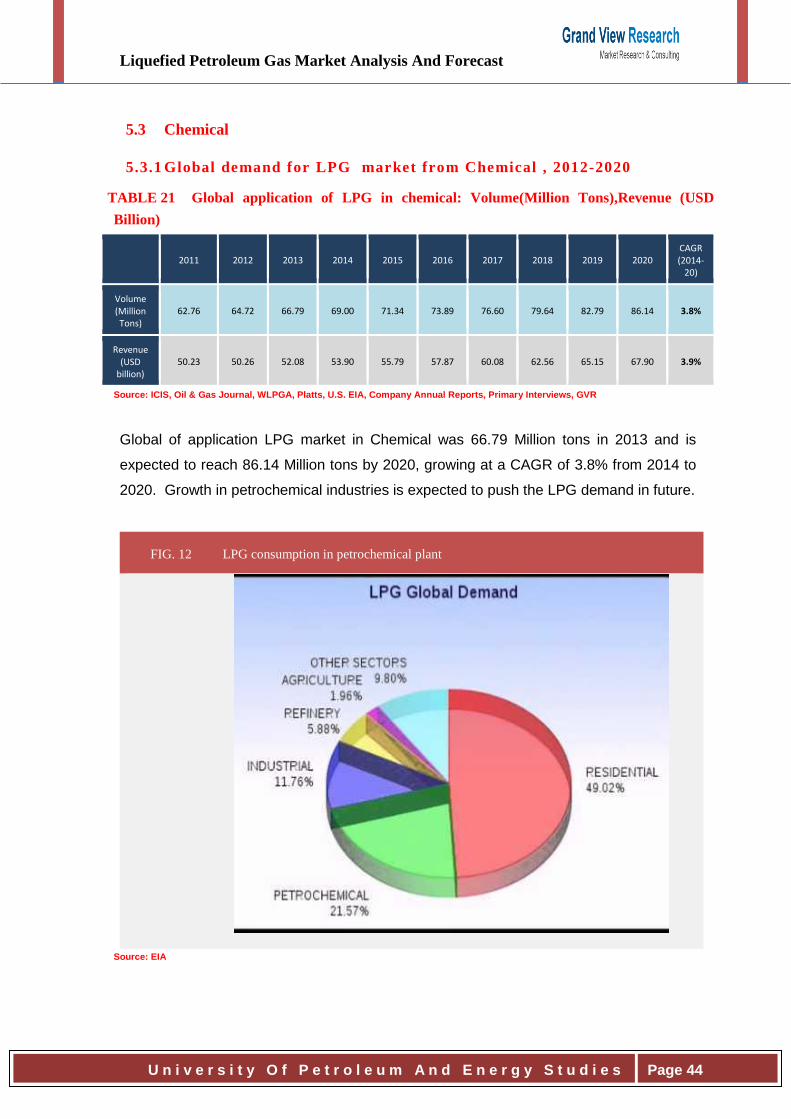
Liquefied Petroleum Gas Market Analysis And Forecast
U n i v e r s i t y O f P e t r o l e u m A n d E n e r g y S t u d i e s
Page 44
5.3 Chemical
5.3.1 Global demand for LPG market from Chemical , 2012-2020
TABLE 21 Global application of LPG in chemical: Volume(Million Tons),Revenue (USD
Billion)
2011 2012 2013 2014 2015 2016 2017 2018 2019 2020
CAGR (2014-
20)
Volume (Million Tons)
62.76 64.72 66.79 69.00 71.34 73.89 76.60 79.64 82.79 86.14 3.8%
Revenue (USD
billion) 50.23 50.26 52.08 53.90 55.79 57.87 60.08 62.56 65.15 67.90 3.9%
Source: ICIS, Oil & Gas Journal, WLPGA, Platts, U.S. EIA, Company Annual Reports, Primary Interviews, GVR
Global of application LPG market in Chemical was 66.79 Million tons in 2013 and is
expected to reach 86.14 Million tons by 2020, growing at a CAGR of 3.8% from 2014 to
2020. Growth in petrochemical industries is expected to push the LPG demand in future.
FIG. 12 LPG consumption in petrochemical plant
Source: EIA
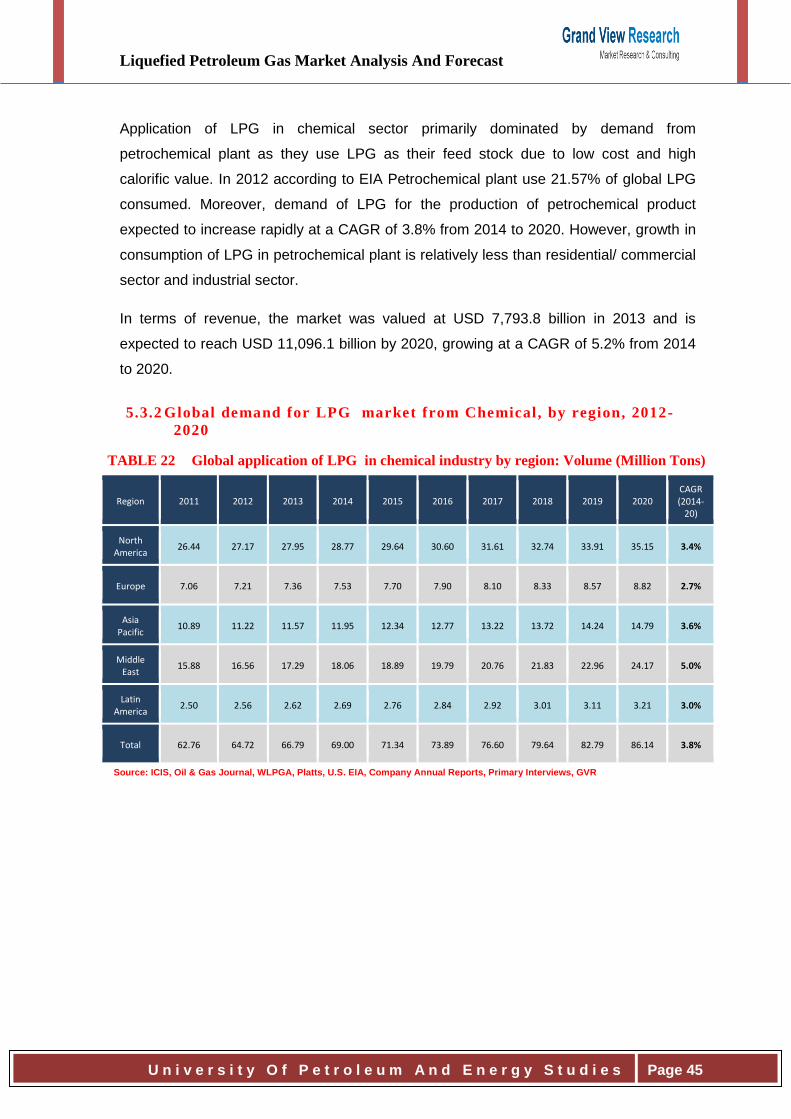
Liquefied Petroleum Gas Market Analysis And Forecast
U n i v e r s i t y O f P e t r o l e u m A n d E n e r g y S t u d i e s
Page 45
Application of LPG in chemical sector primarily dominated by demand from
petrochemical plant as they use LPG as their feed stock due to low cost and high
calorific value. In 2012 according to EIA Petrochemical plant use 21.57% of global LPG
consumed. Moreover, demand of LPG for the production of petrochemical product
expected to increase rapidly at a CAGR of 3.8% from 2014 to 2020. However, growth in
consumption of LPG in petrochemical plant is relatively less than residential/ commercial
sector and industrial sector.
In terms of revenue, the market was valued at USD 7,793.8 billion in 2013 and is
expected to reach USD 11,096.1 billion by 2020, growing at a CAGR of 5.2% from 2014
to 2020.
5.3.2 Global demand for LPG market from Chemical , by region, 2012-
2020
TABLE 22 Global application of LPG in chemical industry by region: Volume (Million Tons)
Region 2011 2012 2013 2014 2015 2016 2017 2018 2019 2020 CAGR (2014-
20)
North America
26.44 27.17 27.95 28.77 29.64 30.60 31.61 32.74 33.91 35.15 3.4%
Europe 7.06 7.21 7.36 7.53 7.70 7.90 8.10 8.33 8.57 8.82 2.7%
Asia Pacific
10.89 11.22 11.57 11.95 12.34 12.77 13.22 13.72 14.24 14.79 3.6%
Middle East
15.88 16.56 17.29 18.06 18.89 19.79 20.76 21.83 22.96 24.17 5.0%
Latin America
2.50 2.56 2.62 2.69 2.76 2.84 2.92 3.01 3.11 3.21 3.0%
Total 62.76 64.72 66.79 69.00 71.34 73.89 76.60 79.64 82.79 86.14 3.8%
Source: ICIS, Oil & Gas Journal, WLPGA, Platts, U.S. EIA, Company Annual Reports, Primary Interviews, GVR
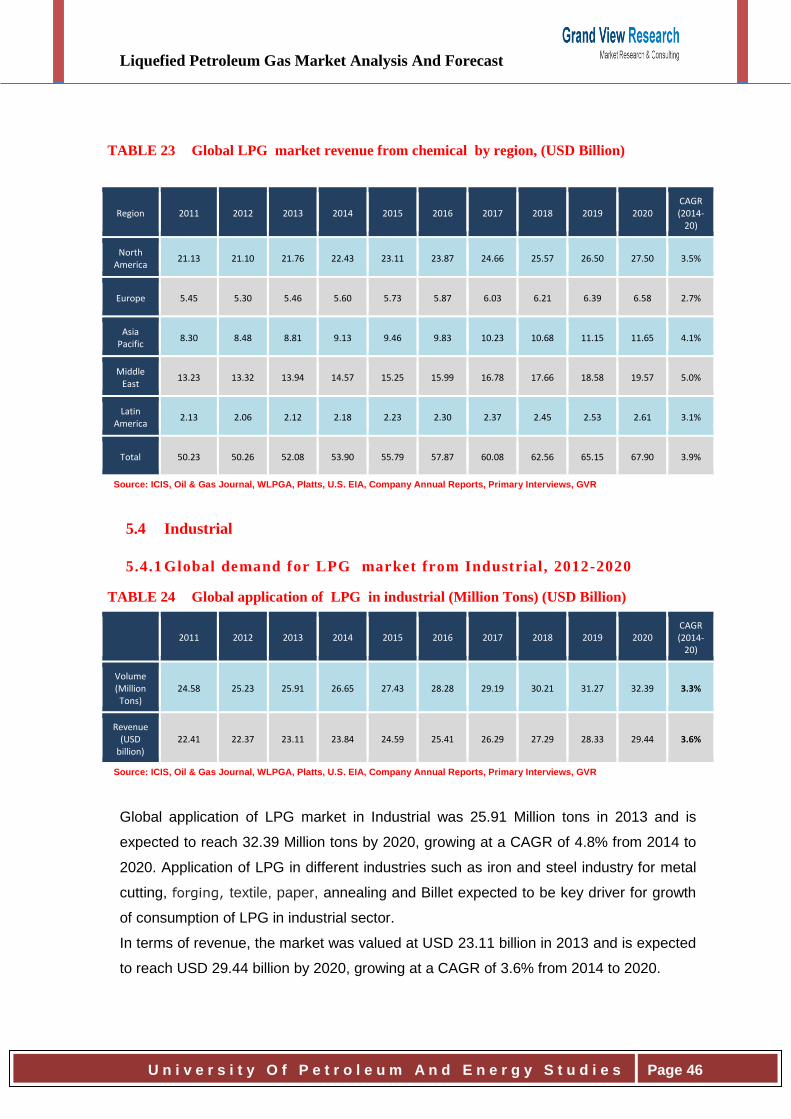
Liquefied Petroleum Gas Market Analysis And Forecast
U n i v e r s i t y O f P e t r o l e u m A n d E n e r g y S t u d i e s
Page 46
TABLE 23 Global LPG market revenue from chemical by region, (USD Billion)
Region 2011 2012 2013 2014 2015 2016 2017 2018 2019 2020 CAGR (2014-
20)
North America
21.13 21.10 21.76 22.43 23.11 23.87 24.66 25.57 26.50 27.50 3.5%
Europe 5.45 5.30 5.46 5.60 5.73 5.87 6.03 6.21 6.39 6.58 2.7%
Asia Pacific
8.30 8.48 8.81 9.13 9.46 9.83 10.23 10.68 11.15 11.65 4.1%
Middle East
13.23 13.32 13.94 14.57 15.25 15.99 16.78 17.66 18.58 19.57 5.0%
Latin America
2.13 2.06 2.12 2.18 2.23 2.30 2.37 2.45 2.53 2.61 3.1%
Total 50.23 50.26 52.08 53.90 55.79 57.87 60.08 62.56 65.15 67.90 3.9%
Source: ICIS, Oil & Gas Journal, WLPGA, Platts, U.S. EIA, Company Annual Reports, Primary Interviews, GVR
5.4 Industrial
5.4.1 Global demand for LPG market from Industrial , 2012-2020
TABLE 24 Global application of LPG in industrial (Million Tons) (USD Billion)
2011 2012 2013 2014 2015 2016 2017 2018 2019 2020
CAGR (2014-
20)
Volume (Million Tons)
24.58 25.23 25.91 26.65 27.43 28.28 29.19 30.21 31.27 32.39 3.3%
Revenue (USD
billion) 22.41 22.37 23.11 23.84 24.59 25.41 26.29 27.29 28.33 29.44 3.6%
Source: ICIS, Oil & Gas Journal, WLPGA, Platts, U.S. EIA, Company Annual Reports, Primary Interviews, GVR
Global application of LPG market in Industrial was 25.91 Million tons in 2013 and is
expected to reach 32.39 Million tons by 2020, growing at a CAGR of 4.8% from 2014 to
2020. Application of LPG in different industries such as iron and steel industry for metal
cutting, forging, textile, paper, annealing and Billet expected to be key driver for growth
of consumption of LPG in industrial sector.
In terms of revenue, the market was valued at USD 23.11 billion in 2013 and is expected
to reach USD 29.44 billion by 2020, growing at a CAGR of 3.6% from 2014 to 2020.

Liquefied Petroleum Gas Market Analysis And Forecast
U n i v e r s i t y O f P e t r o l e u m A n d E n e r g y S t u d i e s
Page 47
5.4.2 Global demand for LPG market from Industrial , by region, 2012-
2020
TABLE 25 Global LPG market by region: Volume (Million Tons)
Region 2011 2012 2013 2014 2015 2016 2017 2018 2019 2020 CAGR (2014-
20)
North America
9.14 9.37 9.61 9.86 10.13 10.43 10.74 11.10 11.46 11.85 3.1%
Europe 4.85 4.90 4.94 5.00 5.05 5.12 5.18 5.27 5.35 5.44 1.4%
Asia Pacific
8.03 8.35 8.70 9.06 9.45 9.87 10.32 10.82 11.34 11.90 4.6%
Middle East
0.722 0.736 0.752 0.768 0.785 0.803 0.822 0.844 0.866 0.888 2.4%
Latin America
1.83 1.87 1.91 1.96 2.01 2.06 2.12 2.19 2.25 2.32 2.9%
Total 24.58 25.23 25.91 26.65 27.43 28.28 29.19 30.21 31.27 32.39 3.3%
Source: ICIS, Oil & Gas Journal, WLPGA, Platts, U.S. EIA, Company Annual Reports, Primary Interviews, GVR
TABLE 26 Global application of LPG in industry: Revenue by region (USD Billion)
Region 2011 2012 2013 2014 2015 2016 2017 2018 2019 2020 CAGR (2014-
20)
North America
7.81 7.78 8.00 8.23 8.46 8.72 8.99 9.30 9.62 9.95 3.2%
Europe 4.36 4.20 4.29 4.36 4.42 4.49 4.57 4.65 4.74 4.84 1.8%
Asia Pacific
7.55 7.75 8.10 8.45 8.82 9.23 9.66 10.15 10.67 11.22 4.8%
Middle East
0.941 0.931 0.957 0.982 1.010 1.039 1.070 1.105 1.140 1.177 3.1%
Latin America
1.75 1.71 1.76 1.82 1.88 1.94 2.01 2.09 2.17 2.25 3.6%
Total 22.41 22.37 23.11 23.84 24.59 25.41 26.29 27.29 28.33 29.44 3.6%
Source: ICIS, Oil & Gas Journal, WLPGA, Platts, U.S. EIA, Company Annual Reports, Primary Interviews, GVR
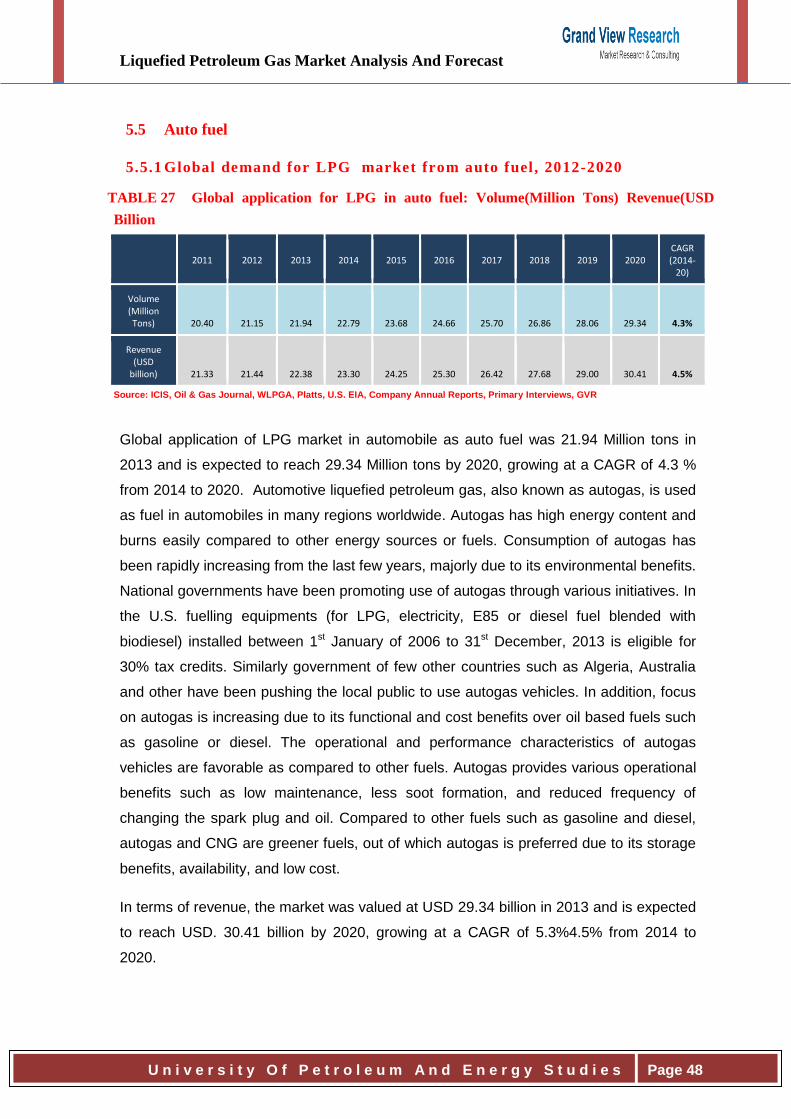
Liquefied Petroleum Gas Market Analysis And Forecast
U n i v e r s i t y O f P e t r o l e u m A n d E n e r g y S t u d i e s
Page 48
5.5 Auto fuel
5.5.1 Global demand for LPG market from auto fuel , 2012-2020
TABLE 27 Global application for LPG in auto fuel: Volume(Million Tons) Revenue(USD
Billion
2011 2012 2013 2014 2015 2016 2017 2018 2019 2020
CAGR (2014-
20)
Volume (Million Tons)
20.40
21.15
21.94
22.79
23.68
24.66
25.70
26.86
28.06
29.34 4.3%
Revenue (USD
billion)
21.33
21.44
22.38
23.30
24.25
25.30
26.42
27.68
29.00
30.41 4.5%
Source: ICIS, Oil & Gas Journal, WLPGA, Platts, U.S. EIA, Company Annual Reports, Primary Interviews, GVR
Global application of LPG market in automobile as auto fuel was 21.94 Million tons in
2013 and is expected to reach 29.34 Million tons by 2020, growing at a CAGR of 4.3 %
from 2014 to 2020. Automotive liquefied petroleum gas, also known as autogas, is used
as fuel in automobiles in many regions worldwide. Autogas has high energy content and
burns easily compared to other energy sources or fuels. Consumption of autogas has
been rapidly increasing from the last few years, majorly due to its environmental benefits.
National governments have been promoting use of autogas through various initiatives. In
the U.S. fuelling equipments (for LPG, electricity, E85 or diesel fuel blended with
biodiesel) installed between 1st January of 2006 to 31st December, 2013 is eligible for
30% tax credits. Similarly government of few other countries such as Algeria, Australia
and other have been pushing the local public to use autogas vehicles. In addition, focus
on autogas is increasing due to its functional and cost benefits over oil based fuels such
as gasoline or diesel. The operational and performance characteristics of autogas
vehicles are favorable as compared to other fuels. Autogas provides various operational
benefits such as low maintenance, less soot formation, and reduced frequency of
changing the spark plug and oil. Compared to other fuels such as gasoline and diesel,
autogas and CNG are greener fuels, out of which autogas is preferred due to its storage
benefits, availability, and low cost.
In terms of revenue, the market was valued at USD 29.34 billion in 2013 and is expected
to reach USD. 30.41 billion by 2020, growing at a CAGR of 5.3%4.5% from 2014 to
2020.
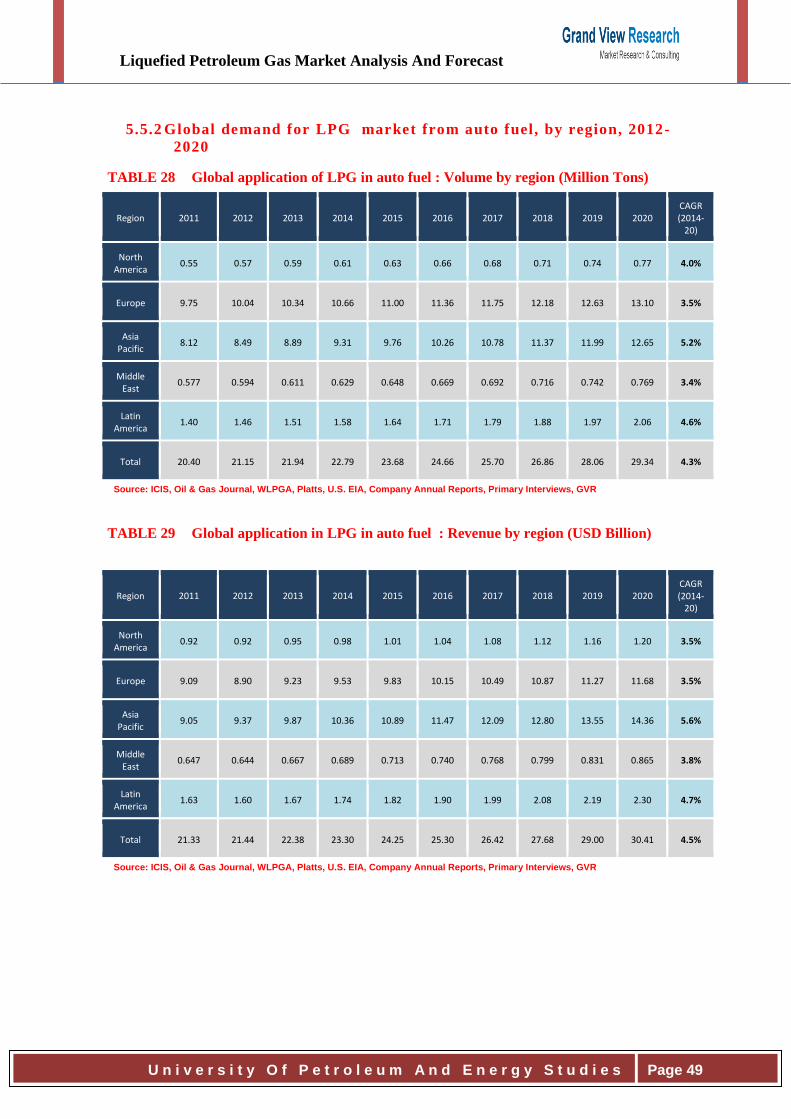
Liquefied Petroleum Gas Market Analysis And Forecast
U n i v e r s i t y O f P e t r o l e u m A n d E n e r g y S t u d i e s
Page 49
5.5.2 Global demand for LPG market from auto fuel, by region, 2012-
2020
TABLE 28 Global application of LPG in auto fuel : Volume by region (Million Tons)
Region 2011 2012 2013 2014 2015 2016 2017 2018 2019 2020 CAGR (2014-
20)
North America
0.55 0.57 0.59 0.61 0.63 0.66 0.68 0.71 0.74 0.77 4.0%
Europe 9.75 10.04 10.34 10.66 11.00 11.36 11.75 12.18 12.63 13.10 3.5%
Asia Pacific
8.12 8.49 8.89 9.31 9.76 10.26 10.78 11.37 11.99 12.65 5.2%
Middle East
0.577 0.594 0.611 0.629 0.648 0.669 0.692 0.716 0.742 0.769 3.4%
Latin America
1.40 1.46 1.51 1.58 1.64 1.71 1.79 1.88 1.97 2.06 4.6%
Total 20.40 21.15 21.94 22.79 23.68 24.66 25.70 26.86 28.06 29.34 4.3%
Source: ICIS, Oil & Gas Journal, WLPGA, Platts, U.S. EIA, Company Annual Reports, Primary Interviews, GVR
TABLE 29 Global application in LPG in auto fuel : Revenue by region (USD Billion)
Region 2011 2012 2013 2014 2015 2016 2017 2018 2019 2020 CAGR (2014-
20)
North America
0.92 0.92 0.95 0.98 1.01 1.04 1.08 1.12 1.16 1.20 3.5%
Europe 9.09 8.90 9.23 9.53 9.83 10.15 10.49 10.87 11.27 11.68 3.5%
Asia Pacific
9.05 9.37 9.87 10.36 10.89 11.47 12.09 12.80 13.55 14.36 5.6%
Middle East
0.647 0.644 0.667 0.689 0.713 0.740 0.768 0.799 0.831 0.865 3.8%
Latin America
1.63 1.60 1.67 1.74 1.82 1.90 1.99 2.08 2.19 2.30 4.7%
Total 21.33 21.44 22.38 23.30 24.25 25.30 26.42 27.68 29.00 30.41 4.5%
Source: ICIS, Oil & Gas Journal, WLPGA, Platts, U.S. EIA, Company Annual Reports, Primary Interviews, GVR
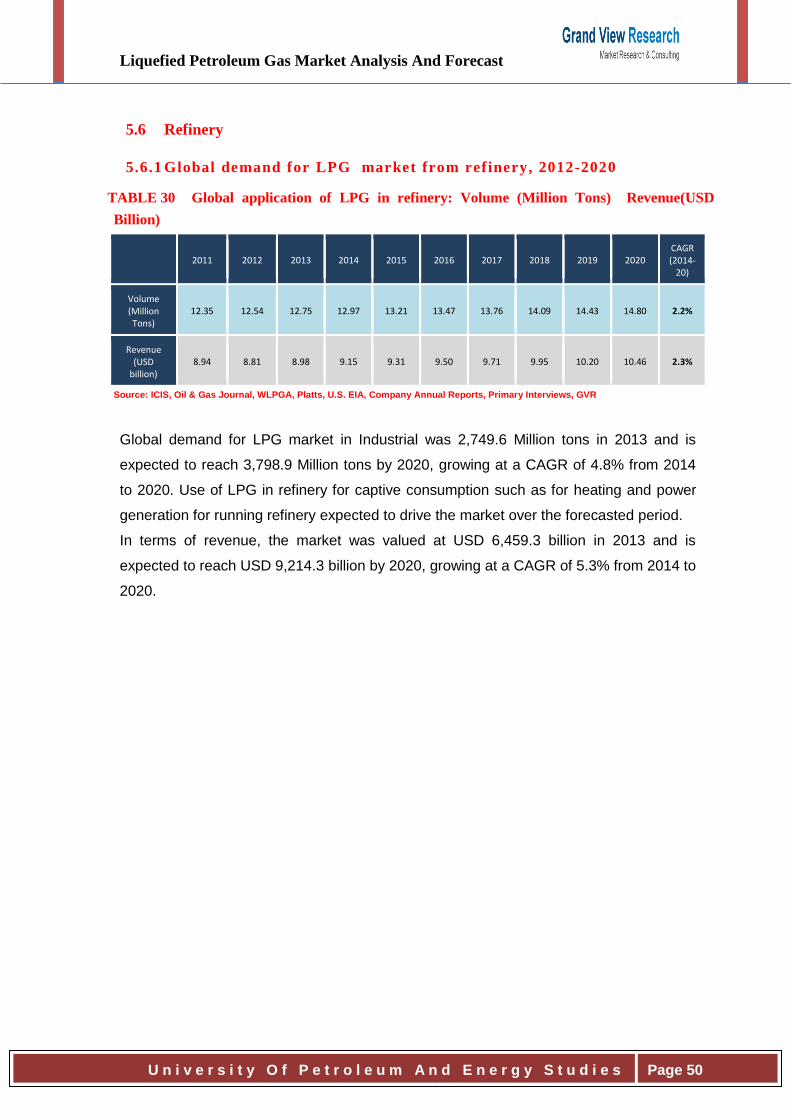
Liquefied Petroleum Gas Market Analysis And Forecast
U n i v e r s i t y O f P e t r o l e u m A n d E n e r g y S t u d i e s
Page 50
5.6 Refinery
5.6.1 Global demand for LPG market from refinery, 2012-2020
TABLE 30 Global application of LPG in refinery: Volume (Million Tons) Revenue(USD
Billion)
2011 2012 2013 2014 2015 2016 2017 2018 2019 2020
CAGR (2014-
20)
Volume (Million Tons)
12.35 12.54 12.75 12.97 13.21 13.47 13.76 14.09 14.43 14.80 2.2%
Revenue (USD
billion) 8.94 8.81 8.98 9.15 9.31 9.50 9.71 9.95 10.20 10.46 2.3%
Source: ICIS, Oil & Gas Journal, WLPGA, Platts, U.S. EIA, Company Annual Reports, Primary Interviews, GVR
Global demand for LPG market in Industrial was 2,749.6 Million tons in 2013 and is
expected to reach 3,798.9 Million tons by 2020, growing at a CAGR of 4.8% from 2014
to 2020. Use of LPG in refinery for captive consumption such as for heating and power
generation for running refinery expected to drive the market over the forecasted period.
In terms of revenue, the market was valued at USD 6,459.3 billion in 2013 and is
expected to reach USD 9,214.3 billion by 2020, growing at a CAGR of 5.3% from 2014 to
2020.

Liquefied Petroleum Gas Market Analysis And Forecast
U n i v e r s i t y O f P e t r o l e u m A n d E n e r g y S t u d i e s
Page 51
5.6.2 Global demand for LPG market from refinery, by region, 2012-
2020
TABLE 31 Global application of LPG in refinery : Volume by region, (Million Tons)
Region 2011 2012 2013 2014 2015 2016 2017 2018 2019 2020 CAGR (2014-
20)
North America
6.06 6.09 6.12 6.16 6.20 6.24 6.30 6.36 6.43 6.49 0.9%
Europe 2.65 2.66 2.67 2.68 2.69 2.71 2.72 2.75 2.77 2.79 0.7%
Asia Pacific
2.86 2.99 3.13 3.28 3.45 3.62 3.81 4.02 4.25 4.48 5.3%
Middle East
0.180 0.184 0.188 0.192 0.196 0.201 0.206 0.211 0.216 0.222 2.4%
Latin America
0.61 0.63 0.64 0.66 0.68 0.70 0.72 0.75 0.77 0.80 3.3%
Total 12.35 12.54 12.75 12.97 13.21 13.47 13.76 14.09 14.43 14.80 2.2%
Source: ICIS, Oil & Gas Journal, WLPGA, Platts, U.S. EIA, Company Annual Reports, Primary Interviews, GVR
TABLE 32 Global LPG market revenue for refinery by region, 2012 – 2020 (USD Billion)
Region 2011 2012 2013 2014 2015 2016 2017 2018 2019 2020 CAGR (2014-
20)
North America
4.13 4.02 4.04 4.05 4.05 4.07 4.08 4.11 4.13 4.15 0.4%
Europe 1.82 1.74 1.76 1.77 1.78 1.80 1.81 1.83 1.85 1.87 0.9%
Asia Pacific
2.26 2.34 2.46 2.58 2.71 2.86 3.01 3.18 3.37 3.56 5.5%
Middle East
0.176 0.174 0.179 0.184 0.188 0.194 0.199 0.205 0.212 0.218 2.9%
Latin America
0.55 0.53 0.55 0.56 0.57 0.59 0.61 0.62 0.64 0.66 2.9%
Total 8.94 8.81 8.98 9.15 9.31 9.50 9.71 9.95 10.20 10.46 2.3%
Source: ICIS, Oil & Gas Journal, WLPGA, Platts, U.S. EIA, Company Annual Reports, Primary Interviews, GVR
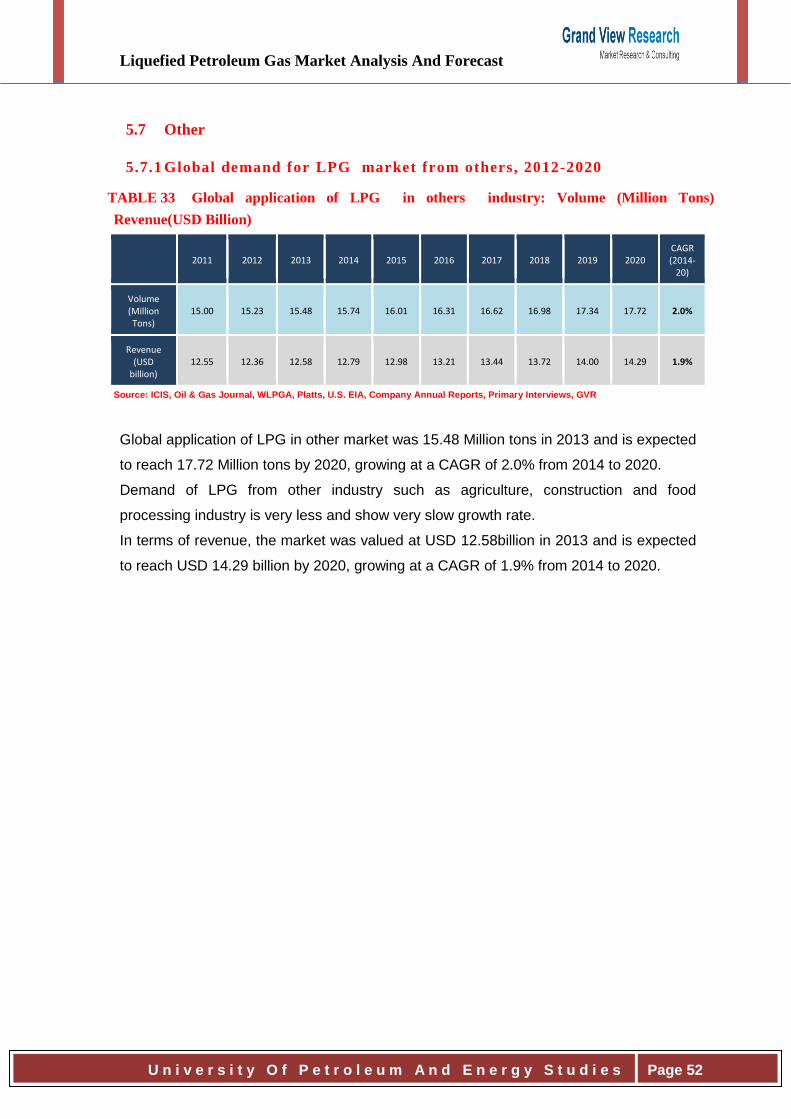
Liquefied Petroleum Gas Market Analysis And Forecast
U n i v e r s i t y O f P e t r o l e u m A n d E n e r g y S t u d i e s
Page 52
5.7 Other
5.7.1 Global demand for LPG market from others, 2012-2020
TABLE 33 Global application of LPG in others industry: Volume (Million Tons)
Revenue(USD Billion)
2011 2012 2013 2014 2015 2016 2017 2018 2019 2020
CAGR (2014-
20)
Volume (Million Tons)
15.00 15.23 15.48 15.74 16.01 16.31 16.62 16.98 17.34 17.72 2.0%
Revenue (USD
billion) 12.55 12.36 12.58 12.79 12.98 13.21 13.44 13.72 14.00 14.29 1.9%
Source: ICIS, Oil & Gas Journal, WLPGA, Platts, U.S. EIA, Company Annual Reports, Primary Interviews, GVR
Global application of LPG in other market was 15.48 Million tons in 2013 and is expected
to reach 17.72 Million tons by 2020, growing at a CAGR of 2.0% from 2014 to 2020.
Demand of LPG from other industry such as agriculture, construction and food
processing industry is very less and show very slow growth rate.
In terms of revenue, the market was valued at USD 12.58billion in 2013 and is expected
to reach USD 14.29 billion by 2020, growing at a CAGR of 1.9% from 2014 to 2020.
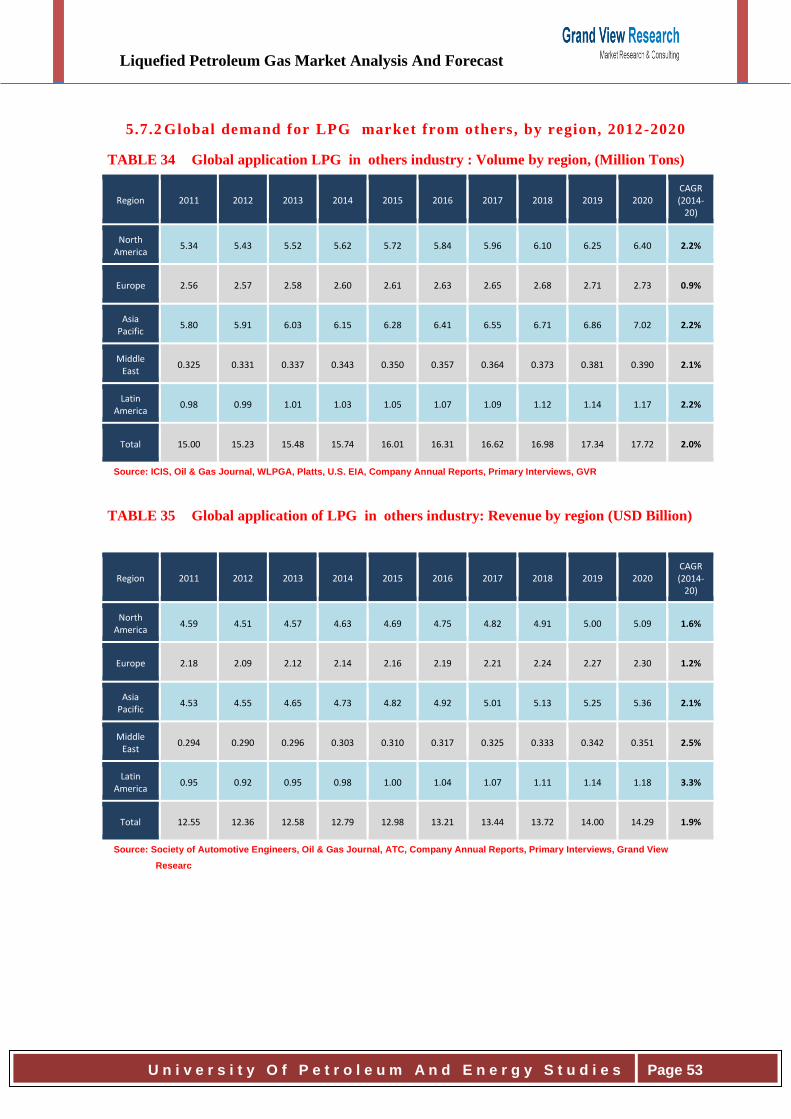
Liquefied Petroleum Gas Market Analysis And Forecast
U n i v e r s i t y O f P e t r o l e u m A n d E n e r g y S t u d i e s
Page 53
5.7.2 Global demand for LPG market from others, by region, 2012-2020
TABLE 34 Global application LPG in others industry : Volume by region, (Million Tons)
Region 2011 2012 2013 2014 2015 2016 2017 2018 2019 2020 CAGR (2014-
20)
North America
5.34 5.43 5.52 5.62 5.72 5.84 5.96 6.10 6.25 6.40 2.2%
Europe 2.56 2.57 2.58 2.60 2.61 2.63 2.65 2.68 2.71 2.73 0.9%
Asia Pacific
5.80 5.91 6.03 6.15 6.28 6.41 6.55 6.71 6.86 7.02 2.2%
Middle East
0.325 0.331 0.337 0.343 0.350 0.357 0.364 0.373 0.381 0.390 2.1%
Latin America
0.98 0.99 1.01 1.03 1.05 1.07 1.09 1.12 1.14 1.17 2.2%
Total 15.00 15.23 15.48 15.74 16.01 16.31 16.62 16.98 17.34 17.72 2.0%
Source: ICIS, Oil & Gas Journal, WLPGA, Platts, U.S. EIA, Company Annual Reports, Primary Interviews, GVR
TABLE 35 Global application of LPG in others industry: Revenue by region (USD Billion)
Region 2011 2012 2013 2014 2015 2016 2017 2018 2019 2020 CAGR (2014-
20)
North America
4.59 4.51 4.57 4.63 4.69 4.75 4.82 4.91 5.00 5.09 1.6%
Europe 2.18 2.09 2.12 2.14 2.16 2.19 2.21 2.24 2.27 2.30 1.2%
Asia Pacific
4.53 4.55 4.65 4.73 4.82 4.92 5.01 5.13 5.25 5.36 2.1%
Middle East
0.294 0.290 0.296 0.303 0.310 0.317 0.325 0.333 0.342 0.351 2.5%
Latin America
0.95 0.92 0.95 0.98 1.00 1.04 1.07 1.11 1.14 1.18 3.3%
Total 12.55 12.36 12.58 12.79 12.98 13.21 13.44 13.72 14.00 14.29 1.9%
Source: Society of Automotive Engineers, Oil & Gas Journal, ATC, Company Annual Reports, Primary Interviews, Grand View
Researc
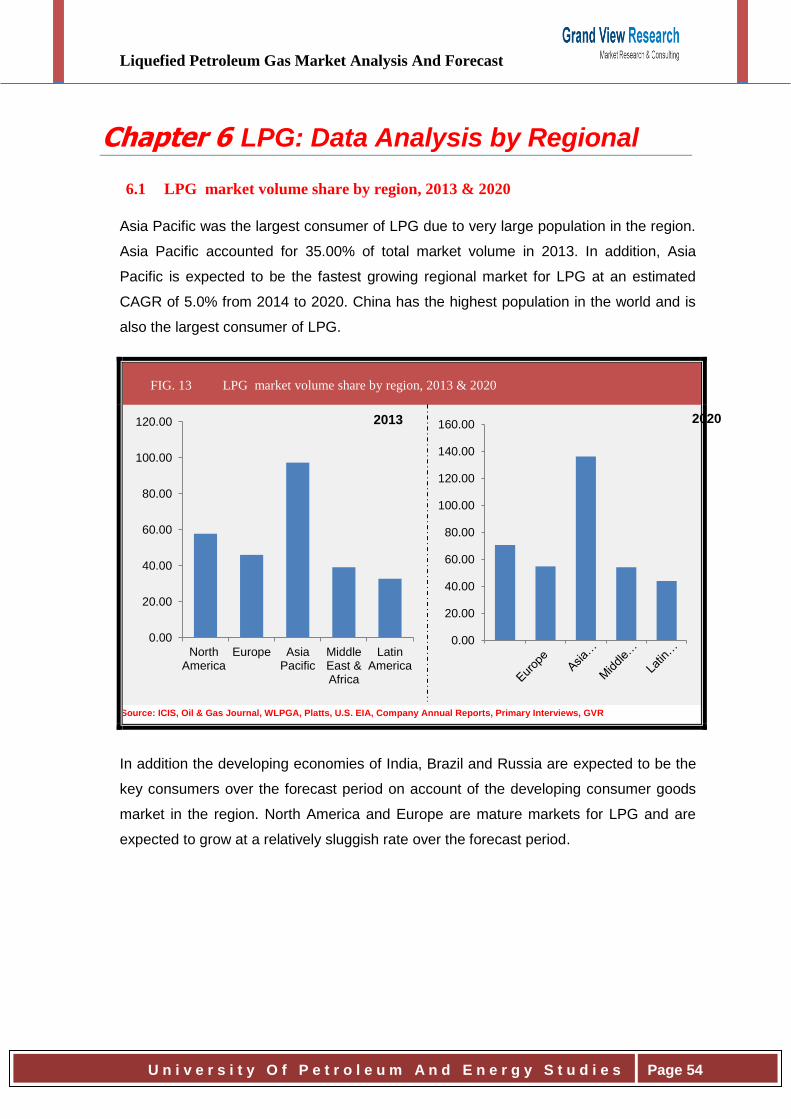
Liquefied Petroleum Gas Market Analysis And Forecast
U n i v e r s i t y O f P e t r o l e u m A n d E n e r g y S t u d i e s
Page 54
Chapter 6 LPG: Data Analysis by Regional
6.1 LPG market volume share by region, 2013 & 2020
Asia Pacific was the largest consumer of LPG due to very large population in the region.
Asia Pacific accounted for 35.00% of total market volume in 2013. In addition, Asia
Pacific is expected to be the fastest growing regional market for LPG at an estimated
CAGR of 5.0% from 2014 to 2020. China has the highest population in the world and is
also the largest consumer of LPG.
FIG. 13 LPG market volume share by region, 2013 & 2020
Source: ICIS, Oil & Gas Journal, WLPGA, Platts, U.S. EIA, Company Annual Reports, Primary Interviews, GVR
In addition the developing economies of India, Brazil and Russia are expected to be the
key consumers over the forecast period on account of the developing consumer goods
market in the region. North America and Europe are mature markets for LPG and are
expected to grow at a relatively sluggish rate over the forecast period.
NorthAmerica
Europe AsiaPacific
MiddleEast &Africa
LatinAmerica
0.00
20.00
40.00
60.00
80.00
100.00
120.00
0.00
20.00
40.00
60.00
80.00
100.00
120.00
140.00
160.002013 2020
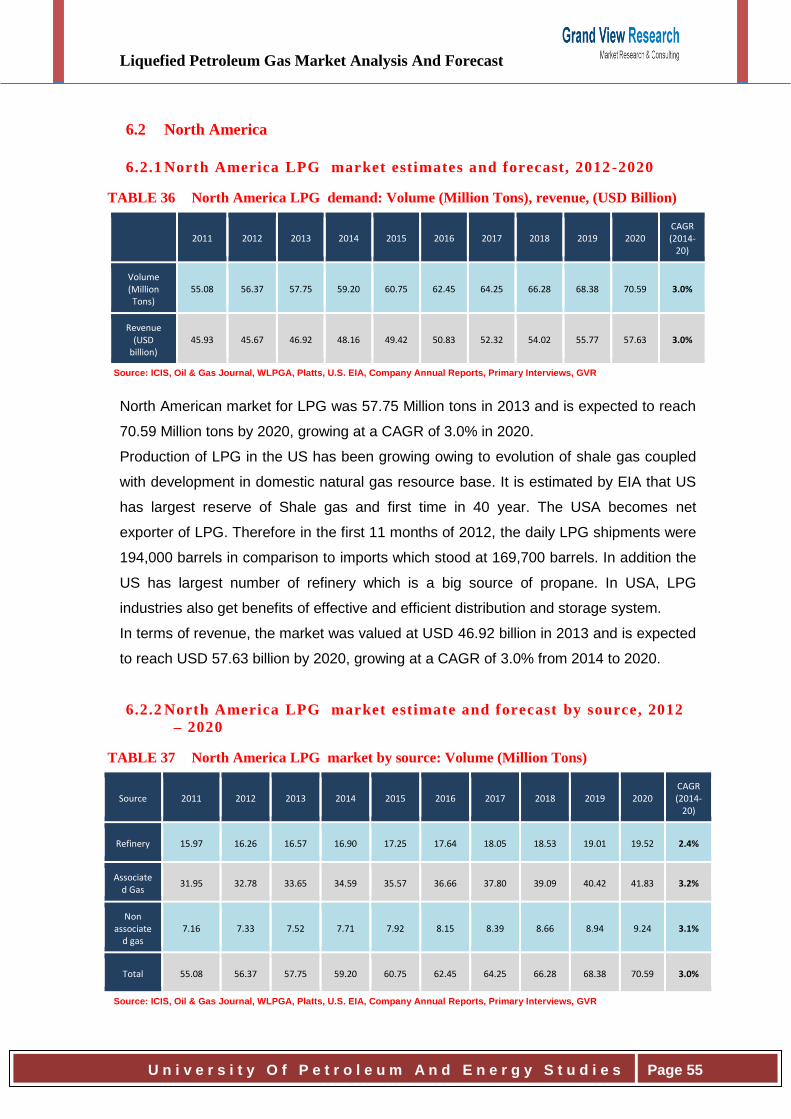
Liquefied Petroleum Gas Market Analysis And Forecast
U n i v e r s i t y O f P e t r o l e u m A n d E n e r g y S t u d i e s
Page 55
6.2 North America
6.2.1 North America LPG market estimates and forecast, 2012-2020
TABLE 36 North America LPG demand: Volume (Million Tons), revenue, (USD Billion)
2011 2012 2013 2014 2015 2016 2017 2018 2019 2020
CAGR (2014-
20)
Volume (Million Tons)
55.08 56.37 57.75 59.20 60.75 62.45 64.25 66.28 68.38 70.59 3.0%
Revenue (USD
billion) 45.93 45.67 46.92 48.16 49.42 50.83 52.32 54.02 55.77 57.63 3.0%
Source: ICIS, Oil & Gas Journal, WLPGA, Platts, U.S. EIA, Company Annual Reports, Primary Interviews, GVR
North American market for LPG was 57.75 Million tons in 2013 and is expected to reach
70.59 Million tons by 2020, growing at a CAGR of 3.0% in 2020.
Production of LPG in the US has been growing owing to evolution of shale gas coupled
with development in domestic natural gas resource base. It is estimated by EIA that US
has largest reserve of Shale gas and first time in 40 year. The USA becomes net
exporter of LPG. Therefore in the first 11 months of 2012, the daily LPG shipments were
194,000 barrels in comparison to imports which stood at 169,700 barrels. In addition the
US has largest number of refinery which is a big source of propane. In USA, LPG
industries also get benefits of effective and efficient distribution and storage system.
In terms of revenue, the market was valued at USD 46.92 billion in 2013 and is expected
to reach USD 57.63 billion by 2020, growing at a CAGR of 3.0% from 2014 to 2020.
6.2.2 North America LPG market estimate and forecast by source, 2012
– 2020
TABLE 37 North America LPG market by source: Volume (Million Tons)
Source 2011 2012 2013 2014 2015 2016 2017 2018 2019 2020 CAGR (2014-
20)
Refinery 15.97 16.26 16.57 16.90 17.25 17.64 18.05 18.53 19.01 19.52 2.4%
Associated Gas
31.95 32.78 33.65 34.59 35.57 36.66 37.80 39.09 40.42 41.83 3.2%
Non associate
d gas 7.16 7.33 7.52 7.71 7.92 8.15 8.39 8.66 8.94 9.24 3.1%
Total 55.08 56.37 57.75 59.20 60.75 62.45 64.25 66.28 68.38 70.59 3.0%
Source: ICIS, Oil & Gas Journal, WLPGA, Platts, U.S. EIA, Company Annual Reports, Primary Interviews, GVR
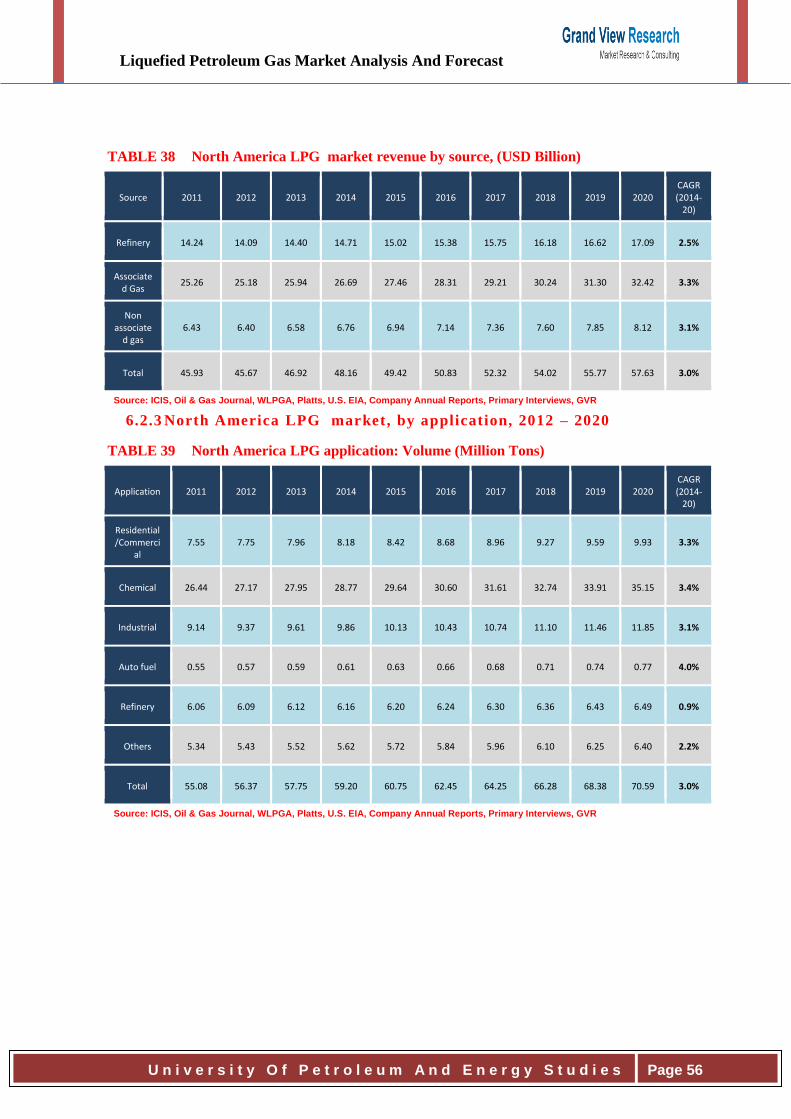
Liquefied Petroleum Gas Market Analysis And Forecast
U n i v e r s i t y O f P e t r o l e u m A n d E n e r g y S t u d i e s
Page 56
TABLE 38 North America LPG market revenue by source, (USD Billion)
Source 2011 2012 2013 2014 2015 2016 2017 2018 2019 2020 CAGR (2014-
20)
Refinery 14.24 14.09 14.40 14.71 15.02 15.38 15.75 16.18 16.62 17.09 2.5%
Associated Gas
25.26 25.18 25.94 26.69 27.46 28.31 29.21 30.24 31.30 32.42 3.3%
Non associate
d gas 6.43 6.40 6.58 6.76 6.94 7.14 7.36 7.60 7.85 8.12 3.1%
Total 45.93 45.67 46.92 48.16 49.42 50.83 52.32 54.02 55.77 57.63 3.0%
Source: ICIS, Oil & Gas Journal, WLPGA, Platts, U.S. EIA, Company Annual Reports, Primary Interviews, GVR
6.2.3 North America LPG market, by application, 2012 – 2020
TABLE 39 North America LPG application: Volume (Million Tons)
Application 2011 2012 2013 2014 2015 2016 2017 2018 2019 2020 CAGR (2014-
20)
Residential/Commerci
al 7.55 7.75 7.96 8.18 8.42 8.68 8.96 9.27 9.59 9.93 3.3%
Chemical 26.44 27.17 27.95 28.77 29.64 30.60 31.61 32.74 33.91 35.15 3.4%
Industrial 9.14 9.37 9.61 9.86 10.13 10.43 10.74 11.10 11.46 11.85 3.1%
Auto fuel 0.55 0.57 0.59 0.61 0.63 0.66 0.68 0.71 0.74 0.77 4.0%
Refinery 6.06 6.09 6.12 6.16 6.20 6.24 6.30 6.36 6.43 6.49 0.9%
Others 5.34 5.43 5.52 5.62 5.72 5.84 5.96 6.10 6.25 6.40 2.2%
Total 55.08 56.37 57.75 59.20 60.75 62.45 64.25 66.28 68.38 70.59 3.0%
Source: ICIS, Oil & Gas Journal, WLPGA, Platts, U.S. EIA, Company Annual Reports, Primary Interviews, GVR
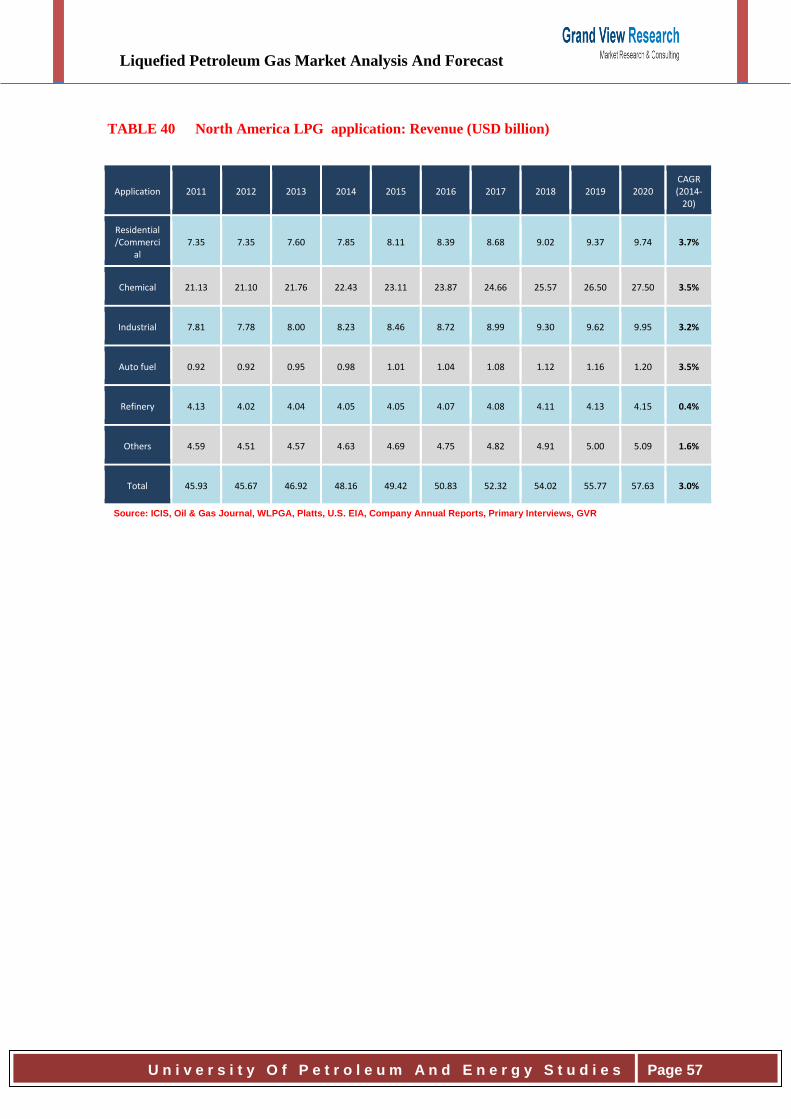
Liquefied Petroleum Gas Market Analysis And Forecast
U n i v e r s i t y O f P e t r o l e u m A n d E n e r g y S t u d i e s
Page 57
TABLE 40 North America LPG application: Revenue (USD billion)
Application 2011 2012 2013 2014 2015 2016 2017 2018 2019 2020 CAGR (2014-
20)
Residential/Commerci
al 7.35 7.35 7.60 7.85 8.11 8.39 8.68 9.02 9.37 9.74 3.7%
Chemical 21.13 21.10 21.76 22.43 23.11 23.87 24.66 25.57 26.50 27.50 3.5%
Industrial 7.81 7.78 8.00 8.23 8.46 8.72 8.99 9.30 9.62 9.95 3.2%
Auto fuel 0.92 0.92 0.95 0.98 1.01 1.04 1.08 1.12 1.16 1.20 3.5%
Refinery 4.13 4.02 4.04 4.05 4.05 4.07 4.08 4.11 4.13 4.15 0.4%
Others 4.59 4.51 4.57 4.63 4.69 4.75 4.82 4.91 5.00 5.09 1.6%
Total 45.93 45.67 46.92 48.16 49.42 50.83 52.32 54.02 55.77 57.63 3.0%
Source: ICIS, Oil & Gas Journal, WLPGA, Platts, U.S. EIA, Company Annual Reports, Primary Interviews, GVR
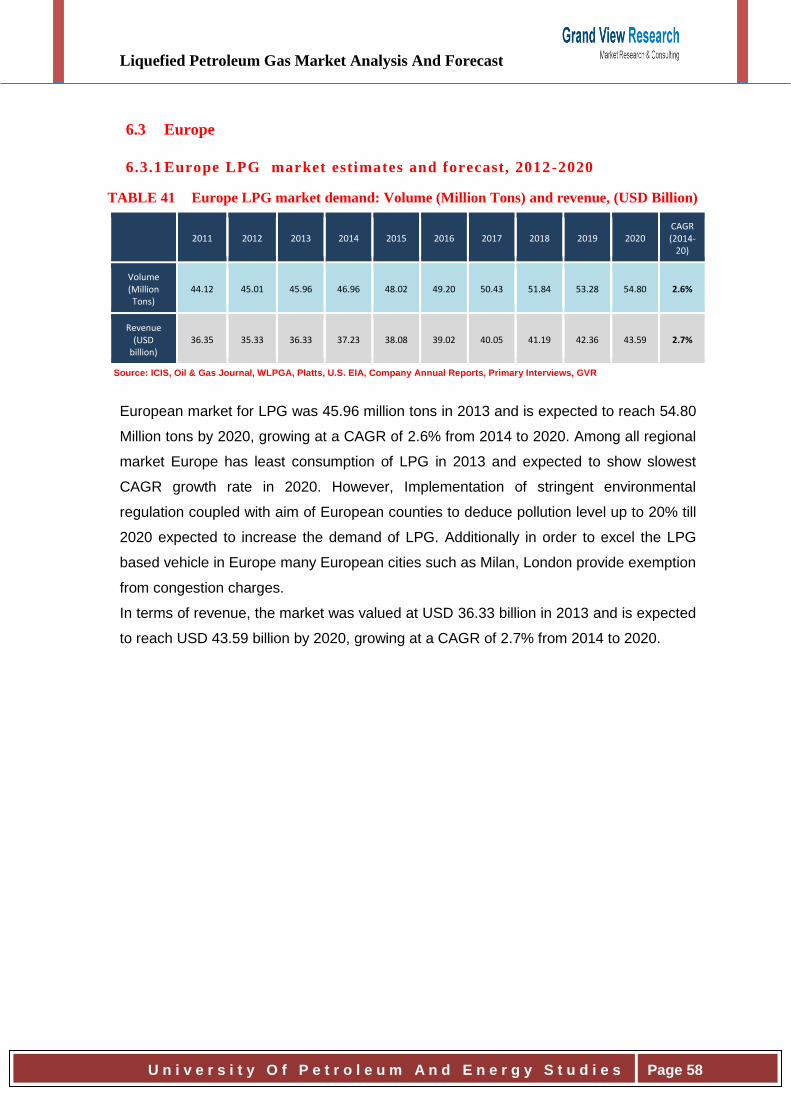
Liquefied Petroleum Gas Market Analysis And Forecast
U n i v e r s i t y O f P e t r o l e u m A n d E n e r g y S t u d i e s
Page 58
6.3 Europe
6.3.1 Europe LPG market estimates and forecast, 2012-2020
TABLE 41 Europe LPG market demand: Volume (Million Tons) and revenue, (USD Billion)
2011 2012 2013 2014 2015 2016 2017 2018 2019 2020
CAGR (2014-
20)
Volume (Million Tons)
44.12 45.01 45.96 46.96 48.02 49.20 50.43 51.84 53.28 54.80 2.6%
Revenue (USD
billion) 36.35 35.33 36.33 37.23 38.08 39.02 40.05 41.19 42.36 43.59 2.7%
Source: ICIS, Oil & Gas Journal, WLPGA, Platts, U.S. EIA, Company Annual Reports, Primary Interviews, GVR
European market for LPG was 45.96 million tons in 2013 and is expected to reach 54.80
Million tons by 2020, growing at a CAGR of 2.6% from 2014 to 2020. Among all regional
market Europe has least consumption of LPG in 2013 and expected to show slowest
CAGR growth rate in 2020. However, Implementation of stringent environmental
regulation coupled with aim of European counties to deduce pollution level up to 20% till
2020 expected to increase the demand of LPG. Additionally in order to excel the LPG
based vehicle in Europe many European cities such as Milan, London provide exemption
from congestion charges.
In terms of revenue, the market was valued at USD 36.33 billion in 2013 and is expected
to reach USD 43.59 billion by 2020, growing at a CAGR of 2.7% from 2014 to 2020.
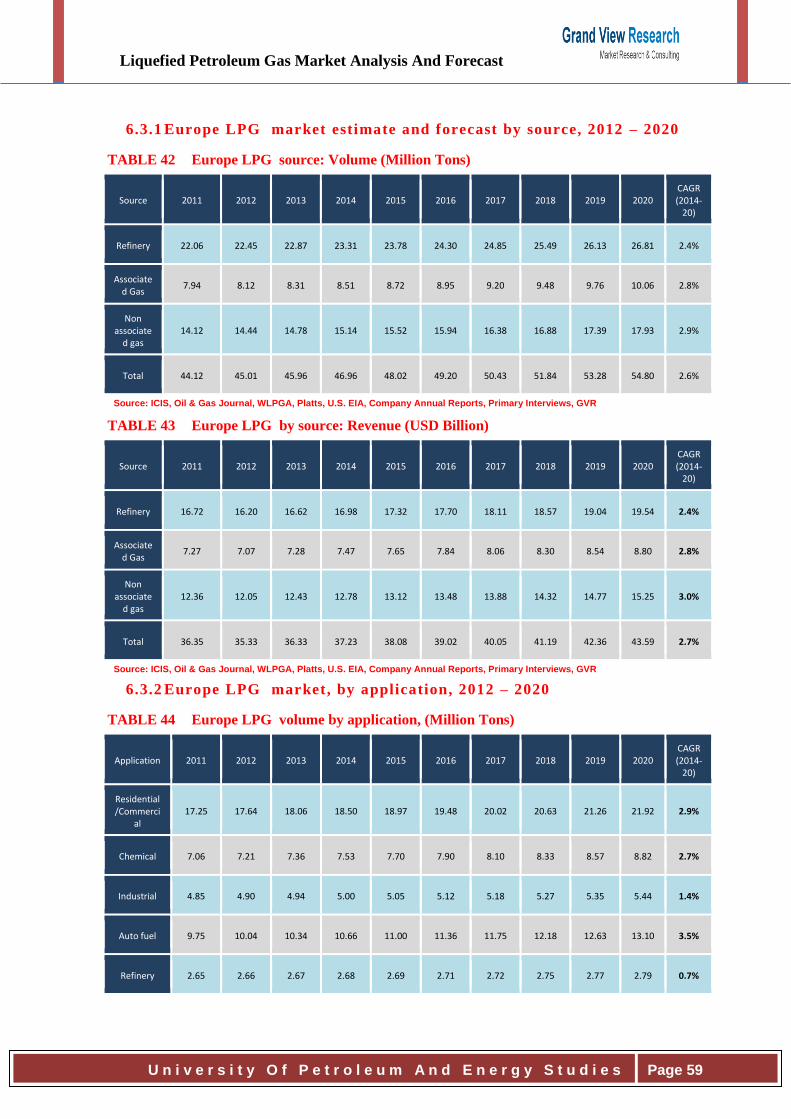
Liquefied Petroleum Gas Market Analysis And Forecast
U n i v e r s i t y O f P e t r o l e u m A n d E n e r g y S t u d i e s
Page 59
6.3.1 Europe LPG market estimate and forecast by source, 2012 – 2020
TABLE 42 Europe LPG source: Volume (Million Tons)
Source 2011 2012 2013 2014 2015 2016 2017 2018 2019 2020 CAGR (2014-
20)
Refinery 22.06 22.45 22.87 23.31 23.78 24.30 24.85 25.49 26.13 26.81 2.4%
Associated Gas
7.94 8.12 8.31 8.51 8.72 8.95 9.20 9.48 9.76 10.06 2.8%
Non associate
d gas 14.12 14.44 14.78 15.14 15.52 15.94 16.38 16.88 17.39 17.93 2.9%
Total 44.12 45.01 45.96 46.96 48.02 49.20 50.43 51.84 53.28 54.80 2.6%
Source: ICIS, Oil & Gas Journal, WLPGA, Platts, U.S. EIA, Company Annual Reports, Primary Interviews, GVR
TABLE 43 Europe LPG by source: Revenue (USD Billion)
Source 2011 2012 2013 2014 2015 2016 2017 2018 2019 2020 CAGR (2014-
20)
Refinery 16.72 16.20 16.62 16.98 17.32 17.70 18.11 18.57 19.04 19.54 2.4%
Associated Gas
7.27 7.07 7.28 7.47 7.65 7.84 8.06 8.30 8.54 8.80 2.8%
Non associate
d gas 12.36 12.05 12.43 12.78 13.12 13.48 13.88 14.32 14.77 15.25 3.0%
Total 36.35 35.33 36.33 37.23 38.08 39.02 40.05 41.19 42.36 43.59 2.7%
Source: ICIS, Oil & Gas Journal, WLPGA, Platts, U.S. EIA, Company Annual Reports, Primary Interviews, GVR
6.3.2 Europe LPG market, by application, 2012 – 2020
TABLE 44 Europe LPG volume by application, (Million Tons)
Application 2011 2012 2013 2014 2015 2016 2017 2018 2019 2020 CAGR (2014-
20)
Residential/Commerci
al 17.25 17.64 18.06 18.50 18.97 19.48 20.02 20.63 21.26 21.92 2.9%
Chemical 7.06 7.21 7.36 7.53 7.70 7.90 8.10 8.33 8.57 8.82 2.7%
Industrial 4.85 4.90 4.94 5.00 5.05 5.12 5.18 5.27 5.35 5.44 1.4%
Auto fuel 9.75 10.04 10.34 10.66 11.00 11.36 11.75 12.18 12.63 13.10 3.5%
Refinery 2.65 2.66 2.67 2.68 2.69 2.71 2.72 2.75 2.77 2.79 0.7%
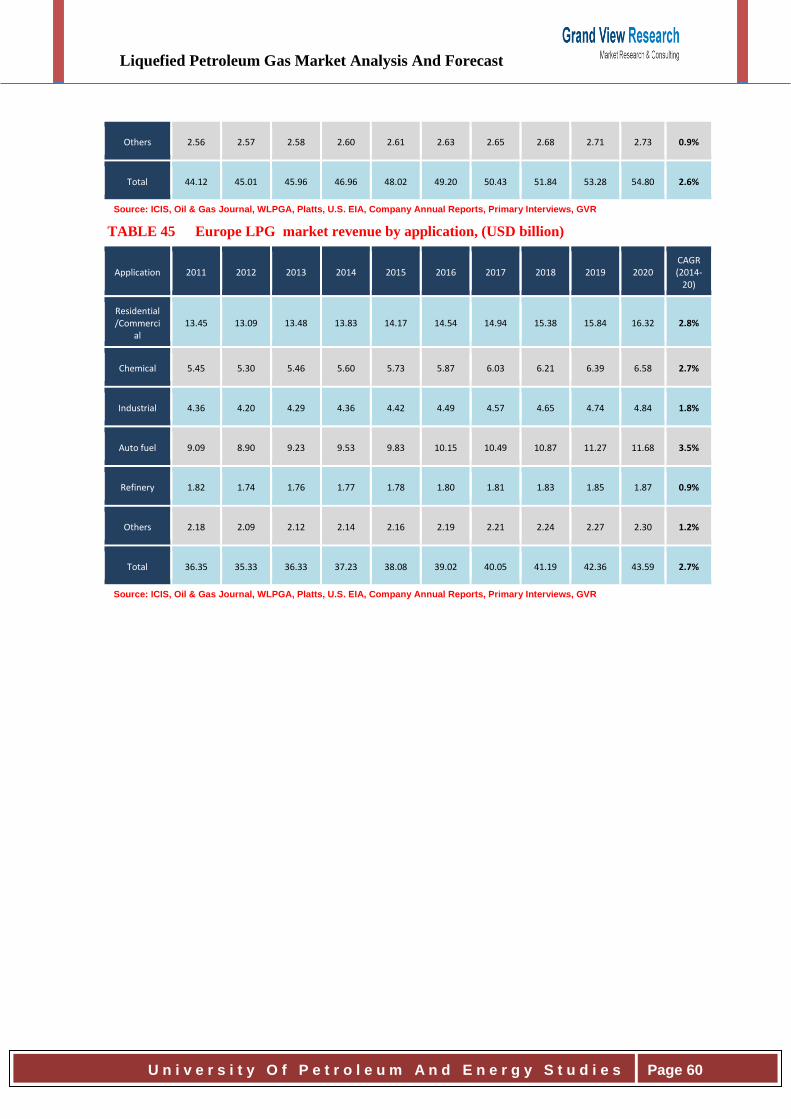
Liquefied Petroleum Gas Market Analysis And Forecast
U n i v e r s i t y O f P e t r o l e u m A n d E n e r g y S t u d i e s
Page 60
Others 2.56 2.57 2.58 2.60 2.61 2.63 2.65 2.68 2.71 2.73 0.9%
Total 44.12 45.01 45.96 46.96 48.02 49.20 50.43 51.84 53.28 54.80 2.6%
Source: ICIS, Oil & Gas Journal, WLPGA, Platts, U.S. EIA, Company Annual Reports, Primary Interviews, GVR
TABLE 45 Europe LPG market revenue by application, (USD billion)
Application 2011 2012 2013 2014 2015 2016 2017 2018 2019 2020 CAGR (2014-
20)
Residential/Commerci
al 13.45 13.09 13.48 13.83 14.17 14.54 14.94 15.38 15.84 16.32 2.8%
Chemical 5.45 5.30 5.46 5.60 5.73 5.87 6.03 6.21 6.39 6.58 2.7%
Industrial 4.36 4.20 4.29 4.36 4.42 4.49 4.57 4.65 4.74 4.84 1.8%
Auto fuel 9.09 8.90 9.23 9.53 9.83 10.15 10.49 10.87 11.27 11.68 3.5%
Refinery 1.82 1.74 1.76 1.77 1.78 1.80 1.81 1.83 1.85 1.87 0.9%
Others 2.18 2.09 2.12 2.14 2.16 2.19 2.21 2.24 2.27 2.30 1.2%
Total 36.35 35.33 36.33 37.23 38.08 39.02 40.05 41.19 42.36 43.59 2.7%
Source: ICIS, Oil & Gas Journal, WLPGA, Platts, U.S. EIA, Company Annual Reports, Primary Interviews, GVR
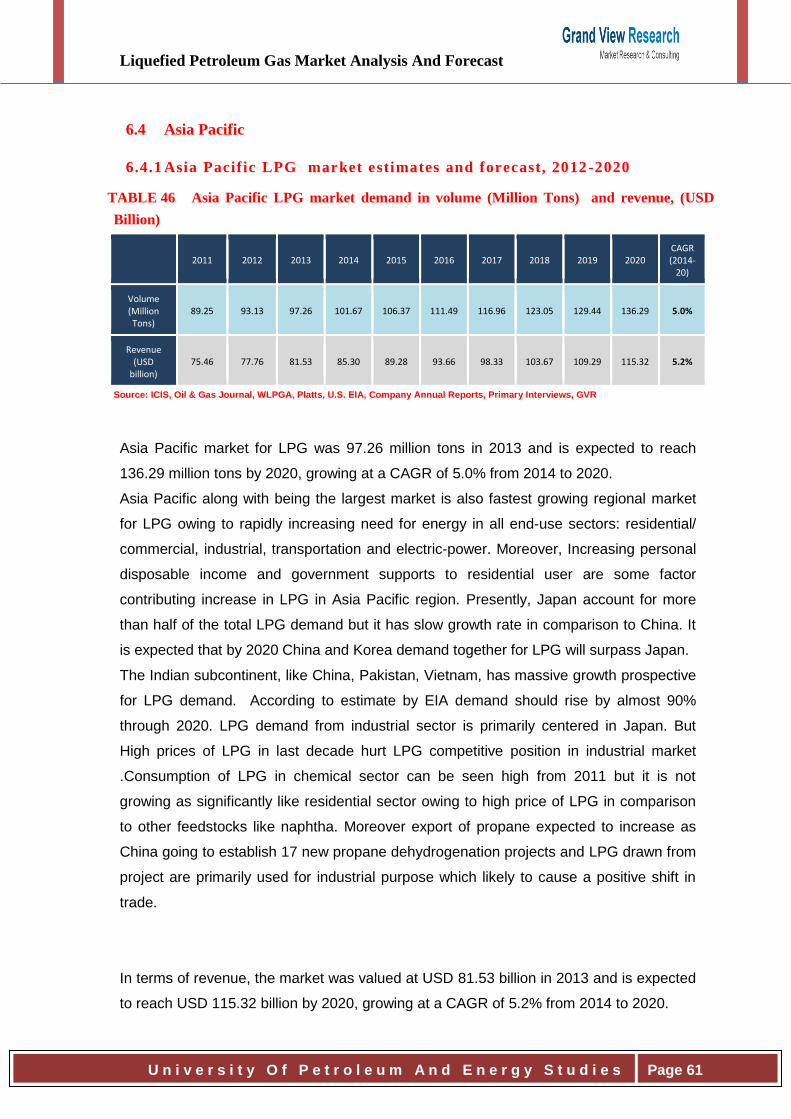
Liquefied Petroleum Gas Market Analysis And Forecast
U n i v e r s i t y O f P e t r o l e u m A n d E n e r g y S t u d i e s
Page 61
6.4 Asia Pacific
6.4.1 Asia Pacific LPG market estimates and forecast, 2012-2020
TABLE 46 Asia Pacific LPG market demand in volume (Million Tons) and revenue, (USD
Billion)
2011 2012 2013 2014 2015 2016 2017 2018 2019 2020
CAGR (2014-
20)
Volume (Million Tons)
89.25 93.13 97.26 101.67 106.37 111.49 116.96 123.05 129.44 136.29 5.0%
Revenue (USD
billion) 75.46 77.76 81.53 85.30 89.28 93.66 98.33 103.67 109.29 115.32 5.2%
Source: ICIS, Oil & Gas Journal, WLPGA, Platts, U.S. EIA, Company Annual Reports, Primary Interviews, GVR
Asia Pacific market for LPG was 97.26 million tons in 2013 and is expected to reach
136.29 million tons by 2020, growing at a CAGR of 5.0% from 2014 to 2020.
Asia Pacific along with being the largest market is also fastest growing regional market
for LPG owing to rapidly increasing need for energy in all end-use sectors: residential/
commercial, industrial, transportation and electric-power. Moreover, Increasing personal
disposable income and government supports to residential user are some factor
contributing increase in LPG in Asia Pacific region. Presently, Japan account for more
than half of the total LPG demand but it has slow growth rate in comparison to China. It
is expected that by 2020 China and Korea demand together for LPG will surpass Japan.
The Indian subcontinent, like China, Pakistan, Vietnam, has massive growth prospective
for LPG demand. According to estimate by EIA demand should rise by almost 90%
through 2020. LPG demand from industrial sector is primarily centered in Japan. But
High prices of LPG in last decade hurt LPG competitive position in industrial market
.Consumption of LPG in chemical sector can be seen high from 2011 but it is not
growing as significantly like residential sector owing to high price of LPG in comparison
to other feedstocks like naphtha. Moreover export of propane expected to increase as
China going to establish 17 new propane dehydrogenation projects and LPG drawn from
project are primarily used for industrial purpose which likely to cause a positive shift in
trade.
In terms of revenue, the market was valued at USD 81.53 billion in 2013 and is expected
to reach USD 115.32 billion by 2020, growing at a CAGR of 5.2% from 2014 to 2020.
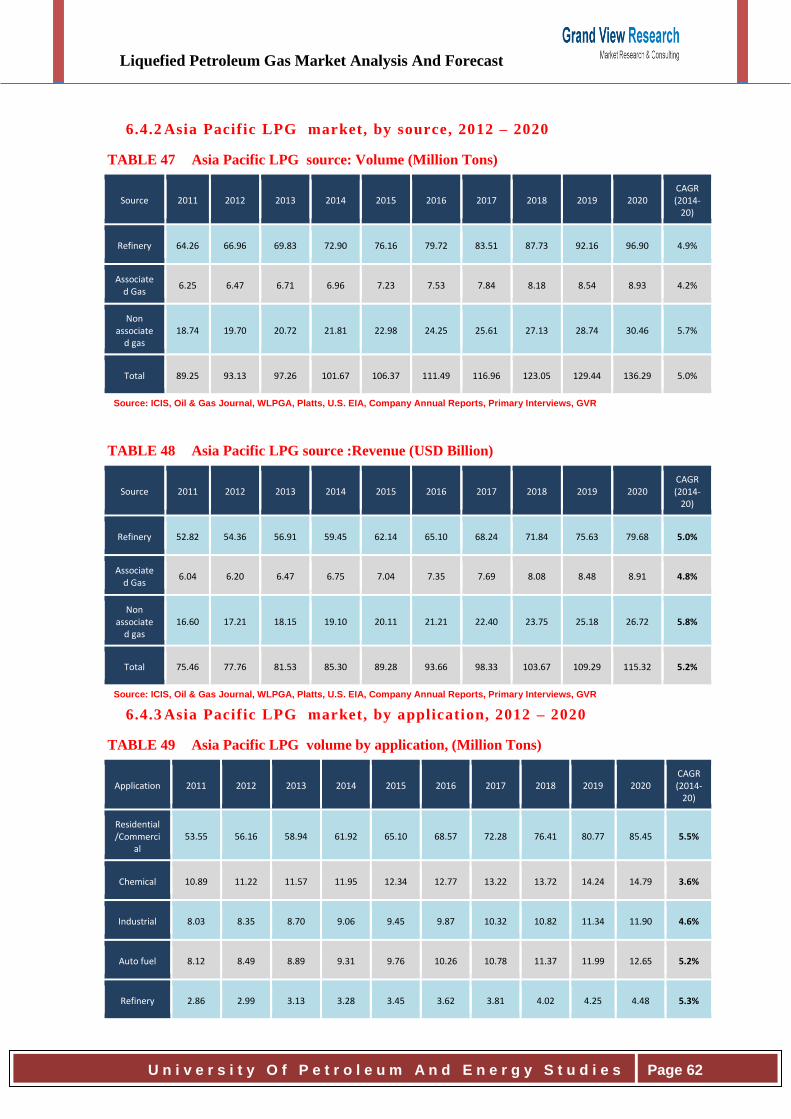
Liquefied Petroleum Gas Market Analysis And Forecast
U n i v e r s i t y O f P e t r o l e u m A n d E n e r g y S t u d i e s
Page 62
6.4.2 Asia Pacific LPG market, by source, 2012 – 2020
TABLE 47 Asia Pacific LPG source: Volume (Million Tons)
Source 2011 2012 2013 2014 2015 2016 2017 2018 2019 2020 CAGR (2014-
20)
Refinery 64.26 66.96 69.83 72.90 76.16 79.72 83.51 87.73 92.16 96.90 4.9%
Associated Gas
6.25 6.47 6.71 6.96 7.23 7.53 7.84 8.18 8.54 8.93 4.2%
Non associate
d gas 18.74 19.70 20.72 21.81 22.98 24.25 25.61 27.13 28.74 30.46 5.7%
Total 89.25 93.13 97.26 101.67 106.37 111.49 116.96 123.05 129.44 136.29 5.0%
Source: ICIS, Oil & Gas Journal, WLPGA, Platts, U.S. EIA, Company Annual Reports, Primary Interviews, GVR
TABLE 48 Asia Pacific LPG source :Revenue (USD Billion)
Source 2011 2012 2013 2014 2015 2016 2017 2018 2019 2020 CAGR (2014-
20)
Refinery 52.82 54.36 56.91 59.45 62.14 65.10 68.24 71.84 75.63 79.68 5.0%
Associated Gas
6.04 6.20 6.47 6.75 7.04 7.35 7.69 8.08 8.48 8.91 4.8%
Non associate
d gas 16.60 17.21 18.15 19.10 20.11 21.21 22.40 23.75 25.18 26.72 5.8%
Total 75.46 77.76 81.53 85.30 89.28 93.66 98.33 103.67 109.29 115.32 5.2%
Source: ICIS, Oil & Gas Journal, WLPGA, Platts, U.S. EIA, Company Annual Reports, Primary Interviews, GVR
6.4.3 Asia Pacific LPG market, by application, 2012 – 2020
TABLE 49 Asia Pacific LPG volume by application, (Million Tons)
Application 2011 2012 2013 2014 2015 2016 2017 2018 2019 2020 CAGR (2014-
20)
Residential/Commerci
al 53.55 56.16 58.94 61.92 65.10 68.57 72.28 76.41 80.77 85.45 5.5%
Chemical 10.89 11.22 11.57 11.95 12.34 12.77 13.22 13.72 14.24 14.79 3.6%
Industrial 8.03 8.35 8.70 9.06 9.45 9.87 10.32 10.82 11.34 11.90 4.6%
Auto fuel 8.12 8.49 8.89 9.31 9.76 10.26 10.78 11.37 11.99 12.65 5.2%
Refinery 2.86 2.99 3.13 3.28 3.45 3.62 3.81 4.02 4.25 4.48 5.3%

Liquefied Petroleum Gas Market Analysis And Forecast
U n i v e r s i t y O f P e t r o l e u m A n d E n e r g y S t u d i e s
Page 63
Others 5.80 5.91 6.03 6.15 6.28 6.41 6.55 6.71 6.86 7.02 2.2%
Total 89.25 93.13 97.26 101.67 106.37 111.49 116.96 123.05 129.4
4 136.29 5.0%
Source: ICIS, Oil & Gas Journal, WLPGA, Platts, U.S. EIA, Company Annual Reports, Primary Interviews, GVR
TABLE 50 Asia Pacific LPG application: Revenue (USD Billion)
Application 2011 2012 2013 2014 2015 2016 2017 2018 2019 2020 CAGR (2014-
20)
Residential/Commerci
al 43.76 45.27 47.65 50.04 52.57 55.35 58.33 61.73 65.31 69.17 5.5%
Chemical 8.30 8.48 8.81 9.13 9.46 9.83 10.23 10.68 11.15 11.65 4.1%
Industrial 7.55 7.75 8.10 8.45 8.82 9.23 9.66 10.15 10.67 11.22 4.8%
Auto fuel 9.05 9.37 9.87 10.36 10.89 11.47 12.09 12.80 13.55 14.36 5.6%
Refinery 2.26 2.34 2.46 2.58 2.71 2.86 3.01 3.18 3.37 3.56 5.5%
Others 4.53 4.55 4.65 4.73 4.82 4.92 5.01 5.13 5.25 5.36 2.1%
Total 75.46 77.76 81.53 85.30 89.28 93.66 98.33 103.67 109.2
9 115.32 5.2%
Source: ICIS, Oil & Gas Journal, WLPGA, Platts, U.S. EIA, Company Annual Reports, Primary Interviews, GVR
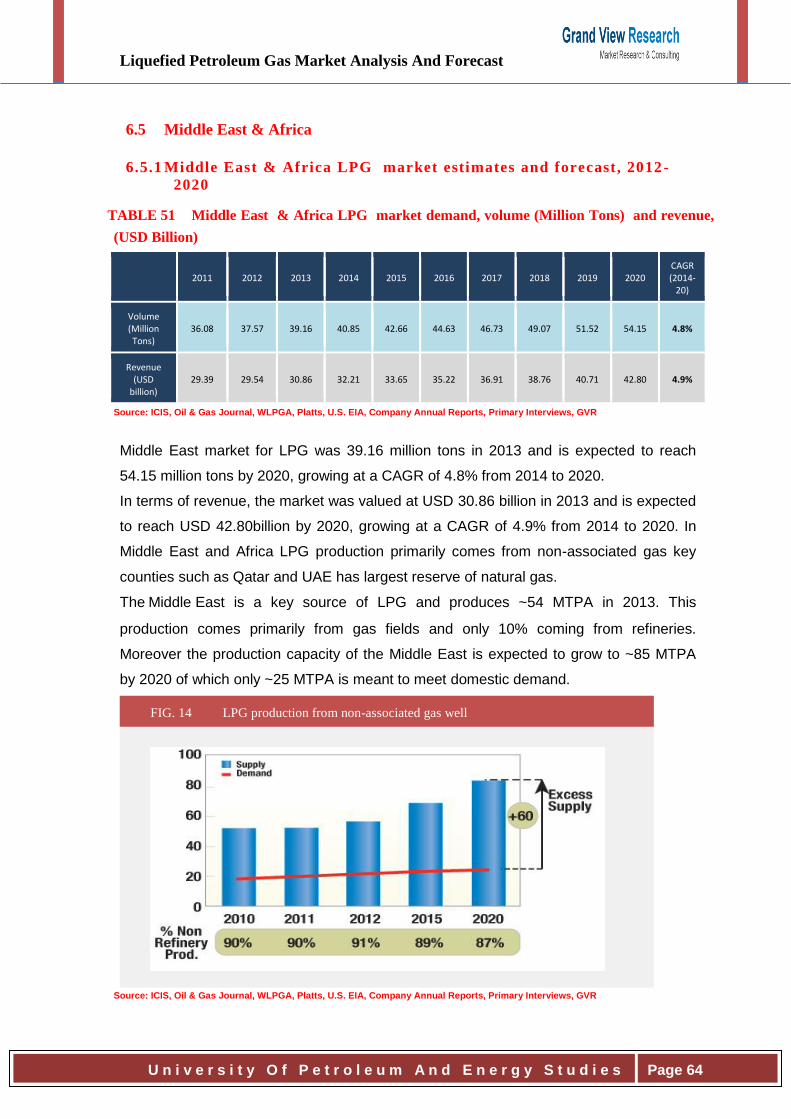
Liquefied Petroleum Gas Market Analysis And Forecast
U n i v e r s i t y O f P e t r o l e u m A n d E n e r g y S t u d i e s
Page 64
6.5 Middle East & Africa
6.5.1 Middle East & Africa LPG market estimates and forecast, 2012 -
2020
TABLE 51 Middle East & Africa LPG market demand, volume (Million Tons) and revenue,
(USD Billion)
2011 2012 2013 2014 2015 2016 2017 2018 2019 2020
CAGR (2014-
20)
Volume (Million Tons)
36.08 37.57 39.16 40.85 42.66 44.63 46.73 49.07 51.52 54.15 4.8%
Revenue (USD
billion) 29.39 29.54 30.86 32.21 33.65 35.22 36.91 38.76 40.71 42.80 4.9%
Source: ICIS, Oil & Gas Journal, WLPGA, Platts, U.S. EIA, Company Annual Reports, Primary Interviews, GVR
Middle East market for LPG was 39.16 million tons in 2013 and is expected to reach
54.15 million tons by 2020, growing at a CAGR of 4.8% from 2014 to 2020.
In terms of revenue, the market was valued at USD 30.86 billion in 2013 and is expected
to reach USD 42.80billion by 2020, growing at a CAGR of 4.9% from 2014 to 2020. In
Middle East and Africa LPG production primarily comes from non-associated gas key
counties such as Qatar and UAE has largest reserve of natural gas.
The Middle East is a key source of LPG and produces ~54 MTPA in 2013. This
production comes primarily from gas fields and only 10% coming from refineries.
Moreover the production capacity of the Middle East is expected to grow to ~85 MTPA
by 2020 of which only ~25 MTPA is meant to meet domestic demand.
FIG. 14 LPG production from non-associated gas well
Source: ICIS, Oil & Gas Journal, WLPGA, Platts, U.S. EIA, Company Annual Reports, Primary Interviews, GVR
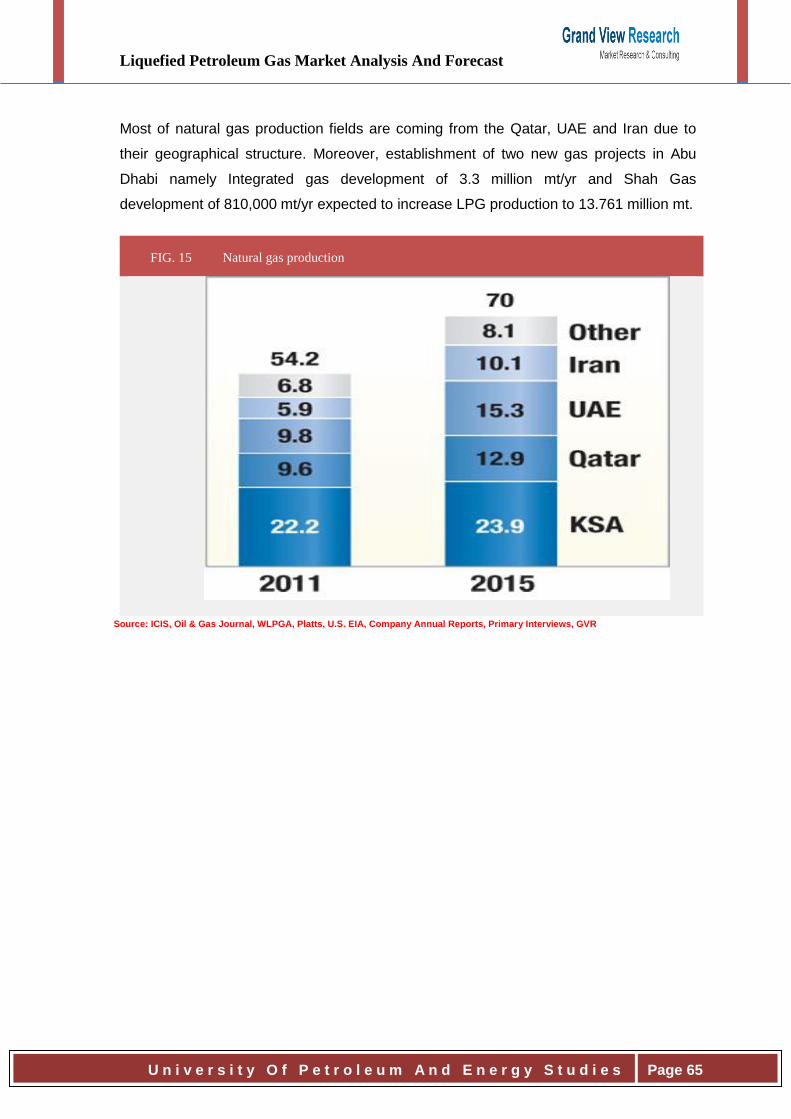
Liquefied Petroleum Gas Market Analysis And Forecast
U n i v e r s i t y O f P e t r o l e u m A n d E n e r g y S t u d i e s
Page 65
Most of natural gas production fields are coming from the Qatar, UAE and Iran due to
their geographical structure. Moreover, establishment of two new gas projects in Abu
Dhabi namely Integrated gas development of 3.3 million mt/yr and Shah Gas
development of 810,000 mt/yr expected to increase LPG production to 13.761 million mt.
FIG. 15 Natural gas production
Source: ICIS, Oil & Gas Journal, WLPGA, Platts, U.S. EIA, Company Annual Reports, Primary Interviews, GVR
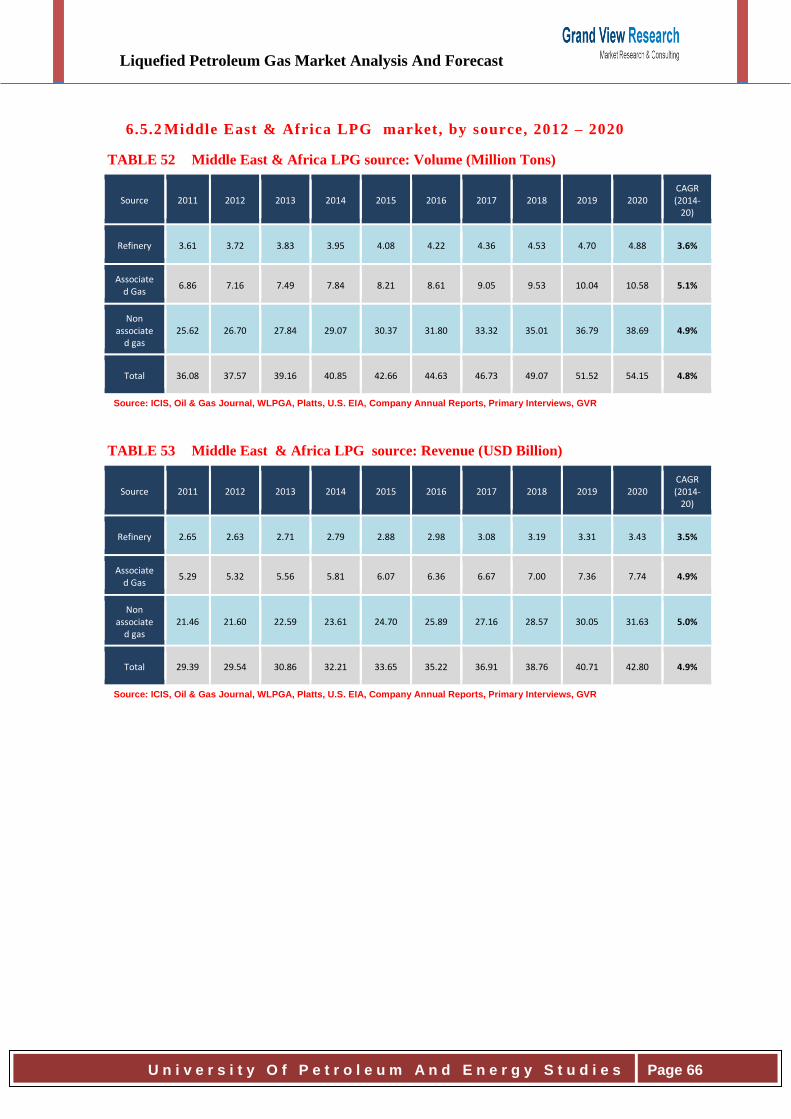
Liquefied Petroleum Gas Market Analysis And Forecast
U n i v e r s i t y O f P e t r o l e u m A n d E n e r g y S t u d i e s
Page 66
6.5.2 Middle East & Africa LPG market, by source, 2012 – 2020
TABLE 52 Middle East & Africa LPG source: Volume (Million Tons)
Source 2011 2012 2013 2014 2015 2016 2017 2018 2019 2020 CAGR (2014-
20)
Refinery 3.61 3.72 3.83 3.95 4.08 4.22 4.36 4.53 4.70 4.88 3.6%
Associated Gas
6.86 7.16 7.49 7.84 8.21 8.61 9.05 9.53 10.04 10.58 5.1%
Non associate
d gas 25.62 26.70 27.84 29.07 30.37 31.80 33.32 35.01 36.79 38.69 4.9%
Total 36.08 37.57 39.16 40.85 42.66 44.63 46.73 49.07 51.52 54.15 4.8%
Source: ICIS, Oil & Gas Journal, WLPGA, Platts, U.S. EIA, Company Annual Reports, Primary Interviews, GVR
TABLE 53 Middle East & Africa LPG source: Revenue (USD Billion)
Source 2011 2012 2013 2014 2015 2016 2017 2018 2019 2020 CAGR (2014-
20)
Refinery 2.65 2.63 2.71 2.79 2.88 2.98 3.08 3.19 3.31 3.43 3.5%
Associated Gas
5.29 5.32 5.56 5.81 6.07 6.36 6.67 7.00 7.36 7.74 4.9%
Non associate
d gas 21.46 21.60 22.59 23.61 24.70 25.89 27.16 28.57 30.05 31.63 5.0%
Total 29.39 29.54 30.86 32.21 33.65 35.22 36.91 38.76 40.71 42.80 4.9%
Source: ICIS, Oil & Gas Journal, WLPGA, Platts, U.S. EIA, Company Annual Reports, Primary Interviews, GVR
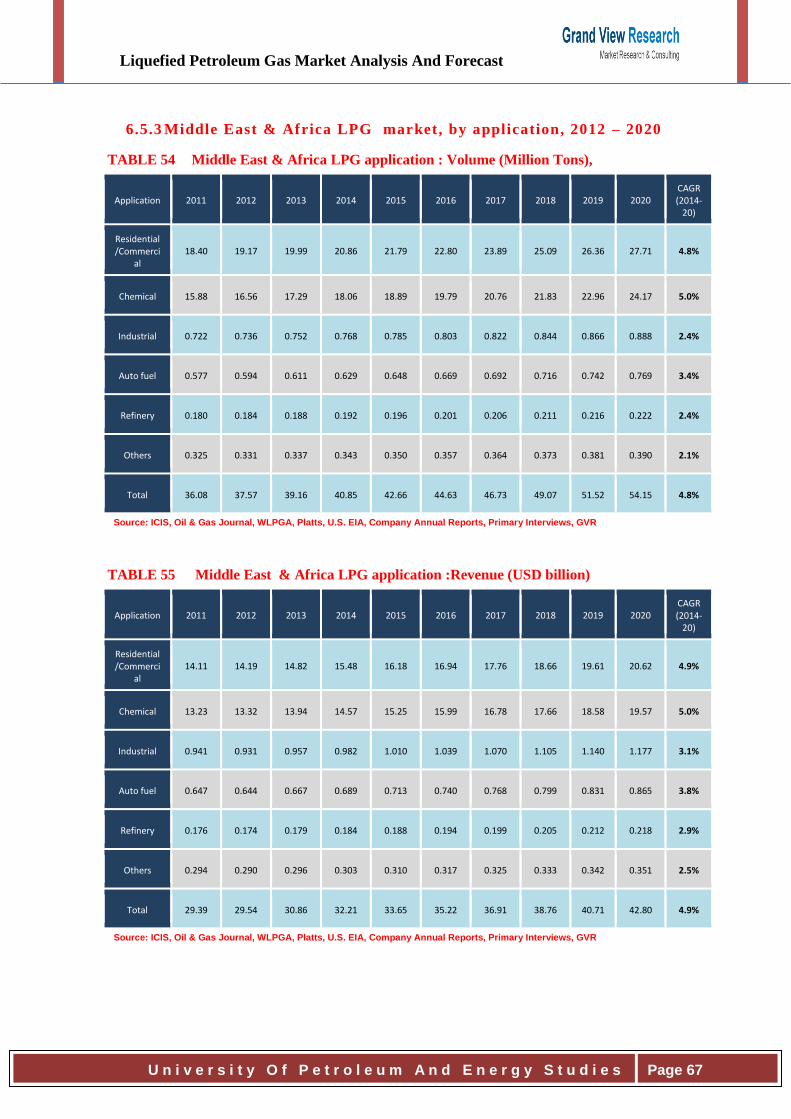
Liquefied Petroleum Gas Market Analysis And Forecast
U n i v e r s i t y O f P e t r o l e u m A n d E n e r g y S t u d i e s
Page 67
6.5.3 Middle East & Africa LPG market, by application, 2012 – 2020
TABLE 54 Middle East & Africa LPG application : Volume (Million Tons),
Application 2011 2012 2013 2014 2015 2016 2017 2018 2019 2020 CAGR (2014-
20)
Residential/Commerci
al 18.40 19.17 19.99 20.86 21.79 22.80 23.89 25.09 26.36 27.71 4.8%
Chemical 15.88 16.56 17.29 18.06 18.89 19.79 20.76 21.83 22.96 24.17 5.0%
Industrial 0.722 0.736 0.752 0.768 0.785 0.803 0.822 0.844 0.866 0.888 2.4%
Auto fuel 0.577 0.594 0.611 0.629 0.648 0.669 0.692 0.716 0.742 0.769 3.4%
Refinery 0.180 0.184 0.188 0.192 0.196 0.201 0.206 0.211 0.216 0.222 2.4%
Others 0.325 0.331 0.337 0.343 0.350 0.357 0.364 0.373 0.381 0.390 2.1%
Total 36.08 37.57 39.16 40.85 42.66 44.63 46.73 49.07 51.52 54.15 4.8%
Source: ICIS, Oil & Gas Journal, WLPGA, Platts, U.S. EIA, Company Annual Reports, Primary Interviews, GVR
TABLE 55 Middle East & Africa LPG application :Revenue (USD billion)
Application 2011 2012 2013 2014 2015 2016 2017 2018 2019 2020 CAGR (2014-
20)
Residential/Commerci
al 14.11 14.19 14.82 15.48 16.18 16.94 17.76 18.66 19.61 20.62 4.9%
Chemical 13.23 13.32 13.94 14.57 15.25 15.99 16.78 17.66 18.58 19.57 5.0%
Industrial 0.941 0.931 0.957 0.982 1.010 1.039 1.070 1.105 1.140 1.177 3.1%
Auto fuel 0.647 0.644 0.667 0.689 0.713 0.740 0.768 0.799 0.831 0.865 3.8%
Refinery 0.176 0.174 0.179 0.184 0.188 0.194 0.199 0.205 0.212 0.218 2.9%
Others 0.294 0.290 0.296 0.303 0.310 0.317 0.325 0.333 0.342 0.351 2.5%
Total 29.39 29.54 30.86 32.21 33.65 35.22 36.91 38.76 40.71 42.80 4.9%
Source: ICIS, Oil & Gas Journal, WLPGA, Platts, U.S. EIA, Company Annual Reports, Primary Interviews, GVR
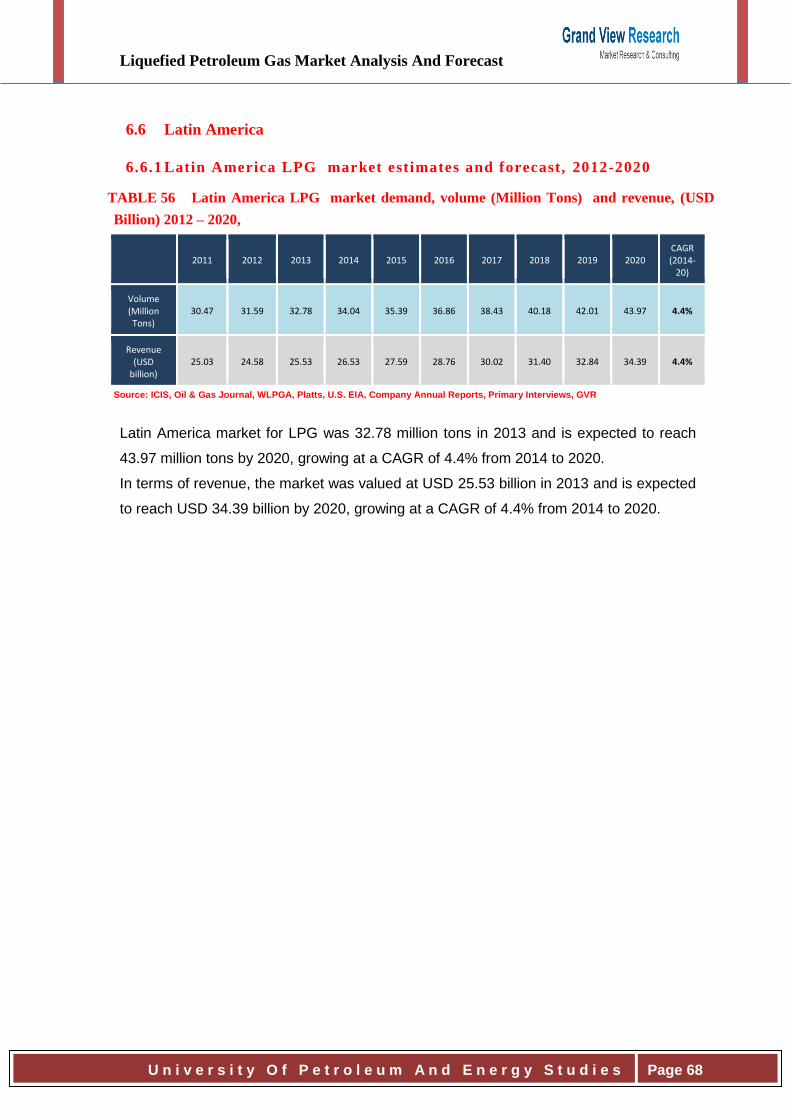
Liquefied Petroleum Gas Market Analysis And Forecast
U n i v e r s i t y O f P e t r o l e u m A n d E n e r g y S t u d i e s
Page 68
6.6 Latin America
6.6.1 Latin America LPG market estimates and forecast, 2012-2020
TABLE 56 Latin America LPG market demand, volume (Million Tons) and revenue, (USD
Billion) 2012 – 2020,
2011 2012 2013 2014 2015 2016 2017 2018 2019 2020
CAGR (2014-
20)
Volume (Million Tons)
30.47 31.59 32.78 34.04 35.39 36.86 38.43 40.18 42.01 43.97 4.4%
Revenue (USD
billion) 25.03 24.58 25.53 26.53 27.59 28.76 30.02 31.40 32.84 34.39 4.4%
Source: ICIS, Oil & Gas Journal, WLPGA, Platts, U.S. EIA, Company Annual Reports, Primary Interviews, GVR
Latin America market for LPG was 32.78 million tons in 2013 and is expected to reach
43.97 million tons by 2020, growing at a CAGR of 4.4% from 2014 to 2020.
In terms of revenue, the market was valued at USD 25.53 billion in 2013 and is expected
to reach USD 34.39 billion by 2020, growing at a CAGR of 4.4% from 2014 to 2020.
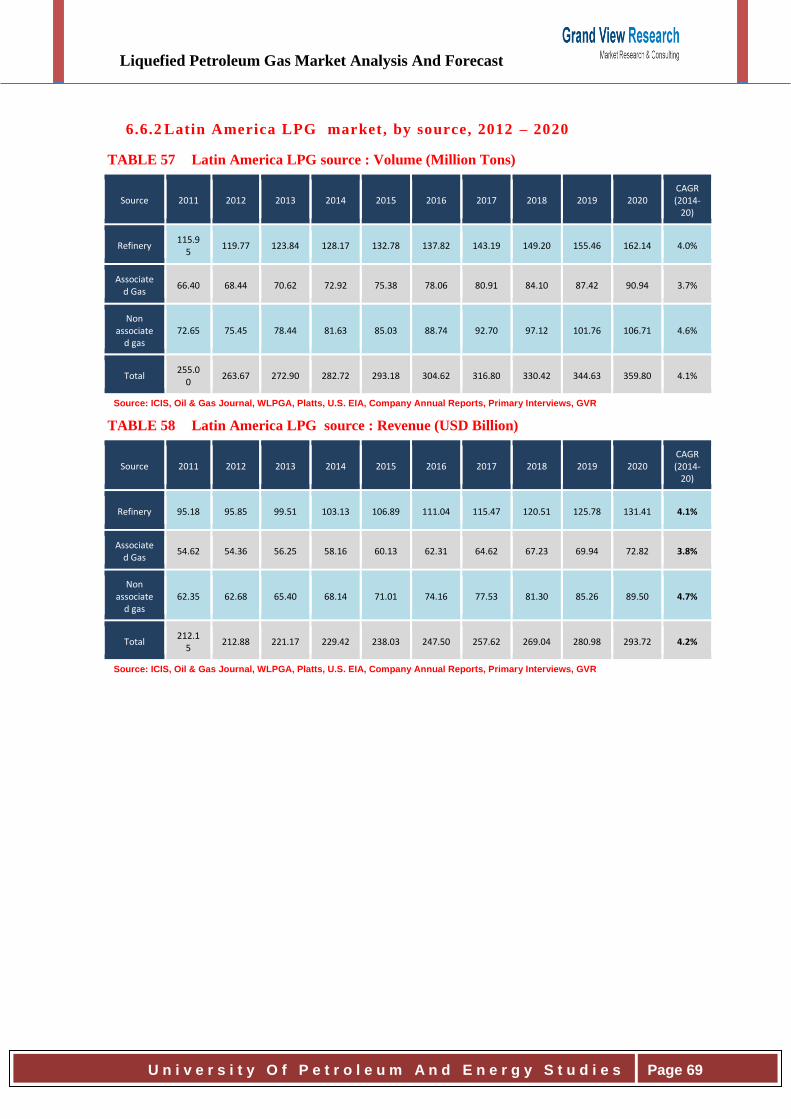
Liquefied Petroleum Gas Market Analysis And Forecast
U n i v e r s i t y O f P e t r o l e u m A n d E n e r g y S t u d i e s
Page 69
6.6.2 Latin America LPG market, by source, 2012 – 2020
TABLE 57 Latin America LPG source : Volume (Million Tons)
Source 2011 2012 2013 2014 2015 2016 2017 2018 2019 2020 CAGR (2014-
20)
Refinery 115.9
5 119.77 123.84 128.17 132.78 137.82 143.19 149.20 155.46 162.14 4.0%
Associated Gas
66.40 68.44 70.62 72.92 75.38 78.06 80.91 84.10 87.42 90.94 3.7%
Non associate
d gas 72.65 75.45 78.44 81.63 85.03 88.74 92.70 97.12 101.76 106.71 4.6%
Total 255.0
0 263.67 272.90 282.72 293.18 304.62 316.80 330.42 344.63 359.80 4.1%
Source: ICIS, Oil & Gas Journal, WLPGA, Platts, U.S. EIA, Company Annual Reports, Primary Interviews, GVR
TABLE 58 Latin America LPG source : Revenue (USD Billion)
Source 2011 2012 2013 2014 2015 2016 2017 2018 2019 2020 CAGR (2014-
20)
Refinery 95.18 95.85 99.51 103.13 106.89 111.04 115.47 120.51 125.78 131.41 4.1%
Associated Gas
54.62 54.36 56.25 58.16 60.13 62.31 64.62 67.23 69.94 72.82 3.8%
Non associate
d gas 62.35 62.68 65.40 68.14 71.01 74.16 77.53 81.30 85.26 89.50 4.7%
Total 212.1
5 212.88 221.17 229.42 238.03 247.50 257.62 269.04 280.98 293.72 4.2%
Source: ICIS, Oil & Gas Journal, WLPGA, Platts, U.S. EIA, Company Annual Reports, Primary Interviews, GVR
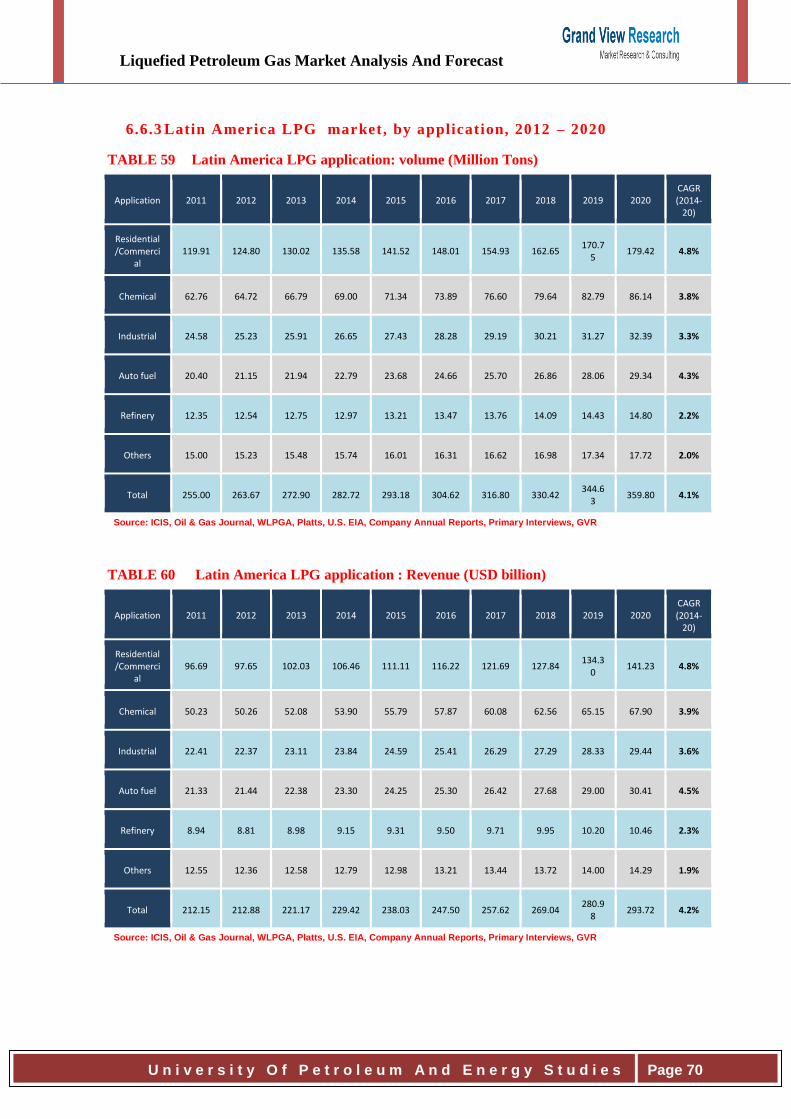
Liquefied Petroleum Gas Market Analysis And Forecast
U n i v e r s i t y O f P e t r o l e u m A n d E n e r g y S t u d i e s
Page 70
6.6.3 Latin America LPG market, by application, 2012 – 2020
TABLE 59 Latin America LPG application: volume (Million Tons)
Application 2011 2012 2013 2014 2015 2016 2017 2018 2019 2020 CAGR (2014-
20)
Residential/Commerci
al 119.91 124.80 130.02 135.58 141.52 148.01 154.93 162.65
170.75
179.42 4.8%
Chemical 62.76 64.72 66.79 69.00 71.34 73.89 76.60 79.64 82.79 86.14 3.8%
Industrial 24.58 25.23 25.91 26.65 27.43 28.28 29.19 30.21 31.27 32.39 3.3%
Auto fuel 20.40 21.15 21.94 22.79 23.68 24.66 25.70 26.86 28.06 29.34 4.3%
Refinery 12.35 12.54 12.75 12.97 13.21 13.47 13.76 14.09 14.43 14.80 2.2%
Others 15.00 15.23 15.48 15.74 16.01 16.31 16.62 16.98 17.34 17.72 2.0%
Total 255.00 263.67 272.90 282.72 293.18 304.62 316.80 330.42 344.6
3 359.80 4.1%
Source: ICIS, Oil & Gas Journal, WLPGA, Platts, U.S. EIA, Company Annual Reports, Primary Interviews, GVR
TABLE 60 Latin America LPG application : Revenue (USD billion)
Application 2011 2012 2013 2014 2015 2016 2017 2018 2019 2020 CAGR (2014-
20)
Residential/Commerci
al 96.69 97.65 102.03 106.46 111.11 116.22 121.69 127.84
134.30
141.23 4.8%
Chemical 50.23 50.26 52.08 53.90 55.79 57.87 60.08 62.56 65.15 67.90 3.9%
Industrial 22.41 22.37 23.11 23.84 24.59 25.41 26.29 27.29 28.33 29.44 3.6%
Auto fuel 21.33 21.44 22.38 23.30 24.25 25.30 26.42 27.68 29.00 30.41 4.5%
Refinery 8.94 8.81 8.98 9.15 9.31 9.50 9.71 9.95 10.20 10.46 2.3%
Others 12.55 12.36 12.58 12.79 12.98 13.21 13.44 13.72 14.00 14.29 1.9%
Total 212.15 212.88 221.17 229.42 238.03 247.50 257.62 269.04 280.9
8 293.72 4.2%
Source: ICIS, Oil & Gas Journal, WLPGA, Platts, U.S. EIA, Company Annual Reports, Primary Interviews, GVR
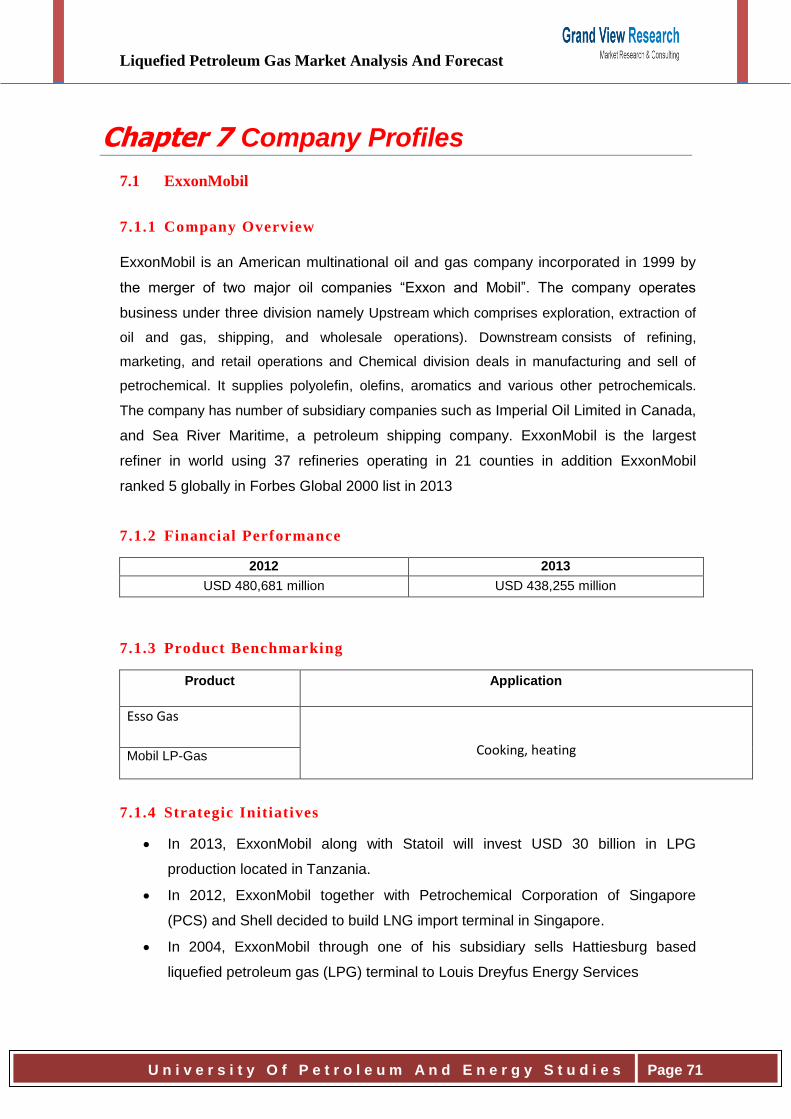
Liquefied Petroleum Gas Market Analysis And Forecast
U n i v e r s i t y O f P e t r o l e u m A n d E n e r g y S t u d i e s
Page 71
Chapter 7 Company Profiles
7.1 ExxonMobil
7.1.1 Company Overview
ExxonMobil is an American multinational oil and gas company incorporated in 1999 by
the merger of two major oil companies “Exxon and Mobil”. The company operates
business under three division namely Upstream which comprises exploration, extraction of
oil and gas, shipping, and wholesale operations). Downstream consists of refining,
marketing, and retail operations and Chemical division deals in manufacturing and sell of
petrochemical. It supplies polyolefin, olefins, aromatics and various other petrochemicals.
The company has number of subsidiary companies such as Imperial Oil Limited in Canada,
and Sea River Maritime, a petroleum shipping company. ExxonMobil is the largest
refiner in world using 37 refineries operating in 21 counties in addition ExxonMobil
ranked 5 globally in Forbes Global 2000 list in 2013
7.1.2 Financial Performance
2012 2013
USD 480,681 million USD 438,255 million
7.1.3 Product Benchmarking
Product Application
Esso Gas
Cooking, heating Mobil LP-Gas
7.1.4 Strategic Initiatives
In 2013, ExxonMobil along with Statoil will invest USD 30 billion in LPG
production located in Tanzania.
In 2012, ExxonMobil together with Petrochemical Corporation of Singapore
(PCS) and Shell decided to build LNG import terminal in Singapore.
In 2004, ExxonMobil through one of his subsidiary sells Hattiesburg based
liquefied petroleum gas (LPG) terminal to Louis Dreyfus Energy Services
Liquefied Petroleum Gas Market Analysis And Forecast
U n i v e r s i t y O f P e t r o l e u m A n d E n e r g y S t u d i e s
Page 72
In 2010, ExxonMobil planning to merge with natural-gas producer XTO Energy
Inc. (XTO). This merger will open the door for ExxonMobil's grand investment in
U.S. Shale gas.
7.2 Valero Energy Corporation
7.2.1 Company Overview
Valero Energy Corporation is an international marketer and manufacturer of
transportation fuels and other petrochemical products. It is an American based company
headquarters in Texas It operates through two segments, Refining and Ethanol. The
Refining segment is deals in refining, marketing, distribution and transportation. The
Ethanol segment produces ethanol and distillers grains. It has 16 refineries located in the
United States (U.S.), the United Kingdom (U.K.), Canada, and Aruba and sells their
refined product through approximately 7,400 outlets under the Valero, Shamrock,
Diamond Shamrock, Ultramar, Beacon, and Texaco names. Valero serves in gasoline,
diesels, jet fuels, propane, sulphur, etc. Valero’s propane products are used for
petrochemical feed, refined butane; natural gasoline is sold and purchased for
petrochemical feed and gasoline blending.
7.2.2 Financial Performance
2012 2013
USD 139,250 million USD 138,074 million
Note: Operating revenue
7.2.3 Strategic Initiatives
In 2011, Valero purchase Pembroke Refinery from Chevron
Valero expands its Texas refinery to increase plants profitability and increase
total plant capacity.
Valero completed the divestment process with Eagle refinery and its related
Assets.
Valero plans to acquire Ultramar Diamond Shamrock
Liquefied Petroleum Gas Market Analysis And Forecast
U n i v e r s i t y O f P e t r o l e u m A n d E n e r g y S t u d i e s
Page 73
7.3 Sinopec
7.3.1 Company Overview
Sinopec is one of the largest integrated energy and chemical company. It is owned by
China Petroleum & Chemical Corporation and has headquarters in Beijing. Sinopec's
deals in oil and gas exploration, refining, and marketing; production of chemical fibers,
petrochemicals, chemical fertilizers, and other chemical products; storage and pipeline
transportation of natural gas and crude oil and also involved in import and export
business of crude oil, natural gas, petrochemicals, refined oil products, and other
chemicals. The company is listed in Hong Kong stock exchange and also trades in New
York stock exchange and Shanghai Stock Exchange. Sinopec Group holds various
subsidiary companies under it. Sinopec Group is one of the major state owned petroleum
energy and chemical company in China. It also serves LPG which is served as a
petrochemical feedstock for ethylene production with the help of hydrocarbons, produced
through steam conversion.
7.3.2 Financial Performance
2012 2013
USD 448,779.42million USD 463,963.89million
*Note: 1 USD= 6. 21RMB
7.3.3 Strategic Initiative
In 2014, Sinopec stuck deal with Phillips 66 to buy LPG.
Liquefied Petroleum Gas Market Analysis And Forecast
U n i v e r s i t y O f P e t r o l e u m A n d E n e r g y S t u d i e s
Page 74
7.4 BP PLC
7.4.1 Company Overview
BP Plc., also Known As British Petroleum Company, is a British Oil and Gas
multinational company; headquartered in London, U.K. BP is the sixth largest energy
company by market capitalization and oil and gas company, measured by revenue of
2012. The company operates in many areas of oil and gas such as production and
exploration, distribution and marketing, refining, power generation, petrochemicals. BP
also deals with renewable energy like biofuels and wind power. BP operates in more
than 80 counties globally, and produces 3.2 million barrels of oil every day.
7.4.2 Financial Performance
2012 2013
USD 375,765 Million USD 379,136 Million
7.4.3 Product Benchmarking
Product Application
Petgaz Cooking fuel
7.4.4 Strategic Initiatives
In 2012, BP announces to sell Bottle and Wholesale LPG and Petgaz branded
autogas business to Russian based Oteko Group.
In 2012, BP announces its plan to sell global LPG bottle business which also
includes sales of LPG storage terminals, bottle filling plants. The decision taken
to concentrate on core competitive skill of company such as refining and
marketing businesses.
In 2003, BP Sharjah makes world record of achieving 99.75% of propane and
100 % of butane at its plants in Sajaa.
In 2004, the company announces to sell complete business of BP Czech
Republic LPG Business to UGI Corporation. The decision to sell Czech Republic
LPG Business as strategy to concentrate on refining and marketing businesses
BP and the Singapore Petroleum Company Limited (SPC) announced conditional
agreement for SPC to purchase LPG Business in Singapore retail network and
related assets for USD $70 million.
Liquefied Petroleum Gas Market Analysis And Forecast
U n i v e r s i t y O f P e t r o l e u m A n d E n e r g y S t u d i e s
Page 75
7.5 Indian Oil Corporation (IOCL)
7.5.1 Company Overview
Indian Oil Corporation is an India based company present in entire hydrocarbon value
chain – starting from exploration & production of crude oil & gas, refining, marketing,
retailing coupled with pipeline transportation of petroleum products and petrochemicals.
Indian Oil along with their subsidiaries such as IBP account for 49% total share in the
petroleum product market. Moreover, Company has 31% share in refining and 67%
share in pipeline in India. The Indian Oil has own and operates 10 refineries with
capacity of 65.7 MMT per year across different part of India. In addition the company
also deals in cooking fuel and automobile fuel by brand name of Indian and Autogas
respectively. Presently Indane is one of the largest packed-LPG brands in the world and
got status of “Consumer Superbrand’ status by the Superbrands Council of India.
7.5.2 Financial Performance
2012 2013
USD 67299.3 Million USD 75498.2million
Note: 1 Indian Rupee = 0.017 US Dollar
7.5.3 Product Benchmarking
Product Application
Indiane Cooking Gas
Auto Gas Automobile
7.5.4 Strategic Initiatives
• In 2011, Indian Oil started LPG refilling booking through SMS and IVRS system. This
enables the customer to book LPG cylinder from home.
Liquefied Petroleum Gas Market Analysis And Forecast
U n i v e r s i t y O f P e t r o l e u m A n d E n e r g y S t u d i e s
Page 76
Chapter 8 Conclusion
On basis of above data analysis I come to following conclusions
The global market for LPG was 270.76 million tons in 2013 and is expected to reach
356.98 million tons by 2020, growing at a CAGR of 4.1% from 2014 to 2020. In terms of
revenue, the market was valued at USD 219.43 billion in 2013 and is expected to reach
USD 291.42 billion by 2020, growing at a CAGR of 4.2% from 2014 to 2020.
LPG market expected to grow forecasted period owing to following key drivers.
Increasing demand for natural gas vehicles (NGV)
High cost of petroleum based fuels
Growing importance toward maintaining national security and saving economy
from global oil price risks
NGVs is environment friendly owing to natural gas is clean burning gas than
gasoline and HSD
Shift towards replacing coal and wood as a domestic fuel
Black carbon is one of the major contributors to climate change and cause pollution to
environment. According to estimate of United nation, 2004 approximately 26% of global
co2 are attributed from residential sector.
However there are some constraints which resist the market growth.
Volatility in raw material prices
Crude oil, associated and non-associated gas are primary source of LPG. Thus changes
in their prices have direct impact on price of price of LPG globally.
Key opportunities in LPG market are following
Increasing demand from Asia pacific region
Use of LPG in fractional drilling of well
Natural gas vehicles witnessing Growth
Liquefied Petroleum Gas Market Analysis And Forecast
U n i v e r s i t y O f P e t r o l e u m A n d E n e r g y S t u d i e s
Page 77
PESTEL Analysis -
LPG market gaining popularity owing to favorable government support such as
subsidy, promotion of alternative fuel such as LPG and CNG coupled with
development in technological such as LPG-Sep systems to separate LPG from
Associated gas. However , Volatility in raw material price of LPG along with capital
intensive nature of LPG project act as hinder to market growth.
CRITICAL SUCCESS FACTORS (CSFS)
The rising demand for energy from various sectors has boosted the demand LPG
Increasing stringent regulation on carbon emission
Increasing Investment in emerging market of Asia Pacific, Africa and Middle East.
Overall LPG market is segmented into various source namely refinery, associated gas,
and non-associated gas. Highest amount of LPG is obtained from the refineries owing to
increasing number of refineries in Asia Pacific countries such as India, China and Brazil.
LPG produced from refineries accounts for 45.4% of total LPG production. As
environment regulation in this countries are not stringent. In addition Government
provides various type of incentive and tax holiday for new private players to establish
refinery. LPG sourced from associated gas is a relatively unexplored area due to lack of
state of art technology such as “LPG-Sep systems”. LPG sourced from non-associated
gas is expected to be the fastest growing market at an estimated CAGR of 4.6% from
2014 to 2020
The key applications of LPG include residential/commercial, chemical, auto fuel, refinery
and other where there is a growing demand. LPG has been experiencing rapid growth in
residential/commercial applications due to legislative regulations and subsidies offered
by the government. Increasing population in Asia Pacific coupled with the increasing
spending power of the regions results in augmented demand for LPG. Use of LPG in
refineries is a relatively unexplored market. Use of LPG in other applications is expected
to be slowest growing market over the forecasted period accounted for 22.7% of the total
market in 2013
Liquefied Petroleum Gas Market Analysis And Forecast
U n i v e r s i t y O f P e t r o l e u m A n d E n e r g y S t u d i e s
Page 78
Asia Pacific along with being the largest market accounted for 35.00% of total market
volume in 2013. In addition, Asia Pacific is expected to be the fastest growing regional
market for LPG at an estimated CAGR of 5.0% from 2014 to 2020 owing to rapidly
increasing need for energy in all end-use sectors: residential/ commercial, industrial,
transportation and electric-power. Moreover, Increasing personal disposable income and
government supports to residential user are some factor contributing increase in LPG in
Asia Pacific region. China has the highest population in the world and is also the largest
consumer of LPG.
In North America, the production of LPG in the US has been growing owing to evolution
of shale gas coupled with development in domestic natural gas resource base. In
addition, LPG industries in USA also get benefits of effective and efficient distribution
and storage system.
Among all regional market Europe has least consumption of LPG in 2013 and expected
to show slowest CAGR growth rate in 2020. However, Implementation of stringent
environmental regulation coupled with aim of European counties to deduce pollution
level up to 20% till 2020 expected to increase the demand of LPG. Additionally in order
to excel the LPG based vehicle in Europe many European cities such as Milan, London
provide exemption from congestion charges are some factor expected to increase
demand in forecasted period. But still growth in European countries will be slow in
comparison to other region
Liquefied Petroleum Gas Market Analysis And Forecast
U n i v e r s i t y O f P e t r o l e u m A n d E n e r g y S t u d i e s
Page 79
Chapter 9 Limitation
1. Data is collected from secondary sources so there are chances of error.
2. The strategies have to be implemented in real market conditions to find out their
efficacy.
3. Availability of time and budget constraints.
4. Technical analysis is used to forecast LPG prices but sometimes it may not yield
effective results.
5. Fundamentals tools used for valuation vary with the industry which again time
consuming process to decide which better
6. Data analyze by me may misrepresented although it may not be wrong but
possibility success may be less.
7. Future uncertainty owing to frequent change happing in economy, industry and
company, especially oil and gas industry. Therefore data required to updated
frequently.
Liquefied Petroleum Gas Market Analysis And Forecast
U n i v e r s i t y O f P e t r o l e u m A n d E n e r g y S t u d i e s
Page 80
Chapter 10 Bibliography
Report consider
1. Annual review 2012 AGPL Europe
2. OPIS North America LPG Report
3. Energy trend in selected manufacturing sector by EPA
4. Alex Evans report on Potential for LPG Market Expansion
5. LPG World by Argus
6. World LPG market outlook by Purvin & Gertz
7. Natural gas price volatility in UK and North America
8. Statistical Review of Global LP Gas by Argus
9. LPG Industry road Map by AEGPL
10. GLOBAL TRENDS IN OIL & GAS MARKETS TO 2025 by LUKOIL
11. American LPG report by OPIS
12. Europe LPG report
Article consider
1. GLOBAL LPG MARKETS BEGIN RECOVERY FROM RECESSION
2. LPG – A Growing Global MARKET
3. Statistical review 2020 by Argus
4. Auto gas sees continued market growth in 2011
Websites
1. www2.doe.gov.ph/DO/Report2007.html
2. www.pazgas.co.il/eng/greentechnology/aroundtheworld/
3. www.brcgb.co.uk/about-lpg/lpg-around-the-world
4. www.brcgb.co.uk/conversions
5. www.brcgb.co.uk/about-lpg
Liquefied Petroleum Gas Market Analysis And Forecast
U n i v e r s i t y O f P e t r o l e u m A n d E n e r g y S t u d i e s
Page 81
Other sources considered are
1. ICIS
2. Oil & Gas Journal
3. WLPGA
4. Platts
5. U.S. EIA
6. Company Annual Reports
7. GVR