Embed Size (px)
Citation preview
Reporting to Management Using Microsoft Project and EPM
Derek Loar, Pcubed
Agenda
1. Perspectives in Project Information
2. Types of Information Views (reports)
3. Project Metrics
4. Resource Capacities
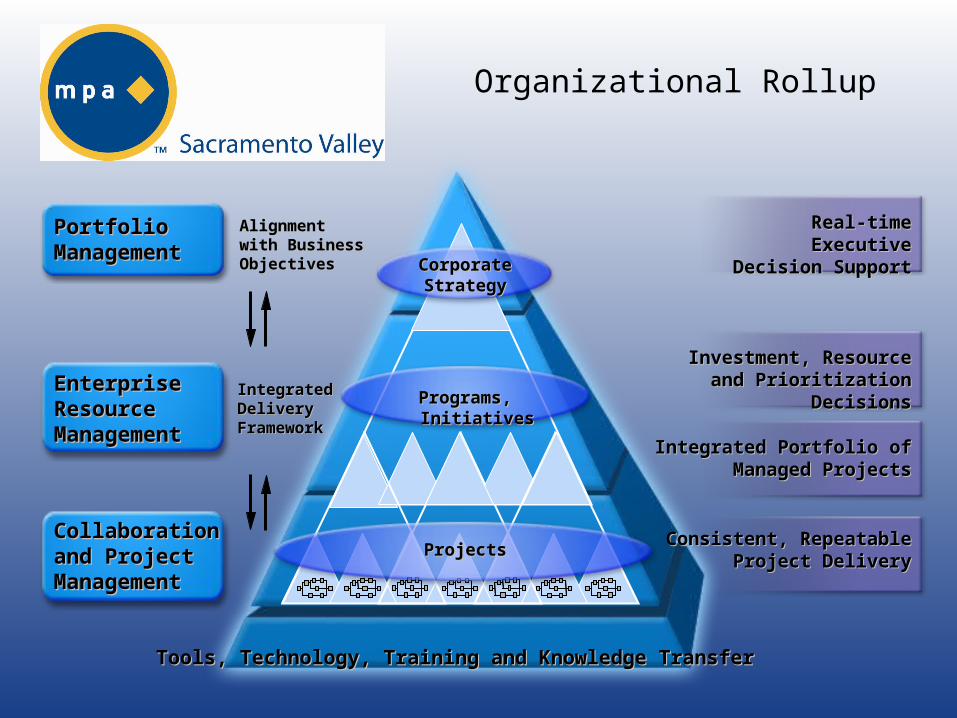
Organizational Rollup
Tools, Technology, Training and Knowledge Transfer Tools, Technology, Training and Knowledge Transfer
Alignment Alignment with Business with Business Objectives Objectives
Integrated Integrated Delivery Delivery Framework Framework
Real-time Executive Real-time Executive Decision SupportDecision Support
Collaboration Collaboration and Project and Project ManagementManagement
Portfolio Portfolio ManagementManagement
Programs, InitiativesPrograms, Initiatives
Corporate Corporate StrategyStrategy
Investment, Resource and Investment, Resource and Prioritization DecisionsPrioritization Decisions
Integrated Portfolio of Integrated Portfolio of Managed ProjectsManaged Projects
Consistent, Repeatable Consistent, Repeatable Project DeliveryProject Delivery
EnterpriseEnterpriseResource Resource ManagementManagement
ProjectsProjects
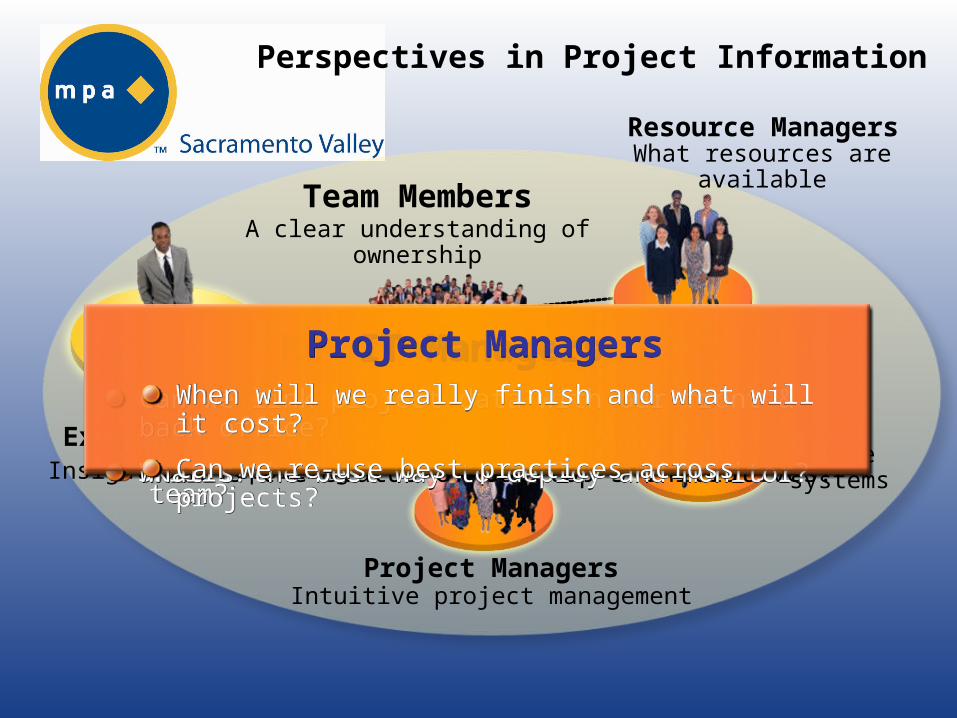
Perspectives in Project Information
Insight and ReportingExec Stakeholders
Project ManagersIntuitive project management
Team MembersA clear understanding of
ownership
Resource ManagersWhat resources are
available
ITOpen, secure systems
Executive StakeholdersHow can I see & prioritize initiatives across my org?
What’s the status of our top 3 initiatives?
What am I supposed to be delivering this week?
How can I collaborate with people on my team?
What am I supposed to be delivering this week?
How can I collaborate with people on my team?
Team MembersResource ManagersWho’s available to staff our new projects?
Who's working on what and do they have the skills?
Resource ManagersWho’s available to staff our new projects?
Who's working on what and do they have the skills?
IT ManagersCan we link project data with our front & back office?
What’s the best way to deploy and monitor?
IT ManagersCan we link project data with our front & back office?
What’s the best way to deploy and monitor?
Project ManagersWhen will we really finish and what will it cost?
Can we re-use best practices across projects?
Project ManagersWhen will we really finish and what will it cost?
Can we re-use best practices across projects?
Types of Information Views (reports)
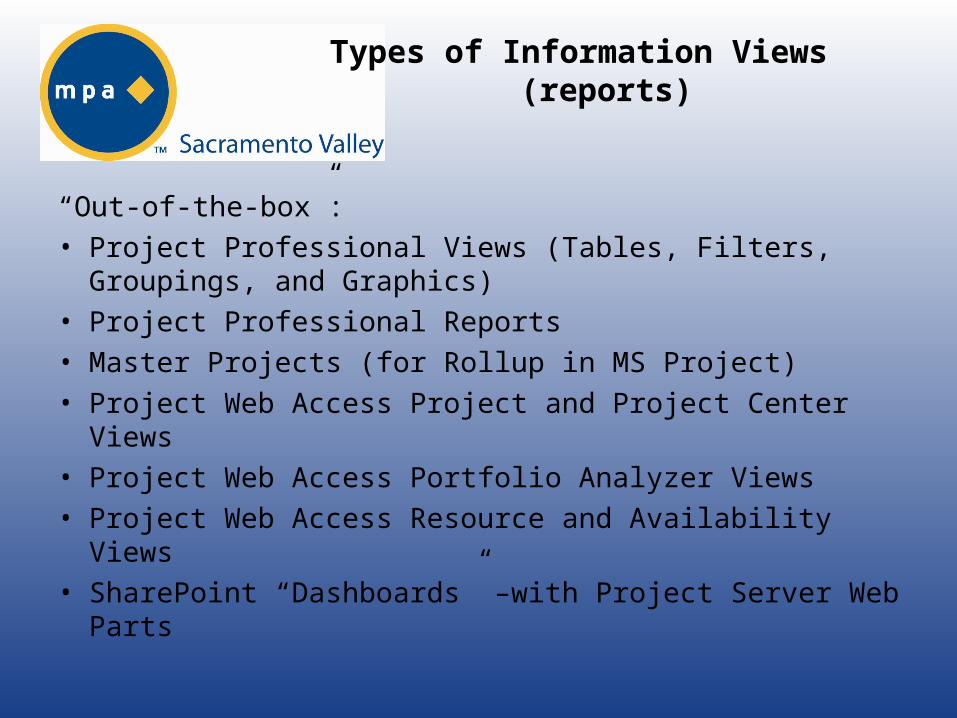
“Out-of-the-box”:• Project Professional Views (Tables, Filters, Groupings,
and Graphics)• Project Professional Reports• Master Projects (for Rollup in MS Project)• Project Web Access Project and Project Center Views• Project Web Access Portfolio Analyzer Views• Project Web Access Resource and Availability Views• SharePoint “Dashboards” –with Project Server Web Parts
Types of Information Views (reports)
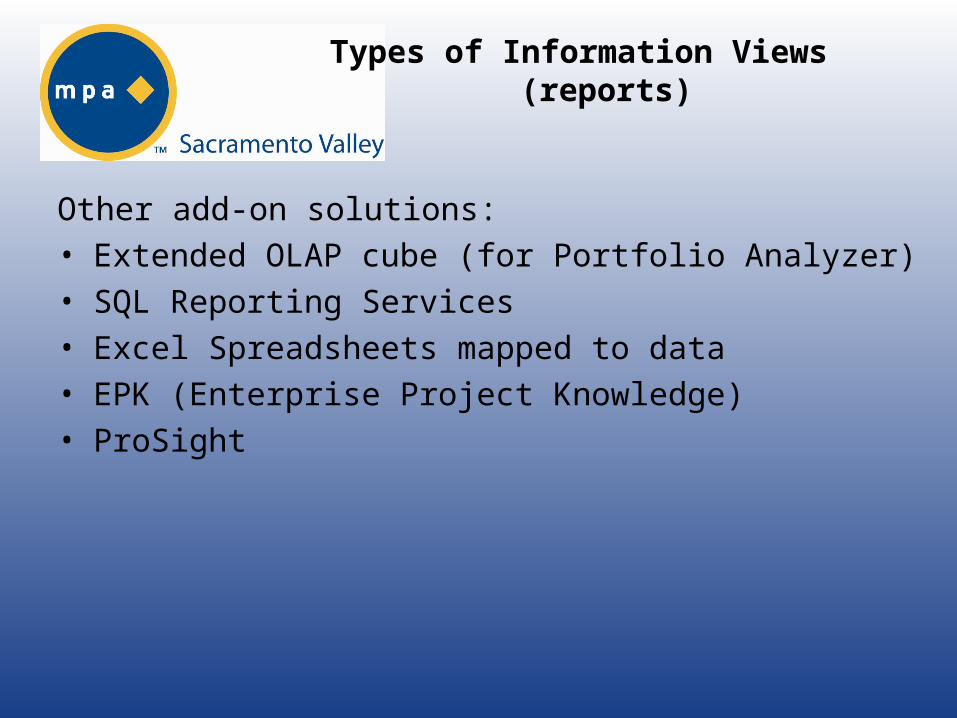
Other add-on solutions:• Extended OLAP cube (for Portfolio Analyzer)• SQL Reporting Services• Excel Spreadsheets mapped to data• EPK (Enterprise Project Knowledge)• ProSight
Types of Information Views (reports)
Explore views

Project Metrics
• Schedule– Baseline Variances
• Cost– Baseline Variances– Budget Variances
• Risk (This metric can be scored per project and managed in Windows SharePoint Services)– Risk level (Impact, Severity, Probability)– Contributors (Complexity, Vague Requirements, Resource
Availability, etc.)• Issues
– Open, Overdue, Closed• Change
– Multiple Baseline Variances
Project Metrics
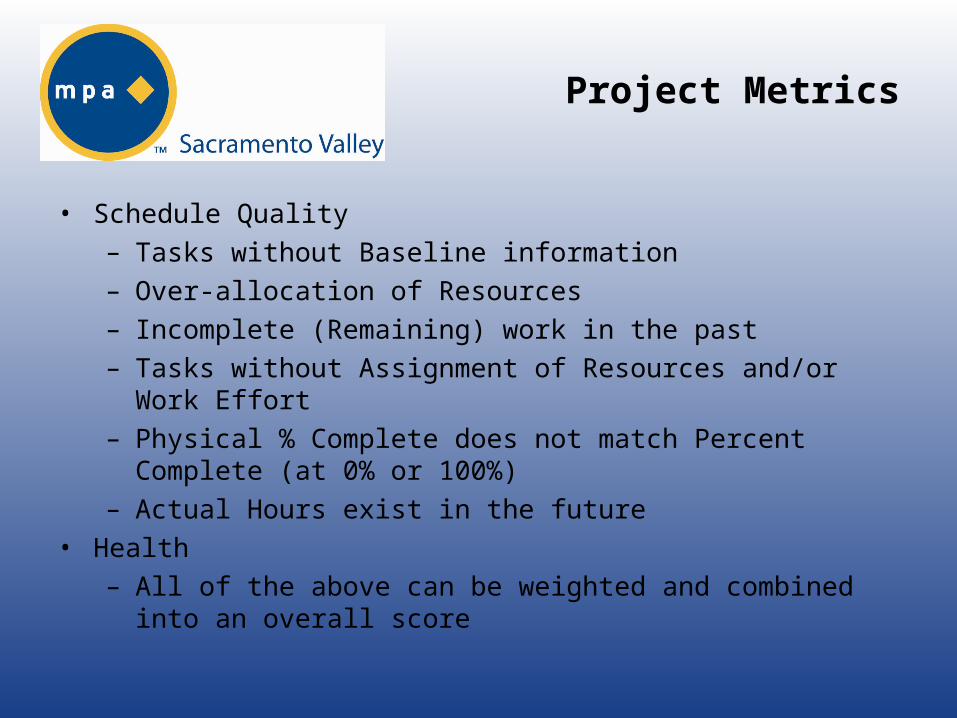
• Schedule Quality– Tasks without Baseline information– Over-allocation of Resources– Incomplete (Remaining) work in the past– Tasks without Assignment of Resources and/or Work Effort– Physical % Complete does not match Percent Complete (at 0%
or 100%)– Actual Hours exist in the future
• Health– All of the above can be weighted and combined into an overall
score
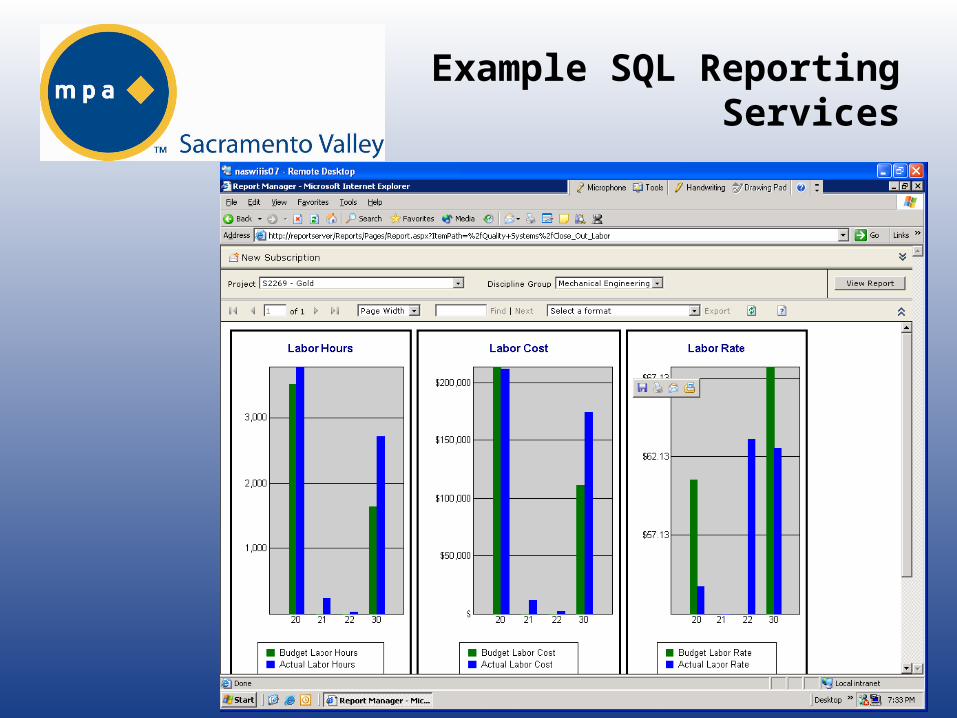
Example SQL Reporting Services
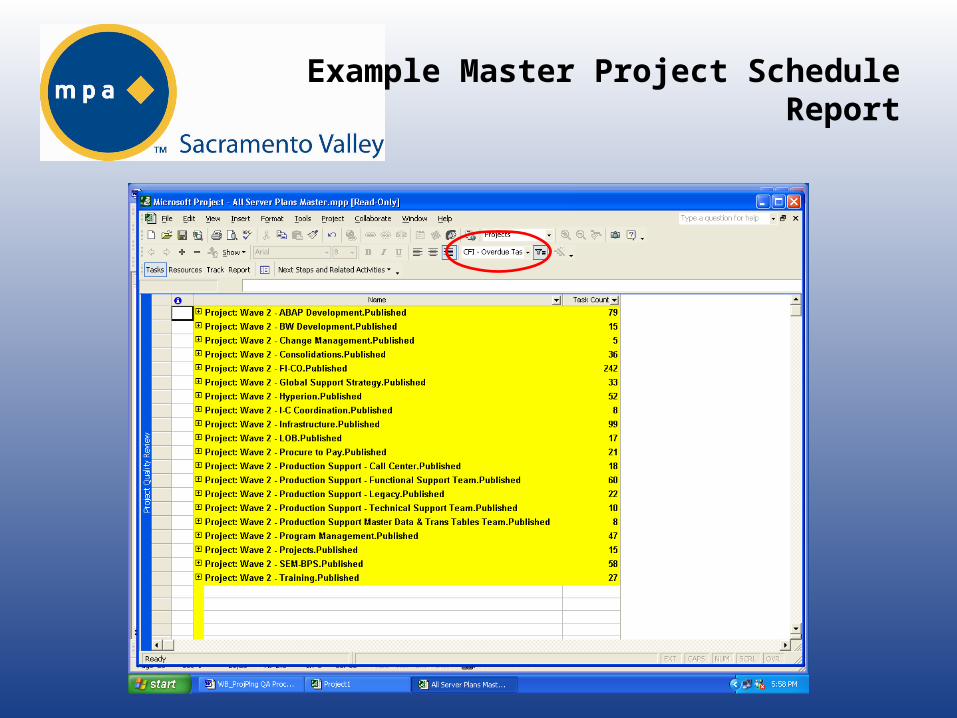
Example Master Project Schedule Report
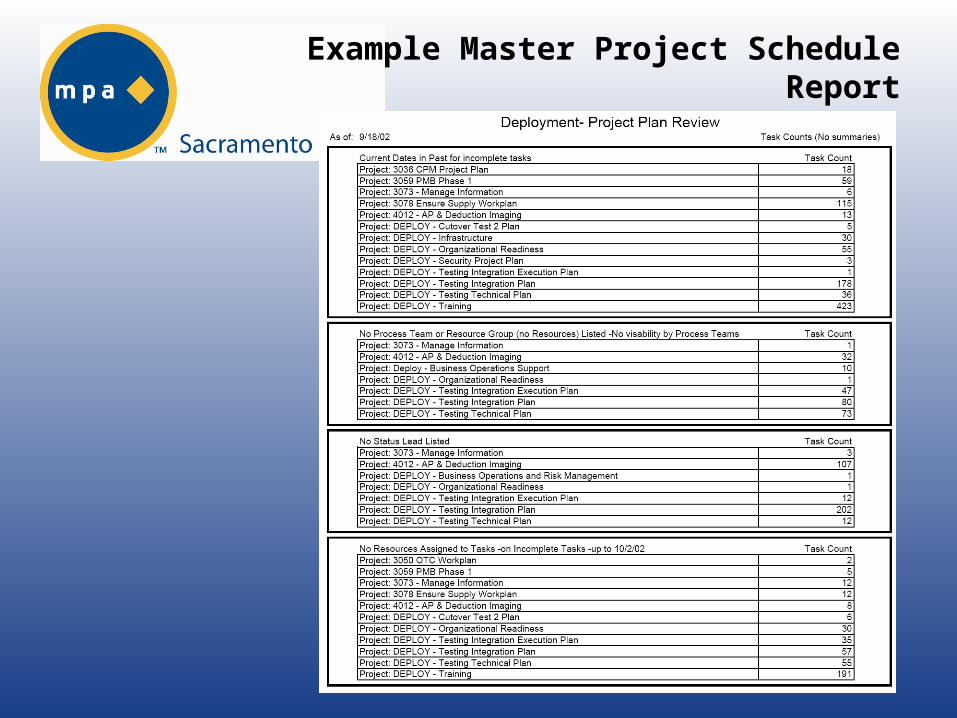
Example Master Project Schedule Report
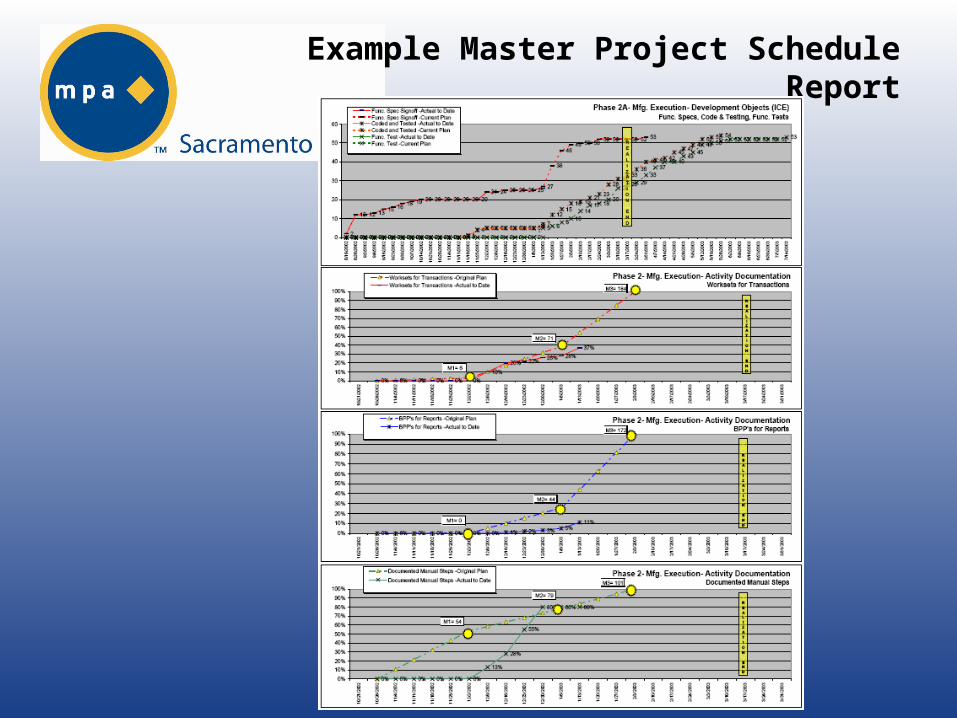
Example Master Project Schedule Report
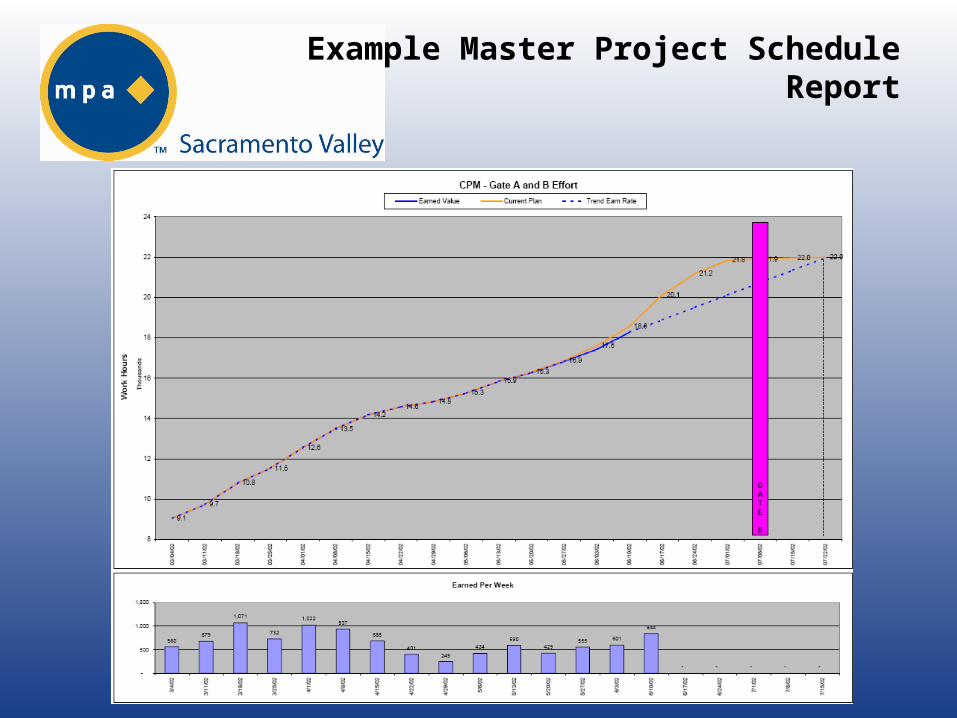
Example Master Project Schedule Report
Resource Capacities
Explore views
Final Thoughts
• Defining what metrics and information is important and can be obtained can be very complex across an organization
• When creating a solution either based on EPM or MS Project on the desktop, start with a few key metrics and build from there
• Senior Stakeholders need to use the data, whether it’s printed for them or the go online to look– By nature, if they don’t use and manage by it, the
metrics and reporting will not be maintained


![Untitled-5 [] · 2020. 9. 15. · AMMETER EPM-4A 1 EPM-4C / EPM-4D / EPM-4P EPM-4D (Ammeter with Demand) : EPM-4D is designed to measure RMS value of AC current which flows from the](https://img.pdfslide.us/doc/110x75/60389b94586a40652f159b94/untitled-5-2020-9-15-ammeter-epm-4a-1-epm-4c-epm-4d-epm-4p-epm-4d-ammeter.jpg)