Embed Size (px)
Citation preview
Reporting Fundamentals for
Programmers
FOR MICROSOFT DYNAMICS AX 2012 R3
Atlanta I Denver I San Francisco I St. Louis I Toronto
Reporting Fundamentals R3: Syllabus & Agenda
Proprietary and Confidential Page 2 of 13 2012
Subject to Change
Key Data ___________________________________________________________________ 3
Look and Feel _______________________________________________________________ 3
Audience ___________________________________________________________________ 3
Prerequisites ________________________________________________________________ 4
Students _________________________________________________________________ 4
Environment ______________________________________________________________ 4
Course Outline ______________________________________________________________ 5
Chapter 1: Look and Feel ____________________________________________________ 5
Chapter 2: Introduction to Reporting Fundamentals _______________________________ 5
Chapter 3: Personalization and Autoreports _____________________________________ 5
Chapter 4: Excel Integration __________________________________________________ 6
Chapter 5: Creating Report Builder Reports _____________________________________ 6
Chapter 6: SSRS and Visual Studio Reports _____________________________________ 6
Chapter 7: Generating Existing Cubes __________________________________________ 8
Chapter 8: Introduction to Management Reporter _________________________________ 8
Chapter 9: Excel Cube Building _______________________________________________ 8
Chapter 10: SQL Server Analysis Services Cube Building __________________________ 9
Chapter 11: Data Processing Class ____________________________________________ 9
Chapter 12: Data Processing and Contract Classes _______________________________ 9
Chapter 13: Modifying Existing Data Models for Reporting _________________________ 11
Chapter 14: Customizing Out-of the-Box Reports ________________________________ 11
Bonus Chapter: Power View Preview – SQL Server 2012 __________________________ 11
Agenda: Reporting Fundamentals for Programmers ________________________________ 13
Reporting Fundamentals R3: Syllabus & Agenda
Proprietary and Confidential Page 3 of 13 2012
Subject to Change
Key Data This course syllabus should be used to determine whether the course is appropriate for the
students based on their current skill and technical training needs.
Number of days: 4
Format: Instructor-led
Maximum number of students per course: 10
Look and Feel This four-day instructor-led course provides students with the knowledge and skill to leverage the
extended reporting features of Microsoft Dynamics AX 2012 R3. The course is built using SQL
Server 2012 with Visual Studio 2010.
The training course covers creating and deploying reports using SSRS, creating, adjusting, and
deploying cubes using SSAS, and integrating all of these features together in the rich client.
Audience This course is intended for the following:
Programmers
Report Business Process Managers
Technical Business Analyst
Report Developer
Reporting Fundamentals R3: Syllabus & Agenda
Proprietary and Confidential Page 4 of 13 2012
Subject to Change
Prerequisites
Students
Before attending this course, students must have:
A working knowledge of the navigation and use of Microsoft Dynamics AX 2012
Familiar with X++ programming, Tech Bootcamp or MS Dev1&2 equivalent required
Basic knowledge of Visual Studio 2010, aka SQL Server Data Tools.
Environment
If the training will be conducted in Denver at the Junction Solutions office, the requirements listed
below will be provided by Junction Solutions.
Before the beginning of the first lesson the following materials and equipment will be required:
A LCD Projector*
Projection screen/surface
A white board or
Flip chart stand/paper (optional)
Each attendee will need a Laptop/PC with the following available:
Internet connection
A VPN connection to Junction Solution (The connection information will be provided
by the trainer upon the first day of training).
Junction Solutions Training Academy hosts the training images on a local server in our Denver
offices. The VPN connection is required for the participants to connect to the Hyper-V training
image.
* The instructor can provide a projector if one is not available upon request only.
Reporting Fundamentals R3: Syllabus & Agenda
Proprietary and Confidential Page 5 of 13 2012
Subject to Change
Course Outline
Chapter 1: Look and Feel
Microsoft Dynamics AX is an enterprise resource planning (ERP) solution for midsize and larger
organizations that helps people to work effectively, manage change, and compete globally.
Microsoft Dynamics AX works like and with familiar Microsoft software and is a solution that
automates and streamlines financial, business intelligence, and supply chain processes in a way
that can help you with your business.
The topics in this section provide information about the Microsoft Dynamics AX look and feel for
common tasks that any user might complete
Lessons
Describe the user interface elements in Microsoft Dynamics AX 2012.
Chapter 2: Introduction to Reporting Fundamentals
Microsoft SQL Server Reporting Services is now the primary reporting platform for Microsoft
Dynamics AX. The default, preconfigured reports that are included with Microsoft Dynamics AX
run on the Reporting Services platform. This section introduces reporting formats such as Excel,
Autoreports, Report Builder, Reporting Services Reports, and Management Reporter. These
report formats are either built on the transaction processing database or the analytical services
cubes.
Lessons
Review the types of reports used in Dynamics AX.
Discuss the reporting architecture and reporting options.
Describe online analytical processing (OLAP).
Describe Management Reporter 2012 information flow.
Chapter 3: Personalization and Autoreports
Personalization in Microsoft Dynamics AX uses a technology called IntelliMorph. It is the ability to
customize your client session without affecting other users. You can use IntelliMorph to hide and
show fields or portions of a form. In addition, you can resize and rearrange fields on forms. An
additional tool is the use of Autoreports. These Auto reports are preconfigured reports that you
can generate by clicking the Print icon on a form.
Lessons
Discuss the levels of customization available at different user rights.
Describe how to modify form set up.
Reporting Fundamentals R3: Syllabus & Agenda
Proprietary and Confidential Page 6 of 13 2012
Subject to Change
Create and organize favorites.
Using personalization for both the power user and the developer.
Utilize the Export to Excel functionality for custom interfaces.
Generate, Print, and Save Autoreport formats.
Exercises
Personalize your navigation
Create a custom auto report
Chapter 4: Excel Integration
One of the fastest ways to integrate data from Microsoft Dynamics AX is the Excel Add-in. This
tool, once configured as part of the Office integration, exposes large amounts of data that typical
users can easily customize and create new reports using a standard interface.
Lessons
Create a report from the Export to Excel tool.
Create a transactional report using the Excel Add-in.
Create a pivot table report based on analysis services using the Excel Add-in.
Chapter 5: Creating Report Builder Reports
Report Builder is a report authoring environment for business users who prefer to work in the
Microsoft Office environment. When you design a report, you specify where to get the data, which
data to get, and how to display the data. When you run the report, the report processor takes all
the information you have specified, retrieves the data, and combines it with the report layout to
generate the report. You can preview your reports in Report Builder, or you can publish your
report to a report server or a report server in SharePoint integrated mode, where others can run
it.
Lessons
Create a basic report using Report Builder
Exercises
Create a basic Report Builder report
Chapter 6: SSRS and Visual Studio Reports
Microsoft Dynamics AX provides a model-based approach to create reports by providing project
templates and modeling tools that are incorporated into the Microsoft Visual Studio development
environment. The reporting features provided by Microsoft Dynamics AX are based on a tight
integration with SQL Server Reporting Services
Reporting Fundamentals R3: Syllabus & Agenda
Proprietary and Confidential Page 7 of 13 2012
Subject to Change
Lessons
Review creating a report for customer transaction data
Develop a report for vendor transaction data.
Review creating a report bound by date.
Develop a report created using a matrix template and a complex query.
Develop and test a report created using drill through.
Review referencing a report with multiple datasets and uses precision design.
Exercises
Creating a report for customer transaction data
Creating a report for vendor transaction data
Creating a report bound by date
Creating a matrix report
Creating a drill through report
Referencing a report parameter from multiple datasets
Reporting Fundamentals R3: Syllabus & Agenda
Proprietary and Confidential Page 8 of 13 2012
Subject to Change
Chapter 7: Generating Existing Cubes
A cube is a multidimensional structure that provides the basis for developing Business
Intelligence (BI) applications. This chapter describes the components of a cube so that
you can better understand how to use a cube to analyze data. In addition, you can
deploy and process Analysis cubes by using the Analysis Services project wizard in
Microsoft Dynamics AX.
Lessons
Review Measures, Dimensions, Perspectives, and KPI’s
Deploy an Existing SQL Server Analysis Services Project in AX.
Exercises
Deploy the default cubes in Dynamics AX 2012.
Chapter 8: Introduction to Management Reporter
Management Reporter is the Microsoft Dynamics ERP application used for the creation,
distribution and analysis of financial statements. Management Reporter empowers
decision makers to provide real-time insights into organizational results allowing you to
take action and align employee behavior with overall goals.
Lessons
Introduce accessing Management Reporter
Explore Management Reporter capabilities
Review the building blocks of Management Reporter
Chapter 9: Excel Cube Building
In this chapter, you modify an Excel workbook in PowerPivot for Excel to make a small but
functional cube that you can use as a basis for sample Power View reports. Everything you do in
this tutorial in PowerPivot, you can also do in tabular models that you create in SQL Server Data
Tools (SSDT).
Lessons
To setup and create a Power Pivot for Excel cube that you can use as a report data
source.
Exercises
Build a sample cube using Excel and PowerPivot
Reporting Fundamentals R3: Syllabus & Agenda
Proprietary and Confidential Page 9 of 13 2012
Subject to Change
Chapter 10: SQL Server Analysis Services Cube Building
In this walkthrough, you will create a cube that enables you to analyze data from Microsoft
Dynamics AX. You will use the Business Intelligence (BI) properties in Microsoft Dynamics AX to
specify measures and attributes for the cube, and then generate an Analysis Services project so
that you can work with the cube in SQL Server Business Intelligence Development Studio (BIDS).
Lessons
OLTP vs OLAP Database architecture
Understanding the Cube
Tools Used for Analytics
How to design, configure, deploy, and browse a cube.
Exercises
Creating a perspective for a cube
Specifying cube measure and attributes
Generating an Analysis Services project
Deploying a cube
Browsing cube data
Chapter 11: Data Processing Class
Using the Data process class to access data is more advanced than the traditional query
methodology. It is used when the data to be rendered in the report is not available through query,
you need to further process the data at the time that it is run, and the business logic is based on
X++ code. Additionally, report data provides allow for more filters at runtime based on UI
parameters than queries.
Lessons
Discuss the Model-View-Controller (MVC) pattern.
Create a report data provider (RDP) class.
Exercises
Simple report generation – data provider class
Chapter 12: Data Processing and Contract Classes
A report parameter provides a way to choose report data, connect related reports together, and
vary the report presentation. It is used when generating the report data set. The parameters that
a report data provider class will reference are defined in a data contract class.
Lessons
Creating a new report
Reporting Fundamentals R3: Syllabus & Agenda
Proprietary and Confidential Page 10 of 13 2012
Subject to Change
Manage report parameters in a data contract class in X++.
Exercises
Creating a Sales Return report using a report data provider and contract class
Creating a report bound with X++ business logic
Reporting Fundamentals R3: Syllabus & Agenda
Proprietary and Confidential Page 11 of 13 2012
Subject to Change
Chapter 13: Modifying Existing Data Models for Reporting
The Invent Cost Report is a complex series of interrelated classes. This chapter explores the
modification of the basic building block classes, report data provider, controller, contract, and UI
builder.
Lessons
Importing and modifying an existing report project
Using Enums for parameters
Bonus: Updating a report from an auto design to a precision report.
Exercises
Creating a complex report – modifying existing X++ class structures
Chapter 14: Customizing Out-of the-Box Reports
Understanding the techniques for customizing out-of-the-box reports will enable you to quickly
produce complex reports that satisfy the business specific customer requirements.
Lessons
Editing, customizing, and republishing existing reports.
Exercises
Customizing LedgerBalanceControlReport
Customizing BudgetDetailReport
Customizing Purchase Orders
Bonus Chapter: Power View Preview – SQL Server 2012
In this chapter, you create a Power View report that demonstrates what Power View can do,
using a small sample model created in PowerPivot for Excel. You create tables and convert them
into a number of different visualizations. You create tiles and add visualizations to them. You
create multiple pages, or views, in your report. You create a bubble chart and add a play axis to
it, so you can see how the values change over time. You create small multiples – a set of small
charts, one per series, with the same axes. Then you experiment with different ways to filter the
data in the visualizations. In the end, you export your report to PowerPoint.
Lessons
Create a Power View report starting from the PowerPivot created.
Creating views that illustrate the report
Creating bubble charts that dynamically show data over time.
Reporting Fundamentals R3: Syllabus & Agenda
Proprietary and Confidential Page 12 of 13 2012
Subject to Change
Exporting the information to PowerPoint
Exercises
Build a PowerView report
Reporting Fundamentals R3: Agenda
Proprietary and Confidential Page 13 of 13 2012
Subject to Change
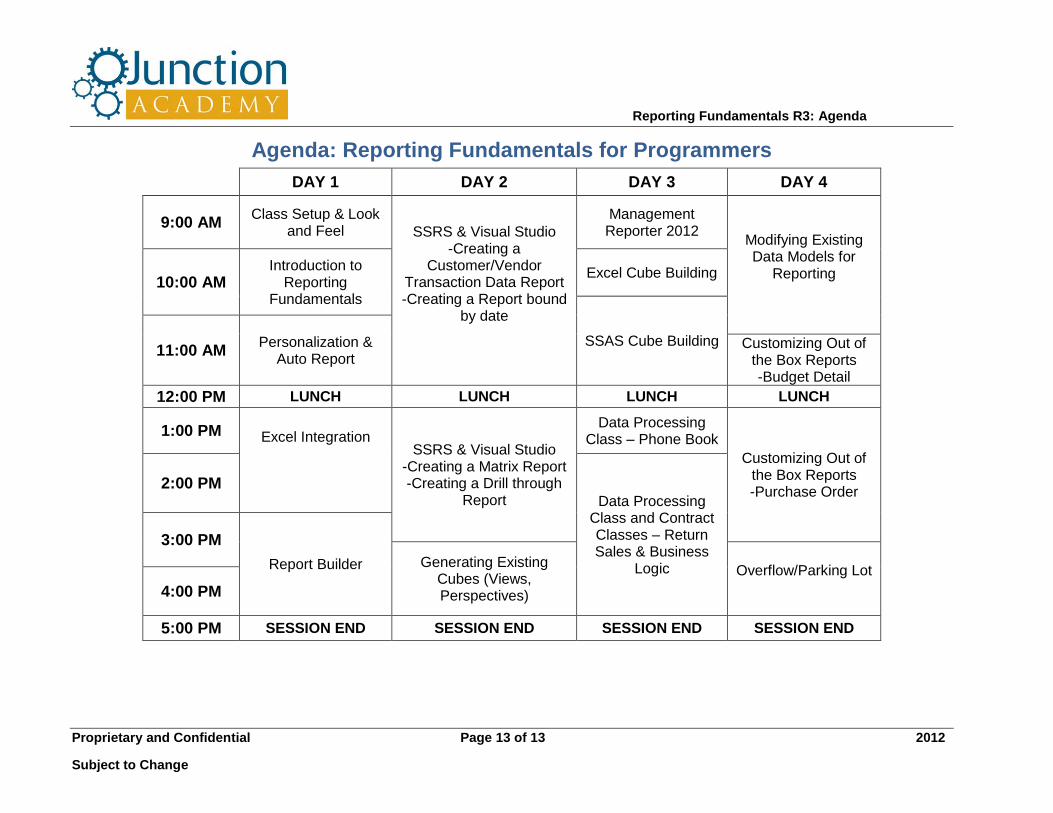
Agenda: Reporting Fundamentals for Programmers
DAY 1 DAY 2 DAY 3 DAY 4
9:00 AM Class Setup & Look
and Feel SSRS & Visual Studio -Creating a
Customer/Vendor Transaction Data Report -Creating a Report bound
by date
Management Reporter 2012
Modifying Existing Data Models for
Reporting
10:00 AM Introduction to
Reporting Fundamentals
Excel Cube Building
SSAS Cube Building 11:00 AM
Personalization & Auto Report
Customizing Out of the Box Reports -Budget Detail
12:00 PM LUNCH LUNCH LUNCH LUNCH
1:00 PM Excel Integration
SSRS & Visual Studio -Creating a Matrix Report -Creating a Drill through
Report
Data Processing Class – Phone Book
Customizing Out of the Box Reports -Purchase Order
2:00 PM Data Processing
Class and Contract Classes – Return Sales & Business
Logic
3:00 PM
Report Builder Generating Existing Cubes (Views, Perspectives)
Overflow/Parking Lot 4:00 PM
5:00 PM SESSION END SESSION END SESSION END SESSION END


![Not for Distribution - Routledgecw.routledge.com/textbooks/9780415448789/5275-Parcak-Ch01.pdf · Not for Distribution [15:59 16/2/2009 5275-Parcak-Ch01.tex] Job No: 5275 PARCAK: Satellite](https://img.pdfslide.us/doc/110x75/5f06d9927e708231d41a0be7/not-for-distribution-not-for-distribution-1559-1622009-5275-parcak-ch01tex.jpg)


![5275-A4_EXS-1000_Remote_Terminal_Unit [PDF Search Engine]](https://img.pdfslide.us/doc/110x75/577d2f271a28ab4e1eb0f0b0/5275-a4exs-1000remoteterminalunit-pdf-search-engine.jpg)