Embed Size (px)
Citation preview
1
nature neuroscience | reporting checklistM
arch 2016
Corresponding Author: Christopher Hill
Manuscript Number: NN-A58070
Manuscript Type: Article
# Main Figures: 6
# Supplementary Figures: 2
# Supplementary Tables: 3
# Supplementary Videos: 0
Reporting Checklist for Nature NeuroscienceThis checklist is used to ensure good reporting standards and to improve the reproducibility of published results. For more information, please read Reporting Life Sciences Research.
Please note that in the event of publication, it is mandatory that authors include all relevant methodological and statistical information in the manuscript.
Statistics reporting, by figure
Please specify the following information for each panel reporting quantitative data, and where each item is reported (section, e.g. Results, & paragraph number).
Each figure legend should ideally contain an exact sample size (n) for each experimental group/condition, where n is an exact number and not a range, a clear definition of how n is defined (for example x cells from x slices from x animals from x litters, collected over x days), a description of the statistical test used, the results of the tests, any descriptive statistics and clearly defined error bars if applicable.
For any experiments using custom statistics, please indicate the test used and stats obtained for each experiment.
Each figure legend should include a statement of how many times the experiment shown was replicated in the lab; the details of sample collection should be sufficiently clear so that the replicability of the experiment is obvious to the reader.
For experiments reported in the text but not in the figures, please use the paragraph number instead of the figure number.
Note: Mean and standard deviation are not appropriate on small samples, and plotting independent data points is usually more informative. When technical replicates are reported, error and significance measures reflect the experimental variability and not the variability of the biological process; it is misleading not to state this clearly.
TEST USED n DESCRIPTIVE STATS (AVERAGE, VARIANCE)
P VALUEDEGREES OF FREEDOM &
F/t/z/R/ETC VALUE
FIG
URE
N
UM
BER
WHICH TEST?
SECT
ION
&
PARA
GRA
PH #
EXACT VALUE DEFINED?
SECT
ION
&
PARA
GRA
PH #
REPORTED?
SECT
ION
&
PARA
GRA
PH #
EXACT VALUE
SECT
ION
&
PARA
GRA
PH #
VALUE
SECT
ION
&
PARA
GRA
PH #
exam
ple
1a one-way ANOVA
Fig. legend
9, 9, 10, 15
mice from at least 3 litters/group
Methods para 8
error bars are mean +/- SEM
Fig. legend p = 0.044 Fig.
legend F(3, 36) = 2.97 Fig. legend
exam
ple
results, para 6
unpaired t-test
Results para 6 15 slices from 10 mice Results
para 6error bars are mean +/- SEM
Results para 6 p = 0.0006 Results
para 6 t(28) = 2.808 Results para 6
Nature Neuroscience: doi:10.1038/nn.4602

2
nature neuroscience | reporting checklistM
arch 2016
TEST USED n DESCRIPTIVE STATS (AVERAGE, VARIANCE)
P VALUEDEGREES OF FREEDOM &
F/t/z/R/ETC VALUE
FIG
URE
N
UM
BER
WHICH TEST?SE
CTIO
N &
PA
RAG
RAPH
#EXACT VALUE DEFINED?
SECT
ION
&
PARA
GRA
PH #
REPORTED?
SECT
ION
&
PARA
GRA
PH #
EXACT VALUE
SECT
ION
&
PARA
GRA
PH #
VALUE
SECT
ION
&
PARA
GRA
PH #
+-
Figure 1. D
OlS multiple
regression
Matlab fitlm Payoff ~ 1 + Condition + Kappa + Eta
- 58 All subjects (58) methods Paragrap
h 1
Errors bars +/- SEM for Beta coefficients
Figure 1. D
Condition p = 0.25 Kappa
p = 0.025 Eta
p = 0.51
Behavioral results Paragrap
h 2
Condition t(54) = 1.14
Kappa t(54) = 2.30
Eta t(54) = 0.65
Behavioral results Paragrap
h 2
+-
Figure 2.
A
OLS regression
Matlab fitlm Switch_rate
~ 1 + Condition
- 58 All subjects (58)methods Paragrap
h 1
Errors bars +/- SEM for mean
coefficients
Figure 2. A
Condition p = 0.046
rTPJ-cTBS
reduces behavioral indices
of influence computa
tions Paragrap
h 1
Condition t(56)=-2.03
rTPJ-cTBS reduces behavioral indices
of influence computat
ions Paragrap
h 1
+-
Figure 2.B
Matlab ttest two t-tests vs log odds
= 0
- 29 29
cTBS-vertex (29) cTBS-rTPJ (29)
methods Paragrap
h 1
Errors bars +/- SEM for mean
coefficients
Figure2. B
cTBS-rTPJ p = 7.37^10-6 cTBS-vertex
p = 0.34
rTPJ-cTBS
reduces behavioral indices
of influence computa
tions Paragrap
h 3
cTBS-rTPJ t(28) = -5.48 cTBS-vertex t(28) = -0.95
rTPJ-cTBS reduces behavioral indices
of influence computat
ions Paragrap
h 3
+-
Figure 2.B
OLS regression
Matlab fitlm Effect_of_OwnAction ~
1 + Condition
- 58 All subjects (58)methods Paragrap
h 1
Errors bars +/- SEM for mean
coefficients
Figure2. B p = 0.04
rTPJ-cTBS
reduces behavioral indices
of influence computa
tions Paragrap
h 3
t(56) = -2.10
rTPJ-cTBS reduces behavioral indices
of influence computat
ions Paragrap
h 3
+-
Figure 2.B
OLS multiple
regression
Matlab fitlm Effect_of_OwnAction ~
1 + Condition + Effect_of_O
ppAction
- 58 All subjects (58)methods Paragrap
h 1
Errors bars +/- SEM for beta coefficients
Figure2. B
Condition p = 0.022
Effect_of_OppAction p = 0.45
rTPJ-cTBS
reduces behavioral indices
of influence computa
tions Paragrap
h 3
Condition t(55) = -2.35
Effect_of_OppAction
t(55) = -2.04
rTPJ-cTBS reduces behavioral indices
of influence computat
ions Paragrap
h 3
Nature Neuroscience: doi:10.1038/nn.4602

3
nature neuroscience | reporting checklistM
arch 2016
+-
Figure 2. C
HDI test R rJags
Bayesian
hypothesis
testing Paragraph 1
58 All subjects (58)methods Paragrap
h 1
Posterior distributions
Figure 2. C
Kappa p(mcmc) =
0.003 Eta
p(mcmc) = 0.65 Beta
p(mcmc) = 0.12
rTPJ-cTBS
reduces behavioral indices
of influence computa
tions Paragrap
h 4
n/a n/a n/a
rTPJ-cTBS reduces behavioral indices
of influence computat
ions Paragrap
h 4
+-
Figure 2. D
OLS multiple
regression
Matlab fitlm Switch_rate
~ 1 + Condition + Kappa + Eta
- 58 All subjects (58)methods Paragrap
h 1
Errors bars +/- SEM for Beta coefficients
Figure 2. D
Condition p = 0.066
Kappa p =2.9089e-06
Eta p = 0.15
rTPJ-cTBS
reduces behavioral indices
of influence computa
tions Paragrap
h 5
Condition t(54) = 1.8721
Kappa t(54) = 5.2217
Eta t(54) = -1.4394
rTPJ-cTBS reduces behavioral indices
of influence computat
ions Paragrap
h 5
+-
Figure 3.
A
SnPM: Random-
effects permutation
test on parameter estimates
from subject-level
multiple regression
in SPM. Parameter
modeled the effect of
"Influence update"
Data analysi
s: Neuroimaging
29 All cTBS-vertex (29)
Local cTBS
effects on influence computat
ions in rTPJ
Paragraph 1
None Table 2.
p(FWE) = 0.009
Figure 1 legend
Paragraph 1
Ke = 1326, df(28)
Local cTBS
effects on
influence computat
ions in rTPJ
Paragraph 1
+-
Figure 3. B
SPM: two-sample t test on
parameter estimates
from subject-level
multiple regression
on parameter "Influence update"
TMS-control > TMS-rTPJ
Data analysi
s: Neuroimaging
57All subjects with fMRI data (57)
methods Paragrap
h 1
Errors bars +/- SEM for mean
beta coefficients
Figure 3. B. p(SVC) = 0.009
Local cTBS
effects on
influence computa
tion in rTPJ
Paragraph 2
t(55) = 3.65
Local cTBS
effects on
influence computat
ion in rTPJ
Paragraph 2
+-
Figure 4 A.
SPM: random-effects
regression on
parameter estimates
from subject-level
multiple regression on "model likelihood" predicting "Influence update"
Data analysi
s: Neuroimaging
57 All subjects with fMRI data (57)
methods Paragrap
h 1
Scatter-plot. Points indicate subjects. Colors
provided for respective conditions.
Figure 4 A. p(SVC) = 0.014
Network cTBS
effects on
influence-update computations in
the dmPFC
Paragraph 1
t(55) = 4.15
teNetwork cTBS effects
on influence-update
computations in
the dmPFC
Paragraph 1
Nature Neuroscience: doi:10.1038/nn.4602
4
nature neuroscience | reporting checklistM
arch 2016
+-
Figure 4. B
SnPM: Random-
effects permutation
test on parameter estimates
from subject-level
multiple regression
in SPM. Parameter modeled :
connectivity to seed
region (rTPJ VOI) in TMS
vertex > TMS rTPJ at the time of feedback
Data analysi
s: Neuroimaging
57All subjects with fMRI data (57)
methods Paragrap
h 1
Errors bars +/- SEM for mean
beta coefficients284 p(FWE) =
0.031
Network cTBS
effects on
influence-update computations in
the dmPFC
Paragraph 2
Ke = 332, df(55)
Network cTBS
effects on
influence-update
computations in
the dmPFC
Paragraph 2
+-
Figure 5.
A
SPM: one-sample t test on
parameter estimates
from subject-level
multiple regression
on parameter "value of
the chosen option" in
TMS-control
Data analysi
s: Neuroimaging
29 cTBS-vertex (29)
Network cTBS
effects on value
computations in vmPFC
Paragraph 1
None. n/a p(SVC) = 0.04
Network cTBS
effects on value computations in vmPFC
Paragraph 1
t(28) = 4.11
Network cTBS
effects on value
computations in vmPFC
Paragraph 1
+-
Figure 5. B
SPM: two-sample t test on
parameter estimates
from subject-level
multiple regression. Parameter modeled :
connectivity to seed
region (rTPJ VOI) TMS-control >
TMS-rTPJ at the time of choice as a function of
the "Influence update"
Data analysi
s: Neuroimaging
57 All subjects with fMRI data (57)
methods Paragrap
h 1
Errors bars +/- SEM for mean
beta coefficients334 p(SVC) = 0.029
Network cTBS
effects on value computations in vmPFC
Paragraph 2
t(55) = 3.95
Network cTBS
effects on value
computations in vmPFC
Paragraph 2
+- n/a
OLS regression
Matlab fitlm
Payoff ~ 1 +Condition+ Switch_rate
- 58 All subjects (58)methods Paragrap
h 1None. n/a p = 0.36
rTPJ-cTBS
reduces behavioral indices
of influence computa
tions Paragrap
h 2
t (55) = 0.91
rTPJ-cTBS reduces behavioral indices
of influence computat
ions Paragrap
h 2
Nature Neuroscience: doi:10.1038/nn.4602

5
nature neuroscience | reporting checklistM
arch 2016
+-
n/a
Matlab vartestn
'LeveneAbsolute'
test for
equality of variance
rTPJ-cTBS
reduces
behavioral
indices of
influence
computations Paragraph 3
58 All subjects (58)methods Paragrap
h 1None. n/a p = 0.01
rTPJ-cTBS
reduces behavioral indices
of influence computa
tions Paragrap
h 3
F(1,56) = 7.08
rTPJ-cTBS reduces behavioral indices
of influence computat
ions Paragrap
h 3
+-
n/a
SPM: Random-
effects permutation
test on parameter estimates
from subject-level
multiple regression
in SPM. Parameter
modeled the effect of
"Influence update"
Data analysi
s: Neuroimaging
57 All subjects with fMRI data (57)
methods Paragrap
h 1None. n/a
Right pSTS p(SVC)=0
left pSTS
p(SVC)=0.001
Local cTBS
effects on
influence computations in
rTPJ Paragrap
h 1
Right pSTS t(56) = 6.36
left pSTS
t(56) = 5.12
Local cTBS
effects on
influence computat
ions in rTPJ
Paragraph 1
+-
n/a
SnPM: Random-
effects permutation
test on parameter estimates
from subject-level
multiple regression
in SPM. Parameter
modeled the effect of
"Influence update"
Data analysi
s: Neuroimaging
57 All subjects with fMRI data (57)
methods Paragrap
h 1None. n/a
p(FWE) < 0.05. See
table 2 for details.
Local cTBS
effects on
influence computations in
rTPJ Paragrap
h 1
See SI Table 2 for details.
Local cTBS
effects on
influence computat
ions in rTPJ
Paragraph 1
+- n/a
SPM: two-sample t-
test on random-effects
regression on
parameter estimates
from subject-level
multiple regression on "model likelihood" predicting "Influence update"
Data analysi
s: Neuroimaging
57
TMS control subjects TMS rTPJ subjects
with fMRI data.
methods Paragrap
h 1None. n/a p(SVC) = 0.809
Network cTBS
effects on
influence-update computations in
the dmPFC
Paragraph 1
t (53) = 1.53
Network cTBS
effects on
influence-update
computations in
the dmPFC
Paragraph 1
Nature Neuroscience: doi:10.1038/nn.4602

6
nature neuroscience | reporting checklistM
arch 2016
+- n/a
SPM: one-sample t test on
parameter estimates
from subject-level
multiple regression
on parameter "value of
the chosen option"
Data analysi
s: Neuroimaging
57
TMS control subjects TMS rTPJ subjects
with fMRI data.
methods Paragrap
h 1None. n/a p(SVC) = 0.84
Network cTBS
effects on value computations in vmPFC
Paragraph 1
t(56) = 1.12
Network cTBS
effects on value
computations in vmPFC
Paragraph 1
+- n/a
SPM: one-sample t test on
parameter estimates
from subject-level
multiple regression
on parameter "value of
the chosen option"
Data analysi
s: Neuroimaging
28 cTBS-rTPJ (28)methods Paragrap
h 1None. n/a p(SVC)=0.43
Network cTBS
effects on value computations in vmPFC
Paragraph 1
t(27) = 0.43
Network cTBS
effects on value
computations in vmPFC
Paragraph 1
+- n/a HDI test
R rJags
Bayesian
hypothesis
testing Paragraph 1
57 All subjects (58)methods Paragrap
h 1None n/a
p(mcmc) = 0.03
p(mcmc) = 0.48
rTPJ-cTBS
reduces behavioral indices
of influence computa
tions Paragrap
h 3
n/a n/a
rTPJ-cTBS reduces behavioral indices
of influence computat
ions Paragrap
h 3
+- n/a
SPM: one-sample t test on
parameter estimates
from subject-level
multiple regression
on parameter "value of
the chosen option" in
TMS-control > TMS active
Data analysi
s: Neuroimaging
57 All subjects with fMRI data
methods Paragrap
h 1None. n/a p(SVC)=0.30
Network cTBS
effects on value computations in vmPFC
Paragraph 1
t(55) = 2.72
Network cTBS
effects on value
computations in vmPFC
Paragraph 1
+- n/a
Multiple regression with robust estimator (Bisquare
weight function)
Matlab fitlm Beta vmPFC
PPI~1+Kappa+Eta
Regression
models to link cTBS
effects on
behaviour and
neural functio
n
29 cTBS-rTPJ (29)
Relationship
between the
neural and
behavioral effects
caused by TMS
Paragraph 1
None n/a
Kappa p=0.0087
Eta p = 0.43
Relationship
between the
neural and
behavioral effects caused by TMS
Paragraph 1
Kappa t(25)=2.84
Eta t(25) = -0.79
Relationship
between the
neural and
behavioral effects caused by TMS
Paragraph 1
Nature Neuroscience: doi:10.1038/nn.4602
7
nature neuroscience | reporting checklistM
arch 2016
+-
Multiple regression with robust estimator (Bisquare
weight function)
Matlab fitlm
Beta rTPJ PPI~1
+Kappa+Eta
Regression
models to link cTBS
effects on
behaviour and
neural functio
n
29 cTBS-rTPJ (29)
Relationship
between the
neural and
behavioral effects
caused by TMS
Paragraph 1
None n/a
Kappa p=0.97
Eta p = 0.0074
Relationship
between the
neural and
behavioral effects caused by TMS
Paragraph 1
Kappa t(25)= 0.02
Eta t(25) = -2.91
Relationship
between the
neural and
behavioral effects caused by TMS
Paragraph 1
+-
Multiple regression with robust estimator (Bisquare
weight function)
Matlab fitlm Beta dmPFC
PPI~1+Kappa+Eta
Regression
models to link cTBS
effects on
behaviour and
neural functio
n
29 cTBS-rTPJ (29)
Relationship
between the
neural and
behavioral effects
caused by TMS
Paragraph 1
None n/a
Kappa p=0.39
Eta p = 0.57
Relationship
between the
neural and
behavioral effects caused by TMS
Paragraph 1
Kappa t(25)= 0.86
Eta t(25) = 0.56
Relationship
between the
neural and
behavioral effects caused by TMS
Paragraph 1
+-
Figure 6
Multiple regression with robust estimator (Bisquare
weight function)
Matlab fitlm Beta vmPFC
PPI~1+Eta*Condit
ion+Kappa*Con
dition
Regression
models to link cTBS
effects on
behaviour and
neural functio
n
58 All subjects (58)methods Paragrap
h 1
Errors bars +/- SEM for mean
beta coefficientsn/a
Condition p = 0.58 Kappa
p = 0.08 Eta
p = 0.9 Condition*Ka
ppa p = 0.02
Condition*Eta p = 0.61
Relationship
between the
neural and
behavioral effects caused by TMS
Paragraph 1
Condition t(51) = 0.55
Kappa t(51) = -1.7
Eta t(51) = -0.005
Condition*Kappa t(51) = 2.34
Condition*Eta t(51) = -0.51
Relationship
between the
neural and
behavioral effects caused by TMS
Paragraph 1
+-
Figure 6
Multiple regression with robust estimator (Bisquare
weight function)
Matlab fitlm Beta rTPJ~1+Eta*Condit
ion+Kappa*Con
dition
Regression
models to link cTBS
effects on
behaviour and
neural functio
n
58 All subjects (58)methods Paragrap
h 1
Errors bars +/- SEM for mean
beta coefficientsn/a
Condition p = 0.12 Kappa
p = 0.41 Eta
p = 0.75 Condition*Ka
ppa p = 0.87
Condition*Eta p = 0.03
Relationship
between the
neural and
behavioral effects caused by TMS
Paragraph 1
Condition t(51) = -1.54
Kappa t(51) = -0.82
Eta t(51) = -0.31
Condition*Kappa t(51) = 0.16
Condition*Eta t(51) = -2.24
Relationship
between the
neural and
behavioral effects caused by TMS
Paragraph 1
+-
Figure 6
Multiple regression with robust estimator (Bisquare
weight function)
Matlab fitlm Beta dmPFC
PPI~1+Eta*Condit
ion+Kappa*Con
dition
Regression
models to link cTBS
effects on
behaviour and
neural functio
n
58 All subjects (58)methods Paragrap
h 1
Errors bars +/- SEM for mean
beta coefficientsn/a
Condition p = 0.53 Kappa
p = 0.95 Eta
p = 0.59 Condition*Ka
ppa p = 0.48
Condition*Eta p = 0.50
Relationship
between the
neural and
behavioral effects caused by TMS
Paragraph 1
Condition t(51) = -0.61
Kappa t(51) = -0.06
Eta t(51) = -0.53
Condition*Kappa t(51) = 0.70
Condition*Eta t(51) = 0.67
Relationship
between the
neural and
behavioral effects caused by TMS
Paragraph 1
Nature Neuroscience: doi:10.1038/nn.4602
8
nature neuroscience | reporting checklistM
arch 2016
+-
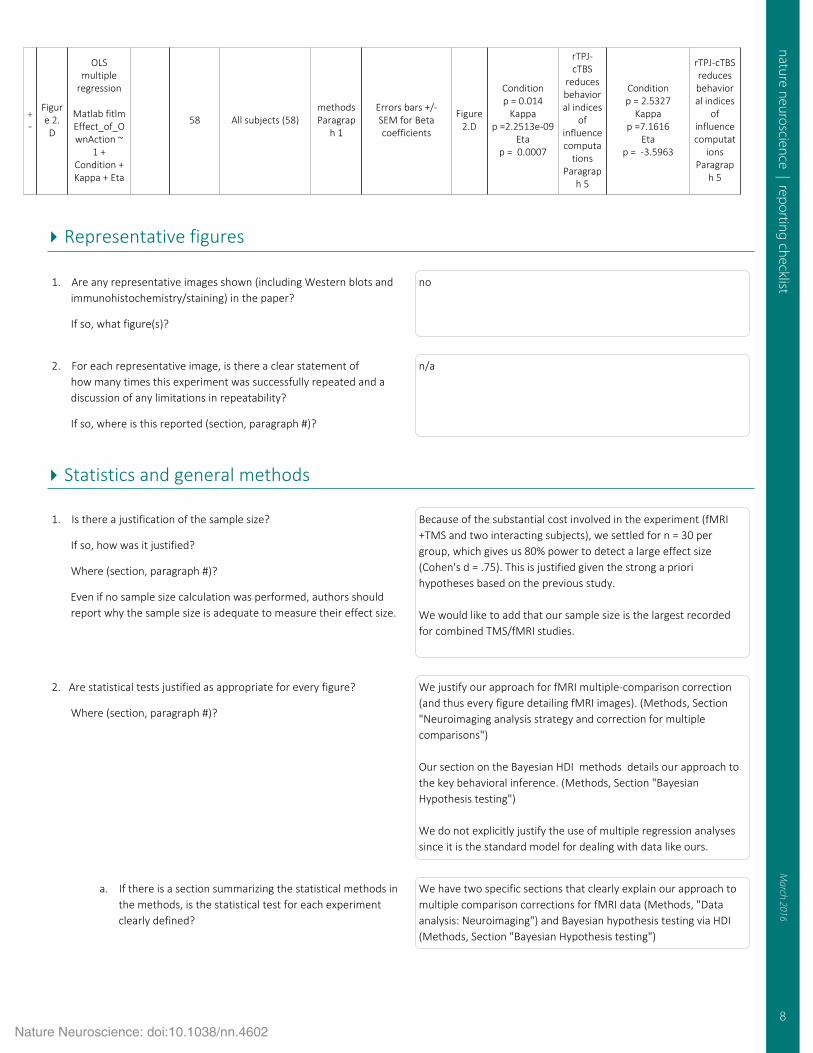
Figure 2. D
OLS multiple
regression
Matlab fitlm Effect_of_OwnAction ~
1 + Condition + Kappa + Eta
58 All subjects (58)methods Paragrap
h 1
Errors bars +/- SEM for Beta coefficients
Figure 2.D
Condition p = 0.014
Kappa p =2.2513e-09
Eta p = 0.0007
rTPJ-cTBS
reduces behavioral indices
of influence computa
tions Paragrap
h 5
Condition p = 2.5327
Kappa p =7.1616
Eta p = -3.5963
rTPJ-cTBS reduces behavioral indices
of influence computat
ions Paragrap
h 5
Representative figures
1. Are any representative images shown (including Western blots and immunohistochemistry/staining) in the paper?
If so, what figure(s)?
no
2. For each representative image, is there a clear statement of how many times this experiment was successfully repeated and a discussion of any limitations in repeatability?
If so, where is this reported (section, paragraph #)?
n/a
Statistics and general methods
1. Is there a justification of the sample size?
If so, how was it justified?
Where (section, paragraph #)?
Even if no sample size calculation was performed, authors should report why the sample size is adequate to measure their effect size.
Because of the substantial cost involved in the experiment (fMRI+TMS and two interacting subjects), we settled for n = 30 per group, which gives us 80% power to detect a large effect size (Cohen's d = .75). This is justified given the strong a priori hypotheses based on the previous study. We would like to add that our sample size is the largest recorded for combined TMS/fMRI studies.
2. Are statistical tests justified as appropriate for every figure?
Where (section, paragraph #)?
We justify our approach for fMRI multiple-comparison correction (and thus every figure detailing fMRI images). (Methods, Section "Neuroimaging analysis strategy and correction for multiple comparisons") Our section on the Bayesian HDI methods details our approach to the key behavioral inference. (Methods, Section "Bayesian Hypothesis testing") We do not explicitly justify the use of multiple regression analyses since it is the standard model for dealing with data like ours.
a. If there is a section summarizing the statistical methods in the methods, is the statistical test for each experiment clearly defined?
We have two specific sections that clearly explain our approach to multiple comparison corrections for fMRI data (Methods, "Data analysis: Neuroimaging") and Bayesian hypothesis testing via HDI (Methods, Section "Bayesian Hypothesis testing")
Nature Neuroscience: doi:10.1038/nn.4602
9
nature neuroscience | reporting checklistM
arch 2016
b. Do the data meet the assumptions of the specific statistical test you chose (e.g. normality for a parametric test)?
Where is this described (section, paragraph #)?
Yes. All statistical tests conform to their assumptions. Some of these assumptions are field-specific (e.g., for fMRI) and we addressed recent concerns about possible problems with cluster-level FWE correction by using non parametric testing or peak-level FWE correction as advocated (Methods, "Neuroimaging analysis strategy and correction for multiple comparisons")
c. Is there any estimate of variance within each group of data?
Is the variance similar between groups that are being statistically compared?
Where is this described (section, paragraph #)?
We do not explicitly report estimates of variance but these variances are explicitly modeled in our analysis approach. All between-group fMRI comparison using Region-of-Interest analysis and peak-level FWE correction assume unequal variance. All whole-brain between-group fMRI comparison use non-parametric statistics (permutation tests). The details of these tests are defined in all table legends.
d. Are tests specified as one- or two-sided? All tests performed on behavioral data are two-sided. All tests on fMRI data via SPM are one-sided as is standard practice in the field.
e. Are there adjustments for multiple comparisons? Yes. There is a section devoted to multiple comparison on fMRI data in our methods sections. For Table 1, where we record a number of variables for each subjects, inference is performed using adjusted alpha via Bonferroni correction. For the section "Relationship between the neural and behavioral effects caused by TMS" we make excplicit the alpha levels via Bonferroni to account for multiple tests.
3. To promote transparency, Nature Neuroscience has stopped allowing bar graphs to report statistics in the papers it publishes. If you have bar graphs in your paper, please make sure to switch them to dot-plots (with central and dispersion statistics displayed) or to box-and-whisker plots to show data distributions.
Bar graphs featured in the manuscript depict coefficients estimates with their standard errors from multiple regressions. There are no datapoints that could be plotted for these point estimates and their confidence intervals. In the Methods sections "Figure S2: Deviation from random responding" we graph the mean and standard deviation of population-level posterior estimates for ME model. This is clearly stated. All remaining graphs are errorbar plots with the underlying data points as per the guidelines.
4. Are criteria for excluding data points reported?
Was this criterion established prior to data collection?
Where is this described (section, paragraph #)?
We did not exclude data points after data collection.
Nature Neuroscience: doi:10.1038/nn.4602
10
nature neuroscience | reporting checklistM
arch 2016
5. Define the method of randomization used to assign subjects (or samples) to the experimental groups and to collect and process data.
If no randomization was used, state so.
Where does this appear (section, paragraph #)?
Our subjects were randomly recruited from the Zurich student population (provided they adhere to TMS/fMRI safety restrictions). The recruitment criteria were identical for both groups. This is stated in paragraph 2 under "Experimental Design and Task"
6. Is a statement of the extent to which investigator knew the group allocation during the experiment and in assessing outcome included?
If no blinding was done, state so.
Where (section, paragraph #)?
N/A. TMS experiments cannot be blind. Statement is made explicit in the text, methods "Ethics compliance, blinding, and conflict of interest."
7. For experiments in live vertebrates, is a statement of compliance with ethical guidelines/regulations included?
Where (section, paragraph #)?
Our experiment was done in full compliance with ethical imperatives of our laboratory (SNS-lab), institution (University of Zürich) and Canton-level (Zürich) regulations. methods "Ethics compliance, blinding, and conflict of interest."
8. Is the species of the animals used reported?
Where (section, paragraph #)?
n/a
9. Is the strain of the animals (including background strains of KO/transgenic animals used) reported?
Where (section, paragraph #)?
n/a
10. Is the sex of the animals/subjects used reported?
Where (section, paragraph #)?
Yes, Methods "Participants"; 60 females, 60 males.
11. Is the age of the animals/subjects reported?
Where (section, paragraph #)?
Yes, Methods "Participants"; age restricted to 18-25
12. For animals housed in a vivarium, is the light/dark cycle reported?
Where (section, paragraph #)?
n/a
13. For animals housed in a vivarium, is the housing group (i.e. number of animals per cage) reported?
Where (section, paragraph #)?
n/a
14. For behavioral experiments, is the time of day reported (e.g. light or dark cycle)?
Where (section, paragraph #)?
No. It is not reported. The experiments began at 8AM, and concluded at 8PM.
Nature Neuroscience: doi:10.1038/nn.4602
11
nature neuroscience | reporting checklistM
arch 2016
15. Is the previous history of the animals/subjects (e.g. prior drug administration, surgery, behavioral testing) reported?
Where (section, paragraph #)?
We took a number of auxiliary measurements on our subject population to ensure they were well-matched. Those measurements are reported in Table SI 1.
a. If multiple behavioral tests were conducted in the same group of animals, is this reported?
Where (section, paragraph #)?
n/a
16. If any animals/subjects were excluded from analysis, is this reported?
Where (section, paragraph #)?
Yes, it is reported. Methods "Participants".
a. How were the criteria for exclusion defined?
Where is this described (section, paragraph #)?
We excluded two subjects who could not carry on the procedure due to feeling anxious/dizzy. Additionally, one subject's fMRI data were lost due to scanner database error. For the post-experimental questionnaires use in supplementary table 1 : Three subjects left the second part of the questionnaire form unanswered after completing the computerized N-back test. This is described in methods "Participants".
b. Specify reasons for any discrepancy between the number of animals at the beginning and end of the study.
Where is this described (section, paragraph #)?
n/a
Reagents
1. Have antibodies been validated for use in the system under study (assay and species)?
n/a
a. Is antibody catalog number given?
Where does this appear (section, paragraph #)?
n/a
b. Where were the validation data reported (citation, supplementary information, Antibodypedia)?
Where does this appear (section, paragraph #)?
n/a
2. Cell line identity
a. Are any cell lines used in this paper listed in the database of
commonly misidentified cell lines maintained by ICLAC and
NCBI Biosample?
Where (section, paragraph #)?
n/a
b. If yes, include in the Methods section a scientific justification of their use--indicate here in which section and paragraph the justification can be found.
n/a
Nature Neuroscience: doi:10.1038/nn.4602

12
nature neuroscience | reporting checklistM
arch 2016
c. For each cell line, include in the Methods section a statement that specifies:
- the source of the cell lines
- have the cell lines been authenticated? If so, by which
method?
- have the cell lines been tested for mycoplasma
contamination?
Where (section, paragraph #)?
n/a
Data availabilityProvide a Data availability statement in the Methods section under "Data
availability", which should include, where applicable: • Accession codes for deposited data • Other unique identifiers (such as DOIs and hyperlinks for any other datasets) • At a minimum, a statement confirming that all relevant data are available from the authors • Formal citations of datasets that are assigned DOIs • A statement regarding data available in the manuscript as source data • A statement regarding data available with restrictions
See our data availability and data citations policy page for more information.
Data deposition in a public repository is mandatory for:
a. Protein, DNA and RNA sequences b. Macromolecular structures c. Crystallographic data for small molecules d. Microarray data
Deposition is strongly recommended for many other datasets for which structured public repositories exist; more details on our data policy are available here. We encourage the provision of other source data in supplementary information or in unstructured repositories such as Figshare and Dryad.
We encourage publication of Data Descriptors (see Scientific Data) to maximize data reuse.
Where is the Data Availability statement provided (section, paragraph #)?
Raw behavioural data, Matlab and R code for reconstruction all figures and statistical analysis (including fMRI t-maps and ROIs) reported in the main text is available online (Code repository DOI). Raw fMRI data and processing pipelines are available upon request. This is stated in the methods section under "Data and code availability"
Computer code/software
Any custom algorithm/software that is central to the methods must be supplied by the authors in a usable and readable form for readers at the time of publication. However, referees may ask for this information at any time during the review process.
1. Identify all custom software or scripts that were required to conduct the study and where in the procedures each was used.
No custom softwares were used. Custom scripts were used, both in MATLAB and R. See code repository for a full description of custom code.
Nature Neuroscience: doi:10.1038/nn.4602

13
nature neuroscience | reporting checklistM
arch 2016
2. If computer code was used to generate results that are central to the paper's conclusions, include a statement in the Methods section under "Code availability" to indicate whether and how the code can be accessed. Include version information as necessary and any restrictions on availability.
We provide such statement in the methods section under "Data and code availability"
Human subjects
1. Which IRB approved the protocol?
Where is this stated (section, paragraph #)?
The Ethics Committee of the Canton of Zürich approved the protocol.
2. Is demographic information on all subjects provided?
Where (section, paragraph #)?
Yes. See Table SI 1 for exhaustive summary.
3. Is the number of human subjects, their age and sex clearly defined?
Where (section, paragraph #)?
Yes. See Table SI1 and methods section "Participants"
4. Are the inclusion and exclusion criteria (if any) clearly specified?
Where (section, paragraph #)?
Yes. Methods section "Participants"
5. How well were the groups matched?
Where is this information described (section, paragraph #)?
We collected a number of measures to account for putative discrepances between our groups of subjects. Results from Table 1 indicate our groups were well-matched. See methods "Experimental Design and Task" Paragraph 2
6. Is a statement included confirming that informed consent was obtained from all subjects?
Where (section, paragraph #)?
Yes. See Methods "Ethics compliance, blinding, and conflict of interest."
7. For publication of patient photos, is a statement included confirming that consent to publish was obtained?
Where (section, paragraph #)?
n/a
fMRI studies
For papers reporting functional imaging (fMRI) results please ensure that these minimal reporting guidelines are met and that all this information is clearly provided in the methods:
1. Were any subjects scanned but then rejected for the analysis after the data was collected?
No.
a. If yes, is the number rejected and reasons for rejection described?
Where (section, paragraph #)?
n/a
Nature Neuroscience: doi:10.1038/nn.4602

14
nature neuroscience | reporting checklistM
arch 2016
2. Is the number of blocks, trials or experimental units per session and/or subjects specified?
Where (section, paragraph #)?
Yes. In methods "Experimental Design and Task" paragraph 3
3. Is the length of each trial and interval between trials specified? Yes. In methods "Experimental Design and Task" paragraph 3
4. Is a blocked, event-related, or mixed design being used? If applicable, please specify the block length or how the event-related or mixed design was optimized.
Event-related design. Timings were optimized using simulations and the criterion contrast efficiency. We optimized design efficiency for both the decision and feedback epoch.
5. Is the task design clearly described?
Where (section, paragraph #)?
Yes. See main text Figure 1 and and methods "Experimental Design and Task"
6. How was behavioral performance measured? Sum of points scored in the task.
7. Is an ANOVA or factorial design being used? No.
8. For data acquisition, is a whole brain scan used?
If not, state area of acquisition.
Yes
a. How was this region determined? n/a
9. Is the field strength (in Tesla) of the MRI system stated? 3 Tesla
a. Is the pulse sequence type (gradient/spin echo, EPI/spiral) stated?
Yes.
b. Are the field-of-view, matrix size, slice thickness, and TE/TR/flip angle clearly stated?
Yes.
10. Are the software and specific parameters (model/functions, smoothing kernel size if applicable, etc.) used for data processing and pre-processing clearly stated?
Yes.
11. Is the coordinate space for the anatomical/functional imaging data clearly defined as subject/native space or standardized stereotaxic space, e.g., original Talairach, MNI305, ICBM152, etc? Where (section, paragraph #)?
We used the MNI norm. Methods "Data acquisition: fMRI recording and pre-processing"
12. If there was data normalization/standardization to a specific space template, are the type of transformation (linear vs. nonlinear) used and image types being transformed clearly described? Where (section, paragraph #)?
Yes. Methods "Data acquisition: fMRI recording and pre-processing"
13. How were anatomical locations determined, e.g., via an automated labeling algorithm (AAL), standardized coordinate database (Talairach daemon), probabilistic atlases, etc.?
Using AAL from WfuPickAtlas.
Nature Neuroscience: doi:10.1038/nn.4602

15
nature neuroscience | reporting checklistM
arch 2016
14. Were any additional regressors (behavioral covariates, motion etc) used?
Yes. We used behavioral covariates, motion and physiological covariates. See methods "Data acquisition: Peripheral measures" and "fMRI design matrix"
15. Is the contrast construction clearly defined? Yes.
16. Is a mixed/random effects or fixed inference used? All inference was performed using Random Effects Analysis.
a. If fixed effects inference used, is this justified? n/a
17. Were repeated measures used (multiple measurements per subject)? Yes.
a. If so, are the method to account for within subject correlation and the assumptions made about variance clearly stated?
Yes.
18. If the threshold used for inference and visualization in figures varies, is this clearly stated?
Thresholds are stated in every figure caption.
19. Are statistical inferences corrected for multiple comparisons? Yes.
a. If not, is this labeled as uncorrected? We do not make inference on uncorrected results.
20. Are the results based on an ROI (region of interest) analysis? Yes.
a. If so, is the rationale clearly described? Yes.
b. How were the ROI’s defined (functional vs anatomical localization)?
See "Neuroimaging analysis strategy and correction for multiple comparisons" for precise definition of all ROI. ROIs are functionally defined based on prior studies.
21. Is there correction for multiple comparisons within each voxel? All ROI results use peak-level correction. For display purposes, figures for ROI analysis show uncorrected thresholds inside ROIs (p = 0.001 (yellow) and p = 0.005 (red)). When applicable, ROI volumes are clearly shown in all figures in Black for transparency.
22. For cluster-wise significance, is the cluster-defining threshold and the corrected significance level defined?
Yes. We use SnPM non-parametric toolbox for all whole-brain analysis and cluster-level correction. (see Methods "Neuroimaging analysis strategy and correction for multiple comparisons")
Additional comments
Additional Comments None.
Nature Neuroscience: doi:10.1038/nn.4602