Embed Size (px)
Citation preview
Review
www.thelancet.com Published online November 28, 2018 http://dx.doi.org/10.1016/S0140-6736(18)32594-7 1
The 2018 report of the Lancet Countdown on health and climate change: shaping the health of nations for centuries to comeNick Watts, Markus Amann, Nigel Arnell, Sonja Ayeb-Karlsson, Kristine Belesova, Helen Berry, Timothy Bouley, Maxwell Boykoff, Peter Byass, Wenjia Cai, Diarmid Campbell-Lendrum, Jonathan Chambers, Meaghan Daly, Niheer Dasandi, Michael Davies, Anneliese Depoux, Paula Dominguez-Salas, Paul Drummond, Kristie L Ebi, Paul Ekins, Lucia Fernandez Montoya, Helen Fischer, Lucien Georgeson, Delia Grace, Hilary Graham, Ian Hamilton, Stella Hartinger, Jeremy Hess, Ilan Kelman, Gregor Kiesewetter, Tord Kjellstrom, Dominic Kniveton, Bruno Lemke, Lu Liang, Melissa Lott, Rachel Lowe, Maquins Odhiambo Sewe, Jaime Martinez-Urtaza, Mark Maslin, Lucy McAllister, Slava Jankin Mikhaylov, James Milner, Maziar Moradi-Lakeh, Karyn Morrissey, Kris Murray, Maria Nilsson, Tara Neville, Tadj Oreszczyn, Fereidoon Owfi, Olivia Pearman, David Pencheon, Steve Pye, Mahnaz Rabbaniha, Elizabeth Robinson, Joacim Rocklöv, Olivia Saxer, Stefanie Schütte, Jan C Semenza, Joy Shumake-Guillemot, Rebecca Steinbach, Meisam Tabatabaei, Julia Tomei, Joaquin Trinanes, Nicola Wheeler, Paul Wilkinson, Peng Gong*, Hugh Montgomery*, Anthony Costello*
Executive summaryThe Lancet Countdown: tracking progress on health and climate change was established to provide an independent, global monitoring system dedicated to tracking the health dimensions of the impacts of, and the response to, climate change. The Lancet Countdown tracks 41 indicators across five domains: climate change impacts, exposures, and vulnerability; adaptation, planning, and resilience for health; mitigation actions and health co-benefits; finance and economics; and public and political engagement.
This report is the product of a collaboration of 27 leading academic institutions, the UN, and intergovernmental agencies from every continent. The report draws on world-class expertise from climate scientists, ecologists, mathematicians, geographers, engineers, energy, food, live stock, and transport experts, economists, social and poli tical scientists, public health professionals, and doctors.
The Lancet Countdown’s work builds on decades of research in this field, and was first proposed in the 2015 Lancet Commission on health and climate change,1 which documented the human impacts of climate change and provided ten global recommendations to respond to this public health emergency and secure the public health benefits available (panel 1).
The following four key messages derive from the Lancet Countdown’s 2018 report:1 Present day changes in heat waves, labour capacity,
vector-borne disease, and food security provide early warning of the compounded and overwhelming impact on public health that are expected if temperatures continue to rise. Trends in climate change impacts, exposures, and vulnerabilities show an unacceptably high level of risk for the current and future health of populations across the world.
2 A lack of progress in reducing emissions and building adaptive capacity threatens both human lives and the viability of the national health systems they depend on, with the potential to disrupt core public health infra structure and overwhelm health services.
3 Despite these delays, a number of sectors have seen the beginning of a low-carbon transition, and it is clear that the nature and scale of the response to climate change will be the determining factor in shaping the health of nations for centuries to come.
4 Ensuring a widespread understanding of climate change as a central public health issue will be crucial in delivering an accelerated response, with the health profession beginning to rise to this challenge.
Climate change impacts, exposures, and vulnerabilityVulnerability to extremes of heat has steadily risen since 1990 in every region, with 157 million more people exposed to heatwave events in 2017, compared with 2000, and with the average person experiencing an additional 1·4 days of heatwaves per year over the same period (indicators 1.1 and 1.3). For national economies and household budgets, 153 billion hours of labour were lost in 2017 because of heat, an increase of more than 62 billion hours (3·2 billion weeks of work) since 2000 (indicator 1.4). The direct effects of climate change extend beyond heat to include extremes of weather. In 2017, a total of 712 extreme weather events resulted in US$326 billion in economic losses, almost triple the total losses of 2016 (indicator 4.1).
Small changes in temperature and precipitation can result in large changes in the suitability for transmission of important vector-borne and water-borne diseases. In 2016, global vectorial capacity for the transmission of the dengue fever virus was the highest on record, rising to 9·1% for Aedes aegypti and 11·1% for Aedes albopictus above the 1950s baseline. Focusing on high-risk areas and diseases, the Baltic region has had a 24% increase in the coastline area suitable for epidemics of Vibrio cholerae, and in 2016, the highlands of sub-Saharan Africa saw a 27·6% rise in the vectorial capacity for the transmission of malaria from the 1950 baseline (indicator 1.8). A proxy of agricultural yield potential shows declines in every region, with 30 countries having downward trends in yields, reversing a decades-long trend of improvement (indicator 1.9.1).
Published Online November 28, 2018 http://dx.doi.org/10.1016/S0140-6736(18)32594-7
*Co-chairs
Institute for Global Health (N Watts MA, I Kelman PhD, N Wheeler MSc), Institute for Environmental Design and Engineering (Prof M Davies PhD), Institute for Sustainable Resources (P Drummond MSc, Prof P Ekins PhD, J Tomei PhD), Department of Geography (L Georgeson PhD, Prof M Maslin PhD), UCL Energy Institute (I Hamilton PhD, T Oreszczyn PhD, S Pye MSc), Centre for Human Health and Performance, Department of Medicine (Prof H Montgomery MD), and Office of the Vice-Provost (Research) (Prof A Costello FMedSci), University College London, London, UK; Air Quality and Greenhouse Gases Programme, International Institute for Applied Systems Analysis, Laxenburg, Austria (M Amann PhD, G Kiesewetter PhD); Department of Meteorology (Prof N Arnell PhD) and School of Agriculture, Policy, and Development (Prof E Robinson PhD), University of Reading, Reading, UK; Institute for Environment and Human Security, UN University (S Ayeb-Karlsson PhD); Department of Public Health, Environments, and Society (K Belesova PhD, J Milner PhD, R Steinbach PhD, Prof P Wilkinson FRCP), Department of Infectious Disease Epidemiology
**Strictly embargoed until 23.30 UK time / 6.30pm New York time
Wednesday 28th November 2018**
Review
2 www.thelancet.com Published online November 28, 2018 http://dx.doi.org/10.1016/S0140-6736(18)32594-7
(R Lowe PhD), and Department of Population Health
(P Dominguez-Salas PhD), London School of Hygiene &
Tropical Medicine, London, UK; Sydney School of Public Health,
Sydney Medical School, University of Sydney, Sydney,
Australia (Prof H Berry PhD); Health and Climate Change
Unit, World Bank, Washington, DC, USA (T Bouley MD);
Cooperative Institute for Research in Environmental
Sciences (M Boykoff PhD), History and Society Division
(L McAllister PhD), and Centre for Science and Technology
Policy Research (O Pearman MEM), University of
Colorado Boulder, Boulder, CO, USA; Epidemiology and Global
Health Unit, Department of Public Health and Clinical
Medicine (Prof P Byass PhD, M O Sewe PhD, M Nilsson PhD,
Prof J Rocklöv PhD), Umeå University, Umeå, Sweden;
Department of Earth System Science, Tsinghua University,
Beijing, China (W Cai PhD, Prof P Gong PhD); Department
of Public Health and the Environment, WHO, Geneva,
Switzerland (D Campbell-Lendrum DPhil,
L F Montoya MSc, T Neville MSc); University of Geneva, Geneva, Switzerland (J Chambers PhD);
Department of Environmental Studies, University of
New England, Biddeford, ME, USA (M Daly PhD); School of
Government and Society, University of Birmingham,
Birmingham, UK (N Dasandi PhD); Centre
Virchow-Villermé for Public Health Paris-Berlin, Université
Sorbonne Paris Cité and Université Paris Sorbonne,
Paris, France (A Depoux PhD, O Saxer MA, S Schütte PhD);
Department of Global Health (Prof K Ebi PhD) and Centre for
Health and the Global Environment (J Hess PhD), University of Washington,
Washington, DC, USA; Department of Psychology,
Heidelberg University, Heidelberg, Germany
(H Fischer PhD); International Livestock Research Institute, Nairobi, Kenya (D Grace PhD);
Department of Health Sciences, University of York, York, UK
(Prof H Graham PhD); Universidad Peruana Cayetano
Heredia, Lima, Peru (S Hartinger Peña PhD); Health
Decreasing labour productivity, increased capacity for the transmission of diseases such as dengue fever, malaria, and cholera, and threats to food security provide early warning of compounding negative health and nutrition effects if temperatures continue to rise.
Adaptation, planning, and resilience for healthGlobal inertia in adapting to climate change persists, with a mixed response from national governments since the signing of the Paris Agreement in 2015. More than half of global cities surveyed expect climate change to seriously
compromise public health infrastructure, either directly, with extremes of weather disrupting crucial services, or indirectly, through the overwhelming of existing services with increased burdens of disease (indicator 2.2).
Globally, spending for climate change adaptation remains well below the $100 billion per year commitment made under the Paris Agreement. Within this annual spending, only 3·8% of total development spending committed through formal UN Framework Convention on Climate Change (UNFCCC) mechanisms is dedicated to human health (indicator 2.8). This low investment in
Panel 1: Progress towards the recommendations of the 2015 Lancet Commission on health and climate change
In 2015, the Lancet Commission made ten policy recommendations. Of these ten recommendations, the Lancet Countdown is measuring progress on the following:
Recommendation 1: invest in climate change and public health researchSince 2007, the number of published articles on health and climate change in scientific journals has increased by 182% (indicator 5.2).
Recommendation 2: scale up financing for climate-resilient health systemsSpending on direct health adaptation as a proportion of total adaptation spending increased in 2017 to 4·8% (£11·68 billion), which is an increase in absolute and relative terms from the previous year (indicator 2.7). Health-related adaptation spending (including disaster response and food and agriculture) was estimated at 15·2% of total adaptation spend. Although this national-level spending is increasing, climate financing for mitigation and adaptation remains well below the US$100 billion per year committed in the Paris Agreement (indicator 2.8).
Recommendation 3: phase out coal-fired powerCoal consumption remains high, but continued to decline in 2017, a trend which is largely driven by China’s decreased reliance and continued investment in renewable energy (indicators 3.2 and 3.3). The Powering Past Coal Alliance (an alliance of 23 countries including the UK, Italy, Canada, and France) was launched at the 23rd Conference of the Parties to the UN Framework Convention on Climate Change (UNFCCC) in December, 2017 (COP23), committing to phase out coal use by 2030 or earlier.
Recommendation 4: encourage city-level low-carbon transition to reduce urban pollutionIn 2017, a new milestone was reached, with more than 2 million electric vehicles on the road, and with global per-capita electricity consumption for road transport increasing by 13% from 2013 to 2015 (indicator 3.6). China is responsible for more than 40% of electric cars sold globally.
Recommendation 5: establish the framework for a strong and predictable carbon pricing mechanismAlthough a global carbon pricing mechanism has seen limited progress, the proportion of total greenhouse-gas emissions
covered by national and regional instruments is increasing from a low base. In 2017, 13·1% of greenhouse-gas emissions were covered, a proportion that is expected to increase to 20% in 2018, with the implementation of the Chinese National Emissions Trading Scheme (indicator 4.9).
Recommendation 6: rapidly expand access to renewable energy, unlocking the substantial economic gains available from this transitionGlobally, 157 GW of renewable energy was installed in 2017, more than twice as much as the 70 GW of fossil fuel capacity that was installed (indicator 3.3), which advanced mitigation efforts and improved local air quality. This trend was mirrored by a 5·7% increase in the number of people employed in renewable energy in 2017, which reached 10·3 million jobs (indicator 4.4). From 2000 to 2016, the number of people without connection to electricity fell from 1·7 billion to 1·1 billion (indicator 3.4).
Recommendation 9: agree and implement an international treaty that facilitates the transition to a low-carbon economyIn response to the USA’s announcement of its intention to withdraw from the Paris Agreement, the great majority of countries provided statements of support for the agreement, reaffirming their commitment to hold global average temperature rise to well below 2°C. Nicaragua and Syria have both since signed the Paris Agreement. The UNFCCC requested the development of a formal report to be delivered at COP24 (December, 2018), which is designed to provide recommendations on how public health can more comprehensively engage with the negotiation process.
Recommendation 10: develop a new, independent collaboration to provide expertise in implementing policies that mitigate climate change and promote public health, and monitor progress over the next 15 yearsThe Lancet Countdown is a growing collaboration of 27 partners, committed to an iterative and open process of tracking the links between public health and climate change. In 2018, the Wellcome Trust announced its intention to continue funding the collaboration’s work, supporting ongoing monitoring across its five domains up to 2030.
**Strictly embargoed until 23.30 UK time / 6.30pm New York time
Wednesday 28th November 2018**
Review
www.thelancet.com Published online November 28, 2018 http://dx.doi.org/10.1016/S0140-6736(18)32594-7 3
and Environment International Trust, Nelson, New Zealand (T Kjellstrom PhD); School of Global Studies, University of Sussex, Falmer, UK (Prof D Kniveton PhD); Nelson Marlborough Institute of Technology, Nelson, New Zealand (B Lemke PhD); University of North Texas, Denton, TX, USA (L Liang PhD); Asia Pacific Energy Research Centre, Tokyo, Japan (Lott M PhD); The Centre for Environment, Fisheries, and Aquaculture Science, Weymouth, UK (J Martinez-Urtaza); Institute for Analytics and Data Science, University of Essex, Essex, UK (Prof S J Mikhaylov PhD); Preventive Medicine and Public Health Research Centre, Iran University of Medical Sciences, Tehran, Iran (M Moradi-Lakeh MD); European Centre for the Environment and Human Health (K Morrissey PhD) and Medical School (D Pencheon BM), University of Exeter, Exeter, UK; Faculty of Medicine, School of Public Health, Imperial college London, London, UK (K Murray PhD); Iranian Fisheries Science Research Institute, Agricultural Research, Education, and Extension Organisation, Tehran, Iran (F Owfi PhD, M Rabbaniha PhD); European Centre for Disease Control and Prevention, Solna, Sweden (J Semenza PhD); WHO-WMO Joint Climate and Health Office, Geneva, Switzerland (J Shumake-Guillemot DrPH); Agricultural Biotechnology Research Institute of Iran, Agricultural Research, Education, and Extension Organisation, Tehran, Iran (M Tabatabaei PhD); and Physical Oceanography Division, Atlantic Oceanographic and Meteorological Laboratory, National Oceanic and Atmospheric Administration, Miami, FL, USA (J Trinanes PhD)
Correspondence to: Dr Nick Watts, Institute for Global Health, University College London, London WC1N 1EH, UK [email protected]
For the Lancet report see https://www.thelancet.com/climate-and-health
and for more on the accompanying materials see www.lancetcountdown.org
adaptive capacity is magnified in specific regions around the world, with only 55% of African countries meeting International Health Regulation core requirements for preparedness for a multihazard public health emergency (indicator 2.3).
Mitigation actions and health co-benefitsMultiple examples of stagnated mitigation efforts exist, with a crucial marker of decarbonisation—the carbon intensity of total primary energy supply—remaining un-changed since 1990 (indicator 3.1). A third of the global population, 2·8 billion people, live without access to healthy, clean, and sustainable cooking fuel or technolo-gies, which is the same number of people as in 2000 (indicator 3.4). In the transport sector, per-capita global road-transport fuel use increased by 2% from 2013 to 2015, and cycling comprises less than 10% of total journeys taken in three quarters of a global sample of cities (indicators 3.6 and 3.7).
The health burden of such inaction has been immense, with people in more than 90% of cities breathing polluted air that is toxic to their cardiovascular and respiratory health. Indeed, between 2010, and 2016, air pollution concentrations worsened in almost 70% of cities around the globe, particularly in low-income and middle-income countries (LMICs; indicator 3.5.1). In 2015 alone, fine particulate matter (ie, atmospheric particulate matter with a diameter of less than 2·5 µm [PM2·5]) was responsible for 2·9 million premature deaths, with coal being responsible for more than 460 000 (16%) of these deaths, and with the total death toll (from other causes including particulates and emissions such as nitrogen oxide) being substantially higher (indicator 3.5.2). Of concern, global employment in fossil-fuel extractive industries actually increased by 8% between 2016, and 2017, reversing the strong decline seen since 2011 (indicator 4.4). At a time when national health budgets and health services face a growing epidemic of lifestyle diseases, continued delay in unlocking the potential health co-benefits of climate change mitigation is short-sighted and damaging for human health.
Despite this stagnation, progress in the power generation and transport sectors provide some cause for optimism, with many positive trends being observed in the 2017 report,2 and which continue in the present 2018 report. Notably, coal use continues to decline (indicator 3.2) and more renewable energy was installed in 2017 than energy from fossil fuels (indicator 3.3). However, maintaining the global average temperature rise to well below 2°C necessitates wide-reaching transformations across all sectors of society, including power generation, transport, spatial infra structure, food and agriculture, and the design of health systems. These transformations, in turn, offer levers to help tackle the root causes of the world’s greatest public health challenges.
Finance and economicsAbout 712 climate-related extreme events were res-ponsible for US$326 billion of losses in 2017, almost triple the losses of 2016 (indicator 4.1). Crucially, 99% of the losses in low-income countries remained uninsured.
Indicators of investment in the low-carbon economy show that the transition is already underway, with con-tinued growth in investment in zero-carbon energy, and growing numbers of people employed in renewable energy sectors (indicators 4.2 and 4.4). Furthermore, investment in new coal capacity in 2017, was at its lowest in at least 10 years, with 2015 potentially marking a peak in coal investment. Correspondingly, global subsidies for fossil fuels continued to decrease, and carbon pricing only covers 13·1% of global greenhouse-gas emissions, a number that is expected to increase to more than 20% when planned legislation in China is implemented in late 2018 (indicators 4.6 and 4.7).
However, the rise of employment in fossil fuel in-dustries in 2017 reversed a 5 year downward trend, and will be a key indicator to follow closely.
Public and political engagementA better understanding of the health dimensions of climate change allows for advanced preparedness, in-creased resilience and adaptation, and a prioritisation of mitigation interventions that protect and promote human wellbeing.
To this end, coverage of health and climate change in the media has increased substantially between 2007, and 2017 (indicator 5.1). Following this trend, the number of academic journal articles published on health and climate change has almost tripled over the same period (indicator 5.2). These figures often follow internationally important events, such as the UNFCCC’s Conference of the Parties (COP), along with temporary rises in mentions of health and climate change within the UN General Debate (UNGD; indicator 5.3). The extended heatwaves across the northern hemisphere in the summer of 2018, might prove to be a turning point in public awareness of the seriousness of climate change.
2017 saw a substantial rise in the number of medical and health professional associations actively respon-ding to climate change. In the USA, the US Medical Society Consortium on Health and Climate represents 500 000 physicians. This organisation follows the forma-tion of the UK Health Alliance on Climate Change, which brings together many of the UK’s royal medical and nursing colleges and major health institutions. Organisations like the European Renal Association–European Dialysis and Transplant Association and the UK’s National Health Service (NHS) are committing to reducing the contributions of their clinical practice emis-sions. The NHS achieved an 11% reduction in emissions between 2007, and 2015. Several health organisa tions have divested, or are committing to divest, their holdings in fossil fuel companies, including the Royal Australasian
**Strictly embargoed until 23.30 UK time / 6.30pm New York time
Wednesday 28th November 2018**
Review
4 www.thelancet.com Published online November 28, 2018 http://dx.doi.org/10.1016/S0140-6736(18)32594-7
College of Physicians, the Canadian Medical Association, the American Public Health Association, and the World Medical Association (indicator 4.5).
Given that climate change is the biggest global health threat of the 21st century, responding to this threat, and ensuring this response delivers the health benefits avail-able, is the responsibility of the health profes sion; indeed, such a transformation will not be possible without it.
Progress on the recommendations of the 2015 Lancet CommissionThe 2015 Lancet Commission1 made ten global recom-mendations to accelerate the response to climate change and deliver the health benefits this response could offer. A summary of the progress made against these recom-mendations using the 2018 Lancet Countdown’s indicators is presented in panel 1. Here, global leadership is increasingly provided by China, the EU, and many of the countries that are most vulnerable to climate change.
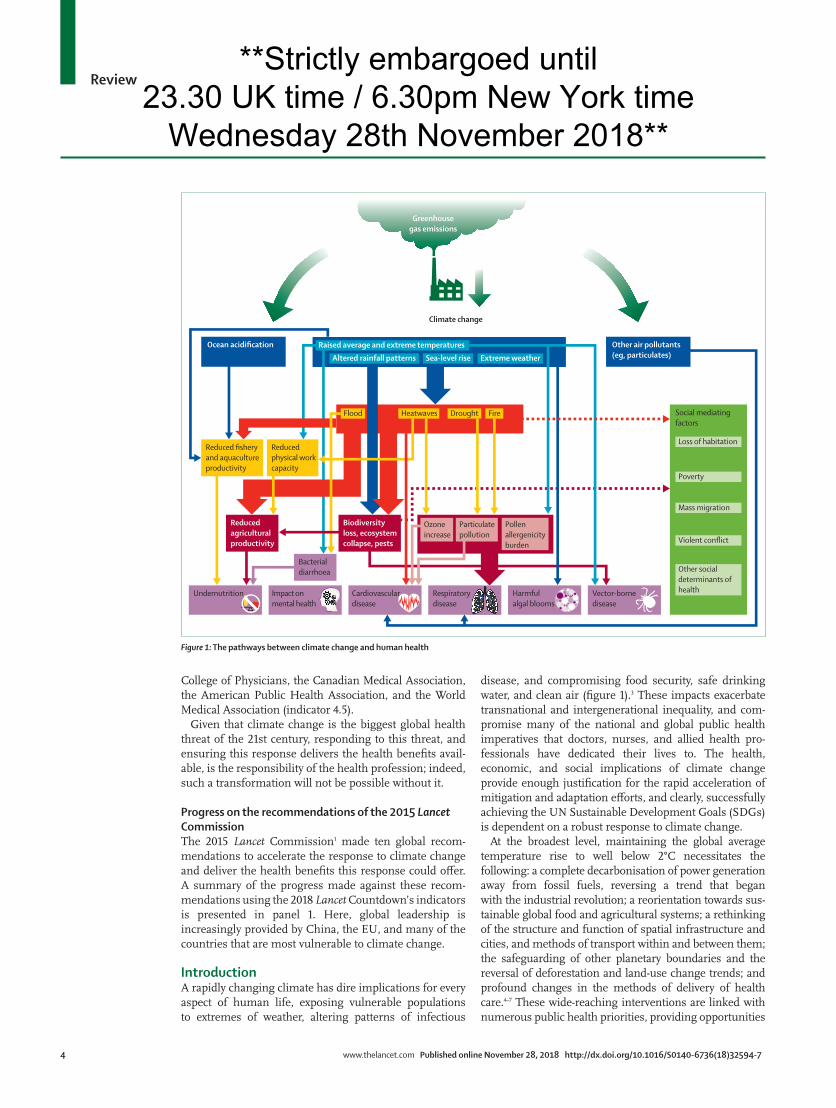
IntroductionA rapidly changing climate has dire implications for every aspect of human life, exposing vulnerable popula tions to extremes of weather, altering patterns of in fectious
disease, and compromising food security, safe drinking water, and clean air (figure 1).3 These impacts exacerbate transnational and intergenerational inequality, and com-promise many of the national and global public health imperatives that doctors, nurses, and allied health pro-fessionals have dedicated their lives to. The health, economic, and social implications of climate change provide enough justification for the rapid acceleration of mitigation and adaptation efforts, and clearly, success fully achieving the UN Sustainable Development Goals (SDGs) is dependent on a robust response to climate change.
At the broadest level, maintaining the global average temperature rise to well below 2°C necessitates the following: a complete decarbonisation of power gener ation away from fossil fuels, reversing a trend that began with the industrial revolution; a reorientation towards sus-tainable global food and agricultural systems; a rethinking of the structure and function of spatial infrastructure and cities, and methods of transport within and between them; the safeguarding of other planetary boundaries and the reversal of deforestation and land-use change trends; and profound changes in the methods of delivery of health care.4–7 These wide-reaching interventions are linked with numerous public health priorities, providing opportunities
Reduced agriculturalproductivity
Bacterialdiarrhoea
Undernutrition Impact onmental health
Cardiovasculardisease
Harmfulalgal blooms
Vector-bornedisease
Greenhousegas emissions
Climate change
Ocean acidification Other air pollutants(eg, particulates)
Raised average and extreme temperaturesAltered rainfall patterns Sea-level rise
Ozone increase
Particulatepollution
Pollenallergenicityburden
Extreme weather
Flood Heatwaves Drought Fire
Reduced fisheryand aquacultureproductivity
Reduced physical workcapacity
Biodiversity loss, ecosystemcollapse, pests
Social mediatingfactors
Loss of habitation
Poverty
Mass migration
Violent conflict
Other socialdeterminants ofhealthRespiratory
disease
Figure 1: The pathways between climate change and human health
**Strictly embargoed until 23.30 UK time / 6.30pm New York time
Wednesday 28th November 2018**

Review
www.thelancet.com Published online November 28, 2018 http://dx.doi.org/10.1016/S0140-6736(18)32594-7 5
to improve breathing conditions for 90% of the global population exposed to polluted air, tackle the root causes of obesity, physical inactivity, and poor diet, alleviate social inequalities and promote social inclusion, improve work-place environments, and increase access to health care and other social services.1
Taken as a whole, the form and pace of the world’s response to climate change will shape the health of nations for centuries to come.
The Lancet Countdown: tracking progress on health and climate change is an international, politically-independent collaboration that exists to monitor this global transition from threat to opportunity. The partner ship brings together 27 leading academic institutions and UN and intergovernmental agencies from every continent, with expertise from climate scientists, ecolo gists, mathe-maticians, geographers, engineers, energy, food, livestock, and transport experts, economists, social and political scientists, public health professionals, and doctors.
This 2018 report tracks 41 indicators of impact and progress across five domains: climate change impacts, exposures, and vulnerability; adaptation planning and resilience for health; mitigation actions and their health co-benefits; economics and finance; and public and political engagement (panel 2).
A global monitoring system for health and climate changeFor the public health profession, monitoring and tracking have long been essential tools and are important in understanding and diagnosing the problem in ques-tion, predicting its future impact, identifying vulnerable populations, developing and prioritising responses, and evaluating interventions.
A good indicator should be based on a credible link between public health and climate change, should be sensitive to changes in the climate, and less sensitive to non-climate explanations, its data should be available and reproducible across temporal and geographical scales, and the indicator should provide actionable informa tion to guide policy in a timely manner.8 The Lancet Countdown has adopted an iterative and open approach to the development of indicators of the links between climate change and public health. The Lancet Countdown’s 2016 report9 launched a global consultation, seeking input on what can and should be tracked, with a final set of indicators presented in its 2017 report.2 These indicators were based on the aforementioned criteria and the collaboration’s time and resource constraints.2,9
This 2018 report provides an additional year of data and presents the results of 12 months of work, further de veloping and improving the methods and data sources for each indicator. These improvements include the following adjustments: first, new methods were used to measure indicators that captured changes in labour capacity, future projections of dengue fever (an important climate-sensitive disease), terrestrial and marine food security, climate information provided to health services,
Panel 2: The 2018 Lancet Countdown indicators
Climate change impacts, exposures, and vulnerability• Indicator 1.1: vulnerability to the heat-related risks of climate change• Indicator 1.2: health effects of temperature change• Indicator 1.3: health effects of heatwaves• Indicator 1.4: change in labour capacity• Indicator 1.5: health effects of extremes of precipitation (flood and drought)• Indicator 1.6: lethality of weather-related disasters• Indicator 1.7: global health trends in climate-sensitive diseases• Indicator 1.8: climate-sensitive infectious diseases• Indicator 1.9: food security and undernutrition
• Indicator 1.9.1: terrestrial food security and undernutrition• Indicator 1.9.2: marine food security and undernutrition
• Indicator 1.10: migration and population displacement
Adaptation, planning, and resilience for health• Indicator 2.1: national adaptation plans for health• Indicator 2.2: city-level climate change risk assessments• Indicator 2.3: detection, preparedness, and response to health emergencies• Indicator 2.4: climate change adaptation to vulnerabilities from mosquito-borne
diseases• Indicator 2.5: climate information services for health• Indicator 2.6: national assessments of climate change impacts, vulnerability,
and adaptation for health• Indicator 2.7: spending on adaptation for health and health-related activities• Indicator 2.8: health adaptation funding from global climate financing mechanisms
Mitigation actions and health co-benefits• Indicator 3.1: carbon intensity of the energy system• Indicator 3.2: coal phase-out• Indicator 3.3: zero-carbon emission electricity• Indicator 3.4: access to clean energy• Indicator 3.5: exposure to ambient air pollution
• Indicator 3.5.1: exposure to air pollution in cities• Indicator 3.5.2: premature mortality from ambient air pollution by sector
• Indicator 3.6: clean fuel use for transport• Indicator 3.7: sustainable travel infrastructure and uptake• Indicator 3.8: ruminant meat for human consumption• Indicator 3.9: health-care sector emissions
Finance and economics• Indicator 4.1: economic losses due to climate-related extreme events• Indicator 4.2: investments in zero-carbon energy and energy efficiency• Indicator 4.3: investment in new coal capacity• Indicator 4.4: employment in renewable and fossil-fuel energy industries• Indicator 4.5: funds divested from fossil fuels• Indicator 4.6: fossil fuel subsidies• Indicator 4.7: coverage and strength of carbon pricing• Indicator 4.8: use of carbon pricing revenues
Public and political engagement• Indicator 5.1: media coverage of health and climate change• Indicator 5.2: coverage of health and climate change in scientific journals• Indicator 5.3: engagement in health and climate change in the UN General Assembly• Indicator 5.4: engagement in health and climate change in the corporate sector
**Strictly embargoed until 23.30 UK time / 6.30pm New York time
Wednesday 28th November 2018**
Review
6 www.thelancet.com Published online November 28, 2018 http://dx.doi.org/10.1016/S0140-6736(18)32594-7
the quality and comprehensiveness of health adaptation plans, and global access to clean energy. Second, expanded geographical and temporal coverage was applied for indicators that captured mortality from air pollution (atmospheric particulate matter with a diameter of less than 2·5 µm [PM2·5]) by sector, active transport uptake, employment in low-carbon industries, and engagement from governments, the scientific community, and the media in health and climate change. Third, new indicators were added, including indicators of vulnerability to extremes of heat, exposure to flood, exposure to drought, transmission suitability for malaria and pathogenic Vibrio, adaptive capacity to vector-borne disease, and corporate sector engagement in health and climate change. And fourth, proposals were made for future indicators looking to capture the mental health effects of climate change and the preparedness of the health-care infrastructure.
Every year until 2030, these indicators will be developed and improved, taking into account new methods, data sources, and resources as they become available. To this end, the collaboration continuously invites input from experts and academic institutions willing to support the further development of the analysis presented in this report.
Health and climate change in 2017This report presents 41 indicators of progress in health and climate change, with global-level and regional-level results and analyses for each indicator. Detailed metho-dological descriptions, data sources, and discussion are included in the appendix, which has been developed as an essential companion to the main report.
In 2017, several concerning trends continued, with vulnerable populations being subjected to 157 million heatwave-exposure events, and 153 billion hours of labour being lost because of rising temperatures, which re-presents substantial increases from baseline levels (in-dicators 1.3 and 1.4). Vectorial capacity for the transmission of dengue fever virus continued to rise, with 2016 being the most suitable year for transmission from Aedes aegypti and Aedes albopictus since the 1950 baseline was studied. The carbon intensity of the total primary energy supply (TPES) remained static at 55–57 tCO2/TJ (the emission at which the TPES has been since 1990; tCO2/TJ is a carbon intensity metric that estimates the tonnes of CO2 for each unit of total primary energy supplied), and 2·8 billion people still lived without access to healthy, clean, and sustainable cooking fuels and technologies (indicators 3.1 and 3.4).
However, clear signs of progress both within and beyond the health profession’s response to climate change have been observed. Health systems’ adaptive capacity remained robust, and the WHO newly elected Director General listed health adaptation as among the agency’s top priorities. TPES from coal-fired power continued to decline, with more than 20 countries (including the UK, Canada, Mexico, and France) committing to unilateral coal phase-out
(indicator 3.2). Renewable energy continued to grow rapidly, with 157 GW of new capacity installed (an increase from 143 GW in 2016), compared with 70 GW of fossil fuel capacity (indicator 3.3). Health institutions, including the American Public Health Association, Medibank Australia, and the Hospitals Contribution Fund of Australia, announced their commitment to divest from fossil fuels, with funds totalling $33·6 billion (indicator 4.5). The USA’s announcement of its intention to withdraw from the Paris Agreement contrasted with the formation of a new alliance of US medical associations (including the American Medical Association, the American College of Physicians, and the American Academy of Paediatrics) representing 500 000 clinicians, dedicated to tackling climate change.
The data presented in the Lancet Countdown’s 2018 report2 provide ongoing reason for cautious optimism, with the continuation of important trends signalling the beginning of a broader transition. Despite these trends, substantially faster progress is required across the full range of indicators over the coming 5 years to meet the commitments made under the Paris Agreement.
Section 1: climate change impacts, exposures, and vulnerabilityIntroductionThis first section provides insights into the impact of anthropogenic climate change on human health, tracking its many pathways (figure 1). These indicators follow numerous mechanisms and causal pathways, looking to describe underlying population vulnerabilities, human exposures, and ultimately, the health impacts that result from a changing climate. This narrative approach, built around quantitative indicators, allows the explicit exploration of the extent to which climate change is compromising public health globally.
The methods, data sources, and indicators selected for this year’s Lancet Countdown report have been sub stantially improved. Several new indicators have been developed, including metrics on vulnerability to heat exposure (indicator 1.1), exposure to flood and drought (indicator 1.5), and the climatic suitability for trans mission of malaria and pathogenic Vibrio species (indicator 1.8). Methods and data sources have also been updated and improved, with more sophisticated analysis being done on labour capacity loss due to rising tempera tures (indicator 1.4) and the health implications of declin ing marine and terrestrial primary food productivity (indicator 1.9).
Indicator 1.1: vulnerability to the heat-related risks of climate changeHeadline finding: rising ambient temperatures place vulnerable populations at increased risks across all WHO regions. Populations in Europe and the East Mediterranean are particularly at risk, with 42% and 43% of their populations older than 65 years vulnerable to heat exposureIncreasing temperatures as a result of climate change will continue to expose vulnerable populations to additional
See Online for appendix
For more on the Medical Society Consortium on Climate
and Health see https://medsocietiesforclimate
health.org/
**Strictly embargoed until 23.30 UK time / 6.30pm New York time
Wednesday 28th November 2018**
Review
www.thelancet.com Published online November 28, 2018 http://dx.doi.org/10.1016/S0140-6736(18)32594-7 7
heat-related morbidity and mortality, including heat stress, cardiovascular disease, and renal disease.2 Adults aged more than 65 years are particularly vulnerable, as are individuals with underlying cardio vascular diseases, dia betes, and chronic respiratory diseases, and those living in urban areas.10–12 These exact factors are used, with equal weighting, to develop an index of vulnerability to current and future heat exposure as a result of climate change.
In all regions of the world, the proportion of populations vulnerable to heat exposure is rising. Europe and the eastern Mediterranean show markedly higher vulner-ability than Africa and southeast Asia, a finding that is most probably the result of a more elderly population living in urban areas in these regions. In addition, demographic transitions in LMICs show accelerating upward trends in the prevalence of non-communicable diseases, especially in southeast Asia, where vulnerability has increased by 3·5% since 1990 (appendix).
This heat vulnerability index was compiled using data from the Global Burden of Disease (GBD) for trends in disease prevalence, and the Inter-Sectoral Impact Model Intercomparison Project for GDP, population densities, and demographics.13 Full details of the methods, data sources, and figures for this new indicator can be found in the appendix.
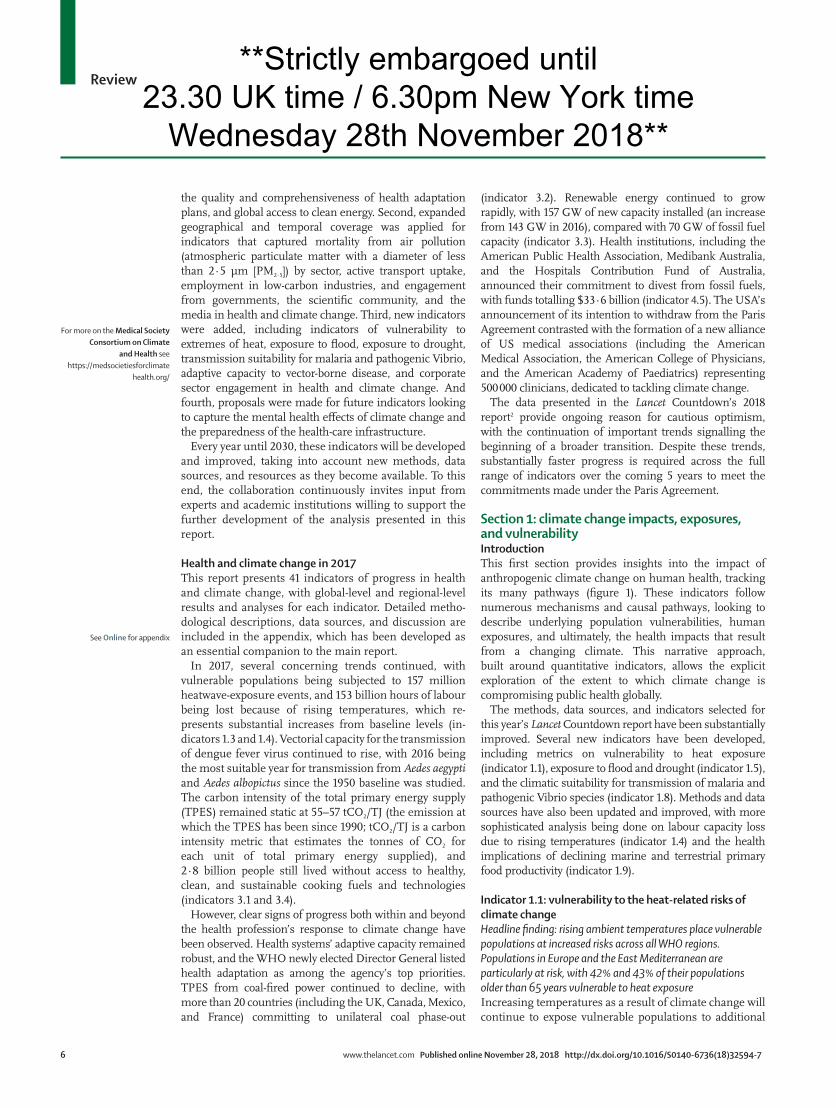
Indicator 1.2: health effects of temperature changeHeadline finding: the mean global temperature change to which humans are exposed is more than double the global average change, with temperatures rising 0·8°C versus 0·3°C The rising vulnerability to heat-related risks of climate change (indicator 1.1) is mirrored by greater human exposures to higher temperatures. In 2017, although the global mean temperature increase relative to the 1986–2005 reference period was 0·3°C, the increase in human exposure temperature (the temperature increase in populated zones) was more than double at 0·8°C (figure 2). This continues an accelerating trend globally, which was identified in the Lancet Countdown’s previous report.2
The methods and data sources for this indicator remain unchanged, and are described in full in the 2017 Lancet Countdown report2 and in the appendix, with data sourced from the European Centre for Medium-Range Weather Forecasts (ECMWF).14
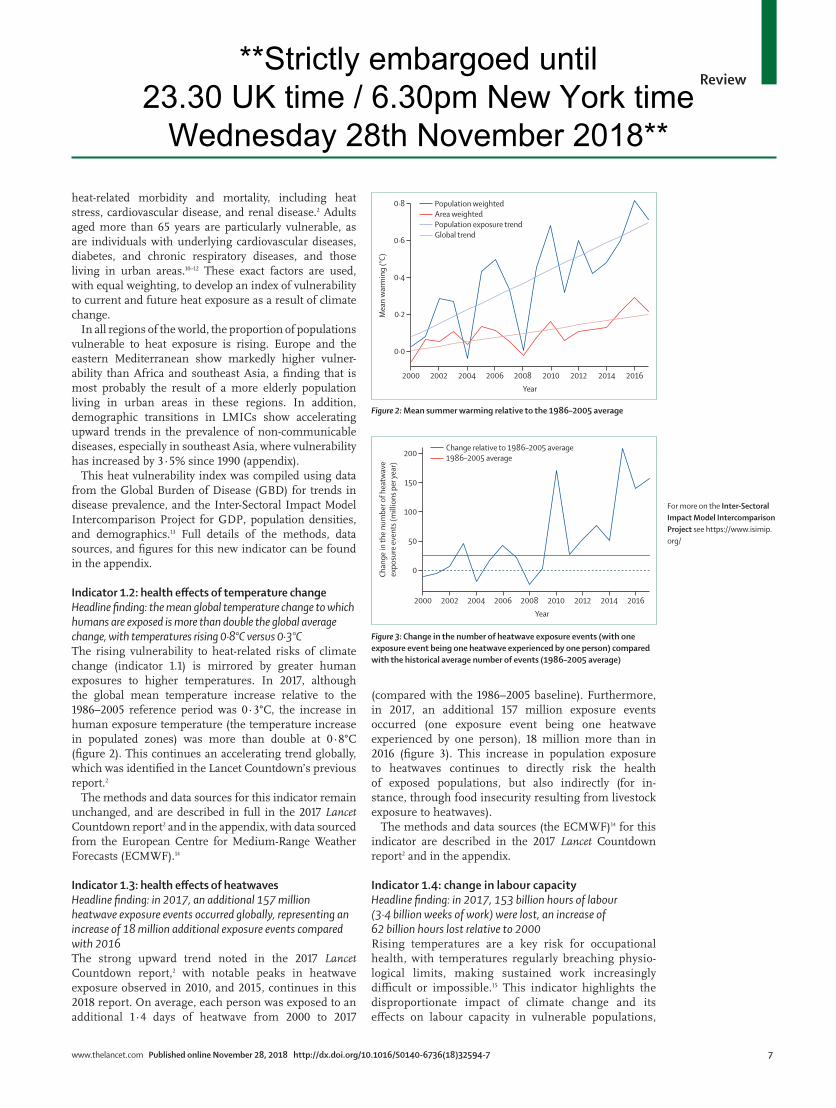
Indicator 1.3: health effects of heatwavesHeadline finding: in 2017, an additional 157 million heatwave exposure events occurred globally, representing an increase of 18 million additional exposure events compared with 2016The strong upward trend noted in the 2017 Lancet Countdown report,2 with notable peaks in heatwave exposure observed in 2010, and 2015, continues in this 2018 report. On average, each person was exposed to an additional 1·4 days of heatwave from 2000 to 2017
(compared with the 1986–2005 baseline). Furthe rmore, in 2017, an additional 157 million exposure events occurred (one exposure event being one heatwave experienced by one person), 18 million more than in 2016 (figure 3). This increase in population exposure to heatwaves continues to directly risk the health of exposed populations, but also indirectly (for in-stance, through food insecurity resulting from livestock exposure to heatwaves).
The methods and data sources (the ECMWF)14 for this indicator are described in the 2017 Lancet Countdown report2 and in the appendix.
Indicator 1.4: change in labour capacityHeadline finding: in 2017, 153 billion hours of labour (3·4 billion weeks of work) were lost, an increase of 62 billion hours lost relative to 2000Rising temperatures are a key risk for occupational health, with temperatures regularly breaching physio-logical limits, making sustained work increasingly difficult or impossible.15 This indicator highlights the disproportionate impact of climate change and its effects on labour capacity in vulnerable populations,
2000 2002 2004 2006 2008 2010 2012 2014 2016
0·0
0·2
0·4
0·6
0·8
Mea
n w
arm
ing
(°C)
Year
Population weightedArea weightedPopulation exposure trendGlobal trend
Figure 2: Mean summer warming relative to the 1986–2005 average
For more on the Inter-Sectoral Impact Model Intercomparison Project see https://www.isimip.org/
2000 2002 2004 2006 2008 2010 2012 2014 2016
0
50
100
150
200
Chan
ge in
the
num
ber o
f hea
twav
eex
posu
re e
vent
s (m
illio
ns p
er ye
ar)
Year
Change relative to 1986–2005 average1986–2005 average
Figure 3: Change in the number of heatwave exposure events (with one exposure event being one heatwave experienced by one person) compared with the historical average number of events (1986–2005 average)
**Strictly embargoed until 23.30 UK time / 6.30pm New York time
Wednesday 28th November 2018**
Review
8 www.thelancet.com Published online November 28, 2018 http://dx.doi.org/10.1016/S0140-6736(18)32594-7
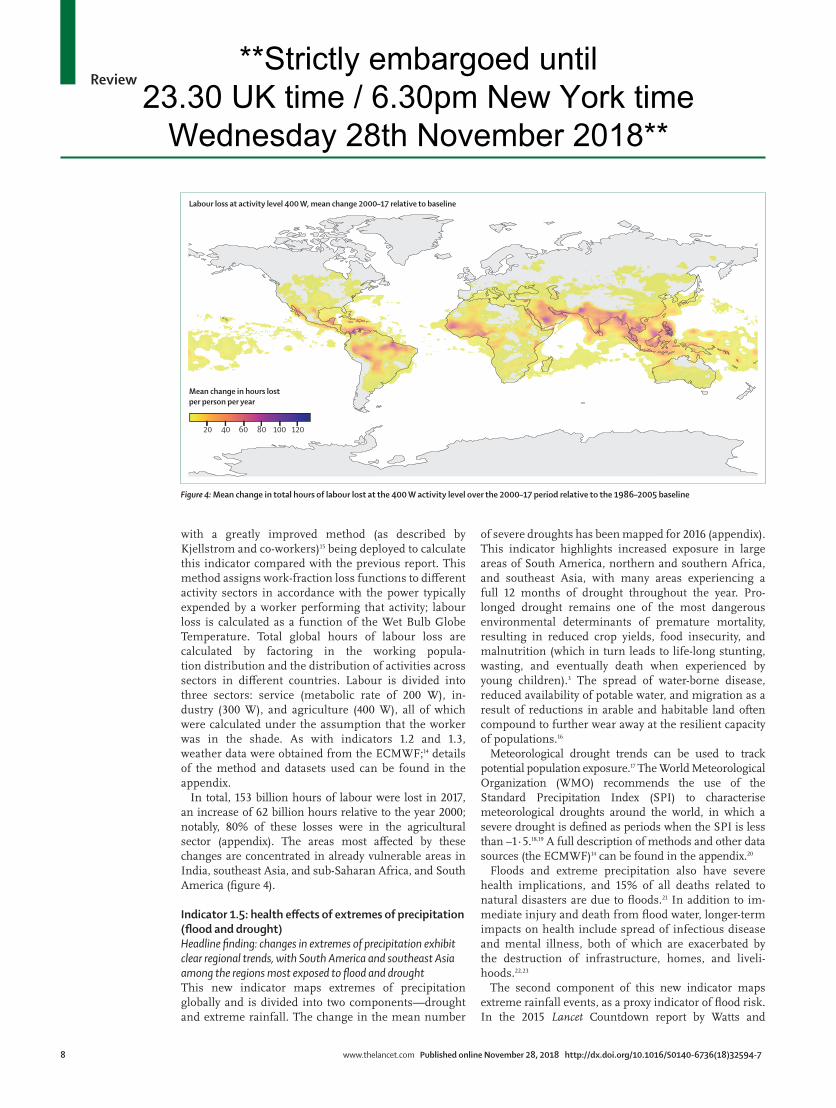
with a greatly improved method (as described by Kjellstrom and co-workers)15 being deployed to calculate this indicator compared with the previous report. This method assigns work-fraction loss functions to different activity sectors in accordance with the power typically expended by a worker performing that activity; labour loss is calculated as a function of the Wet Bulb Globe Temperature. Total global hours of labour loss are calculated by factoring in the working popula-tion distribution and the distribution of activities across sectors in different countries. Labour is divided into three sectors: service (metabolic rate of 200 W), in-dustry (300 W), and agriculture (400 W), all of which were calculated under the assumption that the worker was in the shade. As with indicators 1.2 and 1.3, weather data were obtained from the ECMWF;14 details of the method and datasets used can be found in the appendix.
In total, 153 billion hours of labour were lost in 2017, an increase of 62 billion hours relative to the year 2000; notably, 80% of these losses were in the agricultural sector (appendix). The areas most affected by these changes are concentrated in already vulnerable areas in India, southeast Asia, and sub-Saharan Africa, and South America (figure 4).
Indicator 1.5: health effects of extremes of precipitation (flood and drought)Headline finding: changes in extremes of precipitation exhibit clear regional trends, with South America and southeast Asia among the regions most exposed to flood and droughtThis new indicator maps extremes of precipitation globally and is divided into two components—drought and extreme rainfall. The change in the mean number
of severe droughts has been mapped for 2016 (appendix). This indicator highlights increased exposure in large areas of South America, northern and southern Africa, and southeast Asia, with many areas experiencing a full 12 months of drought throughout the year. Pro-longed drought remains one of the most dangerous environmental determinants of premature mortality, resulting in reduced crop yields, food insecurity, and malnutrition (which in turn leads to life-long stunting, wasting, and eventually death when experienced by young children).3 The spread of water-borne disease, reduced availability of potable water, and migration as a result of reductions in arable and habitable land often com pound to further wear away at the resilient capacity of populations.16
Meteorological drought trends can be used to track potential population exposure.17 The World Meteorological Organization (WMO) recommends the use of the Standard Precipitation Index (SPI) to characterise meteorological droughts around the world, in which a severe drought is defined as periods when the SPI is less than –1·5.18,19 A full description of methods and other data sources (the ECMWF)14 can be found in the appendix.20
Floods and extreme precipitation also have severe health implications, and 15% of all deaths related to natural disasters are due to floods.21 In addition to im-mediate injury and death from flood water, longer-term impacts on health include spread of infectious disease and mental illness, both of which are exacerbated by the destruction of infrastructure, homes, and liveli-hoods.22,23
The second component of this new indicator maps extreme rainfall events, as a proxy indicator of flood risk. In the 2015 Lancet Countdown report by Watts and
20 40 60 80 100 120
Mean change in hours lost per person per year
Labour loss at activity level 400 W, mean change 2000–17 relative to baseline
Figure 4: Mean change in total hours of labour lost at the 400 W activity level over the 2000–17 period relative to the 1986–2005 baseline
**Strictly embargoed until 23.30 UK time / 6.30pm New York time
Wednesday 28th November 2018**

Review
www.thelancet.com Published online November 28, 2018 http://dx.doi.org/10.1016/S0140-6736(18)32594-7 9
coworkers,1 flood risk was estimated for 2090 by defining a flood event as a 5 day precipitation total exceeding the 10 year rainfall level (a level of rainfall only expected once every 10 years) in the reference period. This method has been adapted here to produce extreme rainfall trends from 2000 to 2016. An extreme rainfall event is defined as commencing when the 5 day rolling sum of daily total precipitation exceeds the 10 year return level in the 1986–2005 reference period, and ending when precipi tation drops below this value. The return values and events were calculated using the European Research Area-Interim daily precipitation dataset from the ECMWF.14 Exposures were calculated as the sum of people at a location multiplied by the number of events at that location, measured in person-events. A full account of the methods and data can be found in the appendix.
As with drought, changes in extreme heavy rain vary regionally, with particularly important increases in ex-treme heavy rainfall events evident in South America and southeast Asia (appendix). Here, regional trends are more significant than global trends, reflecting the varying nature of climate change depending on the geographical region studied.
Indicator 1.6: lethality of weather-related disastersHeadline finding: Annual frequencies of floods and extreme temperature events have increased since 1990, with no clear upward or downward trend in the lethality of these eventsProviding global estimates of human exposure, mor-bidity, and mortality associated with extreme weather events is fraught with methodological complexities and gaps in reliable data. Projections suggest that, if left unmitigated, climate change is ex pected to result in an additional 1·4 billion drought-exposure events per year and 2 billion flood-exposure events per year by the end of the century.1 These projections are borne out in recent history, with clear increases in the annual frequencies of flood and temperature anomalies over the past 25 years. Although trends within regions and income groups have been important in the lethality of weather-related disasters, no clear trend is seen at the global level, with the exception of a slight decline in the absolute numbers of people affected by floods. Governments and national health services are increasingly adapting to extreme weather events and climate change with impress ive results (section 2). These adaptation interven tions and broad development initiatives present a plaus ible explanation for the results identified in this report. Crucially, indicator 4.1 makes clear that health and human wellbeing is affected indirectly through the economic and social losses that result from such events.
Indicator 1.6 makes use of the same methods and data sources (the Emergency Events Database)24 as those described in the 2017 Lancet Countdown report2 and in the appendix.
Indicator 1.7: global health trends in climate-sensitive diseasesHeadline finding: although global health and development interventions have resulted in some impressive improvements in human health and wellbeing, mortality from two particularly climate-sensitive diseases, dengue fever and malignant skin melanoma, is still rising in regions most susceptible to both diseasesClimate change interacts directly and indirectly with a wide variety of disease processes, ultimately acting as a force multiplier for many of the existing challenges faced by the global public health community. Drawing out mortality estimates for climate-sensitive diseases calcu-lated by the GBD helps to elucidate these macro trends over time (figure 5).13 Climate change’s role in influencing these trends will vary depending on disease process, geography, and demographic profile of affected regions and populations.
The reference category (all-cause mortality) shows a strong decrease in mortality rates in Africa, and a substantial reduction in southeast Asia. The number of deaths caused by diarrhoeal diseases also show marked decreases, especially in Africa. By contrast, mortality from dengue fever disease is clearly increasing rapidly, especially in regions most susceptible to its spread—southeast Asia and the Americas. Mortality rates for malignant melanoma, which notably has a decadal delay from exposure to death and is associated with exposure to ultraviolet radiation, have increased markedly in Europe, the Americas, and the Western Pacific. The methods used to measure this indicator are described in full in the 2017 Lancet Countdown2 report and in the appendix.
Indicator 1.8: climate-sensitive infectious diseasesHeadline finding: in 2016, global vectorial capacity for the transmission of dengue virus was the highest on record, rising to 9·1% above the 1950s baseline for A aegypti and 11·1% above the baseline for A albopictusChanging climatic conditions are a key determinant for the spread and impact of many infectious diseases. Understanding how climate change is altering the environmental suitability for disease vectors, pathogen replication, and transmission is crucial to understanding the consequences for human exposure. The 2017 Lancet Countdown2 analysis on dengue virus is expanded here to include a seasonal analysis of dengue fever and global analysis of pathogenic Vibrio species and malaria. The second component of the indicator analyses publication trends of climate-change infectious-disease research.
Vectorial capacity is a measure of the capacity for vectors to transmit a pathogen to a host and is influ-enced by vector, pathogen, and environmental factors. Compared with the 1950s baseline, climatic changes have increased global vectorial capacity for dengue virus in the 2010s (2011–16 average) by 7·8% for A aegypti and 9·6% for A albopictus (figure 6). For both vectors, 2016 was the most suitable year on record. In addition, the
**Strictly embargoed until 23.30 UK time / 6.30pm New York time
Wednesday 28th November 2018**

Review
10 www.thelancet.com Published online November 28, 2018 http://dx.doi.org/10.1016/S0140-6736(18)32594-7
seasonal dynamics of vectorial capacity for dengue virus for both vectors have lengthened and strengthened (appendix). Model pro jections suggest this rise will continue for both vectors in step with greenhouse gas emissions (appendix). The contribution of mobility and globalisation to the expansion of the dengue virus vector and dengue disease burden is important to note, alongside the impact of climate change.
Turning to water-borne infectious diseases, in regions with suitable salinity conditions, a consistent associ-ation between sea-surface temperature (SST) anomalies and cases of pathogenic Vibrio infections has been reported.25–27 In 2018, a Vibrio indicator has been added to track the environmental suitability of coastal regions for Vibrio infections on the basis of SST and salinity. This indicator was developed for Vibrio species that are pathogenic to humans, including Vibrio
parahaemolyticus, Vibrio vulnificus, and non-toxigenic Vibrio cholerae (non-O1 and non-O139 serogroups). Vibrio-caused illnesses (vibriosis) include gastroenteritis, wound infections, and septicaemia, and can be trans-mitted in brackish marine waters. A clear trend of rising suitability to Vibrio infections is observable globally (notably in the northern hemisphere), with 2017 being a particularly abnormal year of decreased suitability (figure 7A). The percentage of coastal area suitable for Vibrio infections in the 2010s has increased at northern latitudes (40–70°N) by 3·5% compared with the 1980s baseline. Over the same period, in two high-risk focal regions, the Baltic region and northeastern USA, increases of 24·0% and 27·0%, respectively, were observed in the area of coastline that was suitable for infections (figure 7B, C). Similarly, the number of days suitable per year has almost doubled in the Baltic region, extending the highest risk season by around 5 weeks (figure 7B).
A second new indicator addresses the changing suitability for the transmission of malaria. The indicator focuses on environmental suitability for Plasmodium falciparum (African continent) and Plasmodium vivax (other regions), the two dominant parasites causing disease worldwide. The indicator shows significant changes in suitability in highland areas of Africa, with suitability increasing by 20·9% in the 2010s compared with the 1950s baseline (figure 8), and with 2016 being the fourth most suitable year (after 2002, 1997, and 2006) since the beginning of the time series (27·7% rise compared with the 1950s baseline). The expanded methods for all disease indicators are in the appendix.
The final component of this indicator tracks research and published literature on climate change and infec tious
19501955
19601965
19701975
19801985
19901995
20002005
20102015
0
5
10
Vect
oria
l cap
acity
per
cent
age
chan
ge fr
om th
e 19
50 b
asel
ine
Year
Aedes aegyptiAedes albopictus
Figure 6: Changes in global vectorial capacity for the dengue virus vectors Aedes aegypti and Aedes albopictus since 1950
19901995
20002005
20102016
0
5
10
15
20
Deat
hs p
er 1
00 0
00 p
eopl
e
Year
500
750
1000
1250
Deat
hs p
er 1
00 0
00 p
eopl
e
Exposure to forces of nature
All causes
19901995
20002005
20102016
0
25
50
75
100
Year
0·5
0
1·0
1·5
2·0
19901995
20002005
20102016
0
1
2
3
Year
0
50
100
19901995
20002005
20102016
0
20
10
30
40
50
Year
0·5
1·0
1·5
2·0
African regionEastern Mediterranean region
European regionRegion of the Americas
South-East Asia regionWestern Pacific region
Malaria
Dengue fever
Malignant skin melanoma
Diarrhoeal diseases
Protein-energy malnutrition
Environmental heat and cold exposure
Figure 5: Global trends in all-cause mortality and mortality from selected causes as estimated by the Global Burden of Disease 201713 for the 1990–2016 period, by World Bank regions
**Strictly embargoed until 23.30 UK time / 6.30pm New York time
Wednesday 28th November 2018**

Review
www.thelancet.com Published online November 28, 2018 http://dx.doi.org/10.1016/S0140-6736(18)32594-7 11
diseases. Overall, the number of publications in the previous 12 months remains high compared with historical numbers, with a slight decrease in 2017 (75 publications) from a peak in 2016 (89 publications). A clear majority of papers continue to report on positive associations (appendix).
Indicator 1.9: food security and undernutrition1.9.1: terrestrial food security and undernutrition—headline finding: 30 countries are experiencing downward trends in crop yields, reversing a decade-long trend that had previously seen global improvement. Yield potential is estimated to be declining in every region, as measured by accumulated thermal timeWorldwide, more than sufficient food is produced to feed the global population. The causes of food insecurity and under nutrition are hence both complex and multi-factorial, driven by factors beyond total food availability.28,29 However, food production is already being compromised by extremes of weather that are predicted to become more frequent and extreme; yield potentials are de creasing globally, and many countries are already experiencing falling yields.30,31
A multilevel indicator is presented in this report, linking climate hazards and trends, crop yields and harvests, and undernutrition. Overall trends are tracked using globally-aggregated and country-level data, highlighting the extent to which negative impacts of climate change outweigh potential positive impacts on national nutrition and food security through varietal breeding, improved farming practices, and reductions in poverty.
First, global grain potential is represented by current and future predictions of crop growth duration for maize (appendix), which acts as a proxy for yield potential, and in turn, food security. Reductions in crop growth duration for maize in each region suggests declining maize yield potential in each region and globally (figure 9, appendix).32 Second, the number of countries for which yields are trending downwards is tracked. This number fell from 56 to 32 between 2000, and 2010, but has scarcely
decreased since, reaching 30 in 2016. For some countries, where the yield gap (the difference between actual and maximum potential yield) is small, falling yields reflect the negative effects of climate change already outweighing any technological improvement.33 The third component of this indicator tracks under nutrition, aggregated at a global scale. Although pre valence and
A GlobalLatitude
1982 1987 1992 1997 2002 2007 2012 2017
6
9
12
15
Coas
tal a
rea
suita
ble
for V
ibrio
out
brea
ks (%
)
Year
Northern Tropics Southern
B Baltic regionSuitability metric
1982 1987 1992 1997 2002 2007 2012 2017
6
0
9
12
15
Suita
bilit
y fo
r Vib
rio o
utbr
eaks
(%)
Year
Days per year Percent of coast
C Northeastern USA
1982 1987 1992 1997 2002 2007 2012 2017
20
30
40
50
60
Coas
tal a
rea
suita
ble
for V
ibrio
out
brea
ks (%
)
Year
Figure 7: Change in suitability for pathogenic Vibrio outbreaks as a result of changing sea surface temperatures
Figure 8: Environmental suitability for malaria transmission from 1950 to 2016, grouped by continent and elevation
19501960
19701980
19902000
20103
4
5
6
7
8
Aver
age
num
ber o
f sui
tabl
e m
onth
s
Year Year Year
Africa
Elevation
Asia Latin America
19501960
19701980
19902000
20101950
19601970
19801990
20002010
HighLow
Figure 9: Change in crop growth duration relative to the 1961–90 accumulated thermal time, as a proxy for maize yieldThe dashed line represents the average crop growth over the period of 1961–90, and the solid black line represents an 11-year moving average.
1960 1980 2000 2020–15
–9
–3
3
9
15
Accu
mul
ated
ther
mal
tim
e day
s
Year
**Strictly embargoed until 23.30 UK time / 6.30pm New York time
Wednesday 28th November 2018**
Review
12 www.thelancet.com Published online November 28, 2018 http://dx.doi.org/10.1016/S0140-6736(18)32594-7
absolute numbers of under nutrition have declined over the past decade, a reversal of this trend and consequent rise in undernutrition is evident in recent years.
The methods and data sources used for this indicator have been improved on and expanded substantially since the 2017 Lancet Countdown report,2 to incorporate potential crop yield and actual crop production data,34 and are presented in full in the appendix; additional figures for this analysis are also available in the appendix.
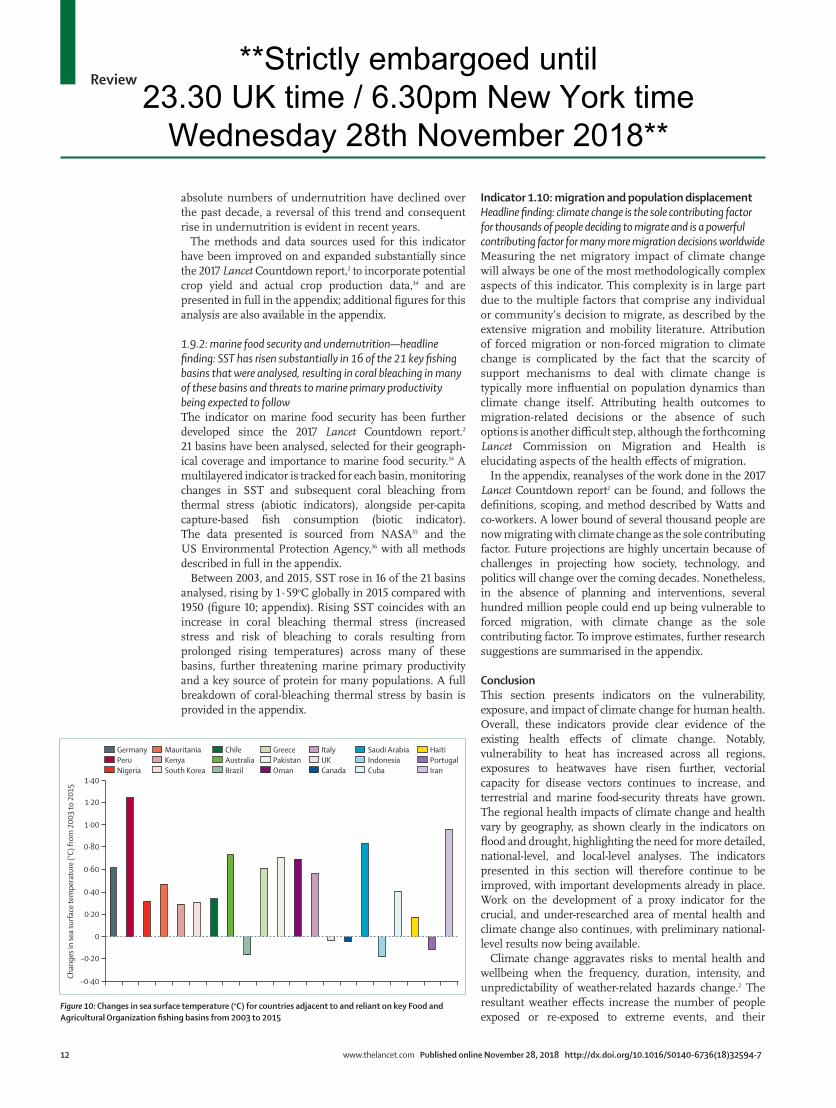
1.9.2: marine food security and undernutrition—headline finding: SST has risen substantially in 16 of the 21 key fishing basins that were analysed, resulting in coral bleaching in many of these basins and threats to marine primary productivity being expected to followThe indicator on marine food security has been further developed since the 2017 Lancet Countdown report.2 21 basins have been analysed, selected for their geo graph-ical coverage and importance to marine food security.34 A multilayered indicator is tracked for each basin, monitoring changes in SST and subsequent coral bleaching from thermal stress (abiotic indicators), alongside per-capita capture-based fish consumption (biotic indicator). The data presented is sourced from NASA35 and the US Environmental Protection Agency,36 with all methods described in full in the appendix.
Between 2003, and 2015, SST rose in 16 of the 21 basins analysed, rising by 1·59oC globally in 2015 compared with 1950 (figure 10; appendix). Rising SST coincides with an increase in coral bleaching thermal stress (increased stress and risk of bleaching to corals resulting from prolonged rising temperatures) across many of these basins, further threatening marine primary productivity and a key source of protein for many populations. A full breakdown of coral-bleaching thermal stress by basin is provided in the appendix.
Indicator 1.10: migration and population displacementHeadline finding: climate change is the sole contributing factor for thousands of people deciding to migrate and is a powerful contributing factor for many more migration decisions worldwideMeasuring the net migratory impact of climate change will always be one of the most methodologically complex aspects of this indicator. This complexity is in large part due to the multiple factors that comprise any individual or community’s decision to migrate, as described by the extensive migration and mobility literature. Attribution of forced migration or non-forced migration to climate change is complicated by the fact that the scarcity of support mechanisms to deal with climate change is typically more influential on population dynamics than climate change itself. Attributing health outcomes to migration-related decisions or the absence of such options is another difficult step, although the forthcoming Lancet Commission on Migration and Health is elucidating aspects of the health effects of migration.
In the appendix, reanalyses of the work done in the 2017 Lancet Countdown report2 can be found, and follows the definitions, scoping, and method described by Watts and co-workers. A lower bound of several thousand people are now migrating with climate change as the sole contributing factor. Future projections are highly uncertain because of challenges in projecting how society, technology, and politics will change over the coming decades. Nonetheless, in the absence of planning and inter ventions, several hundred million people could end up being vulnerable to forced migration, with climate change as the sole contributing factor. To improve estimates, further research suggestions are summarised in the appendix.
ConclusionThis section presents indicators on the vulnerability, exposure, and impact of climate change for human health. Overall, these indicators provide clear evidence of the existing health effects of climate change. Notably, vulnerability to heat has increased across all regions, exposures to heatwaves have risen further, vectorial capacity for disease vectors continues to increase, and terrestrial and marine food-security threats have grown. The regional health impacts of climate change and health vary by geography, as shown clearly in the indicators on flood and drought, highlighting the need for more detailed, national-level, and local-level analyses. The indicators presented in this section will therefore continue to be improved, with important developments already in place. Work on the development of a proxy indicator for the crucial, and under-researched area of mental health and climate change also continues, with preliminary national-level results now being available.
Climate change aggravates risks to mental health and wellbeing when the frequency, duration, intensity, and unpredictability of weather-related hazards change.2 The resultant weather effects increase the number of people exposed or re-exposed to extreme events, and their
–0·40
–0·20
0
0·20
0·40
0·60
0·80
1·00
1·20
1·40
Chan
ges i
n se
a su
rface
tem
pera
ture
(°C)
from
200
3 to
201
5
GermanyPeruNigeria
MauritaniaKenyaSouth Korea
ChileAustraliaBrazil
GreecePakistanOman
ItalyUKCanada
HaitiPortugalIran
Saudi ArabiaIndonesiaCuba
Figure 10: Changes in sea surface temperature (oC) for countries adjacent to and reliant on key Food and Agricultural Organization fishing basins from 2003 to 2015
**Strictly embargoed until 23.30 UK time / 6.30pm New York time
Wednesday 28th November 2018**
Review
www.thelancet.com Published online November 28, 2018 http://dx.doi.org/10.1016/S0140-6736(18)32594-7 13
consequent psychological problems, with suicide an extreme manifestation of trauma.37,38 Because of their rapidly growing frequency, duration, and intensity, heat-waves are of particular concern, with strong evidence linking their occurrence to increases in population distress, hospital psychiatric admissions, and suicides.39–42 Less obvious effects of weather-related hazards can be especially perilous, creating food shortages, home less ness and displacement, and damaging public infra structure, power and connectivity, agricultural land, and sacred places.43 These pressures can impair social cohesion, undermining crucial supports for mental health. Recent analysis examining the relationship between hot years and the incidence of suicide in Australia has been provided (appendix).44
The adaptation and mitigation efforts of governments and health professionals clearly matter immensely in establishing the scale of the eventual health impacts of climate change. Progress in these two areas, and on the economic, financial, and political context on which they depend, is the focus of the remainder of this report.
Section 2: adaptation, planning, and resilience for healthIntroductionWith the observed and future health impacts of climate change becoming increasingly evident, and emission trajectories committing the world to further warming, accelerated adaptation interventions are needed to safe-guard populations’ health. As the 2030 agenda shows,45 strategies to improve community resilience are often linked to poverty reduction and broader socioeconomic development imperatives, creating the possibility of no-regret scenarios.1
The health sector should be at the forefront of adaptation efforts, ensuring health systems, hospitals, and clinics remain anchors of community resilience. This under-recognised, yet growing area of practice, is the focus of this section. The data are incomplete, providing more insight into adaptation than resilience, and predominantly allow for process-based indicators. However, several indicators have been improved on since 2017: qualitative analyses of the content and quality of national adaptation strategies and vulnerability and adaptation assessments in the health sector are included to complement previous quantitative findings (indicators 2.1 and 2.6), and health-specific adaptation questions were included in survey tools and questionnaires for climate services (indicators 2.2 and 2.5). In addition, this year’s report includes a new indicator assessing adaptive capacity to vector-borne disease (in dicator 2.4). The indicators presented in this report show an overall trend of increased uptake of adaptation measures. However, although adaptation activities may have increased, they do not guarantee resilience against future climate change, and hence efforts to adapt to climate change must be redoubled. This increase in efforts is largely dependent upon sufficient
spending on adaptation (indicator 2.7), funding availability for adaptation (indicator 2.8), and an improved under-standing of how to most effectively deliver resilience within health systems.
Indicator 2.1: national adaptation plans for healthHeadline finding: in 2015, 30 of 40 countries responding to the WHO Climate and Health Country Survey reported having national health adaptation strategies or plans approved by their respective health authorityThis indicator tracks the policy commitment of national governments on health adaptation to climate change. Revised data, based on the biennial WHO Climate and Health Country Survey will be presented in the 2019 Lancet Countdown report. In the interim, a qualitative analysis of 16 national health adaptation strategies and plans is presented. Of note, as the most current and available country strategies and plans were collected for this Review, the documents included might not correspond exactly to those reported in the 2015 survey findings.2 A full description of the methods used in this qualitative review can be found in the appendix.
Of the 16 national health adaptation strategies or plans that were reviewed, only six were identified as being the formal health component of a National Adaptation Plan (NAP) of the UNFCCC process, referred to as an H-NAP.46
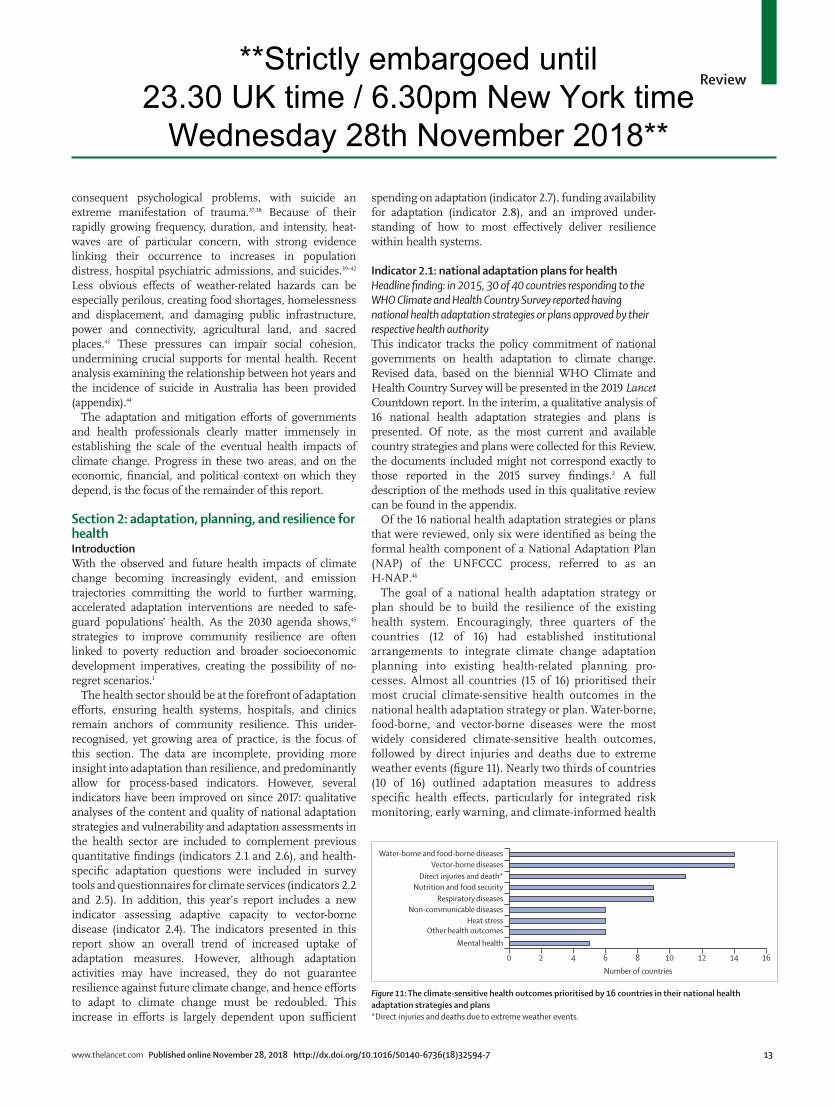
The goal of a national health adaptation strategy or plan should be to build the resilience of the existing health system. Encouragingly, three quarters of the countries (12 of 16) had established institutional arrangements to integrate climate change adaptation planning into ex isting health-related planning pro-cesses. Almost all countries (15 of 16) prioritised their most crucial climate-sensitive health outcomes in the national health adapta tion strategy or plan. Water-borne, food-borne, and vector-borne diseases were the most widely considered climate-sensitive health outcomes, followed by direct injuries and deaths due to extreme weather events (figure 11). Nearly two thirds of countries (10 of 16) outlined adaptation measures to address specific health effects, particularly for integrated risk monitoring, early warning, and climate-informed health
0 2 4 6 8 10 12 14 16
Water-borne and food-borne diseases Vector-borne diseases
Direct injuries and death* Nutrition and food security
Respiratory diseases Non-communicable diseases
Heat stress Other health outcomes
Mental health
Number of countries
Figure 11: The climate-sensitive health outcomes prioritised by 16 countries in their national health adaptation strategies and plans *Direct injuries and deaths due to extreme weather events.
**Strictly embargoed until 23.30 UK time / 6.30pm New York time
Wednesday 28th November 2018**

Review
14 www.thelancet.com Published online November 28, 2018 http://dx.doi.org/10.1016/S0140-6736(18)32594-7
programmes. Yet less concrete measures were proposed for mental health, non-communicable diseases, respiratory diseases, and heat stress. Most countries (12 of 16) detailed a monitoring and evaluation process for the implement ation of their strategy or plan with ten of these countries proposing specific indicators for each adaptation activity.
Indicator 2.2: city-level climate change risk assessmentsHeadline finding: of the 478 global cities surveyed, 65% have either already completed or are currently doing climate-change risk assessments, with 51% of cities expecting climate change to seriously compromise their public health infrastructureMore than 50% of the world’s population live in cities, generating 80% of global GDP and consuming 60% of energy. Cities’ independent political and legal status often affords them flexibility in developing a compre-hensive adaptation response to climate change. This
indicator captures both the extent to which cities have developed their own climate-change risk assessments, and their own perception of the vulnerability of their public health infrastructure to these threats.
Globally, 48% of cities had completed a climate-change impact assessment, with 17% currently in progress. As part of these assessments, 51% of cities identified public health infrastructure as being particularly vulnerable to climate change, and as needing additional and rapid intervention. Global inequalities in the capacity to do such assessments are evident, with only 25% of cities in low-income countries doing so, as compared with 57% of cities in high-income countries (appendix). Regional trends are similarly correlated with development.
Data for this indicator are sourced from the Carbon Disclosure Project’s 2017 survey of 478 global cities, and the indicator is described in full in the 2017 Lancet Countdown report2 and in the appendix.
AfricaAmericasEastern MediterraneanEuropeSoutheast AsiaWestern Pacific
WHO regions
20102011
20122013
20142015
20162017
20
40
60
80
100
Capa
city
scor
e
Year
20102011
20122013
20142015
20162017
Year
C D
20
40
60
80
100
Capa
city
scor
e
A B
Figure 12: International Health Regulations capacity scores by WHO regions(A) Human resources capacity score. (B) Surveillance capacity score. (C) Preparedness capacity score. (D) Response capacity score.
For more on CDP cities and regions data see
https://data.cdp.net/
**Strictly embargoed until 23.30 UK time / 6.30pm New York time
Wednesday 28th November 2018**

Review
www.thelancet.com Published online November 28, 2018 http://dx.doi.org/10.1016/S0140-6736(18)32594-7 15
Indicator 2.3: detection, preparedness, and response to health emergenciesHeadline finding: despite a previous marked increase, a substantial decline in national international health regulation capacities, relevant to climate adaptation and resilience, was observed in most WHO world regions in 2017In total, 85% of WHO Member States responded to the 2017 International Health Regulations (IHR) monitoring questionnaire47 (see panel 6 of Watts and co-workers2 for details). Overall capacity scores have decreased for all four capacities in 2017 compared with 2016, including human resources (–9·9%), surveillance (–5·3%), preparedness (–8·5%), and response (–7·8%). We present the progress in capacity scores from 2010 to 2017 by WHO region (figure 12).
The first of these capacities, human resources, has seen the most heterogeneous change across WHO regions (figure 12A). Two regions showed an increase in their capacity score, Africa (11·8%) and Europe (7·1%), whereas the remaining regions showed a decrease in their capacity score—the Americas (–15·9%), the eastern Mediterranean region (–8·0%), southeast Asia (–16·6%), and the Western Pacific region (–21·3%).48 All regions showed a decrease in surveillance capacity score (figure 12B), with Africa the region showing the greatest decrease (–8·4%), followed by the eastern Mediterranean region (–8·1%), the Americas (–6·7%), southeast Asia (–6·5%,), Europe (–1·2%), and the Western Pacific region (–1·1%).46 All regions except for Africa have seen a decrease in their preparedness capacity score;49 the African region main tained its capacity score from 2016 (figure 12C). The greatest decrease occurred in southeast Asia (18·3%), followed by the Western Pacific (12·1%), the eastern Mediterranean region (6·9%), the Americas (5·3%), and Europe (4·9%). Similar to surveillance capacity, all regions showed a decrease in their response capacity score (figure 12D), with the greatest decrease occurring in the eastern Mediterranean region (–12·6%), followed by southeast Asia (–11·1%), the Americas (–10·2%), Africa (–6·8%), the Western Pacific (–3·3%), and Europe (–2·4%).50 Importantly, these figures are affected by a substantial improvement in reporting (appendix).
Indicator 2.4: climate change adaptation to vulnerabilities from mosquito-borne diseasesHeadline finding: globally, improvements in public health have reduced vulnerability to mosquito-borne diseases, with a 28% fall in global vulnerability observed from 2010–16As indicator 1.8 makes clear, climate change is already contributing to changing patterns of burden of disease from vector-borne illnesses, such as dengue fever and malaria. Robust public health adaptation strategies can help to reduce these risks. This new indicator is the first in a set of indicators that are in development, assessing adaptive capacity to specific climate-related risks. The indicator maps the preparedness and response capacity of governmental institutions to prevent, prepare for,
cope with, and recover from climate change impacts. Using a process-based mathematical model, relevant country-level core capacities (drawn from the WHO IHR, describing states of surveillance and response to infectious disease outbreaks) were inversely related to the hazard of being exposed to the dengue vector A aegypti.51
The index combines estimates of risk of exposure to A aegypti that a population could face, with the adaptive capacity of the public health system. Improvements in relevant areas of core capacity over the study period translate into increased adaptive capacity (decreased vulnerability) to mosquito-borne diseases. The largest decrease in vulnerability was observed in the Western Pacific and the Americas. The only region to experience an increase in vulnerability was the eastern Mediterranean. Importantly, as exposures to climate-sensitive diseases change (indicator 1.8), the existing adaptive capacity reported here might be threatened, and thus vulnerability to such diseases could increase in future. The data and methods for this new indicator are described in full in the appendix, in which figures are also available.
Indicator 2.5: climate information services for healthHeadline finding: the national meteorological and hydrological services of 53 countries report providing climate services to the health sectorThis indicator has been enhanced since 2017, with the original survey now replaced by the WMO Country Profile Database integrated questionnaire.52 Not only does this questionnaire provide greater insights into the nature of the provision of climate services to the health sector than previously, it also allows for continuous updating of this indicator. A snapshot of responses as of May, 2018, were used; the methods and data for this indicator are presented in full in the appendix, and a full list of the countries reporting to provide climate services to the health sector is included.
Of the 55 national meteorological and hydrological services of WMO member states providing climate services to the health sector, 14 were from Africa, 11 from the Americas, four from the eastern Mediterranean, 18 from Europe, three from southeast Asia, and five from the Western Pacific. Furthermore, services from 47 countries provided additional detail on the status of climate service provision to the health sector: ten countries reported to have initiated engagement with the health sector, 13 reported to be undergoing health sector needs definition, seven reported to be co-designing climate products with the health sector, 14 reported that tailored products are accessible to the health sector, and three reported that climate services are guiding the health sector’s policy decisions and investments plans. For the remaining countries, whether they did not respond to this section of the survey or whether they are not providing services is unknown.
**Strictly embargoed until 23.30 UK time / 6.30pm New York time
Wednesday 28th November 2018**
Review
16 www.thelancet.com Published online November 28, 2018 http://dx.doi.org/10.1016/S0140-6736(18)32594-7
Indicator 2.6: national assessments of climate change impacts, vulnerability, and adaptation for healthHeadline finding: in 2015, more than two thirds of the countries that responded to the WHO Climate and Health Country Survey reported to have done a national assessment of climate change impacts, vulnerability, and adaptation for healthTo design a comprehensive health adaptation plan to effectively respond to climate risks and reduce adverse health outcomes, a thorough assessment of a country’s potential health impacts, vulnerability, and adaptation needs is crucial.53 Similar to indicator 2.1, revised data from the WHO Climate and Health Country Survey is not available for this report. In the interim, WHO did a qualitative analysis of the nature and quality of 34 national assessments. A brief summary is presented here, with methodological details presented in the appendix. Of note, because the most recent and available country assessments were collected for this Review, the assess ments that are included might not correspond exactly to those reported in the 2015 survey findings.
More than two thirds of countries that did the national assessments (26 of 34) anticipated the integration of the assessment findings into their national climate-change adaptation strategy, and planned to use the assessments to provide evidence-based policy options for health systems and public health. 31 countries evaluated to some extent the adaptive capacity of their health sector, with the highest number of countries assessing adaptive capacity in the areas of programmes (28 countries), infrastructure (28 countries), and human resources (25 countries). By comparing the countries’ assessments of vulnerability and adaptive capacity with their proposed adaptation measures, we showed that 23 countries had a corresponding needs-to-actions translation, according to the established criteria for the analysis (appendix). Detailed specifications of how adaptation measures would be implemented, however, were often absent, and resource constraints, data availability, and capacity continue to be factors limiting the scope and coverage of national assessments. Mirroring national adaptation actions, capturing and better under-standing how in dividual health systems are preparing and adapting to climate change is equally important (panel 3).
Indicator 2.7: spending on adaptation for health and health-related activitiesHeadline finding: globally, spending on adaptation for health is estimated to be 4·8% (£11·68 billion) of all adaptation spending, and health-related spending is estimated to be 15·2% (£32·65 billion)This indicator tracks global adaptation spending on health (spending directly within the formal health-care sector) and health-related spending (spending in health care, disaster preparedness, and agriculture). Such spending can sub stantially reduce the mortality associated with climate-related disasters, and monitoring this expenditure over time is important (panel 4). Using the Adaptation and Resilience to Climate Change (A&RCC) data reported last year,54 health adaptation spending was shown to increase by 8·2% in 2016–17 compared with 2015–16. This percentage increase is larger than the change in total adaptation spending over the same period (5·01%).
Globally, relative health-adaptation spending has grown slightly from 4·6% for all adaptation spending estimated by the A&RCC dataset in 2015–16 to 4·8% of all spending in 2016–17 (a percentage change of 3·1%). For the wider health-related values, relative spending increased from 13·5% to 15·2% of total A&RCC spending grouped by World Bank income group, the highest percentage change in health adaptation spending was in lower middle-income countries followed by low-income countries, although the differences at this level of aggregation are small (figure 13).55 Grouped by WHO region, the highest percentage change is observed in Europe and southeast Asia. However, noting the much lower spending in low-income countries is important, because despite large percentage changes, the total spending in low-income countries is still far too low to meet their needs.
Panel 3: Health system climate change risk assessment, preparedness and resilience
Future iterations of the Lancet Countdown will aim to understand the extent to which individual hospitals and health systems are adapting to climate change. A regular survey done as part of the Health Care Climate Challenge is attempting to gather such information. Although the data do not have sufficient global coverage and annual reproducibility, they provide some insight into the measures taken at the health system level, and could potentially represent a promising source for a future indicator.
Participants include health centres, hospitals, and health systems, answering questions related to climate-change risk assessment and preparedness activities. Respondents to the survey are currently only based in the USA, the UK, Australia, Brazil, France, Canada, New Zealand, and South Africa, with the vast majority being in high-income countries. Participants also represent the most engaged health systems, introducing an element of bias into any analysis. Both adaptation engagement (respondents who have completed a vulnerability and adaptation assessment), and adaptation activity (respondents who have begun to implement preparedness activities) provide potentially useful sources of data for future analyses.
Although the level of engagement rose somewhat between 2015, and 2016, adaptation activity is much lower, with only 57% of health systems, 22% of hospitals, and 20% of health centres having developed a plan to address future health-care service delivery needs resulting from climate change. Within this sample, these results suggest that there may be more capacity to undertake risk assessments than to plan and implement adaptation activities, or may suggest a delay between risk assessment and risk reduction efforts.
For more on the Health Care Climate Challenge see https://
noharm-global.org/
**Strictly embargoed until 23.30 UK time / 6.30pm New York time
Wednesday 28th November 2018**
Review
www.thelancet.com Published online November 28, 2018 http://dx.doi.org/10.1016/S0140-6736(18)32594-7 17
Indicator 2.8: health adaptation funding from global climate financing mechanismsHeadline finding: the amount of adaptation funding falls short of the commitments made in the Paris Agreement, with just $472·82 million of adaptation funding for development in 2017; only 3·8% of the funding in 2017 was allocated for health adaptationThis indicator makes use of the same data source (Climate Funds Update)56 and methods as those described in the 2017 Lancet Countdown report.2 The past 12 months saw the approval of a new health-adaptation programme in east Asia and the Pacific to scale-up health system resilience in Pacific Island Least Developed Countries. At $17·85 million, this project was the only health-focused project to be approved in 2017, and represented 3·8% of the total 2017 adaptation spending for development ($472·82 million), far less than the annual $100 billion for adaptation efforts by 2020 promised at the 2010 Cancun Agreements under the UNFCCC (appendix).57
ConclusionThe data presented in section 2 suggests that health professionals and health systems are increasingly considering and responding to the health effects of climate change. There appears to be more and earlier engagement in higher-resource settings than low-resource settings, although there is evidence of adapta-tion activity in health sectors across the develop mental and geographic spectrum. There is evidence of health adaptation occurring incidentally, through broad de-velopment initiatives, such as IHRs (indicator 2.3 and 2.4), and directly through specific climate-change adap-tation initiatives (indicators 2.1, 2.2, and 2.6). Although absolute preparedness remains low, most trends followed in this report are moving in the right direc-tion, and when vulnerability has been tracked, risks related to climate change appear to be decreasing. Despite this positive trend, absolute funding available for health adaptation remains particularly low, limiting further progress on this issue. Furthermore, powerful technolo gical and financial limits to adaptation exist, and these necessitate a joint focus on mitigation as part of the global response to climate change.3
Measuring health adaptation and resilience to climate change presents numerous methodological challenges, with most available metrics being proxy indicators of progress. These measures must be interpreted with caution and applied to climate change, rather than solely in their original context. This section has worked to present findings of indicators for adaptation assess-ments, planning, implementation, and financing.
Section 3: mitigation actions and health co-benefitsIntroductionThis section presents evidence relating to climate change mitigation and associated near-term consequences for
health. The health impacts of climate change, and communities’ ability to adapt to it, both depend on the success of global mitigation efforts. But mitigation also has more immediate co-benefits arising from the changes in harmful exposures (eg, reductions in particle air pollution) and health-related behaviours that mitiga tion actions entail. Therefore, the pace of the low-carbon transition establishes the degree to which such benefits are realised.
The changes since the 2017 Lancet Countdown report2 mostly reflect continuing trends or modest incremental shifts. A shift of investment towards clean energy tech-nologies continues to occur, with accelerating growth in new low-carbon power generation (indicator 3.3) and a downward trend in global demand for coal (indicator 3.2). However, global energy-sector carbon emissions remain largely unchanged (indicator 3.1) and ambient air pollution remains generally poor (indicator 3.5), with estimated contributions of different sectors to PM2·5-attributable
Panel 4: Deaths from climate-related disasters versus health spending
The number of people killed in climate-related disasters is a function of the strength of the climate hazard, the exposure of the population to the hazard related to the number of people in the hazard location, and the underlying vulnerability of the population. Governments can reduce deaths to climate-related disasters through disaster preparedness measures, such as early-warning systems and via enhanced health services for those affected by a disaster. Although generally countries with higher GDPs (gross domestic products) have lower numbers of disaster fatalities than countries with lower GDPs, this relationship does not necessarily hold when also accounting for the number of people exposed to climate hazards (appendix).
Instead, a clear relationship exists between deaths per capita from climate-related disasters and per-capita health national spending. Countries that spend more on health tend to have fewer deaths from such disasters than countries that spend less. Although health spending (per capita) is related to GDP (per capita), the relationship is not one to one (appendix). Most notably, when ranking countries by the percentage of GDP that is spent on health, for the first three quartiles of countries, a decrease in deaths per capita from disasters related to climate hazards can be seen as the percentage of GDP increases. This finding would appear to support the notion that as governments allocate more of their GDP to health spending per capita, they decrease the number of deaths (per capita) from climate-related disasters for all countries, except those in the highest percentage of the health spending quartile. This raises serious questions as to which elements of health spending are most effective at reducing climate-related disaster deaths; for example, whether preparedness or primary health or response have the greatest role in minimising mortality.
**Strictly embargoed until 23.30 UK time / 6.30pm New York time
Wednesday 28th November 2018**
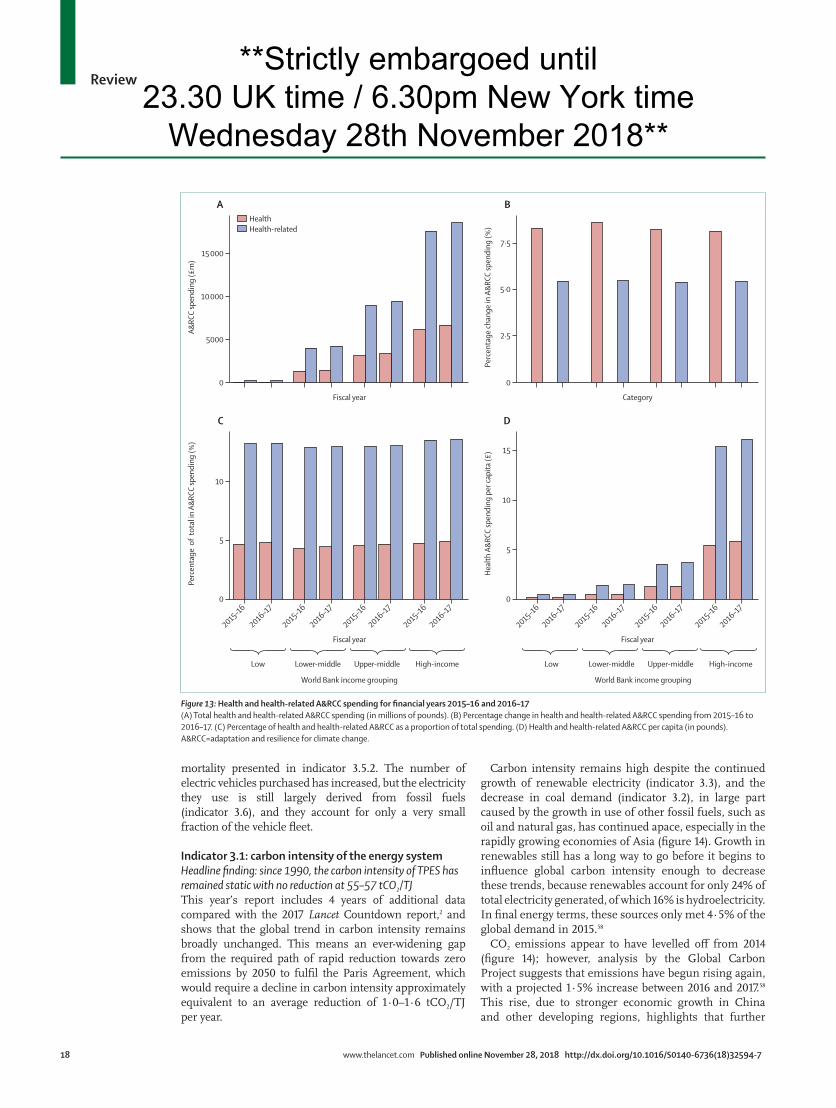
Review
18 www.thelancet.com Published online November 28, 2018 http://dx.doi.org/10.1016/S0140-6736(18)32594-7
mortality presented in indicator 3.5.2. The number of electric vehicles purchased has increased, but the electricity they use is still largely derived from fossil fuels (indicator 3.6), and they account for only a very small fraction of the vehicle fleet.
Indicator 3.1: carbon intensity of the energy systemHeadline finding: since 1990, the carbon intensity of TPES has remained static with no reduction at 55–57 tCO2/TJThis year’s report includes 4 years of additional data compared with the 2017 Lancet Countdown report,2 and shows that the global trend in carbon intensity remains broadly unchanged. This means an ever-widening gap from the required path of rapid reduction towards zero emissions by 2050 to fulfil the Paris Agreement, which would require a decline in carbon intensity approximately equivalent to an average reduction of 1·0–1·6 tCO2/TJ per year.
Carbon intensity remains high despite the continued growth of renewable electricity (indicator 3.3), and the decrease in coal demand (indicator 3.2), in large part caused by the growth in use of other fossil fuels, such as oil and natural gas, has continued apace, especially in the rapidly growing economies of Asia (figure 14). Growth in renewables still has a long way to go before it begins to influence global carbon intensity enough to decrease these trends, because renewables account for only 24% of total electricity generated, of which 16% is hydroelectricity. In final energy terms, these sources only met 4·5% of the global demand in 2015.58
CO2 emissions appear to have levelled off from 2014 (figure 14); however, analysis by the Global Carbon Project suggests that emissions have begun rising again, with a projected 1·5% increase between 2016 and 2017.58 This rise, due to stronger economic growth in China and other developing regions, highlights that further
0
5000
10 000
15 000
A&RC
C sp
endi
ng (£
m)
A
0
2·5
5·0
7·5
Perc
enta
ge ch
ange
in A
&RCC
spen
ding
(%)
B
0
5
10
Perc
enta
ge o
f to
tal i
n A&
RCC
spen
ding
(%)
2015–16
2016–17
2015–16
2016–17
2015–16
2016–17
2015–16
2016–17
2015–16
2016–17
2015–16
2016–17
2015–16
2016–17
2015–16
2016–17
C
0
5
10
15
Hea
lth A
&RCC
spen
ding
per
capi
ta (£
)
D
Fiscal year Category
Fiscal year
World Bank income grouping
Low Lower-middle Upper-middle High-income
World Bank income grouping
Low Lower-middle Upper-middle High-income
Fiscal year
HealthHealth-related
Figure 13: Health and health-related A&RCC spending for financial years 2015–16 and 2016–17(A) Total health and health-related A&RCC spending (in millions of pounds). (B) Percentage change in health and health-related A&RCC spending from 2015–16 to 2016–17. (C) Percentage of health and health-related A&RCC as a proportion of total spending. (D) Health and health-related A&RCC per capita (in pounds). A&RCC=adaptation and resilience for climate change.
**Strictly embargoed until 23.30 UK time / 6.30pm New York time
Wednesday 28th November 2018**
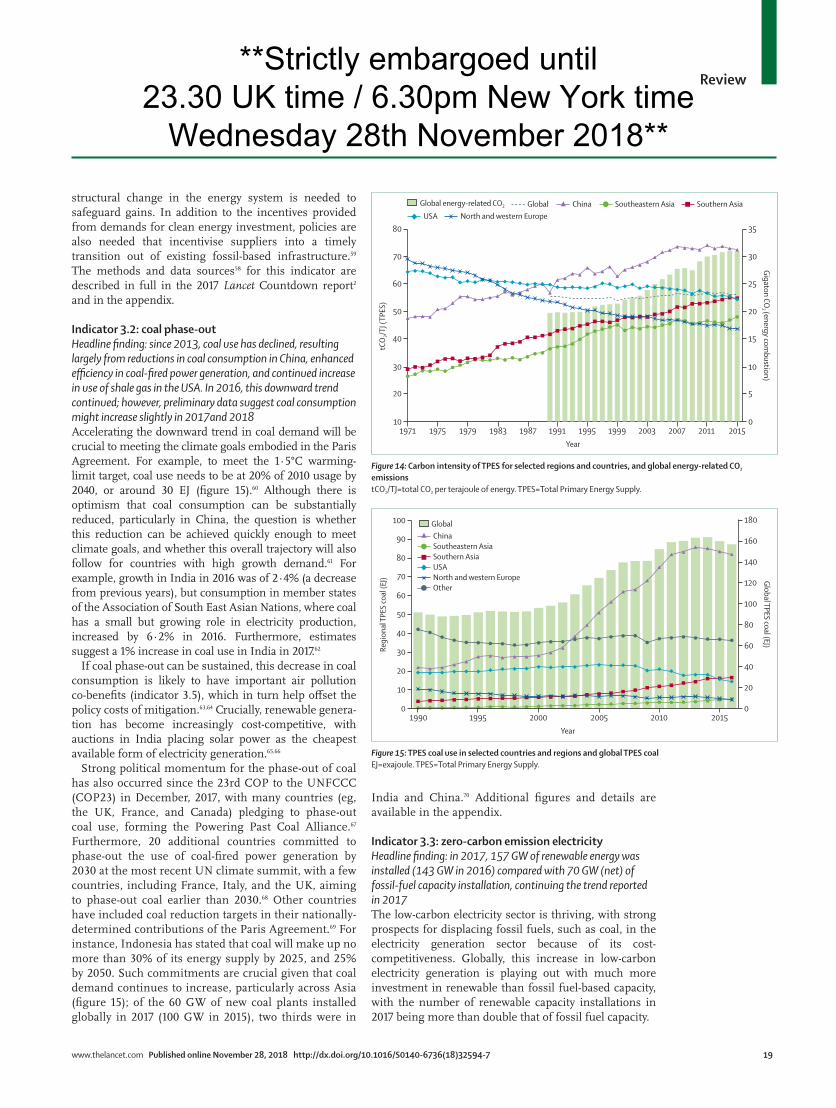
Review
www.thelancet.com Published online November 28, 2018 http://dx.doi.org/10.1016/S0140-6736(18)32594-7 19
structural change in the energy system is needed to safeguard gains. In addition to the incentives provided from demands for clean energy investment, policies are also needed that incentivise suppliers into a timely transition out of existing fossil-based infrastructure.59 The methods and data sources58 for this indicator are described in full in the 2017 Lancet Countdown report2 and in the appendix.
Indicator 3.2: coal phase-outHeadline finding: since 2013, coal use has declined, resulting largely from reductions in coal consumption in China, enhanced efficiency in coal-fired power generation, and continued increase in use of shale gas in the USA. In 2016, this downward trend continued; however, preliminary data suggest coal consumption might increase slightly in 2017and 2018Accelerating the downward trend in coal demand will be crucial to meeting the climate goals embodied in the Paris Agreement. For example, to meet the 1·5°C warming-limit target, coal use needs to be at 20% of 2010 usage by 2040, or around 30 EJ (figure 15).60 Although there is optimism that coal consumption can be substantially reduced, particularly in China, the question is whether this reduction can be achieved quickly enough to meet climate goals, and whether this overall trajectory will also follow for countries with high growth demand.61 For example, growth in India in 2016 was of 2·4% (a decrease from previous years), but consumption in member states of the Association of South East Asian Nations, where coal has a small but growing role in electricity production, increased by 6·2% in 2016. Furthermore, estimates suggest a 1% increase in coal use in India in 2017.62
If coal phase-out can be sustained, this decrease in coal consumption is likely to have important air pollution co-benefits (indicator 3.5), which in turn help offset the policy costs of mitigation.63,64 Crucially, renewable genera-tion has become increasingly cost-competitive, with auctions in India placing solar power as the cheapest available form of electricity generation.65,66
Strong political momentum for the phase-out of coal has also occurred since the 23rd COP to the UNFCCC (COP23) in December, 2017, with many countries (eg, the UK, France, and Canada) pledging to phase-out coal use, forming the Powering Past Coal Alliance.67 Furthermore, 20 additional countries committed to phase-out the use of coal-fired power generation by 2030 at the most recent UN climate summit, with a few countries, including France, Italy, and the UK, aiming to phase-out coal earlier than 2030.68 Other countries have included coal reduction targets in their nationally-determined contributions of the Paris Agreement.69 For instance, Indonesia has stated that coal will make up no more than 30% of its energy supply by 2025, and 25% by 2050. Such commitments are crucial given that coal demand continues to increase, particularly across Asia (figure 15); of the 60 GW of new coal plants installed globally in 2017 (100 GW in 2015), two thirds were in
India and China.70 Additional figures and details are available in the appendix.
Indicator 3.3: zero-carbon emission electricityHeadline finding: in 2017, 157 GW of renewable energy was installed (143 GW in 2016) compared with 70 GW (net) of fossil-fuel capacity installation, continuing the trend reported in 2017The low-carbon electricity sector is thriving, with strong prospects for displacing fossil fuels, such as coal, in the electricity generation sector because of its cost-competitiveness. Globally, this increase in low-carbon electricity generation is playing out with much more investment in renewable than fossil fuel-based capacity, with the number of renewable capacity installations in 2017 being more than double that of fossil fuel capacity.
USA
1971 1975 1979 1983 1987 1991 1995 1999 2003 2007 2011 201510 0
20 5
30 10
40 15
50 20
60 25
70 30
80 35
tCO
2/TJ (
TPES
)
Gigaton CO2 (energy com
bustion)
Year
Southern AsiaSoutheastern AsiaNorth and western Europe
Global energy-related CO2 Global China
Figure 14: Carbon intensity of TPES for selected regions and countries, and global energy-related CO2 emissionstCO2/TJ=total CO2 per terajoule of energy. TPES=Total Primary Energy Supply.
ChinaSoutheastern AsiaSouthern AsiaUSANorth and western EuropeOther
1990 1995 2000 2005 2010 20150
10
20
30
40
50
60
70
80
90
100
Regi
onal
TPE
S co
al (E
J)
0
20
40
60
80
100
120
140
160
180
Global TPES coal (EJ)
Year
Global
Figure 15: TPES coal use in selected countries and regions and global TPES coalEJ=exajoule. TPES=Total Primary Energy Supply.
**Strictly embargoed until 23.30 UK time / 6.30pm New York time
Wednesday 28th November 2018**

Review
20 www.thelancet.com Published online November 28, 2018 http://dx.doi.org/10.1016/S0140-6736(18)32594-7
Approximately 30% of global electricity generation is from zero-carbon sources, with the majority coming from hydropower and nuclear power. In 2015, 5% of global electricity generation was from so-called new renewables (solar and wind power), rising from 0·5% in 2000. This growth is particularly evident in the USA, China, northwest Europe, and India, all of which are expanding their renewables deployment (figure 16A and C). The increasing share of renewable generation either displaces fossil fuel gener ation or meets a portion of new demand growth, reducing the need for investment in fossil fuels (figure 16B and D). The data and methods for this indicator are reported in the 2017 Lancet Countdown2 and the appendix.71
Indicator 3.4: access to clean energyHeadline finding: the number of people without connections to electricity decreased from 1·7 billion in 2000 to 1·1 billion in 2016, and many countries will achieve electricity for all by 2030, with the greatest gains to be seen in east Asia and southeast Asia. Conversely, more than 2·8 billion people still go without healthy, clean, and sustainable cooking fuel or technologies, the same number as in 2000The reduction in the number of people without access to electricity from 1·7 billion in 2000 to 1·1 billion in 2016,
is primarily due to an increase in new connections made to a centralised grid, although modest gains continue for decentralised grids or microgrids. Most new access was achieved using electricity generated with fossil fuels, highlighting a key challenge in moving towards a decarbonised energy system. Much of this growth has been driven by coal-generated power stations in China, India, and southeast Asia; at 37%, coal remains the main fuel used in global electricity production.58 Although strong economic, health, and social benefits come from increased use of electricity, costs (such as exacerbated outdoor ambient air pollution and greenhouse gas emissions) will vary depending on how electricity is provided (indicator 3.5). The residential sector’s energy mix has changed over 15 years alongside access to electricity, which has been driven largely by fossil fuel generation. The complicated nature of the relationship between energy access and health is fraught with local synergies and tradeoffs (panel 5).
Access and use of clean fuels and technologies for cooking has seen limited improvement since 2000, and in several countries negative trends have been observed as the access gap increases. Access to clean cooking remains a continuous problem, with around 3 billion people (1·9 billion in developing Asia and 850 million in
0
200
400
600
800
1000
1200
1400
1600
Low
-car
bon
gene
ratio
n (T
Wh)
A
0
0·1
0·2
0·3
0·4
0·5
0·6
0·7
Shar
e of l
ow-c
arbo
n ge
nera
tion
Shar
e of r
enew
able
gen
erat
ion
(exc
ludi
ng h
ydro
pow
er)
B
1990 201520102005200019950
50
100
150
200
250
300
Rene
wab
le g
ener
atio
n (e
xclu
ding
hyd
ropo
wer
; TW
h)
Year
C
1990 201520102005200019950
0·02
0·06
0·04
0·08
0·10
0·12
0·14
Year
D
ChinaSoutheastern AsiaSouthern Asia
USANorth and western Europe
Figure 16: Renewable and zero-carbon emission electricity generation(A) Electricity generated from zero-carbon sources. (B) Share of electricity generated from zero-carbon sources. (C) Electricity generated from renewable sources (excludring hydropower). (D) Share of electricity generated from renewable sources (excluding hydropower). TWh=terawatt hours.
**Strictly embargoed until 23.30 UK time / 6.30pm New York time
Wednesday 28th November 2018**
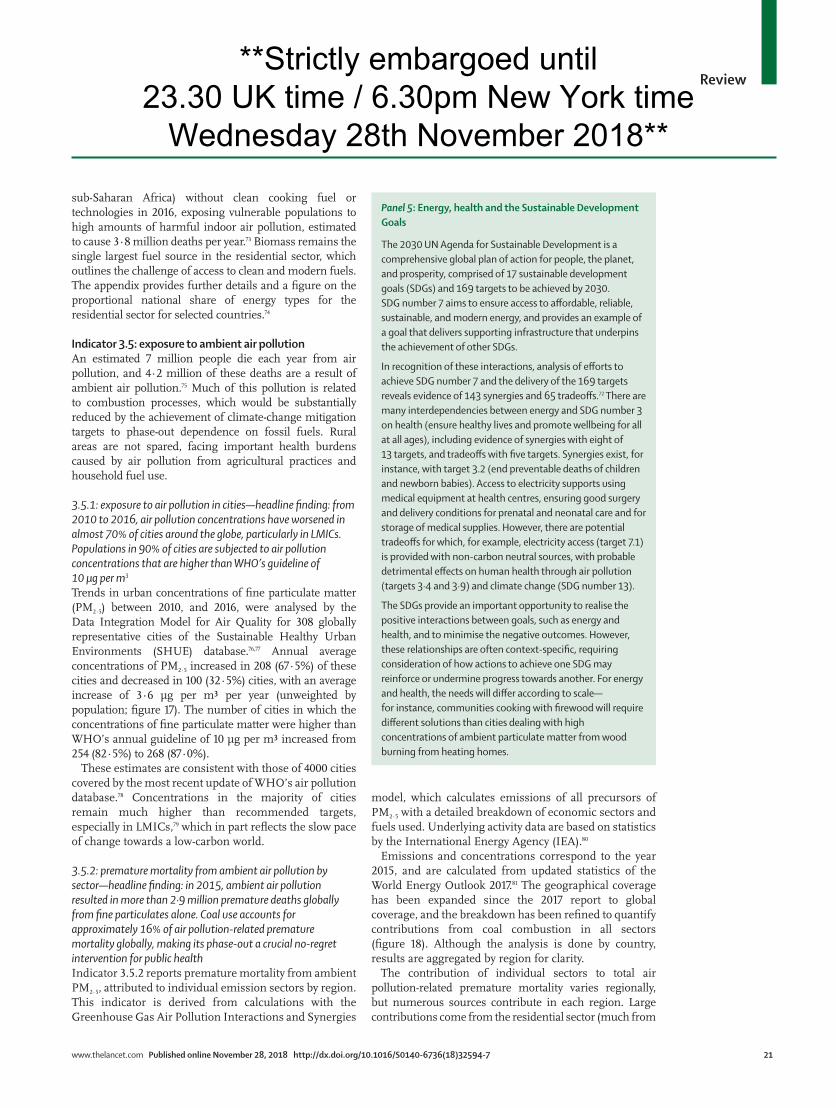
Review
www.thelancet.com Published online November 28, 2018 http://dx.doi.org/10.1016/S0140-6736(18)32594-7 21
sub-Saharan Africa) without clean cooking fuel or technologies in 2016, exposing vulnerable popu lations to high amounts of harmful indoor air pollution, estimated to cause 3·8 million deaths per year.73 Biomass remains the single largest fuel source in the residential sector, which outlines the challenge of access to clean and modern fuels. The appendix provides further details and a figure on the proportional national share of energy types for the residential sector for selected countries.74
Indicator 3.5: exposure to ambient air pollutionAn estimated 7 million people die each year from air pollution, and 4·2 million of these deaths are a result of ambient air pollution.75 Much of this pollution is related to combustion processes, which would be substantially reduced by the achievement of climate-change mitigation targets to phase-out dependence on fossil fuels. Rural areas are not spared, facing important health burdens caused by air pollution from agricultural practices and household fuel use.
3.5.1: exposure to air pollution in cities—headline finding: from 2010 to 2016, air pollution concentrations have worsened in almost 70% of cities around the globe, particularly in LMICs. Populations in 90% of cities are subjected to air pollution concentrations that are higher than WHO’s guideline of 10 µg per m3
Trends in urban concentrations of fine particulate matter (PM2·5) between 2010, and 2016, were analysed by the Data Integration Model for Air Quality for 308 globally representative cities of the Sustainable Healthy Urban Environments (SHUE) database.76,77 Annual average concentrations of PM2·5 increased in 208 (67·5%) of these cities and decreased in 100 (32·5%) cities, with an average increase of 3·6 µg per m³ per year (unweighted by population; figure 17). The number of cities in which the concentrations of fine particulate matter were higher than WHO’s annual guideline of 10 μg per m³ increased from 254 (82·5%) to 268 (87·0%).
These estimates are consistent with those of 4000 cities covered by the most recent update of WHO’s air pollution database.78 Concentrations in the majority of cities remain much higher than recommended targets, especially in LMICs,79 which in part reflects the slow pace of change towards a low-carbon world.
3.5.2: premature mortality from ambient air pollution by sector—headline finding: in 2015, ambient air pollution resulted in more than 2·9 million premature deaths globally from fine particulates alone. Coal use accounts for approximately 16% of air pollution-related premature mortality globally, making its phase-out a crucial no-regret intervention for public healthIndicator 3.5.2 reports premature mortality from ambient PM2·5, attributed to individual emission sectors by region. This indicator is derived from calculations with the Greenhouse Gas Air Pollution Interactions and Synergies
model, which calculates emis sions of all precursors of PM2·5 with a detailed breakdown of economic sectors and fuels used. Underlying activity data are based on statistics by the International Energy Agency (IEA).80
Emissions and concentrations correspond to the year 2015, and are calculated from updated statistics of the World Energy Outlook 2017.81 The geo graphical coverage has been expanded since the 2017 report to global coverage, and the breakdown has been refined to quantify contributions from coal combustion in all sectors (figure 18). Although the analysis is done by country, results are aggregated by region for clarity.
The contribution of individual sectors to total air pollution-related premature mortality varies regionally, but numerous sources contribute in each region. Large contributions come from the residential sector (much from
Panel 5: Energy, health and the Sustainable Development Goals
The 2030 UN Agenda for Sustainable Development is a comprehensive global plan of action for people, the planet, and prosperity, comprised of 17 sustainable development goals (SDGs) and 169 targets to be achieved by 2030. SDG number 7 aims to ensure access to affordable, reliable, sustainable, and modern energy, and provides an example of a goal that delivers supporting infrastructure that underpins the achievement of other SDGs.
In recognition of these interactions, analysis of efforts to achieve SDG number 7 and the delivery of the 169 targets reveals evidence of 143 synergies and 65 tradeoffs.72 There are many interdependencies between energy and SDG number 3 on health (ensure healthy lives and promote wellbeing for all at all ages), including evidence of synergies with eight of 13 targets, and tradeoffs with five targets. Synergies exist, for instance, with target 3.2 (end preventable deaths of children and newborn babies). Access to electricity supports using medical equipment at health centres, ensuring good surgery and delivery conditions for prenatal and neonatal care and for storage of medical supplies. However, there are potential tradeoffs for which, for example, electricity access (target 7.1) is provided with non-carbon neutral sources, with probable detrimental effects on human health through air pollution (targets 3·4 and 3·9) and climate change (SDG number 13).
The SDGs provide an important opportunity to realise the positive interactions between goals, such as energy and health, and to minimise the negative outcomes. However, these relationships are often context-specific, requiring consideration of how actions to achieve one SDG may reinforce or undermine progress towards another. For energy and health, the needs will differ according to scale—for instance, communities cooking with firewood will require different solutions than cities dealing with high concentrations of ambient particulate matter from wood burning from heating homes.
**Strictly embargoed until 23.30 UK time / 6.30pm New York time
Wednesday 28th November 2018**
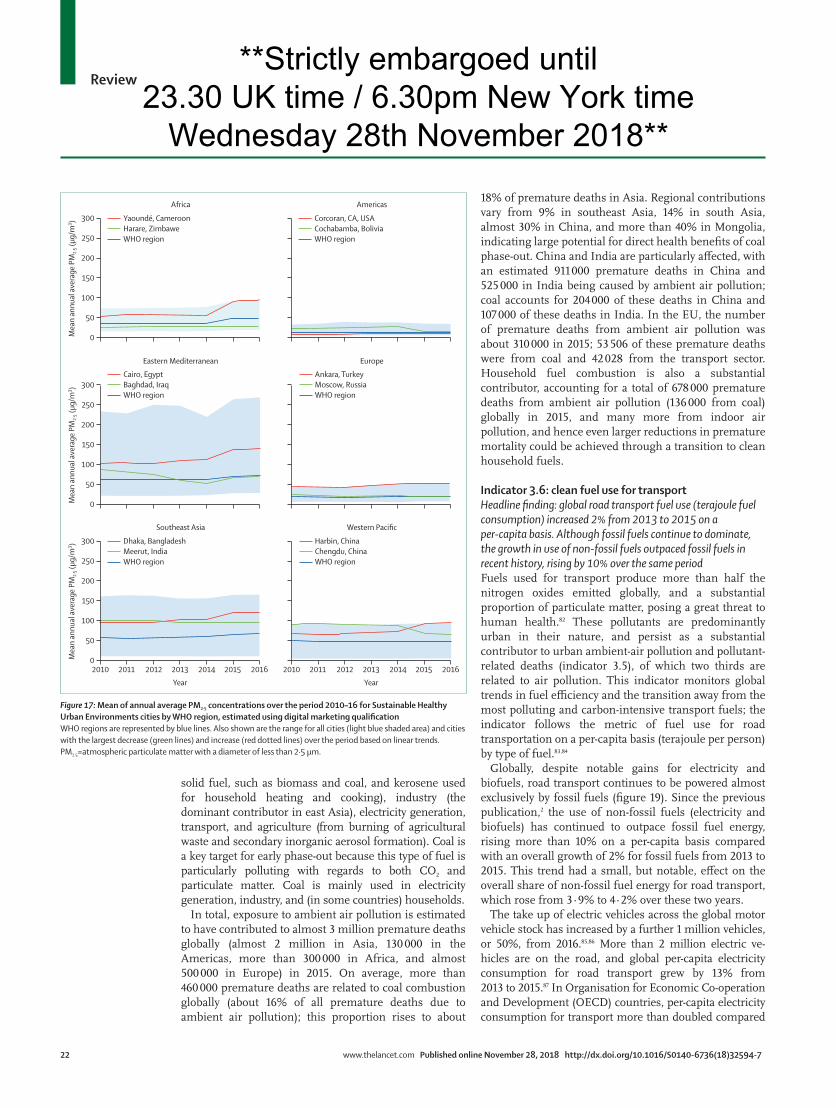
Review
22 www.thelancet.com Published online November 28, 2018 http://dx.doi.org/10.1016/S0140-6736(18)32594-7
solid fuel, such as biomass and coal, and kerosene used for household heating and cooking), industry (the dominant contributor in east Asia), electricity generation, transport, and agriculture (from burning of agricultural waste and secondary inorganic aerosol formation). Coal is a key target for early phase-out because this type of fuel is particularly polluting with regards to both CO2 and particulate matter. Coal is mainly used in electricity generation, industry, and (in some countries) households.
In total, exposure to ambient air pollution is estimated to have contributed to almost 3 million premature deaths globally (almost 2 million in Asia, 130 000 in the Americas, more than 300 000 in Africa, and almost 500 000 in Europe) in 2015. On average, more than 460 000 premature deaths are related to coal combustion globally (about 16% of all premature deaths due to ambient air pollution); this proportion rises to about
18% of premature deaths in Asia. Regional contributions vary from 9% in southeast Asia, 14% in south Asia, almost 30% in China, and more than 40% in Mongolia, indicating large potential for direct health benefits of coal phase-out. China and India are particularly affected, with an estimated 911 000 premature deaths in China and 525 000 in India being caused by ambient air pollution; coal accounts for 204 000 of these deaths in China and 107 000 of these deaths in India. In the EU, the number of premature deaths from ambient air pollution was about 310 000 in 2015; 53 506 of these premature deaths were from coal and 42 028 from the transport sector. Household fuel combustion is also a substantial contributor, accounting for a total of 678 000 premature deaths from ambient air pollution (136 000 from coal) globally in 2015, and many more from indoor air pollution, and hence even larger reductions in premature mortality could be achieved through a transition to clean household fuels.
Indicator 3.6: clean fuel use for transportHeadline finding: global road transport fuel use (terajoule fuel consumption) increased 2% from 2013 to 2015 on a per-capita basis. Although fossil fuels continue to dominate, the growth in use of non-fossil fuels outpaced fossil fuels in recent history, rising by 10% over the same periodFuels used for transport produce more than half the nitrogen oxides emitted globally, and a substantial proportion of particulate matter, posing a great threat to human health.82 These pollutants are predominantly urban in their nature, and persist as a substantial contributor to urban ambient-air pollution and pollutant-related deaths (indicator 3.5), of which two thirds are related to air pollution. This indicator monitors global trends in fuel efficiency and the transition away from the most polluting and carbon-intensive transport fuels; the indicator follows the metric of fuel use for road transportation on a per-capita basis (terajoule per person) by type of fuel.83,84
Globally, despite notable gains for electricity and biofuels, road transport continues to be powered almost exclusively by fossil fuels (figure 19). Since the previous publication,2 the use of non-fossil fuels (electricity and biofuels) has continued to outpace fossil fuel energy, rising more than 10% on a per-capita basis compared with an overall growth of 2% for fossil fuels from 2013 to 2015. This trend had a small, but notable, effect on the overall share of non-fossil fuel energy for road transport, which rose from 3·9% to 4·2% over these two years.
The take up of electric vehicles across the global motor vehicle stock has increased by a further 1 million vehicles, or 50%, from 2016.85,86 More than 2 million electric ve-hicles are on the road, and global per-capita electricity con sumption for road transport grew by 13% from 2013 to 2015.87 In Organisation for Economic Co-operation and Development (OECD) countries, per-capita electricity consumption for transport more than doubled compared
2010 2011 2012 2013 2014 2015 20160
50
100
150
200
250
300
Mea
n an
nual
ave
rage
PM
2·5 (
µg/m
3 )
Year
Southeast Asia
2010 2011 2012 2013 2014 2015 2016Year
Western Pacific
0
50
100
150
200
250
300
Mea
n an
nual
ave
rage
PM
2·5 (
µg/m
3 )
Eastern Mediterranean Europe
0
50
100
150
200
250
300
Mea
n an
nual
ave
rage
PM
2·5 (
µg/m
3 )
Africa Americas
Yaoundé, CameroonHarare, ZimbaweWHO region
Cairo, EgyptBaghdad, IraqWHO region
Ankara, TurkeyMoscow, RussiaWHO region
Dhaka, BangladeshMeerut, IndiaWHO region
Harbin, ChinaChengdu, ChinaWHO region
Corcoran, CA, USACochabamba, BoliviaWHO region
Figure 17: Mean of annual average PM2·5 concentrations over the period 2010–16 for Sustainable Healthy Urban Environments cities by WHO region, estimated using digital marketing qualificationWHO regions are represented by blue lines. Also shown are the range for all cities (light blue shaded area) and cities with the largest decrease (green lines) and increase (red dotted lines) over the period based on linear trends. PM2·5=atmospheric particulate matter with a diameter of less than 2·5 µm.
**Strictly embargoed until 23.30 UK time / 6.30pm New York time
Wednesday 28th November 2018**
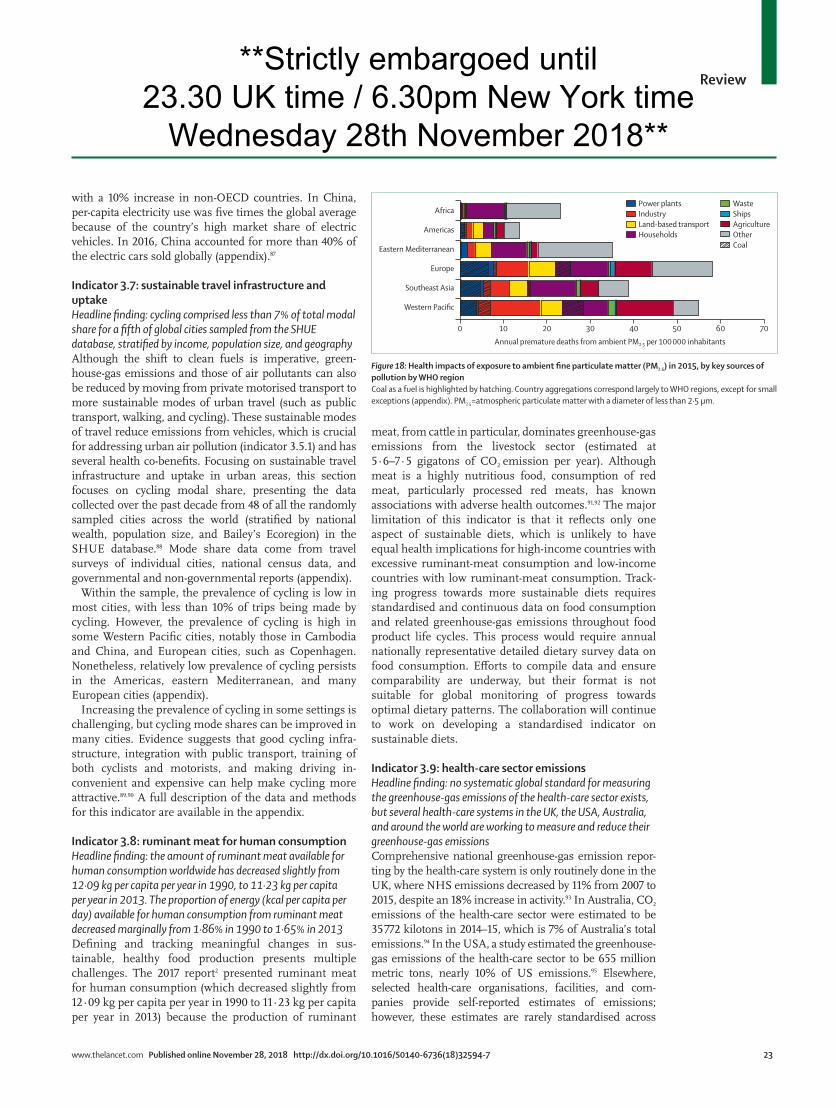
Review
www.thelancet.com Published online November 28, 2018 http://dx.doi.org/10.1016/S0140-6736(18)32594-7 23
with a 10% increase in non-OECD countries. In China, per-capita electricity use was five times the global average because of the country’s high market share of electric vehicles. In 2016, China accounted for more than 40% of the electric cars sold globally (appendix).87
Indicator 3.7: sustainable travel infrastructure and uptakeHeadline finding: cycling comprised less than 7% of total modal share for a fifth of global cities sampled from the SHUE database, stratified by income, population size, and geographyAlthough the shift to clean fuels is imperative, green-house-gas emissions and those of air pollutants can also be reduced by moving from private motorised transport to more sustainable modes of urban travel (such as public transport, walking, and cycling). These sustainable modes of travel reduce emissions from vehicles, which is crucial for addressing urban air pollution (indicator 3.5.1) and has several health co-benefits. Focusing on sus tainable travel infrastructure and uptake in urban areas, this section focuses on cycling modal share, presenting the data collected over the past decade from 48 of all the randomly sampled cities across the world (stratified by national wealth, population size, and Bailey’s Ecoregion) in the SHUE database.88 Mode share data come from travel surveys of individual cities, national census data, and governmental and non-governmental reports (appendix).
Within the sample, the prevalence of cycling is low in most cities, with less than 10% of trips being made by cycling. However, the prevalence of cycling is high in some Western Pacific cities, notably those in Cambodia and China, and European cities, such as Copenhagen. Nonetheless, relatively low prevalence of cycling persists in the Americas, eastern Mediterranean, and many European cities (appendix).
Increasing the prevalence of cycling in some settings is challenging, but cycling mode shares can be im proved in many cities. Evidence suggests that good cycling infra-structure, integration with public transport, training of both cyclists and motorists, and making driving in-convenient and expensive can help make cycling more attractive.89,90 A full description of the data and methods for this indicator are available in the appendix.
Indicator 3.8: ruminant meat for human consumptionHeadline finding: the amount of ruminant meat available for human consumption worldwide has decreased slightly from 12·09 kg per capita per year in 1990, to 11·23 kg per capita per year in 2013. The proportion of energy (kcal per capita per day) available for human consumption from ruminant meat decreased marginally from 1·86% in 1990 to 1·65% in 2013Defining and tracking meaningful changes in sus-tainable, healthy food production presents multiple challenges. The 2017 report2 presented ruminant meat for human con sumption (which decreased slightly from 12·09 kg per capita per year in 1990 to 11·23 kg per capita per year in 2013) because the production of ruminant
meat, from cattle in particular, dominates greenhouse-gas emissions from the livestock sector (estimated at 5·6–7·5 gigatons of CO2 emission per year). Although meat is a highly nutri tious food, consumption of red meat, particularly proces sed red meats, has known associations with adverse health outcomes.91,92 The major limitation of this indicator is that it reflects only one aspect of sustainable diets, which is unlikely to have equal health implications for high-income countries with excessive ruminant-meat consum ption and low-income countries with low ruminant-meat consumption. Track-ing progress towards more sustainable diets requires standardised and continuous data on food consumption and related greenhouse-gas emissions throughout food product life cycles. This process would require annual nationally representative detailed dietary survey data on food consumption. Efforts to compile data and ensure comparability are underway, but their format is not suitable for global monitoring of progress towards optimal dietary patterns. The collaboration will continue to work on developing a standardised indicator on sustainable diets.
Indicator 3.9: health-care sector emissionsHeadline finding: no systematic global standard for measuring the greenhouse-gas emissions of the health-care sector exists, but several health-care systems in the UK, the USA, Australia, and around the world are working to measure and reduce their greenhouse-gas emissionsComprehensive national greenhouse-gas emission repor-ting by the health-care system is only routinely done in the UK, where NHS emissions decreased by 11% from 2007 to 2015, despite an 18% increase in activity.93 In Australia, CO2 emissions of the health-care sector were estimated to be 35 772 kilotons in 2014–15, which is 7% of Australia’s total emissions.94 In the USA, a study estimated the greenhouse-gas emissions of the health-care sector to be 655 million metric tons, nearly 10% of US emissions.95 Elsewhere, selected health-care organisations, facilities, and com-panies provide self-reported estimates of emissions; however, these estimates are rarely standardised across
Western Pacific
Southeast Asia
Europe
Eastern Mediterranean
Americas
AfricaWasteShipsAgricultureOtherCoal
Power plantsIndustryLand-based transportHouseholds
0 10 20 30 40 50 60 70Annual premature deaths from ambient PM2·5 per 100 000 inhabitants
Figure 18: Health impacts of exposure to ambient fine particulate matter (PM2.5) in 2015, by key sources of pollution by WHO regionCoal as a fuel is highlighted by hatching. Country aggregations correspond largely to WHO regions, except for small exceptions (appendix). PM2·5=atmospheric particulate matter with a diameter of less than 2·5 µm.
**Strictly embargoed until 23.30 UK time / 6.30pm New York time
Wednesday 28th November 2018**
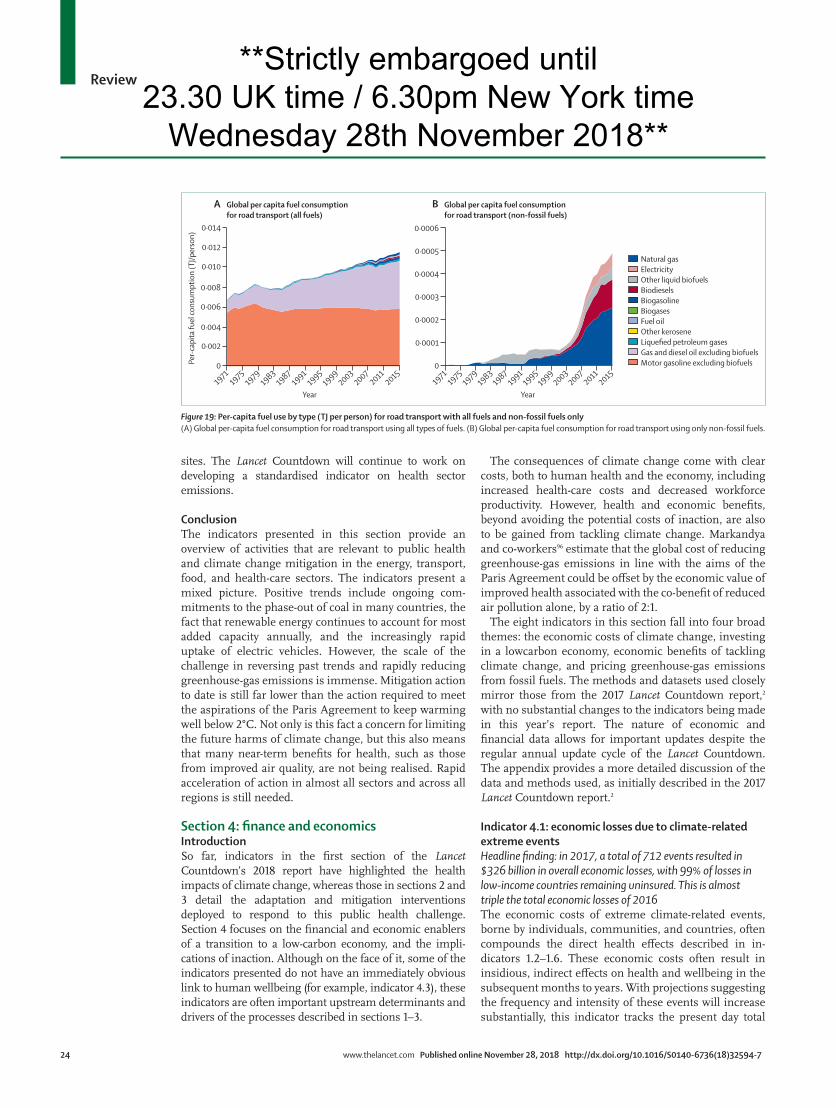
Review
24 www.thelancet.com Published online November 28, 2018 http://dx.doi.org/10.1016/S0140-6736(18)32594-7
sites. The Lancet Countdown will continue to work on developing a standardised indicator on health sector emissions.
ConclusionThe indicators presented in this section provide an overview of activities that are relevant to public health and climate change mitigation in the energy, transport, food, and health-care sectors. The indicators present a mixed picture. Positive trends include ongoing com-mitments to the phase-out of coal in many countries, the fact that renewable energy continues to account for most added capacity annually, and the increasingly rapid uptake of electric vehicles. However, the scale of the challenge in reversing past trends and rapidly reducing greenhouse-gas emissions is immense. Mitigation action to date is still far lower than the action required to meet the aspirations of the Paris Agreement to keep warming well below 2°C. Not only is this fact a concern for limiting the future harms of climate change, but this also means that many near-term benefits for health, such as those from improved air quality, are not being realised. Rapid acceleration of action in almost all sectors and across all regions is still needed.
Section 4: finance and economicsIntroductionSo far, indicators in the first section of the Lancet Countdown’s 2018 report have highlighted the health impacts of climate change, whereas those in sections 2 and 3 detail the adaptation and mitigation interventions deployed to respond to this public health challenge. Section 4 focuses on the financial and economic enablers of a transition to a low-carbon economy, and the impli-cations of inaction. Although on the face of it, some of the indicators presented do not have an immediately obvious link to human wellbeing (for ex ample, indicator 4.3), these indicators are often important upstream determinants and drivers of the processes described in sections 1–3.
The consequences of climate change come with clear costs, both to human health and the economy, including increased health-care costs and decreased workforce productivity. However, health and economic benefits, beyond avoiding the potential costs of inaction, are also to be gained from tackling climate change. Markandya and co-workers96 estimate that the global cost of reducing greenhouse-gas emissions in line with the aims of the Paris Agreement could be offset by the economic value of improved health associated with the co-benefit of reduced air pollution alone, by a ratio of 2:1.
The eight indicators in this section fall into four broad themes: the economic costs of climate change, investing in a low carbon economy, economic benefits of tackling climate change, and pricing greenhouse-gas emissions from fossil fuels. The methods and datasets used closely mirror those from the 2017 Lancet Countdown report,2 with no substantial changes to the indicators being made in this year’s report. The nature of economic and financial data allows for important updates despite the regular annual update cycle of the Lancet Countdown. The appendix provides a more detailed discussion of the data and methods used, as initially described in the 2017 Lancet Countdown report.2
Indicator 4.1: economic losses due to climate-related extreme eventsHeadline finding: in 2017, a total of 712 events resulted in $326 billion in overall economic losses, with 99% of losses in low-income countries remaining uninsured. This is almost triple the total economic losses of 2016The economic costs of extreme climate-related events, borne by individuals, communities, and countries, often compounds the direct health effects described in in-dicators 1.2–1.6. These economic costs often result in insidious, indirect effects on health and wellbeing in the subsequent months to years. With projections suggesting the frequency and intensity of these events will increase substantially, this indicator tracks the present day total
Natural gasElectricityOther liquid biofuelsBiodieselsBiogasolineBiogasesFuel oilOther keroseneLiquefied petroleum gasesGas and diesel oil excluding biofuelsMotor gasoline excluding biofuels
19711975
19791983
19871991
19951999
20032007
20112015
0
0·002
0·004
0·006
0·008
0·010
0·012
19711975
19791983
19871991
19951999
20032007
20112015
0·014
Per-
capi
ta fu
el co
nsum
ptio
n (T
J/per
son)
Year
0
0·0001
0·0002
0·0003
0·0004
0·0005
0·0006
Year
A Global per capita fuel consumptionfor road transport (all fuels)
B Global per capita fuel consumptionfor road transport (non-fossil fuels)
Figure 19: Per-capita fuel use by type (TJ per person) for road transport with all fuels and non-fossil fuels only(A) Global per-capita fuel consumption for road transport using all types of fuels. (B) Global per-capita fuel consumption for road transport using only non-fossil fuels.
**Strictly embargoed until 23.30 UK time / 6.30pm New York time
Wednesday 28th November 2018**
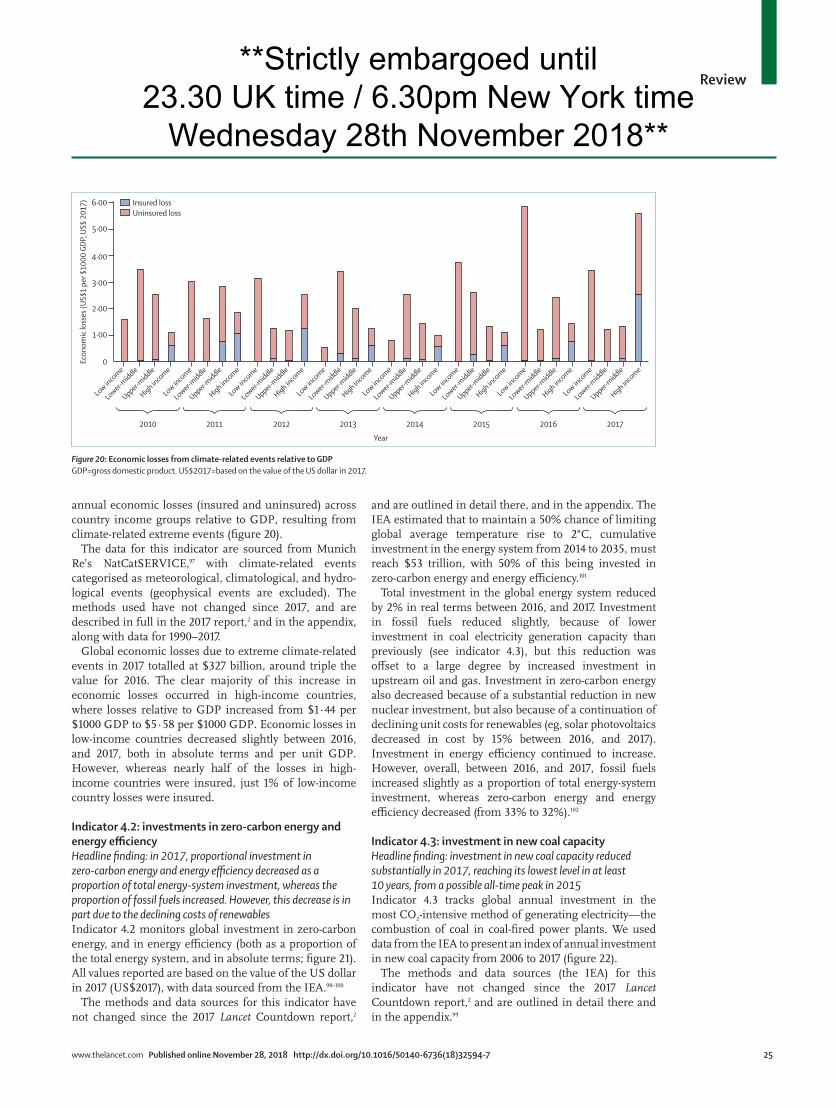
Review
www.thelancet.com Published online November 28, 2018 http://dx.doi.org/10.1016/S0140-6736(18)32594-7 25
annual economic losses (insured and uninsured) across country income groups relative to GDP, resulting from climate-related extreme events (figure 20).
The data for this indicator are sourced from Munich Re’s NatCatSERVICE,97 with climate-related events categorised as meteorological, climatological, and hydro-logical events (geophysical events are excluded). The methods used have not changed since 2017, and are described in full in the 2017 report,2 and in the appendix, along with data for 1990–2017.
Global economic losses due to extreme climate-related events in 2017 totalled at $327 billion, around triple the value for 2016. The clear majority of this increase in economic losses occurred in high-income countries, where losses relative to GDP increased from $1·44 per $1000 GDP to $5·58 per $1000 GDP. Economic losses in low-income countries decreased slightly between 2016, and 2017, both in absolute terms and per unit GDP. However, whereas nearly half of the losses in high-income countries were insured, just 1% of low-income country losses were insured.
Indicator 4.2: investments in zero-carbon energy and energy efficiencyHeadline finding: in 2017, proportional investment in zero-carbon energy and energy efficiency decreased as a proportion of total energy-system investment, whereas the proportion of fossil fuels increased. However, this decrease is in part due to the declining costs of renewablesIndicator 4.2 monitors global investment in zero-carbon energy, and in energy efficiency (both as a proportion of the total energy system, and in absolute terms; figure 21). All values reported are based on the value of the US dollar in 2017 (US$2017), with data sourced from the IEA.98–100
The methods and data sources for this indicator have not changed since the 2017 Lancet Countdown report,2
and are outlined in detail there, and in the appendix. The IEA estimated that to maintain a 50% chance of limiting global average temperature rise to 2°C, cumulative investment in the energy system from 2014 to 2035, must reach $53 trillion, with 50% of this being invested in zero-carbon energy and energy efficiency.101
Total investment in the global energy system reduced by 2% in real terms between 2016, and 2017. Investment in fossil fuels reduced slightly, because of lower investment in coal electricity generation capacity than previously (see indicator 4.3), but this reduction was offset to a large degree by increased investment in upstream oil and gas. Investment in zero-carbon energy also decreased because of a substantial reduction in new nuclear investment, but also because of a continuation of declining unit costs for renewables (eg, solar photovoltaics decreased in cost by 15% between 2016, and 2017). Investment in energy efficiency continued to increase. However, overall, between 2016, and 2017, fossil fuels increased slightly as a proportion of total energy-system investment, whereas zero-carbon energy and energy efficiency decreased (from 33% to 32%).102
Indicator 4.3: investment in new coal capacityHeadline finding: investment in new coal capacity reduced substantially in 2017, reaching its lowest level in at least 10 years, from a possible all-time peak in 2015Indicator 4.3 tracks global annual investment in the most CO2-intensive method of generating electricity—the combustion of coal in coal-fired power plants. We used data from the IEA to present an index of annual investment in new coal capacity from 2006 to 2017 (figure 22).
The methods and data sources (the IEA) for this indicator have not changed since the 2017 Lancet Countdown report,2 and are outlined in detail there and in the appendix.99
Low inco
me
Lower-middle
Upper-middle
High inco
me
Low inco
me
Lower-middle
Upper-middle
High inco
me
Low inco
me
Lower-middle
Upper-middle
High inco
me
Low inco
me
Lower-middle
Upper-middle
High inco
me
Low inco
me
Lower-middle
Upper-middle
High inco
me
Low inco
me
Lower-middle
Upper-middle
High inco
me
Low inco
me
Lower-middle
Upper-middle
High inco
me
Low inco
me
Lower-middle
Upper-middle
High inco
me0
1·00
2·00
3·00
4·00
5·00
6·00
Econ
omic
loss
es (U
S$1
per $
1000
GDP
, US$
201
7)
2010 2011 2012 2013
Year
2014 2015 2016 2017
Insured lossUninsured loss
Figure 20: Economic losses from climate-related events relative to GDPGDP=gross domestic product. US$2017=based on the value of the US dollar in 2017.
**Strictly embargoed until 23.30 UK time / 6.30pm New York time
Wednesday 28th November 2018**
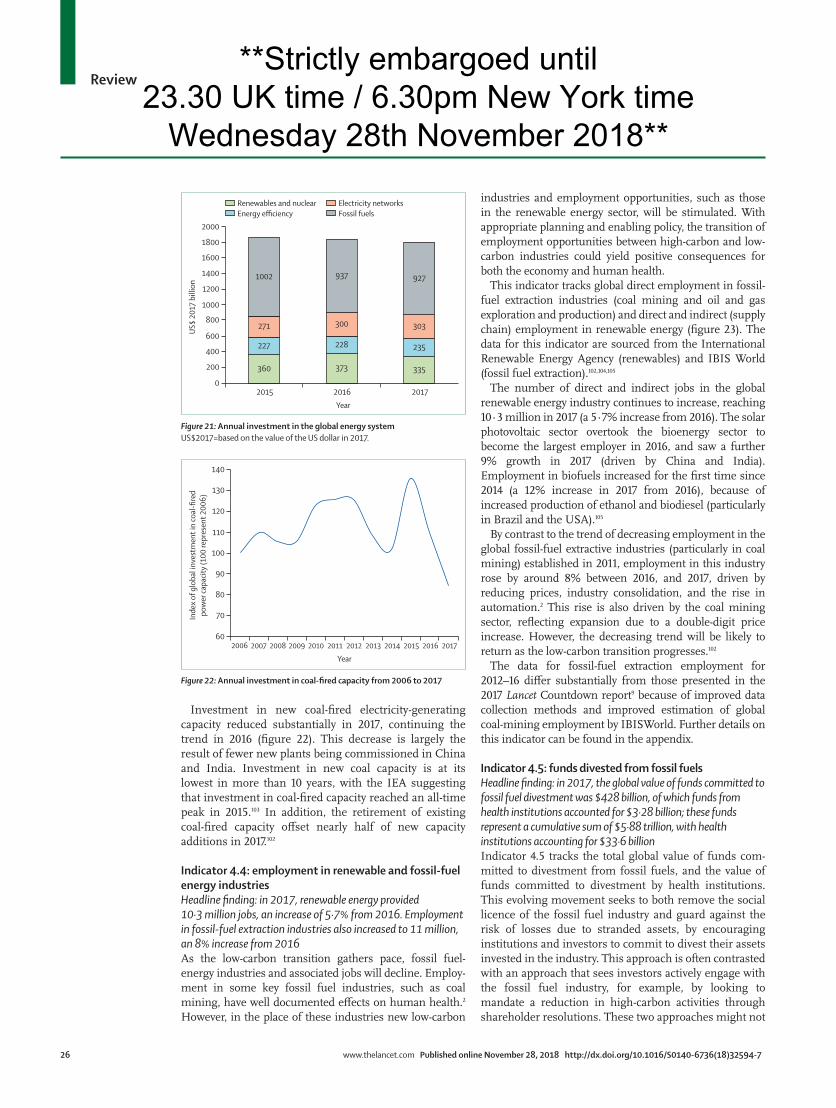
Review
26 www.thelancet.com Published online November 28, 2018 http://dx.doi.org/10.1016/S0140-6736(18)32594-7
Investment in new coal-fired electricity-generating capacity reduced substantially in 2017, continuing the trend in 2016 (figure 22). This decrease is largely the result of fewer new plants being commissioned in China and India. Investment in new coal capacity is at its lowest in more than 10 years, with the IEA suggesting that investment in coal-fired capacity reached an all-time peak in 2015.103 In addition, the retirement of existing coal-fired capacity offset nearly half of new capacity additions in 2017.102
Indicator 4.4: employment in renewable and fossil-fuel energy industriesHeadline finding: in 2017, renewable energy provided 10·3 million jobs, an increase of 5·7% from 2016. Employment in fossil-fuel extraction industries also increased to 11 million, an 8% increase from 2016As the low-carbon transition gathers pace, fossil fuel-energy industries and associated jobs will decline. Employ-ment in some key fossil fuel industries, such as coal mining, have well documented effects on human health.2 However, in the place of these industries new low-carbon
industries and employment opportunities, such as those in the renewable energy sector, will be stimulated. With appropriate planning and enabling policy, the transition of employment opportunities between high-carbon and low-carbon industries could yield positive consequences for both the economy and human health.
This indicator tracks global direct employment in fossil-fuel extraction industries (coal mining and oil and gas exploration and production) and direct and indirect (supply chain) employment in renewable energy (figure 23). The data for this indicator are sourced from the International Renewable Energy Agency (renewables) and IBIS World (fossil fuel extraction).102,104,105
The number of direct and indirect jobs in the global renewable energy industry continues to increase, reaching 10·3 million in 2017 (a 5·7% increase from 2016). The solar photovoltaic sector overtook the bioenergy sector to become the largest employer in 2016, and saw a further 9% growth in 2017 (driven by China and India). Employment in biofuels increased for the first time since 2014 (a 12% increase in 2017 from 2016), because of increased production of ethanol and biodiesel (particularly in Brazil and the USA).105
By contrast to the trend of decreasing employment in the global fossil-fuel extractive industries (particularly in coal mining) established in 2011, employment in this industry rose by around 8% between 2016, and 2017, driven by reducing prices, industry consolidation, and the rise in automation.2 This rise is also driven by the coal mining sector, reflecting expansion due to a double-digit price increase. However, the decreasing trend will be likely to return as the low-carbon transition progresses.102
The data for fossil-fuel extraction employment for 2012–16 differ substantially from those presented in the 2017 Lancet Countdown report9 because of improved data collection methods and improved estimation of global coal-mining employment by IBISWorld. Further details on this indicator can be found in the appendix.
Indicator 4.5: funds divested from fossil fuelsHeadline finding: in 2017, the global value of funds committed to fossil fuel divestment was $428 billion, of which funds from health institutions accounted for $3·28 billion; these funds represent a cumulative sum of $5·88 trillion, with health institutions accounting for $33·6 billionIndicator 4.5 tracks the total global value of funds com-mitted to divestment from fossil fuels, and the value of funds committed to divestment by health institutions. This evolving movement seeks to both remove the social licence of the fossil fuel industry and guard against the risk of losses due to stranded assets, by encouraging institutions and investors to commit to divest their assets invested in the industry. This approach is often contrasted with an approach that sees investors actively engage with the fossil fuel industry, for example, by looking to mandate a reduction in high-carbon activities through shareholder resolutions. These two approaches might not
360 373 335
227 228 235
271 300 303
1002 937 927
2015 2016 20170
200
400
600
800
1000
1200
1400
1600
1800
2000
US$
2017
bill
ion
Year
Renewables and nuclearEnergy efficiency
Electricity networksFossil fuels
2006 2007 2008 2009 2010 2011 2012 2013 2014 2015 2017201660
70
80
90
100
110
120
130
140
Inde
x of g
loba
l inv
estm
ent i
n co
al-fi
red
pow
er ca
pacit
y (1
00 re
pres
ent 2
006)
Year
Figure 21: Annual investment in the global energy systemUS$2017=based on the value of the US dollar in 2017.
Figure 22: Annual investment in coal-fired capacity from 2006 to 2017
**Strictly embargoed until 23.30 UK time / 6.30pm New York time
Wednesday 28th November 2018**
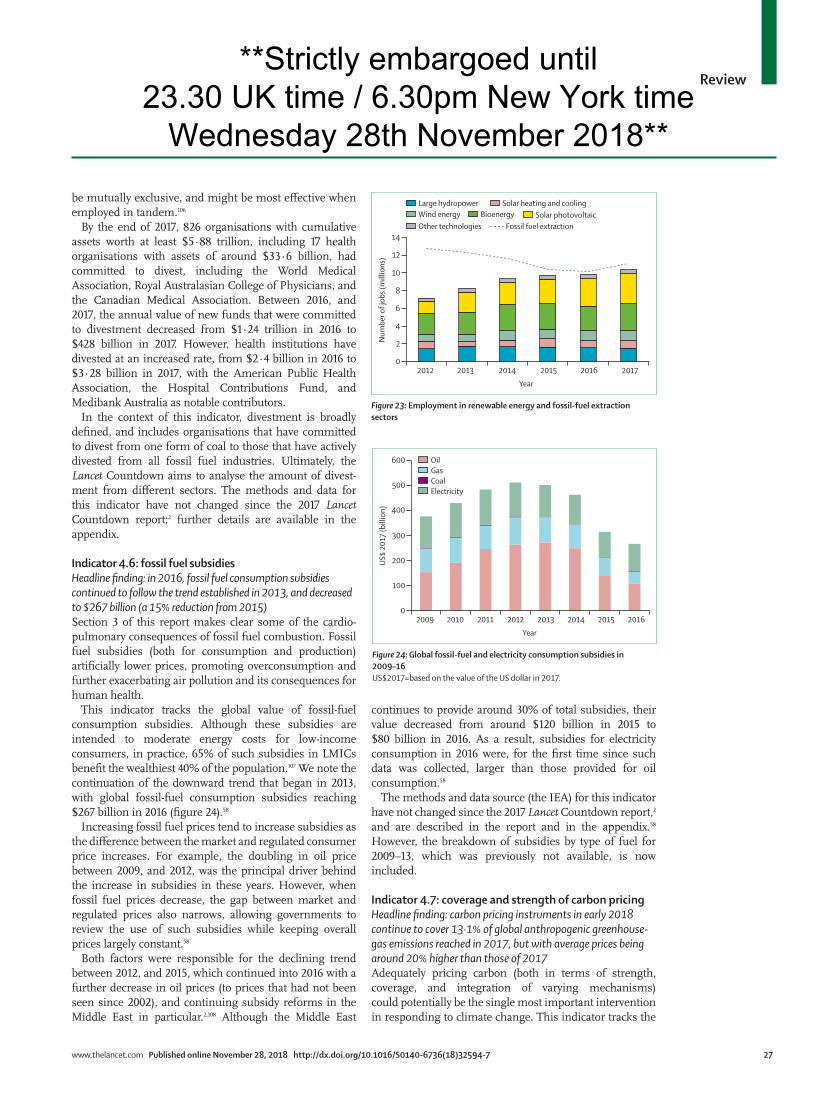
Review
www.thelancet.com Published online November 28, 2018 http://dx.doi.org/10.1016/S0140-6736(18)32594-7 27
be mutually exclusive, and might be most effective when employed in tandem.106
By the end of 2017, 826 organisations with cumulative assets worth at least $5·88 trillion, including 17 health organisations with assets of around $33·6 billion, had committed to divest, including the World Medical Association, Royal Australasian College of Physicians, and the Canadian Medical Association. Between 2016, and 2017, the annual value of new funds that were committed to divestment decreased from $1·24 trillion in 2016 to $428 billion in 2017. However, health institutions have divested at an increased rate, from $2·4 billion in 2016 to $3·28 billion in 2017, with the American Public Health Association, the Hospital Contributions Fund, and Medibank Australia as notable contributors.
In the context of this indicator, divestment is broadly defined, and includes organisations that have committed to divest from one form of coal to those that have actively divested from all fossil fuel industries. Ultimately, the Lancet Countdown aims to analyse the amount of divest-ment from different sectors. The methods and data for this indicator have not changed since the 2017 Lancet Countdown report;2 further details are available in the appendix.
Indicator 4.6: fossil fuel subsidiesHeadline finding: in 2016, fossil fuel consumption subsidies continued to follow the trend established in 2013, and decreased to $267 billion (a 15% reduction from 2015)Section 3 of this report makes clear some of the cardio-pulmonary consequences of fossil fuel combust ion. Fossil fuel subsidies (both for consumption and production) artificially lower prices, promoting over consumption and further exacerbating air pollution and its consequences for human health.
This indicator tracks the global value of fossil-fuel consumption subsidies. Although these subsidies are intended to moderate energy costs for low-income consumers, in practice, 65% of such subsidies in LMICs benefit the wealthiest 40% of the population.107 We note the continuation of the downward trend that began in 2013, with global fossil-fuel consumption subsidies reaching $267 billion in 2016 (figure 24).58
Increasing fossil fuel prices tend to increase subsidies as the difference between the market and regulated consumer price increases. For example, the doubling in oil price between 2009, and 2012, was the principal driver behind the increase in subsidies in these years. However, when fossil fuel prices decrease, the gap between market and regulated prices also narrows, allowing governments to review the use of such subsidies while keeping overall prices largely constant.58
Both factors were responsible for the declining trend between 2012, and 2015, which continued into 2016 with a further decrease in oil prices (to prices that had not been seen since 2002), and continuing subsidy reforms in the Middle East in particular.2,108 Although the Middle East
continues to provide around 30% of total subsidies, their value decreased from around $120 billion in 2015 to $80 billion in 2016. As a result, subsidies for electricity consumption in 2016 were, for the first time since such data was collected, larger than those provided for oil consumption.58
The methods and data source (the IEA) for this indicator have not changed since the 2017 Lancet Countdown report,2 and are described in the report and in the appendix.58 However, the breakdown of subsidies by type of fuel for 2009–13, which was previously not available, is now included.
Indicator 4.7: coverage and strength of carbon pricingHeadline finding: carbon pricing instruments in early 2018 continue to cover 13·1% of global anthropogenic greenhouse-gas emissions reached in 2017, but with average prices being around 20% higher than those of 2017Adequately pricing carbon (both in terms of strength, coverage, and integration of varying mechanisms) could potentially be the single most important intervention in responding to climate change. This indicator tracks the
Fossil fuel extraction
0
2
4
6
8
10
12
14
Num
ber o
f job
s (m
illio
ns)
Year2012 2013 2014 2015 2016 2017
Solar photovoltaicOther technologies
Large hydropowerBioenergy
Solar heating and coolingWind energy
Figure 23: Employment in renewable energy and fossil-fuel extraction sectors
2009 2010 2011 2012 2013 2014 2015 20160
100
200
300
400
500
600
US$
2017
(bill
ion)
Year
OilGasCoalElectricity
Figure 24: Global fossil-fuel and electricity consumption subsidies in 2009–16US$2017=based on the value of the US dollar in 2017.
**Strictly embargoed until 23.30 UK time / 6.30pm New York time
Wednesday 28th November 2018**

Review
28 www.thelancet.com Published online November 28, 2018 http://dx.doi.org/10.1016/S0140-6736(18)32594-7
extent to which carbon pricing instruments are applied around the world as a proportion of total greenhouse-gas emissions, and the weighted average carbon price instruments provided (table). The same methods and data source (the World Bank Carbon Pricing Dashboard)109 were used for this indicator as in the 2017 Lancet Countdown report,2 and are further detailed in the appendix.
The coverage of carbon pricing instruments re-mained at 13·1% of global anthropogenic greenhouse gas emissions between 2017, and 2018, implemented through 42 national and 25 subnational instruments (appendix).
The range of carbon prices across instruments remains vast (from <$1 per tonnes of CO2 equivalent in Poland and Ukraine to $139 per tCO2e in Sweden), although weighted-average prices in early 2018 were 20% higher than those of 2017 (both across instruments and total global anthropogenic greenhouse-gas emis sions). For example, the price under the EU Emissions Trading Scheme (ETS; the largest carbon pricing instrument in the world) rose by $10 per tCO2e between Dec 1, 2017, and April 1, 2018.
With the addition of instruments scheduled for implementation, including the Chinese national ETS (replacing the existing subnational pilots), around 20% of global anthropogenic greenhouse gas emissions will be subject to a carbon price.110 Further carbon pricing instruments are under consideration in several other national and subnational jurisdictions.
Indicator 4.8: use of carbon pricing revenuesHeadline finding: revenues from carbon pricing instruments increased 50% between 2016, and 2017, reaching $33 billion, with $14·5 billion allocated to further climate change mitigation activitiesIndicator 4.8 tracks the total government revenue from carbon pricing instruments and how this income is subsequently allocated. Government revenue from carbon pricing instruments can be put to a range of uses. Revenue can be invested in climate change mitigation or adaptation activities, be explicitly recycled for other purposes (eg, enabling the reduction of other taxes or levies), or simply contribute towards general government funds.
Government revenue generated from carbon pricing instruments in 2017, totalled at nearly $33 billion, a 50% increase from the $22 billion generated in 2016. This increase is driven by a combination of increasing carbon pricing coverage in 2017 (with the introduction of the Ontario, Canada, ETS and carbon taxes in Alberta, Canada, in Chile, and in Colombia), an increase in average prices, and an increasing share of ETS permits bought at auction (rather than distributed for free).110
The absolute value of allocated funds has increased in all four categories, with the proportional share remaining largely stable between 2016, and 2017. The most marked change is a shift of approximately 4% of total revenue from revenue recycling to mitigation (appendix). This is in part driven by Colombia and particularly Ontario, which have committed to allocate all revenues from their newly-introduced instruments to further mitigation action.
Data on revenue generated are provided on the World Bank’s Carbon Pricing Dashboard, with revenue allo-cation information obtained from various sources. Only instruments with revenue estimates and with revenue received by the administering authority before redis-tribution are considered. The methods and principle data source (the World Bank)109,110 for this indicator have not changed since the 2017 Lancet Countdown report,2 and are described there and in the appendix, along with further detail on the various sources used to obtain this global picture of carbon pricing revenues and data for individual instruments.
ConclusionSection 4 has presented indicators on the costs of the broader impacts of climate change and the economics and finance that underpin climate mitigation. The results of these indicators suggest that the beginning of an economic transition towards a low-carbon economy is underway, with many of the trends identified in the 2017 report2 continuing. These trends can be interpreted as early signs of a broader transformation, with important health benefits to follow, as a result of growing investment in low-carbon technology and employment, a transition away from fossil fuels, and strengthened and expanded pricing of greenhouse-gas emissions.
However, the indicators presented here also make clear that meeting the Paris Agreement commitments will require substantial further engagement from govern ments, private sector, and general public to increase the pace and scale of action.
Section 5: Public and political engagementIntroductionAs earlier sections make clear, climate change is still moving much faster than we are, and its negative effects on human health continue to multiply.111 The impact (section 1) and response (sections 2–4) sections of this
2016 2017 2018
Global emissions coverage* 12·1% 13·1% 13·1%
Weighted average carbon price of instruments (current prices in US$)
7·79 9·28 11·58
Global weighted average carbon price (current prices in US$)
0·94 1·22 1·51
*Global emissions coverage is based on 2012 total anthropogenic greenhouse-gas emissions.
Table: Carbon pricing: global coverage and weighted average prices per tonnes of CO₂ equivalent
**Strictly embargoed until 23.30 UK time / 6.30pm New York time
Wednesday 28th November 2018**
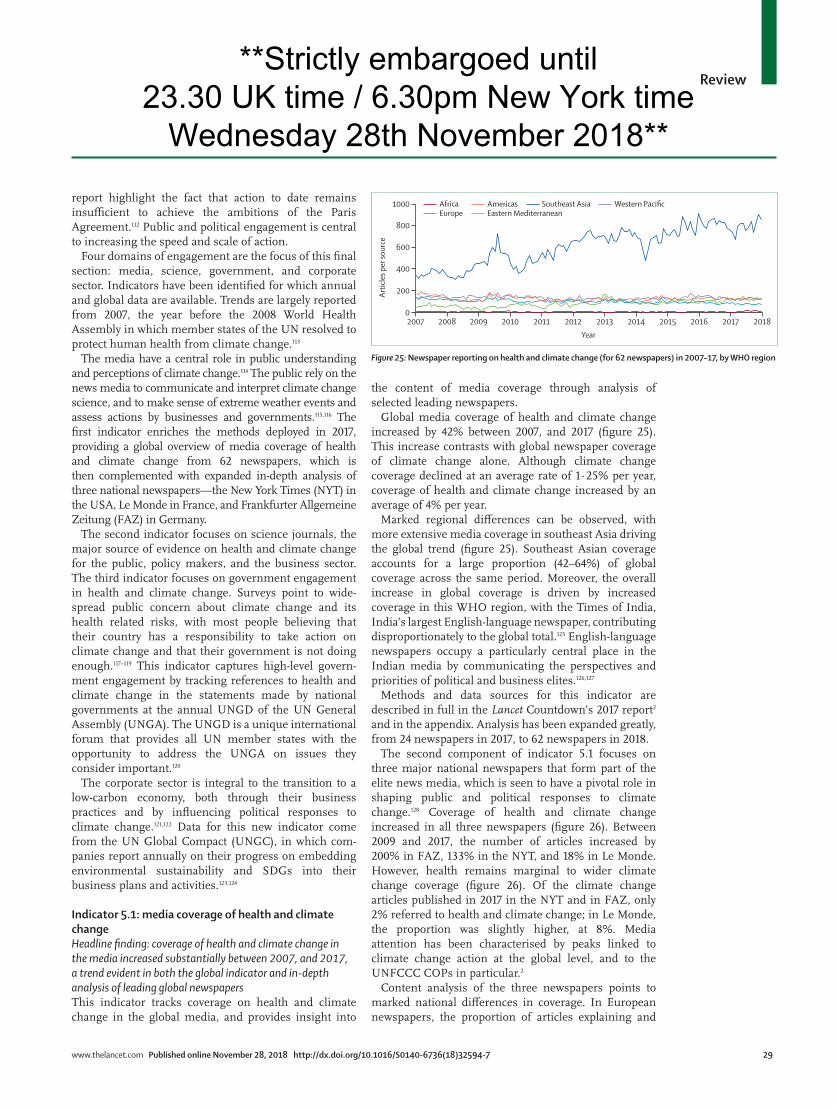
Review
www.thelancet.com Published online November 28, 2018 http://dx.doi.org/10.1016/S0140-6736(18)32594-7 29
report highlight the fact that action to date remains insufficient to achieve the ambitions of the Paris Agreement.112 Public and political engagement is central to increasing the speed and scale of action.
Four domains of engagement are the focus of this final section: media, science, government, and corporate sector. Indicators have been identified for which annual and global data are available. Trends are largely reported from 2007, the year before the 2008 World Health Assembly in which member states of the UN resolved to protect human health from climate change.113
The media have a central role in public understanding and perceptions of climate change.114 The public rely on the news media to communicate and interpret climate change science, and to make sense of extreme weather events and assess actions by businesses and govern ments.115,116 The first indicator enriches the methods deployed in 2017, providing a global overview of media coverage of health and climate change from 62 newspapers, which is then complemented with expanded in-depth analysis of three national newspapers—the New York Times (NYT) in the USA, Le Monde in France, and Frankfurter Allgemeine Zeitung (FAZ) in Germany.
The second indicator focuses on science journals, the major source of evidence on health and climate change for the public, policy makers, and the business sector. The third indicator focuses on government engagement in health and climate change. Surveys point to wide-spread public concern about climate change and its health related risks, with most people believing that their country has a responsibility to take action on climate change and that their government is not doing enough.117–119 This indicator captures high-level govern-ment engagement by tracking references to health and climate change in the statements made by national governments at the annual UNGD of the UN General Assembly (UNGA). The UNGD is a unique international forum that provides all UN member states with the opportunity to address the UNGA on issues they consider important.120
The corporate sector is integral to the transition to a low-carbon economy, both through their business practices and by influencing political responses to climate change.121,122 Data for this new indicator come from the UN Global Compact (UNGC), in which com-panies report annually on their progress on embed ding environmental sustainability and SDGs into their business plans and activities.123,124
Indicator 5.1: media coverage of health and climate changeHeadline finding: coverage of health and climate change in the media increased substantially between 2007, and 2017, a trend evident in both the global indicator and in-depth analysis of leading global newspapersThis indicator tracks coverage on health and climate change in the global media, and provides insight into
the content of media coverage through analysis of selected leading newspapers.
Global media coverage of health and climate change increased by 42% between 2007, and 2017 (figure 25). This increase contrasts with global newspaper coverage of climate change alone. Although climate change coverage declined at an average rate of 1·25% per year, coverage of health and climate change increased by an average of 4% per year.
Marked regional differences can be observed, with more extensive media coverage in southeast Asia driving the global trend (figure 25). Southeast Asian coverage accounts for a large proportion (42–64%) of global coverage across the same period. Moreover, the overall increase in global coverage is driven by increased coverage in this WHO region, with the Times of India, India’s largest English-language newspaper, contributing disproportionately to the global total.125 English-language newspapers occupy a particularly central place in the Indian media by communicating the perspectives and priorities of political and business elites.126,127
Methods and data sources for this indicator are described in full in the Lancet Countdown’s 2017 report2 and in the appendix. Analysis has been expanded greatly, from 24 newspapers in 2017, to 62 newspapers in 2018.
The second component of indicator 5.1 focuses on three major national newspapers that form part of the elite news media, which is seen to have a pivotal role in shaping public and political responses to climate change.128 Coverage of health and climate change increased in all three newspapers (figure 26). Between 2009 and 2017, the number of articles increased by 200% in FAZ, 133% in the NYT, and 18% in Le Monde. However, health remains marginal to wider climate change coverage (figure 26). Of the climate change articles published in 2017 in the NYT and in FAZ, only 2% referred to health and climate change; in Le Monde, the proportion was slightly higher, at 8%. Media attention has been characterised by peaks linked to climate change action at the global level, and to the UNFCCC COPs in particular.2
Content analysis of the three newspapers points to marked national differences in coverage. In European newspapers, the proportion of articles explaining and
2007 2008 2009 2010 2011 2012 2013 2014 2015 2016 2017 20180
200
400
600
800
1000
Artic
les p
er so
urce
Year
AfricaEastern MediterraneanEurope
Western PacificSoutheast AsiaAmericas
Figure 25: Newspaper reporting on health and climate change (for 62 newspapers) in 2007–17, by WHO region
**Strictly embargoed until 23.30 UK time / 6.30pm New York time
Wednesday 28th November 2018**

Review
30 www.thelancet.com Published online November 28, 2018 http://dx.doi.org/10.1016/S0140-6736(18)32594-7
justifying why climate change is a public health issue declined over the period from 2007 to 2017, with a parallel increase in those highlighting the health dimensions of national climate change interventions. By contrast, in the NYT, most (92%) articles referring to both health and climate did so without linking the two topics. For example, the NYT referred separately to US health-care reforms (Obamacare) and US disengage-ment from the Paris Agreement. Such articles are therefore not included among those linking health and climate change (figure 26). In European newspapers, health and climate change are most frequently covered in news sections—for example, as an environmental issue (Le Monde) and an economic issue (FAZ). However, in the NYT, health and climate change appear less frequently as news items and more frequently within the opinions section. The distinctive patterns of US media coverage of climate change have also been noted elsewhere.129
Methods and data sources are described in full in the 2017 Lancet Countdown report2 and in the appendix. The analysis has been enhanced both by the addition of a third national newspaper (the NYT) and by examining media engagement in health and climate change in the context of the wider coverage of climate change; further analyses are also presented in the appendix.
Indicator 5.2: coverage of health and climate change in scientific journalsHeadline finding: coverage of health and climate change increased by 182% in scientific journals between 2007, and 2017Between 2007, and 2017, more than 2500 scientific articles examined the links between climate change and
health. Just under half (47%) presented new research. The remainder comprised research-related articles (eg, research reviews, editorials, comments, and viewpoints), with research reviews making up the majority (55%) of these articles. The slight decline in scientific output on health and climate change between 2016, and 2017, is the result of fewer research-related publications than previously (appendix).
As in previous years, scientific interest in health and climate change in 2017 was focused on America and Europe. More than a third (35%) of the papers concentrated on climate change and health in America, with just under 30% of all papers concerned with North America only. A further 25% focused on countries in Europe. Of the 20% of articles relating to the Western Pacific region, half focused solely on China. Less than 10% of papers related to health and climate change related to Africa (n=23) and southeast Asia (n=18), a region that includes India and Bangladesh. With respect to health outcomes, infectious diseases (particularly dengue fever and other mosquito-borne diseases) were the most common health focus (24%).
Although this analysis points to increasing scientific engagement in health and climate change over the past decade, the area is marginal to climate change science. Of the 43 000 articles published in 2017 in the general area of climate change, only 4% made any link to health, and less than 1% (n=265) had a specific focus on health and climate change.
Methods and data sources are explained in full in the Lancet Countdown’s 2017 report2 and in the appendix. In addition to updating the analysis to include the date of 2017, this year’s report also explores the type of scientific output (research or research-related) and the volume of outputs relating to climate change more broadly.
Indicator 5.3: engagement in health and climate change in the UN General AssemblyHeadline finding: from 2007 to 2017, national statements in the UNGD have increasingly linked climate change and healthIn this subsection we present trends from 1970 to 2017, looking separately at references to health, climate change, and health and climate change (figure 27). Although both health and climate change have been central focuses of the UNGD for an extended period, joint references to health and climate change did not truly begin to rise until 2000. Since 2007, trends in engagement in health and climate change have broadly matched the separate trends for climate change and health.
Two spikes in engagement are apparent; in 2009–10, 20% of countries referenced health and climate change as linked issues, a sharp increase associated with the build-up to the UNFCCC’s COP15. The second, larger, spike in 2014, coincided with the transition from the Millennium Development Goals to the SDGs and the lead-up to the UNFCCC’s COP21. In that year, almost a
NYT (climate change coverage)NYT (health and climate change coverage)Le Monde (climate change coverage)Le Monde (health and climate change coverage)FAZ (climate change coverage)FAZ (health and climate change coverage)
2007 2008 2009 2010 2011 2012 2013 2014 2015 2016 20170
500
1000
1500
2000
2500
3000
3500
0
50
100
150
200
250
300
Num
ber o
f all
artic
les f
or cl
imat
e ch
ange
cove
rage
onl
y (s
olid
line
s)
Num
ber of articles for health and climate change coverage (dashed lines)
Year
Figure 26: Newspaper reporting of climate change and health and climate change in the NYT, Le Monde, and FAZ in 2007–17FAZ=Frankfurter Allgemeine Zeitung. NYT=New York Times.
**Strictly embargoed until 23.30 UK time / 6.30pm New York time
Wednesday 28th November 2018**
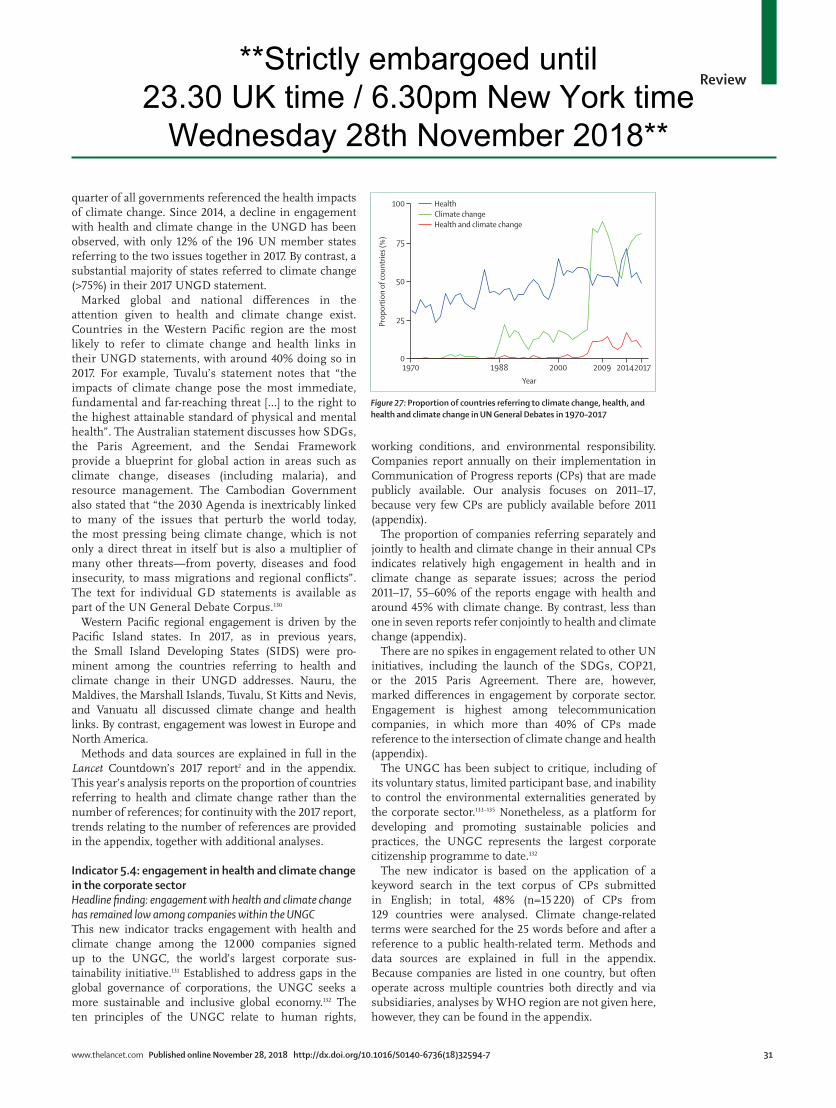
Review
www.thelancet.com Published online November 28, 2018 http://dx.doi.org/10.1016/S0140-6736(18)32594-7 31
quarter of all governments referenced the health impacts of climate change. Since 2014, a decline in engagement with health and climate change in the UNGD has been observed, with only 12% of the 196 UN member states referring to the two issues together in 2017. By contrast, a substantial majority of states referred to climate change (>75%) in their 2017 UNGD statement.
Marked global and national differences in the attention given to health and climate change exist. Countries in the Western Pacific region are the most likely to refer to climate change and health links in their UNGD state ments, with around 40% doing so in 2017. For example, Tuvalu’s statement notes that “the impacts of climate change pose the most immediate, fundamental and far-reaching threat […] to the right to the highest attainable standard of physical and mental health”. The Australian statement discusses how SDGs, the Paris Agreement, and the Sendai Framework provide a blueprint for global action in areas such as climate change, diseases (including malaria), and resource management. The Cambodian Government also stated that “the 2030 Agenda is inextricably linked to many of the issues that perturb the world today, the most pressing being climate change, which is not only a direct threat in itself but is also a multiplier of many other threats—from poverty, diseases and food insecurity, to mass migrations and regional conflicts”. The text for individual GD statements is available as part of the UN General Debate Corpus.130
Western Pacific regional engagement is driven by the Pacific Island states. In 2017, as in previous years, the Small Island Developing States (SIDS) were pro-minent among the countries referring to health and climate change in their UNGD addresses. Nauru, the Maldives, the Marshall Islands, Tuvalu, St Kitts and Nevis, and Vanuatu all discussed climate change and health links. By contrast, engagement was lowest in Europe and North America.
Methods and data sources are explained in full in the Lancet Countdown’s 2017 report2 and in the appendix. This year’s analysis reports on the proportion of countries referring to health and climate change rather than the number of references; for continuity with the 2017 report, trends relating to the number of references are provided in the appendix, together with additional analyses.
Indicator 5.4: engagement in health and climate change in the corporate sectorHeadline finding: engagement with health and climate change has remained low among companies within the UNGCThis new indicator tracks engagement with health and climate change among the 12 000 companies signed up to the UNGC, the world’s largest corporate sus-tainability initiative.131 Established to address gaps in the global governance of corporations, the UNGC seeks a more sustainable and inclusive global economy.132 The ten principles of the UNGC relate to human rights,
working conditions, and environmental responsibility. Companies report annually on their implementation in Communication of Progress reports (CPs) that are made publicly available. Our analysis focuses on 2011–17, because very few CPs are publicly available before 2011 (appendix).
The proportion of companies referring separately and jointly to health and climate change in their annual CPs indicates relatively high engagement in health and in climate change as separate issues; across the period 2011–17, 55–60% of the reports engage with health and around 45% with climate change. By contrast, less than one in seven reports refer conjointly to health and climate change (appendix).
There are no spikes in engagement related to other UN initiatives, including the launch of the SDGs, COP21, or the 2015 Paris Agreement. There are, however, marked differences in engagement by corporate sector. Engagement is highest among telecommunication companies, in which more than 40% of CPs made reference to the intersection of climate change and health (appendix).
The UNGC has been subject to critique, including of its voluntary status, limited participant base, and inability to control the environmental externalities generated by the corporate sector.133–135 Nonetheless, as a platform for developing and promoting sustainable policies and practices, the UNGC represents the largest corporate citizenship programme to date.132
The new indicator is based on the application of a keyword search in the text corpus of CPs submitted in English; in total, 48% (n=15 220) of CPs from 129 countries were analysed. Climate change-related terms were searched for the 25 words before and after a reference to a public health-related term. Methods and data sources are explained in full in the appendix. Because companies are listed in one country, but often operate across multiple countries both directly and via subsidiaries, analyses by WHO region are not given here, however, they can be found in the appendix.
1970 1988 2000 2009 201420170
25
50
75
100
Prop
ortio
n of
coun
trie
s (%
)Year
HealthClimate changeHealth and climate change
Figure 27: Proportion of countries referring to climate change, health, and health and climate change in UN General Debates in 1970–2017
**Strictly embargoed until 23.30 UK time / 6.30pm New York time
Wednesday 28th November 2018**

Review
32 www.thelancet.com Published online November 28, 2018 http://dx.doi.org/10.1016/S0140-6736(18)32594-7
ConclusionSection 5 of this report has presented indicators of public and political engagement, which are crucial to trans-formational action on climate change. The barriers to action on health and climate change are predominantly societal and not technical, with public and political engagement therefore holding the key to accelerating the pace and scale of action.1 Three conclusions can be drawn from this analysis of engagement in the media, science, UN, and corporate sector.
First, engagement in health and climate change has increased in the media, science, and the UNGD over the past decade. The upward trend underlines the role of the UN, particularly through the UNFCCC and its COPs, in mobilising engagement. For example, spikes in the indicators around COP15 (2009) and COP21 (2015) were observed. The years that follow tend to see a decline in engagement. The exception to this broad pattern is the corporate sector, in which evidence for companies within the UNGC points to little change in engagement in health and climate change.
Second, although overall engagement has increased over the past decade, engagement remains partial and uneven. Rather than reflecting a process of global mobilisation, the upward trend is being driven by individual regions and countries. The increase in global media attention is the result of increased coverage by newspapers in southeast Asia and by the Indian press in particular. With respect to political engagement, SIDS are using the global platform of the UNGD to draw attention to the health impacts of climate change. Within the scientific domain, overall trends again reflect uneven engagement. In this domain, however, increased engagement has been driven by research focusing on health and climate change in high-income and high-emitting countries. By contrast, very few studies focus on Africa and southeast Asia, regions bearing the brunt of the health impacts of climate change.
Third, although engagement in health and climate change has increased over the past year, this engagement represents a very small part of public and political engagement in climate change. Across the media, science, government, and the corporate sector, climate change is being framed in ways that largely ignore its health dimensions. Thus, analyses of national news-papers and scientific journals indicate that less than 5% of climate change coverage relates to health. Analysis of the intergovernmental forum of the UNGD suggests that climate change and health are largely represented as separate issues, with much less attention given to them as interconnected phenomena. Similarly, a high pro-portion of companies within the UNGC refer separately to health and climate change in their annual reports; however, only a small minority make links between health and climate change.
Taken together, these conclusions point to increasing engagement in the health impacts of climate change,
and to the challenge of making health central to climate change action.
Conclusion: the Lancet Countdown in 2018The Lancet Countdown: tracking progress on health and climate change monitors progress on health and climate change across five domains: climate change impacts, exposures, and vulnerabilities; adaptation, planning, and resilience for health; mitigation actions and health co-benefits; finance and economics; and public and political engagement. The collaboration is committed to an iterative and open process, and will continue to develop the methods and data sources its indicators draw on, publishing annually in The Lancet through to 2030.
In 2018, many of the global trends previously identified accelerated, both in terms of the health impacts of climate change, and the mitigation and adaptation interventions being implemented around the world. The first section of the report made clear that vulnerable populations are continually exposed to more severe climate hazards, with indicators reporting 157 million heatwave exposure events for such groups in 2017, more than 153 billion hours of labour lost due to rising temperatures, and that climatic conditions are at their most suitable for the transmission of dengue fever virus since 1950. Section 2 explored the various ways in which ministries of health, cities, and health systems are planning to enhance resilience and adaptation, providing more detailed insight into the quality and compre hensiveness of these strategies, and highlighted the fact that only 3·8% of adaptation funds available for development were allocated specifically for public health. Although more than 2·9 million premature deaths were caused by ambient pollution from PM2·5 globally in 2015, promising trends reported in sections 3 and 4 showed a continued phase-out of coal-fired power, accelerated deployment of renewable energy, and continued divestment from fossil fuels, which should help to reduce premature mortality from air pollution. Indicators in the final section pointed to the same conclusions—that engagement in health and climate change is increasing, enabling this engagement to be an important driver of policy change globally.
Four key messages emerge from the 41 indicators of the Lancet Countdown’s 2018 report. First, present day changes in labour capacity, vector-borne disease, and food security provide early warning of compounded and overwhelming impacts expected if temperature continues to rise. Trends in climate change impacts, exposures, and vulnerabilities show an unacceptably high risk for the current and future health of populations across the world. Second, slow progress in reducing emissions and building adaptive capacity threatens both human lives and the viability of the national health systems they depend on, with the potential to disrupt core public-health infrastructure and overwhelm health services. Third, despite these delays, trends in a number of sectors are helping to generate the beginning of a low-carbon
**Strictly embargoed until 23.30 UK time / 6.30pm New York time
Wednesday 28th November 2018**

Review
www.thelancet.com Published online November 28, 2018 http://dx.doi.org/10.1016/S0140-6736(18)32594-7 33
transition, and clearly the nature and scale of the response to climate change will be the determining factor in shaping the health of nations for centuries to come. And fourth, ensuring a widespread understanding of climate change as a central public-health issue will be vital in delivering an accelerated response, with the health profession beginning to rise to this challenge.
Taken as a whole, the indicators and data presented in the Lancet Countdown’s 2018 report provide great cause for concern, with the pace of climate change outweighing the urgency of the response. Despite this concerning trend, exciting trends in key areas for health, including the phase-out of coal, the deployment of healthier, cleaner modes of transport, and health system adaptation, give justification for cautious optimism.
Regardless, the way in which these indicators of impact and response progress up until 2030 will clearly shape the health of nations for centuries to come. ContributorsThe Lancet Countdown: tracking progress on health and climate change is an international academic collaboration that builds off the work of the 2015 Lancet Commission on health and climate change, convened by The Lancet. The Lancet Countdown’s work for this report was conducted by its five working groups, each of which were responsible for the design, drafting, and review of their individual indicators and sections. All authors contributed to the overall structure and concepts of the report and provided input and expertise to the relevant sections. Authors contributing to Working Group 1 included Nigel Arnell, Helen Berry, Jonathan Chambers, Ilan Kelman, Tord Kjellstrom, Bruno Lemke, Lu Liang, Rachel Lowe, Jaime Martinez-Urtaza, Maziar Moradi-Lakeh, Kris Murray, Fereidoon Owfi, Mahnaz Rabbaniha, Elizabeth Robinson, Jan C Semenza, Meisam Tabatabaei, and Joaquin Trinanes. Authors contributing to Working Group 2 included Sonja Ayeb-Karlsson, Peter Byass, Diarmid Campbell-Lendrum, Paula Dominguez-Salas, Kristie L Ebi, Lucia Fernandez Montoya, Lucien Georgeson, Delia Grace, Jeremy Hess, Dominic Kniveton, Maquins Odhiambo Sewe, Mark Maslin, Maria Nilsson, Tara Neville, Karyn Morrissey, Joacim Rocklöv, and Joy Shumake-Guillemot. Authors contributing to Working Group 3 included Markus Amann, Kristine Belesova, Michael Davies, Ian Hamilton, Stella Hartinger, Gregor Kiesewetter, Melissa Lott, James Milner, Tadj Oreszczyn, David Pencheon, Steve Pye, Rebecca Steinbach, Julia Tomei, and Paul Wilkinson. Authors contributing to Working Group 4 included Paul Drummond and Paul Ekins. Authors Contributing to Working Group 5 included Maxwell Boykoff, Meaghan Daly, Niheer Dasandi, Anneliese Depoux, Helen Fischer, Hilary Graham, Rébecca Grojsman, Lucy McAllister, Slava Mikhaylov, Olivia Pearman, Olivia Saxer, and Stefanie Schütte. Additional technical input and support was provided by Timothy Bouley and Wenjia Cai. The coordination, strategic direction, and editorial support for this Review was provided by Anthony Costello (Co-Chair), Hugh Montgomery (Co-Chair), Peng Gong (Co-Chair), Nick Watts (Executive Director), and Nicola Wheeler. The findings and conclusions in this Review are those of the authors and do not necessarily represent the official position of WHO, the World Bank, or the World Meteorological Organization.
Declarations of interestThe Lancet Countdown’s work is supported by an unrestricted grant from the Wellcome Trust (200890/Z/16/Z). The Lancet Countdown covered travel costs for meetings related to the development of the paper. Six of the authors (NWa, NWh, ML, PD, JC, and KB) were compensated for their time while working on the drafting and development of the Lancet Countdown’s report. HM is a board member of the UK Climate and Health Council and has a patent particulate pollution mask pending (no competing interest). NA, MD, HF, JT, and PW respectively received separate grants from: the UK Foreign and Commonwealth Government; the Wellcome Trust; the Heidelberg University Excellence Initiative, Institutional Strategy ZUK 5.4; the National Oceanic and Atmospheric
Administration’s OceanWatch and Atlantic Oceanographic and Meteorological Laboratory; and the Wellcome Trust and National Environment Research Council. All other authors declare no competing interests.
References1 Watts N, Adger WN, Agnolucci P, et al. Health and climate change:
policy responses to protect public health. Lancet 2015; 386: 1861–914.2 Watts N, Amann M, Ayeb-Karlsson S, et al. The Lancet Countdown
on health and climate change: from 25 years of inaction to a global transformation for public health. Lancet 2018; 391: 581−630.
3 Smith KR, Woodward A, Campbell-Lendrum D, et al. Human health: impacts, adaptation, and co-benefits. In: Field CB, Barros VR, Dokken DJ, et al, eds. Climate change 2014: impacts, adaptation, and vulnerability part a: global and sectoral aspects contribution of working group ii to the fifth assessment report of the intergovernmental panel of climate change. Cambridge and New York: Cambridge University Press, 2014: 709−54.
4 The New Climate Economy. Better growth, better climate: the new climate economy report. The synthesis report. 2015. https://newclimateeconomy.report/2016/wp-content/uploads/sites/2/2014/08/BetterGrowth-BetterClimate_NCE_Synthesis-Report_web.pdf (accessed June 20, 2018).
5 Rydin Y, Bleahu A, Davies M, et al. Shaping cities for health: complexity and the planning of urban environments in the 21st century. Lancet 2012; 379: 2079−108.
6 Whitmee S, Haines A, Beyrer C, et al. Safeguarding human health in the Anthropocene epoch: report of The Rockefeller Foundation–Lancet Commission on planetary health. Lancet 2015; 386: 1973–2028.
7 EAT. EAT-Lancet Commission on health diets from sustainable food systems. Lancet (in press).
8 Navi M, Hansen A, Nitschke M, Hanson-Easey S, Pisaniello D. Developing health-related indicators of climate change: Australian stakeholder perspectives. Int J Environ Res Public Health 2017; 14: 552.
9 Watts N, Adger WN, Ayeb-Karlsson S, et al. The Lancet Countdown: tracking progress on health and climate change. Lancet 2017; 389: 1151–64.
10 Kenny G, Yardley J, Brown C, Sigal R, Jay O. Heat stress in older individuals and patients with common chronic diseases. CMAJ 2010; 182: 1053−60.
11 Kjellstrom T, Butler A, Lucas R, Bonita R. Public health impact of global heating due to climate change: potential effects on chronic non-communicable diseases. Int J Public Health Res 2010; 55: 97–103.
12 Anderson G, Dominici F, Wang Y, McCormack M, Bell M, Peng R. Heat-related emergency hospitalizations for respiratory diseases in the medicare population. Am J Respir Crit Care Med 2013; 187: 1098–103.
13 Global Health Data Exchange. Global burden of disease study 2015 (GBD 2015) results. 2016. http://ghdx.healthdata.org/gbd-2015 (accessed May 30, 2018).
14 European Centre for Medium-Range Weather Forecasts. Climate reanalysis. 2017. https://www.ecmwf.int/en/research/climate-reanalysis (accessed May 20, 2018).
15 Kjellstrom T, Freyberg C, Lemke B, Otto M, Briggs D. Estimating population heat exposure and impacts on working people in conjunction with climate change. Int J Biometeorol 2017; 62: 291−306.
16 Shiferaw B, Tesfaye K, Menale K, Abate T, Prasanna B, Menkir A. Managing vulnerability to drought and enhancing livelihood resilience in sub-Saharan Africa: technological, institutional and policy options. Weather Clim Extrem 2014; 3: 67−79.
17 Wilhite D, Glantz M. Understanding: the drought phenomenon: the role of definitions. Water Int 1985; 10: 111−20.
18 World Meteorological Organization. Standardized Precipitation Index user guide. J Clim 2012; 21: 1333−48.
19 Mckee T, Doesken N, Kleist J. The relationship of drought frequency and duration to time scales. American Meteorological Society Eighth Conference on Applied Climatology; Anaheim, CA, USA; Jan 17–22, 1993. 179–84.
20 Climate Research Unit. CRU data. http://www.cru.uea.ac.uk/data (accessed May 26, 2018).21 Raes D. College on Soil Physics—30th anniversary (1983–2013).
Frequency analysis of rainfall data. Leuven: International Centre for Theoretical Physics, 2013.
**Strictly embargoed until 23.30 UK time / 6.30pm New York time
Wednesday 28th November 2018**

Review
34 www.thelancet.com Published online November 28, 2018 http://dx.doi.org/10.1016/S0140-6736(18)32594-7
22 Zhong S, Yang L, Toloo S, et al. The long-term physical and psychological health impacts of flooding: a systematic mapping. Sci Total Environ 2018; 1: 165−94.
23 Du W, FitzGerald G, Clark M, Hou X. Health impacts of floods. Prehosp Disaster Med 2010; 25: 265−72.
24 Emergency Events Database. The international disaster database—Centre for Research on the Epidemiology of Disasters. 2018. https://www.emdat.be/database (accessed May 1, 2018).
25 Wang H, Tang X, Su Y, Chen J, Yan J. Characterization of clinical Vibrio parahaemolyticus strains in Zhoushan, China, from 2013 to 2014. PLoS One 2017; 12: e0180335.
26 Martinez-Urtaza J, Trinanes J, Abanto M, et al. Epidemic dynamics of Vibrio parahaemolyticus illness in a hotspot of disease emergence, Galicia, Spain. Emerg Infect Dis 2018; 24: 852−59.
27 Martinez-Urtaza J, van Aerle R, Abanto M, et al. Genomic variation and evolution of Vibrio parahaemolyticus ST36 over the course of a transcontinental epidemic expansion. MBio 2017; 8: e01425–17.
28 FAO, IFAD, UNICEF, WFP, WHO. The state of food security and nutrition in the world 2017. Building resilience for peace and food security. Rome: FAO, 2017.
29 Leathers HD, Foster P. The world food problem: tackling the causes of undernutrition in the third world (third edition). Boulder: Lynne Rienner Publishers, 2004.
30 UN World Food Programme. Climate impacts on food security. 2018. https://www.wfp.org/climate-change/climate-impacts (accessed May 16, 2018).
31 Wheeler T, von Braun J. Climate change impacts on global food security. Science 2013; 341: 508−13.
32 Hatfield J, Prueger J. Temperature extremes: effect on plant growth and development. Weather Clim Extrem 2015; 10: 4−10.
33 Finger R. Food security: close crop yield gap. Nature 2011; 480: 39.34 Food and Agriculture Organization of the UN. Food balance sheets.
2017. http://www.fao.org/faostat/en/#data/FBS (accessed June 1, 2018).
35 NASA. NEO NASA earth observatory. Sea surface temperature (1 month – AQUA/MODIS). 2017. https://neo.sci.gsfc.nasa.gov/view.php?datasetId=MYD28M (accessed May 5, 2018).
36 US Environmental Protection Agency. Climate change indicators: sea surface temperature. 2015. https://www.epa.gov/climate-indicators/climate-change-indicators-sea-surface-temperature (accessed May 5, 2018).
37 Padhy SK, Sarkar S, Panigrahi M, Paul S. Mental health effects of climate change. Indian J Occup Environ Med 2015; 19: 3−7.
38 Majeed H, Lee J. The impact of climate change on youth depression and mental health. Lancet Planet Health 2017; 1: e94–95.
39 Williams MN, Hill SR, Spicer J. Do hotter temperatures increase the incidence of self-harm hospitalisations? Psychol Health Med 2015; 21: 226−35.
40 Nitschke M, Tucker GR, Bi P. Morbidity and mortality during heatwaves in metropolitan Adelaide. Med J Aust 2007; 187: 662−65.
41 Qi X, Hu W, Mengersen K, Tong S. Socio-environmental drivers and suicide in Australia: Bayesian spatial analysis. BMC Public Health 2014; 14: 681.
42 Carleton TA. Crop-damaging temperatures increase suicide rates in India. Proc Natl Acad Sci USA 2017; 114: 8746−51.
43 Berry HL, Waite TD, Dear KBG, Capon AG, Murray V. The case for systems thinking about climate change and mental health. Nat Clim Change 2018; 8: 282−90.
44 Zhang Y, Beggs PJ, Bambrick H, et al. The MJA-Lancet Countdown on health and climate change: policy inaction in a vulnerable high-income country threatens Australian lives. Med J Aust (in press).
45 UN. Resolution adopted by the General Assembly on 25 September 2015. http://www.un.org/ga/search/view_doc.asp?symbol=A/RES/70/1&Lang=E (accessed April 1, 2018).
46 WHO. Global health observatory (GHO) data. IHR core capacities implementation status: surveillance. 2018. http://www.who.int/gho/ihr/monitoring/surveillance/en/ (accessed May 15, 2018).
47 WHO. IHR core capacity monitoring framework: questionnaire for monitoring progress in the implementation of IHR core capacities in states parties. Geneva: World Health Organization, 2016.
48 WHO. Global health observatory (GHO) data. IHR core capacities implementation status: human resources. 2018. http://www.who.int/gho/ihr/monitoring/human_resources/en/ (accessed May 15, 2018).
49 WHO. Global health observatory (GHO) data. IHR core capacities implementation status: preparedness. 2018. http://www.who.int/gho/ihr/monitoring/preparedness/en/ (accessed May 15, 2018).
50 WHO. Global health observatory (GHO) data. IHR core capacities implementation status: response. 2018. http://www.who.int/gho/ihr/monitoring/response/en/ (accessed May 15, 2018).
51 WHO. International health regulations (2005) monitoring framework. 2018. http://www.who.int/gho/ihr/en/ (accessed May 16, 2018).
52 World Meteorological Organization. Country profile database. 2018. https://www.wmo.int/cpdb/ (accessed May 27, 2018).
53 WHO. Protecting health from climate change: vulnerability and adaptation assessment. Geneva: World Health Organization, 2013.
54 Georgeson L, Maslin M, Poessinouw M. Global disparity in the supply of commercial weather and climate information services. Sci Adv 2017; 3: e1602632.
55 The World Bank. World Bank country and lending groups. 2017. https://datahelpdesk.worldbank.org/knowledgebase/articles/906519-world-bank-country-and-lending-groups (accessed June 2, 2018).
56 Climate Funds Update. Climate funds update: the data. 2017. http://www.climatefundsupdate.org/. https://climatefundsupdate.org/data-dashboard/ (accessed April 1, 2018).
57 UN Framework Convention on Change. Cancun agreements. 2018. https://unfccc.int/process/conferences/pastconferences/cancun-climate-change-conference-november-2010/statements-and-resources/Agreements (accessed May 16, 2018).
58 International Energy Agency. World energy outlook 2017. https://www.iea.org/weo2017/ (accessed May 1, 2018).
59 Green F, Denniss R. Cutting with both arms of the scissors: the economic and political case for restrictive supply-side climate policies. Clim Change 2018; 150: 73−87.
60 Rogelj J, Popp A, Calvin KV, et al. Scenarios towards limiting global mean temperature increase below 1.5°C. Nat Clim Change 2018; 8: 325−32.
61 Tollefson J. Can the world kick its fossil-fuel addiction fast enough? Nat Clim Change 2018; 556: 422–25.
62 BP. June 2018 BP statistical review of world energy. 67th edition. 2018. https://www.bp.com/content/dam/bp/en/corporate/pdf/energy-economics/statistical-review/bp-stats-review-2018-full-report.pdf (accessed May 9, 2018).
63 Li M, Zhang D, Li C-T, Mulvaney KM, Selin NE, Karplus VJ. Air quality co-benefits of carbon pricing in China. Nat Clim Change 2018; 8: 398−403.
64 Williams ML, Lott MC, Kitwiroon N, et al. The Lancet Countdown on health benefits from the UK Climate Change Act: a modelling study for Great Britain. Lancet Planet Health 2018; 2: e202−13.
65 International Renewable Energy Agency. Renewable power generation costs in 2017. Abu Dhabi: International Renewable Energy Agency, 2018.
66 Mahapatra S. New solar projects in India are cheaper than 92% of all thermal power plants in the country. 2017. https://cleantechnica.com/2017/05/25/new-solar-projects-india-cheaper-92-thermal-power-plants-country/ (accessed April 26, 2018).
67 BEIS. Department for Business, Energy and Industrial Strategy (BEIS): powering past coal alliance declaration, 2017. https://assets.publishing.service.gov.uk/government/uploads/system/uploads/attachment_data/file/740899/powering-past-coal-declaration.pdf (accessed June 19, 2018).
68 UN Framework Convention on Climate Change. More than 20 countries launch global alliance to phase out coal. 2017. https://unfccc.int/news/more-than-20-countries-launch-global-alliance-to-phase-out-coal (accessed June 18, 2018).
69 UN Framework Convention on Climate Change. Nationally determined contributions (NDCs): the Paris Agreement and NDCs. 2018. https://unfccc.int/process-and-meetings/the-paris-agreement/nationally-determined-contributions-ndcs (accessed June 18, 2018).
70 CoalSwarm. Global coal plant tracker. 2018. https://endcoal.org/global-coal-plant-tracker/ (accessed April 26, 2018).
71 International Energy Agency, International Renewable Energy Agency. Perspectives for the energy transition: investment needs for a low-carbon energy system. 2017. http://www.irena.org/-/media/Files/IRENA/Agency/Publication/2017/Mar/Perspectives_for_the_Energy_Transition_2017.pdf?la=en&hash=56436956B74DBD22A9C6309ED76E3924A879D0C7 (accessed May 1, 2018).
**Strictly embargoed until 23.30 UK time / 6.30pm New York time
Wednesday 28th November 2018**

Review
www.thelancet.com Published online November 28, 2018 http://dx.doi.org/10.1016/S0140-6736(18)32594-7 35
72 Fuso-Nerini F, Tomei J, To LS, et al. Mapping synergies and trade-offs between energy and the sustainable development goals. Nat Energy 2018; 3: 10−15.
73 WHO. Burden of disease from household air pollution for 2016. Geneva: World Health Organization, 2018.
74 International Energy Agency. Energy access outlook 2017: from poverty to prosperity. Paris: International Energy Agency, 2017.
75 WHO. Ambient air pollution: health impacts. 2018. http://www.who.int/airpollution/ambient/health-impacts/en/ (accessed June 18, 2018).
76 Shaddick G, Thomas ML, Green A, et al. Data integration model for air quality: a hierarchical approach to the global estimation of exposures to ambient air pollution. J R Stat Soc Ser C Appl Stat 2018; 67: 231−53.
77 Milner J, Taylor J, Barreto M, et al. Environmental risks of cities in the European region: analyses of the Sustainable Healthy Urban Environments (SHUE) database. Pub Health Panorama 2017; 3: 141–356.
78 WHO. WHO global ambient air quality database (update 2018). http://www.who.int/airpollution/data/cities/en/ (accessed May 25, 2018).
79 Cohen AJ, Brauer M, Burnett R, et al. Estimates and 25-year trends of the global burden of disease attributable to ambient air pollution: an analysis of data from the Global Burden of Diseases Study 2015. Lancet 2017; 389: 1907−18.
80 Amann M, Bertok I, Borken-Kleefeld J, et al. Cost-effective control of air quality and greenhouse gases in Europe: modeling and policy applications. Environ Model Softw 2011; 26: 1489–501.
81 International Energy Agency. World energy outlook 2017. https://www.iea.org/weo2017/ (accessed April 1, 2018).
82 International Energy Agency. Energy and air pollution: world energy outlook special report. Paris: International Energy Agency, 2016.
83 International Energy Agency. World Energy Balances. 2017. https://www.iea.org/publications/freepublications/publication/WorldEnergyBalances2017Overview.pdf (accessed May 1, 2018).
84 World Bank. Population, total. 2017. https://data.worldbank.org/indicator/SP.POP.TOTL (accessed May 16, 2018).
85 International Energy Agency. Global EV outlook 2016: beyond one million electric cars. Paris: International Energy Agency, 2016.
86 International Energy Agency. Global EV outlook 2017: towards cross-modal electrification. Paris: International Energy Agency, 2016.
87 International Energy Agency. Global EV outlook 2017: two million and counting. Paris: International Energy Agency, 2017.
88 Milner J, Taylor J, Barreto ML, et al. Environmental risks of cities in the European region: analyses of the Sustainable Healthy Urban Environments (SHUE) database. Pub Health Panorama 2017; 3: 300−09.
89 Stewart G, Anokye NK, Pokhrel S. What interventions increase commuter cycling? A systematic review. BMJ Open 2015; 5: e007945.
90 Pucher J, Buehler R. Making cycling irresistible: lessons from the Netherlands, Denmark and Germany. Transport Rev 2008; 28: 495−528.
91 Herrero M, Henderson B, Havlik P, et al. Greenhouse gas mitigation potentials in the livestock sector. Nat Clim Change 2016; 6: 452−61.
92 Bouvard V, Loomis D, Guyton KZ, et al. Carcinogenicity of consumption of red and processed meat. Lancet Oncol 2015; 16: 1599−600.
93 NHS Sustainable Development Unit. NHS carbon footprint. 2016. https://www.sduhealth.org.uk/policy-strategy/reporting/nhs-carbon-footprint.aspx (accessed June 3, 2018).
94 Malik A, Lenzen M, McALister S, McGain F. The carbon footprint of Australian health care. Lancet Planet Health 2018; 2: e27−35.
95 Eckelman M, Sherman J. Estimated global disease burden from US health care sector greenhouse gas emissions. Am J Public Health 2017; 108: S120–22.
96 Markandya A, Sampedro J, Smith SJ, et al. Health co-benefits from air pollution and mitigation costs of the Paris Agreement: a modelling study. Lancet Planet Health 2018; 2: e126−33.
97 Munich Re. NatCatSERVICE. 2017. https://www.munichre.com/en/reinsurance/business/non-life/natcatservice/index.html (accessed May 17, 2018).
98 International Energy Agency. World energy investment 2016. Paris: International Energy Agency, 2016.
99 International Energy Agency. World energy investment 2017. Paris: International Energy Agency, 2017.
100 International Energy Agency. World energy investment 2018. Paris: International Energy Agency, 2018.
101 International Energy Agency. World energy investment outlook. Paris: International Energy Agency, 2014.
102 IBIS World. IBIS World industry report: global oil & gas exploration & production. Los Angeles: IBIS World, 2018.
103 International Energy Agency. Tracking clean energy progress 2017. Paris: International Energy Agency, 2017.
104 IBIS World. IBIS World industry report: global coal mining. Los Angeles: IBIS World, 2017.
105 International Renewable Energy Agency. Renewable energy and jobs: annual review 2018. Abu Dhabi: International Renewable Energy Agency, 2018.
106 Hanman R. Divestment from fossil fuels should be linked with active engagement. 2016. https://theconversation.com/divestment-from-fossil-fuels-should-be-linked-with-active-engagement-59990 (accessed April 28, 2018).
107 del Granado JA, Coady D, Gillingham R. The unequal benefits of fuel subsidies: a review of evidence for developing countries. Paris: International Monetary Fund, 2010.
108 Verme P. Subsidy reforms in the Middle East and North Africa region: a review. 2016. http://documents.worldbank.org/curated/en/212631469021941386/pdf/WPS7754.pdf (accessed May 1, 2018).
109 World Bank. Carbon pricing dashboard. 2017. http://carbonpricingdashboard.worldbank.org (accessed June 6, 2017).
110 World Bank. State and trends of carbon pricing 2018. Washington DC: World Bank, 2018.
111 UN Secretary General. Secretary-general’s press encounter on climate change [with Q&A]. March 29, 2018. https://www.un.org/sg/en/content/sg/press-encounter/2018-03-29/secretary-generals-press-encounter-climate-change-qa (accessed May 1, 2018).
112 Schleussner C-F, Rogelj J, Schaeffer M, et al. Science and policy characteristics of the Paris Agreement temperature goal. Nat Clim Change 2016; 6: 827−35.
113 World Health Assembly. Sixty-first World Health Assembly. Geneva: World Health Organization, 2008.
114 Ryghaug M, Holtan Sørensen K, Næss R. Making sense of global warming: Norwegians appropriating knowledge of anthropogenic climate change. Public Underst Sci 2011; 20: 778−95.
115 Boykoff MT, Roberts JT. Media coverage of climate change: current trends, strengths, weaknesses. New York: UNDP, 2007.
116 Happer C, Philo G. New approaches to understanding the role of the news media in the formation of public attitudes and behaviours on climate change. Eur J Commun 2016; 31: 136−51.
117 World Bank. Public attitudes toward climate change: findings from a multi-country poll. Washington DC: World Bank, 2009.
118 Pew Research Center. Global Concern about Climate Change. 2015. http://www.pewglobal.org/2015/11/05/global-concern-about-climate-change-broad-support-for-limiting-emissions/ (accessed June 2, 2018).
119 Yale Program on Climate Change Communication. Public climate change awareness and climate change communication in China. http://climatecommunication.yale.edu/wp-content/uploads/2016/02/2012_11_Public-Climate-Change-Awareness-and-Climate-Change-Communication-in-China.pdf (accessed May 17, 2018).
120 Smith C. Politics and process at the United Nations: the global dance. Boulder: Lynne Rienner, 2006.
121 Jeswani H, Wehrmeyer W, Mulugetta Y. How warm is the corporate response to climate change? Evidence from Pakistan and the UK. Bus Strategy Environ 2008; 17: 46−60.
122 Wright C, Nyberg D. Climate change, capitalism, and corporations: processes of creative self-destruction. Cambridge: Cambridge University Press, 2015.
123 McIntosh M, Waddock S, Kell G. Learning to talk: corporate citizenship and the development of the UN Global Compact. Sheffield: Greenleaf, 2004.
124 Cetindamar D. Corporate social responsibility practices and environmentally responsible behavior: the case of the United Nations Global Compact. J Bus Ethics 2007; 76: 163−76.
**Strictly embargoed until 23.30 UK time / 6.30pm New York time
Wednesday 28th November 2018**

Review
36 www.thelancet.com Published online November 28, 2018 http://dx.doi.org/10.1016/S0140-6736(18)32594-7
125 Audit Bureau of Circulations.Highest circulated amongst ABC membre publications (across languages). http://www.auditbureau.org/files/Highest%20Circulated%20amongst%20ABC%20Member%20Publications%20(across%20languages).pdf 2016 (accessed May 4, 2018).
126 Nagarathinam S, Bhatta A. Coverage of climate change issues in Indian newspapers and policy implications. Curr Sci 2015; 108: 1972−73.
127 Billett S. Dividing climate change: global warming in the Indian mass media. Clim Change 2010; 99: 1−16.
128 Boykoff M, Luedecke G. Elite news coverage of climate change. Oxford Res Encyclopedia Clim Sci 2016; published online December. DOI:10.1093/acrefore/9780190228620.013.357 (preprint).
129 Park DJ. United States news media and climate change in the era of US President Trump. Integr Environ Assess Manag 2018; 14: 202−04.
130 Baturo A, Dasandi N, Mikhaylov S. Understanding state preferences with test as data: introducing the UN General Debate Corpus. Res Polit 2017; 4: 2053168017712821.
131 UN Global Compact. UN Global Compact participation 2018. https://www.unglobalcompact.org/interactive (accessed June 1, 2018).
132 UN Global Compact. Corporate sustainability in the world economy. New York: UN Global Compact, 2008.
133 Nason RW. Structuring the global marketplace: the impact of the United Nations Global Compact. J Macromarketing 2008; 28: 8−25.
134 Rasche A, Woodcock S, McIntosh M. The United Nations Global Compact: retrospect and prospect. Bus Soc 2012; 52: 6−30.
135 Voegtlin C, Pless NM. Global governance: CSR and the role of the UN Global Compact. J Bus Ethics 2014; 122: 179−91.
© 2018 Elsevier Ltd. All rights reserved.
**Strictly embargoed until 23.30 UK time / 6.30pm New York time
Wednesday 28th November 2018**