Embed Size (px)
Citation preview
00-4
Planning
Report
The Economic Impacts
of
NIST Cholesterol S
tandards
Program
Prepared by:
TASC, Inc.
for
National In
stitute of
Standards & Tech
nology
Program Office
Strategic
Planning and
Economic
Analysis
Group
September 2000
U.S Department of CommerceTechnology Administration
The Economic Impacts of NIST’S Cholesterol Standards Program
September 2000
Prepared for:
The National Institute of Standards and Technology Program Office
Strategic Planning and Economic Analysis Group
Prepared under:
Contract No. 43NANB612002
Prepared by: David P. Leech Reviewed by: Paul A. Belmont
TASC, Inc. 1101 Wilson Boulevard
Suite 1500 Arlington, VA 22209
ACKNOWLEDGEMENTS
We wish to acknowledge the contributions of Michael Chinworth and Albert Link to an
early draft of this report. We also wish to acknowledge the contributions of Ellyn Beary and
Michael Welch, of NIST, for their support during the survey phase of the effort. Michael Marx
(TASC) made incisive recommendations for improving the analysis and presentation of the
report.
ii
Table of Contents
ACKNOWLEDGEMENTS............................................................................................................. i
LIST OF FIGURES........................................................................................................................ iii
LIST OF TABLES ......................................................................................................................... iii
EXECUTIVE SUMMARY............................................................................................................. 1
1. INTRODUCTION................................................................................................................... 1
2. THE ECONOMIC IMPORTANCE OF ACCURATE CHOLESTEROL MEASURMENT. 4 2.1 Cholesterol and Health........................................................................................................ 4 2.2 Sources of Cholesterol Measurement Inaccuracy ............................................................... 5
2.2.1 Pre-analytical Issues................................................................................................ 6 2.2.2 Analytical Issues ..................................................................................................... 6
2.3 NIST’s Role in Cholesterol Measurement Standardization................................................ 8 2.3.1 Chronology of Significant Events........................................................................... 8 2.3.2 Clinical Laboratory Traceability for Cholesterol .................................................. 11
3. INDUSTRY SUPPLY CHAIN ............................................................................................. 16 3.1 Clinical Laboratories......................................................................................................... 16 3.2 Instrument manufacturers ................................................................................................. 18 3.3 The Market for Cholesterol Diagnostics........................................................................... 19 3.4 Changes in Buyer Supplier Relations: Implications for the Utility of NIST SRMs ........ 21
4. ECONOMIC ASSESSMENT FRAMEWORK.................................................................... 25 4.1 NIST’s Cholesterol Standards Program Outputs .............................................................. 25 4.2 Evalution Framework and Approach ................................................................................ 25
4.2.1 Cholesterol SRMs: Mitigation of Market Failures ............................................... 25 4.2.2 Comparison Scenario ............................................................................................ 27 4.2.3 Impact Estimation Timeframe .............................................................................. 28 4.2.4 Hypothesized Outcomes ....................................................................................... 29
5. SURVEY FINDINGS ........................................................................................................... 31 5.1 The Survey Population...................................................................................................... 31 5.2 Quantitative Findings........................................................................................................ 31 5.3 Qualitative Findings.......................................................................................................... 32
6. QUANTITATIVE ANALYSIS ............................................................................................ 35 6.1 Cost Avoidance Benefits................................................................................................... 35
6.1.1 Production Cost Avoidance ......................................................................................... 36 6.1.2 Transaction Cost Avoidance ........................................................................................ 36
6.2 NIST Expenditures............................................................................................................ 37 6.3 Measures of Economic Impact.......................................................................................... 38
APPENDIX A: WHAT IS CHOLESTEROL? ............................................................................ 40
APPENDIX B: MEASURES OF ECONOMIC IMPACT .......................................................... 42
iii
LIST OF FIGURES
Figure 1—Traceability to NIST’s Cholesterol Accuracy Base..................................................... 12 Figure 2—Traceability Hierarchy of Measurement Methods ....................................................... 14 Figure 3—The Relevant Supply Chain for Cholesterol SRMs..................................................... 17
LIST OF TABLES
Table ES-1—Economic Impact of NIST’s Cholesterol Standards Program .................................. 2 Table 1—Timeline of Significant Events in the Development of Cholesterol-
related SRMs and the Definitive Method ............................................................................... 8 Table 2—Major Chemistry Instrument & Diagnostic Chemical Manufacturers .......................... 20 Table 3—Chemistry Instrument Installed Base: Hospital & Commercial Labs ........................... 21 Table 4—Economic Analysis Framework .................................................................................... 26 Table 5—Industry Cost Avoidance Benefits ................................................................................ 35 Table 6—Cholesterol SRM Program Costs.................................................................................. 38 Table 7—Constant 1999 Dollar Benefits and Costs (1986-1999)*............................................... 38 Table 8—Lower-Bound Estimates of Economic Impact (1986–1999) ........................................ 39 Table A-1—Cholesterol Blood Level Thresholds ........................................................................ 41
ES–1
EXECUTIVE SUMMARY
The National Institute of Standards and Technology (NIST) develops and maintains
national standards, certifies standard reference materials (SRMs), and offers a wide variety of
calibration services that are used to assure the quality of clinical laboratory processes. The
purpose of this case study is to assess the economic impacts of cholesterol-related standard
reference materials (SRMs) from NIST's Clinical Standards Program.
Cardiovascular disease is a major health hazard in the U.S. The control of blood levels of
cholesterol, especially the constituent known as “bad” cholesterol, is regarded by the medical
community as essential to good health. Accurate measurement of cholesterol and its constituents,
therefore, is important to minimizing cardiovascular disease.
A national quality control system, the National Reference System for Clinical
Laboratories (NRSCL), has evolved within the U.S. medical community and it’s supporting
industries to assure accurate measurement of cholesterol and other medically significant
constituents of blood. NIST has played an important part in that system by developing basic
measurement methods and standards as well as providing highly accurate reference materials to
assure the accuracy of cholesterol tests.
The measurement technologies developed by NIST are highly accurate, complex, and
expensive compared to the measurement technologies typically used in high-volume cholesterol-
testing laboratories. Assuring access to the most accurate measurement technologies across the
supply chain—from measurement system manufacturers, to clinical laboratories, to medical
service providers—is essential for controlling the disparities in measurement accuracy among
laboratories. In the absence of public sector efforts to make these measurement technologies
widely available, it is unlikely that the private sector would have undertaken a similar
investment. Even in the late 70’s, more than 10 years after the release of the first NIST
cholesterol standard, industry still faced a wide array of analysis methods that could be
implemented in instrumentation and laboratory analysis processes. Within the private sector,
incentives to share information about the relative attributes of these measurement technologies
ES–2
were low. Where such incentives existed—for example between measurement system suppliers
and potential clinical laboratory customers—the cost of comparing and verifying such
information was high.
The economic consequences of NIST’s Cholesterol Standards Program are experienced at
four levels in the supply chain that ultimately delivers medical services to the consumer. First,
due to the availability of highly accurate cholesterol reference materials, manufacturers of
cholesterol measurement systems (including measurement instruments and the complementary
diagnostic chemicals used with them) experience lower production costs than they would if
SRMs were not available from NIST. Second, in their interactions with measurement system
users (clinical laboratories) concerning the quality and accuracy of their products, measurement
system manufacturers face significantly lower transactions costs than they would if the accuracy
of their products was not “anchored” to nationally-recognized standards. Third, clinical
laboratories experience lower cost in maintaining their quality control and assurance systems.
Finally, consumers of medical services receive higher quality medical services in the form of
more accurate test results, because inaccurate cholesterol tests can lead to unnecessary medical
expenses and health risks.
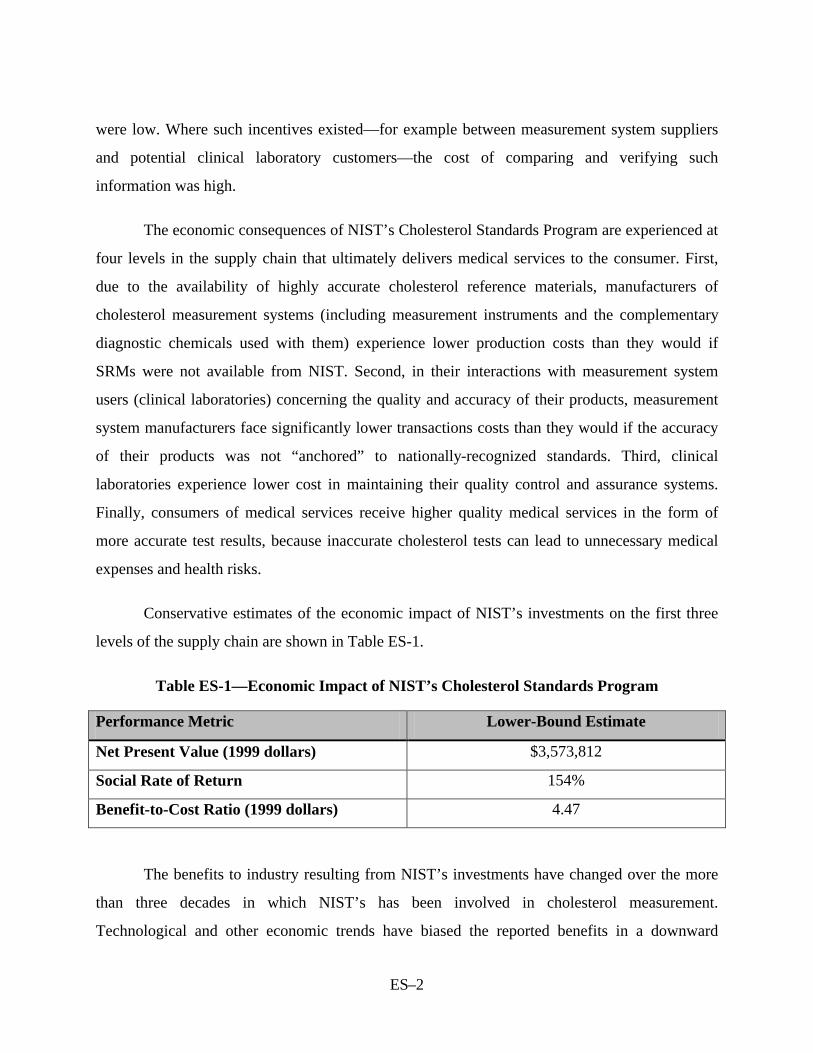
Conservative estimates of the economic impact of NIST’s investments on the first three
levels of the supply chain are shown in Table ES-1.
Table ES-1—Economic Impact of NIST’s Cholesterol Standards Program
Performance Metric Lower-Bound Estimate
Net Present Value (1999 dollars) $3,573,812
Social Rate of Return 154%
Benefit-to-Cost Ratio (1999 dollars) 4.47
The benefits to industry resulting from NIST’s investments have changed over the more
than three decades in which NIST’s has been involved in cholesterol measurement.
Technological and other economic trends have biased the reported benefits in a downward
ES–3
direction. Among the most significant of these trends are the movement to “closed” automated
measurement systems, and the change in the composition of knowledge and skill levels within
clinical laboratories that has come about as a result of cost-cutting trends in the medical
community.
The study timeframe for this analysis (1986-1999) covers only a part of the program’s life
cycle. This biases the measured impacts downward because the benefits enjoyed by respondents
have declined relative to the earlier phase of the program’s history. Another source of downward
bias in the impact calculations was the choice not to scale respondent’s estimates to reflect
benefits of their industry as a whole. The structure of the industry in question was not well
enough understood to justify such a procedure.
Nevertheless, the results indicate that NIST has played an important economic role in
support of a national effort to monitor, measure, and control cholesterol levels, thereby
contributing to reduced levels of cardiovascular disease.
The Economic Impacts of NIST’s Cholesterol Standards Program
1. INTRODUCTION
The focus of this economic impact assessment is NIST’s Clinical Standards Program, the
cholesterol family of Standard Reference Materials (SRMs), and associated measurement
methodologies, in particular. NIST has developed accurate and precise analytical methods
(“definitive methods”) for measuring the purity and concentration of various chemical
compositions (commonly referred to as “analytes”) in human specimens. These methodologies
provide the foundation for a nation-wide system assuring the accuracy of health-related testing.
NIST also procures vials of chemical materials, verifies the assay and the purity or concentrations
of these materials using its definitive method, and distributes these materials through its Standard
Reference Materials Program.
Every day, in hundreds of thousands of physician’s offices and hospitals across the
nation, tests of human specimen are performed to diagnose, monitor, or treat health problems.
NIST cholesterol-related SRMs are used throughout the clinical laboratory supply chain—from
instrument manufacturers to hospital laboratories—to assure the accuracy of cholesterol
measurement. The accuracy of these clinical testing procedures has been the subject of public
concern and regulation for over a decade. Current guidance by public health organizations
suggests that adults at low risk for cardiovascular disease have cholesterol tests repeated every 5
years. If the original screening results misclassify a person with abnormal values into the
acceptable range, the excess risk may go undetected for an extended period of time.1
To assure the accuracy of various diagnostic tests, a regimen of standard quality assurance
practices has evolved within the health care community. This National Reference System for
Clinical Laboratories (NRSCL) is an evolving system of private, public, and academic
institutions that seek to promote consistency of laboratory results within all clinical laboratory
1 M. Dominiczak and J. McNamara, “The System of Cardiovascular Prevention,” in Nader Rifai, et al., Handbook
2
disciplines. The goal of the NRSCL is the harmonization of clinical laboratory measurement so
that the clinically significant characteristics of an analyte are equivalent among all medical
institutions.2
In the case of cholesterol measurement, NIST plays an important role in this national
reference system, primarily by providing standards for cholesterol of known assay and purity to
manufacturers of cholesterol-testing products and to the clinical laboratories that utilize
cholesterol-testing products.3
The Clinical Standards Program is part of a much larger effort by NIST’s Chemical
Science and Technology Laboratory (CSTL) to help the U.S. chemical manufacturing, energy,
health care, biotechnology, food processing, and materials processing industries to meet the
broad range of international measurement requirements and compete in global markets. CSTL is
one of seven operating units in NIST’s Measurement and Standards Laboratories (MSL). It
performs leading-edge research in measurement science; develops and maintains measurement
methods, standards, and reference data; and develops models for chemical, biochemical, and
physical properties and processes.
CSTL’s Analytical Chemistry Division engages in the development and evaluation of
measurement methods of known accuracy, precision, sensitivity, and selectivity. The resulting
reference methodologies provide the foundation for the certification of chemical composition in
more than 850 Standard Reference Materials important to U.S. industry, government agencies,
and educational institutions. The Division’s cholesterol-related activities are central to its
Clinical Standards Program.
This report assesses the economic impacts of NIST’s cholesterol SRMs at three of four
levels in the medical services supply chain: in the development of cholesterol measurement
of Lipoprotein Testing, AACC Press, 1997, pp. 60-74.
2 The Reference System for the Clinical Laboratory: Criteria for Development and Credentialing of Methods and Material for Harmonization of Results; Proposed Guideline, NRSCL 13-P, Vol. 15, No. 12, December 1995, p. ix.
3 An “assay” is defined by the National Council of Clinical Laboratory Standards (NCCLS) as the quantitative determination of the amount, activity, or potency of a constituent. (See, NCCLS, (NRSCL 8-P3) October 17, 1996.)
3
system products; in the clinical laboratories’ cost of quality; and in the transactions and
communications between manufacturers and clinical labs.
In Chapter 2, we discuss the economic importance of accurately measuring cholesterol
and the sources of cholesterol measurement inaccuracy; the evolution of a national infrastructure
to assure traceability to national standards of measurement accuracy, and NIST’s role in the
national infrastructure dedicated to cholesterol measurement. Chapter 3 describes the industry
supply chain and discusses some of the trends that have caused relations between suppliers of
measurement technologies and their users to change over time. In Chapter 4, the approach to
measuring the impacts of the cholesterol SRMs program is described and hypothesized outcomes
are discussed. Chapter 5 presents the quantitative and qualitative findings of the study survey.
Finally, the quantitative analysis of the economic impact of NIST’s investments is presented in
Chapter 6.
4
2. THE ECONOMIC IMPORTANCE OF ACCURATE CHOLESTEROL MEASURMENT
2.1 CHOLESTEROL AND HEALTH
Proper health care for all Americans is both a policy objective of the U.S. government
and an important foundation for continued prosperity.4 Poor health care costs lives and affects
economic growth. Cardiovascular disease (CVD) includes heart disease and stroke. In 1997,
heart disease in the U.S. was responsible for the deaths of 725,000 persons over the age of 22.
Heart disease is the leading cause of death for persons 65 and over. It is the second leading cause
of death for persons 45 and over. 5 The cost of heart disease in the United States in 1999 was
estimated at $215 billion.6
One of the most important means of minimizing the risks of heart attacks and heart
disease is maintaining desirable cholesterol levels in the bloodstream. Medical experts consider
the provision of precise and accurate measurement of cholesterol, “an essential component of a
cardiovascular disease prevention system.”7 Some believe that national and international efforts
to contain cardiovascular disease, through the development and enforcement of measurement
standards over the past three-to-four decades, may be regarded as one of clinical chemistry’s
greatest contribution to public health.8
To assure the accuracy of various diagnostic tests, a regimen of standard quality assurance
practices has been developed by the health care community. Under the sponsorship of the
National Council of Clinical Laboratory Standards (NCCLS), a National Reference System for
4 “Investing in people” (education and health care) is one of three crucial elements of the Clinton Administration’s
economic strategy. See Economic Report of the President, February 1998, pp. 3-5. 5 CDC, National Vital Statistics Reports, Vol. 48, Table 33, “Leading causes of death and numbers of deaths, according to age: United States, 1980 and 1997.”
6 This figure includes health expenditures (direct costs, which include the cost of physicians and other professionals, hospital and nursing home services, the cost of medications, home health and other medical durables) and lost productivity resulting from morbidity and mortality (indirect costs). 2000 Heart and Stroke Statistical Update, American Heart Association, http://www.americanheart.org/statistics/index.html (July 20, 2000)
7 M. Dominiczak and J. McNamara, “The System of Cardiovascular Prevention,” in Nader Rifai, et al., Handbook of Lipoprotein Testing, AACC Press, 1997, pp. 60-74.
8 Nader Rifai, et al., Handbook of Lipoprotein Testing, AACC Press, 1997, pp. xxi.
5
Clinical Laboratories (NRSCL) has evolved.9 The NRSCL is a system of private, public, and
academic institutions that seek to promote consistency of laboratory results within all clinical
laboratory disciplines. The goal of the NRSCL is the harmonization of clinical laboratory
measurement so that the clinically significant characteristics of an analyte are equivalent among
all medical institutions.
In 1985, the National Institutes of Health (NIH) launched the National Cholesterol
Education Program (NCEP) and the NCCLS established that National Reference System for
Cholesterol (NRS/CHOL) in support of efforts of the NCEP. The NRS/CHOL is one facet of the
NRSCL. It is comprised of the NIST definitive method (the isotope dilution mass spectrometric
procedure (IDMS)), a CDC reference method (a modified Abell-Kendell method), a NIST-
certified pure cholesterol reference material (SRM 911), and NIST-certified serum-based
secondary reference materials (e.g., SRM 909, SRM 1951 and SRM 1952).10
NIST’s development and distribution of widely accepted reference materials (NIST’s so-
called standard reference materials or SRMs) have made a significant contribution to these
developments. These reference materials are used by manufacturers and clinical laboratories to
gauge their measurement systems to a substance of known and extremely high purity or to known
and accurate concentrations.
2.2 SOURCES OF CHOLESTEROL MEASUREMENT INACCURACY11
There are multiple sources of error in the measurement of cholesterol. The reliability of
cholesterol measurement depends on how well potential sources of error are controlled,
beginning with factors that occur before samples are taken and laboratory analysis is undertaken.
9 The NCCLS is an international, interdisciplinary, nonprofit, standards-developing and educational organization
that promotes the development and use of voluntary consensus standards and guidelines within the healthcare community.
10 Recommendations for Improving Cholesterol Measurement (A Report from the Laboratory Standardization Panel of the National Cholesterol Education Program), U.S. Department of Health and Human Services, National Institutes of Health, NIH Publication No. 93-2964, January 1993, p. 21.
11 Unless otherwise noted, the material in this section is based on, Recommendations for Improving Cholesterol Measurement (A Report from the Laboratory Standardization Panel of the National Cholesterol Education Program), U.S. Department of Health and Human Services, National Institutes of Health, NIH Publication No. 93-2964, January 1993.
6
“Error” refers to the factors that can alter a measurement such that it does not reflect a patient’s
usual cholesterol level or normal metabolic state. There are two broad categories of error: pre-
analytic and analytic error.
2.2.1 Pre-analytical Issues
Pre-analytic error is the primary cause of error in cholesterol measurement but it is not the
easiest to control. Pre-analytic factors include: intra-individual biological variation, pregnancy,
trauma, surgery, acute illness, chronic diseases, diet, acute exercise, and mediation as well as the
conditions of patient preparation, sample collection, sample handling, storage, and shipment to
the laboratory. Factors that contribute to the patients usual cholesterol levels include age, sex,
and body weight; behavioral factors such as diet, alcohol use and exercise; genetic factors and
chronic medical disorders.
2.2.2 Analytical Issues
Analytical variation, or “laboratory error,” refers to errors associated with cholesterol
measurement procedures themselves. National efforts to standardize cholesterol have focused on
improving the analytical accuracy of laboratories and minimizing inter-laboratory variations. The
major components of a clinical laboratory’s analytic system are as follows:
• Method or sequence of chemical reactions
• Reagent
• Measurement instrument
• Approach to calibration.
Each of these components is discussed in turn.
By the early 1990s, enzymatic methods had replaced “wet chemistry” methods in most
clinical laboratories.12 These enzymatic methods are less corrosive than wet chemistry methods
12 This implies a degree of homogeneity among clinical laboratory practices that was not always the case. When
NIST first became involved in cholesterol measurement standardization, the situation regarding methods was characterized as chaotic by one observer. See, B. Zak, “Cholesterol Methodologies: A Review,” Clinical
7
and thus do not tend to degrade the performance of the instrument as previous methods did. The
specific enzymatic method has unique characteristics that interact with the analyte or other
aspects of the specimen to influence measurement results. The microbial source of the enzyme,
as well as the concentrations of other chemicals in the specimen matrix, can also affect the
accuracy of cholesterol measurement.
The reagents are highly complex mixtures. Their design is affected by considerations
other than accuracy, such as cost and convenience. Reagents can also be a source of analytical
error in cholesterol measurement. Instability, chemical or biological contamination, changing
composition of purchased reagents and improper storage of reagents can affect accuracy.
A wide variety of instruments are used in clinical laboratories. They are comprised of
sophisticated mechanical, optical, and electronic subsystems. Inherent errors in these subsystems
can cause variation in the measurements reported by different instruments. The nature of the
pipetting device used in sample preparation; the consistency of temperature control; the
characteristics of the spectrophotometer; the approach to isolating particular wavelengths; and
the sophistication of microprocessors in controlling and monitoring various instrument functions
can all influence the accuracy and precision of instrumentation.
As late as 1993, the NCEP reported that accurate calibration remained a major problem in
clinical laboratories. The approach to calibration is a major factor in determining the overall
accuracy of a system. It is essential that manufacturers link the accuracy of their systems to the
accuracy base of the NRS/CHOL. NIST’s SRMs are typically used by manufacturers (and
clinical laboratories) to assign (or check) concentration values in the calibrators they sell to
calibrate the instruments and reagents and, thereby, to assure they are performing accurately (i.e.,
that they are maintaining a linear relationship between response and concentration).
Chemistry, Vol. 23, No. 7, 1977, pp. 1201-1214.
8
2.3 NIST’S ROLE IN CHOLESTEROL MEASUREMENT STANDARDIZATION
2.3.1 Chronology of Significant Events
NIST engages in the development of materials and methodologies that are used by
clinical testing facilities across the United States—indeed, throughout the world—to assure
accurate medical testing and evaluation. One critical area in which NIST has made important
contributions to advances in measurement and reliability is that of cholesterol testing. NIST has
made contributions in several respects, including the development of the definitive method, a
highly specialized analytical method with a comprehensive accuracy assessment, and the
development and sale of a family of cholesterol standard reference materials tied to the definitive
method. The SRMs have been widely used for assuring the accuracy of manufacturer’s
cholesterol testing systems, specifically for assigning cholesterol concentration values to
commercially marketed “calibrators” that accompany an instrument, providing the user with a
traceable measurement system. These calibrators are designed to calibrate the reagents used in
measurement instruments.13 In addition to assuring the accuracy of the values assigned to NIST’s
SRMs, the definitive method is the ultimate source of accuracy and reliability in national clinical
laboratory blood sample assays.14
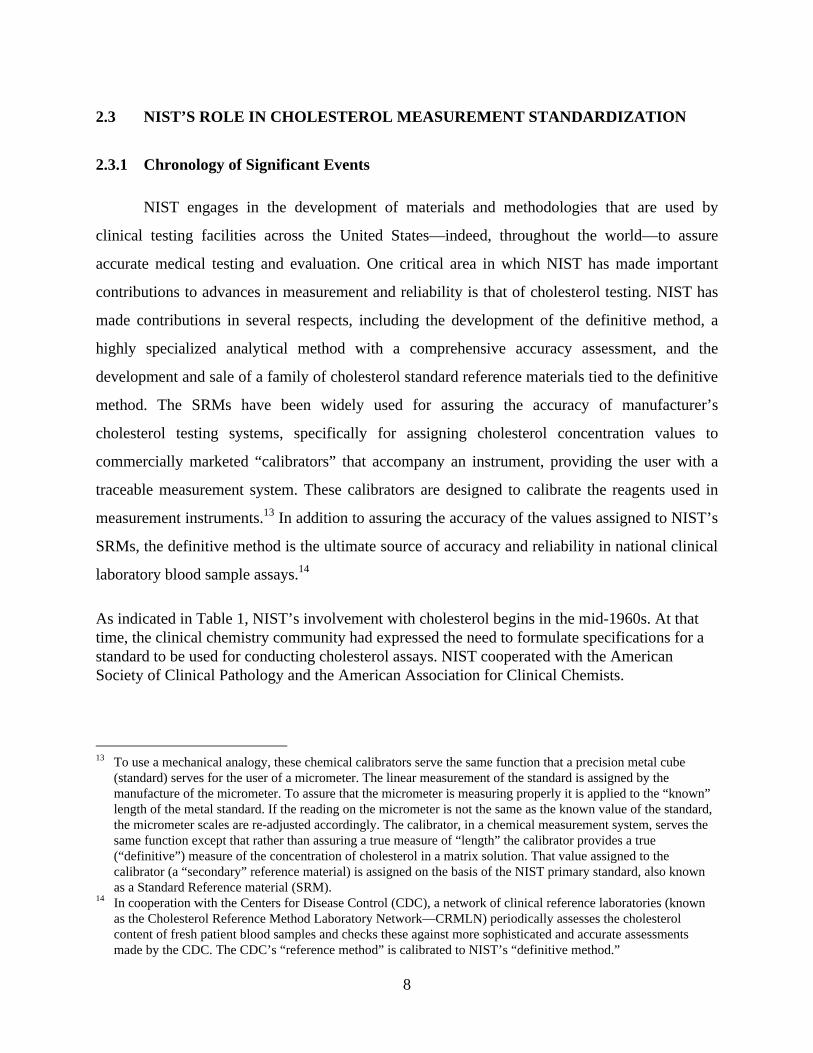
As indicated in Table 1, NIST’s involvement with cholesterol begins in the mid-1960s. At that time, the clinical chemistry community had expressed the need to formulate specifications for a standard to be used for conducting cholesterol assays. NIST cooperated with the American Society of Clinical Pathology and the American Association for Clinical Chemists.
13 To use a mechanical analogy, these chemical calibrators serve the same function that a precision metal cube
(standard) serves for the user of a micrometer. The linear measurement of the standard is assigned by the manufacture of the micrometer. To assure that the micrometer is measuring properly it is applied to the “known” length of the metal standard. If the reading on the micrometer is not the same as the known value of the standard, the micrometer scales are re-adjusted accordingly. The calibrator, in a chemical measurement system, serves the same function except that rather than assuring a true measure of “length” the calibrator provides a true (“definitive”) measure of the concentration of cholesterol in a matrix solution. That value assigned to the calibrator (a “secondary” reference material) is assigned on the basis of the NIST primary standard, also known as a Standard Reference material (SRM).
14 In cooperation with the Centers for Disease Control (CDC), a network of clinical reference laboratories (known as the Cholesterol Reference Method Laboratory Network—CRMLN) periodically assesses the cholesterol content of fresh patient blood samples and checks these against more sophisticated and accurate assessments made by the CDC. The CDC’s “reference method” is calibrated to NIST’s “definitive method.”
9
Table 1—Timeline of Significant Events in the Development of Cholesterol-related SRMs and the Definitive Method15
Date Event 1966 NIST participates with the American Society of Clinical Pathology (ASCP) and the American
Association of Clinical Chemists (AACC) in specifying a standard for serum cholesterol assays.
1966-67 NIST contracts for production of pure cholesterol specifying “Fieser’s Method.” 1967 NIST issues SRM 911 (99.4% + 0.3% pure). 1969 National Institutes of Health (NIH) funds NIST to development of a wide range standard
analytes for the purpose of improving clinical diagnosis. NIST begins development of an atomic absorption spectroscopic (AAS) procedure as a
“referee method” for the determination of calcium in human serum. An isotope dilution mass spectrometric (IDMS) procedure, for calcium determinations, was developed at the same time as “an independent method of known accuracy” as required by the NIST certification process for SRMs. This IDMS method developed for calcium is known as a definitive method. A NIST special publication was released in 1972. NIST then began the development of IDMS definitive methods for the determination of glucose in serum, an organic analyte in an organic matrix.
1974 Food & Drug Administration (FDA) funds development of NIST’s IDMS capability as a definitive method for several analytes viewed as critical to improving the evaluation of clinical measurements.
1979-80 First organic IDMS method published. 1980 NIST uses its IDMS definitive method to assign 8 (of 17) analytes in human serum (SRM
909). 1982 Centers for Disease Control & Prevention (CDC) adopts the Abell-Kendall procedure as its
reference method because its values for cholesterol concentrations in serum differed only slightly from those of the definitive method.
1986 The NIST DM is modified to incorporate new technology.16 1987 NIST-CDC cooperate in the development of SRM 1951 (cholesterol in human serum-frozen)
and assign DM and RM values for total cholesterol. 1990 NIST-CAP cooperate in development of SRM 1952a (cholesterol in human serum- freeze
dried) and assign DM values for total cholesterol 1991 NIST assigns 11 analytes to SRM 909a (human serum-freeze dried) using its IDMS/DM. 1996 NIST assigns 13 analytes to SRM 909b (freeze-dried human serum) using definitive methods. 1997 NIST certifies cholesterol in SRM 1951a (lipids in fresh-frozen human serum), developed
through a subcommittee project of NCCLS, involving NIST, CDC, CAP, and the clinical instrument manufacturers.
15 Robert Schaffer, et al., “History of NIST’s Contribution to Development of Standard Reference Materials and
Reference and Definitive Methods for Clinical Chemistry,” Clinical Chemistry, Vol. 41, No. 9, 1995. 16 P. Ellerbe, et al., “A Comparison of Results for Cholesterol in Human Serum Obtained by the Reference Method
and by the Definitive Method of the National Reference System for Cholesterol,” Clinical Chemistry, Vol. 36, No. 2, 1990, p. 370. The DM was modified, in part, by replacing packed columns in the gas chromatograph with capillary columns and updating the mass spectrometer with improved technology. The procedure modification is described in, P. Ellerbe, et al., “Determination of Serum Cholesterol by a Modification of the Isotope Dilution Mass Spectrometric Definitive Method,” Analytical Chemistry, Vol. 61, pp 1718-23.
10
Chemistry in developing such specifications. NIST arranged for the manufacture of pure
cholesterol, produced according to a specified process (the so-called “Fieser method”); assessed
the purity of the material; and issued the cholesterol as SRM 911 in 1967. The success of this
effort led the clinical chemistry community to fund NIST’s development of a number of
reference materials for other analytes considered important to practicing clinical chemists.
In cooperation with the Centers for Disease Control (CDC) and the College of American
Pathologists (CAP), NIST became further involved in the development of reference methods and
definitive methods for the accurate assessment of health-related analytes and the chemical
composition of materials that contain them. NIST developed additional cholesterol SRMs in
recognition of shortcomings of cholesterol measurement nationally and of efforts to establish
better traceability for clinical laboratories making these measurements.
NIST’s efforts during the 1980s paralleled a growing national awareness of both the
health hazards associated with cardiovascular disease and the need to address clinical diagnostic
practices at the national level. A report by NIH/NCEP’s Laboratory Standardization Panel in
1988 concluded that “considerable inaccuracy” in cholesterol testing existed in the United States.
Estimates from various testing and monitoring organizations suggested that the range of
inaccuracy at the time could have been as high as 25 percent. The NCEP recommended attaining
higher accuracy levels by 1992.
The Clinical Laboratory Improvement Act (CLIA) of 1988 established standards designed
to improve quality of clinical laboratory testing in U.S. laboratories that conduct tests on human
specimens for health assessment or for diagnosis, prevention, or treatment of disease. CLIA
mandates proficiency testing as a means to externally validate the quality of a laboratory’s
performance. Each laboratory is challenged in three testing events annually. Several initiatives
have been instituted to support this proficiency testing and as a result a national reference system
as emerged to provide clinical laboratories and their suppliers with traceability to NIST’s
definitive methodology.
Since 1988, accuracy and consistency have improved. The U.S. General Accounting
Office (GAO) concluded in a 1994 report that under controlled conditions, research facilities,
11
clinical laboratories and hospital laboratories generally had “reasonably accurate and precise”
measurement of cholesterol levels in test samples. In 1995, the NCEP issued national
performance criteria for components of cholesterol measurement: Triglycerides, HDL and LDL.
NIST’s Cholesterol Standards Program has continued to develop SRMs to meet the increasingly
demanding metrological challenges of the clinical laboratory community.
2.3.2 Clinical Laboratory Traceability for Cholesterol
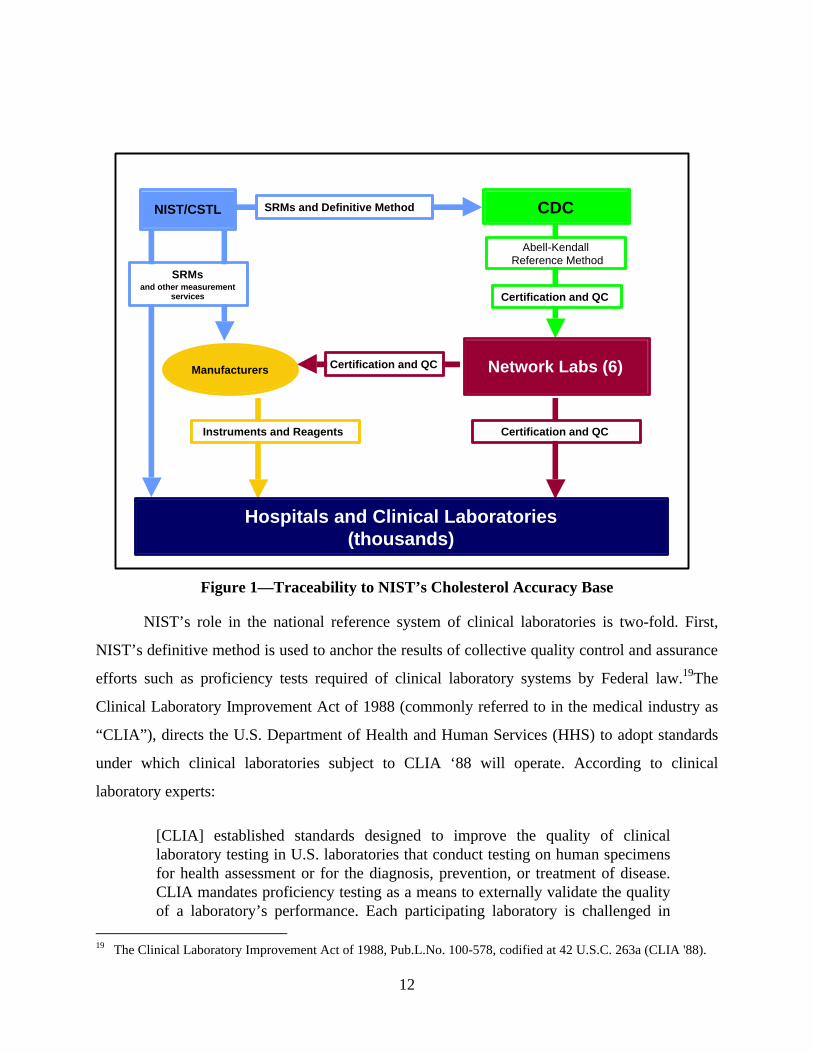
As depicted in Figure 1, NIST’s SRMs and the definitive method constitute the “accuracy
base” of a system of traceability that runs from NIST; to cholesterol system manufacturers and
public organizations, like the Centers for Disease Control and Prevention (CDC), and the and
quasi-public College of American Pathologists (CAP, an industry association of medical
pathologists17); and, ultimately, to the hospitals, physician offices, and independent laboratories
where cholesterol tests are actually performed. Traceability is very important to those engaged in
any kind of demanding measurement process. Traceability means that the standard used to set
values of purity or concentration can be traced back to a recognized and well-established
standard of high purity or accuracy.
The cornerstone of cholesterol traceability is NIST’s definitive method. For a method to
be considered definitive it must have been subjected to an extensive investigation and evaluation
for sources of inaccuracy. The sources of inaccuracy and their range must be documented. The
mean value of the definitive method is considered to be the “true value.” The definitive method
developed for cholesterol determinations, as well as other clinically important analytes is Isotope
Dilution Mass Spectrometry (IDMS). Typically, IDMS is labor intensive, expensive, and requires
highly specialized instrumentation and analysis. Its costs are prohibitive and its methods too time
consuming to be used in a clinical setting.18
17 Pathologists are medical doctors who specialize in laboratory medicine. They are experts in the use of laboratory
tests to diagnose and treat disease. Pathologists, as the directors of medical laboratories, are responsible for sophisticated laboratory tests on samples of tissues or fluids, and the quality and accuracy of the results.
18 The NIST definitive method involves a very precise technique that specifically measures cholesterol concentrations. It is very costly in terms of time and skill level as well as in the instrumentation required. Most clinical laboratories do not have the instrumentation, the highly skilled scientists, or the time to perform this definitive method.
12
Figure 1—Traceability to NIST’s Cholesterol Accuracy Base
NIST’s role in the national reference system of clinical laboratories is two-fold. First,
NIST’s definitive method is used to anchor the results of collective quality control and assurance
efforts such as proficiency tests required of clinical laboratory systems by Federal law.19The
Clinical Laboratory Improvement Act of 1988 (commonly referred to in the medical industry as
“CLIA”), directs the U.S. Department of Health and Human Services (HHS) to adopt standards
under which clinical laboratories subject to CLIA ‘88 will operate. According to clinical
laboratory experts:
[CLIA] established standards designed to improve the quality of clinical laboratory testing in U.S. laboratories that conduct testing on human specimens for health assessment or for the diagnosis, prevention, or treatment of disease. CLIA mandates proficiency testing as a means to externally validate the quality of a laboratory’s performance. Each participating laboratory is challenged in
19 The Clinical Laboratory Improvement Act of 1988, Pub.L.No. 100-578, codified at 42 U.S.C. 263a (CLIA '88).
CDC
Network Labs (6)
NIST/CSTL
Manufacturers
Hospitals and Clinical Laboratories(thousands)
Certification and QC
Certification and QCInstruments and Reagents
SRMs and Definitive Method
Certification and QC
SRMsand other measurement
services
Abell-Kendall Reference Method
13
three testing events annually. In each test event, 5 unknown samples of each analyte or test are provided.20
NIST’s definitive method plays an important part in the national proficiency program for
clinical laboratories mandated by CLIA. Some 15 public and private laboratories and
organizations are authorized to administer CLIA-approved testing programs. The College of
American Pathologists (CAP) is one such organization. CAP administers the Laboratory
Accreditation Program which examines all aspects of quality assurance in the laboratory,
including methodology, reagents, control media, equipment, specimen handling, procedure
manuals, reports and proficiency testing, personnel, safety, and the overall management
principles that distinguish a quality laboratory.21 Upon successful completion of the inspection
process, the laboratory is awarded CAP accreditation. CAP’s proficiency tests for cholesterol are
anchored to the NIST definitive method.
NIST’s definitive method also provides the accuracy base for CDC’s cholesterol
measurement system certification program (the Cholesterol Reference Method Laboratory
Network, or CRMLN).22 The CRMLN, in turn, assures that manufacturers are transferring the
accuracy base to their “calibrators” and that reagents used in measurement instruments are
calibrated properly. In other words, CRMLN assures that the reagents, and the instrument
systems of which they are a part, are accurately “reading” the cholesterol concentrations of
samples.
NIST’s other important role in the national reference system is to organize the production,
assessment, and quality assurance of primary and secondary reference materials.23
20 G. Myers, et al., “Standardization of Lipid and Lipoprotein Measurements,” in Nader Rifai, et al., Handbook of
Lipoprotein Testing, AACC Press, 1997, p. 239-40. 21 College of American Pathologists, www.cap.org 22 There are 6 labs in the CRMLN: University. of Wisconsin (State Laboratory of Hygiene); Northwest Lipid
Research Laboratories (Seattle); Wadsworth Center for Laboratories and Research (New York State Department of Health); Washington University School of Medicine; Jean Mayer USDA Human Nutrition Research Center on Aging at Tufts University; Pacific Biometrics Research Foundation. See, G. Meyer, "Standardization of Lipid and Lipoprotein Measurement," in Rifai, et al, (ed.) Handbook of Lipoprotein Testing (1997), page 237.
23 By definition, a “reference material” is a material or substance, one or more of whose property values are sufficiently homogeneous and well established to be used for the calibration of an apparatus, the assessment of a measurement method, or for assigning values to materials. A “certified reference material” (CRM) is a reference material, accompanied by a certificate, one or more of whose property values are certified by a procedure which establishes its traceability to an accurate realization of the unit in which the property values are expressed, and for
14
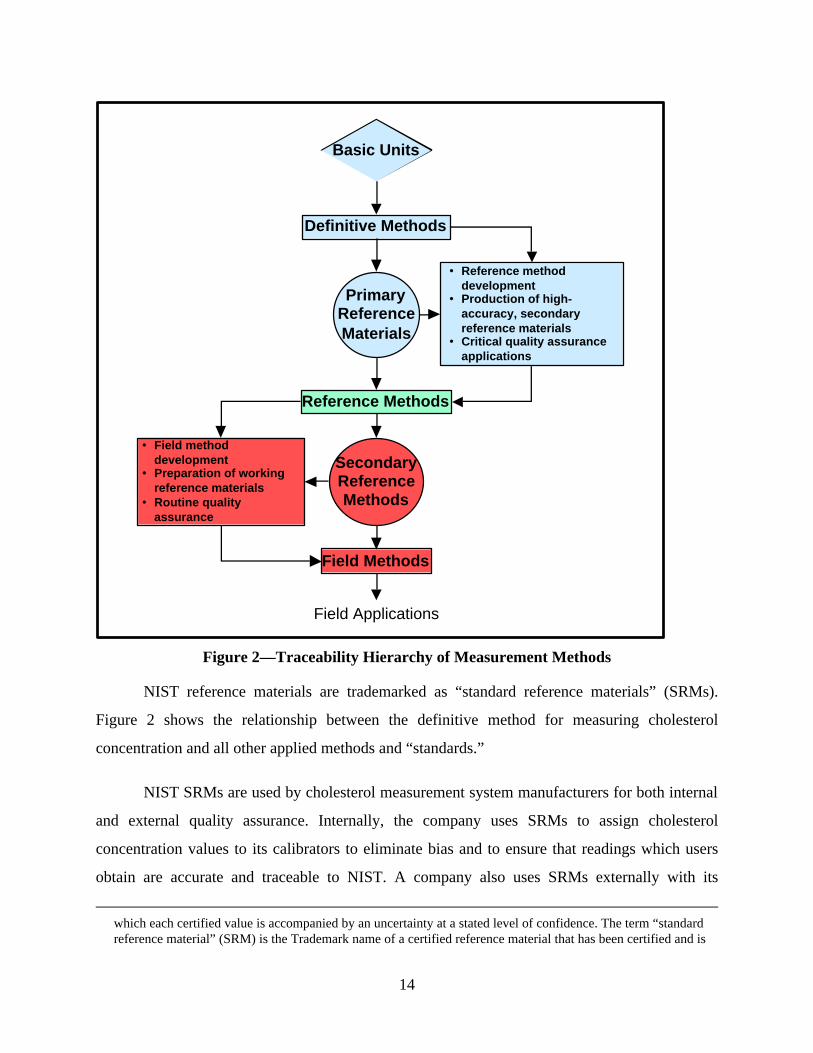
Figure 2—Traceability Hierarchy of Measurement Methods
NIST reference materials are trademarked as “standard reference materials” (SRMs).
Figure 2 shows the relationship between the definitive method for measuring cholesterol
concentration and all other applied methods and “standards.”
NIST SRMs are used by cholesterol measurement system manufacturers for both internal
and external quality assurance. Internally, the company uses SRMs to assign cholesterol
concentration values to its calibrators to eliminate bias and to ensure that readings which users
obtain are accurate and traceable to NIST. A company also uses SRMs externally with its
which each certified value is accompanied by an uncertainty at a stated level of confidence. The term “standard reference material” (SRM) is the Trademark name of a certified reference material that has been certified and is
Basic Units
Definitive Methods
PrimaryReferenceMaterials
Reference Methods
SecondaryReferenceMethods
Field Methods
• Reference methoddevelopment
• Production of high-accuracy, secondaryreference materials
• Critical quality assuranceapplications
• Field methoddevelopment
• Preparation of workingreference materials
• Routine qualityassurance
Field Applications
15
customers as part of a quality assurance function. In this role, the company interacts with users
in performing “trouble-shooting” and dispute resolution arising, for example, from a rigorous
proficiency test requirement to which many clinical laboratories are subject under (CLIA).
Of primary concern to this study are NIST’s cholesterol reference material (99.9percent
pure cholesterol—SRM 911) and NIST’s human serum reference materials (various analytes of
known concentration, including cholesterol, in frozen and freeze-dried human blood—SRMs
909, 1951, and 1952).24 Manufacturers utilize NIST SRMs primarily in the development,
production, and quality assurance of calibrators, one of the three classes of the diagnostic
chemicals used to support cholesterol measurement instruments.25
distributed by the NIST.
24 The terms “reference material,” “calibration material,” and “calibrator,” are equivalent terms. “Primary standard,” “secondary standard,” are the international terms for what the NCCLS, the national clinical laboratory standards body, calls “calibration material.” See, NCCLS, (NRSCL 8-P3) October 17, 1996.
For the purposes of this report, we will use the term “reference material” followed by some organizational or functional information that allows the reader to asses “distance” from the NIST accuracy base. An important distinction will be between commercial “calibrators” (formally “secondary calibrators,” defined by NCCLS as, a substance or device that is based on a reference preparation, or in which the analyte concentration or other quality has been determined by a formal analytical procedure of stated reliability) and those available from public or quasi-public organizations, such as industry and professional associations.
25 The dominant instrument manufacturers produce a measurement device that measures multiple analytes, cholesterol being just one of these. Instrument manufacturers also typically produce the diagnostic chemicals with which the instrument “reads” analyte qualities (reagents), such as concentration, and with which the machine’s accuracy (calibrators) and total analysis process (controls) are monitored for stability and accuracy. Reagents tend to be analyte-specific. Calibrators and controls are not analyte-specific.
16
3. INDUSTRY SUPPLY CHAIN
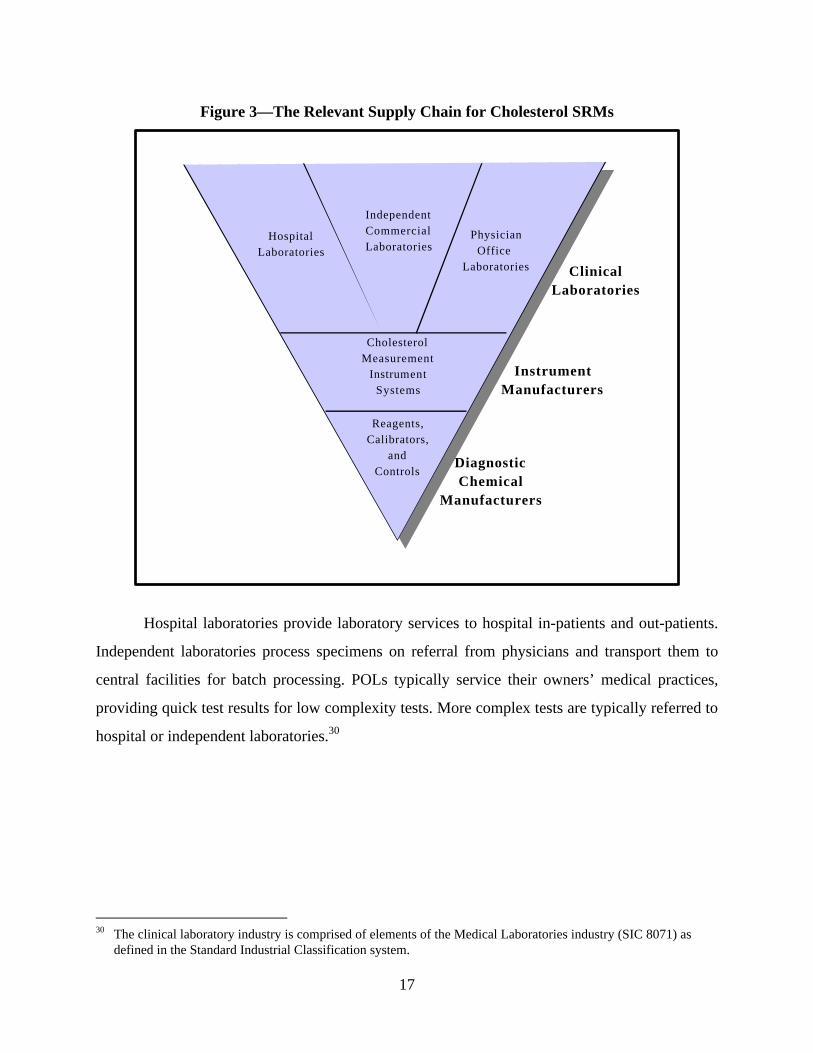
Figure 3 identifies three levels of the industry supply chain that are affected by NIST’s
clinical standards programs: diagnostic chemical manufacturers; instrument system
manufacturers; and clinical laboratories (the latter consisting of three distinct sub-sectors).26
Based on a review of SRM sales data, we estimate that chemical manufacturers and instrument
manufacturers purchase roughly one third of the cholesterol family of SRMs. Another large
fraction appears to have been purchased by independent and hospital-based clinical
laboratories.27
3.1 CLINICAL LABORATORIES28
There are more than 171,000 clinical laboratories in the U.S.29 The clinical laboratory
industry is comprised of three major types of laboratories:
• Hospital laboratories
• Independent laboratories
• Physician’s office laboratories (POLs).
26 It was anticipated that program impacts on a fourth tier of the supply chain—recipients of cholesterol testing
services (patients)—would be assessed. Survey participants were unable to provide estimates of trends in misclassifications that result in duplicate testing costs. Cholesterol measurement experts were unable to identify studies that related improvements in cholesterol measurement to misclassification trends.
27 The fraction purchased by clinical laboratories is difficult to estimate for three reasons. First, the number of organizations is very large and there is not a standard list that would allow the identification of all clinical laboratories. Even if this were the case, buying organizations purchase under multiple names making an accurate matching of names to purchasing organizations unreliable. Second, due to extensive consolidation in the independent clinical laboratory segment of the clinical laboratory industry, organizational names appear to have changed considerably. Third, hospital laboratories are only occasionally identified as such. Many are associated with universities. We assume that many university purchasers are hospitals but certainly university researchers also purchase cholesterol-related SRMs for a number of reasons.
28 Unless otherwise indicated, the source of information on the clinical laboratory industry is, Thomas Hoerger, et al., Background Report on the Clinical Laboratory Industry, Research Triangle Institute, Oct. 1996.
29 Health Care Finance Administration (HCFA), Oscar Database, July 21, 2000.
17
Figure 3—The Relevant Supply Chain for Cholesterol SRMs
Hospital laboratories provide laboratory services to hospital in-patients and out-patients.
Independent laboratories process specimens on referral from physicians and transport them to
central facilities for batch processing. POLs typically service their owners’ medical practices,
providing quick test results for low complexity tests. More complex tests are typically referred to
hospital or independent laboratories.30
30 The clinical laboratory industry is comprised of elements of the Medical Laboratories industry (SIC 8071) as
defined in the Standard Industrial Classification system.
HospitalLaboratories
IndependentCommercialLaboratories
PhysicianOffice
Laboratories ClinicalLaboratories
InstrumentManufacturers
CholesterolMeasurement
InstrumentSystems
Reagents,Calibrators,
andControls
DiagnosticChemical
Manufacturers
18
There are over 8,000 CLIA-certified hospital laboratories in the country; almost 90,000
certified POLs; and over 5,000 certified independent laboratories. Among the independent
laboratories, LabCorp, Quest Diagnostics, and SmithKline-Beecham are believed to control
almost 60 percent of the national independent laboratory market.31 Annual revenues of the
clinical laboratory industry have been estimated at $30-35B (1995) with approximately 50
percent going to hospitals; 26 percent to independent labs and ~24 percent going to POLS.
3.2 INSTRUMENT MANUFACTURERS
The term “measurement system” refers to the hardware and software that comprise a
measurement instrument and the complementary diagnostic chemicals (reagents, calibrators, and
controls) that allow the instrument to “read” the attributes of the target sample. The system’s
suite of diagnostic chemical are also used to assess the accuracy of the instrument as well as the
larger measurement procedure of which the instrument is a part.
Cholesterol measurement systems belong to a class of measurement instrument
commonly referred to within the industry as “general chemistry” instruments. General chemistry
instruments are increasingly automated, offer an ever-widening array of tests, and the technology
is changing more rapidly than ever before.32 Manufacturers compete to provide clinical users
with measurement instruments that perform a wide range of analytical tests rapidly and that
eliminate as much preparatory and post-processing expense as possible. (Examples of such pre-
and post-processing expense include the elimination of time-consuming and error-prone steps for
reconstituting reagents to make solutions, or to prepare dilutions from more concentrated
solutions; minimization of reagent waste; reagent storage; and specimen identification, labeling,
31 As of 1996, these three independent laboratories controlled a number of well-known independent clinical
laboratories. Corning Life Science controlled: MetPath, Damon, Nichols Institute, Clinical Pathology Facility, DeYor CPF, Associated Clinical, Clinical Labs of Lincoln, and Pharmaceutical Laboratory Services. LabCorp controlled: National Health Laboratories, Allied Clinical Labs, Roche Biomedical Labs, Reference Pathology Laboratory, Physician Clinical Laboratories, Sierra Nevada Laboratories, and Suburban Pathology Laboratories. During the course of this study, consolidation among the large independent laboratories continued: Corning and SmithKline-Beecham were purchased by Quest Diagnostics in 1999.
32 M. Dominiczak and J. McNamara, “The System of Cardiovascular Prevention,” in Nader Rifai, et al., Handbook of Lipoprotein Testing, AACC Press, 1997, pp. 60-74; Carl A. Burtis, “Converging Technologies and Their Impact on the Clinical Lab,” Clinical Chemistry, Vol. 42, No. 11, 1996, pp. 1735-1749.
19
handling, delivery, transport, storage, retrieval).33 In the face of rapid technological change, some
observers believe that an emphasis on quality control is increasingly important.34
3.3 THE MARKET FOR CHOLESTEROL DIAGNOSTICS
The market for cholesterol measurement systems is complex and fragmented. Instrument
manufacturers also produce (or distribute under proprietary label) the diagnostic chemicals
required to calibrate, operate, and perform quality control on their instruments. Some instrument
manufacturers have designed “open” systems, capable of utilizing the diagnostic chemicals of
competing instrument manufacturers or of diagnostic chemical vendors. Others maintain
“closed” systems.35
While the instruments themselves are multifunctional, the diagnostic chemicals or
reagents are analyte-specific. According to industry representatives, calibrators, and controls
typically are applicable to a number of different analytes.
Industry representatives estimate that in 1997 the worldwide market for diagnostic
chemicals (reagents, calibrators and controls) was approximately $4.3 billion. The U.S. market is
estimated to constitute some 40 percent of that total, or $1.7 billion. Industry representatives
estimate that the value of the cholesterol-related diagnostic chemical market alone is
approximately $100 million a year, 95 percent of which is estimated to be reagents, with
calibrators and controls comprising the remaining 5 percent. Some 75 percent of the diagnostic
chemical market is believed to be controlled by instrument manufacturers. Diagnostic chemical
vendors control the remaining 25 percent.
33 C. A. Burtis, “Converging technologies and their impact on the clinical lab,” Clinical Chemistry, Vol. 42, No. 11,
1996, pp. 1735-1749; and “Advanced Technology and Its Impact on the Clinical Laboratory,” Clinical Chemistry, Vol. 33, No. 3, 1987.
34 Alejandro Macias and Lynne Garcia, “Progress in Clinical Laboratories,” Review of Clinical Investigations, Vol. 47, No. 5, September-October 1995.
35 Among the leading cholesterol measurement system manufacturers, Dade Diagnostics, and Ortho Clinical have
20
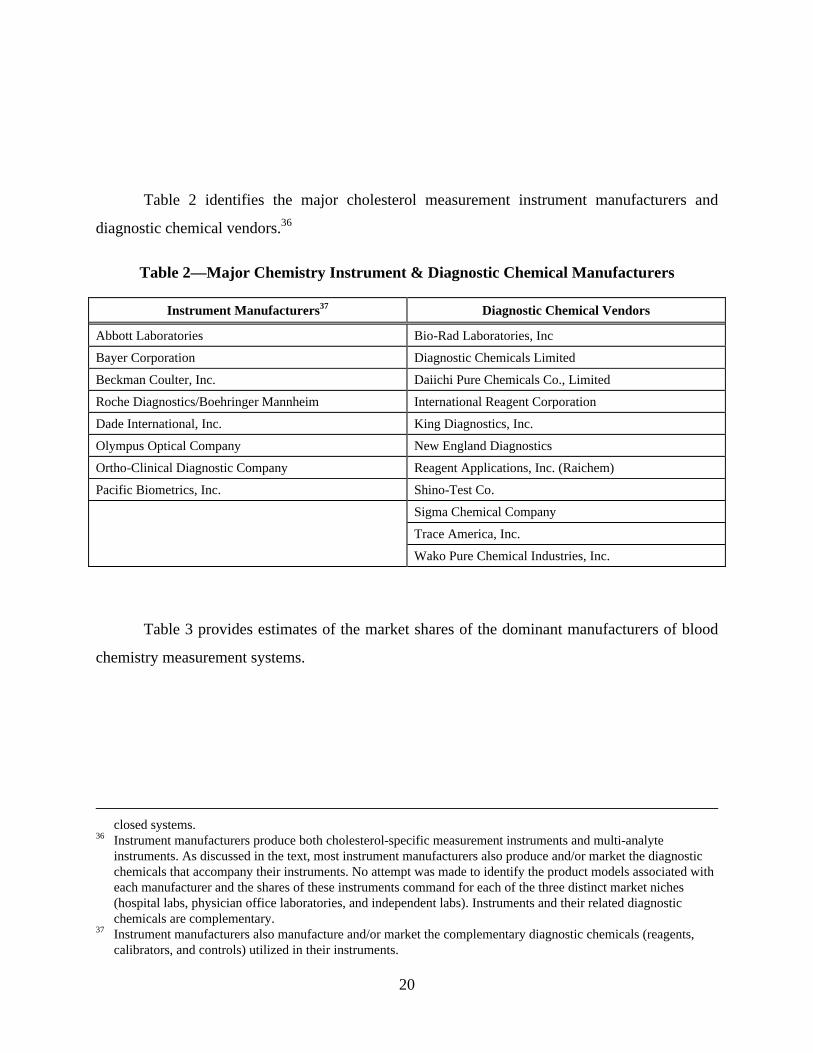
Table 2 identifies the major cholesterol measurement instrument manufacturers and
diagnostic chemical vendors.36
Table 2—Major Chemistry Instrument & Diagnostic Chemical Manufacturers
Instrument Manufacturers37 Diagnostic Chemical Vendors
Abbott Laboratories Bio-Rad Laboratories, Inc
Bayer Corporation Diagnostic Chemicals Limited
Beckman Coulter, Inc. Daiichi Pure Chemicals Co., Limited
Roche Diagnostics/Boehringer Mannheim International Reagent Corporation
Dade International, Inc. King Diagnostics, Inc.
Olympus Optical Company New England Diagnostics
Ortho-Clinical Diagnostic Company Reagent Applications, Inc. (Raichem)
Pacific Biometrics, Inc. Shino-Test Co.
Sigma Chemical Company
Trace America, Inc.
Wako Pure Chemical Industries, Inc.
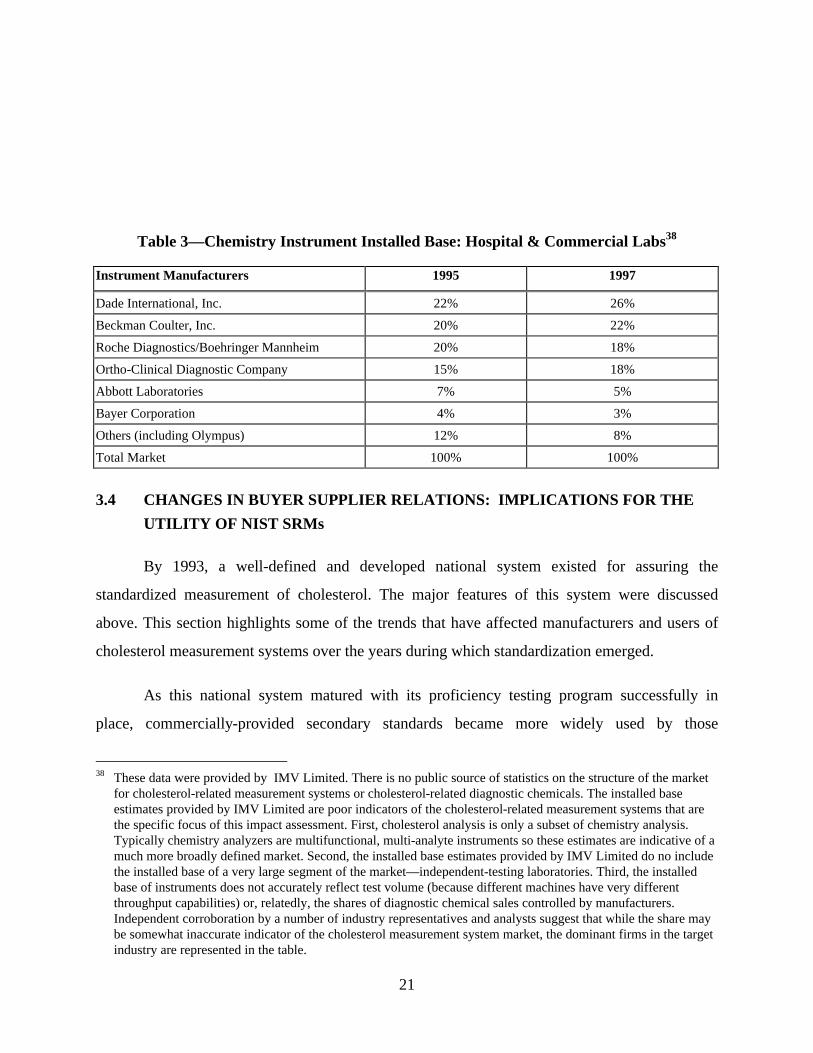
Table 3 provides estimates of the market shares of the dominant manufacturers of blood
chemistry measurement systems.
closed systems.
36 Instrument manufacturers produce both cholesterol-specific measurement instruments and multi-analyte instruments. As discussed in the text, most instrument manufacturers also produce and/or market the diagnostic chemicals that accompany their instruments. No attempt was made to identify the product models associated with each manufacturer and the shares of these instruments command for each of the three distinct market niches (hospital labs, physician office laboratories, and independent labs). Instruments and their related diagnostic chemicals are complementary.
37 Instrument manufacturers also manufacture and/or market the complementary diagnostic chemicals (reagents, calibrators, and controls) utilized in their instruments.
21
Table 3—Chemistry Instrument Installed Base: Hospital & Commercial Labs38
Instrument Manufacturers 1995 1997
Dade International, Inc. 22% 26%
Beckman Coulter, Inc. 20% 22%
Roche Diagnostics/Boehringer Mannheim 20% 18%
Ortho-Clinical Diagnostic Company 15% 18%
Abbott Laboratories 7% 5%
Bayer Corporation 4% 3%
Others (including Olympus) 12% 8%
Total Market 100% 100%
3.4 CHANGES IN BUYER SUPPLIER RELATIONS: IMPLICATIONS FOR THE
UTILITY OF NIST SRMs
By 1993, a well-defined and developed national system existed for assuring the
standardized measurement of cholesterol. The major features of this system were discussed
above. This section highlights some of the trends that have affected manufacturers and users of
cholesterol measurement systems over the years during which standardization emerged.
As this national system matured with its proficiency testing program successfully in
place, commercially-provided secondary standards became more widely used by those
38 These data were provided by IMV Limited. There is no public source of statistics on the structure of the market
for cholesterol-related measurement systems or cholesterol-related diagnostic chemicals. The installed base estimates provided by IMV Limited are poor indicators of the cholesterol-related measurement systems that are the specific focus of this impact assessment. First, cholesterol analysis is only a subset of chemistry analysis. Typically chemistry analyzers are multifunctional, multi-analyte instruments so these estimates are indicative of a much more broadly defined market. Second, the installed base estimates provided by IMV Limited do no include the installed base of a very large segment of the market—independent-testing laboratories. Third, the installed base of instruments does not accurately reflect test volume (because different machines have very different throughput capabilities) or, relatedly, the shares of diagnostic chemical sales controlled by manufacturers. Independent corroboration by a number of industry representatives and analysts suggest that while the share may be somewhat inaccurate indicator of the cholesterol measurement system market, the dominant firms in the target industry are represented in the table.
22
performing clinical testing. NIST SRMs were reserved for use at the highest level of the
traceability chain. The net result was that the routine use of SRMs declined. As discussed in
detail in Chapter 4, the timeframe selected for this economic impact assessment is one in which
the widespread use of NIST’s cholesterol SRMs was in decline.
In 1949, a national survey on total cholesterol measurement among clinical laboratories
showed an inter-laboratory comparability of approximately 24 percent, reflecting a large
variability of measured cholesterol values from one institution to the next. By 1969 this
variability had decreased to 18.5 percent, and by 1983, to 6.4 percent. By the early 1990s, inter-
laboratory comparability ranged from 5.5 –7.2 percent, showing stability over the intervening
decade.
When NIST became involved in the standardization of cholesterol measurement, no
consensus existed as to what analytic method most accurately measured cholesterol. In 1977,
clinical laboratories still faced a “quandary” when choosing among a variety of complex
measurement methods.39 The wide variety of analysis methods, in itself, would have been
sufficient to cause high variability in accuracy between clinical laboratories. At that time clinical
laboratories were unregulated and far less cost-sensitive than they are today. They maintained in-
house capabilities to develop and implement a variety of complex analytic procedures. Many
developed their own diagnostic chemicals (reagents, calibrators, and controls) and performed
complex and labor intensive analysis functions.
Simultaneously, instrument and chemical manufacturers were striving to incorporate a
variety of measurement methods into instrument systems that automated the labor-intensive
processes performed in the clinical laboratories. Competition among manufacturers no doubt
emphasized the differences among measurement systems adding additional layers of complexity
to choices facing clinical laboratories.
In addition to the trend toward standardization, in which NIST has played a prominent
part, two other trends have affected the manner in which NIST’s contributions to standardization
have been realized. First, there was a shift within the community of manufacturers and users
23
from “wet chemistry” to “dry chemistry” measurement technologies. The wide introduction of
enzymatic reagents (dry chemistry) in the late 1960s early 1970s heralded a major change in the
“process technologies” with which cholesterol had been measured for 50 years. These dry
chemistry technologies had numerous advantages over traditional technologies.40 The cholesterol
measurement methods that became the basis for national traceability in the early 1980s at NIST
and CDC are “wet chemistry” methods. While typically more accurate than dry chemistry
methods, these wet chemistry (or “strong acid” methods) were too complex and costly for the
large volume requirements of the routine laboratory.41
With increasing automation and the movement to “closed systems,” in which
measurement instrument and related diagnostic chemicals are sold as an integrated system, the
wide use of NIST’s SRMs declined. The accuracy of diagnostic test kits that were marketed to
clinical laboratories was assessed by the manufacturer (rather than the clinical laboratory) either
directly or through the CDC system. In other words, as the Cholesterol SRMs program matured
SRMs were increasingly needed only at the highest level to provide traceability of the entire
system to NIST.
In retrospect, the technological trends favoring dry chemistry also had ramifications for
highly trained analytical chemists that determined the quality assurance practices of clinical
laboratories. The exodus of clinical chemists from clinical laboratories to manufacturers was
foreseen by one observer:
As regards their analytical role, clinical chemists should continue to perform significant analytical function in the overall practice of laboratory medicine; however, where they apply their analytical expertise may change. If advanced instruments will be completed automated, have built-in quality assurance capabilities, and be able to monitor their own performance and status, highly trained personnel may not be needed in the laboratory to perform these functions. However, these functions will shift to industry, to join method development and evaluation, and will require trained personnel with expertise in research and development. Thus, the clinical chemists of the future will more
39 B. Zak, “Cholesterol Methodologies: A Review,” Clinical Chemistry, Vol. 23, No. 7, 1977, pp. 1201-1214. 40 C.A. Brutis, “New Technologies to Improve Laboratory Testing,” in E.W. Bermes (ed.) The Clinical Laboratory
in the New Era, Washington, D.C., AACC Press, 1985. 41 B. Zak and J. D. Artiss, “Some Observations on Cholesterol Measurement in the Clinical Laboratory,”
Microchemical Journal, Vol. 41, 1990, pp. 251-270.
24
probably be employed in industry than in a hospital. This translocation is already occurring: a recent study by the American Association for Clinical Chemistry found that, in 1976, 57% of new AACC members worked in hospitals and 16% in industry; by 1982 these numbers had changed to 37% (hospitals) and 36% (industry).
A second important trend that has unfolded along with the trend toward cholesterol
measurement standardization was an increasing emphasis on cost-control in the health care
industry. The health care industry has undergone a dramatic restructuring over the last two
decades in large part to contain the high and rising costs of US health care.42 With technological
trends reducing the demand for the expertise of clinical chemists in the laboratory setting, and
cost-containment pressures being exerted throughout the healthcare industry, it is to be expected
that only the most essential and cost-effective quality practices would be retained in the clinical
laboratory environment.
Today, NIST’s cholesterol SRMs remain an important part of the traceability chain for
clinical laboratories and cholesterol measurement system manufacturers. However, the
importance of NIST’s cholesterol SRMs is increasingly felt at a distance, through the CDC’s
manufacturers certification program for measurement system manufacturers. As explained in
section 2.3.2, NIST’s cholesterol SRM anchors the CRMLN’s assessment of cholesterol
measurement accuracy to the national standard of cholesterol purity.
42 These trends were synthesized from a variety of sources and reported in NIST Planning Report 98-2, The
Economics of a Technology-Based Service Sector, especially Chapter 7, “Case Study: Barriers to Technology Development and Implementation in the Health Care Industry,” pp. 121-141.
25
4. ECONOMIC ASSESSMENT FRAMEWORK
4.1 NIST’S CHOLESTEROL STANDARDS PROGRAM OUTPUTS
The primary outputs of NIST’s Cholesterol Standards Program being evaluated in this
report are the following cholesterol-related standard reference materials: SRM 911, SRM 909,
SRM 1951, and SRM 1952. NIST’s SRMs are widely used throughout the clinical laboratory
industry supply chain, primarily to assign cholesterol concentration values to commercial
secondary reference materials, also known as commercial calibrators.
This economic impact assessment focuses on the use of these SRMs by manufacturers of
cholesterol measurement systems, diagnostic chemical manufacturers, and the clinical
laboratories that use NIST SRMs to perform quality control and assurance.
4.2 EVALUTION FRAMEWORK AND APPROACH
4.2.1 Cholesterol SRMs: Mitigation of Market Failures
The existence of market failures is the chief economic rationale for government
involvement in technology development activities.43 Traditionally, NIST has provided those
elements of an industry’s technology that must be shared in order to have a significant economic
impact. Economists refer to such technologies as “infratechnologies.”44 Because of the “public
goods” character of such technology infrastructure (resulting from common use) private firms
tend to underinvest in its development. For a private firm, the problem of capturing sufficient
returns from investment in such a technology is accentuated by the prospect of several companies
developing alternative infratechnologies (different approaches to performing the same test). Only
one version, or a hybrid of several versions, is eventually accepted as the industry standard so
investments in the other versions have to be written off.
43 R. G. Noll, “Economic Perspectives on the Politics of Regulation,” in Handbook of Industrial Organization, Vol.
II, R. Schmalensee and R. Willig (Eds.) Elsevier 1989, pp. 1253-1287 44 G. Tassey, The Economics of R&D Policy, (Quorum Books) 1997.
26
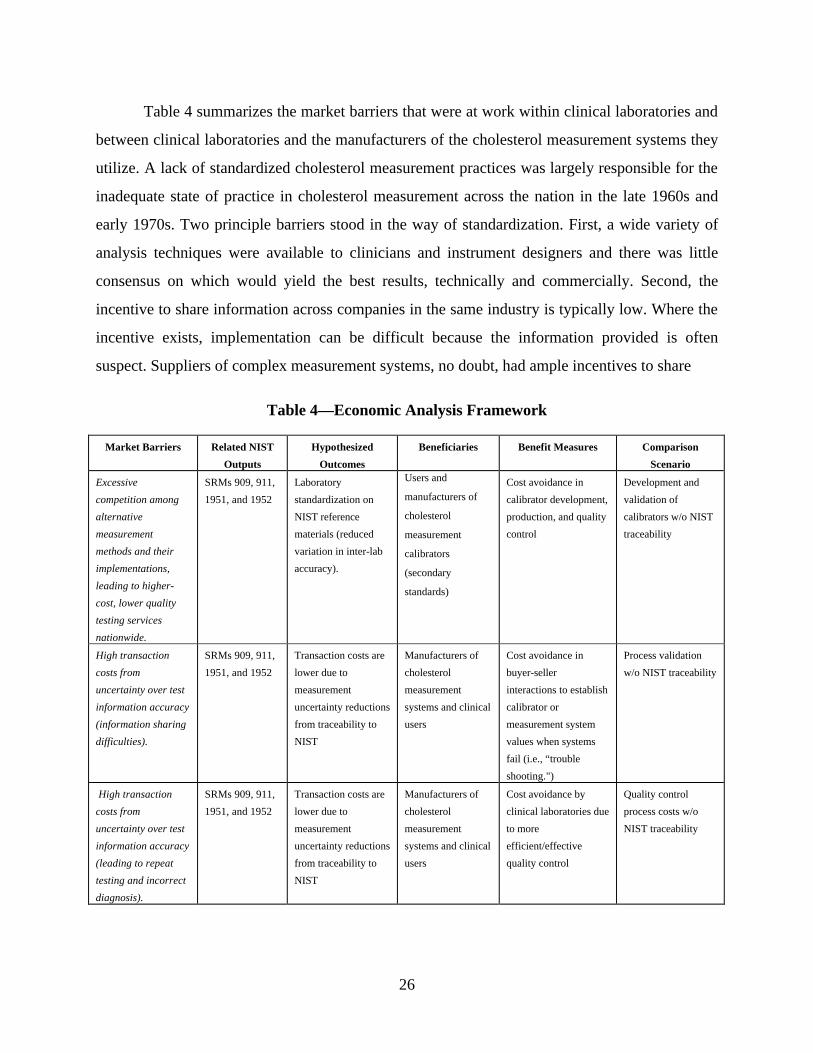
Table 4 summarizes the market barriers that were at work within clinical laboratories and
between clinical laboratories and the manufacturers of the cholesterol measurement systems they
utilize. A lack of standardized cholesterol measurement practices was largely responsible for the
inadequate state of practice in cholesterol measurement across the nation in the late 1960s and
early 1970s. Two principle barriers stood in the way of standardization. First, a wide variety of
analysis techniques were available to clinicians and instrument designers and there was little
consensus on which would yield the best results, technically and commercially. Second, the
incentive to share information across companies in the same industry is typically low. Where the
incentive exists, implementation can be difficult because the information provided is often
suspect. Suppliers of complex measurement systems, no doubt, had ample incentives to share
Table 4—Economic Analysis Framework
Market Barriers Related NIST
Outputs
Hypothesized
Outcomes
Beneficiaries Benefit Measures Comparison
Scenario
Excessive
competition among
alternative
measurement
methods and their
implementations,
leading to higher-
cost, lower quality
testing services
nationwide.
SRMs 909, 911,
1951, and 1952
Laboratory
standardization on
NIST reference
materials (reduced
variation in inter-lab
accuracy).
Users and
manufacturers of
cholesterol
measurement
calibrators
(secondary
standards)
Cost avoidance in
calibrator development,
production, and quality
control
Development and
validation of
calibrators w/o NIST
traceability
High transaction
costs from
uncertainty over test
information accuracy
(information sharing
difficulties).
SRMs 909, 911,
1951, and 1952
Transaction costs are
lower due to
measurement
uncertainty reductions
from traceability to
NIST
Manufacturers of
cholesterol
measurement
systems and clinical
users
Cost avoidance in
buyer-seller
interactions to establish
calibrator or
measurement system
values when systems
fail (i.e., “trouble
shooting.")
Process validation
w/o NIST traceability
High transaction
costs from
uncertainty over test
information accuracy
(leading to repeat
testing and incorrect
diagnosis).
SRMs 909, 911,
1951, and 1952
Transaction costs are
lower due to
measurement
uncertainty reductions
from traceability to
NIST
Manufacturers of
cholesterol
measurement
systems and clinical
users
Cost avoidance by
clinical laboratories due
to more
efficient/effective
quality control
Quality control
process costs w/o
NIST traceability
27
information about the quality of their products (vs. those of their rivals) with clinical testing
laboratories. But the credibility of information shared would be suspect and the cost of verifying
it would be high. Economists refer to these costs as transaction costs.
Because of the lack of standardization, the public health risks of cardiovascular disease
were higher than desirable. From an economic perspective, the mitigation of these barriers was
the motivation for NIST’s involvement and investment in the development and dissemination of
cholesterol SRMs. In the absence of NIST’s investments, inter-laboratory variation in the
accuracy of cholesterol measurements across the nation would have lagged behind what was
historically achieved and manufacturers would have born additional private costs in attempting to
accurately assign cholesterol concentration levels to calibrators used with their measurement
systems. In addition, both cholesterol measurement system manufacturers and clinical
laboratories that use their products would have incurred additional costs in resolving disputes
with suppliers (“trouble-shooting”) concerning the sources of inaccuracies that occur in the
regular course of clinical measurement practice.
4.2.2 Comparison Scenario
Industry representatives perceive NIST as the ultimate basis, “the ground truth,” for the
levels of accuracy that has been achieved in the measurement of cholesterol. By the same token
they recognize that NIST is one facet of the larger national system—the National Reference
System for Cholesterol (NRS/CHOL)—that assures the accuracy and traceability of clinical
measurements. In the case of cholesterol SRMs, our surveys posited a counterfactual hypothesis
whereby the private sector organizations that rely upon NIST cholesterol SRMs were responsible
for developing and implementing measurement alternatives to the products and analytical
services performed by NIST.
It was difficult for industry representatives to clearly separate one component of the
national traceabilty system—the NRS/CHOL—from the whole and therefore to assess the
hypothetical cost implications of only one facet of the system being unavailable.
28
To respond, two counterfactual scenarios were adopted in the course of the survey phase
of the assessment:
• NIST ceases to perform its functions in the national traceability chain but all other facets of the NRS/CHOL remained intact
• CDC replicates the functions currently performed by NIST.45
The costs estimated in both cases are interpreted to be the cost-avoidance benefits that
accrue to industry representatives as a result of the NIST program. Since the first of the two
hypotheses produced more conservative estimates, this scenario was used to assess the impact of
the cholesterol SRMs program.
4.2.3 Impact Estimation Timeframe
NIST’s involvement in cholesterol standards goes back more than 30 years. In estimating
the economic impact of projects with this temporal scope, difficulties are often encountered in
obtaining records or recollections of costs and benefits. This is true of both the cost (NIST) and
the benefits (industry) sides. Experience suggests that ~10 years from time of study is an outside
temporal boundary for estimating costs and benefits unless relevant historical records are
available.
In 1986, NIST’s definitive method was significantly altered to update the technology.
This significant change in the capital stock of the program provided a convenient starting point
for the assessment timeframe. All pre-1986 investments are treated as “sunk costs.”46
Initially, the period from 1986 to the present appeared adequate for estimating the
economic impact of the program. Given this start date for the economic impact assessment, the
costs of updating the DM; the costs of maintaining the DM and all net costs associated with the
45 An estimate of the cost of CDC replacing NIST (a surrogate for social the cost-avoidance benefits) was
developed in communications between NIST and CDC. Personal correspondence with Dr. Ellyn Beary (NIST/CSTL), January 11, 2000.
46 A sunk cost is an investment that produces a stream of benefits over a long period of time but can never be recouped. Because it can never be recouped it has no “economic value”—no alternative employment—and should, therefore, be ignored in our calculations of economic impact.
29
development, procurement, and maintenance of relevant SRM series could be accounted for.47
(The relevant SRM series are 911, 909, 1951, and 1952.) There are a number of releases
associated with each SRM. For example, 909a and 909b were developed and released following
the modification of the definitive method in 1986.) Other organizations (for example, CAP) have
also made contributions to the development of some SRMs in the post-1986 timeframe.
It became clear during the survey phase of this study that the timeframe chosen for the
assessment biased the reported benefit estimates downward. Given the difficulties associated
with assessing NIST programs of long duration, we feel that the choice of timeframes was,
nevertheless, reasonable. Furthermore, the sentiment expressed by respondents concerning the
life-cycle of the cholesterol program’s value assures that the substantial benefit estimates
provided by respondents are a conservative assessment of the true value of the program to
society.
4.2.4 Hypothesized Outcomes
In the absence of NIST’s cholesterol SRMs, considerable expense would have to be
undertaken to replicate the process through which high-accuracy cholesterol calibrators are
produced, distributed, and used. It appears likely that the analytical methods developed and
utilized by NIST are uneconomical for the private sector to maintain and that many laboratories
today lack the capability to implement rigorous measurement methods. In part this is due to the
unit cost of highly accurate reference materials, and in part it is due to inherent limitations on the
expected demand for reference materials produced and marketed by private sector firms.48 This
aspect of barriers to wider investment in infratechnologies affects both ends of the supply chain:
the manufacturers of measurement systems (whose use NIST, or NIST traceable, primary
47 The analytical capability represented by the definitive method is utilized to assign values to all organic reference
material developed and distributed by NIST. Therefore, a fraction of the total cost associated with the modification and maintenance of the DM for cholesterol was estimated. Similarly, cholesterol is only one of 13 or more assigned analyte values for the SRM 909 series. SRM 911, 1951, and 1952 are constituents of cholesterol only. Only a fraction of the cost for development, maintenance, and distribution of the SRM 909 series was allocated to the Cholesterol Standards Program.
48 It is believed that a private sector firm would be perceived as too opportunistic to take advantage of NIST’s independent “honest broker” status and that NIST’s extensive distribution of information concerning the analytic method (the so-called definitive methods) employed by NIST would be curtailed to limit access to what would be proprietary knowledge.
30
reference materials to assign cholesterol concentration levels to secondary reference materials);
and the clinical laboratories that utilize SRMs to assure measurement quality control.
Without NIST standards, and the definitive method that anchors the accuracy of those
reference materials, the capacity to perform accurate assignment of concentration values would
be diminished and additional quality control steps would be necessary in an attempt to assure
confidence in the values assigned. In addition, disputes that arise concerning the source of errors
would be more frequent and more costly to resolve because more effort is required to establish
the source of the error and to assure that the error is not repeated.
In addition to these intermediate impacts, in the absence of sufficient investment in
NIST’s infratechnologies patients would be uncertain of their health status and clinical
laboratories would be very uncertain about the quality of the measurement systems they employ.
For manufacturers, the costs of quality control and quality assurance would be considerably
higher without NIST SRMs and the resolution of conflicts surrounding the quality of their
products and services would also be higher. In short, NIST’s cholesterol standards program
appears to substantially lower the cost of information that is critical to the pace and level of
cholesterol measurement-related transactions within the health community, especially between
clinical laboratories and their industrial suppliers. In the absence of high levels of quality
assurance, sales of measurement systems, sales of measurement services, and, ultimately, the
health of the population would certainly suffer.
To summarize, the benefits of NIST’s Cholesterol Standards Program were formulated in
terms of the following hypotheses:
• Availability of SRMs to measurement system manufacturers reduces product formulation and quality control costs, especially the cost of assigning reliable concentration values to commercially-marketed calibrators
• Availability of SRMs reduces the internal cost of quality control and quality assurance for clinical laboratories.
• Use of SRMs (traceability) reduces transaction costs for manufacturers and clinical laboratories, in the form of “trouble shooting” that occurs when products or systems fail to provide expected results.
31
5. SURVEY FINDINGS
5.1 THE SURVEY POPULATION
The survey population consists of two groups: manufacturers and clinical laboratory
service providers. Representatives of these groups were interviewed informally, by phone, during
the fact-gathering phase of the study. This was followed by an electronic mail survey. Follow-up
phone interviews and electronic mail exchanges were conducted with selected respondents to
clarify or further explore their responses.
Approximately 20 manufacturers of cholesterol measurement instruments and
complementary diagnostic chemicals were identified. Seven of the 17 manufacturers contacted
provided information on their use of SRMs, the importance of traceability to NIST and the
additional costs they would have incurred in the hypothetical absence of NIST’s definitive
method and the family of cholesterol SRMs.
Three large national independent clinical laboratories provided detailed survey responses.
The three organizations responding control scores of individual laboratories across the U.S. and
are responsible for a significant fraction of all cholesterol tests performed by independent
clinically laboratories annually. Several hospital laboratory directors responded to surveys but
since these could not be construed as a representative sample of all hospital laboratories, the
quantitative analysis of costs and benefits presented below is not based on their responses.49
5.2 QUANTITATIVE FINDINGS
Survey respondents provided estimates of internal cost avoidance realized by their
organizations due to the traceability of their products and services to the definitive method. Not
49 The impact of NIST’s cholesterol standards program on POLs was not addressed for two reasons. First, the
number of these organizations is very large and no comprehensive list could be identified. Second, in fact-finding interviews, measurement system manufacturers asserted that POL users typically lack the sophistication to adequately address the metrological issues associated with cholesterol testing and would, therefore, be unable to assess the role and impact of NIST’s cholesterol SRMs.
32
all the manufacturing respondents currently use SRMs, but all recognized that in the absence of
traceability to NIST they would have to incur additional costs.
The reported cost avoidance is of two kinds: production costs and transaction costs. In the
hypothetical absence of NIST, manufacturers and clinical laboratories would incur additional
operating costs in assigning, or validating, cholesterol concentration values to secondary or
working calibration standards. Dispute resolution costs (transaction costs), born largely, but not
solely, by the manufacturers when the measurement processes in clinical laboratory settings get
out of control, would be higher if manufacturers could not trace there value assignments to NIST.
The sum of these “costs avoided” are interpreted as the benefits to society of NIST’s
investment in the development and maintenance cholesterol SRMs and the definitive method that
assures their accuracy.
5.3 QUALITATIVE FINDINGS
Many industry respondents recognize the continuing importance of being traceable to
NIST. According to a leading manufacturer,
Traceability to a higher order reference material is a fundamental expectation of customers worldwide. The availability of reference materials directly from NIST, for use in support of product calibration by the manufacturer of an [cholesterol measurement] system, adds a significant dimension of certainty to the process and ultimately to the value of our product. This added dimension of certainty … facilitates the resolution of numerous potential problems and questions from customers when accuracy may be in question. This provides for more efficient problem resolution where the root causes may be related to operator protocols, or other system failure modes, independent of the underlying calibration.
According to a representative of one of the largest national independent testing
laboratories, “standardization is used strategically to attract national contracts. It also enables
better purchasing decisions.” While manufacturers and testing laboratories recognize the
importance of traceability, relations between clinical laboratories (buyers) and manufacturers
(suppliers) appear to have changed in complex ways.
33
Today not all laboratories have the capability to establish a reference material. Industry
respondents point out that automation of the measurement process, as well as the long-term
“de-skilling” of the clinical laboratory, has resulted in a situation where only relatively few
commercial testing laboratories have the expertise to develop even a secondary reference
material in the absence of commercially available standards traceable to NIST. According to one
survey respondent, describing the changed environment within clinical laboratories, “we no
longer have the time available to perform our own documentation.”
Independent testing laboratories have become “production operations.” While lead
laboratories within a commercial laboratory network retain high-level measurement expertise, the
experimental and research culture that used to characterize clinical testing is no longer typical.
Coupled with the manufacturers’ drive to automate as many of the measurement functions as
feasible, this de-skilling of the clinical laboratory appears to have shifted the locus of
measurement expertise to the manufacturer.
Nevertheless, the large clinical laboratories have retained market power and use it
effectively to influence the manufacturer’s quality control processes and costs. When
measurement processes go out of control, clinical laboratories consider it the measurement
system manufacturer’s responsibility to identify the problem and expend the resources to solve it.
Not surprisingly, clinical laboratory representatives report that a primary criterion for instrument
manufacturers is the maintenance of traceability to NIST.
Clinical laboratory representatives report both these trends are increasing laboratory
reliance on “closed systems” in which instrument, reagents, calibrators, and controls are sold and
assured only as a package or system. While some respondents continue to rely on “open”
systems, the trend appears to be in the other direction. Industry representatives report that closed
systems tend to obviate the direct need for NIST SRMs. In the words of one survey respondent,
“instrument calibration has become more and more difficult for a clinical lab to change.” For
these and other reasons, the College of American Pathologists is reported to have decided to
discontinue the distribution of traceable cholesterol reference materials. Other survey
34
respondents describe a trend, here and abroad, away from standard materials and toward standard
methods.
While it is difficult to say with certainty, it appears that the increasing pressure for cost-
control in clinical laboratories, and the technological trends favoring “closed” cholesterol
measurement systems, created an environment in which the CDC’s CRMLN program (certifying
measurement systems against the reference method) has been “selected” (to use an evolutionary
metaphor) over the more traditional reference material approach. CRMLN certification has
become widely regarded as “good enough.”50
Of course this reference method is traceable to a NIST standard reference material and the
definitive method. But, where manufacturers use the reference method, they are not relying
directly on the NIST’s primary standards and are effectively satisfied with measurement results
that are somewhat less accurate. In the words of one manufacturer,
The difference is that, whereas, in the past, we would have purchased the NIST material and standardized our systems ourselves, we now rely on CDC-certified labs to standardize sera for our standardization procedure. In this way, we maintain CDC certification of our systems for our customers to A-K [the Abell-Kendall measurement method — the reference method used by CDC’s CRMLN], but no longer standardize directly to the NIST material.
50 A representative of a cholesterol measurement system manufacturer explained that the company was under
considerable pressure from the clinical laboratory (customer) community to become certified through the CRMLN even though the company’s technical staff felt that the NIST reference material approach was more appropriate than the reference method.
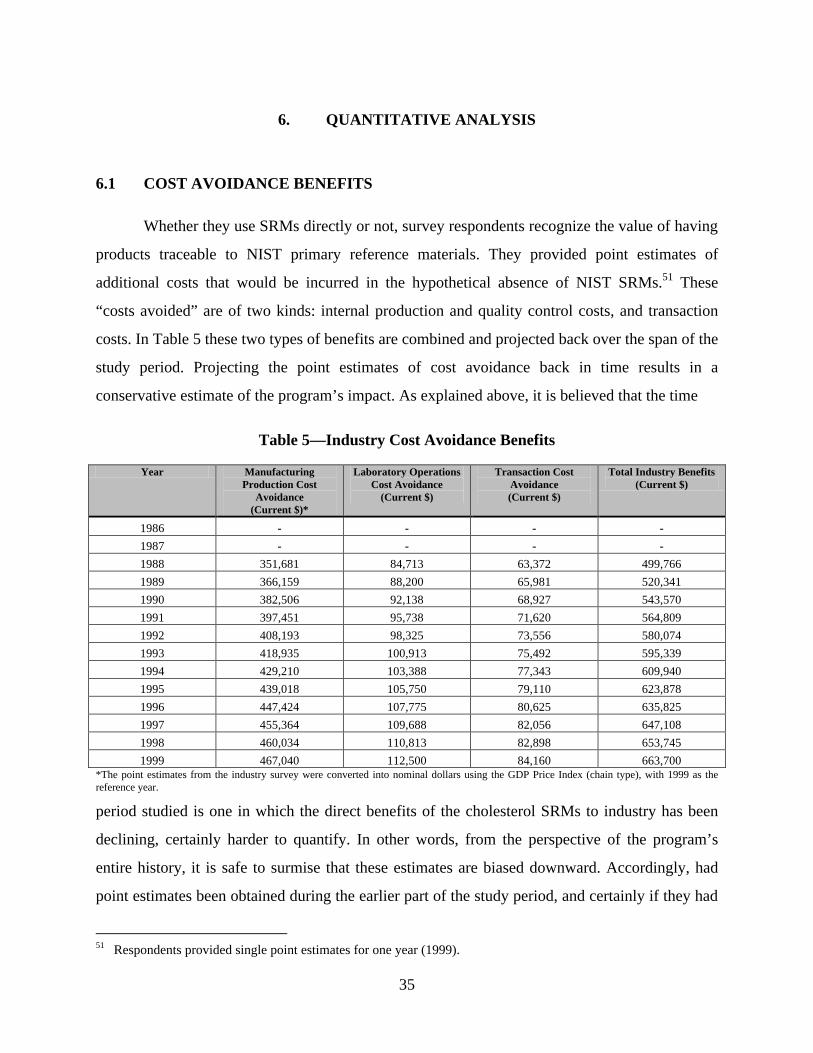
35
6. QUANTITATIVE ANALYSIS
6.1 COST AVOIDANCE BENEFITS
Whether they use SRMs directly or not, survey respondents recognize the value of having
products traceable to NIST primary reference materials. They provided point estimates of
additional costs that would be incurred in the hypothetical absence of NIST SRMs.51 These
“costs avoided” are of two kinds: internal production and quality control costs, and transaction
costs. In Table 5 these two types of benefits are combined and projected back over the span of the
study period. Projecting the point estimates of cost avoidance back in time results in a
conservative estimate of the program’s impact. As explained above, it is believed that the time
Table 5—Industry Cost Avoidance Benefits
Year Manufacturing Production Cost
Avoidance (Current $)*
Laboratory Operations Cost Avoidance
(Current $)
Transaction Cost Avoidance (Current $)
Total Industry Benefits (Current $)
1986 - - - -
1987 - - - -
1988 351,681 84,713 63,372 499,766
1989 366,159 88,200 65,981 520,341
1990 382,506 92,138 68,927 543,570
1991 397,451 95,738 71,620 564,809
1992 408,193 98,325 73,556 580,074
1993 418,935 100,913 75,492 595,339
1994 429,210 103,388 77,343 609,940
1995 439,018 105,750 79,110 623,878
1996 447,424 107,775 80,625 635,825
1997 455,364 109,688 82,056 647,108
1998 460,034 110,813 82,898 653,745
1999 467,040 112,500 84,160 663,700 *The point estimates from the industry survey were converted into nominal dollars using the GDP Price Index (chain type), with 1999 as the reference year.
period studied is one in which the direct benefits of the cholesterol SRMs to industry has been
declining, certainly harder to quantify. In other words, from the perspective of the program’s
entire history, it is safe to surmise that these estimates are biased downward. Accordingly, had
point estimates been obtained during the earlier part of the study period, and certainly if they had
51 Respondents provided single point estimates for one year (1999).
36
been obtained for the preceding era (1967-1986), these estimates would have been higher,
perhaps dramatically so.
6.1.1 Production Cost Avoidance
Out of 17 manufacturers surveyed seven responded completely. Only five provided
quantitative estimates of counterfactual cost avoidance benefits. The estimates ranged from
$6,500 per year to $220,000, with a mean cost avoidance benefit of $66,720. Since all seven
respondents recognized NIST’s value, the average annual benefit of $66,720 is assigned to all
seven for a total annual benefit of $467,040.
Three independent national clinical laboratories and several hospital system laboratories
were surveyed. Based only on the survey results from independent clinical laboratories the
average annual cost avoidance per laboratory system is $37,500. The annual cost avoidance
estimate for the three large independent clinical labs is $112,500.
6.1.2 Transaction Cost Avoidance
Only one organization provided quantitative data allowing a quantitative estimate of
transaction cost savings. Absent NIST traceable standards, according to the respondent,
laboratory personnel would spend considerably more time engaged in trouble-shooting activities.
The estimated saving per laboratory, per month, between 1990 and 2000 is 2hrs. Based on data
provided by respondents we estimate the average hourly burdened rate of a person engaged in
trouble-shooting activities between laboratories and manufacturers to be $21.92. Therefore, the
estimated transaction cost savings to a clinical lab is $43.84 per month or $526 per year. The
independent laboratories surveyed manage approximately 80 laboratories of the type where this
kind of trouble-shooting for cholesterol tests would occur. Transaction cost savings due to the
availability of NIST traceable standards is therefore estimated to be $42,080 per year for the three
independent laboratory systems surveyed. Doubling this figure to account for similar savings on
the manufacturers’ side of the trouble-shooting transaction results in a total annual transaction
cost savings attributable to NIST traceability of $84,160.
37
The total estimated annual counterfactual cost saving (benefits) attributable to NIST
traceability is $663,700.52 We project the benefits back to 1988 which was the year of the first
sale of an SRM series (the SRM 911b series) certified by means of the upgraded IDMS system.
The reader will recall that it was the investment of substantial fixed costs in the upgrading of
NIST’s mass spectrometer apparatus that determined the start date (1986) for this impact
assessment. Cholesterol SRMs have been available since 1967.
6.2 NIST EXPENDITURES
The costs associated with the development and distribution of the cholesterol SRMs that
are the focus of this impact assessment were derived from data provided by CSTL concerning
SRM sales and their distribution over time, as well as one-time equipment costs, incurred when
NIST renovated the IDSM process in, as well “other agency” cost incurred by the College of
American Pathologists (CAP) in support of the certification of some of the SRMs as several
investments made by according to procedures developed by NIST's Program Office, Strategic
Planning and Economic Analysis Group. Table 6 presents these costs over the course of the study
period.
These costs are comprised of development costs, production costs, and overhead costs.
They are derived from SRM unit price and yearly sales data except where organizations outside
NIST contributed resources. For several years the CAP-funded NIST’s SRM development and
production activities. These costs are included in the costs represented in Table 6.53
52 $467,040 (manufacturers internal process cost avoidance) + $112,500 (dominant independent clinical labs’
internal process cost avoidance) + $84,160 (transaction cost savings to independent labs and their measurement system suppliers).
53 While the detail is not shown here, no production or overhead costs were recorded prior to 1989. Production costs for 1986 and 1987 are excluded because certification of the SRMs placed in inventory in those years occurred prior to 1986. No overhead costs are shown for 1986 and 1987 since the SRMs sold in those years were developed prior to 1986. The College of American Pathologists contributed ~$150,000 (FY1999) over the course of the study period for the development and production of SRMs: $70,000 (1986); and $20,000 per year (1988, 1990, 1995, and 1996).
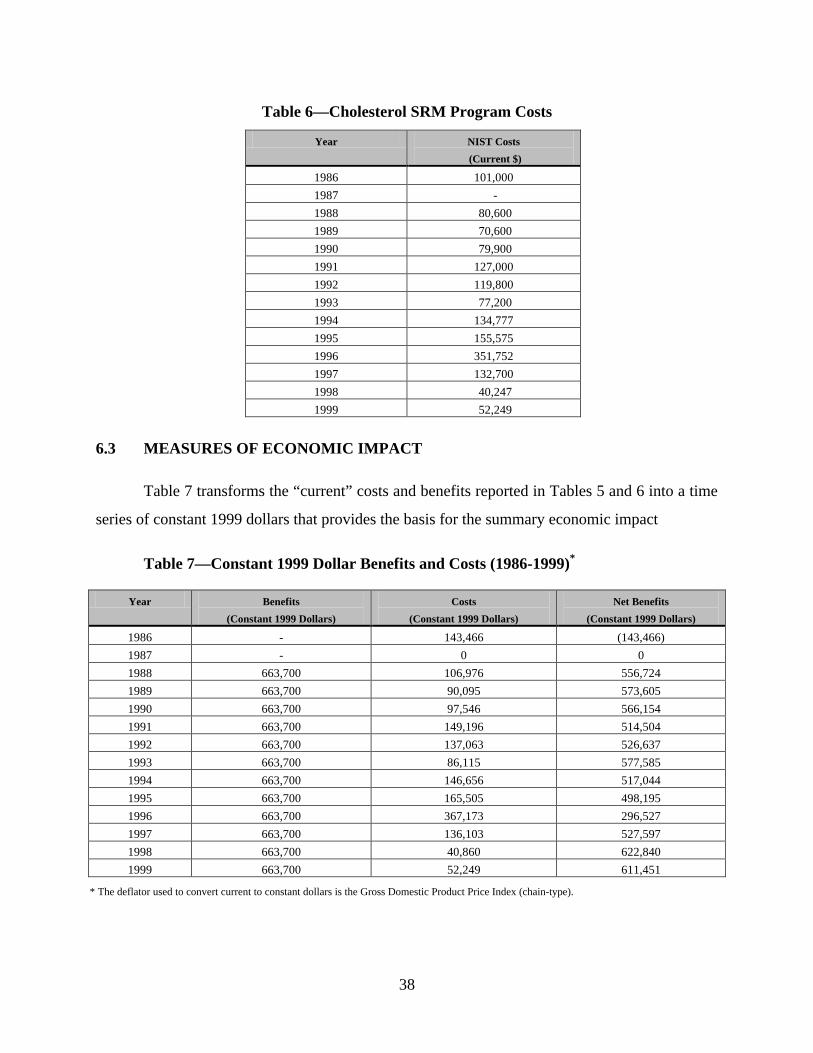
38
Table 6—Cholesterol SRM Program Costs
Year NIST Costs
(Current $)
1986 101,000
1987 -
1988 80,600
1989 70,600
1990 79,900
1991 127,000
1992 119,800
1993 77,200
1994 134,777
1995 155,575
1996 351,752
1997 132,700
1998 40,247
1999 52,249
6.3 MEASURES OF ECONOMIC IMPACT
Table 7 transforms the “current” costs and benefits reported in Tables 5 and 6 into a time
series of constant 1999 dollars that provides the basis for the summary economic impact
Table 7—Constant 1999 Dollar Benefits and Costs (1986-1999)*
Year Benefits
(Constant 1999 Dollars)
Costs
(Constant 1999 Dollars)
Net Benefits
(Constant 1999 Dollars)
1986 - 143,466 (143,466)
1987 - 0 0
1988 663,700 106,976 556,724
1989 663,700 90,095 573,605
1990 663,700 97,546 566,154
1991 663,700 149,196 514,504
1992 663,700 137,063 526,637
1993 663,700 86,115 577,585
1994 663,700 146,656 517,044
1995 663,700 165,505 498,195
1996 663,700 367,173 296,527
1997 663,700 136,103 527,597
1998 663,700 40,860 622,840
1999 663,700 52,249 611,451
* The deflator used to convert current to constant dollars is the Gross Domestic Product Price Index (chain-type).
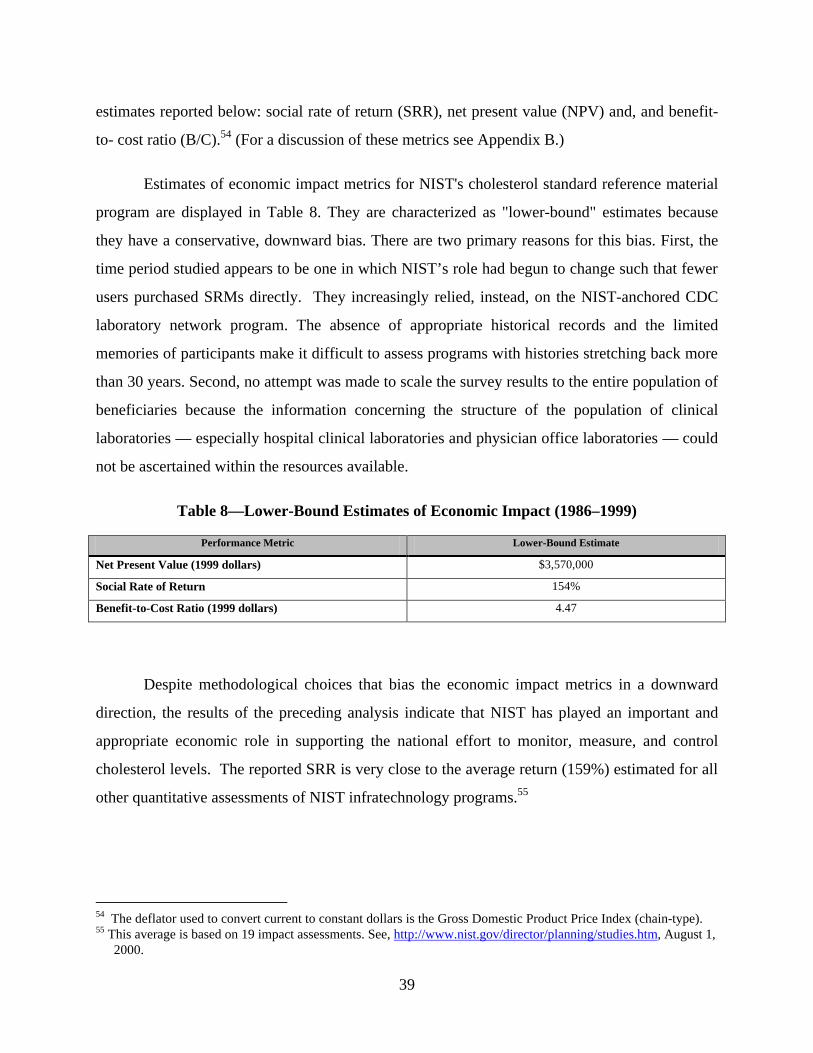
39
estimates reported below: social rate of return (SRR), net present value (NPV) and, and benefit-
to- cost ratio (B/C).54 (For a discussion of these metrics see Appendix B.)
Estimates of economic impact metrics for NIST's cholesterol standard reference material
program are displayed in Table 8. They are characterized as "lower-bound" estimates because
they have a conservative, downward bias. There are two primary reasons for this bias. First, the
time period studied appears to be one in which NIST’s role had begun to change such that fewer
users purchased SRMs directly. They increasingly relied, instead, on the NIST-anchored CDC
laboratory network program. The absence of appropriate historical records and the limited
memories of participants make it difficult to assess programs with histories stretching back more
than 30 years. Second, no attempt was made to scale the survey results to the entire population of
beneficiaries because the information concerning the structure of the population of clinical
laboratories — especially hospital clinical laboratories and physician office laboratories — could
not be ascertained within the resources available.
Table 8—Lower-Bound Estimates of Economic Impact (1986–1999)
Performance Metric Lower-Bound Estimate
Net Present Value (1999 dollars) $3,570,000
Social Rate of Return 154%
Benefit-to-Cost Ratio (1999 dollars) 4.47
Despite methodological choices that bias the economic impact metrics in a downward
direction, the results of the preceding analysis indicate that NIST has played an important and
appropriate economic role in supporting the national effort to monitor, measure, and control
cholesterol levels. The reported SRR is very close to the average return (159%) estimated for all
other quantitative assessments of NIST infratechnology programs.55
54 The deflator used to convert current to constant dollars is the Gross Domestic Product Price Index (chain-type). 55 This average is based on 19 impact assessments. See, http://www.nist.gov/director/planning/studies.htm, August 1,
2000.
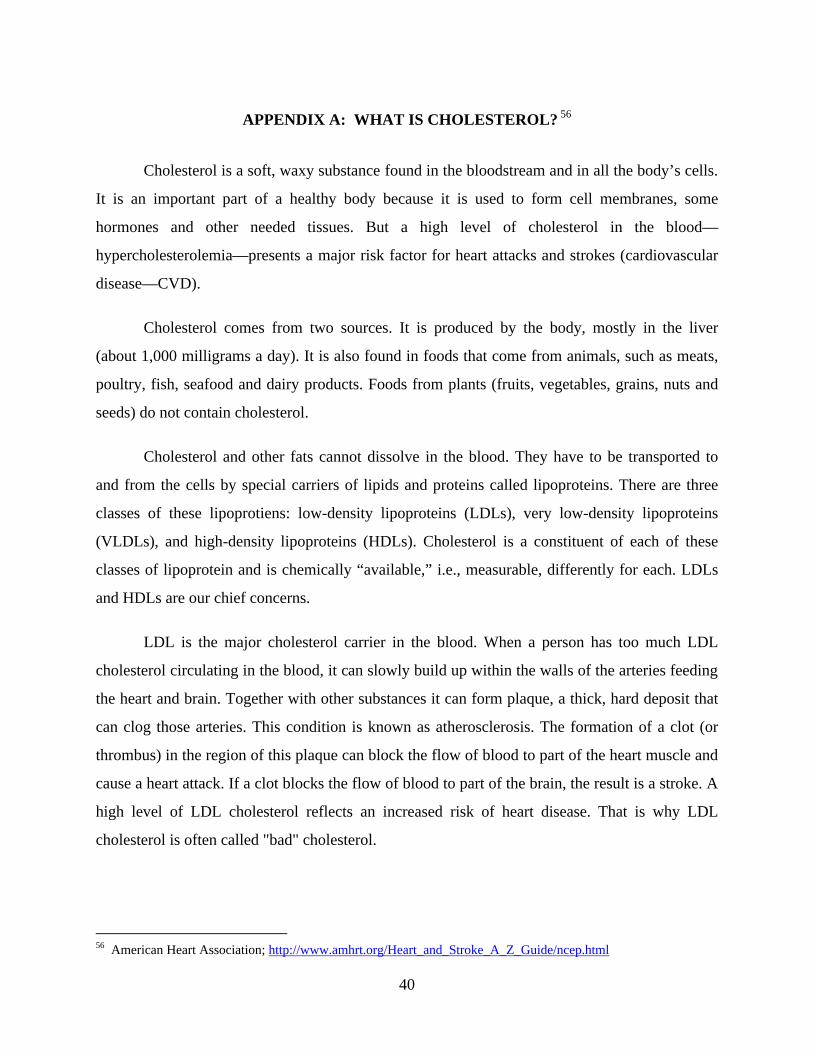
40
APPENDIX A: WHAT IS CHOLESTEROL? 56
Cholesterol is a soft, waxy substance found in the bloodstream and in all the body’s cells.
It is an important part of a healthy body because it is used to form cell membranes, some
hormones and other needed tissues. But a high level of cholesterol in the blood—
hypercholesterolemia—presents a major risk factor for heart attacks and strokes (cardiovascular
disease—CVD).
Cholesterol comes from two sources. It is produced by the body, mostly in the liver
(about 1,000 milligrams a day). It is also found in foods that come from animals, such as meats,
poultry, fish, seafood and dairy products. Foods from plants (fruits, vegetables, grains, nuts and
seeds) do not contain cholesterol.
Cholesterol and other fats cannot dissolve in the blood. They have to be transported to
and from the cells by special carriers of lipids and proteins called lipoproteins. There are three
classes of these lipoprotiens: low-density lipoproteins (LDLs), very low-density lipoproteins
(VLDLs), and high-density lipoproteins (HDLs). Cholesterol is a constituent of each of these
classes of lipoprotein and is chemically “available,” i.e., measurable, differently for each. LDLs
and HDLs are our chief concerns.
LDL is the major cholesterol carrier in the blood. When a person has too much LDL
cholesterol circulating in the blood, it can slowly build up within the walls of the arteries feeding
the heart and brain. Together with other substances it can form plaque, a thick, hard deposit that
can clog those arteries. This condition is known as atherosclerosis. The formation of a clot (or
thrombus) in the region of this plaque can block the flow of blood to part of the heart muscle and
cause a heart attack. If a clot blocks the flow of blood to part of the brain, the result is a stroke. A
high level of LDL cholesterol reflects an increased risk of heart disease. That is why LDL
cholesterol is often called "bad" cholesterol.
56 American Heart Association; http://www.amhrt.org/Heart_and_Stroke_A_Z_Guide/ncep.html
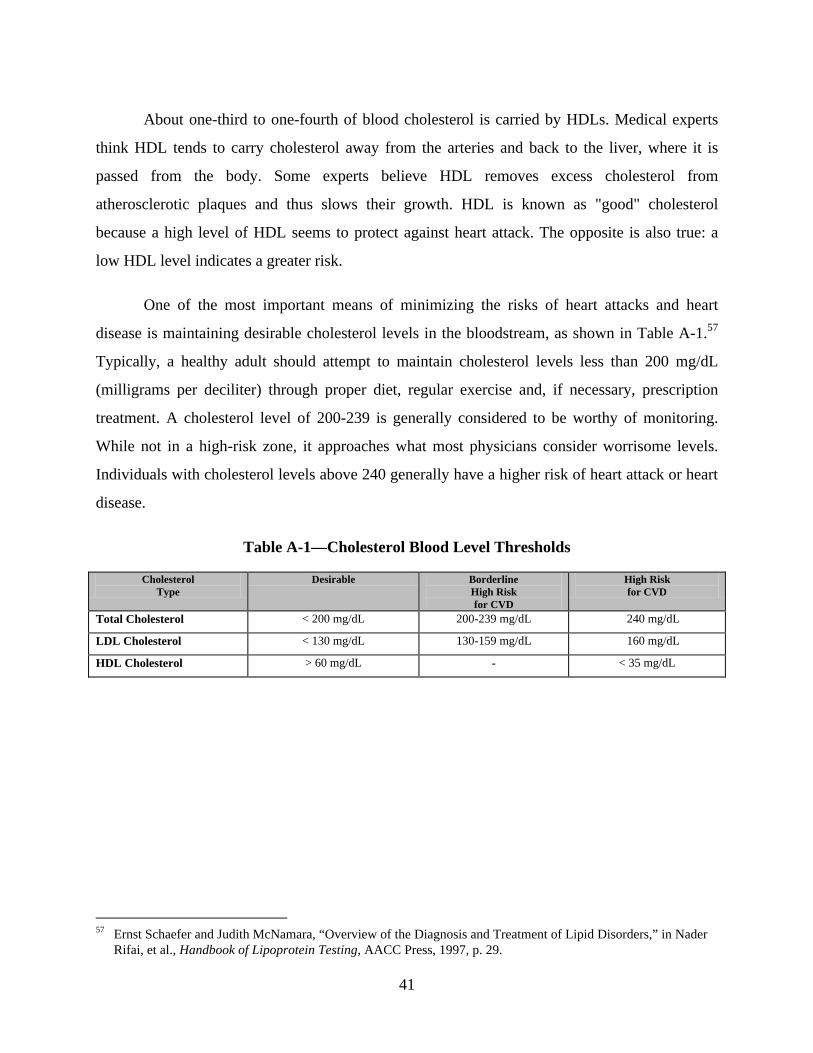
41
About one-third to one-fourth of blood cholesterol is carried by HDLs. Medical experts
think HDL tends to carry cholesterol away from the arteries and back to the liver, where it is
passed from the body. Some experts believe HDL removes excess cholesterol from
atherosclerotic plaques and thus slows their growth. HDL is known as "good" cholesterol
because a high level of HDL seems to protect against heart attack. The opposite is also true: a
low HDL level indicates a greater risk.
One of the most important means of minimizing the risks of heart attacks and heart
disease is maintaining desirable cholesterol levels in the bloodstream, as shown in Table A-1.57
Typically, a healthy adult should attempt to maintain cholesterol levels less than 200 mg/dL
(milligrams per deciliter) through proper diet, regular exercise and, if necessary, prescription
treatment. A cholesterol level of 200-239 is generally considered to be worthy of monitoring.
While not in a high-risk zone, it approaches what most physicians consider worrisome levels.
Individuals with cholesterol levels above 240 generally have a higher risk of heart attack or heart
disease.
Table A-1—Cholesterol Blood Level Thresholds
Cholesterol Type
Desirable Borderline High Risk for CVD
High Risk for CVD
Total Cholesterol < 200 mg/dL 200-239 mg/dL � 240 mg/dL
LDL Cholesterol < 130 mg/dL 130-159 mg/dL � 160 mg/dL
HDL Cholesterol > 60 mg/dL - < 35 mg/dL
57 Ernst Schaefer and Judith McNamara, “Overview of the Diagnosis and Treatment of Lipid Disorders,” in Nader
Rifai, et al., Handbook of Lipoprotein Testing, AACC Press, 1997, p. 29.
42
APPENDIX B: MEASURES OF ECONOMIC IMPACT58
Economists and business analysts use a number of measures to estimate the economic
impact of science and technology projects. The most accurate employ the “net present value”
concept whereby the value of a times series of net benefits (benefits minus cost) from an
investment project (projected or realized) are adjusted to their “present” value by means of a
“discount” rate.59 The three metrics used to characterize the economic impact of NIST’s
investments in this report are: net present value (NPV), social rate of return (SRR), and benefit-
to-cost ratio (B/C).
Net Present Value (NPV). NPV is the value of projected or realized series of net benefits
stated in “present” or “current” dollars. The adjustment of the net benefits for each period in a
time series is accomplished by a discount rate reflecting the return that could have been earned
on the money invested the project being evaluated. Mathematically,
NPV = �t=0 to t=n (B t - C t) / (1 + i)t
where (Bt - Ct) represents the net benefits associated with the project in year t and “i” is the value
of the discount rate.
Social rate of return (SRR) SRR is the value of the discount rate, i, that equates the net
present value (NPV) of a stream of net benefits associated with a research project to zero.
Mathematically,
NPV = [(B0 - C0) / (1 + i)0] + … + [(Bn - Cn) / (1 + i)
n] = 0
where (Bt - Ct) represents the net benefits associated with the project in year t, and n represents
the number of time periods (years in most cases) being considered in the evaluation.
This measure is more commonly referred to as the internal rate of return (IRR) and used
to measure relative impact of a private firm’s investment projects. Because the benefits of
58 Unless otherwise indicated, the following characterization of economic impact metrics follows closely the
discussion of Albert N. Link and John T. Scott, Public Accountability: Evaluating Technology-Based Institutions (Boston: Kluwer Academic Publishers) 1998.
59 Gregory Tassey, Rates of Return from Investments in Technology Infrastructure, NIST Planning Report 96-3,

43
NIST’s investments accrue to a large number of organizations, and these benefits are used to
calculate the economic impact of public investments, this traditional financial metric has been
called the social rate of return.60
The time series for calculating the SRR runs from the beginning of the research project, t
= 0, to a milestone terminal point, t = n. Net benefits refer to total benefits (B) less total costs (C)
in each time period. For unique solutions of i, in the equation directly above, the SRR can be
compared to a value r that represents the opportunity cost of funds invested by the technology-
based public institution. Thus, if the opportunity cost of funds is less than the internal rate of
return, the project was worthwhile from an ex post social perspective.
Benefit-to-cost ratio. The ratio of benefits-to-costs is the ratio of the present value of all
measured benefits to the present value of all costs. Both benefits and costs are referenced to the
initial time period, t = 0, as:
B / C = [�t=0 to t=n Bt / (1 + r)t] / [�t=0 to t=n Ct / (1 + r)t]
A benefit-to-cost ratio of 1 implies that the project is a break-even project. Any project with B /
C > 1 is a relatively successful project. Furthermore, the information developed to determine the
benefit-to-cost ratio can be used to determine net prevent value for each of several projects,
allowing in principle one means of prioritizing projects ex post.
Fundamental to implementing the ratio of benefits-to-costs is a value for the discount
rate, i. The calculated metrics, above, approximate the opportunity cost of public funds by
following the guidelines set forth by the Office of Management and Budget (OMB) in Circular
Number A-94, which states:
Constant-dollar benefit-cost analyses of proposed investments and regulations should report net present value and other outcomes determined using a real discount rate of 7 percent.
That procedure was followed in developing the economic impact estimates for this report.
June 1996.
60 Gregory Tassey, Rates of Return From Investments in Technology Infrastructure, NIST Planning Report 96-3, June 1996.