Embed Size (px)
Citation preview

Victorian ResidentialEfficiency Scorecard: commercialisation opportunitiesPublic background paper
Prepared for:
Victorian Department of Environment,Land, Water and Planning
22 May 2018

Page 2 of 64 www.pointadvisory.com
This report has been prepared for the Department of Environment, Land. Water and Planning (the “Client”) as outlined in the associated proposal and scope of works. The services provided in connection with this engagement comprise an advisory engagement, which is not subject to Australian Auditing Standards or Australian Standards on Review or Assurance Engagements, and consequently no opinions or conclusions intended to convey assurance have been expressed.
Point Advisory acts in a professional manner and exercises all reasonable skill and care in the provision of its professional services. The reports are commissioned by and prepared for the exclusive use of the Client. They are subject to and issued in accordance with the agreement between the Client and Point Advisory. Point Advisory is not responsible for any liability and accepts no responsibility whatsoever arising from the misapplication or misinterpretation by third parties of the contents of its reports.
Except where expressly stated, Point Advisory does not attempt to verify the accuracy, validity or comprehensiveness of any information supplied to Point Advisory for its reports. We have indicated within this report the sources of the information provided. We are under no obligation in any circumstance to update this report, in either oral or written form, for events occurring after the report has been issued in final form.
The findings in this report have been formed on the above basis.
Version control
Version Date Author Project Director
1 6 April 2018 Charlie Knaggs
Jenya Khvatsky
Christophe Brulliard
Charlie Knaggs
1.1 26 April 2018 Charlie Knaggs
Jenya Khvatsky
Christophe Brulliard
Charlie Knaggs
1.2 22 May 2018 Charlie Knaggs
Jenya Khvatsky
Christophe Brulliard
Charlie Knaggs

Integrated sustainability www
CONTENTS
EXECUTIVE SUMMARY................................................................................................................................................ 4
The case for the Scorecard...................................................................................................................................................4The design of the Scorecard.................................................................................................................................................4Commercialisation...............................................................................................................................................................5Support for the release of the Scorecard.............................................................................................................................6Governance structure..........................................................................................................................................................6Stakeholder comments on the Scorecard’s long-term future..............................................................................................7INTRODUCTION.......................................................................................................................................................... 8
Objectives of this document................................................................................................................................................8Project methodology...........................................................................................................................................................8THE CASE FOR THE SCORECARD.................................................................................................................................. 9
Background..........................................................................................................................................................................9The need for the Scorecard..................................................................................................................................................9Policy response..................................................................................................................................................................11The design of the Scorecard...............................................................................................................................................12THE MARKET FOR THE SCORECARD........................................................................................................................... 14
Value of the Scorecard.......................................................................................................................................................14Market development: supply and demand........................................................................................................................16DEMAND SIDE ANALYSIS........................................................................................................................................... 17
Market segments...............................................................................................................................................................17Willingness / ability to pay.................................................................................................................................................20SUPPLY SIDE ANALYSIS............................................................................................................................................. 22
Volume of assessors..........................................................................................................................................................22Pricing................................................................................................................................................................................24COMMERCIALISATION PATHWAYS............................................................................................................................ 25
Selecting high potential sectors.........................................................................................................................................25Likely delivery modes.........................................................................................................................................................26Price point..........................................................................................................................................................................27Market support and stimulation measures by the State Government...............................................................................28Market support and stimulation measures by other actors...............................................................................................30Market development phasing............................................................................................................................................31GOVERNANCE........................................................................................................................................................... 35
Integrity safeguards...........................................................................................................................................................36Scorecard promotion and dissemination...........................................................................................................................38Scorecard governance structure........................................................................................................................................39Stakeholder comments on the Scorecard’s long-term future.....................................................................................42
Interstate and national expansion.....................................................................................................................................42Mandatory disclosure........................................................................................................................................................42REFERENCES............................................................................................................................................................. 45Appendix 1 MARKET SEGMENTS........................................................................................................................... 46Appendix 2 STAKEHOLDER LIST............................................................................................................................. 57Appendix 3 SURVEY FINDINGS.............................................................................................................................. 58

Page 4 of www.pointadvisory.c
EXECUTIVE SUMMARY
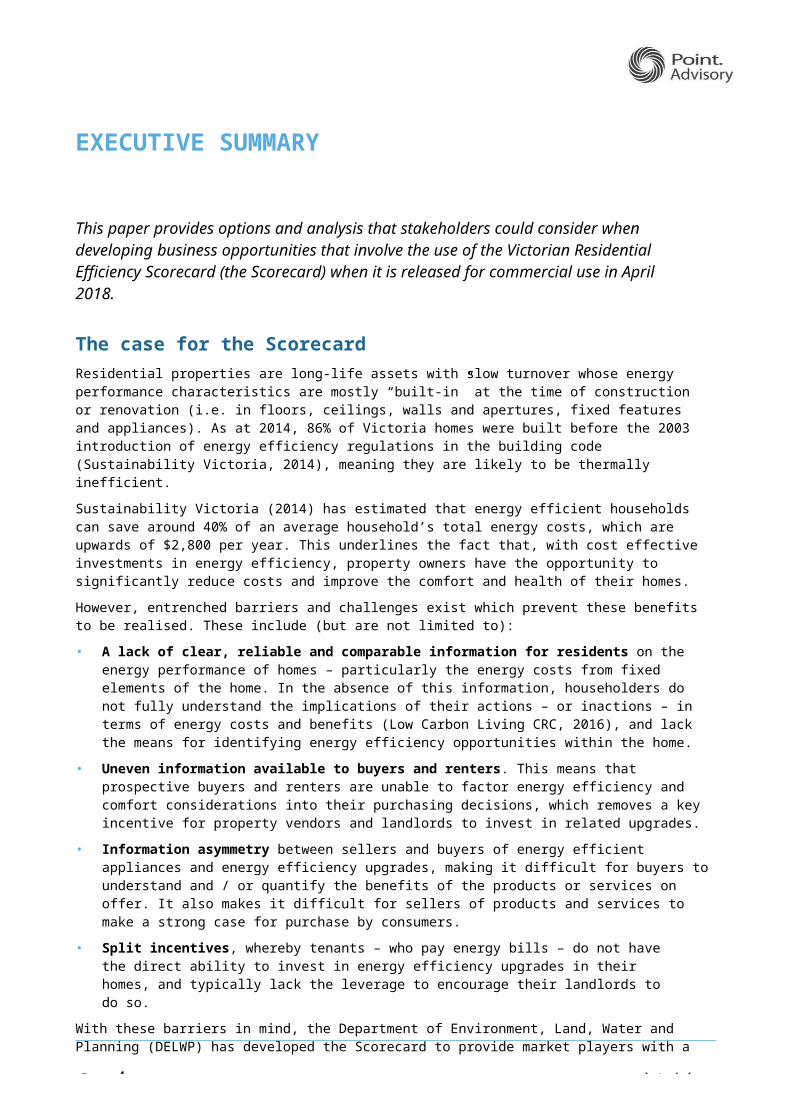
This paper provides options and analysis that stakeholders could consider when developing business opportunities that involve the use of the Victorian Residential Efficiency Scorecard (the Scorecard) when it is released for commercial use in April 2018.
The case for the ScorecardResidential properties are long-life assets with slow turnover whose energy performance characteristics are mostly “built-in” at the time of construction or renovation (i.e. in floors, ceilings, walls and apertures, fixed features and appliances). As at 2014, 86% of Victoria homes were built before the 2003 introduction of energy efficiency regulations in the building code (Sustainability Victoria, 2014), meaning they are likely to be thermally inefficient.
Sustainability Victoria (2014) has estimated that energy efficient households can save around 40% of an average household’s total energy costs, which are upwards of $2,800 per year. This underlines the fact that, with cost effective investments in energy efficiency, property owners have the opportunity to significantly reduce costs and improve the comfort and health of their homes.
However, entrenched barriers and challenges exist which prevent these benefits to be realised. These include (but are not limited to):
• A lack of clear, reliable and comparable information for residents on the energy performance of homes – particularly the energy costs from fixed elements of the home. In the absence of this information, householders do not fully understand the implications of their actions – or inactions – in terms of energy costs and benefits (Low Carbon Living CRC, 2016), and lack the means for identifying energy efficiency opportunities within the home.
• Uneven information available to buyers and renters. This means that prospective buyers and renters are unable to factor energy efficiency and comfort considerations into their purchasing decisions, which removes a key incentive for property vendors and landlords to invest in related upgrades.
• Information asymmetry between sellers and buyers of energy efficient appliances and energy efficiency upgrades, making it difficult for buyers to understand and / or quantify the benefits of the products or services on offer. It also makes it difficult for sellers of products and services to make a strong case for purchase by consumers.
• Split incentives, whereby tenants – who pay energy bills – do not have the direct ability to invest in energy efficiency upgrades in their homes, and typically lack the leverage to encourage their landlords to do so.
With these barriers in mind, the Department of Environment, Land, Water and Planning (DELWP) has developed the Scorecard to provide market players with a government-approved methodology, tool and supporting administrative framework to assess the performance of existing homes and identify cost-effective measures to improve their energy performance and comfort.
The design of the ScorecardThe Scorecard has been designed to help householders understand the factors influencing the energy consumption and cost of their homes, and to provide guidance on how to save money on energy bills and improve hot weather performance through cost-effective upgrades. A key feature of the Scorecard is to measure and communicate the energy efficiency performance of fixed features in existing homes, thereby providing an indication of the inherent energy efficiency of their dwelling independent of occupant behaviour.
After undergoing an assessment, the householder receives a certificate that provides:
• an overall star rating that represents the average cost of energy for that home

Page 5 of www.pointadvisory.c
• information about the performance of key elements of the home
• options to improve the rating of the home
• information to enable them to select a service provider who can help implement the identified options.
The Scorecard was released in March 2017 through not-for-profit organisations and local councils. Since its release, assessors have been trained and accredited to deliver the required assessments and DELWP has been consulting widely on the broader program release to the market.
The Scorecard is being made available for full commercial use in April 2018, when accredited assessors and related service providers will be able to use the Scorecard to develop and deliver commercial offerings.
CommercialisationThis study used a combination of desktop research and stakeholder consultation to identify the most promising opportunities for the commercial uptake of the Scorecard. This was done by segmenting the market for assessments into key parts, and then analysing the size and nature of these segments. Market segmentation also enables stakeholders to understand the potential customer base and to develop tailored, targeted strategies to cultivate each segment.
Priority segmentsBased on this analysis, the segments offering the greatest potential for the commercialisation of the Scorecard are:
1. Property owners – at major renovation: These property owners, who are typically also the occupiers of the home, would use the Scorecard to identify and prioritise upgrades in an objective and robust way, overcoming the concern that service providers could recommend inappropriate upgrades in preference to upgrades that would deliver the greatest benefit to the occupiers.
2. Vulnerable households – social housing: Public and community housing landlords, when considering upgrades to their properties, would use the Scorecard to decide on the most beneficial and cost-effective works to identify, prioritise and measure ongoing improvement to their property portfolios.
3. Builders – differentiation of new properties: While the Scorecard has been designed primarily for upgrades, it could be used to demonstrate excellent performance of display homes and thus attract buyers concerned about future energy bills.
In addition, two ‘high potential’ segments were identified. Point Advisory recommends these segments be targetedwhen the ‘high priority’ segments above have been addressed.
4. Vulnerable households – hardship customers: Stakeholders suggested that energy retailers could use the Scorecard to help hardship customers to manage their energy bills. The Scorecard could help retailers provide information to householders on energy saving actions and could be used to help identify and prioritise upgrades delivered by the retailer.
5. Property owners – at minor upgrade: A separate segment to the major upgrade segment above (because the financial investment would be much less), the motivators for the property owners would be similar: property owners would look for an objective assessment of potential upgrades and their benefits.
These segments are believed to present the best chances of adoption. It should however be noted that these remain niche markets that are unlikely to lead to a wide-ranging market transition without significant and ongoing effort.
The potential size of these segments is summarised in Table 1. Our analysis estimates a potential steady-state demand across these priority segments of between 5,127 and 18,236 assessments per year.
The voluntary nature of the Scorecard means that its uptake and ultimate success will depend on the generation of sufficient market interest and demand to drive initial market creation and ramp up. The priority segments outlined above, and their relative size, provide a basis for the creation of a market development plan to maximise uptake of the Scorecard.
Page 6 of www.pointadvisory.c
Table 1: Potential demand in priorty market segments
Market segment # assessments per year (low/ high)
Property owners – at major renovation Low: 2,166High: 7,039
Vulnerable households – public housing Low: 0High: 1,431
Builders Low: 261High: 848
Vulnerable households – hardship customers Low: 471High: 1,675
Property owners – at minor upgrade Low: 2,197High: 7,141
TOTAL Low: 5,127High: 18,236
Price of Scorecard assessmentsFeedback from workshops and the survey indicates that Scorecard assessments would cost approximately $320 to$350 as standalone assessments, and $250 when bundled with other services. These figures exclude costs associated with lead generation, which is currently unknown but estimated to be an additional $50 to $100 per assessment.
Support for the release of the ScorecardThe commercial success of the Scorecard program will ultimately hinge on the number of assessments being undertaken leading to an increase in energy efficiency upgrades, and subsequently to reductions in household bills, energy consumption and greenhouse gas emissions. Demonstration of beneficial use of the Scorecard can be expected to create a positive flow-on impact on demand.
Work on marketing the Scorecard is ongoing and relevant stakeholders are being consulted via a dedicated workstream. Marketing could be targeted initially on expanding demand in the recommended priority segments identified above for optimal effectiveness.
This report further explores potential pathways for government to support a “ramping up” phase and then letting the private sector take the lead on commercialisation. Best estimates are that, with significant marketing and promotional support but without direct incentives or a regulatory requirement, the number of yearly Scorecard assessments delivered could reach 10,000 at “steady state” (after approximately 5 years).
The existing pool of accredited Scorecard assessors, combined with the pool of skills and competencies in the broader Victorian home energy efficiency market suggests this number of assessors could easily be accommodated, provided the training and accreditation effort is maintained.
Governance structureThe key elements of governance for the Scorecard fall into the two following broad categories:• Guaranteeing the integrity of the Scorecard as a robust program, independent from commercial interests
(technical development, assessor oversight, program integrity)
• Driving wide use of the Scorecard (strategic oversight, promotion).
Several stakeholders throughout this engagement expressed interest in being involved in the Scorecard program on an ongoing basis, particularly in the areas of ‘Scorecard program integrity’ and ‘technical development of the Scorecard’. Stakeholders indicated they were happy to be consulted (via workshops, phone calls, etc.) once every three months.
Based on examples presented by the National Australian Built Environment Rating Scheme (NABERS) program and the Low Carbon Living CRC Report (2016) that explored some standard governance and operating structures, the following committees and workgroups could be considered for the Scorecard:

Page 7 of www.pointadvisory.c
• Marketing Advisory Committee, providing advice on possible promotion strategies and channels
• Quality Assurance and Risk Committee, periodically reviewing potential risks to the program and introducing or reviewing program controls
• Technical Review Committee, with a strong representation from assessors and the building industry to help guide the ongoing technical development of the Scorecard1.
Annual reporting to the public on the achievement of set objectives would complement the governance arrangements.
Stakeholder comments on the Scorecard’s long-term futureDuring the consultation, stakeholders of all types expressed interest in how the Scorecard program might evolve in the medium and long term. Two future delivery approaches were suggested: mandatory disclosure and expanding the Scorecard nationally. DELWP’s current focus is the voluntary delivery of the Scorecard and the following comments are based on stakeholder feedback received through the consultation process.
Interstate and national expansionExpanding the Scorecard nationally would dramatically expand the potential market for assessments, helping tosecure the scheme’s long-term viability by increasing the volume of assessments and creating greater visibility of the program. This objective is enshrined in Measure 5 of the National Energy Productivity Plan (NEPP), which is to“improve residential building energy ratings and disclosure”. DELWP is already discussing the Scorecard with other states through the existing national discussion forums on the NEPP.
Assuming DELWP continues to manage the program, expanding the scheme to a national coverage could broaden cost-sharing opportunities through assessment fees should these be introduced at some point in the future.
Mandatory disclosureThe prospect of the Scorecard as a tool in a mandatory residential energy efficiency disclosure scheme was raised by stakeholders. Under a mandatory disclosure scheme, there would be a legal requirement for property owners to advertise a Scorecard rating at the time of sale and/or lease of their property. In Australia, an example is the Commercial Buildings Disclosure (CBD) scheme which requires energy efficiency information to be provided when commercial office space of 1000 square metres or more is offered for sale or lease.
Industry consultation indicated that whilst some stakeholders are hesitant to support a mandatory scheme that would add to the regulatory burden of certain industry players, there is a belief by many stakeholders that a mandatory residential disclosure scheme will be necessary to properly transform the energy efficiency of the residential sector.
Should disclosure of residential energy efficiency ratings become mandatory at the time of sale or lease, the market size for Scorecard assessments would greatly increase. This would require careful management of the Scorecard assessors’ pool, including training and quality control.
–1 The recently released Technical Support Documentation partially addresses this point and provides transparency around decisions that have been made on the technical development of the Scorecard.

Page 8 of www.pointadvisory.c
INTRODUCTION
Improving energy efficiency in residential dwellings leads to multiple benefits including reduced costs to households, reduced energy consumption, lower greenhouse gas emissions, and crucially, healthier and more comfortable homes.
To help unlock these benefits, DELWP has developed the Scorecard to rate the thermal comfort and energy performance of existing homes.
DELWP will open the Scorecard for full commercial use in April 2018. At this point, accredited assessors and related service providers will be able to use the Scorecard to develop and deliver commercial offerings.
Objectives of this documentThis report is intended to provide options and analysis that stakeholders could consider when developing business opportunities which utilise the Scorecard when it is released for general use. The paper explores the potential commercial and non-commercial opportunities for stakeholders offered by the rollout of the Scorecard program. It outlines key aspects of the market for residential energy efficiency assessments that could be relevant to the development of a viable Scorecard-related business strategy, including:
• articulation of the value proposition to potential users
• desktop analyses of market segments, including their size and potential
• possible price-points for Scorecard assessments for various stakeholders
• possible pathways (and likely barriers) to market development.
The analysis in this report is based on the current market conditions and policy environment that the Scorecard is being released into. Whilst some consideration is given to possible future policy scenarios, these simply reflect feedback offered by stakeholders. It is not the intention of this report to canvass changes to the overarching policy framework.
Project methodologyThis paper is the product of an extensive consulting engagement conducted between July and December 2017. Key aspects of the engagement methodology included:
1. Preliminary research and analysis: The project team reviewed and analysed the literature relating to residentialenergy efficiency assessment schemes and background documentation relating to DELWP’s Scorecarddevelopment program. Key documentation reviewed as part of this process can be found in the ‘REFERENCES’section.
2. Preliminary stakeholder interviews: One-on-one interviews were conducted with key stakeholders to gain an understanding of their views regarding the Scorecard program and the ways in which it might be taken up by the market upon commercial release. A list of interview participants is provided in Appendix 2.
3. Discussion paper and workshops: Point Advisory facilitated two stakeholder workshops in November and December 2017 to seek stakeholder feedback on the preliminary market segments that had been identified, with a focus on the viability and size of these segments. A discussion paper was released prior to the workshop to provide specific information to attendees. A list of workshop attendees is provided in Appendix 2.
4. Survey: An online survey was distributed to gather further quantitative and qualitative information about the commercialisation of the Scorecard. Sixty-five usable responses were received. A summary of the survey findings is provided in Appendix 3.
5. Reporting: The results and outcomes of the previous stages were brought together into this paper.

Page 9 of www.pointadvisory.c
THE CASE FOR THE SCORECARD
The Scorecard aims to address the need to provide better information to householders about the energy cost, performance and comfort of their homes and the opportunities to improve performance in a cost-effective way.
BackgroundEnergy use in Victorian homesThere are approximately 2.36 million Victorian households, a number that will increase to 2.93 million by 2030 (Australian Bureau of Statistics, 2017). In total, these homes account for around 21% of Victoria’s total final energy use (Sustainability Victoria, 2014).
Residential properties are long-life assets with slow turnover, whose energy performance characteristics are mostly “built-in” at the time of construction or renovation in the form of their thermal shells (i.e. floors, ceilings, walls and apertures), fixed features and appliances. As at 2014, 86% of Victoria homes were built before the introduction of energy efficiency regulations in Section J of the National Construction Code in 2003 (Sustainability Victoria, 2014), meaning they are likely to be thermally inefficient.
Sustainability Victoria (2014) has estimated that energy efficient households can save around 40% of an average household’s total energy costs, which are upwards of $2,800 per year. This underlines the fact that, with cost effective investments in energy efficiency, property owners have the opportunity to significantly reduce costs and improve the comfort and health of their homes.
Barriers to residential energy efficiencyDespite the opportunities, capturing household energy savings has proven difficult due to the significant and entrenched barriers that exist. These barriers include:
• A lack of clear, reliable and comparable information for residents on the energy performance of homes – particularly the energy costs from fixed elements of the home. In the absence of this information, householders do not fully understand the implications of their actions – or inactions – in terms of energy costs and benefits (Low Carbon Living CRC, 2016), and lack the means for identifying energy efficiency opportunities within the home.
• Uneven information available to buyers and renters. This means that prospective buyers and renters are unable to factor energy efficiency and comfort considerations into their purchasing decisions, which removes a key incentive for property vendors and landlords to invest in related upgrades.
• Information asymmetry between sellers and buyers of energy efficient appliances and energy efficiency upgrades, making it difficult for buyers to understand and / or quantify the benefits of the products or services on offer. It also makes it difficult for sellers of products and services to make a strong case for purchase by consumers.
• Split incentives, whereby tenants – who pay energy bills – do not have the direct ability to invest in energy efficiency upgrades in their homes, and typically lack the leverage to encourage their landlords to do so.
In combination, these barriers create inefficient outcomes because they reduce the incentives for home owners to invest in making their properties more comfortable and energy efficient (Edge Environment, 2016).
The need for the ScorecardContextTo address the barriers to energy efficiency in the residential sector outlined above, the need for a robust energy performance evaluation and rating methodology for residential dwellings is supported by the following references:

Page 10 of www.pointadvisory.c
• The National Australian Built Environment Rating System (NABERS) has provided the framework for the efficiency and comfort features of commercial buildings to be recognised through the provision of various ratings. NABERS Energy has achieved a market penetration of 81% in the office buildings sector since its inception in 1998/99 (CBD regulations have been one driver of this uptake) and on average, buildings with multiple ratings have achieved energy savings of 36% (NABERS, 2017a). This provides a benchmark for what a program for residential buildings could aim to achieve.
• The Cooperative Research Centre for Low Carbon Living (CRC LCL, 2016) summarised recent surveys of stakeholders and concluded that there is “high consumer and industry demand for the disclosure of information on the energy efficiency performance of existing homes”.
• The American Council for an Energy Efficient Economy’s Residential Energy Use Disclosure: A Guide for Policymakers points to the need for tools to produce either an ‘operational’ or ‘asset’ rating to provide a means for communicating the energy performance of homes (American Council for an Energy Efficient Economy, 2017).
Until the Scorecard was released, there was no single accepted method of evaluating, rating, and comparing the energy performance of existing properties in Victoria, enabling a householder to obtain an assessment of energy cost performance and comfort of their property against a recognised standard. Whilst several energy efficiency rating tools have been available, none are tools that specifically address energy costs and comfort in existing homes, and none fully address the barriers to residential energy efficiency outlined above. For example:
• The Nationwide House Energy Rating System (NatHERS) is a design tool that applies to the building shell of houses and does not model energy cost.
• NABERS provides operational ratings of existing commercial buildings, retail centres, data centres, hospitals and hotels but not homes.
• Several private tools have been developed (e.g. the CSIRO’s “Liveability Tool”) but these target different barriers and home features to the Scorecard.
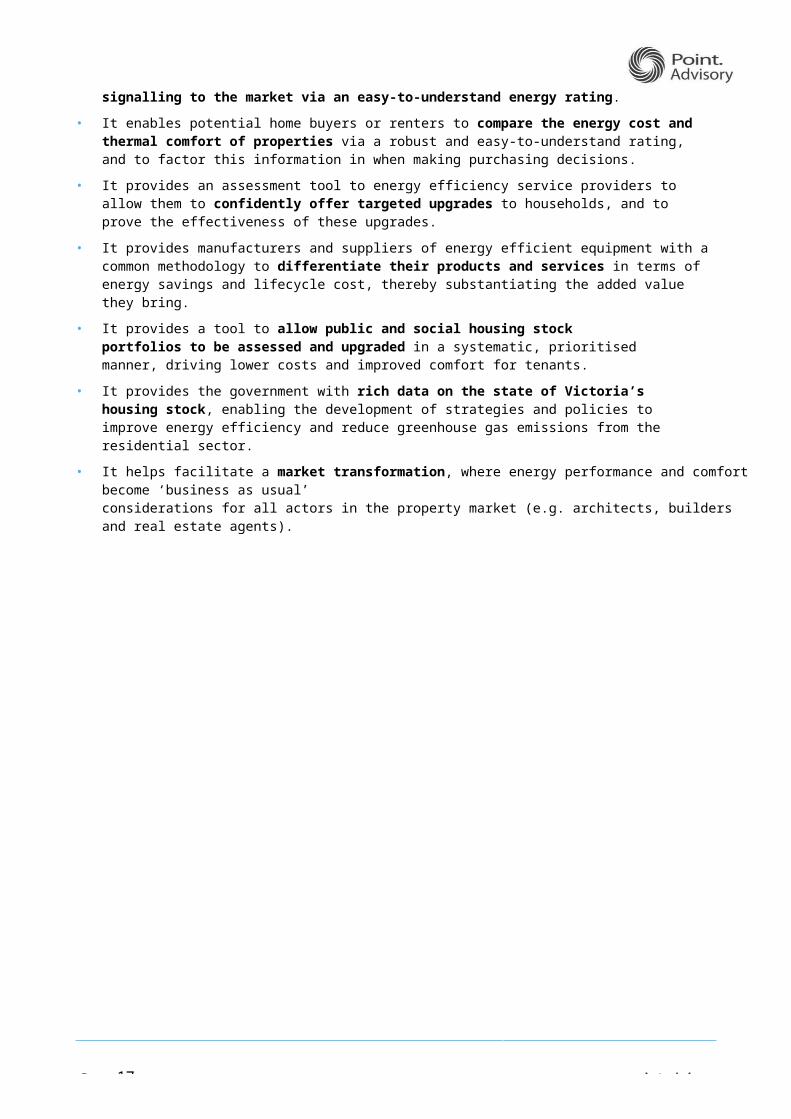
The multiple benefits of the ScorecardAn objective and credible assessment of the energy cost performance and comfort characteristics of a house and of opportunities for upgrades (e.g. the Scorecard) provides the following benefits:
• It provides a trusted, visible and communicable vehicle for understanding the energy cost and comfort of homes, while recognising the upgrade activities of home owners.
• It enables householders to identify and prioritise upgrade opportunities to reduce energy costs in the face of rising energy prices, and subsequently to improve the health and comfort of their homes (for example by improving the thermal performance of the home in hot and cold weather).
• It allows property vendors to be rewarded for investments in the efficiency and comfort of their homes at the time of sale or lease by signalling to the market via an easy-to-understand energy rating.
• It enables potential home buyers or renters to compare the energy cost and thermal comfort of properties via a robust and easy-to-understand rating, and to factor this information in when making purchasing decisions.
• It provides an assessment tool to energy efficiency service providers to allow them to confidently offer targeted upgrades to households, and to prove the effectiveness of these upgrades.
• It provides manufacturers and suppliers of energy efficient equipment with a common methodology to differentiate their products and services in terms of energy savings and lifecycle cost, thereby substantiating the added value they bring.
• It provides a tool to allow public and social housing stock portfolios to be assessed and upgraded in a systematic, prioritised manner, driving lower costs and improved comfort for tenants.
• It provides the government with rich data on the state of Victoria’s housing stock, enabling the development of strategies and policies to improve energy efficiency and reduce greenhouse gas emissions from the residential sector.
• It helps facilitate a market transformation, where energy performance and comfort become ‘business as usual’considerations for all actors in the property market (e.g. architects, builders and real estate agents).

Page 11 of www.pointadvisory.c
• It facilitates a reduction in carbon emissions and meeting Victoria’s emissions reduction target by reducingenergy-related greenhouse gas emissions in the residential sector.
Policy responseThe need for government leadershipThe Scorecard has been developed by DELWP to address the market barriers and needs outlined above. The need for government leadership is supported by research, which suggests that “support from government for voluntary schemes greatly increase[s] market uptake” (Edge Environment, 2016).
Beyond the initial investment in the technical development of the Scorecard, there is a strong case for the ongoing involvement of DELWP in the dissemination of the Scorecard:
• While there is a need for better energy efficiency information in the market, this need is largely latent, i.e. it is not recognised as such by end users, who may not immediately see the value of information and are focused on “reducing bills”. There is therefore a need to articulate the value of the Scorecard, promoting it and generally“creating a market” for it to ensure its success.
• As with any voluntary tool or program, significant effort will be required before the Scorecard becomes arecognised market standard and a “must have” for a majority of stakeholders. DELWP’s role would be akin to the role played by the NSW Office of Environment and Heritage shepherding NABERS through its early years to the point where it is now a globally recognised framework (see the ‘Alternative Policy Approaches’ section for a brief history of NABERS).
• As with any change in the property market, some stakeholders may not understand or support the Scorecard either in principle or for practical reasons: roadblocks are likely to eventuate and will need be addressed and overcome. Sustained and consistent government support and leadership is likely to be necessary to overcome these barriers.
• The greenhouse gas reduction outcomes expected from broad use of the Scorecard and subsequent investments in energy efficiency upgrades, as well as the information on the housing stock it may generate over time, can be considered ‘public goods’. In the absence of any other obvious champion, it falls to government to play this role.
• To realise this latter benefit, it is important for government to retain control over the administration and data management of the scheme so that the robustness of the assessments is not jeopardised, and data can be put to good use (by government or other parties) while adhering to the strictest data privacy rules.
These reasons justify strong and ongoing government involvement in, and support for, the Scorecard. The Victorian Government has committed to funding the Scorecard program until 2020. Future scenarios and ongoing delivery opportunities for the Scorecard are being planned now and will be informed by learnings from the 2018 commercial release.
Policy contextThe Scorecard program is also framed by government policy at the federal level via the National Energy Productivity Plan (NEPP), and at the Victorian state level via the Victorian Energy Efficiency and Productivity Strategy.
The National Energy Productivity Plan
Measure 5 of the NEPP is to “improve residential building energy ratings and disclosure”. Specifically, this measurecommits the Council of Australian Governments (COAG) to “consider a range of different tools to improve information for residential buildings”.
The Victorian Energy Efficiency and Productivity Strategy
The Scorecard is a key part of the Victorian Energy Efficiency and Productivity Strategy, which was released in November 2017. The Strategy incorporates a number of measures involving the Scorecard, as discussed in the ‘Future policy and programs’ section below.

2016: Piloting
March 2017: Initial not-for-profit release
April 2018: Commercial release
2017-18: EnergySmart program2018: Affordable Retrofits program2018-19: Healthy Homes program
Oct 2017: 300 assessments undertakenJan 2018: 450 assessments undertaken
Page 12 of www.pointadvisory.c
The design of the ScorecardThe Scorecard is a web-based tool that rates the cost, thermal comfort and energy performance of existing homes. To ensure rigour, assessments are undertaken by accredited assessors who visit the home to collect data and calculate an efficiency rating through the Scorecard. Once the assessor has completed the rating, the householder receives a certificate that provides:
• an overall star rating that represents the average cost of energy for that home (with 10 stars representing best performance);
• a rating and information about the performance of key elements of the home;
• a rating and information about performance of the home in hot conditions; and
• a range of options about how they could improve the rating of the home.
The Scorecard has been primarily designed to help householders understand the factors influencing the energy consumption of their homes and provide guidance on how to save money on energy bills – thereby addressing the barriers outlined above. Unlike other programs and tools on the market, the Scorecard measures and communicates the energy efficiency performance and average energy cost of fixed features in existing homes, thereby providing an indication of the inherent energy efficiency of the dwelling independent of occupant behaviour.
Testing and progressive roll-outTo ensure its robustness and provide stakeholders with the opportunity to contribute to its development and testing, the Scorecard has been progressively piloted and refined, as shown in Figure 1.
Figure 1: Timeline of Scorecard development and rollout
Piloting
Following extensive technical and algorithm development, the Scorecard was piloted over two tranches in 2016 by the Moreland Energy Foundation Ltd (MEFL) as a means of testing the tool in a real-world environment and identifying any issues in advance of its initial release.
Initial not-for-profit release
The Scorecard was initially released in March 2017 for use by select not-for-profit organisations and local councils (including the Brotherhood of St Lawrence, Moreland Energy Foundation Ltd, Uniting Care and South East Councils Climate Change Alliance).
During this time, experienced home energy assessors have been trained and accredited to use the Scorecard and DELWP has been consulting widely on the broader program release to the market (including through the stakeholder consultation activities conducted as part of the production of this paper). As at January 2018, over 450 valid assessments had been undertaken in Victorian households, in addition to the 300 assessments undertaken through earlier pilot stages.

Page 13 of www.pointadvisory.c
The not-for-profit release has been an opportunity for the Scorecard to be used in a relatively controlled environment. Specifically, this has provided the opportunity for:
• assessors to be trained and to gain experience outside of a purely commercial setting
• an appropriate volume of assessors to become trained in the use of the Scorecard in advance of commercial release (ensuring fair and equitable access to the tool to all assessors who applied to participate in the initial accreditation process)
• the Scorecard to be tested at scale in ‘real-world’ homes, enabling DELWP to confirm that tool was working as intended
• DELWP to gain valuable information about the Scorecard, such as the time it takes to conduct an assessment and the ways in which the Scorecard can help drive energy efficiency upgrades, and to identify support requirements for assessors to ensure high quality service delivery to the community.
Commercial release
DELWP will release the Scorecard for full commercial use in April 2018. At this point, accredited assessors and related service providers will be able to use the Scorecard to develop and deliver commercial offerings. It is important to note that several assessors have already been accredited, with more coming through regularly.
The commercial release of the Scorecard will see the Scorecard reach a broader audience and create a ripple effect through other segments of the housing market.
The rationale behind the commercial release is that the Scorecard may be integrated into existing services or may create opportunities for service providers to develop new packaged or standalone offerings that will:
• enhance their market reach or service range; or
• strengthen existing services by providing a technically robust, government-accredited basis for these offerings.
The Scorecard’s commercial release is intended to create mutually beneficial outcomes:• for government, a broader reach of the Scorecard, at limited cost
• for service providers, a stronger (or new) approach to market.
Future policy and programs
As previously mentioned, the recently released Victorian Energy Efficiency and Productivity Strategy incorporates several measures involving the Scorecard, including (but not limited to):
• up to 1,000 assessments to be conducted as part of the ‘Healthy Homes’ program
• up to 800 assessments as part of the ‘Affordable Retrofits’ program, during 2018 and 2019;
• at least 200 assessments as part of the ‘EnergySmart Public Housing’ program during 2017 and 2018.

Page 14 of www.pointadvisory.c
THE MARKET FOR THE SCORECARD
While the need for the Scorecard has been established, turning this need into a commercial proposition is a different matter. It requires thinking in terms of value creation and analysing the dynamics of supply and demand.
Value of the ScorecardThe primary value of the Scorecard to its main stakeholder groups – households, landlords, service providers and government – is in improving understanding of the energy performance of the housing stock at an individual and aggregated level, leading to decisions to upgrade buildings and appliances and save money on energy bills. The Scorecard’s rating also provides a comparable scale that enables the value of a property to be linked to its energy performance. The Scorecard should enable the following:
• Energy cost savings for householders by providing a credible and trusted way of assessing home energy performance and subsequently identifying and prioritising upgrade opportunities. This is especially important for low income households, who typically spend a higher proportion of their income on energy.
• Greater health and comfort outcomes for occupiers through an increased ability to identify measures that could affordably improve the relevant aspects of the home, and by providing a way for the value of these characteristics to be communicated to potential buyers and tenants.
• Increased volumes of business for energy efficiency service providers (translating into economic activity and contributing to gross state product) by providing a tool that can be used to deliver standalone assessments, identify targeted upgrade opportunities and verify the effectiveness of services delivered.
• Savings in residential energy use and associated greenhouse gas emissions, benefitting society as a whole.
• Delayed need for electricity network augmentation (i.e. aggregated together, household energy efficiency improvements can result in significant reductions in overall and peak demand).
A more detailed breakdown of the expected value of the Scorecard to various stakeholders is summarised in Table 2.
This articulation of the value of the Scorecard provides a starting point for the market analysis (and market segments) presented in the next sections.
Table 2: Expected value of the Scorecard to key stakeholder groups
Group Stakeholder Use of Scorecard
Value / benefit of Scorecard
Property owners, buyers and renters
Private property owners
Home improvement
Obtain an assessment of their property to: understand the energy costs, performance and comfort of the home,
and the potential for improvements understand options available and prioritise investment in upgrades to
improve energy efficiency.
Signalling value to the market
Obtain and use the Scorecard rating to attract a premium sale price bydemonstrating the property’s lower ongoing energy costs.
Social / community property owners (including community housing organisations)
Home improvement
Obtain an assessment of the property to: understand the energy costs and performance of the home, and the
potential for improvements understand the thermal comfort of the home, particularly when it is
being tenanted by vulnerable customers prioritise investment in upgrades to improve energy efficiency.

Page 15 of www.pointadvisory.c
Group Stakeholder Use of Scorecard
Value / benefit of Scorecard
Home buyers / renters
Home selection Compare properties to buy or rent based on the likely running costs, comfort and energy efficiency features.
Industry Assessors Assessments for property owner
Deliver accredited, comparable assessments and an easy-to-understand rating using a government-backed, trusted, robust tool.
Source of business
Opportunity to secure new sources of revenue from providing assessments, facilitating upgrades and/or facilitating finance.
Energy efficiency services providers
Source of business
Opportunity to secure new business for sale of upgrade-related services and/or equipment.
Validate the benefits of products or upgrade services or link to Victorian Energy Upgrades program or similar programs (leading to increased business).
Finance providers
Source of business
Opportunity to secure new business providing upgrade-related finance to property owners using the Scorecard as a tool to identify/validate upgrades.
Other Victorian Government (including the Department of Health and Human Services as Victoria’s largest landlord)
Home improvement
Obtain an assessment of government-owned public housing to: understand the energy costs and performance of the home, and the
potential for ongoing improvements understand the thermal comfort of homes, particularly when they are
being tenanted by vulnerable customers prioritise investment in upgrades to improve energy efficiency ( select and manage the property portfolio.
Aggregate data Develop an aggregated standardised baseline of the energy performance ofthe State’s housing stock, thereby quantifying potential for cost-effective energy and GHG savings helping to inform policy development tracking progress of GHG reduction initiatives.
Reduce energy- related costs and GHGs
Assess the public and community housing stock, enabling better insight and management of utility costs, comfort and health outcomes and scheduling of maintenance activities.
Not-for-profit groups(e.g. advocates for low socio- economic tenants or local energy groups)
Advocacy Leverage Scorecard to: understand and advocate for increased levels of comfort and efficiency design interventions to reduce utility costs / improve comfort and health
outcomes for low income housing help inform program development (incl. grants/rebates) determine areas of need for efficiency upgrades for low income housing.
Designers / builders / developers
Design of new homes
Quantify and advertise home performance above minimum standards and use to differentiate from other properties.
Renovations to existing homes
Identify and prioritise actions to improve the comfort and efficiency of homes during renovation and design.
Local government
Meet council energy efficiency objectives
Deliver programs to improve the efficiency and comfort of homes in the LGA using a credible and robust tool.
Energy retailers Home assessment
Option to support energy hardship customers to identify reasons for low comfort / high utility bills and subsequent potential improvements.

Page 16 of www.pointadvisory.c
Market development: supply and demandWhile the parameters impacting the development of a new market can be complex, a commercial opportunity typically arises when an existing need or demand for a product or service can be met by a suitable offering on the supply side, at an acceptable price, for a suitable quality of service or product. When one of these elements is out of balance (for example the acceptable price for the supplier to deliver a product is higher than the maximum price the customer is ready to pay) then the market may not exist.
Of course, the situation is rarely clear cut: the market can be segmented and suppliers selling at a high price may find some market demand due to a specific characteristic of the product or because a small number of potential customers might not be sensitive to price. There is therefore a potentially complex relationship between supply and demand, which depend on price and other factors:
• On the demand side, the perceived value by customers influences their willingness to pay for the service.Willingness to pay is also influenced by other factors, such as budgetary constraints. Perceived value depends on various factors including their personal values and their susceptibility to persuasion.
• On the supply side, the capacity to deliver is important and may depend on previous investment in training or, for a product, the maturity of the product along its lifecycle. It will also depend on price or on the ability to open a new market for a supplier.
The service level and quality standard are effectively set through the technical requirements for the Scorecard and the quality controls and governance mechanisms that have been put in place.
Figure 2 shows the way in which the analysis of commercialisation of the Scorecard is undertaken in this report.
Figure 2: Schematic of commercialisation analysis conducted in this report
Each box represents a chapter, and each numbered item represents a subheading in the relevant chapter.

Page 17 of www.pointadvisory.c
DEMAND SIDE ANALYSIS
To estimate demand for Scorecard assessments in Victoria, it is useful to identify the different market segments and to consider how these segments may respond to different drivers or motivators. The question of ability or willingness to pay for the Scorecard is relevant to all segments and will greatly affect market size.
Market segmentsTo assess the demand for a product or service, it is useful to break the demand side into coherent market segments that will respond to different drivers and incentives, and hence may warrant targeted commercialisation strategies. For this analysis, nine market segments were initially defined based on research. Over the course of the project, this initial number has been reduced to seven segments based on stakeholder workshops and the survey conducted as part of this analysis.
The seven market segments can be broadly grouped into three end-user categories: property owners, builders and vulnerable households. All have very different levels of control over the property and hence different reasons to use the Scorecard.
Property owners, who may or may not reside at the property, have been categorised into the following segments, depending on the possible motivation for carrying out a Scorecard assessment:
1. Property owners at time of minor upgrades – using the Scorecard to identify and prioritise potential minor upgrades (such as purchasing insulation or an air conditioner or looking to transition from a wood fire to electric heating).
2. Property owners at time of renovation – using the Scorecard to support their decision making as part of a major renovation to the property’s shell and/or equipment.
3. Property owner ahead of a sale transaction – using the Scorecard rating to demonstrate uplift in the property’s market value due to energy efficiency performance of the property’s features.
4. Property owner ahead of a rental transaction – using the Scorecard rating to demonstrate uplift in the property’s rental value due to energy efficiency performance of the property’s features.
Builders, who are likely to be at the larger ‘volume builder’ end of the market, fall into the following segment:5. Volume builders wanting to differentiate – using the Scorecard rating to differentiate themselves from
competitors by highlighting the superior as built energy performance of their homes they build.
Vulnerable households, who are often renters but may also be landlords, fall into the following segments:
6. Social housing – owners of public and community housing (e.g. the Department of Health and Human Services or community housing providers) using the Scorecard to assess the efficiency, quality and comfort of their housing portfolios and identify cost-effective interventions to help low-income tenants to lower their energy costs.
7. Hardship customers of energy retailers – retailers choosing to use the Scorecard to help hardship customers manage their energy bills (see breakout box on page 56) by delivering energy assessments in a more objective and systematic way.
The overall size of the market for Scorecard assessments will depend on the uptake in these segments, which, in turn, will depend on a range of factors.
A detailed profile for each market segment (including the assumptions and sources underpinning the segment size) is provided in Appendix 1. A summary of each segment is provided in Table 3 below, including an estimate of the gross annual segment size.

Page 18 of www.pointadvisory.c
Table 3: Summary of market segments for the Scorecard program
Market segment Gross segment size Drivers for use Delivery mode Barriers Enablers Opportunities for DELWP support
1. Property owners at time of minor upgrade not requiring building permit
53,500 per annum• c. 1.5 m owner-
occupied properties in Victoria
• c. 4% or 54,933 pa undertake home upgrades
• understand the energy cost and comfort profile of the home
• identify and prioritise upgrade opportunities
• save on energy bills• reductions in greenhouse
gas emissions
• assessment undertaken by a standalone assessor
OR• bundled with the
upgrade
• owners seldom focus on energy efficiency when considering an upgrade
• bundling is commercially challenging
• cost of customer acquisition could add significantly to assessment price
• awareness of the Scorecard and its benefits (home owners and service providers)
• suppliers and installers using Scorecard for lead generation
• local governments as a reputable source of information
• market Scorecard to both householders and service providers
2. Property owners at time of major renovation
54,149 per annum• building permit
approvals by Victorian Building Authority in 2016 with value greater than $50,000 ≈ 54,149 pa
• understand the energy cost and comfort profile of the home
• identify and prioritise upgrade opportunities
• save on energy bills• reductions in greenhouse
gas emissions
• bundled into cost of renovations
OR• initiated by
homeowner to guide options to renovate, extend or rebuild
• owners seldom focus on energy efficiency when considering renovation
• perception that future potential buyers of the property won’t value Scorecard rating as a signal of additional value of the home post upgrade
• NatHERS already in use – owners may be confused by multiple ratings
• awareness of the Scorecard and its benefits (home owners and service providers)
• building designers and architects
• builders seeking to confirm / communicate the performance of their homes
• market Scorecard to both householders and service providers
3. Property owners ahead of a sale
11,910 per annum• c. 79,400 property
sales in 2015• c. 15% or 11,910 pa
are of high energy performance
• market signal of home energy cost and comfort performance
• identify and prioritise upgrade opportunities
• differentiate property from those currently on the market
• standalone assessment ahead of marketing property for sale
• buyers rarely ask about ahome’s energy performance
• real estate agents do not ‘push’ratings
• awareness of the Scorecard and its benefits (home owner and buyers)
• real estate agents promoting assessments and advertising results
• market Scorecard to both householders, prospective buyers and real estate agents
Page 19 of www.pointadvisory.c
Market segment Gross segment size Drivers for use Delivery mode Barriers Enablers Opportunities for DELWP support
4. Property owners at the time of rental
9,765 per annum• c. 65,100 rental
properties in 2015• c. 15% or c. 9,765 pa
are of high energy performance
• market signal of home energy cost and comfort performance
• identify and prioritise upgrade opportunities
• differentiate property from those currently on the market
• standalone assessment ahead of marketing property
• current tight rental market decreases need for owners to differentiate via enhanced energy and comfort performance
• split incentives whereby owner does not reap direct financial benefit of upgrades
• awareness of the Scorecard and its benefits (home owners and renters)
• real estate agents promoting assessments and advertising results
• market Scorecard to both householders, prospective tenants and real estate agents
5. Volume builders seeking differentiation
6,525 per annum• c. 43,000 new
properties built• c. 15% or 6,525 pa are
of high energy performance
• differentiate their product based on energy cost and comfort performance
• provide a robust and easily communicable star rating designed for public communication of energy performance
• assessment on a display home to create a “model” rating
• model rating adjusted for specific home at design & handover
• NatHERS already in use – owners may be confused by multiple ratings
• builders need to be aware of the Scorecard program, how it is different to NatHERS and how it could benefit them
• Volume builder sales teams and Real Estate agents play a key role
• market Scorecard to builders
• collaborate with builders to deliver pilot ratings for new builds
6. Social housing 1,431 per annum• c. 71,500 non high-rise
dwellings owned by Dept of Health & Human Services
• c. 10%, (7,150) used for upgrade reference scenarios over a 5- year program
• understand the aggregated energy performance of property portfolio
• identify and prioritise upgrade opportunities
• reduce energy-related subsidies
• improve tenant health and comfort
• assessment undertaken by a standalone assessor employed by a social services organisation
• requires funding • could be integrated into existing maintenance and replacement program
• work closely with DHHS to develop the business case for Scorecard assessments of public housing stock
7. Hardship customers of energy retailers
33,658 per annum• c. 33,658 households
in retailer hardship programs (2013/14)
• provide assistance to hardship customers
• identify and prioritise upgrade opportunities
• assessment undertaken by standalone assessors, possibly by social services organisations
• energy retailers not obligated to provide specific services
• limited budget of retailers for services
• energy retailers need to understand the value of using the Scorecard for hardship customers
• market Scorecard to retailers
• collaborate with retailers to deliver pilot ratings to hardship customers
.

Page 20 of www.pointadvisory.c

Page 20 of www.pointadvisory.c
For several of the market segments identified, there may be opportunities to link to the Victorian Energy Upgrades program to access incentives available for upgrades.
In Table 3, it is important to note that “gross segment size” does not represent the number of Scorecard assessments that are expected to be undertaken each year; rather it is the full market of which only a subset will elect to undertake assessments (depending on the dynamic between price point and willingness to pay). Demand volume scenarios based on the gross market size are presented in the following section.
The Opportunities for DELWP support column in Table 3 refers to activities DELWP could undertake for specific market segments in addition to the segment-wide activities listed below (and detailed in the ‘Market support and stimulation measures by the State Government’ section on page 28 of this document).
The most promising market segments for the Scorecard are presented in this section and analysed in greater detail inthe “Selecting high potential sectors” section of this report.
Willingness / ability to payPrice for a service or product is a key determinant of market volume unless the demand for the service or product is inelastic. Logic and previous studies indicate that the demand for a Scorecard assessment is highly elastic (i.e. highly responsive to price changes) in the absence of regulatory drivers. This means the demand for Scorecard assessments will quickly tend towards zero as the price increases.
Previous studiesTo understand consumers’ willingness to pay for Scorecard-type home energy efficiency assessments, the Low Carbon Living CRC surveyed 841 people. The survey results indicate that more than a third (38%) of respondents were willing to pay up to $250 for such assessments (see Table 4). This number drops to 13% of respondents for an assessment price of up to $500 (Low Carbon Living CRC, 2016).
Table 4: Consumer willingness to pay for home energy efficiency assessments (Low Carbon Living CRC, 2016)
Price of assessment % of respondents willing to pay price
> $500 4%
$500 13%
$250 38%
$100 56%
free 100%
It should be noted that these estimates only provide some indication about the actual market demand at a certain price point. Willingness-to-pay studies are subject to biases which include 'self-selection’ of survey participants, the framing of the question and the conversion from declared (hypothetical) intention-to-buy to the actual decision in the real world where budget constraints apply.
Demand volume scenarios for various price pointsTable 4 presents the estimated demand volumes for each segment identified in the previous section at a price point of$250 to $500 per assessment, based on the willingness to pay presented in Table 5. This is understood to be the cost range for delivery by commercial providers and has been confirmed anecdotally and by the survey results which found that assessors would charge an average price of around $320 for assessments. As these volumes reflect the assumptions made and the limited market intelligence available, they are subject to a high level of uncertainty and should be considered as indicative scenarios for discussion.
The volumes provided below assume that a “steady state” has been reached by the market, i.e. the market has effectively matured. The time it might take to reach this stage of full market development may vary greatly depending on the market segment and the market development effort (and budget) available but is likely to take years for most segments (based on the experience of the NABERS program).

Page 21 of www.pointadvisory.c
The proportion of upgrades per year are calculated based on findings from survey results presented in the CRC LCL (2016) report and have been adjusted for some categories based on individual circumstances. Full information can be found in the detailed segment profiles presented in Appendix 1.
Table 5: Possible volumes of assessments in Victoria at $250-$500 per assessment (modified assumptions from Low Carbon Living CRC, 2016)
\User(and use case)
Gross segment size (annual)
Possible demand for assessments per year at $250 - $500 per assessment
Possible number of upgrades per year
Property owners
1. Property owners – at minor upgrade 54,933 Low - 4%
High - 13%2,1977,141
33%66%
7254,713
2. Property owners – at major renovation 54,149 Low - 4%
High - 13%2,1667,039
50%75%
1,0385,280
3. Property owners – at time of sale 11,910 Low - 4%
High - 13%476
1,5487.5%30%
36464
4. Property owners – at time of rent 9,765 Low - 4%
High - 13%391
1,2697.5%30%
29381
Builders
5. Volume builders 6,525 Low - 4%High - 13%
261848 n/a n/a
Vulnerable households
6. Social housing 1,431 Low - 0%High - 100%
01,431
25%50%
0716
7. Hardship customers of energy retailers 33,658 Low - 1.4%
High - 5%471
1,675 unknown unknown2
TOTAL 172,370 Low High
5,96220,952
1,87311,554
When considering demand, it is important to note that the market for Scorecard assessments is likely to have a‘saturation point’ – for example, householders are unlikely to obtain more than one Scorecard rating every five years (possibly more). This is a material consideration for the long-term viability of the Scorecard as a voluntary program but has not been included in this analysis, which focuses on the immediate and medium-term commercialisation of the Scorecard.
Discussion of which of these segments should be prioritised by DELWP for the commercial release is provided in the‘Commercialisation’ section of this report.
–2 The number of actual upgrades among hardship customers is not known and will be highly dependent on complementary retrofit support programs available to this segment.

Page 22 of www.pointadvisory.c
SUPPLY SIDE ANALYSIS
This section assesses the capacity of suitable service providers to deliver Scorecard assessments to satisfy a demand that will vary greatly depending on how the various segments of the marketdevelop over time to reach a “steady state”.
This supply side analysis complements the demand side market assessment presented in the previous section.
Volume of assessorsAll Scorecard assessors must undergo training and be accredited by DELWP. These assessors are likely to be drawn from the following sections of the market:
• Assessors can work individually as “sole traders” or for an organisation that provides related services.Organisations providing assessments will range from mission-driven not-for-profit organisations looking to impact the health, comfort and amenity of low income houses through to fully commercial for-profit organisations seeking to grow their business.
• Upgrade suppliers represent the range of suppliers who ultimately deliver the upgrade-related product or service.
• Builders and designers (i.e. architects, engineers and drafters) represent a range of professionals who could be involved in the design and planning of an upgrade or new build.
Estimated number of required assessorsDiscussions at workshops and survey results suggest that dedicated assessors could conduct between two and three assessments per day. Over a 12-month period, this amounts to approximately 500 assessments that could be delivered by each individual assessor. However, these numbers would require assessors to be delivering Scorecard assessments full-time to the exclusion of any other work and are therefore considered to be a maximum. A rate of 200 assessments per assessor per year is considered to be more likely, factoring in time spent by assessors on business development and other work activities beyond just Scorecard assessments. Estimates of the number of assessors required to deliver these assessments have been modelled at rates of 50 (low), 200 (medium) and 500 (high) assessments per assessor per year, as shown in Table 6.Table 6: Estimate of the number of assessors required
Total number of assessments per year
Number of assessors required at 50
assessments per year
Number of assessors required at 200
assessments per year
Number of assessors required at 500
assessments per year
5,000 100 25 10
25,000 500 125 50
50,000 1,000 250 100
75,000 1,500 375 150
100,000 2,000 500 200
At the most likely rate of 200 assessments per assessor per year it is estimated that between 25 and 125 assessors would be required to meet the total modelled steady-state demand of 5,962 to 20,952 assessments per year.At a low-end rate of 50 assessments per assessor per year, it is estimated that between 100 and 500 assessors would be required to meet the total modelled steady-state demand.

Page 23 of www.pointadvisory.c
Potential supply of assessorsAn initial analysis of Victoria’s energy and building sector indicates that there are sufficient number of suitably qualified professionals who could be trained to become Scorecard assessors to supply the program’s requirements (see Table 7).Table 7: Potential capacity of service providers to become accredited Scorecard assessors and deliver assessments
Supplier segment
Total potential suppliers
organisations
Total potential assessors
@ 1.6assessors per organisation3
Motivators Annual capacity to deliverassessments per assessor per year
Barriers to undertaking assessment
50 200 500
Not-for-profit housing providers and social organisations offering energy assessments
> 20(depending on whether
regional communities
are considered)
~32 Meet mission to provide assistance to low income / vulnerable demographicPlatform for identifying fixed appliance and thermal fabric upgradesProvides baseline data collection for research purpose
1,600 6,400 16,000 Reliance on funding to cover cost of assessmentsChallenges identifying and recruiting households, particularly those willing to pay for the service
Commercial businesses providing residential energy assessments
> 3004 ~480 Commercial opportunityPlatform for identifying fixed appliance and thermal fabric upgrades
24,000 96,000 240,000 Difficulty identifying and recruiting potential customersSome providers already have streamlined home assessment methodologies they may wish to push ahead of the Scorecard
Total > 320 512 25,600 102,400 256,000
As at March 2018, there are 21 assessors accredited to provide Scorecard assessments, with a further 84 in the accreditation pipeline. Analysis indicates that there are over 20 not-for-profit and 300 commercial organisations in Victoria providing building energy and thermal assessments (though it should be noted that not all of these organisations will be suitable to become accredited as Scorecard assessors). Results from the survey conducted as part of this engagement found that service providers would seek to employ an average of 1.6 Scorecard assessors5, totalling 512 potential assessors across Victoria who could be trained and accredited to provide Scorecard assessments. This exceeds the highest number of assessors (500) that would be needed to conduct 25,000 assessments (the high-range estimate for demand of Scorecard assessments) as shown in Table 6.Furthermore, there are over 18,000 building tradespersons in the state, some of whom will have adequate base qualifications to be trained and accredited. Additional assessors could be sourced from this cohort if there is a shortfall in suppliers.
–3 Based on survey finding that service providers would look to employ an average of 1.6 assessors (see page 59)4 Residential Housing Industry Capabilities – ACIL Allen Consulting, 2017. Based on stakeholder consultations.5 See survey results on page 59

Page 24 of www.pointadvisory.c
Regional supplyIn some regions of Victoria, low population density could make it difficult to achieve a critical demand volume which in turn may not be enough to drive suppliers to train and accredit Scorecard assessors to enter the local market.
This is compounded by the fact that the remoteness or dispersion of potential customers will require longer travel time for the assessors, increasing their variable costs.
This will need to be considered carefully when developing a commercialisation strategy which would likely require providers to devise a specific recruitment and delivery solution for the regions including, for example, a grouping of assessment appointments according to a logical travel itinerary.
PricingPrivate sector assessors will only invest in becoming accredited to deliver Scorecard assessments if there is a sufficient return on their effort, i.e. the activity must provide a revenue comparable (or higher) to alternative activities they could undertake. This means covering both:
• Fixed costs (training6, some administration and marketing, quality control and audits), and
• Variable costs (customer recruitment, travel, scorecard delivery, administrative follow-up).
Alternatively, Scorecard assessments could be a “loss-leading” marketing activity that is not profitable in itself, butcreates an opening for profitable sales of other services or equipment.
The Scorecard commercialisation survey indicated the average price point for assessments at launch is expected to be around $320 for dedicated assessors and around $220 for energy efficiency service providers (taking into accountthose seeking to provide ‘free’ assessments as part of a bundled offering). This is broadly consistent with feedback received in workshops and interviews and aligns with other relevant research (Low Carbon Living CRC, 2016).
An important consideration for determining assessment prices is whether lead generation costs (i.e. ‘acquiring’ customers) is the responsibility of the assessor or not: such costs are significant in a nascent market with no regulatory driver and low customer awareness. Anecdotal feedback from individual assessors and assessment companies suggest that lead generation could increase costs by an additional $50 to $100 per assessment. These costs could drop if an adequate demand volume can be generated centrally (e.g. through active marketing, promotion and/or recruitment).
A higher market price for Scorecard assessments would attract more suppliers (assessors) into the market given the relatively low barriers to entry. Hence it can be assumed that, provided the price is right, the number of suppliers servicing the market will adjust as required.
–6 Training in the use of the Scorecard is provided free to prospective assessors that enter the accreditation process.

Page 25 of www.pointadvisory.c
COMMERCIALISATION PATHWAYS
This section articulates and quantifies the different pathways through which the Scorecard could be commercialised when it is made available for commercial use in April 2018.
A commercialisation pathway is the way in which key agents will use the Scorecard to create a sustainable market for assessments in each segment. By understanding these pathways, stakeholders can consider business opportunities which in turn will help drive market development.
Selecting high potential sectorsIn the demand side analysis above, the potential steady-state market for the Scorecard was estimated at between 5,962 and 20,952 assessments per year (see Table 5).
The most viable segments of those defined in the DEMAND SIDE ANALYSIS section are described below and quantified in Table 9. They have been selected through research, stakeholder consultation and the findings of the online survey.
These segments have been divided into ‘high priority’ segments, which could be pursued now, and ‘high potential’segments, which could warrant DELWP’s attention in the medium term:
High priority segments1. Property owners – at major renovation. Customers in this segment have already made a decision to improve
their homes and will therefore be considering building envelope and large home appliances. Engaging with this cohort at these important decision points will increase the potential uptake of the Scorecard (Low Carbon Living CRC, 2016). In addition, these households are by definition seeking to spend a significant sum of money (greater than $50,000) on their home, and the cost of a Scorecard assessment will be small in comparison, further increasing the likelihood of uptake. The survey conducted as part of this project also found that this segment was the most likely to be pursued by stakeholders seeking to deliver Scorecard assessments, with 65% saying they were either ‘likely’ or ‘highly likely’ to target this group.
2. Vulnerable households – social housing. This segment already exists, albeit through government funding. As previously mentioned, a number of Victorian government programs are also delivering assessments to lowincome and social houses. As Victoria’s largest landlord, Point Advisory notes that there is further opportunity for the Department of Health and Human Services (DHHS) to deliver Scorecard ratings across more of Victoria’s public housing stock. It is recommended that DELWP and DHHS continue to cultivate this segment to ensurethere is a minimum level of demand for assessments, thereby protecting assessors against the ‘boom and bust’that has accompanied most previous programs of this nature.
3. Builders - volume builders seeking differentiation. During consultation, a market segment was identified for builders to use the Scorecard to demonstrate the quality and energy performance of their homes. This may involve volume builders undertaking a Scorecard assessment of a ‘display home’ and using this rating to promote other houses in the development. In the survey, 57% of respondents said they were either ‘likely’ or ‘very likely’ to target this segment. This segment could be developed and expanded through focused to develop a specific value proposition for builders and purchasers of off-the-plan homes. It is understood that DELWP is already engaging with volume builders in relation to this segment, and that Sustainability Victoria is reviewing its offering for this segment, which may present an opportunity to integrate the Scorecard into program design.
High potential segments4. Vulnerable households – hardship customers of energy retailers. Stakeholders identified that this segment,
while modest in size, could see energy retailers use the Scorecard to help hardship customers assess in-home opportunities for energy efficiency.
5. Property owners – at minor upgrade. This segment was supported by some stakeholders and in the survey(where 90% of energy efficiency service providers were either ‘likely’ or ‘highly likely’ to target it). However,
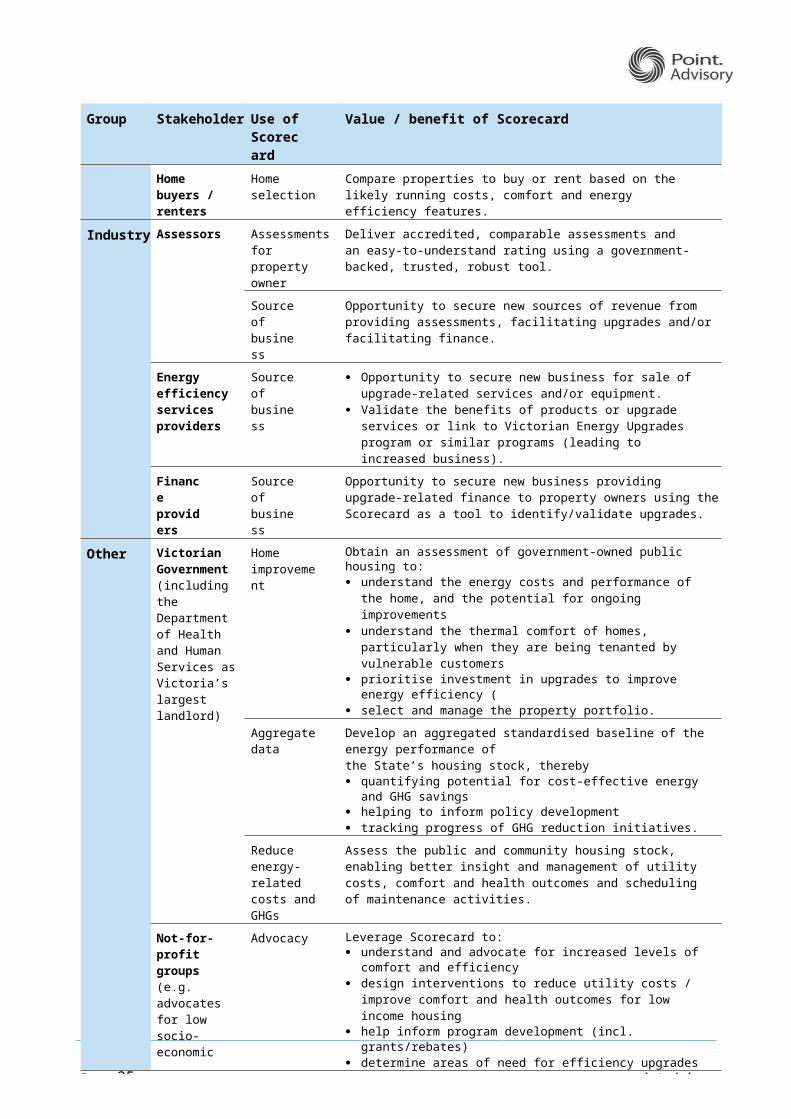
Page 26 of www.pointadvisory.c
during the workshops, several stakeholders (mainly from the real estate sector) suggested that it is unlikely to be viable because the cost of the assessment would disproportionately outweigh the relatively low cost of upgrades. Notwithstanding, it is included in this high potential list because a) the Scorecard is a relatively low-cost investment, and b) the Scorecard could be integrated into a Victorian Energy Upgrades methodology involving minor upgrades for houses to further incentivise service providers to pursue this channel.
Note that both the “hardship customer” and “volume builder” segments are characterised by a relatively small number of corporate decision makers, simplifying engagement and decision making and potentially making these segments easier to materialise.
Likely delivery modesThere are broadly two scenarios through which businesses will deliver Scorecard assessments, as described in Table 8:
• standalone assessments, or
• bundled with other products or services, where the Scorecard is used as by service providers as a vehicle to identify, prioritise and/or validate energy efficiency upgrades.
These delivery modes can then be matched to the various market segments described in previous sections.
Table 8: Description of key Scorecard delivery modes
Delivery mode
Description Practitioner profile Strengths Weaknesses
Standalone assessment
Assessments are delivered on their own, without being “bundled” together with products or services.
Dedicated assessorAn assessor solely delivering Scorecard assessments to clients as a commercial offering, or through government funding (i.e. for public housing).
Simple and direct Enables assessors to
focus on delivering assessments
Cost-sensitive – may result in lower than desired uptake
Customer access may be challenging
Supplier of upgrade products or servicesAn individual or company providing a range of energy efficiency services, who also offers clients standalone assessments as a commercial offering.
Bundled with other services
Assessments will be packaged as part of the delivery of a broader range of upgrade-related products and services (e.g. building renovations, insulation installers, etc).
Supplier of upgrade products or servicesA firm whose core business is the delivery of upgrades (e.g. solar panels, insulation, renovations) who decides to provide Scorecard assessments as a value adding differentiator or as a means of validating energy savings.Individual firms would decide whether to undertake the assessments in- house or to subcontract to standalone assessors.
Lead generation for upgrade products and services
Assessments are offered as a value- adding differentiator
Inherently more complex than standalone
Likely to be a loss leader due to difficulty in ensuring follow-on sales
May be seen as biased (currently managed through a conflict of interest declaration by assessor at the beginning of the assessment)
Victorian Energy Upgrades Accredited PersonOrganisations that undertake accredited activities under the Victorian Energy Upgrades program to create tradeable VEEC certificates.
Assessments are offered as free or subsidised
Revenues primarily from sale of Victorian Energy Efficiency Certificates (VEECs)
Requires a new Victorian Energy Upgrades methodology to be developed
Methodologies involving the

Page 27 of www.pointadvisory.c
Delivery mode
Description Practitioner profile Strengths Weaknesses
Individual firms would decide whether to undertake assessments in house or subcontract to standalone assessors.
either through the assessment itself (would require a new Victorian Energy Upgrades methodology) or through upgrades delivered as part of the service
Scorecard may be more involved than existing upgrade methodologies
Assessments will be packaged by real estate agents as part of the sale of a property
Dedicated assessorAn assessor solely delivering Scorecard assessments contracted by the real estate agent to deliver assessments.
Cost of assessment is minor compared to the broader cost of real estate services
Creates a connection between home energy performance and the property value
Requires buy-in from real estate agents, who are rarely asked for energy efficiency information by potential buyers
The survey conducted as part of this engagement indicated that for Scorecard assessors, standalone assessments are likely to be the most common delivery mode. A total of 88% of assessors were either likely or highly likely to pursue this as a delivery mode. Anecdotal evidence from the stakeholder workshops also suggests that this approach may be favoured, with one attendee noting that bundling was ‘exponentially more complex’ than delivering standalone assessments.
Notwithstanding these findings, energy efficiency service providers (including equipment suppliers and installers) indicated via the survey that they are most likely to pursue a ‘bundled’ offering, with 80% being either likely or very likely to target this deliver mode, compared to 70% who were seeking to deliver standalone assessments. 70% if service providers also indicated that they were either likely or very likely to target government funded assessments. Whilst stakeholders were not asked to define what they understood by ‘government funded assessments’, it is reasonable to assume these may include assessments directly funded by DELWP (such as the existing tranche of low income assessments) or assessments that may be funded at some future stage.
This suggests that focusing on assisting the market for standalone assessments could be a wise strategy at launch because bundled offerings may take longer to develop. Indeed, the uptake of the Scorecard in bundled offerings may rely on the successful establishment of a market of standalone assessments to ‘prove’ the it as a valid, marketable tool.
Price pointAs previously noted (see DEMAND SIDE ANALYSIS), the Scorecard commercialisation survey indicated the average price point for assessments at launch is expected to be around $320 for dedicated assessors and around $220 for energy efficiency service providers (factoring in those seeking to provide ‘free’ assessments as part of a bundled offering).
The relatively high elasticity of demand for Scorecard assessments has been discussed in the “Willingness / ability to pay” section, based on analysis of survey data from the CRC LCL (Low Carbon Living CRC, 2016). Other research also supports the finding that for voluntary ratings to be attractive, the cost must be in the vicinity of $130 to $260 (Edge Environment, 2016). For these reasons, the market for assessments could increase significantly if prices come down. For example, reducing the price from $500 to $250 could result increase the number of assessment from 5,000 to 18,000 (see Table 5).
Over time, it is expected that the price of assessments should come down as assessors become more adept and efficient at conducting assessments, which should in itself should drive some increase in demand. Additionally, DELWP has some control over the design of the tool to enable assessors and service providers to develop ‘least cost pathways’ to delivering assessments which may include bundling with other services such as upgrades or even NatHERS assessments.

Page 28 of www.pointadvisory.c
For clarity, at no stage did any stakeholders suggest that DELWP should compromise the quality of the Scorecard to drive price reductions. It is also worth noting that in workshops and interviews, several stakeholders strongly indicated that DELWP should not offer the Scorecard for free or discount it too heavily. The consensus was that customers need to perceive the Scorecard as valuable, and that could not occur if it is made available too cheaply.
Market support and stimulation measures by the State GovernmentDeveloping a market for a new product, even if a need pre-exists, normally requires significant effort and investment in the absence of a regulatory obligation. This is supported by the literature, which acknowledges that “developing demand within the residential housing market for energy efficiency is… a key barrier” (Edge Environment, 2016).
A high-level insight from workshops was stakeholders’ expectation that DELWP should commit to a long-term strategy for the rollout of the Scorecard. Stakeholders referred to the long (~10 year) gestation period for the NABERS program, and the need for assessors to be confident that support for the Scorecard will not be suddenly revoked at any stage. They encouraged the delivery of a clear long-term strategy, accompanied by a robust commitment to maintain and develop the Scorecard program over time.
As the proponent of the Scorecard, the State Government can mount significant interventions to stimulate uptake of the Scorecard, as discussed below.
Promotional supportMarketing, communications and promotional support will be essential to the success of the Scorecard program. In particular, it is worth noting that “consistent communication that is targeted to specific stakeholders in the value chain is important to raise awareness and to maintain support for the scheme” (Edge Environment, 2016).As a new program, the Scorecard will need to be introduced to all market participants: homeowners, assessors, suppliers of upgrade solutions and their representative bodies, as well as local and state government departments and agencies. Without basic awareness, these parties cannot expect to engage with the program.DELWP should consider a sustained, multi-faceted campaign to promote the Scorecard to all the stakeholder groups. The campaign should have the following elements:• Raise awareness of the Scorecard program, its purpose, its goals, and how it fits into the State’s wider energy
productivity and health strategies.
• Clear articulation of the value of the Scorecard specifically tailored to each customer group – especially noting that according to some research “the main drivers for housing retrofit are not energy savings and carbon reduction, but comfort levels and sustained, or even improved, asset values” (Arup, 2013)7.
• Explanation of how the Scorecard works – in an appropriate level of detail for the targeted party.
• Where to get more information, including how to find an assessor, gain accreditation, etc.
• Examples of how the Scorecard has been successfully used to drive energy savings, comfort improvements, property value increases, etc.
The promotional channels would include:• a dedicated website for the program
• the development of easy to use guides and toolkits
• a helpline for households, industry and assessors
• targeted advertising (e.g. product placement on “The Block” or similar popular real estate programs).
It is noted that DELWP is running a dedicated workstream on marketing and communications for the Scorecard. That process should provide valuable insight into where DELWP is best placed to deliver promotional support.
Liaison with local governments and agencies
Stakeholder consultation undertaken as part of this analysis revealed that local governments are the key sales channel for (non-Scorecard) home energy assessments for many existing providers. These providers stated that local
–7 This is consistent with stakeholder feedback gathered during workshops, which indicated that any marketing and promotion of the Scorecard should emphasise its ability to help deliver quality, comfortable homes (rather than focusing on energy efficiency outcomes).
Page 29 of www.pointadvisory.c
governments are generally regarded as being trusted purveyors of home energy advice, and that they regularly receive requests from local citizens for referrals to home energy auditors.Local governments may also seek to develop their own programs that incorporate the Scorecard. For example, theCity of Yarra’s Home Energy Retrofit Program offers local homeowners with a pensioner concession card the opportunity to undergo a free home inspection and subsequent installation of energy efficient products (Yarra Energy Foundation, 2018). There is an opportunity for the Scorecard to be used in these programs to help add rigour and consistency.Additionally, Sustainability Victoria has extensive information on its website about residential energy efficiency, including a page that refers visitors directly to a range of energy efficiency service providers (including home sustainability assessors)8.DELWP is well-positioned to engage with local governments and other government agencies to promote the Scorecard as a tool for homeowner-initiated energy assessments, and as a mechanism to assist in developing and delivering residential energy efficiency programs.
Pipeline developmentThe cost of building a pipeline of assessments for delivery is a major source of uncertainty that must be reflected in the individual cost of an assessment. In the early days of the Scorecard, such lead generation costs are expected to be substantial, possibly limiting the uptake of the Scorecard in its formative years. As previously noted, stakeholders have suggested that lead generation and customer acquisition could add up to $100 on to the cost of an assessment. The Government can reduce this cost by providing a central on-line platform where assessors could find homeowners interested in assessments.Such a platform could be integrated into the Scorecard’s website and supported by a dedicated helpline forhouseholds and industry.
Financial supportGiven the high price elasticity of demand for residential energy assessments identified by the CRC LCL (see Table 3), the Government could set up a mechanism to reduce the cost of assessments to the householder. Grants, subsidies and rebates could all be considered – possibly targeting the most vulnerable households.The aim would be to provide low-cost assessments to householders in the early years of the Scorecard program. This would drive uptake that, in turn, would generate demand for assessors, upgrade services, etc. – stimulating a virtuous cycle of Scorecard activity.Recently announced programs like Healthy Homes, Affordable Retrofits and EnergySmart Public Housing are examples of well-targeted programs.Suggestions for alternative financing mechanisms to help remove funding-related barriers are provided in the “Market support” section below.
Link the Scorecard with the Victorian Energy Upgrades programThe Victorian Energy Upgrades program is “a Victorian Government program providing households and businesses with access to discounts on energy-efficient products and services” (DELWP, 2018).
The program works by enabling accredited businesses to create Victorian Energy Efficiency Certificates (VEECs) for the sale or installation of approved energy efficient products to Victorian households and businesses. One VEEC is equal to one tonne of greenhouse gas abated (measured in carbon dioxide equivalent). Accredited businesses then sell these certificates to energy retailers, who are required to purchase a certain number of VEECs depending on the amount of energy they sell each year. This effectively creates an additional revenue stream to suppliers and installers of energy efficient products and services and allows them to offer services at a reduced rate. A diagram showing how the Victorian Energy Upgrades program works is provided in Figure 3.
The Victorian Energy Efficiency and Productivity Strategy states that “households that have an energy assessment done using the Victorian Residential Efficiency Scorecard will be linked to the Victorian Energy Upgrades program to access incentives for home energy efficiency upgrades.” Results from the survey indicate broad support for this, with 80% of energy efficiency service providers expressing an intention to deliver assessments as part of a bundled option that would potentially link to the Victorian Energy Upgrades program.
–8 http://www.sustainability.vic.gov.au/You-and-Your-Home/Building-and-renovating/Planning-and-design/Building-and-renovation-advice

Page 30 of www.pointadvisory.c
Figure 3: Diagram showing how the Victorian Energy Upgrades program works (DELWP, 2018)
Options for linking the Scorecard with the Victorian Energy Upgrades program could include:• Informal integration of the Scorecard into the Victorian Energy Upgrades program, for example Scorecard
assessments being used by service providers as a lead generator for upgrade activities.
• Formal integration of the Scorecard into the Victorian Energy Upgrades program, for example Scorecard assessments being linked to accredited activities, facilitating the cross-subsidy of the assessment through the issue of VEECs for assessments or subsequent upgrades.
If the Scorecard could be linked to the Victorian Energy Upgrades scheme, Point Advisory suggests that an additional driver could be created by changing the rules of the program to require a certain proportion of activities to occur in low income homes (as required by the South Australian Retailer Energy Efficiency Scheme).
It is noted that DELWP is running a dedicated workstream for linking the Scorecard with the Victorian Energy Upgrades program. That process will yield further valuable information for how DELWP should approach potential integration.
Market support and stimulation measures by other actorsIn addition to Government action, uptake can be stimulated by specific measures from market participants, who may be well positioned to positively impact on the commercial success of the Scorecard program. Some examples of such measures that were identified by stakeholders and the literature are presented below. The following is not intended to be a comprehensive list of possible measures. It should be noted that these measures are proposals to government and have not been endorsed by government.
Energy retailers may be able to adopt or support the Scorecard through:
• Hardship programs – Retailers could align their existing hardship programs with the Scorecard, using the Scorecard as the basis for assessments and upgrades of customers facing significant financial stress.
• On-bill finance – Retailers could offer simple on-bill finance mechanisms that would enable homeowners to pay for assessments and upgrades over a period of time, with repayments added to their energy bills. This model would require the retailer to either offer assessments themselves, or to develop a relationship with a delivery partner. Whilst historically this approach has had limited take up in Australia, it has been used successfully in other countries (ACEEE, 2011) and may still prove to be a viable mechanism.

Page 31 of www.pointadvisory.c
Councils are regarded as a trusted source of information by many householders. Feedback from existing home energy assessors indicates that local government are also already their key sales channel for work. Councils could support the Scorecard through:
• Source of information – Councils could provide simple information for homeowners about the Scorecard, its benefits, etc. and could refer enquiries to assessors.
• On-bill finance – Councils could offer a simple mechanism that would enable homeowners to pay off the costs of the assessments and upgrades over a period of time, with repayments added to their rates notices.
Real estate agents could support the Scorecard through:• Source of information – Estate agents have a prominent and pivotal position in the market for vendors, buyers
and tenants, which could be used to promote the Scorecard and its benefits. They could encourage their clients (vendors) to undertake and advertise Scorecard ratings and inform prospective buyers about the ratings of the homes they sell. For real estate agents to be active supporters of the Scorecard, it is considered essential that they are aware of its existence and convinced of its robustness and usefulness.
• Lead generation – Through their daily interaction with homeowners and tenants, estate agents are in a position to know who could be interested in a Scorecard assessment and pass them onto assessors.
All these various actions and support measures could participate in creating successful commercialisation pathways for the Scorecard.
Market development phasingA key measure of the commercial success of the Scorecard will be the number of assessments undertaken leading to energy efficiency upgrades, and subsequently the reduction in the household bills, energy consumption and greenhouse gas emissions of Victorian housing stock.9
The voluntary nature of the Scorecard means that its uptake and ultimate success will depend on the generation of sufficient market interest and demand in the Scorecard to drive initial market creation and ramp up. This ramp up period needs to be managed to ensure it is efficiently scaled up into a full market-led program.
It is imperative that a strong case for the benefits of the Scorecard is made over the initial years of the program and that early success can be demonstrated to create momentum. This momentum may depend on the support that key market participants are willing to offer - for example, portfolio building owners such as DHHS, volume builders or energy retailers.
Pathways for priority segmentsThe previous “Selecting high potential sectors” section of this report identified three priority market segments, and another two that could be further developed. Table 9 below aims to bring together the various components analysed above. The following section then offers some insights into the remaining difficulties and barriers to consider. It should be noted that these measures are proposals to government and have not been endorsed by government.
Table 9: Summary of commercialisation pathways for priorty segments
Market segment # assessments per year
(low/high)
Delivery mode
Funding mechanism Other support Likely upgrades per year
(low/high)
High priority
Property owners – at major renovation
2,1667,039
Standalone or bundled
Self-fund,Victorian Energy Upgrades or
linked to finance
May require a specific focus on designers and
builders
1,0835,280
Vulnerable households – low income housing
01,431
Standalone or bundled
Funded by government or community housing
providers
Will require collaboration with
DHHS
0716
–9 Whilst there is currently no way to measure the flow on effects of Scorecard assessments, this information could be obtained through post-assessment surveys.

Page 32 of www.pointadvisory.c
Market segment # assessments per year
(low/high)
Delivery mode
Funding mechanism Other support Likely upgrades per year
(low/high)
Builders – volume Will require directbuilders 261
848 Standalone Funded by builder DELWP engagementwith builders n/a
High potential
Vulnerable households – hardship customers
4711,675
Standalone or bundled
Funded by retailer (with potential Government
assistance)
Will require direct DELWP engagement with energy retailers
unknown
Property owners –at minor upgrade 2,197
7,141Standalone or bundled
Self-fund,Victorian Energy Upgrades or
linked to finance
May require a specific focus on suppliers and
installers
7254,713
TOTAL 5,09518,134
1,80810,708
The market analysis predicts a steady-state market of between 5,095 and 18,134 assessments per year in the priority segments. It should be noted that these steady-state numbers may take several years to eventuate, and it is likely to require ongoing effort from DELWP to cultivate them to their potential.
Market development timelineThere is a natural sequencing in rolling out the Scorecard in which the Government is likely to take a prominent role in generating early demand for assessments, enabling the private sector to increasingly take over. Given the Scorecard was released in 2017, several of the activities outlined in this timetable are already underway of planned. The remaining measures are suggestions to government and have not been endorsed.
1. Government taking the lead (2017 to 2020):
The Government demonstrates the value and viability of the Scorecard and de-risks participation by industry stakeholders through the following key activities:
I. Capacity building
a. Run targeted promotional campaigns to build awareness of the Scorecard amongst householders andindustry, particularly in the ‘property owners – major renovation’ segment. Local government could be a good conduit for reaching this segment, especially those with higher populations of environmentally or health-conscious residents who could be targeted via Council websites, local groups, fairs, existing programs, etc.
b. Work with the Victorian Energy Upgrades team to develop linkages between the two programs.
c. Develop web page for matching homeowners with assessors.
d. Work with energy retailers to encourage (or require) them to use the Scorecard as part of their mandated hardship assistance programs to vulnerable customers.
II. Delivery
a. Create the initial market by delivering assessments committed to in the Victorian Energy Efficiency and Productivity Strategy, including:
i. up to 1,000 Scorecard assessments to be conducted as part of the ‘Healthy Homes’ program, mostlyduring 2018 and 2019
ii. up to 800 assessments as part of the ‘Affordable Retrofits’ program, mostly in 2018iii. at least 200 assessments for the ‘EnergySmart Public Housing’ program during 2017 and 2018.
b. Point Advisory recommends working with DHHS to consider further assessment of Victoria’s social housing stock to identify and validate opportunities and upgrades – a total cost of approximately $1.8 million per year over 3 years.
c. Continue liaising with volume builders to facilitate the adoption of the Scorecard to demonstrate the performance of new homes they construct.

Page 33 of www.pointadvisory.c
2. Increased private sector participation (2020 to 2024):
Having created a market for assessments through its own housing stock, the government could engage with industry to help develop and promote products that will support the ongoing delivery of Scorecard assessments. These may include:
I. Capacity building
a. Ongoing marketing and communications campaign to raise awareness of the Scorecard program amongst targeted stakeholders.
b. Work with lenders to develop finance-linked products for upgrades.
c. Work with energy retailers and local councils to develop an on-bill financing program (see “Market support and stimulation measures by other actors” section above).
d. Work with local governments and other government agencies to promote the Scorecard for use in residential energy efficiency programs they develop.
II. Delivery
a. Continue assessment of Victoria’s social housing stock.
b. Commence assessment of homes developed by volume builders.
c. Commence roll-out to the private upgrade and renovation segments.
Figure 4 shows the ramp-up of the proposed market development plan, indicating a five year ramp up period, before a steady state of an average of 10,900 assessments per annum is reached10. The line above the chart indicates the number of assessors required to supply the given market in any one year, assuming each assessor undertakes 200 assessments per year (for further information about this figure, refer to the analysis in the “Volume of assessors” section on page 22).
Figure 4: Ramp-up of Scorecard assessments
It is important to note that there is a substantial variability in the number of assessments that could be delivered in a given year – between 5,000 and 18,000 per year at steady state. It is also worth emphasising feedback from several stakeholders that the estimates provided above may be overly optimistic and that the market is unlikely to be large enough to support an industry or drive transformational change under a voluntary scheme.
To maximise the number of assessments, the following measures should be considered:
• Minimising the cost of assessments
• Maximising promotion of the Scorecard
–10 This figure of 10,900 represents the average of the low-range estimate and the high-range estimate for the priority segments.

Page 34 of www.pointadvisory.c
• Centralised lead generation whereby DELWP and partner organisations (such as local governments or Sustainability Victoria) could promote the Scorecard program and develop a mechanism to centrally collate the leads that result. Under this model, DELWP would then allocate leads to trusted delivery partners.
Geographic focusAs foreshadowed previously in this document, a potential approach for early market development activities is to focus on a specific geographical area, most likely a local government area. DELWP should consider targeting specific Victorian councils that are open to supporting and promoting the early stages of the Scorecard program. By focusingits resources on areas that are likely to be more ‘sympathetic’ to the Scorecard, the chances of success will increase. To identify suitable areas, DELWP could investigate potential proxy measures for Scorecard support, such as the number of rooftop solar installations in a particular area or areas with a high rate of owner/occupiers.

Page 35 of www.pointadvisory.c
GOVERNANCE
The Victorian Government is funding the rollout of the Scorecard program to 2020. The DELWP Scorecard team is managing the rollout and delivery of the Scorecard, including:• strategic oversight: setting program objectives and performance indicators
• technical development: system specification, tool development and data management11
• assessor oversight: pre-qualification, training, accreditation and support (see breakout box below)
• program integrity: code of conduct, auditing, penalty regime, customer complaints and stakeholder engagement
• promotion: website, materials, events, call centre, and monitoring demand and uptake.
Currently, decisions regarding these aspects of the program are made within existing government structures – i.e. they are signed off by Departmental Executive Officers and, where required, approved by the relevant minister. There are two distinct goals emerging from the analysis of these functions:• one is guaranteeing the integrity of the Scorecard as a robust program, independent from commercial interests
(technical development, assessor oversight, program integrity)
• the other is pushing for wide use of the Scorecard (strategic oversight, promotion).
These two key goals need to be balanced and, depending on the future commercialisation pathways for the Scorecard, there could be a role for stakeholders beyond DELWP to be involved in governance arrangements. This also needs to be considered in light of the costs and benefits of implementing such arrangements. Longer term expansion of the program (see next section) may also influence optimal governance arrangements. This section explores some of the opportunities for DELWP to consider in the short term.Before delving into these opportunities, it is useful to briefly review the development of National Australian Built Environment Rating System (NABERS). NABERS is a performance-based rating system for the energy and greenhouse gas efficiency of office buildings in Australia. It provides a useful set of learnings for the evolution of a building rating tool from a voluntary, state-based initiative to an internationally recognised program with mandatory elements (see breakout box below).
–11 Technical support documentation for the Scorecard has been released. This document outlines, in detail, the decisions that were made to support each calculation within the Scorecard and significantly supports the transparency requested by stakeholders.
National Australian Built Environment Rating System
NABERS is based on the Australian Building Greenhouse Rating (ABGR) scheme designed and managed by the NSW Government’s Sustainable Energy Development Authority. Initially launched in NSW in 1999, it was progressively customised and adopted by individual states until it became fully national by 2006. Use of the ABGR was voluntary.
In the mid-2000s, the Federal government was interested in developing a national performance-based building rating scheme covering a range of sustainability issues such as energy, water, waste and indoor air quality. With ABGR already operational and widely adopted by the states, the NSW Government was awarded the contract to develop and manage a national scheme called the National Australian Built Environment Rating System (NABERS) based on ABGR. NABERS was launched in 2006. AGBR and NABERS ran in parallel until 2009, when the two schemes merged.NABERS is currently administered by the NSW Office of Environment and Heritage.
NABERS was purely voluntary until November 2010 when ratings became mandatory under the Building Energy Efficiency Disclosure Act 2010 (Cth) for commercial office sale and lease transactions over 2,000m2. By that stage, NABERS had achieved widespread acceptance, with voluntary uptake on approximately 60% of Australian offices by net lettable area. The threshold for mandatory disclosure decreased to 1,000m2 on 1 July 2017, which will result in further increases in the total rated office space.
One of the reasons for the relatively high level of voluntary adoption was the incorporation of base building ratings

Page 36 of www.pointadvisory.c
which tend to be long and low risk, increased a building’s valuation. Consequently, high NABERS ratings becomecorrelated with higher rents and higher capital valuations – creating a key market driver for voluntary adoption.
The current NABERS governance structure consists of a National Steering Committee (NSC) of governments from each jurisdiction, which receives advice and feedback from a Stakeholder Advisory Committee (SAC) of industry representatives. In turn, the NSC is comprised of Government and Stakeholder members, as well as the National Administrator (see Figure 5).
Figure 5: Governance structure of the NABERS National Steering Committee (NABERS, 2017b)
These groups are tasked with advising and making decisions on a range of strategic and technical issues, risks and opportunities relevant to the NABERS program.
It is worth noting that in 2017, NABERS consulted on a proposed new governance structure that would move from two to three groups comprising a Leadership Group, a Government Forum and an Industry Forum. The discussion paper circulated as part of this consultation proposed that under the changes, the NABERS National Administrator (NSW OEH) would have “greater decision-making capabilities over operational matters, to ensure NABERS can be responsive to the needs of its stakeholders and manage the program efficiently” (NABERS, 2017b). This reveals an important consideration: that while consultation is crucial, it can come at the expense of responsiveness if not carefully managed.
The NABERS administrators are highly consultative in their approach to governance, particularly with the property sector. This has contributed to industry embracing the system, which in turn has been a significant factor in its success. The key learnings for DELWP from the NABERS scheme’s approach to governance are:
• the importance of consulting with stakeholders at all stages of the process to ensure their buy-in
• the importance of focusing on the needs and wants of the end customer (in the case of the Scorecard, householders) in developing the Scorecard program
• the importance of balancing the need to be consultative with the need to remain responsive in a fast-moving industry and policy space.
Integrity safeguardsSix Scorecard Quality Principles have been developed to underpin the administration of the program. All Scorecard assessors and intermediaries are required to comply with these Principles. They are:1. Provide an excellent customer experience
2. Robust assessment approach: assessments accurately reflect home energy performance
3. Provide consumer focused energy efficiency upgrade advice

Page 37 of www.pointadvisory.c
4. Prioritise safety and wellbeing in the delivery of assessments
5. Robust administrative process to support the quality principles and a good experience for the community and participating organisations
6. Consultation and continuous improvement: commitment to work collaboratively to continuously improve the program.
The integrity of the Scorecard program is also underpinned by an assessor Code of Conduct, Privacy Policy and a customer complaints mechanism.In preliminary consultation, most industry stakeholders indicated their preference for a robust governance system that manages risks associated with the quality of delivery partners and the assessments they undertake. Specifically, stakeholders emphasised the importance of the quality of individual Assessors (technical skills, personal skills and integrity); the quality of recommended upgrades coming out of the tool; the quality of installers (technical skills, personal skills and integrity); and the quality of the upgrades themselves. Another key theme was the need for the Scorecard itself to produce accurate and repeatable ratings.
To deliver on these outcomes, it is vital that stakeholders from across the spectrum – from householders through to assessors, suppliers, installers and industry bodies – are involved in the ongoing management and governance of the Scorecard program. Involving stakeholders in Scorecard governance can:
• foster buy-in from participants, as they will feel their views are considered in the development of the Program
• provide DELWP with insight into the development of the market for Scorecard assessments, helping to identify potential commercialisation opportunities and helping ensure that there is a sufficient pool of assessors to meet demand for assessments
• increase the level of insight into opportunities to cut down unnecessary or ineffective controls, streamlining theprogram’s monitoring and evaluation process
• identify the requirement for additional or increased controls where necessary.
Experience from the NABERS program (see breakout box above) shows the importance of ‘real’ rather than ‘token’ engagement. Stakeholders must be given a genuine opportunity to shape the direction of the Scorecard program. Opportunities for stakeholder involvement are described in Table 10 below. It is noted that all these activities are already underway in some form – however in some cases not as formally as others.
Table 10: Opportunites for stakeholders to be involved in governance for Scorecard integrity
Function [and status] Stakeholder involvement opportunity Benefits Risks
Assessor oversight
Assessor pre-qualification Consultation with assessors, industry bodies, Supports a balanced Limited risk as long asand accreditation [in place] not-for-profits and householders to ensure outcome and helps DELWP retains ultimate
appropriateness and rigour of the qualification ensure an appropriate decision over theprocess level of rigour process
Assessor training [in place] Feedback from assessors or applicants on themes and mode of deliveryFeedback from auditors (see program integrity) identifying knowledge gapsFeedback from customers on the quality of service provision
Streamlined and cost- effective training programEnsuring quality of service delivery
N/A
Assessor support [in place] Consultation with assessors on need for support Increase assessor N/Afor different modes of delivery motivation and
retention over time,hence assessmentquality
Program integrity

Page 38 of www.pointadvisory.c
Function [and status] Stakeholder involvement opportunity Benefits Risks
Code of conduct and penalty regime [in place]
Consultation with householders, assessors and industry bodies to ensure key professional risks are covered and all requirements are relevant and penalties adequate, as not to constitute a barrier to entry
Increases ownership and motivation
N/A
Auditing [in place] Consultation with householders, assessors and industry bodies to ensure audit requirements focus on quality control and are not seen as unnecessarily onerous or too weak
Improved quality controlStreamlined and cost- effective audits
Audits must inform program’s continuous improvement process
Customer complaints [in place]
Involve householders, assessors and industry bodies in the analysis of complaints, and development of corrective actionsEnsure right of response by householders who feel they have received an unfair rating
Fairness towards all stakeholder groupsOwnership and continuous improvement
Must foster constructive rather than defensive attitude amongst assessors
Scorecard technical development
Tool development [in place]
Consultation with assessors and customers to capture possible improvements
Continuous improvement and ownership by stakeholders
The balance between useability and cost- effectiveness needs to be maintained
Data management [under development]
Maintaining a database of assessments requires centralisation and is likely to remain the role of DELWP.Producing analyses based on this data and communicating results to key stakeholders will be part of the monitoring and evaluation process. Stakeholders may contribute ideas to the need for analyses.
Continuous improvement and ownership
N/A
Scorecard promotion and disseminationTo realise its full potential benefit and to drive transformation in residential energy efficiency, the Scorecard needs to be used widely to promote energy efficiency awareness and support upgrade programs. This is the purpose of the present analysis, but it will also require a sustained effort that can be supported by appropriate governance arrangements.
Stakeholder involvement in Scorecard promotion and dissemination can provide:
• market intelligence and insight
• advocacy for and promotion of the Scorecard.
Further discussion of these opportunities is provided in Table 11 below.
Table 11: Opportunities for stakeholders to be involved in governance for Scorecard promotion
Function Stakeholders involvement opportunity Benefits Risks
Strategic oversight
Program objectives and performance indicators
Other agencies, householders, community and industry stakeholders can be involved in the definition of goals and indicators for the Scorecard: government stakeholders will be
Ownership by partners Market intelligence
Divergent stakeholder views may be difficult to reconcile – requires
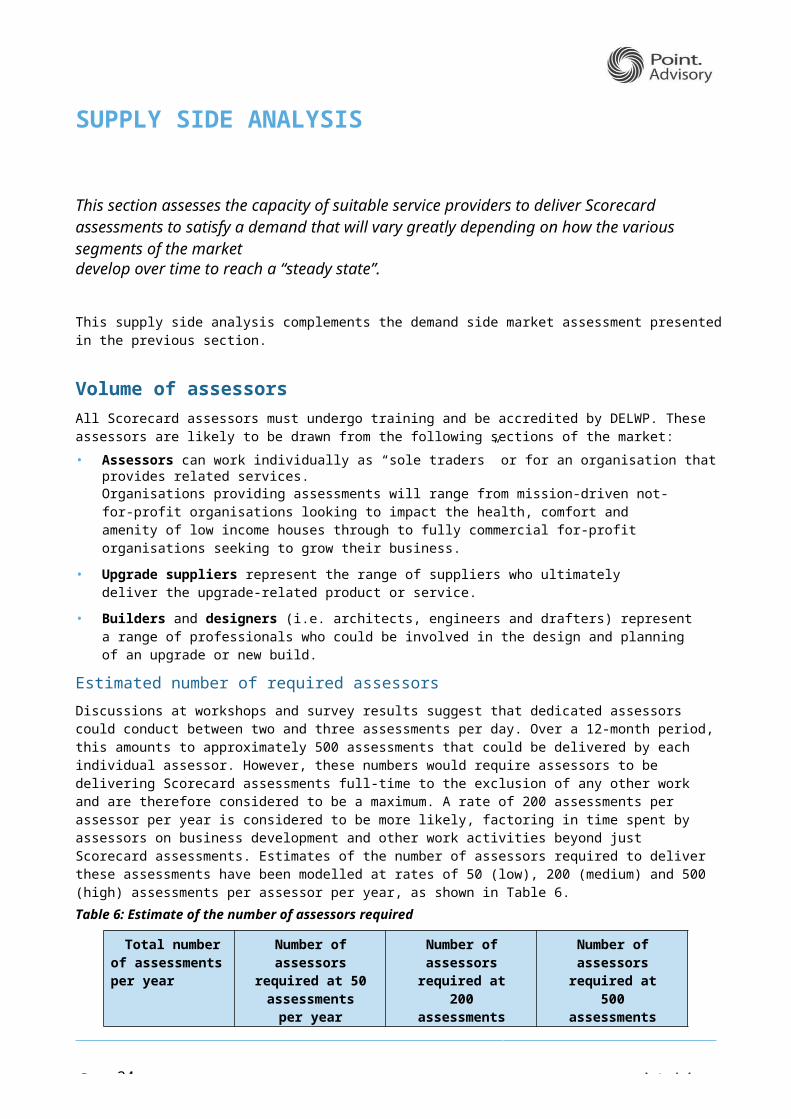
The Governing Board would be responsible for setting system objectives and performance indicators. The Boardwould be supported by working groups, initially focussing on (1) user experience and marketing, (2) technical performance, and (3) system governance, policy and stakeholder management.The light-touch Administrator would act as a Secretariat to the Board and as Contract Manager overseeing the contracted management of the scheme by a 3rd party System Operator.The System Operator would be contracted to the Administrator to develop and manage the core rating system on a day-to-day basis. This includes the oversight and management of Delivery Partners, and the centralised oversight of the scheme’s integrity (i.e. training and accreditation, rating certification, data management, QA/QC, etc).Delivery Partners would interface with the households to deliver individual ratings. They would have the authority and incentives to innovate to improve reliability, affordability and uptake of ratings.
Governance findings from Low Carbon Living CRC report on energy efficient homesIn its report Enhancing the Market for Energy Efficient Homes, the Low Carbon Living CRC (2016) observes that governance of home energy rating systems should involve an open, collaborative and authoritative governing board, an administrator, and the technology and marketing support to drive market delivery of ratings and information whilst ensuring their integrity.The CRC recommends the following governance structure:
Page 39 of www.pointadvisory.c
Function Stakeholders involvement opportunity Benefits Risks
responsible for the delivery of complementary programs and industry stakeholders may have relevant insights relating to access to market.
robust stakeholder management approach
Promotion
Website, brochures and other material
All types of stakeholders could provide insight into information required to increase awareness and uptake of the program.
Market intelligence Creativity
Vocal stakeholders may skew market perception- requires robust stakeholder management approach
Active promotion (call centre, advertising campaign)
Recruitment of candidates for Scorecard assessments is onerous and some form of promotion will be required. Involving all stakeholders would allow better targeting of customer segments most likely to respond positively.
Advocacy from associated partiesMarket intelligence
Vocal stakeholders may skew market perception- requires robust stakeholder management approach
Again, it is important to acknowledge that the Scorecard team is already engaging with stakeholders on several of these issues.
Scorecard governance structureTo perform the functions described in the sections above, some advisory groups could be formed with members drawn from across government, industry, households and community. The Low Carbon Living CRC Report (2016) has explored some standard governance and operating structures and recommendations from this report are summarised in the box below.
Stakeholder feedback on governanceRespondents to the online survey were asked which aspects of governance and development they wished to participate in (refer to Appendix 3 for full detail). ‘Scorecard program integrity’ and ‘technical development of the Scorecard’ are the areas that stakeholders are most interested to participate in.

Energy, Environment & Climate Change Minister
Technical ReviewCommittee
Quality Assurance andRisk Committee
Marketing Committee
Scorecard Advisory Group
DELWP Scorecard Team
Page 40 of www.pointadvisory.c
Stakeholders were especially interested in participating in technical development of the Scorecard (which 68% survey of respondents were either ‘likely’ or ‘highly likely’ to be interested in) and program integrity (59% on the same measure). This is understandable, given their business models rely on the Scorecard being a credible and robust tool.
Most stakeholders are happy to participate in program governance and development (e.g. through workshops or phone calls) and the frequency of three months between meetings presents the best chances of being accepted as a workable compromise between those who prefer to meet more often and those who prefer to meet less often.
Suggested approachDrawing on these recommendations, and considering the learnings from the NABERS program (see breakout box above), Figure 6 presents a model of governance that could be helpful in delivering on the objectives of the Scorecard program:
Figure 6: Potential governance structure for Scorecard program
The advisory groups presented in Figure 6 could operate as follows:
• The Advisory Group would be comprised of at least one representative from each major stakeholder group (householders, assessors, service providers, real estate agents and government). The Group should have a mix of skills from across the underlying committees i.e. marketing, risk, technical energy efficiency and IT development. The role of this Group would be to help guide the Scorecard Team by consolidating the work of the underlying committees into coherent positions, and to act as a review body and sounding board for any changes the government propose to make to the Scorecard program.
• The Marketing Committee would be comprised of people from industry, community and government that have experience in similar programs. The role of this Committee would be to review the progress of the Scorecard and provide advice on possible promotion strategies and channels; this could inject some ongoing energy and fresh insight into the diffusion and / or commercialisation of the Scorecard.
• The Quality Assurance and Risk Committee would incorporate members from all sectors with a technical background and industry knowledge, but with independence safeguards to ensure it is not dominated by any particular industry player. This committee could carry out a periodic review of potential risks to the program and ensure they are appropriately covered by mitigating actions.

Page 41 of www.pointadvisory.c
• The Technical Review Committee, with a strong representation from assessors and the building industry, but also incorporating representatives from community and government to ensure a cross-section of independent views. The Committee could consider required adjustments to the Scorecard, or expansion to other categories of buildings. Representation from government entities having experience in similar rating systems (e.g. NABERS) could also be beneficial.
It is noted that a Quality Assurance and Risk process already exists.
It is important to emphasise that each of the non-governmental governance groups presented in Figure 6 should contain at least one representative of each major stakeholder group (householders, assessors, service providers, real estate agents and government). This will ensure an appropriate cross-section of views are heard and will help build confidence in the rigour of the Scorecard program across the residential energy efficiency value chain.
It is also worth restating that being consultative can come at the expense of being responsive. DELWP should bear this in mind as it continues to develop the governance framework around the Scorecard.
Governance structure over timeAs the Scorecard program evolves, its governance structure should also. For example, if the program becomes widely adopted as an ‘industry standard’, the focus of governance may shift away from marketing towards quality assurance. Conversely, if the program struggles to gain traction, it may become prudent to give additional focus to marketing and promotional activities.
Should the Scorecard program move to the national space, a more complex governance structure such as the one outlined by the LCL CRC (2016) could be considered.

Page 42 of www.pointadvisory.c
STAKEHOLDER COMMENTS ON THE SCORECARD’S LONG-TERM FUTURE
Looking beyond the full commercial launch of the Scorecard as a voluntary program, operating solely in Victoria, stakeholders of all types have expressed interest in considering how the Scorecard program might evolve in the medium and long term. Through Point Advisory’s discussions with stakeholders, these considerations invariably point to two potential delivery approaches:
1. Expanding the Scorecard program into a consistent national scheme
2. Mandatory disclosure of Scorecard ratings at the time of sale or lease of a home.
When considering alternative delivery approaches for the Scorecard, it is instructive to revisit some learnings from the successful rollout of NABERS program (see NABERS breakout box in the Governance section for more detail):
• In the initial stages, focus on developing and operating a scheme that is appropriate for Victoria, whilst beddingdown the Scorecard’s technology, delivery and governance.
• Use the government’s buying power to “kick start” the use of the Scorecard in its early years.
• Lead the way so other jurisdictions can see the benefits of the Scorecard.
Interstate and national expansionThere is currently a lack of a state or national tool to evaluate and rate the fabric and equipment of existing residential properties. Consequently, there is currently a gap in the national market which the Scorecard could fill.
Impact on market sizeExpanding the Scorecard nationally would dramatically expand the potential market for assessments, helping tosecure the scheme’s long-term commercial viability. This objective is also enshrined in the National EnergyProductivity Plan, whose Measure 5 is to “improve residential building energy ratings and disclosure”. This, in turn, would provide material impetus for industry players to engage with the program – creating a virtuous cycle. DELWP is engaging with other jurisdictions on this Measure through the formal NEPP process.
ImplementationThe preconditions for transitioning to a national tool would include:
• proof of community benefit of Scorecard
• technical platform stability
• established delivery ecosystem
• strong governance and integrity.
In particular, the Scorecard platform would need to be updated to allow homes in other states to be assessed, for example by incorporating new climate zones. Additionally, work would need to be done to train and accredit assessors in interstate locations to enable demand to be met.
Mandatory disclosureDELWP’s current focus is the voluntary delivery of the Scorecard. However, during the consultation many stakeholders raised the possibility of mandating the use of the Scorecard.
Mandatory disclosure schemes place a legal requirement on property owners to advertise an energy performance rating at the time of sale and/or lease of their property. In Australia, an example is the Commercial Buildings Disclosure (CBD) scheme which requires energy efficiency information to be provided when commercial office space of 1000 square metres or more is offered for sale or lease.

Page 43 of www.pointadvisory.c
Industry feedbackIndustry feedback indicated that some stakeholders were hesitant to support a mandatory scheme that they believed would add to their regulatory burden, while others felt a mandatory residential disclosure scheme will be necessary to properly transform the energy efficiency of the residential sector. Some stakeholders expressed a view that such a scheme is likely to eventuate at some point in the medium term. Table 12 sets out views expressed by stakeholders on voluntary and mandatory residential disclosure approaches
Table 12: Stakeholder feedback on a voluntary and mandatory residential disclosure scheme
Voluntary Mandatory
Features No obligation on property owners to assess theirproperty’s energy performance.
Uptake based largely on intrinsic values: improve thermal comfort, save on energy bills, good for the environment, etc.
Obligates property owners to provide a “current”certificate of the property’s energy performance uponits sale and/or lease.
Uptake based on extrinsic values: compliance, increased value of property, etc.
Advantages Not compulsory → no regulatory burden for householders.
Improvements to the rating tool and associated programs are easier if changes to legislation are not required.
Significantly higher uptake by property owners and industry.
Unlocks significantly more energy savings in households.
Administrative and cost burden are spread more evenly between government, industry and end users.
Disadvantages Lower uptake compared to mandatory → energy savings only for those that participate; societal benefits lower.
No obligation likely to lead to limited uptake by property owners and industry.
Additional compliance burden for property owners, which may translate into higher transaction costs and rents.
At several points during the engagement, stakeholders from across the spectrum commented that the Scorecard program is unlikely to have high uptake as a voluntary scheme. This is also evident in the survey results, where 10 respondents (15% of respondents) pointed to significant challenges in maintaining the Scorecard as part of a voluntary program without actually being asked about it. Many peak bodies (including ASBEC, BDAV and HIA12) have public positions supporting a system of mandatory disclosure.
Impact on market sizeEach year, some 80,000 Victorian properties are sold and a further 65,000 are rented out (Low Carbon Living CRC, 2016). Should disclosure of residential energy efficiency ratings become mandatory at the time of sale or lease, the market size is expected to increase to between 16,000 and 145,000 assessments per year13 (depending on whether the disclosure scheme applies only to property sales or also includes rental transactions, and regulatory parameters such as the validity period of ratings).
This compares to delivery volumes of between 5,962 and 20,952 assessments per year in steady-state under the current voluntary design of the Scorecard program (see Table 5).
In their 2011 study of possible residential energy performance schemes14, Allen Consulting concluded that a mandatory scheme would result in the highest overall economic value (net present value).
–12 HIA endorses a system of mandatory residential disclosure involving a self-assessment checklist as opposed to an independent Scorecard assessment.13 The figure of 16,000 is based on a disclosure scheme that only applies to new properties, and energy ratings that have a validity of five years14 Mandatory disclosure of residential building energy, greenhouse and water performance – Consultation Regulation Impact Statement, Allens Consulting, July 2011

Page 44 of www.pointadvisory.c
ImplementationIn addition to the pre-conditions raised above in relation to national expansion, should disclosure of residential energy efficiency ratings become mandatory at the time of sale or lease to raise the profile of better performing homes and help deliver a price premium for the seller or landlord having invested in energy efficiency improvement, the market for Scorecard assessments would greatly increase. This would put the entire program under additional stress and would require careful management of the Scorecard assessors’ pool, including training and quality control.

Page 45 of www.pointadvisory.c
REFERENCES
ACEEE. (2011). On-Bill Financing for Energy Efficiency Improvements: A Review of Current Program Challenges, Opportunities and Best Practices. Washington, D.C.: American Council for an Energy-Efficient Economy.
Allen Consulting Group. (2011). Mandatory disclosure of residential building energy, greenhouse and water performance: Consultation Regulation Impact Statement. Allen Consulting Group,.
American Council for an Energy Efficient Economy. (2017, 12 12). Residential Energy Use Disclosure: A Guide For Policymakers. Retrieved from American Council for an Energy Efficient Economy: http://aceee.org/sector/local-policy/toolkit/residential-disclosure
Arup. (2013). Delivering and Funding Housing Retrofit: A Review of Community Models. London: Arup.
Australian Bureau of Statistics. (2016). Census of Population and Housing. Canberra: Australian Bureau of Statistics.
Australian Bureau of Statistics. (2017). Census of Population and Housing. Canberra: Australian Bureau of Statistics.
DELWP. (2018, Feb 1). Victorian Energy Upgrades. Retrieved from Victorian Energy Saver:https://www.victorianenergysaver.vic.gov.au/victorian-energy-upgrades
Department of Health and Human Services. (2016/17). Annual Report 2016/17. Melbourne: Victorian Government.
Edge Environment. (2016). BEET 5 Part 2 - Interpretation for Australia: Best Practice to Inform National ResidentialBuilding Energy Ratings and Disclosure. Sydney: Department of the Environment and Energy.
Essential Services Commission. (2015). Energy Hardship Inquiry - Final Report. Melbourne: Essential Services Commission.
Low Carbon Living CRC. (2016). Enhancing the Market for Energy Efficient Homes. Sydney.
NABERS. (2017a). Annual Report 2016/17. Sydney: National Australian Built Environment Rating System.
NABERS. (2017b). Proposed Changes to NABERS Governance. Sydney: National Australian Built Environment Rating System.
Roy Morgan Research. (2017). Renovation Nation: home improvement in Australia. Melbourne: Roy Morgan.
Sustainability Victoria. (2014). Victorian Households Energy Report. Melbourne.
UK Government. (2017, August 14). Energy Performance Certificates for your business premises. Retrieved from https://www.gov.uk/energy-performance-certificate-commercial-property/overview
Victorian Government. (2015). Saving Energy, Growing Jobs: Victoria’s energy efficiency and productivity statement.Melbourne.
Victorian Government. (2017). Energy Efficiency and Productivity Strategy. Melbourne.
Yarra Energy Foundation. (2018, February 1). Home Energy Retrofit Program. Retrieved from Yarra Energy Foundation: http://www.yef.org.au/home_energy_retrofit_program

Page 46 of www.pointadvisory.c
APPENDIX 1 MARKET SEGMENTS
To assess the demand for a product or service, it is useful to break the demand side into coherent market segments that will respond to different drivers and incentives, and hence may warrant targeted commercialisation strategies. For this analysis, seven market segments have been defined based on previous research, stakeholder interviews, on- line survey and our understanding of the market.
The seven market segments can be broadly grouped into three end-user categories: property owners, renters andvolume builders. All have very different level of control over the property.
Property owners, who may or may not reside at the property, have been categorised into the following segments, depending on the possible motivation for carrying out a Scorecard assessment:
1. Property owners at time of minor upgrades – using the Scorecard to identify and prioritise potential minor upgrades, such as purchasing insulation or an air conditioner, or looking to transition from a wood fire to electric heating.
2. Property owners at time of renovation – using the Scorecard to support their decision making as part of a major renovation to the property’s shell and/or equipment.
3. Property owner ahead of a sale transaction – using the Scorecard rating to demonstrate uplift in the property’s market value due to energy efficiency performance of the property’s features.
4. Property owner ahead of a rental transaction – using the Scorecard rating to demonstrate uplift in the property’s rental value due to energy efficiency performance of the property’s features.
Builders, who are likely to be at the larger ‘volume builder’ end of the market, fall into the following segment:5. Volume builders wanting to demonstrate the performance of their homes – using the Scorecard rating to
differentiate themselves by highlighting the superior as built energy performance of their properties.
Vulnerable households, who are often renters but may also be landlords, fall into the following segments:
6. Social housing – owners of public and community housing (e.g. the Department of Health and Human Services or community housing providers) using the Scorecard to assess the efficiency, quality and comfort of their housing portfolios and identify cost-effective interventions to help low-income tenants to lower their energy costs.
7. Hardship customers of energy retailers – retailers using the Scorecard to help them meet their obligations to hardship customers to manage their energy bills (see breakout box on page 56) by delivering energy assessments in a more objective and systematic way.
Two further market segments were considered, but ultimately discounted as either unviable as a stand-alone demand generating segment following stakeholder consultation and analysis:
8. Property owners who are interested in understanding the energy performance of their home independent of any immediate transaction (i.e. renovation, sale or rent). It was considered that there will be very few householders that undertake an assessment without any intention of doing anything about it. As homeowners looking to upgrade are already captured in segments 1 and 2 above, this segment was discounted.
9. Tenants who are interested in understanding the energy consumption profile of their rented home and are willing to pay for a Scorecard assessment despite not being able to undertake any upgrades without involvement of the property owner. Stakeholder feedback indicated that very few tenants will spend the required sum on an assessment without any commitment from their landlord to undertake subsequent upgrades. As homeowners looking to upgrade are already captured in segments 1 and 2 above, this segment was discounted.
The overall size of the market for Scorecard assessments will depend on the uptake in these segments, which, in turn, will depend on a range of driving factors, some of which could be influenced by DELWP.
A profile has been developed for each of these market segments mentioned above, based on research and assumptions made by the consulting team. These profiles are presented below, including the gross annual segment size. It is important to note that this gross segment size does not represent the number of Scorecard assessments that are expected to be undertaken each year; rather it is the full market of which only a subset will elect to undertake

Page 47 of www.pointadvisory.c
assessments (depending on price point). Demand volume scenarios based on the gross market size are presented in Table 5Table 5 in the body of the report.
Market segment 1 – Property owners at time of upgrades not requiring permitsDescription of segment
This segment includes home owners who are contemplating making material incremental improvements to their property and/or appliances, where such improvements do not require a building permit. These includes installation of new hot water systems, air conditioners, cavity insulation, double glazing, etc. The cost of such improvements is likely to be above $3,000, with the cost of assessment not exceeding 10% of the improvement cost. In this situation, the owner may wish to use a Scorecard assessment as a guide to which activity would yield the best result in terms of thermal comfort and energy savings compared with upfront cost.
There are some 1.5 million owner-occupied properties in Victoria, of which around 3.7% (or 54,933) undertake insulation work in their home each year (Roy Morgan Research, 2017). This represents the gross annual size of this segment.
Drivers for adoption of the Scorecard
Using the Scorecard when carrying out a minor home upgrade can result in:
• Enhanced Comfort – the Scorecard rating can be used as a proxy on how the thermal comfort of the property can be improved, for example by emphasising certain features over others.
• Decision support for upgrade decisions – the Scorecard can be used to indicate trade-offs between possible improvements.
• Market value – the Scorecard’s rating can be used to signal the uplift in energy efficiency of the property afterthe improvement / upgrade (with a view to possibly selling the property at a later time).
The rationale for marketing the Scorecard assessment to a property owner at the time of renovation would be:
• The Scorecard is well suited for decision making in case of renovation (e.g. to provide options and prioritisation for energy cost reductions, fuel switching, etc.).
• The Scorecard represents a small cost (≤ 10%) relative to total upgrade costs.
• The Scorecard can be used to demonstrate the value of upgrades and to validate the post-renovation improvement in energy performance.
From the perspective of driving energy efficiency upgrades, this market segment could potentially deliver high conversion rates (from Scorecard assessment to upgrades) as the intention to upgrade certain features of the property is already established and, presumably, the property owner will have ascertained that they are in a financial position to fund the works.
Consequently, the key marketing challenge to access this segment will be to convince the owner of the benefits of using the Scorecard to guide the selection of upgrades and to signal the resulting energy efficiency enhancements. The Scorecard assessment can then be delivered as part of the overall planning and procurement of the renovation and can likely be delivered efficiently if done in tandem with the installation of the upgrade. Its cost can be incorporated into the overall cost of the upgrade.
Delivery mode & business strategy
For this segment, the Scorecard assessment would either be undertaken by a standalone assessor or be bundled with the overall cost of upgrade.
If the Scorecard assessment is initiated by the homeowner, then it is likely to be delivered by a standalone assessor. Following the assessment, the assessor would provide the homeowner with Scorecard-based upgrade options.
Alternatively, if the homeowner is already exploring upgrade options through discussions with upgrade suppliers and tradespeople, then a Scorecard assessment could be incorporated into the delivery of the upgrade.
In either case, suppliers of upgrade options should be encouraged to create Scorecard-based packages, where the cost of any upgrade includes the post-upgrade Scorecard rating. This would necessitate strong commercial links between assessors and suppliers.

Page 48 of www.pointadvisory.c
Key barriers
The following barriers were identified:
• Many consumers may not focus on energy efficiency when considering an upgrade; preferring the look, practicality, etc.
• Bundling a Scorecard assessment with other services is commercially challenging due to the need to align incentives between the customer, assessor and supplier.
• Cost of acquisition of customers is what sinks these projects. It’s difficult to ‘find’ these customers.
Key enablers
Both the homeowner and upgrade suppliers need to be aware of the Scorecard, and its benefits.
Homeowners need to understand how the Scorecard can assist them in prioritising their upgrades, and how to leverage the Scorecard to obtain a discounted assessment as part of the upgrade.
The upgrade suppliers that will be advising the owner on the proposed work would be a key source of information on the Scorecard and its value. The use of the Scorecard assessment would need to be highlighted as an additional source of value at minimal cost.
To optimise their time, and keep the assessment costs down, assessors need to have a strong pipeline of assessments.
A key enabler is for these tradespeople to convinced of the value of using the Scorecard:
• The tradesperson must be aware of the existence of the Scorecard.
• The tradesperson must be educated on the value of the Scorecard, and how it can be used as an assessment tool and a signal of value, to ‘sell’ it to the property owner.
• Tradesperson can be briefed via government or their industry bodies.
• Owners can be educated by government or their real estate agents.
How can DELWP assist?
DELWP would need to engage with the renovation market and its key influencers (i.e. suppliers, installers, electricians, etc.) to define the benefits of them becoming prescribers or advocates for the Scorecards.
Building home owners’ awareness and understanding of the Scorecard would be essential to ensure they are receptive to recommendations from tradespeople. This could include:
• Information – high level information packs on the Scorecard specifically targeting home owners considering renovations should be prepared and made available through relevant government websites, real estate agents, hardware stores, et cetera.
• Promotion – a multi-media campaign could be used to promote the Scorecard to home owners and direct them to additional sources of information.
• Incentives – DELWP could also consider using time-limited subsidies and rebates to encourage the early uptake of Scorecard assessments and demonstration of the benefits. DELWP could also consider linking Scorecard assessments and upgrades with the Victoria Energy Upgrades program.
For assessors:
• Simplify and streamline customer acquisition through creation of registries, matchmaking, etc.
For upgrade suppliers:
• Information – detailed information packs on the Scorecard could be prepared in conjunction with the relevant industry bodies.
• Promotion – through direct engagement, through industry bodies, at conferences and in specialised publications, newsletters, etc.
• Matchmaking – connecting upgrade suppliers with assessors to facilitate creation of upgrade plus assessment packages.

Page 49 of www.pointadvisory.c
What should others do?
Industry bodies and allied organisations are expected to play a key role in disseminating the information concerning the Scorecard. The main groups would include:
• Community Groups / Local Council
• Consumer and environment groups (e.g. Choice, Environment Victoria, Consumer Utilities Advocacy Centre)
• Master Builders Association Victoria
• the Housing Industry Association
• the Energy Efficiency Council.
These groups would need to be incorporated into a holistic information strategy.
Market segment 2 – Property owners at time of renovationDescription of segment
This segment includes home owners who are contemplating renovating their properties and may wish to incorporate a Scorecard assessment into that process to identify and/or validate energy efficiency upgrades that could be done as part of that process. For this segment, it is assumed that the renovation is of sufficient scale to require a planning permit to be lodged with the Victorian Building Authority.
In 2016, some 54,149 building permits for projects with a value of greater than $50,000 were issued by the Victorian Building Authority. This represents the gross annual size of this segment.
Drivers for adoption of the Scorecard
Using the Scorecard when undertaking a significant home renovation or improvement can deliver:
• Enhanced comfort – the Scorecard rating can be used as a proxy on how the thermal comfort of the property can be improved, for example by emphasising certain features over others.
• Decision support for upgrade decisions – the Scorecard can be used to indicate trade-offs between possible improvements.
• Market value – the Scorecard’s rating can be used to signal the uplift in energy efficiency of the property after the renovation (with a view to possibly selling the property later).
The rationale for marketing the Scorecard assessment to a property owner at the time of renovation would be that:
• The Scorecard is well suited for decision making in case of renovation (e.g. to provide options and prioritisation for energy cost reductions, fuel switching, etc.).
• The Scorecard represents a very small cost relative to renovation and improvement costs.
• The Scorecard can be used to demonstrate the value of upgrades and to validate the post-renovation improvement in energy performance via a clear and communicable rating.
• A NatHERS energy assessment is likely to be required as part of the requirements of the Energy Efficiency Performance requirement for residential buildings in the National Construction Code, and the Scorecard assessment could potentially be undertaken at low additional costs, with additional benefits (as described above).
From the perspective of driving energy efficiency upgrades, this market segment could potentially deliver high conversion rates (from Scorecard assessment to upgrades) as the intention to upgrade the property is already established and the property owner will have ascertained that they are in a financial position to fund the works.
Consequently, the key marketing challenge to access this segment will be to convince the owner of the benefits of using the Scorecard (in addition to a NatHERS assessment) to guide the renovations and to signal the resulting energy efficiency. The Scorecard assessment can then be delivered as part of the overall design and planning of the renovation and can likely be delivered efficiently if done in tandem with the NatHERS assessment. Its cost can be incorporated into the overall cost of the renovation.

Page 50 of www.pointadvisory.c
Delivery mode & business strategy
The Scorecard assessment would be bundled with the overall cost of planning renovations – most likely incorporated into the fees of the builder, building designer or architect (collectively the “designer”) managing the renovation process. The designer is likely to contract out the Scorecard assessment to third parties – most likely a standalone assessor.
Alternatively, the Scorecard assessment could be initiated by the homeowner to help guide their deliberations on whether to renovate, extend or rebuild. Such an assessment would be delivered by a standalone assessor.
Key barriers
The following barriers were identified:
• Many homeowners considering renovations may not focus on energy efficiency when considering; preferring instead the additional space, the design, practicality, etc.
• Conveying the Scorecard rating as a valid representation of additional value of the home post upgrade.
Key enablers
As mentioned above, the “prescribers” or advocates for the use of the Scorecard for this segment would be the designer managing the renovation process. The use of the Scorecard assessment would need to be highlighted as an additional source of value at minimal cost. A key enabler is for these professions to be fully on board with the merit and use of the Scorecard:
• The designer must be aware of the existence of the Scorecard.
• The designer must be educated on the value of the Scorecard, and how it can be used as an assessment tool and a signal of value, to ‘sell’ it to the property owner.
• Designers can be briefed via government or their industry bodies.
• Owners can be educated by government or their real estate agents.
How can DELWP assist?
DELWP would need to engage with the renovation market and its key influencers (i.e. builders, building designers, architects, etc.) to define the benefits of them becoming prescribers or advocates for the Scorecards.
For designers:
• Information – detailed information packs on the Scorecard could be prepared in conjunction with the relevant industry bodies. This could extend to incorporating knowledge of the Scorecard into the designer accreditation.
• Promotion – through direct engagement, through industry bodies, at conferences and in specialised publications, newsletters, etc.
• Facilitation – connecting designers with assessors and homeowners.
Building home owners’ awareness and understanding of the Scorecard would be essential to ensuring they arereceptive to recommendations from designer. This could include:
• Information – high level information packs on the Scorecard specifically targeting home owners considering renovations should be prepared and made available through relevant government websites, real estate agents, hardware stores, et cetera.
• Promotion – a multi-media campaign could be used to promote the Scorecard to home owners and direct them to additional sources of information.
• Incentives – DELWP could also consider using time-limited subsidies and rebates to encourage the early uptake of Scorecard assessments and demonstration of the benefits.
What should others do?
As mentioned above, industry bodies and allied organisations are expected to play a key role in disseminating the information concerning the Scorecard. The main groups would include:
• Master Builders Association Victoria

Page 51 of www.pointadvisory.c
• the Housing Industry Association
• Australian Institute of Architects
• Building Designers Association of Victoria
• the Energy Efficiency Council.
These groups would need to be incorporated into a holistic information strategy.
Market segment 3 – Property owners ahead of a saleDescription of segment
This segment includes property owners who are contemplating the sale of their property and may wish to increase the value of their property by signalling to the market the property’s energy efficiency features and the resultant energy consumption profile. However, only properties with already comparatively high energy performance characteristics are likely to explore this signalling strategy, as poorly performing homes will not gain any value enhancement from obtaining a home energy efficiency rating.
In 2015, there were some 79,400 property sales in Victoria, of which 11,910 (15%)15 are assumed to be of sufficiently high energy performance to justify obtaining an energy rating. This represents the gross annual size of this segment.
Drivers for adoption
The owner’s main motivation for undertaking a Scorecard assessment would be obtain a rating to signal to the market the superior energy performance and comfort of their home, in turn to secure a higher sales price. Following an assessment, the owner may decide to proceed with some of the recommended upgrades to further improve theproperty’s value.
Consequently, the key driver for the Scorecard assessment is the belief that the cost of the assessment will be outweighed by the signalling value of the star rating – effectively differentiating it from similar, but less energy efficient properties.
Delivery mode
For this segment, the Scorecard assessment would most likely to be undertaken by a standalone assessor.
Key barriers
The following barriers were identified:
• Sellers may be reluctant to advertise a Scorecard rating due to potential legal implications if the home doesn’tperform as indicated by the rating.
• Sellers of older homes may not be willing to undergo a Scorecard assessment because they believe their home is not energy efficient.
• Buyers rarely if ever ask about the energy performance characteristics of a house, meaning real estate agents and vendors are not inclined to promote this.
Key enablers
To consider the Scorecard as a pre-sale value-enhancing strategy, home owners would need to be aware of the Scorecard program and how it could benefit them. This suggests a key role for real estate agents who assist owners with the sale and could incorporate the Scorecard into their recommendations for pre-sale value-enhancing strategies.
How can DELWP assist?
DELWP should consider developing targeted information packages to both home owners and real estate agents.
For home owners, this could include:
• Information – high level information packs on the Scorecard should be prepared and made available through relevant government websites, real estate agents, hardware stores, et cetera.
–15 CSIRO found that 15% of home owners expressed interest in the energy performance of a home. It is also a widely accepted metric for the proportion of innovators and early adopters for any given product.

Page 52 of www.pointadvisory.c
• Promotion – a multi-media campaign could be used to promote the Scorecard to home owners and direct them to additional sources of information (noting that research and stakeholder feedback suggests that consumers are more likely to respond to messages about quality and comfort rather than efficiency).
• Incentives – DELWP could also consider using time-limited subsidies and rebates to encourage the early uptake of Scorecard assessments.
For real estate agents:
• Information – detailed information packs on the Scorecard should be prepared in conjunction with the relevant industry bodies.
• Promotion – a multi-media promotional campaign should be developed to encourage real estate agents to seek out more information from their industry bodies.
What should others do?
Industry bodies and allied organisations are expected to play a key role in disseminating the information concerning the Scorecard. The main groups would include the Real Estate Institute of Victoria. This group would need to be incorporated into a holistic information strategy.
Market segment 4 – Property owners at the time of rentalDescription of segment
This segment describes rental property owners who may wish to enhance the value of their property by signalling to potential tenants the property’s low energy costs. However, only properties with good ratings are likely to explore this signalling strategy.
In 2015, there were some 65,100 properties were available to rent in Victoria, of which 9,765 (15%) are considered to be of sufficiently high energy performance to make it possible that a Scorecard assessment may be justified (Sustainability Victoria, 2014). This represents the gross annual size of this segment.
Drivers for adoption
The owner’s main motivation for undertaking a Scorecard assessment would be to improve the likelihood of renting out their property on more favourable terms by obtain a rating to signal to the market the superior energy performance and comfort of their home. These terms may include higher rental payments in comparison with similar properties, longer leasing periods or a higher calibre of tenant. Following an assessment, the owner may decide to proceed with some of the recommended upgrades to further improve the property’s rental value.
Consequently, the key driver for the Scorecard assessment is the belief that the cost of the assessment will be outweighed by the signalling value of its star rating – effectively differentiating it from similar, but less energy efficient properties.
Delivery mode
For this segment, the Scorecard assessment would most likely be undertaken by a standalone assessor.
It is notable that for this sector, the cost of the assessment would be tax deductible as an investment property expense, and the cost would therefore be significantly offset.
Key barriers
The following barriers were identified:
• In the current “seller’s market” owners are not under pressure to differentiate themselves to lease theirproperties.
Key enablers
To consider the Scorecard as a pre-rental value-enhancing strategy, owners would need to be aware of the Scorecard program and how it could benefit them. They would also need to believe that tenants would be aware of and trust the Scorecard to provide an accurate rating. This suggests a key role for real estate agents, who will assist owners with the rental, and could incorporate the Scorecard into their recommendations for rent-enhancing strategies.

Page 53 of www.pointadvisory.c
How can DELWP assist?
DELWP could develop targeted information packages to property owners, tenants and real estate agents.
For property owners and tenants:
• Information – high level information packs on the Scorecard should be prepared and made available through relevant government websites, real estate agents, hardware stores, et cetera.
• Promotion – a multi-media campaign could be used to promote the Scorecard to home owners and direct them to additional sources of information (noting that research and stakeholder feedback suggests that consumers are more likely to respond to messages about quality and comfort rather than efficiency).
• Incentives – DELWP could also consider using time-limited subsidies and rebates to encourage the early uptake of Scorecard assessments, noting that these would need to be carefully calibrated and argued to justify the expenditure.
For real estate agents:
• Information – detailed information packs on the Scorecard should be prepared in conjunction with the relevant industry bodies.
• Promotion – a multi-media promotional campaign should be developed to encourage real estate agents to seek out more information from their industry bodies.
What should others do?
Industry bodies and allied organisations are expected to play a key role in disseminating the information concerning the Scorecard. The main groups would include:
• Real Estate Institute of Victoria.
• Tenants Union of Victoria.
These groups would need to be incorporated into a holistic information strategy.
Market segment 5 – Progressive volume builders seeking differentiationDescription of segment
This segment includes volume builders who are seeking market differentiation by highlighting the superior energy performance of their properties. Such builders would undertake a Scorecard assessment post-build, and then include the resulting rating in its marketing.
Each year, there are some 43,000 new properties added to the State’s housing stock, of which 6,525 (15%) are considered to be of sufficiently high energy performance and are targeting the higher end of the market. This represents the gross annual size of this segment.
Drivers for adoption
The builder’s main motivation for undertaking a Scorecard assessment would be to promote the energy performance of their homes, to differentiate themselves in the market and achieve higher prices.
Delivery mode
For this segment, the Scorecard assessment would either be undertaken by a standalone assessor contracted by thebuilders, or by the builders’ in-house assessors.
A Scorecard assessment could be undertaken on a display home to create a “model” rating for that type of home. The model rating could then be adjusted for the specific home during its design (to allow for orientation, modifications, customisation, etc.) and finalised at handover. This process could be streamlined in consultation with DELWP toreduce assessment costs by permitting off the plan assessment based on “model” designs.
Key barriers
• Builders currently use NatHERS and would need to be convinced to adopt another rating methodology.• There is a disconnect between sales process and handover:

Page 54 of www.pointadvisory.c
− Estimated Scorecard rating would be modelled based on a display home, adjusted for options selected by purchaser.
− Final Scorecard rating (post-construction) may vary depending on actual materials and design, which may not exactly reflect the modelled home. There is a risk that the actual rating may not meet the modelled (target) rating.
Key enablers
To consider the Scorecard as a pre-sale value-enhancing strategy, builders would need to be aware of the Scorecard program and how it could benefit them. They would also need to believe that buyers would be aware of and trust the Scorecard to provide an accurate rating. This suggests a key role for real estate agents, who will assist builders with the sale, communicate its value to purchasers.
A key enabler is for these professions to be fully on board with the merit and use of the Scorecard:
• The builder must be aware of the existence of the Scorecard.
• Builders can be briefed via government or their industry bodies.
• Owners can be educated by government or their real estate agents.
How can DELWP assist?
DELWP would need to engage with the volume builders to define the benefits of them using Scorecards ratings to promote their properties. This would include:
• Information – detailed information packs on the Scorecard could be prepared in conjunction with the relevant industry bodies.
• Promotion – through direct engagement, through industry bodies, at conferences and in specialised publications, newsletters, etc.
What should others do?
As mentioned above, industry bodies and allied organisations are expected to play a key role in disseminating the information concerning the Scorecard. The main groups would include:
• Master Builders Association Victoria
• the Housing Industry Association
• the Association of Building Sustainability Assessors
• Building Designers Association of Victoria
These groups would need to be incorporated into a holistic information strategy.
Market segment 6 – Social housingDescription of segment
This segment describes tenants who are living in low-income housing, primarily in public or community housing (i.e. housing owned by the Department of Health and Human Services or “DHHS”) or community housing providers.
This segment is characterised by the tenants’ lack of financial capacity to pay for a Scorecard assessment, and their inability to undertake any upgrades without involvement of the property owner (in most cases, DHHS or a community housing provider).
In 2015, there were some 86,418 public housing dwellings owned by DHHS (Department of Health and Human Services, 2016/17). Of these, there are understood to be just under 15,00016 high rise apartments with central heating and hot water plant, leaving 71,551 that would be eligible for Scorecard assessments. Feedback during stakeholder consultation indicated that DHHS is unlikely to assess its entire housing stock, as many dwellings are similar or identical across the portfolio. In the absence of any indication from DHHS as to what proportion of its housing stock it may wish to assess, the analysis assumes that DHHS will only undertake assessments on up to 10%, or 7,155, of these properties to develop a set of optimised upgrade reference scenarios. It is further assumed that these assessments
–16 Based on data provided directly by DHHS.

Page 55 of www.pointadvisory.c
occur over a 5-year rolling program, meaning some 1,431 properties would be assessed each year. This represents the gross annual size of this segment.
This market segment could be expanded to include broader community housing, of which there are some 20,0000 dwellings in Victoria managed by not-for-profit providers.
Drivers for adoption
In this segment, the landlord would fund (or significantly subsidise) Scorecard assessments as a means of reducing tenant energy bills and improving tenant comfort because will almost certainly be unable or unwilling to fund them. It is important to emphasise that in this segment, the landlord is the Government (DHHS) or a community housing provider.
In their role as the landlord, DHHS’ motivation for undertaking the Scorecard assessment would be to understand the aggregated energy performance of its residential property portfolio, and the potential to improve it. Furthermore, proceeding with Scorecard-identified upgrades would reduce the energy-related subsidies paid out to housing recipients and would drive improved tenant health and comfort outcomes.
The tenants’ main motivation would be dissatisfaction with the energy costs of their rented property.
Delivery mode
For this segment, the Scorecard assessment would most likely be undertaken by a standalone assessor employed by a social services organisation.
Key barriers
• Assessments would need to be funded, at least partially.
Key enablers
This segment would require DHHS to make a strategic commitment to undertake a progressive, portfolio-wideprogram of assessments and (if necessary) upgrades. This could be integrated into DHHS’ ongoing maintenance and replacement program.
How can DELWP assist?
A single landlord like DHHS, with tens of thousands of properties under management, has unparalleled potential to provide a significant source of demand in the early stages of the Scorecard program. DELWP could work closely with DHHS to deliver a commitment to assessing Victoria’s public housing stock and subsequent design and implementation of a program to conduct the assessments. This could include joint funding.
What should others do?
Environmental and social services organisations could play a significant role in supporting DHHS in segment strategy. In particular, the following groups could be useful allies:
• The Australian Council of Social Services
• The Energy Efficiency Council
• Charitable and community groups (e.g. MEFL and the Brotherhood of St Lawrence).
Market segment 7 – Hardship customers of energy retailersDescription of segment
This segment describes households who qualify for energy hardship programs offered by Victorian energy retailers under the Energy Retail Code. Hardship customers are those who have had persistent difficulty in paying their energy bills. Under hardship programs, energy retailers engage with these households to work out a manageable payment plan, to assist with identifying opportunities for reducing energy use and cost, and, in certain cases, undertaking equipment upgrades.
In 2013/14, there were some 33,600 households in retailers’ energy hardship programs (Essential Services Commission, 2015). This represents the gross annual size of this segment.
For further information on retailer hardship obligations, refer to the breakout box on the following page.

Page 56 of www.pointadvisory.c
Drivers for adoption
Energy retailers are required under the Electricity Industry Act 2000, the Gas Industry Act 2001 and the Energy Retail Code to provide hardship assistance to qualifying households. This assistance may include the provision of energy audits and upgrades at no cost to the household. An average of 830 energy assessments per year have been undertaken under hardship programs between 2009 and 2014 (Essential Services Commission, 2015).
The precise form of home energy assessment is not currently specified, resulting in energy retailers adopting their own methodologies. Consequently, stakeholders indicated an opportunity for the Essential Services Commission (ESC) to consider directing retailers to use the Scorecard for all future assessments to introduce consistency and rigour.Improving the energy efficiency of low income housing would also reduce energy concession payments made by the Victorian government17.
Delivery mode
For this segment, the Scorecard assessment would most likely be undertaken by standalone assessors, possibly in the form of social services organisations employing multiple assessors.
Key barriers
• Energy retailers are not obligated to adhere to a particular assessment standard, and generally default to inexpensive methodologies – e.g. over the phone assessments, web-based tools, etc.
Key enablers
Energy retailers would need to be briefed on the Scorecard program and understand the value of using the Scorecard for future assessments under their hardship programs. Specifically, they would need to be persuaded that the Scorecard enabled them to meet their hardship obligations in an efficient, effective manner. The ESC could also be an enabler, either by requiring or suggesting that retailers incorporate Scorecard assessments into their hardship programs.
How can DELWP assist?
DELWP should consider working with the ESC, energy retailers and community groups on clarifying the potential benefits of using the Scorecard as the basis of household assessments under retailer hardship programs.
What should others do?
As a group that is responsible for upwards of 800 assessments per year, energy retailers represent a potentially material and ongoing source of demand for Scorecard assessments. For this reason, they could be a critical driver of market uptake in the early stages of the program.
Industry groups (e.g. the Energy Efficiency Council), social advocacy groups (e.g. the Australian Council of Social Services) and community support organisations could be useful allies in driving the use of the Scorecard as part of retailers’ hardship programs.
–17 These concessions include a year-round discount of 17.5 per cent on mains electricity, and a winter concession of 17.5 per cent for mains gas usage (from 1 May to 31 October) - see https://www.energy.vic.gov.au/about-energy/your-bill/concessions-and-hardship
Energy hardship programs in Victoria (Essential Services Commission, 2015)
Victoria’s Essential Services Commission reports that in 2013/14, 33,673 households participated in energy hardship programs and received assistance from their energy retailer and the Government. These households used an average of 116% more energy than other customers in their postcode.
The legislation and the Energy Retail Code require retailers’ hardship policies to include the provision of flexible payment options, audits of a domestic customer’s energy usage, and supply of replacement electrical appliances (wholly or partly at the expense of the retailer).
Under the legislation, energy retailers have significant discretion for the design of their hardship programs. Consequently, each of Victoria’s energy retailers has a unique program. In the period 2009 to 2014 there were approximately 4,100 audits undertaken and 3,100 appliances provided under these hardship programs.

Page 57 of www.pointadvisory.c
APPENDIX 2 STAKEHOLDER LIST
2.1 Preliminary interviewsThe following stakeholders participated in one-on-one interviews in July and August 2017:
• Brotherhood of St Lawrence• Property Council of Australia• Australian Sustainable Built Environment Council• Building Designers Association of Victoria• Energy Efficiency Council• Australian Building Sustainability Association
• Housing Industry Association• Real Estate Institute of Victoria• Moreland Energy Foundation Ltd• NSW Office of Environment and Heritage• SA Department of the Premier and Cabinet• Self-employed assessor
2.2 WorkshopsThe following stakeholders attended workshops held in November 2017:
University of South Australia Department of Health and Human Services Sculptor Homes Moreland Energy Foundation Ltd EcoResults Energy Inspectors Australian Sustainable Built Environment Council Frasers Property NSW Office of Environment and Heritage Energy Efficiency Council CSIRO Real Estate Institute of Victoria Kingspan Jellis Craig DELWP Eco Designs

Page 58 of www.pointadvisory.c
APPENDIX 3 SURVEY FINDINGS
The Scorecard commercialisation survey was released electronically via SurveyMonkey on Wednesday 13 December 2017 and sent to a distribution list of approximately 700 stakeholders. The survey closed at midnight on Wednesday 20 December 2017, with exactly 100 responses received. Once incomplete responses (i.e. where less than three questions had been answered) were removed, there were 65 responses remaining. These 65 responses are the basis of the analysis presented here.
Figure 7 shows the stakeholder groups that responded to the survey. Most respondents were either assessors or ‘none of the above’, both with 38% of total responses (n=25). Of the ‘none of the above’ stakeholders, almost half (n=12) were from local and state government, with many of the remaining being a combination of the main stakeholder categories (e.g. both a home energy assessor and an energy efficiency service provider).
Figure 7: Which stakeholder group best describes you / your organisation? (all respondents n=65) 18
builder or tradesperson
5%
building designer or architect 3%
real estate agent 0%
supplier or installer of energy
efficiency equipment or
services15%
home energy assessor
39%
none of the above (please specify) 38%
No survey responses were received from real estate agents, which is likely to be reflective of the fact that this group is under-represented on the distribution list.
A key objective of the survey was to ask respondents which of nine nominated market segments they are likely to target when the Scorecard is released in April 2018. The responses to this question across all stakeholder groups are presented in Figure 8 below. The chart shows that the most favoured market segment is ‘property ownersundertaking major renovations’, which 65% of respondents were either ‘highly likely’ or ‘likely’ to target to promote and/or deliver Scorecard assessments. This outcome is consistent with feedback obtained during workshops, which suggested that this could be a viable segment because the cost of the Scorecard could be absorbed into the much greater cost of the renovation. The second most favoured segment was ‘property owners ahead of the sale of their property’ which scored 58% on the same measure.
The third most favoured market segment is ‘builders wishing to demonstrate the energy performance of homes they build’, which 57% of respondents say they will target. While this was previously identified as a potentially viable segment, it is surprising to see it ranked so highly and above more conventional segments including home owners at point of sale. This may justify further efforts to unlock this segment by DELWP.
–18 ‘Home energy assessor’ and ‘none of the above’ both had the same value (n=25). Percentages vary due to Excel rounding error.

%112
%332%%8
%1%232%12
324%20%20%
48232%828
7 22%%311%11%20%
29%35%12%6%17%
28%%2817%10%17%
25%5%2%2012%18%
20%5%325%%15% 5
29%%2822%%18%3
13%%1827%22%20%
18%26%22%11%23%
13%30%20%13%23%
Page 59 of www.pointadvisory.c
Figure 8: Which market segments are you likely to target to promote and/or deliver Scorecard assessments? (all respondents, n=65)
i. energy customers on hardship concession programs
h. public and social housing providers
g. renters for their own general information
f. builders wishing to demonstrate energy…
e. property owners for their own general information
d. property owners ahead of rental of their property
c. property owners ahead of sale of their property
b. property owners undertaking major renovations
a. property owners undertaking minor upgrades
0% 20% 40% 60% 80% 100%highly unlikely unlikely neutral likely highly likely
It is important to note that targeted segments vary significantly according to stakeholder grouping. For this reason, the remainder of this section analyses each of these stakeholder groups in turn.
3.1 Home energy assessorsHome energy assessors were the equal largest stakeholder group represented in the survey (n=25). Most respondents (56%) were sole traders, with the remaining 44% coming from companies.
Segments targeted
Assessors were most likely to target homeowners undergoing major renovations (where 72% were either ‘likely’ or ‘highly likely’ to target the segment) and property owners at time of sale (where the same measure was 68%). These results are presented in Figure 9 below.
Figure 9: Which market segments are you likely to target to promote and/or deliver Scorecard assessments? (home energy assessors, n=25)
i. energy customers on hardship concession programs %
h. public and social housing providers 2% 4%
g. renters for their own general information 6
f. builders wishing to demonstrate energy performance
e. property owners for their own general information 2
d. property owners ahead of rental of their property 4
c. property owners ahead of sale of their property 4
b. property owners undertaking major renovations
a. property owners undertaking minor upgrades 6 20%%448
24%48%8128
6%332%0%2%
32%32%20%%
24%
28%3616%812
12
0% 20% 40% 60% 80% 100%highly unlikely unlikely neutral likely highly likely

Page 60 of www.pointadvisory.c
Delivery modes
Predictably, most assessors indicated they were likely to target standalone, privately funded assessments as a delivery mode. In all, 88% of assessor respondents were either likely or highly likely to deliver assessments in this way. The second most favoured delivery mode was government funded assessments, which 56% of assessors were either likely or highly likely to target. Because current assessments are being delivered in this way, it is likely that this number is inflated above what it might otherwise be.
Price point
Assessors were asked, based on their preferred delivery mode, what price they would charge customers for Scorecard assessments. Responses were distributed around the $300 price point. While an average figure is difficult to calculate because responses were given as a range, the figures indicate an approximate average of around $320 per assessment. The responses are shown in Figure 10.
Figure 10: Considering your preferred delivery mode, what is the minimum price you would charge customers for Scorecard assessments on an ongoing basis (home energy assessors, n=25)
50%
45%
40%
35%
30%
25%
20%
15%
10%
5%
0%not
applicablefree as part of a bundled
offering
up to $100 up to $200 up to $300 up to $400 up to $500 up to $600 more than$600
Number of assessments and assessors
Assessors were asked about the number of assessments they would be looking to conduct, and the number of assessors they would employ to undertake these assessments. Excluding those who answered either ‘not applicable’ or ‘other’ (n=7), most respondents (89%) stated they would need to conduct up to 50 assessments per month for the Scorecard to be a viable business activity for them. The remaining 11% nominated up to 100 per month. The lowest response available in the survey was 50 assessments per month. It is considered highly possible that several assessors would undertake far fewer
To service these assessments, assessors would seek to employ an average of 1.6 assessors (including themselves).
3.2 Energy efficiency service providersEnergy efficiency service providers, including suppliers and installers of energy efficiency products and services, represented 15% of survey respondents (n=10). The clear majority of these (90%) were for-profit companies.
Segments targeted
Energy efficiency service providers were most likely to target homeowners undergoing minor upgrades (where 90%were either ‘likely’ or ‘highly likely’ to target the segment). These results are presented in Figure 11.
Note that respondents were free to choose as many segments as they wished, so a single assessor might say theywere ‘highly likely’ to target several segments.

0 0
0 0 0
0 0
0 0
0
0 0 0
0 0 0
0 0
0 50%%410%
50%10%%2%2
%2%4%210%10%
30%%2%2%210%
30%%230%10%10%
%410%30%%2
10%%430%%2
%6%2%2
30%30%%2%2
0 0
0
0 0
0 0%430%%210%
70%10%10%10%
30%%2%410%
10%10%30%30%%2
%430%%210%
Page 61 of www.pointadvisory.c
Figure 11: Which market segments are you likely to target to promote and/or deliver Scorecard assessments? (energy efficiency service providers, n=10)
i. energy customers on hardship concession programs
h. public and social housing providers
g. renters for their own general information
f. builders wishing to demonstrate energy performance
e. property owners for their own general information
d. property owners ahead of rental of their property
c. property owners ahead of sale of their property
b. property owners undertaking major renovations
a. property owners undertaking minor upgrades
0% 10% 20% 30% 40% 50% 60% 70% 80% 90% 100%
highly unlikely unlikely neutral likely highly likely
Delivery modes
Energy efficiency service providers were most likely to target bundled assessments as a delivery mode (with 80% either ‘likely’ or ‘highly likely’ to target this mode). They were also likely to target ‘standalone’ assessments and ‘government funded’ assessments (both 70% on the same measure). These responses are shown in Figure 12.
Figure 12: Which market segments are you likely to target to promote and/or deliver Scorecard assessments? (energy efficiency service providers, n=10)
e. as government funded assessments
d. as part of real estate (sale or leasing) services
c. as part of property design and / or construction services
b. bundled with other products (e.g. VEU projects, insulation upgrades, etc.)
a. as stand-alone, privately funded assessments
0% 10% 20% 30% 40% 50% 60% 70% 80% 90% 100%
highly unlikely unlikely neutral likely highly likely
Price point
Energy efficiency service providers were asked whether they would outsource assessments or conduct them in-house. 60% of these respondents intend to outsource assessments to an external provider, with the remaining 40% conducting them in-house.
Respondents were also asked, based on their preferred delivery mode and their outsourcing intentions, what price they would charge customers for Scorecard assessments. The responses to this question were unevenly distributed and are considered unreliable. Notwithstanding, the figures indicate an approximate average of around $206 per assessment for those conducting assessments in-house, and a slightly higher average of $229 for those electing to outsource. Those looking to outsource indicated a willingness to pay external assessors around $180 per assessment.

2
8%42%7%18%25%
25%5%27%18%25%
33%8%8%%2525%
8%33%17%8%33%
8%33%25%8%25%
17%17%25%%4
17%25%25%17%17%
8%33%25%33%
8%%2525%17%25%
Page 62 of www.pointadvisory.c
Number of assessments and assessors
All energy efficiency service providers looking to employ Scorecard assessors in-house (n=4) nominated that they would seek to employ two (2) assessors (including themselves, where relevant).
3.3 GovernmentWhile not strictly the target audience of the Scorecard commercialisation survey, several state and local government stakeholders responded (n=12), accounting for 18% of all responses. On this basis, discussion of the survey responses received from this stakeholder group is provided below.
Segments targeted
Government stakeholders were most likely to target homeowners undergoing minor upgrades and major renovations (where, for both segments, 50% were either ‘likely’ or ‘highly likely’ to target the segment). These results are presented in Figure 13. These figures provide an indication that local government bodies, who accounted for several of the respondents, may be open to engaging with the Scorecard Team to discuss ways of driving these segments.
Figure 13: Which market segments are you likely to target to promote and/or deliver Scorecard assessments? (government, n=12)
i. energy customers on hardship concession programs
h. public and social housing providers
g. renters for their own general information
f. builders wishing to demonstrate energy performance
e. property owners for their own general information
d. property owners ahead of rental of their property
c. property owners ahead of sale of their property
b. property owners undertaking major renovations
a. property owners undertaking minor upgrades
0% 20% 40% 60% 80% 100%
highly unlikely unlikely neutral likely highly likely
Delivery modes
Predictably, government stakeholders are mainly looking to roll out Scorecard assessments as government funded activities (with 58% of respondents being either ‘highly likely’ or ‘likely’ to pursue this delivery mode). The next- favoured delivery mode was bundled assessments (42% on the same measure).
While it is unclear exactly what these stakeholders mean when they think about ‘government funded assessments’, it seems reasonable to assume that they are either referring to funding from the state government to undertake assessments in their LGA or local government funded programs. One comment made by a local council stakeholder was that the Scorecard “needs high public recognition and strong [communications] to be effective and able to be leveraged by councils”.
Price point
Government stakeholders were asked whether they would outsource assessments or conduct them in-house. 75% of respondents intend to outsource assessments to an external provider.
Of these governments intending to use external assessors to deliver assessments, approximate average price to be charged to householders was $134. In turn, these government stakeholders would be willing to pay assessors an indicative average of $179 to conduct the assessments, indicating a subsidised approach to assessments because the nominated price charged to customers is below the cost of delivering assessments.

6
28%40%% 12%516%
26%6%2%114%19%
33%26%22%7%12%
19%34%26%9%12%
Page 63 of www.pointadvisory.c
3.4 GovernanceThe survey asked a series of questions about governance, in particular seeking feedback on those aspects of Scorecard program governance and development that stakeholders wished to be involved with. The overarching results of this are shown in Figure 14. Stakeholders indicated a preference to be involved in the ‘technical development of the(which 68% of respondents were either ‘likely’ or ‘highly likely’ to be interested in). This is understandable, given their business models rely on the Scorecard being a credible and robust tool. Stakeholders were also interested in being involved in Scorecard program integrity (59% on the same measure).
Figure 14: Which aspects of governance and development would your organisation be most interested to participate in? (all respondents, n=58)
Scorecard promotion and marketing
Scorecard program integrity
assessor certification and oversight
technical development of the Scorecard
Interestingly, over half of respondents expressed an interest in being involved in each individual aspect of program governance.
On average, stakeholders are happy to participate in program governance and development (e.g. through workshops or phone calls) every three months, as shown in Figure 15.
Figure 15: How often would you be willing to participate in meetings and workshops to discuss the nominated aspects of Scorecard governance and development? (all respondents, n=58)
50%45%40%35%30%25%20%15%10%
5%0%
not applicable once a month once every three
months
once every six months once a year
0% 20% 40% 60% 80% 100%highly unlikely unlikely neutral likely highly likely
I

I