Embed Size (px)
Citation preview

Find more information here: https://www.corc.uk.net/outcome-experience-measures/feedback-and-outcome-measures-for-children-and-young-people-with-learning-disabilities/
REPORT: USE OF THE STRENGTHS AND DIFFICULTIES QUESTIONNAIRE FOR MONITORING THE WELLBEING OF CHILDREN AND YOUNG PEOPLE WITH LEARNING DISABILITIES
Stream 2 of the wider project: Gathering feedback and measuring outcomes and change with Children and Young People with Learning Disabilities (LD)
May 2021
Eric Emerson Lead Stream 2 for interrogation of Millennium Cohort Study data on Strengths and Difficulties Questionnaire (SDQ)
Emeritus Professor of Disability and Health Research, Lancaster and Sydney Universities

Find more information here: https://www.corc.uk.net/outcome-experience-measures/feedback-and-outcome-measures-for-children-and-young-people-with-learning-disabilities/
Table of Contents Summary ................................................................................................................................................. 3
Face Validity ..................................................................................................................................... 3 Factorial Structure and Reliability .................................................................................................... 3 Conclusion ........................................................................................................................................ 4
Background ............................................................................................................................................. 4 Previous Research on the Applicability of the SDQ to Children and Young People with Learning Disabilities ........................................................................................................................................ 4 Research Aims .................................................................................................................................. 5
Methods Used ......................................................................................................................................... 6 Sampling ........................................................................................................................................... 6 Procedure ......................................................................................................................................... 6 Identification of Children with Learning Disabilities ........................................................................ 6 The Strengths & Difficulties Questionnaire (SDQ) ............................................................................ 8 Child Self-Report Measures of Wellbeing ........................................................................................ 9 Age 11: Child Self-report ................................................................................................................. 9 Age 14: Short-Form Mood and Feelings Questionnaire (SF-MFQ) ................................................. 9
Approach to Analysis ........................................................................................................................ 9 Findings ................................................................................................................................................. 10
The Association between Learning Disability and SDQ Scores ...................................................... 10 The Factorial Structure of the SDQ ................................................................................................. 15 Conclusion ..................................................................................................................................... 16
The Internal Consistency of SDQ Scales ......................................................................................... 17 Conclusion ..................................................................................................................................... 18
Agreement between Maternal and Teacher SDQ Ratings ............................................................. 19 Conclusion ..................................................................................................................................... 19
Agreement between Maternal SDQ Ratings and Child Self-Report ............................................... 20 Conclusion ..................................................................................................................................... 20
Discussion ............................................................................................................................................. 21 Face Validity ................................................................................................................................... 21 Factorial Structure and Reliability .................................................................................................. 21 Strengths and Limitations ............................................................................................................... 22 Conclusion ...................................................................................................................................... 22
References ............................................................................................................................................ 23

Report: Use of the Strengths and Difficulties Questionnaire for monitoring the wellbeing of children and young people with learning disabilities Gathering feedback and measuring outcomes and change with Children and Young People with Learning Disabilities (LD)
3
This analysis is part of the “Special Measures” Project funded by the British Psychological Society’s Division of Clinical Psychology (BPS DCP) and delivered in collaboration with the Child Outcome Research Consortium (CORC). The project seeks to increase equality and diversity in feedback and outcome measures by progressing practice and practice-guidance on measures and methods for children and young people with learning disabilities (CYP-LD), their families and networks.
SUMMARY
It has been suggested that the pattern of emotional and behavioural difficulties may be different among children and young people with learning disabilities when compared to their peers. Therefore, it has been argued that scales developed for the general population may not be applicable to children and young people with learning disabilities, especially those with more severe learning disabilities. The aim of this report was to present new data, extracted from the UK’s Millennium Cohort Study, on the face validity, factorial structure and reliability of the SDQ when used with children with learning disabilities.
Face Validity
There is relatively robust evidence that: (1) a wide range of emotional and behavioural difficulties are more common among children with learning disabilities when compared with their peers; and (2) that these difficulties are associated with increased family burden. The analyses of SDQ data presented in this report (including subscale scores and result of the impact supplement) are fully consistent with this existing literature. The analyses also indicated that, in general, greater severity of learning disabilities tended to be associated with more severe emotional and behavioural difficulties.
Factorial Structure and Reliability • The analyses undertaken do suggest that the factorial structure of the SDQ may be less stable for
children with learning disabilities. However, this may also simply reflect the much smaller sample sizes available for children with learning disabilities.
• There were no systematic differences in the internal consistency of the SDQ scales between children with and without learning disabilities.
• Consistent with the results of previous research, the association between maternal report and teacher report of emotional and behavioural difficulties were weak to modest. There were no systematic differences in the strength of these associations between children with and without learning disabilities.
• Consistent with the results of previous research, the association between maternal report and child self-report of emotional and behavioural difficulties was weak. Overall, the association was stronger for children without learning disabilities. However, this difference was only apparent for girls.
• Among children with learning disabilities there was very little evidence that key psychometric characteristics of the SDQ vary by severity of learning disability in the sample.

Report: Use of the Strengths and Difficulties Questionnaire for monitoring the wellbeing of children and young people with learning disabilities Gathering feedback and measuring outcomes and change with Children and Young People with Learning Disabilities (LD)
4
Conclusion We found little evidence to support the contention that the parent completed SDQ may not be applicable to children and young people with learning disabilities, including those with more severe disabilities in the sample.
BACKGROUND
It has been suggested that the pattern of emotional and behavioural difficulties may be different among children and young people with learning disabilities when compared to their peers. Therefore, it has been argued that: (1) scales developed for the general population may not be applicable to children and young people with learning disabilities; and (2) scales may need to be developed specifically for children and young people with learning disabilities.
It is currently recommended by CORC (Child Outcomes Research Consortium) on the basis of a consensus development exercise that the SDQ could be appropriately used with children and young people with mild learning disabilities, ‘but not those with more severe disabilities’. No research evidence was cited in support of the recommendation that the SDQ would be inappropriate to use with children and young people with more severe learning disabilities. However, a comment from the primary developer of the SDQ (Robert Goodman) was included in the recommendation; ‘his experience that the SDQ generally works well for mild intellectual disability but not severe/profound intellectual disability “... at least in part because the high rate of self-injurious behaviour and autistic features is not well covered”.1
Previous Research on the Applicability of the SDQ to Children and Young People with Learning Disabilities Very little research has been conducted on the applicability of the SDQ to children and young people with learning disabilities.2 The research that has been undertaken is summarised below.
1. A relatively small scale Australian study reported that the parental completed SDQ total difficulties score correlates well with the parent version of the Developmental Behaviour Checklist (DBC-P) total behaviour problem score and that agreement between the SDQ borderline cut-off and the DBC-P cut-off for abnormality was high (83%). Positive agreement between the DBC-P and the SDQ borderline cut-off was also reported to be high, with the SDQ borderline cut-off identifying 86% of those who met the DBC-P criterion.3 Unfortunately no information was available on the severity of learning disability of participants.
2. More recently a much larger UK study has reported a strong association between the SDQ Total Difficulties score and the DBC-P and supported the use of the same SDQ cut-off for those with and without intellectual disability.4
3. The SDQ subscales of conduct difficulties, hyperactivity/inattention and peer problems (but not total difficulties) were sensitive to change over time following intervention by a Family Intensive Support Service for Children presenting with learning disabilities and challenging behaviours.5 While no

Report: Use of the Strengths and Difficulties Questionnaire for monitoring the wellbeing of children and young people with learning disabilities Gathering feedback and measuring outcomes and change with Children and Young People with Learning Disabilities (LD)
5
information is provided on the severity of learning disability of the participants, it is implied in the discussion that the children had ‘significant learning disabilities’.
4. Inter-rater reliability between parent, teacher and child completed SDQ data are similar for children with and without learning disabilities, as are measures of the internal consistency of SDQ subscales.6-
8 Two of these studies focused on children with mild-moderate learning disability.6, 8 The other was undertaken on a sample of 33 children with a mean age of 9.0 years and a mean developmental delay of 3.8 years.7
5. The pattern of child self-reported SDQ scores is also consistent with ICD-10 psychiatric diagnoses in children with mild-moderate learning disabilities.6
6. There was no evidence of response bias among children with mild-moderate learning disabilities.6
Research Aims Given the paucity of research on the applicability of the SDQ to children and young people with learning disabilities we sought to determine:
1. Whether there are differences between data collected on children with and without learning disabilities regarding the
a. The prevalence and severity of emotional and behavioural difficulties b. factorial structure of the SDQ c. internal consistency of SDQ sub-scales d. level of agreement between maternal completed and completed teacher completed
versions of the SDQ e. level of agreement between maternal completed SDQ data and child-self report data.
2. Whether there are differences among children with different severity of learning disabilities regarding these four characteristics of the SDQ.
Learning disabilities is the term used in this project and report, used in the plural form to denote a range of abilities/disabilities in a range of people. Current Department of Health (DH) definition in their policy and practice documents includes:
• significantly reduced ability to understand new or complex information, to learn new skills
• reduced ability to cope independently which starts before adulthood with lasting effects on development.9
The “significantly reduced ability to understand new or complex information, to learn new skills” is taken to be 2 Standard Deviations below the mean on a validated test of general cognitive functioning (equivalent to an IQ score of less than 70).
As such, our use of the term ‘learning disabilities’ is broadly synonymous with the international terms ‘intellectual disabilities’ and (in ICD-11) ‘disorders of intellectual development’.

Report: Use of the Strengths and Difficulties Questionnaire for monitoring the wellbeing of children and young people with learning disabilities Gathering feedback and measuring outcomes and change with Children and Young People with Learning Disabilities (LD)
6
METHODS USED
We undertook secondary analysis of Waves 2-6 of the UK’s Millennium Cohort Study (MCS). MCS is the fourth in the series of British birth cohort studies. It aims to follow throughout their lives a cohort of over 18,000 children born in the UK between 2000 and 2002. MCS data are managed by the Centre for Longitudinal Studies at the University of London (www.cls.ioe.ac.uk/) and are available to researchers registered with the UK Data Service (http://ukdataservice.ac.uk/). Full details of the design of MCS are available in a series of reports and technical papers,10-12 key aspects of which are summarised below.
Sampling Participant families were randomly selected from Child Benefit Records, a non-means tested welfare benefit available to all UK children. Sampling was geographically clustered to include all four countries of the UK (England, Wales, Scotland, Northern Ireland), and disproportionately stratified to over-sample children from ethnic minority groups, disadvantaged communities and children born in Wales, Scotland and Northern Ireland.13 Children and families were drawn from 398 randomly selected electoral wards in the UK. The first survey (MCS1) took place when children were nine months old and included a total of 18,551 families. Children were followed up at ages three (MCS2; 15,590 families, 84% retention rate from MCS1), five (MCS3; 15,246 families, 82% retention rate from MCS1), seven (MCS4; 13,857 families, 75% retention rate from MCS1), 11 (MCS5; 12,813 families, 69% retention rate from MCS1) and 14 (MCS6; 11,726 families, 63% retention rate from MCS1). For each family, information was collected on the target child falling within the designated birth date window. For multiple births (e.g., twins, triplets) information was collected on all children.
Procedure All data used in the present study were collected by parental report, direct cognitive testing of the child and data linkage.
Identification of Children with Learning Disabilities To identify whether children had a learning disability we followed a procedure that has been used extensively with MCS data and other surveys to estimate IQ for abbreviated cognitive test scores.14-31 Child cognitive ability was assessed at age three using the Bracken School Readiness Assessment32 and Naming Subscale of the British Ability Scales BAS; 33 selected subscales of the BAS at ages five and seven, and the National Foundation for Educational Research (NFER) Progress in Maths test at age seven.34 At age eleven children were given three cognitive tests; verbal similarities (BAS), the Spatial Working Memory task and the Cambridge Gambling task, both from the Cambridge Neuropsychological Test Automated Battery. Of the age eleven tests, only the verbal similarities test was closely related to traditional measures of IQ.
For ages five and seven we extracted the first component (‘g’) from a principal component analysis of all age-standardised subscale/test scores.14-17 The first component accounted for 63% of score variance at age seven and 55% of score variance at age five. We identified children as having learning disability if they scored two or more standard deviations below the mean on the first principal component at age seven (n=423 [3.3%] of 12,799 children for whom test results were available).

Report: Use of the Strengths and Difficulties Questionnaire for monitoring the wellbeing of children and young people with learning disabilities Gathering feedback and measuring outcomes and change with Children and Young People with Learning Disabilities (LD)
7
If cognitive test scores were missing at age seven, we identified children as having learning disability if they scored two or more standard deviations below the mean on the first principal component at age five (n=146 [6.5%] of 2,250 children). If cognitive test scores were missing at age five and at age seven, we identified children as having learning disability if they scored two or more standard deviations below the mean on the Bracken School Readiness Assessment at age three (n=56 [4.4%] of 1110 children). If Bracken scores were not available, we identified children as having learning disability if they scored two or more standard deviations below the mean on the BAS Naming Subscale at age three (n=19 [17.2%] of 110 children). Overall this procedure identified 644 children as having learning disabilities from the 16,269 children for who cognitive tests were available.
For 2,975 children no cognitive test results were available at any age. Of these, 2736 (92.0%) did not participant at all in Waves 2-4. For the 239 who did participate in at least one of these waves, interviewers did not administer cognitive assessments if the child ‘has a learning disability/serious behavioural problem (e.g., severe ADHD, autism) which prevents them from carrying out the assessments’, ‘is unable to respond in the required manner for each assessment, e.g., reading, writing, manipulating objects’, ‘is not able to speak or understand English (or Welsh if applicable)’ or if consent and co-operation were not forthcoming. For these children we identified learning disability on the basis of parental report at age seven. A child was identified as having learning disability if both of the following two criteria were met: (1) the child was reported to be receiving special education due to their ‘learning difficulty’ (the term used in educational services in the UK to refer to learning disability); AND (2) the child was reported to have ‘great difficulty’ in all three areas of reading, writing and maths. This led to the identification of another 10 of 79 children as having learning disability.
Finally, we used the normalised verbal similarities standard score at age eleven to attempt to address potential errors in classification derived from the W2-4 variables. Specifically, all children who had been identified as having learning disability who scored at or above the population mean on verbal similarities at age eleven were reclassified as not having learning disability. Similarly, all children identified as not having learning disability but who scored three or more standard deviations below the population mean on verbal similarities at age eleven were reclassified as having learning disability.
This procedure led to the identification of 665 of the 16,342 (4.1%) children for who data was available as having a learning disability. As expected, boys were significantly more likely than girls to be identified as having learning disability (4.3% vs 2.6%; OR=1.67, 95% CI 1.42-1.96).
We had estimates of IQ (‘g’) from a principal component analysis of age-standardised subscale/test scores for 649 (97.6%) of children we had identified as having learning disabilities. We used these estimates of IQ in two ways to create subgroups of children with learning disabilities. First, we created three groups ranging from least to most severe based on approximately equal numbers per group (population tercile groups; least severe (estimated IQ > 67.3, n=217), moderately severe (estimated IQ 62-67.3, n=218), most severe (estimated IQ < 62, n=214). These categories do not correspond to traditional categories of severity of learning disability. Instead they represent a pragmatic approach to deriving a classification of different levels of severity which has the greatest statistical power to examine variation in outcomes at differing levels of severity of learning disability. Second, we created two groups based on more traditional IQ cut-offs; those scoring 2 to 3 standard deviations below the population mean (estimated IQ 55-69, n= 576) and those scoring more than 3 standard deviations below the population mean (estimated IQ <55, n= 73).

Report: Use of the Strengths and Difficulties Questionnaire for monitoring the wellbeing of children and young people with learning disabilities Gathering feedback and measuring outcomes and change with Children and Young People with Learning Disabilities (LD)
8
The classification system we used is based solely on evidence of impaired cognitive functioning, an approach which is consistent with the ICD-10 definition of ‘mental retardation’.35 However, the ICD-11 definition of ‘disorders of intellectual development’ also contains criteria based on adaptive behaviour or functioning.36 As such the classification system used in this report may be overinclusive when compared against ICD-11 criteria.
The Strengths & Difficulties Questionnaire (SDQ) The MCS has used the SDQ37-41 in Waves 2-6. It is psychometrically robust instrument commonly used in large-scale population surveys to measure emotional and behavioural difficulties in children.39, 40, 42, 43 The SDQ is comprised of four problem-oriented subscales (Conduct Difficulties, Emotional Difficulties, Hyperactivity, Peer Problems) and a Pro-social Behaviour subscale. Each subscale consists of five items relating to child behaviour (e.g., ‘[child’s name] is often unhappy, down-hearted or tearful’), rated by the parental informant on a three-point Likert scale (not true, somewhat true, certainly true) in relation to the child’s behaviour over the previous six months. Scores on the four problem-oriented sub-scales are summed to produce a Total Difficulties score.
There are three versions of the SDQ designed for: (1) parental completion; (2) child-self completion (age 11+); (3) teacher completion. The MCS included the parental completion form in Waves 2-6 and the teacher completion form in Waves 4 (age 7) and 5 (age 11). MCS has not included the child self-completion form of the SDQ in any Wave. The availability of complete SDQ data collected from the child’s biological mother at each wave for children with and without learning disabilities is presented in Table 1.
Table 1: Number and % of Children with and without Learning Disabilities Participating at each Stage for who Complete SDQ Data Collected from the Child’s Biological Mother was Available Age Children with learning disabilities Children without learning disabilities
3 192 (41%) 8,239 (65%) 5 312 (61%) 10,977 (78%) 7 291 (63%) 10,018 (81%)
11 379 (73%) 12,183 (85%) 14 280 (75%) 8,422 (85%)
In addition, the extended SDQ includes an ‘impact supplement’ that is answered after the above section.
Q1: Overall, do you think that your child has difficulties in one or more of the following areas: emotions, concentration, behaviour or being able to get on with other people? (Response options: No; Yes- minor difficulties; Yes- definite difficulties; Yes- severe difficulties). If the respondent answers ‘Yes’ to Q1 the following questions are asked.
Q2: How long have these difficulties been present? (Response options: Less than a month; 1-5 months; 6-12 months; Over a year)
Q3: Do the difficulties upset or distress your child? (Response options: Not at all; Only a little; Quite a lot; A great deal)
Q4: Do the difficulties interfere with your child's everyday life in the following areas? (a) home life, (b) friendships, (c) classroom learning, (d) leisure activities (Response options: Not at all; Only a little; Quite a lot; A great deal).
Q5: Do the difficulties put a burden on you or the family as a whole? (Response options: Not at all; Only a little; Quite a lot; A great deal).

Report: Use of the Strengths and Difficulties Questionnaire for monitoring the wellbeing of children and young people with learning disabilities Gathering feedback and measuring outcomes and change with Children and Young People with Learning Disabilities (LD)
9
The MCS has included the parent completed impact supplement of the SDQ in Wave 2 (age 3), Wave 3 (age 5) and Wave 4 (age 7).
Child Self-Report Measures of Wellbeing Age 11: Child Self-report
The age 11 child self-report data are based on six items originally developed for the Understanding Society survey Youth Questionnaire: ‘In the last four weeks, how often did you …. ‘feel happy?’, ’get worried about what would happen to you?’, ‘feel sad?’, ‘feel afraid or scared?’, ‘laugh?’, ‘get angry?’. Response options were: (1) ‘never’; (2) ‘almost never’; (3) ‘sometimes’; (4) ‘often’; (5) ‘almost always’. The scale demonstrated reasonable internal consistency (alpha = 0.69). There are no established cut-points for the scale. Child self-report data were available at age 11 for 400 children with learning disabilities (78% of participating children) and 13,456 children without learning disabilities (94% of participating children).
Age 14: Short-Form Mood and Feelings Questionnaire (SF-MFQ)
The SF-MFQ was included in MCS Wave 6 (age 14). It is a 13-item questionnaire designed to screen for depression in children and adolescents.44 While two studies have suggested using a cut-off of eight or higher for major depression,44, 45 sensitivity (ranging from 60%-75%) and specificity (ranging from 74%-85%) are less than optimal. In addition, this cut-off identifies 28.5% (95% CI 27.2% to 29.8%) of children at risk of major depression compared to an estimated population prevalence among 11-16 year old children in the UK of 1.4%.43 Child self-report data were available at age 14 for 272 children with learning disabilities (73% of participating children) and 9,311 children without learning disabilities (94% of participating children).
Approach to Analysis All analyses were restricted to a subsample in which SDQ data was completed by the child’s biological mother and, for households in which more than one child was born in the MCS sampling window, the first named child. By restricting data to that which was completed by the child’s biological mother we sought to reduce potential biases associated with different informants. In all waves, by far the most common adult informant was the child’s biological mother (e.g., for 88% of children at age 3). By restricting data to one child per household we avoided bias in the calculation of standard errors due to clustering within families.
All analyses were undertaken in IBM SPSS 24 using sample weights provided with the data to address known biases resulting from differential recruitment rates and attrition over time. All analyses were undertaken on participants for who complete SDQ data was available (i.e., no missing SDQ data were imputed).

Report: Use of the Strengths and Difficulties Questionnaire for monitoring the wellbeing of children and young people with learning disabilities Gathering feedback and measuring outcomes and change with Children and Young People with Learning Disabilities (LD)
10
FINDINGS
The Association between Learning Disability and SDQ Scores Mean scale scores are presented in Table 2 for children with and without learning disabilities at each wave of data collection. Consistent with available evidence,46 SDQ data indicated that children with learning disabilities were more likely than their peers to show emotional and behavioural difficulties at all ages.
Table 2: Mean SDQ Scale Scores for Children with and without Learning Disabilities Children with
learning disabilities
Children without learning disabilities
Statistical significance of difference (Mann-Whitney z)
Age 3 Conduct difficulties 3.74 2.76 z=7.98, p<0.001
Emotional difficulties 2.10 1.33 z=8.42, p<0.001 Hyperactivity/Inattention 5.60 3.85 z=13.04, p<0.001
Peer Problems 2.32 1.49 z=9.25, p<0.001 Pro-social behaviour 6.84 7.37 z=4.40, p<0.001
Total difficulties 13.79 9.37 z=14.28, p<0.001 Age 5
Conduct difficulties 2.53 1.46 z=11.79, p<0.001 Emotional difficulties 2.28 1.33 z=9.76, p<0.001
Hyperactivity/Inattention 5.33 3.32 z=15.86, p<0.001 Peer Problems 1.96 1.39 z=14.71, p<0.001
Pro-social behaviour 7.64 8.41 z=8.10, p<0.001 Total difficulties 12.35 7.05 z=16.99, p<0.001
Age 7 Conduct difficulties 2.67 1.39 z=14.33, p<0.001
Emotional difficulties 2.67 1.51 z=11.45, p<0.001 Hyperactivity/Inattention 5.61 3.34 z=14.77, p<0.001
Peer Problems 2.59 1.19 z=13.82, p<0.001 Pro-social behaviour 7.68 8.60 z=8.57, p<0.001
Total difficulties 13.39 7.42 z=17.17, p<0.001 Age 11
Conduct difficulties 2.55 1.45 z=13.44, p<0.001 Emotional difficulties 3.29 1.88 z=12.98, p<0.001
Hyperactivity/Inattention 5.37 1.36 z=16.90, p<0.001 Peer Problems 2.86 1.38 z=16.24, p<0.001
Pro-social behaviour 8.05 8.75 z=7.91, p<0.001 Total difficulties 14.06 7.86 z=18.65, p<0.001
Age 14 Conduct difficulties 2.43 1.53 z=7.67, p<0.001
Emotional difficulties 3.31 2.09 z=9.37, p<0.001 Hyperactivity/Inattention 4.78 3.13 z=11.24, p<0.001
Peer Problems 2.95 1.81 z=9.82, p<0.001
Report: Use of the Strengths and Difficulties Questionnaire for monitoring the wellbeing of children and young people with learning disabilities Gathering feedback and measuring outcomes and change with Children and Young People with Learning Disabilities (LD)
11
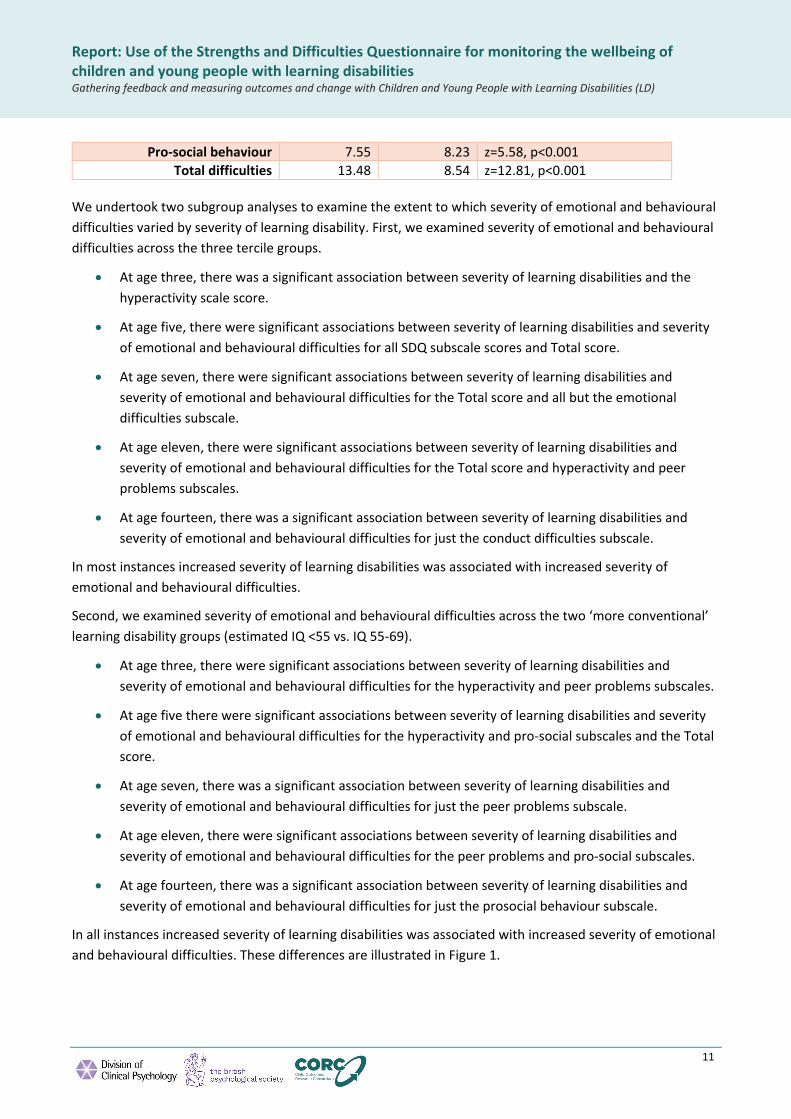
Pro-social behaviour 7.55 8.23 z=5.58, p<0.001 Total difficulties 13.48 8.54 z=12.81, p<0.001
We undertook two subgroup analyses to examine the extent to which severity of emotional and behavioural difficulties varied by severity of learning disability. First, we examined severity of emotional and behavioural difficulties across the three tercile groups.
• At age three, there was a significant association between severity of learning disabilities and the hyperactivity scale score.
• At age five, there were significant associations between severity of learning disabilities and severity of emotional and behavioural difficulties for all SDQ subscale scores and Total score.
• At age seven, there were significant associations between severity of learning disabilities and severity of emotional and behavioural difficulties for the Total score and all but the emotional difficulties subscale.
• At age eleven, there were significant associations between severity of learning disabilities and severity of emotional and behavioural difficulties for the Total score and hyperactivity and peer problems subscales.
• At age fourteen, there was a significant association between severity of learning disabilities and severity of emotional and behavioural difficulties for just the conduct difficulties subscale.
In most instances increased severity of learning disabilities was associated with increased severity of emotional and behavioural difficulties.
Second, we examined severity of emotional and behavioural difficulties across the two ‘more conventional’ learning disability groups (estimated IQ <55 vs. IQ 55-69).
• At age three, there were significant associations between severity of learning disabilities and severity of emotional and behavioural difficulties for the hyperactivity and peer problems subscales.
• At age five there were significant associations between severity of learning disabilities and severity of emotional and behavioural difficulties for the hyperactivity and pro-social subscales and the Total score.
• At age seven, there was a significant association between severity of learning disabilities and severity of emotional and behavioural difficulties for just the peer problems subscale.
• At age eleven, there were significant associations between severity of learning disabilities and severity of emotional and behavioural difficulties for the peer problems and pro-social subscales.
• At age fourteen, there was a significant association between severity of learning disabilities and severity of emotional and behavioural difficulties for just the prosocial behaviour subscale.
In all instances increased severity of learning disabilities was associated with increased severity of emotional and behavioural difficulties. These differences are illustrated in Figure 1.

Report: Use of the Strengths and Difficulties Questionnaire for monitoring the wellbeing of children and young people with learning disabilities Gathering feedback and measuring outcomes and change with Children and Young People with Learning Disabilities (LD)
12
Figure 1: Mean scale scores for children with mild/moderate and severe learning disabilities
0
5
10
15
20
Emotional Conduct Hyperactivity Peer Prosocial Total
Age 3
0
5
10
15
20
Emotional Conduct Hyperactivity Peer Prosocial Total
Age 5
0
5
10
15
20
Emotional Conduct Hyperactivity Peer Prosocial Total
Age 7
0
5
10
15
20
Emotional Conduct Hyperactivity Peer Prosocial Total
Age 11
0
5
10
15
20
Emotional Conduct Hyperactivity Peer Prosocial Total
Age 14
mild/moderate
severe

Report: Use of the Strengths and Difficulties Questionnaire for monitoring the wellbeing of children and young people with learning disabilities Gathering feedback and measuring outcomes and change with Children and Young People with Learning Disabilities (LD)
13
Impact scores are presented in Table 3 for children with and without learning disabilities at each wave of data collection. These data indicated that the parents of children with learning disabilities were more likely than their peers to report that their child’s behaviour had a detrimental impact on their functioning and were associated with greater family burden.
We again undertook two subgroup analyses to examine the extent to which severity of emotional and behavioural difficulties varied by severity of learning disability. First, we examined severity of emotional and behavioural difficulties across the three tercile groups.
• At age three, there were significant associations between severity of learning disabilities and duration of emotional and behavioural difficulties.
• At age five, there were significant associations between severity of learning disabilities and severity of emotional and behavioural difficulties and impact on learning.
• At age seven, there were significant associations between severity of learning disabilities and severity of emotional and behavioural difficulties, impact on learning and impact on leisure activities.
In all instances increased severity of learning disabilities was associated with increased severity of emotional and behavioural difficulties.
Second, we examined severity of emotional and behavioural difficulties across the two ‘more conventional’ learning disability groups (estimated IQ <55 vs. IQ 55-69).
• At ages three and five, there were significant associations between severity of learning disabilities and severity of emotional and behavioural difficulties, duration of difficulties and impact on learning.
• At age seven, there was a significant association between severity of learning disabilities and severity of emotional and behavioural difficulties and impact on friendships, learning and leisure activities.
In all instances increased severity of learning disabilities was associated with increased severity of emotional and behavioural difficulties.

Report: Use of the Strengths and Difficulties Questionnaire for monitoring the wellbeing of children and young people with learning disabilities Gathering feedback and measuring outcomes and change with Children and Young People with Learning Disabilities (LD)
14
Table 3: SDQ Impact Scores for Children with and without Learning Disabilities Children
with learning disabilities
Children without learning disabilities
Statistical significance of difference (Mann-Whitney z for full ordinal scale)
Age 3 Severity of difficulties (% severe difficulties) 2.6% 0.4% z=13.65, p<0.001 Duration of difficulties (% > 1 year) 47.4% 35.0% z=3.17, p<0.01 Difficulties upset or distress child (% a great deal)
3.6% 1.9% z=0.51, n.s.
Difficulties interfere with child’s everyday activities in …. (% a great deal)
Home life 3.5% 1.2% z=2.19, p<0.05 Friendships 5.3% 1.6% z=2.54, p<0.05
Learning 14.0% 1.9% z=7.95, p<0.001 Leisure activities 3.6% 1.0% z=4.75, p<0.001
Difficulties put a burden on family (% a great deal)
5.9% 2.9% z=2.71, p<0.01
Age 5 Severity of difficulties (% severe difficulties) 5.9% 0.6% z=16.63, p<0.001 Duration of difficulties (% > 1 year) 68.8% 56.2% z=2.56, p<0.05 Difficulties upset or distress child (% a great deal)
8.8% 2.0% z=4.95, p<0.001
Difficulties interfere with child’s everyday activities in …. (% a great deal)
Home life 8.3% 1.6% z=4.85, p<0.001 Friendships 8.7% 2.0% z=7.66, p<0.001
Learning 16.7% 3.0% z=9.56, p<0.001 Leisure activities 7.8% 1.6% z=7.78, p<0.001
Difficulties put a burden on family (% a great deal)
8.0% 2.4% z=5.76, p<0.001
Age 7 Severity of difficulties (% severe difficulties) 11.1% 1.1% z=18.11, p<0.001 Duration of difficulties (% > 1 year) 81.5% 68.1% z=4.10, p<0.001 Difficulties upset or distress child (% a great deal)
8.8% 3.3% z=6.52, p<0.001
Difficulties interfere with child’s everyday activities in …. (% a great deal)
Home life 8.8% 2.2% z=4.92, p<0.001 Friendships 13.5% 2.9% z=5.78, p<0.001
Learning 20.5% 5.4% z=11.76, p<0.001 Leisure activities 9.4% 2.0% z=6.30, p<0.001
Difficulties put a burden on family (% a great deal)
10.7% 3.7% z=5.15, p<0.001

Report: Use of the Strengths and Difficulties Questionnaire for monitoring the wellbeing of children and young people with learning disabilities Gathering feedback and measuring outcomes and change with Children and Young People with Learning Disabilities (LD)
15
The Factorial Structure of the SDQ In order to investigate potential differences in the factorial structure of the SDQ when applied to children with learning disabilities we used principal components analysis with varimax factor rotation to extract five factors from the available data on children with and without learning disabilities at each age. In the following table we report a simple metric, the percentage of items that had their highest factor loading on the intended factor.
Table 4: Factorial Structure of Maternal Completed SDQ at Child Ages 3, 5, 7, 11 and 14 % of 25 items loading
most heavily on the intended factor
Comments
Age Children with learning disabilities
Other children
3 80% 84% For children with and without learning disabilities all items on the Pro-social Behaviour subscale loaded on the intended factor. For children without learning disabilities all items on the Emotional Difficulties subscale loaded on the intended factor. For children with learning disabilities all items on the Hyperactivity/Inattention subscale loaded on the intended factor.
5 64%* 92%* For children with and without learning disabilities all items on the Hyperactivity/Inattention and Pro-social Behaviour subscales loaded on the intended factor. For children without learning disabilities all items on the Emotional Difficulties and Peer Problems subscales loaded on the intended factor.
7 84% 92% For children with and without learning disabilities all items on the Emotional Difficulties and Pro-social Behaviour subscales loaded on the intended factor. For children without learning disabilities all items on the Hyperactivity/Inattention and Peer Problems subscales loaded on the intended factor.
11 64%* 96%* For children with and without learning disabilities all items on the Pro-social Behaviour subscale loaded on the intended factor. For children without learning disabilities all items on the Hyperactivity/Inattention, Peer Problems and Emotional Difficulties subscales loaded on the intended factor.
14 64%* 96%* For children without learning disabilities all items on the Hyperactivity/Inattention, Peer Problems, Pro-social Behaviour and Emotional Difficulties subscales loaded on the intended factor.
Table Notes: * denotes a statistically significant difference between percentages between children with and without learning disabilities;

Report: Use of the Strengths and Difficulties Questionnaire for monitoring the wellbeing of children and young people with learning disabilities Gathering feedback and measuring outcomes and change with Children and Young People with Learning Disabilities (LD)
16
The analyses undertaken suggest that the factorial structure of the SDQ may be less stable for children with learning disabilities. However, while there is no clear consensus on the minimum required sample size to attain stable results in factor analysis, stability of solutions does increase with larger sample sizes. Given this we repeated the analyses for children without learning disabilities on a randomly selected sub-sample equivalent to the sample size of children with learning disabilities. In these analyses the percentage of the 25 items loading most heavily on the intended factor was reduced to 80% at age 3, 76% at age 5, 80% at age 7, 76% at age 11 and 92% at age 14. In this set of analyses there would only have been a statistically significant difference between children with and without learning disabilities at one of the five ages (age 14). Given the relatively small number of participants with learning disability, it was not viable to undertake factor analyses for subgroups of children with differing severity of learning disability.
Conclusion
The analyses undertaken suggest that the factorial structure of the SDQ may be less stable for children with learning disabilities. However, this may simply reflect the much smaller sample sizes of children with learning disabilities. At a more general level it is notable that in none of these analyses did all five of the items of the Conduct Difficulties subscale load primarily on the same factor.

Report: Use of the Strengths and Difficulties Questionnaire for monitoring the wellbeing of children and young people with learning disabilities Gathering feedback and measuring outcomes and change with Children and Young People with Learning Disabilities (LD)
17
The Internal Consistency of SDQ Scales Internal consistency is an assessment of how reliably test items measure a specific construct that is considered to underlie scales such as the SDQ. Cronbach's alpha is one the most commonly used measure of internal consistency. There is a consensus that an alpha value of 0.60 represents the minimal accepted level of internal consistency for psychometric scales. Confidence intervals for alpha were estimated using the programme available at https://www.psyctc.org/stats/R/Feldt1.html
Table 5: Internal Consistency (Cronbach’s Alpha with 95% Confidence Intervals) of Maternal Completed SDQ Scales at Child Ages 3, 5, 7, 11 and 14 Children with learning
disabilities Other children
Age 3 Total problems 0.77 (0.72-0.81) 0.78 (0.77-0.78)
Conduct difficulties 0.69 (0.63-0.74) 0.69 (0.68-0.70) Emotional difficulties 0.55 (0.46-0.62) 0.50 (0.49-0.52)
Hyperactivity 0.71 (0.66-0.76) 0.71 (0.70-0.72) Peer Problems 0.43 (0.32-0.53)# 0.47 (0.45-0.48)#
Pro-social behaviour 0.70 (0.64-0.75) 0.66 (0.65-0.67) Age 5
Total problems 0.82 (0.79-0.85) 0.79 (0.78-0.79) Conduct difficulties 0.67 (0.61-0.72)* 0.55 (0.53-0.56)*#
Emotional difficulties 0.63 (0.58-0.69) 0.59 (0.58-0.60) Hyperactivity 0.77 (0.74-0.81) 0.77 (0.76-0.77)
Peer Problems 0.56 (0.48-0.62) 0.51 (0.50-0.53)# Pro-social behaviour 0.70 (0.65-0.74) 0.67 (0.66-0.68)
Age 7 Total problems 0.85 (0.82-0.88) 0.82 (0.82-0.83)
Conduct difficulties 0.61 (0.55-0.67) 0.61 (0.60-0.62) Emotional difficulties 0.68 (0.63-0.73) 0.65 (0.64-0.66)
Hyperactivity 0.81 (0.78-0.84) 0.79 (0.78-0.79) Peer Problems 0.62 (0.58-0.65) 0.58 (0.56-0.59)#
Pro-social behaviour 0.76 (0.72-0.80)* 0.70 (0.69-0.71)* Age 11
Total problems 0.85 (0.83-0.87) 0.85 (0.84-0.85) Conduct difficulties 0.63 (0.57-0.68) 0.64 (0.63-0.65)
Emotional difficulties 0.72 (0.67-0.76) 0.72 (0.71-0.72) Hyperactivity 0.76 (0.72-0.79) 0.79 (0.79-0.80)
Peer Problems 0.61 (0.55-0.67) 0.65 (0.64-0.66) Pro-social behaviour 0.72 (0.67-0.76) 0.67 (0.66-0.68)
Age 14 Total problems 0.78 (0.72-0.83) 0.79 (0.78-0.79)
Conduct difficulties 0.70 (0.64-0.75)* 0.62 (0.61-0.63)* Emotional difficulties 0.74 (0.70-0.79) 0.73 (0.73-0.74)
Hyperactivity 0.56 (0.45-0.65)* 0.68 (0.66-0.69)* Peer Problems 0.56 (0.48-0.64) 0.57 (0.56-0.59)#
Pro-social behaviour 0.75 (0.71-0.79) 0.74 (0.73-0.74)

Report: Use of the Strengths and Difficulties Questionnaire for monitoring the wellbeing of children and young people with learning disabilities Gathering feedback and measuring outcomes and change with Children and Young People with Learning Disabilities (LD)
18
Table Notes: * denotes a statistically significant difference between alpha levels between children with and without learning disabilities; # denotes an alpha level significantly below minimum acceptable value.
In 4 of the 30 comparisons (13%) there were statistically significant differences in the internal consistency of SDQ scales between children with and without learning disabilities. In three of these instances internal consistency was significantly greater among children with learning disabilities.
In 6 of the 60 analyses (10%) internal consistency (primarily of the Peer Problems sub-scale) was significantly lower than the consensus level of 0.60. In five of these six instances this was for children without learning disabilities.
We repeated these analyses among children with learning disabilities separately for children with least severe, moderately severe and most severe disabilities. The purpose of this exercise was to assess whether internal consistency would be lower among children with more severe learning disabilities. We considered internal consistency to be low if two criteria were met: (1) internal consistency in the three groups systematically declined as severity increased; (2) the difference in internal consistency between the ‘least severe’ and ‘most severe’ groups was statistically significant (p<0.05). The first criterion was met in 5 of the 30 analyses. The second criterion was met in two of these five instances. It is worth noting that a reverse pattern of results (internal consistency increasing as severity of learning disability increased) was met in 8 of the 30 analyses, with the second criterion being met in one of these six analyses.
Conclusion It has been suggested that the pattern of emotional and behavioural difficulties may be different among children and young people with learning disabilities when compared to their peers and, consequently, that scales developed for the general population may not be applicable to children and young people with learning disabilities. The analyses undertaken in this and the previous section provide no evidence to support this suggestion. At a more general level it is notable that at four of the five ages the internal consistency of the Peer Problems subscale failed to reach minimal accepted level of internal consistency for a psychometric scale.

Report: Use of the Strengths and Difficulties Questionnaire for monitoring the wellbeing of children and young people with learning disabilities Gathering feedback and measuring outcomes and change with Children and Young People with Learning Disabilities (LD)
19
Agreement between Maternal and Teacher SDQ Ratings We examined the association (Spearman’s r) between maternally completed and teacher completed SDQ scores at ages 7 and 11. Additional analyses indicated no systematic relationship between severity of learning disability and levels of mother-teacher agreement.
Table 6: Association (Spearman’s r) between Maternally Completed and Teacher Completed SDQ Scale Scores for Children with and without Learning Disabilities Children with
learning disabilities
Children without learning disabilities
Statistical significance of difference between correlation coefficients
Age 7 Total problems 0.422 0.407 z=0.26, n.s.
Conduct difficulties 0.432 0.280 z=2.51, p<0.05 Emotional difficulties 0.210 0.222 z=0.18, n.s.
Hyperactivity 0.327 0.449 z=2.07, p<0.05 Peer Problems 0.412 0.241 z=1.76, n.s.
Pro-social behaviour 0.122 0.236 z=1.69, n.s. Age 11
Total problems 0.433 0.463 z=0.58, n.s. Conduct difficulties 0.352 0.330 z=039., n.s.
Emotional difficulties 0.195 0.306 z=1.85, n.s. Hyperactivity 0.438 0.459 z=0.41, n.s.
Peer Problems 0.310 0.357 z=0.82, n.s. Pro-social behaviour 0.131 0.261 z=2.11, p<0.05.
Conclusion Consistent with the results of previous research, the association between maternal report and teacher report of emotional and behavioural difficulties were weak to modest.47 There were no systematic differences in the strength of these associations between children with and without learning disabilities.

Report: Use of the Strengths and Difficulties Questionnaire for monitoring the wellbeing of children and young people with learning disabilities Gathering feedback and measuring outcomes and change with Children and Young People with Learning Disabilities (LD)
20
Agreement between Maternal SDQ Ratings and Child Self-Report We examined the association (Spearman’s r) between maternally completed SDQ scores on the Emotional Difficulties subscale with child self-report of emotional difficulties at ages 11 and 14. Given that the group of children with learning disabilities had a greater proportion of boys, we undertook additional analyses stratified by gender. Additional analyses indicated no systematic relationship between severity of learning disability and levels of mother-child agreement.
Table 7: Association (Spearman’s r) between SDQ Emotional Difficulties Scale Scores and Child Self-Report of Emotional Difficulties for Children with and without Learning Disabilities Children with
learning disabilities
Children without learning disabilities
Statistical significance of difference between correlation coefficients
Age 11 Overall 0.043 0.223 z=3.45, p<0.001
Girls 0.213 -0.071 z=3.35, p<0.001 Boys 0.123 0.236 z=1.71, n.s.
Age 14 Overall 0.066 0.249 z=2.86 p<0.01
Girls 0.016 0.261 z=2.45, p<0.05 Boys 0.214 0.174 z=-0.52, n.s.
Conclusion Consistent with the results of previous research, the association between maternal report and child self-report of emotional difficulties was weak.48 Overall, the association was stronger for children without learning disabilities. However, this difference was only apparent for girls. For boys there was no statistically significant difference between the strength of maternal report and child self-report.

Report: Use of the Strengths and Difficulties Questionnaire for monitoring the wellbeing of children and young people with learning disabilities Gathering feedback and measuring outcomes and change with Children and Young People with Learning Disabilities (LD)
21
DISCUSSION
It has been suggested that the pattern of emotional and behavioural difficulties may be different among children and young people with learning disabilities when compared to their peers. Therefore, it has been argued that scales developed for the general population may not be applicable to children and young people with learning disabilities, especially those with more severe learning disabilities.1
The aim of this report was to present new data, extracted from the UK’s Millennium Cohort Study, on the face validity, factorial structure and reliability of the SDQ when used with children with learning disabilities.
Face Validity There is relatively robust evidence that: (1) a wide range of emotional and behavioural difficulties are more common among children with learning disabilities when compared with their peers;46, 49, 50 and (2) that these difficulties are associated with increased family burden.51 The analyses of SDQ data presented in this report (including subscale scores and result of the impact supplement) are fully consistent with this existing literature.
Factorial Structure and Reliability • The analyses undertaken do suggest that the factorial structure of the SDQ may be less stable for
children with learning disabilities. However, this may also simply reflect the much smaller sample sizes available for children with learning disabilities.
• There were no systematic differences in the internal consistency of the SDQ scales between children with and without learning disabilities.
• Consistent with the results of previous research, the association between maternal report and teacher report of emotional and behavioural difficulties were weak to modest.47 There were no systematic differences in the strength of these associations between children with and without learning disabilities.
• Consistent with the results of previous research, the association between maternal report and child self-report of emotional and behavioural difficulties was weak.48 Overall, the association was stronger for children without learning disabilities. However, this difference was only apparent for girls.
• Among children with learning disabilities there was very little evidence that key psychometric characteristics of the SDQ vary by severity of learning disability in the sample.

Report: Use of the Strengths and Difficulties Questionnaire for monitoring the wellbeing of children and young people with learning disabilities Gathering feedback and measuring outcomes and change with Children and Young People with Learning Disabilities (LD)
22
Strengths and Limitations The main strength of the analyses presented in this report is that they are based on a large sample of children with and without learning disabilities which is representative of children who are currently growing up in the UK.
The two main limitations of these analyses are:
1. The sample contains too few children with severe or profound levels of learning disability to allow disaggregation of data by commonly recognised categories of severity;
2. The classification system used is based on evidence of impaired cognitive functioning, an approach which is consistent with the ICD-10 definition of ‘mental retardation’.35 However, the ICD-11 definition of ‘disorders of intellectual development’ also contains criteria based on adaptive behaviour or functioning.36 As such the classification system used in this report may be overinclusive when compared against ICD-11 criteria.
Conclusion We found little evidence to support the contention that the parent completed SDQ may not be applicable to children and young people with learning disabilities, including those with more severe disabilities in the sample.

Report: Use of the Strengths and Difficulties Questionnaire for monitoring the wellbeing of children and young people with learning disabilities Gathering feedback and measuring outcomes and change with Children and Young People with Learning Disabilities (LD)
23
REFERENCES
1 Law D, Wolpert M. Guide to Using Outcomes and Feedback Tools with Children, Young People and Families. 2nd Edition. London: CAMHS Press; 2014.
2 Vostanis P. Strengths and difficulties questionnaire: research and clinical applications. Current Opinion in Psychiatry 2006;19:367–372.
3 Rice LJ, Emerson E, Gray KM, et al. Concurrence of the strengths and difficulties questionnaire and developmental behaviour checklist among children with an intellectual disability. Journal of Intellectual Disability Research 2018;62:150-155.
4 Murray CA, Hastings RP, Totsika V. Clinical utility of the parent-reported Strengths and Difficulties Questionnaire as a screen for emotional and behavioural difficulties in children and adolescents with intellectual disability. British Journal of Psychiatry 2020 online.
5 Mulligan B, John M, Coombes R, Singh R. Developing outcome measures for a Family Intensive Support Service for Children presenting with challenging behaviours. British Journal of Learning Disabilities 2015;43:161–167.
6 Emerson E. Use of the strengths and difficulties questionnaire to assess the mental health needs of children and adolescents with intellectual disabilities. Journal of Intellectual & Developmental Disability 2005.
7 Beck A, Daley D, Hastings RP, Stevenson J. Mothers’ expressed emotion towards children with and without intellectual disabilities. Journal of Intellectual Disability Research 2004;48:628–638.
8 Kaptein S, Jansen DEMC, Vogels AGC, Reijneveld SA. Mental health problems in children with intellectual disability: use of the Strengths and Difficulties Questionnaire. . Journal of Intellectual Disability Research 2008;52: 125–131.
9 Department of Health. Valuing People: A New Strategy for Learning Disability for the 21st Century. 2001.
10 Ipsos MORI. Millennium Cohort Study Sixth Sweep (MCS6): Technical Report. London: Ipsos Mori Social Research Institute, 2016.
11 Mostafa T, Ploubidis G. Millennium Cohort Study Sixth Survey 2015-2016: Technical report on response (Age 14). London: Centre for Longitudinal Studies; 2017.
12 Fitzsimons EE. Millennium Cohort Study Sixth Survey 2015-2016: User Guide (First Edition). London: Centre for Longitudinal Studies; 2017.
13 Plewis I. The Millennium Cohort Study: Technical Report on Sampling 4th Edition. London: Centre For Longitudinal Studies; 2007.
14 Jones E, Schoon I. Child cognition and behaviour. In: Hansen K, Joshi H, editors. Millennium Cohort Study Third Survey: A user’s guide to initial findings. London: Centre for Longitudinal Studies, Institute of Education, University of London, 2008:118-144.

Report: Use of the Strengths and Difficulties Questionnaire for monitoring the wellbeing of children and young people with learning disabilities Gathering feedback and measuring outcomes and change with Children and Young People with Learning Disabilities (LD)
24
15 Parsons S. Childhood cognition in the 1970 British Cohort Study London: Centre for Longitudinal Studies, UCL, 2014.
16 Schoon I, Sacker A, Hope S, Collishaw S, Maughan B. Children's development in the family environment. In: Dex S, Joshi H, editors. Children of the 21st Century: From birth to nine months. Bristol: Policy Press, 2005:159-174.
17 Totsika V, Hastings RP, Vagenas D, Emerson E. Parenting and the behaviour problems of young children with an intellectual disability: Concurrent and longitudinal relationships in a population-based study. American Journal of Intellectual and Developmental Disabilities 2014;119:422-435.
18 Totsika V, Hastings RP, Emerson E, Berridge D, Lancaster GA. Prosocial skills in young children with autism, and their mothers’ psychological well-being: longitudinal relationships. Research in Autism Spectrum Disorders 2015;13-14:25-31.
19 Totsika V, Hastings RP, Emerson E, Berridge DM, Lancaster GA. Behavior problems at five years of age and maternal mental health in autism and intellectual disability. Journal of Abnormal Child Psychology 2011;39:1137-1147.
20 Totsika V, Hastings RP, Emerson E, Berridge DM, Lancaster GA, Vagenas D. Is there a bidirectional relationship between maternal well-being and child problem behaviors? Longitudinal evidence in autism spectrum disorders. Autism Research 2013;6:201-211.
21 Totsika V, Hastings RP, Emerson E, Hatton C. Early years parenting mediates early adversity effects on problem behaviors in intellectual disability. Child Development 2019 online:DOI: 10.1111/cdev.13273.
22 Totsika V, Hastings RP, Emerson E, Lancaster GA, Berridge DM. A population-based investigation of behavioural and emotional problems and maternal mental health: Associations with autism spectrum disorder and intellectual disability. Journal of Child Psychology & Psychiatry and Allied Disciplines 2011;52:91-99.
23 Emerson E, Blacher J, Einfeld S, Hatton C, Robertson J, Stancliffe R. Environmental risk factors associated with the persistence of conduct difficulties in children with and without intellectual disabilities or autistic spectrum disorders Research in Developmental Disabilities 2014;35:3508-3517.
24 Emerson E, Einfeld S. Emotional and behavioural difficulties in young children with and without developmental delay: A bi-national perspective. Journal of Child Psychology and Psychiatry 2010;51:583-593.
25 Emerson E, Hatton C, Baines S, Robertson J. Exposure to second hand tobacco smoke and smoking at age 11 among British children with and without intellectual disability. Journal of Intellectual Disability Research 2016;60:274–281.
26 Emerson E, Hatton C, Baines S, Robertson J. The association between employment status and health among British adults with and without intellectual impairments: Cross-sectional analyses of a cohort study. BMC Public Health 2018;18:401
27 Emerson E, Robertson J, Baines S, Hatton C. Obesity in British children with and without intellectual disability: Cohort study. BMC Public Health 2016;16:644 DOI 610.1186/s12889-12016-13309-12881.
Report: Use of the Strengths and Difficulties Questionnaire for monitoring the wellbeing of children and young people with learning disabilities Gathering feedback and measuring outcomes and change with Children and Young People with Learning Disabilities (LD)
25
28 Emerson E, Robertson J, Baines S, Hatton C. Predictors of self-reported alcohol use and attitudes toward alcohol among 11 year old British children with and without intellectual disability. Journal of Intellectual Disability Research 2016;60:1212-1226.
29 Emerson E, Robertson J, Hatton C, Baines S. Risk of exposure to air pollution among British children with and without intellectual disabilities. Journal of Intellectual Disability Research 2019;63:161-167.
30 Emerson E, Robertson J, Baines S, Hatton C. Vaccine coverage among children with and without intellectual disabilities in the UK: Cross sectional study. BMC Public Health 2019;19:748.
31 Bailey T, Totsika V, Hastings R, Hatton C, Emerson E. Developmental trajectories of behaviour problems and prosocial behaviours of children with intellectual disabilities in a population-based cohort. Journal of Child Psychology and Psychiatry 2019 online https://doi.org/10.1111/jcpp.13080
32 Bracken BA. Bracken School Readiness Assessment. London: Harcourt Assessment, 2002.
33 Elliott C, Smith P, McCulloch K. British Ability Scales: Second Edition. London: nferNelson, 1997.
34 Hansen K. Millennium Cohort Study: First, Second, Third and Fourth Surveys. A Guide to the Datasets. Seventh Edition. London: Centre for Longitudinal Studies, Institute of Education, University of London, 2012.
35 World Health Organization. ICD-10 Guide for Mental Retardation. Geneva: World Health Organization; 1996.
36 Tassé MJ, Balboni G, Navas P, et al. Developing behavioural indicators for intellectual functioning and adaptive behaviour for ICD-11 disorders ofintellectual development. Journal of Intellectual Disabilities Research 2019;63:386-407.
37 Goodman R. The Strengths and Difficulties Questionnaire: a research note. Journal of Child Psychology and Psychiatry, and Allied Disciplines 1997;38:581-586.
38 Goodman R. The extended version of the Strengths and Difficulties Questionnaire as a guide to child psychiatric caseness and consequent burden. Journal of Child Psychology and Psychiatry 1999;40:791-801.
39 Goodman R. Psychometric properties of the Strengths and Difficulties Questionnaire (SDQ). Journal of the American Academy of Child and Adolescent Psychiatry 2001;40:1337-1345.
40 Goodman R, Ford T, Simmons H, Gatward R, Meltzer H. Using the Strengths and Difficulties Questionnaire (SDQ) to screen for child psychiatric disorders in a community sample. British Journal of Psychiatry 2000;177:534-539.
41 Goodman R, Scott S. Comparing the Strengths and Difficulties Questionnaire and the Child Behaviour Checklist: Is small beautiful? . Journal of Abnormal Child Psychology, Crime and Law 1999;27:17-24.
42 Meltzer H, Gatward R, Goodman R, Ford T. Mental Health of Children and Adolescents in Great Britain. London: The Stationery Office, 2000.
43 Green H, McGinnity A, Meltzer H, Ford T, Goodman R. Mental Health of Children and Young People in Britain, 2004. Basingstoke: Palgrave MacMillan, 2005.

Report: Use of the Strengths and Difficulties Questionnaire for monitoring the wellbeing of children and young people with learning disabilities Gathering feedback and measuring outcomes and change with Children and Young People with Learning Disabilities (LD)
26
44 Angold A, Costello EJ, Messer SC, Pickles A, Winder F, Silver D. Development of a short questionnaire for use in epidemiological studies of depression in children and adolescents. International Journal of Methods in Psychiatric Research 1995;5:237-249.
45 Thapar A, McGuffin P. Validity of the shortened Mood and Feelings Questionnaire in a community sample of children and adolescents: A preliminary research note. Psychiatry Research 1998;81:259-268.
46 Einfeld S, Ellis L, Emerson E. Comorbidity of intellectual disability and mental disorder: A systematic review. Journal of Intellectual & Developmental Disability 2011;36:137-143.
47 Cheng S, Keyes KM, Bitfoi A, et al. Understanding parent–teacher agreement of the Strengths and Difficulties Questionnaire (SDQ): Comparison across seven European countries. International Journal of Methods in Psychiatric Research 2018;27:e1589.
48 De Los Reyes A, Augenstein TM, Wang M, et al. The Validity of the Multi-Informant Approach to Assessing Child and Adolescent Mental Health. Psychological Bulletin 2015;141:858–900.
49 Emerson E, Hatton C. The Mental Health of Children and Adolescents with Learning Disabilities in Britain. London: Foundation for People with Learning Disabilities; 2007.
50 Hughes-McCormack LA, Rydzewska E, Henderson A, MacIntyre C, Rintoul J, Cooper S-A. Prevalence of mental health conditions and relationship with general health in a wholecountry population of people with intellectual disabilities compared with the general population. BJPsych Open 2017;3:243-248.
51 Families Special Interest Research Group of IASSIDD. Families Supporting a Child with Intellectual or Developmental Disabilities: The Current State of Knowledge. Journal of Applied Research in Intellectual Disabilities 2014;27:420-430.