Embed Size (px)
Citation preview
Improving Energy Efficiency and Promoting Renewable Energy in the Agro-Food and Other Small and Medium Enterprises (SMEs) in Ukraine
Project GF/UKR/11/004
REPORT
Energy Efficiency Benchmarking in the Beverages Subsector of the Ukraine’s Agro-Industrial Sector
Drafted by: A. Chernyavskyy
Kyiv 2012

This page internally left blank
2

TABLE OF CONTENTS TABLE OF CONTENTS ................................................................................................................3 SUMMARY .....................................................................................................................................4 INTRODUCTION............................................................................................................................5 POTENTIAL ROLE OF BENCHMARKING IN IMPROVING ENERGY EFFICIENCY OF AGRO-FOOD ENTERPRISES .......................................................................................................7 BRIEF DESCRIPTION OF THE INDUSTRY AND ITS SPECIFIC FEATURES IN TERMS OF ENERGY SAVING .......................................................................................................................11 ANALYSIS FINDINGS ..................................................................................................................17 CONCLUSIONS ..........................................................................................................................22 SOURCES .....................................................................................................................................24
3

SUMMARY
This report is prepared in the scope of implementation of GEF/UNIDO Improving Energy Efficiency and Promoting Renewable Energy in the Agro-Food and Other Small and Medium Enterprises (SMEs) in Ukraine Project.
The main task of this analysis is to identify energy efficiency in the food
industry, specifically, in the production of flour and bakery with the use of benchmarking. The approaches, methods and findings of this analysis will be further disseminated among all the stakeholders.
The report presents the findings of energy efficiency benchmarking in the
flour and bakery productions via comparing their specific indicators of energy consumption per unit of output. These indicators are compared both among themselves and against those at the best enterprises of the relevant profile.
We hope that this report would popularize benchmarking and provide an
impetus to its applications at food industry enterprises in Ukraine
4
INTRODUCTION The growing competition encourages domestic enterprises to seek new ways
and methods to raise management efficiency, ensure stable competitiveness based on identifying and launching of innovations. The pressure of energy costs has become so high that threatens not only competitiveness of the enterprises but rather their existence.
One of these effective tools that provides an enterprise with the possibility to steadily build up productivity, improve performance, be energy efficient is benchmarking.
Benchmarking is the process of analysis and comparative assessment of the methods used in an organization to carry out its functions. This assessment may be conducted either inside an enterprise or organization (comparison of individual structural units or links) or by comparing an enterprise performance results with those of other enterprises. Based on the comparison findings, the enterprise may identify weaknesses in its production processes, find new effective ideas and select the best ways to improve based on the other companies’ lessons learned.
Benchmarking stipulates ongoing analysis and assessment of the existing methods of production used at an enterprise through comparing it with the best internal and external practices with further launching of the most effective approaches.
Benchmarking is a very common practice in the world. The main idea underlying benchmarking emerged at the beginning of ХХ century. The most striking example was Henry Ford’s visit to the slaughterhouse in Chicago. The carcasses hung on the hooks and the conveyor moved them from one worker to another with each worker doing his portion of processing. This manufacturing method inspired Mr.Ford and he launched it in the form of automobile conveyor.
The term “benchmarking” was introduced by Xerox in 1979 and within the fifteen years benchmarking spread all over the world at an incredible speed with its applications being available almost in all spheres of manufacturing and service provision. This analysis may be applied to any enterprise or organization operations, starting with performance of first aid stations and fire-fighting crews and ending with the strategic benchmarking at Coca-Cola, Sony, Kraft, etc. The enterprises establish benchmarking associations to perform unbiased analysis, where the main goal is its absolute confidentiality. So, enterprises may share the best practices while not disclosing their business secrets.
They are the following associations inter alia: The Association for Benchmarking Health Care ISO Benchmarking Association Electric Utility Benchmarking Association Knowledge Management Benchmarking Association Technology Assessment Benchmarking Association and many others.
5

Unfortunately, the threat of hostile takeover induces enterprises to protect all their information related to energy consumption and product output, therefore benchmarking applications are very limited in Ukraine.
6
POTENTIAL ROLE OF BENCHMARKING IN IMPROVING ENERGY EFFICIENCY OF AGRO-FOOD ENTERPRISES
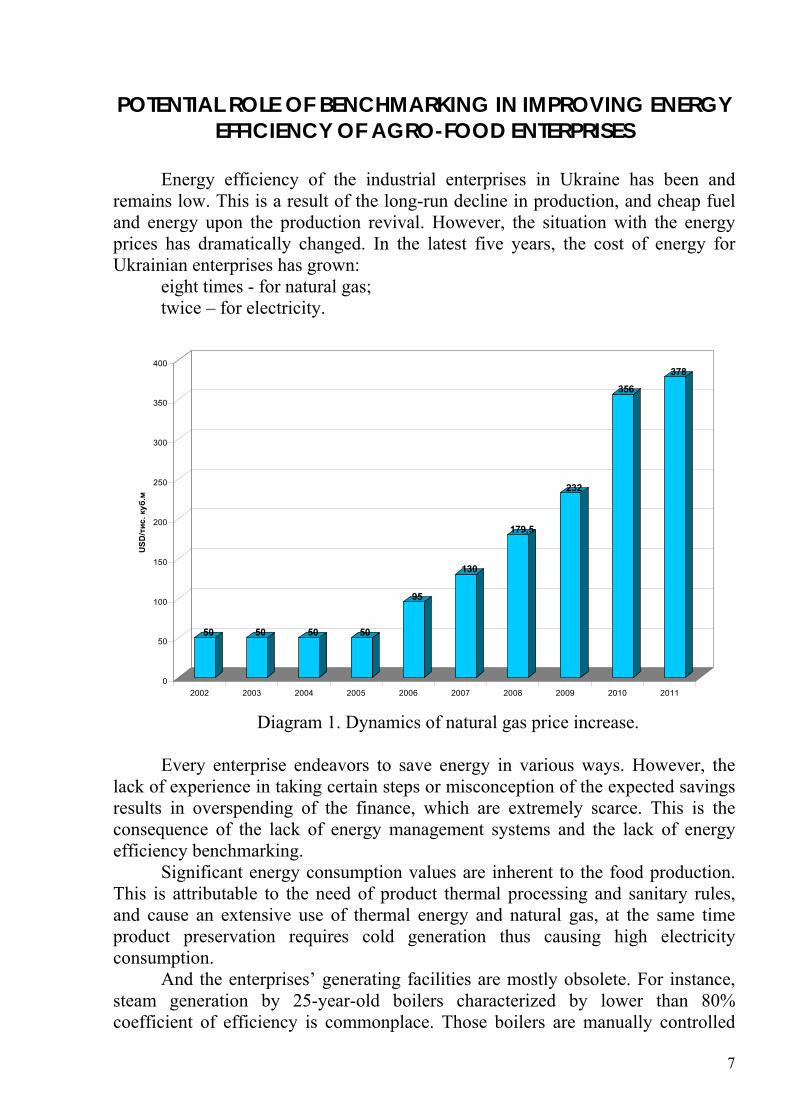
Energy efficiency of the industrial enterprises in Ukraine has been and
remains low. This is a result of the long-run decline in production, and cheap fuel and energy upon the production revival. However, the situation with the energy prices has dramatically changed. In the latest five years, the cost of energy for Ukrainian enterprises has grown:
eight times - for natural gas; twice – for electricity.
50 50 50 50
95
130
179,5
232
356
378
0
50
100
150
200
250
300
350
400
US
D/тис
. куб
.м
2002 2003 2004 2005 2006 2007 2008 2009 2010 2011
Diagram 1. Dynamics of natural gas price increase.
Every enterprise endeavors to save energy in various ways. However, the
lack of experience in taking certain steps or misconception of the expected savings results in overspending of the finance, which are extremely scarce. This is the consequence of the lack of energy management systems and the lack of energy efficiency benchmarking.
Significant energy consumption values are inherent to the food production. This is attributable to the need of product thermal processing and sanitary rules, and cause an extensive use of thermal energy and natural gas, at the same time product preservation requires cold generation thus causing high electricity consumption.
And the enterprises’ generating facilities are mostly obsolete. For instance, steam generation by 25-year-old boilers characterized by lower than 80% coefficient of efficiency is commonplace. Those boilers are manually controlled
7

and the only measurement device is a steam pressure manometer and it is used to control the boiler accordingly. As concern cold generation, compressor refrigerating systems not always correspond to compressor performance capability, as the summer air temperatures have grown and the refrigerating systems are worn out. This causes overconsumption of electricity, as the compressors work in the inefficient mode.
0,00
20,00
40,00
60,00
80,00
100,00
120,00
січень 2
008
березень
200
8
травень 2
008
липень
200
8
вересень
200
8
листопад
200
8
січень 2
009
березень
200
9
травень 2
009
липень
200
9
вересень
200
9
листопад
200
9
січень 2
010
березень
201
0
травень 2
010
липень
201
0
вересень
201
0
листопад
201
0
січень 2
011
березень
201
1
травень 2
011
липень
201
1
вересень
201
1
листопад
201
1
січень 2
012
березень
201
2
коп
./кВ
т.год
з ПДВ
Diagram 2. Dynamics of electricity price increase
Energy efficiency benchmarking provides the opportunity to find out how
effectively an enterprise uses energy resources as compared to its competitors and the best similar enterprises in the sector. It helps to identify the spots where energy is excessively consumed. For instance, what stage energy is wasted at: at generation, transportation or when consumed for product manufacturing?
However it is not essential to use only competitive or sectoral benchmarking. This method is flexible and provides the capability to compare enterprises from different sectors, although not in full, but by individual processes, workshops or sectors. For example, the following issues may be analyzed:
- How much more energy do we consume for heating office premises than others? Why? What is the least cost solution to this problem?
- Why do we consume more fuel than other enterprises to generate steam? What is the best solution to reduce this indicator value?
- What potential percentage reduction in electricity bills may we achieve through application of the three-zonal tariff? Why do some enterprises manage to reach higher savings than others?
8

- What secondary sources of thermal energy do other enterprises use for hot water supply?
They are only several issues that benchmarking may help to address,
however, an economic effect upon receipt of benchmarking findings and launch of the best practices offers an enterprise significant energy saving opportunities.
Energy Efficiency Benchmarking Methodology Energy efficiency benchmarking is based on comparing of energy spending
indicators in actual values per unit of output. A model benchmarking curve reflects enterprise efficiency as a function of
total product output at similar enterprises or as a function of total number of enterprises operating at this energy efficiency level or lower.
The most ineffective enterprises are portrayed in the left lower part of the curve with the most effective ones being represented in its upper right part. Benchmarking curve shapes will differ for various industries and regions. However, as a rule, several enterprises are most efficient while several enterprises are very inefficient. This situation is expressed in the form of steep region of the curve in the first and the last deciles, respectively. Between these two polar groups, the curve is usually depicted in the form of broad linear dependence between energy efficiency and cumulative output (number of enterprises). This relation could be used for approximate assessment of energy saving potential, which is defined as 50% of the difference between efficiency in the first and the last deciles.
The most efficient enterprise within the benchmark curve is taken to identify the Best Practicable Technology (BPT). Physical product output should be used, where possible, to identify an enterprise location by deciles. Where the data is lacking or unreliable, this approach may not be applied and deciles are formed on the basis of the number of enterprises.
Two other types of analysis could be applied to contribute to the enterprise-related data. They are based on average Specific Energy Consumption (SEC) per unit of output for the sector, region or country (I type) and Energy Efficiency Index (EEI) developed by Phylipsen et al. (2002) and Neelis et al. (2007) in the Netherlands (II type).
SEC analysis employs an average current SEC value at the national or regional level depending on data availability. Where no input data is available for this kind of analysis, statistics provide only the basis for evaluation of the energy efficiency. Statics enables analysis of the information on the use of energy resources at industry-specific (sector-specific) level including all production processes in a certain sector.
Country’s EEI assessment j for sector x with production processes i is accomplished according to the following equation:
9
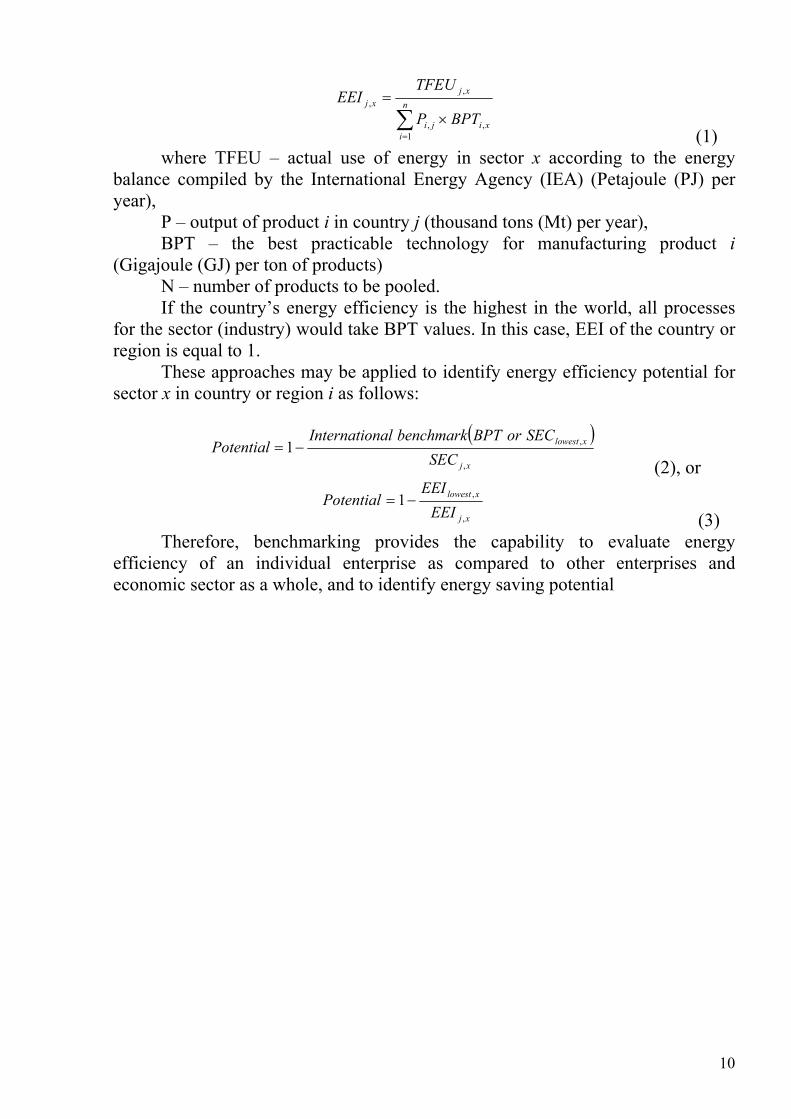
xi
n
iji
xjxj
BPTP
TFEUEEI
,1
,
,,
(1)
where TFEU – actual use of energy in sector х according to the energy balance compiled by the International Energy Agency (IЕА) (Petajoule (PJ) per year),
Р – output of product i in country j (thousand tons (Mt) per year), BPT – the best practicable technology for manufacturing product і
(Gigajoule (GJ) per ton of products) N – number of products to be pooled. If the country’s energy efficiency is the highest in the world, all processes
for the sector (industry) would take BPT values. In this case, EEI of the country or region is equal to 1.
These approaches may be applied to identify energy efficiency potential for sector х in country or region і as follows:
xj
xlowest
SEC
SECorBPTbenchmarknalInternatioPotential
,
,1 (2), or
xj
xlowest
EEI
EEIPotential
,
,1 (3)
Therefore, benchmarking provides the capability to evaluate energy efficiency of an individual enterprise as compared to other enterprises and economic sector as a whole, and to identify energy saving potential
10

BRIEF DESCRIPTION OF THE INDUSTRY AND ITS SPECIFIC FEATURES IN TERMS OF ENERGY SAVING
Soft drinks in large assortment are produced at specialized enterprises as well as at soft drinks production units of breweries. Drinking water, tale mineral water, natural fruit and vegetable juices, nectars, juice containing drinks, tea, coffee, milk, sour milk drinks, fermentation quasses, drinks containing herbs infusions and extracts, special-purpose drinks and others are considered to be soft drinks.
There is no common global understanding of what drinks should be considered soft drinks. Each country approaches this issue in its own way. For example in Great Britain soft drinks are sweet carbonated and still drinks, bottled water, juices and instant drinks.
In Ukraine things seem to be different. According to the National Classification System of products and services of State Standard of Ukraine the following drinks are referred to as soft drinks (drinks with alcohol strength not more then 0,5% ):
mineral waters (natural or artificial), sweet or flavored; refreshment soft drinks like lemonade, orange, cola etc., produced
with drinking water sweet or regular, flavored with juice or essence, with colorants;
soft drinks of special purpose (diet, diabetic, tonic, for sportsmen etc); quass; drinks produced with milk and cocoa, tea and other ready-prepared
drinks. Fruit and vegetable juices, water-soluble drinks and minerals waters are not
qualified as non-alcoholic beverages in Ukraine. Contemporary beverage production uses semi-products with high degree of
fabrication. Innovations in beverages production in Ukraine are concentrated in several clusters:
Innovations in production of soft drinks in Ukraine are concentrated in several spheres: development of drinks and concentrates for their production based on natural materials with the use of juice, plant extracts, honey, after-products of cheese-making and milk production, quass wort concentrates, creation of concentrated and functional drinks, development of products range and raw material base of quass fermentation.
Carbonated soft drinks. The central player at the Ukrainian market of carbonated soft drinks is Cocа-Cola Beverages Ukraine Ltd. According to the market operators this company continues controlling the largest share of Ukrainian carbonated soft drinks market – more than 17%. All main trademarks of Coca-Cola are of a premium category, from which three leading brands of the company (Coca-Cola, Fanta, Sprite) are among top five brands in terms of popularity of carbonated soft drinks.
11

The second place in the rating is held by PrJSC Obolon. According to the market operators the company control more than 15% of the domestic soft drins market.
The next key player is Akvaplast LLC (trademark - Fruits) from Dnipropetrovsk. This company control approximately 10% of the market.
Sandora LLC, which is the Ukrainian subsidiary of PepsiCo, has made a breakthrough at the Ukrainian market of carbonated water in 2010. According to the market operators this company has managed to win about 9% of Ukrainian soft drinks market.
Private Enterprise Malbi Agency (Dnipropetrovsk), which belong to Rainford trade and industrial group, is just a little behind PepsiCo. According to the market operators within the year of 2010 it controlled more than 7% of the market (in 2009 – 5.3%, and in 2008 - 4%).
PrJSC Erlan (Dnipropetrovsk) and PrJSC Orlan (deom Kyiv) control approximately 6% of Ukrainian market.
Private small enterprise Private Firm Panda frpm Vinnytsya (trademark - Karavan) possesses about 5% of domestic market.
"Slavutych" Company (Carlsberg Group) controls around 4% of Ukrainian soft-drinks market. The company holds 8th place in rating.
"Rosynka" plant controlled about 3 % of Ukrainian sort drinks market Chuguyivsky Factory of Mineral Waters private enterprise (trademark -
Sebek) secured about 1.5% of the local market of carbonated water. Mineral water. Ukraine is one of the global leaders in mineral water stocks.
Thus, in 2011 Ukrainian industry produced more than 130 million decalitres of mineral waters that included more than 28 million decalitres of still water. The Ukrainian mineral water market demonstrated the trend toward extension of competition, though sector leaders reserve their status. At present there are about 300 manufacturers of bottled water at the market. The top five producers are headed by IDS group (trademarks - Myrgorodska, Morshynska and Alaska). It is followed by Coca-Cola Beverages Ukraine (trademark - BonAqua), Obolon (trademark - Obolonska, Prozora), Rosynka (trademark - Sofiya Kyivska) and Erlan (trademark - Znamenivska). Despite the fact that this business sector is open for new players it is rather difficult to gain a significant market share.
The absolute main reason for increasing mineral water consumption is a natural factor (air temperature). The main factor is also the level of population welfare. As soon as the income level of population decreases, it leads to reduction of water production output and sales volumes.
Juices, juice containing drinks and nectars. Ukrainian market of juices, juice containing drinks and nectars is consolidated. Four largest producers – companies "Sandora" (ТМ "Sadora", "Sandoryk", "Sadochok", Mykolayivskyy juice factory), "Vitmark" (Jaffa, "Nash sik", "Juisik", "Sokovyta"), CocaCola (ТМ "Rich", "Dobryy", "BotaniQ") and "Erlan" (ТМ "Biola", "Soky lito") – hold more then 90% of the market.
Research companies provided different estimations capacity of juice, juice containing drinks and nectars for the previous year from 510 to 560 thousand tons.
12

According to the data of State Statistics Service of Ukraine the capacity of juice market was 592 thousand tons in 2011. The capacity of natural reconstituted juices (including orange) decreased as compared to 2010 by 5,6%, blended (mixes of different juices) - by 12,1%. The producers consider that the decrease was much more significant - 15-20%. Before crises the juice market of Ukraine ascended by 10-20% annually, getting to the record figures of 950 thousand tons in 2008.
Enterprises involved in production of soft drinks have the following
structure: filling shop and polyethylene bottles blowing department, syrup cooking and blending departments, sugar remelting department, mineral water treatment department, water treatment, warehouses for raw and other materials, finished products warehouse, boiler facility, air compressor and refrigerating units, household premises etc.
Heat supply of enterprises is secured mostly from their own industrial boiler houses equipped with steam boilers. In most cases such boilers are equipped with automated control systems and system for control of their technological operation process. Heat energy consumers include technological installations, heating facilities, tidal ventilation and public supply needs. Aggregated structure of heat balance is given in Table 1.
Table 1
Typical Heat Balance of the Enterprise
Item No. Balance Items
Share of Supply, %
1 Supply (total heat energy produced): 100.02 From third parties -3 From own sources 100.04 - by boilers 90.05 - by air-heating units 10.06 Consumption (total): 100.07 Heating and ventilation of production facility premises 24.0
8 Heating and ventilation of administrative premises and parking house 9.0
9 Technology 64.010 Household needs (hot water supply) 3.0
Composition of technological unit consumption of heat energy for
production of the main products types is given in Table 2.
13

Table 2
Composition of Technological Consumption of Heat Energy per Product Unit
Item No. Product Name Technological Norm Components Names
Glassware washing Syrup preparation Washing and disinfection of technological equipment and pipelines Pasteurization
1 Soft drinks
Food steam production Washing and disinfection of technological equipment and pipelines 2
Carbonated drinking water
Food steam production Washing and disinfection of technological equipment and pipelines Food steam production
3 Juice
Pasteurization Electricity supply is secured from energy system via step-down transforming
stations 35(10)/0.4 kW. The electricity accounting development level differs depending on the enterprise, beginning from simple availability of devices for commercial accounting of electricity consumption, up to presence of modern high-technology enterprises, at which almost all electricity consuming units have instrumental accounting. The main electricity consuming equipment includes:
compressors and refrigerating units; tidal and exhaust facilities, air conditioners; installations for preparation, sterilizing and packing of products; freight elevators; pump electric motors; repair and maintenance equipment (welding machines, turning and
drilling machines, electric tools); boiler facilities equipment (vents, smoke exhausts, pumps); lighting of production premises and territories; laboratory equipment; and computer hardware.
Aggregated structure of electricity balance is given in Table 3.
14
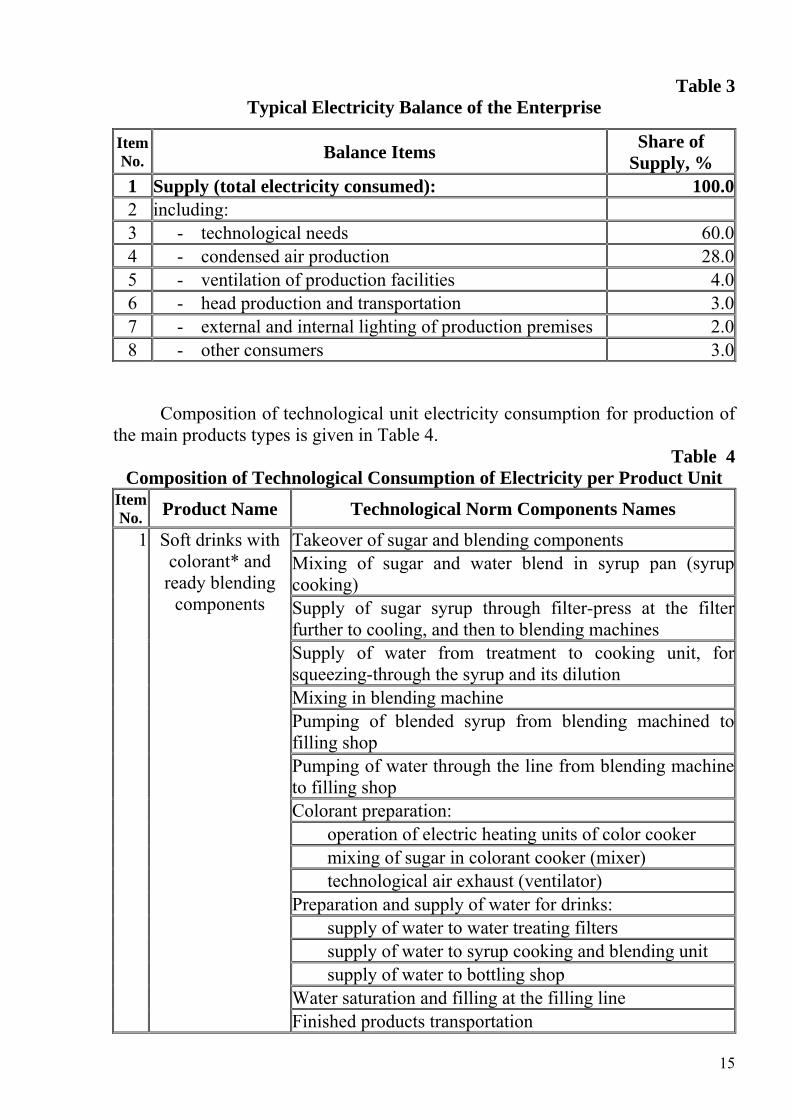
Table 3 Typical Electricity Balance of the Enterprise
Item No. Balance Items
Share of Supply, %
1 Supply (total electricity consumed): 100.02 including: 3 - technological needs 60.04 - condensed air production 28.05 - ventilation of production facilities 4.06 - head production and transportation 3.07 - external and internal lighting of production premises 2.08 - other consumers 3.0
Composition of technological unit electricity consumption for production of the main products types is given in Table 4.
Table 4 Composition of Technological Consumption of Electricity per Product Unit
Item No. Product Name Technological Norm Components Names
Takeover of sugar and blending components Mixing of sugar and water blend in syrup pan (syrup cooking) Supply of sugar syrup through filter-press at the filter further to cooling, and then to blending machines Supply of water from treatment to cooking unit, for squeezing-through the syrup and its dilution Mixing in blending machine Pumping of blended syrup from blending machined to filling shop Pumping of water through the line from blending machine to filling shop Colorant preparation:
operation of electric heating units of color cooker mixing of sugar in colorant cooker (mixer) technological air exhaust (ventilator)
Preparation and supply of water for drinks: supply of water to water treating filters supply of water to syrup cooking and blending unit supply of water to bottling shop
Water saturation and filling at the filling line
1 Soft drinks with colorant* and
ready blending components
Finished products transportation
15

Washing, disinfection, maintenance of technological equipment and pipes within the whole technological process (pumps for circulation, treatment and supply of disinfectant solutions; technological equipment to be operated while sanitation, etc.) Supply and preparation of water to filling Water saturation Water filling (bottling, polyethylene containers, water carriers, cans) Production of polyethylene containers, caps and covers Finished products transportation
2 Drinking, table (mineral) water
Washing, disinfection, maintenance of technological equipment and pipes within the whole technological process
*) Сoca-Cola, Sprite, Burn type drinks etc. Colorant - the product of thermal sugar decomposition; used for making drinks of yellow and brown color.
For drinks without colorant exclude those expenses related to colorant preparation.
16
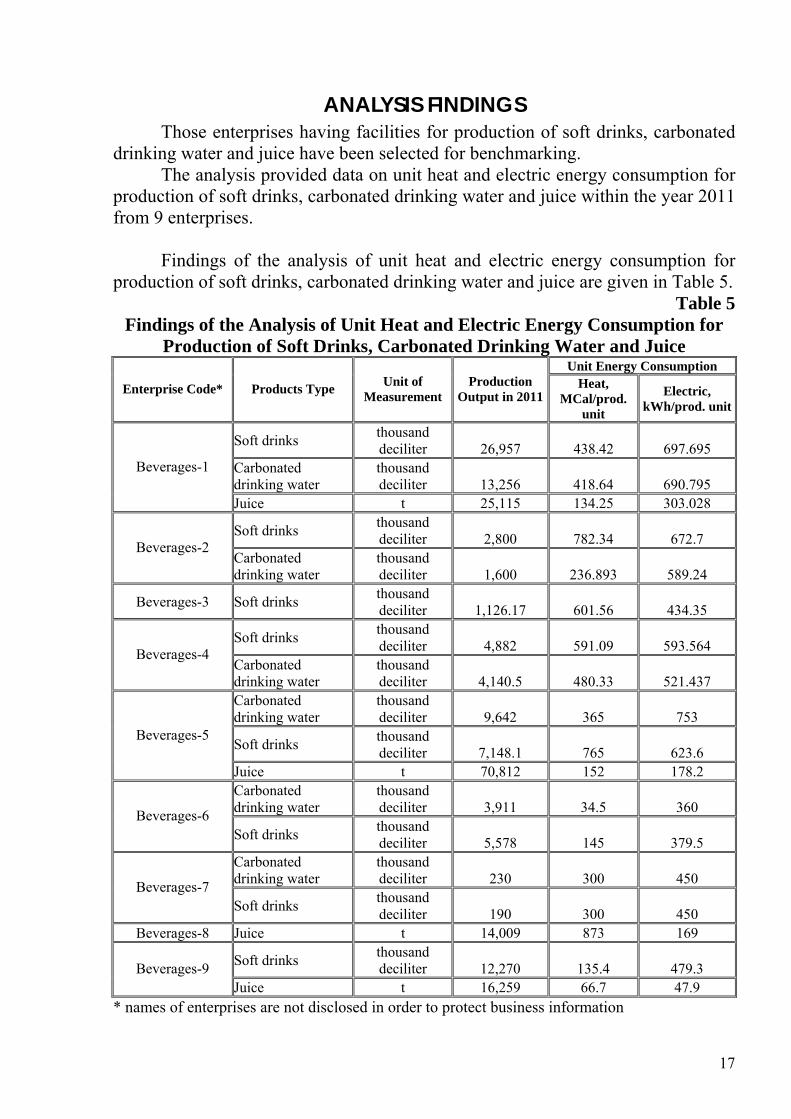
ANALYSIS FINDINGS Those enterprises having facilities for production of soft drinks, carbonated
drinking water and juice have been selected for benchmarking. The analysis provided data on unit heat and electric energy consumption for
production of soft drinks, carbonated drinking water and juice within the year 2011 from 9 enterprises.
Findings of the analysis of unit heat and electric energy consumption for
production of soft drinks, carbonated drinking water and juice are given in Table 5. Table 5
Findings of the Analysis of Unit Heat and Electric Energy Consumption for Production of Soft Drinks, Carbonated Drinking Water and Juice
Unit Energy Consumption
Enterprise Code* Products Type Unit of
Measurement Production
Output in 2011Heat,
MCal/prod. unit
Electric, kWh/prod. unit
Soft drinks thousand deciliter 26,957 438.42 697.695
Carbonated drinking water
thousand deciliter 13,256 418.64 690.795
Beverages-1
Juice t 25,115 134.25 303.028
Soft drinks thousand deciliter 2,800 782.34 672.7
Beverages-2 Carbonated drinking water
thousand deciliter 1,600 236.893 589.24
Beverages-3 Soft drinks thousand deciliter 1,126.17 601.56 434.35
Soft drinks thousand deciliter 4,882 591.09 593.564
Beverages-4 Carbonated drinking water
thousand deciliter 4,140.5 480.33 521.437
Carbonated drinking water
thousand deciliter 9,642 365 753
Soft drinks thousand deciliter 7,148.1 765 623.6
Beverages-5
Juice t 70,812 152 178.2 Carbonated drinking water
thousand deciliter 3,911 34.5 360
Beverages-6 Soft drinks
thousand deciliter 5,578 145 379.5
Carbonated drinking water
thousand deciliter 230 300 450
Beverages-7 Soft drinks
thousand deciliter 190 300 450
Beverages-8 Juice t 14,009 873 169
Soft drinks thousand deciliter 12,270 135.4 479.3 Beverages-9
Juice t 16,259 66.7 47.9 * names of enterprises are not disclosed in order to protect business information
17
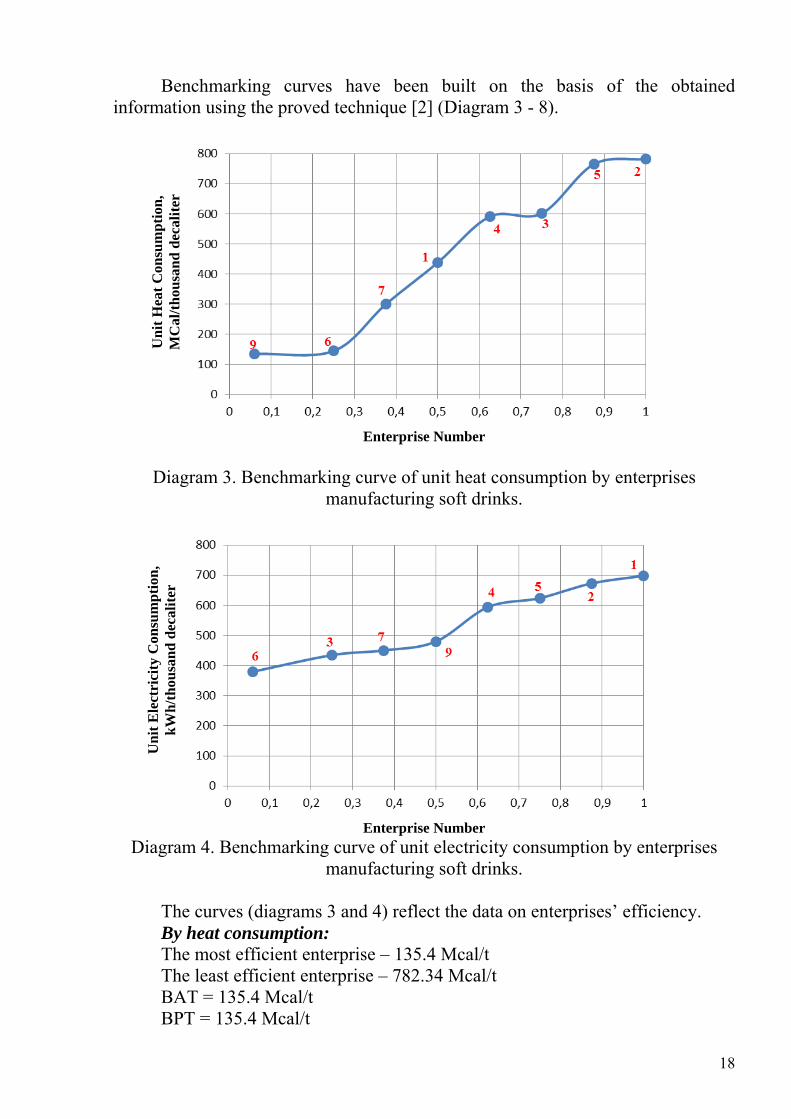
Benchmarking curves have been built on the basis of the obtained information using the proved technique [2] (Diagram 3 - 8).
Un
it H
eat
Con
sum
pti
on,
MC
al/t
hou
san
d d
ecal
iter
Enterprise Number
Diagram 3. Benchmarking curve of unit heat consumption by enterprises
manufacturing soft drinks.
Un
it E
lect
rici
ty C
onsu
mp
tion
, k
Wh
/th
ousa
nd
dec
alit
er
Enterprise Number
Diagram 4. Benchmarking curve of unit electricity consumption by enterprises manufacturing soft drinks.
The curves (diagrams 3 and 4) reflect the data on enterprises’ efficiency. By heat consumption: The most efficient enterprise – 135.4 Mcal/t The least efficient enterprise – 782.34 Mcal/t BAT = 135.4 Mcal/t BPT = 135.4 Mcal/t
18
By electricity consumption: The most efficient enterprise – 379.5 kWh/t The least efficient enterprise – 697.695 kWh/t BAT = 379.5 kWh/t BPT = 379.5 kWh/t
Un
it H
eat
Con
sum
pti
on,
MC
al/t
hou
san
d d
ecal
iter
Enterprise Number
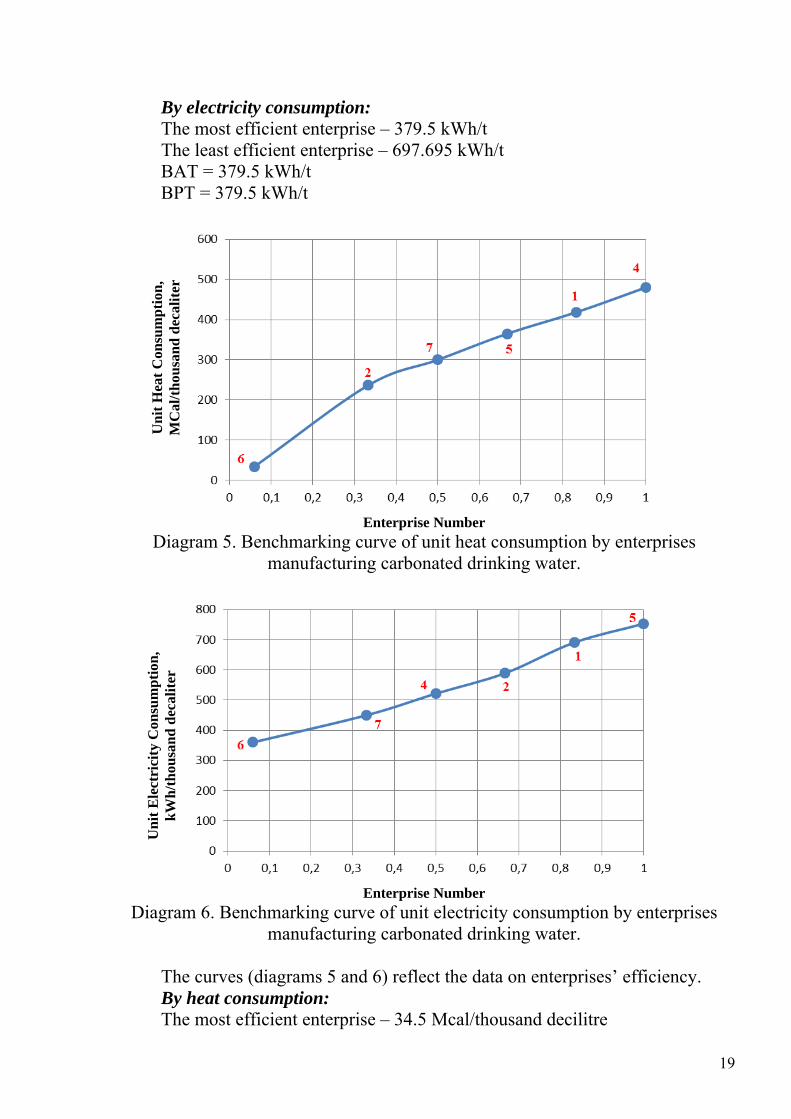
Diagram 5. Benchmarking curve of unit heat consumption by enterprises manufacturing carbonated drinking water.
Un
it E
lect
rici
ty C
onsu
mp
tion
, k
Wh
/th
ousa
nd
dec
alit
er
Enterprise Number
Diagram 6. Benchmarking curve of unit electricity consumption by enterprises manufacturing carbonated drinking water.
The curves (diagrams 5 and 6) reflect the data on enterprises’ efficiency. By heat consumption: The most efficient enterprise – 34.5 Mcal/thousand decilitre
19
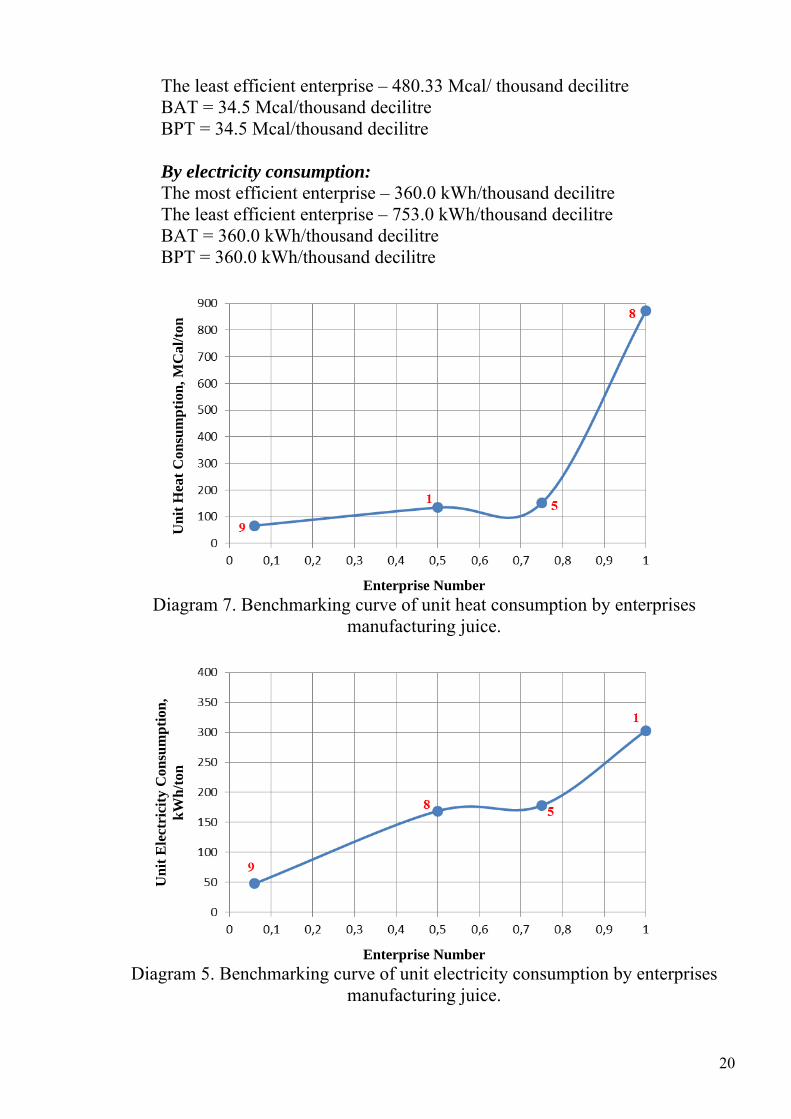
The least efficient enterprise – 480.33 Mcal/ thousand decilitre BAT = 34.5 Mcal/thousand decilitre BPT = 34.5 Mcal/thousand decilitre By electricity consumption: The most efficient enterprise – 360.0 kWh/thousand decilitre The least efficient enterprise – 753.0 kWh/thousand decilitre BAT = 360.0 kWh/thousand decilitre BPT = 360.0 kWh/thousand decilitre
Un
it H
eat
Con
sum
pti
on, M
Cal
/ton
Enterprise Number
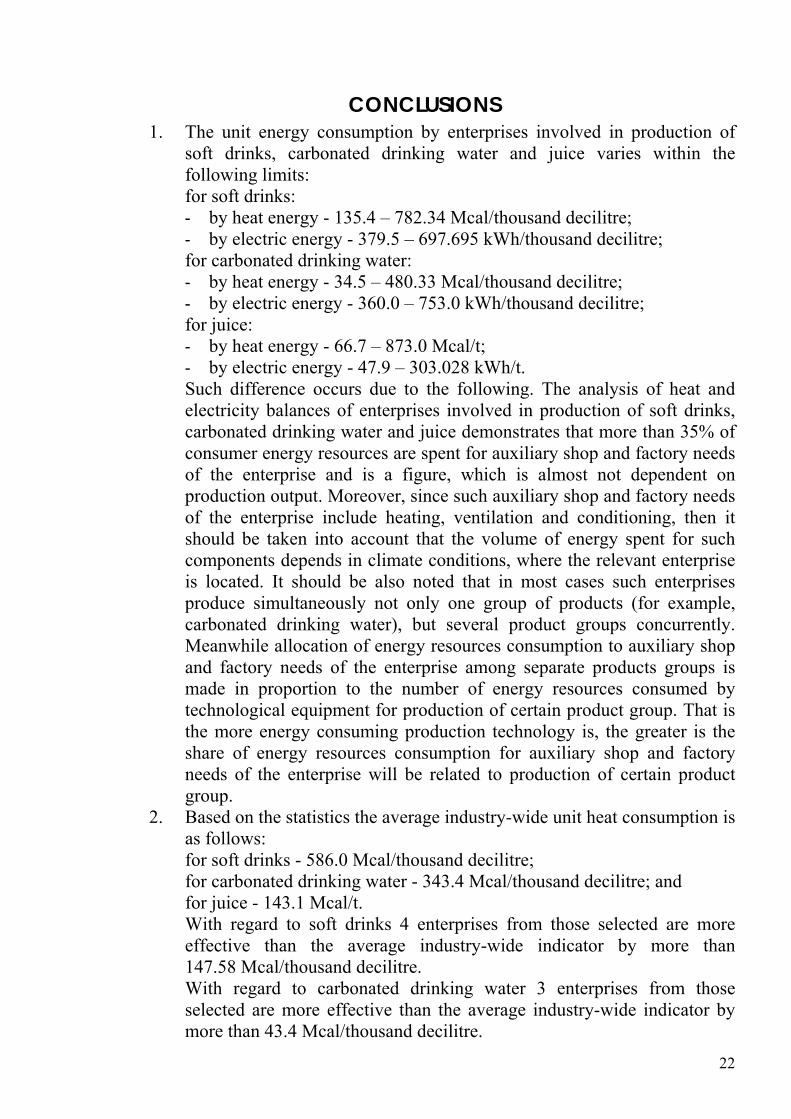
Diagram 7. Benchmarking curve of unit heat consumption by enterprises manufacturing juice.
Un
it E
lect
rici
ty C
onsu
mp
tion
, k
Wh
/ton
Enterprise Number
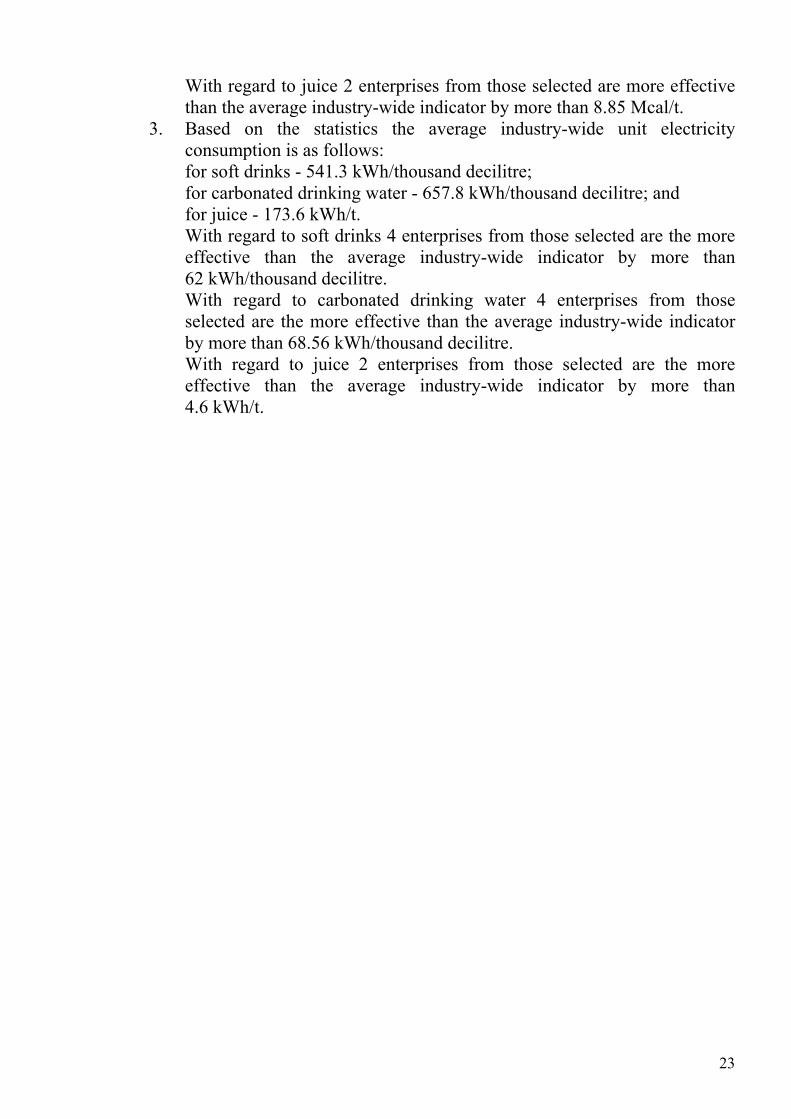
Diagram 5. Benchmarking curve of unit electricity consumption by enterprises manufacturing juice.
20

The curves (diagrams 7 and 8) reflect the data on enterprises’ efficiency. By heat consumption: The most efficient enterprise – 66.7 Mcal/t The least efficient enterprise – 873.0 Mcal/t BAT = 66.7 Mcal/t BPT = 66.7 Mcal/t By electricity consumption: The most efficient enterprise – 47.9 kWh/t The least efficient enterprise – 303.028 kWh/t BAT = 47.9 kWh/t BPT = 47.9 kWh/t
21
CONCLUSIONS 1. The unit energy consumption by enterprises involved in production of
soft drinks, carbonated drinking water and juice varies within the following limits: for soft drinks: - by heat energy - 135.4 – 782.34 Mcal/thousand decilitre; - by electric energy - 379.5 – 697.695 kWh/thousand decilitre; for carbonated drinking water: - by heat energy - 34.5 – 480.33 Mcal/thousand decilitre; - by electric energy - 360.0 – 753.0 kWh/thousand decilitre; for juice: - by heat energy - 66.7 – 873.0 Mcal/t; - by electric energy - 47.9 – 303.028 kWh/t. Such difference occurs due to the following. The analysis of heat and electricity balances of enterprises involved in production of soft drinks, carbonated drinking water and juice demonstrates that more than 35% of consumer energy resources are spent for auxiliary shop and factory needs of the enterprise and is a figure, which is almost not dependent on production output. Moreover, since such auxiliary shop and factory needs of the enterprise include heating, ventilation and conditioning, then it should be taken into account that the volume of energy spent for such components depends in climate conditions, where the relevant enterprise is located. It should be also noted that in most cases such enterprises produce simultaneously not only one group of products (for example, carbonated drinking water), but several product groups concurrently. Meanwhile allocation of energy resources consumption to auxiliary shop and factory needs of the enterprise among separate products groups is made in proportion to the number of energy resources consumed by technological equipment for production of certain product group. That is the more energy consuming production technology is, the greater is the share of energy resources consumption for auxiliary shop and factory needs of the enterprise will be related to production of certain product group.
2. Based on the statistics the average industry-wide unit heat consumption is as follows: for soft drinks - 586.0 Mcal/thousand decilitre; for carbonated drinking water - 343.4 Mcal/thousand decilitre; and for juice - 143.1 Mcal/t. With regard to soft drinks 4 enterprises from those selected are more effective than the average industry-wide indicator by more than 147.58 Mcal/thousand decilitre. With regard to carbonated drinking water 3 enterprises from those selected are more effective than the average industry-wide indicator by more than 43.4 Mcal/thousand decilitre.
22
With regard to juice 2 enterprises from those selected are more effective than the average industry-wide indicator by more than 8.85 Mcal/t.
3. Based on the statistics the average industry-wide unit electricity consumption is as follows: for soft drinks - 541.3 kWh/thousand decilitre; for carbonated drinking water - 657.8 kWh/thousand decilitre; and for juice - 173.6 kWh/t. With regard to soft drinks 4 enterprises from those selected are the more effective than the average industry-wide indicator by more than 62 kWh/thousand decilitre. With regard to carbonated drinking water 4 enterprises from those selected are the more effective than the average industry-wide indicator by more than 68.56 kWh/thousand decilitre. With regard to juice 2 enterprises from those selected are the more effective than the average industry-wide indicator by more than 4.6 kWh/t.
23

24
SOURCES 1. Web-portal - http://uadrinks.info/
2. Global Industrial Energy Efficiency Benchmarking. An Energy Policy
Tool.– Working Paper.– November 2010
3. Website of PJSC Rosynka - http://www.rosinka.ua
4. Website of PrJSC Obolon - http://www.obolon.com
5. Website of Malbi Agency - http://www.bonboisson.rainford.ua/
6. Website of Cocа-Cola Beverages Ukraine Ltd. - http://www.coca-cola-
job.com.ua
7. Website of PepsiCo - http://www.pepsicoukraine.com/
8. Website of PrJSC Erlan - http://www.biola.ua/
9. Website of Panda Production Firm - http://www.panda.vin.ua/
10. Website of PrJSC Vinnifruit - http://www.vinni.ua/
11. Website of Carlsberg Ukraine - http://ru.carlsbergukraine.com/
12. Forms of State Statistical Statements 11-МТП "Statement on Consumption
of Fuel, Heat and Electric Energy" for 2011.