Embed Size (px)
Citation preview
Report to the
U. S. Election Assistance Commission
On
Best Practices to Improve Voter Identification Requirements
Pursuant to the
HELP AMERICA VOTE ACT OF 2002
Public Law 107-252
June 28, 2006
Submitted by
The Eagleton Institute of Politics, Rutgers, The State University of New Jersey
The Moritz College of Law, The Ohio State University
2
Report to the U. S. Election Assistance Commission
Best Practices to Improve Voter Identification Requirements
CONTENTS
The Research Team 3 Report Background 5 Executive Summary and Recommendations 5 Background and Methods 5 Methodology 8 Summary of Findings 9 Recommendations 11 Summary of Research 13 Background and Approach of the Study 13 Voter ID and Turnout 19 Litigation Over Voter ID Requirements 31 Developments since 2004 33 Conclusions 34 Appendix A: Summary of Voter ID Requirements by State
Appendix B: Court Decisions and Literature on Voter Identification and Related Issues Court Decisions
Appendix C: Analysis of Effects of Voter ID Requirements on Turnout Appendix D: Annotated Bibliography on Voter Identification Issues Appendix E: State Statutes and Regulations Affecting Voter Identification
(included in electronic form only)

3
The Research Team
This research report on Voter Identification Requirements in the 2004 election is part of a broader analysis that also includes a study of Provisional Voting, which has already been submitted to the EAC. Conducting the work was a consortium of The Eagleton Institute of Politics of Rutgers, The State University of New Jersey, and The Moritz College of Law of The Ohio State University. The Eagleton Institute explores state and national politics through research, education, and public service, linking the study of politics with its day-to-day practice. It focuses attention on how contemporary political systems work, how they change, and how they might work better. Eagleton regularly undertakes projects to enhance political understanding and involvement, often in collaboration with government agencies, the media, non-profit groups, and other academic institutions.
The Moritz College of Law has served the citizens of Ohio and the nation since its establishment in 1891.It has played a leading role in the legal profession through countless contributions made by graduates and faculty. Its contributions to election law have become well known through its Election Law @ Moritz website. Election Law @ Moritz illuminates public understanding of election law and its role in our nation's democracy. Project Management Team Dr. Ruth B. Mandel Director. Eagleton Institute of Politics Board of Governors Professor of Politics Principal Investigator Chair of the Project Management Team Edward B. Foley Robert M. Duncan/Jones Day Designated Professor of Law The Moritz College of Law Director of Election Law @ Moritz
Ingrid Reed Director of the New Jersey Project Eagleton Institute of Politics Daniel P. Tokaji Assistant Professor of Law The Moritz College of Law John Weingart Associate Director Eagleton Institute of Politics
Dave Andersen Graduate Assistant, Eagleton Institute of Politics John Harris Graduate Assistant Eagleton Institute of Politics Donald Linky Senior Policy Fellow Eagleton Institute of Politics Sara A. Sampson Reference Librarian, Moritz College of Law Tim Vercellotti Assistant Research Professor Assistant Director, Center for Public Interest Polling Eagleton Institute of Politics Laura Williams The Moritz College of Law
Thomas M. O’Neill Consultant, Eagleton Institute of Politics Project Director

4
Peer Review Group
A draft of this report and the statistical analysis in its appendix were critiqued by a Peer Review Group. The comments of its members improved the quality of our work. While the Group as a whole and the comments of its members individually contributed generously to the research effort, any errors of fact or weaknesses in inference are the responsibility of the Eagleton-Moritz research team. The members of the Peer Review Group do not necessarily share the views reflected in our recommendations.
R. Michael Alvarez Professor of Political Science California Institute of Technology John C. Harrison Massee Professor of Law University of Virginia School of Law Martha E. Kropf Assistant Professor Political Science University of Missouri-Kansas City Daniel H. Lowenstein Professor of Law, School of Law University of California at Los Angeles
Timothy G. O’Rourke Dean, Fulton School of Liberal Arts Salisbury University Bradley Smith Professor of Law Capital University Law School Tim Storey Program Principal National Conference of State Legislatures Peter G. Verniero former Attorney General, State of New Jersey Counsel, Sills, Cummis, Epstein and Gross, PC

REPORT AND RECOMMENDATIONS TO THE EAC VOTER IDENTIFICATION ISSUES Report Background The Help America Vote Act of 2002 (HAVA) (Public Law 107-252) authorizes the United
States Election Assistance Commission (EAC) (Sec. 241, 42 USC 15381) to conduct periodic
studies of election administration issues. The purpose of these studies is to promote
methods for voting and administering elections, including provisional voting, that are
convenient, accessible and easy to use; that yield accurate, secure and expeditious voting
systems; that afford each registered and eligible voter an equal opportunity to vote and to
have that vote counted; and that are efficient.
This study provides information on voter identification practices in the 2004 election. It makes
recommendations for best practices to evaluate future proposals for voter ID requirements,
including the systematic collection and evaluation of information from the states. The
research was conducted by the Eagleton Institute of Politics at Rutgers, the State University
of New Jersey, and the Moritz College of Law at the Ohio State University under a contract
with the EAC, dated May 24, 2005. The work included a review and legal analysis of state
statutes, regulations and litigation concerning voter identification and provisional voting as
well as a statistical analysis of the relationship of various requirements for voter identification
to turnout in the 2004 election. This report is a companion to a report on Provisional Voting
submitted to the EAC on November 28, 2005 under the same contract.
EXECUTIVE SUMMARY AND RECOMMENDATIONS Background and Methods
This report arrives at a time of considerable ferment over the issue of voter identification. The
debate across the nation over requiring voters to produce a specific identification document
before being permitted to cast a regular (as opposed to a provisional) ballot, has revealed
supporters and opponents in polarized camps.
− Proponents of stricter identification requirements base their case on improving the
security of the ballot by reducing opportunities for one kind of vote fraud --multiple voting
or voting by those who are not eligible. The proponents argue that their goal is to ensure
that only those legally entitled to vote do so, and do so only once at each election.

6
− Opponents seek to forestall more stringent identification requirements, such as
government-issued photo ID, in order to ensure broad access to a regular ballot. They
fear that some voters --such as, they argue, racial and ethnic minorities, the young, and
elderly voters-- may lack convenient access to the required ID documents, or that such
voters may be fearful of submitting their ID documents to official scrutiny and thus stay
away from the polls.
− Both sides argue that their preferred policy will engender faith in the electoral process
among citizens.
This report considers policy issues associated with the voter ID debate. It inquires whether
empirical study can suggest a way to estimate the effects of different voter ID requirements on
turnout. That analysis would constitute an important first step in assessing tradeoffs between
ballot security and ballot access. The aim of this research is to contribute to the effort to raise
the quality of the debate over this contentious topic. The tradeoffs between ballot security and
ballot access are crucial. A voting system that requires voters to produce an identity document
or documents may prevent the ineligible from voting. It may also prevent eligible voters from
casting a ballot. If the ID requirement of a ballot protection system blocks ineligible voters from
the polls at the cost of preventing eligible voters who lack the required forms of identification, the
integrity of the ballot may not have been improved; the harm may be as great as the benefit.
As part of the project’s effort to analyze the relationship between Voter ID requirements, turnout,
and their policy implications, a statistical analysis examined the potential variation in turnout.
This statistical study developed a model to illuminate the relationships between voter ID
requirements and turnout. This model’s findings and limitations suggest avenues for further
research and analysis that may assist the EAC and the states as they explore policies to
balance the goals of ballot integrity and ballot access.
The statistical analysis describes one possible way to estimate what might be the incremental
effect on voters’ access to the ballot of an increase in the rigor of voter identification
requirements. We do not offer this statistical analysis as the last word, but rather as a
preliminary word on the subject. Its findings must be regarded as tentative; the information
(such as the specific reasons some potential voters are not allowed to cast a regular ballot) that
that might permit greater certainty is simply not available. Indeed, as our recommendations
indicate, the next step to improve understanding of the effects of stricter voter identification on

7
turnout and on vote fraud is to collect more information on both topics systematically and
regularly.
Making a statistical estimate of the effect of voting regulations on turnout is difficult. The
dynamics of turnout are complex, much studied, and only partially understood. Some agreement
exists, however, that three factors that exert substantial influence on voter turnout are:1 the
socioeconomic status of the potential voter; legal requirements to vote; and the political context
of the election. By focusing on how voters identify themselves at the polls, this report
emphasizes legal requirements. The statistical analysis also considers some of the
socioeconomic, racial, and age characteristics of the electorate, as well as the political context
in 2004 (such as whether a state was a battleground in the presidential race).
Examining tradeoffs between ballot security and ballot access requires some measure of the
effectiveness of voter ID requirements in reducing multiple voting or voting by ineligible voters.
The existing evidence on the incidence of vote fraud, especially on the kind of vote fraud that
could be reduced by requiring more rigorous voter identification, is not sufficient to evaluate
those tradeoffs.2 Assessing the effectiveness of voter ID as a way to protect the integrity of the
ballot should logically include an estimate of the nature and frequency of vote fraud. This
research does not include consideration of vote fraud, nor does it estimate the possible
effectiveness of various voter ID regimes to counter attempts at vote fraud. Our analysis also
cannot take into account how many potential voters who did not turn out under comparatively
stricter voter ID requirements might have been ineligible or eligible to vote.
Despite these qualifications regarding the quality of the available data and the limitations of
statistical analysis, however, the different statistical methods and two different sets of data on
turnout in 2004 election used in the study point to the same general finding. Stricter voter
identification requirements (for example, requiring voters to present non-photo ID compared to
simply stating their names) were correlated with reduced turnout in the models employed, as
described in detail in Appendix C. 3 As explained below, these models find that a statistically
1 See, for example, Tom William Rice and Patrick J. Kenney, "Voter Turnout in Presidential Primaries." 1985. Political Behavior, 7: 101-112. Identification requirements are not the only legal restrictions on voting. States also differ, for example, in their registration requirements (including how long before the election registration must take place and the identity documents required register). 2 The EAC has contracted with other researchers to study vote fraud issues. 3 Appendix C: Tim Vercellotti, Eagleton Institute of Politics, Analysis of Effects of Voter Identification Requirements on Turnout. Using the aggregate data, photo ID did not have a significant effect on turnout, possibly because in the

8
significant relationship exists, even when controlling for other factors (such as whether the
election was in a battleground state) that might affect turnout. (But note that in the model using
the aggregate data, photo ID did not have a significant effect on turnout. The reason may have
been that in this election, each state with a photo ID requirement provided an alternate way for
those without a photo ID to cast a regular ballot.) Without knowing more about the effects of
stricter voter ID on reducing multiple voting or voting by ineligible voters, however, the tradeoffs
between ballot security and ballot access cannot be assessed.
Methodology The report includes detailed information on the nature of the statutory requirements across the
country in 2004 and on the statutes and court decisions that provide the legal context for the
voter ID debate. We gathered information on the requirements in effect in the 50 states and the
District of Columbia in that year. Based on our interpretation of state statutes, supplemented in
some cases by conversations with state election officials, we divided the states’ ID requirements
into five categories. We believe each category is more rigorous than the one preceding, based
on the demands they make on voters.4 The categories range from “Stating Name” which we
judge to be somewhat less demanding than “Signing Name.” “Signature Match” requires poll
workers to examine the signature and compare it to a sample, which is slightly more demanding
than the voter simply signing. “Present ID” requires voters to offer some documentary evidence
of their identity, ranging from a utility bill to a passport. It is more demanding than the previous
three categories because it requires that the voter remember to bring this documentation to the
polls. (Even a simple ID, such as a utility bill, may not be available to some renters or, say,
those in group housing.) We regard a government “Photo ID” as the most rigorous requirement.
Such identity documents may not be uniformly and conveniently available to all voters.
For each state, we identified both the “maximum” and “minimum” identification requirements.
The term “maximum” refers to the most that voters may be asked to do or show at the polling
place (putting aside cases in which particular voter’s eligibility may be questioned pursuant to a
state challenge process). The term “minimum,” on the other hand, refers to the most that voters
can be required to do or show, in order to cast regular ballot (again leaving aside a state
2004 election every state requiring photo ID provided an alternative way to cast a regular ballot for those voters who lacked photo identification. The individual data from the Current Population Survey did show a significant effect, but only for the overall sample and for white voters, which may be an artifact of the large sample size. 4 Even the most relaxed provisions for identification at the polls –anything stricter than the honor system used in North Dakota—will impose some burden on particular voters. Harvard Law Review 119:1146

9
challenge process). We have included “maximum” requirements in our analysis, and not simply
“minimum” requirements, because simply asking voters to produce particular identifying
information may have a deterrent effect, even if voters are ultimately allowed to cast a regular
ballot without that identification. For example, in a state where voters are asked to show photo
ID at the polling place, but still allowed to vote by completing an affidavit confirming their
eligibility, the “maximum” of being asked to show photo ID may deter some voters even though
the “minimum” would allow them to vote without photo ID.
It is worth emphasizing that, at the time of the 2004 election, there was no state that had a
“minimum” requirement of showing photo ID – in other words, there was no state that required
voters to show photo ID in order to cast a regular ballot. For this reason, our report does not
measure the impact of laws, like those recently enacted in Indiana and Georgia, which require
voters to show photo ID in order to cast a regular ballot without an affidavit exception.
To examine the potential variation on turnout rates associated with each type of voter ID
requirements in effect on Election Day 2004, the statistical analysis drew on two sets of data.
These were, first, aggregate turnout data at the county level for each state and, second, the
reports of individual voters collected in the November 2004 Current Population Survey by the U.
S. Census Bureau. Using two different data sets makes it possible to check the validity of one
analysis against the other. It also provides insights not possible using only one of the data sets.
The aggregate analysis cannot provide valid estimates on the effects of different ID
requirements on particular demographic groups (e.g., the old, the young, African-Americans, the
poor, or high school graduates). The Current Population Survey data does permit that kind of
analysis, although it has the disadvantage of relying on self-reports by respondents about their
registration status and experience in the polling place.
To understand legal issues that have been raised in recent litigation over voter ID requirements,
we collected and analyzed the few major cases that have been decided so far on this issue. The
decisions so far provide some guidance on the constitutional and other constraints as to voter
ID requirements.
Summary of Findings
As voter identification requirements vary, voter turnout varies as well. This finding emerged from
both the statistical analysis’s aggregate data and the individual-level data, although not always
10
for both the maximum and minimum sets of requirements. The overall relationship between the
stringency of ID requirements and turnout was fairly small, but still statistically significant.
In the model used with the aggregate data in the statistical analysis, for the maximum ID
requirements, the match-signature requirement and the provide-a- non-photo-ID requirement,
but not the photo ID requirement, were all correlated with lower turnout compared to requiring
that voters state their names. When the registration closing deadline was added as an
independent variable in the aggregate analysis, signature match and non-photo id remained
significant and negative predictors in the model.
The reduction in turnout was not the same for all demographic groups in the citizen voting age
population.
.
The non-photo identification requirement showed the most significant and consistent correlation
with reduced turnout. This result may be surprising given the intense debates surrounding photo
identification requirements. The effect of photo ID requirements cannot, however, be assessed
from the data the statistical analysis examined, since none of the states had laws in 2004 that
conditioned voting on presentation of photo ID. Each of the five states that had photo ID as a
“maximum” requirement (i.e., the most that voters could be asked to show at the polls)
accepted another type of identification or an affidavit as a “minimum” requirement in the 2004
election (i.e., they were allowed to cast a regular ballot with something less than photo ID).
Significant questions about the relationship of voter identification requirements to turnout remain
unanswered. The data examined in this project could not capture the dynamics of how
identification requirements might lower turnout. If ID requirements dampen turnout, is it because
individuals are aware of the requirements and stay away from the polls because they cannot or
do not want to meet the requirements? Or, do the requirements result in some voters being
turned away when they cannot meet the requirements on Election Day? Other factors that may
also be correlated with stricter ID laws – such as less user-friendly voter registration systems –
may actually be causing lower turnout. The CPS data do not include the information needed to
answer this question. Knowing more about the “on the ground” experiences of voters
concerning identification requirements could guide policy-makers at the state and local level in
determining whether and at what point in the electoral cycle a concerted public information
campaign might be most effective in helping voters to meet identification requirements. Such
11
knowledge also could help in designing training for election judges to handle questions about,
and potential disputes over, voter identification requirements.
Our analysis of litigation suggests that the courts will look more strictly at requirements that
voters produce a photo ID in order to cast a regular ballot, than at non-photo ID laws. The courts
have used a balancing test to weigh the legitimate interest in preventing election fraud against
the citizen’s right to privacy (protecting social security numbers from public disclosure, for
example) and the reasonableness of requirements for identity documents. To provide both the
clarity and certainty in administration of elections needed to forestall destabilizing challenges to
outcomes, a best practice for the states may be to limit requirements for voter identification to
the minimum needed to prevent duplicate registration and ensure eligibility.
The current lack of understanding of precisely how voter ID requirements affect turnout could be
ameliorated by requiring the collection and reporting of additional data, including the reasons
potential voters are required to cast a provisional ballot and the reasons for rejecting provisional
ballots during the 2006 and subsequent elections. Also useful would be the results of surveys of
voters on their experiences in meeting voter ID requirements and on what type of ballot they
cast.5 And, of course, more information is needed on the incidence and varieties of vote fraud,
but that inquiry is outside the scope of this report.
Recommendations for consideration and action by the EAC
The dynamics of Voter ID requirements –how more rigorous voter ID requirements may affect
the decision by potential voters to go or stay away from the polls-- are not perfectly understood.
This lack of understanding should be recognized in the policy process in the states. The debate
over voter ID in the states would be improved by additional research sponsored by the EAC.
The EAC should consider the following actions to improve understanding of the relationship
between voter ID requirements and the two important goals of ensuring ballot access and
ensuring ballot integrity.
5 Arizona held its first election with its new, stricter ID requirements on March 14, 2006. In at least one county (Maricopa) election officials handed a survey to voters that asked if they knew about the voter identification law and if they did, how they found out about it. Edythe Jensen, “New Voter ID Law Goes Smoothly in Chandler,” Arizona Republic, March 15, 2006. More surveys of this kind can illuminate the dynamics of voter ID and voting in ways that are not possible now because of insufficient data.

12
1. Encourage or sponsor further research to clarify the connection between Voter ID
requirements and the number of potential voters actually able to cast a ballot that is
actually counted.
2. Recommend as a best practice the publication of a “Voting Impact Statement” by states
as they assess their voter ID requirements to protect the integrity of the ballot. The
analysis will help ensure that efforts to increase ballot security have a neutral effect on
electoral participation by eligible voters. A “Voter Impact Statement” would estimate the
number and demographics of 1) eligible, potential voters that may be kept from the polls
or permitted to cast a provisional ballot by a stricter ID requirement; and 2) and assess
the number of ineligible voters who will be prevented from voting by the stricter ID
requirements.
3. Encourage or require the states in the 2006 election and beyond, to collect and report
reliable, credible information on the relationship between ballot access and ballot
security. EAC should publish an analysis of this information to provide a sound factual
basis for the states to consider as they estimate the incidence of the kinds of vote fraud
that more stringent ID requirements may prevent. The analysis should describe the
dynamics of the voter ID process in preserving the security of the ballot. EAC might also
use the information reported by the states to encourage further assessment by the
states of the effectiveness of programs to ensure that all eligible voters have required ID
and are permitted to vote in future elections. Well-designed longitudinal studies in the
states can show the results of changing voter ID requirements on electoral participation
over time. The studies should include precinct-level data to provide the fine-grained
analysis that can provide a solid foundation for policy.
I. Useful information could be supplied by state-sponsored surveys of voters
conducted by local election officials. Such surveys would make clear why those
who cast a provisional ballot were found ineligible to cast a regular ballot. The
answers would illuminate the frequency with which ID issues divert voters into the
provisional ballot line.
II. Surveys to ask voters what they know about the voter id requirements would also
provide useful context for evaluating the effect of various voter ID requirements on
electoral participation.
III. Spot checks by state election officials on how the identification process works at
polling places could provide information on how closely actual practice tracks

13
statutory or regulatory requirements. Such reports should be available to the
public.
4. Encourage states to examine the time period allowed for voters who cast a provisional
ballot because they lacked required ID to return with their identification. In eleven states,
voters who had to cast a provisional ballot because they lacked the ID required for a
regular ballot were permitted to return later with their ID. Their provision of this ID is the
critical step in evaluating the ballots. The length of the period in which the voter may
return with ID is important. In setting the time period for return, which now varies among
the states from the same day to about two weeks, states should consider three factors:
the convenience of the voter, the total time allowed to evaluate ballots6, and the safe
harbor provision in presidential elections.
5. Recommendations to the states from EAC should reflect current judicial trends.
Requirements that voters provide some identifying documentation have been upheld where
photo ID is not the only acceptable form. Whether laws requiring photo ID will be upheld is
less certain.
SUMMARY OF RESEARCH Background and Approach of the Study Voter ID requirements are just one set of rules governing voting that may affect turnout. Social
scientists have long studied how election rules affect participation in elections. The general view
today is that the individual citizen makes the choice of whether to vote in a way similar to other
decisions that a rational citizen makes, by comparing costs and benefits. The benefits of voting
are fairly stable and hard to specify given the remote probability that any one vote will make a
difference in an election. But whatever the benefit as perceived by an individual voter, as the
costs of voting (for example, time, hassle, acquisition of information) increase, the likelihood that
a citizen will vote decrease. Not all groups in the population calculate the cost of participation in
the same way, so that election laws (such as registration or identification requirements) may
affect different groups differently.
A short summary of some of the social science literature illustrates what may be a broad
consensus that the rules of elections affect turnout, but note the important differences in the
details of what groups may be most affected. 6 Our research on provisional voting reveals that states that provide more than a week to evaluate provisional ballots end up counting substantially more of those ballots than states that provide less than a week.

14
− Bowler, Brockington and Donovan in “Election Systems and Voter Turnout: Experiments
in the United States”. The Journal of Politics, 63:3 (August 2001) concluded that
electoral systems help shape turnout by altering the benefits perceived by voters. For
example, cumulative voting systems have 5% greater turnout than plurality systems
− The effect of registration systems has been the subject of many studies over the last 40
years. Kelley, Ayres, and Bowen in "Registration and Voting: Putting First Things First."
American Political Science Review. 61:2 (June 1967) found that local variations in the
rate of voting are most directly tied to variations in the rate of registering to vote, and that
the rate of registering to vote in localities is most directly related to the laws and
administration of the registration process. They concluded that the decline in voting over
the past 80 years was due, in part, to the rise of registration laws.
− Brians and Grofman in "Election Day Registration's Effect on U.S. Voter Turnout."
Social Science Quarterly. 82:1 (March 2001), found that relaxing registration laws
produces higher turnout. In particular, they observed that relaxing registration laws is
more likely to promote voter turnout among those with medium levels of income and
education, rather than those at the lowest levels. Highton in "Easy Registration and
Voter Turnout," Journal of Politics. 59:2 (May 1997), concluded similarly that registration
laws affect voter turnout, but also observed that easier registration promotes turnout
among those in lower socio-economic status.
− Mitchell and Wlezien. "The Impact of Legal Constraints on Voter Registration, Turnout,
and the Composition of the American Electorate," Political Behavior. 17:2 (June 1995)
agreed that easier registration promotes higher turnout, but also concluded that higher
turnout from easier registration would be unlikely to change the composition of the
electorate. Nagler in "The Effect of Registration Laws and Education on U.S. Voter
Turnout." American Political Science Review. 85:4 (December 1991) found that
registration laws decrease voter turnout by depressing the eligible electorate, but that
lower educated people are not disproportionately impacted by these laws. But
Rosenstone and Raymond E. Wolfinger in "The Effect of Registration Laws on Voter
Turnout." American Political Science Review. 72:1 (March 1978) found that while
registration laws did affect both voter turnout and the composition of the electorate, the
sharpest effect of these restrictions was felt in the South and among the least educated.

15
− Squire, Wolfinger, and Glass in "Residential Mobility and Voter Turnout." American
Political Science Review. 81:1 (March 1987) found that people who move constitute a
major demographic group affected by registration laws. They estimated that altering laws
to facilitate voting by recently moved people could increase turnout by 9%. Highton in
"Residential Mobility, Community Mobility, and Voter Turnout." Political Behavior. 22:2
(June 2000) also found that people who move have lower turnout than stable residents,
and estimated that the decline was more a result of registration laws than a loss of social
connections.
− Highton and Wolfinger in "Estimating the Effects of the National Voter Registration Act of
1993." Political Behavior. 20:2 (June 1998) concluded that the Motor Voter laws led to a
significant increase in voting; that eliminating voter purges for not voting also increases
voting; and that these effects are felt most heavily by the young (under 30) and the
mobile (moved within past 2 years). Knack, in "Does 'Motor Voter' Work? Evidence
from State-Level Data." Journal of Politics., 57:3 (August 1995), also found that motor
voter does lead to increased registration and voting, but that other parts of NVRA of
1993, like mail-in registrations, agency-based registrations, and limitations on voter
purges had not been as influential two years after the passage of the act.
. While voter ID may not have been the subject of as much research as the registration process,
establishing the eligibility of a person to vote has long been part of the electoral process. Voters
may have to identify themselves twice in the electoral process: when registering to vote and
then when casting a ballot. The pressures felt by the voter arising from the need to check ID,
even so simple a check as a signature match, can be greater at the polls on Election Day than
at the time of registration. Poll workers may feel under pressure when faced with long lines and
limited time.
Voter ID requirements on Election Day
This analysis focuses on ID requirements on Election Day, but with an appreciation that the ID
requirements at time of registration and on Election Day are inter-related. 7 The emphasis in this
report is on Voter ID requirements on Election Day and afterwards as election judges evaluate
provisional ballots. This is the critical period for the electoral system, the time when ballot
access and ballot security are in the most sensitive balance.
7 As the Carter-Baker Commission noted, photo ID requirements for in-person voting do little to address the problem of fraudulent registration by mail, especially in states that do not require third-party organizations that register voters to verify ID. Commission on Federal Election Reform, pp 46-47.

16
The report looks at voter ID issues that go beyond the rather narrow identification requirements
in HAVA. Much of the current debate in state legislatures over voter ID ranges beyond HAVA to
require more rigorous documentation of identity for all would-be voters, not just those who had
not registered in person and are casting a ballot for the first time. Current controversies in the
states over voter ID seems to have been sparked in part by the HAVA requirements, but goes
beyond those requirements, and sets the context for the analysis here.8
We recognize that the previously technical, rather dull subject of voter ID requirements has
become fiercely partisan and divisive in many states. The polarization of the debate has raised
the stakes over this issue, making dispassionate analysis both more valuable and more rare.9
Voter ID is often described as the critical step in protecting the integrity of the ballot, the process
to ensure that the potential voter is eligible and, if eligible, is permitted to cast one ballot and
one ballot only. Truly protecting the integrity of the ballot, however, requires a perspective that
takes in the entire voting process. It demands more than preventing the ineligible from voting,
and should also ensure that all those who are eligible and want to vote can cast a ballot that
counts. The protection effort must embrace all forms of voting, including absentee ballots, and
consider each step in the process from registration through vote counting.
A voting system that requires voters to produce an identity document or documents may prevent
the ineligible from voting. It may also prevent the eligible from casting a ballot. If the ID
requirements block ineligible voters from the polls at the cost of preventing eligible voters who
cannot obtain or have left at home the required forms of identification, the integrity of the ballot
may not have been improved; the harm may be as great as the benefit. Ultimately, a normative
evaluation of whether a state should adopt a stricter voter ID requirement (and, if so, what
particular form that new requirement should take) will weigh value judgments as well as
available factual evidence. Nonetheless, this report has proceeded on the premise that
8 Harvard Law Review 119:1127: “Legislators hoping to stiffen their state antifraud laws have taken their cue from identification provisions buried in HAVA.“ 9 “Of the various electoral procedure laws passed in the fifty states since the 2000 and 2004 presidential elections and those still being debated in state legislatures and local media, few arouse more potent partisan feelings than voter identification laws.” Harvard Law Review 119:1144. John Fund’s 2004 book, Stealing Elections: How Voter Fraud Threaten Our Democracy, cites (pages 16 – 17) a Rasmussen Research poll that asked respondents if they were more concerned with voting by ineligible participants or with disenfranchisement of eligible voters. Sixty-two percent of Kerry supporters, but only 18 percent of Bush supporters, worried more about disenfranchisement; 58 percent of Bush supporters, but only 19 percent of Kerry supporters were more concerned with voter fraud.
17
increased understanding of the factual evidence relating to the imposition of voter ID
requirements, based on available data and statistical analysis of that data, can help inform the
policy process.
Assessing the effectiveness of voter ID as a way to protect the integrity of the ballot should
logically include an estimate of the nature and frequency of vote fraud. The EAC has
commissioned a separate analysis of the incidence of vote fraud. Consequently, this research
does not include consideration of vote fraud nor the possible effectiveness of various voter ID
regimes to counter attempts at vote fraud. As a result, our study of the possible effects of voter
ID requirements on turnout cannot take into account how many potential voters who did not turn
out under comparatively stricter voter ID requirements might have been ineligible or eligible to
vote.
In some states, voters lacking required ID, or who have ID that does not reflect their current
address, are able to vote only by casting a provisional ballot.10 Voter ID requirements that
require voters to bring a document to the polls --rather than simply sign their names-- may divert
more voters to the provisional ballot. Requiring poll workers to request and check ID, can put
stress on the already demanding environment of the polling place. Scrutiny of ID can create
lines at the polling places. Further delays can result when voters cast a provisional ballot and fill
out the ballot envelope. Voters who cast a provisional ballot because they lack their ID on
Election Day, and who then fail to return with the needed document or documents, will have
their ballot rejected.11 And, of course, the cost of processing provisional ballots is greater than
the cost of regular ballots.
Each of these potential consequences of more elaborate voter identification processes can
increase the chance of litigation. Long lines will, at best, discourage voters and at worst make
voting seem a hassle, an impression that could keep more citizens (even those with ID) from the
polls.
10 For example, the Florida voter ID law adopted after the 2004 election and pre-cleared by the Department of Justice, permits voters who cannot meet the ID requirements to sign an affidavit on the envelope of a provisional ballot, which will be counted if the signature matches that on the voter’s registration form. 11 The EAC’s Election Day Study found “improper ID,” to be the third most common reason for a provisional ballot to be rejected. “Improper ID” was cited by 7 states responding to the survey, compared to 14 mentions for voting in the wrong precinct. Election Day Study, Chapter 6, p. 5.

18
Evaluating the effect of different Voter ID regimes can be most effective when based on clear
standards --legal, equitable, practical. The standards outlined here might be described as
questions policy-makers should ask about Voter ID requirements. We suggest seven questions
that address important dimensions of the problem.
1. Is the Voter ID system designed on the basis of valid and reliable empirical studies of the
incidence of the sorts of vote fraud it is designed to prevent?12
2. How effective is the ID requirement in increasing the security of the ballot? How well can
it be coordinated with a statewide voter database?13
3. How practical is the requirement? (Can it be administered smoothly by the staff and
budget likely to be made available? How much additional training of polling place
workers might be required?) Is it simple enough or can it be defined with sufficient clarity
that poll workers throughout the state can administer it uniformly and with a minimum of
local interpretation made on the fly under the pressure of Election Day?14
4. How cost-effective is the system? Does it demonstrably increase the security of the
ballot affordably, measured in both monetary and other costs? To improve
understanding of the non-monetary component of the costs, conducting a voter impact
study might be appropriate. The voter impact study would examine, before the adoption
of the regulation, the cost of compliance by the voter (such as the cost in time and
money of acquiring a photo ID card), any offsetting benefits to voters, and the possible
disparate effects of the regulation on various groups of voters.15 A thorough, objective
impact statement that demonstrated the nexus between the identification regime and the
integrity of the ballot could provide protection against inevitable legal challenges.
12 “Often where the battle over voter identification is most heated, real evidence of voter fraud proves scarce: in Georgia, for example, the Secretary of State averred that she had never encountered a single instance of voter impersonation at the polls. State laws might sometimes impose tighter restrictions on in-person voting than on absentee ballots, which yield the greatest incidence of, and provide the easiest avenue for, voter fraud. . .” Harvard Law Review 127:1144 (2006) 13 See the final section of this report for a brief overview of possible effects of a statewide voter database on voter identification issues. 14 In New York, in 2004, disparities in training and voting information were made apparent in a study finding elections officials had wildly varying interpretations of what the state’s voter identification requirement actually was. Tova Wang, “Warning Bell in Ohio,” December 5, 2005. Website, the Foundation for National Progress. 15 “Absent clear empirical evidence demonstrating widespread individual voter fraud, legislatures need to fashion narrowly tailored voter identification provisions with an eye toward the inevitable and well-grounded constitutional challenges that will arise in the courts. Only as states grow more adept at administering elections will courts likely demonstrate greater willingness to uphold strict identification requirements.” Harvard Law Review 127:1144 (2006)
19
5. If a side effect of the Voter ID regulation is likely to reduce turnout, generally or among
particular groups, is it possible to take other steps to ameliorate the adverse
consequences?16
6. Does it comply with the letter and spirit of Voting Rights Act?
7. The seventh question is the most difficult to answer. How neutral is the effect of the
Voter ID requirement on the composition of the qualified and eligible electorate? Might it,
intentionally or unintentionally, reduce the turnout of particular groups of voters or
supporters of one party or another without an offsetting decrease in vote fraud?
Voter ID and Turnout Based on research for this study by the Moritz College of Law, states had one of five types of
maximum requirements in place on Election Day 2004.These are shown in Table 1, Voter ID
Requirements. The five categories: at the polling place, voters were asked to either: state their
names (10 states); sign their names (13 states and the District of Columbia); sign their names,
to be matched to a signature on file (seven states); provide a form of identification that did not
necessarily include a photo (15 states); or provide a photo identification (five states).17 Using
this information made it possible to code the states according to these requirements, and
examine the assumption that voter identification requirements would pose an increasingly
demanding requirement in this order: stating one’s name, signing one’s name, matching one’s
signature to a signature on file, providing a form of identification, and providing a form of photo
identification, however, in all “photo ID” states in 2004, voters without photo ID could cast a
regular ballot after signing an affidavit concerning their identity and eligibility or provide other
forms of ID). The report refers to this set of ID requirements as “maximum,” the most rigorous ID
the voter can be asked to present at the polling place in order to cast a regular ballot.18
Election laws in several states offer exceptions to these requirements if potential voters lack the
necessary form of identification. Laws in those states set a minimum standard – that is the
16 For example, the Carter-Baker Commission coupled its recommendation for a national voter ID card to a call for an affirmative effort by the states to reach out and register the unregistered, that is, to use the new Voter ID regime as a means to enroll more voters. Similarly, Richard Hasen has suggested combining a national voter ID with universal registration. See his "Beyond the Margin of Litigation: Reforming U.S. Election Administration to Avoid Electoral Meltdown," 62 Washington and Lee Law Review 937 (2005). 17 Oregon conducts elections entirely by mail. Voters sign their mail-in ballots, and election officials match the signatures to signatures on file. For the purposes of this analysis, Oregon is classified as a state that requires a signature match. 18 As noted above, our analysis does not consider additional requirements that particular voters may be subjected to as part of an official challenge process, in the event that their eligibility is called into question.
20
minimum requirement that a voter may be required to satisfy in order to vote using a regular
ballot. States can be categorized based on the minimum requirement for voting with a regular
ballot. In 2004 the categories were somewhat different compared to the maximum requirement,
in that none of the states required photo identification as a minimum standard for voting with a
regular ballot. That is, voters who lacked photo ID would still be allowed to vote in all states, if
able to meet another requirement. Four states required voters to swear an affidavit as to their
identity (Florida, Indiana, Louisiana, and North Dakota). The five categories for minimum
requirements were: state name (12 states), sign name (14 states and the District of Columbia),
match one’s signature to a signature on file (six states), provide a non-photo identification (14
states), or swear an affidavit (four states). The analysis also examined this array of minimum
identification requirements to assess how they correlated with turnout: state name, sign name,
match signature, provide non-photo identification, and, given the potential legal consequences
for providing false information, swearing an affidavit. As noted above, no state had a “minimum”
requirement of showing photo ID. This analysis therefore cannot estimate the effect of laws,
such as those recently enacted in Indiana and Georgia that require voters to show photo ID in
order to cast a regular ballot without an affidavit or other exception.
We recognize the difficulties in summarizing each state’s voter ID requirements. The problem
is illustrated by the number of footnotes to Table 1 below. The variety of statutory and
regulatory details among the states is complex.
Moving beyond the statutes and regulations, we also recognize that the assignment of each
state to one category may fail to reflect actual practice at many polling places. As in any
system run by fallible humans, the voter ID process is subject to variation in practice.19 Voters
may have been confronted with demands for identification different from the directives in state
statutes or regulation. It seems reasonable to conclude, however, that while actual practices
may vary, the variance is around each state’s legal requirement for ID. The analysis of the
effect of state requirements on turnout must be viewed with some caution. We believe that the
categories used in this report provide an acceptable level of discrimination among voter
identification regimes.
19 One state election official told us that, “We have 110 election jurisdictions in Illinois, and I have reason to believe [the voter ID requirements] are administered little bit differently in each one. We wish it weren’t that way, but it probably is.”

21
TABLE 1 – Voter ID Requirements20 State Maximum
Forms of ID Required 2004
Current ID Requirement for First-Time Voters
Current ID Requirements for All Other Voters
Verification Method for Provisional Ballots
Alabama Provide ID Provide ID Provide ID Address & Registration Alaska Provide ID Provide ID Provide ID Signature Arizona Provide ID Gov-issued Photo ID Gov-issued Photo ID1 Address & Registration Arkansas Provide ID Provide ID Provide ID Address & Registration California Sign Name Sign Name Sign Name Signature Colorado Provide ID Provide ID Provide ID Address & Registration Connecticut Provide ID Provide ID Provide ID Affidavit D.C. Sign Name Provide ID* Sign Name Address & Registration Delaware Provide ID Provide ID Provide ID Affidavit Florida Photo ID2 Photo ID Photo ID Signature Georgia Provide ID Gov. Issued Photo ID Gov. Issued Photo ID Affidavit Hawaii Photo ID^^ Photo ID Photo ID^^ Affidavit Idaho Sign Name Provide ID* Sign Name EDR Illinois Give Name Provide ID* Match Sig. Affidavit Indiana Sign Name Gov. Issued Photo ID Gov. Issued Photo ID Bring ID Later Iowa Sign Name Provide ID* Sign Name Bring ID Later Kansas Sign Name Sign Name Sign Name Bring ID Later Kentucky Provide ID Provide ID Provide ID Affidavit Louisiana Photo ID Photo ID Photo ID^ DOB and Address Maine Give Name Provide ID* Give Name EDR Maryland Sign Name Provide ID* Sign Name Bring ID Later Mass. Give Name Provide ID* Give Name Affidavit Michigan Sign Name Provide ID* Sign Name Bring ID Later Minnesota Sign Name Provide ID* Sign Name EDR Mississippi Sign Name Provide ID* Sign Name Affidavit Missouri Provide ID Provide ID* Provide ID Address & Registration Montana Provide ID Provide ID* Provide ID Bring ID Later Nebraska Sign Name Provide ID* Sign Name Affidavit Nevada Match Sig. Provide ID* Match Sig. Affidavit New Jersey Match Sig. Provide ID* Match Sig. Bring ID Later New Mexico Sign Name Provide ID Provide ID Bring ID Later New York Match Sig. Provide ID* Match Sig. Affidavit NH Give Name Provide ID Give Name EDR North Carolina Give Name Provide ID* Give Name Varies North Dakota Provide ID Provide ID Provide ID No Registration Ohio Match Sig. Provide ID Provide ID Address & Registration Oklahoma Sign Name Provide ID* Sign Name Address & Registration Oregon Match Sig. Provide ID* Match Sig. Signature Penn. Match Sig. Provide ID4 Match Sig. Address & Registration Rhode Island Give Name Provide ID* Give Name Address & Registration
20 See Appendix 1 for a more detailed summary, including citations and statutory language, of the identification requirements in each state.

22
South Carolina Photo ID5 Photo ID Photo ID^^ Address & Registration South Dakota Photo ID6 Photo ID Photo ID^^ Affidavit Tennessee Provide ID Provide ID7 Provide ID Affidavit Texas Provide ID Provide ID8 Provide ID Bring ID Later Utah Give Name Provide ID Give Name Bring ID Later Vermont Give Name Provide ID Give Name Affidavit Virginia Provide ID Provide ID Provide ID Affidavit Washington Sign Name Provide ID Provide ID Address & Registration West Virginia Match Sig. Provide ID Match Sig. Address & Registration Wisconsin Give Name Provide ID Give Name Bring ID Later Wyoming Give Name Provide ID Give Name Affidavit * States applies only HAVA’s ID requirement, applicable to first-time voters who registered by mail and did not provide applicable ID at the time of registration. 1 Arizona voters who lack a photo ID may present 2 forms of ID with no photograph. 2 Florida required a photo ID in 2004, but voters without that credential could sign an affidavit concerning their identity and eligibility and cast a regular ballot. Florida subsequently changed its law to require that voters present photo ID to cast a regular ballot, though voters without photo ID may still cast a provisional ballot by signing an affidavit, which ballot should ordinarily be counted. 3 Louisiana required a photo ID in 2004. Voters without that credential could sign an affidavit concerning their identity and eligibility and cast a regular ballot. 4 Pennsylvania requires ID of all first-time voters, whether they registered by mail or in-person. 5 Voters lacking a photo ID could vote by providing another form of ID in 2004. 6 Voters lacking a photo ID could vote by providing another form of ID in 2004.
7 Tennessee voters must provide signature and address. In counties without computerized lists, the signature is compared to the registration card. In counties with computerized lists, the signature is compared to a signature on ID presented with the registration. 8Texas voters must present a current registration certificate. Those without a certificate can vote provisionally after completing an affidavit. Relationship of Voter ID requirements to Turnout
The statistical analysis examined the potential variation in turnout rates based on the type of
voter identification required in each state on Election Day 2004 using two sets of data:
aggregate turnout data at the county level for each state, as compiled by the Eagleton Institute
of Politics, and individual-level survey data included in the November 2004 Current Population
Survey conducted by the U.S. Census Bureau.
The statistical analysis examined turnout among U.S. citizens of voting age in both the
aggregate and the individual-level data. Determining citizenship status in the individual-level
data simply involved restricting the analyses to individuals who identified themselves as citizens
in the November 2004 Current Population Survey. (Those who said they were not citizens did
not have the opportunity to answer the supplemental voting questions contained in the Current
Population Survey.)
23
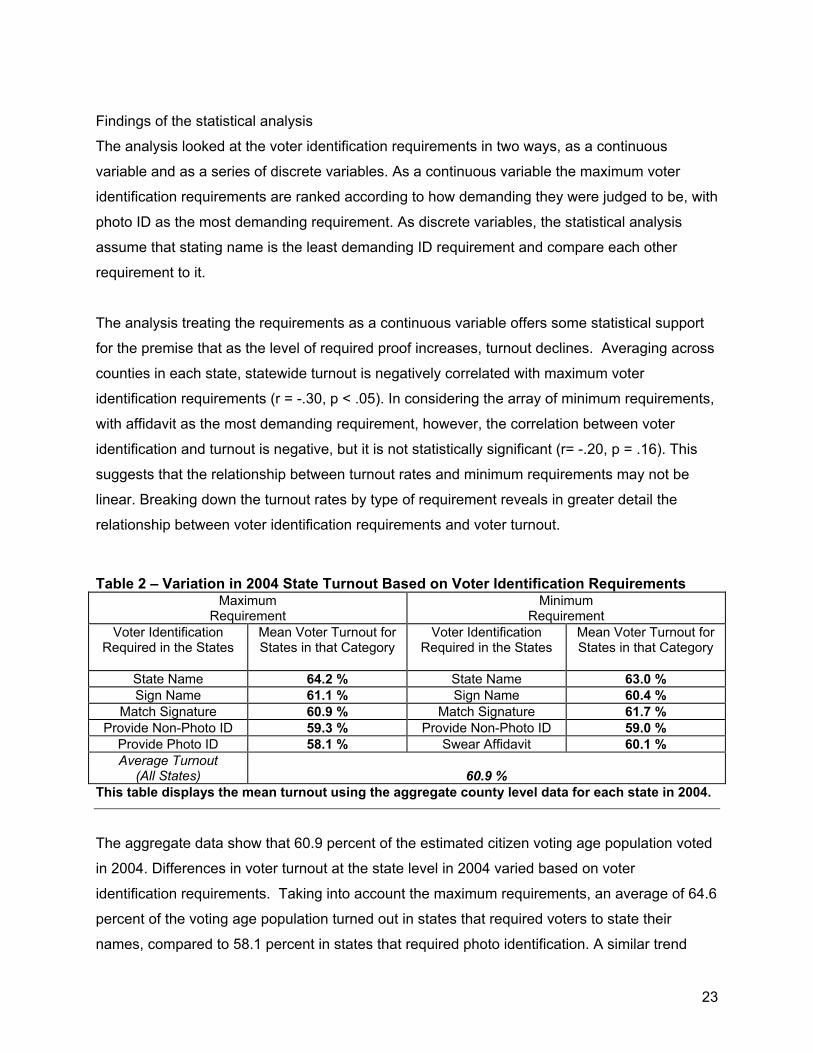
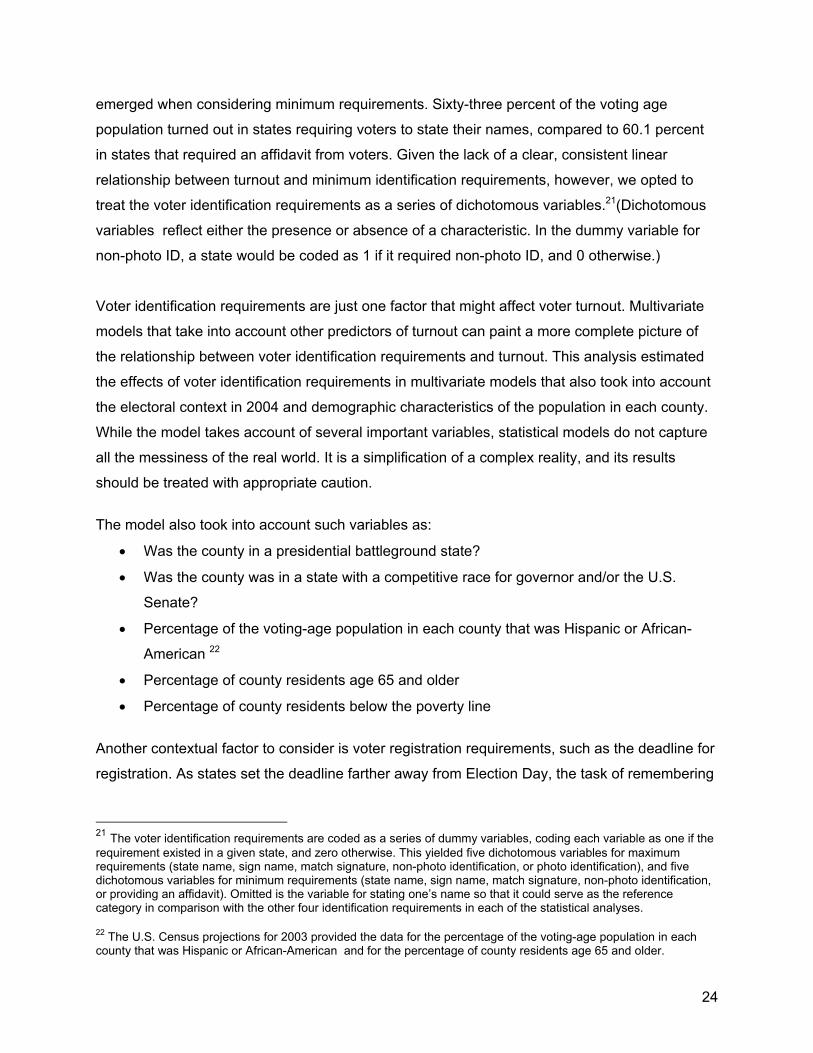
Findings of the statistical analysis
The analysis looked at the voter identification requirements in two ways, as a continuous
variable and as a series of discrete variables. As a continuous variable the maximum voter
identification requirements are ranked according to how demanding they were judged to be, with
photo ID as the most demanding requirement. As discrete variables, the statistical analysis
assume that stating name is the least demanding ID requirement and compare each other
requirement to it.
The analysis treating the requirements as a continuous variable offers some statistical support
for the premise that as the level of required proof increases, turnout declines. Averaging across
counties in each state, statewide turnout is negatively correlated with maximum voter
identification requirements (r = -.30, p < .05). In considering the array of minimum requirements,
with affidavit as the most demanding requirement, however, the correlation between voter
identification and turnout is negative, but it is not statistically significant (r= -.20, p = .16). This
suggests that the relationship between turnout rates and minimum requirements may not be
linear. Breaking down the turnout rates by type of requirement reveals in greater detail the
relationship between voter identification requirements and voter turnout.
Table 2 – Variation in 2004 State Turnout Based on Voter Identification Requirements
Maximum Requirement
Minimum Requirement
Voter Identification Required in the States
Mean Voter Turnout for States in that Category
Voter Identification Required in the States
Mean Voter Turnout for States in that Category
State Name 64.2 % State Name 63.0 % Sign Name 61.1 % Sign Name 60.4 %
Match Signature 60.9 % Match Signature 61.7 % Provide Non-Photo ID 59.3 % Provide Non-Photo ID 59.0 %
Provide Photo ID 58.1 % Swear Affidavit 60.1 % Average Turnout
(All States)
60.9 % This table displays the mean turnout using the aggregate county level data for each state in 2004.
The aggregate data show that 60.9 percent of the estimated citizen voting age population voted
in 2004. Differences in voter turnout at the state level in 2004 varied based on voter
identification requirements. Taking into account the maximum requirements, an average of 64.6
percent of the voting age population turned out in states that required voters to state their
names, compared to 58.1 percent in states that required photo identification. A similar trend
24
emerged when considering minimum requirements. Sixty-three percent of the voting age
population turned out in states requiring voters to state their names, compared to 60.1 percent
in states that required an affidavit from voters. Given the lack of a clear, consistent linear
relationship between turnout and minimum identification requirements, however, we opted to
treat the voter identification requirements as a series of dichotomous variables.21(Dichotomous
variables reflect either the presence or absence of a characteristic. In the dummy variable for
non-photo ID, a state would be coded as 1 if it required non-photo ID, and 0 otherwise.)
Voter identification requirements are just one factor that might affect voter turnout. Multivariate
models that take into account other predictors of turnout can paint a more complete picture of
the relationship between voter identification requirements and turnout. This analysis estimated
the effects of voter identification requirements in multivariate models that also took into account
the electoral context in 2004 and demographic characteristics of the population in each county.
While the model takes account of several important variables, statistical models do not capture
all the messiness of the real world. It is a simplification of a complex reality, and its results
should be treated with appropriate caution.
The model also took into account such variables as:
• Was the county in a presidential battleground state?
• Was the county was in a state with a competitive race for governor and/or the U.S.
Senate?
• Percentage of the voting-age population in each county that was Hispanic or African-
American 22
• Percentage of county residents age 65 and older
• Percentage of county residents below the poverty line
Another contextual factor to consider is voter registration requirements, such as the deadline for
registration. As states set the deadline farther away from Election Day, the task of remembering
21 The voter identification requirements are coded as a series of dummy variables, coding each variable as one if the requirement existed in a given state, and zero otherwise. This yielded five dichotomous variables for maximum requirements (state name, sign name, match signature, non-photo identification, or photo identification), and five dichotomous variables for minimum requirements (state name, sign name, match signature, non-photo identification, or providing an affidavit). Omitted is the variable for stating one’s name so that it could serve as the reference category in comparison with the other four identification requirements in each of the statistical analyses. 22 The U.S. Census projections for 2003 provided the data for the percentage of the voting-age population in each county that was Hispanic or African-American and for the percentage of county residents age 65 and older.
25
to register to vote becomes more challenging. Thus our model takes into account the number of
days between each state’s registration deadline and the election.
The dependent variable in each model using the aggregate data was voter turnout at the county
level, with turnout calculated as the percentage of the citizen voting-age population that voted in
the 2004 election.
The results of this modeling suggest that the stricter voter identification requirements of
matching one's signature to a signature on file with election authorities or presenting a non-
photo ID are associated with lower turnout compared to turnout in states that required voters to
simply state their name, holding constant the electoral context and demographic variables.
Contextual factors, such as whether the county was in a battleground state or whether that state
had a competitive race for governor and/or U.S. Senate, were associated with increased voter
turnout. The time between the closing date for registration and the election was correlated with
a slight negative effect on turnout. As the percentage of Hispanics in the county’s population
increased, turnout declined. The percentage of senior citizens in the county and household
median income were associated with higher turnout. The percentage of African-Americans in
the county did not have a significant effect in the model. The percentage of senior citizens in
the county and household median income showed a positive correlation with turnout. In this
aggregate model, the percentage of African-Americans in the county was not associated with a
significant difference in turnout.
The relationship of the minimum voter identification requirements to turnout was not
demonstrated. None of the dummy variables for voter identification requirements were
statistically significant. (A “dummy variable” represents a particular attribute and has the value
zero or one for each observation, e.g. 1 for male and 0 for female.) Being a battleground state
and having a competitive statewide race were significant and positive, as was the percentage of
senior citizens in the county and household median income. The percentage of Hispanics in the
county’s population continued to be associated with reduced turnout, as was the number of
days between the closing date for registration and the election. 23
23 This test incorporated a series of interactions between the maximum and minimum voter identification requirements and the percentage of African-Americans and Hispanics living in the counties. In each case the interactions did not improve the fit of the models to the data. See tables A-1 and A-2 in the appendix of Vercellotti’s paper in the appendices.

26
Analysis of the aggregate data at the county level generates some support for the hypothesis
that stricter identification requirements are correlated with lower turnout. For the maximum
requirements, a signature match and non-photo identification –but not photo identification-- were
correlated at a significant level with lower turnout in 2004, compared to requiring that voters
simply state their names.
Aggregate data, however, cannot fully capture the individual demographic factors that may
figure into the decision to turn out to vote.24 Voter identification requirements could have a
relationship to the turnout of particular groups of voters, in ways that county-level aggregate
data on turnout would not capture. To explore the effects of voter identification requirements on
turnout more completely, it is important to examine individual-level data as well.
.
Individual-level Analysis
Individual-level turnout data exists in the November 2004 Current Population Survey conducted
by the U.S. Census Bureau. The Census Bureau conducts the CPS monthly to measure
unemployment and other workforce data, but the bureau adds a battery of voter participation
questions to the November survey in even-numbered years to coincide with either a presidential
or midterm Congressional election.
One of the of the CPS is the sheer size of the sample. The survey’s Voting and Registration
Supplement consisted of interviews, either by telephone or in person, with 96,452
respondents.25 The large sample size permits analyses of smaller groups, such as Black or
Hispanic voters or voters with less than a high school education. The statistical analysis in
relying on the CPS is based on reports from self-described registered voters. Omitted are those
who said they were not registered to vote, as are those who said they cast absentee ballots
because the identification requirements for absentee ballots may differ from those required
when one votes in person. Eliminated from the sample are respondents who said they were not
U.S. citizens, who in this survey were not asked the voter registration and turnout questions. In
24 For example, previous research has found that education is a powerful determinant of turnout (Wolfinger and Rosenstone 1980, but see also Nagler 1991).24 Married people also are more likely to vote than those who are not married (Alvarez and Ansolabehere 2002; Alvarez, Nagler and Wilson 2004; Fisher, Kenny, and Morton 1993). 25 It is important to note that the Census Bureau allows respondents to answer on behalf of themselves and others in the household during the interview. While proxy reporting of voter turnout raises the possibility of inaccurate reports concerning whether another member of the household voted, follow-up interviews with those for whom a proxy report had been given in the November 1984 CPS showed 99 percent agreement between the proxy report and the information given by the follow-up respondent (U.S. Census Bureau 1990).
27
addition to the voter identification requirements, the models include other socioeconomic,
demographic, and political environment factors that might have influenced turnout in 2004.26
The dependent variable in these analyses is whether a respondent said he or she voted in the
November 2004 election.27
In the model, three of the voter identification requirements have a statistically significant
correlation with whether survey respondents said they had voted in 2004. That is, compared to
states that require voters only to state their names, the requirement to sign one’s name, provide
a non-photo ID, or photo ID in the maximum requirements or affidavit in the minimum is
associated with lower turnout.
Of the other state factors, only the competitiveness of the presidential race showed a significant,
correlation with increased turnout. In terms of demographic influences, African-American voters
were more likely than white voters or other voters to say they had cast a ballot, while Asian-
Americans were less likely than white or other voters to say they had turned out. Hispanic voters
were not statistically different from white or other voters in terms of reported turnout. Consistent
with previous research, income, and marital status all were positive predictors of voting. Women
also were more likely to say they voted than men. Among the age categories, those ages 45 to
64 and 65 and older were more likely than those ages 18 to 24 to say they voted. Respondents
who had earned a high school diploma, attended some college, graduated from college or
attended graduate school were all more likely to say they voted than those who had not finished
high school.
While the probit models provide statistical evidence for the relationship of voter identification
requirements and other variables to turnout, probit coefficients do not lend themselves to
intuitive interpretation.28 Table 3 below shows predicted probabilities (calculated from the probit
26 The models are estimated using probit analysis, which calculates the effects of independent variables on the probability that an event occurred – in this case whether a respondent said he or she voted and using robust standard errors to control for correlated error terms for observations from within the same state. 27 The U.S. Census Bureau reported, based on the November 2004 CPS, that 89 percent of those who identified themselves as registered voters said they voted in 2004 (U.S. Census Bureau 2005). Previous research has shown that, generally speaking, some survey respondents overstate their incidence of voting. Researchers speculate that over-reports may be due to the social desirability that accompanies saying one has done his or her civic duty, or a reluctance to appear outside the mainstream of American political culture (U.S. Census Bureau 1990). It is also possible that voting is an indication of civic engagement that predisposes voters to agree to complete surveys at a higher rate than non-voters (Flanigan and Zingale 2002). Hence the voter turnout rates reported in the CPS tend to be up to 10 percentage points higher than the actual turnout rate for the nation (Flanigan and Zingale 2002). Even with this caveat, however, the CPS serves as a widely accepted source of data on voting behavior. 28 A probit model is a popular specification of a generalized linear regression model, using the probit link function.
28
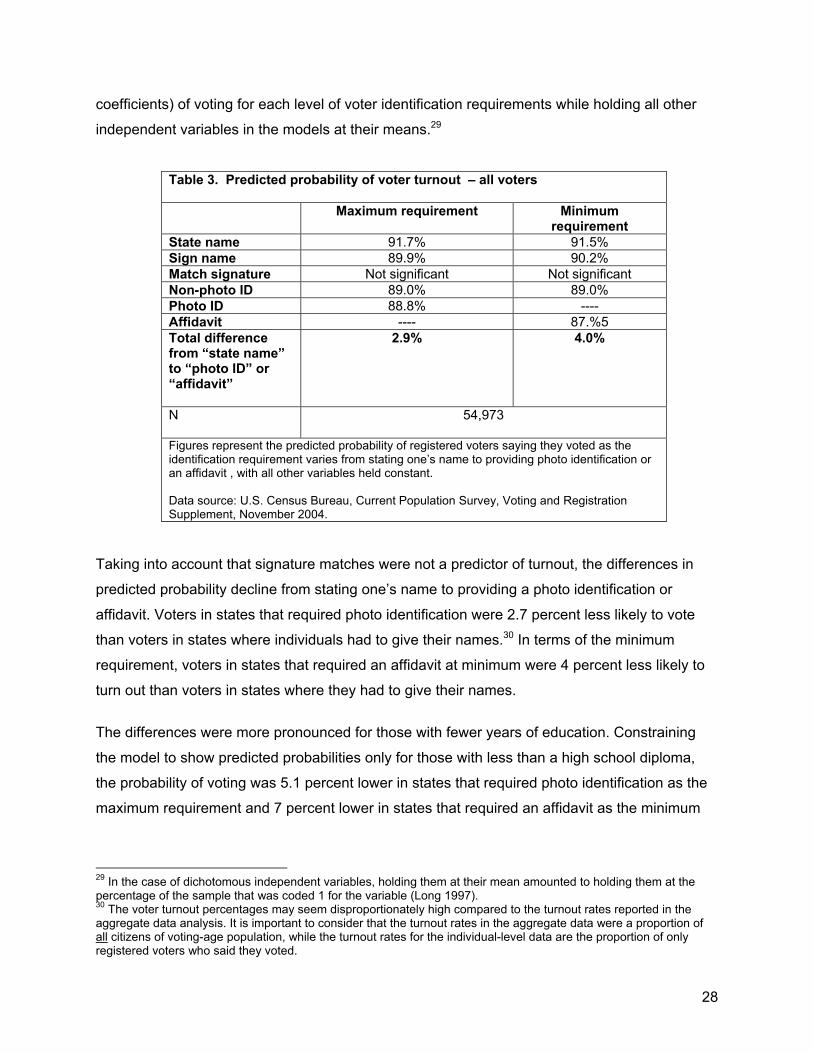
coefficients) of voting for each level of voter identification requirements while holding all other
independent variables in the models at their means.29
Table 3. Predicted probability of voter turnout – all voters
Maximum requirement Minimum requirement
State name 91.7% 91.5% Sign name 89.9% 90.2% Match signature Not significant Not significant Non-photo ID 89.0% 89.0% Photo ID 88.8% ---- Affidavit ---- 87.%5 Total difference from “state name” to “photo ID” or “affidavit”
2.9% 4.0%
N
54,973
Figures represent the predicted probability of registered voters saying they voted as the identification requirement varies from stating one’s name to providing photo identification or an affidavit , with all other variables held constant. Data source: U.S. Census Bureau, Current Population Survey, Voting and Registration Supplement, November 2004.
Taking into account that signature matches were not a predictor of turnout, the differences in
predicted probability decline from stating one’s name to providing a photo identification or
affidavit. Voters in states that required photo identification were 2.7 percent less likely to vote
than voters in states where individuals had to give their names.30 In terms of the minimum
requirement, voters in states that required an affidavit at minimum were 4 percent less likely to
turn out than voters in states where they had to give their names.
The differences were more pronounced for those with fewer years of education. Constraining
the model to show predicted probabilities only for those with less than a high school diploma,
the probability of voting was 5.1 percent lower in states that required photo identification as the
maximum requirement and 7 percent lower in states that required an affidavit as the minimum
29 In the case of dichotomous independent variables, holding them at their mean amounted to holding them at the percentage of the sample that was coded 1 for the variable (Long 1997). 30 The voter turnout percentages may seem disproportionately high compared to the turnout rates reported in the aggregate data analysis. It is important to consider that the turnout rates in the aggregate data were a proportion of all citizens of voting-age population, while the turnout rates for the individual-level data are the proportion of only registered voters who said they voted.

29
requirement compared to states where stating one’s name was the maximum or minimum
requirement.
Race and ethnicity have generated particular interest in the debate over voter ID
requirements.31 The analysis using the aggregate data shed no light on the association
between voter ID requirements and turnout for African-American and Hispanic voters. But in the
models using the individual data, some significant relationships emerged for African-American,
Hispanic and Asian citizens. For the entire population, the signature, non-photo identification
and photo identification requirements all were associated with lower turnout compared to the
requirement that voters simply state their names. These correlations translated into reduced
probabilities of voting of about 3 to 4 percent for the entire sample, with larger differences for
specific subgroups. For example, the predicted probability that Hispanics would vote in states
that required non-photo identification was about 10 percentage points lower than in states
where Hispanic voters gave their names. The difference was about 6 percent for African-
Americans and Asian-Americans, and about 2 percent for white voters.
The model also showed that Hispanic voters were less likely to vote in states that required non-
photo identification as opposed to stating one’s name. Hispanic voters were 10 percent less
likely to vote in non-photo identification states compared to states where voters only had to give
their name.
More rigorous voter identification requirements were associated with lower turnout rates for
Asian-American voters as well. Asian-American voters were 8.5 percent less likely to vote in
states that required non-photo identification compared to states that require voters to state their
names under the maximum requirements, and they were 6.1 percent less likely to vote where
non-photo identification was the minimum requirement.
Conclusions of the Statistical Analysis
The statistical analysis found that, as voter identification requirements vary, voter turnout varies
as well. This finding emerged from both the aggregate data and the individual-level data,
31 Incorporating discrete variables for Hispanics, African-Americans, and Asian-Americans into one model carries the implicit assumption that the remaining variables, including education and income, will influence each of these groups in a similar manner in terms of deciding whether to vote. These assumptions are not always born out by the data (see Leighley and Vedlitz, 1999.) To isolate the effects of voter identification and other variables on voter turnout within specific racial and ethnic groups, the sample is divided into sub-samples and the model re-run to calculate the data discussed and shown in Tables 5, 6, and 7 in Appendix C.

30
although not always for both the maximum and minimum sets of requirements. The overall
relationship between ID requirements and turnout for all registered voters was fairly small, but
still statistically significant.
In the aggregate data, the match-signature requirement and the provide-a-non-photo ID
requirement were correlated with lower turnout compared to requiring that voters state their
names. But the photo-ID requirement did not have an effect that was statistically significant,
possibly because in 2004 each state requiring a photo-ID provided an alternative way to cast a
regular ballot for voters who lacked that document.
In the model using the individual-level data the signature, non-photo ID, and photo ID
requirements were all correlated with lower turnout compared to the requirement that voters
simply state their names (in the entire sample and for white voters, but the statistical
significance may be an artifact of the very large sample size). That the non-photo identification
requirement was the most consistent in terms of statistical significance across the groups is
intriguing given the intense debates surrounding photo identification requirements.
Significant questions about the relationship between voter identification requirements and
turnout remain unanswered. The data examined in the statistical analysis could not capture the
dynamics of how identification requirements might lower turnout, nor could they rule out that
other attributes of a state’s electoral system might explain the statistically significant correlations
that the study found. If ID requirements dampen turnout, is it because individuals are aware of
the requirements and stay away from the polls because they cannot or do not want to meet the
requirements? Or, do the requirements result in some voters being turned away when they
cannot meet the requirements on Election Day , or forced to cast a provisional ballot that is not
ultimately counted? The CPS data do not include measures that can answer this question.
Knowing more about the “on the ground” experiences of voters concerning identification
requirements could guide policy-makers at the state and local level in determining whether and
at what point in the electoral cycle a concerted public information campaign might be most
effective in helping voters to meet identification requirements. Such knowledge also could help
in designing training for election judges to handle questions about, and potential disputes over,
voter identification requirements.
31
Litigation Over Voter ID Requirements A handful of cases have challenged identification requirements in court in recent years. In general,
requirements that voters provide some identifying documentation have been upheld, where photo ID
is not the only acceptable form. Whether laws requiring photo ID will be upheld is more doubtful.
To date, only two cases have considered laws requiring voters to show photo ID (Common Cause v.
Billups and Indiana Democratic Party v. Rokita).. Cases challenging the mandatory disclosure of
voters’ Social Security numbers on privacy grounds have yielded mixed results.
Non-photo identification. For the most part, courts have looked favorably on requirements
that voters present some form of identifying documents if the photo identification is not the
only form accepted. In Colorado Common Cause v. Davidson, No. 04CV7709, 2004 WL
2360485, at *1 (Colo. Dist. Ct. Oct. 18, 2004), plaintiffs challenged a law requiring all in-
person voters to show identification (not just first-time registrants). The court upheld this
requirement against a constitutional challenge. Similarly, in League of Women Voters v.
Blackwell, 340 F. Supp. 2d 823 (N.D. Ohio 2004), the court rejected a challenge to an
Ohio directive requiring first-time voters who registered by mail to provide one of the
HAVA-permitted forms of identification, in order to have their provisional ballots counted.
Specifically, the directive provided that their provisional ballots would be counted if the
voter (a) orally recited his driver’s license number or the last four digits of his social
security number or (b) returned to the polling place before it closed with some
acceptable identification (including reciting those identification numbers). Id. This was
found to be consistent with HAVA.
Photo ID. Since the 2004 election, two states have adopted laws requiring photo
identification at the polls in order to have one’s vote counted, without an affidavit exception:
Georgia and Indiana.32 Both these requirements were enacted in 2005 and both have been
challenged in court. The Georgia law required voters attempting to cast a ballot in person
present a valid form of photographic identification. O.C.G.A. § 21-2-417. On October
18, 2005, the District Court granted the plaintiffs’ motion for a preliminary injunction,
enjoining the application of the new identification requirements on constitutional grounds.
In granting the injunction, the court held that plaintiffs’ claims under both the Fourteenth
Amendment (equal protection) and Twenty-Fourth Amendment (poll tax) had a
32 Indiana’s law does allow voters without ID to cast provisional ballots, and then to appear before the county board of elections to execute an affidavit saying that they are indigent and unable to obtain the requisite ID without payment of a fee. But in contrast to other states, voters cannot cast a ballot that will be counted by submitting an affidavit at the polls, affirming that they are the registered voter and are otherwise eligible to vote.

32
substantial likelihood of succeeding on the merits at trial (Common Cause v. Billups,
Prelim. Inj. 96, 104). In January 2006, Georgia enacted a modified version of its photo
ID law, which the court has not yet ruled on. In the other state that has enacted a photo
ID requirement (Indiana), legal challenges have also been filed. (Indiana Democratic
Party v. Rokita and Crawford v. Marion County Election Board). On April 14, 2006, the
district court granted defendants’ motion for summary judgment, concluding that plaintiffs
had failed to produce evidence showing that the state’s ID law would have an adverse
impact on voters. Another case of significance, for purposes of photo ID requirements,
is American Civil Liberties Union of Minnesota v. Kiffmeyer, No. 04-CV-4653, 2004 WL
2428690, at *1 (D. Minn. Oct. 28, 2004). In that case, the court enjoined a Minnesota
law that allowed the use of tribal photo ID cards, only for an Indian who lived on the
reservation. 2004 WL 2428690, at *1. The Court found no rational basis for
distinguishing based on whether or not the cardholder lives on the reservation. Id. at *1,
3. These decisions indicate that courts are likely to carefully scrutinize the evidence
regarding the impact of photo ID requirements.
Privacy. In Greidinger v. Davis, 988 F.2d 1344 (4th Cir. 1993), the court struck down on
due process grounds a Virginia law requiring disclosure of voters’ social security
numbers for voter registration. The social security numbers recorded in voter registration
lists had been disclosed to the public and political parties that had requested the lists.
The court found that the requirement to give the social security number effectively
conditioned rights on the consent to an invasion of privacy. It concluded that this public
disclosure of the social security numbers was not necessary to achieve the
government’s interest in preventing fraud. On the other hand, in McKay v. Thompson,
226 F.3d 752 (6th Cir. 2000), the court rejected privacy challenges based on both the
Constitution and federal statutes, to a Tennessee law requiring social security numbers
for voter registration since 1972. 226 F.3d at 755. Second, the NVRA only permits
requiring the minimum amount of information necessary to prevent duplicate voter
registration and to determine eligibility. The distinction appears to be between the use of
Social Security numbers for internal purposes only, which was deemed permissible, and
the disclosure of those numbers to the public which was not.
These decisions suggest that the courts will carefully scrutinize the evidence, where states
require that voters produce a photo ID in order to cast a regular ballot. The courts have used a
33
balancing test to weigh the legitimate interest in preventing election fraud against the citizen’s
right to privacy (protecting social security numbers from public disclosure, for example) and the
reasonableness of requirements for identity documents. To provide both the clarity and certainty
in administration of elections needed to forestall destabilizing challenges to outcomes, these
early decisions suggest that best practice may be to limit requirements for voter identification to
the minimum needed to prevent duplicate registration and ensure eligibility.
Developments since 2004 Since the passage of HAVA, with its limited requirements for voter identification, and following
the 2004 election, debate over voter ID has taken place in state legislatures across the country.
That debate has not been characterized by solid information on the consequences of tightening
requirements for voters to identify themselves before being permitted to cast a regular, rather
than a provisional, ballot.
Better information might improve the quality of the debate. Answers to the following key
questions are not available in a form that might satisfy those on both sides of the argument.
• What is the overall incidence of vote fraud?
• How does fraud take place in the various stage of the process: registration, voting at the
polls, absentee voting, or ballot counting?
• What contribution can tighter requirements for voter ID make to reducing vote fraud?
• What would be the other consequences of increasingly demanding requirements for
voters to identify themselves? This is the question addressed, within the limits of the
available data, in the analysis in this report.
Answering these questions would provide the information needed for more informed judgement
in the states as they consider the tradeoffs among the competing goals of ballot integrity, ballot
access, and administrative efficiency. The Carter-Baker Commission recognized the tradeoffs
when it tied recommendation for national ID to an affirmative effort by government to identify
unregistered voters and make it easy for them to register.
State Voter Databases and Voter ID
With the implementation of the HAVA Computerized Statewide Voter Registration List, an
application for voter registration for an election for Federal office may not be accepted or
processed unless the application includes a driver’s license number or last four digits of the

34
Social Security number on the voter registration form. This information can be used to verify the
identity of the registrant through interfacing with lists maintained by the Motor Vehicle office and
Social Security office. If registrants do not have either a driver’s license or Social Security
number, the State will assign a unique identifier number to that person.
Some states are wrestling now with these unresolved issues. In New Jersey, for example,
pending legislation would require that voters must be able to confirm their registration through a
secure access to the Statewide Voter Registration List. It also requires voters to present ID at
the polls in order to cast a regular ballot if the numbers recorded on the registration have not
been verified (or if no verifiable number appears on the registration). It recognizes the HAVA
requirement that if the number provided by the voter has not been verified and if the voter does
not present ID at the polls, that voter may cast a provisional ballot. The bill does not specify they
have to provide ID within 48 hours in order for their vote to count, as is the case with first-time
mail-in registrants.
As some states gain experience in this area, the EAC would perform a useful service by making
timely recommendations of best practices for all states to consider.
Conclusions The analysis of voter ID requirements is complex. It takes into account important values
associated with an electoral process, such as ballot access and integrity. The continuing effort
to understand how voter ID requirements may affect turnout and the integrity of the ballot could
benefit from additional factual information, including statistical analyses. Our research includes
a statistical study of this kind. It indicated that the level of voter turnout in a state is correlated
with the stringency of the voter ID requirement imposed by that state. Additional empirical
research of this nature, with additional data collected by or for the EAC, would further illuminate
the relationship between stricter voter ID rules and turnout, perhaps explaining if awareness of a
strict ID requirement tends to discourage would-be voters from going to the polls. Or, additional
research may shed light on whether, if voters did go to the polls, stricter Voter ID requirements
will divert more voters into the line for provisional ballots. The consequence of increased
reliance on provisional ballots can be longer lines at the polls and confusion, without
necessarily a clear demonstration that the security of the ballot is correspondingly increased. 33
33 In this connection, the Brennan Center’s response to the Carter-Baker Commission report observes that, “while it might be true that in a close election “a small amount of fraud could make the margin of
35
The debate over voter ID in the states would be improved by additional research sponsored by
the EAC. That might include longitudinal studies of jurisdictions that have changed voter ID
requirements, as well as precinct-level analyses that would allow more finely tuned assessment
of the correlation between stricter identification requirements and turnouts. Further research
could also identify methods to eliminate the need for voters to bring specific identity documents
with them to the polls, while assuring that each voter who casts a ballot is eligible and votes only
once.
difference,” it is equally true that the rejection of a much larger number of eligible voters could make a much bigger difference in the outcome.” Response to the Report of the 2005 Commission on Federal Election Reform, The Brennan Center for Justice at NYU School of Law and Spencer Overton, On Behalf Of The National Network on State Election Reform, September 19, 2005