Embed Size (px)
Citation preview

Report to the Congress onthe Office of Minorityand Women Inclusion
March 2018
B O A R D O F G O V E R N O R S O F T H E F E D E R A L R E S E R V E S Y S T E M


Report to the Congress onthe Office of Minorityand Women Inclusion
March 2018
B O A R D O F G O V E R N O R S O F T H E F E D E R A L R E S E R V E S Y S T E M

This and other Federal Reserve Board reports and publications are available online at
www.federalreserve.gov/publications/default.htm.
To order copies of Federal Reserve Board publications offered in print,
see the Board’s Publication Order Form (www.federalreserve.gov/files/orderform.pdf)
or contact:
Printing and Fulfillment
Mail Stop K1-120
Board of Governors of the Federal Reserve System
Washington, DC 20551
(ph) 202-452-3245
(fax) 202-728-5886
(email) [email protected]
Preface: Implementing the Dodd-Frank Act
The Board of Governors of the Federal Reserve
System (Board) is responsible for implementing
numerous provisions of the Dodd-Frank Wall Street
Reform and Consumer Protection Act (Dodd-Frank
Act) of 2010. The Dodd-Frank Act requires, among
other things, that the Board produce reports to Con-
gress on a number of topics.
The Board maintains a Regulatory Reform website,
which provides an overview of regulatory reform
efforts implementing the Dodd-Frank Act and a list
of the implementation initiatives completed by the
Board as well as the most significant initiatives
the Board expects to address in the future. See
www.federalreserve.gov/reform.htm for the latest
information.
iii

Overview ..................................................................................................................................... 1
About the Federal Reserve .......................................................................................................... 1
Office of Diversity and Inclusion and Office of Minority and Women Inclusion ................................. 1
About This Report ....................................................................................................................... 2
Equal Employment of Minorities and Women and Diversity andInclusion at the Board ............................................................................................................ 3
Equal Employment Opportunity ................................................................................................... 3
Diversity and Inclusion at the Board ............................................................................................. 7
Successes .................................................................................................................................. 8
Challenges and Next Steps ....................................................................................................... 11
Inclusion of Minority-Owned and Women-Owned Businesses ............................. 13
Contracts Awarded to M/WOBs ................................................................................................. 13
Contract Payments to M/WOBs ................................................................................................. 16
Successes ................................................................................................................................ 16
Next Steps ............................................................................................................................... 19
Financial Literacy Activities ............................................................................................... 21
Diversity Policies and Practices of Regulated Entities .............................................. 23
Aggregated Assessment Results ............................................................................................... 23
Appendix A: EEO-1 Report for the Board of Governors of theFederal Reserve System for Calendar-Year 2017 ......................................................... 25
Appendix B: Contract Payments to Minority and Women-OwnedBusinesses by the Federal Reserve Board and Federal Reserve Banksfor Calendar-Years 2016 and 2017 ................................................................................... 27
v
Contents


Equal Employment of Minorities and Women and Diversity andInclusion at the Board ............................................................................................................ 3
Table 1. Federal Reserve Board reported total workforce demographics, 2016 and 2017 ................ 4
Table 2. Federal Reserve Board workforce profile 2017, selected data ........................................... 4
Table 3. Federal Reserve Board hiring statistics, 2017 ................................................................... 5
Table 4. Federal Reserve Board hires in major job families, 2017 ................................................... 9
Inclusion of Minority-Owned and Women-Owned Businesses ............................. 13
Table 5. Contract awards to minority- or women-owned businesses, 2013–17 ............................. 14
Table 6. Contract payments to minority- and women-owned businesses, 2013–17 ....................... 16
Figure 1. Percentage of total awards by demographic group, 2015–17 ......................................... 15
Figure 2. Contracts awarded by summary account, 2017 ............................................................ 15
Financial Literacy Activities ............................................................................................... 21
Table 7. Math x Economics program attendee distribution, 2017 ................................................. 21
Diversity Policies and Practices of Regulated Entities .............................................. 23
Table 8. Number of regulated entity self-assessment submissions, by institution category ............ 23
Appendix A: EEO-1 Report for the Board of Governors of theFederal Reserve System for Calendar-Year 2017 ......................................................... 25
Employer Information Report EEO-1 .......................................................................................... 25
Appendix B: Contract Payments to Minority and Women-OwnedBusinesses by the Federal Reserve Board and Federal Reserve Banksfor Calendar-Years 2016 and 2017 ................................................................................... 27
Federal Reserve System payments to minority- and women-owned businesses, 2016 and
2017 ................................................................................................................................ 27
vii
Tables and Figures


Overview
The Board of Governors of the Federal Reserve
System (Board) is committed to fostering an inclu-
sive workplace and diverse workforce as well as to
fostering diversity in our procurement practices and
at the institutions we regulate. The Board believes
that diverse perspectives inspire the best ideas, deci-
sionmaking, and—ultimately—service to the public.
We continue to work toward increasing diversity and
inclusion at all levels of the Board; promoting fair
inclusion and utilization of minority- and women-
owned businesses in the Board’s procurement pro-
cess; and promoting transparency and awareness of
diversity policies and practices at regulated
institutions.
About the Federal Reserve
The Federal Reserve System is the central bank of
the United States. It performs five general functions
to promote the effective operation of the U.S.
economy and, more generally, the public interest:
• Conducts the nation’s monetary policy to promote
maximum employment, stable prices, and moder-
ate long-term interest rates in the U.S. economy.
• Promotes the stability of the financial system and
seeks to minimize and contain systemic risks
through active monitoring and engagement in the
U.S. and abroad.
• Promotes the safety and soundness of individual
financial institutions and monitors their impact on
the financial system as a whole.
• Fosters payment and settlement system safety and
efficiency through services to the banking industry
and the U.S. government that facilitate U.S.-dollar
transactions and payments.
• Promotes consumer protection and community
development through consumer-focused supervi-
sion and examination, research and analysis of
emerging consumer issues and trends, community
economic development activities, and the adminis-
tration of consumer laws and regulations.
The Board in Washington, D.C., is the governing
body of the Federal Reserve System. The Board
oversees the operations of the 12 Reserve Banks and
shares with them the responsibility for supervising
and regulating certain financial institutions and
activities. (For more information about the Board
and the System, see Federal Reserve System Purposes
& Functions at www.federalreserve.gov/aboutthefed/
pf.htm.)
Office of Diversity and Inclusionand Office of Minority andWomen Inclusion
The Board established its Office of Diversity and
Inclusion (ODI) in January 2011 to promote diver-
sity and inclusion throughout the agency and in the
financial services industry. ODI administers and
directs the Board’s Equal Employment Opportunity
(EEO) compliance policies and programs and
includes the Office of Minority and Women Inclu-
sion (OMWI). ODI works to assess the Board’s
diversity policies, programs, and performance to
determine progress and increase transparency. ODI’s
ongoing efforts to foster an informed dialogue on
diversity best practices include participation in Equal
Employment Opportunity Commission (EEOC)
technical workshops, attendance at conferences and
events held by professional organizations, and par-
ticipation in financial industry groups addressing
diversity issues.
The OMWI, created pursuant to section 342 of the
Dodd-Frank Wall Street Reform and Consumer Pro-
tection Act (Dodd-Frank Act), develops standards,
procedures, and initiatives to ensure fair inclusion of
minorities, women, and minority-owned and women-
owned businesses in all activities of the Board,
1
including workforce diversity, procurement, and
assessment of diversity policies and practices of
regulated entities. Sheila Clark is the director of both
ODI and OMWI at the Board.
More information about diversity and inclusion at
the Federal Reserve Board, including the Board’s
current Diversity and Inclusion Strategic Plan, is
available at www.federalreserve.gov/aboutthefed/
diversityinclusion.htm.
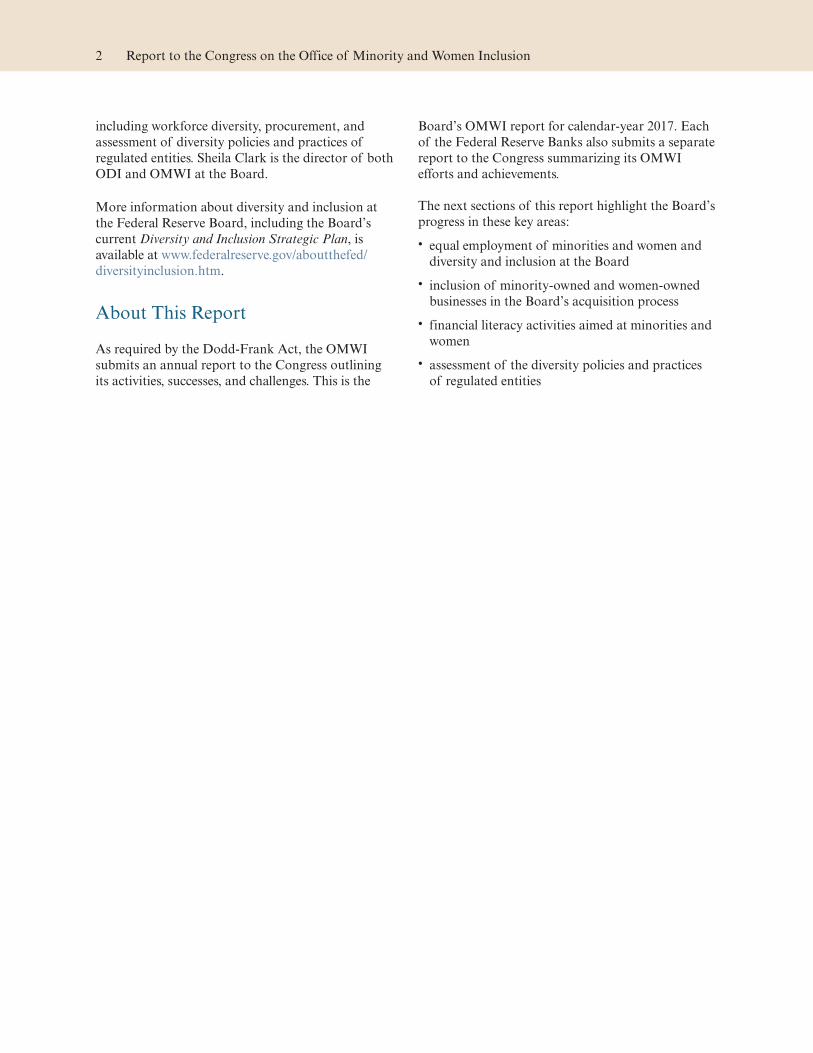
About This Report
As required by the Dodd-Frank Act, the OMWI
submits an annual report to the Congress outlining
its activities, successes, and challenges. This is the
Board’s OMWI report for calendar-year 2017. Each
of the Federal Reserve Banks also submits a separate
report to the Congress summarizing its OMWI
efforts and achievements.
The next sections of this report highlight the Board’s
progress in these key areas:
• equal employment of minorities and women and
diversity and inclusion at the Board
• inclusion of minority-owned and women-owned
businesses in the Board’s acquisition process
• financial literacy activities aimed at minorities and
women
• assessment of the diversity policies and practices
of regulated entities
2 Report to the Congress on the Office of Minority and Women Inclusion

Equal Employment of Minorities and Womenand Diversity and Inclusion at the Board
The Board is committed to equal employment
opportunity in all aspects of employment, and to
fostering diversity and inclusion in the workplace. In
support of this commitment, the Board has in place
strategic objectives to attract, hire, develop, promote,
and retain a highly skilled and diverse workforce.1
The Board also allocates significant resources to
ensure the success of its EEO and diversity and
inclusion initiatives, which help enable the Board to
compete with other federal agencies and the private
sector for talented individuals.
Equal Employment Opportunity
Section 342 of the Dodd-Frank Act charged the
Board of Governors with responsibility for develop-
ing internal standards for equal employment oppor-
tunity and the racial, ethnic, and gender diversity in
the workforce and senior management of the agency.
The EEO and Diversity Standards were adopted in
October 2016 and are posted on the Board’s website
at www.federalreserve.gov/aboutthefed/
diversityinclusion.htm.
The standards for equal employment opportunity at
the Board are aligned with the EEOC’s Management
Directive 715 and Management Directive 110, the
Notification and Federal Employee Anti-
discrimination and Retaliation Act (No FEAR Act)
of 2002, and the Board’s Rules Regarding Equal
Opportunity (12 CFR part 268). Each of these is
summarized below.
1. Management Directive 715 (MD-715) contains
policy guidance and standards for establishing
and maintaining an effective affirmative program
for EEO.
2. Management Directive 110 contains procedures
that must be followed when processing com-
plaints of discrimination filed by federal employ-
ees and by applicants for federal employment
alleging employment discrimination.
3. The No FEAR Act improves accountability for
antidiscrimination and whistleblower protection.
The Office of Personnel Management has imple-
mented rules regarding the reporting and training
requirements under the No FEAR Act.
4. The Board’s Rules Regarding Equal Opportunity
set forth the requirements and procedures relat-
ing to the Board’s policies to promote equal
opportunity.
In order to implement its EEO Program according to
these standards, the Board strives to meet the
“Essential Elements of a Model EEO Program” as
prescribed in MD-715 and the Governmentwide
Diversity and Inclusion Strategic Plan 2016 issued by
the Office of Personnel Management and mandated
by Presidential Executive Order 13583 issued in
2011. The Board uses the elements of MD-715 as the
primary metric to assess the effectiveness of its EEO
and diversity programs, policies, and initiatives.
ODI annually reviews workforce data, policies, prac-
tices, and programs to identify enhancements and
challenges for equal employment opportunity while
ensuring that the Board is free of discrimination,
harassment, retaliation, or reprisal. In-depth analysis
of workforce data equips Board leaders with the
information required to create effective changes sup-
porting the fulfillment of the Board’s EEO and
diversity initiatives. Therefore, ODI commits to
developing and using data-driven strategies and
forward-thinking diversity and inclusion concepts,
models, and theories to leverage the EEO and diver-
sity programs. To ensure the Board is aware of inno-
vative developments and practices, ODI consults
with leading national professional and research orga-
nizations such as the Society for Human Resource
Management, the Federal Interagency Diversity
Partnership, Mercer Diversity and Inclusion/U.S.
Workforce Opportunity Network, the Conference
Board, and the Institute for Corporate Productivity.
1 See the Board’s Strategic Plan 2016–19 at www.federalreserve.gov/publications/gpra/files/2016-2019-gpra-strategic-plan.pdf.
3

Information obtained from these resources enables
ODI to provide input to management around lead-
ing practices and benchmarking against diversity and
inclusion programs and activities.
In compliance with the No FEAR Act, all new hires
in 2017 were required to complete No FEAR Act
training within 60 days of beginning their employ-
ment. The No FEAR Act training includes modules
on diversity and inclusion, discrimination-free work-
place, workplace harassment, lawful hiring, and dis-
ability discrimination and accommodation. In 2018,
the Board will augment the No FEAR Act training
with education and skills training consisting of web-
based and classroom formats focusing on diversity,
workplace inclusion, civil treatment, harassment and
discrimination, equal employment opportunity,
unconscious bias, and inclusive leadership.
ODI prepares and submits federally mandated EEO
and diversity reports on behalf of the Board, includ-
ing the Annual EEO Plan and Program Status
Report required by EEOC Management Directive
715; the Annual Federal EEO Statistical Report on
Discrimination Complaints (EEOC Form 462); and
the Annual No Fear Act Report to Congress. The
Board also submits its EEO-1 Report, which is pub-
lished at www.federalreserve.gov/aboutthefed/
diversityinclusionrpt.htm. The Board’s 2017 EEO-1
Report is included in appendix A of this document.
Highlights of the Board’s 2016 and 2017 reported
total workforce demographics are shown in table 1.
The Board’s total workforce in 2017 was 43 percent
minority and 44 percent female. The Board reported
a decrease of 21 employees (-.08 percent) in the total
workforce for 2017, of which none were minorities.
The female workforce grew by 12, and is offset by a
decrease of 33 in the male workforce (net decrease of
21 in total workforce).
The Board’s EEO-1 Management categories are 1.1
Executive, Sr. Level Officers and Governors (grade
FR-00); 1.2 Sr. Level Managers (grades FR-28
through FR-31); and 1.3 1st/Mid. Level Managers.
Selected data for EEO-1 categories in 2017 are
shown in table 2, and the detailed Employer Infor-
mation Report EEO-1 is available in appendix A.
The percentage of minorities in the Executive, Sr.
Level category increased from 20 percent in 2016 to
21 percent in 2017. The percentage of minorities in
the Sr. Level Manager category decreased from
35 percent in 2016 to 33 percent in 2017. The minor-
ity representation in the 1st/Mid. Level Manager cat-
egory saw a decrease of 10 percentage points com-
pared to 2016, from 62 percent minority representa-
tion to 52 percent. The decrease at the 1st/Mid. Level
category is attributed to six personnel actions: three
retirements and the promotion of three 1st/Mid.
Level Managers to the Sr. Level Manager category.
The Board continuously reviews and assesses its
employment policies, procedures, and practices to
ensure EEO compliance and the full utilization of its
diverse and talented workforce. As examples, the
Board closely monitors applicant pool data; the pro-
grams in place to advance and promote employees as
well as those related to skill development, succession
planning, and compensation equity; and the pipeline
Table 2. Federal Reserve Board workforce profile 2017, selected data
Demographic
EEO-1 categories
Exec. Sr. Level Sr. Level Manager 1st/Mid. Level Manager Professionals Admin. Support
Workers Service Workers
Number Percent Number Percent Number Percent Number Percent Number Percent Number Percent
Male 136 59 157 57 47 54 1,005 54 18 17 119 79
Female 94 41 117 43 40 46 852 46 85 83 32 21
Non-minority 182 79 183 67 42 48 1,078 58 13 13 50 33
Minority 48 21 91 33 45 52 779 42 90 87 101 67
Total employees 230 – 274 – 87 – 1,857 – 103 – 151 –
Table 1. Federal Reserve Board reported total workforcedemographics, 2016 and 2017
Demographic 2016 2017 Change
(number)
Male 1,558 1,525 -33
Female 1,208 1,220 +12
Non-minority 1,584 1,563 -21
Minority 1,182 1,182 0
Total employees 2,766 2,745 -21
4 Report to the Congress on the Office of Minority and Women Inclusion

of personnel available for promotions. Results of the
Board’s assessments are considered when deciding
how to address issues and trends.
In addition to monitoring hiring and promotion, the
Board also monitors the retention of women and
minorities by job category, level, and grade. In the
event there are concerns about retention, ODI works
with management to address any issues.
Further, the Board utilizes the administrative-
complaint investigation process to identify trends in
the workplace that may adversely affect the Board’s
employees.
Recruitment and Retention
The Board recognizes that a work environment that
attracts and retains top talent is essential to fulfilling
its mission. ODI and the Board’s Talent Acquisition
and Organizational Development and Learning units
collaborate continuously to promote an excellent
quality of work life at the Board for all employees.
The Board takes several steps to ensure that minori-
ties and women are represented in the applicant and
candidate pools for hires and promotions. In 2017,
the Board filled 399 positions (see table 3). Eighty-
one percent of the positions, including 111 interns,
were filled externally. Forty-eight percent of all posi-
tions filled were in the Board’s five major job fami-
lies: attorney, computer professional, economist,
financial analyst, and research assistant. Among
external non-intern hires, 41 percent were minorities,
a decrease of 1 percentage point from the previous
year, and 46 percent were female, an increase of
3 percentage points from the previous year. Among
interns, 47 percent were minorities, down 2 percent-
age points from the previous year.
The Board utilized a variety of sources (see box 1) to
attract a diverse pool of well-qualified candidates to
fill positions. To complement the Board’s use of tra-
ditional recruitment sources such as job boards,
employee referrals, publications, search firms, and
career fairs, the Board continued to make significant
Table 3. Federal Reserve Board hiring statistics, 2017
Demographic
Internal hires External hires
(excluding Interns) Interns1
Total hires
Number Percent Number Percent Number Percent Number Percent
Male 40 52 114 54 61 55 215 54
Female 37 48 97 46 50 45 184 46
Non-minority 53 69 125 59 59 53 237 59
Minority 24 31 86 41 52 47 162 41
Total 77 – 211 – 111 – 399 –
Note: Includes all open positions filled in 2017.1 Interns are temporary employees.
Box 1. Federal Reserve Boardapplicant recruitment sources, 2017
• Board website (Careers page)
• Career fairs
• College recruiting
• Community outreach
• Employee referral
• Internal applicant
• Internet Job Board
• JOE (Job Openings for Economists)
• Professional associations
• Professor referral
• Rehire
• Reserve Bank
• Social media (Twitter)
• Temp/contractor
• USA Jobs website
March 2018 5
use of social media to attract diverse candidates,
including
• ongoing promotion of the Board’s open positions
on Twitter;
• contracting with LinkedIn to ensure all Board jobs
are posted on that site; and
• contracting with Diversity Advantage Network, a
service that disseminates the Board’s job postings
to a wide range of diversity and inclusion associa-
tions, schools, organizations, and job boards.
In addition, the Board targeted its career opportuni-
ties to several diversity groups on LinkedIn during
2017, including the following:
• African American groups: National Black MBA
Association, Black Enterprise Network, Black
Executives Network, National Society of Black
Engineers
• Hispanic groups: Prospanica, Hispanic Profession-
als, Latino Professionals, Society of Hispanic Pro-
fessional Engineers, Hispanic Alliance for Career
Enhancement, Association of Latino Professionals
for America
• Veterans groups: Disabled American Veterans, Jobs
for Vets, U.S. Military Veterans Network, Veterans
Hired, Wounded Warrior Project
• Disabled groups: Disability Advocates, Disabled
Resources – Support, DisABLEDperson, Inc.
• LGBTQA groups: Gay Business Network, LGBT
Networking, LGBT Friendly Professional Network
by OUTstanding
• Women’s groups: She Codes, Girls Who Code,
Society of Women Engineers, Women in Banking
and Finance
The Board attended three major diversity and inclu-
sion career fairs in 2017 as well:
• the Association of Latino Professionals for
America Career Fair & Expo
• the joint Prospanica/National Black MBA Asso-
ciation Conference & Career Exposition
• the Grace Hopper Celebration of Women in Com-
puting, the largest women in STEM careers fair in
the world
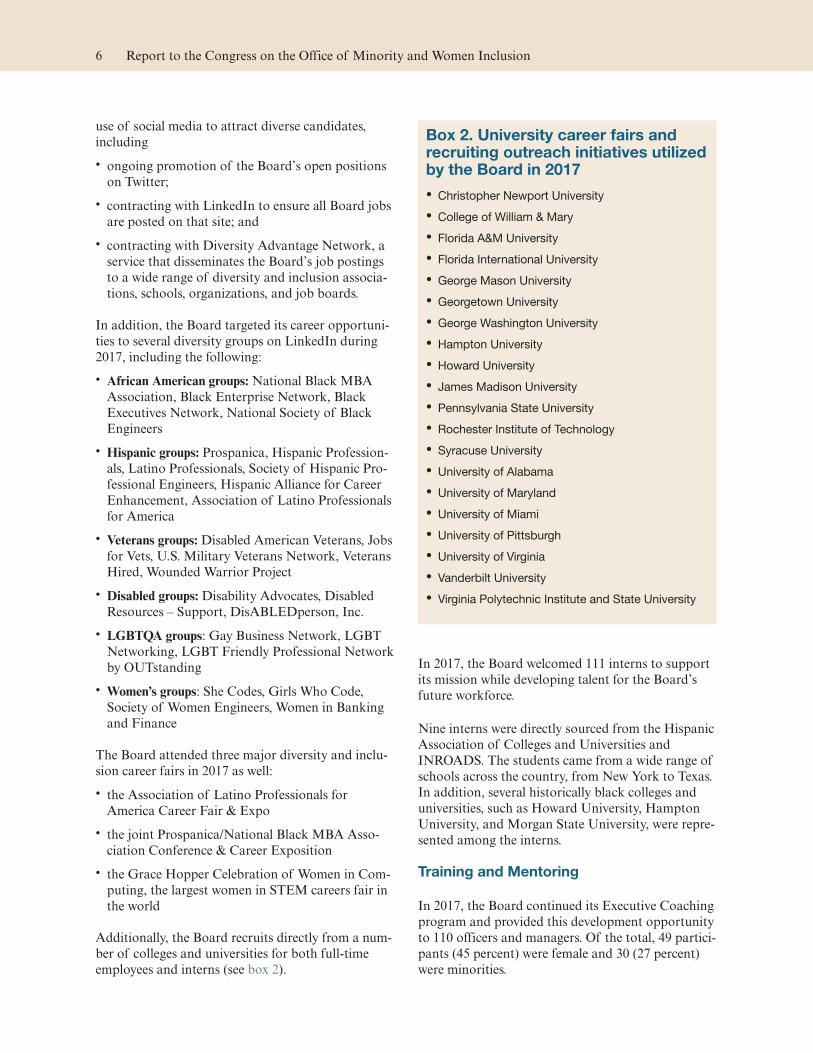
Additionally, the Board recruits directly from a num-
ber of colleges and universities for both full-time
employees and interns (see box 2).
In 2017, the Board welcomed 111 interns to support
its mission while developing talent for the Board’s
future workforce.
Nine interns were directly sourced from the Hispanic
Association of Colleges and Universities and
INROADS. The students came from a wide range of
schools across the country, from New York to Texas.
In addition, several historically black colleges and
universities, such as Howard University, Hampton
University, and Morgan State University, were repre-
sented among the interns.
Training and Mentoring
In 2017, the Board continued its Executive Coaching
program and provided this development opportunity
to 110 officers and managers. Of the total, 49 partici-
pants (45 percent) were female and 30 (27 percent)
were minorities.
Box 2. University career fairs andrecruiting outreach initiatives utilizedby the Board in 2017
• Christopher Newport University
• College of William & Mary
• Florida A&M University
• Florida International University
• George Mason University
• Georgetown University
• George Washington University
• Hampton University
• Howard University
• James Madison University
• Pennsylvania State University
• Rochester Institute of Technology
• Syracuse University
• University of Alabama
• University of Maryland
• University of Miami
• University of Pittsburgh
• University of Virginia
• Vanderbilt University
• Virginia Polytechnic Institute and State University
6 Report to the Congress on the Office of Minority and Women Inclusion

In addition, the Board had 16 employees attend the
System Leadership Initiative’s Thrive conference for
manager-level leaders. Of the total, 10 participants
(63 percent) were female and 3 (19 percent) were
minorities.
Manager Quick Start, an eight-module leadership
development program, was offered in 2017, with a
total enrollment of 17 managers. Five participants
(29 percent) were female and ten (59 percent) were
minorities. This program has received consistently
high ratings from participants for supporting their
development as leaders. Based on the success of
Manager Quick Start, the Board launched an Officer
Leadership Program in 2016 to provide additional
development opportunities for Board officers. The
first full cohort of the program was offered in 2017,
with a total enrollment of 20 officers. Of the total,
nine participants (45 percent) were female and three
(15 percent) were minorities. These efforts also sup-
port leadership development objectives outlined as
part of the “Workforce” Strategic Pillar in the
Board’s Strategic Plan 2016–19.
The Board also offered two sessions of Situational
Leadership in 2017. Of the 30 total participants, 13
officers and managers participated in this training
program. Of that total, 7 participants (54 percent)
were female and 10 participants (77 percent) were
minorities.
Additional courses supporting professional and lead-
ership development were provided to employees
through the Board’s core curriculum. Course offer-
ings focused on several key areas, including emo-
tional intelligence, career development, leading proj-
ect teams, giving and receiving feedback, interper-
sonal skills, and conflict resolution.
Course offerings that focused on unconscious bias
and generational differences were also offered
through the core curriculum to support the Board’s
diversity and inclusion efforts. In addition to the core
curriculum, the Board provided targeted training to
support division-specific initiatives related to diver-
sity and inclusion and employee engagement.
To ensure consistency and fairness in evaluating per-
formance, the Board maintains a performance
appraisal system supported by using standardized
competencies; training for managers and employees
about the process; workshops and resources for lead-
ers to ensure performance ratings are used consis-
tently; and an interactive website with tools, guides,
and video training modules to increase understand-
ing of the program.
As a result of feedback from the Board’s 2016
Engagement Survey, a Boardwide Mentoring Pro-
gram was launched to strengthen the Board’s inter-
nal talent pool and increase cross-divisional collabo-
ration. All Board employees may apply for the Men-
toring Program. In 2017, the Board hosted two
mentoring cohorts with a total of 34 mentor-mentee
pairs. Of the total number of mentees participating
in the program, 21 (62 percent) were female and 19
(56 percent) were minorities. Additional cohorts are
planned in the coming years.
Diversity and Inclusion at the Board
The Board recognizes that fostering diversity and
inclusion requires multiple, integrated, ongoing efforts.
In 2016, the Board published its Diversity and Inclu-
sion Strategic Plan 2016–19. The plan details specific
objectives and actions that are aligned with the
Board’s diversity and inclusion and EEO standards
in the areas of organizational commitment; work-
force diversity; workplace inclusion; supplier diver-
sity; and sustainability. In addition, the plan is a
companion document to the Board’s Strategic Plan
2016–19. Taken together, these plans will enable the
Board to successfully recruit, hire, promote, educate,
and retain a more diverse workforce as well as foster
a culture that encourages collaboration, flexibility,
transparency, and fairness—thus enabling individu-
als to participate to their full potential to make sig-
nificant contributions toward achieving and main-
taining a highly skilled and diverse workforce.
The Board recognizes that collaboration is key for
the leaders, stakeholders, and partners who are work-
ing toward enhancing diversity, building a culture
and climate of inclusion, and having a model EEO
program. With this is mind, the ODI director meets
with the Chairman of the Board, chief operating
officer, chief human capital officer, and senior lead-
ership to discuss priority issues related to EEO,
diversity, and inclusion.
In addition, to ensure the Board is supportive of the
needs of its workforce, the Board utilizes input from
its six Employee Resource Groups (ERGs): the Afri-
can American ERG; the Asian American Pacific
Islander ERG; the ERG for People with Disabilities;
the Hispanic ERG; the Lesbian, Gay, Bisexual,
March 2018 7
Transgender, Queer, and Allies ERG; and the Wom-
en’s ERG. The ERGs serve as a collective voice in
providing input to management around diversity and
inclusion programs and activities at the Board. In
2017, the ERGs held joint meetings to discuss affin-
ity awareness, best practices, and cross-collaboration;
updated their charters to align their missions, goals,
and objectives with the Board’s diversity and inclu-
sion framework; and developed operational plans
outlining activities focused on strengthening mem-
bership and delivering impactful events and
initiatives.
ODI assesses the effectiveness of the Board’s prog-
ress in accomplishing its strategic diversity and inclu-
sion goals through the collective evaluation of all
division Diversity and Inclusion Scorecards. The
scorecard is a template for measuring both progress
and results against the Board’s diversity and inclu-
sion standards. In 2017, enhancements were imple-
mented to the Diversity and Inclusion Scorecard
process, based on feedback solicited from the divi-
sions. In addition, the scorecard elements were
changed to better align with the Board’s diversity
and inclusion standards. Further, a primary standard
objective was set for each scorecard element to allow
for continuity across the divisions and to enable the
divisions to link their strategies and objectives to the
Diversity and Inclusion Strategic Plan objectives.
All divisions receive quarterly reports, which include
demographic data for the division’s current employ-
ees (by race, gender, and grade band) as well as a
snapshot of workforce transactions (hires, promo-
tions, and separations). These reports serve as a stan-
dard briefing with division management to discuss
departmental workforce trends and areas needing
specific attention. The divisions, in conjunction with
ODI, assess their reports and bridge the information
into scorecard actions. The quarterly reports and
ODI briefings, coupled with the divisions’ results
from the Board’s 2016 engagement survey, provide
both quantitative and qualitative information to help
divisions better address diversity and inclusion
issues.
Further, the Board has undertaken efforts to enhance
diversity and inclusion training among staff. In 2017,
for example, ODI finalized a basic ordering agree-
ment with leading consulting firms in the diversity
and inclusion field to provide consulting services and
training on diversity and inclusion program initia-
tives. This initiative will provide learning opportuni-
ties for all levels of Board employees on diversity and
inclusion. Also in 2017, the Board introduced a
training workshop for hiring managers called “Effec-
tively Hiring Top Talent without Bias.” The work-
shop provided hiring managers with strategies to
mitigate unconscious bias in the hiring process; high-
lighted effective interviewing techniques for evaluat-
ing candidates fairly and equitably; and covered what
questions legally may and may not be asked during
interviews. Based on the positive feedback from
attendees, the workshop will be offered again in 2018.
Successes
As detailed in earlier sections of this report, the
Board continued to enhance and strengthen its
efforts to promote diversity and inclusion among its
workforce. Successes for 2017 are highlighted below.
Diversity in Official Staff Pipeline and
Major Job Family Hires
The Board continues to increase pools for progres-
sion to official staff2 for minorities and women in
pipeline grades FR-27 through FR-31. Minorities in
the pipeline grades increased by 6 percent, from 411
in 2016 to 436 in 2017. Similarly, the percentage of
women in the official staff pipeline increased by
5 percent, from 474 in 2016 to 499 in 2017. In 2017,
there were 17 appointments to the official staff, of
which 6 (35 percent) were minorities and 10 (59 per-
cent) were women, an increase of 8 percentage points
and 18 percentage points from the previous year,
respectively.
The Board’s long-term and short-term outreach and
recruitment strategies continue to produce diverse
applicant pools for major job families. The number
of minorities hired into the attorney job family
increased 28 percentage points, from 18 percent in
2016 to 46 percent in 2017 (see table 4). The number
of minorities hired into the economist job family
increased 5 percentage points, from 25 percent in
2016 to 30 percent in 2017, and the number of
females hired into this category increased 22 percent-
age points, from 17 percent in 2016 to 39 percent in
2017. The computer professional job family also
experienced an increase in hires of minorities and
females: the number of minorities increased by
12 percentage points, from 45 percent in 2016 to
57 percent in 2017, and the number of females
2 Official staff is equivalent to Senior Executive Service (SES).
8 Report to the Congress on the Office of Minority and Women Inclusion

increased by 7 percentage points, from 39 percent in
2016 to 46 percent in 2017.
Leadership Commitment to Diversity
and Inclusion
Ensuring diversity and inclusion at the Board
requires a long-term, holistic approach that focuses
on doing the utmost to bring people in and provide
them paths for success, which in turn, requires hav-
ing an overall culture and organization that is very
focused on diversity and demonstrates its ongoing
commitment at all levels, starting with leadership.
Board leaders demonstrated their commitment
through a variety of means in 2017.
During the year, the Board advanced the Diversity
and Economic Inclusion Workgroup, which was
established in 2016 to update the Board on diversity
and inclusion issues and activities. The workgroup is
composed of the OMWI director, division directors,
senior staff, and Board members. The workgroup
met quarterly in 2017 to discuss progress on a range
of activities related to diversity and economic inclu-
sion, such as underrepresentation of minorities
among the official staff and continued research on
the lack of minorities and women in the economics
profession. The workgroup’s efforts are ongoing.
In addition, Chair Janet Yellen focused the spotlight
on diversity and inclusion: During National Wom-
en’s History Month (March 2017), she issued a state-
ment on the Board’s internal website reinforcing the
Board’s commitment to equal opportunity and
diversity of perspectives and ideas.
Also in 2017, ODI facilitated benchmarking sessions
with Board managers and officers to identify diver-
sity and inclusion leading practices related to leader-
ship engagement and sponsored a workshop on
inclusive leadership. Through ODI’s assessment of
the divisions’ Diversity and Inclusion Scorecard
actions, Board leaders also are adopting and imple-
menting many of the learned strategies to promote
diversity and inclusion in their divisions. For
example, divisions are discussing diversity and inclu-
sion topics at management meetings; sharing and
discussing their division’s scorecard with division
staff; providing unconscious bias training to staff;
and are exploring or have implemented a diversity
and inclusion competency in staff performance
plans.
Strategic Communication of Diversity
and Inclusion
In an effort to bring diversity and inclusion to the
forefront externally and internally, the Board used
multiple communication channels to disseminate
information about its diversity and inclusion strate-
gies and initiatives. The following are a few
examples:
• The Board’s Diversity and Inclusion Strategic Plan
2016–19 and its diversity and inclusion standards
were posted to the Diversity & Inclusion section of
the Board’s website (www.federalreserve.gov/
aboutthefed/diversityinclusion.htm) in order to
provide transparency to the public regarding the
Board’s diversity and inclusion initiatives and
practices, mission, vision, and framework.
• The ODI director was interviewed on the Board’s
“Employee Life News”—an internal video series
for all staff that highlights Board programs, events,
and other happenings—to provide an overview of
the Diversity and Inclusion Strategic Plan.
• The ODI director briefed Board division directors
on specific objectives and actions related to the
Diversity and Inclusion Strategic Plan and their
responsibilities for implementing the plan.
• Board divisions used diverse internal communica-
tion methods and channels, such as town halls,
intranet sites, podcasts, staff meetings, and discus-
sion groups to convey diversity and inclusion mes-
sages to employees.
Table 4. Federal Reserve Board hires in major job families, 2017
Demographic
Attorney Computer Prof. Economist Financial Analyst Research Assistant
Number Percent Number Percent Number Percent Number Percent Number Percent
Male 8 62 15 54 20 61 23 53 46 61
Female 5 38 13 46 13 39 20 47 30 39
Non-minority 7 54 12 43 23 70 32 74 53 70
Minority 6 46 16 57 10 30 11 26 23 30
Total 13 – 28 – 33 – 43 – 76 –
March 2018 9

• To promote awareness of the Board’s culture and
diversity and inclusion initiatives, all new employ-
ees were presented with information on the
Board’s Diversity and Inclusion Strategic Plan and
on the Employee Resource Groups during New
Employee Orientation.
Education and Training to Support
Diversity and Inclusion
To ensure that Board staff understand the complex-
ity of diversity and in order to effectively promote
inclusion and equity in a variety of contexts, the
Board in 2017 offered three diversity and inclusion
educational courses: “Unconscious Bias Awareness,”
“MicroTriggers,” and “Generational Translation.”
All staff were eligible to sign up for these formal
training sessions through FedLearn, the Board’s
online learning management system. In addition,
division leaders established opportunities for staff to
conduct informal discussions around diversity and
inclusion topics and issues in order to promote
diverse perspectives aimed at fostering a culture in
which a broad range of divergent views are
appreciated.
External Outreach and Recruitment
Activities Targeting Minority and
Women Economists
The Board undertook several significant outreach
and recruitment initiatives in 2017 to address diver-
sity in the economics profession.
First and foremost, the Board’s economics divisions
continue to collaborate on a variety of diversity and
inclusion initiatives to support and encourage
increased representation of women and minority
groups in the economics profession. These initiatives
involve partnerships with outside organizations—
such as the Hispanic Heritage Foundation, the Bank
of England, the European Central Bank, the Brook-
ings Institution, the National Economic Association,
and the American Society of Hispanic Econo-
mists—as well as System and internal efforts.
In 2017, the Board continued to collaborate with the
American Economic Association (AEA) to address
the state of diversity in the economics profession
through participation in the Summer Training and
Scholarship Program Conference and the Teaching
and Research in Economic Education Conference.
The Board supported the AEA Summer Training
Program, which aims to increase diversity in the eco-
nomics profession by preparing talented undergradu-
ates who are seriously considering PhD programs in
economics. More specifically, Board staff from the
economic research divisions presented to AEA Sum-
mer Program students about job opportunities for
research assistants and economists at the Board and
the Federal Reserve Banks. As a result of the Board’s
outreach and recruitment efforts in 2017, five AEA
Summer Program graduates were hired into full-time
research assistant positions at the Board.
The Board also organized and hosted a meeting with
senior staff at the Brookings Institution, a public
policy research organization, to discuss a variety of
issues related to diversity and inclusion, such as
inclusive leadership, cultural readiness and engage-
ment, recruitment, and career development. This
meeting provided thought leadership regarding
actions, initiatives, and strategies that senior Board
economics staff could undertake to improve diversity
within the economics field.
In addition, the Board continued its teaching and
mentoring partnership with Howard University’s
Department of Economics. Approximately 30 Board
economists were involved in the design of the Finan-
cial Literacy/R-Programming course offered through
Howard and taught by a Board economist. The goals
are to build critical skills and knowledge required for
postgraduate and professional success in the eco-
nomics field and establish mentoring relationships
between students and Board economists.
In an effort to build the national pipeline of minority
economists, the Board and the Federal Reserve
Banks have been collaborating on several recruiting
and outreach diversity initiatives. One such initiative
involved the development of a list of U.S. colleges
and universities that award the most undergraduate
degrees in economics to underrepresented minority
groups. The Board and the Reserve Banks will utilize
this resource for future recruitment of minority and
women research assistants and summer interns.
Additionally, the Board’s economics divisions have
established an Economics Divisions Diversity Coun-
cil. One of the committee’s high-priority objectives is
to address the issue of underrepresentation of
minorities and women in the economics profession.
And the economics divisions have expanded their
recruitment and outreach sources for research assis-
tant and economist job candidate applications in
order to increase diversity in the applicant pool.
They also require implicit-bias awareness training for
10 Report to the Congress on the Office of Minority and Women Inclusion
all staff involved in recruiting activities. This strategy
has resulted in a 5 percentage point increase in
minority economist hires, from 25 percent in 2016 to
30 percent in 2017.
Challenges and Next Steps
Addressing diversity within its workforce continues
to be a priority for the Board, and it faces several
ongoing challenges.
Increasing Hispanic Representation in
Board Workforce
Although the Board continues to work to address
the low representation of Hispanics in its workforce,
their overall participation rate remains at 5 percent.
To address workforce diversity and to further
improve Hispanic employment in its major job fami-
lies, the Board will continue to implement strategies
and actions outlined in the Diversity and Inclusion
Strategic Plan, which include strengthening existing
partnerships with external Hispanic organizations
and the Board’s Hispanic Employees Advisory
Committee.
In 2017, the Board employed four summer interns
sourced from the Hispanic Association of Colleges
and Universities. The Board also participated in two
career fairs in its efforts to recruit Hispanics—the
Association of Latino Professionals for America
Career Fair & Expo and the joint Prospanica/
National Black MBA Association Conference &
Career Exposition. In addition to continued collabo-
ration with these organizations, the Board main-
tained ongoing relationships with the Society of His-
panic Professional Engineers and the Hispanic Alli-
ance for Career Enhancement.
Additionally, to address the low representation of
African Americans and Hispanics in its economic
research assistant job family, the Board will continue
to explore new sources for summer intern research
assistants, including building partnerships with col-
leges and universities with significant minority stu-
dent enrollment and enhancing networking with and
outreach to professional economics organizations.
Increasing Minority Representation among
Official Staff
Although the Board has made progress in increasing
the representation of minorities in the pipeline to
official staff, it continues to explore ways to identify
talent for official staff positions. Targeted recruit-
ment strategies include the use of executive search
firms and expansion of outreach and recruitment
sources, which have resulted in a more diverse appli-
cant pool. The OMWI director participates in the
recruitment process and leadership development pro-
grams, as well as reviews and evaluates processes for
proposed official staff appointments.
Availability of Minority and Women
Economists
The availability of minority and female economists
in the national educational and professional pipeline
remains persistently low, which creates ongoing
recruitment challenges for the Board. Under the pur-
view of the AEA’s Committee on the Status of
Minority Groups in the Economics Profession, the
Board will continue to organize, oversee, and partici-
pate in the three programs intended to foster a long-
term strategy in the recruitment of minority econo-
mists: (1) the Summer Economics Fellows Program;
(2) the Summer Training Program; and (3) the Men-
toring Program. In order to identify potential
research candidates more often, the Board plans to
track and engage AEA summer program partici-
pants with the goal of converting eligible, high-
performing interns to research assistants.
The Board also continues to stimulate an interest in
economics and math among minorities and women
through its participation in financial literacy pro-
grams and educational partnerships with under-
served communities (see the “Financial Literacy
Activities” section for details).
March 2018 11


Inclusion of Minority-Owned andWomen-Owned Businesses
The Board’s commitment to supplier diversity has
grown extensively over the years. The Board has an
active Supplier Diversity Program, with detailed
policies and procedures aligned with the provisions
of section 342 of the Dodd Frank Act.
The Board is committed to fostering diversity in its
procurement process through the inclusion and utili-
zation of minority- and women-owned businesses
(M/WOBs) both regionally and nationally. The
Board recognizes the vital role that diverse businesses
play in contributing to the economic growth and
development of the communities they serve. Sup-
porting diverse businesses is an important business
objective of the Board and the Federal Reserve
System.
Throughout 2017, the Division of Financial Man-
agement’s Procurement team continued its efforts to
identify areas of opportunity for M/WOBs to par-
ticipate in the Board’s acquisition process. Procure-
ment also innovated, expanded, and modernized
almost all aspects of its business activities during the
year. In response to an overall Procurement review, a
revised organizational structure was put in place to
align Procurement staff with internal client divisions
in order to improve customer service and gain a bet-
ter understanding of divisions’ business and procure-
ment needs. Procurement also undertook a series of
business-process improvements to streamline acquisi-
tion processes. This included revising acquisition
policies and procedures to clarify processes, roles and
responsibilities, and expectations for client divisions
and the Procurement staff.
During 2017, Procurement enhanced the Board’s
Supplier Diversity Program in three key ways:
• Implemented an automatic covered company3 set-
aside by enhancing its Small and Disadvantaged
Business policy. In general, any acquisition for sup-
plies or services that has an anticipated dollar
value of at least $5,000, but not more than
$100,000, is reserved for covered companies and
may be sourced using the U.S. General Services
Administration’s Federal Business Opportunities
website (FedBizOpps.gov). In addition, Procure-
ment staff used FedBizOpps to conduct market
research, issue Requests for Information (RFI),
and post acquisitions that exceeded $100,000.
• Eliminated the requirement for Board divisions to
receive vendor quotes associated with market
research on a product. This significantly reduced
the risk that a particular vendor had an unfair
competitive advantage, and allowed more covered
companies to participate in a fair acquisition pro-
cess. This change also improved collaboration with
client divisions and resulted in more open
competition.
• Maintained a Tier 2 sourcing program with tar-
geted subcontracting goals. Contracts include sub-
contracting goals for covered companies based
upon the U.S. Small Business Administration’s
goals (see the “Tier 2 Program” section for more
details).
Contracts Awarded to M/WOBs
The Board is committed to working with, and sup-
porting, companies owned by minorities and women,
by creating business opportunities that enable them
to become profitable and sustainable enterprises. The
Board’s objective is to ensure that M/WOBs partici-
pate in the Board’s acquisition process and that these
3 Covered company means a firm qualified as a small businessconcern under the Small Business Act (15 USC 632) and regu-lations thereunder, including (1) business concerns that meetthe size eligibility standards set forth in 13 CFR 121; (2) small
business concerns owned and controlled by veterans or service-disabled veterans as defined by 15 USC 632(q); (3) qualifiedHUBZone small business concerns pursuant to 15 USC632(p) and 13 CFR 126; (4) socially and economically disad-vantaged small business concerns as defined by 15 USC 637and certified as such under 13 CFR 124; and (5) small businessconcerns owned and controlled by women as defined by 15USC 632(n).
13

diverse firms get the technical assistance they need to
be successful in the acquisition process.
During calendar-year 2017, the Board awarded
$156,986,687 worth of contracts for goods and ser-
vices.4 Of this total, $27,990,561, or 17.83 percent,
was awarded to M/WOBs, including $17,663,074, or
11.25 percent, to minority-owned businesses and
$10,327,487, or 6.58 percent, to non-minority
women-owned businesses. The percentage of con-
tract dollars awarded to minority-owned firms was
about the same as in 2016. In addition, women-
owned business contract dollars awarded decreased
slightly compared to 2016.
Five-Year Trend in Awards to Minority
Women-Owned Businesses,
Minority-Owned Businesses, and
Women-Owned Businesses
As the Board strives for continuous improvement in
supplier diversity, the Procurement team continued
to work with client divisions to develop new strate-
gies and strengthen existing initiatives to improve
understanding, outreach, and supplier diversity
results. The Board’s diversity spend over the last five
years (2013–17) demonstrates the progress it has
made with M/WOBs. Table 5 shows the amounts
and percentages of contract dollars awarded to
M/WOBs over the past five years.
Trends in Awards by Demographic Group
In addition to reporting the percentage of contract
dollars awarded to M/WOBs as required under sec-
tion 342 of the Dodd-Frank Act, in 2014 the Board
began tracking awards to M/WOBs by demographic
groups. Specifically, the Board tracks and reports
4 This report describes the contracts awarded by the Board forthe period January 1, 2017, through December 31, 2017, andincludes contracts for the Board’s Office of Inspector Generalas well as the Board’s currency program. The dollar amountshown represents the total obligated amount of the contractsrather than the actual amounts paid to contractors.
Table 5. Contract awards to minority- or women-owned businesses, 2013–17
Demographic
2017 2016 2015 2014 2013
Dollars Percent Dollars Percent Dollars Percent Dollars Percent Dollars Percent
By business type
Total awards, all businesses 156,986,687 100.00 155,189,977 100.00 214,867,580 100.00 190,643,728 100.00 158,196,516 100.00
Minority-owned1,2 17,663,074 11.25 17,671,644 11.39 24,128,891 11.23 14,122,354 7.41 6,806,841 4.30
Non-minority women-owned 10,327,487 6.58 12,693,869 8.18 13,332,172 6.20 16,340,738 8.57 11,520,842 7.28
Minority women-owned 0 0.00 0 0.00 0 0.00 0 0.00 2,670,032 1.69
Total minority-owned andwomen-owned2
27,990,561 17.83 30,365,514 19.57 37,461,063 17.43 30,463,092 15.98 20,997,715 13.27
By demographic group
American Indian or Alaska Native 102,261 0.07 0 0.00 0 0.00 0 0.00 n.d. n.d.
Asian American 8,913,998 5.68 6,476,066 4.17 7,428,282 3.46 5,728,722 3.00 n.d. n.d.
Black or African American 2,653,874 1.69 3,216,920 2.07 1,829,100 0.85 3,222,106 1.69 n.d. n.d.
Hispanic or Latino 5,482,823 3.49 5,455,102 3.52 13,065,762 6.08 4,506,404 2.36 n.d. n.d.
Native Hawaiian or otherPacific Islander 388,580 0.25 1,181,906 0.76 1,210,920 0.56 0 0.00 n.d. n.d.
Other minority3 121,538 0.08 1,341,650 0.02 594,826 0.28 665,120 0.35 n.d. n.d.
Note: Awards are contracts awarded between January 1 and December 31. “Percent” columns reflect the percentage of total contracts awarded for the calendar year.Components may not sum to totals and may not yield percentages shown because of rounding.1 “Minority-owned” for 2014–17 includes minority women-owned businesses.2 The term minority means an individual who falls within one or more of the following race and ethnic categories: Hispanic or Latino, Black or African American, Native
Hawaiian or other Pacific Islander, Asian, and American Indian or Alaska Native. The term minority-owned business means a business that meets the following criteria:(i) more than 50 percent of the ownership or control is held by one (1) or more minority individuals; and (ii) more than 50 percent of the net profit or loss accrues to one (1) ormore minority individuals. The term women-owned business means a business that meets the following criteria: (i) more than 50 percent of the ownership or control is heldby one (1) or more women; (ii) more than 50 percent of the net profit or loss accrues to one (1) or more women; and (iii) a significant percentage of senior managementpositions are held by women.
3 Other minority means those businesses designating “minority-owned” but not designating Asian American, Black American, Hispanic American, or Native American.
n.d. No data available.
Source: Oracle/MicroStrategy, 2013–17.
14 Report to the Congress on the Office of Minority and Women Inclusion
contracts awarded to Asian American, Black or Afri-
can American, Hispanic or Latino, American Indian
or Alaska Native, Native Hawaiian or other Pacific
Islanders, and other (nonspecific) minority-owned
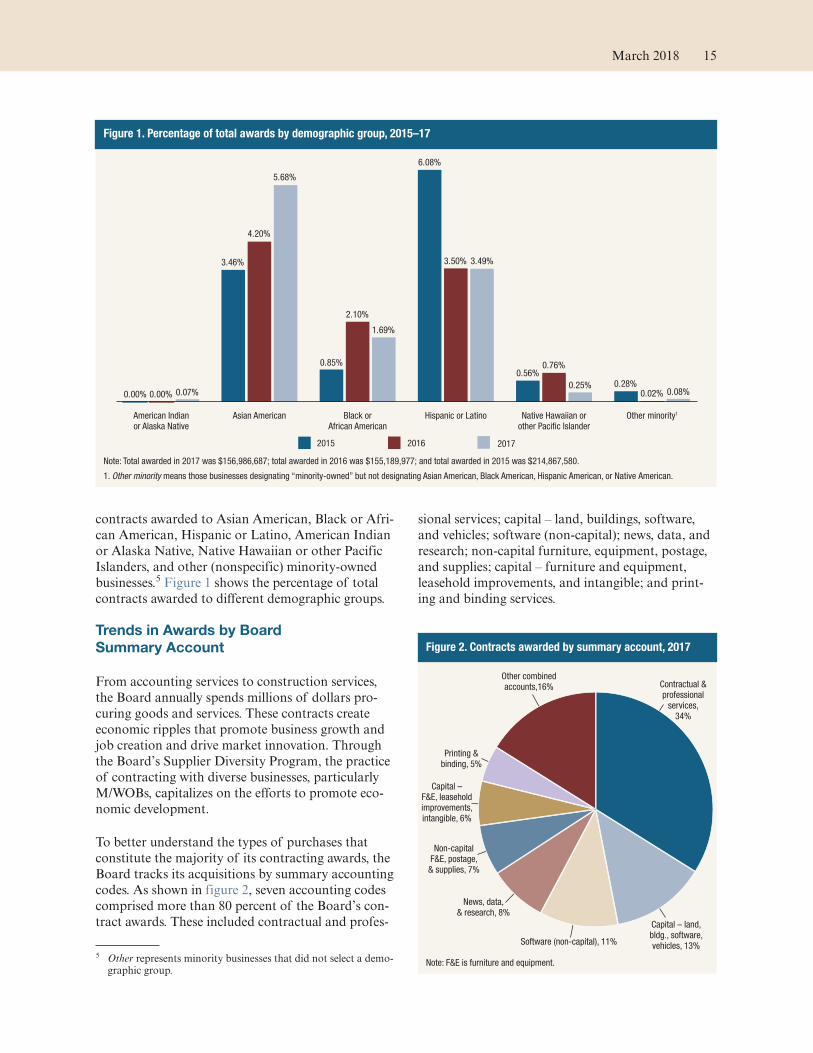
businesses.5 Figure 1 shows the percentage of total
contracts awarded to different demographic groups.
Trends in Awards by Board
Summary Account
From accounting services to construction services,
the Board annually spends millions of dollars pro-
curing goods and services. These contracts create
economic ripples that promote business growth and
job creation and drive market innovation. Through
the Board’s Supplier Diversity Program, the practice
of contracting with diverse businesses, particularly
M/WOBs, capitalizes on the efforts to promote eco-
nomic development.
To better understand the types of purchases that
constitute the majority of its contracting awards, the
Board tracks its acquisitions by summary accounting
codes. As shown in figure 2, seven accounting codes
comprised more than 80 percent of the Board’s con-
tract awards. These included contractual and profes-
sional services; capital – land, buildings, software,
and vehicles; software (non-capital); news, data, and
research; non-capital furniture, equipment, postage,
and supplies; capital – furniture and equipment,
leasehold improvements, and intangible; and print-
ing and binding services.
5 Other represents minority businesses that did not select a demo-graphic group.
Figure 1. Percentage of total awards by demographic group, 2015–17
201720162015
Other minority1Native Hawaiian or
other Pacific Islander
Hispanic or LatinoBlack or
African American
Asian AmericanAmerican Indian
or Alaska Native
0.07%0.00%0.00%
3.46%
5.68%
4.20%
1.69%
2.10%
0.85%
3.49%3.50%
6.08%
0.25%
0.76%0.56%
0.28%0.08%0.02%
Note: Total awarded in 2017 was $156,986,687; total awarded in 2016 was $155,189,977; and total awarded in 2015 was $214,867,580.
1. Other minority means those businesses designating “minority-owned” but not designating Asian American, Black American, Hispanic American, or Native American.
Figure 2. Contracts awarded by summary account, 2017
Printing &
binding, 5%
Other combined
accounts,16%
Capital –
F&E, leasehold
improvements,
intangible, 6%
Non-capital
F&E, postage,
& supplies, 7%
News, data,
& research, 8%
Software (non-capital), 11%
Capital – land,
bldg., software,
vehicles, 13%
Contractual &
professional
services,
34%
Note: F&E is furniture and equipment.
March 2018 15
Contract Payments to M/WOBs
Another way to gauge the Board’s progress with
M/WOBs is by examining annual payments to con-
tractors. This participation can be best measured
through “contract payments.” Contract payments
are the funds the Board pays to contractors for
goods and services provided. Performance of a con-
tract might not occur within the same year the con-
tract is awarded; thus, payments made during the
year in many instances are for goods or services pro-
vided under contracts awarded in a previous year. As
a result, a direct correlation between the dollar
amounts for contract payments and contract awards
in a given year cannot be made.
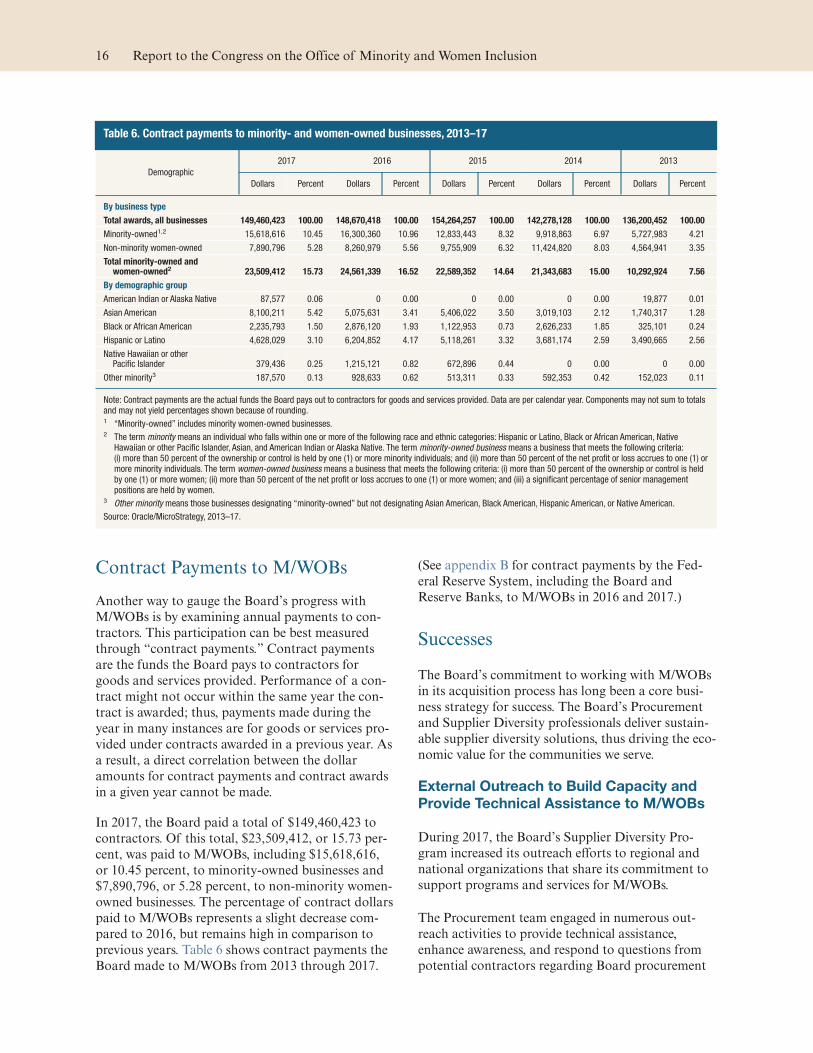
In 2017, the Board paid a total of $149,460,423 to
contractors. Of this total, $23,509,412, or 15.73 per-
cent, was paid to M/WOBs, including $15,618,616,
or 10.45 percent, to minority-owned businesses and
$7,890,796, or 5.28 percent, to non-minority women-
owned businesses. The percentage of contract dollars
paid to M/WOBs represents a slight decrease com-
pared to 2016, but remains high in comparison to
previous years. Table 6 shows contract payments the
Board made to M/WOBs from 2013 through 2017.
(See appendix B for contract payments by the Fed-
eral Reserve System, including the Board and
Reserve Banks, to M/WOBs in 2016 and 2017.)
Successes
The Board’s commitment to working with M/WOBs
in its acquisition process has long been a core busi-
ness strategy for success. The Board’s Procurement
and Supplier Diversity professionals deliver sustain-
able supplier diversity solutions, thus driving the eco-
nomic value for the communities we serve.
External Outreach to Build Capacity and
Provide Technical Assistance to M/WOBs
During 2017, the Board’s Supplier Diversity Pro-
gram increased its outreach efforts to regional and
national organizations that share its commitment to
support programs and services for M/WOBs.
The Procurement team engaged in numerous out-
reach activities to provide technical assistance,
enhance awareness, and respond to questions from
potential contractors regarding Board procurement
Table 6. Contract payments to minority- and women-owned businesses, 2013–17
Demographic
2017 2016 2015 2014 2013
Dollars Percent Dollars Percent Dollars Percent Dollars Percent Dollars Percent
By business type
Total awards, all businesses 149,460,423 100.00 148,670,418 100.00 154,264,257 100.00 142,278,128 100.00 136,200,452 100.00
Minority-owned1,2 15,618,616 10.45 16,300,360 10.96 12,833,443 8.32 9,918,863 6.97 5,727,983 4.21
Non-minority women-owned 7,890,796 5.28 8,260,979 5.56 9,755,909 6.32 11,424,820 8.03 4,564,941 3.35
Total minority-owned andwomen-owned2
23,509,412 15.73 24,561,339 16.52 22,589,352 14.64 21,343,683 15.00 10,292,924 7.56
By demographic group
American Indian or Alaska Native 87,577 0.06 0 0.00 0 0.00 0 0.00 19,877 0.01
Asian American 8,100,211 5.42 5,075,631 3.41 5,406,022 3.50 3,019,103 2.12 1,740,317 1.28
Black or African American 2,235,793 1.50 2,876,120 1.93 1,122,953 0.73 2,626,233 1.85 325,101 0.24
Hispanic or Latino 4,628,029 3.10 6,204,852 4.17 5,118,261 3.32 3,681,174 2.59 3,490,665 2.56
Native Hawaiian or otherPacific Islander 379,436 0.25 1,215,121 0.82 672,896 0.44 0 0.00 0 0.00
Other minority3 187,570 0.13 928,633 0.62 513,311 0.33 592,353 0.42 152,023 0.11
Note: Contract payments are the actual funds the Board pays out to contractors for goods and services provided. Data are per calendar year. Components may not sum to totalsand may not yield percentages shown because of rounding.1 “Minority-owned” includes minority women-owned businesses.2 The term minority means an individual who falls within one or more of the following race and ethnic categories: Hispanic or Latino, Black or African American, Native
Hawaiian or other Pacific Islander, Asian, and American Indian or Alaska Native. The term minority-owned business means a business that meets the following criteria:(i) more than 50 percent of the ownership or control is held by one (1) or more minority individuals; and (ii) more than 50 percent of the net profit or loss accrues to one (1) ormore minority individuals. The term women-owned business means a business that meets the following criteria: (i) more than 50 percent of the ownership or control is heldby one (1) or more women; (ii) more than 50 percent of the net profit or loss accrues to one (1) or more women; and (iii) a significant percentage of senior managementpositions are held by women.
3 Other minority means those businesses designating “minority-owned” but not designating Asian American, Black American, Hispanic American, or Native American.
Source: Oracle/MicroStrategy, 2013–17.
16 Report to the Congress on the Office of Minority and Women Inclusion

opportunities. Specifically, Procurement representa-
tives hosted, led, or were featured speakers at several
events that provided specific technical assistance to
M/WOBs. Procurement representatives also exhibited
and held matchmaking sessions at many other exter-
nal events. See box 3 for a list of the Board’s supplier
diversity outreach activities during the year.
Highlights
• Federal Reserve Board Vendor Outreach Fair
In August 2017, Procurement hosted a vendor out-
reach fair to provide vendors an opportunity to
market their products and services and to collabo-
rate with technical representatives from the Board,
the Federal Reserve System, and federal agencies.
The overall goal of this signature event was to
assist small and diverse businesses by broadening
their awareness of and access to business opportu-
nities; facilitate their communication with buyers
and key procurement decisionmakers; and provide
them with access to capacity-building resources.
Chair Janet Yellen, in a video used during the
opening ceremony, delivered a special message
about the importance of small business to the
economy (see the video at www.federalreserve.gov/
aboutthefed/procurement/vendor-outreach-fair
.htm).
More than 430 companies attended the event,
including 370 small business representatives. Sev-
eral speakers, including many Board staff, con-
tracting officers, and contracting officer represen-
tatives, explained the Board’s and Federal Reserve
System’s procurement processes and discussed
strategies for companies to consider when submit-
ting proposals for contracts. In addition, technical
representatives from around the Federal Reserve
System and the federal government met with busi-
ness owners to discuss current contract opportuni-
ties, and seminars were offered on such topics as
cybersecurity for businesses, the U.S. payment
system and small business, and how small busi-
nesses can access credit.
• U.S. Department of Treasury Business
Matchmaking for ChallengHER
In October 2017, Board staff participated in the
Treasury’s Office of Small Disadvantaged Business
Utilization Business Matchmaking Event for Chal-
lengeHER. ChallengeHER is a national initiative
to increase government contracting opportunities
for women-owned small businesses. ChallengeHER
hosts free events serving approximately 18,000
women all across the country. Training includes a
variety of federal contracting topics presented by
local resources such as Procurement Technical
Box 3. Supplier diversity outreach activities, 2017
• Alliance Mid-Atlantic Small Business Procure-ment Fair
• American Express OPEN Business MatchmakingEvent
• Capital Region Minority Supplier DevelopmentCouncil Matchmaking Event
• Congressional Black Caucus Foundation AnnualLegislative Conference
• Federal Procurement Conference (Office of Smalland Disadvantaged Business Utilization)
• Federal Reserve Bank of Atlanta – Supplier DiversityForum
• Federal Reserve Bank of Chicago – BusinessSmart Week
• Greater Washington Hispanic Chamber ofCommerce Business Exposition
• National 8(a) Association Small BusinessConference
• National Minority Supplier Development Council
• National Veterans Small Business EngagementConference
• U.S. Hispanic Chamber of Commerce Conference
• U.S. Hispanic Legislative Summit
• U.S. Pan Asian American Chamber of CommerceCelebrAsian Conference
• U.S. Department of Treasury Industry Day
• U.S. Women’s Chamber of Commerce Conference
• Women’s Business Enterprise National CouncilConference & Business Fair
• Women’s Business Enterprise National CouncilSummit and Salute
• Women’s Business Enterprise National CouncilPath to Power Conference
March 2018 17

Assistance Center; matchmaking with agencies and
prime contractors; and mentor roundtables allow-
ing the attendees to engage in more in-depth con-
versation with experts. The Treasury Department
partnered with the Small Business Administration,
Women Impacting Public Policy, and American
Express OPEN to host this event.
• Federal Agencies Cybersecurity Awareness
Technical Assistance Event
Board staff participated in the April 2017 Cyberse-
curity Awareness Technical Assistance Event
hosted by the Office of the Comptroller of the
Currency, the Federal Deposit Insurance Corpora-
tion, and the National Credit Union Administra-
tion. The event took attendees on a journey
through the cybersecurity age and offered insights
for businesses on adopting cyberstrategies in
today’s marketplace. It also explored current
trends regarding cybersecurity intrusions into
small businesses, suggestions for good “cyber-
hygiene,” and what to do if a business finds it has
been compromised. Event attendees were also able
to engage in matchmaking with various agencies.
The U.S. Secret Service also participated in this
event and later gave its presentation at the Board’s
Vendor Outreach Fair.
Internal Training and Communication to
Support the Supplier Diversity Program
In 2017, the Board continued to identify opportuni-
ties to enhance its supplier diversity efforts internally.
Procurement continually evaluates its Supplier Diver-
sity Program to identify potential enhancements, and
team members meet regularly with internal stake-
holders to discuss innovative methods to increase
participation of M/WOBs in its business activities. In
2017, the Procurement team continued to use a vari-
ety of strategies to support and promote supplier
diversity, such as offering training sessions and
forums to educate staff (agency-wide) on the impor-
tance of supplier diversity, disseminating a quarterly
newsletter focused on supplier diversity, and using
reporting tools and dashboards to provide stakehold-
ers with additional data to help them manage their
diversity spend.
Highlights
• Division of Financial Management Customer Forum
The forum provided Board staff with useful infor-
mation on updated procurement policies and Sup-
plier Diversity Program enhancements. It also
included concurrent breakout sessions on specific
subjects to help internal client divisions better
manage their acquisition activities and supplier
diversity objectives.
• Procurement Newsletter
The quarterly newsletter serves as a key vehicle for
communicating supplier diversity information to
internal stakeholders. It features information on
Procurement’s major programs and activities as
well as on staff training and development. It also
shares supplier diversity activities and contracts
awarded by vendor classification.
• Tracking and Reporting Supplier Diversity Results
In 2017, the Procurement team enhanced its
progress-tracking tools to provide client divisions
and Procurement staff with more-individualized
analysis and follow-up based on program perfor-
mance as well as with new supplier-selection tools
that will help stakeholders identify diverse vendors.
Tier 2 Program
In keeping with the Board’s commitment to maxi-
mizing the participation of M/WOBs in the acquisi-
tion process, Procurement continued to encourage
tier 1/prime suppliers to do business with competitive
covered companies through its Second-Tier Sourcing
Program, which was launched in 2016.6 The program
seeks to meet the second-tier contracting goals for
federal agencies that have been set by the Small Busi-
ness Administration. These goals include
• 23 percent of prime contracts for small businesses
• 5 percent of prime and subcontracts for women-
owned small businesses
• 5 percent of prime and subcontracts for small dis-
advantaged businesses
• 3 percent of prime and subcontracts for service-
disabled veteran-owned small businesses
• 3 percent of prime and subcontracts for
HUBZone-certified small businesses
The Board has a policy of providing covered compa-
nies with an equitable opportunity to compete, as a
contractor or a subcontractor, in its acquisitions.
Not only does the Second-Tier Sourcing Program
provide additional opportunities for these firms to
6 Second-tier sourcing is the process of subcontracting suppliersto support a tier 1/prime contractor’s fulfillment of a contract.For definition of a covered company, see footnote 3.
18 Report to the Congress on the Office of Minority and Women Inclusion
participate in the Board’s acquisition process, it also
strengthens the Board’s supply chain.
Next Steps
The Board strives to improve its Supplier Diversity
Program by enhancing existing programs and devel-
oping new initiatives to support the continued suc-
cess and growth of M/WOBs. The Board will con-
tinue to refine its supplier diversity model to support
the requirements of section 342 of the Dodd-
Frank Act.
Areas of focus in 2018 include
• expanding internal suppler diversity training for
employees;
• enhancing the Board’s Tier 2 spend with M/WOBs
through outreach and tracking the results of sub-
contracting opportunities with prime contractors;
• supporting initiatives that encourage diverse sup-
pliers to consider competing for opportunities in
emerging technology; and
• expanding technical assistance by leveraging
opportunities with federal financial regulatory
agencies and advocacy groups and by hosting ven-
dor events within the Federal Reserve System to
help diverse suppliers build capacity as well as the
necessary business practices for success and scal-
able growth.
March 2018 19

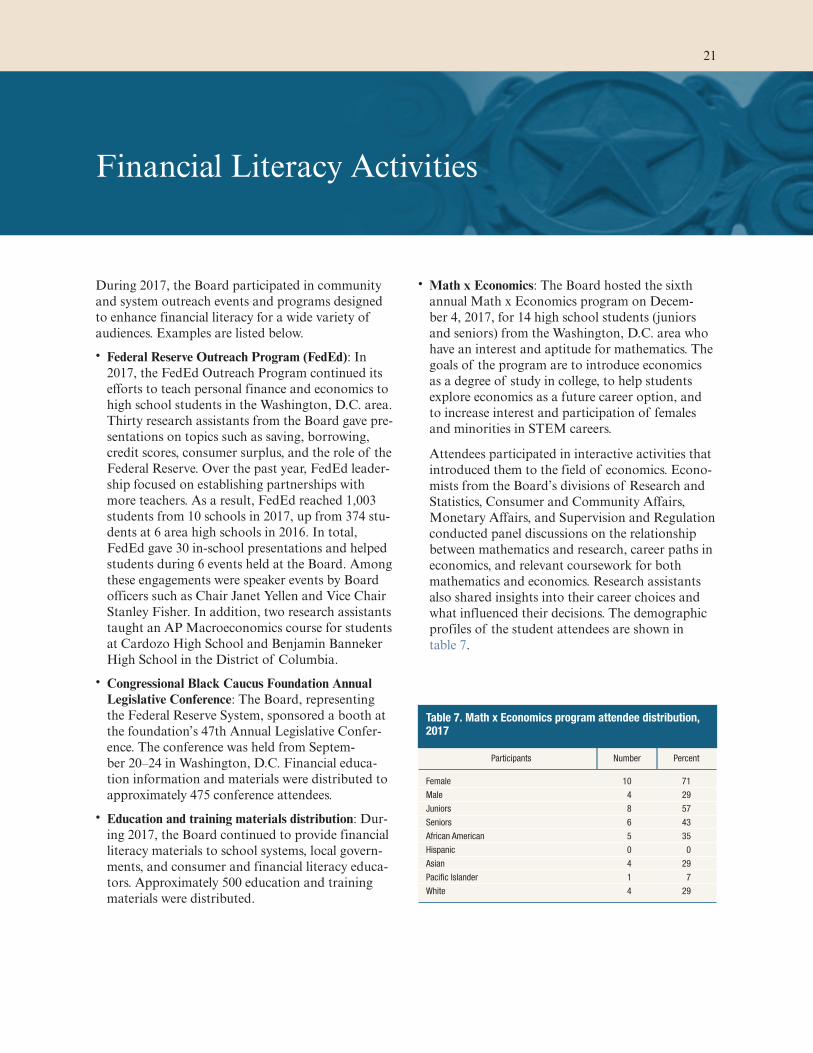
Financial Literacy Activities
During 2017, the Board participated in community
and system outreach events and programs designed
to enhance financial literacy for a wide variety of
audiences. Examples are listed below.
• Federal Reserve Outreach Program (FedEd): In
2017, the FedEd Outreach Program continued its
efforts to teach personal finance and economics to
high school students in the Washington, D.C. area.
Thirty research assistants from the Board gave pre-
sentations on topics such as saving, borrowing,
credit scores, consumer surplus, and the role of the
Federal Reserve. Over the past year, FedEd leader-
ship focused on establishing partnerships with
more teachers. As a result, FedEd reached 1,003
students from 10 schools in 2017, up from 374 stu-
dents at 6 area high schools in 2016. In total,
FedEd gave 30 in-school presentations and helped
students during 6 events held at the Board. Among
these engagements were speaker events by Board
officers such as Chair Janet Yellen and Vice Chair
Stanley Fisher. In addition, two research assistants
taught an AP Macroeconomics course for students
at Cardozo High School and Benjamin Banneker
High School in the District of Columbia.
• Congressional Black Caucus Foundation Annual
Legislative Conference: The Board, representing
the Federal Reserve System, sponsored a booth at
the foundation’s 47th Annual Legislative Confer-
ence. The conference was held from Septem-
ber 20–24 in Washington, D.C. Financial educa-
tion information and materials were distributed to
approximately 475 conference attendees.
• Education and training materials distribution: Dur-
ing 2017, the Board continued to provide financial
literacy materials to school systems, local govern-
ments, and consumer and financial literacy educa-
tors. Approximately 500 education and training
materials were distributed.
• Math x Economics: The Board hosted the sixth
annual Math x Economics program on Decem-
ber 4, 2017, for 14 high school students (juniors
and seniors) from the Washington, D.C. area who
have an interest and aptitude for mathematics. The
goals of the program are to introduce economics
as a degree of study in college, to help students
explore economics as a future career option, and
to increase interest and participation of females
and minorities in STEM careers.
Attendees participated in interactive activities that
introduced them to the field of economics. Econo-
mists from the Board’s divisions of Research and
Statistics, Consumer and Community Affairs,
Monetary Affairs, and Supervision and Regulation
conducted panel discussions on the relationship
between mathematics and research, career paths in
economics, and relevant coursework for both
mathematics and economics. Research assistants
also shared insights into their career choices and
what influenced their decisions. The demographic
profiles of the student attendees are shown in
table 7.
Table 7. Math x Economics program attendee distribution,2017
Participants Number Percent
Female 10 71
Male 4 29
Juniors 8 57
Seniors 6 43
African American 5 35
Hispanic 0 0
Asian 4 29
Pacific Islander 1 7
White 4 29
21

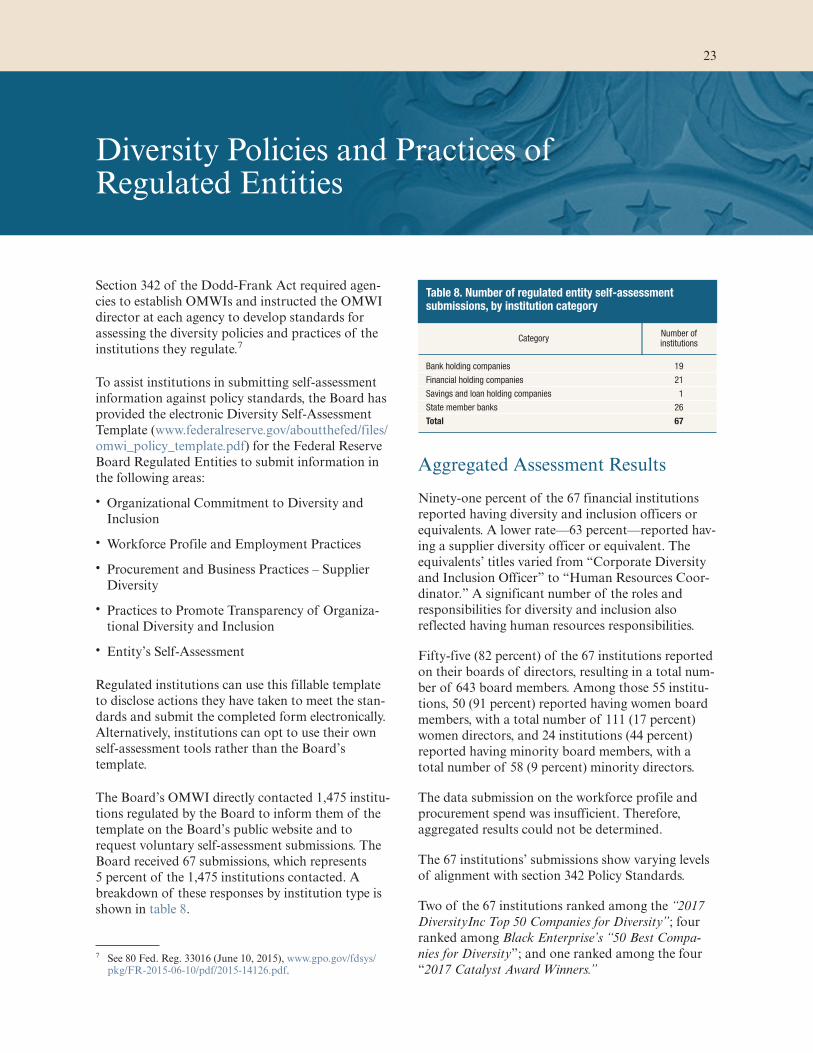
Diversity Policies and Practices ofRegulated Entities
Section 342 of the Dodd-Frank Act required agen-
cies to establish OMWIs and instructed the OMWI
director at each agency to develop standards for
assessing the diversity policies and practices of the
institutions they regulate.7
To assist institutions in submitting self-assessment
information against policy standards, the Board has
provided the electronic Diversity Self-Assessment
Template (www.federalreserve.gov/aboutthefed/files/
omwi_policy_template.pdf) for the Federal Reserve
Board Regulated Entities to submit information in
the following areas:
• Organizational Commitment to Diversity and
Inclusion
• Workforce Profile and Employment Practices
• Procurement and Business Practices – Supplier
Diversity
• Practices to Promote Transparency of Organiza-
tional Diversity and Inclusion
• Entity’s Self-Assessment
Regulated institutions can use this fillable template
to disclose actions they have taken to meet the stan-
dards and submit the completed form electronically.
Alternatively, institutions can opt to use their own
self-assessment tools rather than the Board’s
template.
The Board’s OMWI directly contacted 1,475 institu-
tions regulated by the Board to inform them of the
template on the Board’s public website and to
request voluntary self-assessment submissions. The
Board received 67 submissions, which represents
5 percent of the 1,475 institutions contacted. A
breakdown of these responses by institution type is
shown in table 8.
Aggregated Assessment Results
Ninety-one percent of the 67 financial institutions
reported having diversity and inclusion officers or
equivalents. A lower rate—63 percent—reported hav-
ing a supplier diversity officer or equivalent. The
equivalents’ titles varied from “Corporate Diversity
and Inclusion Officer” to “Human Resources Coor-
dinator.” A significant number of the roles and
responsibilities for diversity and inclusion also
reflected having human resources responsibilities.
Fifty-five (82 percent) of the 67 institutions reported
on their boards of directors, resulting in a total num-
ber of 643 board members. Among those 55 institu-
tions, 50 (91 percent) reported having women board
members, with a total number of 111 (17 percent)
women directors, and 24 institutions (44 percent)
reported having minority board members, with a
total number of 58 (9 percent) minority directors.
The data submission on the workforce profile and
procurement spend was insufficient. Therefore,
aggregated results could not be determined.
The 67 institutions’ submissions show varying levels
of alignment with section 342 Policy Standards.
Two of the 67 institutions ranked among the “2017
DiversityInc Top 50 Companies for Diversity”; four
ranked among Black Enterprise’s “50 Best Compa-
nies for Diversity”; and one ranked among the four
“2017 Catalyst Award Winners.”
7 See 80 Fed. Reg. 33016 (June 10, 2015), www.gpo.gov/fdsys/pkg/FR-2015-06-10/pdf/2015-14126.pdf.
Table 8. Number of regulated entity self-assessmentsubmissions, by institution category
Category Number ofinstitutions
Bank holding companies 19
Financial holding companies 21
Savings and loan holding companies 1
State member banks 26
Total 67
23

In regards to section 342 Policy Standards, institu-
tions highlighted a variety of commendable prac-
tices—for example:
• providing a detailed description or infographic of
the organization’s diversity and inclusion strategy
on the organization’s web page;
• utilizing surveys (e.g., Human Rights Campaign
Corporate Equality Index and DiversityInc) to
benchmark quantitative and qualitative progress
measures;
• formalizing strategies to create a culture that values
diversity and demonstrates inclusion, including
assessing core human resources practices, work-
force planning, engagement surveys, and targeted
recruitment;
• providing annual EEO training for all employees,
both mandatory and self-initiated;
• including an EEO policy statement in the
employee handbook as well as a Code of Conduct
and channels available to employees and applicants
to address issues;
• working with organizations in the markets served
by the institutions to share employment
opportunities;
• leveraging employee resource groups;
• conducting an annual employee survey to assess
engagement;
• diversifying talent pipelines through a mix of pro-
prietary programs and external partners;
• using quantitative and qualitative metrics to track
applicants, hires, promotions, and turnovers; and
• utilizing approaches that align diversity and inclu-
sion goals with the organization’s global business
strategy, such as
—attracting, engaging, developing, and retaining a
diverse talent workforce,
—integrating diversity and inclusion within busi-
nesses to drive high performance, and
—leveraging diverse perspectives to advance a cul-
ture of inclusion and innovation.
Diversity and inclusion activities requiring priority
focus identified by Regulated Entities were as
follows:
• outreach to educational institutions serving signifi-
cant women and minority populations
• participation in conferences, workshops, and other
events to attract women and minorities and inform
them of employment opportunities
• establishing qualitative and quantitative metrics in
the area of supplier diversity
• having an ongoing process to publicize the institu-
tion’s procurement opportunities
In the first quarter of 2018, the Board will request
self-assessment submissions for calendar-year 2017.
24 Report to the Congress on the Office of Minority and Women Inclusion
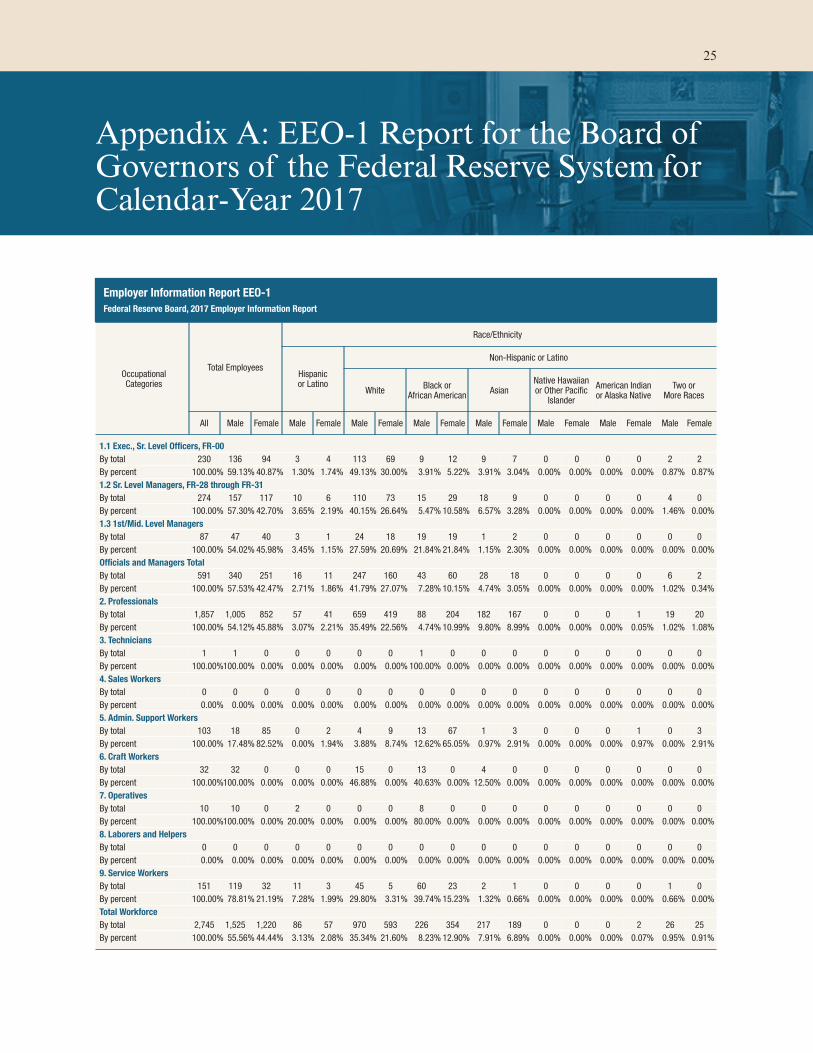
Appendix A: EEO-1 Report for the Board ofGovernors of the Federal Reserve System forCalendar-Year 2017
Employer Information Report EEO-1
Federal Reserve Board, 2017 Employer Information Report
OccupationalCategories
Total Employees
Race/Ethnicity
Hispanicor Latino
Non-Hispanic or Latino
White Black or
African American Asian
Native Hawaiianor Other Pacific
Islander
American Indianor Alaska Native
Two orMore Races
All Male Female Male Female Male Female Male Female Male Female Male Female Male Female Male Female
1.1 Exec., Sr. Level Officers, FR-00
By total 230 136 94 3 4 113 69 9 12 9 7 0 0 0 0 2 2
By percent 100.00% 59.13% 40.87% 1.30% 1.74% 49.13% 30.00% 3.91% 5.22% 3.91% 3.04% 0.00% 0.00% 0.00% 0.00% 0.87% 0.87%
1.2 Sr. Level Managers, FR-28 through FR-31
By total 274 157 117 10 6 110 73 15 29 18 9 0 0 0 0 4 0
By percent 100.00% 57.30% 42.70% 3.65% 2.19% 40.15% 26.64% 5.47% 10.58% 6.57% 3.28% 0.00% 0.00% 0.00% 0.00% 1.46% 0.00%
1.3 1st/Mid. Level Managers
By total 87 47 40 3 1 24 18 19 19 1 2 0 0 0 0 0 0
By percent 100.00% 54.02% 45.98% 3.45% 1.15% 27.59% 20.69% 21.84% 21.84% 1.15% 2.30% 0.00% 0.00% 0.00% 0.00% 0.00% 0.00%
Officials and Managers Total
By total 591 340 251 16 11 247 160 43 60 28 18 0 0 0 0 6 2
By percent 100.00% 57.53% 42.47% 2.71% 1.86% 41.79% 27.07% 7.28% 10.15% 4.74% 3.05% 0.00% 0.00% 0.00% 0.00% 1.02% 0.34%
2. Professionals
By total 1,857 1,005 852 57 41 659 419 88 204 182 167 0 0 0 1 19 20
By percent 100.00% 54.12% 45.88% 3.07% 2.21% 35.49% 22.56% 4.74% 10.99% 9.80% 8.99% 0.00% 0.00% 0.00% 0.05% 1.02% 1.08%
3. Technicians
By total 1 1 0 0 0 0 0 1 0 0 0 0 0 0 0 0 0
By percent 100.00% 100.00% 0.00% 0.00% 0.00% 0.00% 0.00% 100.00% 0.00% 0.00% 0.00% 0.00% 0.00% 0.00% 0.00% 0.00% 0.00%
4. Sales Workers
By total 0 0 0 0 0 0 0 0 0 0 0 0 0 0 0 0 0
By percent 0.00% 0.00% 0.00% 0.00% 0.00% 0.00% 0.00% 0.00% 0.00% 0.00% 0.00% 0.00% 0.00% 0.00% 0.00% 0.00% 0.00%
5. Admin. Support Workers
By total 103 18 85 0 2 4 9 13 67 1 3 0 0 0 1 0 3
By percent 100.00% 17.48% 82.52% 0.00% 1.94% 3.88% 8.74% 12.62% 65.05% 0.97% 2.91% 0.00% 0.00% 0.00% 0.97% 0.00% 2.91%
6. Craft Workers
By total 32 32 0 0 0 15 0 13 0 4 0 0 0 0 0 0 0
By percent 100.00% 100.00% 0.00% 0.00% 0.00% 46.88% 0.00% 40.63% 0.00% 12.50% 0.00% 0.00% 0.00% 0.00% 0.00% 0.00% 0.00%
7. Operatives
By total 10 10 0 2 0 0 0 8 0 0 0 0 0 0 0 0 0
By percent 100.00% 100.00% 0.00% 20.00% 0.00% 0.00% 0.00% 80.00% 0.00% 0.00% 0.00% 0.00% 0.00% 0.00% 0.00% 0.00% 0.00%
8. Laborers and Helpers
By total 0 0 0 0 0 0 0 0 0 0 0 0 0 0 0 0 0
By percent 0.00% 0.00% 0.00% 0.00% 0.00% 0.00% 0.00% 0.00% 0.00% 0.00% 0.00% 0.00% 0.00% 0.00% 0.00% 0.00% 0.00%
9. Service Workers
By total 151 119 32 11 3 45 5 60 23 2 1 0 0 0 0 1 0
By percent 100.00% 78.81% 21.19% 7.28% 1.99% 29.80% 3.31% 39.74% 15.23% 1.32% 0.66% 0.00% 0.00% 0.00% 0.00% 0.66% 0.00%
Total Workforce
By total 2,745 1,525 1,220 86 57 970 593 226 354 217 189 0 0 0 2 26 25
By percent 100.00% 55.56% 44.44% 3.13% 2.08% 35.34% 21.60% 8.23% 12.90% 7.91% 6.89% 0.00% 0.00% 0.00% 0.07% 0.95% 0.91%
25

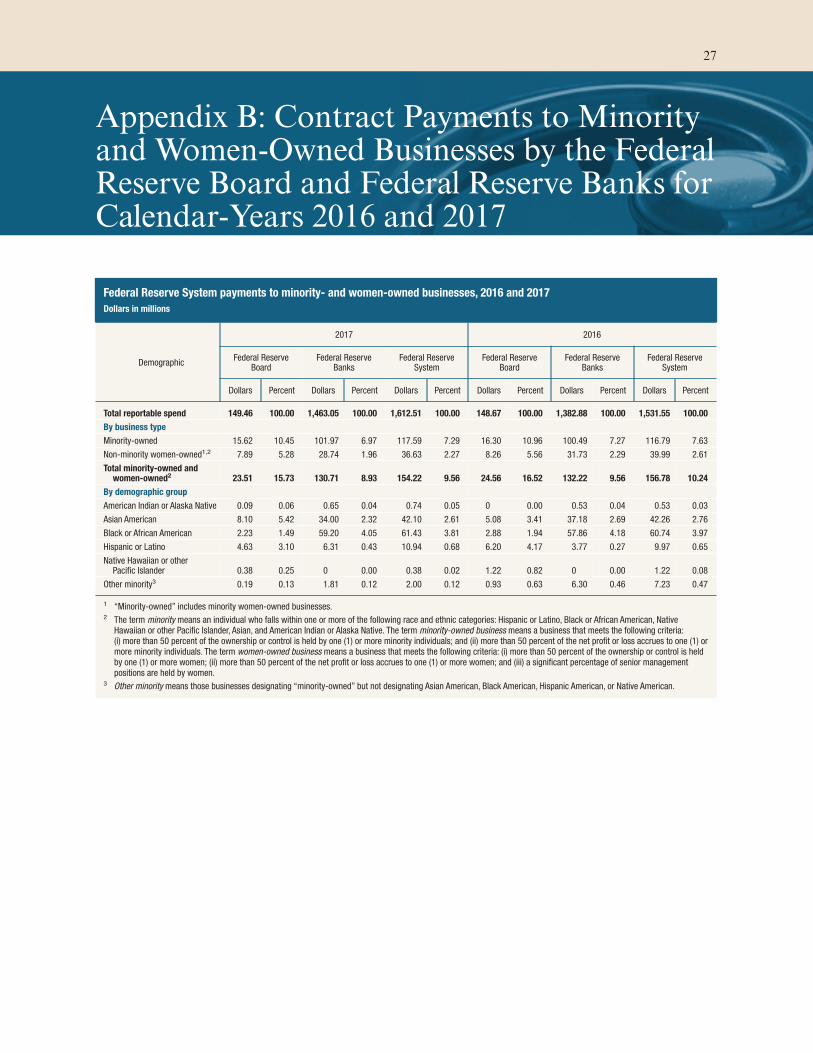
Appendix B: Contract Payments to Minorityand Women-Owned Businesses by the FederalReserve Board and Federal Reserve Banks forCalendar-Years 2016 and 2017
Federal Reserve System payments to minority- and women-owned businesses, 2016 and 2017
Dollars in millions
Demographic
2017 2016
Federal ReserveBoard
Federal ReserveBanks
Federal ReserveSystem
Federal ReserveBoard
Federal ReserveBanks
Federal ReserveSystem
Dollars Percent Dollars Percent Dollars Percent Dollars Percent Dollars Percent Dollars Percent
Total reportable spend 149.46 100.00 1,463.05 100.00 1,612.51 100.00 148.67 100.00 1,382.88 100.00 1,531.55 100.00
By business type
Minority-owned 15.62 10.45 101.97 6.97 117.59 7.29 16.30 10.96 100.49 7.27 116.79 7.63
Non-minority women-owned1,2 7.89 5.28 28.74 1.96 36.63 2.27 8.26 5.56 31.73 2.29 39.99 2.61
Total minority-owned andwomen-owned2
23.51 15.73 130.71 8.93 154.22 9.56 24.56 16.52 132.22 9.56 156.78 10.24
By demographic group
American Indian or Alaska Native 0.09 0.06 0.65 0.04 0.74 0.05 0 0.00 0.53 0.04 0.53 0.03
Asian American 8.10 5.42 34.00 2.32 42.10 2.61 5.08 3.41 37.18 2.69 42.26 2.76
Black or African American 2.23 1.49 59.20 4.05 61.43 3.81 2.88 1.94 57.86 4.18 60.74 3.97
Hispanic or Latino 4.63 3.10 6.31 0.43 10.94 0.68 6.20 4.17 3.77 0.27 9.97 0.65
Native Hawaiian or otherPacific Islander 0.38 0.25 0 0.00 0.38 0.02 1.22 0.82 0 0.00 1.22 0.08
Other minority3 0.19 0.13 1.81 0.12 2.00 0.12 0.93 0.63 6.30 0.46 7.23 0.47
1 “Minority-owned” includes minority women-owned businesses.2 The term minority means an individual who falls within one or more of the following race and ethnic categories: Hispanic or Latino, Black or African American, Native
Hawaiian or other Pacific Islander, Asian, and American Indian or Alaska Native. The term minority-owned business means a business that meets the following criteria:(i) more than 50 percent of the ownership or control is held by one (1) or more minority individuals; and (ii) more than 50 percent of the net profit or loss accrues to one (1) ormore minority individuals. The term women-owned business means a business that meets the following criteria: (i) more than 50 percent of the ownership or control is heldby one (1) or more women; (ii) more than 50 percent of the net profit or loss accrues to one (1) or more women; and (iii) a significant percentage of senior managementpositions are held by women.
3 Other minority means those businesses designating “minority-owned” but not designating Asian American, Black American, Hispanic American, or Native American.
27