Embed Size (px)
Citation preview

Agenda Item No.10
REPORT TO THE BOARD OF DIRECTORS
RESPONSIBLE DIRECTOR: REPORT FOR: IMPACT ON BUSINESS: Patrick Johnson Chief Transformation Officer
Decision High Med Low Discussion √ √ Information
LEAD MANAGER: REPORT TYPE: BAF REFERENCES & RAG: Carly West-Burnham Associate Director of Strategic Partnerships
Strategic √ Operational √ Governance √ RELATED WORK: (PREVIOUS
PAPERS TO COMMITTEE) PEER ASSIST: PEER REVIEW:
Executive Directors CQC Domain: (safe, caring, effective, responsive, well-led)
Well Led
Meeting Date: 25th June 2019 Report Title: Integrated Performance Report PURPOSE: This paper accompanies the attached Integrated Performance Report (IPR.)
SUMMARY:
The Trust is required to provide assurance that its approach to performance management is rigorous and appropriately identifies, escalates and deals with areas of performance which should be of concern in a timely manner. A robust sign off process is in place for the IPR with Executive Directors having responsibility for specific domains and the narrative provided in relation to support exception reporting. RISK ASSESSMENT (CROSS-REFERENCE WITH RISK REGISTER WHERE APPROPRIATE):
Strategic / External
Operational/ Organisational
Financial Clinical Legal/ Regulatory
Reputational / Patient
Experience √ √ √ √ √ √
RECOMMENDATION/S: The Trust Board are asked to note the contents of this report.
Author: Patrick Johnson Date: 20th June 2019 Version: 1.0

Page | 1
Integrated Performance Report
Trust Board
May 2019 data

Page | 2
Contents
1. Executive Summary
Page 3
2. Trust Performance Overview
Page 5
3. Domain Reports
- Safe
Page 7
- Effective
Page 10
- Caring
Page 11
- Responsive
Page 14
- Well Led (Finance & Detailed Finance Report)
Page 20
- Well Led (People)
Page 26
4. Appendices
Page 31

Page | 3
1. EXECUTIVE SUMMARY
Safe
There were no never events, no falls with moderate, severe or catastrophic harm and no cases of MRSA bacteraemia within the month. The Trust was ranked 1st out of 18 regional Trusts in May in relation to New Harm Free Care. Cleanliness also improved to meet the 95% target.
Four SIs and three hospital acquired pressure ulcers were reported this month. There were three episodes of hospital acquired C. Diff in May.
The Trust’s Infection Prevention and Control (IP&C) rating by NHSI has been changed from amber to red and the current IP&C action plan has been revised and will be reported to the Hospital Infection Control Committee on a monthly basis.
Effective
Mortality remains within expected parameters.
The caesarean section rate has fallen to 27.56%, the lowest reported rate in 12 months.
Caring
The Trust has not met the family and friend’s recommendation target of 95% for the first time since May 2018, with the rate for May being 94.73%.
The response rate for complaints in May was 21.28%. This is an improvement upon the previous month. New processes have been implemented to meet an agreed recovery trajectory.
Responsive
Four-hour emergency care performance deteriorated from 84.67% in April to 83.80% in May. However, a sustained improvement in performance has been seen since January. Ambulance handover within 15 minutes has improved from 55.77% in April to 59.73% in May and remains the strongest performance delivered in over 12 months.
≥ 21-day length of stay remains above the baseline (60) and ambition (46). However, improvements have been demonstrated during April and May. The Trust is re-launching long stay reviews, in line with national guidance; ECIST are providing support to this process. Actions to improve performance will be incorporated into the emergency care improvement plan and a quarterly update will be provided to the Trust Board of Directors from July 2019
18-week RTT performance improved from 80.42% in April to 82.55% in May, ahead of the May trajectory set at 80.15%. At the end of May 2019, the total Trust waiting list was 13,767 and the total backlog was 2,402. There were no 52-week breaches reported in May.
6-week diagnostic performance deteriorated from 0.86% in April to 4.54% in May. The underperformance is due to the high number of breaches in CT (68) and ultrasound (87). There is an underlying capacity deficit in both these modalities with a reliance on additional sessions.
The Trust achieved the 31-day diagnosis to treatment standard (96.12%), 31-day subsequent treatment (drug) (100%) and the 62-day screening to treatment standard (100%) for April.
2 week wait performance was 81.05% in April, against the standard of 93%, and 2 week wait (breast symptomatic) performance was 20.9% against the standard of 93%.

Page | 4
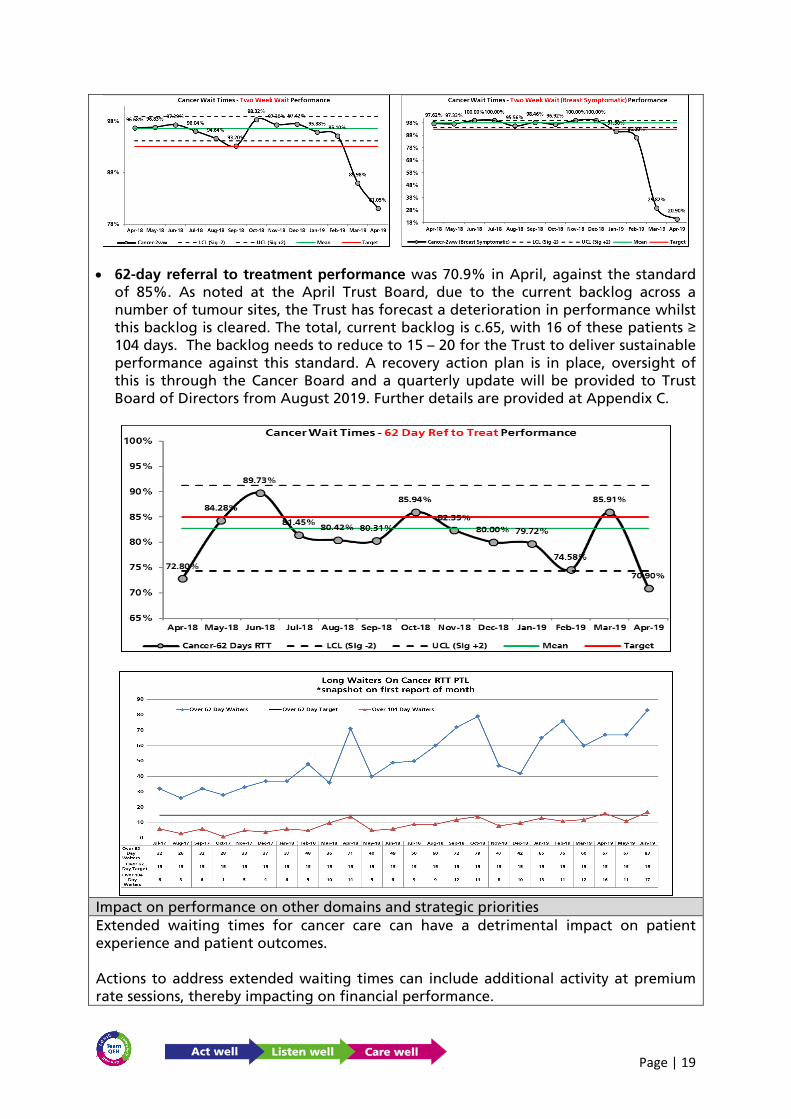
62-day referral to treatment performance was 70.9% in April, against the standard of 85%. As noted at the April Trust Board, due to the current backlog across a number of tumour sites, the Trust has forecast a deterioration in performance whilst this backlog is cleared.
Well Led (Finance)
The Trust’s YTD performance at M2 is now £1m adverse to our Operational Plan. £0.2m of this stems from the profiling in our Operational Plan not weighting M1 for the AfC top of pay scale banding payments made in April that have been fully provided for in our annual pay budget. The causes of the remaining £0.8m YTD adverse variance to Plan are well understood and, with the exception of medical agency staffing cost overruns, action has been taken to stem each causal factor and draw up recovery plans for the M2 position. Recruitment plans are in place to address the Medical Agency issue, but plans to address the recovery of its YTD (£0.2m) over budget performance, beyond potential recourse to the Trust’s Contingency and/or non-recurrent expected balance sheet flexibility, have yet to be drawn up. This is currently being worked on within the Divisions.
At the time of writing c.£2.8m of the £5.5m CIP target (excluding prior year FYEs) is now in delivery, with £0.3m nearing delivery; £0.7m at the initial workbook stage and £0.5m yet to be worked from ideas to tangible schemes. That is a potential, should all schemes deliver, aggregated in-year delivery value of £4.3m, which is still £1.2m short of our target. Further idea generation planning is underway, as is contingent planning to provide non-recurrent resilience to ensure final 2019/20 Control Total delivery to Plan in the event of any CIP shortfall.
Well Led (Workforce)
The Trust continues to be below target for a number of workforce KPIs at the end of April 2019 specifically sickness, mandatory training and appraisal rates.
Both substantive FTE and headcount increased for the sixth consecutive month but agency and bank usage decreased in May. With the increase of an additional 226.5 FTE in the 2019/20 funded establishment, the Trust vacancy rate has increased to 14.45%. It is to be noted that sickness has decreased for the third consecutive month.

Page | 5
2. TRUST PERFORMANCE OVERVIEWIndicator Objective Director Target Set By May Jun Jul Aug Sep Oct Nov Dec Jan Feb Mar Apr May 17/18 18/19 19/20Falls per 1000 occupied bed days resulting in Harm Patients VN <=0.98 QEH 0.16 0.00 0.08 0.00 0.00 0.00 0.08 0.17 0.08 0.18 0.33 0.09 0.00 0.07 0.09 0.04Eligible patients having Venous Thromboembolism (VTE) risk assessment
Patients VN >= 97.24% QEH 97.26% 97.50% 97.45% 97.28% 97.29% 97.36% 97.57% 97.41% 97.29% 97.36% 97.44% 97.45% Data 1 Mth in arrears 97.10% 97.41% 97.45%
Harm-free QEH Care Patients VN >= 95% QEH 98.50% 98.04% 96.40% 97.22% 97.66% 97.49% 98.77% 98.46% 98.62% 99.18% 96.08% 98.29% 99.54% 96.84% 97.73% 98.93%Never Events Patients FS 0 Nat 0 1 0 0 0 0 0 0 0 0 0 0 0 2 1 0Serious Incidents (OCCURRED IN MONTH) Patients FS 0 Nat 4 5 1 5 3 3 4 7 6 3 7 2 2 29 51 4Serious Incidents (DECLARED IN MONTH) Patients FS 0 Nat 5 3 4 1 1 4 3 8 3 8 7 6 4 10Patient safety alerts not completed by deadline Patients FS 0 Nat 0 0 0 0 0 0 0 0 0 0 0 0 0 1 0 0Clostridium difficile (QEH acquired) Patients VN 4 Nat 1 0 4 6 1 1 3 2 0 1 0 2 3 48 22 5Clostridium difficile per 100k occupied bed days (rolling 12 months) Patients VN <= 17.6 Nat 31.4 28.8 28.2 30.3 27.7 23.6 23.0 23.8 21.8 19.3 15.3 14.7 16.2 32.4 15.3 16.2
MRSA bacteraemia (QEH acquired) Patients VN 0 Nat 0 0 0 0 0 0 0 0 0 0 0 0 0 0 2 0 £kPenalties from CCG, fines
from other statutory authorities. £10,000 inrespect of each incidence in the relevant year
MRSA bacteraemia per 100k occupied bed days (rolling 12 months) Patients VN 0.0 1.3 1.3 1.3 1.3 1.3 1.4 1.4 1.4 1.4 1.4 1.4 0.0 0.0 0.0 1.4 0.0Safe staffing levels (overall fill rate) Patients VN >= 80% Nat 99.3% 96.7% 95.6% 93.5% 95.2% 98.7% 98.1% 98.4% 102.6% 101.2% 111.0% 103.3% 103.8% 94.6% 98.9% 103.6%No. of wards below 80% fill rate Patients VN 0 Nat 0 0 0 1 0 0 0 0 0 0 0 0 0 1 1 0Cleanliness Scores - very high-risk areas Places VN >= 95% Nat 96.28% 96.40% 94.71% 93.87% 95.45% 95.10% 94.59% 95.71% 94.60% 95.82% 95.48% 95.63% 95.88% 95.23% 95.75%Cleanliness Scores - high-risk areas Places VN >= 95% Nat 95.11% 93.74% 93.78% 93.89% 93.91% 95.29% 96.08% 93.84% 95.25% 96.03% 95.89% 94.41% 95.94% 94.88% 95.18%Cleanliness Scores - significant-risk areas Places VN >= 90% Nat 91.13% 84.46% 90.88% 92.20% 93.06% 92.85% 92.17% 88.11% 92.10% 92.62% 93.59% 94.19% 94.67% 91.48% 94.43%Cleanliness Scores - low-risk areas Places VN >= 75% Nat 84.77% 97.22% 89.38% 84.52% 90.56% 88.40% 94.43% 0.00% 92.03% 90.01% 96.72% 92.33% 95.50% 83.24% 93.92%No. of cleanliness audits complete Places VN 37 26 28 46 34 29 45 35 31 47 35 34 44 36 435 80
SHMI (Trust Level - Rolling 12 Mth position, 6 mths in arrears) Patients FS
Not higher than expected
QEH 0.00 97.29 0.00 0.00 99.56 0.00 0.00 0.00 0.00 0.00 0.00
Crude HSMR Mortality (Trust Level - Rolling 12 Mth position, 3 mths in arrears) Patients FS - 3.50 3.49 3.53 3.46 3.43 3.36 3.35 3.25 3.14 3.09 3.60
HSMR (basket of 56 diagnosis groups) (Trust Level - Rolling 12 Mth position, 3 months in arrears) Patients FS
Not higher than expected
QEH 104.4 104.7 106.5 106.7 106.9 105.8 105.8 103.2 101.2 100.5 104.94
WEEKEND HSMR (basket of 56 diagnosis groups) (Trust Level - Rolling 12 Mth position, 3 months in arrears) Patients FS
Not higher than expected
QEH 114.8 114.5 115.0 114.4 115.3 116.4 114.7 114.5 112.4 109.0 111.35
Rate per 1000 admissions of inpatient cardiac arrests Patients FS < 2.0 QEH 1.44 1.37 1.65 1.39 1.44 1.31 1.02 2.05 0.90 1.91 0.40 1.71 1.14 1.55 1.34 1.42Total C Section Rate Patients FS < 25.00% QEH 29.71% 37.57% 34.39% 27.81% 41.71% 30.77% 30.91% 35.63% 32.18% 34.30% 31.61% 31.93% 27.95% 28.87% 33.47% 29.97%Stillbirth Rate (per 1000 births/stillbirths-Rolling 12 Mths) Patients FS < 3.73 QEH 3.71 3.71 4.22 4.26 5.21 4.80 4.34 4.31 4.29 2.38 2.82 2.38 1.92 3.23 2.82 1.92Neonatal Deaths Rate (per 1000 livebirths-Rolling 12 Mths) Patients FS < 1.06 QEH 0.93 0.93 0.47 0.95 1.43 1.45 2.42 2.88 2.87 3.34 3.31 3.82 3.84 0.93 3.31 3.84Extended Perinatal Deaths Rate (per 1000 births/stillbirths - Rolling 12 Mths) Patients FS < 4.79 QEH 4.63 4.64 4.69 5.21 6.63 6.24 6.75 7.18 7.15 5.71 6.12 6.19 5.76 4.16 6.12 5.76
Unexpected term admission to the NNU Patients FS 0 QEH 0 0 0 4 3 4 0 8 3 1 2 4 3 1 25 7Maternal Deaths Patients FS 0 QEH 0 0 0 0 0 0 0 0 0 0 0 0 0 0 0 0National Clinical Audits participation rate Patients FS =100% QEH 95%No. of patients recruited in NIHR studies Patients FS >600 Annually QEH 77 130 74 111 64 67 123 51 37 153 77 37 29 994 66
Same Sex accommodation standard breaches Patients VN 0 Nat 6 2 16 8 9 8 14 2 7 11 4 6 5 62 93 11 £2.8k Penalties from CCG - £250 per breach
No. of Complaints (Clinical & Non Clinical) Patients VN <= 20 QEH 31 31 36 41 41 36 32 27 41 37 38 34 47 362 421 81Complaints (rate as proportion of activity) Patients VN #N/A QEH 0.09% 0.09% 0.10% 0.12% 0.12% 0.09% 0.08% 0.09% 0.11% 0.11% 0.11% 0.09% 0.13% 0.10% 0.11%% Complaints responded to within the national standard of six months from receipt of the complaint
Patients VN 100% Nat 100% 97% 100% 100% 100% 100% 100% 100% 100% 100% 100% 100% 100% 100% 100%
% Complaints responded to within 30 days from receipt of the complaint
Patients VN >= 90% QEH 47.06% 63.16% 66.67% 71.88% 36.11% 46.34% 54.17% 33.33% 57.14% 46.43% 36.17% 6.90% 21.28% 45.40% 15.79%
Reopened complaints (% of total complaints) Patients VN <= 15% QEH 6.45% 0.00% 0.00% 0.00% 2.44% 0.00% 3.13% 11.11% 0.00% 0.00% 0.00% 2.94% 6.38% 1.66% 4.94%
% eligible patients who have dementia case find applied Patients VN >= 90.00% 43.68% 39.42% 41.20% 48.32% 40.48% 38.76% 46.98% 45.80% 45.79% 44.66% 43.54% 48.94%Data 1 Mth in arrears 60.97% 44.09%
Data 1 Mth in arrears
Friends & Family (Inpatients & Daycases) Patients VN >= 95% QEH 96.18% 95.87% 95.48% 95.01% 95.50% 95.15% 96.15% 95.17% 95.05% 95.03% 96.21% 97.01% 94.73% 95.53% 95.53% 95.73%Sample Size: Friends & Family (Inpatients & Daycases) Patients VN >= 30% QEH 31.14% 33.96% 30.36% 34.62% 34.97% 31.47% 33.05% 28.58% 33.67% 37.26% 37.83% 30.17% 36.67% 30.33% 33.21% 33.51%Friends & Family (Accident & Emergency) Patients VN >= 95% QEH 90.00% 90.87% 93.15% 93.21% 90.94% 89.42% 89.80% 89.94% 94.32% 95.32% 90.57% 93.25% 94.92% 93.12% 91.16% 94.10%Sample Size: Friends & Family (Accident & Emergency) Patients VN >= 20% QEH 11.52% 17.67% 14.65% 12.96% 8.84% 21.32% 20.81% 14.60% 10.20% 11.59% 11.04% 11.55% 11.70% 16.98% 13.79% 11.63%Friends & Family (Outpatients) Patients VN >= 95% QEH 97.38% 97.34% 97.10% 97.72% 96.65% 96.03% 96.79% 97.40% 97.07% 96.88% 97.35% 96.98% 96.17% 96.78% 97.05% 96.57%Sample Size: Friends & Family (Outpatients) Patients VN QEH 6.70% 6.79% 6.63% 6.07% 5.90% 6.86% 6.18% 5.71% 6.86% 5.38% 6.52% 5.97% 5.99% 5.39% 6.37% 5.98%Friends & Family (Maternity) Patients VN >= 95% QEH 95.65% 100.00% 95.12% 100.00% 100.00% 100.00% 94.74% 94.12% 96.67% 100.00% 93.65% 98.04% 100.00% 96.90% 96.57% 99.10%Sample Size: Friends & Family (Maternity) Patients VN >= 15% QEH 26.74% 29.51% 21.24% 14.71% 11.58% 22.94% 23.31% 20.12% 17.05% 21.64% 34.62% 31.68% 35.71% 15.20% 21.97% 33.74%
Harm Free Care % for Feb was submitted late and may not reflect nationally published Safety Thermometer figure.
Financial Impact *Sa
feEf
fect
ive
Car
ing
95% 95% 95%
3 months in arrears
6 months in arrears

Page | 6
Indicator Objective Director Target Set By May Jun Jul Aug Sep Oct Nov Dec Jan Feb Mar Apr May 17/18 18/19 19/20Emergency access within four hours Performance DS >= 95% Nat 82.63% 91.92% 88.67% 82.04% 82.14% 84.05% 78.09% 83.99% 74.85% 77.35% 81.97% 84.67% 83.80% 85.53% 82.48% 84.23%
- Majors only Performance DS >= 95% Nat 69.59% 84.90% 80.78% 68.99% 70.28% 73.61% 61.24% 76.29% 60.68% 65.08% 70.26% 71.82% 70.60% 75.74% 70.55% 71.20%
- Minors only Performance DS >= 100% QEH 93.10% 97.21% 94.92% 91.99% 91.88% 92.83% 95.02% 91.80% 90.69% 90.37% 97.09% 97.67% 97.66% 94.82% 93.26% 97.66%
12 hour trolley waits Performance DS 0 Nat 0 0 0 1 1 1 2 0 3 0 1 0 0 0 9 0Ambulance Handovers completed within 15 minutes
Performance DS 100% Nat 40.78% 42.62% 40.62% 39.50% 52.70% 52.42% 39.90% 50.95% 49.88% 49.24% 51.38% 55.77% 59.73% 21.97% 45.87% 57.80%
% beds occupied by Delayed Transfers Of Care Performance DS <= 3.5% Nat 4.20% 3.50% 5.20% 4.00% 6.20% 5.90% 6.50% 5.60% 3.00% 3.48% 4.00% 2.25% 2.47% 3.30% 4.00% 2.47%
MFFD (Medically Fit For Discharge) - Patients Performance DS 238 360 318 313 318 269 270 249 298 247 306 227 244 0 3310 471
MFFD (Medically Fit For Discharge) - Days Performance DS 2023 1810 1753 1994 2092 2197 2182 1802 1991 1571 1856 1490 1633 0 23085 3123No. of beds occupied by adult inpatients >=21 days (Mthly average over rolling 3 mths)
Performance DS <= 46 QEH 63 64 58 59 64 69 69 66 64 62 71 72 73
18 Weeks Referral to Treatment Time (Incomplete Pathways)
Performance DS >= 92% Nat 81.88% 82.00% 83.20% 83.74% 81.20% 79.96% 80.13% 78.48% 78.80% 79.56% 79.82% 80.42% 82.55% 81.05% 79.82% 82.55%
Specialties exceeding 18 wk Referral To Treatment time (Incomplete pathways)
Performance DS 0 Nat 21 25 25 24 26 26 29 30 25 28 22 21 20 0 304 41
No. of cases exceeding 52 weeks Referral To Treatment
Performance DS 0 Nat 0 0 1 5 7 1 1 1 1 1 0 0 0 3 18 0
Diagnostic Waiters, 6 weeks and over (DM01) Performance DS <= 1% Nat 0.48% 1.35% 0.94% 0.64% 0.56% 0.46% 0.66% 0.68% 0.98% 0.52% 0.37% 0.86% 4.54% 2.45% 0.37% 4.54%
Total non-clinical cancelled elective operations Performance DS <= 3.2% Nat 4.75% 5.0% 5.6% 7.25% 6.74% 6.78% 6.62% 5.24% 5.74% 6.71% 5.74% 5.73% 5.19% 5.9% 5.4%Last minute non-clinical cancelled elective operations
Performance DS <= 0.8% Nat 1.05% 1.29% 0.89% 1.66% 0.75% 1.02% 0.90% 0.48% 1.78% 0.51% 0.60% 0.89% 0.69% 1.0% 1.0% 1.58%
Breaches of the 28 day readmission guarantee Performance DS 0 Nat 4 11 2 2 7 2 0 2 4 5 5 1 0 52 53 1 £2k Penalties from CCG - £2K per cancellation
Urgent operations cancelled more than once Performance DS 0 Nat 0 0 0 0 0 0 0 0 0 0 0 0 0 0 0 0
2 week GP referral to 1st OP appointment Performance DS >= 93% Nat 96.83% 97.29% 96.04% 94.64% 93.20% 98.32% 97.30% 97.42% 95.88% 95.10% 85.98% 81.05% 96.70% 95.32% 81.05%14 Days referral for breast symptoms to assessment
Performance DS >= 93% Nat 97.33% 100.00% 100.00% 95.56% 98.46% 96.92% 100.00% 100.00% 91.30% 86.30% 29.82% 20.90% 97.97% 91.67% 20.90%
31 Day Diagnosis to Treatment Performance DS >= 96% Nat 98.25% 97.50% 97.41% 97.41% 97.35% 97.66% 96.15% 98.84% 97.22% 95.29% 96.46% 96.12% 98.67% 97.50% 96.12%
31 Day Second or Subsequent Treatment (Drug) Performance DS >= 98% Nat 100.00% 100.00% 100.00% 100.00% 100.00% 97.92% 98.04% 100.00% 100.00% 100.00% 100.00% 100.00% 99.64% 99.71% 100.00%
31 Day Second or Subsequent Treatment (Surg) Performance DS >= 94% Nat 100.00% 100.00% 100.00% 100.00% 100.00% 100.00% 92.86% 100.00% 100.00% 100.00% 100.00% 92.31% 95.91% 99.43% 92.31%
62 Days Urgent Referral to Treatment Performance DS >= 85% Nat 84.28% 89.73% 81.45% 80.42% 80.31% 85.94% 82.35% 80.00% 79.72% 74.58% 85.91% 70.90% 83.23% 81.74% 70.90%
62 Days Referral to Treatment from Screening Performance DS >= 90% Nat 100.00% 100.00% 95.00% 93.33% 96.00% 100.00% 85.00% 100.00% 100.00% 92.31% 100.00% 100.00% 98.51% 96.94% 100.00%
Single Oversight Framework (SOF) - overall Score Patients RJ 3 SOF 3 3 3 3 3 4 4 4 4 4 4 4 4 3 4 4
Distance from Plan (YTD) Patients RJ >= 0% SOF -7.23% -9.10% -8.10% -8.00% -9.10% -10.90% -11.60% -13.00% -13.70% -13.90% -14.90% -6.86% -2.50% -7.70% -14.90% -2.50%
Distance from control total (YTD) Patients RJ >= 0% QEH -40.85% -69.10% -67.68% -75.09% -90.87% -127.42% -162.36% -188.91% -220.57% -226.81% -280.82% -19.40% -15.57% -204.48% -280.82% -15.57%
Agency spend (versus cap) Patients KC <= 0% SOF -90.68% -88.99% -83.19% -80.46% -77.16% -76.45% -75.21% -52.72% -51.65% -50.80% -52.12% -76.32% -74.00% -49.72% -52.12% -74.00%
% of eligible staff appraised (rolling 12 months) Patients KC >= 90% QEH 78.19% 79.66% 81.47% 81.31% 82.66% 83.00% 83.93% 82.14% 82.61% 82.51% 84.06% 84.10% 84.55%% medical staff (except junior doctors) with an appraisal (rolling 12 months)
Patients KC >= 95% QEH 86% 88% 88% 84% 92% 95% 95% 91% 86% 87% 97% 92% 89%
WTE lost as % of contracted WTE due to sickness absence (rolling 12 months)
Patients KC <= 3.5% QEH 4.55% 4.70% 4.64% 4.71% 5.08% 5.30% 5.55% 5.90% 5.82% 6.28% 5.53% 4.79% 4.81%
% eligible staff attending core Mandatory Training (rolling 12 months)
Patients KC >= 95% QEH 85.06% 85.52% 85.15% 84.80% 85.14% 84.96% 85.04% 85.63% 85.63% 86.32% 87.25% 87.23% 86.49%
Turnover (rolling 12 months) Patients KC <= 10% QEH 12.38% 12.28% 12.37% 12.30% 11.90% 11.83% 11.93% 11.69% 11.89% 11.54% 11.86% 11.40% 11.75%
Time to recruit (rolling position) * Patients KC <= 65.5 days QEH 0.0 0.0 0.0 0.0 0.0 0.0 0.0 0.0 106.7 103.0 101.5 99.2 99.1
Staff Friends and Family (quarterly) Patients KC 0.00% 0.00% 43.22% 0.00% 0.00% Not Collected
0.00% 0.00% 45.55% 0.00% 0.00% 0.00% 0.00% 50.91% 44.69% 0.00%
PPM Including Statutory PPM Patients RJ >= 95% QEH 91% 97% 92% 93% 94% 96% 96% 97% 92% 89% 83% 85% 86%
CTG Training Compliance (Midwives) Patients KC >= 90% QEH 0% 0.0% 0.0% 0.0% 0.0% 74.4% 75.8% 87.0% 97.0% 94.3% 94.1% 97.7% 95.0%
CTG Training Compliance (Doctors) Patients KC >= 90% QEH 0.0% 0.0% 0.0% 0.0% 0.0% 96.6% 96.6% 96.8% 85.7% 86.7% 86.7% 100.0% 100.0%
Staff Friends and Family for Q1 2019/20 will be available after submission in July 2019
Res
po
nsi
veW
ell L
edFinancial Impact **
Data not available prior to Oct 2018
Data not available prior to Jan 2019

Page | 7
3. DOMAIN REPORTS
Safe
Areas of strong performance Incidents The Trust declared no Never Events in May 2019. The last Never Event was declared in June 2018. All incidents are under appropriate investigation and no investigations are overdue for submission to the CCG. There were no falls with catastrophic, major or moderate harm this month.
There were no cases of MRSA bacteraemia; the last reported case was April 2018. For Safety Thermometer Harm Free Care, the Trust ranked 1st out of 18 regional Trusts in May (in comparison to 7th in April) with a score of 99.54% (in relation to New Harm Free Care only). This is above the national average of 97.75%. Only three areas fell below the 90% RN staffing fill rate during the day;
• Shouldham – 89%. This was due to sickness and absence. The senior nurse supported during the shift.
• Critical Care 83%. This was mitigated by Consultant Nurse support. All high dependency and critical care ratios were met.
• CDS at 88.63%. Midwifery Matron and Registered Nurse cover is given to support as required in order to cover absence.
We have seen an improvement in relation to achievement of the cleanliness metrics. All areas were reported as green which is an improvement from last month’s position.

Page | 8
Areas requiring improvement The Trust declared 4 Serious Incidents (SI) in May 2019;
Date SI declared Date SI occurred Description of incident
06/05/2019 31/01/2019 Delay in Cancer diagnosis.
23/05/2019 20/08/2018
A left distal Scaphoidectomy (removal of scaphoid bone in the wrist) was partially performed during a planned left Trapeiectomy (removal of the trapezium bone in the wrist).
09/05/2019 05/05/2019 Avoidable risk in response to a ruptured Ovarian Cyst.
28/05/2019 17/05/2019 Avoidable risk in response to a ruptured uterus during homebirth.
A new system of regular fixed review panels was launched this month to ensure all potential new SIs are reviewed and can be reported within 72 hours. This change should also encourage wider engagement with and learning from the incident review process. The first two incidents were historic, detected during subsequent follow up and reported immediately thereafter. The third incident occurred over a weekend and so was reported within the target of 72 working hours. The fourth incident was detected during investigation into events surrounding the third incident explaining the delay but was then reported promptly. Actions from Serious Incidents declared in May In all cases immediate actions were taken to ensure that any urgent safety implications were addressed and these were discussed in Safety Huddles in clinical areas. Immediate actions are reported in detail via Serious Incident reporting to the Quality and Performance Committee. This month’s actions included; work to review previous CT scan reports to provide assurance that there is no risk of any further delays in treatment due to missed reports; a review of hand surgery techniques; an escalation to the local ambulance trust around a delayed attendance; a review of diagnostic and escalation processes for some haematology pathways and a review of Obstetric on-call arrangements. Immediate actions are monitored through the Trust’s Clinical Governance Committee and assurance on delivery is provided to Quality and Performance Committee. Staff involved in incidents have been supported and managed where appropriate following the Trust’s policies.
Page | 9
Learning from Serious Incidents Learning from previous incidents is monitored through the Trust’s Clinical Governance Committee and assurance provided to the Quality and Performance Committee. The trust received four closure notices for investigations from the local Clinical Commissioning Group. Key learning points this month are concerned with appropriate escalation from junior staff to senior or specialist staff in a timely manner when clinical ‘early warning scores’ decline. A thematic analysis of oxygen related incidents has also been completed, and a task and finish group was convened to improve the safe prescription, delivery and recording of oxygen and to focus on safe transfer of patients between clinical areas. The investigation process The number of incidents currently under investigation in the Trust is 23. This is in line with National Reporting and Learning Service (NRLS) benchmarks. The Trust has 12 investigations expected to complete within timeframes agreed with the Clinical Commissioning Group (CCG). No incidents are overdue. Hospital Acquired Pressure Ulcers The rate of pressure ulcers per 1000 days was 0.24 which was a decrease from last month. There were three hospital acquired pressure ulcers in May, two category two on Necton and one category three on Gayton.
• Necton Category 2 to heel – no lapses in care. • Gayton Category 3 to coccyx – no lapses in care • Necton Category 2 skin damage to face - caused by an ill-fitting BIPAP mask. The
mask manufacturers have visited the ward to deliver further training and a checklist/flowchart for patient’s receiving BIPAP has been developed to ensure that the correct process for fitting is followed and that routine skin checking is carried out and documented.
Infection prevention and control (IP&C)
The Trust’s amber rating for IP&C has been revised by NHSI and has been moved to a red rating. The reasons for this have been fully reported at the Quality and Performance meeting in June 2019. The current IP&C action plan has been revised and updated and will be presented to the Hospital Infection Control Committee (HICC) in June 2019. The HICC meetings have been increased from bimonthly to monthly from May to ensure that there is increased oversight over the IP&C action plan. The action plan will be reported to the Quality and Performance Committee on a monthly basis. A planned IP&C visit by NHSI has been confirmed for 9th July 2019.
The Trust had three cases of C. difficile in May and MSSA was isolated from a patient in the Critical Care Unit. Full route cause analyses are being undertaken for all four incidents.

Page | 10
Effective
Areas of strong performance Our HSMR and SHMI both remain within the expected range with fewer deaths in the hospital in May 2019 than in May 2018. There were 81 deaths in May 2019 compared to 93 in May 2018, equating to 10.3 deaths per 1000 admissions, compared to 12.3 for the same period last year. The caesarean section rate has fallen to 27.56% after a suite of actions were undertaken last month.
Areas requiring improvement The highest number of deaths occurred on our care of the elderly wards (27), with the most frequent final diagnosis being pneumonia and sepsis in line with previous data. The weekend HSMR is 109.5 which remains within the expected range but is higher than the weekday HSMR. An audit is underway to examine any contributory factors to this. This is due to report in July, and themes will be discussed at the mortality surveillance group.

Page | 11
Caring
Areas of strong performance The Family and Friends (FFT) has met the Trust target in May for the following areas;
• 96.17% recommended for Outpatients • 36.67% response rate for inpatient and day care • 5.99% response rate for Outpatients • 100% recommended for Maternity and Antenatal • 100% recommended for Maternity and Labour • 35.71% response rate for Maternity and Labour • 100% recommended for Maternity Postnatal • 97.56% recommended for Maternity Community Postnatal
Areas requiring improvement Family and Friends
The Trust did not achieve the Family and Friends target for inpatient and day care of 95% for the first time since May 2018. The score for May 2019 was 94.73% and outpatients also fell from 98.98% in April to 96.17% in May. A review of why the rate has fallen is being undertaken and the work being undertaken by Health Watch (through patient listening events), should help to provide further insight into reasons that patients may have not to recommend the Trust. Health Watch will be undertaking listening events throughout June 2019. The A&E Friends and Family recommended test improved to 94.92% from 93.25 in April and the A&E response rate has slightly improved at 11.7% from 11.55% in April. Work is ongoing to review patient’s experience in A&E with the support of Health Watch Norfolk who are undertaking listening events for patients in June. The outcomes of the work will be reported to Patient Experience Steering Group and the Trust’s PRM. Mixed Sex Accommodation
Mixed sex accommodation (MSA) remains red this month following two incidents of mixed sex accommodation breaches which affected five patients in total. This occurred in the Critical Care Unit and was due to delayed transfers of level-one patients out of the unit due to capacity challenges in the organisation This process is monitored on a daily basis and discussed at the 10:00 bed meeting in order to ensure all operational teams are aware of potential MSA breaches. Complaints During May 2019, the Trust received 47 complaints and achieved a response rate of 21.28% against the Trust target of 90%. This is an improvement from last month due to the allocation of additional resources within the Complaints Team, however it is recognised that significant work still remains in order to meet the agreed performance
Page | 12
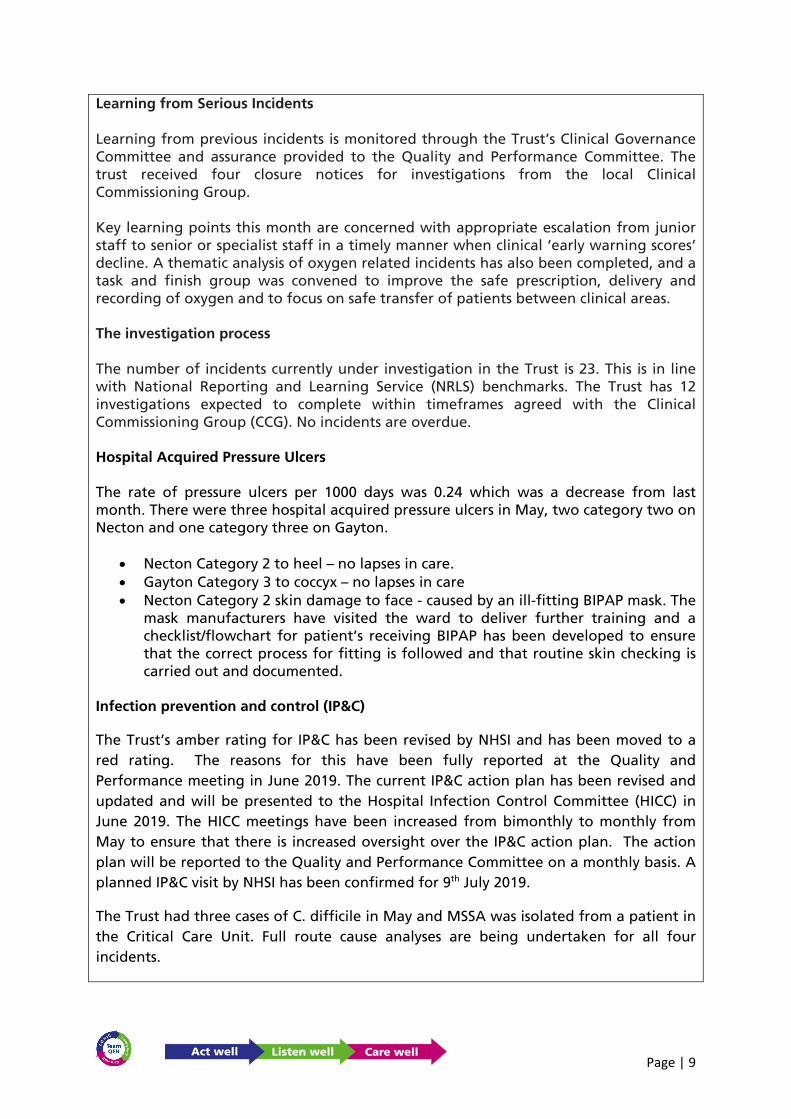
improvement trajectory. The resolution of the backlog in expected to be achieved by the end of July. A trajectory for improvement has been reset with the following timescales:
Month Complaints Compliance Response Rate Trajectory
June 55%
July 65%
August 75% September 80%
October 90% March 2020 100%
The number of reopened complaints as a percentage of all complaints rose to 6.38% from last month’s figure of 2.94%. A range of actions are being taken to address both compliance and quality of responses;
• The Chief Nurse Advisor is reviewing the complaint processes both from a timeliness and quality of response and learning perspective. The work will be reported at the Quality and Performance Committee in July.
• A revised timetable of responsibilities and accountabilities has been drafted which includes the opportunity for improved timeliness, CBU support, escalation and sign off processes. This will be implemented in July.
• Revised guidance relating to letter content and style has been drafted for discussion with the Divisions.
• The reintroduction of divisional quality meetings has commenced and learning from complaints is being undertaken via Quality summits where learning is shared with clinical teams.
• A recovery trajectory and action plan has been established to improve compliance rates. This is being monitored at the Quality and Performance Committee on a monthly basis.
• There are weekly meetings with each Divisional team, alongside weekly CEO escalation meetings led by the Acting Chief Nurse to support the timely response of all complaints.
• Training sessions on the complaint process have been rolled out Trust wide for all staff involved in the complaints process.
• The Complaints Department continue to work closely with the Divisions to manage responses being sent on time alongside developing learning and experience actions plans to ensure divisional and ward engagement.
• The new Complaints manager has commenced a review of the current processes and existing data and will be proposing changes to ensure timely complaints responses are completed improving patient satisfaction and experience. This work will be fully implemented before the end of August.

Page | 13
Dementia Case Finding Dementia case finding compliance remains below trajectory. A review of the medical clerking proforma highlighted the need for an addition to the document to ensure inclusion of the dementia screening question on the Medicine assessment and clerking document. This will be available when new printed clerking proformas arrive within the Trust. In the interim a sticker will be used. This is currently being actioned by the Associate Medical Director for Division 2.

Page | 14
Responsive
Emergency Pathway
Areas of strong performance
• Delayed transfers of care performance in May was 2.47%, exceeding the national standard of 3.5%.
• There were no 12-hour breaches during May. Areas requiring improvement • Four-hour emergency performance deteriorated from 84.67% in April to 83.80%
in May.
A sustained improvement in performance has been seen since January. The Trust has an Emergency Care Improvement plan in place to address the CQC section 31 conditions and deliver improvements in performance; a quarterly update will be provided to the Trust Board of Directors from July 2019. • Ambulance handover within 15 minutes has improved from 55.77% in April to
59.73% in May and remains the strongest performance delivered in over 12 months.

Page | 15
Ambulance handovers taking 30 – 60 minutes have marginally increased from 9.14% in April to 9.55% in May. However, ambulance handovers taking over 60 minutes have reduced from 8.69% in April to 8.01% in May. The Trust and EEAST have a joint action plan in place to deliver improvements in ambulance handover times and EEAST continue to provide dedicated management support to the Trust. • ≥ 21-day length of stay remains above the baseline (60) and ambition (46). The
Trust is re-launching long stay reviews, in line with national guidance; ECIST are providing support to this process. Actions to improve performance will be incorporated into the emergency care improvement plan and a quarterly update will be provided to the Trust Board of Directors from July 2019.
Impact on performance on other domains and strategic priorities ED overcrowding can have an adverse impact on patient safety and patient experience. In addition, long waits in ED can have a detrimental impact on patient outcomes and lead to longer lengths of stay.

Page | 16
Elective pathway
Areas of strong performance • Reportable (non-clinical) cancelled operations as a proportion of elective activity
improved from 0.89% in April to 0.69% in May against the standard of 0.8%.
• There were no breaches of the 28-day guarantee in May. • There were no urgent operations cancelled more than once in May. • There were no 52-week breaches reported in May. Areas requiring improvement • 18-week RTT performance improved from 80.42% in April to 82.55% in May, ahead
of the May trajectory set at 80.15%. At the end of May 2019, the total Trust waiting list was 13,767 and the total backlog was 2,402.
• The number of ‘prior to the day’ non-clinical cancellations improved from 5.73% in April to 5.19% in May; however, this is remains above the local target and further work is underway actions to improve this.

Page | 17
• 6-week diagnostic performance deteriorated from 0.86% in April to 4.54% in May.
The underperformance is due to the high number of breaches in CT (68) and ultrasound (87). A recovery action plan is in place and a quarterly update will be provided to Trust Board of Directors from September 2019. Further details are provided at Appendix B. Impact on performance on other domains and strategic priorities Extended waiting times for elective care can have a detrimental impact on patient experience and patient outcomes. Actions to address extended waiting times can include additional activity at premium rate sessions, thereby impacting on financial performance.

Page | 18
Cancer pathway
Areas of strong performance • The Trust achieved the 31-day diagnosis to treatment standard (96.12%) and 31-day
subsequent treatment (drug) (100%) for April.
The Trust achieved 62-day screening to treatment standard (100%) for April.
Areas requiring improvement • 2 week wait performance was 81.05% in April, against the standard of 93%, and 2
week wait (breast symptomatic) performance was 20.9% against the standard of 93%. As noted at the April Trust Board, there was a 25% loss of capacity in March. Performance is forecast to recover, for both standards, in June 2019 (reported in August).
Page | 19
• 62-day referral to treatment performance was 70.9% in April, against the standard
of 85%. As noted at the April Trust Board, due to the current backlog across a number of tumour sites, the Trust has forecast a deterioration in performance whilst this backlog is cleared. The total, current backlog is c.65, with 16 of these patients ≥ 104 days. The backlog needs to reduce to 15 – 20 for the Trust to deliver sustainable performance against this standard. A recovery action plan is in place, oversight of this is through the Cancer Board and a quarterly update will be provided to Trust Board of Directors from August 2019. Further details are provided at Appendix C.
Impact on performance on other domains and strategic priorities Extended waiting times for cancer care can have a detrimental impact on patient experience and patient outcomes. Actions to address extended waiting times can include additional activity at premium rate sessions, thereby impacting on financial performance.

Page | 20
Well Led
Finance
Areas of strong performance CIP planning and delivery levels are improving, but a minimum of £1.2m of in-year delivery remains to be identified and delivered by end March 2020. The focus remains upon delivery of the CIP target in full, but where also contingent planning is underway to mitigate potential non-delivery. An early recovery plan to address the YTD adverse position has been drawn up, with relevant staff working to fully recover the position. Areas requiring improvement
YTD performance by end May was £1m behind expected Operational Plan. Within that position rota processes within Facilities had weaknesses, since addressed, that caused a lack of budgetary control across April & May that has now contributed to a requirement for in-year recovery of the position. Impact on performance on other domains and strategic priorities
Extra processes are being brought in by the Regulator NHSI via STPs to scrutinise Capital plans with the aim of reducing NHS expenditure nationally. Any reduction to the Trust’s Capital Programme may have implications for service delivery and the overall delivery of the aims of our Operational Plan.
Page | 21
DETAILED FINANCE REPORT
1.0 FINANCIAL PERFORMANCE – MONTH 2 – May 2019 The Annual Plan The Trust is measuring its financial performance against a plan to deliver a 2019/20 deficit Control Total of £2.3m as submitted to NHSI in May 2019. This includes £6m of STP support and £19.8m in relation to Financial Recovery Fund (FRF) and Performance Sustainability Fund (PSF). Following Control Total acceptance £3.5m of central Marginal Rate Emergency Threshold (MRET) funding is receivable by the Trust in full. The Trust must achieve an initial post MRET funding operational deficit of £28.1m in order to release the total £25.8m of additional support from the DHSC and our STP. In month I&E The Trust’s performance for May 2019 is a £3.0m deficit before Provider Sustainability Fund (PSF) and Financial Recovery Funding (FRF) income is taken into account; this is £0.5m adverse to the submitted NHSI financial plan. The Control Total deficit is £2.0m, which is £0.5m adverse to NHSI plan. Year to date I&E The year to date position is a £6.2m deficit before PSF which is £1.0m (£960k) adverse to Plan. £0.8m adverse to Plan after consideration of £0.2m Operational Plan vs local budget setting M1 monthly profiling difference. This £0.8m adverse variance arrives from a mixture of causes including delays to supplementary income funding processes, agency staffing costs, drugs costs, facilities’ pay costs, CIP savings trajectory shortfall and IM&T costs, including software relicencing, above budget. Action is being taken to address the causes of the YTD adverse position and recovery plans are currently being implemented to ensure the Trust achieves its 2019/2020 forecast control total deficit of £2.3m. Outturn I&E The Trust’s 2019/20 outturn control total deficit is currently forecast to be £2.3m. At the end of month 2, the plan is forecast to be achieved. Performance against total agency cap The Trust’s monthly agency spend is £1.5m, this is £0.7m adverse to our monthly cap (£0.1m adverse to our budget). Cash Cash at the 31st May is £4.7m, a £1.3m increase from 30th April Distressed financing revenue support loans of £2.37m were received in May. Further loans of £1.75m have been requested to be received in June Interim capital loan repayments of £0.4m are forecast for late July.

Page | 22
Capital As at the end of May 2019 total capital expenditure of £0.8m has been spent, against the plan of £2.1m. The expected capital programme for 2019/20 remains dependent upon £9.6m of capital loan finance. National decision making on a further externally financed element, relating to £0.6m of matched funding, has been deferred to September. Finance Ratios
The agency to total pay ratio is 11.1%. This has been affected by the year on year increase in agency pay costs (principally driven by nurse agency) which has outstripped the year on year increase in substantive and bank pay costs. 2.0 STATEMENT OF COMPREHENSIVE INCOME

Page | 23
Year to Date:
Clinical Income, £0.5m favourable to plan: Planned Care (In-patient elective activity and outpatient activity) is £0.9m favourable to plan. This is primarily as a result of work undertaken in the private sector which is £0.6m favourable but attracts matching costs. In addition, Elective inpatient activity is a further £0.2m above plan and outpatient attendances are also a further £0.2m above planned level. Day case activity however is below plan by £0.1m. Unplanned care is £0.2m adverse to plan at the end of May. ED attendances are 104 (£0.1m) above the plan whilst non-elective admitted inpatient activity is £0.3m adverse to plan at the end of month 2. Other types of income combined are £0.2m adverse to plan at the end of month 2. The details of which continue to be investigated. Education, Training, Research & Other Non-Clinical Income, £0.3m favourable to plan: £0.1m of income above the plan has been recorded in May in addition to those items identified in April making a cumulative favourable variance of £0.3m. In May a favourable £0.1m has been recorded against income generation schemes across the Trust. The largest single variance being within R&D (£29k) as a result of the release of deferred income. Pay costs YTD pay costs including substantive, bank and agency are £27.3m. This is adverse to the YTD budget of £26.6m by £0.7m. Agency costs are £355k adverse to budget (mainly medical and nursing) Bank costs are £31k favourable to budget and substantive costs are £333k adverse to budget (phasing issue Month 1). Non pay costs The Trust reports an in month non pay position of £848K adverse to budget. This takes the YTD position to £1,080k adverse against the budget. This adverse variance was mainly due to the additional purchase of healthcare from other providers £0.6m (which is offset by matching income within our planned care favourable variance). Efficiency savings The CIP target for May was a total of £224k and where £207k total delivery occurred, £111k of which arose from new 2019/20 schemes that moved into delivery during April and May. Year to date the CIP target for May was £458k and where £370k total delivery occurred, £169k of which arose from new 2019/20 schemes.
Page | 24
3.0 STATEMENT OF FINANCIAL POSITION St
atem
ent o
f Fin
anci
al P
ositi
on
31st Mar 2019 £m
30th Apr
2019 £m
31st May 2019 £m
Month Variance
£m
YTD Variance
£m
Non-Current Assets 84.9 84.5 84.5 - (0.4)
Current Assets
Inventories 2.1 2.2 2.2 - 0.1
Trade & Other Receivables 13.9 16.6 15.6 (1.0) 1.7
Cash 4.4 3.4 4.7 1.3 0.3
Current Liabilities
Trade & Other Payables (12.7) (14.6) (11.3) 3.3 1.4
Accruals (12.1) (11.6) (14.6) (3.0) (2.5)
Other current liabilities (exc. Borrowings) (0.7) (1.2) (1.6) (0.4) (0.9)
Non-current liabilities (exc. Borrowing) (0.8) (0.8) (0.7) 0.1 0.1 Borrowings (120.0) (121.7) (124.0) (2.3) (4.0)
Total Assets Employed (41.0) (43.2) (45.2) (2.0) (4.2)
Taxpayers' equity
Public Dividend Capital 52.7 52.7 52.7 - -
Revaluation Reserve 11.6 11.6 11.6 - -
Income & Expenditure Reserve (105.3) (107.5) (109.5) (2.0) (4.2)
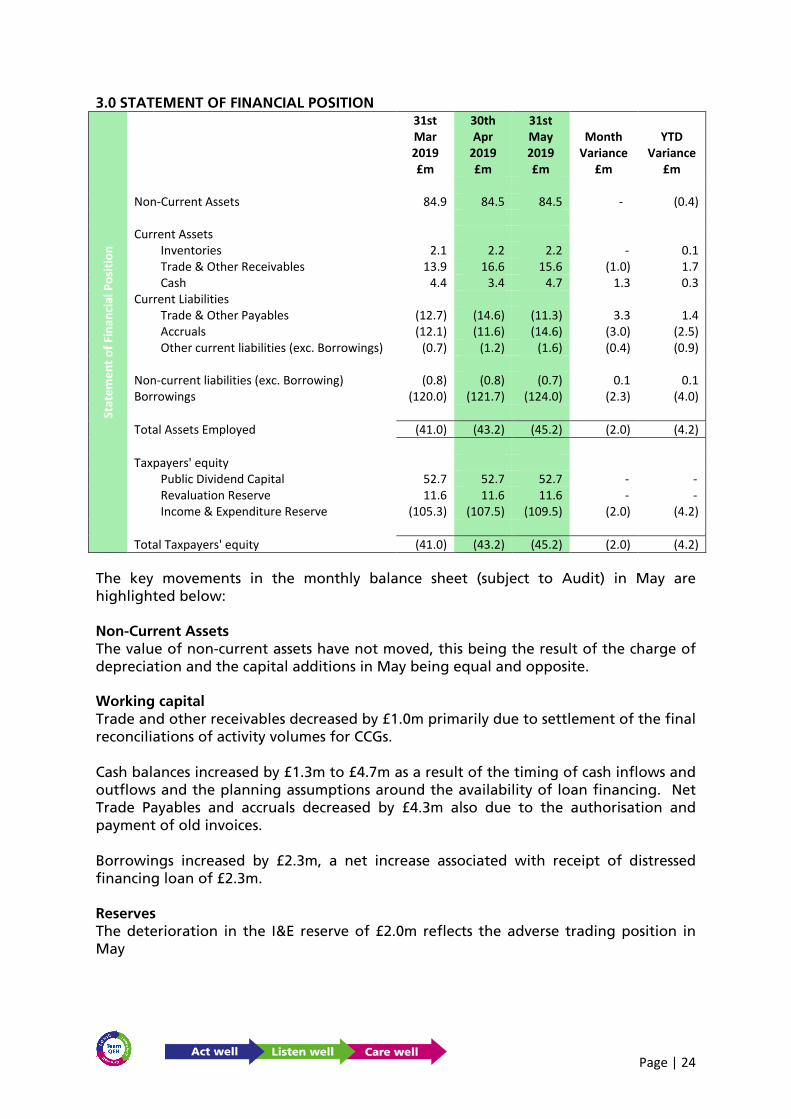
Total Taxpayers' equity (41.0) (43.2) (45.2) (2.0) (4.2) The key movements in the monthly balance sheet (subject to Audit) in May are highlighted below: Non-Current Assets The value of non-current assets have not moved, this being the result of the charge of depreciation and the capital additions in May being equal and opposite. Working capital Trade and other receivables decreased by £1.0m primarily due to settlement of the final reconciliations of activity volumes for CCGs. Cash balances increased by £1.3m to £4.7m as a result of the timing of cash inflows and outflows and the planning assumptions around the availability of loan financing. Net Trade Payables and accruals decreased by £4.3m also due to the authorisation and payment of old invoices. Borrowings increased by £2.3m, a net increase associated with receipt of distressed financing loan of £2.3m. Reserves The deterioration in the I&E reserve of £2.0m reflects the adverse trading position in May

Page | 25
4.0 STATEMENT OF FINANCIAL POSITION: WORKING CAPITAL
Debtor and Creditor Days Debtor days remain comparable to the year end and target at 27 days. Creditor days have decreased by 15 days between April and May. For a number of years the Trust plan has been to operate at around 60 days, due to stretching creditor payments over a number of prior years to support lower deficit loan drawdowns. The increased level of CCG receipts in the month have enabled the Trust to pay a greater number of creditors. Better Payment Practice Code (BPPC) The Trust’s BPPC performance has improved slightly due to the improvement in creditor days as described above. The consistent low performance is associated with the stretching of creditor days over a number of years to minimise loan requirements.
For material improvement in the BPPC to occur, the Trust would require additional working capital loans in the region of £4.2m i.e. 3 weeks of creditor payments. In the absence of significant cessation in the supply of goods/services to the Trust, the Regulator is highly unlikely to approve any such loan request. Aged Debt (Sales Ledger) The majority of aged debt over 90 days is associated with long standing disputes between the Trust and local NHS organisations (NNUH & NCH&C). The disputes are around the provision of Trust staff and the use of Trust premises to these partner organisations. The STP remains aware of the requirement to broker the resolution of these debts at DoF level. Due to the commissioning reconciliation process and AOB agreement for 2018/19, a level of outstanding debt has slipped from current i.e. <30 day, to >30 days <60 Days. It is usual that April & May see this increase in NHS o/s debt, but usually by end of Q1 final agreements and discussions have concluded, reducing the overall debt value. Liquidity Days Liquidity days have slightly improved between April & May, the improved position is associated with the increased cash receipt from WNCCG.

Page | 26
Well Led (continued)
People
Areas of strong performance Sickness absence has decreased to 4.81% from 4.85% for the month of May. This is the third consecutive month where a reduction in absence rate has been seen within the Trust. Stability (staff staying in post for longer than 12 months) has increased to 87.69%.
KPI Performance
KPI Change over the
year
Change since last month
Vacancy 2.04% 5.75% Sickness 0.10% -0.04% Stability -2.67% 0.02% Turnover -0.63% 0.34%
Appraisal (exc Bank) 5.68% 0.52% Appraisal (inc Bank) 4.89% 0.45%
Areas requiring improvement
Staff in post
Staff in post, bank and agency usage;
The Trust currently employs 3333 substantive headcount, equating to a substantive whole time equivalent of 2901.46. This is against the 2019/20 funded establishment of 3399.48 as of May 2019. May 2019 FTE Split: Establishment 3399.48 Substantive 2901.46 Bank 247.41 Agency 141.35 Under Established 109.26

Page | 27
Both substantive FTE and headcount increased for the sixth consecutive month but agency and bank usage decreased in May. With the increase of an additional 226.5 FTE in the 2019/20 funded establishment, the Trust vacancy rate has increased to 14.45%. A detailed paper has been presented to the Finance and Activity Committee in June to review the pilot of the enhanced bank rate for nursing staff. Turnover increased to 11.71% from 11.37% in April.
In respect of the Operational Plan submission the following details apply; Plan Actual
31/05/2019 31/05/2019
Month 2 Month 2
WTE WTE
ALL STAFF 3306.64 3399.48 Bank 271.77 247.41 Agency staff (including, Agency, Contract and
Locum) 105.15
141.35 Substantive WTE 2929.72 2901.46
Total Substantive Non-Medical - Clinical Staff 2026.81 1967.67 Total Substantive Non-Medical - Non-Clinical
Staff 522.54 564.77
Total Substantive Medical and Dental Staff 380.37 369.02 Sickness Absence Although sickness has decreased for the third month in a row - this month from 4.85% as at 30th April 2019 to 4.81% in May 2019 - this is higher than the trajectory of improvement for sickness absence which was agreed by the Trust Board in March 2019. The Trust trajectory target for April 2019 was 3.60% which was set in order to enable the Trust to achieve a level of 4% by the end of the financial year. Areas continue to experience a mixture of short- and long-term sickness cases which are being managed in accordance with the relevant Trust Policies and Procedures.

Page | 28
The table below shows the top five reasons for sickness in April 2019; Top reasons for sickness; Absence Reason Headcou
nt Abs
Occurrences
FTE Days Lost
Abs Estimate
d Cost
%
S99 Unknown causes / Not specified
97 102 703.60 £62,627.44
16.3
S10 Anxiety/stress/depression/other psychiatric illnesses
52 53 685.69 £59,592.71
15.9
S98 Other known causes - not elsewhere classified
47 47 388.60 £40,069.15
9.0
S25 Gastrointestinal problems 108 108 366.08 £28,667.07
8.5
S12 Other musculoskeletal problems
36 38 363.29 £19,393.25
8.4
Actions taken to address;
• Non-recording of sickness absence is highlighted at Divisional Board and CBU meetings with all managers asked to amend their records to show the actual reasons for sickness.
• ‘Supporting you’ session run with managers. • Absence training has been undertaken for managers • All long-term sickness cases have been reviewed and plans are in place to inform
next steps. • There has been a roll out of OU training for mental health.
It is to be noted that there has been a month on month improvement in sickness levels for the last three months. There are individuals currently on long term sickness which are attributable to the impact of undergoing a HR process. All employee relations cases are being reviewed and timescales added to draw the cases to conclusion. From July 2019 these will be monitored and reviewed by the Workforce Committee. Turnover; Turnover has increased from 11.37% to 11.71%. The detailed Recruitment and Retention action plan will be presented to the Workforce Committee in July 2019. Turnover for Medical and Dental staff has increased slightly from 9.13% to 9.63%. Nurse turnover has decreased for the second month in a row from 14.57% to 14.11%. A workforce prediction tool has been developed which predicts a decrease in vacancy rate from 136.73 WTE to 71.8 WTE in December 2019. AHP turnover has increased from 15.39% to 18.91%. This increase is due to a number of retirements within the service.
Page | 29
Starters and leavers by Staff Group from 01-Jun-2018 to 31-May-2019
Staff Group Starters Leavers Net gain
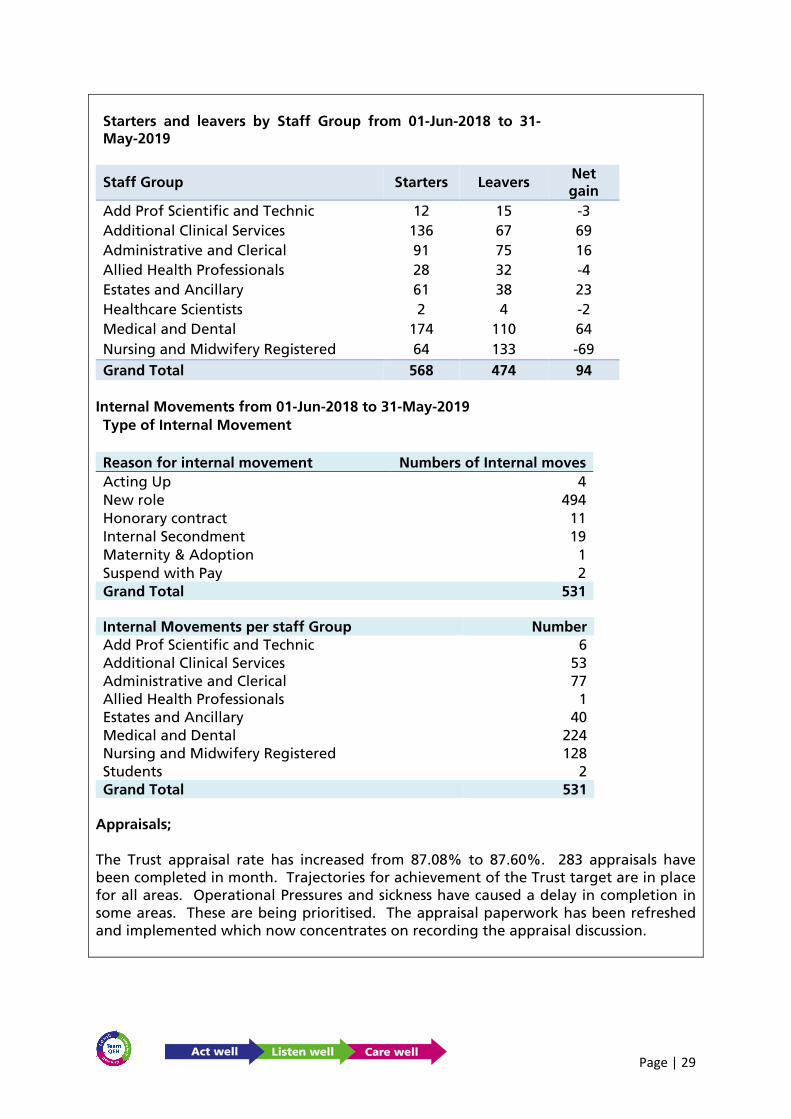
Add Prof Scientific and Technic 12 15 -3 Additional Clinical Services 136 67 69 Administrative and Clerical 91 75 16 Allied Health Professionals 28 32 -4 Estates and Ancillary 61 38 23 Healthcare Scientists 2 4 -2 Medical and Dental 174 110 64 Nursing and Midwifery Registered 64 133 -69 Grand Total 568 474 94
Internal Movements from 01-Jun-2018 to 31-May-2019 Type of Internal Movement
Reason for internal movement Numbers of Internal moves Acting Up 4 New role 494 Honorary contract 11 Internal Secondment 19 Maternity & Adoption 1 Suspend with Pay 2 Grand Total 531
Internal Movements per staff Group Number Add Prof Scientific and Technic 6 Additional Clinical Services 53 Administrative and Clerical 77 Allied Health Professionals 1 Estates and Ancillary 40 Medical and Dental 224 Nursing and Midwifery Registered 128 Students 2 Grand Total 531
Appraisals; The Trust appraisal rate has increased from 87.08% to 87.60%. 283 appraisals have been completed in month. Trajectories for achievement of the Trust target are in place for all areas. Operational Pressures and sickness have caused a delay in completion in some areas. These are being prioritised. The appraisal paperwork has been refreshed and implemented which now concentrates on recording the appraisal discussion.

Page | 30
Mandatory training; There has been a slight increase for all ten subjects which means that overall compliance has increased from 86.10% to 86.49%. More emphasis is being placed on workbook completion and e-learning thereby extending the flexibility to complete the training. A complete review of mandatory training is being undertaken as part of the Workforce Development programme with support from the PMO team. Steve Finney NHS ESR Regional Account Manager will be attending the Trust in July to look at E-learning opportunities and mandatory compliance. Contact has been made with West Herts and Sherwood HR teams to review processes and systems for mandatory training.
Employee relations cases; There are currently the following outstanding cases 22 x Disciplinary 3 x Mutual respect 6 x Grievances 1 x Tribunal Six cases were closed in May 2019.

Page | 31
4. APPENDICES APPENDIX A EMERGENCY CARE ACCESS
Current position The Trust has not achieved the 4-hour performance standard since September 2016. Performance in May 2019 was 83.8%, compared to 82.6% in May 2018. Breach analysis shows that the majority of breaches are due to exit block from the Emergency Department, with patients awaiting transfer to the medical assessment area. Causes of under performance The two main root causes of underperformance are (i) a negative net flow position, where the number of daily emergency admissions to medicine exceeds the number of medical discharges and (ii) where the number of pre-noon medical discharges is insufficient to create the required capacity early in the day. Mitigating actions 1. Pre-hospital – the Trust continues to work with commissioners and EEAST to provide
alternatives to hospital attendance and conveyance by ambulance. 2. Emergency Department – improvement work is in progress to streamline the
streaming and triage process to maximise streaming to primary care and ambulatory emergency care.
3. Discharge – medical wards have recommenced long stay reviews to reduce the number of patients with a length of stay of ≥21 days. ECIST will be supporting a re-launch of this approach across all wards in the Trust.
4. Hospital Flow – a revised standard operating procedure is in place to manage capacity and flow to maintain operational grip and control.
Improvement trajectory The Trust has an improvement trajectory in place, detailed below:
Improvement plan Trust Board will receive a quarterly update of the emergency care improvement plan from July 2019.
Apr-19 May-19 Jun-19 Jul-19 Aug-19 Sep-19 Oct-19 Nov-19 Dec-19 Jan-20 Feb-20 Mar-20
Trajectory 85.0% 85.0% 90.0% 90.0% 90.0% 90.0% 85.0% 85.0% 85.0% 85.0% 85.0% 85.0%
Actual 84.7% 83.8%
Page | 32
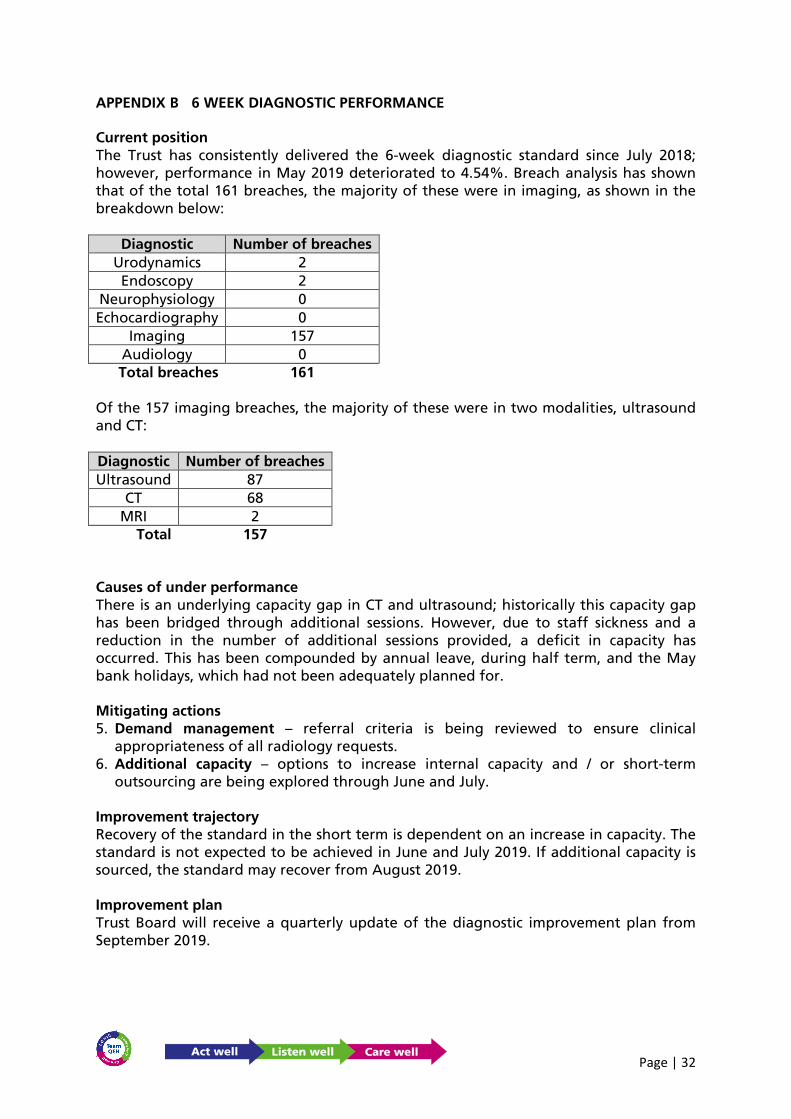
APPENDIX B 6 WEEK DIAGNOSTIC PERFORMANCE Current position The Trust has consistently delivered the 6-week diagnostic standard since July 2018; however, performance in May 2019 deteriorated to 4.54%. Breach analysis has shown that of the total 161 breaches, the majority of these were in imaging, as shown in the breakdown below:
Diagnostic Number of breaches Urodynamics 2 Endoscopy 2
Neurophysiology 0 Echocardiography 0
Imaging 157 Audiology 0 Total breaches 161
Of the 157 imaging breaches, the majority of these were in two modalities, ultrasound and CT: Diagnostic Number of breaches Ultrasound 87
CT 68 MRI 2
Total 157 Causes of under performance There is an underlying capacity gap in CT and ultrasound; historically this capacity gap has been bridged through additional sessions. However, due to staff sickness and a reduction in the number of additional sessions provided, a deficit in capacity has occurred. This has been compounded by annual leave, during half term, and the May bank holidays, which had not been adequately planned for. Mitigating actions 5. Demand management – referral criteria is being reviewed to ensure clinical
appropriateness of all radiology requests. 6. Additional capacity – options to increase internal capacity and / or short-term
outsourcing are being explored through June and July. Improvement trajectory Recovery of the standard in the short term is dependent on an increase in capacity. The standard is not expected to be achieved in June and July 2019. If additional capacity is sourced, the standard may recover from August 2019. Improvement plan Trust Board will receive a quarterly update of the diagnostic improvement plan from September 2019.

Page | 33
APPENDIX C CANCER WAITING TIMES Current position The Trust delivered the 62-day referral to treatment standard in March 2019; prior to this the standard was last delivered in October 2018. Performance in April 2019 was 70.9%; there were 67 treatments, of which 19.5 patients breaches. Over 50% of breaches occurred in two tumour sites, urology (5.5) and lung (4.5). The table below shows the performance, by tumour site for 18/19 and 19/20 year to date.
Causes of under performance The underlying cause of underperformance is the current backlog of patients ≥ 62 days. The current backlog is 65, of which 16 patients ≥ 104 days. For the Trust to deliver sustainable performance this backlog needs to reduce to 15 – 20. Of the total backlog, over 60% is across three tumour sites, urology (22), lower GI (16) and gynaecology (12). Mitigating actions 1. Leadership and management of the cancer services team transfers to the Deputy
Chief Operating Officer with effect from 24 June 2019; as part of this change, the Deputy Chief Operating Officer will chair the weekly cancer performance meetings. These changes will provide improved oversight of cancer performance and ensure robust grip and control is in place.

Page | 34
2. Pathway reviews in several specialties have already commenced. There is scope to introduce one-stop clinics, reduce time to diagnosis and pool patient lists.
Improvement trajectory Until the backlog is cleared the Trust will not deliver sustainable 62-day cancer performance and the standard is not forecast to deliver for the remainder of quarter 1. A revised trajectory will be provided once a forensic analysis, by tumour site, has been completed. Improvement plan A recovery action plan is in place, oversight of this is through the Cancer Board and a quarterly update will be provided to Trust Board of Directors from August 2019.

Page | 35
Appendix D
2019/20 YEAR TO DATE PERFORMANCE COMPARED WITH PEER HOSPITALS (To April-19)
Indicator Target QEH Dartford & Gravesham
Dorset County
Hospital FT
George Eliot
Hospital
Homerton Uni
Hospital FT
Isle of Wight
James Paget Uni Hospitals
FT
Northern Devon
Healthcare
West Suffolk FT
Wye ValleyYeovil District
Hospital FT
Clostridium Difficile (Hospital acquired) 4 2 0 1 1 1 2 1 0 1 1 0MRSA Bacteraemia (Hospital acquired) 0 0 0 0 0 0 0 0 0 0 0 0Same Sex Accomodation Standards breaches 0 6 20 10 0 0 22 0 0 0 19 0Friends & Family Inpatients & Daycases 95.00% 97.01% 96.95% 98.36% 88.86% 95.29% 97.27% 96.65% 98.25% 96.73% 98.51% 97.18%Sample Size: Friends & Family Inpatients & Daycases 30.00% 30.17% 13.13% 11.50% 30.17% 16.28% 15.37% 19.56% 24.03% 20.82% 24.45% 14.75%Friends & Family Accident & Emergency 95.00% 93.25% 90.63% 82.30% 86.49% 94.54% 100.00% 91.53% 0.00% 94.14% 87.80% 98.41%Sample Size: Friends & Family Accident & Emergency 20.00% 11.55% 0.70% 29.62% 22.78% 1.86% 3.47% 8.79% 1.02% 2.78% 6.74% 1.85%Emergency Access within four hours 95% 84.67% 81.51% 89.54% 80.88% 95.23% 76.68% 86.37% 81.26% 86.88% 78.78% 95.51%18 Weeks Referral to Treatment time - Incomplete pathways 92% 80.40% 92.12% 75.13% 82.25% 95.23% 75.66% 82.99% 79.26% 84.76% 80.46% 89.82%Diagnostic Waiters, 6 weeks and over - DM01 1% 0.9% 0.7% 11.8% 0.6% 0.5% 4.6% 0.8% 15.9% 12.5% 0.2% 1.4%2 week GP referral to 1st Outpatient appointment 93.00% 81.05% 95.62% 68.69% 96.04% 93.06% 93.03% 94.55% 94.06% 94.34% 95.35% 88.20%31 day Diagnosis to Treatment 96.00% 96.12% 100.00% 100.00% 100.00% 100.00% 95.52% 98.97% 97.92% 100.00% 97.92% 96.70%31 day second or subsequent treat (Surgery) 94.00% 92.31% 100.00% 100.00% 0.00% 50.00% 100.00% 100.00% 92.31% 100.00% 92.31% 100.00%31 day second or subsequent treat (Drug) 98.00% 100.00% 100.00% 100.00% 0.00% 100.00% 100.00% 100.00% 100.00% 100.00% 100.00% 100.00%62 days urgent referral to treatment 85.00% 70.90% 89.61% 84.75% 84.06% 84.48% 61.76% 89.81% 83.61% 78.31% 81.74% 84.26%62 day referral to treatment from screening 90.00% 100.00% 100.00% 94.12% 100.00% 0.00% 86.96% 100.00% 100.00% 92.31% 100.00% 100.00%14 days referral for breast symptoms to assessment 93.00% 20.90% 96.09% 3.57% 93.80% 91.16% 96.08% 88.89% 91.43% 87.84% 93.65% 94.12%
Data Source: www.england.nhs.uk/statistics/statistical-work-areas
Please note:- Peer Hospitals are selected according to the "Recommended Peers" as chosen by Model Hospital and can be subject to change over time.- Indicators in the table above may show different periods to the same Indicators in the rest of the report. This is because data for peer hospitals is ony available once it is made public.- The Cancer 62 day indicator may differ slightly from that reported previously as NHS England rarer cancers in this indicator.- The RTT Incomplete indicator may differ slightly from that reported previously as non-English pathways are not included in the published data.- Friends and Family RAG Rating for Peer Trusts is based on QEH FFT Targets.
C Diff Target is YTD Target adjusted each month as we move through the financial year

Page | 36
Appendix E


![USS HENRY L. STIMSON ASSOCIATION SSBN655 NEWSLETTER ... Stimson Draft.pdf · Association Officers & Board of Directors 2013—2016 PRESIDENT Ray [Rita] Kreul VIE PRESIDENT Tom [Marie]](https://img.pdfslide.us/doc/110x75/5f91840f5b646d7fdc4634a5/uss-henry-l-stimson-association-ssbn655-newsletter-stimson-draftpdf-association.jpg)