Embed Size (px)
Citation preview

Report to Shareholders for the Third Quarter, 2017www.cibc.com August 24, 2017
Report of the President and Chief Executive Officer
Overview of resultsCIBC today announced its financial results for the third quarter ended July 31, 2017.
Third quarter highlights• Reported net income was $1,097 million, compared with $1,441 million for the third quarter a year ago, and $1,050 million for the prior
quarter.• Adjusted net income(1) was $1,166 million, compared with $1,072 million for the third quarter a year ago, and $1,070 million for the prior
quarter.• Reported diluted earnings per share (EPS) was $2.60, compared with $3.61 for the third quarter a year ago, and $2.59 for the prior quarter.• Adjusted diluted EPS(1) was $2.77, compared with $2.67 for the third quarter a year ago, and $2.64 for the prior quarter.• Reported return on common shareholders’ equity (ROE) was 16.3% and adjusted ROE(1) was 17.3%.
Results for the third quarter of 2017 were affected by the following items of note aggregating to a negative impact of $0.17 per share:• $45 million ($33 million after-tax) increase in legal provisions;• $38 million ($29 million after-tax) in transaction and integration-related costs associated with the acquisition of The PrivateBank; and• $10 million ($7 million after-tax) amortization of intangible assets.
We maintained strong Basel III Common Equity Tier 1, Tier 1 and Total capital ratios of 10.4%, 11.9% and 13.7%, respectively, on an all-in basis comparedwith 12.2%, 13.5% and 15.4%, respectively, from the prior quarter, reflecting the impact on regulatory capital of the acquisition of The PrivateBank. CIBC’sBasel III leverage ratio at July 31, 2017 was 3.9% on an all-in basis.
CIBC announced a quarterly dividend increase of 3 cents per common share to $1.30 per share.
Our strong results this quarter reflect solid contributions from our strategic business units, as well as our acquisition of The PrivateBank, which closed in June.This acquisition expands CIBC’s geographical reach delivering enhanced growth opportunities and is a pivotal milestone as we create a strong cross-borderplatform, and continue to build a client-first culture that strengthens and deepens our relationships with clients.
Core business performanceCanadian Retail and Business Banking reported net income of $719 million for the third quarter, up $53 million or 8% from the third quarter a year ago.Excluding items of note, adjusted net income(1) was $720 million, up $53 million or 8% from the third quarter a year ago. Solid volume growth and higher feeswere partially offset by narrower spreads and higher spending on strategic initiatives.
Canadian Retail and Business Banking continued to make progress against our objectives of leadership in profitable revenue growth and client experience.During the third quarter of 2017:• CIBC earned the highest overall score for the fourth consecutive year for online banking functionality among the five largest retail banks in Canada in
Forrester Research Inc.’s 2017 Canadian Online Banking Benchmark report;• CIBC ranked #1 among the six largest retail banks in Canada for the third consecutive year in the Investment Executive 2017 Report Card on Banks; and• CIBC was the first Canadian financial institution to offer all three leading mobile wallets and the first major Canadian bank to introduce free mobile credit
scores for clients.

Canadian Wealth Management reported net income of $136 million for the third quarter, down $370 million or 73% from the third quarter a year ago,which included a gain of $383 million, net of transaction costs, on the sale of our minority investment in American Century Investments. Excluding this gain andother items of note, adjusted net income(1) was $136 million, up $12 million or 10% from the third quarter a year ago, driven by higher revenue, partially offsetby higher expenses. The higher revenue was driven primarily by growth in fee-based client assets and higher commission revenue from debt and equity issuanceactivity.
During the third quarter of 2017, Canadian Wealth Management continued to make progress against our objectives of enhancing client experience,driving asset growth, and simplifying our business platform:• We introduced a suite of new, lower-cost CIBC Passive Portfolios to improve value and accessibility for Canadian investors;• We enhanced our investment lineup including management fee reductions, lower investment minimums and a simplified product offering; and• We launched the CIBC Active Global Currency Pool for institutional investors, leveraging our 20-year track record of managing active currency strategies
for institutional investors.
U.S. Commercial Banking and Wealth Management reported net income of $40 million for the third quarter, up $17 million or 74% from the thirdquarter a year ago. Excluding items of note, adjusted net income(1) was $44 million, up $19 million or 76% from the third quarter a year ago, primarily due tothe inclusion of the results of The PrivateBank in the current quarter.
During the third quarter of 2017, U.S. Commercial Banking and Wealth Management:• Completed the acquisition of The PrivateBank, a Chicago-based commercial bank with personal banking and wealth management capabilities;• Entered into a definitive agreement to acquire Geneva Advisors, a private wealth management firm headquartered in Chicago. This transaction is expected
to close in the fourth quarter at which time it will become part of CIBC’s private wealth management business in the U.S.; and• Received first time deposit ratings from Moody’s and Fitch for The PrivateBank, expanding our capabilities to serve new and existing commercial clients.
Capital Markets reported net income of $252 million for the third quarter, down $29 million or 10% from the third quarter a year ago. Excluding items ofnote, adjusted net income(1) was $252 million, down $38 million or 13%, primarily due to lower revenue, partially offset by lower expenses. Revenue was lowerprimarily due to lower equity derivatives and interest rate trading and lower equity underwriting revenue, partially offset by higher corporate banking revenueand investment portfolio gains.
As a leading capital markets franchise in Canada serving clients around the world, Capital Markets acted during the third quarter of 2017 as:• Joint bookrunner on a US$2.0 billion bond offering for the Province of Ontario;• Sole bookrunner for TransAlta Corp.’s $1.0 billion credit facility and TransAlta Renewables Inc.’s new $500 million credit facility;• Joint bookrunner on a $1.2 billion three-tranche bond offering for Enbridge Inc.;• Financial advisor to Barrick Gold on the sale of a 50% joint venture interest in the Veladero gold mine to Shandong Gold for US$960 million; and• Joint bookrunner on $414 million of subscription receipts for Intact Financial Corporation.
Making a difference in our CommunitiesCIBC is committed to building a bank that is relevant to our clients, our team members and our communities. During the quarter:• The PrivateBank announced plans for US$10 million in charitable donations as part of a three-year US$3 billion Community Development Plan to support
the communities it serves;• More than 80 Team CIBC cyclists raised $900,000 during this year’s Tour CIBC Charles-Bruneau in support of Quebec’s Fondation Charles-Bruneau for
children affected by cancer; and• CIBC announced its sponsorship of the Toronto 2017 Invictus Games as Signature Sponsor of Team Canada and the Games’ Alumni Program.
During the quarter, CIBC was:• Recognized as one of the Best 50 Corporate Citizens in Canada by Corporate Knights; and• Named one of Canada’s 50 Most Engaged Workplaces by Achievers.
In the quarter, CIBC announced the name of its new global headquarters, CIBC Square. As the anchor tenant of the state-of-the-art urban campus, CIBC willbring together 15,000 of the bank’s Toronto-area employees into a leading-edge technology-enabled and collaborative work environment.
Victor G. DodigPresident and Chief Executive Officer
(1) For additional information, see the “Non-GAAP measures” section.
ii CIBC THIRD QUARTER 2017

Enhanced Disclosure Task ForceThe Enhanced Disclosure Task Force (EDTF), established by the Financial Stability Board, released its report “Enhancing the Risk Disclosures of Banks” in 2012,which included thirty-two disclosure recommendations. The index below provides the listing of these disclosures, along with their locations. EDTF disclosures arelocated in our 2016 Annual Report, quarterly Report to Shareholders, and supplementary packages, which may be found on our website (www.cibc.com). Noinformation on CIBC’s website, including the supplementary packages, should be considered incorporated herein by reference.
Third quarter, 2017
2016AnnualReportTopics Recommendations Disclosures
Management’sdiscussion
and analysis
Consolidatedfinancial
statements
Supplementaryregulatory
capitaldisclosure
Page references
General 1 Index of risk information – current page2 Risk terminology and measures (1) 293 Top and emerging risks 25 464 Key future regulatory ratio requirements 18, 20, 38, 41 62 6 34, 69, 72, 139
Riskgovernance,
riskmanagementand business
model
56
Risk management structureRisk culture and appetite
24 41, 4240, 43, 44
7 Risks arising from business activities 27 44, 488 Bank-wide stress testing 30 36, 46, 52, 57,
64, 68, 74
Capitaladequacyand risk-
weightedassets
9 Minimum capital requirements 17 62 29, 13910 Components of capital and reconciliation to the
consolidated regulatory balance sheet1–4 31
11 Regulatory capital flow statement 5 3312 Capital management and planning 35, 13913 Business activities and risk-weighted assets 27 7 32–34, 4814 Risk-weighted assets and capital requirements 7 30, 3215 Credit risk by major portfolios 13–20 51–5516 Risk-weighted assets flow statement 8 33–3417 Back-testing of models 21, 22 45, 51, 63, 74
Liquidity 18 Liquid assets 37 68
Funding 19 Encumbered assets 38 6920 Contractual maturities of assets, liabilities and
off-balance sheet instruments41 72
21 Funding strategy and sources 39 70
Market risk 22 Reconciliation of trading and non-tradingportfolios to the consolidated balance sheet
34 62
23 Significant trading and non-trading market riskfactors
34–36 62–66
24 Model assumptions, limitations and validationprocedures
62–66
25 Stress testing and scenario analysis 36, 64
Credit risk 26 Analysis of credit risk exposures 28–33 67 9–12 52–60,121–123, 163
27 Impaired loan and forbearance policies 28, 31 50, 57, 77, 10328 Reconciliation of impaired loans and the
allowance for credit losses28, 31 58 50, 57, 121
29 Counterparty credit risk arising from derivatives 31 12, 30(2) 49, 53,133–134
30 Credit risk mitigation 28 12, 25 49, 50, 55,133–134
Other risks 31 Other risks 42 73–7532 Discussion of publicly known risk events 64 74, 153
(1) A detailed glossary of our risk and capital terminology is included on page 174 of our 2016 Annual Report.(2) Included in our supplementary financial information package.
CIBC THIRD QUARTER 2017 iii

Management’s discussion and analysisManagement’s discussion and analysis (MD&A) is provided to enable readers to assess CIBC’s financial condition and results of operations as at and for thequarter and nine months ended July 31, 2017 compared with corresponding periods. The MD&A should be read in conjunction with our 2016 Annual Reportand the unaudited interim consolidated financial statements included in this report. Unless otherwise indicated, all financial information in this MD&A hasbeen prepared in accordance with International Financial Reporting Standards (IFRS or GAAP) and all amounts are expressed in Canadian dollars. Certaindisclosures in the MD&A have been shaded as they form an integral part of the interim consolidated financial statements. The MD&A is current as ofAugust 23, 2017. Additional information relating to CIBC is available on SEDAR at www.sedar.com and on the U.S. Securities and Exchange Commission’s(SEC) website at www.sec.gov. No information on CIBC’s website (www.cibc.com) should be considered incorporated herein by reference. A glossary of termsused throughout this quarterly report can be found on pages 172 to 177 of our 2016 Annual Report.
Contents
2 External reporting changes 16 Financial condition16 Review of condensed consolidated balance sheet
3 Third quarter financial highlights 17 Capital resources22 Off-balance sheet arrangements
4 Overview4 Financial results 24 Management of risk7 Significant events 24 Risk overview7 Review of quarterly financial information 28 Credit risk8 Economic outlook 34 Market risk
37 Liquidity risk9 Non-GAAP measures 42 Other risks
10 Strategic business units overview 43 Accounting and control matters10 Canadian Retail and Business Banking 43 Critical accounting policies and estimates11 Canadian Wealth Management 43 Accounting developments12 U.S. Commercial Banking and Wealth Management 45 Regulatory developments13 Capital Markets 46 Controls and procedures14 Corporate and Other 46 Related-party transactions
A NOTE ABOUT FORWARD-LOOKING STATEMENTS: From time to time, we make written or oral forward-looking statements within the meaning of certain securities laws,including in this report, in other filings with Canadian securities regulators or the SEC and in other communications. All such statements are made pursuant to the “safe harbour”provisions of, and are intended to be forward-looking statements under applicable Canadian and U.S. securities legislation, including the U.S. Private Securities Litigation Reform Actof 1995. These statements include, but are not limited to, statements made in the “Overview – Financial results”, “Overview – Significant events”, “Overview – Economic outlook”,“Financial condition – Capital resources”, “Management of risk – Risk overview”, “Management of risk – Credit risk”, “Management of risk – Market risk”, “Management of risk –Liquidity risk”, “Accounting and control matters – Critical accounting policies and estimates”, and “Accounting and control matters – Regulatory developments” sections of thisreport and other statements about our operations, business lines, financial condition, risk management, priorities, targets, ongoing objectives, strategies, the regulatory environmentin which we operate and outlook for calendar year 2017 and subsequent periods. Forward-looking statements are typically identified by the words “believe”, “expect”, “anticipate”,“intend”, “estimate”, “forecast”, “target”, “objective” and other similar expressions or future or conditional verbs such as “will”, “should”, “would” and “could”. By their nature,these statements require us to make assumptions, including the economic assumptions set out in the “Overview – Economic outlook” section of this report, and are subject toinherent risks and uncertainties that may be general or specific. A variety of factors, many of which are beyond our control, affect our operations, performance and results, and couldcause actual results to differ materially from the expectations expressed in any of our forward-looking statements. These factors include: credit, market, liquidity, strategic, insurance,operational, reputation and legal, regulatory and environmental risk; the effectiveness and adequacy of our risk management and valuation models and processes; legislative orregulatory developments in the jurisdictions where we operate, including the Dodd-Frank Wall Street Reform and Consumer Protection Act and the regulations issued and to beissued thereunder, the Organisation for Economic Co-operation and Development Common Reporting Standard, and regulatory reforms in the United Kingdom and Europe, the BaselCommittee on Banking Supervision’s global standards for capital and liquidity reform, and those relating to bank recapitalization legislation and the payments system in Canada;amendments to, and interpretations of, risk-based capital guidelines and reporting instructions, and interest rate and liquidity regulatory guidance; the resolution of legal andregulatory proceedings and related matters; the effect of changes to accounting standards, rules and interpretations; changes in our estimates of reserves and allowances; changes intax laws; changes to our credit ratings; political conditions and developments, including changes relating to economic or trade matters; the possible effect on our business ofinternational conflicts and the war on terror; natural disasters, public health emergencies, disruptions to public infrastructure and other catastrophic events; reliance on third parties toprovide components of our business infrastructure; potential disruptions to our information technology systems and services; increasing cyber security risks which may include theft ofassets, unauthorized access to sensitive information, or operational disruption; social media risk; losses incurred as a result of internal or external fraud; anti-money laundering; theaccuracy and completeness of information provided to us concerning clients and counterparties; the failure of third parties to comply with their obligations to us and our affiliates orassociates; intensifying competition from established competitors and new entrants in the financial services industry including through internet and mobile banking; technologicalchange; global capital market activity; changes in monetary and economic policy; currency value and interest rate fluctuations, including as a result of market and oil price volatility;general business and economic conditions worldwide, as well as in Canada, the U.S. and other countries where we have operations, including increasing Canadian household debtlevels and global credit risks; our success in developing and introducing new products and services, expanding existing distribution channels, developing new distribution channels andrealizing increased revenue from these channels; changes in client spending and saving habits; our ability to attract and retain key employees and executives; our ability to successfullyexecute our strategies and complete and integrate acquisitions and joint ventures; the risk that expected synergies and benefits of the acquisition of PrivateBancorp, Inc. will not berealized within the expected time frame or at all; and our ability to anticipate and manage the risks associated with these factors. This list is not exhaustive of the factors that mayaffect any of our forward-looking statements. These and other factors should be considered carefully and readers should not place undue reliance on our forward-looking statements.Any forward-looking statements contained in this report represent the views of management only as of the date hereof and are presented for the purpose of assisting ourshareholders and financial analysts in understanding our financial position, objectives and priorities and anticipated financial performance as at and for the periods ended on the datespresented, and may not be appropriate for other purposes. We do not undertake to update any forward-looking statement that is contained in this report or in other communicationsexcept as required by law.
CIBC THIRD QUARTER 2017 1

External reporting changes
The following external reporting changes were made in the third quarter of 2017. Prior period amounts were reclassified accordingly. The changes impacted theresults of our strategic business units (SBUs), but there was no impact on prior period consolidated net income resulting from these reclassifications.
U.S. Commercial Banking and Wealth ManagementOn June 23, 2017, we completed the acquisition of PrivateBancorp, Inc. (PrivateBancorp) and its subsidiary, The PrivateBank and Trust Company (ThePrivateBank) (see the “Significant events” section for additional information). As a result of the acquisition, a new U.S. Commercial Banking and WealthManagement SBU was created, and includes the following lines of business:• Commercial banking;• Wealth management; and• Other.
In addition to the results of The PrivateBank, U.S. Commercial Banking and Wealth Management includes:• The results of CIBC Atlantic Trust Private Wealth Management (CIBC Atlantic Trust) in the wealth management line of business, previously reported in the
private wealth management line of business within the Wealth Management SBU; and• The results of U.S. real estate finance in the commercial banking line of business, previously reported in the corporate and investment banking line of
business within Capital Markets.
SBU name changesGiven the addition of the U.S. Commercial Banking and Wealth Management SBU, we have changed the name of our Retail and Business Banking SBU toCanadian Retail and Business Banking, and the name of our Wealth Management SBU to Canadian Wealth Management. The lines of business within each SBUremain unchanged, apart from the reclassifications noted above.
Changes to our organizational structureOn June 20, 2017, we announced changes to CIBC’s leadership team and organizational structure to further accelerate our transformation. As a result of thesechanges, we expect to make further external reporting changes in the fourth quarter of 2017.
2 CIBC THIRD QUARTER 2017
Third quarter financial highlightsAs at or for the three
months endedAs at or for the nine
months ended
Unaudited2017
Jul. 31 (1)2017
Apr. 302016
Jul. 312017
Jul. 31 (1)2016
Jul. 31
Financial results ($ millions)Net interest income $ 2,276 $ 2,095 $ 2,113 $ 6,513 $ 6,256Non-interest income 1,828 1,603 2,023 5,498 5,098
Total revenue 4,104 3,698 4,136 12,011 11,354Provision for credit losses 209 179 243 600 829Non-interest expenses 2,452 2,275 2,218 7,001 6,624
Income before income taxes 1,443 1,244 1,675 4,410 3,901Income taxes 346 194 234 856 537
Net income $ 1,097 $ 1,050 $ 1,441 $ 3,554 $ 3,364
Net income attributable to non-controlling interests $ 4 $ 5 $ 6 $ 14 $ 16
Preferred shareholders 9 10 9 28 28Common shareholders 1,084 1,035 1,426 3,512 3,320
Net income attributable to equity shareholders $ 1,093 $ 1,045 $ 1,435 $ 3,540 $ 3,348
Financial measuresReported efficiency ratio 59.7 % 61.5 % 53.6 % 58.3 % 58.3 %Adjusted efficiency ratio (2) 57.3 % 58.9 % 57.8 % 57.5 % 58.0 %Loan loss ratio (3) 0.24 % 0.25 % 0.32 % 0.25 % 0.32 %Reported return on common shareholders’ equity 16.3 % 17.7 % 26.8 % 19.3 % 21.0 %Adjusted return on common shareholders’ equity (2) 17.3 % 18.1 % 19.8 % 18.4 % 19.1 %Net interest margin 1.66 % 1.63 % 1.64 % 1.63 % 1.66 %Net interest margin on average interest-earning assets 1.85 % 1.81 % 1.87 % 1.82 % 1.90 %Return on average assets 0.80 % 0.82 % 1.12 % 0.89 % 0.89 %Return on average interest-earning assets 0.89 % 0.91 % 1.28 % 0.99 % 1.02 %Total shareholder return (0.65)% 0.58 % (0.94)% 11.41 % 2.59 %Reported effective tax rate 24.0 % 15.6 % 14.0 % 19.4 % 13.8 %Adjusted effective tax rate (2) 24.1 % 15.7 % 15.4 % 19.7 % 16.2 %
Common share informationPer share ($) – basic earnings $ 2.61 $ 2.59 $ 3.61 $ 8.68 $ 8.40
– reported diluted earnings 2.60 2.59 3.61 8.67 8.38– adjusted diluted earnings (2) 2.77 2.64 2.67 8.29 7.62– dividends 1.27 1.27 1.21 3.78 3.54– book value 64.29 61.42 54.54 64.29 54.54
Share price ($) – high 109.57 119.86 104.19 119.86 104.19– low 104.87 109.71 96.84 97.76 83.33– closing 108.22 110.25 99.19 108.22 99.19
Shares outstanding (thousands) – weighted-average basic (4)(5) 415,561 399,807 394,753 404,388 395,459– weighted-average diluted (4) 416,385 400,577 395,328 405,139 395,975– end of period (4)(5) 436,059 401,608 394,838 436,059 394,838
Market capitalization ($ millions) $ 47,190 $ 44,277 $ 39,164 $ 47,190 $ 39,164
Value measuresDividend yield (based on closing share price) 4.7 % 4.7 % 4.9 % 4.7 % 4.8 %Reported dividend payout ratio 50.9 % 49.0 % 33.5 % 44.2 % 42.2 %Adjusted dividend payout ratio (2) 47.8 % 48.1 % 45.2 % 46.2 % 46.4 %Market value to book value ratio 1.68 1.80 1.82 1.68 1.82
On- and off-balance sheet information ($ millions)Cash, deposits with banks and securities $ 108,297 $ 110,472 $ 98,093 $ 108,297 $ 98,093Loans and acceptances, net of allowance 358,993 330,752 312,273 358,993 312,273Total assets 560,912 528,591 494,490 560,912 494,490Deposits 439,357 413,128 389,573 439,357 389,573Common shareholders’ equity 28,036 24,668 21,533 28,036 21,533Average assets 543,138 528,099 511,925 533,421 502,908Average interest-earning assets 486,949 475,067 448,834 477,681 439,145Average common shareholders’ equity 26,447 23,932 21,198 24,356 21,111Assets under administration (AUA) (6)(7) 2,105,626 2,120,972 1,993,740 2,105,626 1,993,740Assets under management (AUM) (7) 201,275 198,941 179,903 201,275 179,903
Balance sheet quality (All-in basis) and liquidity measuresRisk-weighted assets (RWA) ($ millions)
Common Equity Tier 1 (CET1) capital RWA $ 198,459 $ 175,431 $ 168,077 $ 198,459 $ 168,077Tier 1 capital RWA 198,686 175,431 168,407 198,686 168,407Total capital RWA 198,867 175,431 168,690 198,867 168,690
Capital ratiosCET1 ratio 10.4 % 12.2 % 10.9 % 10.4 % 10.9 %Tier 1 capital ratio 11.9 % 13.5 % 12.4 % 11.9 % 12.4 %Total capital ratio 13.7 % 15.4 % 14.4 % 13.7 % 14.4 %
Basel III leverage ratioLeverage ratio exposure ($ millions) $ 602,314 $ 572,104 $ 537,172 $ 602,314 $ 537,172Leverage ratio 3.9 % 4.1 % 3.9 % 3.9 % 3.9 %
Liquidity coverage ratio 125 % 125 % 120 % n/a n/a
Other informationFull-time equivalent employees 45,685 43,444 43,741 45,685 43,741(1) In the third quarter of 2017, we completed the acquisition of The PrivateBank. See “Significant events” for additional details.(2) For additional information, see the “Non-GAAP measures” section.(3) The ratio is calculated as the provision for credit losses on impaired loans to average loans and acceptances, net of allowance for credit losses.(4) Excludes 2,010,890 common shares which are issued and outstanding but which have not been acquired by a third party. These shares were issued as a component of our acquisition of The PrivateBank. These
shares are currently held on behalf of CIBC, and may be cancelled at CIBC’s discretion.(5) Excludes 190,789 unvested restricted shares as at July 31, 2017 (April 30, 2017: nil; July 31, 2016: nil).(6) Includes the full contract amount of AUA or custody under a 50/50 joint venture between CIBC and The Bank of New York Mellon of $1,681.3 billion (April 30, 2017: $1,699.4 billion; July 31, 2016:
$1,598.8 billion).(7) AUM amounts are included in the amounts reported under AUA.n/a Not applicable.
CIBC THIRD QUARTER 2017 3

Overview
Financial resultsReported net income for the quarter was $1,097 million, compared with $1,441 million for the same quarter last year, and $1,050 million for the prior quarter.The current quarter included the results of The PrivateBank after the close of the acquisition on June 23, 2017, which contributed $23 million to net income,excluding transaction and integration-related costs(2).
Adjusted net income(1) for the quarter was $1,166 million, compared with $1,072 million for the same quarter last year, and $1,070 million for the priorquarter.
Reported diluted earnings per share (EPS) for the quarter was $2.60, compared with $3.61 for the same quarter last year, and $2.59 for the prior quarter.Adjusted diluted EPS(1) for the quarter was $2.77, compared with $2.67 for the same quarter last year, and $2.64 for the prior quarter.The EPS and adjusted diluted EPS for the current quarter included the results of The PrivateBank after the close of the acquisition on June 23, 2017. EPS
was also impacted by the issuance of CIBC common shares, as detailed in Note 3 to our interim consolidated financial statements.
Net income for the current quarter was affected by the following items of note:• $45 million ($33 million after-tax) increase in legal provisions (Corporate and Other);• $38 million ($29 million after-tax) in transaction and integration-related costs(2) associated with the acquisition of The PrivateBank (Corporate and Other);
and• $10 million ($7 million after-tax) amortization of intangible assets ($1 million after-tax in Canadian Retail and Business Banking, $4 million after-tax in U.S.
Commercial Banking and Wealth Management, and $2 million after-tax in Corporate and Other).
The above items of note decreased revenue by $9 million, increased non-interest expenses by $84 million, and decreased income taxes by $24 million. Inaggregate, these items of note decreased net income by $69 million.
Net interest income(3)
Net interest income was up $163 million or 8% from the same quarter last year, primarily due to volume growth across retail products and the inclusion of theresults of The PrivateBank, partially offset by lower trading income.
Net interest income was up $181 million or 9% from the prior quarter, primarily due to the inclusion of the results of The PrivateBank, additional days inthe current quarter, volume growth across retail products, wider retail spreads, and higher treasury revenue, partially offset by lower trading income.
Net interest income for the nine months ended July 31, 2017 was up $257 million or 4% from the same period in 2016, primarily due to volume growthacross retail products and the inclusion of the results of The PrivateBank, partially offset by lower trading income and narrower retail spreads.
Non-interest income(3)
Non-interest income was down $195 million or 10% from the same quarter last year, as the same quarter last year included a gain, net of related transactioncosts, on the sale of our minority investment in American Century Investments (ACI), shown as an item of note. The decrease was partially offset by highertrading income, higher investment management and custodial fees, mutual fund fees, and the inclusion of the results of The PrivateBank in the current quarter.
Non-interest income was up $225 million or 14% from the prior quarter, primarily due to higher trading income, higher credit fees, underwriting andadvisory fees, and the inclusion of the results of The PrivateBank.
Non-interest income for the nine months ended July 31, 2017 was up $400 million or 8% from the same period in 2016, primarily due to a gain on thesale and lease back of certain retail properties, shown as an item of note, higher trading income, investment management and custodial fees, mutual fund fees,and credit fees. The increase was partially offset by the gain related to ACI noted above, and a gain on the sale of a processing centre, shown as an item ofnote in the same period last year.
Provision for credit lossesProvision for credit losses was down $34 million or 14% from the same quarter last year. In Canadian Retail and Business Banking, the provision was downprimarily due to reversals in the commercial banking portfolio. In U.S. Commercial Banking and Wealth Management, the provision was up primarily due tolosses in our pre-existing U.S. real estate finance portfolio, and the inclusion of the results of The PrivateBank. In Capital Markets, the provision was down, asthe same quarter last year included losses in our exited European leveraged finance portfolio, shown as an item of note. In Corporate and Other, the reversal ofcredit losses was up primarily due to a higher reduction in the collective allowance.
Provision for credit losses was up $30 million or 17% from the prior quarter. In Canadian Retail and Business Banking, the provision was down primarilydue to reversals in the commercial banking portfolio. In U.S. Commercial Banking and Wealth Management, the provision was up primarily due to losses in ourpre-existing U.S. real estate finance portfolio, and the inclusion of the results of The PrivateBank. In Capital Markets, the current quarter included a provision forcredit losses compared with a reversal of credit losses in the prior quarter, primarily due to lower reversals in the oil and gas sector. In Corporate and Other, thereversal of credit losses was comparable with the prior quarter.
(1) For additional information, see the “Non-GAAP measures” section.(2) Transaction costs include legal and other advisory fees, as well as financing costs associated with: (i) pre-funding the cash component of the merger consideration; and (ii) interest incurred on the obligation
payable to dissenting shareholders. Integration costs are comprised of direct and incremental costs incurred as part of planning for integrating the businesses of The PrivateBank with CIBC, including enablingcross-sell opportunities and expansion of services in the U.S. market, the upgrade and conversion of systems and processes, project management, integration-related travel, consulting fees and marketing costsrelated to rebranding activities.
(3) Trading activities and related risk management strategies can periodically shift trading income between net interest income and non-interest income. Therefore, we view total trading income as the mostappropriate measure of trading performance.
4 CIBC THIRD QUARTER 2017

Provision for credit losses for the nine months ended July 31, 2017 was down $229 million or 28% from the same period in 2016. In Canadian Retail andBusiness Banking, the provision was up primarily due to higher write-offs in the card and personal lending portfolios, and higher losses in the mortgageportfolio, partially offset by reversals in the commercial banking portfolio. In U.S. Commercial Banking and Wealth Management, the provision was up primarilydue to losses in our pre-existing U.S real estate finance portfolio, and the inclusion of the results of The PrivateBank. In Capital Markets, the current periodincluded a reversal of credit losses compared with a provision for credit losses in the same period in 2016, primarily due to better performance in the oil and gassector. The same period last year also included losses in our exited European leveraged finance portfolio, as noted above. In Corporate and Other, the currentperiod included a reversal of credit losses of $20 million compared with a provision for credit losses of $117 million in the same period in 2016, as the sameperiod last year included increases in the collective allowance, shown as items of note.
Non-interest expensesNon-interest expenses were up $234 million or 11% from the same quarter last year, primarily due to the inclusion of the results of The PrivateBank. Inaddition, the current quarter included higher spending on strategic initiatives, as well as transaction and integration-related costs associated with the acquisitionand an increase in legal provisions, shown as items of note.
Non-interest expenses were up $177 million or 8% from the prior quarter, primarily due to the inclusion of the results of The PrivateBank, the legalprovisions noted above, higher spending on strategic initiatives, and higher salaries.
Non-interest expenses for the nine months ended July 31, 2017 were up $377 million or 6% from the same period in 2016, primarily due to the inclusionof the results of The PrivateBank, higher spending on strategic initiatives, higher employee-related compensation and benefits, and transaction and integration-related costs as noted above. The increase was partially offset by lower legal provisions, shown as items of note in both periods.
Income taxesIncome tax expense was up $112 million or 48% from the same quarter last year notwithstanding lower income, primarily due to substantially lower tax-exempt income and the acquisition of The PrivateBank. The same quarter last year included the impact of a lower effective tax rate on the gain on sale of ACInoted above.
Income tax expense was up $152 million or 78% from the prior quarter, primarily due to substantially lower tax-exempt income and the acquisition of ThePrivateBank, as well as higher income.
Income tax expense for the nine months ended July 31, 2017 was up $319 million or 59% from the same period in 2016, largely due to substantiallylower tax-exempt income, the acquisition of The PrivateBank, and higher income. The increase was partially offset by the impact of a lower effective tax rate onthe gain on the sale and lease back of certain retail properties noted above. The same period in 2016 included an income tax recovery from the settlement oftransfer pricing-related matters, and an income tax recovery arising from a change in our expected utilization of certain tax loss carryforwards, both shown asitems of note.
In prior years, the Canada Revenue Agency (CRA) issued reassessments disallowing the deduction of approximately $3 billion of the 2005 Enronsettlement payments and related legal expenses. The matter is currently in litigation. The Tax Court of Canada trial on the deductibility of the Enron payments isexpected to commence in 2018.
Should we successfully defend our tax filing position in its entirety, we would recognize an additional accounting tax benefit of $231 million and taxablerefund interest of approximately $196 million. Should we fail to defend our position in its entirety, we would incur an additional tax expense of approximately$820 million and non-deductible interest of approximately $157 million.
The 2015 Canadian federal budget, released on April 21, 2015, contained new rules for “synthetic equity arrangements” which eliminated the taxdeductibility of Canadian inter-corporate dividends for Canadian corporations in certain circumstances. The rules became law effective as of November 1, 2015,with a set of transition rules that applied between November 1, 2015 and April 30, 2017. The new rules have resulted in a higher effective tax rate, as the taxdeductibility of certain Canadian corporate dividends is diminished.
In June 2016, the CRA reassessed CIBC approximately $118 million of additional income tax by denying the tax deductibility of certain 2011 Canadiancorporate dividends on the basis that they were part of a “dividend rental arrangement”. In May 2017, the CRA reassessed CIBC additional income tax ofapproximately $180 million related to the tax deductibility of dividends during the 2012 taxation year. The circumstances of the dividends subject to thereassessments are similar to those prospectively addressed by the rules in the 2015 Canadian federal budget. It is possible that subsequent years may bereassessed for similar activities. CIBC is confident that its tax filing positions were appropriate and intends to defend itself vigorously. Accordingly, no amountshave been accrued in the consolidated financial statements.
Foreign exchangeThe following table provides the estimated impact of U.S. dollar translation on key lines of our interim consolidated statement of income, as a result of changes in averageexchange rates.
For the threemonths ended
For the ninemonths ended
$ millions, except per share amounts
Jul. 31, 2017 (1)
vs.Jul. 31, 2016
Jul. 31, 2017 (1)
vs.Apr. 30, 2017
Jul. 31, 2017 (1)
vs.Jul. 31, 2016
Estimated increase (decrease) in:Total revenue $ (3) $ (24) $ (5)Provision for credit losses – (1) –Non-interest expenses (2) (14) (3)Income taxes – (1) –Net income (1) (8) (2)
Impact on EPS:Basic $ – $ (0.02) $ –Diluted – (0.02) –
Average USD appreciation (depreciation) relative to CAD (0.4) % (3.2) % (0.3) %(1) In the third quarter of 2017, we completed the acquisition of The PrivateBank. See “Significant events” for additional details.
CIBC THIRD QUARTER 2017 5

Impact of items of note in prior periods(1)
Net income for the prior quarters was affected by the following items of note:
Q2, 2017• $20 million ($15 million after-tax) in transaction and integration-related costs(2) associated with the acquisition of The PrivateBank (Corporate and Other);
and• $6 million ($5 million after-tax) amortization of intangible assets ($1 million after-tax in Canadian Retail and Business Banking, $1 million after-tax in U.S.
Commercial Banking and Wealth Management, and $3 million after-tax in Corporate and Other).
The above items of note decreased revenue by $7 million, increased non-interest expenses by $19 million, and decreased income taxes by $6 million. Inaggregate, these items of note decreased net income by $20 million.
Q1, 2017• $299 million ($245 million after-tax) gain on the sale and lease back of certain retail properties (Canadian Retail and Business Banking); and• $6 million ($4 million after-tax) amortization of intangible assets ($1 million after-tax in Canadian Retail and Business Banking, $2 million after-tax in
U.S. Commercial Banking and Wealth Management, and $1 million after-tax in Corporate and Other).
The above items of note increased revenue by $299 million, non-interest expenses by $6 million, and income taxes by $52 million. In aggregate, these items ofnote increased net income by $241 million.
Q3, 2016• $428 million ($383 million after-tax) gain, net of related transaction costs, on the sale of our minority investment in ACI (Canadian Wealth Management);• $40 million ($30 million after-tax) of loan losses in our exited European leveraged finance portfolio (Capital Markets);• $28 million ($21 million after-tax) gain from the structured credit run-off business (Capital Markets); and• $7 million ($5 million after-tax) amortization of intangible assets ($1 million after-tax in Canadian Retail and Business Banking, $1 million after-tax in
Canadian Wealth Management, $2 million after-tax in U.S. Commercial Banking and Wealth Management, and $1 million after-tax in Corporate andOther).
The above items of note increased revenue by $459 million, provision for credit losses by $40 million, non-interest expenses by $10 million, and income taxes by$40 million. In aggregate, these items of note increased net income by $369 million.
Q2, 2016• $77 million ($56 million after-tax) increase in legal provisions (Corporate and Other);• $53 million ($47 million after-tax) gain, net of related transaction and severance costs, on the sale of a processing centre (Corporate and Other);• $40 million ($29 million after-tax) increase in the portion of the collective allowance recognized in Corporate and Other(3);• $30 million income tax recovery due to the settlement of transfer pricing-related matters (Canadian Retail and Business Banking);• $11 million ($8 million after-tax) loss from the structured credit run-off business (Capital Markets); and• $7 million ($5 million after-tax) amortization of intangible assets ($1 million after-tax in Canadian Retail and Business Banking, $1 million after-tax in
Canadian Wealth Management, $1 million after-tax in U.S. Commercial Banking and Wealth Management, and $2 million after-tax in Corporate andOther).
The above items of note increased revenue by $53 million, provision for credit losses by $40 million and non-interest expenses by $95 million, and decreasedincome taxes by $61 million. In aggregate, these items of note decreased net income by $21 million.
Q1, 2016• $69 million ($51 million after-tax) increase in the portion of the collective allowance recognized in Corporate and Other(3);• $15 million income tax recovery arising from a change in our expected utilization of certain tax loss carryforwards, primarily due to the sale of our minority
investment in ACI (Corporate and Other);• $9 million ($7 million after-tax) amortization of intangible assets ($2 million after-tax in Canadian Retail and Business Banking, $1 million after-tax in
Canadian Wealth Management, $2 million after-tax in U.S. Commercial Banking and Wealth Management, and $2 million after-tax in Corporate andOther); and
• $5 million ($4 million after-tax) loss from the structured credit run-off business (Capital Markets).
The above items of note decreased revenue by $4 million, increased provision for credit losses by $69 million and non-interest expenses by $10 million, anddecreased income taxes by $36 million. In aggregate, these items of note decreased net income by $47 million.
(1) Certain information has been reclassified to conform to the presentation adopted in the current period. See “External reporting changes” for additional details.(2) Transaction costs include legal and other advisory fees, as well as financing costs associated with pre-funding the cash component of the merger consideration. Integration costs are comprised of direct and
incremental costs incurred as part of planning for integrating the businesses of The PrivateBank with CIBC, including enabling cross-sell opportunities and expansion of services in the U.S. market, the upgradeand conversion of systems and processes, project management, integration-related travel, consulting fees and marketing costs related to rebranding activities.
(3) Relates to collective allowance, except for: (i) residential mortgages greater than 90 days delinquent; (ii) personal loans and scored small business loans greater than 30 days delinquent; and (iii) net write-offsfor the card portfolio, which are all reported in the respective SBUs.
6 CIBC THIRD QUARTER 2017

Significant eventsAcquisition of PrivateBancorp, Inc.On June 23, 2017, we completed the acquisition of PrivateBancorp, Inc. (PrivateBancorp) and its subsidiary, The PrivateBank and Trust Company (ThePrivateBank) for total consideration of US$5.0 billion (C$6.6 billion). This acquisition expands our U.S. presence which diversifies earnings and strengthens ourplatform for long-term growth. The acquisition also creates a platform for CIBC to deliver high-quality middle market commercial and private bankingcapabilities, which advances our client-focused strategy. The results of the acquired business have been consolidated from the date of close and are included inthe U.S. Commercial Banking and Wealth Management SBU. For additional information, see Note 3 to our interim consolidated financial statements.
Acquisition of Geneva AdvisorsOn July 10, 2017, we announced that we had entered into a definitive agreement to acquire Geneva Advisors, a private wealth management firm,headquartered in Chicago. Geneva Advisors is an independent private wealth management firm focused on high net worth clients, which will expand CIBC’sprivate wealth management client base and investment management capabilities in the U.S.
Under the terms of the agreement, CIBC will acquire Geneva Advisors for up to US$200 million, of which up to US$135 million will be paid at closing andup to US$65 million is contingent on future performance conditions being met. The consideration will be paid 25% in cash and 75% in the form of CIBCcommon shares, including the portion that is contingent on future performance conditions being met. The transaction is expected to close in the fourth quarterof fiscal 2017, subject to the satisfaction of customary closing conditions, including receipt of regulatory approvals. The results of the acquired business will beconsolidated from the date of close and will be included in our U.S. Commercial Banking and Wealth Management SBU.
Launch of Simplii Financial and wind-down of President’s Choice Financial consumer banking offerOn August 16, 2017, we announced both the launch of Simplii Financial and the wind-down of our President’s Choice Financial branded consumer bankingoffer with Loblaw Companies Limited (Loblaw). Under the terms of the wind-down agreement negotiated with Loblaw, CIBC is required to pay certain feesto Loblaw. In addition, as a result of the agreement, we will incur ancillary asset impairment and severance costs, as well as ongoing project-related costs.In aggregate, CIBC expects to incur fees and charges of approximately $100 million ($74 million after-tax) in the fourth quarter of 2017.
Aeroplan developmentsAir Canada announced on May 11, 2017, that it will not be renewing its exclusive Aeroplan partnership with Aimia Inc. (Aimia) upon the expiry of the contractin 2020. CIBC’s Aeroplan clients are not immediately impacted by this announcement, as Aeroplan members may continue to collect miles and redeem themfor Air Canada travel until Aimia’s contract with Air Canada expires in 2020.
Lease of new premisesOn April 12, 2017, we announced that we had entered into a lease agreement to become the anchor tenant at a new office complex in downtown Toronto.We have agreed to lease up to 1.75 million square feet of total office space in two buildings to be constructed at the site within the next six years. Theaggregate future minimum lease commitments related to the lease, which begins in 2020, are $2.3 billion.
Sale and lease back of certain retail propertiesDuring the first quarter, we sold and leased back 89 retail properties located mainly in Ontario and British Columbia, and recognized a gain of $299 million($245 million after-tax) in our Canadian Retail and Business Banking SBU.
Review of quarterly financial information
$ millions, except per share amounts,for the three months ended 2017 2016 2015
Jul. 31 Apr. 30 Jan. 31 Oct. 31 Jul. 31 Apr. 30 Jan. 31 Oct. 31
RevenueCanadian Retail and Business Banking $ 2,342 $ 2,225 $ 2,596 $ 2,290 $ 2,225 $ 2,150 $ 2,190 $ 2,176Canadian Wealth Management (1) 603 601 589 564 982 534 543 556U.S. Commercial Banking and Wealth Management (2) 239 101 112 105 93 81 103 98Capital Markets (1)(2) 679 690 829 624 769 718 638 524Corporate and Other (2) 241 81 83 98 67 148 113 129
Total revenue $ 4,104 $ 3,698 $ 4,209 $ 3,681 $ 4,136 $ 3,631 $ 3,587 $ 3,483
Net interest income $ 2,276 $ 2,095 $ 2,142 $ 2,110 $ 2,113 $ 2,037 $ 2,106 $ 2,043Non-interest income 1,828 1,603 2,067 1,571 2,023 1,594 1,481 1,440
Total revenue 4,104 3,698 4,209 3,681 4,136 3,631 3,587 3,483Provision for credit losses 209 179 212 222 243 324 262 198Non-interest expenses 2,452 2,275 2,274 2,347 2,218 2,242 2,164 2,383
Income before income taxes 1,443 1,244 1,723 1,112 1,675 1,065 1,161 902Income taxes 346 194 316 181 234 124 179 124
Net income $ 1,097 $ 1,050 $ 1,407 $ 931 $ 1,441 $ 941 $ 982 $ 778
Net income attributable to:Non-controlling interests $ 4 $ 5 $ 5 $ 4 $ 6 $ 5 $ 5 $ 2Equity shareholders 1,093 1,045 1,402 927 1,435 936 977 776
EPS – basic $ 2.61 $ 2.59 $ 3.50 $ 2.32 $ 3.61 $ 2.35 $ 2.44 $ 1.93– diluted 2.60 2.59 3.50 2.32 3.61 2.35 2.43 1.93
(1) Certain information has been reclassified to conform to the presentation adopted in the current period. See “External reporting changes” for additional details.(2) Capital Markets and U.S. Commercial Banking and Wealth Management revenue and income taxes are reported on a taxable equivalent basis (TEB) with an equivalent offset in the revenue and income taxes
of Corporate and Other.
Our quarterly results are modestly affected by seasonal factors. The second quarter has fewer days as compared with the other quarters, generally leading tolower earnings. The summer months (July – third quarter and August – fourth quarter) typically experience lower levels of market activity, which affects ourbrokerage, investment management, and Capital Markets activities.
CIBC THIRD QUARTER 2017 7

RevenueCanadian Retail and Business Banking revenue has benefited from volume growth, partially offset by the continued low interest rate environment, and attritionin our exited FirstLine mortgage broker business. The first quarter of 2017 included a gain on the sale and lease back of certain retail properties.
In Canadian Wealth Management, we recognized a gain, net of related transaction costs, on the sale of our minority investment in ACI in the third quarterof 2016. We ceased recognition of income from equity-accounted associates relating to ACI following the announcement of the sale in the first quarter of2016.
U.S. Commercial Banking and Wealth Management includes the revenue of The PrivateBank after the close of the acquisition on June 23, 2017.Capital Markets revenue is influenced, to a large extent, by market conditions and activity in the equity derivatives business, which includes tax-exempt
income. Tax-exempt income is substantially lower in the third quarter of 2017 than in prior quarters. The first quarter of 2017 included higher trading revenue,while the third quarter of 2016 included a gain from the structured credit run-off business.
Corporate and Other includes the offset related to the TEB component of tax-exempt income reported in the revenue of Capital Markets and U.S.Commercial Banking and Wealth Management. The second quarter of 2016 included a gain on sale of a processing centre.
Provision for credit lossesProvision for credit losses is dependent upon the credit cycle in general and on the credit performance of the loan portfolios. In Canadian Retail and BusinessBanking, losses in the card and personal lending portfolios trended higher after the first quarter of 2016. In U.S. Commercial Banking and Wealth Management,the third quarter of 2017 included losses in our pre-existing U.S. real estate finance portfolio and the provision for credit losses of The PrivateBank after theclose of the acquisition on June 23, 2017. In Capital Markets, losses in the oil and gas sector were elevated in the fourth quarter of 2015 and the first half of2016, but performance in this sector has improved in more recent quarters. The third quarter of 2016 had higher losses in our exited European leveragedfinance portfolio. In Corporate and Other, the second and the third quarters of 2017 included reversals of the collective allowance. The first two quarters of2016 included increases in the collective allowance, primarily relating to deterioration in the commodities sector and economic conditions.
Non-interest expensesNon-interest expenses have fluctuated over the period largely due to changes in employee-related compensation and benefits, higher spending on strategicinitiatives, and movement in foreign exchange rates. Non-interest expenses increased in the third quarter of 2017, as the results of The PrivateBank wereincluded after the close of the acquisition on June 23, 2017. The third quarter of 2017 and second quarter of 2016 included legal provisions in Corporate andOther. The fourth quarters of 2016 and 2015 included restructuring charges primarily relating to employee severance.
Income taxesIncome taxes vary with changes in income subject to tax, and the jurisdictions in which the income is earned. Taxes can also be affected by the impact ofsignificant items and the level of tax-exempt income. Income taxes increased in the third quarter of 2017, primarily due to substantially lower tax-exemptincome and our acquisition of The PrivateBank. The second quarter of 2016 included an income tax recovery due to the settlement of transfer pricing-relatedmatters. The first quarter of 2016 included an income tax recovery arising from a change in our expected utilization of certain tax loss carryforwards.
Economic outlookCanada’s strong first half has it headed for nearly 3% growth in real gross domestic product in 2017. Housing and consumer spending have continued to beareas of strength, and there are signs of a positive turn for business capital spending and exports. With labour markets tightening, the Bank of Canada hasstarted a very gradual process of increasing interest rates, with a further quarter point increase likely by the end of 2017. In addition, assuming U.S. trade policydoes not prove a major barrier to Canada, another 50 basis point increase is expected in 2018, aimed at moderating growth next year to 2% to containinflation.
The U.S. appears to have gathered momentum after a slow start, with expected 2017 real gross domestic product growth of approximately 2%. Thefavourable impact on labour markets should be enough to justify an additional 25 basis point interest rate increase late in 2017 or soon thereafter, despitesluggish inflation. Consistent with Canada, growth in 2018 should be held to roughly 2%, as the U.S. Federal Reserve is expected to raise rates a further halfpercent, with risks of additional hikes should fiscal policy turn more stimulative.
Canadian Retail and Business Banking should see a moderation in consumer and mortgage lending reflecting the interest rate increases and regulatorymeasures. Business credit demand should remain healthy as capital spending plans pick up.
Growth in corporate profits should support equity-related business in Capital Markets and Canadian Wealth Management, while financing infrastructurespending should offset lower government deficits as a driver of fixed income activity. Credit quality should remain healthy given low unemployment and amodest further recovery in energy prices.
In U.S. Commercial Banking and Wealth Management, commercial banking activity should benefit from the impact of further rate hikes on margins, andfrom the financing needs associated with steady economic growth and healthy business credit quality. Wealth management could benefit as potential U.S. taxreforms and economic growth provide a greater high net worth savings pool. Although interest rates are moving higher, they remain low by historicalstandards, in support of growth in U.S. real estate finance.
8 CIBC THIRD QUARTER 2017

Non-GAAP measuresWe use a number of financial measures to assess the performance of our business lines. Some measures are calculated in accordance with GAAP (IFRS), whileother measures do not have a standardized meaning under GAAP, and accordingly, these measures may not be comparable to similar measures used by othercompanies. Investors may find these non-GAAP measures useful in analyzing financial performance. For a more detailed discussion on our non-GAAP measures,see page 13 of the 2016 Annual Report. The following table provides a reconciliation of non-GAAP to GAAP measures related to CIBC on a consolidated basis.
As at or for the threemonths ended
As at or for the ninemonths ended
$ millions2017
Jul. 31 (1)2017
Apr. 302016
Jul. 312017
Jul. 31 (1)2016
Jul. 31
Reported and adjusted diluted EPSReported net income attributable to common shareholders A $ 1,084 $ 1,035 $ 1,426 $ 3,512 $ 3,320After-tax impact of items of note (2) 69 20 (369) (152) (301)
Adjusted net income attributable to common shareholders (3) B $ 1,153 $ 1,055 $ 1,057 $ 3,360 $ 3,019
Diluted weighted-average common shares outstanding (thousands) C 416,385 400,577 395,328 405,139 395,975
Reported diluted EPS ($) A/C $ 2.60 $ 2.59 $ 3.61 $ 8.67 $ 8.38Adjusted diluted EPS ($) (3) B/C 2.77 2.64 2.67 8.29 7.62
Reported and adjusted efficiency ratioReported total revenue D $ 4,104 $ 3,698 $ 4,136 $ 12,011 $ 11,354Pre-tax impact of items of note (2) 9 7 (459) (283) (508)TEB 21 123 142 262 377
Adjusted total revenue (3) E $ 4,134 $ 3,828 $ 3,819 $ 11,990 $ 11,223
Reported non-interest expenses F $ 2,452 $ 2,275 $ 2,218 $ 7,001 $ 6,624Pre-tax impact of items of note (2) (84) (19) (10) (109) (115)
Adjusted non-interest expenses (3) G $ 2,368 $ 2,256 $ 2,208 $ 6,892 $ 6,509
Reported efficiency ratio F/D 59.7 % 61.5 % 53.6 % 58.3 % 58.3 %Adjusted efficiency ratio (3) G/E 57.3 % 58.9 % 57.8 % 57.5 % 58.0 %
Reported and adjusted dividend payout ratioDividends paid to common shareholders H $ 551 $ 508 $ 478 $ 1,552 $ 1,401Reported dividend payout ratio H/A 50.9 % 49.0 % 33.5 % 44.2 % 42.2 %Adjusted dividend payout ratio (3) H/B 47.8 % 48.1 % 45.2 % 46.2 % 46.4 %
Reported and adjusted return on common shareholders’ equityAverage common shareholders’ equity I $ 26,447 $ 23,932 $ 21,198 $ 24,356 $ 21,111Reported return on common shareholders’ equity A/I (4) 16.3 % 17.7 % 26.8 % 19.3 % 21.0 %Adjusted return on common shareholders’ equity (3) B/I (4) 17.3 % 18.1 % 19.8 % 18.4 % 19.1 %
Reported and adjusted effective tax rateReported income before income taxes J $ 1,443 $ 1,244 $ 1,675 $ 4,410 $ 3,901Pre-tax impact of items of note (2) 93 26 (409) (174) (244)
Adjusted income before income taxes (3) K $ 1,536 $ 1,270 $ 1,266 $ 4,236 $ 3,657
Reported income taxes L $ 346 $ 194 $ 234 $ 856 $ 537Tax impact of items of note (2) 24 6 (40) (22) 57
Adjusted income taxes (3) M $ 370 $ 200 $ 194 $ 834 $ 594
Reported effective tax rate L/J 24.0 % 15.6 % 14.0 % 19.4 % 13.8 %Adjusted effective tax rate (3) M/K 24.1 % 15.7 % 15.4 % 19.7 % 16.2 %
$ millions, for the three months ended
CanadianRetail and
BusinessBanking
CanadianWealth
Management
U.S. CommercialBanking and
WealthManagement (1)
CapitalMarkets
Corporateand Other
CIBCTotal
2017 Reported net income (loss) $ 719 $ 136 $ 40 $ 252 $ (50) $ 1,097Jul. 31 After-tax impact of items of note (2) 1 – 4 – 64 69
Adjusted net income (3) $ 720 $ 136 $ 44 $ 252 $ 14 $ 1,166
2017 Reported net income (loss) $ 647 $ 153 $ 26 $ 267 $ (43) $ 1,050Apr. 30 (5) After-tax impact of items of note (2) 1 – 1 – 18 20
Adjusted net income (loss) (3) $ 648 $ 153 $ 27 $ 267 $ (25) $ 1,070
2016 Reported net income (loss) $ 666 $ 506 $ 23 $ 281 $ (35) $ 1,441Jul. 31 (5) After-tax impact of items of note (2) 1 (382) 2 9 1 (369)
Adjusted net income (loss) (3) $ 667 $ 124 $ 25 $ 290 $ (34) $ 1,072
$ millions, for the nine months ended
2017 Reported net income (loss) $ 2,319 $ 419 $ 94 $ 865 $ (143) $ 3,554Jul. 31 After-tax impact of items of note (2) (242) – 7 – 83 (152)
Adjusted net income (loss) (3) $ 2,077 $ 419 $ 101 $ 865 $ (60) $ 3,402
2016 Reported net income (loss) $ 2,002 $ 742 $ 62 $ 734 $ (176) $ 3,364Jul. 31 (5) After-tax impact of items of note (2) (26) (380) 5 21 79 (301)
Adjusted net income (loss) (3) $ 1,976 $ 362 $ 67 $ 755 $ (97) $ 3,063
(1) In the third quarter of 2017, we completed the acquisition of The PrivateBank. The results of The PrivateBank are included in the U.S. Commercial Banking and Wealth Management SBU. See “Significantevents” for additional details.
(2) Reflects impact of items of note under “Financial results” section.(3) Non-GAAP measure.(4) Annualized.(5) Certain information has been reclassified to conform to the presentation adopted in the current period. See “External reporting changes” for additional details.
CIBC THIRD QUARTER 2017 9

Strategic business units overview
CIBC has four SBUs – Canadian Retail and Business Banking, Canadian Wealth Management, U.S. Commercial Banking and Wealth Management, and CapitalMarkets. These SBUs are supported by the following functional groups – Technology and Operations, Finance, Administration, Risk Management, and InternalAudit, as well as other support groups, which all form part of Corporate and Other. The expenses of these functional and support groups are generally allocatedto the business lines within the SBUs. The functional and support costs of The PrivateBank are recognized directly in the expenses of U.S. Commercial Bankingand Wealth Management. Corporate and Other also includes the results of FirstCaribbean International Bank Limited (CIBC FirstCaribbean) and other strategicinvestments, as well as other income statement and balance sheet items not directly attributable to the business lines. The key methodologies and assumptionsused in reporting financial results of our SBUs are provided on page 16 of the 2016 Annual Report.
See “External reporting changes” for details of the changes made in the current quarter.
Canadian Retail and Business Banking
Canadian Retail and Business Banking provides personal and business clients across Canada with financial advice, products and services through a strongteam of advisors and relationship managers, in our banking centres or through remote channels such as mobile advisors, telephone, online or mobile banking.
Results(1)
For the threemonths ended
For the ninemonths ended
$ millions2017
Jul. 312017
Apr. 302016
Jul. 312017
Jul. 312016
Jul. 31
RevenuePersonal banking $ 1,867 $ 1,771 $ 1,779 $ 5,474 $ 5,241Business banking 467 447 435 1,367 1,283Other 8 7 11 322 41
Total revenue 2,342 2,225 2,225 7,163 6,565Provision for credit losses 187 196 197 588 559Non-interest expenses 1,176 1,149 1,121 3,454 3,323
Income before income taxes 979 880 907 3,121 2,683Income taxes 260 233 241 802 681
Net income $ 719 $ 647 $ 666 $ 2,319 $ 2,002
Net income attributable to:Equity shareholders (a) $ 719 $ 647 $ 666 $ 2,319 $ 2,002
Efficiency ratio 50.2 % 51.6 % 50.3 % 48.2 % 50.6 %Return on equity (2) 52.7 % 47.8 % 50.0 % 56.1 % 51.5 %Charge for economic capital (2) (b) $ (134) $ (131) $ (129) $ (403) $ (378)Economic profit (2) (a+b) $ 585 $ 516 $ 537 $ 1,916 $ 1,624Full-time equivalent employees 20,843 20,715 20,414 20,843 20,414(1) For additional segmented information, see the notes to the interim consolidated financial statements.(2) For additional information, see the “Non-GAAP measures” section.
Financial overviewNet income for the quarter was $719 million, up $53 million from the same quarter last year, and up $72 million from the prior quarter, primarily due to higherrevenue, partially offset by higher non-interest expenses.
Net income for the nine months ended July 31, 2017 was $2.3 billion, up $317 million from the same period in 2016, primarily due to higher revenue,partially offset by higher non-interest expenses and a higher provision for credit losses. Revenue in the current period included a gain on the sale and lease backof certain retail properties, shown as an item of note.
RevenueRevenue was up $117 million or 5% from the same quarter last year.
Personal banking revenue was up $88 million and business banking revenue was up $32 million, primarily due to volume growth and higher fees, partiallyoffset by narrower spreads.
Other revenue was down $3 million, primarily due to lower revenue from our exited FirstLine mortgage broker business.
Revenue was up $117 million or 5% from the prior quarter.Personal banking revenue was up $96 million, primarily due to additional days in the quarter, volume growth and wider spreads.Business banking revenue was up $20 million, primarily due to additional days in the quarter, higher fees and volume growth.Other revenue was comparable with the prior quarter.
Revenue for the nine months ended July 31, 2017 was up $598 million or 9% from the same period in 2016.Personal banking revenue was up $233 million, primarily due to volume growth and higher fees, partially offset by narrower spreads and one less day in
the current period.Business banking revenue was up $84 million, primarily due to volume growth and higher fees, partially offset by narrower spreads.Other revenue was up $281 million, primarily due to the gain noted above, partially offset by lower revenue from our exited FirstLine mortgage broker
business.
Provision for credit lossesProvision for credit losses was down $10 million from the same quarter last year, and $9 million from the prior quarter, primarily due to reversals in thecommercial banking portfolio.
10 CIBC THIRD QUARTER 2017

Provision for credit losses for the nine months ended July 31, 2017 was up $29 million from the same period in 2016, primarily due to higher write-offs inthe card and personal lending portfolios, and higher losses in the mortgage portfolio, partially offset by reversals in the commercial banking portfolio.
Non-interest expensesNon-interest expenses were up $55 million or 5% and up $27 million or 2%, from the same quarter last year and the prior quarter, respectively, primarily dueto higher spending on strategic initiatives, including client experience and innovation to further our retail transformation.
Non-interest expenses for the nine months ended July 31, 2017 were up $131 million or 4% from the same period in 2016, primarily due to higherspending on strategic initiatives, as noted above.
Income taxesIncome taxes were up $19 million from the same quarter last year, primarily due to higher income.
Income taxes were up $27 million from the prior quarter, primarily due to higher income.Income taxes for the nine months ended July 31, 2017 were up $121 million from the same period in 2016, primarily due to higher income, partially offset
by the impact of a lower effective tax rate on the gain noted above. The same period in 2016 included an income tax recovery from the settlement of transferpricing-related matters, shown as an item of note.
Canadian Wealth Management
Canadian Wealth Management provides integrated advice and investment solutions to meet the needs of institutional, retail, and high net worth clients. Ourasset management, retail brokerage and private wealth management businesses combine to create an integrated offer, delivered through approximately 1,500advisors across Canada. The results of ACI (sold in fiscal 2016) are included in the Other business line.
Results(1)
For the threemonths ended
For the ninemonths ended
$ millions2017
Jul. 312017
Apr. 30 (2)2016
Jul. 31 (2)2017
Jul. 312016
Jul. 31 (2)
RevenueRetail brokerage $ 354 $ 352 $ 317 $ 1,058 $ 937Asset management 204 207 196 605 556Private wealth management 45 42 41 130 123Other – – 428 – 443
Total revenue 603 601 982 1,793 2,059Non-interest expenses 417 405 385 1,233 1,144
Income before income taxes 186 196 597 560 915Income taxes 50 43 91 141 173
Net income $ 136 $ 153 $ 506 $ 419 $ 742
Net income attributable to:Equity shareholders (a) $ 136 $ 153 $ 506 $ 419 $ 742
Efficiency ratio 69.1 % 67.4 % 39.3 % 68.7 % 55.6 %Return on equity (3) 44.8 % 50.1 % 155.8 % 44.8 % 51.6 %Charge for economic capital (3) (b) $ (29) $ (30) $ (32) $ (91) $ (140)Economic profit (3) (a+b) $ 107 $ 123 $ 474 $ 328 $ 602Full-time equivalent employees 4,131 4,059 3,983 4,131 3,983(1) For additional segmented information, see the notes to the interim consolidated financial statements.(2) Certain information has been reclassified to conform to the presentation adopted in the current quarter. See “External reporting changes” for additional details.(3) For additional information, see the “Non-GAAP measures” section.
Financial overviewNet income for the quarter was $136 million, down $370 million from the same quarter last year, which included a gain, net of transaction costs, on the sale ofour minority investment in ACI, shown as an item of note.
Net income was down $17 million from the prior quarter, primarily due to higher non-interest expenses and higher income taxes, partially offset by higherrevenue.
Net income for the nine months ended July 31, 2017 was $419 million, down $323 million from the same period in 2016, which included the gain on saleof ACI noted above.
RevenueRevenue was down $379 million or 39% from the same quarter last year.
Retail brokerage revenue was up $37 million, primarily due to higher investment management and custodial fees, driven by higher average AUM andAUA, and higher commission revenue as a result of higher debt and equity issuance activity.
Asset management revenue was up $8 million, primarily due to higher average AUM, driven by net sales of long-term mutual funds and marketappreciation, partially offset by mark-to-market gains on seed capital investments in the same quarter last year.
Private wealth management revenue was up $4 million, primarily due to volume growth in loans and deposits.Other revenue was down $428 million, as the same quarter last year included the gain on sale of ACI noted above.
Revenue was comparable with the prior quarter.Retail brokerage revenue was up $2 million, primarily due to higher investment management and custodial fees, driven by higher average AUM and AUA,
partially offset by lower commission revenue, driven by a decline in transaction volume.Asset management revenue was down $3 million, as the prior quarter included mark-to-market gains on seed capital investments. The decrease was
partially offset by higher average AUM, driven by net sales of long-term mutual funds.Private wealth management revenue was up $3 million, primarily due to volume growth in loans and deposits.
CIBC THIRD QUARTER 2017 11
Revenue for the nine months ended July 31, 2017 was down $266 million or 13% from the same period in 2016.Retail brokerage revenue was up $121 million, primarily due to higher investment management and custodial fees from higher average AUM and AUA,
and higher commission revenue, driven by an increase in transaction volume and debt and equity issuance activity.Asset management revenue was up $49 million, primarily due to higher average AUM, driven by market appreciation and net sales of long-term mutual
funds.Private wealth management revenue was up $7 million, mainly due to volume growth in loans and deposits.Other revenue was down $443 million, as the same period in 2016 included the gain on sale of ACI noted above.
Non-interest expensesNon-interest expenses were up $32 million or 8% from the same quarter last year, and up $12 million or 3% from the prior quarter, primarily due to higherperformance-based compensation.
Non-interest expenses for the nine months ended July 31, 2017 were up $89 million or 8% from the same period in 2016, primarily due to higherperformance-based and employee-related compensation.
Income taxesIncome taxes were down $41 million from the same quarter last year, which included the gain on sale of ACI noted above.
Income taxes were up $7 million from the prior quarter, as the prior quarter included an income tax recovery.Income taxes for the nine months ended July 31, 2017 were down $32 million from the same period in 2016, which included the gain on sale of ACI
noted above.
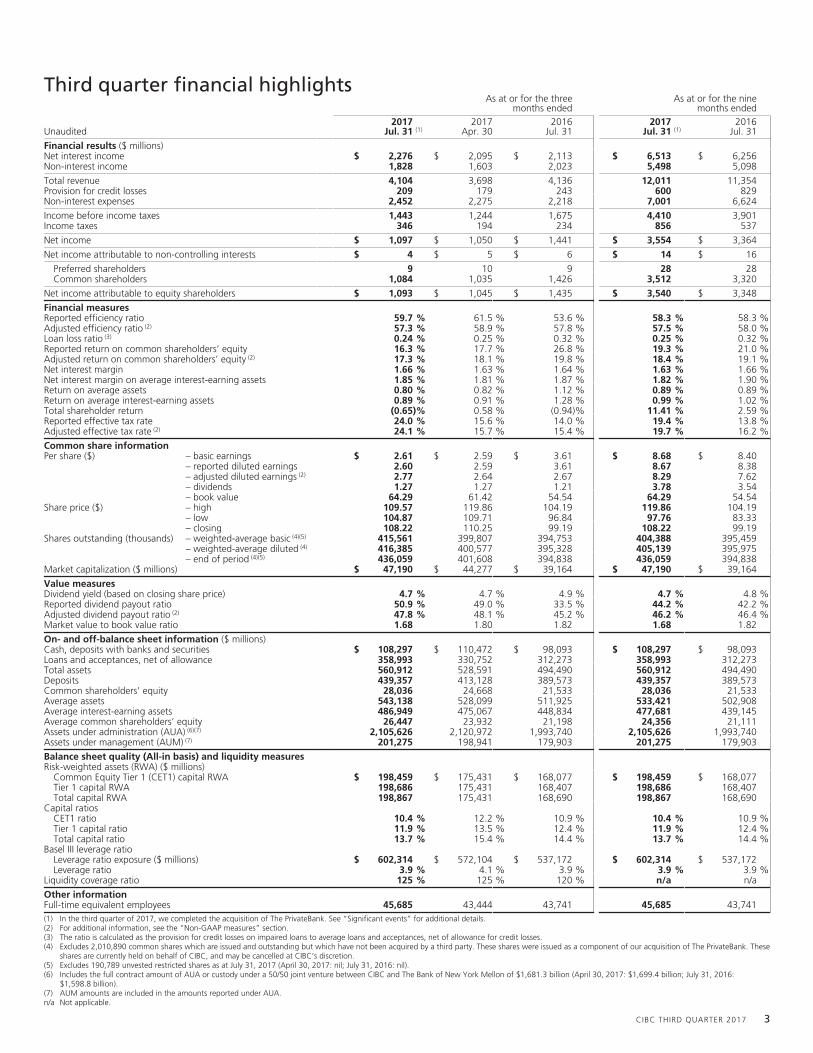
U.S. Commercial Banking and Wealth Management
U.S. Commercial Banking and Wealth Management offers commercial banking, personal, small business, and wealth management services to our U.S.clients.
On June 23, 2017, we completed the acquisition of PrivateBancorp and its subsidiary The PrivateBank. The results of The PrivateBank are only included inthis SBU from the date of acquisition (39 days in the third quarter of 2017). See “Significant events” for additional details.
Results(1)
For the threemonths ended
For the ninemonths ended
$ millions2017
Jul. 312017
Apr. 302016
Jul. 312017
Jul. 312016
Jul. 31
RevenueCommercial banking $ 150 $ 42 $ 39 $ 239 $ 115Wealth management 80 58 53 202 160Other 9 1 1 11 2
Total revenue (2) 239 101 93 452 277Provision for (reversal of) credit losses 34 – – 36 (2)Non-interest expenses 154 71 68 299 211
Income before income taxes 51 30 25 117 68Income taxes (2) 11 4 2 23 6
Net income $ 40 $ 26 $ 23 $ 94 $ 62
Net income attributable to:Equity shareholders (a) $ 40 $ 26 $ 23 $ 94 $ 62
Efficiency ratio 64.4 % 70.2 % 72.6 % 66.2 % 76.1 %Return on equity (3) 5.1 % 20.7 % 19.5 % 9.1 % 16.6 %Charge for economic capital (3) (b) $ (75) $ (14) $ (10) $ (99) $ (35)Economic profit (3) (a+b) $ (35) $ 12 $ 13 $ (5) $ 27Full-time equivalent employees 1,734 311 317 1,734 317(1) For additional segmented information, see the notes to the interim consolidated financial statements.(2) Revenue and income taxes are reported on a TEB basis. Accordingly, revenue and income taxes include a TEB adjustment of $1 million for the quarter ended July 31, 2017 (April 30, 2017: nil; July 31, 2016:
nil) and $1 million for the nine months ended July 31, 2017 (July 31, 2016: nil). The equivalent amounts are offset in the revenue and income taxes of Corporate and Other.(3) For additional information, see the “Non-GAAP measures” section.
Financial overviewNet income for the quarter was $40 million, up $17 million from the same quarter last year, and up $14 million from the prior quarter.
Net income for the nine months ended July 31, 2017 was $94 million, up $32 million from the same period in 2016.Our acquisition of The PrivateBank contributed $23 million to net income in the third quarter of 2017.
RevenueRevenue was up $146 million or 157% from the same quarter last year, up $138 million or 137% from the prior quarter, and up $175 million or 63% for thenine months ended July 31, 2017 versus the same period in 2016. Our acquisition of The PrivateBank contributed $131 million to revenue in the third quarterof 2017.
Commercial banking revenue was up $111 million from the same quarter last year, up $108 million from the prior quarter, and up $124 million for thenine months ended July 31, 2017 versus the same period in 2016, primarily due to the inclusion of the results of The PrivateBank. The current quarter alsoincluded $14 million of accretion of the acquisition date fair value discount on the acquired loans of The PrivateBank, and higher revenue in U.S. real estatefinance.
12 CIBC THIRD QUARTER 2017

Wealth management revenue was up $27 million from the same quarter last year, up $22 million from the prior quarter, and up $42 million for the ninemonths ended July 31, 2017 versus the same period in 2016, primarily due to the inclusion of the results of The PrivateBank, and growth in average AUM inCIBC Atlantic Trust.
The “other” line of business primarily includes the Treasury activities of The PrivateBank.
Provision for credit lossesProvision for credit losses was up $34 million from the same quarter last year and the prior quarter, and up $38 million for the nine months ended July 31, 2017versus the same period in 2016. The current quarter included losses in our pre-existing U.S. real estate finance portfolio. In addition, we recorded provisions of$13 million relating to The PrivateBank, as a collective allowance was established for new loan originations and renewals of acquired loans.
Non-interest expensesNon-interest expenses were up $86 million or 126% from the same quarter last year, up $83 million or 117% from the prior quarter, and up $88 million or42% for the nine months ended July 31, 2017 versus the same period in 2016, primarily due to the inclusion of the results of The PrivateBank of $83 million,which included compensation expenses of $14 million related to the retention of key employees.
Income taxesIncome taxes were up $9 million from the same quarter last year, up $7 million from the prior quarter, and up $17 million for the nine months ended July 31,2017 versus the same period in 2016, primarily due to higher income from the inclusion of the results of The PrivateBank in the third quarter of 2017.
Capital Markets
Capital Markets provides integrated global markets products and services, investment banking advisory and execution, corporate banking and top-rankedresearch to corporate, government and institutional clients around the world.
Results(1)
For the threemonths ended
For the ninemonths ended
$ millions2017
Jul. 312017
Apr. 30 (2)2016
Jul. 31 (2)2017
Jul. 312016
Jul. 31 (2)
RevenueGlobal markets $ 360 $ 407 $ 415 $ 1,298 $ 1,275Corporate and investment banking 321 284 325 893 831Other (2) (1) 29 7 19
Total revenue (3) 679 690 769 2,198 2,125Provision for (reversal of) credit losses 1 (5) 47 (4) 155Non-interest expenses 340 348 355 1,054 1,019
Income before income taxes 338 347 367 1,148 951Income taxes (3) 86 80 86 283 217
Net income $ 252 $ 267 $ 281 $ 865 $ 734
Net income attributable to:Equity shareholders (a) $ 252 $ 267 $ 281 $ 865 $ 734
Efficiency ratio (3) 50.1 % 50.4 % 46.2 % 47.9 % 48.0 %Return on equity (4) 33.2 % 35.4 % 33.2 % 37.1 % 30.4 %Charge for economic capital (4) (b) $ (74) $ (72) $ (83) $ (226) $ (235)Economic profit (4) (a+b) $ 178 $ 195 $ 198 $ 639 $ 499Full-time equivalent employees 1,327 1,262 1,301 1,327 1,301(1) For additional segmented information, see the notes to the interim consolidated financial statements.(2) Certain information has been reclassified to conform to the presentation adopted in the current quarter. See “External reporting changes” for additional details.(3) Revenue and income taxes are reported on a TEB basis. Accordingly, revenue and income taxes include a TEB adjustment of $20 million for the quarter ended July 31, 2017 (April 30, 2017: $123 million;
July 31, 2016: $142 million) and $261 million for the nine months ended July 31, 2017 (July 31, 2016: $377 million). The equivalent amounts are offset in the revenue and income taxes of Corporate andOther.
(4) For additional information, see the “Non-GAAP measures” section.
Financial overviewNet income for the quarter was $252 million, down $29 million from the same quarter last year, primarily due to lower revenue, partially offset by a lowerprovision for credit losses and lower non-interest expenses.
Net income was down $15 million from the prior quarter, primarily due to lower revenue, partially offset by lower non-interest expenses.Net income for the nine months ended July 31, 2017 was $865 million, up $131 million from the same period in 2016, primarily due to a reversal of credit
losses compared with a provision for credit losses in the same period in 2016, and higher revenue, partially offset by higher non-interest expenses.
RevenueRevenue was down $90 million or 12% from the same quarter last year.
Global markets revenue was down $55 million, primarily due to lower revenue from equity derivatives and interest rate trading, partially offset by a gainon sale of an investment, and higher foreign exchange trading revenue.
Corporate and investment banking revenue was down $4 million, primarily due to lower equity underwriting revenue, partially offset by higher corporatebanking revenue and investment portfolio gains.
Other revenue was down $31 million, as the same quarter last year included a gain from the structured credit run-off business, shown as an item of note.
Revenue was down $11 million or 2% from the prior quarter.Global markets revenue was down $47 million, primarily due to lower revenue from equity derivatives and interest rate trading, partially offset by a gain
on sale of an investment, and higher foreign exchange trading revenue.
CIBC THIRD QUARTER 2017 13

Corporate and investment banking revenue was up $37 million, primarily due to higher revenue from debt and equity underwriting, and corporatebanking, partially offset by lower investment portfolio gains.
Other revenue was comparable with the prior quarter.
Revenue for the nine months ended July 31, 2017 was up $73 million or 3% from the same period in 2016.Global markets revenue was up $23 million, primarily due to higher revenue from global markets financing activities, commodities and equity trading, the
movement in reserves related to derivative client exposure, and a gain on sale of an investment. This increase was partially offset by lower revenue from interestrate, foreign exchange, and equity derivatives trading.
Corporate and investment banking revenue was up $62 million, primarily due to higher investment portfolios gains, higher revenue from corporatebanking, and debt underwriting activity, partially offset by lower revenue from equity underwriting.
Other revenue was down $12 million, due to lower revenue from our run-off businesses, including the gain from the structured credit run-off business inthe prior year period noted above.
Provision for (reversal of) credit lossesProvision for credit losses was down $46 million from the same quarter last year, as the same quarter last year included losses in our exited European leveragedfinance portfolio, shown as an item of note.
Provision for credit losses was up $6 million from the prior quarter, due to reversals in the prior quarter.The nine months ended July 31, 2017 included a reversal of credit losses of $4 million, compared with a provision for credit losses of $155 million in the
same period in 2016, primarily due to better performance in the oil and gas sector. The same period in 2016 also included the losses in our exited Europeanleveraged finance portfolio noted above.
Non-interest expensesNon-interest expenses were down $15 million or 4% from the same quarter last year, and down $8 million or 2% from the prior quarter, primarily due to lowerperformance-based compensation.
Non-interest expenses for the nine months ended July 31, 2017 were up $35 million or 3% from the same period in 2016, primarily due to higherspending on strategic initiatives and performance-based compensation.
Income taxesIncome taxes were comparable with the same quarter last year.
Income taxes were up $6 million from the prior quarter, primarily due to the impact of changes in the proportion of income subject to varying rates of taxin different jurisdictions.
Income taxes for the nine months ended July 31, 2017 were up $66 million from the same period in 2016, primarily due to higher income and the impactof changes in the proportion of income subject to varying rates of tax in different jurisdictions.
Corporate and Other
Corporate and Other includes the following functional groups – Technology and Operations, Finance, Administration, Risk Management, and Internal Audit,as well as other support groups. The expenses of these functional and support groups are generally allocated to the business lines within the SBUs. Thefunctional and support costs of The PrivateBank are recognized directly in the expenses of U.S. Commercial Banking and Wealth Management. Corporate andOther also includes the results of CIBC FirstCaribbean and other strategic investments, as well as other income statement and balance sheet items not directlyattributable to the business lines.
Results(1)
For the threemonths ended
For the ninemonths ended
$ millions2017
Jul. 312017
Apr. 302016
Jul. 312017
Jul. 312016
Jul. 31
RevenueInternational banking $ 183 $ 178 $ 176 $ 540 $ 546Other 58 (97) (109) (135) (218)
Total revenue (2) 241 81 67 405 328Provision for (reversal of) credit losses (13) (12) (1) (20) 117Non-interest expenses 365 302 289 961 927
Loss before income taxes (111) (209) (221) (536) (716)Income taxes (2) (61) (166) (186) (393) (540)
Net loss $ (50) $ (43) $ (35) $ (143) $ (176)
Net income (loss) attributable to:Non-controlling interests $ 4 $ 5 $ 6 $ 14 $ 16Equity shareholders (54) (48) (41) (157) (192)
Full-time equivalent employees 17,650 17,097 17,726 17,650 17,726(1) For additional segmented information, see the notes to the interim consolidated financial statements.(2) Revenue and income taxes of Capital Markets and U.S. Commercial Banking and Wealth Management are reported on a TEB basis. The equivalent amounts are offset in the revenue and income taxes of
Corporate and Other. Accordingly, revenue and income taxes include a TEB adjustment of $21 million for the quarter ended July 31, 2017 (April 30, 2017: $123 million; July 31, 2016: $142 million) and$262 million for the nine months ended July 31, 2017 (July 31, 2016: $377 million).
Financial overviewThe current quarter and the nine months ended July 31, 2017 included a lower TEB adjustment(2), which resulted in higher revenue and a lower offsettingincome tax benefit versus the comparative periods.
Net loss for the quarter was $50 million, compared with a net loss of $35 million in the same quarter last year, primarily due to higher non-interestexpenses, partially offset by higher revenue.
Net loss was up $7 million from the prior quarter, primarily due to higher non-interest expenses, partially offset by higher revenue.
14 CIBC THIRD QUARTER 2017

Net loss for the nine months ended July 31, 2017 was $143 million, compared with a net loss of $176 million in the same period in 2016, primarily due toa reversal of credit losses compared with a provision for credit losses in the same period last year, partially offset by lower revenue (excluding the impact of theTEB adjustment(2) noted above), and higher non-interest expenses.
RevenueRevenue was up $174 million or 260% from the same quarter last year.
International banking revenue was up $7 million, primarily due to better performance in CIBC FirstCaribbean.Other revenue was up $167 million, primarily due to a lower TEB adjustment(2) and higher treasury revenue.
Revenue was up $160 million or 198% from the prior quarter.International banking revenue was up $5 million, primarily due to better performance in CIBC FirstCaribbean, partially offset by the unfavourable impact
of foreign exchange rates.Other revenue was up $155 million, primarily due to a lower TEB adjustment(2) and higher treasury revenue.
Revenue for the nine months ended July 31, 2017 was up $77 million or 23% from the same period in 2016.International banking revenue was down $6 million, primarily due to the unfavourable impact of foreign exchange rates.Other revenue was up $83 million, primarily due to a lower TEB adjustment(2). The same period in 2016 included a gain on sale of a processing centre,
shown as an item of note.
Provision for credit lossesReversal of credit losses was up $12 million from the same quarter last year, primarily due to a higher reduction in the collective allowance.
Reversal of credit losses was comparable with the prior quarter.The nine months ended July 31, 2017 included a reversal of credit losses of $20 million compared with a provision for credit losses of $117 million in the
same period in 2016, as the same period last year included increases in the collective allowance, shown as items of note.
Non-interest expensesNon-interest expenses were up $76 million or 26% from the same quarter last year, primarily due to an increase in legal provisions as well as transaction andintegration-related costs associated with the acquisition of The PrivateBank, shown as items of note, and higher spending on other strategic initiatives.
Non-interest expenses were up $63 million or 21% from the prior quarter, primarily due to the legal provisions, and transaction and integration-relatedcosts noted above.
Non-interest expenses for the nine months ended July 31, 2017 were up $34 million or 4% from the same period in 2016. Higher spending on strategicinitiatives, including the transaction and integration-related costs noted above, was partially offset by lower legal provisions, shown as items of note in bothperiods.
Income taxesIncome tax benefit was down $125 million from the same quarter last year, primarily due to lower losses and a lower TEB adjustment(2).
Income tax benefit was down $105 million from the prior quarter, primarily due to a lower TEB adjustment(2).Income tax benefit for the nine months ended July 31, 2017 was down $147 million from the same period in 2016, primarily due to lower losses, a lower
TEB adjustment(2), and an income tax recovery arising from a change in our expected utilization of certain tax loss carryforwards, shown as an item of note inthe same period last year.
CIBC THIRD QUARTER 2017 15

Financial condition
Review of condensed consolidated balance sheet
$ millions, as at2017
Jul. 31 (1)2016
Oct. 31
AssetsCash and deposits with banks $ 19,917 $ 14,165Securities 88,380 87,423Securities borrowed or purchased under resale agreements 45,072 33,810Loans and acceptances, net of allowance 358,993 319,781Derivative instruments 26,370 27,762Other assets 22,180 18,416
$ 560,912 $ 501,357
Liabilities and equityDeposits $ 439,357 $ 395,647Obligations related to securities lent or sold short or under repurchase agreements 37,196 24,550Derivative instruments 28,151 28,807Other liabilities 22,991 25,314Subordinated indebtedness 3,195 3,366Equity 30,022 23,673
$ 560,912 $ 501,357(1) In the third quarter of 2017, we completed the acquisition of The PrivateBank. See “Significant events” for additional details.
AssetsAs at July 31, 2017, total assets were up $59.6 billion or 12% from October 31, 2016, net of a decrease of approximately $9 billion due to the depreciation ofthe U.S. dollar. The acquisition of The PrivateBank added approximately $31 billion of assets as at July 31, 2017.
Cash and deposits with banks increased by $5.8 billion or 41%, mainly due to higher short-term placements in Treasury.Securities increased by $957 million or 1%, primarily due to the inclusion of securities from the acquisition of The PrivateBank, as well as an increase in
available-for-sale (AFS) securities, partially offset by a decrease in trading securities.Securities borrowed or purchased under resale agreements increased by $11.3 billion or 33%, primarily due to client-driven activities.Loans and acceptances, net of allowance increased by $39.2 billion or 12% due to the increase in U.S. business and government loans from the
acquisition of The PrivateBank and an increase in domestic residential mortgages.Derivative instruments decreased by $1.4 billion or 5%, largely driven by a decrease in interest rate derivatives valuation, partially offset by an increase in
foreign exchange and equity derivatives valuation.Other assets increased by $3.8 billion or 20%, primarily due to the increase in goodwill as a result of the acquisition of The PrivateBank.
LiabilitiesAs at July 31, 2017, total liabilities were up $53.2 billion or 11% from October 31, 2016, net of a decrease of approximately $9 billion due to the depreciationof the U.S. dollar. The acquisition of The PrivateBank added approximately $24 billion of liabilities as at July 31, 2017.
Deposits increased by $43.7 billion or 11%, primarily due to the inclusion of the balances of The PrivateBank, increased wholesale funding, and domesticretail volume growth. Further details on the composition of deposits are provided in Note 7 to the interim consolidated financial statements.
Obligations related to securities lent or sold short or under repurchase agreements increased by $12.6 billion or 52%, primarily due to client-drivenactivities.
Derivative instruments decreased by $656 million or 2%, largely driven by a decrease in interest rate derivatives valuation, partially offset by an increase inforeign exchange and equity derivatives valuation.
Other liabilities decreased by $2.3 billion or 9%, mainly due a decrease in acceptances.
EquityAs at July 31, 2017, equity increased by $6.3 billion or 27% from October 31, 2016, primarily due to share issuance arising from the acquisition of ThePrivateBank as well as from shareholder and employee plans, and a net increase in retained earnings.
16 CIBC THIRD QUARTER 2017
Capital resourcesWe actively manage our capital to maintain a strong and efficient capital base, to maximize risk-adjusted returns to shareholders, and to meet regulatoryrequirements. For additional details on capital resources, see pages 29 to 38 of the 2016 Annual Report.
Regulatory capital requirements under Basel IIIOur regulatory capital requirements are determined in accordance with guidelines issued by the Office of the Superintendent of Financial Institutions (OSFI),which are based upon the risk-based capital standards developed by the Basel Committee on Banking Supervision (BCBS).
Regulatory capital consists of CET1, Tier 1 and Tier 2 capital. OSFI requires all institutions to achieve target capital ratios that meet or exceed the 2019 all-in minimum ratios plus a conservation buffer. “All-in” is defined by OSFI as capital calculated to include all of the regulatory adjustments that will be requiredby 2019, but retaining the phase-out rules for non-qualifying capital instruments. Certain deductions from CET1 capital are phased in at 20% per year from2014 for the determination of capital under the transitional rules. Amounts not yet deducted from capital under OSFI’s transitional rules are risk weighted,creating a difference between RWAs on a transitional and all-in basis.
CIBC, along with the Bank of Montreal, the Bank of Nova Scotia, the National Bank of Canada, the Royal Bank of Canada, and the Toronto-DominionBank, have been designated by OSFI as domestic systemically important banks (D-SIBs) in Canada, and they are subject to a 1.0% CET1 surcharge, whichcommenced January 1, 2016. This results in current minimum targets for CET1, Tier 1 and Total capital ratios of 8.0%, 9.5%, and 11.5%, respectively. Thesetargets may be higher for certain institutions at OSFI’s discretion. Additionally, effective beginning in the first quarter of 2017, banks need to hold anincremental countercyclical capital buffer equal to the weighted average of buffers deployed in Canada and across certain other jurisdictions, where privatesector credit exposures exist(1).
Capital adequacy requirements are applied on a consolidated basis, which is consistent with the consolidation basis in our financial statements asdescribed in Note 1 to the 2016 annual consolidated financial statements, except for our insurance subsidiaries (CIBC Reinsurance Company Limited and CIBCLife Insurance Company Limited), which are excluded from the regulatory scope of consolidation. CIBC Life Insurance Company Limited is subject to OSFI’sMinimum Continuing Capital Surplus Requirements for life insurance companies.
A comparison of the BCBS transitional capital ratio requirements and the OSFI all-in target capital ratio requirements is as follows:
CET1 Capital(8.0%)
All-in basis(1) (OSFI)
2.5%
1.0%
1.5%
2.0%
11.5%
2017 - 2019
Tier 1 Capital(9.5%)
Total Capital(11.5%)
4.5%
1.3%
1.5%
2.0%
9.3%
2017
4.5%
1.9%
1.5%
2.0%
9.9%
2018
4.5%
2.5%
1.5%
2.0%
10.5%
2019
CET1 Capital(7.0%)
Tier 1 Capital(8.5%)
Total Capital(10.5%)
CET 1 Capital Conservation Buffer D-SIB Buffer Additional Tier 1 Tier 2
Transitional basis(1)
(BCBS)
4.5%
(1) A countercyclical capital buffer is also applicable, but is insignificant for CIBC as at July 31, 2017.
The tiers of regulatory capital indicate increasing quality/permanence and the ability to absorb losses. The major components of our regulatory capital aresummarized as follows:
CET1 Capital• Common Equity (Common Shares and Retained Earnings)• Accumulated Other Comprehensive Income (AOCI)(1)
• Qualifying instruments issued by a consolidated banking subsidiary to third parties• Less regulatory deductions for items such as: ➢ Goodwill and other intangible assets ➢ Deferred tax assets ➢ Net assets related to defined benefit pension plans ➢ Certain investments
Additional Tier 1 (AT1) Capital• Non-Viability Contingent Capital (NVCC) preferred shares• Qualifying instruments issued by a consolidated subsidiary to third parties• Innovative Tier 1 notes subject to phase-out rules for capital instruments
Tier 2 Capital• NVCC subordinated indebtedness• Non-qualifying subordinated indebtedness subject to phase-out rules for capital instruments• Eligible collective allowance under the standardized approach• Qualifying instruments issued by a consolidated subsidiary to third parties
Total C
apital
Tier 1 Cap
ital
HigherQuality
LowerQuality
(1) Excluding AOCI relating to cash flow hedges and changes to fair value option (FVO) liabilities attributable to changes in own credit risk.
CIBC THIRD QUARTER 2017 17
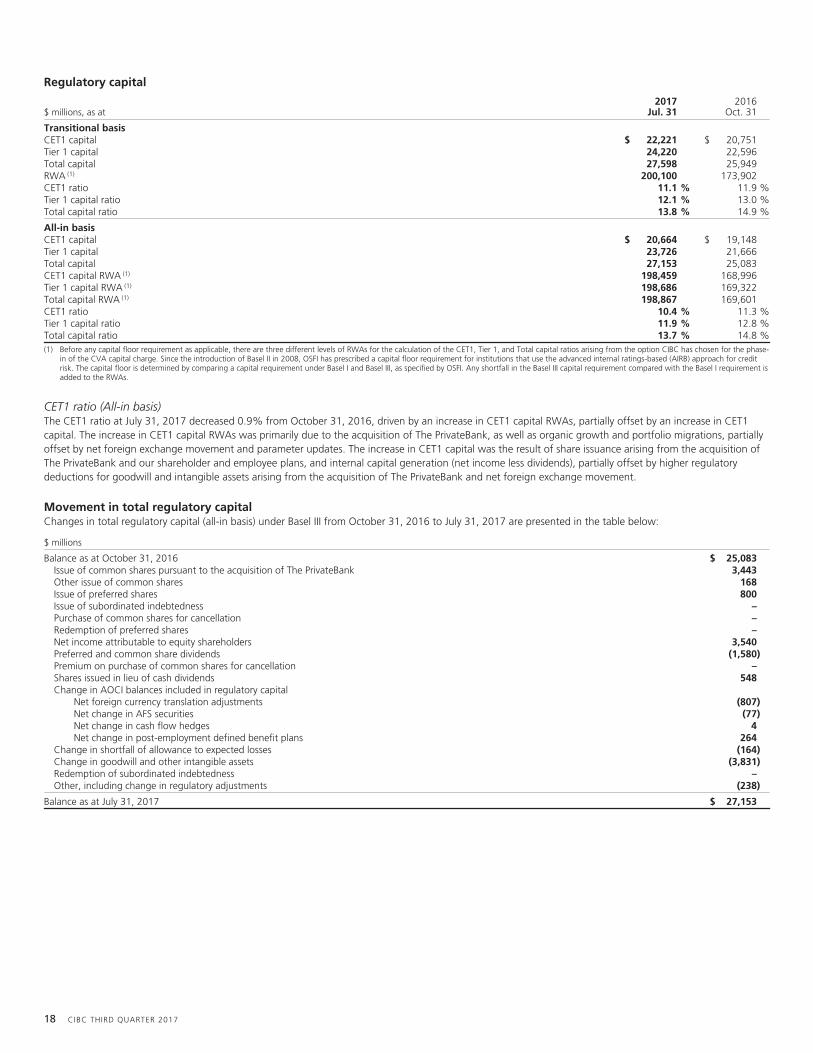
Regulatory capital
$ millions, as at2017
Jul. 312016
Oct. 31
Transitional basisCET1 capital $ 22,221 $ 20,751Tier 1 capital 24,220 22,596Total capital 27,598 25,949RWA (1) 200,100 173,902CET1 ratio 11.1 % 11.9 %Tier 1 capital ratio 12.1 % 13.0 %Total capital ratio 13.8 % 14.9 %
All-in basisCET1 capital $ 20,664 $ 19,148Tier 1 capital 23,726 21,666Total capital 27,153 25,083CET1 capital RWA (1) 198,459 168,996Tier 1 capital RWA (1) 198,686 169,322Total capital RWA (1) 198,867 169,601CET1 ratio 10.4 % 11.3 %Tier 1 capital ratio 11.9 % 12.8 %Total capital ratio 13.7 % 14.8 %(1) Before any capital floor requirement as applicable, there are three different levels of RWAs for the calculation of the CET1, Tier 1, and Total capital ratios arising from the option CIBC has chosen for the phase-
in of the CVA capital charge. Since the introduction of Basel II in 2008, OSFI has prescribed a capital floor requirement for institutions that use the advanced internal ratings-based (AIRB) approach for creditrisk. The capital floor is determined by comparing a capital requirement under Basel I and Basel III, as specified by OSFI. Any shortfall in the Basel III capital requirement compared with the Basel I requirement isadded to the RWAs.
CET1 ratio (All-in basis)The CET1 ratio at July 31, 2017 decreased 0.9% from October 31, 2016, driven by an increase in CET1 capital RWAs, partially offset by an increase in CET1capital. The increase in CET1 capital RWAs was primarily due to the acquisition of The PrivateBank, as well as organic growth and portfolio migrations, partiallyoffset by net foreign exchange movement and parameter updates. The increase in CET1 capital was the result of share issuance arising from the acquisition ofThe PrivateBank and our shareholder and employee plans, and internal capital generation (net income less dividends), partially offset by higher regulatorydeductions for goodwill and intangible assets arising from the acquisition of The PrivateBank and net foreign exchange movement.
Movement in total regulatory capitalChanges in total regulatory capital (all-in basis) under Basel III from October 31, 2016 to July 31, 2017 are presented in the table below:
$ millions
Balance as at October 31, 2016 $ 25,083Issue of common shares pursuant to the acquisition of The PrivateBank 3,443Other issue of common shares 168Issue of preferred shares 800Issue of subordinated indebtedness –Purchase of common shares for cancellation –Redemption of preferred shares –Net income attributable to equity shareholders 3,540Preferred and common share dividends (1,580)Premium on purchase of common shares for cancellation –Shares issued in lieu of cash dividends 548Change in AOCI balances included in regulatory capital
Net foreign currency translation adjustments (807)Net change in AFS securities (77)Net change in cash flow hedges 4Net change in post-employment defined benefit plans 264
Change in shortfall of allowance to expected losses (164)Change in goodwill and other intangible assets (3,831)Redemption of subordinated indebtedness –Other, including change in regulatory adjustments (238)
Balance as at July 31, 2017 $ 27,153
18 CIBC THIRD QUARTER 2017

Movement in CET1 capital RWAsThe following tables show the movement in CET1 capital RWAs (all-in basis) relating to credit, market and operational risks from October 31, 2016 to July 31,2017.
Credit risk
$ millions
Credit risk
Of whichcounterparty
credit risk (1)
Balance as at October 31, 2016 $ 143,075 $ 8,861Book size (2) 10,020 1,213Book quality (3) (3,511) (755)Model updates (4) (2,522) (37)Methodology and policy (5) 1,085 361Acquisitions and disposals 26,517 90Foreign exchange movements (4,279) (217)Other (2,231) (80)
Balance as at July 31, 2017 (6) $ 168,154 $ 9,436(1) Comprises derivatives and repo-style transactions.(2) Relates to net increase/decrease in the underlying exposures.(3) Relates to changes in credit risk mitigation and credit quality of the borrower/counterparty.(4) Relates to internal model or parameter changes.(5) Relates to regulatory changes implemented on an industry-wide basis (i.e., Basel III) and any capital methodology changes implemented within CIBC for our portfolios.(6) Includes $3,264 million of CET1 CVA RWAs relating to bilateral over-the-counter (OTC) derivatives.
The increase in credit risk RWAs is primarily due to the acquisition of The PrivateBank, as well as organic growth across our businesses throughout the year. Thedecrease in the book quality category reflects the impact of portfolio upgrades experienced during the year. Model updates include refinements and normalcourse updates to our underlying AIRB models and parameters.
Market risk
$ millions
Balance as at October 31, 2016 $ 4,175Movement in risk levels (1) 1,654Model updates (2) (284)Methodology and policy (3) –Acquisitions and disposals 59Foreign exchange movements 374Other –
Balance as at July 31, 2017 $ 5,978(1) Relates to changes in open positions and market data.(2) Relates to internal model or parameter changes.(3) Relates to regulatory changes implemented on an industry-wide basis (i.e., Basel III) and any capital methodology changes implemented within CIBC for our portfolios.
The overall increase in market risk RWAs is primarily driven by movement in risk levels, which includes changes in open positions and the market rates affectingthese positions, along with foreign exchange movement. These factors were partially offset by internal model updates.
Operational risk
$ millions
Balance as at October 31, 2016 $ 21,746Movement in risk levels (1) 1,012Methodology and policy (2) –Acquisitions and disposals 1,569
Balance as at July 31, 2017 $ 24,327(1) Relates to changes in loss experience and business environment and internal control factors.(2) Relates to regulatory changes implemented on an industry-wide basis (i.e., Basel III) and any capital methodology changes implemented within CIBC for our portfolios.
The increase in operational risk RWAs is primarily driven by the acquisition of The PrivateBank. The movement in risk level under the advanced measurementapproach reflects changes in loss experience, changes in the business environment, internal control factors and gross income, as defined by the BCBS.Methodology and policy updates reflect capital methodology changes implemented within CIBC for our portfolios.
Continuous enhancement to risk-based capital requirementsThe BCBS has published a number of proposals for changes to the existing risk-based capital requirements (see page 34 of the 2016 Annual Report), whichcontinue to evolve.
In December 2016, OSFI issued a final Capital Adequacy Requirements Guideline, effective beginning in the first quarter of 2017.In March 2017, the BCBS issued a consultative document focusing on the identification and management of step-in risk, with a proposed implementation
timeline of no later than the end of 2019. Step-in risk is the risk that a bank might provide financial support to an unconsolidated entity beyond, or in theabsence of, any contractual obligations or equity ties, should the entity experience financial stress. The focus of these guidelines is on unconsolidated entitiessuch as securitization conduits, structured investment vehicles, and money market funds.
In July 2017, the BCBS issued the consultative document “Capital treatment for simple, transparent and comparable short-term securitisations”, settingout additional guidance and requirements for eligibility to apply preferential regulatory capital treatment for banks that act as investors in, or sponsors of
CIBC THIRD QUARTER 2017 19

simple, transparent and comparable short-term securitizations. The proposed treatment is consistent with the BCBS’ July 2016 revisions to the securitizationframework.
In July 2017, OSFI announced that it is extending the Canadian implementation timeline for adoption of the BCBS’ market risk framework from the end of2019 to no earlier than the first quarter of 2021. The date was revised from the BCBS’ expected 2019 timeline due to the challenges and uncertaintiesassociated with implementation of the requirements.
CIBC will continue to monitor and prepare for developments impacting risk-based capital requirements.
Basel III leverage ratioThe Basel III capital reforms included a non-risk-based capital metric, the leverage ratio, to supplement risk-based capital requirements.
The leverage ratio is defined as Tier 1 capital divided by the leverage ratio exposure. The leverage ratio exposure is defined under the rules as the sum of:(i) On-balance sheet assets less Tier 1 capital regulatory adjustments;(ii) Derivative exposures;(iii) Securities financing transaction exposures; and(iv) Off-balance sheet exposures (such as commitments, direct credit substitutes, letters of credit, and securitization exposures).
OSFI expects federally regulated deposit-taking institutions to have leverage ratios that meet or exceed 3.0%. This minimum may be higher for certaininstitutions at OSFI’s discretion.
$ millions, as at2017
Jul. 312016
Oct. 31
Transitional basisTier 1 capital A $ 24,220 $ 22,596Leverage ratio exposure B 602,730 546,136Leverage ratio A/B 4.0 % 4.1 %
All-in basisTier 1 capital C $ 23,726 $ 21,666Leverage ratio exposure D 602,314 545,480Leverage ratio C/D 3.9 % 4.0 %
Leverage ratio (All-in basis)The leverage ratio at July 31, 2017 decreased 0.1% from October 31, 2016, driven by an increase in leverage ratio exposures, partially offset by an increase inTier 1 capital. The increase in leverage ratio exposure was primarily driven by an increase in on-balance sheet assets primarily resulting from the acquisition ofThe PrivateBank and an increase in securities financing transaction exposures. The increase in Tier 1 capital was primarily driven by the factors noted in the CET1capital discussion above, as well as the issuance of preferred shares.
Proposed revisions to leverage ratio frameworkRevisions proposed by the BCBS are discussed on page 35 of the 2016 Annual Report and are expected to be finalized for implementation on January 1, 2018.
Revised Pillar 3 disclosure requirementsIn January 2015, the BCBS issued “Revised Pillar 3 disclosure requirements”, which set out the first phase of an initiative to replace existing Pillar 3 disclosurerequirements for the various types of risk. Pillar 3 aims to promote market discipline through regulatory disclosure requirements, in order to improvecomparability and consistency of risk disclosures and increase transparency and confidence about a bank’s exposure to risk and the overall adequacy of itsregulatory capital.
In April 2017, OSFI released its guidelines confirming expectations for domestic implementation of the BCBS Pillar 3 first phase requirements, withimplementation required by the fourth quarter of 2018.
In March 2017, the BCBS released “Pillar 3 disclosure requirements – consolidated and enhanced framework”, a standard establishing the second phase ofthe project. This standard includes enhancements to the January 2015 requirements, the introduction of several new disclosure requirements, and theconsolidation of all existing BCBS disclosure requirements into the Pillar 3 framework. The BCBS has also commenced a third phase of its review of Pillar 3. OSFIhas not yet released its requirements for the second and third phases.
CIBC will continue to monitor and prepare for developments in this area.
Global systemically important banks (G-SIBs) – public disclosure requirementsIn March 2017, the BCBS released “Global Systemically Important Banks – Revised Assessment Framework”, a consultative document proposing revisions to theG-SIB assessment framework, designed to capture new dimensions of systemic risk not included in the current framework. The proposal includes new G-SIBindicators as well as amendments to the definition and potential weighting of existing indicators. The revised assessment methodology is expected to befinalized in 2017 and to become effective for the 2019 G-SIB assessment.
Bank recapitalization (Bail-in) conversion regulationsIn June 2016, a legislative framework for a bail-in regime for Canada’s D-SIBs received royal assent. The overarching policy objective is to strengthen financialstability while protecting taxpayers in the event of a D-SIB failure, and is consistent with the objectives of the Financial Stability Board’s rules for Total Loss-Absorbing Capacity (TLAC) applicable to G-SIBs. The bail-in regime is designed to enable the expedient conversion, in whole or in part, of certain bank liabilities(bail-in debt) into common equity, thus ensuring that the D-SIB emerges from conversion as adequately capitalized.
On June 16, 2017, the Department of Finance issued a pre-publication of bail-in regulations. These provide statutory powers to the Canada DepositInsurance Corporation (CDIC) to enact the bail-in regime including the ability to convert specified eligible shares and liabilities of D-SIBs into common shares inthe event such a bank becomes non-viable. OSFI is responsible for designating D-SIBs, setting minimum bail-in/TLAC requirements, and determining that a bankis non-viable. In line with previous consultations, liabilities subject to bail-in are unsecured and tradable liabilities with original term to maturity of more than400 days. Consumer deposits, derivatives and structured notes would not be eligible for bail-in. The regulations become effective 180 days after the regulationsare registered.
20 CIBC THIRD QUARTER 2017
In conjunction with the pre-publication of bail-in regulations, OSFI issued draft guidelines on TLAC for Canada’s D-SIBs and holdings of TLAC instrumentsfor public consultation. OSFI’s TLAC guideline requires D-SIBs to maintain a minimum of 21.5% of TLAC-eligible instruments(1) relative to their RWAs and6.75% relative to their leverage exposures. In addition, D-SIBs will be expected to hold buffers above the minimum TLAC ratios. TLAC-eligible liabilities mustsatisfy all of the requirements set out in the bail-in regulations and have a residual maturity greater than 365 days, among other requirements. The minimumTLAC requirements are proposed to be effective in fiscal 2022.
OSFI’s TLAC holdings proposal is in line with the BCBS’ TLAC holdings standard finalized in October 2016. Under the draft guideline, our investment inother G-SIBs’ and Canadian D-SIBs’ TLAC instruments are to be deducted from our own Tier 2 capital if our aggregate holdings, together with investments incapital instruments of other financial institutions, exceeds certain thresholds in relation to our own CET1 capital.
(1) The sum of a D-SIB’s TLAC, subject to certain adjustments. Will include Tier 1 capital, Tier 2 capital, and prescribed shares and liabilities that are subject to conversion into common shares and meet theeligibility criteria set out in OSFI’s TLAC draft guideline.
Significant capital management activityNormal course issuer bidOn March 10, 2017, we announced that the Toronto Stock Exchange had accepted the notice of CIBC’s intention to commence a normal course issuer bid.Purchases under this bid will terminate upon the earlier of: (i) CIBC purchasing up to a maximum of 8 million common shares; (ii) CIBC providing a notice oftermination; or (iii) March 13, 2018. No common shares have been purchased under this bid.
Common share issuance pursuant to the acquisition of The PrivateBankOn June 23, 2017, we completed the acquisition of The PrivateBank, and in connection therewith, we issued 32,137,402 CIBC common shares. For furtherdetails, see Note 3 and Note 9 to our interim consolidated financial statements.
Shareholder investment plan (the plan)Effective with the October 28, 2016 dividend, CIBC has elected to issue shares from Treasury to fulfill the requirements of the plan. Pursuant to the plan, weissued 1,772,067 common shares for consideration of $187 million for the quarter and 5,073,283 common shares for consideration of $549 million for thenine months ended July 31, 2017.
DividendsOn August 23, 2017, the CIBC Board of Directors (the Board) approved an increase in our quarterly common share dividend from $1.27 per share to $1.30 pershare for the quarter ending October 31, 2017.
Our quarterly common share dividend was increased from $1.24 per share to $1.27 per share for the quarter ended April 30, 2017.
Preferred sharesOn June 2, 2017, we issued 32 million Non-cumulative Rate Reset Class A Preferred Shares Series 45 (Non-Viability Contingent Capital (NVCC)) (Series 45shares) with a par value of $25.00 per share, for gross proceeds of $800 million. For the initial five year period to the earliest redemption date of July 31, 2022,the Series 45 shares pay quarterly cash dividends, if declared, at a rate of 4.40%. On July 31, 2022, and on July 31 every five years thereafter, the dividend ratewill reset to be equal to the then current five-year Government of Canada bond yield plus 3.38%.
Subject to CIBC’s redemption rights, holders of the Series 45 shares will have the right to convert their shares on a one-for-one basis into Non-cumulativeFloating Rate Class A Preferred Shares Series 46 (Non-Viability Contingent Capital (NVCC)) (Series 46 shares), subject to certain conditions, on July 31, 2022 andon July 31 every five years thereafter. Holders of the Series 46 shares will be entitled to receive a quarterly floating rate dividend, if declared, equal to the three-month Government of Canada Treasury Bill yield plus 3.38%. Holders of the Series 46 shares may convert their shares on a one-for-one basis into Series 45shares, subject to certain conditions, on July 31, 2027 and on July 31 every five years thereafter.
Subject to regulatory approval and certain provisions of the shares, we may redeem all or any part of the then outstanding Series 45 shares at par onJuly 31, 2022 and on July 31 every five years thereafter; we may redeem all or any part of the then outstanding Series 46 shares at par on July 31, 2027 and onJuly 31 every five years thereafter.
Subordinated indebtednessDuring the quarter ended July 31, 2017, we purchased and cancelled $42 million (US$34 million) of our Floating Rate Debenture Notes Due 2084.
During the quarter ended April 30, 2017, we purchased and cancelled $25 million (US$19 million) of our Floating Rate Debenture Notes Due 2085.
CIBC THIRD QUARTER 2017 21

Convertible instrumentsThe table below provides a summary of our NVCC capital instruments outstanding:
Shares outstandingMinimum
conversionprice per
common share
Maximum numberof common
shares issuableon conversion$ millions, except number of shares and per share amounts, as at July 31, 2017
Number ofshares
Parvalue
Preferred shares (1)(2)
Series 39 (NVCC) 16,000,000 $ 400 $ 5.00 80,000,000Series 41 (NVCC) 12,000,000 300 5.00 60,000,000Series 43 (NVCC) 12,000,000 300 5.00 60,000,000Series 45 (NVCC) 32,000,000 800 5.00 160,000,000Subordinated indebtedness (2)(3)
3.00% Debentures due October 28, 2024 (NVCC) n/a 1,000 5.00 300,000,0003.42% Debentures due January 26, 2026 (NVCC) n/a 1,000 5.00 300,000,000
Total $ 3,800 960,000,000(1) Upon the occurrence of a Trigger Event, each share is convertible into a number of common shares, determined by dividing the par value of $25.00 plus declared and unpaid dividends by the average common
share price (as defined in the relevant prospectus supplement) subject to a minimum price per share (subject to adjustment in certain events as defined in the relevant prospectus supplement). Preferredshareholders do not have the right to convert their shares into common shares.
(2) The maximum number of common shares issuable on conversion excludes the impact of declared but unpaid dividends and accrued interest.(3) Upon the occurrence of a Trigger Event, the Debentures are convertible into a number of common shares, determined by dividing 150% of the par value plus accrued and unpaid interest by the average
common share price (as defined in the relevant prospectus supplement) subject to a minimum price per common share (subject to adjustment in certain events as defined in the relevant prospectussupplement).
n/a Not applicable.
The occurrence of a “Trigger Event” would result in conversion of all of the outstanding NVCC instruments described above, which would represent a dilutionimpact of 69% based on the number of CIBC common shares outstanding as at July 31, 2017. As described in the Capital Adequacy Guidelines, a Trigger Eventoccurs when OSFI determines the bank is or is about to become non-viable and, if after conversion of all contingent instruments and consideration of any otherrelevant factors or circumstances, it is reasonably likely that its viability will be restored or maintained; or if the bank has accepted or agreed to accept a capitalinjection or equivalent support from a federal or provincial government, without which OSFI would have determined the bank to be non-viable.
Off-balance sheet arrangementsWe enter into off-balance sheet arrangements in the normal course of our business. These arrangements typically involve the use of structured entities (SEs),which are entities that have been designed so that voting or similar rights are not the dominant factor in deciding who controls the entity, such as when anyvoting rights relate to administrative tasks only and the relevant activities are directed by means of contractual arrangements. CIBC is involved with various typesof SEs for which the business activities include securitization of financial assets, asset-backed financings, and asset management.
We consolidate all of our sponsored trusts that securitize our own assets with the exception of a commercial mortgage securitization trust. Details of ourother off-balance sheet arrangements are provided on pages 38 and 39 of the 2016 Annual Report and also in Note 6 to the consolidated financial statementsin the 2016 Annual Report. Following the acquisition of The PrivateBank, we also consolidate certain SEs which we sponsor that invest in communitydevelopment projects in the U.S. through the issuance of below-market loans that generate a return primarily through the realization of tax credits. As atJuly 31, 2017, these consolidated SEs had $49 million of loans outstanding. Our non-consolidated SEs also now include debt and equity investments in limitedliability entities relating to our U.S. Community Reinvestment Act initiatives. These limited liability entities invest in qualifying community development projects,such as affordable housing projects.
We manage and administer a single-seller conduit and several CIBC-sponsored multi-seller conduits in Canada. As at July 31, 2017, there were $6.1 billion(October 31, 2016: $6.0 billion) of total assets in our non-consolidated single-seller conduit and multi-seller conduits.
We earn fees for providing services related to the non-consolidated single-seller and multi-seller conduits, such as backstop liquidity facilities, distribution,transaction structuring, and conduit administration. These fees totalled $11 million in the third quarter of 2017 ($9 million for the same quarter last year and$9 million for the prior quarter). Fees for the nine months ended July 31, 2017 were $31 million ($26 million for the nine months ended July 31, 2016). All feesearned in respect of activities with the conduits are on a market basis.
As at July 31, 2017, the amount funded for the various asset types in our multi-seller conduits amounted to $5.6 billion (October 31, 2016: $5.4 billion).The estimated weighted-average life of these assets was 1.5 years (October 31, 2016: 1.5 years). Our holdings of commercial paper issued by our non-consolidated sponsored multi-seller conduits that offer commercial paper to external investors were $3 million (October 31, 2016: $10 million). Our committedbackstop liquidity facilities to these conduits were $8.0 billion (October 31, 2016: $7.2 billion). We also provided credit facilities of $40 million (October 31,2016: $40 million) to these conduits.
We participate in a syndicated facility for a three-year commitment of $700 million to the single-seller conduit that provides funding to franchisees of amajor Canadian retailer. Our portion of the commitment is $130 million (October 31, 2016: $130 million). As at July 31, 2017, we funded $98 million(October 31, 2016: $103 million) through the issuance of bankers’ acceptances and prime loans.
22 CIBC THIRD QUARTER 2017
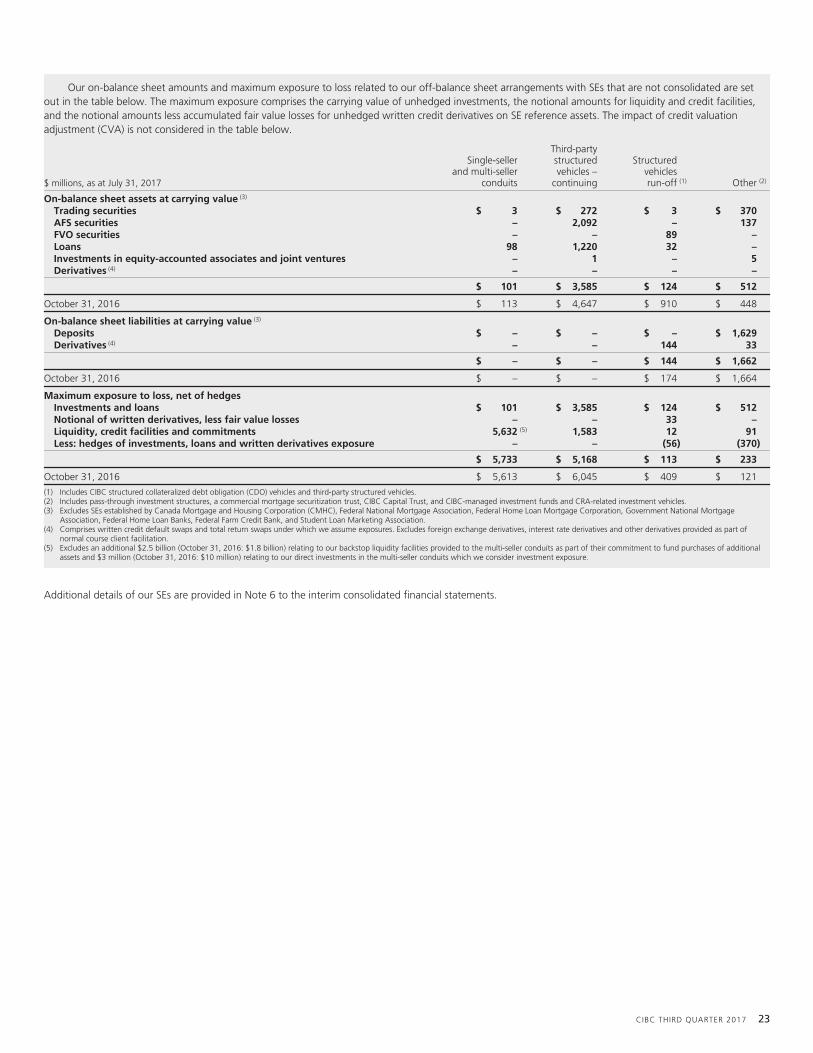
Our on-balance sheet amounts and maximum exposure to loss related to our off-balance sheet arrangements with SEs that are not consolidated are setout in the table below. The maximum exposure comprises the carrying value of unhedged investments, the notional amounts for liquidity and credit facilities,and the notional amounts less accumulated fair value losses for unhedged written credit derivatives on SE reference assets. The impact of credit valuationadjustment (CVA) is not considered in the table below.
$ millions, as at July 31, 2017
Single-sellerand multi-seller
conduits
Third-partystructuredvehicles –
continuing
Structuredvehiclesrun-off (1) Other (2)
On-balance sheet assets at carrying value (3)
Trading securities $ 3 $ 272 $ 3 $ 370AFS securities – 2,092 – 137FVO securities – – 89 –Loans 98 1,220 32 –Investments in equity-accounted associates and joint ventures – 1 – 5Derivatives (4) – – – –
$ 101 $ 3,585 $ 124 $ 512
October 31, 2016 $ 113 $ 4,647 $ 910 $ 448
On-balance sheet liabilities at carrying value (3)
Deposits $ – $ – $ – $ 1,629Derivatives (4) – – 144 33
$ – $ – $ 144 $ 1,662
October 31, 2016 $ – $ – $ 174 $ 1,664
Maximum exposure to loss, net of hedgesInvestments and loans $ 101 $ 3,585 $ 124 $ 512Notional of written derivatives, less fair value losses – – 33 –Liquidity, credit facilities and commitments 5,632 (5) 1,583 12 91Less: hedges of investments, loans and written derivatives exposure – – (56) (370)
$ 5,733 $ 5,168 $ 113 $ 233
October 31, 2016 $ 5,613 $ 6,045 $ 409 $ 121
(1) Includes CIBC structured collateralized debt obligation (CDO) vehicles and third-party structured vehicles.(2) Includes pass-through investment structures, a commercial mortgage securitization trust, CIBC Capital Trust, and CIBC-managed investment funds and CRA-related investment vehicles.(3) Excludes SEs established by Canada Mortgage and Housing Corporation (CMHC), Federal National Mortgage Association, Federal Home Loan Mortgage Corporation, Government National Mortgage
Association, Federal Home Loan Banks, Federal Farm Credit Bank, and Student Loan Marketing Association.(4) Comprises written credit default swaps and total return swaps under which we assume exposures. Excludes foreign exchange derivatives, interest rate derivatives and other derivatives provided as part of
normal course client facilitation.(5) Excludes an additional $2.5 billion (October 31, 2016: $1.8 billion) relating to our backstop liquidity facilities provided to the multi-seller conduits as part of their commitment to fund purchases of additional
assets and $3 million (October 31, 2016: $10 million) relating to our direct investments in the multi-seller conduits which we consider investment exposure.
Additional details of our SEs are provided in Note 6 to the interim consolidated financial statements.
CIBC THIRD QUARTER 2017 23

Management of riskOur approach to management of risk has not changed significantly from that described on pages 40 to 75 of the 2016 Annual Report.
Risk overviewCIBC faces a wide variety of risks across all of its areas of business. Identifying and understanding risks and their impacts allows CIBC to frame its risk appetiteand risk management practices. Defining acceptable levels of risk, and establishing sound principles, policies and practices for managing risks, is fundamental toachieving consistent and sustainable long-term performance, while remaining within our risk appetite.
Our risk appetite defines tolerance levels for various risks. This is the foundation for our risk management culture and our risk management framework.
Our risk management framework includes:• CIBC and SBU-level risk appetite statements;• Risk frameworks, policies, procedures and limits to align activities with our risk appetite;• Regular risk reports to identify and communicate risk levels;• An independent control framework to identify and test compliance with key controls;• Stress testing to consider potential impacts of changes in the business environment on capital, liquidity and earnings;• Proactive consideration of risk mitigation options in order to optimize results; and• Oversight through our risk-focused committees and governance structure.
Managing risk is a shared responsibility at CIBC. Business units and risk management professionals work in collaboration to ensure that business strategies andactivities are consistent with our risk appetite. CIBC’s approach to enterprise-wide risk management aligns with the three lines of defence model:(i) CIBC’s lines of business and functional and support groups are responsible for all risks associated with their activities – this is the first line of defence;(ii) As the second line of defence, CIBC’s Risk Management, including Compliance, and other oversight functions are responsible for independent oversight of
the enterprise-wide risks inherent in CIBC’s business activities; and(iii) As the third line of defence, CIBC’s internal audit function provides an independent assessment of the design and operating effectiveness of risk
management controls, processes and systems.
We continuously monitor our risk profile against our defined risk appetite and related limits, taking actions as needed to maintain an appropriate balance of riskand return. Monitoring our risk profile includes forward-looking analysis of sensitivity to local and global market factors, economic conditions, and political andregulatory environments that influence our overall risk profile.
Regular and transparent risk reporting and discussion at senior management committees facilitate communication of risks and discussion of riskmanagement strategies across the organization.
Risk Management structureThe Risk Management group, led by our Chief Risk Officer (CRO), is responsible for setting risk strategies and for providing independent oversight of thebusinesses. Risk Management works to identify, assess, mitigate, monitor and control the risks associated with business activities and strategies, and isresponsible for providing an effective challenge to the lines of business.
There were changes made during the year to the Risk Management structure. The current structure is illustrated below:
Chief Risk Officer
Risk Appetite and Management Control Metrics
Risk Policies and Limits
Risk Management Structure
Capital MarketsRisk
Management
Risk Identification, Measurement and Reporting
Stress Testing
Effective Challenge as Second Line of Defence
Global Credit RiskManagement
(including non-U.S. Risk Officers)
GlobalOperational Risk
Management
Risk Analytics,Reporting and
CreditDecisioning
ComplianceU.S. Risk
Management
24 CIBC THIRD QUARTER 2017

The Risk Management group performs several important activities including:• Developing CIBC’s risk appetite and associated management control metrics;• Setting risk strategy to manage risks in alignment with our risk appetite and business strategy;• Establishing and communicating risk policies, procedures and limits to control risks in alignment with risk strategy;• Measuring, monitoring and reporting on risk levels;• Identifying and assessing emerging and potential strategic risks;• Deciding on transactions that fall outside of risk limits delegated to business lines; and• Ensuring compliance with applicable regulatory and anti-money laundering requirements.
The following key groups within Risk Management, independent of the originating businesses, contribute to our management of risk:• Capital Markets Risk Management – This group provides independent oversight of the measurement, monitoring and control of market risks (both trading
and non-trading), and trading credit risk (also called counterparty credit risk) across CIBC’s portfolios, and effective challenge and sound risk managementoversight to the treasury/liquidity management function within CIBC.
• Global Credit Risk Management – This group is responsible for the adjudication and oversight of credit risks associated with our commercial, wholesaleand wealth management activities, management of the risks in our investment portfolios, as well as management of special loan portfolios.
• Global Operational Risk Management – This group develops the systems and tools to facilitate the identification of operational risks, and has globalaccountability for the measurement and monitoring of all operational risk types.
• Risk Analytics, Reporting and Credit Decisioning – This group is responsible for enterprise-wide analysis, including enterprise-wide stress testing andreporting, risk policy and governance, risk systems and models, recovery and resolution planning, as well as economic and regulatory capitalmethodologies. In addition, this group manages credit risk in the retail lines of business (residential mortgages, credit cards, personal loans/lines of credit,small business loans) and performs analytics to optimize retail credit performance, along with collections, fraud, and anti-money laundering outcomes.
• Compliance – This group provides timely and proactive advice and independent oversight of CIBC’s compliance with applicable regulatory and anti-moneylaundering requirements.
• U.S. Risk Management – This group carries out the mandate of CIBC Risk Management at a regional level under the leadership of the U.S. CRO, withoversight from the U.S. Risk Management Committee of the Board and reporting to the Senior Executive Vice-President, U.S. Region. The group providesindependent oversight for the identification, management, measurement, monitoring and control of risks in CIBC’s U.S. Commercial Banking and WealthManagement SBU. In addition, the CRO also oversees, through a joint oversight structure, the U.S. CRO, to ensure the relevant aspects of the U.S. RiskManagement group are consistent with the above noted practices.
Top and emerging risksWe monitor and review top and emerging risks that may affect our future results, and take action to mitigate potential risks if required. We perform in-depthanalyses, which can include stress testing our exposures relative to the risks, and provide updates and related developments to the Board on a regular basis. Thissection describes the top and emerging risks that we consider to have potential negative implications, as well as regulatory and accounting developments thatare material for CIBC.
Technology, information and cyber security riskFinancial institutions like CIBC are evolving their business processes to leverage innovative technologies and the internet to improve client experience andstreamline operations. At the same time, cyber threats and the associated financial, reputation and business interruption risks have also increased. CIBC hascyber insurance coverage to help mitigate loss associated with cyber incidents.
These risks continue to be actively managed by us through strategic risk reviews, enterprise-wide technology and information security programs, with thegoal of maintaining overall cyber resilience that prevents, detects and responds to threats such as data breaches, malware, unauthorized access and denial-of-service attacks.
Given the importance of electronic financial systems, including secure online and mobile banking provided by CIBC to its clients, CIBC continues todevelop controls and processes to protect our systems and client information from damage and unauthorized disclosure. CIBC monitors the changingenvironment globally, including cyber threats, evolving regulatory requirements, and mitigation strategies. In addition, we benchmark against best practices andprovide regular updates to the Board.
Despite our commitment to information and cyber security, CIBC and its related third parties may not be able to fully mitigate all risks associated with theincreased complexity and high rate of change in the threat landscape. However, CIBC continuously monitors its risk posture for changes and continues to refinesecurity protection approaches to minimize the impact of any incidents that may occur.
Disintermediation riskCanadian banking clients are increasingly shifting their service transactions from branches to digital platforms. As such, competitive pressure from digitaldisruptors, both global technology leaders and smaller financial technology entrants, is increasing and the risk of disintermediation is growing due to the levelof sophistication of these non-traditional competitors.
CIBC manages disintermediation risk through strategic risk reviews as well as investment in emerging channels, in data and analytics capabilities, and intechnology and innovation in general, to meet our clients’ changing expectations, while working to reduce our cost structure and simplify operations.
Geo-political riskThe level of geo-political risk escalates at certain points in time. While the specific impact on the global economy and on global credit and capital markets woulddepend on the nature of the event, in general, any major event could result in instability and volatility, leading to widening spreads, declining equity valuations,flight to safe-haven currencies and increased purchases of gold. In the short run, market shocks could hurt the net income of our trading and non-tradingmarket risk positions. Although Canada is unlikely to be directly subject to geo-political risk, the indirect impact of reduced economic growth, as well aspotential impacts on commodity prices, could have serious negative implications for general economic and banking activities.
Currently, there are several areas of concern which have raised the level of uncertainty in global financial markets. These include tensions between the U.S.and North Korea, the volatile situation in Syria, and the Brexit negotiations following the election results in the U.K. While it is impossible to predict where newgeo-political disruption will occur, we do pay particular attention to markets and regions with existing or recent historical instability to assess the impact ofthese environments on the markets and businesses in which we operate.
The new administration in the U.S. continues to pose economic policy uncertainties that could either add or subtract to Canadian economic activity. Thedownside risks would be associated with an increase in protectionism that does not exempt Canadian goods and services, as well as heightened competition
CIBC THIRD QUARTER 2017 25
for business investment as the U.S. eases up on corporate taxes and regulations. There could also be positive implications for Canada if U.S. growth acceleratesdue to fiscal stimulus. The U.S. government recently commenced the process of opening discussions to renegotiate the terms of the North American Free TradeAgreement. We will monitor these developments as details emerge.
Canadian consumer debt and the housing marketAs a consequence of historically low interest rates, Canadians have increased debt levels at a pace that has exceeded growth in their income. Most of theincrease in household debt levels has been driven by higher levels of mortgage debt, which is tied to the Canadian housing market. The Bank of Canada’srecent quarter-point increase in interest rates is expected to be followed by a similar increase later in the year. The increase and potential further interest rateincreases by the Bank of Canada can be viewed in concert with measures that OSFI, the Department of Finance and provincial governments have taken to slowdown borrowing and calm the housing market.
Currently, we qualify all variable rate mortgage borrowers using the Bank of Canada 5-year fixed benchmark rate, which is typically higher than thevariable rate by approximately two percentage points. Therefore, our variable rate borrowers should be able to withstand some increase in interest rates. Webelieve the risk of a severe housing crash that generates significant losses for mortgage portfolios is unlikely, but the risk associated with high levels ofconsumer debt would be a concern should the economy falter and unemployment rates increase.
Acquisition riskCIBC seeks out acquisition opportunities which align with its strategies, risk appetite and financial goals. The ability to successfully execute these strategies tointegrate acquisitions, and the ability to anticipate and manage risks associated with them, are subject to certain factors. These include receiving regulatory andshareholder approval on a timely basis and on favourable terms, retaining clients and key personnel, realizing synergies and efficiencies, controlling integrationand acquisition costs, among others, and changes in general business and economic conditions.
Although many of the factors are beyond CIBC’s control, their impact is partially mitigated by conducting due diligence before completing the transaction,developing and executing appropriate integration plans, and monitoring performance following the acquisition. However, acquisitions involve inherentuncertainty and we cannot determine all potential events, facts and circumstances and there could be an adverse impact on CIBC’s operations and financialperformance.
U.S. banking regulationIn conjunction with our acquisition of The PrivateBank, completed on June 23, 2017, our wholly-owned subsidiary, CIBC Holdco Inc. (CIBC Holdco), became abank holding company registered under the U.S. Bank Holding Company Act of 1956, as amended, and is subject to regulation as a bank holding company bythe U.S. Board of Governors of the Federal Reserve System (Federal Reserve). The PrivateBank, as a state-chartered bank with greater than $10 billion of totalassets, is subject to regulation by the U.S. Federal Deposit Insurance Corporation (FDIC), the U.S. Consumer Financial Protection Board (CFPB), and the IllinoisDepartment of Financial and Professional Regulation.
The scope of these regulations could impact our business in a number of ways. For example, both CIBC Holdco and The PrivateBank are required tomaintain minimum capital ratios in accordance with Basel III rules adopted by the U.S. bank regulatory agencies, which differ in some respects from Canada’sBasel III rules. Under the U.S. bank regulatory framework, both CIBC and CIBC Holdco are expected to provide a source of strength to the subsidiary bank andmay be required to commit additional capital and other resources to The PrivateBank in the event that its financial condition were to deteriorate, whether dueto overall challenging economic conditions in the U.S., or because of business-specific issues. The Federal Reserve and the FDIC also have the ability to restrictdividends paid by CIBC Holdco or The PrivateBank, which could limit our ability to receive distributions on our capital investment in our U.S. banking operations.
Furthermore, the Federal Reserve and the FDIC could also place limits on our ability to grow our U.S. banking operation, whether through acquisitions ororganically, if, among other things, they have supervisory concerns about risk management or compliance practices at CIBC Holdco or The PrivateBank. Inaddition, the CFPB has been active in recent years in pursuing enforcement actions and imposing fines against U.S. financial institutions for violations of federalconsumer protection laws.
Commodity pricesCommodity prices continue to fluctuate. Oil prices have rallied somewhat from their low levels in June as stronger growth in demand, as forecast by theInternational Energy Agency, is expected to reduce the glut in global supply.
So far, our overall commodity exposure continues to perform within our risk appetite, with losses in our oil and gas portfolio down significantly. Clients inour oil and gas portfolio are currently being assessed on the basis of our enhanced risk metrics, and our portfolio is being monitored in a prudent manner. Wehave run our enterprise statistical stress tests at lower oil prices to determine potential direct losses, and have also conducted stress tests to assess the secondaryimpacts of lower oil prices on our retail portfolio for the affected regions, where we could see higher losses if unemployment continues to trend negatively.
China economic policy riskWhile meeting the government-set quarterly targets, China’s economy continues to be on a relatively slower growth trajectory as, in addition to cyclical factors,the country tries to rebalance growth from an export-oriented and investment-driven performance to a more sustainable service-oriented and consumption-driven economy. The capital controls deployed by the People’s Bank of China late last year which were designed to slow capital outflows remain in place andcould have implications for Canadian cities such as Vancouver and Toronto, where foreign purchasers have contributed to the sharp rise in house prices overrecent years. These capital controls could also slow the market in Canada for mergers and acquisitions.
We continue to monitor economic policy both within the country and the region for signs of stress or directional change, and have taken a prudent stancein addressing our tolerance for exposure to the country. We currently have little direct exposure to China, but any negative impact from the Chinese economicslowdown could affect clients that export to China or sell into a market where prices have been pushed down by weakness in Chinese demand, and could raisethe credit risk associated with our exposure to trading counterparties.
Anti-money launderingRecognizing the threat of money laundering, terrorist financing activities and other related crimes to the stability and integrity of a country’s financial sector andits broader economy, the international community has made the fight against these illegal activities a priority. Several laws and regulations have been enactedby governments and regulatory bodies globally. As a potential conduit for illegal operations, financial institutions bear a significant responsibility in mitigatingthe risks associated with these activities.
CIBC is committed to adhering to all regulatory requirements pertaining to Anti-Money Laundering (AML) and Anti-Terrorist Financing (ATF) andimplementing best practices to minimize the impact of such activities. As such, CIBC has implemented procedures to ensure that relevant regulatory
26 CIBC THIRD QUARTER 2017

obligations with respect to the reporting of large cash transactions, electronic funds transfers, and cross-border movements of cash and monetary instruments,are met in each jurisdiction. In addition, all employees are required to complete CIBC’s AML/ATF training annually.
Environmental risks and pandemic outbreaksA number of environmental events have occurred over the past several years, including hurricanes, tsunamis, earthquakes, wildfires, droughts and floods, oilspills, and industrial accidents. There is also concern that the outbreak of certain illnesses could have the potential to reach pandemic levels. In addition to thehumanitarian impact, these phenomena, along with the potential impact of climate change, introduce uncertainty and pose risks to the global economy, aswell as our clients and our operations.
CIBC monitors these events and has measures in place including disaster recovery, insurance and business continuity programs, to ensure client needscontinue to be met.
Regulatory developmentsSee the “Capital resources”, “Liquidity risk” and “Accounting and control matters” sections for additional information on regulatory developments.
Accounting developmentsSee the “Accounting and control matters” section and Note 1 to the interim consolidated financial statements for additional information on accountingdevelopments.
Risks arising from business activitiesThe chart below shows our business activities and related risk measures based upon regulatory RWAs and economic capital as at July 31, 2017:
• Deposits
• Residential mortgages
• Personal loans
• Credit cards
• Business lending
• Insurance
• Retail brokerage
• Asset management
• Private wealth management
• Commercial banking
• Asset management
• Private wealth management
• Personal and small businessbanking
• Credit products
• Global markets
• Investment banking
• Investment portfolios
• International banking
• Investment portfolios
• Joint ventures
• Functional and supportgroups (see page 14)
($ millions)
Average assets 297,289Average deposits 203,189
($ millions)
Average assets 3,499Average deposits 10,424
($ millions)
Average assets 22,346Average deposits 9,242
($ millions)
Average assets 151,164Average deposits 27,392
($ millions)
Average assets 68,840Average deposits 172,813
($ millions)
Credit risk 82,756
Market risk –
Operational risk 9,717
($ millions)
Credit risk 370
Market risk –
Operational risk 2,842
($ millions)
Credit risk (1) 29,273
Market risk 57
Operational risk 2,554
($ millions)
Credit risk (2) 38,200
Market risk 5,440
Operational risk 8,047
($ millions)
Credit risk (3) 17,555
Market risk 481
Operational risk 1,167
(%)
Proportion of total CIBC 28
Comprising:
Credit risk (5) 75
Market risk 16
(%)
Proportion of total CIBC 6
Comprising:
Credit risk (5) 3
Market risk 4
(%)
Proportion of total CIBC 33
Comprising:
Credit risk (5) 33
Market risk 1
(%)
Proportion of total CIBC 15
Comprising:
Credit risk (5) 70
Market risk 9
(%)
Proportion of total CIBC 18
Comprising:
Credit risk (5) 24
Market risk 9Operational/Strategic risks 9
Operational/Strategic risks 93
Operational/Strategic risks 66
Operational/Strategic risks 21
Operational/Strategic risks 67
SBUs
Businessactivities
Balancesheet
CET1 RWA(All-in basis)
Economiccapital (4)
Risk profile We are exposed to credit, market, liquidity, operational, and other risks, which primarily include strategic, insurance, technology, information and cyber security,reputation and legal, regulatory compliance, and environmental risks.
Canadian Retail andBusiness Banking
Canadian WealthManagement
CIBC
U.S. Commercial Bankingand Wealth Management Capital Markets
Corporate and Other
(1) Includes counterparty credit risk of $126 million, which comprises derivatives and repo-style transactions.(2) Includes counterparty credit risk of $8,760 million, which comprises derivatives and repo-style transactions.(3) Includes counterparty credit risk of $550 million, which comprises derivatives and repo-style transactions.(4) For additional information, see the “Non-GAAP measures” section.(5) Includes investment risk.
CIBC THIRD QUARTER 2017 27

Credit riskCredit risk is the risk of financial loss due to a borrower or counterparty failing to meet its obligations in accordance with contractual terms.
Credit risk arises out of the lending businesses in each of our SBUs. Other sources of credit risk include our trading activities, including our OTC derivatives,debt securities, and our repo-style transaction activity. In addition to losses on the default of a borrower or counterparty, unrealized gains or losses may occurdue to changes in the credit spread of the counterparty, which could impact the carrying or fair value of our assets.
Exposure to credit risk
$ millions, as at2017
Jul. 312016
Oct. 31
Business and government portfolios – AIRB approachDrawn $ 132,790 $ 127,577Undrawn commitments 45,346 42,526Repo-style transactions 109,744 86,384Other off-balance sheet 76,557 81,210OTC derivatives 16,948 18,587
Gross exposure at default (EAD) on business and government portfolios 381,385 356,284Less: Repo-style transaction collateral 98,861 76,263
Net EAD on business and government portfolios 282,524 280,021
Retail portfolios – AIRB approachDrawn 251,692 232,848Undrawn commitments 68,492 67,541Other off-balance sheet 344 351
Gross EAD on retail portfolios 320,528 300,740
Standardized portfolios (1) 44,342 14,122Securitization exposures 13,350 18,863
Gross EAD $ 759,605 $ 690,009
Net EAD $ 660,744 $ 613,746
(1) In the third quarter of 2017, we completed the acquisition of The PrivateBank. See “Significant events” for additional details. Credit risk for The PrivateBank is calculated under the standardized approach.
Oil and gas exposureThe following table provides a breakdown of our exposure to the oil and gas industry under the AIRB approach. Of these exposures, 76% are investment gradebased on our internal risk rating, which incorporates security pledged (equivalent to Standard & Poor’s Ratings Services (S&P)/Moody’s Investors Service, Inc.(Moody’s) rating of BBB-/Baa3 and higher).
$ millions, as at July 31, 2017 DrawnUndrawn
commitmentsOther off-
balance sheetOTC
derivatives Total
Exploration and production $ 3,940 $ 3,473 $ 413 $ 530 $ 8,356Midstream 1,386 1,790 25 130 3,331Downstream 214 229 72 2 517Integrated 146 1,127 310 715 2,298Oil and gas services 313 175 34 29 551Petroleum distribution 1,249 887 89 52 2,277
$ 7,248 $ 7,681 $ 943 $ 1,458 $ 17,330
October 31, 2016 $ 6,873 $ 7,825 $ 963 $ 1,994 $ 17,655
Forbearance policyWe employ forbearance techniques to manage client relationships and to minimize credit losses due to default, foreclosure or repossession. In certaincircumstances, it may be necessary to modify a loan for economic or legal reasons related to a borrower’s financial difficulties, and we may grant a concessionin the form of below-market rates or terms that would not otherwise be considered, for the purpose of maximizing recovery of our exposure to the loan. Incircumstances where the concession is considered below market, the modification is reported as a troubled debt restructuring (TDR). TDRs are subject to ournormal quarterly impairment review which considers, amongst other factors, covenants and/or payment delinquencies. An appropriate level of loan lossprovision by portfolio segment is then established.
In retail lending, forbearance techniques include interest capitalization, amortization amendments and debt consolidations. We have a set of eligibilitycriteria which allow our Client Account Management team to determine suitable remediation strategies and propose products based on each borrower’ssituation. While these solutions often provide more favourable conditions than those originally provided and are intended to increase the ability of borrowers toservice their obligation to CIBC overall, we consider these solutions to be at market and comparable to terms and conditions we would have offered to newclients with comparable credit ratings.
The solutions available to corporate and commercial clients vary based on the individual nature of the client’s situation and are undertaken selectivelywhere it has been determined that the client has or is likely to have repayment difficulties servicing its obligations. Covenants often reveal changes in the client’sfinancial situation before there is a change in payment behaviour and typically allow for a right to reprice or accelerate payments. Solutions may be temporaryin nature or may involve other special management options.
During the quarter and nine months ended July 31, 2017, $44 million and $232 million, respectively ($21 million and $147 million for the quarter andnine months ended July 31, 2016, respectively) of loans have undergone TDR, of which $34 million related to The PrivateBank.
28 CIBC THIRD QUARTER 2017

Real estate secured personal lendingReal estate secured personal lending comprises residential mortgages and personal loans and lines secured by residential property (HELOC). This portfolio is lowrisk, as we have a first charge on the majority of the properties and a second lien on only a small portion of the portfolio. We use the same lending criteria inthe adjudication of both first lien and second lien loans.
The following table provides details on our residential mortgage and HELOC portfolios:
Residential mortgages HELOC (1) Total
$ billions, as at July 31, 2017 Insured Uninsured Uninsured Insured Uninsured
Ontario (2) $ 42.6 43 % $ 56.3 57 % $ 11.2 100 % $ 42.6 39 % $ 67.5 61 %British Columbia and territories (3) 15.3 36 27.1 64 4.4 100 15.3 33 31.5 67Alberta 15.9 61 10.0 39 2.8 100 15.9 56 12.8 44Quebec 7.3 52 6.7 48 1.5 100 7.3 47 8.2 53Central prairie provinces 4.8 63 2.8 37 0.9 100 4.8 56 3.7 44Atlantic provinces 5.2 62 3.2 38 0.8 100 5.2 57 4.0 43
Canadian portfolio (4)(5) 91.1 46 106.1 54 21.6 100 91.1 42 127.7 58U.S. portfolio (4)(6)(7) – (8) 2 0.8 98 0.1 100 – (8) 2 0.9 98Other international portfolio (4) – – 2.4 100 – – – – 2.4 100
Total portfolio $ 91.1 45 % $ 109.3 55 % $ 21.7 100 % $ 91.1 41 % $ 131.0 59 %
October 31, 2016 $ 97.4 53 % $ 85.9 47 % $ 20.3 100 % $ 97.4 48 % $ 106.2 52 %
(1) We did not have any insured HELOCs as at July 31, 2017 and October 31, 2016.(2) Includes $21.0 billion (October 31, 2016: $22.7 billion) of insured residential mortgages, $39.0 billion (October 31, 2016: $28.3 billion) of uninsured residential mortgages, and $6.5 billion (October 31, 2016:
$5.8 billion) of HELOCs in the Greater Toronto Area (GTA).(3) Includes $7.2 billion (October 31, 2016: $7.8 billion) of insured residential mortgages, $20.2 billion (October 31, 2016: $17.2 billion) of uninsured residential mortgages, and $2.7 billion (October 31, 2016:
$2.5 billion) of HELOCs in the Greater Vancouver Area (GVA).(4) Geographical location is based on the address of the property.(5) 74% (October 31, 2016: 77%) of insurance on Canadian residential mortgages is provided by CMHC and the remaining by two private Canadian insurers, both rated at least AA (low) by DBRS Limited (DBRS).(6) In the third quarter of 2017, we completed the acquisition of The PrivateBank. See “Significant events” for additional details.(7) Insurance on U.S. residential mortgages is provided by Federal Housing Administration.(8) Due to rounding.
The average loan-to-value (LTV) ratios(1) for our uninsured residential mortgages and HELOCs originated during the quarter and nine months are provided in thefollowing table. We did not acquire uninsured residential mortgages or HELOCs from a third party for the periods presented in the table below.
For the threemonths ended
For the ninemonths ended
2017Jul. 31
2017Apr. 30
2016Jul. 31
2017Jul. 31
2016Jul. 31
Residentialmortgages HELOC
Residentialmortgages HELOC
Residentialmortgages HELOC
Residentialmortgages HELOC
Residentialmortgages HELOC
Ontario (2) 63 % 66 % 64 % 67 % 64 % 68 % 64 % 67 % 64 % 69 %British Columbia and territories (3) 61 64 61 65 60 63 60 64 60 64Alberta 68 72 68 73 68 73 68 72 68 72Quebec 68 73 68 72 67 72 68 72 67 72Central prairie provinces 69 73 70 73 68 74 69 73 69 73Atlantic provinces 72 73 73 73 71 73 72 73 72 73
Canadian portfolio (4) 63 % 67 % 64 % 67 % 63 % 67 % 64 % 67 % 64 % 68 %U.S. portfolio (4)(5) 72 % 75 % n/a n/a n/a n/a 72 % 75 % n/a n/aOther international portfolio (4) 73 % n/m 72 % n/m 68 % n/m 73 % n/m 70 % n/m
(1) LTV ratios for newly originated residential mortgages and HELOCs are calculated based on weighted average.(2) Average LTV ratios for our uninsured GTA residential mortgages originated during the quarter were 61% (April 30, 2017: 62%; July 31, 2016: 61%) and 62% for the nine months ended July 31, 2017
(July 31, 2016: 62%).(3) Average LTV ratios for our uninsured GVA residential mortgages originated during the quarter were 58% (April 30, 2017: 58%; July 31, 2016: 57%) and 57% for the nine months ended July 31, 2017
(July 31, 2016: 58%).(4) Geographical location is based on the address of the property.(5) In the third quarter of 2017, we completed the acquisition of The PrivateBank. See “Significant events” for additional details.n/a Not applicable.n/m Not meaningful.
The following table provides the average LTV ratios on our total Canadian residential mortgage portfolio:
Insured Uninsured
July 31, 2017 (1)(2) 54 % 52 %October 31, 2016 (1)(2) 57 % 56 %(1) LTV ratios for residential mortgages are calculated based on weighted average. The house price estimates for July 31, 2017 and October 31, 2016 are based on the Forward Sortation Area (FSA) level indices
from the Teranet – National Bank National Composite House Price Index (Teranet) as of June 30, 2017 and September 30, 2016, respectively. Teranet is an independent estimate of the rate of change inCanadian home prices.
(2) Average LTV ratio on our uninsured GTA residential mortgage portfolio was 46% (October 31, 2016: 53%). Average LTV ratio on our uninsured GVA residential mortgage portfolio was 46% (October 31,2016: 46%).
CIBC THIRD QUARTER 2017 29

The tables below summarize the remaining amortization profile of our total Canadian, U.S. and other international residential mortgages. The first tableprovides the remaining amortization periods based on the minimum contractual payment amounts. The second table provides the remaining amortizationperiods based upon current customer payment amounts, which incorporate payments larger than the minimum contractual amount and/or higher frequency ofpayments.
Contractual payment basis
Less than5 years
5–10years
10–15years
15–20years
20–25years
25–30years
30–35years
35 yearsand above
Canadian portfolioJuly 31, 2017 – % – % 3 % 5 % 35 % 55 % 2 % – %October 31, 2016 – % – % 3 % 6 % 30 % 58 % 3 % – %
U.S. portfolioJuly 31, 2017 (1) – % 3 % 14 % 15 % 10 % 52 % 4 % 2 %October 31, 2016 n/a n/a n/a n/a n/a n/a n/a n/a
Other international portfolioJuly 31, 2017 9 % 15 % 27 % 23 % 16 % 9 % 1 % – %October 31, 2016 8 % 16 % 27 % 24 % 16 % 8 % 1 % – %
(1) In the third quarter of 2017, we completed the acquisition of The PrivateBank. See “Significant events” for additional details.n/a Not applicable.
Current customer payment basis
Less than5 years
5–10years
10–15years
15–20years
20–25years
25–30years
30–35years
35 yearsand above
Canadian portfolioJuly 31, 2017 2 % 4 % 7 % 11 % 35 % 37 % 4 % – %October 31, 2016 2 % 5 % 8 % 12 % 34 % 37 % 2 % – %
U.S. portfolioJuly 31, 2017 (1) – % 4 % 14 % 14 % 10 % 51 % 1 % 6 %October 31, 2016 n/a n/a n/a n/a n/a n/a n/a n/a
Other international portfolioJuly 31, 2017 8 % 15 % 26 % 24 % 16 % 9 % 2 % – %October 31, 2016 8 % 16 % 26 % 23 % 16 % 8 % 2 % 1 %
(1) In the third quarter of 2017, we completed the acquisition of The PrivateBank. See “Significant events” for additional details.n/a Not applicable.
In October 2016, the Minister of Finance announced changes to strengthen the housing market that will impose the use of the government-posted mortgagequalifying rates on a wider range of insured mortgages, and close loopholes related to the principal residence exemption for capital gains taxes. There isongoing consultation with market participants on an approach to implement risk sharing for insured mortgages (i.e., sharing losses between banks andinsurers).
Reflective of the regulatory changes relating to mortgage insurance introduced over the past few years, including the most recent changes noted above,and a change in consumer behaviour in response to the series of government tightening measures on high ratio mortgages, we expect our insured mortgagemix as a proportion of total mortgages to decrease at an accelerated rate.
In August 2016, the government of British Columbia introduced a 15% property transfer tax on the purchase of real estate in the GVA and surroundingregions by foreign buyers. In April 2017, the Ontario government introduced a number of housing-related regulations, including a 15% foreign buyers’ tax inthe GTA and surrounding regions. Initial indications have shown that residential real estate activity, including sales and average resale prices, have slowed in theGTA since the new tax was introduced, while the GVA has seen renewed activity levels in the year since the tax was announced. CIBC will continue to closelymonitor the housing markets and the performance of our credit portfolios in these two regions, and will take risk mitigation action as required.
In July 2017, OSFI released a draft proposal of updates to its B-20 guidelines. The guidelines introduce a number of key changes to qualifying interest ratesfor uninsured mortgages, dynamic and adjusted LTV ratios, more prescriptive guidance around the definitions of non-conforming loans, and process changes inadjudication procedures. Additionally, the draft guidelines tighten OSFI’s expectations and introduce more stringent rules around loan documentation, incomeverification, limits and limit monitoring, as well as controls. CIBC and other Canadian financial institutions continue to hold discussions with OSFI on the subjectmatter, as part of the public consultation process. CIBC will continue to monitor developments in this area, including potential impact on our real estate securedlending portfolios.
We have two types of condominium exposures in Canada: mortgages and developer loans. Both are primarily concentrated in the Toronto and Vancouverareas. As at July 31, 2017, our Canadian condominium mortgages were $23.1 billion (October 31, 2016: $20.6 billion) of which 46% (October 31, 2016: 54%)were insured. Our drawn developer loans were $0.6 billion (October 31, 2016: $0.7 billion) or 0.5% (October 31, 2016: 0.8%) of our business and governmentportfolio, and our related undrawn exposure was $2.6 billion (October 31, 2016: $2.2 billion). The condominium developer exposure is diversified across82 projects.
We stress test our mortgage and HELOC portfolio to determine the potential impact of different economic events. Our stress tests can use variables such asunemployment rates, debt service ratios and housing price changes, to model potential outcomes for a given set of circumstances. The stress testing involvesvariables that could behave differently in certain situations. Our main tests use economic variables in a similar range to historical events when Canadaexperienced economic downturns. Our results show that in an economic downturn, our strong capital position should be sufficient to absorb mortgage andHELOC losses.
30 CIBC THIRD QUARTER 2017

Trading credit exposuresWe have trading credit exposure (also called counterparty credit exposure) that arises from our interest rate, foreign exchange, equity, commodity, and creditderivatives trading, hedging, and portfolio management activities, as described in Note 12 to the 2016 annual consolidated financial statements.
The following table shows the rating profile of OTC derivative mark-to-market (MTM) receivables:
$ billions, as at2017
Jul. 31 (1)2016
Oct. 31
Exposure (2)
Investment grade $ 6.32 83.0 % $ 7.36 82.8 %Non-investment grade 1.23 16.2 1.43 16.1Watch list 0.02 0.2 0.03 0.3Default – – 0.05 0.6Unrated 0.05 0.6 0.02 0.2
$ 7.62 100.0 % $ 8.89 100.0 %
(1) In the third quarter of 2017, we completed the acquisition of The PrivateBank. See “Significant events” for additional details.(2) MTM of the OTC derivative contracts is after the impact of master netting agreements, but before any collateral.
The following table provides details of our impaired loans and allowances for credit losses:As at or for the three
months endedAs at or for the nine
months ended
$ millions2017
Jul. 312017
Apr. 302016
Jul. 312017
Jul. 312016
Jul. 31
Business andgovernment
loansConsumer
loans Total
Business andgovernment
loansConsumer
loans Total
Business andgovernment
loansConsumer
loans Total
Business andgovernment
loansConsumer
loans Total
Business andgovernment
loansConsumer
loans Total
Gross impaired loansBalance at beginning of period $ 604 $ 729 $ 1,333 $ 704 $ 714 $ 1,418 $ 1,146 $ 735 $ 1,881 $ 951 $ 707 $ 1,658 $ 659 $ 760 $ 1,419
Classified as impairedduring the period 134 339 473 40 349 389 283 291 574 259 1,039 1,298 1,032 896 1,928
Transferred to not impairedduring the period (12) (38) (50) (1) (36) (37) (3) (40) (43) (32) (114) (146) (16) (97) (113)
Net repayments (103) (93) (196) (131) (82) (213) (171) (61) (232) (321) (236) (557) (361) (196) (557)Amounts written off (18) (233) (251) (28) (230) (258) (86) (235) (321) (92) (697) (789) (135) (661) (796)Recoveries of loans and advances
previously written off – – – – – – – – – – – – – – –Disposals of loans (4) – (4) – – – (156) – (156) (169) – (169) (156) – (156)Purchased credit-impaired loans (1) 93 12 105 – – – – – – 93 12 105 – – –Foreign exchange and other (40) (26) (66) 20 14 34 22 13 35 (35) (21) (56) 12 1 13
Balance at end of period $ 654 $ 690 $ 1,344 $ 604 $ 729 $ 1,333 $ 1,035 $ 703 $ 1,738 $ 654 $ 690 $ 1,344 $ 1,035 $ 703 $ 1,738
Allowance for impairment (2)
Balance at beginning of period $ 199 $ 325 $ 524 $ 213 $ 310 $ 523 $ 371 $ 324 $ 695 $ 259 $ 313 $ 572 $ 313 $ 333 $ 646Amounts written off (18) (233) (251) (28) (230) (258) (86) (235) (321) (92) (697) (789) (135) (661) (796)Recoveries of amounts written
off in previous periods 5 43 48 5 45 50 3 43 46 14 131 145 12 127 139Charge to income statement 23 186 209 6 191 197 60 185 245 42 575 617 179 540 719Interest accrued on impaired loans (5) (2) (7) (4) (2) (6) (6) (3) (9) (15) (6) (21) (13) (7) (20)Disposals of loans – – – – – – – – – – – – – – –Foreign exchange and other (14) (23) (37) 7 11 18 7 6 13 (18) (20) (38) (7) (12) (19)
Balance at end of period $ 190 $ 296 $ 486 $ 199 $ 325 $ 524 $ 349 $ 320 $ 669 $ 190 $ 296 $ 486 $ 349 $ 320 $ 669
Net impaired loansBalance at beginning of period $ 405 $ 404 $ 809 $ 491 $ 404 $ 895 $ 775 $ 411 $ 1,186 $ 692 $ 394 $ 1,086 $ 346 $ 427 $ 773
Net change in gross impaired 50 (39) 11 (100) 15 (85) (111) (32) (143) (297) (17) (314) 376 (57) 319Net change in allowance 9 29 38 14 (15) (1) 22 4 26 69 17 86 (36) 13 (23)
Balance at end of period $ 464 $ 394 $ 858 $ 405 $ 404 $ 809 $ 686 $ 383 $ 1,069 $ 464 $ 394 $ 858 $ 686 $ 383 $ 1,069
Net impaired loans as a percentageof net loans and acceptances 0.24 % 0.24 % 0.34 % 0.24 % 0.34 %
(1) In the third quarter of 2017, we completed the acquisition of The PrivateBank. See “Significant events” for additional details.(2) Includes collective allowance relating to personal, scored small business and mortgage impaired loans that are greater than 90 days delinquent, and individual allowance.
Gross impaired loansAs at July 31, 2017, gross impaired loans were $1,344 million, down $394 million from the same quarter last year. The decrease was primarily due to reductionsin the oil and gas sector and in our exited European leveraged finance portfolio, as well as the impact of U.S. dollar depreciation on our existing portfolio,partially offset by the inclusion of the results of The PrivateBank and a new impairment in our pre-existing U.S. real estate finance portfolio.
Gross impaired loans were up $11 million from the prior quarter, mainly due to inclusion of the results of The PrivateBank and a new impairment in ourpre-existing U.S. real estate finance portfolio, partially offset by the impact of U.S. dollar depreciation on our existing portfolio and a decrease in the oil and gassector.
Approximately 37% of gross impaired loans related to Canada, of which the residential mortgage and personal lending portfolios accounted for the majority.Approximately 35% of gross impaired loans related to CIBC FirstCaribbean, of which the residential mortgage, real estate and construction, and business
services sectors accounted for the majority.The remaining gross impaired loans related to the U.S., of which the oil and gas, and real estate and construction sectors accounted for the majority.
Allowance for impairmentAllowance for impairment was $486 million, down $183 million from the same quarter last year, primarily due to decreases in the oil and gas sector and in ourexited European leveraged finance portfolio, as well as the impact of U.S. dollar depreciation on our existing portfolio, partially offset by a new impairment inour pre-existing U.S. real estate finance portfolio.
Allowance for impairment was down $38 million from the prior quarter, mainly due to the impact of U.S. dollar depreciation on our existing portfolio and adecrease in CIBC FirstCaribbean, partially offset by a new impairment in our pre-existing U.S. real estate finance portfolio.
CIBC THIRD QUARTER 2017 31

Exposure to certain countries and regionsOver the past several years, a number of countries in Europe experienced credit concerns. The following tables provide our exposure to European countries,both within and outside the Eurozone.
Our direct exposures presented in the tables below comprise (A) funded – on-balance sheet loans (stated at amortized cost net of individual allowances, if any),deposits with banks (stated at amortized cost net of individual allowances, if any) and securities (stated at fair value); (B) unfunded – unutilized creditcommitments, letters of credit, and guarantees (stated at notional amount net of individual allowances, if any) and sold credit default swap (CDS) contractswhere we do not benefit from subordination (stated at notional amount less fair value); and (C) derivative MTM receivables (stated at fair value) and repo-styletransactions (stated at fair value).
Of our total direct exposures to Europe, approximately 32% (October 31, 2016: 34%) is to entities in countries with Aaa/AAA ratings from at least one ofMoody’s or S&P.
The following tables provide a summary of our positions in this business:Direct exposures
Funded Unfunded
$ millions, as at July 31, 2017 Corporate Sovereign BankTotal funded
(A) Corporate BankTotal unfunded
(B)
Austria $ – $ 299 $ – $ 299 $ – $ 2 $ 2Belgium 1 – 21 22 – – –Finland 5 1 13 19 57 – 57France 36 – 35 71 70 1 71Germany 45 528 389 962 104 24 128Ireland – – 1 1 – 13 13Italy – – – – – – –Luxembourg 1 – – 1 5 35 40Netherlands 224 22 76 322 126 60 186Spain – – 1 1 – – –
Total Eurozone $ 312 $ 850 $ 536 $ 1,698 $ 362 $ 135 $ 497
Czech Republic $ – $ – $ – $ – $ – $ – $ –Denmark – – 1 1 – 9 9Norway – 25 6 31 297 – 297Poland – – 2 2 – – –Sweden 21 234 4 259 80 – 80Switzerland 72 – 28 100 215 – 215Turkey – – 40 40 – 7 7United Kingdom 911 412 490 1,813 2,552 187 2,739
Total non-Eurozone $ 1,004 $ 671 $ 571 $ 2,246 $ 3,144 $ 203 $ 3,347
Total Europe (1) $ 1,316 $ 1,521 $ 1,107 $ 3,944 $ 3,506 $ 338 $ 3,844
October 31, 2016 $ 1,684 $ 1,401 $ 1,488 $ 4,573 $ 3,347 $ 296 $ 3,643(1) Includes nil (October 31, 2016: $162 million) of loans, net of allowance, related to the discontinued European leveraged finance business.
Direct exposures (continued)Derivative MTM receivables and repo-style transactions Total direct
exposure(A)+(B)+(C)$ millions, as at July 31, 2017 Corporate Sovereign Bank
Grossexposure (1)
Collateralheld (2)
Net exposure(C)
Austria $ – $ – $ 30 $ 30 $ 15 $ 15 $ 316Belgium – – 12 12 12 – 22Finland 3 – – 3 – 3 79France 22 – 3,603 3,625 3,591 34 176Germany 3 – 1,083 1,086 1,071 15 1,105Ireland – – 2,075 2,075 1,957 118 132Italy – – 4 4 – 4 4Luxembourg 1 – 44 45 1 44 85Netherlands 19 – 49 68 43 25 533Spain – – 37 37 35 2 3
Total Eurozone $ 48 $ – $ 6,937 $ 6,985 $ 6,725 $ 260 $ 2,455
Czech Republic $ – $ 1,304 $ – $ 1,304 $ 1,239 $ 65 $ 65Denmark – – – – – – 10Norway – 470 2 472 471 1 329Poland – – – – – – 2Sweden 9 – 131 140 127 13 352Switzerland 1 – 3,754 3,755 3,598 157 472Turkey – – – – – – 47United Kingdom 604 70 4,122 4,796 4,061 735 5,287
Total non-Eurozone $ 614 $ 1,844 $ 8,009 $ 10,467 $ 9,496 $ 971 $ 6,564
Total Europe $ 662 $ 1,844 $ 14,946 $ 17,452 $ 16,221 $ 1,231 $ 9,019
October 31, 2016 $ 746 $ 1,056 $ 10,109 $ 11,911 $ 10,805 $ 1,106 $ 9,322(1) The amounts are shown net of CVA.(2) Collateral on derivative MTM receivables was $1.1 billion (October 31, 2016: $1.2 billion), collateral on repo-style transactions was $15.2 billion (October 31, 2016: $9.6 billion), and both are comprised of
cash and investment grade debt securities.
32 CIBC THIRD QUARTER 2017

In addition to the European exposure identified above, we have $2 million (October 31, 2016: $132 million) of indirect exposure, which comprises securities(primarily collateralized loan obligations (CLOs) classified as loans on our interim consolidated balance sheet). Our gross exposure before subordination is statedat carrying value.
We also have $129 million (October 31, 2016: $399 million) of indirect exposure to European entities, as we hold debt or equity securities issued byEuropean entities as collateral for our securities lending and borrowing activity, from counterparties that are not in Europe.
Selected exposures in certain activitiesIn response to the recommendations of the Financial Stability Board, this section provides information on our other selected activities within our continuing andexited businesses that may be of particular interest to investors based on their risk characteristics and the current market environment. For additionalinformation on these selected exposures, refer to page 60 of the 2016 Annual Report.
Structured credit run-off businessIn 2008, management made a decision to wind down our exposure in the structured credit business. The following table provides a summary of our exposures:
Written credit derivatives,liquidity and credit facilities
Purchased credit protection
US$ millions, as at July 31, 2017 Investment and loans (1) Financial guarantors Other counterparties
Notional
Fair valuetrading, AFS
and FVOsecurities
Fairvalue of
securitiesclassifiedas loans
Carryingvalue of
securitiesclassifiedas loans Notional Fair value Notional
Fair valuenet of
CVA Notional
Fair valuenet of
CVA
$ 207 $ 71 $ 25 $ 25 $ 138 $ 102 $ 15 $ – $ 128 $ 102
October 31, 2016 $ 611 $ 252 $ 236 $ 236 $ 3,695 $ 120 $ 282 $ 2 $ 3,821 $ 103
(1) Excluded from the table above is an equity AFS security that we obtained in consideration for commutation of our U.S. residential mortgage market (USRMM) contracts with financial guarantors with a carryingvalue of US$8 million (October 31, 2016: US$5 million).
As at July 31, 2017, our significant positions in investments and loans include:• US$15 million notional value of CLO positions classified at amortized cost, consisting of first priority tranches of CLOs, backed by diversified pools of
primarily U.S. and European-based senior secured leveraged loans. As at July 31, 2017, 100% of the total notional amount of the CLO tranches wererated Aaa by Moody’s. The CLO positions have a carrying value of US$15 million and a weighted-average life of three months.
• Notes that were originally received in exchange for our non-bank sponsored asset-backed commercial paper (ABCP) in January 2009, upon the ratificationof the Montreal Accord restructuring, which include loans classified at amortized cost with a notional value of US$48 million and fair value and carryingvalue of nil; and
• US$84 million notional value of CDOs consisting of trust preferred securities (TruPs) collateral, which are Tier I Innovative Capital Instruments issued by U.S.regional banks and insurers. These securities are classified as FVO securities and had a fair value of US$71 million.
As at July 31, 2017, our significant positions in written and purchased credit derivatives include:• USRMM CDO positions consisting of a written and purchased credit derivative with the same notional value of US$128 million.• US$15 million notional value of credit protection purchased from financial guarantors that are hedging the CLO positions.
Net income for the quarter was $3 million, compared with $21 million and $2 million for the same quarter last year and the prior quarter, respectively. Duringthe nine months ended July 31, 2017, our exposure significantly decreased due to maturities and unwinds, including the maturity of a corporate debt exposurein the first quarter of 2017, where CIBC had purchased and sold credit protection with a notional value of US$3.3 billion.
U.S. real estate lendingIn our U.S. Commercial Banking and Wealth Management SBU, we operate a full-service platform which offers real estate credit to mid-market clients. Onceconstruction is complete, and the property is income-producing, we may occasionally offer fixed-rate financing within a permanent financing program (typicallywith average terms of 10 years). This portfolio of permanent financing exposures, which is a small subset of our total U.S. real estate lending portfolio, serves asa warehouse for inclusion in future Commercial Mortgage Backed Securities (CMBS) programs. We retain no exposure to those CMBS programs. As at July 31,2017, the portfolio of permanent financing exposures was $201 million (October 31, 2016: $105 million).
CIBC THIRD QUARTER 2017 33

Market riskMarket risk is the risk of economic financial loss in our trading and non-trading portfolios from adverse changes in underlying market factors, including interestrates, foreign exchange rates, equity market prices, commodity prices, credit spreads, and customer behaviour for retail products. Market risk arises in CIBC’strading and treasury activities, and encompasses all market related positioning and market making activity.
The trading book consists of positions in financial instruments and commodities held to meet the near-term needs of our clients.The non-trading book consists of positions in various currencies that are related to asset/liability management (ALM) and investment activities.
Risk measurementThe following table provides balances on the interim consolidated balance sheet which are subject to market risk. Certain differences between accounting andrisk classifications are detailed in the footnotes below:
$ millions, as at2017
Jul. 31 (1)
2016Oct. 31
Subject to market risk Subject to market risk
Consolidatedbalance
sheet TradingNon-
trading
Notsubject to
market risk
Consolidatedbalance
sheet TradingNon-
trading
Notsubject to
market risk
Non-traded riskprimary risk
sensitivity
Cash and non-interest-bearingdeposits with banks $ 4,207 $ – $ 1,866 $ 2,341 $ 3,500 $ – $ 1,645 $ 1,855 Foreign exchange
Interest-bearing deposits with banks 15,710 73 15,637 – 10,665 347 10,318 – Interest rateSecurities 88,380 46,341 (2) 42,039 – 87,423 48,066 (2) 39,357 – Equity, interest rateCash collateral on securities borrowed 5,866 – 5,866 – 5,433 – 5,433 – Interest rateSecurities purchased under resale agreements 39,206 – 39,206 – 28,377 – 28,377 – Interest rateLoans
Residential mortgages 203,387 – 203,387 – 187,298 – 187,298 – Interest ratePersonal 40,470 – 40,470 – 38,041 – 38,041 – Interest rateCredit card 12,438 – 12,438 – 12,332 – 12,332 – Interest rateBusiness and government 94,913 12,404 (3) 82,509 – 71,437 6,536 (3) 64,901 – Interest rateAllowance for credit losses (1,598) – (1,598) – (1,691) – (1,691) – Interest rate
Derivative instruments 26,370 22,958 (4) 3,412 – 27,762 24,130 (4) 3,632 – Interest rate,foreign exchange
Customers’ liability under acceptances 9,383 – 9,383 – 12,364 – 12,364 – Interest rateOther assets 22,180 884 12,945 8,351 18,416 1,466 9,190 7,760 Interest rate, equity,
foreign exchange
$ 560,912 $ 82,660 $ 467,560 $ 10,692 $ 501,357 $ 80,545 $ 411,197 $ 9,615
Deposits $ 439,357 $ 411 (5) $ 393,818 $ 45,128 $ 395,647 $ 331 (5) $ 352,522 $ 42,794 Interest rateObligations related to securities sold short 12,582 12,570 12 – 10,338 10,256 82 – Interest rateCash collateral on securities lent 2,061 – 2,061 – 2,518 – 2,518 – Interest rateObligations related to securities sold under
repurchase agreements 22,553 – 22,553 – 11,694 – 11,694 – Interest rateDerivative instruments 28,151 24,401 (4) 3,750 – 28,807 24,433 (4) 4,374 – Interest rate,
foreign exchangeAcceptances 9,384 – 9,384 – 12,395 – 12,395 – Interest rateOther liabilities 13,607 1,239 5,661 6,707 12,919 927 5,445 6,547 Interest rateSubordinated indebtedness 3,195 – 3,195 – 3,366 – 3,366 – Interest rate
$ 530,890 $ 38,621 $ 440,434 $ 51,835 $ 477,684 $ 35,947 $ 392,396 $ 49,341
(1) In the third quarter of 2017, we completed the acquisition of The PrivateBank. See “Significant events” for additional details.(2) Excludes securities in the structured credit run-off business of $3 million (October 31, 2016: $496 million), and certain other securities that are considered non-trading for market risk purposes.(3) Excludes $199 million (October 31, 2016: $103 million) of loans that are warehoused for future securitization purposes. These are considered non-trading for market risk purposes.(4) Excludes derivatives relating to the structured credit and other run-off businesses which are considered non-trading for market risk purposes.(5) Comprises FVO deposits which are considered trading for market risk purposes.
Trading activitiesWe hold positions in traded financial contracts to meet client investment and risk management needs. Trading revenue (net interest income or non-interestincome) is generated from these transactions. Trading instruments are recorded at fair value and include debt and equity securities, as well as interest rate,foreign exchange, equity, commodity, and credit derivative products.
Value-at-riskOur value-at-risk (VaR) methodology is a statistical technique that measures the potential overnight loss at a 99% confidence level. We use a full revaluationhistorical simulation methodology to compute VaR, stressed VaR and other risk measures.
The following three tables show VaR, stressed VaR and incremental risk charge (IRC) for our trading activities based on risk type under an internal modelsapproach.
Average total VaR for the three months ended July 31, 2017 was up $1.8 million from the prior quarter, primarily due to an increase in equity, interest rateand debt specific risks, partially offset by a decrease in credit spread, commodity and foreign exchange risks.
Average stressed total VaR for the three months ended July 31, 2017 was up $2.1 million from the prior quarter. During the current stressed VaR periodfrom September 10, 2008 to September 8, 2009, the market exhibited not only increased volatility in interest rates but also increased volatility in equity prices,combined with a reduction in the level of interest rates, and an increase in credit spreads.
Average IRC for the three months ended July 31, 2017 was down $4.2 million from the prior quarter, mainly due to a reduction in fixed income tradinginventory.
34 CIBC THIRD QUARTER 2017

VaR by risk type – trading portfolioAs at or for the three
months endedAs at or for the nine
months ended
$ millions2017
Jul. 312017
Apr. 302016
Jul. 312017
Jul. 312016
Jul. 31
High Low As at Average As at Average As at Average Average Average
Interest rate risk $ 6.9 $ 3.5 $ 4.2 $ 4.5 $ 4.0 $ 3.9 $ 2.2 $ 2.4 $ 3.8 $ 2.1Credit spread risk 2.3 1.2 1.2 1.7 1.8 2.6 2.6 2.8 2.4 3.6Equity risk 18.5 1.9 2.6 4.8 2.4 2.3 2.3 2.8 3.5 2.7Foreign exchange risk 8.1 1.6 2.4 3.8 7.3 3.9 1.3 2.5 3.5 1.7Commodity risk 3.7 1.4 2.0 2.1 2.9 2.5 1.8 1.7 2.5 1.7Debt specific risk 2.0 0.9 1.2 1.4 1.7 1.3 1.1 1.0 1.3 1.4Diversification effect (1) n/m n/m (7.9) (10.2) (12.8) (10.2) (7.1) (7.5) (10.2) (7.2)
Total VaR (one-day measure) $ 22.2 $ 4.6 $ 5.7 $ 8.1 $ 7.3 $ 6.3 $ 4.2 $ 5.7 $ 6.8 $ 6.0(1) Total VaR is less than the sum of the VaR of the different market risk types due to risk offsets resulting from a portfolio diversification effect.n/m Not meaningful. It is not meaningful to compute a diversification effect because the high and low may occur on different days for different risk types.
Stressed VaR by risk type – trading portfolioAs at or for the three
months endedAs at or for the nine
months ended
$ millions2017
Jul. 312017
Apr. 302016
Jul. 312017
Jul. 312016
Jul. 31
High Low As at Average As at Average As at Average Average Average
Interest rate risk $ 27.4 $ 10.1 $ 15.3 $ 16.0 $ 12.2 $ 11.4 $ 8.2 $ 10.3 $ 12.9 $ 9.2Credit spread risk 8.9 4.7 4.7 6.5 5.5 8.2 11.2 10.4 8.5 11.0Equity risk 11.3 0.8 2.4 3.1 1.1 1.3 2.2 2.1 2.3 2.1Foreign exchange risk 28.2 3.6 10.1 11.8 9.6 5.5 0.6 1.6 6.7 3.2Commodity risk 8.8 1.4 1.6 3.9 3.1 4.9 3.9 2.9 4.2 3.1Debt specific risk 5.0 2.7 3.2 3.7 4.2 3.2 2.5 3.0 3.3 2.9Diversification effect (1) n/m n/m (29.4) (30.9) (24.9) (22.5) (22.3) (19.8) (25.0) (21.4)
Stressed total VaR (one-day measure) $ 35.0 $ 6.7 $ 7.9 $ 14.1 $ 10.8 $ 12.0 $ 6.3 $ 10.5 $ 12.9 $ 10.1(1) Stressed total VaR is less than the sum of the VaR of the different market risk types due to risk offsets resulting from a portfolio diversification effect.n/m Not meaningful. It is not meaningful to compute a diversification effect because the high and low may occur on different days for different risk types.
IRC – trading portfolioAs at or for the three
months endedAs at or for the nine
months ended
$ millions2017
Jul. 312017
Apr. 302016
Jul. 312017
Jul. 312016
Jul. 31
High Low As at Average As at Average As at Average Average Average
Default risk $ 159.6 $ 76.0 $ 92.7 $ 112.2 $ 136.8 $ 115.9 $ 69.8 $ 67.7 $ 120.3 $ 66.9Migration risk 145.1 43.5 43.5 71.4 116.6 71.9 26.8 28.8 66.0 30.2
IRC (one-year measure) (1) $ 282.9 $ 122.4 $ 136.2 $ 183.6 $ 253.4 $ 187.8 $ 96.6 $ 96.5 $ 186.3 $ 97.1(1) High and low IRC are not equal to the sum of the constituent parts, because the highs and lows of the constituent parts may occur on different days.
CIBC THIRD QUARTER 2017 35

Trading revenueTrading revenue (TEB) comprises both trading net interest income and non-interest income and excludes underwriting fees and commissions. Trading revenue(TEB) in the chart below excludes certain exited portfolios.
The trading revenue (TEB) versus VaR graph below shows the current quarter and the three previous quarters’ daily trading revenue (TEB) against the closeof business day VaR measures. Trading revenue distribution on which VaR is calculated is not on a TEB basis.
During the quarter, trading revenue (TEB) was positive for 100% of the days. The largest gain of $11.3 million occurred on June 29, 2017. It wasattributable to the normal course of business within our global markets line of business, notably in equity derivatives. Average daily trading revenue (TEB) was$4.1 million during the quarter, and the average daily TEB was $0.3 million. The large increase in VaR in May 2017 was the result of a large transaction in ourequity underwriting business.
Trading revenue (TEB) versus VaR
$ m
illio
ns
(25)
(20)
(15)
(10)
0
(5)
5
10
15
20
25
May-17 Jun-17 Jul-17
Trading Revenue (TEB) VaR
Aug-16 Dec-16 Jan-17 Feb-17 Mar-17 Apr-17Nov-16Oct-16Sep-16
Non-trading activitiesInterest rate riskNon-trading interest rate risk, which includes structural interest rate risk, consists primarily of risk inherent in ALM activities and the activities of domestic andforeign subsidiaries. Interest rate risk results from differences in the maturities or repricing dates of assets and liabilities, both on- and off-balance sheet, as wellas from embedded optionality in retail products. This optionality arises predominantly from the prepayment exposures of mortgage products, mortgagecommitments and some guaranteed investment certificates products with early redemption features. A variety of cash instruments and derivatives, primarilyinterest rate swaps, futures and options, are used to manage these risks.
The following table shows the potential impact over the next 12 months, adjusted for structural assumptions (excluding shareholders’ equity in thecalculation of the present value of shareholders’ equity), estimated prepayments and early withdrawals, of an immediate and sustained 100 and 200 basis pointincrease or decrease in all interest rates.
The third quarter of 2017 included the exposures from the acquisition of The PrivateBank.
Interest rate sensitivity – non-trading
$ millions, as at2017
Jul. 312017
Apr. 302016
Jul. 31
CAD USD Other CAD USD Other CAD USD Other
100 basis point increase in interest ratesIncrease (decrease) in net income after-tax
attributable to equity shareholders $ 108 $ 63 $ (14) $ 123 $ 5 $ (10) $ 95 $ 7 $ 10Increase (decrease) in present value of
shareholders’ equity (319) (56) (35) (292) (85) (36) (117) (113) (7)100 basis point decrease in interest ratesIncrease (decrease) in net income after-tax
attributable to equity shareholders (219) (64) 14 (189) 5 9 (149) (8) (12)Increase (decrease) in present value of
shareholders’ equity 198 (22) 35 192 78 35 34 96 4
200 basis point increase in interest ratesIncrease (decrease) in net income after-tax
attributable to equity shareholders $ 195 $ 104 $ (27) $ 210 $ 10 $ (17) $ 171 $ 14 $ 25Increase (decrease) in present value of
shareholders’ equity (616) (132) (68) (580) (153) (69) (266) (210) (6)200 basis point decrease in interest ratesIncrease (decrease) in net income after-tax
attributable to equity shareholders (437) (80) 28 (373) 27 16 (273) (5) (22)Increase (decrease) in present value of
shareholders’ equity 210 (182) 68 (30) 100 64 (31) 108 8
36 CIBC THIRD QUARTER 2017

Liquidity riskLiquidity risk is the risk of having insufficient cash or its equivalent in a timely and cost-effective manner to meet financial obligations as they come due.Common sources of liquidity risk inherent in banking services include unanticipated withdrawals of deposits, the inability to replace maturing debt, credit andliquidity commitments, and additional pledging or other collateral requirements.
CIBC possesses a comprehensive liquidity management framework that supports our business strategy, aligns with our risk appetite and limits establishedwithin the liquidity risk management policy, and adheres to regulatory expectations. The liquidity risk management policy requires we maintain sufficient liquidassets and diversified funding sources to consistently fund our balance sheet, commitments and contingent obligations, in order to maintain the strength of ourenterprise under both normal and stressed conditions.
Our management strategies, objectives and practices are regularly reviewed to align with changes to the liquidity environment, including regulatory,business and/or market developments. Liquidity risk remains within CIBC’s risk appetite.
Governance and managementWe manage liquidity risk in a manner that enables us to withstand a liquidity stress event without an adverse impact on the viability of our operations. Actualand anticipated cash flows generated from on- and off-balance sheet exposures are routinely measured and monitored to ensure compliance with establishedlimits. CIBC incorporates stress testing into its management and measurement of liquidity risk. Stress test results assist with the development of our liquidityassumptions, identification of potential constraints to funding planning, and contribute to the design of CIBC’s contingency funding plan (CFP).
The Global Asset Liability Committee (GALCO) governs CIBC’s liquidity risk management, ensuring the liquidity risk management methodologies,assumptions, and key metrics such as the Liquidity Horizon, are regularly reviewed and aligned with our operating regulatory requirements. The Liquidity RiskManagement Committee is responsible for supporting GALCO to ensure that CIBC’s liquidity risk profile is comprehensively measured and managed inalignment with CIBC’s strategic direction, risk appetite and regulatory requirements.
The Risk Management Committee (RMC) approves CIBC’s liquidity risk management policy, CFP, and recommends liquidity risk tolerance to the Boardthrough the risk appetite statement.
Liquid and encumbered assetsAvailable liquid assets include cash, high quality marketable securities and other assets that can be used to access funding in a timely fashion. Encumberedassets, composed of assets pledged as collateral and those assets that are deemed restricted due to legal, operational, or other purposes, are not considered assources of available liquidity when measuring liquidity risk.
Unencumbered assets from on- and off-balance sheet sources are summarized as follows:
$ millions, as at2017
Jul. 31 (1)2016
Oct. 31
Gross liquid assets Encumbered liquid assets (2) Unencumbered liquid assets
CIBC owned assets Third-party assets CIBC owned assets Third-party assets
Cash and due from banks $ 19,917 (3) $ – $ 479 $ – $ 19,438 $ 13,665Securities 87,838 (4) 93,264 (5) 29,750 57,825 93,527 91,378National Housing Act mortgage-backed securities 49,618 (6) – 20,530 – 29,088 26,223Mortgages 16,331 (7) – 16,331 – – –Credit cards 2,961 (8) – 2,961 – – –Other assets 4,759 (9) – 4,616 – 143 586
$ 181,424 $ 93,264 $ 74,667 $ 57,825 $ 142,196 $ 131,852
(1) In the third quarter of 2017, we completed the acquisition of The PrivateBank. See “Significant events” for additional details.(2) Excludes intraday pledges to the Bank of Canada related to the Large Value Transfer System as these are normally released at the end of the settlement cycle each day.(3) Includes cash, non-interest-bearing deposits and interest-bearing deposits with contractual maturities of less than 30 days.(4) Includes trading, AFS and FVO securities. Excludes securities in our structured credit run-off business, private debt and private equity securities of $542 million (October 31, 2016: $944 million).(5) Includes $5,866 million (October 31, 2016: $5,433 million) of cash collateral received on securities borrowed, $39,206 million (October 31, 2016: $28,377 million) of securities purchased under resale
agreements, $43,494 million (October 31, 2016: $38,657 million) of securities borrowed against securities lent, and $4,698 million (October 31, 2016: $1,257 million) of securities received for derivativecollateral.
(6) Includes securitized and transferred residential mortgages under the Canada Mortgage Bond Programme, and securitized mortgages that were not transferred to external parties. These are reported as Loanson our interim consolidated balance sheet.
(7) Includes mortgages in the Covered Bond Programme.(8) Includes assets held in consolidated trusts supporting funding liabilities.(9) Includes $4,616 million (October 31, 2016: $6,022 million) of cash pledged as collateral for derivatives and $143 million (October 31, 2016: $586 million) of gold and silver certificates.
The following table summarizes unencumbered liquid assets held by CIBC (parent) and significant subsidiaries:
$ millions, as at2017
Jul. 312016
Oct. 31
CIBC (parent) $ 103,945 $ 96,027CIBC World Markets Inc. (1) 15,417 18,387Other subsidiaries (2) 22,834 17,438
$ 142,196 $ 131,852(1) Includes CIBC World Markets Inc. and CIBC World Markets Corp.(2) In the third quarter of 2017, we completed the acquisition of The PrivateBank. See “Significant events” for additional details.
Asset haircuts and monetization depth assumptions under a liquidity stress scenario are applied to determine asset liquidity value. Haircuts take intoconsideration those margins applicable at central banks – such as the Bank of Canada and the Federal Reserve Bank – historical observations, and securitiescharacteristics including asset type, issuer, credit ratings, currency and remaining term to maturity, as well as available regulatory guidance.
Our unencumbered liquid assets increased by $10.3 billion or 8% from October 31, 2016, primarily due to higher cash and deposits with banks, as wellas the acquisition of The PrivateBank.
Furthermore, CIBC maintains access eligibility to the Bank of Canada’s Emergency Lending Assistance (ELA) program and the Federal Reserve Bank’sDiscount Window.
CIBC THIRD QUARTER 2017 37

Asset encumbranceIn the course of CIBC’s day-to-day operations, securities and other assets are pledged to secure obligations, participate in clearing and settlement systems andother collateral management purposes. For additional details, see Note 22 to the 2016 annual consolidated financial statements.
The following table provides a summary of our total encumbered and unencumbered assets:
Encumbered Unencumbered
$ millions, as atCIBC owned
assetsThird-party
assetsTotal
assetsPledged as
collateral OtherAvailable as
collateral Other
2017 Cash and deposits with banks $ 19,917 $ – $ 19,917 $ 6 $ 473 $ 19,438 $ –Jul. 31 (1) Securities 88,380 – 88,380 29,750 – 58,088 542
Securities borrowed or purchased under resaleagreements – 45,072 45,072 23,910 – 21,162 –
Loans, net of allowance 349,610 – 349,610 40,785 5 29,088 279,732Other
Derivative instruments 26,370 – 26,370 – – – 26,370Customers’ liability under acceptances 9,383 – 9,383 – – – 9,383Land, buildings and equipment 1,762 – 1,762 – – – 1,762Goodwill 5,101 – 5,101 – – – 5,101Software and other intangible assets 1,822 – 1,822 – – – 1,822Investments in equity-accounted associates
and joint ventures 740 – 740 – – – 740Other assets 12,755 – 12,755 4,616 – 143 7,996
$ 515,840 $ 45,072 $ 560,912 $ 99,067 $ 478 $ 127,919 $ 333,448
2016 Cash and deposits with banks $ 14,165 $ – $ 14,165 $ 11 $ 489 $ 13,665 $ –Oct. 31 Securities 87,423 – 87,423 23,690 – 62,789 944
Securities borrowed or purchased under resaleagreements – 33,810 33,810 22,514 – 11,296 –
Loans, net of allowance 307,417 – 307,417 39,468 26 26,223 241,700Other
Derivative instruments 27,762 – 27,762 – – – 27,762Customers’ liability under acceptances 12,364 – 12,364 – – – 12,364Land, buildings and equipment 1,898 – 1,898 – – – 1,898Goodwill 1,539 – 1,539 – – – 1,539Software and other intangible assets 1,410 – 1,410 – – – 1,410Investments in equity-accounted associates
and joint ventures 766 – 766 – – – 766Other assets 12,803 – 12,803 6,022 – 586 6,195
$ 467,547 $ 33,810 $ 501,357 $ 91,705 $ 515 $ 114,559 $ 294,578
(1) In the third quarter of 2017, we completed the acquisition of The PrivateBank. See “Significant events” for additional details.
Restrictions on the flow of fundsOur subsidiaries are not subject to significant restrictions that would prevent transfers of funds, dividends or capital distributions. However, certain subsidiarieshave separate regulatory capital and liquidity requirements, as established by applicable banking and securities regulators.
We monitor and manage our capital and liquidity requirements across these entities to ensure that resources are used efficiently and entities are incompliance with local regulatory and policy requirements.
Liquidity coverage ratioThe objective of the liquidity coverage ratio (LCR) is to promote short-term resilience of a bank’s liquidity risk profile, ensuring that it has adequateunencumbered high quality liquid resources to meet its liquidity needs in a 30-day acute stress scenario. Canadian banks are required to achieve a minimumLCR value of 100%. CIBC is in compliance with this requirement.
In accordance with the calibration methodology contained in OSFI’s liquidity adequacy requirements (LAR) guidelines, CIBC reports the LCR to OSFI on amonthly basis. The ratio is calculated as follows:
Total High Quality Liquid Assets (HQLA) ≥ 100%Total net cash outflows over the next 30 calendar days
The LCR’s numerator consists of unencumbered HQLA, which follow an OSFI-defined set of eligibility criteria that considers fundamental and market-relatedcharacteristics, and relative ability to operationally monetize assets on a timely basis during a period of stress. CIBC’s centrally-managed liquid asset portfolioincludes those liquid assets reported in the HQLA, such as central government treasury bills and bonds, central bank deposits and high-rated sovereign, agency,provincial, and corporate securities. Asset eligibility limitations inherent in the LCR metric do not necessarily reflect CIBC’s internal assessment of its ability tomonetize its marketable assets under stress.
The ratio’s denominator reflects net cash outflows expected in the LCR’s stress scenario over the 30-calendar-day period. Expected cash outflows representLCR-defined withdrawal or draw-down rates applied against outstanding liabilities and off-balance sheet commitments, respectively. Significant contributors toCIBC’s LCR outflows include business and financial institution deposit run-off, draws on undrawn lines of credit and unsecured debt maturities. Cash outflowsare partially offset by cash inflows, which are calculated at LCR-prescribed inflow rates, and include performing loan repayments and non-HQLA marketableassets.
38 CIBC THIRD QUARTER 2017
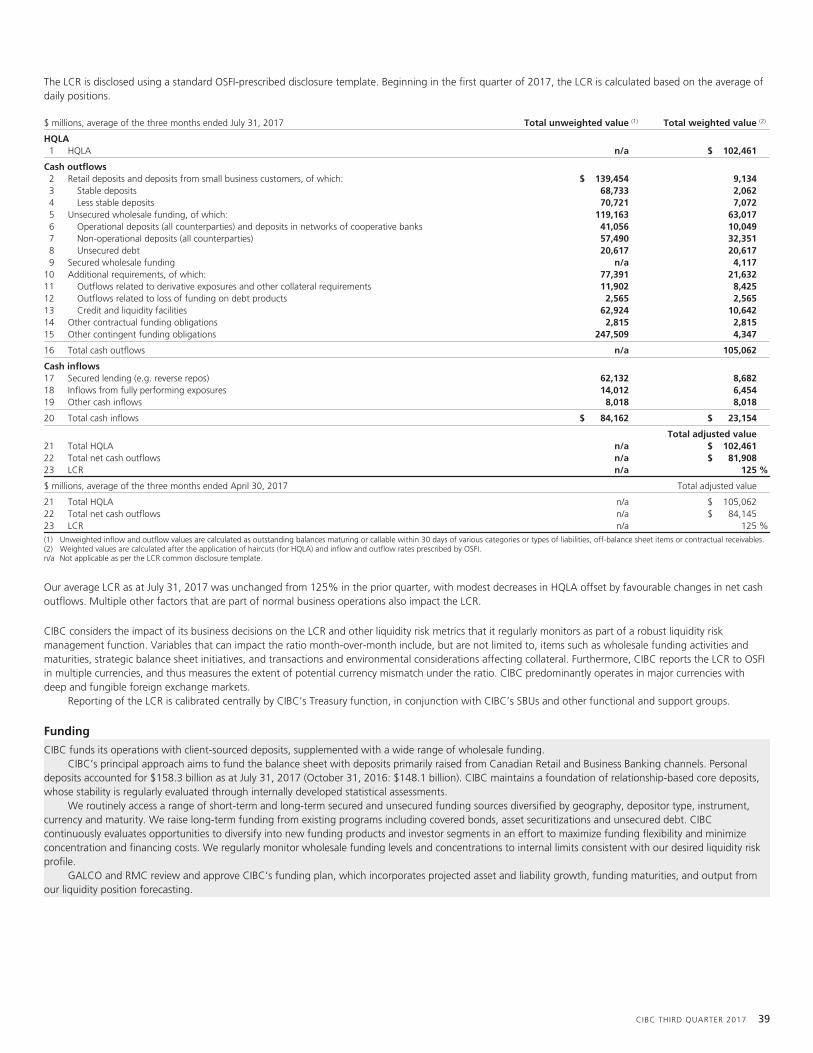
The LCR is disclosed using a standard OSFI-prescribed disclosure template. Beginning in the first quarter of 2017, the LCR is calculated based on the average ofdaily positions.
$ millions, average of the three months ended July 31, 2017 Total unweighted value (1) Total weighted value (2)
HQLA1 HQLA n/a $ 102,461
Cash outflows2 Retail deposits and deposits from small business customers, of which: $ 139,454 9,1343 Stable deposits 68,733 2,0624 Less stable deposits 70,721 7,0725 Unsecured wholesale funding, of which: 119,163 63,0176 Operational deposits (all counterparties) and deposits in networks of cooperative banks 41,056 10,0497 Non-operational deposits (all counterparties) 57,490 32,3518 Unsecured debt 20,617 20,6179 Secured wholesale funding n/a 4,117
10 Additional requirements, of which: 77,391 21,63211 Outflows related to derivative exposures and other collateral requirements 11,902 8,42512 Outflows related to loss of funding on debt products 2,565 2,56513 Credit and liquidity facilities 62,924 10,64214 Other contractual funding obligations 2,815 2,81515 Other contingent funding obligations 247,509 4,347
16 Total cash outflows n/a 105,062
Cash inflows17 Secured lending (e.g. reverse repos) 62,132 8,68218 Inflows from fully performing exposures 14,012 6,45419 Other cash inflows 8,018 8,018
20 Total cash inflows $ 84,162 $ 23,154
Total adjusted value21 Total HQLA n/a $ 102,46122 Total net cash outflows n/a $ 81,90823 LCR n/a 125 %
$ millions, average of the three months ended April 30, 2017 Total adjusted value
21 Total HQLA n/a $ 105,06222 Total net cash outflows n/a $ 84,14523 LCR n/a 125 %(1) Unweighted inflow and outflow values are calculated as outstanding balances maturing or callable within 30 days of various categories or types of liabilities, off-balance sheet items or contractual receivables.(2) Weighted values are calculated after the application of haircuts (for HQLA) and inflow and outflow rates prescribed by OSFI.n/a Not applicable as per the LCR common disclosure template.
Our average LCR as at July 31, 2017 was unchanged from 125% in the prior quarter, with modest decreases in HQLA offset by favourable changes in net cashoutflows. Multiple other factors that are part of normal business operations also impact the LCR.
CIBC considers the impact of its business decisions on the LCR and other liquidity risk metrics that it regularly monitors as part of a robust liquidity riskmanagement function. Variables that can impact the ratio month-over-month include, but are not limited to, items such as wholesale funding activities andmaturities, strategic balance sheet initiatives, and transactions and environmental considerations affecting collateral. Furthermore, CIBC reports the LCR to OSFIin multiple currencies, and thus measures the extent of potential currency mismatch under the ratio. CIBC predominantly operates in major currencies withdeep and fungible foreign exchange markets.
Reporting of the LCR is calibrated centrally by CIBC’s Treasury function, in conjunction with CIBC’s SBUs and other functional and support groups.
Funding
CIBC funds its operations with client-sourced deposits, supplemented with a wide range of wholesale funding.CIBC’s principal approach aims to fund the balance sheet with deposits primarily raised from Canadian Retail and Business Banking channels. Personal
deposits accounted for $158.3 billion as at July 31, 2017 (October 31, 2016: $148.1 billion). CIBC maintains a foundation of relationship-based core deposits,whose stability is regularly evaluated through internally developed statistical assessments.
We routinely access a range of short-term and long-term secured and unsecured funding sources diversified by geography, depositor type, instrument,currency and maturity. We raise long-term funding from existing programs including covered bonds, asset securitizations and unsecured debt. CIBCcontinuously evaluates opportunities to diversify into new funding products and investor segments in an effort to maximize funding flexibility and minimizeconcentration and financing costs. We regularly monitor wholesale funding levels and concentrations to internal limits consistent with our desired liquidity riskprofile.
GALCO and RMC review and approve CIBC’s funding plan, which incorporates projected asset and liability growth, funding maturities, and output fromour liquidity position forecasting.
CIBC THIRD QUARTER 2017 39

The following table provides the contractual maturities at carrying values of CIBC’s wholesale funding sources:
$ millions, as at July 31, 2017Less than1 month
1 – 3months
3 – 6months
6 – 12months
Less than1 year total
1 – 2years
Over2 years Total
Deposits from banks $ 4,645 $ 400 $ 15 $ 13 $ 5,073 $ – $ – $ 5,073Certificates of deposit and commercial paper 8,988 7,383 13,149 16,718 46,238 6,112 – 52,350Bearer deposit notes and bankers’ acceptances 1,594 1,505 2,087 121 5,307 – – 5,307Asset-backed commercial paper – – – – – – – –Senior unsecured medium-term notes 37 5,026 2,175 8,346 15,584 5,233 14,451 35,268Senior unsecured structured notes 355 – – 7 362 – – 362Covered bonds/asset-backed securities
Mortgage securitization – 797 571 1,870 3,238 5,332 12,116 20,686Covered bonds – – 822 – 822 4,563 10,946 16,331Cards securitization – – – 935 935 1,247 779 2,961
Subordinated liabilities – – – – – 36 3,159 3,195Other 3 499 – – 502 6 56 564
$ 15,622 $ 15,610 $ 18,819 $ 28,010 $ 78,061 $ 22,529 $ 41,507 $ 142,097
Of which:Secured $ – $ 797 $ 1,393 $ 2,805 $ 4,995 $ 11,142 $ 23,841 $ 39,978Unsecured 15,622 14,813 17,426 25,205 73,066 11,387 17,666 102,119
$ 15,622 $ 15,610 $ 18,819 $ 28,010 $ 78,061 $ 22,529 $ 41,507 $ 142,097
October 31, 2016 $ 12,701 $ 17,980 $ 26,950 $ 21,035 $ 78,666 $ 17,596 $ 39,727 $ 135,989
CIBC’s wholesale funding is diversified by currency as demonstrated in the table that follows:
$ billions, as at2017
Jul. 312016
Oct. 31
CAD $ 54.1 38 % $ 60.4 44 %USD 69.8 49 56.6 42Other 18.2 13 19.0 14
$ 142.1 100 % $ 136.0 100 %
Credit ratingsCIBC’s access to and cost of wholesale funding are dependent on multiple factors, among them credit ratings provided by rating agencies. Rating agencies’opinions are based upon internal methodologies, and are subject to change based on factors including, but not limited to, financial strength, competitiveposition and liquidity positioning. On May 10, 2017, Moody’s downgraded the ratings of the big six Canadian banks by one notch, including CIBC. We do notexpect a material impact on our funding costs or ability to access funding as a result of this ratings change.
Our credit ratings are summarized in the following table:
Short-term debt Senior debtSubordinatedindebtedness
Subordinatedindebtedness – NVCC (1)
PreferredShares – NVCC (1)
As at2017
Jul. 312016
Oct. 312017
Jul. 312016
Oct. 312017
Jul. 312016
Oct. 312017
Jul. 312016
Oct. 312017
Jul. 312016
Oct. 31 Outlook
DBRS R-1(H) R-1(H) AA AA AA(L) AA(L) A(L) A(L) Pfd-2 Pfd-2 Negative (2)
Fitch Ratings, Inc. F1+ F1+ AA- AA- A+ A+ A+ A+ n/a n/a StableMoody’s P-1 P-1 A1 Aa3 Baa1 A3 Baa2 Baa1 Baa3 Baa2 Negative (3)
S&P A-1 A-1 A+ A+ BBB+ BBB+ BBB BBB P-3(H) P-3(H) Stable(1) Comprises instruments which are treated as NVCC in accordance with OSFI’s capital adequacy guidelines.(2) Negative outlook applies to short-term debt, senior debt, and subordinated indebtedness ratings.(3) Negative outlook only applies to senior debt rating.n/a Not available.
Additional collateral requirements for rating downgradesWe are required to deliver collateral to certain derivative counterparties in the event of a downgrade to our current credit risk rating. The collateral requirementis based on MTM exposure, collateral valuations, and collateral arrangement thresholds, as applicable. The following table presents the additional cumulativecollateral requirements for rating downgrades:
$ billions, as at2017
Jul. 312016
Oct. 31
One-notch downgrade $ – $ –Two-notch downgrade 0.1 0.2Three-notch downgrade 0.3 0.4
40 CIBC THIRD QUARTER 2017
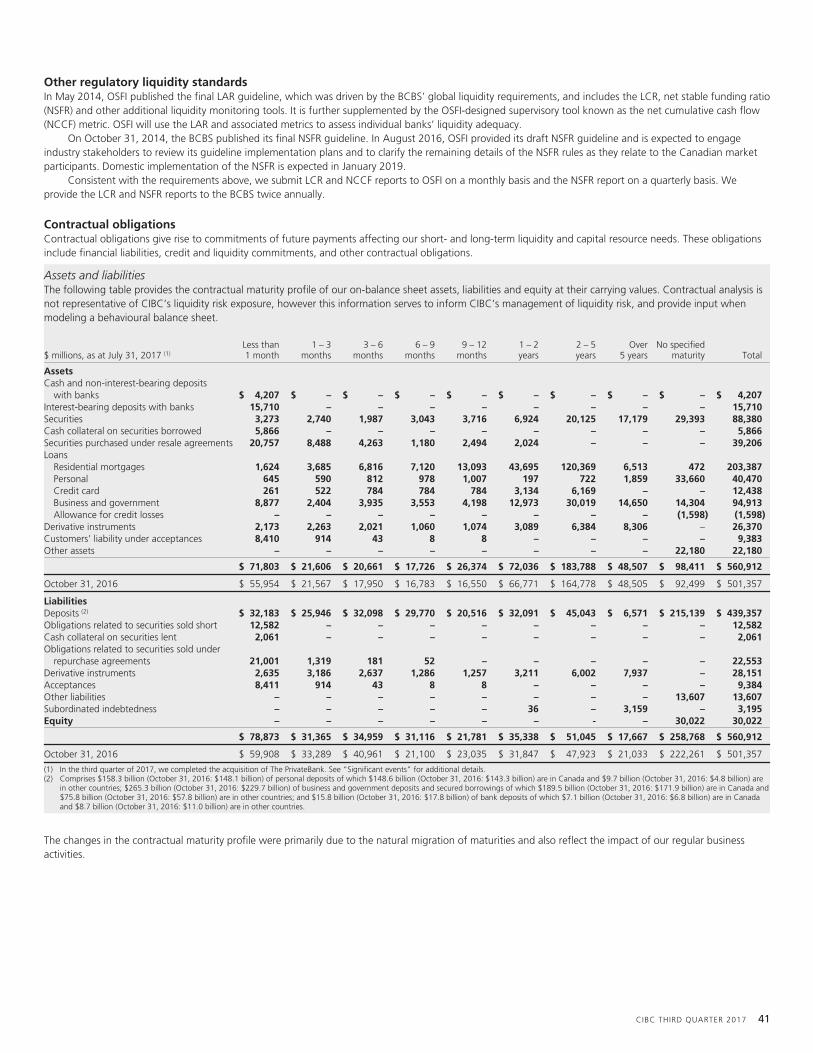
Other regulatory liquidity standardsIn May 2014, OSFI published the final LAR guideline, which was driven by the BCBS’ global liquidity requirements, and includes the LCR, net stable funding ratio(NSFR) and other additional liquidity monitoring tools. It is further supplemented by the OSFI-designed supervisory tool known as the net cumulative cash flow(NCCF) metric. OSFI will use the LAR and associated metrics to assess individual banks’ liquidity adequacy.
On October 31, 2014, the BCBS published its final NSFR guideline. In August 2016, OSFI provided its draft NSFR guideline and is expected to engageindustry stakeholders to review its guideline implementation plans and to clarify the remaining details of the NSFR rules as they relate to the Canadian marketparticipants. Domestic implementation of the NSFR is expected in January 2019.
Consistent with the requirements above, we submit LCR and NCCF reports to OSFI on a monthly basis and the NSFR report on a quarterly basis. Weprovide the LCR and NSFR reports to the BCBS twice annually.
Contractual obligationsContractual obligations give rise to commitments of future payments affecting our short- and long-term liquidity and capital resource needs. These obligationsinclude financial liabilities, credit and liquidity commitments, and other contractual obligations.
Assets and liabilitiesThe following table provides the contractual maturity profile of our on-balance sheet assets, liabilities and equity at their carrying values. Contractual analysis isnot representative of CIBC’s liquidity risk exposure, however this information serves to inform CIBC’s management of liquidity risk, and provide input whenmodeling a behavioural balance sheet.
$ millions, as at July 31, 2017 (1)Less than1 month
1 – 3months
3 – 6months
6 – 9months
9 – 12months
1 – 2years
2 – 5years
Over5 years
No specifiedmaturity Total
AssetsCash and non-interest-bearing deposits
with banks $ 4,207 $ – $ – $ – $ – $ – $ – $ – $ – $ 4,207Interest-bearing deposits with banks 15,710 – – – – – – – – 15,710Securities 3,273 2,740 1,987 3,043 3,716 6,924 20,125 17,179 29,393 88,380Cash collateral on securities borrowed 5,866 – – – – – – – – 5,866Securities purchased under resale agreements 20,757 8,488 4,263 1,180 2,494 2,024 – – – 39,206Loans
Residential mortgages 1,624 3,685 6,816 7,120 13,093 43,695 120,369 6,513 472 203,387Personal 645 590 812 978 1,007 197 722 1,859 33,660 40,470Credit card 261 522 784 784 784 3,134 6,169 – – 12,438Business and government 8,877 2,404 3,935 3,553 4,198 12,973 30,019 14,650 14,304 94,913Allowance for credit losses – – – – – – – – (1,598) (1,598)
Derivative instruments 2,173 2,263 2,021 1,060 1,074 3,089 6,384 8,306 – 26,370Customers’ liability under acceptances 8,410 914 43 8 8 – – – – 9,383Other assets – – – – – – – – 22,180 22,180
$ 71,803 $ 21,606 $ 20,661 $ 17,726 $ 26,374 $ 72,036 $ 183,788 $ 48,507 $ 98,411 $ 560,912
October 31, 2016 $ 55,954 $ 21,567 $ 17,950 $ 16,783 $ 16,550 $ 66,771 $ 164,778 $ 48,505 $ 92,499 $ 501,357
LiabilitiesDeposits (2) $ 32,183 $ 25,946 $ 32,098 $ 29,770 $ 20,516 $ 32,091 $ 45,043 $ 6,571 $ 215,139 $ 439,357Obligations related to securities sold short 12,582 – – – – – – – – 12,582Cash collateral on securities lent 2,061 – – – – – – – – 2,061Obligations related to securities sold under
repurchase agreements 21,001 1,319 181 52 – – – – – 22,553Derivative instruments 2,635 3,186 2,637 1,286 1,257 3,211 6,002 7,937 – 28,151Acceptances 8,411 914 43 8 8 – – – – 9,384Other liabilities – – – – – – – – 13,607 13,607Subordinated indebtedness – – – – – 36 – 3,159 – 3,195Equity – – – – – – - – 30,022 30,022
$ 78,873 $ 31,365 $ 34,959 $ 31,116 $ 21,781 $ 35,338 $ 51,045 $ 17,667 $ 258,768 $ 560,912
October 31, 2016 $ 59,908 $ 33,289 $ 40,961 $ 21,100 $ 23,035 $ 31,847 $ 47,923 $ 21,033 $ 222,261 $ 501,357
(1) In the third quarter of 2017, we completed the acquisition of The PrivateBank. See “Significant events” for additional details.(2) Comprises $158.3 billion (October 31, 2016: $148.1 billion) of personal deposits of which $148.6 billion (October 31, 2016: $143.3 billion) are in Canada and $9.7 billion (October 31, 2016: $4.8 billion) are
in other countries; $265.3 billion (October 31, 2016: $229.7 billion) of business and government deposits and secured borrowings of which $189.5 billion (October 31, 2016: $171.9 billion) are in Canada and$75.8 billion (October 31, 2016: $57.8 billion) are in other countries; and $15.8 billion (October 31, 2016: $17.8 billion) of bank deposits of which $7.1 billion (October 31, 2016: $6.8 billion) are in Canadaand $8.7 billion (October 31, 2016: $11.0 billion) are in other countries.
The changes in the contractual maturity profile were primarily due to the natural migration of maturities and also reflect the impact of our regular businessactivities.
CIBC THIRD QUARTER 2017 41

Credit-related commitmentsThe following table provides the contractual maturity of notional amounts of credit-related commitments. Since a significant portion of commitments areexpected to expire without being drawn upon, the total of the contractual amounts is not representative of future liquidity requirements.
$ millions, as at July 31, 2017 (1)Less than1 month
1 – 3months
3 – 6months
6 – 9months
9 – 12months
1 – 2years
2 – 5years
Over5 years
No specifiedmaturity (2) Total
Securities lending (3) $ 34,171 $ 4,118 $ 5,205 $ – $ – $ – $ – $ – $ – $ 43,494Unutilized credit commitments 730 7,181 2,062 1,722 3,582 12,138 36,721 1,502 141,224 206,862Backstop liquidity facilities – 49 8,420 203 975 171 – 13 – 9,831Standby and performance letters of credit 1,884 1,192 3,207 2,141 1,923 833 1,114 18 – 12,312Documentary and commercial letters of credit 27 99 64 3 10 5 18 – – 226Other 287 – – – – – – – – 287
$ 37,099 $ 12,639 $ 18,958 $ 4,069 $ 6,490 $ 13,147 $ 37,853 $ 1,533 $ 141,224 $ 273,012
October 31, 2016 $ 28,902 $ 23,039 $ 9,515 $ 4,484 $ 3,483 $ 7,049 $ 35,402 $ 1,393 $ 133,514 $ 246,781
(1) In the third quarter of 2017, we completed the acquisition of The PrivateBank. See “Significant events” for additional details.(2) Includes $110.2 billion (October 31, 2016: $105.0 billion) of personal, home equity and credit card lines, which are unconditionally cancellable at our discretion.(3) Excludes securities lending of $2.1 billion (October 31, 2016: $2.5 billion) for cash because it is reported on the interim consolidated balance sheet.
Other contractual obligationsThe following table provides the contractual maturities of other contractual obligations affecting our funding needs:
$ millions, as at July 31, 2017 (1)Less than1 month
1 – 3months
3 – 6months
6 – 9months
9 – 12months
1 – 2years
2 – 5years
Over5 years Total
Operating leases $ 40 $ 79 $ 118 $ 118 $ 117 $ 435 $ 1,054 $ 3,243 $ 5,204Purchase obligations (2) 131 257 280 186 147 510 781 264 2,556Pension contributions (3) 15 31 – – – – – – 46Underwriting commitments 296 1,400 – – – – – – 1,696Investment commitments – – 5 3 1 2 7 132 150
$ 482 $ 1,767 $ 403 $ 307 $ 265 $ 947 $ 1,842 $ 3,639 $ 9,652
October 31, 2016 $ 331 $ 325 $ 365 $ 396 $ 356 $ 1,080 $ 1,747 $ 1,532 $ 6,132
(1) In the third quarter of 2017, we completed the acquisition of The PrivateBank. See “Significant events” for additional details.(2) Obligations that are legally binding agreements whereby we agree to purchase products or services with specific minimum or baseline quantities defined at fixed, minimum or variable prices over a specified
period of time are defined as purchase obligations. Purchase obligations are included through to the termination date specified in the respective agreements, even if the contract is renewable. Many of thepurchase agreements for goods and services include clauses that would allow us to cancel the agreement prior to expiration of the contract within a specific notice period. However, the amount above includesour obligations without regard to such termination clauses (unless actual notice of our intention to terminate the agreement has been communicated to the counterparty). The table excludes purchases of debtand equity instruments that settle within standard market time frames.
(3) Includes estimated minimum funding contributions for our funded defined benefit pension plans in Canada, the U.S., the U.K., and the Caribbean. Estimated minimum funding contributions are included onlyfor the next annual period as the minimum contributions are affected by various factors, such as market performance and regulatory requirements, and therefore are subject to significant variability.
Other risksWe also have policies and processes to measure, monitor and control other risks, including strategic, insurance, operational, technology, information and cybersecurity, reputation and legal, regulatory compliance, and environmental risks. These risks and related policies and processes have not changed significantlyfrom those described on pages 73 to 75 of the 2016 Annual Report.
42 CIBC THIRD QUARTER 2017

Accounting and control mattersCritical accounting policies and estimatesThe interim consolidated financial statements have been prepared in accordance with International Accounting Standard (IAS) 34 “Interim Financial Reporting”using IFRS as issued by the International Accounting Standards Board (IASB). A summary of significant accounting policies is presented in Note 1 to theconsolidated financial statements of our 2016 Annual Report. As a result of the acquisition of The PrivateBank, we adopted new accounting policies onpurchased loans and held-to-maturity securities. Refer to Note 1 to the interim consolidated financial statements for details. Except as indicated above, theseinterim consolidated financial statements have been prepared using the same accounting policies as CIBC’s consolidated financial statements as at and for theyear ended October 31, 2016.
Certain accounting policies require us to make judgments and estimates, some of which may relate to matters that are uncertain. Changes in thejudgments and estimates required in the critical accounting policies discussed on pages 76 to 80 of our 2016 Annual Report could have a material impact onour financial results. No significant changes have occurred with respect to our critical accounting estimates since our 2016 Annual Report.
Accounting developmentsTransition to IFRS 9IFRS 9 “Financial Instruments” (IFRS 9) replaces IAS 39 “Financial Instruments: Recognition and Measurement” and is effective for annual periods beginning onor after January 1, 2018, which for us would have been on November 1, 2018. Early application is permitted if an entity applies all the requirements of thestandard. During 2015, OSFI issued a final advisory that requires D-SIBs to adopt IFRS 9 for their annual period beginning on November 1, 2017, one year earlierthan required by the IASB. As a D-SIB, we will publish our first interim consolidated financial statements under IFRS 9 for the quarter ended January 31, 2018,except for the “own credit” provisions of IFRS 9, which we voluntarily early adopted as of November 1, 2014. IFRS 9 is required to be applied on a retrospectivebasis, with certain exceptions. As permitted, we will not restate our prior period comparative consolidated financial statements when we adopt therequirements of the new standard. We will recognize an adjustment to our opening November 1, 2017 retained earnings and AOCI, to reflect the applicationof the new requirements at the adoption date.
The transition to IFRS 9 represents a significant initiative for CIBC, for which we have established a transition program that is supported by a formalgovernance structure with an enterprise view and a dedicated project team. The project’s Steering Committee is co-chaired by senior stakeholders from ourRisk Management and Finance groups, and comprises individuals from the impacted SBUs as well as other functional groups, such as Technology andOperations and Internal Audit. The Steering Committee is responsible for:• Ensuring the strategic alignment of IFRS 9 with CIBC’s overall strategies;• Ensuring key milestones are met;• Providing direction and guidance on a holistic basis; and• Reviewing and resolving key issues and risks.
To assist the Steering Committee in meeting its responsibilities, our transition program structure has three work streams that correspond to the three sections ofthe new financial instruments standard: (1) Classification and measurement of financial instruments; (2) Impairment; and (3) Hedge accounting. Each workstream comprises stakeholders from the impacted SBUs and functional groups, who are subject matter experts in the relevant policies, processes or technologiesthat are expected to be impacted by the transition.
Classification and measurementThe IFRS 9 classification and measurement model requires that all debt instrument financial assets that do not meet a “solely payment of principal and interest”(SPPI) test, including those that contain embedded derivatives, be classified at initial recognition as fair value through profit or loss (FVTPL). The intent of theSPPI test is to ensure that debt instruments that contain non-basic lending features, such as conversion options and equity linked pay-outs, are measured atFVTPL. Subsequent measurement of instruments classified as FVTPL under IFRS 9 operates in a similar manner to trading under IAS 39.
For debt instrument financial assets that meet the SPPI test, classification at initial recognition will be determined based on the business model underwhich these instruments are managed. Debt instruments that are managed on a “held for trading” or “fair value” basis will be classified as FVTPL. Debtinstruments that are managed on a “hold to collect and for sale” basis will be classified as fair value through OCI (FV-OCI) for debt. Debt instruments that aremanaged on a “hold to collect” basis will be classified as amortized cost. Subsequent measurement of instruments classified at FV-OCI and amortized costclassifications under IFRS 9 operate in a similar manner to AFS for debt securities and loans and receivables, respectively, under existing IAS 39, except for theimpairment provisions which are discussed below.
For those debt instrument financial assets that would otherwise be classified as FV-OCI or amortized cost, an irrevocable designation can be made at initialrecognition to instead measure the debt instrument at FVTPL under the FVO if doing so eliminates or significantly reduces an accounting mismatch and ifcertain OSFI requirements are met.
All equity instrument financial assets are required to be classified at initial recognition as FVTPL unless an irrevocable designation is made to classify theinstrument as FV-OCI for equities. Unlike AFS for equity securities under IAS 39, the FV-OCI for equities category results in all realized and unrealized gains andlosses being recognized in OCI with no recycling to profit and loss. Only dividends will continue to be recognized in profit and loss.
The classification and measurement of financial liabilities remain essentially unchanged from the current IAS 39 requirements, except that changes in fairvalue of FVO liabilities attributable to changes in own credit risk are to be presented in OCI, rather than profit and loss, which we early adopted as ofNovember 1, 2014.
Derivatives will continue to be measured at FVTPL under IFRS 9.
ImpairmentThe new impairment guidance sets out an expected credit loss (ECL) model applicable to all debt instrument financial assets classified as amortized cost or FV-OCI. In addition, the ECL model applies to loan commitments and financial guarantees that are not measured at FVTPL.
Incurred Loss versus Expected Loss MethodologyThe application of ECL will significantly change our credit loss methodology and models. ECL allowances represent credit losses that reflect an unbiased andprobability-weighted amount which is determined by evaluating a range of possible outcomes, the time value of money and reasonable and supportableinformation about past events, current conditions and forecasts of future economic conditions. This compares to the present incurred loss model under IAS 39that incorporates a single best estimate, the time value of money and information about past events and current conditions. The objective of the new
CIBC THIRD QUARTER 2017 43

impairment standard is to record lifetime losses on all financial instruments which have experienced a significant increase in credit risk (SICR) since their initialrecognition. As a result, ECL allowances will be measured at amounts equal to either (i) 12-month ECL or (ii) lifetime ECL for those financial instruments whichhave experienced a SICR since initial recognition. This compares to the present incurred loss model which recognizes lifetime credit losses when there isobjective evidence of impairment. Because of the inclusion of relative credit deterioration criteria and consideration of forward looking information, the ECLmodel eliminates the threshold or trigger event required under the incurred loss model, and lifetime ECL are recognized earlier under IFRS 9.
Stage Migration and Significant Increase in Credit RiskFor non-impaired financial instruments:• Stage 1 is comprised of all non-impaired financial instruments which have not experienced a SICR since initial recognition. Entities are required to
recognize 12 months of ECL for stage 1 financial instruments. In assessing whether credit risk has increased significantly, entities are required to comparethe risk of a default occurring on the financial instrument as at the reporting date, with the risk of a default occurring on the financial instrument as at thedate of initial recognition.
• Stage 2 is comprised of all non-impaired financial instruments which have experienced a SICR since initial recognition. Entities are required to recognizelifetime ECL for stage 2 financial instruments. In subsequent reporting periods, if the credit risk of the financial instrument improves such that there is nolonger a SICR since initial recognition, then entities shall revert to recognizing 12 months of ECL. In contrast to stage 1 and stage 2, inherent within theincurred loss methodology under IAS 39, allowances are provided for non-impaired financial instruments for credit losses that are incurred but not yetidentified.
For impaired financial instruments:• Financial instruments are classified as stage 3 when there is objective evidence of impairment as a result of one or more loss events that have occurred
after initial recognition with a negative impact on the estimated future cash flows of a loan or a portfolio of loans. The ECL model requires that lifetimeECL be recognized for impaired financial instruments, which is similar to the current requirements under IAS 39 for impaired financial instruments.
For our business and government portfolios, the individually assessed allowances for impaired instruments recognized under IAS 39 will generally be replaced bystage 3 allowances under IFRS 9, while the collective allowances for non-impaired financial instruments will generally be replaced by either stage 1 or stage 2allowances under IFRS 9. For our retail portfolios, the portion of our collective allowances that relate to impaired financial instruments under IAS 39 willgenerally be replaced by stage 3 allowances, while the non-impaired portion of our collective allowances will generally be replaced by either stage 1 or stage 2allowances under IFRS 9.
Our definitions of default, our write-off policy and our interest income recognition policy under IAS 39 are not expected to be materially different underthe ECL model.
Key Drivers of Expected Credit LossThe following concepts are subject to a high level of judgment, will have a significant impact on the level of ECL allowances and will be the cause of increasedvolatility of allowances:• Determining when a SICR of a financial asset has occurred,• Measuring both 12-month and lifetime credit losses, and• Incorporating forward-looking information through the use of multiple probability-weighted scenarios.
For the majority of our retail portfolios, we will determine SICR based on relative changes in the financial instrument’s lifetime probability of default (PD) sinceits initial recognition. For the majority of our business and government portfolios and FV-OCI debt securities, we will determine SICR based on relative changesin internal risk ratings since initial recognition. In respect to the lifetime of a financial instrument, the maximum period to consider when measuring ECL shall bethe maximum contractual period over which an entity is exposed to credit risk. For revolving facilities, such as credit cards, an entity shall measure ECL over theperiod that the entity is exposed to credit risk and the ECL would not be mitigated by credit risk management actions, even if that period extends beyond themaximum contractual period.
The measurement of both 12-month and lifetime credit losses involves forecasting forward-looking macroeconomic factors for multiple scenarios anddetermining the probability weighting for the scenarios so that we can appropriately probability weight the expected losses we will recognize on ourconsolidated balance sheet. While this process will leverage existing forecasting processes and will be overseen by a governance committee consisting of keyinternal stakeholders from Economics, Risk Management, and Finance, it involves a significant amount of judgment. The incorporation of the forward-lookinginformation into PDs, LGDs, and EADs for multiple scenarios for the purpose of calculating the ECLs under the different scenarios also involves significantjudgment. In many cases, this process leverages our existing regulatory framework.
Use of the Regulatory FrameworkOur ECL model leverages the data, systems and processes that are used to calculate Basel expected losses regulatory adjustments for the portion of our portfoliosunder the AIRB approach. Appropriate adjustments will be made to the Basel parameters to meet IFRS 9 requirements, including the conversion of through-the-cycle and downturn parameters used in the Basel regulatory calculations to point-in-time parameters used under IFRS 9 that considers forward-lookinginformation. In addition, credit losses under IFRS 9 are for 12 months for stage 1 financial instruments and lifetime for stage 2 and stage 3 financial instruments,as compared with 12 months for AIRB portfolios under Basel. The main adjustments necessary to Basel risk parameters are explained in the table below:
Regulatory Capital IFRS 9
PD Through-the-cycle PD represents long-run average PD throughout afull economic cycle
Point-in-time 12-month or lifetime PD based on current conditions andrelevant forward-looking assumptions
LGD Downturn loss given default (LGD) based on losses that would beexpected in an economic downturn and subject to certain regulatoryfloors
Discounted using the cost of capital
Unbiased probability-weighted LGD based on estimated LGD includingimpact of relevant forward-looking assumptions such as changes incollateral value
Discounted using the original effective interest rate
EAD Based on the drawn balance plus expected utilization of any undrawnportion prior to default, and cannot be lower than the drawn balance
Amortization and repayment of principal and interest from thebalance sheet date to the default is captured
Other ECL is discounted from the default date to the reporting date
44 CIBC THIRD QUARTER 2017

Key ActivitiesWe are currently refining and testing the application of the ECL methodology for our impacted portfolios through the application of an internal parallel runyear. This includes testing the processes to forecast and probability weight the forward looking factors used to calculate our ECLs and assessing theappropriateness of our SICR triggers. The data, processes, systems, models and parameters that support our ECL allowances will undergo further refinement,validation and testing throughout the remainder of the parallel run year.
We will also continue to ensure that all relevant internal controls and policies are updated and we will continue with the education and training of keystakeholders. Our Audit Committee will also continue to receive regular updates.
Upon the adoption of IFRS 9, we plan to change from our current policy of attributing changes to our collective allowance for non-impaired financialinstruments from Corporate and Other to a new IFRS 9 policy to attribute any changes in ECL, including stage 1 and stage 2 ECL changes, to our SBUs.
We are currently evaluating the potential regulatory capital impact of IFRS 9. The impact from potential changes in our balance sheet allowances underIFRS 9 on CET1 capital could be partially mitigated by changes in negative regulatory capital adjustments related to any shortfall of allowances to regulatoryexpected losses in the CET1 calculation.
Regulatory DevelopmentsOur implementation of IFRS 9 takes into account all regulatory requirements, including guidance issued by OSFI and the BCBS covering sound credit riskpractices associated with the implementation and application of an expected credit loss accounting framework. We also continue to monitor regulatorydevelopments related to the new ECL impairment requirements.
In March 2017, the BCBS issued Standards, Regulatory treatment of accounting provisions – interim approach and transitional arrangements, whichaddresses the transitional arrangement requirements and interim approach for the regulatory treatment of accounting provisions. The BCBS has outlined anumber of high-level requirements that local regulatory authorities must comply with should the regulatory authority choose to adopt a transitionalarrangement. The BCBS has decided to retain the current treatment of provisions under both the standardized and IRB approaches for credit risk for an interimperiod. Regulatory authorities in individual jurisdictions will be able to extend their existing approaches to categorize provisions as general or specific toprovisions calculated under the applicable ECL accounting model. Beyond the interim period, the BCBS recommends that regulatory authorities in individualjurisdictions provide guidance, as appropriate, on how they intend to categorize ECL provisions as general or specific to ensure consistency within theirjurisdiction.
In August 2017, OSFI issued a consultative document on the treatment of IFRS 9 allowances in the regulatory capital framework.
Hedge accountingThe IFRS 9 hedge accounting guidance is intended to better align the accounting with risk management activities. However, IFRS 9 allows the existing hedgeaccounting requirements under IAS 39 to continue in place of the hedge accounting requirements under IFRS 9, pending the completion of the IASB’s projecton macro hedge accounting. As permitted, we have elected to not adopt the IFRS 9 hedge accounting requirements and instead will retain the IAS 39 hedgeaccounting requirements. However, we will adopt the new hedge accounting disclosure requirements under amendments to IFRS 7 for our annual periodbeginning November 1, 2017.
Other accounting policy changesFor details on other future accounting policy changes, refer to Note 1 to the interim consolidated financial statements and Note 32 to the consolidated financialstatements included in our 2016 Annual Report.
Regulatory developmentsDodd-Frank Wall Street Reform and Consumer Protection ActThe Dodd-Frank Wall Street Reform and Consumer Protection Act (Dodd-Frank Act) was enacted in the U.S. in July 2010. The Dodd-Frank Act contains manybroad reforms impacting the financial services industry. These reforms impact every financial institution in the U.S. and many financial institutions that operateoutside the U.S. Most aspects of the Dodd-Frank Act have become effective, while some portions are still subject to final rulemakings by U.S. governmentagencies, or the expiration of transition periods. CIBC is subject to a number of specific requirements, including, among other things: (i) mandatory clearing,trade reporting and registration of OTC derivative trading activities; (ii) heightened capital, liquidity and prudential standards, such as the enhanced prudentialstandards and early remediation requirements under Sections 165 and 166 of the Dodd-Frank Act; (iii) mandatory risk retention rules, applicable to sponsors ofasset-backed securities and securitizations; and (iv) restrictions on proprietary trading, private equity and hedge fund activities, commonly known as the VolckerRule.
CIBC continues to devote the resources necessary to ensure that we implement the requirements in compliance with all applicable regulations under theDodd-Frank Act. We continue to monitor developments in this area, including upcoming changes in laws or regulations that may be enacted by the newU.S. government administration.
Automatic Exchange of Information – Organisation for Economic Co-operation and Development (OECD)Under the initiative of the OECD, many countries, including Canada, have committed to automatic exchange of information relating to accounts held by taxresidents of signatory countries, using a Common Reporting Standard (CRS). CIBC will meet all obligations imposed in respect of CRS, in accordance with locallaw, in all applicable jurisdictions in which it operates.
Review of sales practicesDuring the year, the Financial Consumer Agency of Canada and OSFI announced that they are conducting an industry-wide review of the retail banking salespractices of Canadian financial institutions, which is ongoing. CIBC will continue to monitor developments in this area.
CIBC THIRD QUARTER 2017 45

Controls and proceduresDisclosure controls and proceduresCIBC’s management, with the participation of the President and Chief Executive Officer and the Chief Financial Officer, has evaluated the effectiveness ofCIBC’s disclosure controls and procedures as at July 31, 2017 (as defined in the rules of the SEC and the Canadian Securities Administrators). Based on thatevaluation, the President and Chief Executive Officer and the Chief Financial Officer have concluded that such disclosure controls and procedures were effective.On June 23, 2017, CIBC completed the acquisition of The PrivateBank which has not been included in our evaluation of the design effectiveness of CIBC’sdisclosure controls and procedures and internal control over financial reporting as at July 31, 2017. The PrivateBank represents 6% of CIBC’s consolidatedassets, 3% of consolidated revenue and 2% of consolidated net income as at and for the three months ended July 31, 2017.
Changes in internal control over financial reportingThere have been no changes in CIBC’s internal control over financial reporting (excluding The PrivateBank) during the quarter ended July 31, 2017, that havematerially affected, or are reasonably likely to materially affect, its internal control over financial reporting.
Related-party transactionsThere have been no significant changes to CIBC’s procedures and policies regarding related-party transactions since October 31, 2016. For additionalinformation, refer to pages 82 and 158 of the 2016 Annual Report.
46 CIBC THIRD QUARTER 2017

Interim consolidated financial statements(Unaudited)
Contents
48 Consolidated balance sheet49 Consolidated statement of income50 Consolidated statement of comprehensive income51 Consolidated statement of changes in equity52 Consolidated statement of cash flows53 Notes to the interim consolidated financial statements
53 Note 1 – Changes in accounting policies54 Note 2 – Fair value measurement57 Note 3 – Significant transactions58 Note 4 – Securities58 Note 5 – Loans59 Note 6 – Structured entities and derecognition
of financial assets60 Note 7 – Deposits
60 Note 8 – Subordinated indebtedness61 Note 9 – Share capital62 Note 10 – Post-employment benefits63 Note 11 – Income taxes63 Note 12 – Earnings per share64 Note 13 – Contingent liabilities and provision65 Note 14 – Segmented information67 Note 15 – Financial instruments – disclosures
CIBC THIRD QUARTER 2017 47

Consolidated balance sheet
Unaudited, $ millions, as at2017
Jul. 31 (1)2016
Oct. 31
ASSETSCash and non-interest-bearing deposits with banks $ 4,207 $ 3,500
Interest-bearing deposits with banks 15,710 10,665
SecuritiesTrading 48,073 49,915Available-for-sale (AFS) and held-to-maturity (HTM) (Note 4) 40,164 37,253Designated at fair value (FVO) 143 255
88,380 87,423
Cash collateral on securities borrowed 5,866 5,433
Securities purchased under resale agreements 39,206 28,377
LoansResidential mortgages 203,387 187,298Personal 40,470 38,041Credit card 12,438 12,332Business and government 94,913 71,437Allowance for credit losses (Note 5) (1,598) (1,691)
349,610 307,417
OtherDerivative instruments 26,370 27,762Customers’ liability under acceptances 9,383 12,364Land, buildings and equipment 1,762 1,898Goodwill 5,101 1,539Software and other intangible assets 1,822 1,410Investments in equity-accounted associates and joint ventures 740 766Deferred tax assets 712 771Other assets 12,043 12,032
57,933 58,542
$ 560,912 $ 501,357
LIABILITIES AND EQUITYDeposits (Note 7)Personal $ 158,296 $ 148,081Business and government 225,342 190,240Bank 15,741 17,842Secured borrowings 39,978 39,484
439,357 395,647
Obligations related to securities sold short 12,582 10,338
Cash collateral on securities lent 2,061 2,518
Obligations related to securities sold under repurchase agreements 22,553 11,694
OtherDerivative instruments 28,151 28,807Acceptances 9,384 12,395Deferred tax liabilities 30 21Other liabilities 13,577 12,898
51,142 54,121
Subordinated indebtedness 3,195 3,366
EquityPreferred shares 1,796 1,000Common shares (Note 9) 12,197 8,026Contributed surplus 137 72Retained earnings 15,535 13,584Accumulated other comprehensive income (AOCI) 167 790
Total shareholders’ equity 29,832 23,472Non-controlling interests 190 201
Total equity 30,022 23,673
$ 560,912 $ 501,357
(1) In the third quarter of 2017, we completed the acquisition of The PrivateBank. See Note 3 for additional details.
The accompanying notes and shaded sections in “MD&A – Management of risk” are an integral part of these interim consolidated financial statements.
48 CIBC THIRD QUARTER 2017
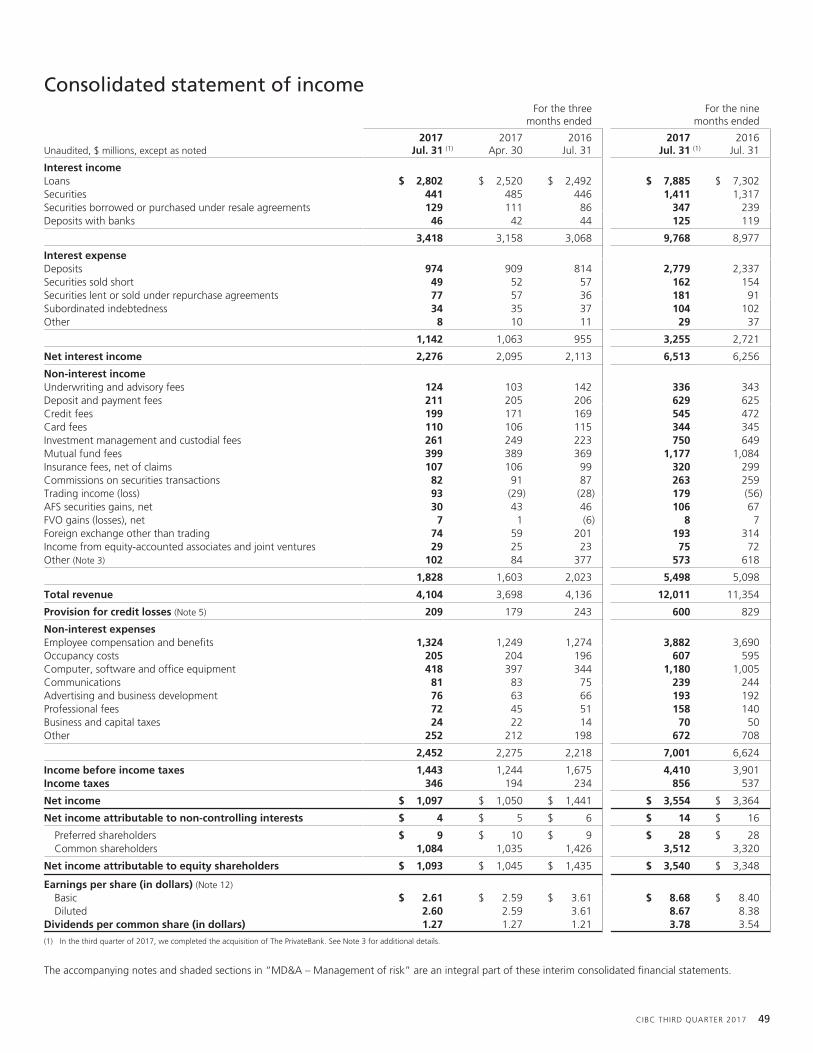
Consolidated statement of incomeFor the three
months endedFor the nine
months ended
Unaudited, $ millions, except as noted2017
Jul. 31 (1)2017
Apr. 302016
Jul. 312017
Jul. 31 (1)2016
Jul. 31
Interest incomeLoans $ 2,802 $ 2,520 $ 2,492 $ 7,885 $ 7,302Securities 441 485 446 1,411 1,317Securities borrowed or purchased under resale agreements 129 111 86 347 239Deposits with banks 46 42 44 125 119
3,418 3,158 3,068 9,768 8,977
Interest expenseDeposits 974 909 814 2,779 2,337Securities sold short 49 52 57 162 154Securities lent or sold under repurchase agreements 77 57 36 181 91Subordinated indebtedness 34 35 37 104 102Other 8 10 11 29 37
1,142 1,063 955 3,255 2,721
Net interest income 2,276 2,095 2,113 6,513 6,256
Non-interest incomeUnderwriting and advisory fees 124 103 142 336 343Deposit and payment fees 211 205 206 629 625Credit fees 199 171 169 545 472Card fees 110 106 115 344 345Investment management and custodial fees 261 249 223 750 649Mutual fund fees 399 389 369 1,177 1,084Insurance fees, net of claims 107 106 99 320 299Commissions on securities transactions 82 91 87 263 259Trading income (loss) 93 (29) (28) 179 (56)AFS securities gains, net 30 43 46 106 67FVO gains (losses), net 7 1 (6) 8 7Foreign exchange other than trading 74 59 201 193 314Income from equity-accounted associates and joint ventures 29 25 23 75 72Other (Note 3) 102 84 377 573 618
1,828 1,603 2,023 5,498 5,098
Total revenue 4,104 3,698 4,136 12,011 11,354
Provision for credit losses (Note 5) 209 179 243 600 829
Non-interest expensesEmployee compensation and benefits 1,324 1,249 1,274 3,882 3,690Occupancy costs 205 204 196 607 595Computer, software and office equipment 418 397 344 1,180 1,005Communications 81 83 75 239 244Advertising and business development 76 63 66 193 192Professional fees 72 45 51 158 140Business and capital taxes 24 22 14 70 50Other 252 212 198 672 708
2,452 2,275 2,218 7,001 6,624
Income before income taxes 1,443 1,244 1,675 4,410 3,901Income taxes 346 194 234 856 537
Net income $ 1,097 $ 1,050 $ 1,441 $ 3,554 $ 3,364
Net income attributable to non-controlling interests $ 4 $ 5 $ 6 $ 14 $ 16
Preferred shareholders $ 9 $ 10 $ 9 $ 28 $ 28Common shareholders 1,084 1,035 1,426 3,512 3,320
Net income attributable to equity shareholders $ 1,093 $ 1,045 $ 1,435 $ 3,540 $ 3,348
Earnings per share (in dollars) (Note 12)Basic $ 2.61 $ 2.59 $ 3.61 $ 8.68 $ 8.40Diluted 2.60 2.59 3.61 8.67 8.38
Dividends per common share (in dollars) 1.27 1.27 1.21 3.78 3.54
(1) In the third quarter of 2017, we completed the acquisition of The PrivateBank. See Note 3 for additional details.
The accompanying notes and shaded sections in “MD&A – Management of risk” are an integral part of these interim consolidated financial statements.
CIBC THIRD QUARTER 2017 49

Consolidated statement of comprehensive incomeFor the three
months endedFor the nine
months ended
Unaudited, $ millions2017
Jul. 31 (1)2017
Apr. 302016
Jul. 312017
Jul. 31 (1)2016
Jul. 31
Net income $ 1,097 $ 1,050 $ 1,441 $ 3,554 $ 3,364
Other comprehensive income (OCI), net of income tax, that is subject to subsequentreclassification to net incomeNet foreign currency translation adjustmentsNet gains (losses) on investments in foreign operations (2,643) 1,095 327 (2,232) (119)Net (gains) losses on investments in foreign operations reclassified to net income – – (254) – (272)Net gains (losses) on hedges of investments in foreign operations 1,586 (592) (100) 1,425 126Net (gains) losses on hedges of investments in foreign operations reclassified to net income – – 113 – 121
(1,057) 503 86 (807) (144)
Net change in AFS securitiesNet gains (losses) on AFS securities (23) 70 73 – 111Net (gains) losses on AFS securities reclassified to net income (19) (35) (33) (77) (53)
(42) 35 40 (77) 58
Net change in cash flow hedgesNet gains (losses) on derivatives designated as cash flow hedges (20) 14 1 50 5Net (gains) losses on derivatives designated as cash flow hedges reclassified to net income 1 (6) 7 (46) (1)
(19) 8 8 4 4
OCI, net of income tax, that is not subject to subsequent reclassification to net incomeNet gains (losses) on post-employment defined benefit plans 203 (158) (148) 264 (445)Net gains (losses) due to fair value change of FVO liabilities attributable to changes
in credit risk (1) (3) 1 (7) (2)
Total OCI (2) (916) 385 (13) (623) (529)
Comprehensive income $ 181 $ 1,435 $ 1,428 $ 2,931 $ 2,835
Comprehensive income attributable to non-controlling interests $ 4 $ 5 $ 6 $ 14 $ 16
Preferred shareholders $ 9 $ 10 $ 9 $ 28 $ 28Common shareholders 168 1,420 1,413 2,889 2,791
Comprehensive income attributable to equity shareholders $ 177 $ 1,430 $ 1,422 $ 2,917 $ 2,819(1) In the third quarter of 2017, we completed the acquisition of The PrivateBank. See Note 3 for additional details.(2) Includes $11 million of losses for the quarter ended July 31, 2017 (April 30, 2017: $11 million of gains; July 31, 2016: $9 million of gains) and $17 million of losses for the nine months ended July 31, 2017
(July 31, 2016: $4 million of gains), relating to our investments in equity-accounted associates and joint ventures.
For the threemonths ended
For the ninemonths ended
Unaudited, $ millions2017
Jul. 31 (1)2017
Apr. 302016
Jul. 312017
Jul. 31 (1)2016
Jul. 31
Income tax (expense) benefitSubject to subsequent reclassification to net income
Net foreign currency translation adjustmentsNet gains (losses) on investments in foreign operations $ 89 $ (35) $ (34) $ 76 $ 2Net (gains) losses on investments in foreign operations reclassified to net income – – 37 – 37Net gains (losses) on hedges of investments in foreign operations (343) 117 60 (306) 59Net (gains) losses on hedges of investments in foreign operations reclassified to net income – – (23) – (26)
(254) 82 40 (230) 72
Net change in AFS securitiesNet gains (losses) on AFS securities 5 (16) (16) (15) (18)Net (gains) losses on AFS securities reclassified to net income 11 8 13 29 14
16 (8) (3) 14 (4)
Net change in cash flow hedgesNet gains (losses) on derivatives designated as cash flow hedges 7 (5) (1) (18) (2)Net (gains) losses on derivatives designated as cash flow hedges reclassified to net income – 2 (2) 17 1
7 (3) (3) (1) (1)
Not subject to subsequent reclassification to net incomeNet gains (losses) on post-employment defined benefit plans (73) 57 54 (96) 162Net gains (losses) due to fair value change of FVO liabilities attributable to changes
in credit risk 1 1 – 3 1
$ (303) $ 129 $ 88 $ (310) $ 230(1) In the third quarter of 2017, we completed the acquisition of The PrivateBank. See Note 3 for additional details.
The accompanying notes and shaded sections in “MD&A – Management of risk” are an integral part of these interim consolidated financial statements.
50 CIBC THIRD QUARTER 2017

Consolidated statement of changes in equity
For the threemonths ended
For the ninemonths ended
Unaudited, $ millions2017
Jul. 31 (1)2017
Apr. 302016
Jul. 312017
Jul. 31 (1)2016
Jul. 31
Preferred sharesBalance at beginning of period $ 1,000 $ 1,000 $ 1,000 $ 1,000 $ 1,000Issue of preferred shares 800 – – 800 –Treasury shares (4) – – (4) –
Balance at end of period $ 1,796 $ 1,000 $ 1,000 $ 1,796 $ 1,000
Common shares (Note 9)Balance at beginning of period $ 8,509 $ 8,286 $ 7,792 $ 8,026 $ 7,813Issued pursuant to the acquisition of The PrivateBank 3,443 – – 3,443 –Other issue of common shares 224 231 23 716 61Purchase of common shares for cancellation – – – – (61)Treasury shares 21 (8) (9) 12 (7)
Balance at end of period $ 12,197 $ 8,509 $ 7,806 $ 12,197 $ 7,806
Contributed surplusBalance at beginning of period $ 65 $ 65 $ 74 $ 72 $ 76Issue of replacement equity-settled awards pursuant to the acquisition of The PrivateBank 72 – – 72 –Stock options and restricted shares expense 3 1 1 4 3Stock options exercised (4) (1) (2) (12) (7)Other 1 – – 1 1
Balance at end of period $ 137 $ 65 $ 73 $ 137 $ 73
Retained earningsBalance at beginning of period $ 15,011 $ 14,483 $ 12,197 $ 13,584 $ 11,433Net income attributable to equity shareholders 1,093 1,045 1,435 3,540 3,348Dividends
Preferred (9) (10) (9) (28) (28)Common (551) (508) (478) (1,552) (1,401)
Premium on purchase of common shares for cancellation – – – – (209)Other (9) 1 – (9) 2
Balance at end of period $ 15,535 $ 15,011 $ 13,145 $ 15,535 $ 13,145
AOCI, net of income taxAOCI, net of income tax, that is subject to subsequent reclassification to net income
Net foreign currency translation adjustmentsBalance at beginning of period $ 1,364 $ 861 $ 805 $ 1,114 $ 1,035Net change in foreign currency translation adjustments (1,057) 503 86 (807) (144)
Balance at end of period $ 307 $ 1,364 $ 891 $ 307 $ 891
Net gains (losses) on AFS securitiesBalance at beginning of period $ 126 $ 91 $ 112 $ 161 $ 94Net change in AFS securities (42) 35 40 (77) 58
Balance at end of period $ 84 $ 126 $ 152 $ 84 $ 152
Net gains (losses) on cash flow hedgesBalance at beginning of period $ 46 $ 38 $ 18 $ 23 $ 22Net change in cash flow hedges (19) 8 8 4 4
Balance at end of period $ 27 $ 46 $ 26 $ 27 $ 26
AOCI, net of income tax, that is not subject to subsequent reclassification to net incomeNet gains (losses) on post-employment defined benefit plansBalance at beginning of period $ (447) $ (289) $ (415) $ (508) $ (118)Net change in post-employment defined benefit plans 203 (158) (148) 264 (445)
Balance at end of period $ (244) $ (447) $ (563) $ (244) $ (563)
Net gains (losses) due to fair value change of FVO liabilities attributable tochanges in credit risk
Balance at beginning of period $ (6) $ (3) $ 2 $ – $ 5Net change attributable to changes in credit risk (1) (3) 1 (7) (2)
Balance at end of period $ (7) $ (6) $ 3 $ (7) $ 3
Total AOCI, net of income tax $ 167 $ 1,083 $ 509 $ 167 $ 509
Non-controlling interestsBalance at beginning of period $ 208 $ 194 $ 187 $ 201 $ 193Net income attributable to non-controlling interests 4 5 6 14 16Dividends (4) – (4) (8) (19)Other (18) 9 (1) (17) (2)
Balance at end of period $ 190 $ 208 $ 188 $ 190 $ 188
Equity at end of period $ 30,022 $ 25,876 $ 22,721 $ 30,022 $ 22,721(1) In the third quarter of 2017, we completed the acquisition of The PrivateBank. See Note 3 for additional details.
The accompanying notes and shaded sections in “MD&A – Management of risk” are an integral part of these interim consolidated financial statements.
CIBC THIRD QUARTER 2017 51

Consolidated statement of cash flowsFor the three
months endedFor the nine
months ended
Unaudited, $ millions2017
Jul. 31 (1)2017
Apr. 302016
Jul. 312017
Jul. 31 (1)2016
Jul. 31
Cash flows provided by (used in) operating activitiesNet income $ 1,097 $ 1,050 $ 1,441 $ 3,554 $ 3,364Adjustments to reconcile net income to cash flows provided by (used in) operating activities:
Provision for credit losses 209 179 243 600 829Amortization and impairment (2) 143 127 115 390 333Stock options and restricted shares expense 3 1 1 4 3Deferred income taxes 125 (181) 51 (9) (34)AFS securities losses (gains), net (30) (43) (46) (106) (67)Net losses (gains) on disposal of land, buildings and equipment (3) (2) (2) (306) (61)Other non-cash items, net 37 (41) (459) 17 (599)Net changes in operating assets and liabilities
Interest-bearing deposits with banks (4,481) 1,416 (1,552) (4,604) 5,398Loans, net of repayments (7,926) (8,101) (8,344) (23,155) (18,461)Deposits, net of withdrawals 2,721 2,552 20,148 19,345 22,163Obligations related to securities sold short (511) 1,321 (192) 2,244 (373)Accrued interest receivable 155 (121) 34 110 (49)Accrued interest payable (120) 167 (130) (62) (266)Derivative assets (625) (1,735) 208 1,491 (2,193)Derivative liabilities 3,787 (1,578) (2,548) (668) 1,154Trading securities 12,204 (4,343) (2,971) 1,842 (2,988)FVO securities 11 (8) (7) 112 5Other FVO assets and liabilities 52 750 527 1,305 792Current income taxes (1,227) 150 19 (1,046) 28Cash collateral on securities lent 359 (475) 416 (457) 1,301Obligations related to securities sold under repurchase agreements (1,607) 9,114 (3,781) 10,859 1,724Cash collateral on securities borrowed 828 (1,127) (871) (433) (2,072)Securities purchased under resale agreements (2,058) 1,841 133 (10,829) (1,054)Other, net (1,356) 1,924 (886) 261 (1,240)
1,787 2,837 1,547 459 7,637
Cash flows provided by (used in) financing activitiesIssue of subordinated indebtedness – – – – 1,000Redemption/repurchase/maturity of subordinated indebtedness (35) (20) – (55) (1,500)Issue of preferred shares, net of issuance cost 792 – – 792 –Issue of common shares for cash 220 230 21 704 54Purchase of common shares for cancellation – – – – (270)Net sale (purchase) of treasury shares 17 (8) (9) 8 (7)Dividends paid (560) (518) (487) (1,580) (1,429)
434 (316) (475) (131) (2,152)
Cash flows provided by (used in) investing activitiesPurchase of AFS securities (12,074) (11,950) (7,883) (28,889) (25,245)Proceeds from sale of AFS securities 4,224 6,678 2,370 16,864 8,995Proceeds from maturity of AFS securities 8,884 3,153 3,204 14,723 9,374Cash used in acquisitions, net of cash acquired (2,490) – – (2,490) –Net cash provided by dispositions – 20 1,363 20 1,363Net sale (purchase) of land, buildings and equipment (26) (72) (66) 267 (95)
(1,482) (2,171) (1,012) 495 (5,608)
Effect of exchange rate changes on cash and non-interest-bearing deposits with banks (147) 80 61 (116) 12
Net increase (decrease) in cash and non-interest-bearing deposits with banksduring the period 592 430 121 707 (111)
Cash and non-interest-bearing deposits with banks at beginning of period 3,615 3,185 2,821 3,500 3,053
Cash and non-interest-bearing deposits with banks at end of period (3) $ 4,207 $ 3,615 $ 2,942 $ 4,207 $ 2,942
Cash interest paid $ 1,262 $ 896 $ 1,085 $ 3,317 $ 2,987Cash interest received 3,309 2,815 2,844 9,120 8,191Cash dividends received 264 222 258 758 737Cash income taxes paid 1,448 225 164 1,911 543
(1) In the third quarter of 2017, we completed the acquisition of The PrivateBank. See Note 3 for additional details.(2) Comprises amortization and impairment of buildings, furniture, equipment, leasehold improvements, and software and other intangible assets.(3) Includes restricted balance of $420 million (April 30, 2017: $465 million; July 31, 2016: $410 million).
The accompanying notes and shaded sections in “MD&A – Management of risk” are an integral part of these interim consolidated financial statements.
52 CIBC THIRD QUARTER 2017

Notes to the interim consolidated financial statements(Unaudited)
The interim consolidated financial statements of CIBC are prepared in accordance with Section 308(4) of the Bank Act (Canada), which states that, except asotherwise specified by the Office of the Superintendent of Financial Institutions (OSFI) (Canada), the financial statements are to be prepared in accordance withInternational Financial Reporting Standards (IFRS) as issued by the International Accounting Standards Board (IASB). There are no accounting requirements ofOSFI that are exceptions to IFRS.
These interim consolidated financial statements have been prepared in accordance with International Accounting Standard (IAS) 34 “Interim FinancialReporting” and do not include all of the information required for full annual consolidated financial statements. Except as indicated below, these interimconsolidated financial statements follow the same accounting policies and methods of application as CIBC’s consolidated financial statements as at and for theyear ended October 31, 2016.
All amounts in these interim consolidated financial statements are presented in Canadian dollars, unless otherwise indicated. These interim consolidatedfinancial statements were authorized for issue by the Board of Directors on August 23, 2017.
1. Changes in accounting policies
(a) Changes in accounting policies
During the third quarter, we adopted the following accounting policies as a result of the acquisition of PrivateBancorp, Inc. and its subsidiary, The PrivateBankand Trust Company on June 23, 2017.
Purchased loansBoth purchased performing and purchased credit-impaired loans are initially measured at their acquisition date fair values. As a result of recording the loans atfair value, no allowance for credit losses is recognized at the acquisition date. Fair value is determined by estimating principal and interest cash flows expectedto be collected and discounting those cash flows at a market rate of interest. At the acquisition date, we classify a loan as performing where we expect timelycollection of all amounts in accordance with the original contractual terms of the loan and as credit-impaired where it is probable that we will not be able tocollect all contractually required payments.
For purchased performing loans, the acquisition date fair value adjustment on each loan is amortized to interest income over the expected remaining lifeof the loan using the effective interest rate method. Actual individual allowances for credit losses are recorded as they arise subsequent to the acquisition datein a manner that is consistent with our impairment policy for loans that we originate. As loans are repaid, the remaining unamortized amounts relating to thoseloans are recorded in income in the period that the loan is repaid. Collective allowances are established after the acquisition date as new loans are originatedand to the extent the credit quality of the acquired portfolio deteriorates.
For purchased credit-impaired loans, the acquisition date fair value adjustment on each loan consists of management’s estimate of the shortfall of principaland interest cash flows expected to be collected and the time value of money. The time value of money component of the fair value adjustment is amortized tointerest income over the expected remaining life of the loan using the effective interest rate method. Subsequent to the acquisition date, we regularly re-estimate the expected cash flows and recognize any difference, either through our provision for credit loss or interest income. Decreases in expected cash flowswill result in a charge to provision for credit losses and an increase in our allowance for credit losses. Increases in expected cash flows will result in a recovery ofprovision for credit losses and a reduction in our allowance for credit losses, or if no allowance exists, an increase in interest income.
HTM securitiesHTM securities are non-derivative financial assets with fixed or determinable payments and fixed maturity, that do not meet the definition of loans andreceivables, and where we have the intention and ability to hold to maturity. They are recognized initially at fair value plus transaction costs that are directlyattributable to the acquisition of the securities. Subsequently, they are measured at amortized cost, using the effective interest rate method, net of impairmentlosses. Interest income is recognized on an accrual basis using the effective interest rate method.
(b) Future accounting policy changesIFRS 9 “Financial Instruments” – issued in July 2014, replaces IAS 39 “Financial Instruments: Recognition and Measurement”. IFRS 9 will be effective for us onNovember 1, 2017. Refer to the “Accounting developments” section of the management’s discussion and analysis (MD&A) on pages 43 to 45 for furtherdetails with respect to our transition to IFRS 9.
In May 2017, the IASB issued IFRS 17 “Insurance Contracts”, which will be effective for us starting November 1, 2021. IFRS 17 replaces prior guidance, IFRS 4“Insurance Contracts”, and provides comprehensive guidance on the recognition, measurement, presentation and disclosures of insurance contracts.
For details on other future accounting policy changes, refer to Note 32 to the consolidated financial statements included in our 2016 Annual Report. We arecontinuing to evaluate the impact of standards that are effective for us after fiscal 2017.
CIBC THIRD QUARTER 2017 53

2. Fair value measurement
The table below presents the level in the fair value hierarchy into which the fair values of financial instruments, that are carried at fair value on the interimconsolidated balance sheet, are categorized:
Level 1 Level 2 Level 3
Quoted market priceValuation technique –
observable market inputsValuation technique –
non-observable market inputs Total Total
$ millions, as at2017
Jul. 312016
Oct. 312017
Jul. 312016
Oct. 312017
Jul. 312016
Oct. 312017
Jul. 312016
Oct. 31Financial assetsDeposits with banks $ – $ – $ 71 $ 347 $ – $ – $ 71 $ 347Trading securities
Government issued or guaranteed 2,700 1,474 12,166 9,307 – – 14,866 10,781Corporate equity 28,600 35,023 279 554 32 40 28,911 35,617Corporate debt – – 2,491 1,853 – – 2,491 1,853Mortgage- and asset-backed – – 1,802 1,168 3 496 1,805 1,664
31,300 36,497 16,738 12,882 35 536 48,073 49,915
Trading loansBusiness and government – – 12,603 6,640 17 – 12,620 6,640Residential mortgages – – 13 – – – 13 –
– – 12,616 6,640 17 – 12,633 6,640
AFS securitiesGovernment issued or guaranteed 3,158 1,429 20,336 22,445 – – 23,494 23,874Corporate equity 44 30 130 – 308 344 482 374Corporate debt – – 5,019 5,838 5 5 5,024 5,843Mortgage- and asset-backed – – 7,386 5,215 1,386 1,947 8,772 7,162
3,202 1,459 32,871 33,498 1,699 2,296 37,772 37,253
FVO securitiesGovernment issued or guaranteed – – 54 59 – – 54 59Corporate debt – – – 102 – – – 102Asset-backed – – – – 89 94 89 94
– – 54 161 89 94 143 255FVO securities purchased under resale
agreements – – 562 – – – 562 –
Derivative instrumentsInterest rate – – 8,425 12,409 23 31 8,448 12,440Foreign exchange – – 14,310 12,492 – – 14,310 12,492Credit – – 2 2 127 140 129 142Equity 1,105 742 1,124 364 7 24 2,236 1,130Precious metal – – 170 70 – – 170 70Other commodity 184 161 893 1,327 – – 1,077 1,488
1,289 903 24,924 26,664 157 195 26,370 27,762Total financial assets $ 35,791 $ 38,859 $ 87,836 $ 80,192 $ 1,997 $ 3,121 $ 125,624 $ 122,172
Financial liabilitiesDeposits and other liabilities (1) $ – $ – $ (4,871) $ (3,124) $ (298) $ (506) $ (5,169) $ (3,630)Obligations related to securities sold short (5,187) (4,684) (7,395) (5,654) – – (12,582) (10,338)
(5,187) (4,684) (12,266) (8,778) (298) (506) (17,751) (13,968)
Derivative instrumentsInterest rate – (2) (8,001) (11,926) (21) (35) (8,022) (11,963)Foreign exchange – – (16,196) (13,599) – – (16,196) (13,599)Credit – – (22) (18) (144) (197) (166) (215)Equity (740) (491) (1,730) (1,446) (58) (42) (2,528) (1,979)Precious metal – – (63) (34) – – (63) (34)Other commodity (155) (216) (1,021) (801) – – (1,176) (1,017)
(895) (709) (27,033) (27,824) (223) (274) (28,151) (28,807)Total financial liabilities $ (6,082) $ (5,393) $ (39,299) $ (36,602) $ (521) $ (780) $ (45,902) $ (42,775)
(1) Comprises FVO deposits of $4,607 million (October 31, 2016: $3,281 million), net bifurcated embedded derivative liabilities of $379 million (October 31, 2016: $203 million), FVO other liabilities of $61 million(October 31, 2016: $11 million), and other financial liabilities measured at fair value of $122 million (October 31, 2016: $135 million).
Transfers between levels in the fair value hierarchy are deemed to have occurred at the beginning of the quarter in which the transfer occurred. Transfersbetween levels can occur as a result of additional or new information regarding valuation inputs and changes in their observability. During the quarter endedJuly 31, 2017, we transferred $3,232 million of trading securities and nil securities sold short from Level 1 to Level 2 due to reduced observability in the inputsused to value these securities (for the quarter ended April 30, 2017, $419 million of trading securities and $2,018 million of securities sold short weretransferred from Level 1 to Level 2; for the quarter ended July 31, 2016, $2 billion of trading securities and nil securities sold short were transferred fromLevel 1 to Level 2). In addition, insignificant transfers between Level 2 and Level 3 were made during the quarter as there were changes in the extent to whichnon-observable inputs have a significant impact on the fair value of these instruments or there were changes in the observability of one or more inputs thatsignificantly impact their fair value (for the quarters ended April 30, 2017 and July 31, 2016, transfers between Level 2 and Level 3 were insignificant).
A net gain of $3 million was recognized in the interim consolidated statement of income for the three months ended July 31, 2017, on the financialinstruments for which fair value was estimated using valuation techniques requiring non-observable market parameters (net gain of $37 million for the threemonths ended April 30, 2017; net gain of $35 million for the three months ended July 31, 2016) and a net gain of $16 million for the nine months endedJuly 31, 2017 (net gain of $40 million for the nine months ended July 31, 2016).
The following table presents the changes in fair value of financial assets and liabilities in Level 3. These instruments are measured at fair value utilizingnon-observable market inputs. We often hedge positions with offsetting positions that may be classified in a different level. As a result, the gains and losses
54 CIBC THIRD QUARTER 2017

for assets and liabilities in the Level 3 category presented in the table below do not reflect the effect of offsetting gains and losses on the related hedginginstruments that are classified in Level 1 and Level 2.
Net gains (losses)included in income
$ millions, for the three months endedOpeningbalance Realized (1) Unrealized (1)(2)
Net unrealizedgains (losses)
included in OCI
Transferin to
Level 3
Transferout of
Level 3 Purchases (3) Issuances Sales SettlementsClosingbalance
Jul. 31, 2017Trading securities
Corporate equity $ 42 $ – $ 1 $ – $ – $ – $ – $ – $ – $ (11) $ 32Mortgage- and asset-backed 3 – – – – – – – – – 3
Trading loansBusiness and government – – – – – – 13 7 (3) – 17
AFS securitiesCorporate equity 327 21 (1) (31) – – 18 – (26) – 308Corporate debt 5 – – – – – – – – – 5Mortgage- and asset-backed 1,537 1 – (5) – – 88 – – (235) 1,386
FVO securitiesAsset-backed 96 1 (4) – – – – – – (4) 89
Derivative instrumentsInterest rate 31 – (7) – – – 1 – – (2) 23Credit 142 (3) (12) – – – – – – – 127Equity 34 – – – 1 (19) – – – (9) 7
Total assets $ 2,217 $ 20 $ (23) $ (36) $ 1 $ (19) $ 120 $ 7 $ (29) $ (261) $ 1,997
Deposits and other liabilities (4) $ (254) $ – $ (11) $ – $ (9) $ 3 $ – $ (36) $ – $ 9 $ (298)Derivative instruments
Interest rate (26) – 5 – – – – – – – (21)Credit (162) 3 14 – – – – – – 1 (144)Equity (80) – (5) – (3) 26 – (4) – 8 (58)
Total liabilities $ (522) $ 3 $ 3 $ – $ (12) $ 29 $ – $ (40) $ – $ 18 $ (521)
Apr. 30, 2017Trading securities
Corporate equity $ 41 $ – $ 1 $ – $ – $ – $ – $ – $ – $ – $ 42Mortgage- and asset-backed 6 – (3) – – – – – – – 3
AFS securitiesCorporate equity 338 18 (6) 5 – – 7 – (35) – 327Corporate debt 5 – – – – – – – – – 5Mortgage- and asset-backed 1,647 1 – 2 – – 82 – – (195) 1,537
FVO securitiesAsset-backed 91 1 6 – – – – – – (2) 96
Derivative instrumentsInterest rate 11 – 23 – – – – – – (3) 31Credit 140 (4) 6 – – – – – – – 142Equity 12 – 4 – 19 – – – – (1) 34
Total assets $ 2,291 $ 16 $ 31 $ 7 $ 19 $ – $ 89 $ – $ (35) $ (201) $ 2,217
Deposits and other liabilities (4) $ (263) $ – $ 5 $ – $ – $ – $ – $ (48) $ – $ 52 $ (254)Derivative instruments
Interest rate (27) – – – – 1 – – – – (26)Credit (159) 4 (7) – – – – – – – (162)Equity (42) – (12) – (25) – – (1) – – (80)
Total liabilities $ (491) $ 4 $ (14) $ – $ (25) $ 1 $ – $ (49) $ – $ 52 $ (522)
Jul. 31, 2016Trading securities
Corporate equity $ 51 $ – $ 1 $ – $ – $ – $ – $ – $ – $ (11) $ 41Mortgage- and asset-backed 537 2 16 – – – – – – (17) 538
AFS securitiesCorporate equity 404 44 (3) (36) – – 4 – (55) – 358Corporate debt 5 – – – – – – – – – 5Mortgage- and asset-backed 1,399 1 – 2 – – 471 – – (318) 1,555
FVO securitiesAsset-backed 100 1 5 – – – – – – (5) 101
Derivative instrumentsInterest rate 26 – 1 – – – – – – – 27Credit 145 (4) 5 – – – – – – – 146Equity 1 – 1 – – – 15 – – – 17
Total assets $ 2,668 $ 44 $ 26 $ (34) $ – $ – $ 490 $ – $ (55) $ (351) $ 2,788
Deposits and other liabilities (4) $ (452) $ (5) $ (35) $ – $ (7) $ – $ – $ (9) $ – $ 27 $ (481)Derivative instruments
Interest rate (33) – 2 – – – – – – – (31)Credit (216) 4 (6) – – – – – – 6 (212)Equity (33) – 5 – (1) – (4) – – – (33)
Total liabilities $ (734) $ (1) $ (34) $ – $ (8) $ – $ (4) $ (9) $ – $ 33 $ (757)
(1) Includes foreign currency gains and losses related to AFS debt securities.(2) Comprises unrealized gains and losses relating to these assets and liabilities held at the end of the reporting period.(3) Includes securities acquired as part of the acquisition of The PrivateBank.(4) Includes FVO deposits of $39 million (April 30, 2017: $42 million; July 31, 2016: $306 million) and net bifurcated embedded derivative liabilities of $259 million (April 30, 2017: $212 million; July 31, 2016:
$175 million).
CIBC THIRD QUARTER 2017 55

Net gains (losses)included in income
$ millions, for the nine months endedOpeningbalance Realized (1) Unrealized (1)(2)
Net unrealizedgains (losses)
included in OCI
Transferin to
Level 3
Transferout of
Level 3 Purchases (3) Issuances Sales SettlementsClosingbalance
Jul. 31, 2017Trading securities
Corporate equity $ 40 $ – $ 3 $ – $ – $ – $ – $ – $ – $ (11) $ 32Mortgage- and asset-backed 496 2 (3) – – – – – – (492) 3
Trading loansBusiness and government – – – – – – 13 7 (3) – 17
AFS securitiesCorporate equity 344 53 (9) (33) – – 33 – (80) – 308Corporate debt 5 – – – – – – – – – 5Mortgage- and asset-backed 1,947 4 – (6) – – 204 – – (763) 1,386
FVO securitiesAsset-backed 94 3 1 – – – – – – (9) 89
Derivative instrumentsInterest rate 31 – (4) – – – 1 – – (5) 23Credit 140 (7) (6) – – – – – – – 127Equity 24 – 8 – 3 (19) 4 – – (13) 7
Total assets $ 3,121 $ 55 $ (10) $ (39) $ 3 $ (19) $ 255 $ 7 $ (83) $ (1,293) $ 1,997
Deposits and other liabilities (4) $ (506) $ – $ (43) $ – $ (11) $ 45 $ – $ (145) $ – $ 362 $ (298)Derivative instruments
Interest rate (35) – 13 – – 1 – – – – (21)Credit (197) 17 7 – – – – – – 29 (144)Equity (42) – (23) – (28) 35 – (11) – 11 (58)
Total liabilities $ (780) $ 17 $ (46) $ – $ (39) $ 81 $ – $ (156) $ – $ 402 $ (521)
Jul. 31, 2016Trading securities
Corporate equity $ 46 $ – $ 3 $ – $ – $ – $ 4 $ – $ – $ (12) $ 41Mortgage- and asset-backed 565 6 5 – – – – – – (38) 538
AFS securitiesCorporate equity 431 55 (19) (44) – – 26 – (91) – 358Corporate debt 6 – (1) – – – – – – – 5Mortgage- and asset-backed 1,604 3 – (4) – – 605 – (4) (649) 1,555
FVO securitiesAsset-backed 111 2 (3) – – – – – – (9) 101
Derivative instrumentsInterest rate 26 – 1 – – – – – – – 27Credit 165 (29) 10 – – – – – – – 146Equity 1 – 1 – – – 15 – – – 17
Total assets $ 2,955 $ 37 $ (3) $ (48) $ – $ – $ 650 $ – $ (95) $ (708) $ 2,788
Deposits and other liabilities (4) $ (474) $ (17) $ (5) $ – $ (7) $ 3 $ – $ (43) $ 1 $ 61 $ (481)Derivative instruments
Interest rate (26) – 2 – – – – (7) – – (31)Credit (244) 27 (3) – – – – – – 8 (212)Equity (27) – 2 – (1) – (7) – – – (33)
Total liabilities $ (771) $ 10 $ (4) $ – $ (8) $ 3 $ (7) $ (50) $ 1 $ 69 $ (757)
(1) Includes foreign currency gains and losses related to AFS debt securities.(2) Comprises unrealized gains and losses relating to these assets and liabilities held at the end of the reporting period.(3) Includes securities acquired as part of the acquisition of The PrivateBank.(4) Includes FVO deposits of $39 million (July 31, 2016: $306 million) and net bifurcated embedded derivative liabilities of $259 million (July 31, 2016: $175 million).
Quantitative information about significant non-observable inputs and sensitivity of Level 3 financial assets and liabilitiesDuring the quarter, there were no significant changes in the valuation techniques and the range of significant non-observable inputs used in measuring ourLevel 3 financial assets and liabilities. The impact of adjusting one or more of the non-observable inputs within a reasonably possible range on the fair value ofour Level 3 financial assets and liabilities as at July 31, 2017 did not change significantly from the impact disclosed in the 2016 Annual Report.
Fair value optionThe fair value of a FVO liability reflects the credit risk relating to that liability. For those FVO liabilities for which we believe changes in our credit risk wouldimpact the fair value from the note holders’ perspective, the related fair value changes were recognized in OCI. The pre-tax impact of changes in CIBC’s owncredit risk on our FVO liabilities were losses of $2 million for the three months ended July 31, 2017 (losses of $4 million and gains of $2 million for the threemonths ended April 31, 2017 and July 31, 2016, respectively), losses of $10 million for the nine months ended July 31, 2017 and losses of $10 millioncumulatively (losses of $3 million for the nine months ended July 31, 2016 and gains of $3 million cumulatively).
56 CIBC THIRD QUARTER 2017

3. Significant transactions
Acquisition of PrivateBancorp, Inc.On June 23, 2017, we completed the acquisition of PrivateBancorp, Inc. (PrivateBancorp) and its subsidiary, The PrivateBank and Trust Company (The PrivateBank)for total consideration of US$5.0 billion (C$6.6 billion). This acquisition expands our U.S. presence which diversifies earnings and strengthens our platform forlong-term growth. The acquisition also creates a platform for CIBC to deliver high-quality middle market commercial and private banking capabilities, whichadvances our client-focused strategy.
We acquired 100% of the outstanding share capital of PrivateBancorp for a final transaction value of US$61.00 per PrivateBancorp share. The followingsummarizes the total purchase consideration of $6.6 billion as of the acquisition date:
$ millions, as at June 23, 2017
Issuance of CIBC common shares (1) $ 3,443Cash (2) 2,770Estimated obligation payable to dissenting shareholders (3) 327Issuance of replacement equity-settled awards (4) 72
Total purchase consideration $ 6,612(1) 32,137,402 CIBC common shares were issued at a price of US$80.95 per share to satisfy the equity component of the merger consideration of 0.4176 of a CIBC common share per PrivateBancorp share.(2) US$2.1 billion in cash was transferred to satisfy the cash component of the merger consideration of US$27.20 per PrivateBancorp share.(3) Former PrivateBancorp shareholders who validly exercised their dissent and appraisal rights under Delaware law forego the merger consideration and will instead be entitled to receive a cash payment equal to
the “fair value” of their PrivateBancorp shares as determined by a Delaware court following an appraisal proceeding. CIBC has estimated the fair value of the obligation payable to dissenting shareholdersusing the final transaction value of US$61.00 per PrivateBancorp share. Following the appraisal proceeding, a Delaware court may require CIBC to pay to the dissenting shareholders an amount more or lessthan, or the same as, the merger consideration. Dissenting shareholders are entitled to receive interest of 5% plus the Federal Reserve discount rate compounded quarterly from the effective date of thetransaction until any appraisal proceeding is adjudicated or settled.
(4) Equity-settled share-based awards issued to employees of PrivateBancorp and The PrivateBank consisted of 190,789 replacement restricted shares and 988,544 replacement stock options with a fair value ofUS$54 million relating to the portion of these awards attributable to pre-acquisition service. The fair values of the restricted shares and the stock options were estimated based on the final transaction value ofUS$61.00 per PrivateBancorp share.
The following summarizes the preliminary fair values of identifiable assets acquired and liabilities assumed at the acquisition date:
$ millions, as at June 23, 2017
Fair values of assets acquiredCash and non-interest-bearing deposits with banks $ 280Interest-bearing deposits with banks 441AFS and HTM securities 5,577Loans (1) 20,642Other assets 33Intangible assets (2) 370
Total fair value of identifiable assets acquired 27,343
Fair values of liabilities assumedDeposits 24,059Other liabilities 496
Total fair value of identifiable liabilities assumed 24,555
Fair value of identifiable net assets acquired 2,788Goodwill 3,824
Total purchase consideration $ 6,612(1) The fair value for loans reflects estimates of incurred and expected future credit losses at the acquisition date and interest rate premiums or discounts relative to prevailing market rates. The gross principal
amount is $20.9 billion.(2) Intangible assets include core deposits, customer relationships, and software. Core deposit and customer relationship intangibles arising from the acquisition are amortized on a straight-line basis over
estimated useful lives which range from 3-10 years.
The goodwill recognized of $3.8 billion primarily reflects the expected growth of our combined U.S. Commercial Banking and Wealth Management businesses,the ability to cross sell products between SBUs, and expected synergies from the integration of certain technology and operational platforms. Goodwill is notexpected to be deductible for tax purposes. The estimates for the fair values of the assets acquired and liabilities assumed are subject to refinement andtherefore may be retroactively adjusted to reflect new information obtained about facts and circumstances that existed as at the acquisition date during themeasurement period.
All results of operations are included in our U.S. Commercial Banking and Wealth Management SBU. Since the acquisition date, our acquisition ofPrivateBancorp has increased our consolidated revenue and net income by $131 million and $23 million, respectively. If our acquisition of PrivateBancorp hadoccurred on November 1, 2016 it would have increased our consolidated revenue and net income by $867 million and $254 million, respectively. In addition,we incurred transaction costs, net of tax, of $14 million and integration costs, net of tax, of $7 million during the quarter. These costs were recognized in non-interest expenses and are included in Corporate and Other.
Acquisition of Geneva AdvisorsOn July 10, 2017, we announced that we had entered into a definitive agreement to acquire Geneva Advisors, a private wealth management firm,headquartered in Chicago. Geneva Advisors is an independent private wealth management firm focused on high net worth clients, which will expand CIBC’sprivate wealth management client base and investment management capabilities in the U.S.
Under the terms of the agreement, CIBC will acquire Geneva Advisors for up to US$200 million, of which up to US$135 million will be paid at closing andup to US$65 million is contingent on future performance conditions being met. The consideration will be paid 25% in cash and 75% in the form of CIBCcommon shares, including the portion that is contingent on future performance conditions being met. The transaction is expected to close in the fourth quarterof fiscal 2017, subject to the satisfaction of customary closing conditions, including receipt of regulatory approvals. The results of the acquired business will beconsolidated from the date of close and will be included in our U.S. Commercial Banking and Wealth Management SBU.
CIBC THIRD QUARTER 2017 57

Launch of Simplii Financial and wind-down of President’s Choice Financial consumer banking offerOn August 16, 2017, we announced both the launch of Simplii Financial and the wind-down of our President’s Choice Financial branded consumer bankingoffer with Loblaw Companies Limited (Loblaw). Under the terms of the wind-down agreement negotiated with Loblaw, CIBC is required to pay certain feesto Loblaw. In addition, as a result of the agreement, we will incur ancillary asset impairment and severance costs, as well as ongoing project-related costs.In aggregate, CIBC expects to incur fees and charges of approximately $100 million ($74 million after-tax) in the fourth quarter of 2017.
Lease of new premisesOn April 12, 2017, we announced that we had entered into a lease agreement to become the anchor tenant at a new office complex in downtown Toronto.We have agreed to lease up to 1.75 million square feet of total office space in two buildings to be constructed at the site within the next six years. Theaggregate future minimum lease commitments related to the lease, which begins in 2020, are $2.3 billion.
Sale and lease back of certain retail propertiesDuring the first quarter, we sold and leased back 89 retail properties located mainly in Ontario and British Columbia, and recognized a gain of $299 million($245 million after-tax) in our Canadian Retail and Business Banking SBU. The gain is included in Non-interest income – Other.
4. Securities
Fair value of AFS securities
$ millions, as at2017
Jul. 31 (1)2016
Oct. 31
Amortizedcost
Grossunrealized
gains
Grossunrealized
lossesFair
valueAmortized
cost
Grossunrealized
gains
Grossunrealized
lossesFair
value
Securities issued or guaranteed by:Canadian federal government $ 5,750 $ 20 $ (2) $ 5,768 $ 7,028 $ 28 $ (1) $ 7,055Other Canadian governments 4,976 14 (2) 4,988 5,646 25 (3) 5,668U.S. Treasury and agencies 9,104 8 (18) 9,094 7,820 9 (2) 7,827Other foreign governments 3,643 14 (13) 3,644 3,326 15 (17) 3,324
Mortgage-backed securities (MBS) 6,815 6 (11) 6,810 4,626 6 (5) 4,627Asset-backed securities 1,966 – (4) 1,962 2,533 3 (1) 2,535Corporate public debt 5,031 8 (20) 5,019 5,842 12 (16) 5,838Corporate private debt 5 – – 5 5 – – 5Corporate public equity (2) 18 30 – 48 10 24 – 34Corporate private equity 331 103 – 434 211 132 (3) 340
$ 37,639 $ 203 $ (70) $ 37,772 $ 37,047 $ 254 $ (48) $ 37,253
(1) In the third quarter of 2017, we completed the acquisition of The PrivateBank. See Note 3 for additional details.(2) Includes restricted stock.
As at July 31, 2017, the amortized cost of 983 AFS securities that are in a gross unrealized loss position (October 31, 2016: 240 securities) exceeded their fairvalue by $70 million (October 31, 2016: $48 million). The securities that have been in a gross unrealized loss position for more than a year include 80 AFSsecurities (October 31, 2016: 81 securities) with a gross unrealized loss of $27 million (October 31, 2016: $37 million). We have determined that these AFSsecurities were not impaired.
HTM securities(1)
As at July 31, 2017, we had HTM securities carried at amortized cost with a carrying value of $2,392 million and a fair value of $2,386 million (October 31,2016: nil carrying value and nil fair value). HTM securities measured at amortized cost are required to be assessed for impairment on a periodic basis.Impairment exists when, in management’s opinion, there is no longer reasonable assurance that the full amount of principal and interest can be collected. As atJuly 31, 2017, we have determined that these HTM securities were not impaired. During the quarter, no HTM securities were sold.
5. Loans
Allowance for credit lossesAs at or for the three
months endedAs at or for the nine
months ended
$ millions2017
Jul. 312017
Apr. 302016
Jul. 312017
Jul. 31 (1)2016
Jul. 31
Individualallowance
Collectiveallowance
Totalallowance
Totalallowance
Totalallowance
Totalallowance
Totalallowance
Balance at beginning of period $ 200 $ 1,553 $ 1,753 $ 1,761 $ 1,918 $ 1,813 $ 1,762Provision for credit losses 19 190 209 179 243 600 829Write-offs (14) (237) (251) (258) (321) (789) (796)Recoveries 4 44 48 50 46 145 139Interest income on impaired loans (5) (2) (7) (6) (9) (21) (20)Foreign exchange and other (1) (16) (16) (32) 27 19 (28) (18)
Balance at end of period $ 188 $ 1,532 $ 1,720 $ 1,753 $ 1,896 $ 1,720 $ 1,896
Comprises:Loans $ 188 $ 1,410 $ 1,598 $ 1,639 $ 1,780 $ 1,598 $ 1,780Undrawn credit facilities (1)(2) – 122 122 114 116 122 116
(1) Included allowances for undrawn credit facilities related to the acquisition of The PrivateBank.(2) Included in Other liabilities on the interim consolidated balance sheet.
58 CIBC THIRD QUARTER 2017

Impaired loans
$ millions, as at2017
Jul. 31 (1)2016
Oct. 31
Grossimpaired
Individualallowance
Collectiveallowance (2)
Netimpaired
Netimpaired
Residential mortgages $ 514 $ 1 $ 152 $ 361 $ 346Personal 176 7 136 33 48Business and government 654 180 10 464 692
Total impaired loans (3)(4) $ 1,344 $ 188 $ 298 $ 858 $ 1,086(1) In the third quarter of 2017, we completed the acquisition of The PrivateBank. See Note 3 for additional details.(2) Includes collective allowance relating to personal, scored small business and mortgage impaired loans that are greater than 90 days delinquent. In addition, we have a collective allowance of $1,234 million
(October 31, 2016: $1,241 million) on balances and commitments which are not impaired.(3) Average balance of gross impaired loans for the quarter ended July 31, 2017 totalled $1,317 million (for the quarter ended October 31, 2016: $1,709 million).(4) Foreclosed assets of $20 million (October 31, 2016: $18 million) were included in Other assets on the interim consolidated balance sheet.
Purchased credit-impaired loansPurchased credit-impaired loans resulting from the acquisition of The PrivateBank consisted mainly of business and government loans with an outstandingunpaid principal balance of $134 million and a fair value of $105 million as at June 23, 2017 (the acquisition date).
The following table provides further details of our purchased credit-impaired loans:
$ millions, as at2017
Jul. 312016
Oct. 31
Unpaid principal balance (1) $ 123 $ n/aCredit related fair value adjustments (20) n/aTime value of money (7) n/aCarrying value 96 n/a
Individually assessed allowance – n/aCarrying value net of related allowance $ 96 $ n/a
(1) Represents principal amount owed net of write-offs since the acquisition of the loan.n/a Not applicable.
Contractually past due loans but not impairedThis comprises loans where repayment of principal or payment of interest is contractually in arrears. The following table provides an aging analysis of thecontractually past due loans.
$ millions, as at2017
Jul. 31 (1)2016
Oct. 31
Less than31 days
31 to90 days
Over90 days Total Total
Residential mortgages $ 2,641 $ 852 $ 190 $ 3,683 $ 3,262Personal 716 177 35 928 810Credit card 589 176 95 860 890Business and government 438 129 31 598 363
$ 4,384 $ 1,334 $ 351 $ 6,069 $ 5,325
(1) In the third quarter of 2017, we completed the acquisition of The PrivateBank. See Note 3 for additional details.
6. Structured entities and derecognition of financial assets
Structured entitiesStructured entities (SEs) are entities that have been designed so that voting or similar rights are not the dominant factor in deciding who controls the entity,such as when any voting rights relate to administrative tasks only and the relevant activities are directed by means of contractual arrangements. SEs are entitiesthat are created to accomplish a narrow and well-defined objective. CIBC is involved with various types of SEs for which the business activities includesecuritization of financial assets, asset-backed financings, and asset management.
We consolidate an SE when the substance of the relationship indicates that we control the SE.Details of our consolidated and non-consolidated SEs are provided on pages 124 to 127 of the 2016 Annual Report.Following the acquisition of The PrivateBank, we also consolidate certain SEs which we sponsor that invest in community development projects in the U.S.
through the issuance of below-market loans that generate a return primarily through the realization of tax credits. As at July 31, 2017, these consolidated SEshad $49 million of loans outstanding. Our non-consolidated SEs also now include debt and equity investments in limited liability entities relating to our U.S.Community Reinvestment Act initiatives. These limited liability entities invest in qualifying community development projects, such as affordable housing projects.
We have two covered bond programs, structured and legislative. Covered bonds are full recourse on-balance sheet obligations that are also fullycollateralized by assets over which bondholders enjoy a priority claim in the event of CIBC’s insolvency. Under the structured program, we transfer a pool ofinsured mortgages to the CIBC Covered Bond Guarantor Limited Partnership that warehouses these mortgages and serves as a guarantor to bondholders forpayment of interest and principal. Under the legislative program, we transfer a pool of conventional uninsured mortgages to the CIBC Covered Bond(Legislative) Guarantor Limited Partnership that warehouses these mortgages and serves as a guarantor to bondholders for payment of interest and principal.The CIBC Covered Bond Guarantor Limited Partnership and the CIBC Covered Bond (Legislative) Guarantor Limited Partnership are SEs which are consolidatedby CIBC. For both covered bond programs, the assets are owned by the guarantor and not CIBC. As at July 31, 2017, our structured program had outstandingcovered bond liabilities of $0.3 billion with a fair value of $0.3 billion (October 31, 2016: $1.0 billion with a fair value of $1.0 billion) and our legislativeprogram had outstanding covered bond liabilities of $16.0 billion with a fair value of $16.2 billion (October 31, 2016: $13.2 billion with a fair value of$13.3 billion). The covered bond liabilities are supported by a contractually determined portion of the assets transferred to the guarantor and certain contractualarrangements designed to protect the bondholders from adverse events, including foreign currency fluctuations.
CIBC THIRD QUARTER 2017 59
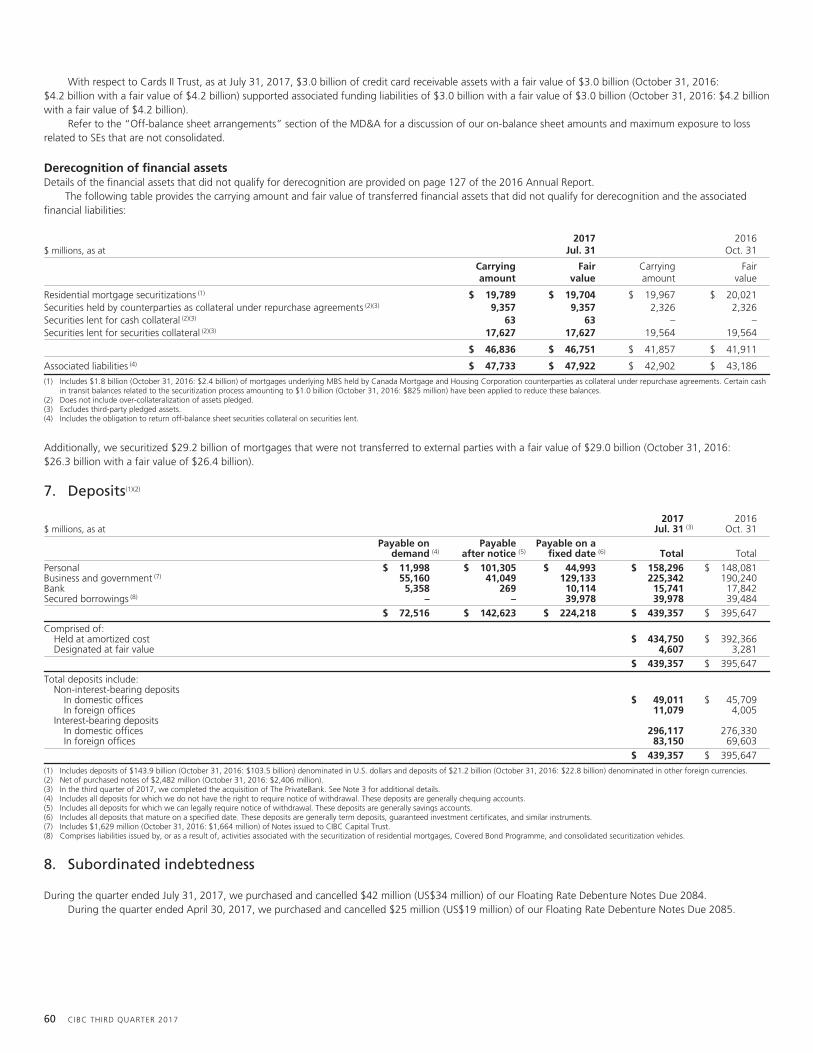
With respect to Cards II Trust, as at July 31, 2017, $3.0 billion of credit card receivable assets with a fair value of $3.0 billion (October 31, 2016:$4.2 billion with a fair value of $4.2 billion) supported associated funding liabilities of $3.0 billion with a fair value of $3.0 billion (October 31, 2016: $4.2 billionwith a fair value of $4.2 billion).
Refer to the “Off-balance sheet arrangements” section of the MD&A for a discussion of our on-balance sheet amounts and maximum exposure to lossrelated to SEs that are not consolidated.
Derecognition of financial assetsDetails of the financial assets that did not qualify for derecognition are provided on page 127 of the 2016 Annual Report.
The following table provides the carrying amount and fair value of transferred financial assets that did not qualify for derecognition and the associatedfinancial liabilities:
$ millions, as at2017
Jul. 312016
Oct. 31
Carryingamount
Fairvalue
Carryingamount
Fairvalue
Residential mortgage securitizations (1) $ 19,789 $ 19,704 $ 19,967 $ 20,021Securities held by counterparties as collateral under repurchase agreements (2)(3) 9,357 9,357 2,326 2,326Securities lent for cash collateral (2)(3) 63 63 – –Securities lent for securities collateral (2)(3) 17,627 17,627 19,564 19,564
$ 46,836 $ 46,751 $ 41,857 $ 41,911
Associated liabilities (4) $ 47,733 $ 47,922 $ 42,902 $ 43,186
(1) Includes $1.8 billion (October 31, 2016: $2.4 billion) of mortgages underlying MBS held by Canada Mortgage and Housing Corporation counterparties as collateral under repurchase agreements. Certain cashin transit balances related to the securitization process amounting to $1.0 billion (October 31, 2016: $825 million) have been applied to reduce these balances.
(2) Does not include over-collateralization of assets pledged.(3) Excludes third-party pledged assets.(4) Includes the obligation to return off-balance sheet securities collateral on securities lent.
Additionally, we securitized $29.2 billion of mortgages that were not transferred to external parties with a fair value of $29.0 billion (October 31, 2016:$26.3 billion with a fair value of $26.4 billion).
7. Deposits(1)(2)
$ millions, as at2017
Jul. 31 (3)2016
Oct. 31Payable on
demand (4)Payable
after notice (5)Payable on a
fixed date (6) Total TotalPersonal $ 11,998 $ 101,305 $ 44,993 $ 158,296 $ 148,081Business and government (7) 55,160 41,049 129,133 225,342 190,240Bank 5,358 269 10,114 15,741 17,842Secured borrowings (8) – – 39,978 39,978 39,484
$ 72,516 $ 142,623 $ 224,218 $ 439,357 $ 395,647
Comprised of:Held at amortized cost $ 434,750 $ 392,366Designated at fair value 4,607 3,281
$ 439,357 $ 395,647
Total deposits include:Non-interest-bearing deposits
In domestic offices $ 49,011 $ 45,709In foreign offices 11,079 4,005
Interest-bearing depositsIn domestic offices 296,117 276,330In foreign offices 83,150 69,603
$ 439,357 $ 395,647
(1) Includes deposits of $143.9 billion (October 31, 2016: $103.5 billion) denominated in U.S. dollars and deposits of $21.2 billion (October 31, 2016: $22.8 billion) denominated in other foreign currencies.(2) Net of purchased notes of $2,482 million (October 31, 2016: $2,406 million).(3) In the third quarter of 2017, we completed the acquisition of The PrivateBank. See Note 3 for additional details.(4) Includes all deposits for which we do not have the right to require notice of withdrawal. These deposits are generally chequing accounts.(5) Includes all deposits for which we can legally require notice of withdrawal. These deposits are generally savings accounts.(6) Includes all deposits that mature on a specified date. These deposits are generally term deposits, guaranteed investment certificates, and similar instruments.(7) Includes $1,629 million (October 31, 2016: $1,664 million) of Notes issued to CIBC Capital Trust.(8) Comprises liabilities issued by, or as a result of, activities associated with the securitization of residential mortgages, Covered Bond Programme, and consolidated securitization vehicles.
8. Subordinated indebtedness
During the quarter ended July 31, 2017, we purchased and cancelled $42 million (US$34 million) of our Floating Rate Debenture Notes Due 2084.During the quarter ended April 30, 2017, we purchased and cancelled $25 million (US$19 million) of our Floating Rate Debenture Notes Due 2085.
60 CIBC THIRD QUARTER 2017

9. Share capital
Common sharesFor the three
months endedFor the nine
months ended
$ millions, except number of shares2017
Jul. 312017
Apr. 302016
Jul. 312017
Jul. 312016
Jul. 31
Numberof shares Amount
Numberof shares Amount
Numberof shares Amount
Numberof shares Amount
Numberof shares Amount
Balance at beginning of period 401,607,560 $ 8,509 399,559,217 $ 8,286 394,678,508 $ 7,792 397,070,280 $ 8,026 397,291,068 $ 7,813Issuance pursuant to:
Acquisition of The PrivateBank 32,137,402 3,443 – – – – 32,137,402 3,443 – –Stock option plans 85,673 8 93,490 8 167,676 15 886,800 81 618,955 53Shareholder investment plan (1) 1,772,067 187 1,746,802 191 – – 5,073,283 549 – –Employee share purchase plan (ESPP) (2) 265,545 29 276,785 32 86,248 8 780,950 86 86,248 8
435,868,247 $ 12,176 401,676,294 $ 8,517 394,932,432 $ 7,815 435,948,715 $ 12,185 397,996,271 $ 7,874Purchase of common shares for cancellation – – – – – – – – (3,081,300) (61)Treasury shares 190,306 21 (68,734) (8) (94,181) (9) 109,838 12 (76,720) (7)
Balance at end of period (3)(4) 436,058,553 $ 12,197 401,607,560 $ 8,509 394,838,251 $ 7,806 436,058,553 $ 12,197 394,838,251 $ 7,806
(1) Commencing with the dividends paid on October 28, 2016, the participants in the Dividend Reinvestment Option and Stock Dividend Option of the Shareholder Investment Plan received a 2% discount fromaverage market price on dividends reinvested in additional common shares issued from Treasury. Commencing November 1, 2016, the participants in the Share Purchase Option of the Plan will receive sharesissued from Treasury with no discount. Previously, shares distributed under the Plan were acquired in the open market.
(2) Commencing June 29, 2016, employee contributions to our Canadian ESPP have been used to purchase common shares from Treasury. Previously, these shares were acquired in the open market.(3) Excludes 2,010,890 common shares which are issued and outstanding but which have not been acquired by a third party. These shares were issued as a component of our acquisition of The PrivateBank. These
shares are currently held on behalf of CIBC, and may be cancelled at CIBC’s discretion.(4) Excludes 190,789 unvested restricted shares as at July 31, 2017 (April 30, 2017: nil; July 31, 2016: nil), for which $13 million is reflected in the contributed surplus.
Normal course issuer bidOn March 10, 2017, we announced that the Toronto Stock Exchange had accepted the notice of CIBC’s intention to commence a normal course issuer bid.Purchases under this bid will terminate upon the earlier of: (i) CIBC purchasing up to a maximum of 8 million common shares; (ii) CIBC providing a notice oftermination; or (iii) March 13, 2018. No common shares have been purchased under this bid.
Preferred sharesNon-cumulative Rate Reset Class A Preferred Shares Series 45 (NVCC)On June 2, 2017, we issued 32 million Non-cumulative Rate Reset Class A Preferred Shares Series 45 (NVCC) (Series 45 shares) with a par value of $25.00 pershare, for gross proceeds of $800 million. For the initial five year period to the earliest redemption date of July 31, 2022, the Series 45 shares pay quarterly cashdividends, if declared, at a rate of 4.40%. On July 31, 2022, and on July 31 every five years thereafter, the dividend rate will reset to be equal to the thencurrent five-year Government of Canada bond yield plus 3.38%.
Holders of the Series 45 shares will have the right to convert their shares on a one-for-one basis into Non-cumulative Floating Rate Class A PreferredShares Series 46 (NVCC) (Series 46 shares), subject to certain conditions, on July 31, 2022 and on July 31 every five years thereafter. Holders of the Series 46shares will be entitled to receive a quarterly floating rate dividend, if declared, equal to the three-month Government of Canada Treasury Bill yield plus 3.38%.Holders of the Series 46 shares may convert their shares on a one-for-one basis into Series 45 shares, subject to certain conditions, on July 31, 2027 and onJuly 31 every five years thereafter.
Subject to regulatory approval and certain provisions of the shares, we may redeem all or any part of the then outstanding Series 45 shares at par onJuly 31, 2022 and on July 31 every five years thereafter; we may redeem all or any part of the then outstanding Series 46 shares at par on July 31, 2027 and onJuly 31 every five years thereafter.
CIBC THIRD QUARTER 2017 61

Regulatory capital and Basel III leverage ratiosOur capital ratios and leverage ratio are presented in the table below:
$ millions, as at2017
Jul. 312016
Oct. 31
Transitional basisCommon Equity Tier 1 (CET1) capital $ 22,221 $ 20,751Tier 1 capital A 24,220 22,596Total capital 27,598 25,949Risk-weighted assets (RWA) (1) 200,100 173,902CET1 ratio 11.1 % 11.9 %Tier 1 capital ratio 12.1 % 13.0 %Total capital ratio 13.8 % 14.9 %Leverage ratio exposure B $ 602,730 $ 546,136Leverage ratio A/B 4.0 % 4.1 %
All-in basisCET1 capital $ 20,664 $ 19,148Tier 1 capital C 23,726 21,666Total capital 27,153 25,083CET1 capital RWA (1) 198,459 168,996Tier 1 capital RWA (1) 198,686 169,322Total capital RWA (1) 198,867 169,601CET1 ratio 10.4 % 11.3 %Tier 1 capital ratio 11.9 % 12.8 %Total capital ratio 13.7 % 14.8 %Leverage ratio exposure D $ 602,314 $ 545,480Leverage ratio C/D 3.9 % 4.0 %(1) Before any capital floor requirement as applicable, there are three different levels of RWAs for the calculation of the CET1, Tier 1, and Total capital ratios arising from the option CIBC has chosen for the phase-
in of the CVA capital charge. Since the introduction of Basel II in 2008, OSFI has prescribed a capital floor requirement for institutions that use the advanced internal ratings-based (AIRB) approach for creditrisk. The capital floor is determined by comparing a capital requirement under Basel I and Basel III, as specified by OSFI. Any shortfall in the Basel III capital requirement compared with the Basel I requirement isadded to the RWAs.
During the quarter ended July 31, 2017, we have complied with OSFI’s regulatory capital requirements.
10. Post-employment benefits
The following tables provide details on the post-employment benefit expense recognized in the interim consolidated statement of income and on theremeasurements recognized in the interim consolidated statement of comprehensive income:
Defined benefit plan expense For the threemonths ended
For the ninemonths ended
$ millions2017
Jul. 312017
Apr. 302016
Jul. 312017
Jul. 312017
Apr. 302016
Jul. 312017
Jul. 312016
Jul. 312017
Jul. 312016
Jul. 31
Pension plansOther
post-employment plans Pension plansOther
post-employment plans
Current service cost $ 54 $ 53 $ 47 $ 3 $ 4 $ 3 $ 161 $ 139 $ 10 $ 9Past service cost – – 1 – – – – 1 – –Net interest (income) expense (1) (2) (7) 6 7 7 (6) (19) 19 21Plan administration costs 2 1 1 – – – 5 4 – –
Net defined benefit plan expenserecognized in net income $ 55 $ 52 $ 42 $ 9 $ 11 $ 10 $ 160 $ 125 $ 29 $ 30
Defined contribution plan expense For the threemonths ended
For the ninemonths ended
$ millions2017
Jul. 31 (1)2017
Apr. 302016
Jul. 312017
Jul. 31 (1)2016
Jul. 31
Defined contribution pension plans $ 5 $ 5 $ 5 $ 17 $ 16Government pension plans (2) 27 26 25 80 73
Total defined contribution plan expense $ 32 $ 31 $ 30 $ 97 $ 89
(1) In the third quarter of 2017, we completed the acquisition of The PrivateBank. See Note 3 for additional details.(2) Includes Canada Pension Plan, Quebec Pension Plan, and U.S. Federal Insurance Contributions Act.
62 CIBC THIRD QUARTER 2017

Remeasurement of employee defined benefit plans(1)
For the threemonths ended
For the ninemonths ended
$ millions2017
Jul. 312017
Apr. 302016
Jul. 312017
Jul. 312017
Apr. 302016
Jul. 312017
Jul. 312016
Jul. 312017
Jul. 312016
Jul. 31
Pension plansOther
post-employment plans Pension plansOther
post-employment plans
Net actuarial gains (losses) on defined benefit obligation $ 384 $ (450) $ (463) $ 35 $ (38) $ (35) $ 362 $ (837) $ 32 $ (65)Net actuarial gains (losses) on plan assets (141) 266 295 – – – (39) 287 – –Changes in asset ceiling excluding interest income (2) 7 1 – – – 5 1 – –
Net remeasurement gains (losses) recognized in OCI $ 241 $ (177) $ (167) $ 35 $ (38) $ (35) $ 328 $ (549) $ 32 $ (65)
(1) The Canadian post-employment defined benefit plans are remeasured on a quarterly basis for changes in the discount rate and for actual asset returns. All other Canadian plans’ actuarial assumptions andforeign plans’ actuarial assumptions are updated at least annually. Amounts exclude net remeasurement gains or losses recognized in OCI in respect of immaterial subsidiaries totalling nil for the quarter endedJuly 31, 2017 (for the quarter ended April 30, 2017: nil; for the quarter ended July 31, 2016: nil) and nil for the nine months ended July 31, 2017 (for the nine months ended July 31, 2016: $7 million ofgains).
11. Income taxes
EnronIn prior years, the Canada Revenue Agency (CRA) issued reassessments disallowing the deduction of approximately $3 billion of the 2005 Enron settlementpayments and related legal expenses. The matter is currently in litigation. The Tax Court of Canada trial on the deductibility of the Enron payments is expectedto commence in 2018.
Should we successfully defend our tax filing position in its entirety, we would recognize an additional accounting tax benefit of $231 million and taxablerefund interest of approximately $196 million. Should we fail to defend our position in its entirety, we would incur an additional tax expense of approximately$820 million and non-deductible interest of approximately $157 million.
Dividend Received DeductionIn June 2016, the CRA reassessed CIBC approximately $118 million of additional income tax by denying the tax deductibility of certain 2011 Canadiancorporate dividends on the basis that they were part of a “dividend rental arrangement”. In May 2017, the CRA reassessed CIBC additional income tax ofapproximately $180 million related to the tax deductibility of dividends during the 2012 taxation year. The circumstances of the dividends subject to thereassessments are similar to those prospectively addressed by the rules in the 2015 Canadian federal budget. It is possible that subsequent years may bereassessed for similar activities. CIBC is confident that its tax filing positions were appropriate and intends to defend itself vigorously. Accordingly, no amountshave been accrued in the consolidated financial statements.
12. Earnings per shareFor the three
months endedFor the nine
months ended
$ millions, except number of shares and per share amounts2017
Jul. 31 (1)
2017Apr. 30
2016Jul. 31
2017Jul. 31 (1)
2016Jul. 31
Basic earnings per shareNet income attributable to equity shareholders $ 1,093 $ 1,045 $ 1,435 $ 3,540 $ 3,348Less: Preferred share dividends and premiums 9 10 9 28 28
Net income attributable to common shareholders $ 1,084 $ 1,035 $ 1,426 $ 3,512 $ 3,320
Weighted-average common shares outstanding (thousands) 415,561 399,807 394,753 404,388 395,459
Basic earnings per share $ 2.61 $ 2.59 $ 3.61 $ 8.68 $ 8.40
Diluted earnings per shareNet income attributable to common shareholders $ 1,084 $ 1,035 $ 1,426 $ 3,512 $ 3,320
Weighted-average common shares outstanding (thousands) 415,561 399,807 394,753 404,388 395,459Add: Stock options potentially exercisable and restricted shares (2) (thousands) 824 770 575 751 516
Weighted-average diluted common shares outstanding (thousands) 416,385 400,577 395,328 405,139 395,975
Diluted earnings per share $ 2.60 $ 2.59 $ 3.61 $ 8.67 $ 8.38(1) In the third quarter of 2017, we completed the acquisition of The PrivateBank. See Note 3 for additional details.(2) Excludes average options outstanding of 795,873 (April 30, 2017: nil; July 31, 2016: 572,628) with a weighted-average exercise price of $111.69 (April 30, 2017: nil; July 31, 2016: $102.33) for the quarter
ended July 31, 2017, and average options of 712,815 with a weighted-average price of $111.69 for the nine months ended July 31, 2017 (average options of 1,284,222 with a weighted-average price of$99.83 for the nine months ended July 31, 2016), as the options’ exercise prices were greater than the average market price of CIBC’s common shares.
CIBC THIRD QUARTER 2017 63

13. Contingent liabilities and provision
Legal proceedings and other contingenciesIn the ordinary course of its business, CIBC is a party to a number of legal proceedings, including regulatory investigations, in which claims for substantialmonetary damages are asserted against CIBC and its subsidiaries. Legal provisions are established if, in the opinion of management, it is both probable thatan outflow of economic benefits will be required to resolve the matter, and a reliable estimate can be made of the amount of the obligation. If the reliableestimate of probable loss involves a range of potential outcomes within which a specific amount within the range appears to be a better estimate, that amountis accrued. If no specific amount within the range of potential outcomes appears to be a better estimate than any other amount, the mid-point in the range isaccrued. In some instances, however, it is not possible either to determine whether an obligation is probable or to reliably estimate the amount of loss, in whichcase no accrual can be made.
While there is inherent difficulty in predicting the outcome of legal proceedings, based on current knowledge and in consultation with legal counsel, wedo not expect the outcome of these matters, individually or in aggregate, to have a material adverse effect on our consolidated financial statements. However,the outcome of these matters, individually or in aggregate, may be material to our operating results for a particular reporting period. We regularly assess theadequacy of CIBC’s litigation accruals and make the necessary adjustments to incorporate new information as it becomes available.
The provisions disclosed in Note 23 to the 2016 annual consolidated financial statements included all of CIBC’s accruals for legal matters as at that date,including amounts related to the significant legal proceedings described in that note and to other legal matters.
CIBC considers losses to be reasonably possible when they are neither probable nor remote. It is reasonably possible that CIBC may incur losses in additionto the amounts recorded when the loss accrued is the mid-point of a range of reasonably possible losses, or the potential loss pertains to a matter in which anunfavourable outcome is reasonably possible but not probable.
CIBC believes the estimate of the aggregate range of reasonably possible losses, in excess of the amounts accrued, for its significant legal proceedings,where it is possible to make such an estimate, is from nil to approximately $1.1 billion as at July 31, 2017. This estimated aggregate range of reasonablypossible losses is based upon currently available information for those significant proceedings in which CIBC is involved, taking into account CIBC’s bestestimate of such losses for those cases for which an estimate can be made. CIBC’s estimate involves significant judgment, given the varying stages of theproceedings and the existence of multiple defendants in many of such proceedings whose share of the liability has yet to be determined. The range does notinclude potential punitive damages and interest. The matters underlying the estimated range as at July 31, 2017, consist of the significant legal mattersdisclosed in Note 23 to the 2016 annual consolidated financial statements as updated below. The matters underlying the estimated range will change from timeto time, and actual losses may vary significantly from the current estimate. For certain matters, CIBC does not believe that an estimate can currently be made asmany of them are in preliminary stages and certain matters have no specific amount claimed. Consequently, these matters are not included in the range.
The following developments related to our significant legal proceedings occurred since the issuance of our 2016 annual consolidated financial statements:• Barbero v. Royal Bank of Canada, et al: The motion for class certification was heard in February 2017. In March 2017, the court dismissed the motion for
class certification. The plaintiffs did not appeal. This matter is closed.• Cerberus Capital Management L.P. v. CIBC: The summary judgment motion was heard in June 2017. The court reserved its decision.• In re PrivateBancorp Shareholder Litigation: This action has settled.• Mortgage prepayment class actions (Sherry): The continuation of the certification motion on the amended pleading is scheduled for November 2017.• Valeant class actions: The motion for class certification in Catucci and motion to dismiss in Potter were heard in April 2017. In Catucci the court reserved
its decision. In Potter the court dismissed the action against the underwriters, without prejudice to the plaintiff to re-plead its allegations.• Green v. Canadian Imperial Bank of Commerce, et al.: The plaintiffs’ motion for summary judgment is scheduled for October 2018.• Credit card class actions – Interchange fees litigation: The motion for class certification in 9085-4886 Quebec Inc. (formerly Bakopanos) is scheduled for
November 2017.• Credit card class actions – Quebec Consumer Protection Act: The Lamoureux, St. Pierre and Corriveau actions were settled in 2016 subject to court
approval. Pursuant to the proposed settlement CIBC will pay $4.25 million to settle these three actions. The court approval hearing was held in December2016. In January 2017, the court did not approve CIBC’s proposed settlement as it found the fees for plaintiffs’ counsel were excessive and the end datefor one of the actions was later than required. The plaintiffs’ appeal is scheduled for September 2017.
• Fresco v. Canadian Imperial Bank of Commerce: The plaintiffs’ motion for summary judgment has been adjourned to a date to be scheduled.
In addition to the developments described above, we recognized an increase of $45 million in our legal provisions during the quarter.
Other than the items described above, there are no significant developments in the matters identified in Note 23 to our 2016 annual consolidated financialstatements, and no new significant legal proceedings have arisen since the issuance of our 2016 annual consolidated financial statements.
RestructuringIn previous years we recorded cumulative restructuring charges of $430 million. As at July 31, 2017, the remaining provision relating to restructuring chargesrecognized in previous years was $169 million (October 31, 2016: $256 million). The reduction in the provision during the nine months ended July 31, 2017primarily relates to payments made to settle a portion of the obligation. While this amount represents our best estimate as at July 31, 2017 of the amountrequired to settle the obligation, uncertainty exists with respect to when the obligation will be settled and the amounts that will ultimately be paid, as this willlargely depend upon individual facts and circumstances.
64 CIBC THIRD QUARTER 2017

14. Segmented information
CIBC has four SBUs: Canadian Retail and Business Banking, Canadian Wealth Management, U.S. Commercial Banking and Wealth Management, and CapitalMarkets. These SBUs are supported by Corporate and Other.
Canadian Retail and Business Banking provides personal and business clients across Canada with financial advice, products and services through a strongteam of advisors and relationship managers, in our banking centres or through remote channels such as mobile advisors, telephone, online or mobile banking.
Canadian Wealth Management provides integrated advice and investment solutions to meet the needs of institutional, retail, and high net worth clients.Our asset management, retail brokerage and private wealth management businesses combine to create an integrated offer, delivered through approximately1,500 advisors across Canada. The results of American Century Investments (sold in fiscal 2016) are included in the Other business line.
U.S. Commercial Banking and Wealth Management offers commercial banking, personal, small business, and wealth management services to our U.S.clients.
Capital Markets provides integrated global markets products and services, investment banking advisory and execution, corporate banking and top-rankedresearch to corporate, government and institutional clients around the world.
Corporate and Other includes the following functional groups – Technology and Operations, Finance, Administration, Risk Management, and InternalAudit, as well as other support groups. The expenses of these functional and support groups are generally allocated to the business lines within the SBUs. Thefunctional and support costs of The PrivateBank are recognized directly in the expenses of U.S. Commercial Banking and Wealth Management. Corporate andOther also includes the results of FirstCaribbean International Bank Limited and other strategic investments, as well as other income statement and balancesheet items not directly attributable to the business lines.
Changes made to our business segmentsThe following external reporting changes were made in the third quarter of 2017. Prior period amounts were reclassified accordingly. The changes impacted theresults of our strategic business units (SBUs), but there was no impact on prior period consolidated net income resulting from these reclassifications.
U.S. Commercial Banking and Wealth ManagementOn June 23, 2017, we completed the acquisition of PrivateBancorp, Inc. (PrivateBancorp) and its subsidiary, The PrivateBank and Trust Company (ThePrivateBank) (see Note 3 for additional information). As a result of the acquisition, a new U.S. Commercial Banking and Wealth Management SBU was created,and includes the following lines of business:• Commercial banking;• Wealth management; and• Other.
In addition to the results of The PrivateBank, U.S. Commercial Banking and Wealth Management includes:• The results of CIBC Atlantic Trust Private Wealth Management (CIBC Atlantic Trust) in the wealth management line of business, previously reported in the
private wealth management line of business within the Wealth Management SBU; and• The results of U.S. real estate finance in the commercial banking line of business, previously reported in the corporate and investment banking line of
business within Capital Markets.
SBU name changesGiven the addition of the U.S. Commercial Banking and Wealth Management SBU, we have changed the name of our Retail and Business Banking SBU toCanadian Retail and Business Banking, and the name of our Wealth Management SBU to Canadian Wealth Management. The lines of business within each SBUremain unchanged, apart from the reclassifications noted above.
Changes to our organizational structureOn June 20, 2017, we announced changes to CIBC’s leadership team and organizational structure to further accelerate our transformation. As a result of thesechanges, we expect to make further external reporting changes in the fourth quarter of 2017.
CIBC THIRD QUARTER 2017 65

$ millions, for the three months ended
CanadianRetail and
BusinessBanking
CanadianWealth
Management
U.S. CommercialBanking and
WealthManagement
CapitalMarkets
Corporateand Other
CIBCTotal
2017 Net interest income (1) $ 1,664 $ 54 $ 154 $ 331 $ 73 $ 2,276Jul. 31 Non-interest income 549 681 85 345 168 1,828
Intersegment revenue (2) 129 (132) – 3 – –
Total revenue (1) 2,342 603 239 679 241 4,104Provision for credit losses 187 – 34 1 (13) 209Amortization and impairment (3) 22 2 11 2 106 143Other non-interest expenses 1,154 415 143 338 259 2,309
Income (loss) before income taxes 979 186 51 338 (111) 1,443Income taxes (1) 260 50 11 86 (61) 346
Net income (loss) $ 719 $ 136 $ 40 $ 252 $ (50) $ 1,097
Net income (loss) attributable to:Non-controlling interests $ – $ – $ – $ – $ 4 $ 4Equity shareholders 719 136 40 252 (54) 1,093
Average assets (4) $ 297,289 $ 3,499 $ 22,346 $ 151,164 $ 68,840 $ 543,138
2017 Net interest income (1) $ 1,558 $ 53 $ 44 $ 487 $ (47) $ 2,095Apr. 30 (5) Non-interest income 543 675 57 200 128 1,603
Intersegment revenue (2) 124 (127) – 3 – –
Total revenue (1) 2,225 601 101 690 81 3,698Provision for credit losses 196 – – (5) (12) 179Amortization and impairment (3) 22 3 3 1 98 127Other non-interest expenses 1,127 402 68 347 204 2,148
Income (loss) before income taxes 880 196 30 347 (209) 1,244Income taxes (1) 233 43 4 80 (166) 194
Net income (loss) $ 647 $ 153 $ 26 $ 267 $ (43) $ 1,050
Net income (loss) attributable to:Non-controlling interests $ – $ – $ – $ – $ 5 $ 5Equity shareholders 647 153 26 267 (48) 1,045
Average assets (4) $ 289,175 $ 3,496 $ 9,219 $ 157,929 $ 68,280 $ 528,099
2016 Net interest income (1) $ 1,572 $ 49 $ 41 $ 509 $ (58) $ 2,113Jul. 31 (5) Non-interest income 536 1,053 52 257 125 2,023
Intersegment revenue (2) 117 (120) – 3 – –
Total revenue (1) 2,225 982 93 769 67 4,136Provision for credit losses 197 – – 47 (1) 243Amortization and impairment (3) 21 3 3 1 87 115Other non-interest expenses 1,100 382 65 354 202 2,103
Income (loss) before income taxes 907 597 25 367 (221) 1,675Income taxes (1) 241 91 2 86 (186) 234
Net income (loss) $ 666 $ 506 $ 23 $ 281 $ (35) $ 1,441
Net income (loss) attributable to:Non-controlling interests $ – $ – $ – $ – $ 6 $ 6Equity shareholders 666 506 23 281 (41) 1,435
Average assets (4) $ 268,017 $ 3,716 $ 8,474 $ 157,129 $ 74,589 $ 511,925(1) Capital Markets and U.S. Commercial Banking and Wealth Management net interest income and income taxes include taxable equivalent basis (TEB) adjustments of $20 million and $1 million, respectively, for
the three months ended July 31, 2017 (April 30, 2017: $123 million and nil, respectively; July 31, 2016: $142 million and nil, respectively) with an equivalent offset in Corporate and Other.(2) Intersegment revenue represents internal sales commissions and revenue allocations under the Manufacturer / Customer Segment / Distributor Management Model.(3) Comprises amortization and impairment of buildings, furniture, equipment, leasehold improvements, and software and other intangible assets.(4) Assets are disclosed on an average basis as this measure is most relevant to a financial institution and is the measure reviewed by management.(5) Certain information has been reclassified to conform to the presentation adopted in the current period.
66 CIBC THIRD QUARTER 2017

$ millions, for the nine months ended
CanadianRetail and
BusinessBanking
CanadianWealth
Management
U.S. CommercialBanking and
WealthManagement
CapitalMarkets
Corporateand Other
CIBCTotal
2017 Net interest income (1) $ 4,824 $ 161 $ 240 $ 1,322 $ (34) $ 6,513Jul. 31 Non-interest income 1,964 2,016 212 867 439 5,498
Intersegment revenue (2) 375 (384) – 9 – –
Total revenue (1) 7,163 1,793 452 2,198 405 12,011Provision for credit losses 588 – 36 (4) (20) 600Amortization and impairment (3) 66 7 18 4 295 390Other non-interest expenses 3,388 1,226 281 1,050 666 6,611
Income (loss) before income taxes 3,121 560 117 1,148 (536) 4,410Income taxes (1) 802 141 23 283 (393) 856
Net income (loss) $ 2,319 $ 419 $ 94 $ 865 $ (143) $ 3,554
Net income (loss) attributable to:Non-controlling interests $ – $ – $ – $ – $ 14 $ 14Equity shareholders 2,319 419 94 865 (157) 3,540
Average assets (4) $ 289,964 $ 3,492 $ 13,569 $ 157,839 $ 68,557 $ 533,421
2016 Net interest income (1) $ 4,619 $ 150 $ 123 $ 1,488 $ (124) $ 6,256Jul. 31 (5) Non-interest income 1,604 2,259 154 629 452 5,098
Intersegment revenue (2) 342 (350) – 8 – –
Total revenue (1) 6,565 2,059 277 2,125 328 11,354Provision for credit losses 559 – (2) 155 117 829Amortization and impairment (3) 70 9 10 4 240 333Other non-interest expenses 3,253 1,135 201 1,015 687 6,291
Income (loss) before income taxes 2,683 915 68 951 (716) 3,901Income taxes (1) 681 173 6 217 (540) 537
Net income (loss) $ 2,002 $ 742 $ 62 $ 734 $ (176) $ 3,364
Net income (loss) attributable to:Non-controlling interests $ – $ – $ – $ – $ 16 $ 16Equity shareholders 2,002 742 62 734 (192) 3,348
Average assets (4) $ 262,220 $ 4,236 $ 8,235 $ 153,221 $ 74,996 $ 502,908(1) Capital Markets and U.S. Commercial Banking and Wealth Management net interest income and income taxes include TEB adjustments of $261 million and $1 million, respectively, for the nine months ended
July 31, 2017 ($377 million and nil for the nine months ended July 31, 2016) with an equivalent offset in Corporate and Other.(2) Intersegment revenue represents internal sales commissions and revenue allocations under the Manufacturer / Customer Segment / Distributor Management Model.(3) Comprises amortization and impairment of buildings, furniture, equipment, leasehold improvements, and software and other intangible assets.(4) Assets are disclosed on an average basis as this measure is most relevant to a financial institution and is the measure reviewed by management.(5) Certain information has been reclassified to conform to the presentation adopted in the current quarter.
15. Financial instruments – disclosures
We have provided quantitative disclosures related to credit risk consistent with Basel guidelines in the “Credit risk” section of the MD&A in our 2016 AnnualReport and interim report to shareholders, which require entities to disclose their exposures based on how they manage their business and risks. The tablebelow sets out the categories of the on-balance sheet exposure to credit risk under different Basel approaches, displayed in both accounting categories andBasel portfolios.
Accounting categories Basel portfolios
Advanced internal ratings-based and standardized approaches
$ millions, as at Corporate Sovereign Bank
Real estatesecured
personallending
Qualifyingrevolving
retailOtherretail
Assetsecuritization
Totalsubject tocredit risk
Notsubject
to creditrisk
Totalconsolidated
balancesheet
2017 Cash and deposits with banks $ 196 $ 13,976 $ 4,088 $ – $ – $ – $ – $ 18,260 $ 1,657 $ 19,917Jul. 31 Securities 1,419 34,320 3,567 – – – 2,005 41,311 47,069 88,380
Cash collateral on securities borrowed 3,070 1 2,795 – – – – 5,866 – 5,866Securities purchased under resale agreements 18,453 14,305 6,448 – – – – 39,206 – 39,206Loans 89,025 4,286 447 222,421 21,890 11,520 1,478 351,067 141 351,208Allowance for credit losses – – – – – – – – (1,598) (1,598)Derivative instruments 6,229 4,849 15,292 – – – – 26,370 – 26,370Customers’ liability under acceptances 7,728 1,586 69 – – – – 9,383 – 9,383Other assets 372 2,983 3,959 167 32 26 3 7,542 14,638 22,180
Total credit exposure $ 126,492 $ 76,306 $ 36,665 $ 222,588 $ 21,922 $ 11,546 $ 3,486 $ 499,005 $ 61,907 $ 560,912
2016Oct. 31 Total credit exposure $ 96,352 $ 64,554 $ 38,326 $ 204,225 $ 21,597 $ 10,465 $ 5,435 $ 440,954 $ 60,403 $ 501,357
CIBC THIRD QUARTER 2017 67

TO REACH US:
Corporate Secretary: Shareholders may call 416-980-3096, or e-mail: [email protected]
Investor Relations: Financial analysts, portfolio managers and other investors requiring financial information may call 416-956-6996, or e-mail:[email protected]
Communications and Public Affairs: Financial, business and trade media may call 416-861-5482, or e-mail: [email protected]
CIBC Telephone Banking: As part of our commitment to our clients, information about CIBC products and services is available by calling 1-800-465-2422toll-free across Canada.
Online Investor Presentations: Supplementary financial information, Supplementary regulatory capital disclosure and a presentation to investors and analystsare available at www.cibc.com; About CIBC.
Earnings Conference Call: CIBC’s third quarter conference call with analysts and investors will take place on Thursday, August 24, 2017 at 7:30 a.m. (ET).The call will be available in English (416-340-2217, or toll-free 1-866-696-5910, passcode 4944204#) and French (514-861-2255, or toll-free 1-888-789-9572,passcode 2581010#). A telephone replay of the conference call will be available in English and French until 11:59 p.m. (ET) August 31, 2017. To access thereplay in English, call 905-694-9451 or 1-800-408-3053, passcode 2734172#. To access the replay in French, call 514-861-2272 or 1-800-408-3053,passcode 2661311#.
Audio Webcast: A live audio webcast of CIBC’s third quarter results conference call will take place on Thursday, August 24, 2017 at 7:30 a.m. (ET) in Englishand French. To access the audio webcast, go to www.cibc.com; About CIBC. An archived version of the audio webcast will also be available in English andFrench following the call on www.cibc.com; About CIBC.
Annual Meeting: CIBC’s next Annual Meeting of Shareholders will be held on April 5, 2018 in Halifax, Nova Scotia.
Regulatory Capital: Information on CIBC’s regulatory capital instruments and regulatory capital position may be found at www.cibc.com; About CIBC;Investor Relations; Regulatory Capital Instruments.
Nothing in CIBC’s website www.cibc.com should be considered incorporated herein by reference.
DIRECT DIVIDEND DEPOSIT SERVICECanadian-resident holders of common shares may have their dividendsdeposited directly into their account at any financial institution which is amember of Payments Canada. To arrange, please write to AST TrustCompany (Canada), P.O. Box 700 Postal Station B, Montreal, QC H3B 3K3or e-mail: [email protected]
SHAREHOLDER INVESTMENT PLANRegistered holders of CIBC common shares wishing to acquire additionalcommon shares may participate in the Shareholder Investment Plan and payno brokerage commissions or service charges.
For a copy of the offering circular, contact AST Trust Company (Canada) at416-682-3860, toll-free at 1-800-387-0825, or by email [email protected].
PURCHASE PRICE OF COMMON SHARESUNDER THE
SHAREHOLDER INVESTMENT PLAN
Date
Sharepurchase
option
Dividendreinvestment & stock
dividend options
May. 1/17 $111.41Jun. 1/17 $105.45Jul. 4/17 $105.36
Jul. 28/17 $105.59
Canadian Imperial Bank of CommerceHead Office: Commerce Court, Toronto, Ontario, M5L 1A2, Canada, (416) 980-2211
www.cibc.com