Embed Size (px)
Citation preview

Contract No.: 500-00-0033 (02) MPR Reference No.: 8914-762
Report to Congress on the Evaluation of Medicare Disease Management Programs February 14, 2008 Arnold Chen Randall Brown Dominick Esposito Jennifer Schore Rachel Shapiro
Submitted to:
Centers for Medicare & Medicaid Services C3-19-07 7500 Security Boulevard Baltimore, MD 21244
Project Officer:
Lorraine Johnson
Submitted by:
Mathematica Policy Research, Inc. P.O. Box 2393 Princeton, NJ 08543-2393 Telephone: (609) 799-3535 Facsimile: (609) 799-0005
Project Director:
Randall Brown

ii
CONTENTS
Section Page
EXECUTIVE SUMMARY....................................................................................................... vi
BACKGROUND AND POLICY CONTEXT............................................................................1
PLANNED AND REPORTED APPROACHES OF THE THREE DEMONSTRATION PROGRAMS...............................................................................................................................7
Common Features in Programs’ Planned and Reported Approaches................................11 Key Differences in the Programs’ Planned and Reported Approaches .............................12
RECRUITMENT, ENROLLMENT, AND RETENTION .......................................................14
Enrollment Experiences .....................................................................................................15 Enrolled Patients ................................................................................................................17 Disenrollment and Inactivation..........................................................................................23
NURSE DISEASE MANAGER AND PROGRAM ACTIVITIES .........................................24
Timeliness of Initial Assessments......................................................................................24 Follow-Up Patient Contacts by Nurse Disease Managers .................................................25
PROGRAM IMPACTS ON MEDICARE SERVICE USE AND EXPENDITURES .............30
Subgroup Results ...............................................................................................................31
COST RECONCILIATION......................................................................................................34
OTHER PROCESS AND OUTCOME MEASURES ..............................................................34
General and Disease-Specific Preventive Care Services Measurable in Medicare Claims Data ........................................................................................................................34 Patient Education, Knowledge, and Behavior ...................................................................35 Programs’ Coverage of Prescription Drugs .......................................................................38 Access to Prescription Drugs .............................................................................................42 Program Effects on Specific Areas of Care: Patient and Physician Perceptions..............43 Physicians’ and Patients’ Global Perceptions and Satisfaction .........................................45 Clinical Measures for Treatment Group Members ............................................................45 Functioning and Health-Related Quality of Life ...............................................................47 Potentially Preventable Hospitalizations and Mortality ....................................................47
SUMMARY OF EVALUATION FINDINGS AND CONCLUSIONS...................................47
REFERENCES..........................................................................................................................51

iii
TABLES
Table Page
1 BARRIERS TO IMPROVED CHRONIC CARE .........................................................2
2 PLANNED AND REPORTED FEATURES OF PROGRAMS IN THE MEDICARE DISEASE MANAGEMENT DEMONSTRATION................................8
3 NUMBER OF BENEFICIARIES MEETING CLAIMS-BASED DIAGNOSTIC CRITERIA IN EACH PROGRAM AREA AS A ROUGH GUIDE TO PROGRAM “PENETRATION”..............................................................17
4 PREENROLLMENT CHARACTERISTICS OF TREATMENT AND CONTROL GROUP PATIENTS RANDOMLY ASSIGNED TO THE DEMONSTRATION THROUGH ALL PROGRAM MONTHS AND INCLUDED IN THE RESEARCH SAMPLE ............................................................19
5 RATES OF DISENROLLMENT AND INACTIVATION FROM TREATMENT GROUP...............................................................................................24
6 FOLLOW-UP CONTACTS, BY TIME SINCE ENROLLMENT, FOR EVER ACTIVE PATIENTS........................................................................................27
7 PROGRAM CONTACTS WITH OFFICES OF PHYSICIANS OF ENROLLED PATIENTS, BY COHORT AND DURATION OF PATIENT ENROLLMENT.........................................................................................29
8 PROGRAM IMPACTS ON LIKELIHOOD OF HOSPITAL OR EMERGENCY ROOM USE, AND ON TOTAL MEDICARE EXPENDITURES AMONG ALL PROGRAM ENROLLEES, CUMULATIVE THROUGH ALL MONTHS OF PROGRAM OPERATIONS...................................30
9 PRECISION OF ESTIMATES OF PROGRAM EFFECTS ON MEDICARE EXPENDITURES THROUGH ALL PROGRAM MONTHS, AMONG ALL ENROLLEES......................................................................................................31
10 SUBGROUP RESULTS FOR HOSPITAL ADMISSIONS AND MEDICARE EXPENDITURES FOR HEARTPARTNERS AND XLHEALTH BY PATIENT SUBGROUPS DEFINED BY WHEN ENROLLED (IN THE FIRST SIX MONTHS OF PROGRAM OPERATIONS OR AFTER THE FIRST SIX MONTHS) CUMULATIVE THROUGH ALL MONTHS OF PROGRAM OPERATIONS........................................................................................32

TABLES (continued)
Table Page
iv
11 ARC COST RECONCILIATION CALCULATIONS FOR THE BIPA DEMONSTRATION ...................................................................................................34
12 PROGRAM IMPACTS ON GENERAL AND DISEASE-SPECIFIC PREVENTIVE CARE SERVICES MEASURED IN MEDICARE CLAIMS DATA IN THE FIRST YEAR OF ENROLLMENT ..................................................36
13 USE OF DEMONSTRATION PRESCRIPTION BENEFIT OVER THE COURSE OF THE DEMONSTRATION AND POSSESSION OF OTHER PRESCRIPTION COVERAGE AT DEMONSTRATION START ...........................39
14 PROGRAM IMPACTS ON ACCESS TO PRESCRIPTION DRUGS.......................43
15 PROGRAM IMPACTS ON POTENTIALLY PREVENTABLE HOSPITALIZATIONS AND MORTALITY IN THE FIRST YEAR OF ENROLLMENT ....................................................................................................48

v
FIGURES
Figure Page
1 LOGIC MODEL FOR DEMONSTRATION OUTCOMES.........................................6
2 CUMULATIVE ENROLLMENT IN THE THREE PROGRAMS ........................... 16
3 PERCENTAGES OF PATIENTS UNDERGOING INITIAL ASSESSMENT WITHIN SPECIFIED TIME FRAMES FOR THE THREE PROGRAMS............... 26
vi
EXECUTIVE SUMMARY
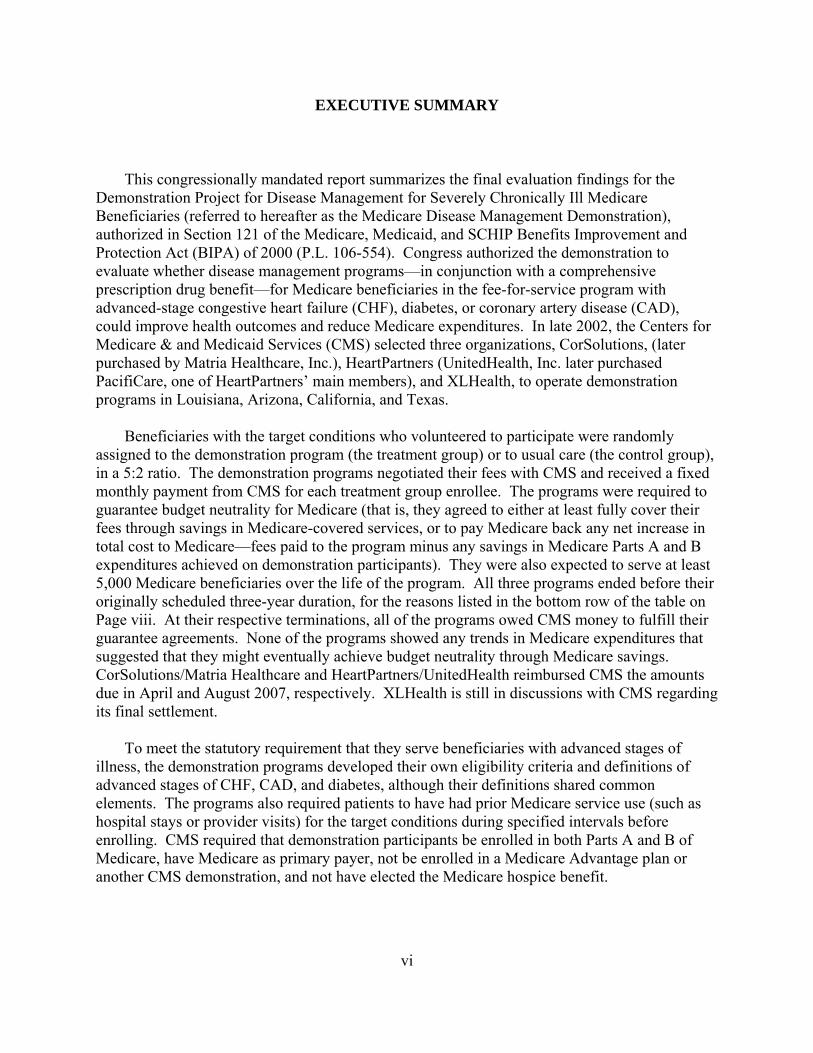
This congressionally mandated report summarizes the final evaluation findings for the Demonstration Project for Disease Management for Severely Chronically Ill Medicare Beneficiaries (referred to hereafter as the Medicare Disease Management Demonstration), authorized in Section 121 of the Medicare, Medicaid, and SCHIP Benefits Improvement and Protection Act (BIPA) of 2000 (P.L. 106-554). Congress authorized the demonstration to evaluate whether disease management programs—in conjunction with a comprehensive prescription drug benefit—for Medicare beneficiaries in the fee-for-service program with advanced-stage congestive heart failure (CHF), diabetes, or coronary artery disease (CAD), could improve health outcomes and reduce Medicare expenditures. In late 2002, the Centers for Medicare & and Medicaid Services (CMS) selected three organizations, CorSolutions, (later purchased by Matria Healthcare, Inc.), HeartPartners (UnitedHealth, Inc. later purchased PacifiCare, one of HeartPartners’ main members), and XLHealth, to operate demonstration programs in Louisiana, Arizona, California, and Texas.
Beneficiaries with the target conditions who volunteered to participate were randomly
assigned to the demonstration program (the treatment group) or to usual care (the control group), in a 5:2 ratio. The demonstration programs negotiated their fees with CMS and received a fixed monthly payment from CMS for each treatment group enrollee. The programs were required to guarantee budget neutrality for Medicare (that is, they agreed to either at least fully cover their fees through savings in Medicare-covered services, or to pay Medicare back any net increase in total cost to Medicare—fees paid to the program minus any savings in Medicare Parts A and B expenditures achieved on demonstration participants). They were also expected to serve at least 5,000 Medicare beneficiaries over the life of the program. All three programs ended before their originally scheduled three-year duration, for the reasons listed in the bottom row of the table on Page viii. At their respective terminations, all of the programs owed CMS money to fulfill their guarantee agreements. None of the programs showed any trends in Medicare expenditures that suggested that they might eventually achieve budget neutrality through Medicare savings. CorSolutions/Matria Healthcare and HeartPartners/UnitedHealth reimbursed CMS the amounts due in April and August 2007, respectively. XLHealth is still in discussions with CMS regarding its final settlement.
To meet the statutory requirement that they serve beneficiaries with advanced stages of
illness, the demonstration programs developed their own eligibility criteria and definitions of advanced stages of CHF, CAD, and diabetes, although their definitions shared common elements. The programs also required patients to have had prior Medicare service use (such as hospital stays or provider visits) for the target conditions during specified intervals before enrolling. CMS required that demonstration participants be enrolled in both Parts A and B of Medicare, have Medicare as primary payer, not be enrolled in a Medicare Advantage plan or another CMS demonstration, and not have elected the Medicare hospice benefit.

vii
The planned disease management interventions of all three programs included assessing, following up with, and educating patients, as well as communicating with physicians. Each program planned to use experienced registered nurses to provide disease management services. Patient education was to include basic disease facts and self-care knowledge, and ways to increase adherence to physicians’ recommendations about diet, exercise, medications, and self-monitoring. All programs said they would provide patients’ physicians with reports comparing patients’ clinical indicators and physicians’ treatment plans (obtained either directly from physicians or indirectly from patients). All three programs planned to identify the reasons for any hospitalizations, to reduce the likelihood of recurrences and to correct potential medication problems. The HeartPartners and CorSolutions programs provided services only by telephone, whereas the XLHealth program planned to contact some patients in person. HeartPartners and XLHealth provided home telemonitoring equipment to their CHF patients. The table on the following page provides an overview of the three programs.
CMS contracted with Mathematica Policy Research, Inc. (MPR) to conduct the
demonstration evaluation. The implementation analysis used interviews with program staff and program-submitted data. The impact analysis, based on the random assignment design, used a survey of patients and physicians and Medicare enrollment and claims data.1
RECRUITMENT, ENROLLMENT, AND RETENTION
Programs Used Medicare Claims Data to Recruit Patients. At the programs’ request, CMS supplied the programs with lists of potentially eligible beneficiaries. These beneficiaries were identified through a Medicare “claims pull” protocol developed for the demonstration, in which CMS compared diagnoses in each program’s eligibility criteria to the diagnosis codes in 2002 and 2003 Medicare claims data (the most recent data available). The resulting lists of beneficiaries, including the contact information in the claims data, were sent to the programs before their start-up dates. CMS also furnished the programs with lists of physicians who had treated any of the identified beneficiaries. After the start of operations, CMS provided each program with monthly updates to identify new potentially eligible beneficiaries.
HeartPartners and XLHealth recruited beneficiaries through letters and telephone calls. In
contrast, CorSolutions initially tried to enlist physicians and hospitals to refer patients to the program, but switched to approaching beneficiaries directly after six months because of slow enrollment. At CorSolutions and HeartPartners, nonclinical enrollment staff were able to screen beneficiaries as originally planned for specific eligibility criteria and obtain informed consent in their initial telephone calls. XLHealth had also planned to screen beneficiaries during enrollment, but found that its nonclinical enrollment staff could not obtain accurate diagnostic
1 Only the XLHealth and HeartPartners programs were surveyed. The CorSolutions program was not surveyed
due to its slow enrollment and short duration in the evaluation.

viii
OVERVIEW OF DEMONSTRATION PROGRAMS IN THE BIPA MEDICARE DISEASE MANAGEMENT DEMONSTRATION
HeartPartners XLHealth CorSolutions Organization Consortium organized for the
demonstration of a large health insurance company and commercial disease management providers
Commercial disease management provider mainly serving managed care plans
Commercial disease management provider mainly serving managed care plans
Conditions targeted CHF CHF alone, diabetes alone, or diabetes and CHF
CHF, CAD, or diabetes
Service area Arizona and California Several specified counties in Texas
Several specified parishes in Louisiana
Main features of planned or proposed disease management intervention
Telephonic disease management by registered nurses Regular transmission of weights and self-reported symptoms by patients to program staff using a program-supplied home monitoring device Periodic ambulatory ischemia monitoring for selected patients
Telephonic and in-person disease management by registered nurses For patients with CHF, regular transmission of weights and self-reported symptoms by patients with home monitoring devices
Telephonic disease management by registered nurses
Prescription benefit Three-tiered formulary: generic medications in lowest tier and preferred brand-name medications in middle tier No limits on number of prescriptions and no spending cap Prescription fills through retail outlets or mail-order service (lower copayments for mail-order) Administration of prescription benefit by large pharmacy benefits management (PBM) firm
Same as HeartPartners Same as HeartPartners
Monthly per-enrollee fees $735.04 $658.80 $602.44
Period of evaluation February 2004–February 2006 April 2004–December 2005 June 2004–August 2005
Reasons for program’s early termination
Voluntary withdrawal to limit financial liability
CMS termination of contract for program’s failure to adhere to operational protocols
Inability to operate as planned due to destruction of New Orleans’ health care system by Hurricane Katrina

ix
information from beneficiaries. Without consulting or obtaining approval from CMS as required, XLHealth decided to forego screening patients and relied solely on the CMS claims pulls to determine eligibility. All three programs forwarded the names and other intake data of consenting beneficiaries to MPR for random assignment.
The Programs Found Recruitment Challenging. The programs all described
unanticipated difficulties with recruiting beneficiaries. Some beneficiaries confused the demonstration with the Medicare prescription drug discount card or with the then forthcoming Medicare Part D drug benefit. Others suspected the demonstration was fraudulent or were unaware or denied that they had a chronic illness. All three programs found that many patients in the claims pull lists were ultimately ineligible. HeartPartners and CorSolutions identified ineligible patients through their eligibility screening, but XLHealth did not discover the ineligible patients on their lists until well after they had enrolled them. Programs reported that, compared to their managed care enrollees, eligible beneficiaries were much less interested in the programs, and that the pharmacy benefit was not as attractive as expected (between 40 and 65 percent of enrollees already had at least some prescription drug coverage at enrollment). Finally, despite persistent efforts, the programs had limited success in enlisting physicians to encourage patient participation in the demonstration. Programs tried various strategies to boost enrollment, such as bringing in staff with experience in recruiting for similar Medicare demonstrations, hiring public relations agencies, collaborating with local Area Agencies on Aging, and timing outreach letters with holidays when beneficiaries’ family members were likely to be visiting.
Two Programs Did Not Meet Their Enrollment Targets. The programs chose enrollment
targets beyond the minimum of 5,000. XLHealth exceeded its target of at least 10,000 treatment group members. However, XLHealth’s rapid enrollment overwhelmed its capacity to conduct timely initial assessments. HeartPartners did not meet its original goal of 17,000 treatment group members by its eighth month but did steadily enroll nearly 6,000. CorSolutions, enrolled only about 1,000 during its 14 months of intake (well short of its original target of 7,500 beneficiaries by its ninth month). The programs targeted very sick beneficiaries and only a small proportion of beneficiaries in each program’s catchment area (between 2 and 7 percent) met the diagnostic criteria in the Medicare claims data. In comparison to the national averages for all Medicare beneficiaries, program participants were older, had previous Medicare expenditures that were three to four times greater, and had much higher rates of fair or poor self-rated health. Compared to the 25 percent of all Medicare beneficiaries without prescription drug coverage in 2003, roughly one-third of HeartPartners and XLHealth patients and 60 percent of CorSolutions patients reported having no prescription drug coverage at enrollment. As expected, randomization produced treatment and control groups with nearly identical average characteristics.
Attrition Rates Were Substantial but Similar Between Treatment and Control Groups.
During the programs’ periods of operation, 14 percent of CorSolutions treatment group patients, 22 percent of HeartPartners treatment group patients, and 25 percent of XLHealth treatment group patients “disenrolled,” that is, left the demonstration because of death or because they no longer met the demonstration eligibility requirements. The main reason for disenrollment among
x
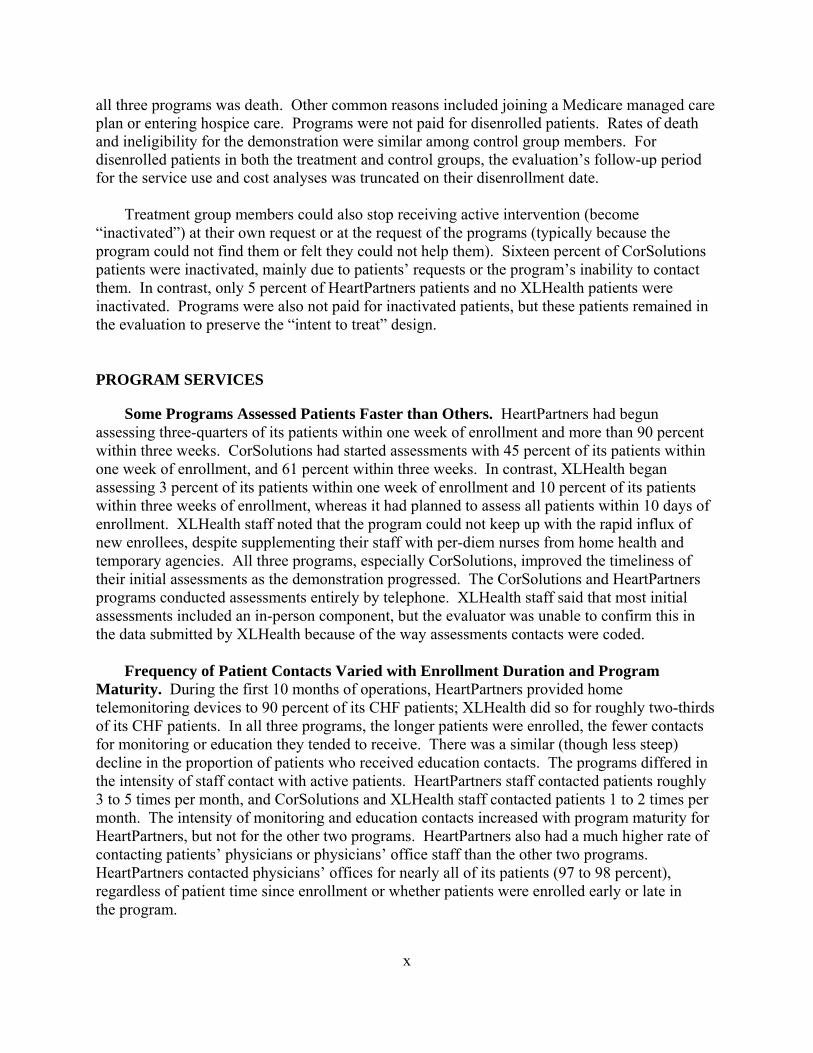
all three programs was death. Other common reasons included joining a Medicare managed care plan or entering hospice care. Programs were not paid for disenrolled patients. Rates of death and ineligibility for the demonstration were similar among control group members. For disenrolled patients in both the treatment and control groups, the evaluation’s follow-up period for the service use and cost analyses was truncated on their disenrollment date.
Treatment group members could also stop receiving active intervention (become
“inactivated”) at their own request or at the request of the programs (typically because the program could not find them or felt they could not help them). Sixteen percent of CorSolutions patients were inactivated, mainly due to patients’ requests or the program’s inability to contact them. In contrast, only 5 percent of HeartPartners patients and no XLHealth patients were inactivated. Programs were also not paid for inactivated patients, but these patients remained in the evaluation to preserve the “intent to treat” design.
PROGRAM SERVICES
Some Programs Assessed Patients Faster than Others. HeartPartners had begun assessing three-quarters of its patients within one week of enrollment and more than 90 percent within three weeks. CorSolutions had started assessments with 45 percent of its patients within one week of enrollment, and 61 percent within three weeks. In contrast, XLHealth began assessing 3 percent of its patients within one week of enrollment and 10 percent of its patients within three weeks of enrollment, whereas it had planned to assess all patients within 10 days of enrollment. XLHealth staff noted that the program could not keep up with the rapid influx of new enrollees, despite supplementing their staff with per-diem nurses from home health and temporary agencies. All three programs, especially CorSolutions, improved the timeliness of their initial assessments as the demonstration progressed. The CorSolutions and HeartPartners programs conducted assessments entirely by telephone. XLHealth staff said that most initial assessments included an in-person component, but the evaluator was unable to confirm this in the data submitted by XLHealth because of the way assessments contacts were coded.
Frequency of Patient Contacts Varied with Enrollment Duration and Program
Maturity. During the first 10 months of operations, HeartPartners provided home telemonitoring devices to 90 percent of its CHF patients; XLHealth did so for roughly two-thirds of its CHF patients. In all three programs, the longer patients were enrolled, the fewer contacts for monitoring or education they tended to receive. There was a similar (though less steep) decline in the proportion of patients who received education contacts. The programs differed in the intensity of staff contact with active patients. HeartPartners staff contacted patients roughly 3 to 5 times per month, and CorSolutions and XLHealth staff contacted patients 1 to 2 times per month. The intensity of monitoring and education contacts increased with program maturity for HeartPartners, but not for the other two programs. HeartPartners also had a much higher rate of contacting patients’ physicians or physicians’ office staff than the other two programs. HeartPartners contacted physicians’ offices for nearly all of its patients (97 to 98 percent), regardless of patient time since enrollment or whether patients were enrolled early or late in the program.

xi
PROGRAM IMPACTS ON MEDICARE SERVICE USE AND EXPENDITURES
There Were No Overall Impacts on Medicare Service Use and Expenditures. In a variety of analyses, none of the programs had impacts on the likelihood of an inpatient admission or emergency room visits, on the average number of inpatient admissions, or on Medicare Part A and B expenditures. The evaluation had more than adequate power to detect the treatment-control differences needed to achieve budget neutrality and had power to detect much smaller differences.
One Program Reduced Medicare Services and Expenditures Among Later Enrollees.
The evaluation also conducted several prespecified subgroup analyses to assess whether the programs might benefit certain types of patients more or less than others. There was a significant subgroup effect in the XLHealth program for early enrollees versus late enrollees, for both the average annual number of hospital admissions and average monthly Medicare expenditures. For the 73 percent of beneficiaries enrolled in the XLHealth program during the first six months, program impacts were essentially zero. Among the 27 percent of all patients who enrolled after the first six months of operations at XLHealth, treatment group members had about 9 percent fewer hospital admissions than control group members, and average monthly treatment group expenditures were about 11 percent lower than those for the control group. However, the estimated treatment-control difference in average monthly Medicare expenditures ($255) for the later enrollees covered only about 40 percent of the average monthly fee paid to the program ($647) and thus was clearly insufficient to achieve cost neutrality even for this later cohort. Furthermore, truncating outlier values reduced the estimated savings on the later cohort to 7 percent, suggesting that the real savings for this group may fall even further short of the amount needed for cost neutrality.
COST RECONCILIATION
As noted, the demonstration was required to be cost-neutral, and programs that failed to achieve savings were expected to reimburse CMS for incurred losses (calculated as the difference in Medicare expenditure per month between the treatment and control groups, multiplied by the total number of eligible months for treatment group members enrolled in the study, plus the fees paid to the disease management program). The amounts owed by the three programs, according to the final cost reconciliation reports by Actuarial Research Corporation, the firm contracted by CMS to calculate quarterly monitoring reports on Medicare expenditures for the demonstration, were $3,568,094 for CorSolutions, $48,589,065 for HeartPartners, and $105,871,858 for XLHealth. As noted earlier, CorSolutions/Matria Healthcare and HeartPartners/UnitedHealth have reimbursed CMS the amounts due, while XLHealth is still in discussions with CMS.

xii
OTHER PROCESS AND OUTCOME MEASURES
There Were Some Favorable Impacts on Recommended Care Processes Measured in Claims Data, Particularly for One Program. The evaluation analyzed program impacts on several preventive care services that are measurable in Medicare claims data. CorSolutions had minimal, if any, effects on these measures, although the followup period for its patients was short. The XLHealth program had statistically significant differences favoring the treatment group in 5 of 10 recommended care processes among patients with diabetes. Among HeartPartners’ and XLHealth’s CHF patients, treatment group members were more likely than control group members to receive an assessment of left ventricular ejection fraction (LVEF).
There Were No Impacts on Patients Reporting That They Had Received Education on
Self-Care Topics. There were two unexpected negative treatment-control differences (fewer treatment group members in HeartPartners reported being taught how to exercise, and fewer treatment group members in XLHealth said that they received educational materials); these differences are unlikely to represent true impacts because of the lack of other corroborating evidence and the implausibility of the programs making it less likely that patients would be taught how to exercise or receive materials.
Use of the Programs’ Prescription Drug Benefits Was Less than Expected, and Impacts
on Prescription Drug Access Were Small. When patients in the HeartPartners and XLHealth programs were surveyed, 9 to 19 months after intake, only 33 percent of treatment group members in HeartPartners and 40 percent of treatment group members in XLHealth reported having used the demonstration prescription drug benefit. The main reason treatment group members gave for not using the demonstration benefit was having other drug coverage (58 percent at HeartPartners and 41 percent at XLHealth). These estimated use rates were roughly consistent with the programs’ drug claims data—in their first six months of enrollment, only about 30 percent of patients at HeartPartners and CorSolutions, and about half of the patients at XLHealth, ever had a claim from their respective demonstration prescription drug plans. Even among patients who had no prescription drug coverage when they started the program, only 30 to 48 percent used the demonstration drug benefit during their first six months in the program.
The demonstration drug benefit had similar impacts for the HeartPartners and XLHealth
programs in helping patients pay for medications. Across the two programs, 83 to 89 percent of treatment group members and 74 to 76 percent of control group members reported getting help with the cost of prescriptions through any insurance or supplemental benefits. However, the demonstration benefit had no impacts on the proportion of patients reporting trouble getting enough medications. These proportions ranged from 16 to 27 percent with no significant treatment-control differences in either program. Treatment group members at HeartPartners paid an average of $109 per month out of pocket for prescription drugs, compared to the $138 that control group members paid. At XLHealth, the average out-of-pocket cost for treatment group members was $124, compared to $189 for control group members. While large in percentage terms, these differences are modest in total dollars, especially given the magnitude of the programs’ fees, which were high partly because of their obligation to provide a comprehensive
xiii
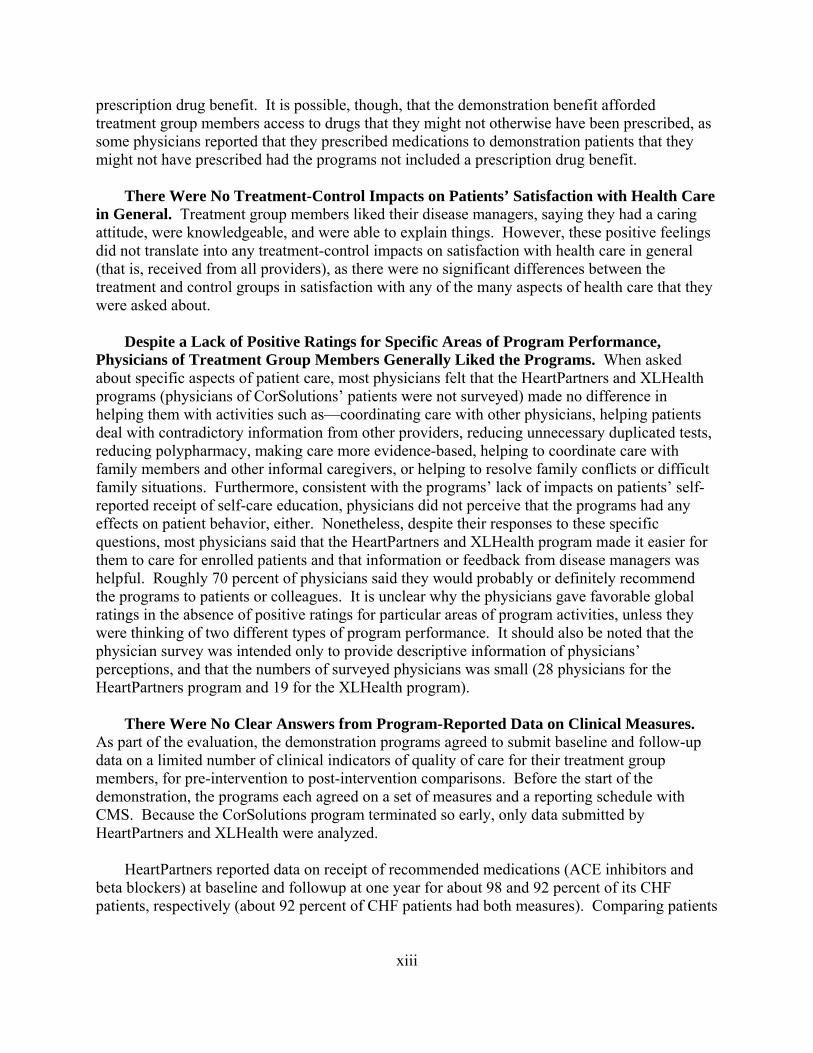
prescription drug benefit. It is possible, though, that the demonstration benefit afforded treatment group members access to drugs that they might not otherwise have been prescribed, as some physicians reported that they prescribed medications to demonstration patients that they might not have prescribed had the programs not included a prescription drug benefit.
There Were No Treatment-Control Impacts on Patients’ Satisfaction with Health Care
in General. Treatment group members liked their disease managers, saying they had a caring attitude, were knowledgeable, and were able to explain things. However, these positive feelings did not translate into any treatment-control impacts on satisfaction with health care in general (that is, received from all providers), as there were no significant differences between the treatment and control groups in satisfaction with any of the many aspects of health care that they were asked about.
Despite a Lack of Positive Ratings for Specific Areas of Program Performance,
Physicians of Treatment Group Members Generally Liked the Programs. When asked about specific aspects of patient care, most physicians felt that the HeartPartners and XLHealth programs (physicians of CorSolutions’ patients were not surveyed) made no difference in helping them with activities such as—coordinating care with other physicians, helping patients deal with contradictory information from other providers, reducing unnecessary duplicated tests, reducing polypharmacy, making care more evidence-based, helping to coordinate care with family members and other informal caregivers, or helping to resolve family conflicts or difficult family situations. Furthermore, consistent with the programs’ lack of impacts on patients’ self-reported receipt of self-care education, physicians did not perceive that the programs had any effects on patient behavior, either. Nonetheless, despite their responses to these specific questions, most physicians said that the HeartPartners and XLHealth program made it easier for them to care for enrolled patients and that information or feedback from disease managers was helpful. Roughly 70 percent of physicians said they would probably or definitely recommend the programs to patients or colleagues. It is unclear why the physicians gave favorable global ratings in the absence of positive ratings for particular areas of program activities, unless they were thinking of two different types of program performance. It should also be noted that the physician survey was intended only to provide descriptive information of physicians’ perceptions, and that the numbers of surveyed physicians was small (28 physicians for the HeartPartners program and 19 for the XLHealth program).
There Were No Clear Answers from Program-Reported Data on Clinical Measures.
As part of the evaluation, the demonstration programs agreed to submit baseline and follow-up data on a limited number of clinical indicators of quality of care for their treatment group members, for pre-intervention to post-intervention comparisons. Before the start of the demonstration, the programs each agreed on a set of measures and a reporting schedule with CMS. Because the CorSolutions program terminated so early, only data submitted by HeartPartners and XLHealth were analyzed.
HeartPartners reported data on receipt of recommended medications (ACE inhibitors and
beta blockers) at baseline and followup at one year for about 98 and 92 percent of its CHF patients, respectively (about 92 percent of CHF patients had both measures). Comparing patients

xiv
with baseline data with those with follow-up data, the percentage of CHF patients at followup taking ACE inhibitors and the percentage taking beta blockers both fell slightly—about one percentage point for ACE inhibitors (from 64 percent at baseline to 63 percent at followup) and one percentage points for beta blockers (from 72 percent at baseline to 71 percent at followup). Results were similar when only patients with data for both time points were analyzed.
XLHealth submitted baseline data on these same quality indicators for 76 percent of their
patients with CHF and follow-up data for about 71 percent. Comparing those with baseline data to those with follow-up data, the percentage of patients taking an ACE inhibitor at followup rose about 12 percentage points (from 59 to 71 percent), or 20 percent compared to baseline, with no change in the percentage taking beta blockers (results for those with both baseline and follow-up data were similar). XLHealth had also agreed to report the results of LVEF tests, but submitted incomplete data on this measure, with only about 12 percent of patients having values at baseline. HeartPartners, on the other hand, did not agree to report LVEF test results.
Finally, XLHealth agreed to submit pre- and post-enrollment data on blood pressure,
hemoglobin A1c and LDL cholesterol blood levels, and urine microalbumin tests for treatment group members with diabetes. The baseline and follow-up data on these measures were incomplete, with values available for blood pressure for 20 percent of patients, for hemoglobin A1c and LDL cholesterol for 10 percent of patients, and for microalbuminuria or proteinuria for 2 percent of patients. Among those with either baseline or follow-up values for these measures, all three quality indicators appeared better at follow-up than at baseline.
Given the pre- and post-enrollment comparisons, the high proportion of patients with
missing data, and the collection of the data by the programs themselves, it is hard to say whether the differences for either program for any of these measures represent any true changes in these particular quality-of-care indicators, and whether any changes are attributable to the program’s intervention. Given the importance of these clinical measures for planning and monitoring evidence-based care for the target conditions, the lack of complete data raises the question of whether the programs had the information they needed to properly assess and improve care for their patients.
There Were No Impacts on Functioning or Health Measures. None of the programs had
favorable impacts on any of the measures of physical functioning or of perceived mental and physical health-related quality of life.
There Were No Impacts on Mortality and Potentially Preventable Hospitalizations.
The programs had no effects on mortality. There were a few scattered effects showing an increase in potentially preventable hospitalizations as measured in Medicare claims data. Patients with diabetes in the HeartPartners program had a higher likelihood of cardiac- and diabetes-related hospitalizations and, in both the HeartPartners and XLHealth programs, a higher rate of microvascular complications. It is unlikely that the programs could actually have diminished quality of care, and there is no corroborating evidence from the other analyses of any harmful effects on patients. Therefore, the differences in these outcomes may (1) represent the effects of the programs’ increased surveillance or monitoring of patients, or (2) be due to chance.

xv
SUMMARY OF EVALUATION FINDINGS AND CONCLUSIONS
None of the three demonstration programs had impacts on the key outcomes of Medicare Part A and B expenditures and service use. Impacts on quality of care indicators were small, observed only for one program, and limited to a few of the many measures examined. These results are consistent with the overall findings from the evaluation of the Medicare Coordinated Care Demonstration (Peikes et al. 2007), another recent, large CMS chronic illness demonstration in fee-for-service Medicare. However, the current demonstration required programs to enroll many more patients and had two important new features: (1) placing the programs at financial risk for achieving savings, and (2) including a comprehensive pharmacy benefit. In fact, the substantial monthly per-patient payments to the three programs in this demonstration were due to the programs’ bearing full financial risk and the high expected costs of the drug benefit. These two new features did not lead to the programs’ being effective, however. The pharmacy benefit did not have the hoped for impacts on improving access to medications, nor did its combination with disease management services have the anticipated benefits on health care expenditures and care quality.
There are many reasons why the programs might not have been able to overcome the many
obstacles on the path to improved chronic illness care. None of the three programs had experience working with large numbers of patients who were as ill, complex, or frail as the participants in this demonstration, nor did they have experience in the Medicare fee-for-service environment. Trying to improve the ingrained self-care behaviors of chronically ill people is inherently difficult, particularly for programs that are unaccustomed to working with this patient population, and to programs that are used to having the support of a managed care plan. A relatively high proportion of enrollees may have had access to drug coverage already, thus blunting any effects of the demonstration’s prescription benefit. The programs were unable to collect important clinical process and outcome measures for many patients. Despite the importance of physician behavior in perpetuating suboptimal chronic illness care, none of the programs concentrated on changing physician behavior or coordinating care across providers.
Although the reasons behind the evaluation’s generally negative results are unclear, they do
lead to the policy conclusion that widespread dissemination in Medicare fee-for-service of large-scale disease management and pharmacy coverage programs similar to the three tested would not result in enough savings to offset program fees and would, in fact, be far from cost neutral. Programs such as the three evaluated in this demonstration are unlikely to lead to major improvements in quality of care or beneficiary well-being.

1
REPORT TO CONGRESS ON THE EVALUATION OF MEDICARE DISEASE MANAGEMENT PROGRAMS
This congressionally mandated report summarizes the final evaluation findings for the Demonstration Project for Disease Management for Severely Chronically Ill Medicare Beneficiaries (referred to hereafter as the Medicare Disease Management Demonstration), authorized in Section 121 of the Medicare, Medicaid, and SCHIP Benefits Improvement and Protection Act (BIPA) of 2000 (Public Law 106-554). For the complete evaluation report, please see Chen et al. (2007).
BACKGROUND AND POLICY CONTEXT
Chronic medical conditions contribute disproportionately to health care costs, morbidity, and mortality (Anderson and Horvath 2004; Brown et al. 2003; Center on an Aging Society 2003). The quality of care for chronically ill people is often poor. The proportions of chronically ill people receiving evidence-based and recommended care for their conditions are unjustifiably low, and relatively few receive the education and support they need to better self-manage their illnesses (Leatherman and McCarthy 2005; McGlynn et al. 2003).
Improving care for chronic illness will require major changes in knowledge, attitudes, and
behavior for both chronically ill people and physicians and health care providers. There are many formidable barriers blocking such changes; Table 1 lists some of these.
A wide range of disease management and case management programs have been developed
and implemented by academic medical centers, health maintenance organizations, integrated delivery systems, and vendors in response to the toll that chronic illness takes on health and imposes on health care costs. The literature provides limited rigorous empirical evidence of the effectiveness of such programs, and the programs vary greatly in their interventions and target populations. However, the programs are highly touted by the disease management industry and have been adopted by many commercial insurers, managed care organizations, and state Medicaid programs.
Since the early 1990s, the Centers for Medicare & Medicaid Services (CMS) has sponsored
several demonstrations to test whether different types of disease management can reduce health care costs in a Medicare fee-for-service environment. A related policy concern, especially before the enactment and implementation of Medicare Part D in 2006, had been whether inadequate coverage for prescription drugs, which play such a key role in the treatment of chronic illness, might also contribute to low medication adherence and, thus, poor health outcomes and increased health care use among some chronically ill Medicare beneficiaries (Bagchi et al. 2007).
Congress authorized the Medicare Disease Management Demonstration in the BIPA of 2000
to evaluate whether disease management programs, in conjunction with a comprehensive

2
TABLE 1
BARRIERS TO IMPROVED CHRONIC CARE
Patient Behaviors Factors hindering adherence (to prescribed medications, diet, exercise, self-care, and medical diagnostic and treatment services)a
Lack of knowledge and understanding of the importance of adherence Inadequate skills to perform self-care (such as blood sugar testing or daily foot inspection) Reluctance or ambivalence towards accepting chronic illness and changing long-standing habits Lack of self-efficacy to adhere or perform self-care Depression, fear, anxiety Tobacco or alcohol dependencies Poor assertiveness or communication skills with family members or health care providers Cognitive deficits Sensory deficits (vision, hearing) Mobility impairments Inadequate access to transportation Geographic or physical isolation Poverty/inadequate insurance coverage Caregiving responsibilities (e.g., ill family member)
Factors hindering appropriate response to disease complication or exacerbation: early recognition of warning signs and symptoms, appropriate self-treatment, appropriate seeking of urgent medical care
Lack of knowledge and understanding of the importance of early detection and management of deterioration Inadequate skills (to recognize warning signs, to self-manage, or to be assertive in getting through to the doctor) Lack of self-efficacy to recognize problems and respond appropriately Lack of self-efficacy and skills to manage transitions between care settings (hospital to SNF to home health and
outpatient care—new self-care instructions, follow-up appointments, changes in medications) Depression Cognitive deficits Poverty/inadequate insurance coverage Transportation difficulties
Physician Behaviors Factors hindering delivery of high-quality chronic illness care: assessment, monitoring, care planning, evidence-based care, patient education, and prompt responses to changes in patient statusb
Barriers to Evidence-Based Care Inadequate time Underdeveloped patient communication and counseling skills Lack of self-efficacy to counsel on lifestyle and adherence Inadequate office systems to support adherence to recommended guidelines for diagnosis and treatment Lack of reminder systems and patient registries Acute care focus during office visits Lack of contact with patient between visits Lack of incentives in reimbursement system
Barriers to Communication with Patients Inadequate time Inadequate office communication and triage systems Acute care focus during office visits Underdeveloped patient communication and counseling skills

TABLE 1 (continued)
3
Physician Behaviors (continued) Lack of self-efficacy to counsel on lifestyle and adherence Lack of contact with patient between visits Lack of awareness of patients’ specific barriers to adherence and self-care Lack of incentives in reimbursement system
Barriers to Communication Across Providers and Management of Transitions Between Care Settings Inadequate time Lack of contact with patient between visits Lack of awareness of other providers’ treatments Lack of knowledge of transitions between care settings (hospital to SNF to home health and outpatient care) Lack of incentives in reimbursement system
Appropriate Drug Therapy and Avoidance of Polypharmacy Inadequate time Lack of contact with patient between visits Lack of awareness of other providers’ treatments (or adverse reactions to those treatments) Lack of knowledge of medication changes between care settings (hospital to SNF to home health and
outpatient care) Lack of incentives in reimbursement system Acute care focus during office visits Inadequate office systems to support adherence to recommended guidelines for diagnosis and treatment Lack of reminder systems and patient registries
aExamples of self-care include weighing oneself daily for CHF or checking blood sugar for diabetes. Examples of adhering to medical diagnostic and treatment services include keeping appointments for visits to specialists, physical therapy, or special diagnostic or imaging tests. bAssessment refers to a thorough, in-depth assessment that would uncover the patient-related barriers listed above.

4
prescription drug benefit, could improve health outcomes and reduce Medicare expenditures for targeted beneficiaries. The program was open to all Medicare beneficiaries in the fee-for-service program who lived in the specified service areas and who had advanced-stage congestive heart failure (CHF), diabetes, or coronary artery disease (CAD). The demonstration was to be large—each program was expected to enroll at least 5,000 beneficiaries over the life of the program, and up to 30,000 beneficiaries could be enrolled in the entire project at any given time. In late 2002, CMS selected CorSolutions, HeartPartners, and XLHealth to operate demonstration programs in Louisiana, Arizona and California, and Texas. CorSolutions and XLHealth are commercial disease management providers that primarily serve managed care plans.2 HeartPartners, in contrast, was a consortium of organizations (PacifiCare Health Systems, a large health insurance company, and QMed and Alere Medical, both experienced disease management providers) brought together solely for the demonstration.3
To ensure a rigorous evaluation, CMS required that the demonstration follow an
experimental design in which beneficiaries with the target conditions who volunteered to participate were randomly assigned to the demonstration program (the treatment group) or to usual care (the control group) in a 5:2 ratio.4 Demonstration programs received a fixed monthly payment from CMS for each patient enrolled in the treatment group.
The programs were required to guarantee budget neutrality for Medicare (that is, they
needed either to generate enough savings in traditional Medicare-covered services to at least fully offset demonstration payments or, failing that, to pay Medicare back the fees it received plus any increases in health care costs).5 Because the programs bore full financial risk for their enrollees and had to cover prescription drugs, their payments were sizable, equal to about 29 percent of the projected costs for beneficiaries eligible for the program. (The monthly per-member fees agreed upon with CMS were $602.44 for CorSolutions, $735.04 for HeartPartners, and $658.80 for XLHealth.)6
The programs all agreed to have a portion of their monthly payments withheld and placed
into escrow to help insure against possible shortfalls between payments to the programs and any Medicare savings generated by them. CMS contracted with the Actuarial Research Corporation (ARC) to produce quarterly monitoring reports on Medicare spending for beneficiaries in the
2 CorSolutions was acquired by Matria Healthcare, Inc. in early 2006.
3 In late 2005, PacifiCare Health Systems was acquired by UnitedHealth Group.
4 This ratio was designed to minimize the total number of enrollees required to meet the criteria of 5,000 being served by each program while ensuring adequate precision of the estimated program effects.
5 There were also provisions for the programs and CMS to share in any Medicare savings generated by the programs in excess of the program payments.
6 HeartPartners and CMS later agreed to a lower per-member per-month payment of $552 starting September 2005.

5
treatment and control groups. CMS used these reports to track the performance of the programs and provide them with ongoing feedback. CMS also provided the programs with Medicare claims data on the treatment group members.
For different reasons, all three programs ended before their originally scheduled three year
duration. At their terminations, all three programs owed CMS money to fulfill their obligations to maintain budget neutrality, and none showed any trends in Medicare expenditures suggesting that they might eventually achieve budget neutrality. HeartPartners served patients from February 2004 through February 2006, when it withdrew from the demonstration to limit its financial liability. XLHealth served patients from April 2004 through December 2005. XLHealth ended its participation following CMS’s decision in fall 2005 to terminate XLHealth’s contract because it had not adhered to operational protocols. CorSolutions, whose service area was Louisiana, served patients from June 2004 through April 2006. It withdrew from the demonstration because it could not function as planned due to the effects of Hurricane Katrina. (The period included in the evaluation ends in August 2005, when Katrina destroyed the health care system in New Orleans. CorSolutions did continue to provide services for humanitarian purposes, however, under a revised compensation agreement with CMS.) CorSolutions/Matria Healthcare and HeartPartners/UnitedHealth reimbursed CMS the amounts due in April and August 2007, respectively, whereupon CMS released the escrow funds to them. CMS is still in discussions with XLHealth regarding the final settlement of the amount due.
CMS contracted with Mathematica Policy Research, Inc. (MPR) to conduct the
demonstration evaluation, which included an implementation analysis and an impact analysis based on the random assignment design. The goals of the impact analysis were to assess the impacts of the demonstration programs on enrollees’ Medicare expenditures, access to prescription drugs, health outcomes, receipt of health education, health behaviors, and quality of care. The goals of the implementation analysis were to provide a detailed description of how the programs were implemented and to provide context for and complement the quantitative findings. The evaluation used several data sources: (1) site visits and telephone interviews by MPR with program staff; (2) documents from the demonstration programs; (3) program-submitted data on the frequency, content, and mode of contacts with patients and physicians; (4) program-submitted data on indicators of quality of care; (5) surveys of treatment and control group patients and of physicians of treatment group patients conducted by MPR; and (6) Medicare enrollment and claims data.7 The patients and physicians of the CorSolutions program were not surveyed because of its slow initial enrollment and then the occurrence of Hurricane Katrina in August 2005.
Figure 1 illustrates (1) the general pathway through which the interventions might be
expected to lead to impacts, and (2) the many measures along the pathway that the evaluation
7 Note that the scope of the independent evaluation did not include independent auditing or verification of
program documents or statements by program staff, program-submitted data on contacts with enrollees, or program-submitted data on quality of care indicators.

6
Note: The italicized text lists measures relevant to the concepts in the boxes and that the evaluation collected and analyzed. Unless otherwise specified, measures were available for both treatment and control group members and comparisons thus represented demonstration impacts. TG refers to measures that were available for treatment group members only. Text in parentheses describes the source of data for the measure. “psd” denotes program-submitted data.
Non-Cost and Use Outcome Measures
Follow-up patient contacts by nurse disease managers for:
Monitoring TG:frequency/intensity (psd)
Patient education TG: frequency/intensity (psd)
Service arrangement and care coordination TG: frequency/intensity (psd)
Collection of follow-up clinical data for disease management and the evaluation TG: data quality and completeness (psd)
Increased recommended disease specific services (e.g. eye examinations for diabetes, blood tests for lipids for diabetes and CAD)
Rates of use (claims)
Increased receipt of specific services and higher ratings of quality of those services (e.g., arranging payment for noncovered services, helping make appointments with specialists or therapy services)
Self-reported ratings and receipt of services (patient survey)
High global satisfaction with program services
TG: reported perceptions (patient and physician surveys)
Increased general preventive services (e.g., colon cancer screening)
Rates of use (claims)
Decrease in potentially preventable hospitalizations and complications (general and disease-specific)
Rates (claims)
Initial assessments TG: timeliness (psd)
Collection of baseline clinical data for disease management and the evaluation
TG: data quality and completeness (psd)
Improved functioning and health-related quality of life
Self-reported measures (patient survey)
Reduction in Medicare service use and costs
Rates of service use, mean numbers of services, dollars (claims)
Increased use of recommended medications (e.g., ACE inhibitors for CHF patients)
TG: pre-post comparison (psd)
Improved clinical measures (e.g., blood pressure, blood test results)
TG: pre-post comparison (psd)
Decrease in mortality
Rates (administrative data)
Increased access to drugs
Self-reported access (patient survey)
Nurse disease manager interactions with physicians
TG: frequency/intensity (psd)
Provision of telemonitoring equipment
TG: proportion provided (psd)
Other health care processes, e.g.--
Reducing polypharmacy
Increasing adherence to guidelines
More timely alerts of patient deterioration
Closer monitoring and follow-up patients
TG: physician perceptions (physician surveys)
Program Activities and Services Process Measures
Coverage of prescription drugs by demonstration drug benefit
TG: use of drug benefit (program drug claims)
Increased patient education and knowledge
Self-reported receipt of education (patient survey)
Self-rated knowledge (patient survey)
TG: perceived patient knowledge (physician survey)
Cost and Use Outcome Measures
FIGURE 1
LOGIC MODEL FOR DEMONSTRATION OUTCOMES

7
analyzed. This report generally follows the progression shown in Figure 1, starting with descriptions of the programs’ original designs and their experiences enrolling beneficiaries. It then describes the actual services and benefits provided to enrollees and goes on to present results for the process and outcome measures. Given the importance of budget neutrality for this demonstration, however, the results for program impacts on Medicare service use and expenditures (shown on the far right of Figure 1) are presented in this report before the results for non-cost and use outcome measures (hypothesized to come earlier than service use and cost effects in the logic model of Figure 1). Some of the measures, such as patient and physician perceptions of the disease managers and pre- and post-values of clinical indicators, were collected only in the treatment group. The key outcome measures, however, were assessed for both treatment and control group participants and observed differences between the groups on these measures are presented as unbiased estimates of the true demonstration impacts. Statistical tests were conducted on all treatment-control differences to identify those that were greater than might be expected by chance, and therefore likely due to the programs.
PLANNED AND REPORTED APPROACHES OF THE THREE DEMONSTRATION PROGRAMS
Descriptions of the demonstration programs’ interventions are somewhat limited for CorSolutions and XLHealth because they are based only on program documents and information obtained during MPR’s initial site visit that took place about six months after services began. The initial visit focused more on the programs’ plans than on what they were actually doing, because the visit occurred shortly after startup. Of the second, or follow-up, site visits originally planned for all three programs, only the one to HeartPartners was completed. The other two programs terminated before their second visits were due. The discussion below distinguishes between what was reported and what was planned. Table 2 provides an overview of the programs’ original designs and reported early activities.8
The HeartPartners program served beneficiaries with CHF living in Arizona or California.9
It reported that its patient intervention included (1) disease management services (such as patient assessment, education, and followup) provided by telephone by registered nurses (supplemented with telephonic nurse case management for patients with more complex needs); (2) twice-daily use of a home monitor that transmitted weights and self-reported symptoms from patients to program staff; and (3) periodic ambulatory ischemia monitoring for at-risk patients. Disease managers reportedly sent updates on patient status to physicians regularly and when urgent health issues (such as worsening CHF symptoms) arose. The program said that it provided physicians with evidence-based recommendations to help in clinical decision making.
8 As laid out in program documents, described by program staff, or recorded in the data that programs submitted to the evaluation.
9 CMS permitted HeartPartners to add Arizona to its service area shortly after the program started to increase its chances of reaching its recruitment target.

8
TABLE 2
PLANNED AND REPORTED FEATURES OF PROGRAMS IN THE MEDICARE DISEASE MANAGEMENT DEMONSTRATION
Program Feature HeartPartners XLHealth CorSolutions Geographic Location Arizona and California (all counties) Texas (35 counties) Louisiana (22 parishes) Diagnoses of Patients Served
CHF Diabetes -- CHF and diabetes -- -- CAD -- --
Criteria for Severity of Illness
CHF Self-reported limitations meeting NYHA class III or IV criteria
Self-reported limitations meeting NYHA class III or IV criteria
NYHA class III or IV as indicated by hospitalization
Diabetes -- Lower-extremity complication (e.g., neuropathy, wounds, or amputation) or CAD
Self-reported health poor
CAD -- -- Self-reported health poor Criteria for Prior Health Service Use Hospital stay with primary or secondary
diagnosis of CHF in past 12 months For CHF: Hospital stay with CHF as primary diagnosis in past 12 months. For diabetes: two or more inpatient stays for diabetes in past 12 months, or two or more outpatient claims for diabetes in past 12 months.
Hospital stay with CHF, CAD, or diabetes as primary diagnosis in past 60 days (later revised to past 12 months)
Program Organizational Structurea
Consortium of organizations formed for the demonstration: PacifiCare: Insurer. Program host,
oversight, complex case management
QMed: Disease management provider. Physician enrollment, chart abstraction, clinical recommendations, ischemia monitoring
Alere: Disease management provider. Patient enrollment, disease management
Disease management provider firm with several subcontracted firms: IntelliCare: provides call center coach
nurses Nursefinders: provides nurses to conduct
in-person patient assessments
OmniCare: provides pharmacists for patient education on drugs
CardioCom: provides remote monitoring equipment for patients with CHF
PlanIt: design of promotional materials, marketing and public relations for demonstration
Disease management provider firm

9
TABLE 2 (continued)
Program Feature HeartPartners XLHealth CorSolutions Organizational Structure (cont.) a Information
Builders: create intranet-based tools (XLCare, see below) for XLHealth staff
Main Approaches in Patient Intervention
Patient assessment Telephonic by registered nurses In-person and telephonic health assessment by registered nurses
Telephonic by registered nurses
Patient monitoring Telephonic by registered nurses
Disease management system/database called NurseStation QMed On-line Health Management System (OHMS) compares patient’s physician’s treatment to evidence-based guidelines Not assigned to any particular nurse disease manager (call is made by an available nurse when patient is to be contacted) No formal risk stratification but prioritization by NurseStation of daily list of patients to be called Nurse case management for patients with more complex needs Twice-daily use of a home monitoring device by patients to transmit weights and self-reported symptoms to program staff Periodic ambulatory ischemia monitoring for patients at risk for ischemic heart disease
Telephonic and in person by registered nurses Chronic care management software system called XLCare Assigned to a team consisting of a fixed group of registered nurses (assessment nurse, coach nurse, and care manager) Formal risk stratification of patients by XLCare, updated with each entry of new information Once-daily use by CHF patients of a home monitoring device to transmit weights and self-reported symptoms to program staff
Telephonic by registered nurses Disease management software called CorConnect, to guide nurses’ conversations with patients Assigned to one registered nurse disease manager No specific risk stratification or prioritization of patients
Patient education Telephonic instruction by registered nurses Telephonic instruction by registered
nurses Some telephonic instruction by registered pharmacists
Telephonic instruction by registered nurses

10
TABLE 2 (continued)
Program Feature HeartPartners XLHealth CorSolutions Interactions with Physicians
Regular updates 30 day communications for stable patients Quarterly patient updates by mail or fax Quarterly status reports and treatment recommendations generated by CorConnect
Patient health problems Faxed alert for urgent symptoms, such as breathlessness, with disease manager telephone followup to patient and to physician’s office if necessary Status report for problem that does not require immediate action within next 24 hours, such as depression
Nurse disease managers call physicians’ offices as needed
Nurse disease managers call physicians’ offices as needed
Decision support Provision of evidence-based
recommendations by OHMS after initial assessment and at least twice yearly
OmniCare doctorate-level pharmacists discuss evidence-based treatment with physicians as needed
Form letters to physicians if patient medication regimen is lacking a recommended drug
Payment to physicians $135 fee per enrolled patient per year $200 fee per beneficiary to review clinical
eligibility for demonstration $120 fee per enrolled patient for discussing first-year medication review with XLHealth staff $30 fee per enrolled patient for discussing quarterly reviews with XLHealth staff
None
Source: Information on proposed, intended, or stated program features from proposals submitted by programs to become demonstration sites, program documents, and
statements from program staff during site visit and telephone interviews. Many of the stated program features were not directly verifiable within the scope of the independent evaluation.
aEach program also had its own PBM, not listed here, except for XLHealth, for which OmniCare also served as the PBM in addition to providing pharmacists for patient education and medication review. CAD = coronary artery disease; CHF = congestive heart failure; NYHA = New York Heart Association; PBM = pharmacy benefits manager.

11
In the consortium of organizations that made up HeartPartners, PacifiCare Health Systems served as the program host, provided program oversight, and furnished complex case management services. QMed was responsible for physician enrollment, medical chart abstractions, and transmitting evidence-based clinical recommendations. Alere Medical was in charge of patient enrollment and disease management services.
XLHealth served beneficiaries with CHF alone, diabetes alone, or diabetes and CHF living
in one of 35 counties in Texas. XLHealth planned for its patient intervention to include (1) a health assessment conducted by a registered nurse, in person if possible; (2) disease management services provided both by telephone and in person, ideally by registered nurses; and (3) for patients with CHF, a home monitoring device that transmitted weights and self-reported symptoms to the program once a day. The program expected care managers to alert physicians immediately if urgent patient problems arose and provide physicians with quarterly patient updates and treatment recommendations.
The CorSolutions program served patients with CHF, CAD, or diabetes living in one of
22 parishes in Louisiana. (In June 2005, CMS permitted the program to focus its outreach on patients with CHF and, in August 2005, permitted it to expand its service area to the entire state of Louisiana.) The program’s patient intervention was to consist of disease management services provided by telephone by the registered nurse assigned to each patient. Because the program expected to teach and encourage patients to communicate directly with their physicians, disease managers’ direct contact with physicians was to be limited to emergency situations or questions about medications. The program did, however, plan to send physicians quarterly patient status reports, which contained treatment recommendations.
Each program developed its own eligibility criteria in response to the statutory requirement
that the demonstration serve beneficiaries with advanced stages of illness. All three programs defined advanced-stage CHF as a disease that limited patients’ ability to conduct daily activities or in which the symptoms were present even when the patient was resting. XLHealth defined advanced-stage diabetes as involving lower-extremity complications (such as neuropathy, wounds, or amputation) or CAD. CorSolutions defined advanced-stage CAD or diabetes as a disease that led the patient to rate his or her health as poor. Each program also required patients to have a hospital stay for the target condition (or, for XLHealth’s diabetic patients, at least two Medicare claims from providers other than laboratories) during a specified interval before enrolling (see Chen et al. [2007] for a complete list of each program’s eligibility criteria). In addition, CMS required that participants in all three programs (1) have Medicare Parts A and B, (2) have Medicare as primary payer, (3) not be enrolled in a managed care plan or another demonstration, and (4) not be using the Medicare hospice benefit.
Common Features in Programs’ Planned and Reported Approaches
All three programs’ disease management interventions were supposed to include assessing, following up with, and educating patients, as well as communicating with physicians. Each planned to use a sophisticated software system to guide program staff in these activities and provide reports to monitor enrollment and program operations (these systems had been developed previously for commercial clients). Assessments were to be embedded in the program
12
software and to cover a wide range of topics (such as medical history, diet, health habits, functional status, psychosocial background, and adherence knowledge and behavior). Each program planned to use experienced registered nurses to provide disease management services.
All the programs intended to provide patients with education on (1) how to adhere to
physicians’ recommendations about diet, exercise, taking medications, and self-monitoring of their condition; and (2) basic disease facts and how to manage their own care (for example, to schedule needed tests and preventive care). Program software was to guide this education and prompt staff to contact patients at appropriate intervals to monitor their symptoms and encourage needed lifestyle changes.
The programs all said they would provide patients’ physicians with reports comparing
patients’ clinical indicators and physicians’ treatment plans (including prescribed medications and suggestions for health-related behavior change) to evidence-based treatment guidelines, to give physicians “decision support tools” for future practice. (During the first year of operations, programs obtained treatment plans either directly from physicians or indirectly from information furnished by patients.) All three programs expected to try identifying the reasons for any hospitalizations that occurred, in order to reduce the likelihood of recurrences and to correct potential medication problems.
The programs’ prescription plans were similar. Each was based on a three-tiered formulary
that categorized generic medications in the lowest patient copayment tier and preferred brand-name medications in the next-highest tier. None of the plans limited the number of prescriptions a patient could fill or had a spending cap. All allowed patients to fill prescriptions either at retail outlets or through a mail-order service; the latter had lower copayments. All three programs contracted with large, experienced pharmacy benefits management firms (PBMs) to administer the demonstration prescription benefit.10
Key Differences in the Programs’ Planned and Reported Approaches
There also were a few noteworthy differences in how staff said their programs were implemented in the early months of operations. First, CorSolutions conducted most demonstration activities itself, XLHealth subcontracted many of its services to other firms,11 and HeartPartners, as noted, was a consortium of organizations, each with different responsibilities. Contracting out major activities may be more efficient, because programs can capitalize on specific organizational expertise or operate more flexibly in responding to ebbs and flows in
10 Express Scripts, Prescription Solutions, and OmniCare, Inc./PBM Plus were the PBMs for CorSolutions, HeartPartners, and XLHealth, respectively.
11 Some of the services provided to XLHealth by subcontractors included—locating potentially eligible beneficiaries for recruitment, marketing and branding, provision of remote monitoring equipment for patients with CHF, drug utilization reporting to XLHealth and enrollees physicians, provision of call center coach nurses, provision of field pharmacists to provide medication education, and provision of additional nurses to help conduct the in person initial assessments.

13
patient enrollment; however, it also requires additional layers of administration to coordinate and oversee their activities and share data. Contracting out services was consistent with XLHealth’s existing model for commercial health plans, and its data system was already designed to support the monitoring of contractors. In contrast, HeartPartners, as a new entity, had to develop a data system to provide oversight.
Second, how the programs said they would deploy and organize their disease management
staff varied. CorSolutions planned to assign each patient to his or her own telephone disease manager to help patients develop trusting relationships with staff. XLHealth said they would assign each patient to his or her own team consisting of several nurses. HeartPartners did not assign patients to any particular staff person or team. Furthermore, at CorSolutions and HeartPartners, one type of staff member (registered nurses called disease managers) was to be responsible for all disease management tasks. XLHealth was going to divide the tasks among several types of staff members (all still registered nurses, however): assessment nurses, (telephone) coach nurses, and care managers. XLHealth also reportedly arranged for pharmacists to provide education on medication adherence to patients who did not completely understand their prescriptions or who were taking many medications. These pharmacists were (1) employees of the PBM for the XLHealth demonstration and based in Pennsylvania, or (2) store pharmacists (“field pharmacists”) for retail drugstores in XLHealth’s service area in Texas. They were to educate patients by telephone or in person, respectively.12
Third, only the XLHealth program had any in-person contact with patients. The other two
programs conducted their interventions entirely by telephone. XLHealth’s planned approach called for all initial assessments to be conducted in person. According to XLHealth, what it called its “high-touch model” was key to engaging patients and to its success in its contracts with commercial health plans.
Fourth, HeartPartners and XLHealth provided home telemonitoring equipment to their CHF
patients, while CorSolutions did not. Telemonitors included scales and devices that asked patients about symptoms of heart failure, and that with a press of a button, transmitted the weights and responses by telephone directly to program staff. Patients were to transmit information daily, and program staff called patients if values were outside preset ranges or if patients failed to transmit data as scheduled. The primary purpose of this equipment was to ensure that staff addressed symptom exacerbations before they became so serious that patients had to be hospitalized.
A final difference was in the use of risk stratification. XLHealth said they were going to
formally stratify patients into risk categories based on the probability of adverse outcomes, continuously update patients’ risk classifications, and use the risk categories to guide the intensity of the intervention. HeartPartners’ disease management software did not stratify patients but could use information on recent symptoms, hospitalizations, and comorbidities to prioritize the daily list of patients to be called by the disease managers according to their likely
12 According to XLHealth, these field pharmacists actually provided very little counseling during the demonstration, as the enrollees were too frail to travel to the retail pharmacies.
14
need for disease management services. CorSolutions planned no specific risk stratification or prioritization of patients, although the program’s disease management software was capable of helping the nurses to create customized care plans and track patients’ needs.
RECRUITMENT, ENROLLMENT, AND RETENTION
To aid in identifying potential enrollees, and at the programs’ request, CMS supplied the programs with lists of potentially eligible beneficiaries from Medicare “claims pulls.” Following a protocol developed for the demonstration, CMS compared diagnoses in each program’s eligibility criteria to diagnosis codes on Medicare claims data for 2002 and 2003. The resulting initial list of beneficiaries who appeared to meet the eligibility criteria according to the 2002–2003 Medicare claims data, along with their addresses as recorded in CMS administrative data, were then sent to the programs before their start-up dates. After the start of operations, CMS provided each program with a monthly update to identify new potentially eligible beneficiaries. CMS also generated lists of physicians who treated any of the identified beneficiaries, so that the programs could educate these physicians about the program and seek their support and referrals.
The three programs differed in how they used the CMS lists and in how they marketed
themselves to beneficiaries. HeartPartners and XLHealth conducted outreach that primarily targeted the beneficiaries on CMS’s lists. First, the identified beneficiaries were mailed letters from CMS introducing the program and information packets describing it in detail. Program enrollment staff then telephoned beneficiaries to introduce the programs, explain random assignment, elicit participation, and obtain informed consent.
In contrast, during its first six months of operations, CorSolutions’ primary approach to
identifying eligible patients was to first enlist physicians and hospitals to refer patients to the program. The CorSolutions staff believed that recently hospitalized patients whose physicians already supported the program would benefit most from it. The program hired a regional director and three field staff, who had previously worked in its service area as nurses or in medical sales, to visit physicians and hospitals to recruit them as referral sources. It was more difficult than expected to enlist the providers’ support, however, and many referred patients were not eligible for the program. After six months, CorSolutions changed its procedure and began to approach the CMS-identified beneficiaries directly, while continuing to accept provider referrals. (HeartPartners and XLHealth also encouraged physicians and hospitals to refer patients to their programs, but this was not their primary approach.)
When each program’s enrollment staff telephoned beneficiaries to describe the program and
answer questions about it, the staff could screen beneficiaries for specific eligibility criteria and obtain informed consent from those who wished to participate. Staff from CorSolutions and HeartPartners reported that this screening proceeded as planned. Nonclinical staff from these two programs followed prepared scripts in asking beneficiaries about the severity of heart failure symptoms and other inclusion and exclusion criteria. XLHealth had proposed to screen beneficiaries during enrollment, had laid out plans to do so in its operational protocol, and had developed screening questions for its enrollment survey. However, after discovering that its nonclinical enrollment staff were having difficulty getting accurate diagnostic information from

15
beneficiaries (particularly regarding cancer, one of XLHealth’s exclusion criteria), it decided not to screen patients and relied solely on the CMS claims pulls to determine eligibility. XLHealth made this major change in its protocol without first consulting or obtaining approval from CMS. All three programs forwarded the names and other intake data of beneficiaries who consented to participate to MPR for random assignment.
Enrollment Experiences
Staff at all three programs described encountering unanticipated difficulties with enrollment. First, it was more difficult than expected to communicate the purpose and features of the program to beneficiaries. Because each program included a pharmacy benefit, many confused that benefit with the Medicare prescription drug discount card or with the forthcoming Medicare Part D drug benefit. Some thought the program sounded “too good to be true” and assumed it was fraudulent. (Furthermore, when beneficiaries skeptical of the programs’ legitimacy called Medicare’s toll-free telephone information line, operators were often unaware of the demonstration and could not allay their fears.) CorSolutions and XLHealth noted that their enrollment staff had to call beneficiaries many more times than expected. HeartPartners staff noted that many identified beneficiaries were unaware (or not ready to admit) that they had a chronic illness.
Second, all three programs experienced lower-than-expected participation among the
potentially eligible beneficiaries identified. XLHealth, which relied primarily on the CMS-generated lists to identify eligible patients, complained that the quality of the contact information on the lists was poor and that many of its mailings were returned. All three programs found that many patients initially identified were ultimately not eligible. XLHealth, which, as noted, did not screen most of its potential participants, did not discover this until well after it had already enrolled the patients. HeartPartners and CorSolutions discovered this before enrollment through their eligibility screening; they also found that consent rates among those eligible were low relative to their experiences with managed care enrollees. Finally, all three programs noted that the pharmacy benefit was not as big a draw to beneficiaries as expected. Between 40 and 65 percent of enrollees already had at least some prescription drug coverage when they enrolled.
Third, although all three programs recognized the value of physicians’ involvement and tried
to convince them to encourage their patients’ participation, the programs were ultimately only partially successful. The programs all made presentations at large physician conferences, visited physicians in their offices, and sent them program literature. XLHealth sought the endorsement of the Texas Medical Association and, after receiving it, advertised it in letters to all physicians. HeartPartners developed letters that physicians who directly referred patients to the program could send to those patients, encouraging them to enroll. As mentioned, CorSolutions eventually abandoned its original provider-focused strategy for a beneficiary-focused one, and the other two programs never stimulated much physician enthusiasm either.
The programs reported pursuing various strategies in trying to overcome the enrollment
challenges, and some of these strategies were quite creative. For example, CorSolutions took advantage of its experience as the Houston site for another similar CMS demonstration, the Medicare Coordinated Care Demonstration, by bringing in its manager for that program to help
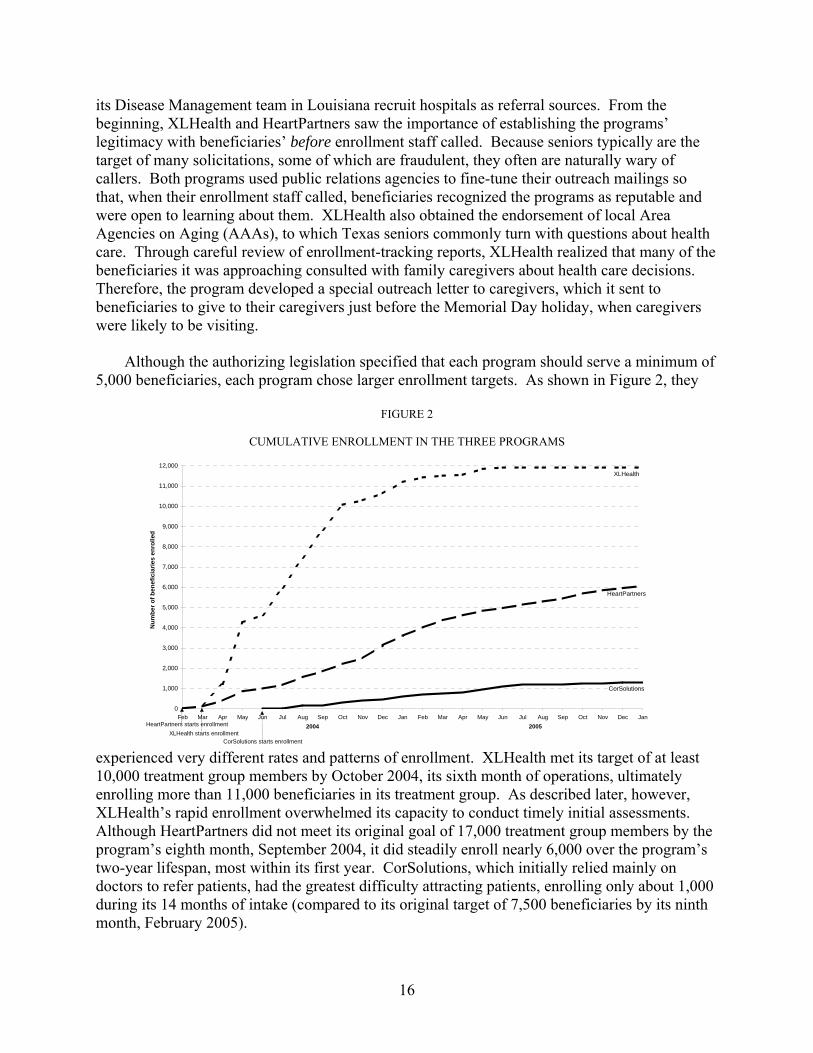
16
its Disease Management team in Louisiana recruit hospitals as referral sources. From the beginning, XLHealth and HeartPartners saw the importance of establishing the programs’ legitimacy with beneficiaries’ before enrollment staff called. Because seniors typically are the target of many solicitations, some of which are fraudulent, they often are naturally wary of callers. Both programs used public relations agencies to fine-tune their outreach mailings so that, when their enrollment staff called, beneficiaries recognized the programs as reputable and were open to learning about them. XLHealth also obtained the endorsement of local Area Agencies on Aging (AAAs), to which Texas seniors commonly turn with questions about health care. Through careful review of enrollment-tracking reports, XLHealth realized that many of the beneficiaries it was approaching consulted with family caregivers about health care decisions. Therefore, the program developed a special outreach letter to caregivers, which it sent to beneficiaries to give to their caregivers just before the Memorial Day holiday, when caregivers were likely to be visiting.
Although the authorizing legislation specified that each program should serve a minimum of
5,000 beneficiaries, each program chose larger enrollment targets. As shown in Figure 2, they
FIGURE 2
CUMULATIVE ENROLLMENT IN THE THREE PROGRAMS
experienced very different rates and patterns of enrollment. XLHealth met its target of at least 10,000 treatment group members by October 2004, its sixth month of operations, ultimately enrolling more than 11,000 beneficiaries in its treatment group. As described later, however, XLHealth’s rapid enrollment overwhelmed its capacity to conduct timely initial assessments. Although HeartPartners did not meet its original goal of 17,000 treatment group members by the program’s eighth month, September 2004, it did steadily enroll nearly 6,000 over the program’s two-year lifespan, most within its first year. CorSolutions, which initially relied mainly on doctors to refer patients, had the greatest difficulty attracting patients, enrolling only about 1,000 during its 14 months of intake (compared to its original target of 7,500 beneficiaries by its ninth month, February 2005).
0
1,000
2,000
3,000
4,000
5,000
6,000
7,000
8,000
9,000
10,000
11,000
12,000
Feb Mar Apr May Jun Jul Aug Sep Oct Nov Dec Jan Feb Mar Apr May Jun Jul Aug Sep Oct Nov Dec Jan
Num
ber o
f ben
efic
iarie
s en
rolle
d
2004 2005
CorSolutions
HeartPartners
XLHealth
HeartPartners starts enrollmentXLHealth starts enrollment
CorSolutions starts enrollment
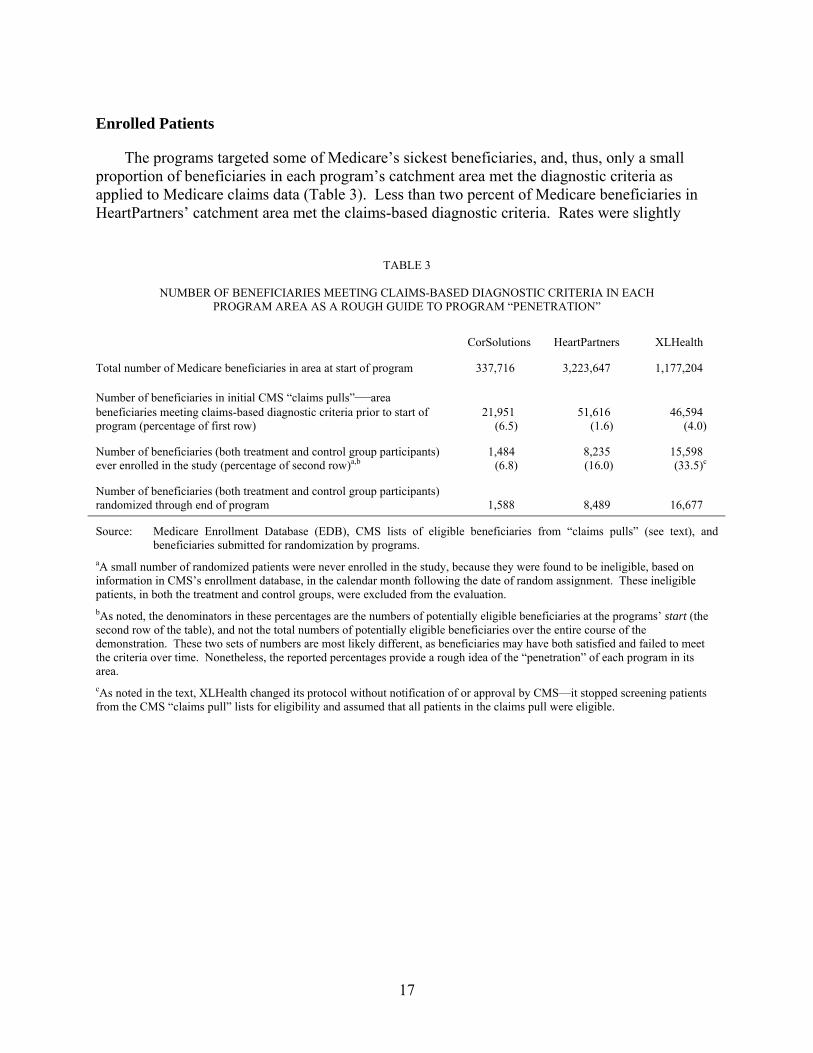
17
Enrolled Patients
The programs targeted some of Medicare’s sickest beneficiaries, and, thus, only a small proportion of beneficiaries in each program’s catchment area met the diagnostic criteria as applied to Medicare claims data (Table 3). Less than two percent of Medicare beneficiaries in HeartPartners’ catchment area met the claims-based diagnostic criteria. Rates were slightly
TABLE 3
NUMBER OF BENEFICIARIES MEETING CLAIMS-BASED DIAGNOSTIC CRITERIA IN EACH
PROGRAM AREA AS A ROUGH GUIDE TO PROGRAM “PENETRATION”
CorSolutions HeartPartners XLHealth
Total number of Medicare beneficiaries in area at start of program 337,716 3,223,647 1,177,204
Number of beneficiaries in initial CMS “claims pulls”—area beneficiaries meeting claims-based diagnostic criteria prior to start of program (percentage of first row)
21,951 (6.5)
51,616 (1.6)
46,594 (4.0)
Number of beneficiaries (both treatment and control group participants) ever enrolled in the study (percentage of second row)a,b
1,484 (6.8)
8,235 (16.0)
15,598 (33.5)c
Number of beneficiaries (both treatment and control group participants) randomized through end of program 1,588 8,489 16,677
Source: Medicare Enrollment Database (EDB), CMS lists of eligible beneficiaries from “claims pulls” (see text), and beneficiaries submitted for randomization by programs.
aA small number of randomized patients were never enrolled in the study, because they were found to be ineligible, based on information in CMS’s enrollment database, in the calendar month following the date of random assignment. These ineligible patients, in both the treatment and control groups, were excluded from the evaluation. bAs noted, the denominators in these percentages are the numbers of potentially eligible beneficiaries at the programs’ start (the second row of the table), and not the total numbers of potentially eligible beneficiaries over the entire course of the demonstration. These two sets of numbers are most likely different, as beneficiaries may have both satisfied and failed to meet the criteria over time. Nonetheless, the reported percentages provide a rough idea of the “penetration” of each program in its area. cAs noted in the text, XLHealth changed its protocol without notification of or approval by CMS—it stopped screening patients from the CMS “claims pull” lists for eligibility and assumed that all patients in the claims pull were eligible.

18
higher but still small for XLHealth (four percent) and CorSolutions (less than seven percent). Of these eligible beneficiaries, the proportions enrolling in the demonstration during each program’s lifetime were 7, 16, and 34 percent for CorSolutions, HeartPartners and XLHealth respectively. An interim analysis of beneficiaries enrolled through December 2004 showed that participants across the three programs were not markedly or consistently different from potentially eligible nonparticipants on numbers of conditions and Medicare payments during the 12 months before enrollment (not shown; Brown et al. 2005). However, they may have differed substantially on other, unmeasured criteria.
Randomization produced treatment and control groups with very similar characteristics, as
expected, and the demonstration enrolled severely ill beneficiaries as required (Table 4). About half of participants in each program were treated for 5 or more of the 11 chronic conditions measured with claims data during the two years before enrollment. As expected, high proportions of participants in each program had been treated in the year before enrollment for the target conditions of CHF (79 to 94 percent), CAD (84 to 87 percent), and diabetes (53 to 79 percent), and more than 80 percent of participants had been treated for two or all three of these conditions (data not shown). Sizable proportions had also been treated in the two years before enrollment for cancer (21 to 32 percent), and dementia or Alzheimer’s disease (13 to 21 percent). Participants had high previous expenditures—34 to 39 percent of participants had monthly Medicare expenditures over $2,000, and 20 to 22 percent of participants had monthly expenditures over $3,000 (compared to the national average of roughly $500 per month for noninstitutionalized beneficiaries).
The majority of CorSolutions and HeartPartners patients (65 and 57 percent, respectively)
described their health as fair or poor, a much higher proportion than beneficiaries nationally (30 percent, according to the Medicare Current Beneficiary Survey). Only slightly more than a third of XLHealth patients said their health was fair or poor, although their preenrollment Medicare expenditures and number of chronic diagnoses were not lower than those of patients of the other two programs. The percentage of beneficiaries age 85 or older enrolling in the programs (14 to 17 percent, not shown in Table 4) was higher than the 11 percent in the general Medicare population (MCBS Project 2006).
Nearly 30 percent of the CorSolutions enrollees and 16 percent of the XLHealth enrollees
were black. In addition, roughly 13 percent of the XLHealth patients were in the Asian/Other category, and about 11 percent were of Hispanic ethnicity. All the programs had substantial proportions of beneficiaries whose original reason for Medicare entitlement was disability (23 to 30 percent), and of dually eligible beneficiaries (around 24 to 32 percent). Roughly two-thirds of patients in each program (slightly higher among XLHealth patients) were overweight, and about half of the overweight patients were obese.13 Across all programs, the patients had seen an average of 17 different providers for Medicare covered services in the year before enrollment (including medical and osteopathic doctors, clinical psychologists, clinical social workers, physician assistants, nurse practitioners, chiropractors, dentists, podiatrists and optometrists).
13 Body mass index was calculated from self-reported height and weight collected by the programs at intake.

19
TABLE 4
PREENROLLMENT CHARACTERISTICS OF TREATMENT AND CONTROL GROUP PATIENTS RANDOMLY ASSIGNED TO THE DEMONSTRATION THROUGH ALL PROGRAM MONTHS AND INCLUDED IN THE RESEARCH SAMPLE
(Percentages, Unless Otherwise Noted)
CorSolutions HeartPartners XLHealth
Treatment Control Difference Treatment Control Difference Treatment Control Difference
Demographic Characteristics
Age at Enrollment Average age (in years) 74.1 74.7 -0.6 75.6 75.3 0.3 75.1 75.1 -0.0 Younger than 65 13.9 11.9 2.0 10.4 11.3 -0.9 9.1 8.9 0.2 65 to 80 53.6 54.0 -0.4 51.1 52.0 -0.9 58.3 59.3 -1.0 Older than 80 32.5 34.1 -1.6 38.5 36.7 1.8 32.5 31.8 0.7
Male 38.9 39.8 -0.9 49.5 49.5 -0.0 41.9 42.6 -0.7 Race
White 69.2 71.6 -2.4 85.3 84.9 0.4 71.4 71.7 -0.3 Black 29.9 28.2 1.7 8.4 9.4 -0.9 16.0 15.5 0.4 Asian or Othera 0.9 0.3 0.6 6.2 5.7 0.5 12.6 12.7 -0.1
Hispanic Ethnicity 0.5 0.3 0.2 3.0 2.6 0.5 10.8 10.7 0.2 Original Reason for Medicare: Disabled 29.9 29.5 0.4 24.1 25.1 -1.0 22.7 22.8 -0.1 State Buy-In for Medicare Part A or Part B (Proxy for Medicaid Coverage)b 32.1 29.5 2.6 23.7 25.2 -1.5 31.4 31.1 0.3 Body Mass Index at Enrollmentc,d
Underweight (below 18.5) 3.8 2.8 1.0 3.1 3.2 -0.1 2.3 2.6 -0.3 Normal (18.5 to 24.9) 28.4 25.1 3.3 32.1 31.9 0.2 26.4 27.0 -0.6 Overweight (25.0 to 29.9) 31.4 30.7 0.6 31.2 32.2 -1.0 32.9 32.6 0.2 Obese (30.0 and above) 36.5 41.3 -4.9 33.7 32.8 0.9 38.4 37.7 0.7 Mean Body Mass Index 28.8 30.0 -1.1** 28.6 28.6 -0.1 29.4 29.2 0.2
Had Previous Prescription Drug Coveraged 44.0 49.1 -5.1* 70.6 70.8 -0.2 62.3 63.2 -0.8
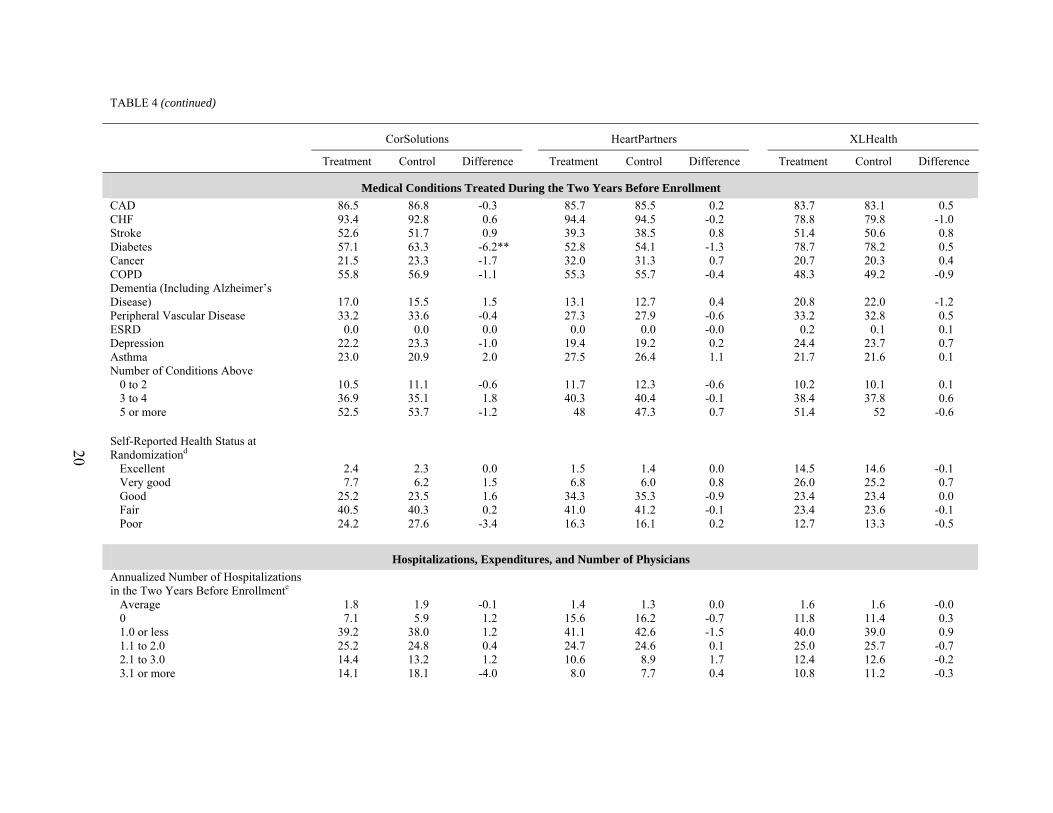
20
TABLE 4 (continued)
CorSolutions HeartPartners XLHealth
Treatment Control Difference Treatment Control Difference Treatment Control Difference
Medical Conditions Treated During the Two Years Before Enrollment CAD 86.5 86.8 -0.3 85.7 85.5 0.2 83.7 83.1 0.5 CHF 93.4 92.8 0.6 94.4 94.5 -0.2 78.8 79.8 -1.0 Stroke 52.6 51.7 0.9 39.3 38.5 0.8 51.4 50.6 0.8 Diabetes 57.1 63.3 -6.2** 52.8 54.1 -1.3 78.7 78.2 0.5 Cancer 21.5 23.3 -1.7 32.0 31.3 0.7 20.7 20.3 0.4 COPD 55.8 56.9 -1.1 55.3 55.7 -0.4 48.3 49.2 -0.9 Dementia (Including Alzheimer’s Disease) 17.0 15.5 1.5 13.1 12.7 0.4 20.8 22.0 -1.2 Peripheral Vascular Disease 33.2 33.6 -0.4 27.3 27.9 -0.6 33.2 32.8 0.5 ESRD 0.0 0.0 0.0 0.0 0.0 -0.0 0.2 0.1 0.1 Depression 22.2 23.3 -1.0 19.4 19.2 0.2 24.4 23.7 0.7 Asthma 23.0 20.9 2.0 27.5 26.4 1.1 21.7 21.6 0.1 Number of Conditions Above
0 to 2 10.5 11.1 -0.6 11.7 12.3 -0.6 10.2 10.1 0.1 3 to 4 36.9 35.1 1.8 40.3 40.4 -0.1 38.4 37.8 0.6 5 or more 52.5 53.7 -1.2 48 47.3 0.7 51.4 52 -0.6
Self-Reported Health Status at Randomizationd
Excellent 2.4 2.3 0.0 1.5 1.4 0.0 14.5 14.6 -0.1 Very good 7.7 6.2 1.5 6.8 6.0 0.8 26.0 25.2 0.7 Good 25.2 23.5 1.6 34.3 35.3 -0.9 23.4 23.4 0.0 Fair 40.5 40.3 0.2 41.0 41.2 -0.1 23.4 23.6 -0.1 Poor 24.2 27.6 -3.4 16.3 16.1 0.2 12.7 13.3 -0.5
Hospitalizations, Expenditures, and Number of Physicians
Annualized Number of Hospitalizations in the Two Years Before Enrollmente
Average 1.8 1.9 -0.1 1.4 1.3 0.0 1.6 1.6 -0.0 0 7.1 5.9 1.2 15.6 16.2 -0.7 11.8 11.4 0.3 1.0 or less 39.2 38.0 1.2 41.1 42.6 -1.5 40.0 39.0 0.9 1.1 to 2.0 25.2 24.8 0.4 24.7 24.6 0.1 25.0 25.7 -0.7 2.1 to 3.0 14.4 13.2 1.2 10.6 8.9 1.7 12.4 12.6 -0.2 3.1 or more 14.1 18.1 -4.0 8.0 7.7 0.4 10.8 11.2 -0.3

21
TABLE 4 (continued)
CorSolutions HeartPartners XLHealth
Treatment Control Difference Treatment Control Difference Treatment Control Difference Medicare Expenditures per Month in FFS During the Two Years Before Enrollment for:
Total Part A $1,320 $1,368 -$48 $1,307 $1,239 $68 $1,285 $1,296 -$11 Total Part B $746 $761 -$15 $661 $632 $29* $800 $807 -$6 Total Expenditures $2,066 $2,129 -$63 $1,967 $1,870 $97* $2,086 $2,103 -$17
Medicare Expenditures per Month in FFS During the Two Years Before Enrollment
$0 to $500 13.5 12.9 0.6 18.5 19.8 -1.3 16.3 15.6 0.7 $501 to $1,000 17.5 22.0 -4.5 19.2 19.8 -0.6 18.2 18.7 -0.4 $1,001 to $2,000 30.6 25.1 5.6 26.2 26.7 -0.5 27.1 26.8 0.3 $2,001 to $3,000 16.8 16.8 -0.0 15.4 14.7 0.7 16.5 16.3 0.2 More than $3,000 21.2 23.3 -2.0 20.6 19.0 1.5 21.9 22.6 -0.7
Average Number of Physicians Billed in the Year Before Enrollmentg 18.3 18.7 -0.4 17.2 16.8 0.4 16.6 16.6 -0.0
Sample Size 1,097 387 5,890 2,345 11,178 4,420 Source: Medicare Enrollment Database (EDB), National Claims History File, Standard Analytic File, and program intake data. Notes: Enrollment in the study for evaluation purposes begins on the first day of the month following the month of random assignment. Treatment and control group members
who did not meet the demonstration-wide requirements of CMS or were dead at the time of enrollment are excluded from this table. Members of the same households as the research sample members are also excluded. Demonstration-wide eligibility requirements at the time of enrollment included (1) enrolled in fee-for-service Medicare, (2) eligible for Part A and Part B Medicare, (3) Medicare is the primary payer, (4) does not reside in a nursing home, (5) not in hospice care, and (6) not classified as having ESRD. During the follow-up period, patient observations are truncated in the first month that they fail to meet any of these eligibility criteria, or have an organ transplant or move from the program’s service area. (XLHealth did not exclude patients who developed ESRD or moved into a nursing home during the follow-up period but did exclude them at enrollment.)
a“Other” includes North American Native and other races. b“State buy-in” is a proxy for whether the beneficiary is also enrolled in Medicaid, because state Medicaid programs typically pay the Medicare Part B premium for their Medicaid enrollees who are also eligible for Medicare. However, some beneficiaries for whom the state buys in do not have full Medicaid coverage (QMBs and SLMBs), and some states do not buy in for some Medicare beneficiaries who do have full Medicaid coverage, depending on their type of eligibility (e.g., for those who are eligible for Medicaid as a result of spending down their assets). cNational Center for Chronic Disease Prevention and Health Promotion website definition: Body mass index (BMI) = [weight (lb.) ÷ height (in.)2] × 703: below 18.5 is “underweight”; 18.5 to 24.9 is “normal”; 25.0 to 29.9 is “overweight”; 30.0 and above is “obese.”

22
TABLE 4 (continued)
_______________________________________________________________________________________________________________________________________________
dCalculated from data collected by the programs before randomization. eCalculated as 12 × (number of hospitalizations during two years before month of enrollment) ÷ (number of months eligible). For example, if a beneficiary was eligible all 24 months and had two hospitalizations during that time, that beneficiary would have one hospitalization per year [(12 × 2) ÷ 24]. If another beneficiary was eligible eight months during the previous two years and had two hospitalizations during those eight months, that beneficiary would have [(12 × 2) ÷ 8], or three hospitalizations per year. fThe quartile is calculated for the combined treatment and control groups in each year. gCalculated as the number of unique physician identification numbers. *Difference between the treatment and control groups is significantly different from 0 at the 0.10 level, two-tailed t-test for simple comparisons of group means. **Difference between the treatment and control groups is significantly different from 0 at the 0.05 level, two-tailed t-test for simple comparisons of group means. ***Difference between the treatment and control groups is significantly different from 0 at the 0.01 level, two-tailed t-test for simple comparisons of group means. †Difference between treatment and control group distributions is significantly different from 0 at the 0.10 level, chi-squared test. ††Difference between treatment and control group distributions is significantly different from 0 at the 0.05 level, chi-squared test. †††Difference between treatment and control group distributions is significantly different from 0 at the 0.01 level, chi-squared test. CAD = coronary artery disease; CHF = congestive heart failure; COPD = chronic obstructive pulmonary disease; ESRD = end stage renal disease; FFS = fee-for-service.

23
Roughly a third of HeartPartners and XLHealth patients reported having no prescription drug coverage when they enrolled, only moderately higher than the 25 percent of all Medicare beneficiaries without prescription drug coverage in 2003 (Safran et al. 2005). In contrast, 56 percent of CorSolutions patients reported having no drug coverage. CorSolutions staff believed that physicians, who were the program’s primary source of patient referrals in its first half year, tended to refer patients who lacked prescription drug coverage. Indeed, according to the program’s intake data, the proportion of patients without drug coverage at enrollment fell over the life of the CorSolutions program as it increasingly used the CMS lists as its primary approach to identifying patients.
With two exceptions, the characteristics of patients the programs enrolled did not change.
First, in addition to the increasing proportion of CorSolutions patients with drug coverage mentioned above, HeartPartners’ earliest patients also had lower rates of drug coverage than later enrollees. This may have been due to an increase in patients with the Medicare drug discount cards, which first became available in June 2004. Second, the proportion of enrollees in XLHealth reporting CHF as their primary diagnosis grew substantially, while the proportion with diabetes fell.
Disenrollment and Inactivation
Treatment group patients left the programs either through disenrollment or inactivation. Disenrollment refers to patients who died or no longer met demonstration eligibility requirements (for example, by joining a Medicare Advantage plan, developing end-stage renal disease, or entering a hospice program). Inactivation refers to patients who asked to leave the programs or whom the programs themselves could not contact or felt they could not help. Programs were not paid for disenrolled or inactivated patients. However, inactivated treatment group patients remained in the evaluation, even after they were inactivated, to preserve the “intent to treat” design. Disenrolled patients in both the treatment and control groups were excluded from the study after disenrollment.
Substantial fractions of treatment group patients were disenrolled from the three programs
during their periods of operation: 14 percent for CorSolutions, 22 percent for HeartPartners, and 25 percent for XLHealth (Table 5). The main reason for disenrollment among all three programs was death. Other common reasons included joining a Medicare managed care plan or entering hospice care. (Disenrollment rates and reasons were similar for control group members, data not shown.) Compared to those who remained enrolled, disenrolled patients were more likely to have reported at intake that their health was only fair or poor and to have had much higher preenrollment costs. In all three programs, rates of disenrollment were lower for later enrollees than for early ones. This was mainly because of lower mortality rates among the later enrollees who had shorter follow-up periods and because the programs also enrolled fewer terminally ill patients later on, as they came to believe that very ill patients benefited less from disease management services.
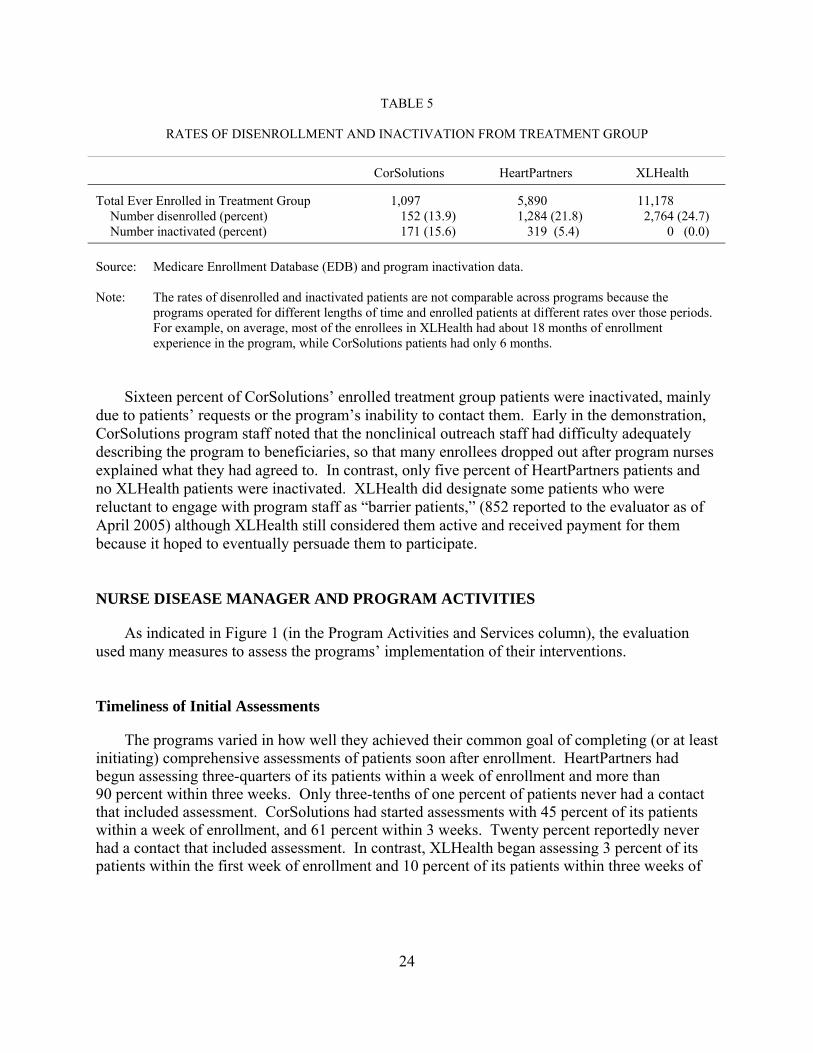
24
TABLE 5
RATES OF DISENROLLMENT AND INACTIVATION FROM TREATMENT GROUP
CorSolutions HeartPartners XLHealth
Total Ever Enrolled in Treatment Group 1,097 5,890 11,178 Number disenrolled (percent) 152 (13.9) 1,284 (21.8) 2,764 (24.7) Number inactivated (percent) 171 (15.6) 319 (5.4) 0 (0.0)
Source: Medicare Enrollment Database (EDB) and program inactivation data. Note: The rates of disenrolled and inactivated patients are not comparable across programs because the
programs operated for different lengths of time and enrolled patients at different rates over those periods. For example, on average, most of the enrollees in XLHealth had about 18 months of enrollment experience in the program, while CorSolutions patients had only 6 months.
Sixteen percent of CorSolutions’ enrolled treatment group patients were inactivated, mainly
due to patients’ requests or the program’s inability to contact them. Early in the demonstration, CorSolutions program staff noted that the nonclinical outreach staff had difficulty adequately describing the program to beneficiaries, so that many enrollees dropped out after program nurses explained what they had agreed to. In contrast, only five percent of HeartPartners patients and no XLHealth patients were inactivated. XLHealth did designate some patients who were reluctant to engage with program staff as “barrier patients,” (852 reported to the evaluator as of April 2005) although XLHealth still considered them active and received payment for them because it hoped to eventually persuade them to participate.
NURSE DISEASE MANAGER AND PROGRAM ACTIVITIES
As indicated in Figure 1 (in the Program Activities and Services column), the evaluation used many measures to assess the programs’ implementation of their interventions.
Timeliness of Initial Assessments
The programs varied in how well they achieved their common goal of completing (or at least initiating) comprehensive assessments of patients soon after enrollment. HeartPartners had begun assessing three-quarters of its patients within a week of enrollment and more than 90 percent within three weeks. Only three-tenths of one percent of patients never had a contact that included assessment. CorSolutions had started assessments with 45 percent of its patients within a week of enrollment, and 61 percent within 3 weeks. Twenty percent reportedly never had a contact that included assessment. In contrast, XLHealth began assessing 3 percent of its patients within the first week of enrollment and 10 percent of its patients within three weeks of

25
enrollment; 13 percent reportedly never had a contact that included assessment.14 XLHealth staff noted that they enrolled so many patients so quickly that the program could not keep up with its plan to assess patients within 10 days of enrollment, despite supplementing its staff with per-diem nurses from home health and temporary agencies. Figure 3 shows the distribution of patients by time periods until initial assessment for the three programs. As time went on, all three programs improved the timeliness of their assessments. CorSolutions made the greatest improvement, increasing the proportion of patients assessed within a week of enrolling from 14 to 55 percent (data not shown).
The CorSolutions and HeartPartners programs conducted assessments entirely by telephone.
XLHealth staff said that they usually started assessments over the telephone (by either nonclinical welcome staff or nurses) but then for frailer patients, would have nurses complete the assessments in person. However, the evaluator was unable to confirm this through the data submitted by XLHealth because of the way assessment contacts were coded. According to the data, only two percent had first-assessment contacts in person.15
Follow-Up Patient Contacts by Nurse Disease Managers
Disease managers at all three programs followed patients regularly by telephone, monitoring symptoms and health status, providing education, assessing the need for support services, and offering emotional support. As mentioned, HeartPartners and XLHealth offered home telemonitoring equipment to their CHF patients to provide staff with early warnings of disease exacerbations before they became serious or, if a patient did not send data on two consecutive days, a possible indication of hospitalization. During the first 10 months of operations,
14 For HeartPartners and XLHealth, patients without assessment contacts were most likely the ones whom the programs never engaged (that is, patients who may have originally agreed to participate but then never responded to the nurses’ calls or refused to answer assessment questions), as the percentages of patients without any contacts and the percentages of patients without any assessment contacts are quite close for the two programs. For the CorSolutions program, however, nearly all patients were contacted but only 80 percent were assessed. The reason for this discrepancy is unclear, but it may have been that the CorSolutions nurses felt they needed to build rapport with patients before starting the assessments (this was the only program that assigned each patient to his or her own nurse disease manager). Furthermore, unlike the other two programs, the CorSolutions staff only used the assessment code for contacts involving initial assessment activities (whereas the other two programs coded contacts involving initial assessments, routine follow-up assessments, and comprehensive reassessments all as assessment contacts).
15 Program staff were supposed to record activities and reasons for each patient contact, such as assessment, education, or monitoring. For contacts that involved assessment, there were no additional codes available for describing the exact type of assessment (for example initial assessment, routine follow-up assessment, or comprehensive reassessment). The evaluator thus identified initial assessment contacts as first contacts that included assessment. For XLHealth the initial assessment contact was usually a telephone call made by (non-clinical) marketing staff that included a few items from the program’s assessment tool. There was thus no way to tell whether subsequent assessment contacts by XLHealth that included in-person visits were part of the initial assessment or part of routine follow up assessment or comprehensive reassessment. The initial telephone calls coded as assessment contacts greatly outnumbered any in person assessment contacts the program conducted.
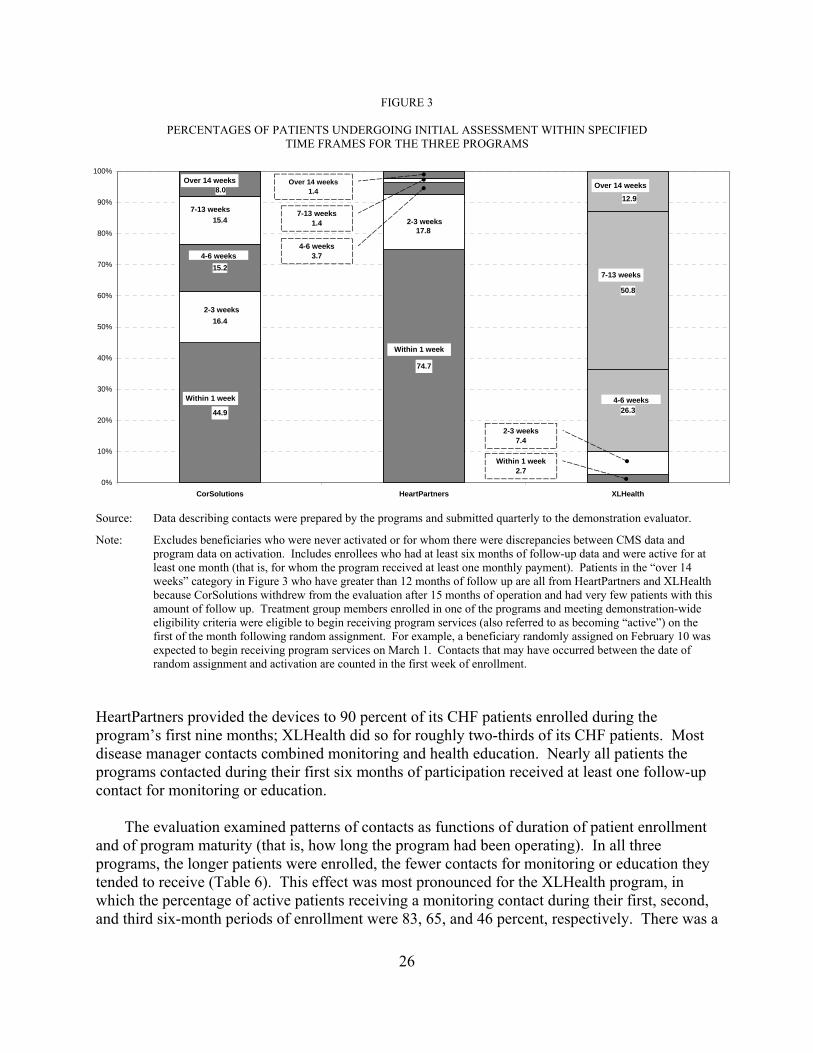
26
FIGURE 3
PERCENTAGES OF PATIENTS UNDERGOING INITIAL ASSESSMENT WITHIN SPECIFIED TIME FRAMES FOR THE THREE PROGRAMS
Source: Data describing contacts were prepared by the programs and submitted quarterly to the demonstration evaluator.
Note: Excludes beneficiaries who were never activated or for whom there were discrepancies between CMS data and program data on activation. Includes enrollees who had at least six months of follow-up data and were active for at least one month (that is, for whom the program received at least one monthly payment). Patients in the “over 14 weeks” category in Figure 3 who have greater than 12 months of follow up are all from HeartPartners and XLHealth because CorSolutions withdrew from the evaluation after 15 months of operation and had very few patients with this amount of follow up. Treatment group members enrolled in one of the programs and meeting demonstration-wide eligibility criteria were eligible to begin receiving program services (also referred to as becoming “active”) on the first of the month following random assignment. For example, a beneficiary randomly assigned on February 10 was expected to begin receiving program services on March 1. Contacts that may have occurred between the date of random assignment and activation are counted in the first week of enrollment.
HeartPartners provided the devices to 90 percent of its CHF patients enrolled during the program’s first nine months; XLHealth did so for roughly two-thirds of its CHF patients. Most disease manager contacts combined monitoring and health education. Nearly all patients the programs contacted during their first six months of participation received at least one follow-up contact for monitoring or education.
The evaluation examined patterns of contacts as functions of duration of patient enrollment
and of program maturity (that is, how long the program had been operating). In all three programs, the longer patients were enrolled, the fewer contacts for monitoring or education they tended to receive (Table 6). This effect was most pronounced for the XLHealth program, in which the percentage of active patients receiving a monitoring contact during their first, second, and third six-month periods of enrollment were 83, 65, and 46 percent, respectively. There was a
44.9 26.3
15.4
50.8
74.7
16.4
17.8
15.2
12.98.0
0%
10%
20%
30%
40%
50%
60%
70%
80%
90%
100%
CorSolutions HeartPartners XLHealth
Over 14 weeks
Within 1 week
Within 1 week
Within 1 week2.7
2-3 weeks7.4
7-13 weeks
2-3 weeks
2-3 weeks
7-13 weeks
4-6 weeks4-6 weeks
3.7
7-13 weeks1.4
Over 14 weeks1.4
4-6 weeks
Over 14 weeks

27
TABLE 6
FOLLOW-UP CONTACTS, BY TIME SINCE ENROLLMENT, FOR EVER ACTIVE PATIENTS
Months of Enrollment
1–6 7–12 13–18
CorSolutions (sample sizes) 478 150 -- Percentage of patients with at least one contact for routine follow-up monitoring 99.5 96.4 -- Percentage of patients with at least one contact for education 98.7 91.8 -- Mean number of follow-up contacts per active patient month 2.2 1.3 --
HeartPartners (sample sizes) 1,286 2,349 1,575 Percentage of patients with at least one contact for routine follow-up monitoring 100.0 99.7 98.9 Percentage of patients with at least one contact for education 99.3 99.1 98.3 Mean number of follow-up contacts per active patient month 4.5 3.5 3.4
XLHealth (sample sizes) 828 5,155 5,444 Percentage of patients with at least one contact for routine follow-up monitoring 82.9 65.3 46.3 Percentage of patients with at least one contact for education 84.8 75.9 74.3 Mean number of follow-up contacts per active patient month 1.3 1.7 1.3
Source: Data describing contacts were prepared by the programs and submitted quarterly to the demonstration
evaluator. Note: Excludes beneficiaries who were never activated or for whom there were discrepancies between CMS
data and program data on activation. Includes enrollees who had at least six months of follow-up data and were active for at least one month (that is, for whom the program received at least one monthly payment). Treatment group members enrolled in one of the programs and meeting demonstration-wide eligibility criteria were eligible to begin receiving program services (also referred to as becoming “active”) on the first of the month following random assignment. For example, a beneficiary randomly assigned on February 10 was expected to begin receiving program services on March 1. Contacts that may have occurred between the date of random assignment and activation are counted in the first week of enrollment.
similar (though less steep) decline in the proportion receiving education contacts. Patients in the other two programs experienced a modest decline in contacts for monitoring or education after their first six months.
The programs also differed extensively in the intensity of staff contact with active patients
(Table 6). Over the different periods of patient enrollment, HeartPartners staff contacted patients from a high of 4.5 times a month (that is, more than once a week) during the first 6 months of enrollment to 3.4 times per month in the 13th to 18th months, CorSolutions staff contacts dropped from 2.2 to 1.3 contacts per month, and XLHealth staff contacts ranged from 1.3 to 1.7 per month.
The intensity of monitoring and education contacts increased with program maturity for
HeartPartners, but not for the other two programs (not shown). The earliest HeartPartners enrollees received an average of 4.3 monitoring contacts per active month during their first six
28
months in the program, while the latest received an average of 5.0 contacts per month during their first six months. HeartPartners staff noted patients had problems that were more medically and psychosocially complex than originally envisioned, and staff increased contacts to address these problems.
Service Arrangement and Care Coordination. HeartPartners and XLHealth helped
patients obtain services such as transportation or other types of nonmedical support services to a greater extent than did CorSolutions. The HeartPartners and XLHealth nurses reported routinely asking their patients whether they needed support services. HeartPartners said it referred patients with needs to a complex-case manager who arranged for services, and XLHealth said it arranged transportation through patients’ relatives or friends or through local AAAs. In contrast, the CorSolutions nurses reported that they did not routinely ask about support services and relied on patients to request any such help, and that relatively few CorSolutions patients discussed with their disease managers the need for additional services or provided follow-up on any services already received.
Over the life of the HeartPartners program, the proportion of patients in their first six
months of enrollment who received contacts involving the identification of support service needs increased from about half to nearly all (not shown), consistent with the program’s assertion that its patients turned out to have more complex problems than originally envisioned. HeartPartners identified support service needs not covered by Medicare for 81 percent of its active patients during their first six months after enrollment, although this proportion dropped during the subsequent six-month periods. Less than 20 percent of patients needed help obtaining any Medicare-covered services early in their enrollment, with the percentage also falling with increasing length of enrollment. The program monitored the receipt of services for nearly all patients during their entire program tenure. XLHealth identified service needs for 85 percent of its patients during their first six months after enrollment and continued to do so for a substantial fraction of patients during their later months in the program (not shown). XLHealth also reported providing durable medical equipment (DME) to 15 percent of its patients during their second six months in the program and to 10 percent during their third six months.16 CorSolutions nurses spent considerably less time addressing patients’ service needs. For example, only four percent of its patients had program contacts during their first six months in the program that included discussion of needed services (not shown). As noted, the CorSolutions nurses relied on patients to bring up any needs for services. There was no trend in contacts involving service needs during the program. CorSolutions did provide 15 percent of patients in their first six months of enrollment with bathroom scales, however.
Nurse Disease Manager Interactions with Physicians’ and Their Offices. In parallel
with having the highest intensity of patient contacts, HeartPartners also had a much higher rate
16 There is no additional information available on what type of equipment this was. During the site visit,
XLHealth staff did not mention providing DME, and the program data available for the case study report showed no provision of DME in the first six months (Esposito et al. 2005).

29
than the other two programs of contacting patients’ physicians or physicians’ office staff. HeartPartners contacted physicians’ offices for nearly all its patients (97 to 98 percent of patients), regardless of patient time since enrollment, or whether patients were enrolled early or late in the program (Table 7). Over the course of its operations, HeartPartners increased the average number of physician contacts during patients’ first six months from 1.9 per active patient month for the earliest enrollees to 2.3 for the latest. In contrast, XLHealth contacted physicians’ offices for 98 percent of its patients during their first six months in the program for its earliest enrollees, but this percentage fell to 59 to 62 percent for the patients it enrolled later on, consistent with reports by XLHealth staff that they had increasing difficulty handling the large numbers of patients they enrolled. As patients remained enrolled in the XLHealth program for longer periods of time, the proportion of their physicians who received any contacts fell (for the early cohort, 98 percent of physicians in the first 6 months of enrollment versus 36 percent during the second six months of enrollment, and for the middle cohort, 62 percent of physicians in the first 6 months of enrollment versus 43 percent during the second six months of enrollment) (Table 7). In XLHealth, the average number of contacts with physicians ranged from 0.2 to 0.3 contacts per active patient month across duration of enrollment and cohorts of patients (Table 7). For both its earlier and later patients, CorSolutions contacted the physicians of just under 70 percent of the patients during patients’ first six months of enrollment, although the rate increased to 83 percent as patients stayed longer in the program. CorSolutions’ average number of contacts with physicians was also 0.2 to 0.3 per month.
TABLE 7
PROGRAM CONTACTS WITH OFFICES OF PHYSICIANS OF ENROLLED PATIENTS, BY COHORT AND DURATION OF PATIENT ENROLLMENT
CorSolutions HeartPartners XLHealth During Patients’: During Patients’: During Patients’:
1st-6th month
7th-12th
month 1st-6th month
7th-12th month
13th-18th
month 1st-6th month
7th-12th month
13th-18th
month Percentage of Patients Whose Physicians Were Contacted, by Enrollment Cohorts with Follow-up up to:
18 months (early cohort) -- a --a 97.0 97.6 97.0 98.1 35.6 50.7 12 months (middle cohort) 68.7 82.7 97.1 96.7 -- 62.1 42.6 -- 6 months (late cohort) 68.2 -- 98.4 -- -- 58.7 -- --
Mean number of Physician Contacts per Month, by Enrollment Cohorts:
18 months (early cohort) -- a --a 1.9 1.8 1.8 0.3 0.2 0.3 12 months (middle cohort) 0.2 0.3 2.0 1.8 -- 0.3 0.3 -- 6 months (late cohort) 0.2 -- 2.3 -- -- 0.3 -- --
Source: Data describing contacts were prepared by programs and submitted quarterly to the demonstration evaluator. Note: Patients were grouped into cohorts depending on the duration of follow-up available, with those enrolled the
earliest having the longest duration of follow-up (up to 18 months). Data for each patient were organized in terms of “months following enrollment” and aggregated into six-month periods (months 1-6, 7-12, and 13-18).
aBecause of CorSolutions’ early termination, the program had very few patients with greater than 12 months of follow-up.

30
CorSolutions contacted physicians for just under 70 percent of its patients during its first six months for both its earlier and later patients, although the rate increased to 83 percent as patients stayed longer in the program. Its average number of contacts was also 0.2 to 0.3 per month.
The most common reasons for CorSolutions disease managers to contact physicians were to
discuss changes in patient symptoms and problems with patient adherence (Chen et al. 2007). The XLHealth program usually called physicians to discuss medical treatment and, less often, to discuss changes in patients’ symptoms, and HeartPartners contacted physicians to talk about symptoms, medications, medical treatment, coordinating information, and patient adherence (Chen et al. 2007).
PROGRAM IMPACTS ON MEDICARE SERVICE USE AND EXPENDITURES
Over the life of each program, there were no impacts on the likelihood of an inpatient admission or emergency room visit, on the average number of inpatient admissions, or on Medicare Part A and B expenditures (Table 8). Estimated effects were small and not statistically significant from zero, even for tests conducted at the 0.10 significance level.
TABLE 8
PROGRAM IMPACTS ON LIKELIHOOD OF HOSPITAL OR EMERGENCY ROOM USE, AND ON TOTAL MEDICARE EXPENDITURES AMONG ALL PROGRAM ENROLLEES,
CUMULATIVE THROUGH ALL MONTHS OF PROGRAM OPERATIONS
CorSolutions HeartPartners XLHealth
Treatment Group
Control Group Difference
Treatment Group
Control Group Difference
Treatment Group
Control Group Difference
Percentage with Hospitalization 43.2 45.9 -2.6 53.0 52.4 0.5 64.4 64.0 0.3
Average Number of Emergency Room Visits per Year 1.19 1.02 0.17 0.79 0.74 0.05 0.86 0.83 0.03
Average Number of Hospital Admissions per Year 1.87 1.98 -0.11 1.22 1.17 0.04 1.44 1.42 0.02
Average Medicare Payments per Month in Fee-for-Service $2,298 $2,255 $43 $1,865 $1,819 $46 $2,239 $2,240 -$1
Sample Size 1,097 387 -- 5,890 2,345 -- 11,178 4,420 -- Source: Medicare claims.
Note: No differences are significant at the p ≤ 0.10 level. Statistical significance was determined using t-tests of whether the coefficients on the treatment-control indicator variables in the regression models were significantly different from zero. Results for percentage with hospitalization, number of emergency room visits, and number of hospital admissions are regression adjusted. Results for monthly Medicare payments are unadjusted comparisons of means performed using the ARC truncation methodology as agreed upon by CMS and the demonstration programs in the demonstration protocol.
Observations are weighted according to the proportion of the follow-up period the sample member meets CMS’s demonstration-wide requirements and is alive. Weights are normalized for treatment and control group members to sum to the number of observations in the group. There were a total of 25 months of operations at HeartPartners, 21 at XLHealth, and 15 at CorSolutions.

31
These findings also held true for any of the fixed post enrollment follow-up periods that were analyzed and regardless of whether the analysis was based on unadjusted comparisons of treatment and control group means or on regression-adjusted means (adjusting for patient-level covariates). In addition to the absence of effects on overall Medicare expenditures, there were no effects on various components of Medicare expenditures, such as Part A or Part B.
Given the sizeable numbers of patients enrolled in the programs, and the large savings
needed for budget neutrality, the evaluation had more than adequate statistical power. For each of the programs, the minimum detectable differences were considerably smaller than the differences needed to achieve budget neutrality (Table 9).
Subgroup Results
The evaluation also conducted subgroup analyses to assess whether the programs might benefit certain types of patients more or less than others. For example, patients’ clinical condition, health status, age, or prior access to prescription drugs might all influence their response to the program. The following prespecified patient subgroups were examined—(1) having prior prescription coverage, (2) having claims before enrollment for a diagnosis of diabetes or not, (3) having five or more chronic medical conditions, (4) age, (5) having fair or poor self-reported health status, and (6) being obese. In addition, program impacts were examined for the subgroups of patients who were enrolled early versus later in the programs’ duration. The programs’ effectiveness might vary with time since program startup, since increasing staff experience, expanding numbers of patients to manage, and growing patient and physician familiarity with the program might all affect program operations. The original analysis plan called for defining the early and late enrollees as those enrolled within or after the programs’ first year, but because of the programs’ premature termination, the subgroups were defined instead as those enrolled within or after the programs’ first six months.
TABLE 9
PRECISION OF ESTIMATES OF PROGRAM EFFECTS ON MEDICARE EXPENDITURES THROUGH ALL PROGRAM MONTHS, AMONG ALL ENROLLEES
Sample Sizes
Treatment
Group Control Group
Minimum Detectable
Difference at 80 Percent
Power
Power to Detect
20 Percent
Effect on Cost
Average Fee Received per
Month in Evaluation
Sample
Average Control Group Cost
Percent Savings
Needed to Cover Fee
Power to Detect Impact
Needed to Cover Fee
CorSolutions 1,097 387 $446 0.80 $581 $2,221 26.2% 0.95
HeartPartners 5,890 2,345 $157 0.99+ $653 $1,834 35.6% 0.99+
XLHealth 11,178 4,420 $139 0.99+ $647 $2,232 29.0% 0.99+ Source: Medicare Enrollment Database, National Claims History File, and Standard Analytic File.

32
Of the subgroups examined, there were only a few significant effects and only for the XLHealth program (Table 10).17 Treatment-control differences in the XLHealth program for
TABLE 10
SUBGROUP RESULTS FOR HOSPITAL ADMISSIONS AND MEDICARE EXPENDITURES FOR HEARTPARTNERS
AND XLHEALTH BY PATIENT SUBGROUPS DEFINED BY WHEN ENROLLED (IN THE FIRST SIX MONTHS OF PROGRAM OPERATIONS OR AFTER THE FIRST SIX MONTHS) CUMULATIVE
THROUGH ALL MONTHS OF PROGRAM OPERATIONS
HeartPartners XLHealth
Patients Enrolled In
First Six Months of Program
Operations
Patients Enrolled
After First Six Months of Program Operations
Patients Enrolled In
First Six Months of Program
Operations
Patients Enrolled After
First Six Months of Program
Operations
Sample Size Treatment 1,022 4,868 8,166 3,012 Control 407 1,938 3,225 1,195
Annualized Number of Hospital Admissions (Average Number per Year)
Treatment 1.25 1.20 1.47 1.32 Control 1.27 1.14 1.41 1.45 Difference -0.02 0.06 0.06 -0.13**, ††
Average Medicare Expenditure per Month in Fee-for-Service
Treatment $1,846 $1,865 $2,283 $2,090 Control $1,840 $1,830 $2,202 $2,345 Difference $6 $35 $81 -$255***,†
Source: Medicare claims.
Note: These findings also held true for any of the fixed postenrollment follow-up periods that were analyzed, for unadjusted comparisons of treatment and control group means, and for regression-adjusted means (adjusting for patient-level covariates). They also held true for the Medicare expenditure results, and for comparisons of various components of Medicare expenditures, such as Part A or Part B. To assess whether there was a significant subgroup effect, that is, whether the treatment effect was significantly different across different subgroups, the evaluator used a t-test of whether the regression coefficient on the interaction term (treatment indicator times subgroup indicator) was significantly different from zero. To test for a significant treatment effect within each subgroup, a t-test was conducted of whether the sum of the regression coefficient on the treatment indicator and of the coefficient on the interaction term was significantly different from zero.
**Effect significantly different for early and late subgroups at the .05 level, two-tailed t-test. ***Effect significantly different for early and late subgroups at the .01 level, two-tailed t-test. †Treatment effect within the subgroup significantly different from zero at the .10 level two-tailed t-test. ††Treatment effect within the subgroup significantly different from zero at the .05 level two-tailed t-test.
17 Complete results of the subgroup analyses are available in Chen et al. (2007). Because of its small overall
sample size, subgroup impacts were not estimated for CorSolutions.
33
both average annual number of hospital admissions and average monthly Medicare expenditures varied by time since program start. Among the 27 percent of all patients who enrolled after the first six months of operations at XLHealth, treatment group members had about 9 percent fewer hospital admissions than control group members, and average monthly treatment group expenditures about 11 percent lower than those for the control group. These results were robust to sensitivity analyses.18 However, the estimated treatment-control difference in average monthly expenditures per beneficiary ($255) for the later enrollees offset less than 40 percent of the average monthly fee paid to the program ($647). Impacts of the XLHealth program for the 73 percent of beneficiaries enrolling during the first six months of the program were essentially zero for both hospitalizations and expenditures.
As noted, the favorable treatment effect in XLHealth on Medicare expenditures among the
subgroup of later enrollees was far below the amount needed to cover the average monthly fee to the program, and the subgroup of later enrollees was also much smaller than that of the earlier enrollees (27 percent versus 73 percent of enrollees). Nevertheless, this subgroup analysis does provide an unbiased estimate of the treatment effect within each subgroup, and the size of the later subgroup was large enough to achieve statistical significance.
One possible explanation for the observed subgroup effect could have been that a higher
proportion of patients in the later cohort met XLHealth’s diagnostic eligibility criteria than in the earlier cohort, since as noted, XLHealth did not screen patients from the CMS claims pull lists for its eligibility criteria. However, the proportion of sample members meeting XLHealth’s eligibility criteria was in fact substantially lower in the later cohort than in the early cohort (38 percent versus 52 percent).
Among the other subgroup effects examined, only two others were statistically significant
(at the p = 0.10 level), and only for the XLHealth program. First, for subgroups defined by self-reported health status at baseline, among those who were in fair or poor health at baseline, treatment group members had slightly more annualized hospital admissions than control group members cumulative through all months of program operations, in contrast to treatment and control group members who were not in fair or poor health at baseline. Second, for subgroups defined by obesity at baseline, among those who were obese, treatment group members had slightly higher average monthly Medicare expenditures than control group members cumulative through all months of program operations, in contrast to treatment and control group members who were not obese at baseline. These differences are likely to be chance differences, rather than due to the effects of the program.
18 First, after truncating outlier values (above the 98th percentile) treatment-control differences fell to seven
percent of the control group mean but remained statistically significant (p = 0.067). Second, examination of treatment-control differences by month of patient enrollment showed that differences began after the fourth month of enrollment and persisted with few exceptions through the end of program operations.

34
COST RECONCILIATION
As noted, the demonstration is required to be cost-neutral, and programs that fail to achieve savings must reimburse CMS for incurred losses (calculated as the difference in Medicare expenditure per month between the treatment and control groups, multiplied by the total number of eligible months for treatment group members enrolled in the study, plus the fees paid to the disease management program). The amounts owed by the three programs, according to the final cost reconciliation reports by ARC, are $3,568,094 for CorSolutions, $48,589,065 for HeartPartners, and $105,871,858 for XLHealth (Table 11). As noted earlier, CorSolutions/Matria Healthcare and HeartPartners/UnitedHealth have reimbursed CMS the amounts due, while CMS is still in discussions with XLHealth regarding the final settlement of the amount due.
OTHER PROCESS AND OUTCOME MEASURES
Measures of process of care that the evaluation analyzed included use of recommended medications, delivery of general and disease-specific preventive services, and physician perceptions of various aspects of care. The evaluation also assessed program effects on many outcome measures including patient and physician satisfaction, patient knowledge and behavior, patient access to drugs, clinical outcomes, functioning, potentially avoidable complications of disease, and mortality. Depending on the data sources, these measures were evaluated either through pre-post comparisons of treatment group patients, descriptive statistics of treatment group patients and their physicians, or treatment and control group impact estimates.
General and Disease-Specific Preventive Care Services Measurable in Medicare Claims Data
The evaluation analyzed program impacts on 15 preventive care services that are measurable in Medicare claims data for both treatment and control group members. HeartPartners had only
TABLE 11
ARC COST RECONCILIATION CALCULATIONS FOR THE BIPA DEMONSTRATION
Difference Treatment Group Member Months Fees Paid
Amount Due to CMS
CorSolutions $43 7,332.31 $3,372,232 $3,568,094
HeartPartners $46 70,899.14 $45,868,665 $48,589,065
XLHealth -$1 164,867.84 $105,988,914 $105,871,858 Source: ARC BIPA reconciliation reports for CorSolutions (March 9, 2007), HeartPartners (April 23, 2007), and
XLHealth (January 18, 2007).

35
one statistically significant treatment-control difference among these measures, a slightly higher proportion of treatment group members than control group members with CHF undergoing assessment of left ventricular (LV) function at one year after enrollment (Table 12).19 All other treatment-control differences were not significant.
The XLHealth program had a number of statistically significant increases in 5 of the
10 recommended care processes among patients with diabetes (Table 12). More treatment group members than control group members had claims for self-monitoring supplies, therapeutic shoes, visits to a podiatrist (as well as more podiatric visits), and urine tests for protein levels. Among CHF patients, treatment group members were more likely than control group members to receive an assessment of LV function. The improvements were modest in size, ranging from 4 to 16 percent of the respective control group means.
Patient Education, Knowledge, and Behavior
All three programs educated patients on basic disease-specific factual information, including disease etiology, the meaning of lab results, the significance of abnormal home telemonitoring reading (for XLHealth and HeartPartners), adherence, and self-management. Programs’ software guided staff on provision of this education and prompted them to contact patients at appropriate intervals to check on symptoms and encourage needed lifestyle changes.
Although HeartPartners provided the highest number of contacts per month, the quality of
education during the contacts is less certain. The telephonic education that one disease manager provided to four patients was observed during the second site visit to HeartPartners.20 She first asked about potential behavioral triggers of symptoms (for example, for abnormal weight gain indicating possible fluid retention, she asked, “Did you take your Lasix? What did you eat? How much did you drink?”). After asking about other symptoms of CHF and comorbid conditions (such as confusion or fatigue from low blood sugar), she delivered brief, prescriptive lectures on topics such as reducing salt intake and taking medications as prescribed. For example, she instructed one patient to reduce salt by “throwing away your salt shaker.” After another patient told her, “I know how to eat, I just don’t do it,” she made no attempts to explore reasons why the patient had not changed her diet or ways to help her do it. In short, during the observed interactions, this particular disease manager did not appear to take a client-centered, collaborative approach to helping patients change, as recommended by modern behavioral
19 Table 12, which includes sample members with 12 months of follow-up, does not show CorSolutions because only 174 patients had enrolled 12 or more months prior to the end of the program’s participation in the demonstration in late August 2005. Chen et al. (2007) includes results for all claims-based measures of quality of care and contains a table of these outcomes for sample members at six months after enrollment—in CorSolutions, a higher proportion of treatment group members than control group members underwent colon cancer screening at six months after enrollment.
20 The disease manager was contacting these four patients for out-of-range home telemonitoring values. Recall that the CorSolutions and XLHealth programs ceased operations before their second site visits could take place.

36
TABLE 12
PROGRAM IMPACTS ON GENERAL AND DISEASE-SPECIFIC PREVENTIVE CARE SERVICES MEASURED IN MEDICARE CLAIMS DATA, IN THE FIRST YEAR OF ENROLLMENT
(Regression Adjusted)
HeartPartners XLHealth
Treatment Control Difference p-Value Treatment Control Difference p-Value
All Enrolled Patients Colon cancer screeninga 10.7 11.9 -1.2 0.213 10.7 11.4 -0.7 0.240 Screening mammography for femalesb 22.2 23.3 -1.1 0.535 18.4 19.0 -0.7 0.473
Patients with Diabetes Number of Patients 2,014 823 8,246 3,244 Diabetes educationc
Any visits 3.3 3.0 0.3 0.682 2.4 2.5 -0.1 0.699
Mean number of diabetes education visits per100 patients 6.9 7.4 -0.5 0.791 4.4 4.1 0.3 0.680 Any claims for blood glucose self-monitoring suppliesd 44.6 45.3 -0.8 0.700 71.1 65.8 5.3 0.000*** Any therapeutic shoes 8.1 8.7 -0.6 0.568 19.1 16.5 2.6 0.001*** Any eye examination 68.9 67.1 1.8 0.336 66.2 64.8 1.3 0.167 Podiatry visits
Any visits 57.3 58.5 -1.3 0.529 69.0 64.8 4.1 0.000***
Average number of podiatry visits per patient 2.6 2.7 -0.1 0.677 3.4 3.2 0.3 0.010** Any blood test for cholesterol or lipids 72.0 70.7 1.3 0.467 73.6 73.2 0.4 0.671 Any blood test for hemoglobin A1c (HbA1c) 69.6 67.8 1.7 0.357 75.9 76.5 -0.6 0.492 Any urine test for protein 23.5 23.7 -0.2 0.930 25.2 22.7 2.6 0.004***
Patients with CHF Number of Patients 3,625 1,451 8,102 3,239 Any assessment of left ventricular function 64.2 61.6 2.6 0.077* 60.0 57.8 2.1 0.033**
Patients with CAD Number of Patients 3,313 1,309 8,633 3,405 Any cardiac hospitalizations 8.0 6.6 1.4 0.106 9.8 10.0 -0.2 0.773 Any blood test for cholesterol or lipids 69.0 68.3 0.7 0.634 72.0 71.7 0.3 0.708 Source: Medicare claims data. Notes: Includes sample members enrolled early enough in program operations to potentially be observed for 12 months. For example, the first year of enrollment sample at
HeartPartners includes all sample members enrolled through March 2005, because the last calendar month of program operations was February 2006. The CorSolutions program is not shown because only 174 patients had enrolled 12 or more months prior to the end of the program’s participation in the demonstration in late August 2005. Treatment-control differences for the first year of enrollment were therefore not calculated.
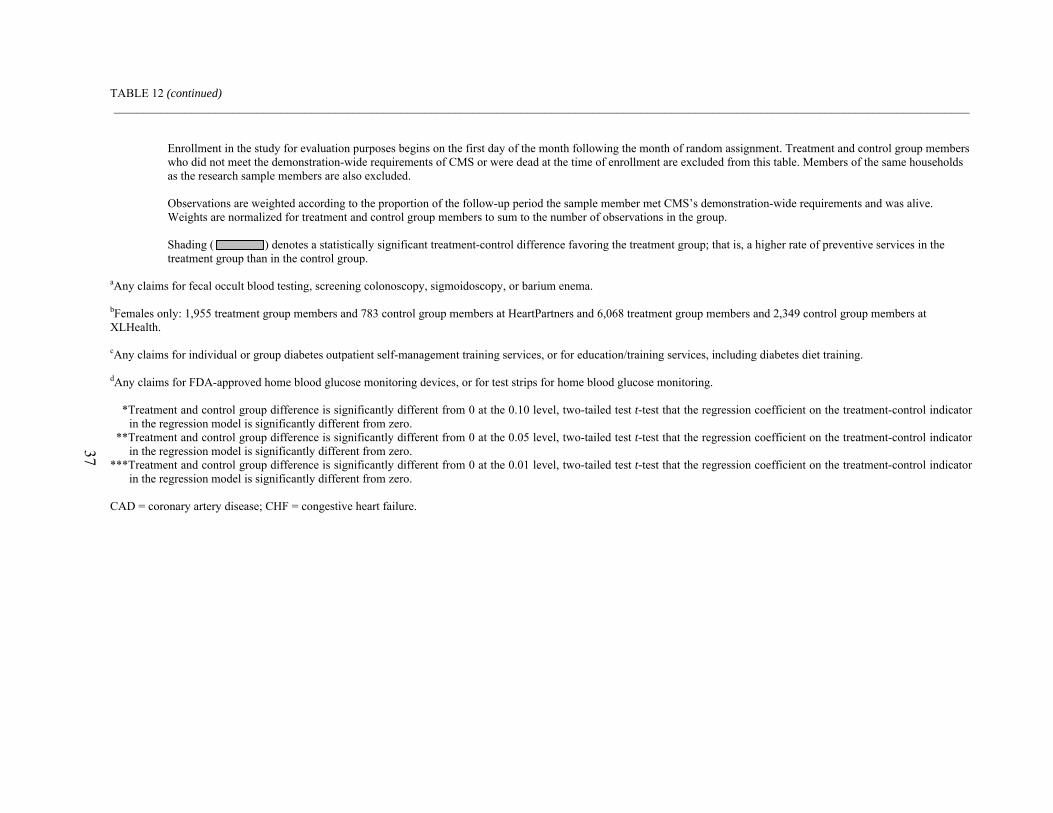
37
TABLE 12 (continued) _______________________________________________________________________________________________________________________________________________
Enrollment in the study for evaluation purposes begins on the first day of the month following the month of random assignment. Treatment and control group members who did not meet the demonstration-wide requirements of CMS or were dead at the time of enrollment are excluded from this table. Members of the same households as the research sample members are also excluded.
Observations are weighted according to the proportion of the follow-up period the sample member met CMS’s demonstration-wide requirements and was alive. Weights are normalized for treatment and control group members to sum to the number of observations in the group. Shading ( ) denotes a statistically significant treatment-control difference favoring the treatment group; that is, a higher rate of preventive services in the treatment group than in the control group.
aAny claims for fecal occult blood testing, screening colonoscopy, sigmoidoscopy, or barium enema. bFemales only: 1,955 treatment group members and 783 control group members at HeartPartners and 6,068 treatment group members and 2,349 control group members at XLHealth. cAny claims for individual or group diabetes outpatient self-management training services, or for education/training services, including diabetes diet training. dAny claims for FDA-approved home blood glucose monitoring devices, or for test strips for home blood glucose monitoring.
*Treatment and control group difference is significantly different from 0 at the 0.10 level, two-tailed test t-test that the regression coefficient on the treatment-control indicator
in the regression model is significantly different from zero. **Treatment and control group difference is significantly different from 0 at the 0.05 level, two-tailed test t-test that the regression coefficient on the treatment-control indicator
in the regression model is significantly different from zero. ***Treatment and control group difference is significantly different from 0 at the 0.01 level, two-tailed test t-test that the regression coefficient on the treatment-control indicator
in the regression model is significantly different from zero. CAD = coronary artery disease; CHF = congestive heart failure.

38
counseling techniques (Whitlock et al. 2002; Emmons and Rollnick 2001; Glanz et al. 1997; Von Korff et al. 1997).
Physicians were also unconvinced that the three programs’ education had much impact on
patient behavior. The percentages of physicians who thought the programs had very good or excellent effects on specific patient behaviors—medication adherence, diet, exercise, self-monitoring, and making and keeping appointments—ranged from 5 to 44 percent across the two programs surveyed. The percentages giving fair or poor ratings for the same topics ranged from 31 to 71 percent. For overall improvement in patients’ ability to self-manage their conditions, the proportion of physicians giving a good rating was 41 percent for HeartPartners and 11 percent for XLHealth, and fair or poor ratings, 33 and 56 percent, respectively.
In fact, for neither of the two surveyed programs (XLHealth and HeartPartners) were there
clear impacts on patients reporting that they had received education on various self-care topics. Two unexpected negative treatment-control differences (fewer treatment group members in HeartPartners reporting being taught how to exercise, and fewer treatment group members in XLHealth saying they got educational materials) are unlikely to represent true impacts because of the lack of other corroborating evidence and the implausibility of the programs making it less likely that patients would be taught how to exercise or receive materials.
Programs’ Coverage of Prescription Drugs
Use of the programs’ prescription drug benefits was much less than expected. When the HeartPartners and XLHealth programs were surveyed, 9 to 19 months after intake, only 33 percent of treatment group members in HeartPartners and 40 percent of treatment group members in XLHealth reported having used the demonstration prescription drug benefit (Table 13). The main reason treatment group members gave for not using the demonstration benefit was having other drug coverage (58 percent at HeartPartners and 41 percent at XLHealth).
Three findings from the patient survey are noteworthy: (1) a very high percentage of control
group members (79 to 87 percent) who reported having no drug coverage at intake reported in the survey conducted 9 to 15 months later that they did have coverage at the time they applied to the demonstration, (2) a lower but still large percentage (53 and 64 percent) of treatment group survey respondents who reported no drug coverage at intake also told survey interviewers that they had drug coverage at the time of enrollment, and (3) among those who said they had coverage at intake, fewer treatment group members than control group members recalled having this coverage when interviewed later for the survey. One possible explanation for the first finding is that some beneficiaries with prescription coverage concealed that information when applying for the demonstration in the hopes that so doing would increase their chances of assignment to the treatment group (either because the demonstration drug coverage was more generous than theirs or because of the attractiveness of the disease management services). Having been assigned to the control group, these beneficiaries no longer had any incentive to hide their preexisting drug coverage in the survey. Another possibility is that respondents
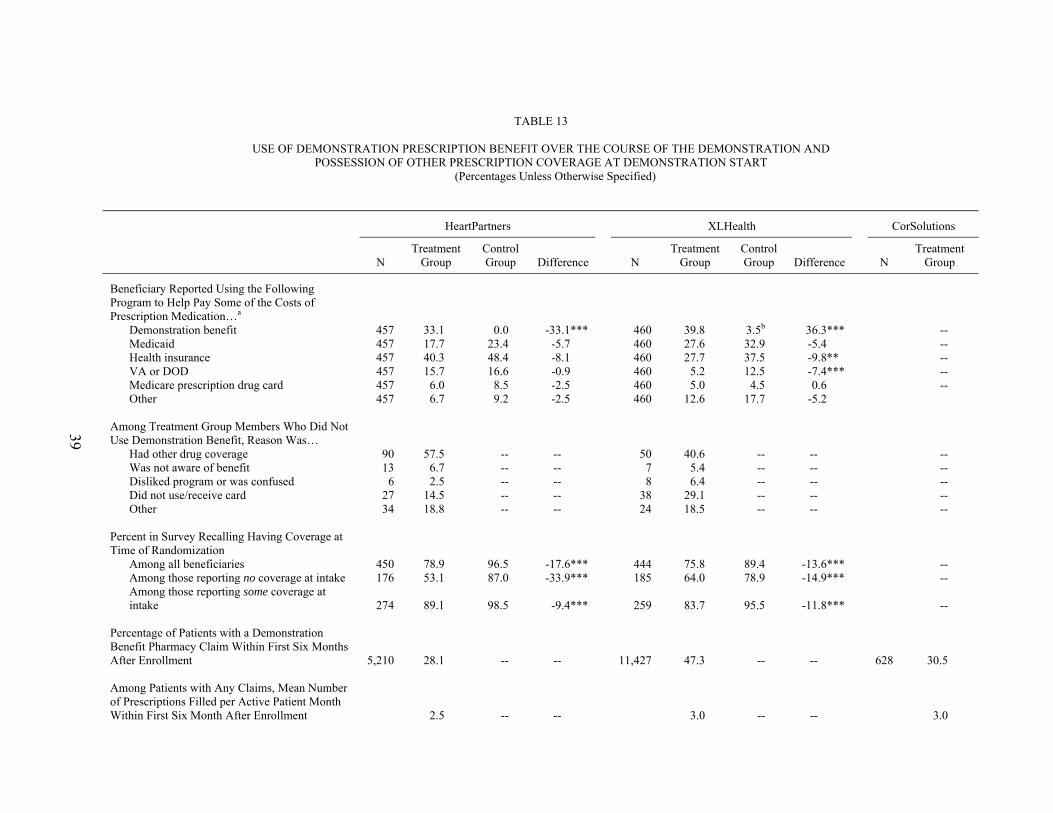
39
TABLE 13
USE OF DEMONSTRATION PRESCRIPTION BENEFIT OVER THE COURSE OF THE DEMONSTRATION AND POSSESSION OF OTHER PRESCRIPTION COVERAGE AT DEMONSTRATION START
(Percentages Unless Otherwise Specified)
HeartPartners XLHealth CorSolutions
N
Treatment Group
Control Group Difference
N
Treatment Group
Control Group Difference
N
Treatment Group
Beneficiary Reported Using the Following Program to Help Pay Some of the Costs of Prescription Medication…a
Demonstration benefit 457 33.1 0.0 -33.1*** 460 39.8 3.5b 36.3*** -- Medicaid 457 17.7 23.4 -5.7 460 27.6 32.9 -5.4 -- Health insurance 457 40.3 48.4 -8.1 460 27.7 37.5 -9.8** -- VA or DOD 457 15.7 16.6 -0.9 460 5.2 12.5 -7.4*** -- Medicare prescription drug card 457 6.0 8.5 -2.5 460 5.0 4.5 0.6 -- Other 457 6.7 9.2 -2.5 460 12.6 17.7 -5.2
Among Treatment Group Members Who Did Not Use Demonstration Benefit, Reason Was…
Had other drug coverage 90 57.5 -- -- 50 40.6 -- -- -- Was not aware of benefit 13 6.7 -- -- 7 5.4 -- -- -- Disliked program or was confused 6 2.5 -- -- 8 6.4 -- -- -- Did not use/receive card 27 14.5 -- -- 38 29.1 -- -- -- Other 34 18.8 -- -- 24 18.5 -- -- --
Percent in Survey Recalling Having Coverage at Time of Randomization
Among all beneficiaries 450 78.9 96.5 -17.6*** 444 75.8 89.4 -13.6*** -- Among those reporting no coverage at intake 176 53.1 87.0 -33.9*** 185 64.0 78.9 -14.9*** -- Among those reporting some coverage at intake 274 89.1 98.5 -9.4*** 259 83.7 95.5 -11.8***
--
Percentage of Patients with a Demonstration Benefit Pharmacy Claim Within First Six Months After Enrollment 5,210 28.1 -- -- 11,427 47.3 -- --
628 30.5
Among Patients with Any Claims, Mean Number of Prescriptions Filled per Active Patient Month Within First Six Month After Enrollment 2.5 -- -- 3.0 -- --
3.0

40
TABLE 13 (continued)
HeartPartners XLHealth CorSolutions
N
Treatment Group
Control Group Difference
N
Treatment Group
Control Group Difference
N
Treatment Group
Among Patients with Any Claims, Percentage Filling a Prescription Within First Six Months After Enrollment for:
Cardiovascular agentsc
ACE or ARBs 45.3 -- -- 44.6 -- -- 39.5 Beta blockers 55.7 -- -- 38.3 -- -- 43.2 Diuretics 71.7 -- -- 54.9 -- -- 60.0 Nutritional productsd 41.5 -- -- 26.5 -- -- 27.6
Diabetic agentsc Insulin
8.6 -- -- 24.6 -- --
10.3 Oral hypoglyemic agents 11.1 -- -- 35.2 -- -- 20.5
Among All Patients, Estimated Mean Pharmacy Benefit Cost, Net of Patient Copay, per Patient per Month Active $47.40 -- -- $217.50 -- --
$31.40 Source: Patient survey and program pharmacy claims data. Survey conducted June 2005 through December 2005 for patients in HeartPartners and XLHealth, when they had
been enrolled roughly 9 to 19 months (average 12 to 13 months). Patients in CorSolutions were not surveyed due to its early withdrawal from the evaluation. Notes: HeartPartners began random assignment in January 2004 and operated from February 2004 through February 2006; XLHealth began random assignment in March
2004 and operated from April 2004 through December 2005; and CorSolutions began random assignment in May 2004 and operated from June 2004 through August 2005. Sample sizes are for total numbers of patients in treatment and control groups combined. Treatment group members enrolled in the program were eligible to begin receiving program services (also referred to as becoming “active”) the first of the months following random assignment, provided CMS found them to meet the demonstration-wide eligibility criteria. For example, a beneficiary randomly assigned on February 10 was expected to begin receiving program services on March 1.
aPercentages sum to greater than 100 percent because respondents could report multiple sources of drug coverage. bFor unclear reasons, a small proportion of survey respondents in the XLHealth control group reported using the demonstration benefit to help pay for prescription medication even though, as control group members, they did not have access to this benefit. cDrug classes were defined using Medispan version 2. dNutritional products include potassium, which is commonly prescribed in conjunction with diuretics for patients with heart failure. *Significantly different from zero at the 0.10 level, two-tailed t-test for simple comparisons of group means. **Significantly different from zero at the 0.05 level, two-tailed t-test for simple comparisons of group means. ***Significantly different from zero at the 0.01 level, two-tailed t-test for simple comparisons of group means. ACE = angiotension converting enzyme inhibitor medication; ARB = angiotension receptor blocker medication; DOD = Department of Defense; VA = Veterans Administration.

41
obtained prescription coverage soon after learning of their assignment to the control group, either because they had already planned to do so but wanted to first try their luck for free coverage through the demonstration, or because assignment to the control group made them think about the importance of having coverage. They then simply incorrectly recalled when they got the coverage when answering the survey months later.
The 53 to 64 percent of treatment group members who reported no drug coverage at intake
but then stated having drug coverage when later surveyed likewise may have been confused or intentionally misreported at intake not having coverage in the mistaken belief that a lack of coverage would increase their chances of assignment to the treatment group. Perhaps they forgot that their current drug coverage through the demonstration only began after randomization into the treatment group. Program staff may also not have collected the intake data on drug coverage in a reliable fashion.
Regardless of the reasons underlying these surprising survey results, they cast doubt on the
30 to 60 percent rates of lacking prescription coverage according to the programs’ intake data (Table 4). Substantial proportions of enrollees actually possessing prescription coverage at intake weakens the potential for the demonstration’s drug benefits to produce impacts.
In their first six months of enrollment, only about 30 percent of patients at HeartPartners and
CorSolutions, and about half of the patients at XLHealth, ever had a claim from their respective demonstration prescription drug plans (Table 13). These percentages remained fairly constant over patients’ 7th through 12th month of enrollment, and over patients’ 13th through 18th months of enrollment (for patients with those amounts of followup; data not shown). Even among patients who had no prescription drug coverage when they started the program, only between 30 and 48 percent used the demonstration drug benefit during the programs’ first six months.
Among patients using the program drug benefits in their first six months of enrollment, the
average number of prescriptions filled per active month was 3.0 for CorSolutions, 2.5 for HeartPartners, and 3.0 for XLHealth. For CorSolutions and HeartPartners, these average numbers remained steady over patients’ 7th through 12th months of enrollment, and for HeartPartners, over patients’ 13th through 18th months of enrollment (not shown).21 For XLHealth, the average number of prescriptions filled per active month increased somewhat as patients remained enrolled longer (4.2 during months 7 through 12 of enrollment, and 4.4 during months 13 through 18 of enrollment, not shown). Consistent with the programs’ target populations, substantial percentages of patients who used the benefit filled prescriptions for ACE inhibitors, potassium supplements, beta blockers, and diuretics (frequently prescribed to treat CHF); and hypoglycemic drugs and insulin (frequently prescribed to treat diabetes).22
21 CorSolutions had no patients with more than 12 months of followup due to its withdrawal from the evaluation in month 13 of operations.
22 Of patients using the benefit, the percentages filling prescriptions for one of these types of medications for CHF or diabetes were generally in the range of 40 to 60 percent. It is hard to say whether these rates are “high” or
42
CorSolutions and HeartPartners payments for prescription drugs for all patients enrolled, net of patient copayments, were between about $30 and $60 per active patient month over months 1 through 6, 7 through 12, and 13 through 18 of enrollment (not shown). XLHealth’s payments net of copayment were roughly $225 per active patient month because of the prospectively determined per-patient payments to its PBM. Use of the prescription benefits and costs of the benefit did not change substantially over the lives of the programs (not shown).
Access to Prescription Drugs
Impacts on providing assistance paying for drugs, out-of-pocket costs, and trouble getting drugs were modest at best. According to the survey data, the demonstration drug benefit had similar impacts for the HeartPartners and XLHealth programs in helping patients pay for medications. In the HeartPartners program, 89 percent of treatment group members and 76 percent of control group members reported getting help with the cost of prescriptions through any insurance or supplemental benefits, an 18 percent relative increase. In the XLHealth program, these percentages were 83 percent for treatment group members and 74 percent for control group members, or a 14 percent relative increase (Table 14).
On the other hand, the demonstration benefit had no impacts on the proportion of patients
reporting trouble getting enough medications. These proportions ranged from 16 to 27 percent with no significant treatment-control differences in either program (Table 14). Of treatment group members who said they had trouble getting medications, 36 percent in the HeartPartners program and 60 percent in the XLHealth program said it was because they exceeded the insurance limit. Beneficiaries may have been confused about the programs and what they covered, however, because neither program’s prescription drug benefit featured an insurance limit.
The programs led to only modestly lower out-of-pocket costs for treatment group
beneficiaries compared to those in the control group, especially given the magnitude of the programs’ fees. Treatment group members at HeartPartners paid an average of $109 per month out of pocket for prescription drugs, compared to the $138 that control group members paid (p = 0.055). At XLHealth, the average out-of-pocket cost for treatment group members was $124, compared to $189 for control group members (p = 0.001) (Table 14). While these are sizeable percentage savings in beneficiaries’ out-of-pocket spending on drugs, the absolute dollar amounts saved are small.
It is possible, though, that the demonstration benefit afforded treatment group members
access to drugs that they might not otherwise have been prescribed. Some physicians reported
(continued) “low” since appropriate use of these medications depends on detailed clinical information not available to the evaluation.

43
TABLE 14
PROGRAM IMPACTS ON ACCESS TO PRESCRIPTION DRUGS
HeartPartners XLHealth
N
Treatment Group
Control Group Difference N
Treatment Group
Control Group Difference
Had Benefits or Insurance That Helped Pay for Prescription Medications 601 89.4 75.5 13.9*** 604 83.1 73.5 9.6***
Patient Reported Having Trouble Getting Enough Medications 561 20.1 16.1 4.0 546 23.2 26.8 -3.7
Reasons Patient Had Trouble Getting Medications…
Not covered by insurance 85 47.3 39.0 8.2 108 60.4 59.0 1.3 Exceeded insurance limit 82 35.8 37.0 -1.2 104 59.9 64.0 -4.1
Average Monthly Out-of-Pocket Cost 517 $109 $138 -$29* 501 $124 $189 -$66*** Source: Patient survey conducted June 2005 through December 2005 for a random sample of treatment and control group
members in HeartPartners and XLHealth, when treatment group members had been enrolled roughly 9 to 19 months (average 12 to 13 months). Patients in CorSolutions were not surveyed due to its early withdrawal from the evaluation.
*Significantly different from zero at the .10 level, two-tailed t-test for simple comparison of group means. ***Significantly different from zero at the .01 level, two-tailed t-test for simple comparison of group means.
that they prescribed medications to demonstration patients that they might not have if the programs did not have a prescription drug benefit (44 percent, or 11 of 25 physicians, in the HeartPartners survey and 21 percent, or 4 of 19 physicians, in the XLHealth survey).
Program Effects on Specific Areas of Care: Patient and Physician Perceptions
The majority of physicians reported that the demonstration programs had little or no favorable effects on specific processes of care, although about 30 to 40 percent of physicians still reported that they led to improved care overall. Most physicians felt that HeartPartners and XLHealth made no difference in helping them coordinate care with other physicians, helping patients deal with contradictory information from other providers, or helping reduce unnecessary duplicate tests. The physicians also felt that the programs had no impact on helping them coordinate care with family members and other informal caregivers or helping resolve family conflicts or difficult family situations. In the HeartPartners program, 60 percent of physicians felt the program had no effects on continuity of care and 40 percent felt the program improved it. In the XLHealth program, 53 percent felt the program had no effects on continuity of care, 42 percent felt the program improved it, and 5 percent felt the program worsened it (Chen et al. 2007).
44
In the HeartPartners program, 62 percent of physicians felt the program had no effects on polypharmacy and 39 percent felt the program reduced this problem. In the XLHealth program, 63 percent felt the program had no effects on polypharmacy, 32 percent felt the program reduced it, and 5 percent felt the program worsened it (Chen et al. 2007). Fifty-eight percent of physicians felt the HeartPartners program made no difference in their following evidence-based clinical practice guidelines while 42 percent felt it helped them do so. Among physicians familiar with the XLHealth program, 68 percent said it had no effects on their adhering to evidence-based clinical practice guidelines and 32 percent felt it helped them adhere to guidelines. One-quarter of physicians in the HeartPartners survey reported that disease managers suggested they use a different drug than the one they had prescribed. However, this happened to only one physician in the XLHealth survey (five percent of respondents) and only because the prescribed drug was nonformulary (a reason unrelated to quality of care).
One-quarter of physicians in the HeartPartners survey said that a disease manager had ever
influenced their clinical decisions, while hardly any of the physicians in the XLHealth survey reported such an experience. In both programs, few physicians reported that disease managers had ever detected emotional or functioning problems in patients, and less than one-third of physicians rated disease managers’ ability in assessing patients’ home situations as very good or excellent.
Despite the marked differences previously described between HeartPartners and XLHealth
in the intensity of disease manager contacts with both patients and physicians, in both programs 44 percent of physicians connected with the program rated it as very good or excellent in monitoring and following up on patients. There were differences in the next levels of rating, however, as 33 percent thought the HeartPartners program was good and 22 percent fair or poor, whereas only 22 percent thought the XLHealth program was good and 33 percent found it fair or poor.
Most physicians said that the HeartPartners and XLHealth programs had no effects on
arranging services. They noted no improvements in appointments with specialists; physical, occupational, or speech therapy, or social work; and transportation, personal care, or meals-on-wheels.
At HeartPartners, among all the areas patients in the treatment group were asked to rate,
satisfaction with the program’s recommending of community resources was lowest, with only 14 percent giving excellent ratings and 22 percent giving fair or poor ratings. For treatment group patients in XLHealth, satisfaction was lowest for getting help arranging payment for noncovered services, with only 17 percent giving excellent ratings and 13 percent giving fair or poor ratings. However, the sample size for both of these questions was very small (only participants who needed community resources or noncovered services answered these questions).
In contrast to physicians’ perceptions, in both the surveyed programs (XLHealth and
HeartPartners), there were large and highly significant impacts on whether beneficiaries reported having a nurse or other health care professional help them with service arranging (more than 40 percentage point treatment-control differences, compared to control group means of 12 and
45
18 percent). Still, only a little more than half (56 percent) of treatment group members at HeartPartners and 61 percent of treatment group members at XLHealth reported that a nurse, disease manager, or social worker helped arrange services. This may be due, in part, to some patients not requiring such assistance in the observed time frame.
Among enrollees of both surveyed programs who needed help for specific Instrumental
Activities of Daily Living (IADLs) (telephone use, transportation, meal preparation, housework, and taking medication), there were no treatment-control differences in arranging help. High percentages of control group members reported being able to get help, however, so there was little opportunity for the programs to show improvement.
Physicians’ and Patients’ Global Perceptions and Satisfaction
Treatment group members in both programs generally gave their disease managers high marks on many areas of performance, such as having a caring attitude, being knowledgeable, or having the ability to explain things. However, these positive feelings did not translate into any treatment-control impacts on satisfaction with health care in general (that is, received from all providers), as there were no significant differences between the treatment and control groups in satisfaction with any of the many aspects of health care that they were asked about.
Despite their feelings about programs’ lack of effects on specific care processes, more than
half of physicians felt that the two surveyed programs (HeartPartners and XLHealth) made it easier to care for enrolled patients, and three-quarters of physicians found the program reports useful. Most physicians also thought information or feedback from disease managers was helpful.
Sixty-one percent of physicians felt the HeartPartners program had improved patients’
overall quality of care, with the remainder feeling it had made no difference. Seventy-one percent of physicians said they would probably or definitely recommend the HeartPartners program to patients or colleagues, 21 percent said they would probably or definitely not recommend the program to patients or colleagues, and 7 percent were unsure.
For the XLHealth program, 37 percent of physicians felt the program had improved patients’
quality of care, 58 percent noted no change, and 5 percent felt the program had worsened care quality. Sixty-eight percent said they would probably or definitely recommend the HeartPartners program to patients or colleagues and 32 percent would not.
Clinical Measures for Treatment Group Members
As part of the evaluation, the demonstration programs agreed to submit baseline and follow-up data on a limited number of clinical indicators of quality of care for their treatment group members, for pre-intervention to post-intervention comparisons. Before the start of the demonstration, the programs each agreed on a set of measures and a reporting schedule with

46
CMS. Because the CorSolutions program terminated so early, only data submitted by HeartPartners and XLHealth were analyzed.
HeartPartners reported data on receipt of recommended medications (ACE inhibitors and
beta blockers) at baseline and followup at one year for about 98 and 92 percent of its CHF patients, respectively (about 92 percent of CHF patients had both measures). Comparing patients with baseline data with those with follow-up data, the percentage of CHF patients at followup taking ACE inhibitors and the percentage taking beta blockers both fell slightly—about one percentage point for ACE inhibitors (from 64 percent at baseline to 63 percent at followup) and one percentage point for beta blockers (from 72 percent at baseline to 71 percent at followup). Results were similar when only patients with data for both time points were analyzed.
XLHealth submitted baseline data on these same quality indicators for 76 percent of their
patients with CHF and follow-up data for about 71 percent. Comparing those with baseline data to those with follow-up data, the percentage of patients taking an ACE inhibitor at followup rose about 12 percentage points (from 59 to 71 percent), or 20 percent compared to baseline, with no change in the percentage taking beta blockers (results for those with both baseline and follow-up data were similar). XLHealth had also agreed to report the results of left ventricular ejection fraction (LVEF) tests, but submitted incomplete data on this measure, with only about 12 percent of patients having values at baseline. HeartPartners, on the other hand, did not agree to report LVEF test results.
Finally, XLHealth agreed to submit pre- and post-enrollment data on blood pressure,
hemoglobin A1c and LDL cholesterol blood levels, and urine microalbumin tests for treatment group members with diabetes. The baseline and follow-up data on these measures were incomplete, with values available for blood pressure for 20 percent of patients, for hemoglobin A1c and LDL cholesterol for 10 percent of patients, and for microalbuminuria or proteinuria for 2 percent of patients. Among those with either baseline or follow-up values for these measures, all three quality indicators appeared better at follow-up than at baseline.
Given the pre- and post-enrollment comparisons, the high proportion of patients with
missing data, and the collection of the data by the programs themselves, it is hard to say whether the differences for either program for any of these measures represent any true changes in these particular quality-of-care indicators, and whether any changes are attributable to the program’s intervention.23 Since these clinical measures are important for planning and monitoring evidence-based care for the target conditions, the lack of complete data from the programs also raises the question of whether they had the information they needed to properly assess and improve care for their patients.
23 Pre- and post-intervention comparisons only for patients with both a baseline value and a follow-up value
were similar (Chen et al. 2007).
47
Functioning and Health-Related Quality of Life
None of the programs had favorable impacts on any on the indicators of functioning (survey data were available on functioning for both treatment and control group members). The only statistically significant treatment-control difference across functioning measures was for a higher proportion of treatment group than control group members in XLHealth reporting that they could bathe without help. Given the nature of XLHealth’s intervention, the absence of effects on ability to access prescription drugs, and the absence of differences among all the other functioning outcomes, this single difference is unlikely to be a true impact.
Likewise, there were no impacts among several measures of perceived mental and physical
health-related quality of life. There was only one statistically significant treatment-control difference—a higher proportion of treatment group members than control group members in the HeartPartners program reported that they felt calm and peaceful most or all of the time in the last four weeks. Again, in light of the lack of differences among all the other outcomes and the implausibility of the HeartPartners program affecting this one outcome only, this difference is most likely due to chance.
Potentially Preventable Hospitalizations and Mortality
Finally, there were a few scattered differences in impact analyses that used Medicare administrative data to measure potentially preventable hospitalizations and mortality (Table 15).24 Patients with diabetes in the HeartPartners program had a higher likelihood of cardiac- and diabetes-related hospitalizations and, in both the HeartPartners and XLHealth programs, a higher rate of microvascular complications. The programs had no effects on mortality. It is unlikely that the programs could actually have led to diminished quality of care, and there is no corroborating evidence from the other analyses of any harmful effects on patients. Therefore, the differences in these outcomes may (1) represent the effects of the programs’ increased surveillance or monitoring of patients, or (2) be due to chance.
SUMMARY OF EVALUATION FINDINGS AND CONCLUSIONS
None of the three demonstration programs had overall impacts on the key outcomes of Medicare Part A and B expenditures and service use. Impacts on quality of care indicators were small, observed only for XLHealth, and limited to a few of the many measures examined.
24 The analyses in Table 15 includes treatment and control group members entering the demonstration
12 months before the end of the demonstration or earlier. CorSolutions is not included in Table 15 because only 174 beneficiaries entered the program before its premature withdrawal from the evaluation in late August 2005. The analysis for CorSolutions for patients in the first six months of enrollment for all outcomes in Table 15 except mortality found only one significant treatment control difference, for colon cancer screening (treatment group rate of 6 percent, control group rate of 2 percent, p = 0.04 (Chen et al. 2007).
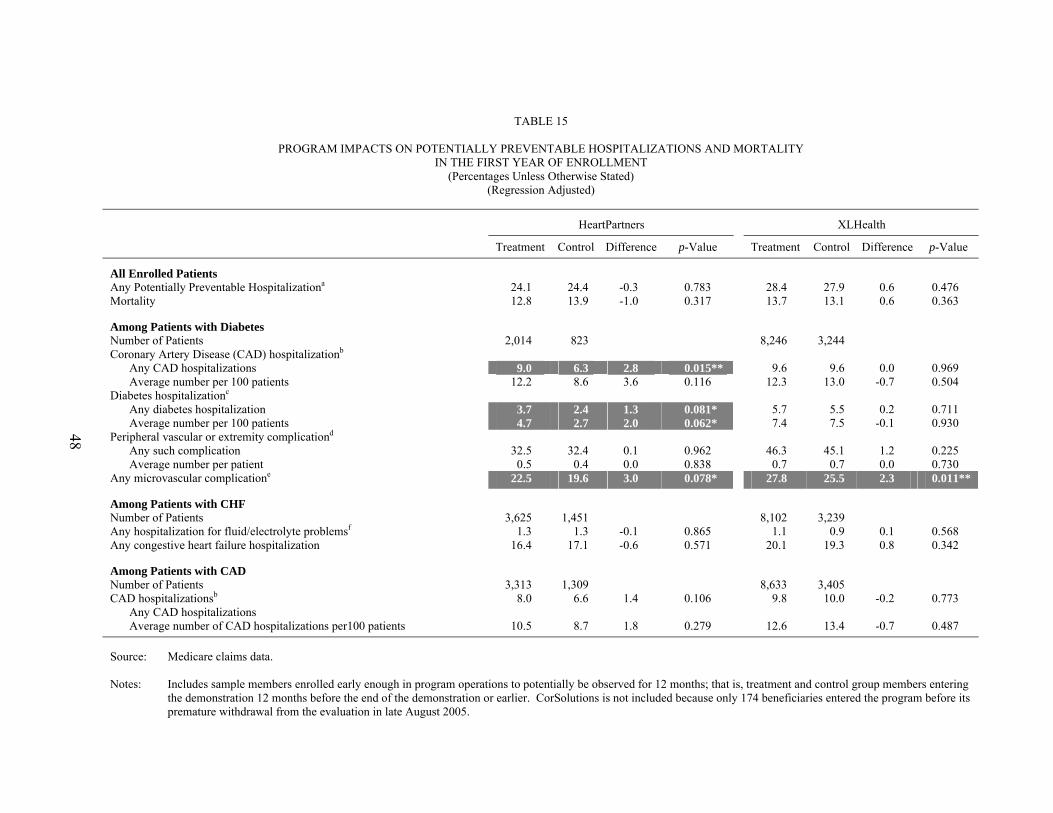
48
TABLE 15
PROGRAM IMPACTS ON POTENTIALLY PREVENTABLE HOSPITALIZATIONS AND MORTALITY IN THE FIRST YEAR OF ENROLLMENT
(Percentages Unless Otherwise Stated) (Regression Adjusted)
HeartPartners XLHealth
Treatment Control Difference p-Value Treatment Control Difference p-Value
All Enrolled Patients Any Potentially Preventable Hospitalizationa 24.1 24.4 -0.3 0.783 28.4 27.9 0.6 0.476 Mortality 12.8 13.9 -1.0 0.317 13.7 13.1 0.6 0.363
Among Patients with Diabetes Number of Patients 2,014 823 8,246 3,244 Coronary Artery Disease (CAD) hospitalizationb
Any CAD hospitalizations 9.0 6.3 2.8 0.015** 9.6 9.6 0.0 0.969 Average number per 100 patients 12.2 8.6 3.6 0.116 12.3 13.0 -0.7 0.504
Diabetes hospitalizationc Any diabetes hospitalization 3.7 2.4 1.3 0.081* 5.7 5.5 0.2 0.711 Average number per 100 patients 4.7 2.7 2.0 0.062* 7.4 7.5 -0.1 0.930
Peripheral vascular or extremity complicationd Any such complication 32.5 32.4 0.1 0.962 46.3 45.1 1.2 0.225 Average number per patient 0.5 0.4 0.0 0.838 0.7 0.7 0.0 0.730
Any microvascular complicatione 22.5 19.6 3.0 0.078* 27.8 25.5 2.3 0.011**
Among Patients with CHF Number of Patients 3,625 1,451 8,102 3,239 Any hospitalization for fluid/electrolyte problemsf 1.3 1.3 -0.1 0.865 1.1 0.9 0.1 0.568 Any congestive heart failure hospitalization 16.4 17.1 -0.6 0.571 20.1 19.3 0.8 0.342
Among Patients with CAD Number of Patients 3,313 1,309 8,633 3,405 CAD hospitalizationsb 8.0 6.6 1.4 0.106 9.8 10.0 -0.2 0.773
Any CAD hospitalizations Average number of CAD hospitalizations per100 patients 10.5 8.7 1.8 0.279 12.6 13.4 -0.7 0.487
Source: Medicare claims data. Notes: Includes sample members enrolled early enough in program operations to potentially be observed for 12 months; that is, treatment and control group members entering
the demonstration 12 months before the end of the demonstration or earlier. CorSolutions is not included because only 174 beneficiaries entered the program before its premature withdrawal from the evaluation in late August 2005.

49
TABLE 15 (continued) _______________________________________________________________________________________________________________________________________________
Enrollment in the study for evaluation purposes begins on the first day of the month following the month of random assignment. Treatment and control group members who did not meet the demonstration-wide requirements of CMS or were dead at the time of enrollment are excluded from this table. Members of the same households as the research sample members are also excluded. Observations are weighted according to the proportion of the follow-up period the sample member met CMS’s demonstration-wide requirements and was alive. Weights are normalized for treatment and control group members to sum to the number of observations in the group. Reverse shading ( ) with white numbers denotes a statistically significant treatment-control difference favoring the control group; that is, a higher rate of hospitalizations or complications in the treatment group than in the control group.
aAny hospitalizations for congestive heart failure, chronic obstructive pulmonary disease, dehydration, or urinary tract infection. bAny hospitalizations for acute myocardial infarction, coronary artery bypass graft surgery, percutaneous transluminal angioplasty, or coronary artery stenting. cAny hospitalizations for diabetes with hyperosmolarity, diabetes with ketoacidosis, diabetes with other (nonhyperosmolar and nonketotic) complications, diabetes with other (nonhyperosmolar and nonketotic) coma, or diabetes without mention of complications. dAny hospitalizations or other services for femoral-bypass procedure, peripheral circulatory disorders, lower limb amputation, incision and drainage of bone cortex, skin and subcutaneous debridement for gangrene, cutaneous gangrene, leg cellulitis, diabetic arthropathy or neurological disorders, osteomyelitis, or incision and drainage below fascia. eAny hospitalizations, claims, or change in enrollment status for diabetic eye disease, laser treatment for diabetic eye disease, nephropathy, or new ESRD. fAny hospitalizations for hyperkalemia, hypernatremia, hypokalemia, hyponatremia, or other fluid/electrolyte problems.
*Treatment and control group difference is significantly different from 0 at the 0.10 level, two-tailed test t-test that the regression coefficient on the treatment-control indicator in the regression model is significantly different from zero. **Treatment and control group difference is significantly different from 0 at the 0.05 level, two-tailed test t-test that the regression coefficient on the treatment-control indicator in the regression model is significantly different from zero. ***Treatment and control group difference is significantly different from 0 at the 0.01 level, two-tailed test t-test that the regression coefficient on the treatment-control indicator in the regression model is significantly different from zero. CAD = coronary artery disease; CHF = congestive heart failure.

50
Although these results are consistent with the overall findings from the evaluation of the Medicare Coordinated Care Demonstration (Peikes et al. 2007), another recent, large CMS chronic illness demonstration in fee-for-service Medicare, the current demonstration required the programs to have much larger enrollments and featured two important new elements: (1) placing the programs at financial risk for achieving savings, and (2) including a comprehensive pharmacy benefit. In fact, the substantial monthly per-patient payments to the three programs in this demonstration were due to the programs’ bearing full financial risk and the high expected costs of the drug benefit.
The pharmacy benefit did not have the impacts hoped for on improving access to
medications, nor did its combination with disease management services have the anticipated benefits on health care expenditures and care quality. The XLHealth program appears to have had modest impacts on some of the process measures of quality of care and may have started reducing Medicare expenditure for later enrollees, although the latter effects were far from the magnitude needed to attain cost neutrality or cost savings.
There are many reasons why the programs might not have been able to overcome the many
obstacles on the path to improved chronic illness care noted in Table 1. None of the three programs had experience working with large numbers of patients who were as ill, complex, or frail as the participants in this demonstration, or with operating in a Medicare fee-for-service environment. Trying to improve chronically ill people’s ingrained self-care behaviors is inherently difficult, and probably even more so among the elderly, sick enrollee population with whom the programs were unaccustomed to working. A relatively high proportion of enrollees apparently had access to drug coverage already, thus blunting any effects of the demonstration’s prescription benefit.
Despite the importance of physician behavior in perpetuating suboptimal chronic illness
care, none of the programs concentrated on changing physician behavior or coordinating care across providers. Compounding this relative lack of focus was the programs’ lack of experience in working in the Medicare fee-for-service environment.
In order for program staff to modify patients’ and physicians’ behavior, the quality of their
interactions with patients and physicians may matter as much as the frequency or intensity of their contacts. For example, HeartPartners had timely initial assessments, frequent contacts with patients and physicians, and did more service arranging for patients, but had no discernible impacts in any domain. It was beyond the scope of the independent evaluation, however, to directly observe a representative sample of interactions between the staff of the three demonstration programs and physicians and patients.
Although the reasons behind the evaluation’s generally negative results are unclear, they do
lead to the policy conclusions that widespread dissemination in Medicare fee-for-service of large scale disease management and pharmacy coverage programs similar to the three tested would not result in discernible savings in Medicare expenditures, and would therefore be far from cost neutral. Programs like these three would likely also not lead to major improvements in quality of care or beneficiary well-being.

51
REFERENCES
Anderson, Gerard, and Jane Horvath. “The Growing Burden of Chronic Disease in America.” Public Health Reports, vol. 119, May-June 2004, pp. 263–270.
Bagchi, Ann D., Dominick Esposito, Myoung Kim, James Verdier, and Deo Bencio. “Adherence to Medications for the Treatment of Congestive Heart Failure and Its Effect on Medicaid Expenditures.” Paper presented at the AcademyHealth Annual Research Meeting, Orlando, FL, June 2007.
Brown, Randall, Dominick Esposito, and Jennifer Schore. “Phase I Report on the Evaluation of Medicare Disease Management Programs.” Princeton, NJ: Mathematica Policy Research, Inc., October 2005.
Brown, Randall, Jennifer Schore, Nancy Archibald, Arnold Chen, Deborah Peikes, Karen Sautter, Bridget Lavin, Sherry Aliotta, and Todd Ensor. “Coordinating Care for Medicare Beneficiaries: Early Experiences of 15 Demonstration Programs, Their Patients, and Providers.” First report to Congress. Princeton, NJ: Mathematica Policy Research, Inc., December 2003.
Center on an Aging Society. “Multiple Chronic Conditions: A Challenge for the 21st Century.” Washington, DC: Georgetown University, November 2003.
Chen, Arnold, Randall S. Brown, Dominick Esposito, Jennifer Schore, and Rachel Shapiro. "Final Report for the Evaluation of Three Medicare Disease Management Programs." Princeton, NJ: Mathematica Policy Research, Inc. October, 2007.
Emmons, K.M., and S. Rollnick. “Motivational Interviewing in Health Care Settings. Opportunities and Limitations.” American Journal of Preventive Medicine, vol. 20, no. 1, January 2001, pp. 68–74.
Esposito, Dominick, Jennifer Schore, and Randall Brown. “Evaluation of Medicare Disease Management Programs: XLHealth Case Study Report.” Princeton, NJ: Mathematica Policy Research, Inc., November 2005.
Glanz, K., F.M. Lewis, and B.K. Rimer (eds). Health Behavior and Health Education—Theory, Research, and Practice. Second edition. San Francisco: Jossey-Bass, 1997.
Leatherman, Sheila, and Douglas McCarthy. “Quality of Health Care for Medicare Beneficiaries: A Chartbook.” The Commonwealth Fund, vol. 815, May 2005. [www.cmwf.org/publications/publications_show.htm?doc_id=275195]. Accessed July 13, 2007.
MCBS Project. “Health & Health Care of the Medicare Population: Data from the 2003 Medicare Current Beneficiary Survey.” Rockville, MD: Westat, 2006.

52
McGlynn, Elizabeth A., Steven M. Asch, J. Adams, J. Keesey, J. Hicks, A. DeCristofaro, and Eve A. Kerr. “The Quality of Health Care Delivered to Adults in the United States.” New England Journal of Medicine, vol. 348, no. 26, June 26, 2003, pp. 2635–2645.
Peikes, Deborah, Randall Brown, Arnold Chen, and Jennifer Schore. “Third Report to Congress on the Evaluation of the Medicare Coordinated Care Demonstration.” Draft report. Princeton, NJ: Mathematica Policy Research, Inc., July 25, 2007.
Safran, Dana Gelb, Patricia Neuman, Cathy Schoen, Michelle S. Kitchman, Ira B. Wilson, Barbara Cooper, Angela Li, Hong Chang, and William H. Rogers. “Prescription Drug Coverage and Seniors: Findings from a 2003 National Survey.” Health Affairs, Web Exclusives, January-June 2005, pp. W5-152–W5-166.
Von Korff, M., J. Gruman, J. Schaefer, et al. “Collaborative Management of Chronic Illness.” Annals of Internal Medicine, vol. 127, 1997, pp. 1097–1102.
Whitlock, E.P., C.T. Orleans, N. Pender, and J. Allan. “Evaluating Primary Care Behavioral Counseling Interventions: An Evidence-Based Approach.” American Journal of Preventive Medicine, vol. 22, no. 4, May 2002, pp. 267–284.