Embed Size (px)
Citation preview

The Centers for Medicare & Medicaid Services’ Office of Research, Development, and Information (ORDI) strives to make information available to all. Nevertheless, portions of our files including charts, tables, and graphics may be difficult to read using assistive technology. Persons with disabilities experiencing problems accessing portions of any file should contact ORDI through e-mail at ORDI 508 Compliance @cms.hhs.gov.
Final Report
on the
Evaluation of the Medical Adult Day Services Demonstration
Walter Leutz, PhD
Deborah Gurewich, PhD Christine Bishop, PhD
Grant Ritter, PhD Stephen Fournier, PhD
August 31, 2010 Submitted to: Submitted by: Centers for Medicare & Medicaid Services Brandeis University 7500 Security Boulevard Schneider Institutes for Health Policy Baltimore, MD 21244-1850 415 South Street Waltham, MA 02454-9110 Project Officer: Project Director: Susan Radke, M.S.W. Walter Leutz, PhD

i
INFORMATION NOT RELEASABLE TO THE PUBLIC UNLESS AUTHORIZED BY LAW:
This information has not been publicly disclosed and may be privileged and confidential. It is for internal government use only and must not be disseminated, distributed, or copied to persons not authorized to receive the information. Unauthorized disclosure may result in prosecution to the full extent of the law.
Table of Contents
Executive Summary…………………………………………………………………… iii Chapter I. Overview of the Demonstration and Evaluation ..........................................1
A. Overview ...................................................................................................................1 B. Congressional Mandate .............................................................................................1 C. Implementation of the Demonstration .......................................................................2 D. Summary of Findings ................................................................................................7
Chapter II. Evaluation Methodology ...............................................................................9 A. Implementation of Marketing and Service Delivery.................................................9 B. Satisfaction among Beneficiaries that Participated Versus Declined .....................10 C. Effects on Home Health Agency and MADC Finances ..........................................10 D. Effects on Home Health Quality and Service Use and Medicare Costs .................12
Chapter III. Findings .......................................................................................................14 A. Sketches of Individual Sites ....................................................................................14 B. Implementation of Marketing and Service Delivery ...............................................33 C. Satisfaction of Beneficiaries....................................................................................42 D. Effects on Home Health Agency and MADC Finances .........................................53 E. Effects on Home Health Service Use, Medicare Expenditures, and Quality ..........55
Chapter IV. Discussion of Findings, Challenges, Limitations, and Implications ......68 A. Demonstration Implementation...............................................................................68 B. Beneficiary Satisfaction ..........................................................................................69 C. Effects of the Demonstration on Home Health Agency and MADC Finances .......70 D. Effects of the Demonstration on Use of Home Health Services, Medicare
Expenditures, and Quality .......................................................................................70 E. Conclusions and Recommendations ........................................................................70
Appendix A: Text of Section 703 of the Medicare Prescription Drug, Improvement and Modernization Act of 2003 ..........................................................................73
Appendix B: Glossary ......................................................................................................75 Appendix C: Descriptive Statistics for Expenditure and Quality Regression
Analyses ................................................................................................................76

ii
INFORMATION NOT RELEASABLE TO THE PUBLIC UNLESS AUTHORIZED BY LAW:
This information has not been publicly disclosed and may be privileged and confidential. It is for internal government use only and must not be disseminated, distributed, or copied to persons not authorized to receive the information. Unauthorized disclosure may result in prosecution to the full extent of the law.
List of Tables Table 1: Participation Data .............................................................................................34 Table 2: Comparisons of Patients that Were Excluded, that Declined, and that
Participated ..........................................................................................................40 Table 3: Survey Sample and Response Rates by Site and Respondent Type .............43 Table 4: Characteristics of Participants Versus Decliners (N=461) ............................45 Table 5: Site Comparisons of Characteristics of Survey Samples ..............................45 Table 6: Experiences of Participants Versus Decliners with Home Health Services 46 Table 7: Satisfaction of Participants with Services Delivered in MADC Centers .....48 Table 8: Satisfaction of Participants with MADC Experience by Sub-Group
(N=199) ..................................................................................................................48 Table 9: Experience of Participants in the Demonstration (N=199) ...........................49 Table 10: Enrollees, Services, and Place of Service1 by Site (8/1/06-12/31/08) ..........57 Table 11: Effects of MADC Demonstration on Medicare Expenditures ....................63 Table 12: Effects of the MADC Demonstration on Health and Functional Status ....66

iii
INFORMATION NOT RELEASABLE TO THE PUBLIC UNLESS AUTHORIZED BY LAW:
This information has not been publicly disclosed and may be privileged and confidential. It is for internal government use only and must not be disseminated, distributed, or copied to persons not authorized to receive the information. Unauthorized disclosure may result in prosecution to the full extent of the law.
Executive Summary
Overview: This Report presents the findings of an independent evaluation of the Centers
for Medicare & Medicaid Services’ (CMS) Medical Adult Day Services Demonstration.
The demonstration was conducted by five home health agencies in five states from
August 1, 2006 through July 31, 2009, and examined the effects of allowing Medicare
home-health services to be delivered in medical adult day-care (MADC) facilities (called
"centers" herein) rather than only in a beneficiary’s home, as is required under current
law. Congress mandated the demonstration under Section 703 of the Medicare
Prescription Drug, Improvement, and Modernization Act of 2003 (Public Law 108-173).
Medicare home health services include skilled nursing, physical therapy (PT) speech
therapy (ST), occupational therapy (OT), medical social work, and home health aide
services. To be eligible for home health services, a beneficiary must need a covered
skilled service, have an order for care and a care plan signed by a physician, and be
homebound. To meet the qualifications of being homebound, leaving the home must be
taxing, and the only exceptions are getting medical care, going to religious services, and
attending MADC. Services are provided without patient copays. Medicare pays home
health agencies a prospective amount for each 60-day period of care (called an
"episode"). Beneficiaries can receive as many episodes of care as necessary, as long as
they continue to meet home health eligibility requirements.
The services provided by MADC centers vary by state, but core services generally
include meals, activities and games, trips in the community, nursing, and transportation to
and from the center. Compared to average Medicare beneficiaries, individuals that use
MADC tend to be older, more often receiving Medicaid, more physically and cognitively
disabled, and have more chronic illnesses. Under current law, home health patients can
attend a MADC center and still meet the homebound criterion, but they need to be at
home to receive Medicare home health services. This requirement may disrupt
beneficiaries' access to MADC.

iv
INFORMATION NOT RELEASABLE TO THE PUBLIC UNLESS AUTHORIZED BY LAW:
This information has not been publicly disclosed and may be privileged and confidential. It is for internal government use only and must not be disseminated, distributed, or copied to persons not authorized to receive the information. Unauthorized disclosure may result in prosecution to the full extent of the law.
Under the demonstration, home health agencies were allowed to deliver a portion of a
patient's Medicare home health services in a MADC center. This could be done either
through MADC centers owned by the home health agency or through contracts with
independent centers. Agencies were allowed to market the new service model to referral
sources (primarily hospitals, physicians, and elder services agencies), as well as to
patients directly. Participation in the demonstration by beneficiaries was voluntary, but
home health agencies were allowed to exclude home health patients that were not
appropriate to receive MADC services. Pursuant to the statute's requirements,
participating beneficiaries were not charged for MADC services furnished under the plan
of care. Rather, home health agencies paid the MADCs their daily rate or an enhanced
rate for the days participants attended MADC. Although Medicare does not cover
MADC, states may cover MADC as an optional or waiver service under Medicaid,
through Older American Act funds, and/or through state funds. Beneficiaries that do not
qualify for public funding may pay for care out-of-pocket.
Evaluation Methods: CMS contracted with Brandeis University to evaluate the
demonstration. The evaluation question underlying the demonstration was whether home
health outcomes could be improved if beneficiaries received some of their home health
services in MADC centers. The improvements could derive either from the way home
health was delivered in MADC centers, from participation in regular MADC activities, or
some combination of the two. The main policy questions addressed by the demonstration
were:
1. Can sponsors successfully recruit beneficiaries for the demonstration?
2. Is it feasible to deliver home health services in MADC centers?
3. Are patients interested in and satisfied with this service model?
4. How does this model affect the finances of agencies participating in the
demonstration?
5. What are the effects on quality of care, the use of home health services, and
overall Medicare costs?

v
INFORMATION NOT RELEASABLE TO THE PUBLIC UNLESS AUTHORIZED BY LAW:
This information has not been publicly disclosed and may be privileged and confidential. It is for internal government use only and must not be disseminated, distributed, or copied to persons not authorized to receive the information. Unauthorized disclosure may result in prosecution to the full extent of the law.
In Phase 1 of the evaluation, Brandeis completed case studies of the five demonstration
sites to assess the implementation process and to understand beneficiaries’ experience
with the new benefit. This included the experience of beneficiaries who were offered the
demonstration but declined ("decliners") as well as those who accepted the offer and
participated in the demonstration ("participants"). During Phase 2, Brandeis
implemented a phone-based satisfaction survey aimed at a sample of patients at the
participating sites and also conducted statistical analyses that drew on assessment, claims,
and agency patient data. The claims analysis focused on the use and cost of home health
services among demonstration participants and matched comparison subjects.
The Five Demonstration Sites: The demonstration operated for three years in five
selected home health agencies serving the following cities and nearby areas:
1. Brooklyn, New York (NY) - Metropolitan Jewish Health System and one MADC
center owned by Metropolitan. A total of 39 beneficiaries participated in the
demonstration at this site, representing 14% of the beneficiaries receiving home
health services from Metropolitan during the study period.
2. St Petersburg, Florida (FL) - Neighborly Care Network and four MADC centers
owned by Neighborly. A total of 160 beneficiaries participated in the
demonstration at this site, representing 17% of the beneficiaries receiving home
health services from Neighborly during the study period.
3. Pittsburgh, Pennsylvania (PA) - Landmark Home Health and seven MADC
centers under contract. A total of 281 beneficiaries participated in the
demonstration at this site, representing 16% of the beneficiaries receiving home
health services from Landmark during the study period.
4. Milwaukee, Wisconsin (WI) - Aurora Visiting Nurses Association and a single
MADC center owned by Aurora. A total of 80 beneficiaries participated in the
demonstration at this site, representing 8% of the Medicare beneficiaries receiving
home health services from Aurora during the study period.
5. McAllen, Texas (TX) - Doctors Care Home Health and 17 to 25 MADC centers
under contract. A total of 455 beneficiaries participated in the demonstration at

vi
INFORMATION NOT RELEASABLE TO THE PUBLIC UNLESS AUTHORIZED BY LAW:
This information has not been publicly disclosed and may be privileged and confidential. It is for internal government use only and must not be disseminated, distributed, or copied to persons not authorized to receive the information. Unauthorized disclosure may result in prosecution to the full extent of the law.
this site, representing 46% of the beneficiaries receiving home health services
from Doctors Care during the study period.
Metropolitan withdrew from the demonstration in February 2008 (18 months into the
demonstration) and Aurora withdrew in October 2008 (25 months in). The other three
sites operated for the full three years of the demonstration.
Findings: Findings concerning the five evaluation questions are summarized below.
1. Marketing and Recruitment. None of the sites reached their initial goals for
participants in the demonstration, and some fell far short. The levels of beneficiary
participation appeared to be a function of outreach to referral sources, the number of new
patients entering the home health agencies, how widely the demonstration was offered to
new patients and how often patients accepted, how often patients had multiple home
health episodes, and patients' prior experience with MADC. These factors were
interrelated, as described in the summary section.
Outreach to referral sources. Home health agency staff believed that the demonstration
would increase referrals from their current referral sources such as hospitals, nursing
homes, physicians, and state home-care programs. However, few if any additional
patients were referred by these sources. Home health staff said this was often because
would-be referrers did not have time to learn about the demonstration, and it also took too
much of their time to explain its details to beneficiaries.
Marketing to home health patients. Without increases in referrals from traditional
sources, the participating home health agencies focused on offering the demonstration to
new patients receiving home health services who might be eligible for and interested in
the program. The sites differed in their monthly flows of new home health patients
(ranging from 16 in the NY site to 54 in the PA site) and this was one factor in their
success in enrolling participants.

vii
INFORMATION NOT RELEASABLE TO THE PUBLIC UNLESS AUTHORIZED BY LAW:
This information has not been publicly disclosed and may be privileged and confidential. It is for internal government use only and must not be disseminated, distributed, or copied to persons not authorized to receive the information. Unauthorized disclosure may result in prosecution to the full extent of the law.
Frequency of offering and accepting. Three of the sites (FL, TX, and PA) offered the
demonstration in 90% or more of the episodes taking place during the demonstration,
while the WI and NY sites offered the demonstration in 53% and 55% of episodes
respectively. One factor in their rate of offering was the types of patients they targeted
and excluded among home health patients. All sites excluded patients whose conditions
made it difficult or dangerous to serve them in MADC settings, e.g., being bedbound,
immuno-suppressed, or with behaviors that were dangerous. The NY site excluded
patients with only one skilled home health need because the high MADC daily rate made
it impossible to achieve sufficient savings on just one service. The TX site targeted
patients who would need ongoing nursing care. Patients accepted the demonstration in
43% of the episodes in which it was offered in TX, but acceptance rates were between
13% and 24% at the other four sites. An analysis of Medicare claims found no consistent
differences in prior use of health care services or expenditures between beneficiaries that
were excluded, that participated, and that declined.
Repeat home health episodes. Sponsors differed in their patterns of offering additional
home health episodes after the initial episode. The average participant at the TX site had
more than 4.0 episodes of home health during the demonstration, while participants
averaged between 1.0 and 1.4 episodes at the other four sites. This factor significantly
affected enrollment success because participants qualifying for a single episode had to
leave the demonstration after 60 days at most, while a participant who qualified for a
subsequent episode could continue in the demonstration.
Prior experience with MADC. The evaluation collected data on whether new home
health patients had been in MADC in the 30 days prior to their home health admission.
The patterns at the sites differed dramatically: Only 3% of participants in the NY and PA
sites had been in MADC, compared to 35% in WI, 66% in FL, and 78% in TX. Decliners
had much lower rates of prior MADC use than participants, e.g., 2% in FL and WI, and
11% in TX.
viii
INFORMATION NOT RELEASABLE TO THE PUBLIC UNLESS AUTHORIZED BY LAW:
This information has not been publicly disclosed and may be privileged and confidential. It is for internal government use only and must not be disseminated, distributed, or copied to persons not authorized to receive the information. Unauthorized disclosure may result in prosecution to the full extent of the law.
The joint workings of these factors produced dramatically different enrollment results
across the sites. On the one end, the NY site had the smallest flow of new home health
patients (16 a month), a low rate of offering (55%), a low rate of accepting (24%), and no
participants with more than one episode. They recruited only one patient from the
MADC. In its 18 months in the demonstration the NY site served 39 patients with 39
episodes of care, for an average of 4 participants a month. The WI site's numbers were
nearly as low (7 participants per month) and they dropped out after 27 months. On the
other end, TX took in 30 new home health patients a month, they offered the
demonstration in 100% of the episodes, and patients accepted in 42% of the episodes.
The high acceptance rates appeared to be a function of repeat episodes for MADC
participants, i.e., patients already in the demonstration and in MADC were very likely to
opt to continue. For the 33 months of data available, the TX site served 455 participants
and had an average enrollment of 113 per month. The PA and FL sites served an average
of 25 and 13 patients per month respectively.
2. Delivery of home health services in MADC centers. Several issues were encountered
in setting up service delivery systems, including whether home health or MADC staff
would deliver home health services in the MADC centers; how home health functions
would be managed and coordinated, and how quality would be maintained.
Staffing. To deliver home health services in the MADC centers, three sites (FL, PA, and
WI) used home health staff rather than MADC staff, one site (NY) used MADC staff who
had home health experience, and one site (TX) initially used MADC nurses. The TX site
found that MADC nurses were too busy at many centers to perform home health
requirements, so they switched to using home health nurses.
Intake, care planning, care coordination, and discharge. Home health agency
respondents reported small but important changes in their intake, care planning and
discharge processes. First, they needed to modify intake processes to identify patients
who were eligible for the demonstration and to present an informed choice to patients
ix
INFORMATION NOT RELEASABLE TO THE PUBLIC UNLESS AUTHORIZED BY LAW:
This information has not been publicly disclosed and may be privileged and confidential. It is for internal government use only and must not be disseminated, distributed, or copied to persons not authorized to receive the information. Unauthorized disclosure may result in prosecution to the full extent of the law.
about joining. Second, they needed to specify in the patient care plans which services
would be delivered in the MADC and which would occur in the home; and they had to
apprise physicians, home health staff, transportation providers, and MADC centers of the
schedule. Third, they needed to establish systems to coordinate care when a patient did
not attend the MADC on a scheduled day. In these instances, the home health agency
needed to reschedule the service at home or in a new MADC visit, and the change might
involve rearranging transportation, billing for the MADC day, and/or changing the
physician's orders. Finally, discharge planners faced new demands from many patients
and families to help them find ways to continue day care after the end of their episode.
This was often difficult if not impossible due to high costs of MADC, low income of
patients, and long waiting lists for public programs.
Quality. The only potential quality of care issue expressed by agency staff related to the
effectiveness of PT and OT in the home versus the MADC setting. On the one hand,
some staff reported that therapy outcomes were better in the centers due to better
equipment and space. However, only two of the sites had MADC centers with such
equipment. On the other hand, some staff reported that outcomes were better at home,
particularly for patients with mild dementia, because family members were usually
present and could be trained to assist and reinforce training.
3. Beneficiary Satisfaction. The evaluation gathered information about beneficiary
satisfaction with home health services, participant satisfaction with MADC services, and
other experiences in MADC, including the demonstration's effects on out-of-pocket costs.
Methods. The evaluation assessed beneficiary satisfaction through in-person interviews
with participants (6 per site) and decliners (4 per site) during site visits that occurred a
little more than a year into operations, and through a telephone survey of 199 participants
and 262 decliners during the third year of the demonstration. In the survey, participants
were asked if they were very satisfied, somewhat satisfied, or dissatisfied about various
aspects of day care, and both participants and decliners were asked a four-part question

x
INFORMATION NOT RELEASABLE TO THE PUBLIC UNLESS AUTHORIZED BY LAW:
This information has not been publicly disclosed and may be privileged and confidential. It is for internal government use only and must not be disseminated, distributed, or copied to persons not authorized to receive the information. Unauthorized disclosure may result in prosecution to the full extent of the law.
about quality concerning home health services in the home and in MADC centers. Due
to the withdrawal of the NY site before the survey and the low enrollment in the WI site,
survey data are available for only the FL, PA and TX sites. Moreover, the number of
respondents in the FL and PA sites were too low to support multivariate analyses of
differences in satisfaction across sites or between participants and decliners.
Characteristics of respondents. Consistent with interviews conducted during the site
visits, decliners were significantly older than participants (mean age 77 compared to 74)
and also more likely to have diabetes, congestive heart failure, specified heart
arrhythmias, chronic obstructive pulmonary disease (COPD), and renal failure.
Otherwise decliners and participants were similar: More than half were female, almost
30% lived alone, 37% walked independently, and 46% had Medicaid. The only
differences among sites were that the FL site had a higher proportion of women, and the
TX site had higher proportions walking independently, receiving Medicaid, and being
younger.
Satisfaction with home health services delivered at home. Nearly 90% of both
participants and decliners said "yes" to three of the four satisfaction items concerning the
quality of the home health services they received at home, and one-third indicated that
they or their caregiver received training or education from the home health agency as part
of their episode of care. A separate analysis found that there were no significant
differences in satisfaction with home health services across the three sites with adequate
survey data (TX, PA and FL).
Satisfaction with services in the MADC. Consistent with what was reported during the
site visits, the overwhelming majority of participants (86%) were very satisfied with the
home health services they received in the MADC centers. Similarly, when asked to rate
their satisfaction with MADC, 82% were very satisfied. The mean age of very satisfied
participants was lower than participants who were not very satisfied (73 years versus 81
years), but satisfaction tended to be independent of a participant's gender, residential

xi
INFORMATION NOT RELEASABLE TO THE PUBLIC UNLESS AUTHORIZED BY LAW:
This information has not been publicly disclosed and may be privileged and confidential. It is for internal government use only and must not be disseminated, distributed, or copied to persons not authorized to receive the information. Unauthorized disclosure may result in prosecution to the full extent of the law.
status, ability to move around independently, need for assistance with daily activities
(such as bathing and dressing), and Medicaid enrollment.
Other experiences with MADC. Participants also provided information about other
experiences with MADC:
• 69% used van services to get to and from the MADC, while 14% used family or
friends.
• 85% reported that transportation worked very well, and 84% reported no
transportation costs.
• 15% were already paying for additional days in the MADC centers.
• 93% wanted to continue attending the MADC when their episode ended: 41% of
them were willing to pay, 43% were not, and a public program was already
paying for another 15%.
• The things participants most liked about MADC were socializing, activities and
games, and the thing they liked least was food.
• Among interview respondents, a few were saving money because the
demonstration paid for MADC days the respondents had been paying for, while a
few others had increased costs because they were paying for transportation.
• Among survey respondents, 37% had paid helpers in the home, and public
programs paid for 79% of the helpers.
• Among the 60% of respondents that had out-of-pocket costs and that reported
their spending levels, the median spending was $110 a week and the mean was
$236.
• There were no differences in out-of-pocket costs for participants and decliners.
Limitations of the survey and interviews. The results of the survey could be biased if
beneficiaries who chose not to respond had unsatisfactory results with their home health
care or their MADC. Other limitations include relatively high non-response rates to cost-
related questions, the necessarily subjective nature of responses to some questions, and
the inability to use adjusted, multivariate statistical models due to small sample sizes. It

xii
INFORMATION NOT RELEASABLE TO THE PUBLIC UNLESS AUTHORIZED BY LAW:
This information has not been publicly disclosed and may be privileged and confidential. It is for internal government use only and must not be disseminated, distributed, or copied to persons not authorized to receive the information. Unauthorized disclosure may result in prosecution to the full extent of the law.
is not possible to determine whether satisfaction outcomes are due to demonstration
effects or other unmeasured differences between participants and decliners.
4. Effects on Home Health Agency and MADC Finances. During the site visits, staff
members at all home health agencies reported that the demonstration was contributing to
financial losses rather than surpluses due to the 5% reduction in Medicare
reimbursement, added operational costs, and the failure to achieve efficiencies because of
small numbers of participants (except at TX). Similarly MADC staff reported that small
increases in their census were offset by small increases in their costs.
The evaluators examined Medicare cost report data to further assess impacts on home
health agency finances. Items tracked included the proportion of agency patients that
were Medicare, the proportion of the agency's patients that were in the demonstration, the
agency's focus on nursing versus other services, the number of episodes per patient, and
the agency's revenues. The cost report data had two limitations for tracking these
impacts. First, the most recent data covered less than the first half of the demonstration.
Second, data covered entire agencies while the demonstration occurred in small sub-parts
of the WI, NY, and PA agencies. It proved feasible to include only TX and FL agencies
in the cost report analysis.
At these sites, there were no clear patterns in the variables tracked. The TX agency
continued its sharp increase in total revenue and episodes per patient, but its net revenue
fell. The FL agency experienced modest growth in revenues, and its episodes per patient
fell after implementation.
5. Effects on Home Health Service Use, Medicare Expenditures, and Quality of Care.
The evaluation used Medicare eligibility and Part A and B claims (but not Part D) data to
assess the effects of the demonstration on the utilization of home health services, on
Medicare expenditures, and on the quality of home health care delivered to participants.

xiii
INFORMATION NOT RELEASABLE TO THE PUBLIC UNLESS AUTHORIZED BY LAW:
This information has not been publicly disclosed and may be privileged and confidential. It is for internal government use only and must not be disseminated, distributed, or copied to persons not authorized to receive the information. Unauthorized disclosure may result in prosecution to the full extent of the law.
Effects on the use of home health services. The mean number of visits per episode ranged
between 15.7 and 19.5 at all sites but WI, where the mean of 27.1 visits was largely
driven by higher use of home health aides. Nursing and PT were the predominant
services delivered to participants. Nearly half of all home health visits were provided in
MADC centers, with the NY highest at 60% and the FL site lowest at 39%. Home health
staff reported that reasons for continuing to deliver services in the home included:
conducting almost all initial nursing visits at home; participants' being too sick to attend
MADC, especially early in their episodes; serving patients at home until transportation
and application for MADC were set up; and patients' deciding to switch to home-based
services after initially attending MADC.
The most likely service to be delivered in MADC centers was PT, and the least likely was
home health aide. The TX site was much more likely to deliver PT visits in the home than
the MADC, and the FL site was much more likely to deliver nursing visits at home than
in the MADC. Three sites (TX, PA, and FL) delivered home health aide services
exclusively in the home. These sites' MADC centers were not equipped or staffed to
provide grooming or bathing services.
Effects on beneficiary health expenditures and functional status. By altering the setting
for provision of home health services from the home to a MADC center, the
demonstration aimed to reduce Medicare service expenditures while enhancing (or at
least not diminishing) outcomes for beneficiaries. The evaluation team used a standard
quasi-experimental design to estimate demonstration effects on Medicare expenditures
and health and functional status outcomes. The steps involved identifying the
participants to be included, selecting a comparison group of home health patients in the
community, collecting expenditure data from Medicare claims files, collecting functional
and health status data from Medicare's Outcome and Assessment Information Set
(OASIS) files, conducting multivariate regression analysis, and determining whether data
could be pooled across sites. The analyses used a pre-post design which compared the
changes in expenditures for participants in the year prior to starting the demonstration to

xiv
INFORMATION NOT RELEASABLE TO THE PUBLIC UNLESS AUTHORIZED BY LAW:
This information has not been publicly disclosed and may be privileged and confidential. It is for internal government use only and must not be disseminated, distributed, or copied to persons not authorized to receive the information. Unauthorized disclosure may result in prosecution to the full extent of the law.
the year after starting, to the changes in expenditures for matched comparisons in the year
before and after a pseudo-start date. There were sufficient numbers of participants to
conduct these analyses only at the FL, PA, and TX sites.
First, the analysis found no evidence of expenditure savings from the demonstration. On
the contrary, at all three sites the effect on total Medicare expenditures was positive. The
findings were significant at the 0.001 level in TX, where the year-to-year change in
Medicare expenditures for the participants was $5,398 higher on average than the year-
to-year change in total expenditures for the matched control group. For the other two
sites, the demonstration effects were also positive but not significant even at the 0.10
level. At the TX and PA sites the increased expenditures for participants were largely
due to increases in home health services ($5,861 in TX and $2,486 in PA - both
significant at 0.001). At the FL site increases among participants in inpatient claims
accounted for 60% of the demonstration effect, but none of the factors was significant.
These differentially higher expenditures were derived from regression models which
adjusted for demographic, health, and prior service utilization factors.
Second, the analysis found no evidence that the demonstration led to greater
improvement (or less decline) in functional status or among selected medical outcomes
for its participants. On the contrary, for the FL site, the evidence suggests that
demonstration participants improved differentially less than comparison patients in
ADLs, IADLs, bladder incontinence, and pain. There were no significant quality impacts
at the PA or TX sites.
Limitations of the analysis. For several reasons, the health and functional status findings
must be interpreted with caution. These include the lack of findings from two sites with
insufficient data, potential bias from missing post-start OASIS assessments among both
participants and comparisons, and small sample sizes at the PA and FL sites. With regard
to expenditures, inadequate sample size was not the issue. The evidence consistently
pointed toward differentially higher expenditures for demonstration participants.

xv
INFORMATION NOT RELEASABLE TO THE PUBLIC UNLESS AUTHORIZED BY LAW:
This information has not been publicly disclosed and may be privileged and confidential. It is for internal government use only and must not be disseminated, distributed, or copied to persons not authorized to receive the information. Unauthorized disclosure may result in prosecution to the full extent of the law.
However, quasi-experimental designs such as those used herein might contain
unobserved biases that influence findings.
Conclusions and Recommendations: The case studies showed that it is possible to
provide Medicare home health services in MADC centers and that a significant minority
of new home health patients may be interested in this model. Those who chose the
demonstration reported high rates of satisfaction with both attending MADC and
receiving their home health in the MADC center. However, there was no evidence that
the demonstration reduced Medicare expenditures or improved quality of care. In fact, in
relation to matched comparison groups, overall Medicare expenditures were increased at
the TX demonstration site, and home health quality was lower on several measures at the
FL demonstration site. There was also some evidence that the demonstration had
negative effects on home health agency finances through increased costs and decreased
revenues.
Findings from the quantitative analysis of demonstration impacts on expenditures and
quality need to be interpreted with caution, primarily due to the small study groups at the
PA and FL sites and to the fact that only three sites are included in the quantitative
analysis. Also, findings from the quantitative analysis should be weighed against the
positive findings concerning satisfaction reported by participants in the survey and in
face-to-face interviews with beneficiaries, family members, and home health and day
care staff members.
The decision about whether to continue to explore the demonstration model for delivering
home health services is a matter for policy makers. If there is further testing, it would be
useful to have a larger sample, which would support more reliable conclusions.
Additionally, the demonstration experience suggests four areas that are important
components in the design and implementation of a MADC Medicare benefit:

xvi
INFORMATION NOT RELEASABLE TO THE PUBLIC UNLESS AUTHORIZED BY LAW:
This information has not been publicly disclosed and may be privileged and confidential. It is for internal government use only and must not be disseminated, distributed, or copied to persons not authorized to receive the information. Unauthorized disclosure may result in prosecution to the full extent of the law.
• Beneficiary choice: Home health agencies would need an approach to offering
beneficiaries the option to be served in a MADC center that ensures informed
choice.
• Service delivery: Home health agencies would need to ensure that their services
are appropriately delivered in MADC centers.
• MADC collaboration: Collaboration between home health agencies and day-care
centers would be required.
• Payment to the MADC center: Including the demonstration's requirement that the
home health agency pay for the day in the MADC appears to undermine financial
feasibility and limit the appeal of the model for home health agencies. However,
removing this requirement would mean that only patients who can obtain
Medicaid payment for MADC or who can pay out of pocket could participate.

1
INFORMATION NOT RELEASABLE TO THE PUBLIC UNLESS AUTHORIZED BY LAW:
This information has not been publicly disclosed and may be privileged and confidential. It is for internal government use only and must not be disseminated, distributed, or copied to persons not authorized to receive the information. Unauthorized disclosure may result in prosecution to the full extent of the law.
Chapter I. Overview of the Demonstration and Evaluation
A. Overview
This Report presents the findings of an independent evaluation of the Centers for Medicare &
Medicaid Services’ (CMS) Medical Adult Day Services Demonstration. The demonstration was
conducted by five home health agencies in five states from August 1, 2006 through July 31,
2009, and examined the effects of allowing Medicare home-health services to be delivered in
medical adult day-care (MADC) facilities (called "centers" herein) rather than only in a
beneficiary’s home. This Report constitutes the final evaluation of the demonstration and
includes analysis of the full 36 months of the demonstration on implementation measures and the
first 30 months on cost and outcome measures. Only 30 months of cost and outcome data were
available due to the need to conduct analyses in July 2009. Only participants starting by
December 2007 could be included in the analysis, which required a year of claims after the start
date, plus six months to have complete claims in the CMS data system.
This report examines, among other things, the following:
• Implementation of the service model;
• Beneficiary participation patterns;
• Beneficiary satisfaction with the model;
• Effects on MADC and home health agency finances;
• Effects on use of services and quality of care;
• Cost offsets to expanding the delivery of home health services to MADC settings.
B. Congressional Mandate
Congress mandated the demonstration under Section 703 of the Medicare Prescription Drug,
Improvement, and Modernization Act of 2003 (Public Law 108-173). The demonstration
permitted a home health agency "directly or under arrangements with a medical adult day-care

2
INFORMATION NOT RELEASABLE TO THE PUBLIC UNLESS AUTHORIZED BY LAW:
This information has not been publicly disclosed and may be privileged and confidential. It is for internal government use only and must not be disseminated, distributed, or copied to persons not authorized to receive the information. Unauthorized disclosure may result in prosecution to the full extent of the law.
facility, to provide medical adult day-care services as a substitute for a portion of home health
services that would otherwise be provided in the beneficiary's home.” (See Appendix A for the
full text of the legislation.) Section 703(b)(1) of the law, in general, directed that home health
agencies be paid 95% of what they would otherwise have been reimbursed by Medicare for an
episode of care, and it also prohibited home health, or a MADC center, under arrangements with
a home agency, from separately charging beneficiaries for MADC services that were part of a
home health plan of care. Section 703(h) of the statute directed the Secretary of Health and
Human Services to conduct an evaluation of the clinical effectiveness and cost-effectiveness of
the demonstration. Currently, Medicare coverage for home health services is limited to
providing the services in a beneficiary’s home. The central purpose of the demonstration was to
test whether allowing portions of the Medicare home health benefit to be delivered in MADC
centers affected beneficiary outcomes and the costs of delivering home health services.
C. Implementation of the Demonstration
This section describes how the legislation was implemented. First, it describes the Medicare
home health benefit and MADC services, including the impact of the current requirement that
beneficiaries be at home to receive home health services. Second, it describes how home health
agencies and MADC centers collaborated to offer demonstration services, including how the
demonstration was offered to beneficiaries. Finally, it describes the evaluation of the
demonstration.
Medicare home health and medical adult day care. Medicare home health services include
skilled nursing, PT, speech therapy, OT, medical social work, and home health aide services.
Services are provided without patient copays. Generally, Medicare covers home health care
when five conditions are met:
• The patient is in need of intermittent skilled nursing services, or needs PT or speech
therapy services, or has a continuing need for OT services;
• A physician orders the care;
• The patient is under the care of a physician and has a plan of care established and
periodically reviewed by the physician;

3
INFORMATION NOT RELEASABLE TO THE PUBLIC UNLESS AUTHORIZED BY LAW:
This information has not been publicly disclosed and may be privileged and confidential. It is for internal government use only and must not be disseminated, distributed, or copied to persons not authorized to receive the information. Unauthorized disclosure may result in prosecution to the full extent of the law.
• Beneficiaries are “homebound,” which is defined as the normal inability to leave the
home; leaving takes a considerable and taxing effort, and absences are for an infrequent
and short duration, or to receive medical care, to attend religious service or to attend a
licensed/certified adult day care program.
• The patient must receive services from a home health agency participating in Medicare.
Medicare pays home health agencies a prospective amount for each 60-day period of care (called
an "episode"). Beneficiaries can receive as many episodes of care as necessary, as long as they
continue to meet home health eligibility requirements.
The services provided by MADC centers vary by state, but core services generally include meals,
activities and games, trips in the community, nursing, and transportation to and from the center.
Some state Medicaid programs also cover physical and other therapies, nutrition, social work,
bathing, grooming, medication administration, and other services. The MADC "day" typically
lasts from 5 to 7 hours. Compared to average Medicare beneficiaries, individuals that use
MADC tend to be older, more often receiving Medicaid, more physically and cognitively
disabled, and have more chronic illnesses.
Under current law, home health patients can attend a MADC center and still meet the
homebound criterion, but they need to be at home to receive Medicare home health services.
This requirement may disrupt beneficiaries' access to MADC and also affect family caregivers'
reliance on MADC for respite. First, home health patients cannot set up a reliable schedule to
attend MADC, since it is difficult for home health agencies to tell them much in advance when
home health services will be delivered. Given the need to arrange transportation and the capacity
constraints at MADC centers, a "drop in" model is not likely to be feasible. Second, not being
able to attend MADC may also interrupt family caregivers’ use of MADC for respite. This may
be especially important for working caregivers who have been using MADC for respite prior to
the home health episode.
How Medicare home health services were delivered in MADC centers. Under the
demonstration, home health agencies were allowed to deliver a portion of a patient's Medicare

4
INFORMATION NOT RELEASABLE TO THE PUBLIC UNLESS AUTHORIZED BY LAW:
This information has not been publicly disclosed and may be privileged and confidential. It is for internal government use only and must not be disseminated, distributed, or copied to persons not authorized to receive the information. Unauthorized disclosure may result in prosecution to the full extent of the law.
home health services in a MADC center. This could be done either through MADC centers
owned by the home health agency or through contracts with independent centers. Medicare
home health services could be delivered either by qualified MADC staff or by staff of the
sponsoring home health agency. Agencies were allowed to market the new service model to
referral sources (primarily hospitals, physicians, and elder services agencies), and they were
allowed to establish exclusion criteria for patients who would not be appropriate for the new
service model. The agencies then offered non-excluded patients who began a home health
episode the option to participate in the demonstration. On a patient-by-patient basis, home health
agencies were allowed to choose whether to deliver all or part of a participant's home health
services in the MADC center.
Participation in the demonstration by beneficiaries was voluntary, but home health agencies were
allowed to exclude home health patients that were not appropriate to receive MADC services.
Pursuant to the statute's requirements, participating beneficiaries were not charged for MADC
services furnished under the plan of care.
Participating home health agencies did not pay for additional days of MADC services when
home health services were not being delivered there. Although Medicare does not cover MADC,
states may cover MADC as an optional or waiver service under Medicaid, through Older
American Act funds, and/or through state funds. Beneficiaries that do not qualify for public
funding may pay for care out-of-pocket. Thus some participants could and did receive additional
days of MADC beyond the days paid by home health agencies.
The demonstration operated for three years in five selected home health agencies serving the
following cities and nearby areas:
• Milwaukee, Wisconsin (WI) - Aurora Visiting Nurses Association and a single MADC
center owned by Aurora. A total of 80 beneficiaries participated in the demonstration at
this site, representing 8% of the Medicare beneficiaries receiving home health services
from Aurora during the study period.

5
INFORMATION NOT RELEASABLE TO THE PUBLIC UNLESS AUTHORIZED BY LAW:
This information has not been publicly disclosed and may be privileged and confidential. It is for internal government use only and must not be disseminated, distributed, or copied to persons not authorized to receive the information. Unauthorized disclosure may result in prosecution to the full extent of the law.
• Pittsburgh, Pennsylvania (PA) - Landmark Home Health and seven MADC centers under
contract. A total of 281 beneficiaries participated in the demonstration at this site,
representing 16% of the beneficiaries receiving home health services from Landmark
during the study period.
• St Petersburg, Florida (FL) - Neighborly Care Network and four MADC centers owned
by Neighborly. A total of 160 beneficiaries participated in the demonstration at this site,
representing 17% of the beneficiaries receiving home health services from Neighborly
during the study period.
• Brooklyn, New York (NY) - Metropolitan Jewish Health Care and one MADC center
owned by Metropolitan. A total of 39 beneficiaries participated in the demonstration at
this site, representing 14% of the beneficiaries receiving home health services from
Metropolitan during the study period.
• McAllen, Texas (TX) - Doctors Care Home Health and 17 to 25 MADC centers under
contract. A total of 455 beneficiaries participated in the demonstration at this site,
representing 46% of the beneficiaries receiving home health services from Doctors
during the study period.
Metropolitan withdrew from the demonstration in February 2008 (18 months into the
demonstration) and Aurora withdrew in October 2008 (25 months in). The other three sites
operated for the full three years of the demonstration.
Evaluation of the demonstration. CMS contracted with Brandeis University to evaluate the
demonstration. The evaluation question underlying the demonstration was whether home health
outcomes could be improved if beneficiaries received some of their home health services in
MADC centers. The improvements could derive either from the way home health was delivered
in MADC centers, from participation in regular MADC activities, or some combination of the
two. The main policy questions addressed by the demonstration are:
• Can sponsors successfully recruit beneficiaries for the demonstration?
• Is it feasible to deliver home health services in MADC centers?
• Are patients interested in and satisfied with this service model?

6
INFORMATION NOT RELEASABLE TO THE PUBLIC UNLESS AUTHORIZED BY LAW:
This information has not been publicly disclosed and may be privileged and confidential. It is for internal government use only and must not be disseminated, distributed, or copied to persons not authorized to receive the information. Unauthorized disclosure may result in prosecution to the full extent of the law.
• How does this model affect the finances of agencies participating in the demonstration?
• What are the effects on quality of care, the use of home health services, and overall
Medicare costs?
Brandeis conducted the evaluation through a series of interrelated activities. In Phase 1, the
evaluation team completed case studies of the five demonstration sites. The goals of case studies
were to assess the implementation process and to understand beneficiaries’ experience with the
new benefit. This included the experience of beneficiaries who were offered the demonstration
but declined ("decliners") as well as those who accepted the offer and participated in the
demonstration ("participants"). Whether they were decliners or participants, both groups were
patients of the home health agencies. To prepare the case studies, the team reviewed
implementation protocols, assessment forms, contracts, and other documents. Then the team
visited each of the demonstration sites to interview professional staff and beneficiaries.
Phase 1 of the evaluation also included a preliminary descriptive analysis of the services
provided by the five home-health agencies and the beneficiaries they served. The beneficiary
analysis included the mix of patients by gender, and whether they were:
• Excluded from the demonstration and why;
• Offered participation and agreed to participate or not;
• Recent MADC users prior to beginning their home health care.
During Phase 2, Brandeis implemented a phone-based satisfaction survey aimed at a sample of
patients at the participating sites. The survey assessed the experiences and satisfaction of
participants and decliners with home health services delivered in the home. Separate survey
questions asked only of participants covered satisfaction with home health services delivered in
the MADC, as well as satisfaction and experiences with MADC services.
During Phase 2 of the evaluation, Brandeis also conducted statistical analyses that drew on the
Outcome and Assessment Information Set (OASIS), home health agency Medicare claims, and
home health agency patient data from the CMS Data Center using the Data Extract System
7
INFORMATION NOT RELEASABLE TO THE PUBLIC UNLESS AUTHORIZED BY LAW:
This information has not been publicly disclosed and may be privileged and confidential. It is for internal government use only and must not be disseminated, distributed, or copied to persons not authorized to receive the information. Unauthorized disclosure may result in prosecution to the full extent of the law.
(DESY). Claims for demonstration participants included an indicator of whether each home
health service was delivered in the home or a MADC, which allowed an analysis of service
delivery patterns. The analysis also focused on the use and cost of home health services among
demonstration participants and matched comparison
subjects. The comparison subjects resided in the market areas of the participating home health
agencies, but they were not served by these agencies. The statistical analysis examined
demonstration effects related to quality and health and functional-status outcomes, health service
utilization, and Medicare costs. A separate analysis used Medicare cost report data to assess
changes in the populations served and the financial status of participating home health agencies.
Brandeis concluded this phase with a synthesis of findings from the case studies, descriptive
analyses, analyses of cost and quality, and the satisfaction survey to assess the possible effects of
implementing the demonstration model as well as how the model might be improved.
D. Summary of Findings
Evaluation results show that it was possible to recruit beneficiaries for the demonstration model,
but it was difficult for home health agencies to use the demonstration as a way to increase
referrals. Case study results indicate that it was feasible to deliver home health services in
MADC centers, and the most successful model was to use home health agency staff or staff with
experience in home health. Analyses of indicators of place of service on home health claims
found that about half of home health services for participants were delivered in MADC centers,
and half continued to be delivered at home. Results from face-to-face interviews and the
telephone survey indicate that home health patients that were older and in poorer health were
more likely to decline participation in the demonstration. Participants were highly satisfied with
the MADC demonstration services, and their satisfaction with home health services was similar
to beneficiaries who declined to participate in the demonstration. Participants overwhelmingly
expressed a desire to continue at the MADC center after their episode of care.
There is no evidence from quantitative analyses that used matched comparison beneficiaries of
either cost savings for Medicare or improvements in beneficiary functional status. However, the
findings should be interpreted with caution due to small sample sizes at the FL and PA sites, and

8
INFORMATION NOT RELEASABLE TO THE PUBLIC UNLESS AUTHORIZED BY LAW:
This information has not been publicly disclosed and may be privileged and confidential. It is for internal government use only and must not be disseminated, distributed, or copied to persons not authorized to receive the information. Unauthorized disclosure may result in prosecution to the full extent of the law.
to numbers of episodes per patient at the at the TX site that are much higher than the other sites.
First, evaluation analyses of Medicare claims at the three sites with adequate numbers of
participants for analysis found no evidence that the demonstration reduced Medicare
expenditures. The FL and PA sites showed no difference in expenditures, while the Texas site
showed substantial increases in Medicare expenditures, primarily due to large increases in home
health utilization. Second, evaluation analyses of data from OASIS assessments performed by
home health agencies found that the demonstration did not lead to greater improvement or less
decline in beneficiary functional status or selected health conditions. In fact, participants in the
FL site showed decrements in functional status relative to comparison beneficiaries. Finally,
there appeared to be no evidence that the demonstration had a positive effect on the finances of
either home health agencies or MADC centers.

9
INFORMATION NOT RELEASABLE TO THE PUBLIC UNLESS AUTHORIZED BY LAW:
This information has not been publicly disclosed and may be privileged and confidential. It is for internal government use only and must not be disseminated, distributed, or copied to persons not authorized to receive the information. Unauthorized disclosure may result in prosecution to the full extent of the law.
Chapter II. Evaluation Methodology
The evaluation addressed:
• The implementation of the demonstration, including marketing and service delivery, and
the characteristics of participating beneficiaries;
• Medicare patients' views of the care they received from demonstration providers;
• Effects of the demonstration on home health agency and MADC finances;
• Effects of the demonstration on the use of home health services, the quality of care, and
Medicare expenditures.
The evaluation's approaches in each of these areas are detailed below.
A. Implementation of Marketing and Service Delivery
The evaluation examined implementation of the demonstration by analyzing participating sites'
operational protocols, tracking participation data submitted by sites to the evaluator, and visiting
each of the sites. The sites' operational protocols detailed marketing plans, patient-exclusion
criteria, and operational and clinical arrangements between home health agencies and MADC
centers. In the fall of 2007, the evaluation team conducted site visits, which included
observations at MADC centers. The team also interviewed home health agency staff, MADC
center staff, aging network staff (i.e., state and local staff managing services funded through the
Older Americans Act and related state funding), six beneficiary participants, and four decliners
at each site. The beneficiaries were selected randomly by gender from active participants and
then recruited by the evaluators. Most of the interviews were conducted in beneficiaries' homes.
To help the evaluators to understand participation patterns, demonstration home health agencies
reported the following data monthly for each patient starting a 60-day home health payment
episode: patient Medicare identification number, patient gender, whether the patient was offered
participation, reason for exclusion if excluded, whether the patient accepted or declined
participation, and whether the patient had used MADC in the prior month. These patient data
were linked to Medicare claims. These data were analyzed to identify and compare patterns of
10
INFORMATION NOT RELEASABLE TO THE PUBLIC UNLESS AUTHORIZED BY LAW:
This information has not been publicly disclosed and may be privileged and confidential. It is for internal government use only and must not be disseminated, distributed, or copied to persons not authorized to receive the information. Unauthorized disclosure may result in prosecution to the full extent of the law.
exclusion by home health agencies, and to compare prior MADC use and home health utilization
patterns among patients that participated and declined to participate.
The evaluation team explored service-delivery issues that included:
• Staffing of home health services in MADC;
• Changes if any in home health intake, care planning, and discharge;
• Coordination of care;
• Effects on quality.
B. Satisfaction among Beneficiaries that Participated Versus Declined
The evaluation assessed beneficiary satisfaction through interviews during the site visits and
through a telephone survey conducted in the final year of the demonstration.1
In both the
interviews and the survey, the objectives were: (1) to collect health status and demographic
information, assess satisfaction with home health services, and determine out-of-pocket costs for
home-based and community-based services; and (2) to compare interview and survey results for
participants and decliners. Additionally, the interviews and survey asked participants but not
decliners about their experiences and satisfaction with MADC services and with home health
services delivered in the MADC centers.
C. Effects on Home Health Agency and MADC Finances
The evaluation collected information on the effects of the demonstration on agency finances
through interviews with administrators of home health agencies and MADC centers during site
visits, and through review of Medicare cost reports submitted by home health agencies to CMS.
The demonstration model anticipated that the demonstration would increase referrals to
participating home health agencies, and also that the delivery of services in MADC centers
would realize efficiencies. Those efficiencies would primarily come from reducing staff travel
costs and also through quicker rehabilitation in centers that were staffed and equipped to provide 1 The survey was approved by OMB (approval # 0938-1017).
11
INFORMATION NOT RELEASABLE TO THE PUBLIC UNLESS AUTHORIZED BY LAW:
This information has not been publicly disclosed and may be privileged and confidential. It is for internal government use only and must not be disseminated, distributed, or copied to persons not authorized to receive the information. Unauthorized disclosure may result in prosecution to the full extent of the law.
and reinforce therapies. Family members often support compliance with therapies provided in
the home. The central question for home health agencies was whether potential savings on travel
and therapy outcomes would offset the extra costs of paying the MADC center per diem, the 5%
loss in Medicare reimbursement, and any other costs associated with the demonstration. The
question for MADC centers was whether the demonstration would improve finances through
increased census, and whether these improvements were offset by additional expenses.
The analysis of Medicare home health agency cost report data included the:
• Number of skilled nursing visits provided to Medicare patients and total skilled nursing
visits;
• Total visits provided to Medicare patients and to all patients;
• Number of unduplicated Medicare and total patients;
• Total Medicare episodes;
• Total patient revenue;
• Net revenue (revenue minus cost) attributable to service to patients.
These variables were used to construct indicators of the scale of the home health agencies
participating in the demonstration (i.e., total visits and total patient revenues), commitment to
Medicare (proportion of total visits provided to Medicare patients), and the service approach.
The latter involved the episodes per unduplicated Medicare patient, the proportion of total
Medicare visits that were skilled nursing visits, and the visits per Medicare episode.
The evaluation design included consideration of the impact of the demonstration on other home
health agencies in the market area. The design called for examining trends in the share of
Medicare and total home health patient services held by the demonstration agencies compared to
other agencies in each market, and on the competitiveness of the home health sector in each
market. However, it proved impossible to develop consistent market-area definitions for the
demonstration agencies.2 In any event, the amount of service provided under the demonstration
2 A combination of factors led to this situation: differences by agency in whether they reported their service area in terms of Core Based Statistical Areas (CBSAs) or Metropolitan Statistical Areas (MSAs),

12
INFORMATION NOT RELEASABLE TO THE PUBLIC UNLESS AUTHORIZED BY LAW:
This information has not been publicly disclosed and may be privileged and confidential. It is for internal government use only and must not be disseminated, distributed, or copied to persons not authorized to receive the information. Unauthorized disclosure may result in prosecution to the full extent of the law.
was extremely small relative to the markets in which these agencies operated, and thus market
effects were likely minimal.
D. Effects on Home Health Quality and Service Use and Medicare Costs
The objectives of this analysis were to examine how coverage of home health services in MADC
centers affected patient utilization of Medicare services, Medicare spending on home health
services, and the quality of home health services. Two types of analyses were conducted. The
first compared participants to decliners and to patients who were not offered participation.
Statistical tests were used to assess how these groups differed in terms of health care utilization
before and after their episodes of home health care.
Second, to better estimate a demonstration effect in a situation where selection may be an issue,
participants were matched, based on gender, age group, and HCC (Hierarchical Condition
Categories) indicators,3 to a comparison group of similar subjects who received home health
services from non-participating home health agencies in the same market areas. This comparison
group analysis looked at the effects of the demonstration on Medicare expenditures and on
Medicare home health quality. Difference-in-difference multivariate regression models were
used and included covariates for age group, gender, and Medicare DCG (Diagnostic Cost
Groupings) risk score.4 These models assessed whether changes in Medicare expenditures for
home health, hospitals, skilled nursing facilities, outpatient, and physician services from the year
directly prior to the date of participants' first home health episode (or the pseudo-start date for
comparisons) to the year after the start date were significantly different for these matched
groups. These models were also used to compare quality of care. The evaluation team used data
overlapping but not contiguous areas with potential comparison agencies, changes during 2006 and 2007 in the CBSA/MSA reporting systems, and differences in large agencies between the county of the agency's address and the county served in the demonstration. Given these factors, it was impossible to consistently define a set of the agencies that truly overlapped with the market area of the Demonstration agencies. 3 Hierarchical Condition Categories are a set of 184 diagnosis categories used for Medicare risk adjustment. 4 Medicare's DCG risk score makes use of a beneficiary's prior diagnoses to estimate relative annual medical care expenditures compared to those of an average Medicare beneficiary. As such, the DCG may be used in regressions as a measure of the beneficiary's health condition.

13
INFORMATION NOT RELEASABLE TO THE PUBLIC UNLESS AUTHORIZED BY LAW:
This information has not been publicly disclosed and may be privileged and confidential. It is for internal government use only and must not be disseminated, distributed, or copied to persons not authorized to receive the information. Unauthorized disclosure may result in prosecution to the full extent of the law.
from Medicare OASIS files to construct scales for activities of daily living, instrumental ADLs,
and cognitive/behavioral status, as well as individual measures for ambulation, incontinence, and
medical problems. These quality measures were used as outcomes in the regression analyses,
which determined whether participants or comparisons were doing better in that domain on the
follow-up home health assessment compared to the initial assessment. Both expenditure and
quality analyses were conducted separately for each agency's market area because the
demonstration was implemented so differently at each site.

14
INFORMATION NOT RELEASABLE TO THE PUBLIC UNLESS AUTHORIZED BY LAW:
This information has not been publicly disclosed and may be privileged and confidential. It is for internal government use only and must not be disseminated, distributed, or copied to persons not authorized to receive the information. Unauthorized disclosure may result in prosecution to the full extent of the law.
Chapter III. Findings
This chapter presents the results of the evaluation regarding the implementation of the
demonstration, home health agency finances, beneficiary satisfaction, and impacts on Medicare
costs, quality and service utilization. Prior to presenting the summary analyses and findings,
sketches of each of the five sites are presented.
A. Sketches of Individual Sites
This section provides an overview of how each of the sites organized and implemented the
demonstration. The information is based primarily on site visits conducted a little more than a
year into operations. During the site visits evaluation staff interviewed both program staff and
beneficiaries.
Metropolitan Jewish Health System, Brooklyn, New York
Sponsor. Metropolitan Jewish Health System, the sponsor of the Brooklyn site, owns about 900
nursing home beds, a Medicare Advantage plan, a prepaid Medicaid managed care organization,
the second-largest home health agency in New York City (only the Brooklyn branch was in the
demonstration), senior housing, a hospice program, and the participating MADC center.
Metropolitan is located in the Borough Park neighborhood in southwest Brooklyn, which is a
diverse, multi-ethnic community that in recent years has experienced large influxes of Russian
and Chinese immigrants, who add to the existing Jewish, Italian, and Latino communities.
Targeting. For the demonstration, the site targeted beneficiaries with at least two Medicare home
health service needs, for example nursing and PT. They also tried to target beneficiaries who
could receive all of their home health services in the MADC, i.e., no services at home.
Metropolitan considered both these conditions necessary in order for the demonstration to be
cost-effective, given the high MADC daily rate of $166. Beneficiaries with a primary mental
health diagnoses, a diagnosis of dementia and those who were too frail to attend the MADC for
five hours were excluded from the demonstration.

15
INFORMATION NOT RELEASABLE TO THE PUBLIC UNLESS AUTHORIZED BY LAW:
This information has not been publicly disclosed and may be privileged and confidential. It is for internal government use only and must not be disseminated, distributed, or copied to persons not authorized to receive the information. Unauthorized disclosure may result in prosecution to the full extent of the law.
Marketing. The site's original plan was to use the demonstration to attract new home health
patients to help fill an excess capacity of 30 spaces of 160 spaces per day in the MADC.
Marketing staff from the home health agency regularly visited agencies such as Metropolitan
nursing homes and area hospitals, and they asked them to keep the demonstration in mind when
making home health referrals. Despite these efforts, very few patients were referred to the home
health agency in order to obtain services in the demonstration. This left the regular flow of
patients into the home health agency, and the biggest enrollment challenge was the small flow of
patients who met the criterion of needing two skilled services and not being a Medicare
Advantage member. Similarly, few MADC participants met these criteria. Another marketing
challenge was that many dually eligible beneficiaries already had home attendants through
Medicaid. Medicaid regulations required that an attendant could not provide services at the
MADC center, so if the beneficiary agreed to join the demonstration, the attendant lost hours and
might ask to be transferred to another client with more hours.
Service Delivery and Care Coordination. The MADC offered traditional socialization activities,
nursing, therapies in a fully equipped room, meals, a beauty parlor, an easily accessible
whirlpool bath, a diabetes clinic, a hypertension clinic, wound prevention and treatment,
depression management, a dementia unit, and access to primary care and care management. A
registered nurse with home health experience provided all the skilled nursing and also performed
the OASIS assessment. The typical care plan called for at least two days a week in the center,
and almost all participants started with an order for PT and an order to evaluate OT. Home
health leadership contended that therapies worked better in the center because treatment was
more intense than at home, and there was extensive equipment. Care coordination in the center
was achieved via frequent phone communication between the lead day care nurse and the
demonstration coordinator nurse at the home health agency. MADC staff also met every
morning to discuss/review progress of demonstration clients.
Several challenges in delivering home health services in the MADC setting were identified.
First, serving participants only in the MADC created challenges for patients who needed
additional in-home services, e.g., home health aides, on the days that they did not attend the

16
INFORMATION NOT RELEASABLE TO THE PUBLIC UNLESS AUTHORIZED BY LAW:
This information has not been publicly disclosed and may be privileged and confidential. It is for internal government use only and must not be disseminated, distributed, or copied to persons not authorized to receive the information. Unauthorized disclosure may result in prosecution to the full extent of the law.
MADC. Second, since most participants were enrolled in home health for a single episode of
care, participants were afforded only a limited stay in the MADC. This was disconcerting to
many of the beneficiary families who saw the value of their family member attending the
MADC. Third, it was difficult to manage the provision of skilled services and still have time for
the patients to take advantage of the other MADC services and social activities. Finally, frail
beneficiaries experienced difficulties with long van rides.
Financial performance. Besides paying the MADC a daily rate of $165, direct costs to the home
health agency included the initial assessment and care plan, emergency visits, off-hours visits,
administration, and marketing. The home health agency expected to break even after these costs,
but low enrollment kept the system from realizing any economies of scale. In contrast to the
Metropolitan home health agency, the MADC was expected to realize a financial surplus on the
demonstration. This was because the overhead was already covered, and all that would be added
was staff. However, because of low enrollment and the extra services the day center provided,
e.g., completing the OASIS assessment for the home health agency and providing transportation,
the demonstration helped only marginally.
Beneficiary Characteristics and Satisfaction. Nine beneficiaries were interviewed, including six
demonstration participants and three decliners. There were no apparent differences in
demographics, long-term care needs or medical conditions between participants and decliners.
They came from five different racial/ethnic groups, and all but one lived in apartments (two in
public housing). Isolation was a common theme, often relieved only by the presence of a
Medicaid-funded PCA. Six of those interviewed had Medicaid coverage, and the other three had
no insurance beyond Medicare. Three respondents had diabetes, two were on dialysis, three had
recent heart attacks, two had recent strokes, two had dementia, and one had developmental
disabilities. Four respondents walked independently or needed only a cane; two needed a walker
inside; and one did not walk at all. Five needed no help with ADLs; two needed help bathing;
and two needed help in two or more areas. All needed some kind of IADL help, if only cleaning
and shopping, and at least three needed help with all IADLs.

17
INFORMATION NOT RELEASABLE TO THE PUBLIC UNLESS AUTHORIZED BY LAW:
This information has not been publicly disclosed and may be privileged and confidential. It is for internal government use only and must not be disseminated, distributed, or copied to persons not authorized to receive the information. Unauthorized disclosure may result in prosecution to the full extent of the law.
Patterns of caregiving reflected the widespread availability of Medicaid PCAs in New York City.
Although some respondents were unclear about who paid for what services, four had Medicaid
PCAs five to seven days a week, one or two appeared to have five-day aides paid through home
health, and one paid out-of-pocket for a two-day housekeeper. Only two respondents were cared
for completely by family caregivers.
The primary motivations for participation in the demonstration were related to the services of the
MADC, including receiving home health services there. Advantages cited by beneficiaries
included getting out of the house, socializing, participating in activities, and receiving therapy at
the day center. Because only two of the participants had significant family caregivers (and one
of these was helped by a six-day PCA), respite for caregivers was not a common motivation to
participate in the demonstration among the participants interviewed. Two of the three decliners
refused to participate in the demonstration because they felt too sick or too weak to attend, while
the third did not want to lose home health services from the nurse who was visiting her in the
home.
Most of the participants' experiences in day care were very positive, but there were exceptions.
All but one liked the activities, socialization, trips, and meals, but three cited challenges in
finding days and times where there were participants who spoke their language. Reportedly,
morning sessions were dominated by Russian immigrants, and afternoons were times that
worked out better for English, Spanish, and Chinese speakers. Most participants (or their family
proxies) cited some very positive experiences with day care, e.g., getting her hair done in the
beauty parlor, the whirlpool bath, excellent therapy results, and better sleep at night due to the
activity levels in the center.
Participants' and decliners' experiences with home health at home were more mixed. Of the five
beneficiaries who received home health at home (including two participants who switched to in-
home services), only one (who was a decliner) seemed completely satisfied. Others complained
of inconsistent staff, missed visits, and services falling short of their needs.

18
INFORMATION NOT RELEASABLE TO THE PUBLIC UNLESS AUTHORIZED BY LAW:
This information has not been publicly disclosed and may be privileged and confidential. It is for internal government use only and must not be disseminated, distributed, or copied to persons not authorized to receive the information. Unauthorized disclosure may result in prosecution to the full extent of the law.
Out-of-pocket costs. Four of the six participants and two of the three decliners were receiving
Medicaid. Therefore, they had no direct costs for either day care or home care, but two were on
spend-down and had expenses related to their share of costs. One decliner out of the remaining
three respondents had out-of-pocket costs for cleaning and laundry services that occurred twice a
week, plus meals on wheels.
Neighborly Care Network
Sponsor. The Neighborly Care Network, which sponsored this site, is a non-profit agency that
owns a home health agency and 4 MADC centers. The MADC centers had a combined daily
capacity of 200 persons. Neighborly also operates transportation, dining programs, a meals-on-
wheels program, a pharmacy program, and a network of more than 2,000 volunteers. The four
Neighborly day centers were the only centers participating in the demonstration, and they were
the only MADC programs in the County.
Targeting. The site tended to exclude or discourage several types of beneficiaries from
participating. These included (1) those who would have difficulty spending a 6.5-hour day in the
day care setting, e.g., persons who were bed-bound, on life-support, had a poor prognosis, or had
poor physical stamina; (2) patients who would recover quickly and become too independent and
high functioning for the center's programming; (3) assisted living residents, who had their own
meals and socialization services; and (4) patients who needed only nursing services. Patients
who were receiving both nursing and PT or OT were the most desirable financially.
Marketing. The site's marketing efforts were multi-faceted, including educating all of its own
direct care staff about the demonstration, as well as conducting presentations with a wide range
of outside medical care and social care providers. These efforts yielded only a small increase in
referrals from a few supportive discharge planners and physicians. More productive were
referrals from Neighborly's own MADC centers. Conditions that were reported to make day care
participants potentially eligible for home health services included experiencing a decrease in
mobility but having good potential for rehabilitation, having medications adjusted and needing

19
INFORMATION NOT RELEASABLE TO THE PUBLIC UNLESS AUTHORIZED BY LAW:
This information has not been publicly disclosed and may be privileged and confidential. It is for internal government use only and must not be disseminated, distributed, or copied to persons not authorized to receive the information. Unauthorized disclosure may result in prosecution to the full extent of the law.
help managing the new regimen, having fallen or becoming more unsteady, having bed sores,
coming back from vacation in a debilitated state, and/or having been hospitalized and
discharged. Sometimes the MADC nurse spotted such conditions, and sometimes families asked
about home health services based on the information in the brochures they were given.
Staff cited several barriers to marketing and enrollment, including "paranoia" among elders due
to all the scamming in the community, difficulties describing how the program worked and for
whom it was targeted, lack of knowledge of day care, and the exclusion of HMO members.
Service Delivery and Care Coordination. Neighborly's MADC centers were staffed primarily for
social activities, and some enhancements were needed for the delivery of skilled services.
Neither of the centers visited by the evaluation team offered routine bathing as a service, and
there were no pre-existing therapy facilities. For example, one already had a nursing room but
another small office had to be converted to the PT suite.
Neighborly home health nurses and physical therapists delivered Medicare home health services
in the MADC centers. Home health aide services were delivered only at home due to lack of
space and privacy in the centers. To promote more staff continuity in nursing, specific home
health nurses were assigned to each center. To further promote communication, Neighborly tried
to schedule visits by all disciplines the same day. The programming in the day centers did not
change much due to the demonstration. Demonstration participants took part in the
programming along with non-participants, and staff pulled people from day center activities to
receive their home health care.
During the site visits respondents indicated that delivering home health services in the day care
center posed many challenges. These included scheduling, communications, arranging
transportation, obtaining a physician order and tuberculosis test, and additional paperwork.
Ongoing issues included dealing with scheduling changes, long trips on vans for frail
participants, caregiver work schedules, and being careful not to deliver services during lunch
hour. Staff reported that training about therapy and home safety to patients and caregivers could

20
INFORMATION NOT RELEASABLE TO THE PUBLIC UNLESS AUTHORIZED BY LAW:
This information has not been publicly disclosed and may be privileged and confidential. It is for internal government use only and must not be disseminated, distributed, or copied to persons not authorized to receive the information. Unauthorized disclosure may result in prosecution to the full extent of the law.
be more easily done at home. Contributing factors included the delays in starting care due to the
delays in setting up the day center visits, the high proportion of patients with dementia and their
challenges learning, and the challenge in teaching about home safety in the day center. Another
challenge was that demonstration managers experienced pressure from families and some staff to
extend home health episodes, particularly for patients with dementia. Such pressure was said to
be uncommon when home health was delivered at home, where patients were smoothly
discharged when goals were met. Conditions that were reported to sometimes justify extension
included medication changes, exacerbation of a problem, a fall, or a new wound.
Notwithstanding the challenges of delivering home health in the day center, home health agency
leaders reported that home health staff liked the approach because going to one center involved
less travel and less wasted time for them. Staff also liked to receive input from daycare staff, and
they reported better care planning, coordination, and follow through.
Financial performance. The Neighborly MADC centers billed the Neighborly home health
agency $66 for each day that participants attend the center. The Neighborly staff reported that
the home health agency was not making money on the demonstration. Besides the 5% reduction
in Medicare revenue, home health agency staff were concerned that the demonstration generated
new referrals from the day center and from certain physicians and discharge planners that had
more chronic illnesses and cognitive deficits than their average home health agency patients.
Some staff feared that they might be more difficult to rehabilitate, which would hurt their OASIS
measures.
The Neighborly day center finances were reported to benefit from the demonstration due to a
modest increase in census and very limited additional costs. At the time of the site visit, 11% of
the participants at one of the centers were in the demonstration but only half of them were new
participants from the community. Only 21% of the day care participants were paying privately
while 79% were receiving help from one of seven public programs. After demonstration
eligibility ran out it was difficult for most participants to continue in the MADC unless they
could pay privately, due to long waiting lists for all public programs.

21
INFORMATION NOT RELEASABLE TO THE PUBLIC UNLESS AUTHORIZED BY LAW:
This information has not been publicly disclosed and may be privileged and confidential. It is for internal government use only and must not be disseminated, distributed, or copied to persons not authorized to receive the information. Unauthorized disclosure may result in prosecution to the full extent of the law.
Beneficiary Characteristics and Satisfaction. Ten beneficiaries were interviewed (five by proxy),
usually in their homes, including six participants and four decliners. All were white and they
ranged in age from 77 to 88. None was receiving Medicaid. The decliners were in general
healthier, wealthier and more independent: All of the decliners but only one of the participants
lived alone; all of the decliners but only three participants had private insurance; and none of the
decliners but five of the participants were interviewed by proxy. In terms of medical conditions
leading to home health use, three of the four decliners had orthopedic problems, and one had
fallen. Participants' conditions were less orthopedic (one hip replacement) and more likely
dementia (four of the six). In terms of functional status, the decliners were much more
independent than the participants. All of the decliners were ambulatory (three used canes and
one still played golf). Participants were much more dependent: One was in a wheelchair, three
used walkers but needed assistance, and one was ambulatory but weak. Five of the six
participants needed assistance with most ADLs and all IADLs. The patterns of assistance also
differed between decliners and participants. The three decliners with family had visits a few
times a week to help with shopping and/or heavier work. One had paid help with housekeeping,
and one lived in assisted living. In contrast, five of the six participants were receiving close to
full-time, live-in care from family members, and one had assistance five days a week from a
PCA.
Motivations for participation and sources of satisfaction were relatively uniform: respite for busy
or burdened caregivers, and/or time outside the home for socialization. Caregivers appreciated
the respite and used it to rest, perform chores and errands, and otherwise take care of their own
needs. In contrast, decliners did not have caregivers who were looking for respite, and they were
all living independently inside of their dwellings (even the assisted living resident). The only
complaints from caregivers were about transportation, including the long time participants had to
spend on the bus, and the timing of pick up and drop off.
Out-of-pocket costs. Demonstration payments for MADC were a welcome financial support to
participants and their caregivers, but the short-term nature of the services, as well as the
22
INFORMATION NOT RELEASABLE TO THE PUBLIC UNLESS AUTHORIZED BY LAW:
This information has not been publicly disclosed and may be privileged and confidential. It is for internal government use only and must not be disseminated, distributed, or copied to persons not authorized to receive the information. Unauthorized disclosure may result in prosecution to the full extent of the law.
limitations in other public support, meant that some beneficiaries ultimately faced the need to
pay for day care privately when their episodes were completed and they wanted to remain in day
care. This was a hardship for most, who had modest incomes even though some owned their
own homes. Of the six participants interviewed, all had Social Security income, and for two, it
was their only income. Participants' plans for continuing MADC at the ends of their episodes
included: private pay (2), wait list for public funding (2), return to public funding plus private
days (1), and not continuing because of no need (1).
Landmark Home Health Care Services, Allegheny County, Pennsylvania
Sponsor. Landmark Home Health Care Services, Inc., the non-profit sponsor of this site, operates
several eldercare businesses including home health care, hospice, assisted living, community-
based in-home supports, and senior community centers. Landmark serves Allegheny County in
Pennsylvania (the urban Pittsburgh Metropolitan area). At the time of the site visit, Landmark
was contracting with nine MADC centers to implement the demonstration. These nine MADC
centers represented 12 service sites. All participating MADC sites were non-profit and relatively
small (serving between 28 and 50 clients).
Targeting. Landmark targeted the demonstration to beneficiaries who lived alone and to
beneficiaries who lived with a caregiver who worked outside the home. Another target group for
the demonstration were beneficiaries discharged from acute care who: (1) did not qualify for
three hours of intense rehab due to dementia but still required some kind of therapy, or (2) had
frequent hospital admissions due to medication non-compliance or other case management-
related issues. Landmark excluded beneficiaries who were bedfast, who had emotional or
behavioral disorders which were disruptive to self or others, who resided too far away from
participating MADC centers, or who were medically contradicted (communicable disease, open
wounds, receiving intravenous therapy, immuno-suppressed, or receiving chemotherapy).

23
INFORMATION NOT RELEASABLE TO THE PUBLIC UNLESS AUTHORIZED BY LAW:
This information has not been publicly disclosed and may be privileged and confidential. It is for internal government use only and must not be disseminated, distributed, or copied to persons not authorized to receive the information. Unauthorized disclosure may result in prosecution to the full extent of the law.
Marketing. Marketing was led by Landmark's business development office and included
outreach to a range of medical and social service providers and agencies, as well as screening of
regular home health agency patients and encouragement of referrals from participating MADC
centers. At the time of the site visit, skilled nursing facilities were the best source of external
referrals (60-65% of demonstration participants). Few referrals were forthcoming from
hospitals, physicians or aging network agencies, reportedly due to the newness and complexity
of the demonstration. The home health agency offered the demonstration to most new patients
but relatively few accepted. The most common reason for declining was that a beneficiary was
too sick. Referrals from MADC centers were also few, reportedly due to the difficulty of
developing an identification and referral mindset among MADC staff. Other marketing
challenges included a complex process for signing up for MADC, obtaining vouchers for the
county transportation system, assembling the paperwork to show that patients had a tuberculosis
test and a physical within the past 90 days, and competing initiatives within Landmark, e.g., a
congestive heart failure program.
Service Delivery and Care Coordination. During the site visit, evaluators toured two of the site's
12 contracted MADC centers. One center's only dedicated space was an office and a day room
with a capacity of 25. Special therapies for the demonstration were provided in either the room
the day center shared with an intellectual disabilities program down the hall, or if that was not
available, the day care office. The other site had two offices, an open kitchen, a relatively large
day room, a separate therapy room, and a bathing facility.
At the time of the site visit, all skilled and unskilled home health services for Demonstration
participants were provided by Landmark staff, whether in the home or in a MADC center. The
typical care plan was three days a week in the center, plus one skilled visit at home. Since
Landmark assigned clinical staff to patients based on region, in some cases the nurse who
provided services to a patient in the center was a different nurse than the one who provided
services at home. Remote entry of care documentation by Landmark staff in a web-based system
was routine whether a home health service was provided in the home or the MADC center, and
this facilitated communication between center-based and home-based providers if they were

24
INFORMATION NOT RELEASABLE TO THE PUBLIC UNLESS AUTHORIZED BY LAW:
This information has not been publicly disclosed and may be privileged and confidential. It is for internal government use only and must not be disseminated, distributed, or copied to persons not authorized to receive the information. Unauthorized disclosure may result in prosecution to the full extent of the law.
different. A drawback to having two nurses involved was that the one based in MADC had less
access to the caregiver, which could mean less opportunity or less effective means (by phone
instead of face-to-face) to involve caregivers in scheduling a doctor’s appointment, managing
medication changes, or OT services, where there is considerable training that needs to be
conducted at home. At the same time, some clinical staff reported getting more information
about a beneficiary from the MADC staff than they did in the home, especially if the patient
lived alone and was cognitively impaired.
Financial performance. Landmark paid each MADC center $62 per day. At the time of the site
visits, neither Landmark nor the MADC centers had completed assessments of the impact of the
demonstration on their finances. The modest increase in MADC centers' census from the
demonstration would have been more valuable had new participants been able to continue
attending, but long waiting lists for public programs blocked this support for most participants.
Beneficiary Characteristics and Satisfaction. Six participants and four decliners were
interviewed for the evaluation. Participants and decliners were similar in terms of age (74-89),
race (9 were white), and caregiving (most lived independently or were cared for by the family
member(s) they lived with); but in other ways they differed. Decliners were more likely to live
alone and to be more independent. Four of six participants versus only one decliner needed
assistance with all personal care activities. Decliners were more likely to have experienced a
single medical event – a heart attack, vertigo, dehydration – that resulted in a hospitalization
followed by a brief episode of home health, after which they resumed relatively normal, fit lives.
Participants were far more likely to have a chronic condition – debilitation from a stroke or
dementia – for which they needed on-going and more intense caregiving.
Participants and caregivers indicated that their experiences with adult day care services were
positive. Respondents liked the food, the arts and crafts, and the outings. Caregivers reported
that they liked having their spouse or parent attend the day center, since this was a welcome
respite from round-the-clock caregiving, and it freed up blocks of time to work, to clean the
house, or just to be alone. The only complaints voiced among participants (or their proxies)

25
INFORMATION NOT RELEASABLE TO THE PUBLIC UNLESS AUTHORIZED BY LAW:
This information has not been publicly disclosed and may be privileged and confidential. It is for internal government use only and must not be disseminated, distributed, or copied to persons not authorized to receive the information. Unauthorized disclosure may result in prosecution to the full extent of the law.
related to transportation on county vans, including late arrivals, long trips, and difficulties
obtaining and paying for vouchers.
Out-of-pocket costs. None of the decliners had any out-of-pocket costs for home care or other
long-term care services, but four of the participants did. Two participants out of the four paid
about $50 a day for extra days in the day center beyond what was covered in the demonstration,
and two others paid for transportation at $5 to $15 a week. The two who paid for extra days plus
one other were applying to a state program to help pay for MADC services when demonstration
eligibility ended. However, the program covered less than half the costs, and the $30 per day
copayment was too much for one of those wanting to continue. None of the respondents was
eligible for Medicaid, so better coverage under the waiver program was not an option.
Aurora Visiting Nurse Association, Milwaukee, Wisconsin
Sponsor. The sponsor is Aurora Visiting Nurse Association, the largest and oldest VNA in
Wisconsin. Aurora joined with the Aurora Adult Day Center to implement the demonstration.
The day center is a division of the Aurora, and both organizations are part of Aurora Health
Care, a community-based, not-for-profit health system located in Milwaukee. The demonstration
operated in one of Aurora's three Metro Region branch offices, although all three branches were
eligible to refer patients to the demonstration. The branch serves a predominantly low-income,
primarily African American resident population. About 90% of the day center’s regular clients
receive adult day services under the Family Care Plan, which is operated by the Milwaukee
County Department of Aging and is supported by combined Medicaid Waiver and long-term
care funds.
Targeting. The site targeted all new Medicare home health patients with the exception of
individuals who required one-on-one care throughout the day, who required ongoing monitoring
or interventions or who had an unstable condition, who exhibited behavior that was disruptive,
and/or who required a mechanical lift transfer.
26
INFORMATION NOT RELEASABLE TO THE PUBLIC UNLESS AUTHORIZED BY LAW:
This information has not been publicly disclosed and may be privileged and confidential. It is for internal government use only and must not be disseminated, distributed, or copied to persons not authorized to receive the information. Unauthorized disclosure may result in prosecution to the full extent of the law.
Marketing. The site marketed the demonstration to both medical and aging network providers
and care coordinators. The best source of new referrals was a geriatric practice at a nearby
hospital. Hospital discharge planners made few referrals, reportedly due to the need to make
quick discharges to trusted providers, and to the difficulty of explaining the demonstration.
Obstacles to referrals from the Aging Network included large numbers of case managers to
reach, staff turnover among case managers, and clients' fears of losing PCAs (and family income
if the PCA was a family member) due to a Medicaid waiver prohibition of receiving PCA and
MADC services on the same day.
The demonstration was marketed to new home health patients by a nurse assigned to oversee all
demonstration participants. Assessment nurses screened new patients and then brought in the
demonstration nurse during a second visit to explain the program. Staff indicated that it was
difficult to recruit participants from other branches of the home health agency due to distance,
class, and racial/cultural differences.
The site did not meet its marketing goals, and staff cited several reasons for this, including a fall
in the Aurora census, staff turnover at the Aurora and referral sources, high home health agency
patient acuity that delayed admission to the MADC, and the large Medicare Advantage
membership in the area.
Service Delivery and Care Coordination. The MADC is certified to serve 80 patients and
provides a full range of activities, as well as meals, medication monitoring, nutrition services,
rehabilitation therapy, art therapy, assisted therapeutic whirlpool baths, message therapy
sessions, podiatry sessions, and excursions. Staff indicated that the center is especially well
suited for the demonstration given the rooms for individual therapies, the whirlpool bath facility,
and trained staff.
All skilled and unskilled home health services for demonstration participants were delivered in
the day center by an Aurora home health team comprised of a nurse, physical therapist,
occupational therapist, and speech therapist. In addition, a new position was created for the

27
INFORMATION NOT RELEASABLE TO THE PUBLIC UNLESS AUTHORIZED BY LAW:
This information has not been publicly disclosed and may be privileged and confidential. It is for internal government use only and must not be disseminated, distributed, or copied to persons not authorized to receive the information. Unauthorized disclosure may result in prosecution to the full extent of the law.
demonstration – a home health aide who was employed part-time by Aurora home health and
part-time by the day center. Demonstration participants averaged about three days a week in the
day center, but staff reported that they believed that it was important to deliver at least some
services in the home, which allowed them to evaluate medications, personal care, and other
potential health/safety issues in the home, and also to educate family members. Care
coordination was facilitated by the co-location of staff (the home health offices are located on the
ground floor of the day center).
Staff reported several challenges related to delivering home health services in the MADC setting.
These included helping participants pay for passes for the county-run transportation system,
reversing an initial tendency of staff to over-prescribe home health in the MADC due to its
convenience, arranging in-home services for participants who missed day care on their scheduled
days, and figuring out how to pay for MADC days when a participant attended but did not
receive home health services.
Financial performance. To break even financially, Aurora planned to cover the cost of a full-
time nurse coordinator for the demonstration out of increased home health agency enrollment,
operational savings from reduced travel time for home health staff, and enhanced patient
outcomes. Unfortunately, low enrollment undermined the economies of scale in travel, patients'
schedule changes affected planned efficiencies, and there were unplanned transportation costs for
both the home health agency and the MADC. Additionally, the MADC had a policy of offering
services for half price after episodes ended if participants were waiting to start the Wisconsin
Family Care Program.
Beneficiary Characteristics and Satisfaction. Six participants and two decliners were interviewed
as part of the site visit. They were similar in terms of gender (half were male), respondent status
(just one participant was interviewed by proxy), and living arrangements (three of eight lived
alone). In contrast, participants and decliners differed on race, income and age: five of six
participants were African-American, whereas the decliners were both white; three of six
participants had Medicaid versus no decliners; and participants were also younger than decliners.

28
INFORMATION NOT RELEASABLE TO THE PUBLIC UNLESS AUTHORIZED BY LAW:
This information has not been publicly disclosed and may be privileged and confidential. It is for internal government use only and must not be disseminated, distributed, or copied to persons not authorized to receive the information. Unauthorized disclosure may result in prosecution to the full extent of the law.
They also differed on functionality and health status: three of six participants needed help with
all ADLs versus one decliner; all six participants needed at least some help with IADLs,
compared to only one decliner. The participants tended to be more chronically ill compared to
non-participants, whereas the two decliners experienced a single event, after which home health
services helped return them to relatively independent lives.
Beneficiaries' motivations for participating included an opportunity to get out of the house and to
meet other people, providing a caregiver with respite, and allowing spouses to resume work on
the days they attended day care. Reasons for declining included being too sick to get out of bed
after cardiac surgery, and living in an assisted living facility. Participants reported high levels of
satisfaction with the demonstration, including the range of home health services in the day
center. One beneficiary indicated appreciation of the encouragement for therapy received from
other day center clients, and another indicated that the space and equipment made it easier to
perform exercises than at home.
Out-of-pocket costs. Five of the six participants but none of the decliners had out-of-pocket costs
for in-home and community-based services beyond those covered by the demonstration. Two
were paying privately for MADC days plus transportation so that their spouses could work ($273
and $244 a week in costs). The three others were spending money on in-home workers and/or
transportation to their doctors and the MADC. There were few problems associated with
transition out of day care after the demonstration ended due to the fact that many demonstration
participants were eligible for Family Care and others were able to pay privately.
Doctors Care, McAllen, Texas
Sponsor. Doctors Care Home Health, a proprietary agency that also owns three participating
MADC centers, was the sponsor of this site. The demonstration served Hidalgo County, which
lies in the Rio Grande Valley bordering Mexico. More than 89% of the seniors in the county are
Latino; the county has the second highest proportion of residents who are obese in the US; and

29
INFORMATION NOT RELEASABLE TO THE PUBLIC UNLESS AUTHORIZED BY LAW:
This information has not been publicly disclosed and may be privileged and confidential. It is for internal government use only and must not be disseminated, distributed, or copied to persons not authorized to receive the information. Unauthorized disclosure may result in prosecution to the full extent of the law.
the county is also ranked as one of the poorest in the U.S. Over 300 MADC centers operate in
the Valley area, and respondents said the centers account for a significant share of Medicaid
spending on MADC services in Texas. At the time of the site visit, Doctors Care had contracts
with 35 MADC centers.
Targeting. The demonstration was initially targeted to Medicare patients who were not eligible
for Medicaid, and who either attended MADC as private pay or were not yet attending MADC
but had needs that could be met by MADC. Doctors Care established several formal exclusion
criteria, including (1) those who were immuno-suppressed, had infectious diseases, or needed
care requiring extensive equipment or patient exposure, (2) those who were bed bound, and (3)
those whose physical or mental health condition required one-on-one staffing. According to
staff, the ideal participant was a person who was living alone and probably not getting a good
meal, particularly a meal compatible with diabetes.
Marketing. The site's marketing efforts included external outreach to physicians and other
providers, as well as internal marketing to home health and day care patients. At the time of the
site visit, Doctors Care staff estimated that about 20% of referrals to the demonstration came
from physicians, adult protective services, and social service agencies. Most physicians were
described as being reluctant to refer due to skepticism on the parts of some about the benefits of
MADC, and involvement with competing home health agencies on the parts of others. Internal
marketing to Doctors Care home health agency patients also yielded some participants, but there
was also resistance among patients due to fear that they would lose their current home health
services.
By far the largest source of demonstration referrals was from participating MADC centers. The
main drivers of these referrals were the MADC site directors, as well as word-of- mouth among
MADC clients. Because MADC centers turned out to be the most important source of referrals,
Doctors Care tried to sign up more centers, but this was challenging. Some MADC centers opted
out of participation because they did not like that demonstration days were tied to the home
health episode, which could translate into a restricted number of paid days per week in the

30
INFORMATION NOT RELEASABLE TO THE PUBLIC UNLESS AUTHORIZED BY LAW:
This information has not been publicly disclosed and may be privileged and confidential. It is for internal government use only and must not be disseminated, distributed, or copied to persons not authorized to receive the information. Unauthorized disclosure may result in prosecution to the full extent of the law.
MADC and termination of MADC reimbursement at the end of the episode of care. The MADC
centers were accustomed to serving clients five days a week.
Service Delivery and Care Coordination. Medicaid-funded MADC centers in TX provide
nursing services, physical rehabilitative services, nutrition/food services, educational or
recreational activities, and transportation to and from the center. The two participating MADC
centers visited by the evaluation team consisted of a large main room with lines of tables. The
kitchens were in the back, and on one side there were a series of offices and the toilets. They
lacked the high-end bathing facilities of some of the other sites in the demonstration, as well as
dedicated therapy space and equipment. Home health and day care staff spoke positively about
many of the services beyond day care that the centers provided, including taking clients to their
medical appointments, organizing shopping trips to shopping centers and Mexico, and helping
clients to fill their prescriptions, either by taking them to the pharmacy or by arranging a
pharmacy drop-off at the center.
The initial service model used by Doctors Care called for MADC staff to provide all skilled
nursing care on the days participants attended, while Doctors Care was responsible for providing
therapies. Most Doctors Care patients needed nursing care only, for example for insulin
injections and health/diet/medication education for patients with diabetes. Doctors Care
provided little aide services to its home health agency patients and had only one home health
aide on staff. According to staff, while the demonstration served may people who lived alone,
most were able to take care of their own ADL needs and many IADL needs within their homes.
Once a beneficiary was enrolled in the demonstration, care coordination was managed through
reference to the care plan, which was in hard copy form at the MADC centers, and through
phone calls between MADC staff and nurse coordinator assigned to the patient at Doctors Care.
The MADC Licensed Vocational Nurses (LVNs) completed nurse assessments on the days a
participant was in the center. The completed assessments were picked up each week by Doctors
Care and taken to the main office, where they were entered into the patient record information
system. If MADC nurses observed any changes related to a participant's health status, they were

31
INFORMATION NOT RELEASABLE TO THE PUBLIC UNLESS AUTHORIZED BY LAW:
This information has not been publicly disclosed and may be privileged and confidential. It is for internal government use only and must not be disseminated, distributed, or copied to persons not authorized to receive the information. Unauthorized disclosure may result in prosecution to the full extent of the law.
responsible for calling both the participant's physician and the participant's Doctors Care nurse
coordinator.
Staff reported to the evaluators that after a number of months of operations, Doctors Care found
that some MADC centers were having a difficult time completing the daily nursing assessments
of demonstration participants, especially for MADC centers with 10 to 20 demonstration
participants on any given day. To address these workload and reporting issues, Doctors Care
decided to move some MADC centers to an alternate contract that cut the daily fee from $52 to
$26 (the Medicaid rate) in exchange for Doctors Care sending one of its nurses to the MADC to
provide the skilled nursing services. A quality assurance nurse at Doctors Care oversaw
coordination and quality issues, including training MADC LVNs to complete paperwork. This
was a new position created for the demonstration.
Respondents identified two other issues related to providing home health and adult day services
to beneficiaries residing in the Valley. These include nursing shortages that hampered the ability
of lower paying organizations such as MADC centers to attract high-quality nurses, and the lag
between the time the MADC nursing notes were completed and when the notes were entered into
the patient records system.
Financial performance. MADC staff reported that participating in the demonstration increased
Doctors Care's overall home health enrollment, primarily due to higher than expected referrals
from MADC centers. Doctors Care start-up costs were reported to be more than expected due to
the fact that they hired a full-time demonstration Director and a full-time Director of Marketing
to support the demonstration. Further, respondents said that the demonstration actually increased
the time of Doctors Care nursing staff because the nurses provided ongoing care coordination by
visiting the MADC centers and checking with the MADC nurses about their shared patients. To
offset this, Doctors Care reported that they had fewer unplanned home visits due to address
patients' unexpected service needs, since MADC staff could often address these needs.

32
INFORMATION NOT RELEASABLE TO THE PUBLIC UNLESS AUTHORIZED BY LAW:
This information has not been publicly disclosed and may be privileged and confidential. It is for internal government use only and must not be disseminated, distributed, or copied to persons not authorized to receive the information. Unauthorized disclosure may result in prosecution to the full extent of the law.
From the perspective of the staff in the two MADC centers participating in the site visit, the
demonstration was a financial gain. The demonstration daily rate exceeded the Medicaid rate,
and in some cases, the demonstration provided coverage to clients who formerly attended the day
centers at reduced fees or at no fee. One MADC indicated that their Center averaged about
$7,000 a month in revenue under the demonstration. At this site, they estimated that about 80%
of the demonstration participants attended the MADC five days/week.
Beneficiary Characteristics and Satisfaction. Six participants and four decliners were
interviewed by the evaluators. All were Hispanic, and only one spoke English well enough to
conduct the interview in English. Compared to decliners, participants more often lived alone and
were male, but otherwise the groups were similar. Three of the four decliners and two of the six
participants needed no help with either ADLs or IADLs. Among those who needed ADL or
IADL help, two participants had all their needs met by family members; two participants used
only paid aides; and one participant and one decliner used a combination of family and paid
helpers. The most common problems seemed to be orthopedic - difficulties with legs, knees,
pain, and osteoporosis (seven respondents); but they also reported dementia (2), diabetes (2), and
cerebral palsy (1).
Beneficiaries' motives for participating in the demonstration and declining were made in the
context of widespread and intensive use of Medicaid-funded adult day care in the Rio Grande
Valley region. Five of six had been attending day care prior to entering the demonstration.
Going to day care simply seemed part of their daily routine. Three of the four decliners had not
been previously in day care, and they were not ready to start now. One was too sick, another
wanted to stay home with her husband, and the third just preferred to stay home. All four
received nursing visits in their homes: two for daily injections, and the other two for weekly
injections. All were satisfied with their nurses.
Besides some confusion about when and why home health services started and ended, the
participants reported that they were well cared for and satisfied with home health in their day
center. In addition to the regular home health services, three of the six participants mentioned

33
INFORMATION NOT RELEASABLE TO THE PUBLIC UNLESS AUTHORIZED BY LAW:
This information has not been publicly disclosed and may be privileged and confidential. It is for internal government use only and must not be disseminated, distributed, or copied to persons not authorized to receive the information. Unauthorized disclosure may result in prosecution to the full extent of the law.
that the center connected with their pharmacy and/or physician, including reporting symptoms,
making appointments and providing transportation, and having prescriptions delivered. The
participants' experiences with the rest of the day care program were generally positive. The four
decliners were generally satisfied with their nurses but not their therapists, who often did not
show up when expected and did not make it clear to them when care was ending.
Out-of-pocket costs. All of the participants and at least two of the decliners were Medicaid
beneficiaries, although one of the participants was a Qualified Medicaid Beneficiary (QMB) and
therefore was eligible for Medicaid coverge of home care but not day care. None of the
participants had any out-of-pocket costs for either day care or home care. One of the decliners
who did not qualify for Medicaid had substantial costs for in-home attendants. The one
participant who was not fully eligible was into a second episode of home health. Even if she
lost her eligibility under the demonstration, she had daily help at home through Medicaid.
B. Implementation of Marketing and Service Delivery
Marketing, participation, and characteristics of beneficiaries served: The levels of
beneficiary participation in the demonstration sites appeared to be a function of several factors.
The factors, which are discussed individually below, are the:
• Home health agency’s outreach to referral sources;
• Number of home health patients served by the agency, including new and continuing
patients;
• Number of episodes per patient in the agency;
• Rate of not offering the demonstration to new patients;
• Acceptance rate among patients offered the demonstration;
• Proportion of those offered who had prior MADC experience;
• Reasons beneficiaries chose to participate or not.
The final part of this section analyzes Medicare claims to show how patients who were excluded
differed from patients who were offered, and how participants differed from decliners.
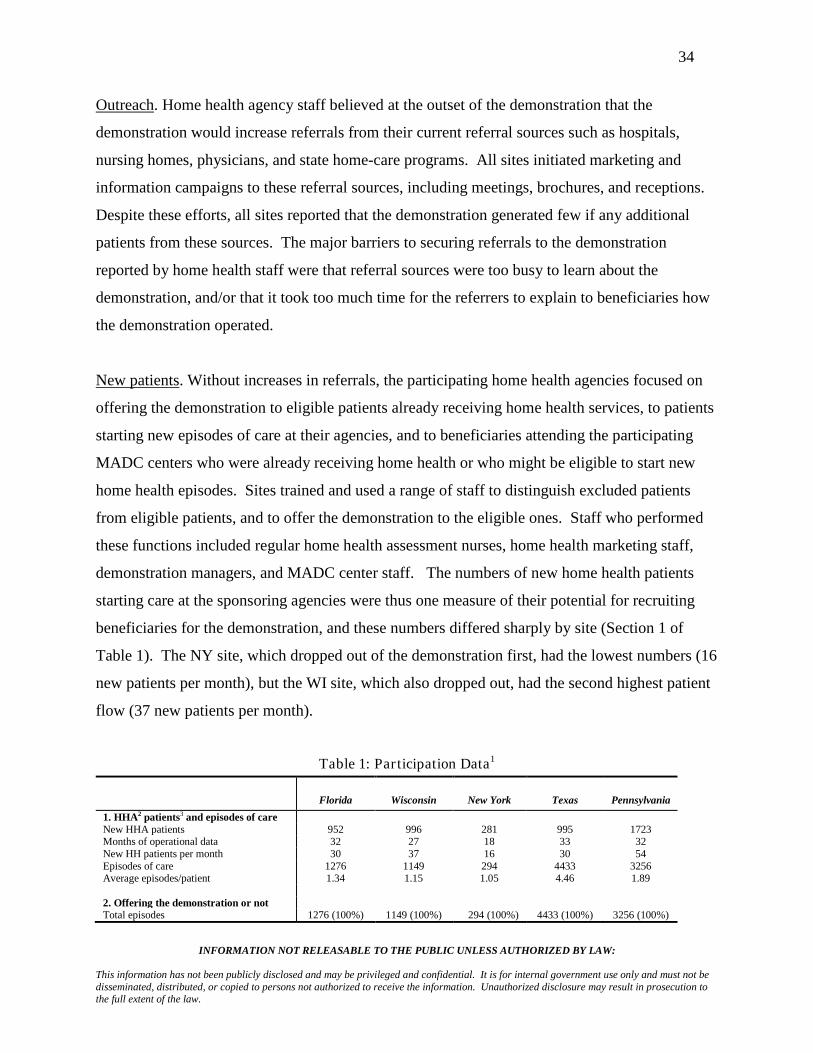
34
INFORMATION NOT RELEASABLE TO THE PUBLIC UNLESS AUTHORIZED BY LAW:
This information has not been publicly disclosed and may be privileged and confidential. It is for internal government use only and must not be disseminated, distributed, or copied to persons not authorized to receive the information. Unauthorized disclosure may result in prosecution to the full extent of the law.
Outreach. Home health agency staff believed at the outset of the demonstration that the
demonstration would increase referrals from their current referral sources such as hospitals,
nursing homes, physicians, and state home-care programs. All sites initiated marketing and
information campaigns to these referral sources, including meetings, brochures, and receptions.
Despite these efforts, all sites reported that the demonstration generated few if any additional
patients from these sources. The major barriers to securing referrals to the demonstration
reported by home health staff were that referral sources were too busy to learn about the
demonstration, and/or that it took too much time for the referrers to explain to beneficiaries how
the demonstration operated.
New patients. Without increases in referrals, the participating home health agencies focused on
offering the demonstration to eligible patients already receiving home health services, to patients
starting new episodes of care at their agencies, and to beneficiaries attending the participating
MADC centers who were already receiving home health or who might be eligible to start new
home health episodes. Sites trained and used a range of staff to distinguish excluded patients
from eligible patients, and to offer the demonstration to the eligible ones. Staff who performed
these functions included regular home health assessment nurses, home health marketing staff,
demonstration managers, and MADC center staff. The numbers of new home health patients
starting care at the sponsoring agencies were thus one measure of their potential for recruiting
beneficiaries for the demonstration, and these numbers differed sharply by site (Section 1 of
Table 1). The NY site, which dropped out of the demonstration first, had the lowest numbers (16
new patients per month), but the WI site, which also dropped out, had the second highest patient
flow (37 new patients per month).
Table 1: Par ticipation Data1
Florida Wisconsin New York Texas Pennsylvania 1. HHA2 patients3 and episodes of care New HHA patients 952 996 281 995 1723 Months of operational data 32 27 18 33 32 New HH patients per month 30 37 16 30 54 Episodes of care 1276 1149 294 4433 3256 Average episodes/patient 1.34 1.15 1.05 4.46 1.89 2. Offering the demonstration or not Total episodes 1276 (100%) 1149 (100%) 294 (100%) 4433 (100%) 3256 (100%)
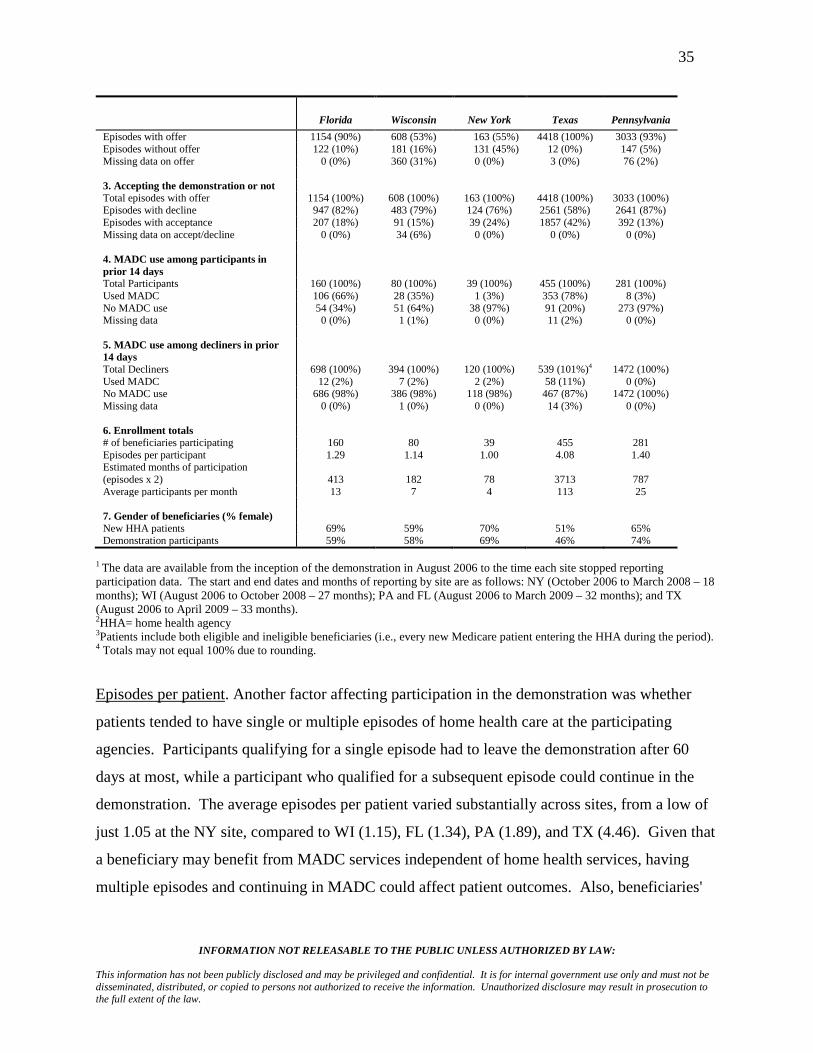
35
INFORMATION NOT RELEASABLE TO THE PUBLIC UNLESS AUTHORIZED BY LAW:
This information has not been publicly disclosed and may be privileged and confidential. It is for internal government use only and must not be disseminated, distributed, or copied to persons not authorized to receive the information. Unauthorized disclosure may result in prosecution to the full extent of the law.
Florida Wisconsin New York Texas Pennsylvania Episodes with offer 1154 (90%) 608 (53%) 163 (55%) 4418 (100%) 3033 (93%) Episodes without offer 122 (10%) 181 (16%) 131 (45%) 12 (0%) 147 (5%) Missing data on offer 0 (0%) 360 (31%) 0 (0%) 3 (0%) 76 (2%) 3. Accepting the demonstration or not Total episodes with offer 1154 (100%) 608 (100%) 163 (100%) 4418 (100%) 3033 (100%) Episodes with decline 947 (82%) 483 (79%) 124 (76%) 2561 (58%) 2641 (87%) Episodes with acceptance 207 (18%) 91 (15%) 39 (24%) 1857 (42%) 392 (13%) Missing data on accept/decline 0 (0%) 34 (6%) 0 (0%) 0 (0%) 0 (0%) 4. MADC use among participants in prior 14 days
Total Participants 160 (100%) 80 (100%) 39 (100%) 455 (100%) 281 (100%) Used MADC 106 (66%) 28 (35%) 1 (3%) 353 (78%) 8 (3%) No MADC use 54 (34%) 51 (64%) 38 (97%) 91 (20%) 273 (97%) Missing data 0 (0%) 1 (1%) 0 (0%) 11 (2%) 0 (0%) 5. MADC use among decliners in prior 14 days
Total Decliners 698 (100%) 394 (100%) 120 (100%) 539 (101%)4 1472 (100%) Used MADC 12 (2%) 7 (2%) 2 (2%) 58 (11%) 0 (0%) No MADC use 686 (98%) 386 (98%) 118 (98%) 467 (87%) 1472 (100%) Missing data 0 (0%) 1 (0%) 0 (0%) 14 (3%) 0 (0%) 6. Enrollment totals # of beneficiaries participating 160 80 39 455 281 Episodes per participant 1.29 1.14 1.00 4.08 1.40 Estimated months of participation (episodes x 2) 413 182
78 3713 787
Average participants per month 13 7 4 113 25 7. Gender of beneficiaries (% female) New HHA patients 69% 59% 70% 51% 65% Demonstration participants 59% 58% 69% 46% 74%
1 The data are available from the inception of the demonstration in August 2006 to the time each site stopped reporting participation data. The start and end dates and months of reporting by site are as follows: NY (October 2006 to March 2008 – 18 months); WI (August 2006 to October 2008 – 27 months); PA and FL (August 2006 to March 2009 – 32 months); and TX (August 2006 to April 2009 – 33 months). 2HHA= home health agency 3Patients include both eligible and ineligible beneficiaries (i.e., every new Medicare patient entering the HHA during the period). 4 Totals may not equal 100% due to rounding.
Episodes per patient. Another factor affecting participation in the demonstration was whether
patients tended to have single or multiple episodes of home health care at the participating
agencies. Participants qualifying for a single episode had to leave the demonstration after 60
days at most, while a participant who qualified for a subsequent episode could continue in the
demonstration. The average episodes per patient varied substantially across sites, from a low of
just 1.05 at the NY site, compared to WI (1.15), FL (1.34), PA (1.89), and TX (4.46). Given that
a beneficiary may benefit from MADC services independent of home health services, having
multiple episodes and continuing in MADC could affect patient outcomes. Also, beneficiaries'
36
INFORMATION NOT RELEASABLE TO THE PUBLIC UNLESS AUTHORIZED BY LAW:
This information has not been publicly disclosed and may be privileged and confidential. It is for internal government use only and must not be disseminated, distributed, or copied to persons not authorized to receive the information. Unauthorized disclosure may result in prosecution to the full extent of the law.
interest in the demonstration could be affected by their knowing in advance that they were or
were not likely to qualify for multiple episodes, and thus continuing participation in MADC.
Excluded patients. Sites could decide not to offer the demonstration to current and new home
health patients whom they did not consider appropriate for the service model. Reasons for not
offering differed by site but included the patient being too physically sick (e.g., having a
compromised immune system), too disabled (bedfast, not able to travel, not able to sit for long
periods), sufficiently mentally impaired to be a danger to themselves and others, and living too
far away from centers. The NY site excluded patients who needed less than two skilled services,
because the home health agency could not achieve enough savings on one service to offset the
MADC rate of $165 per day, which was more than twice the rate of any other site ($60 in FL,
$53 in PA, $44 in WI, and $26 in TX). The rates of exclusion also differed by site. Three sites
(FL, TX, and PA) offered the demonstration to 90% or more of home health patients starting new
episodes of care, while WI and NY offered it much less often (to 53% and 55% of new patients
respectively) (Section 2 of Table 1).
Acceptance rates. The Texas site had the highest rate of acceptance (42% of new episodes
offered participation) while acceptance rates at the other sites ranged from 13% to 24% of the
episodes with an offer (Section 3 of Table 1). The high rate of acceptances per episode at the TX
site was likely related to the site's high rate of multiple episodes.
Prior use of MADC. The percent of participants who used MADC in the 14 days prior to joining
the demonstration differed sharply, with TX (78%) and FL (66%) at the high end, WI (35%) in
the middle, and PA (3%) and NY (3%) at the low end (Section 4 of Table 1). Thus the FL, TX,
and WI sites were able to draw many of their participants from the MADC population, while the
PA and NY sites were not. The rates of prior MADC use among beneficiaries that chose to
decline participation were much lower: 2% or less at the PA, FL, WI, and NY sites, and 11% at
the TX site (Section 5 of Table 1).
Participation totals. The forgoing factors combined to produce very different numbers of unique
total participants, episodes per participant, and average estimated monthly demonstration
37
INFORMATION NOT RELEASABLE TO THE PUBLIC UNLESS AUTHORIZED BY LAW:
This information has not been publicly disclosed and may be privileged and confidential. It is for internal government use only and must not be disseminated, distributed, or copied to persons not authorized to receive the information. Unauthorized disclosure may result in prosecution to the full extent of the law.
participants across the sites (Section 6 of Table 1). Sites did not report their average numbers of
participants, so they were calculated as follows. First, the number of episodes was multiplied by
two, which is the maximum number of months in an episode. This is a high estimate because it
assumes that every episode went for the full 60-day maximum, which was not always the case
due to deaths and to completions of care plans in less than 60 days. Next, this number was
divided by the number of months of data reported (see Section 1 of Table 1) to yield
conservative estimates of the average number of participants each month for each site.
The two sites that dropped out early (NY and WI) had the fewest participants, the fewest
episodes per participant, and by far the lowest average monthly number of participants (4 and 7
participants respectively). In contrast, the TX site had by far the highest number of beneficiaries
participating (455), the highest number of episodes per participant (4.08), and the highest
estimated number of participants per month (113). At the TX site, the combination of a large
number of participating MADC centers, high rates of offering the demonstration, and high
acceptance rates (perhaps influenced by multiple episodes and high rates of prior MADC use
among participants), yielded participation totals that far exceeded the other sites. The PA and FL
sites were intermediate: Florida, with an estimated 13 average participants per month, benefited
from relatively high rates of prior MADC use but had relatively few episodes per participant.
The PA site, with 25 estimated average participants per month, benefited from relatively high
episodes per participant but found few new participants in its MADC centers.
Gender mix. Section 7 of Table 1 shows the proportion of women among each home health
agency’s new patients and among its demonstration participants. At the FL, WI, NY, and PA
sites, most of the new home health patients were female (range 59%-70%), as were the
participants (range 58%-74%). In contrast, women composed only 51% of the TX agency's new
patients and only 46% of demonstration participants.
Reasons for accepting and declining. The face-to-face interviews with participants showed that
their reasons for accepting related to the benefits of attending a MADC center, including getting
out of the house, socializing with others, activities at the MADC centers (e.g., music, trips,
games, beauty parlor), meals, and most of all, respite to family caregivers. The interviews with
38
INFORMATION NOT RELEASABLE TO THE PUBLIC UNLESS AUTHORIZED BY LAW:
This information has not been publicly disclosed and may be privileged and confidential. It is for internal government use only and must not be disseminated, distributed, or copied to persons not authorized to receive the information. Unauthorized disclosure may result in prosecution to the full extent of the law.
decliners revealed that the two major reasons for not participating were that they were either too
sick or too healthy to attend the MADC. On the one hand, some said they declined because they
were too weak to leave home, take transportation, and participate in the typical five to seven
hours of activity. On the other hand, others declined because they expected to regain their
independence during the home health episode and did not think they needed adult day care. At
the NY and WI sites, some patients declined for fear of losing their Medicaid-paid personal care
attendants. Both staff and beneficiary respondents cited Medicaid rules that in some
circumstances prohibited same-day receipt of attendant care and MADC.
The survey asked decliners why they did not participate in the demonstration. Of the 209
respondents who answered this question (representing 80% of the decliner survey sample), 30%
reported that they declined to receive their HH benefits in the MADC because they preferred to
be home, had home care, and/or simply did not want or need MADC. The next most common
reasons for declining were being too disabled to attend MADC (21%), already attending MADC
(11%), not in need of MADC (10%), not remembering being offered (6%), transportation
problems (4%), and other reasons (18%). All but one person of the 11% who declined because
they were already attending MADC were at the TX site, which had a high proportion of
beneficiaries already attending MADC five days a week through Medicaid funding. Some of the
MADC centers in the TX site's service area were participating in the demonstration and some
were not.
Differences between beneficiaries that were excluded, that participated, and that declined. The
evaluation’s analysis of Medicare claims (based on earlier analyses from the Interim Report)
found no consistent differences between beneficiaries that were excluded, that participated, and
that declined either in terms of the percent that used selected Medicare services or the total
expenditures on those services in the year prior to and after starting home health (Table 2). At
the WI site, the excluded tended to have higher utilization and expenditures than those offered in
three categories (pre-demonstration outpatient expenditures and post-demonstration inpatient use
and expenditures), and decliners tended to have higher utilization and expenditures than
participants (post-demonstration outpatient and inpatient claims and post inpatient expenditures).
39
INFORMATION NOT RELEASABLE TO THE PUBLIC UNLESS AUTHORIZED BY LAW:
This information has not been publicly disclosed and may be privileged and confidential. It is for internal government use only and must not be disseminated, distributed, or copied to persons not authorized to receive the information. Unauthorized disclosure may result in prosecution to the full extent of the law.
In NY, those who were excluded had higher home health utilization and claims in the year after
they began their home health episode. There were no patterns in the other sites that pointed to
the demonstration participants being higher or lower users of Medicare services than the average
Medicare patients that entered the home health agencies.
Service Delivery: Several issues were encountered in setting up service delivery systems. Each
is listed here and addressed below. The issues were:
• Whether home health or MADC staff would deliver home health services in the MADC
centers;
• How home health intake, care planning, and discharge would be managed;
• How care would be coordinated;
• How quality of care would be maintained.
Staff delivering home health services in MADC centers. The most common pattern for
delivering home health services in the MADC centers was to use home health staff rather than
MADC staff. The home health agencies in PA, FL, and WI all brought in their own nursing and
therapy staff (or individual home health professionals under contract) to deliver skilled home
health services in the MADC centers. The TX site initially used MADC nurses to provide home
health nursing services and its own staff to provide therapy services, but it eventually stopped
using MADC nurses at many centers after learning that the centers’ nurses were not adequately
trained to provide home health services. The NY site used MADC staff to provide all nursing
and therapy services, but its MADC center hired nurses and therapists with home health
experience to provide these services. Thus the NY approach was consistent with the decisions of
other sites that having experience with Medicare home health rules and documentation was
necessary to provide home health services under the demonstration. Only two of the sites
provided home health aide services in the MADC centers: WI with certified aides from the home
health agency, and NY with experienced MADC aides.
Intake, care planning, and discharge. Home health agency respondents reported small but
important changes in their intake, care planning and discharge processes. First, home health

40
INFORMATION NOT RELEASABLE TO THE PUBLIC UNLESS AUTHORIZED BY LAW:
This information has not been publicly disclosed and may be privileged and confidential. It is for internal government use only and must not be disseminated, distributed, or copied to persons not authorized to receive the information. Unauthorized disclosure may result in prosecution to the full extent of the law.
agencies modified their intake processes to identify patients who were eligible for the
demonstration and to present an informed choice about joining. The changes were described
above in Section III.A., Implementation of Marketing and Service Delivery.
Second, the home health staff prepared care plans using the same standard Medicare criteria and
services as for regular home health patients, but the staff needed to specify in the care plans
which services would be delivered in the MADC and which would occur in the home. Home
health staff had many more logistics to manage for the MADC setting compared to delivering
services at home. Staff had to obtain doctors' orders for both home health care and MADC, had
to advise MADC centers of days of attendance, and had to process and pay bills from the centers.
They also had to coordinate communications and care plans with MADC staff, and rearrange
home health services quickly when participants did not show up in MADC centers as scheduled
to receive home health services there.
Table 2: Compar isons of Patients that Were Excluded, that Declined, and that Par ticipated1
FL WI NY TX PA
Home health
Expenditures in year before episode D>P
Use in year after start of episode E>O
Claims in year after start of episode E>O
Outpatient
Use in year before episode P>D
Expenditures in year before episode O>E E>O O>E D>P
Use in year after start of episode E>O
Claims in year after start of episode D>P P>D
Inpatient
Use in year before episode D>P
Expenditures in year before episode D>P
Use in year after episode E>O D>P
Expenditures in year after episode E>O D>P
1E = Patients who were excluded. O = Patients who were offered. D= Decliners. P = Participants. Significance: Only differences significant at the .05 level are reported.

41
INFORMATION NOT RELEASABLE TO THE PUBLIC UNLESS AUTHORIZED BY LAW:
This information has not been publicly disclosed and may be privileged and confidential. It is for internal government use only and must not be disseminated, distributed, or copied to persons not authorized to receive the information. Unauthorized disclosure may result in prosecution to the full extent of the law.
Third, all sites reported that discharge was more difficult for some demonstration participants
than it typically was for home health patients receiving all services at home. The reason was that
most participants wanted to continue to attend MADC, and the MADC and home health staff
often tried to help them do so. The great majority of the 30 participants interviewed during the
site visits wanted to continue attending day care, and it seemed that two-thirds would: 13 through
Medicaid and seven by paying privately. Both the MADC staff and home health staff tried to
help the rest find other sources of public funding, but they were usually disappointed by
ineligibility and/or waiting lists for these programs. Staff respondents in home health agencies
reported that in some cases families were concerned and advocated that the demonstration staff
consider extending episodes of care. Both participants and family members enjoyed the benefits
of attending MADC, and another episode would extend the demonstration financing of the
service.
Care coordination. Respondents in both home health agencies and MADC centers reported that
the demonstration introduced the challenge of coordinating home health services delivered in the
home with services delivered in the centers. No conflicts were reported with delivering MADC
and home health services: When home health was scheduled, participants simply left their
MADC activity to receive care. The most common problem was how to provide home health
services to participants who did not attend day care when scheduled. These missed appointments
were due to illness, transportation problems, or a beneficiary’s choice to stay home. The home
health agencies devised systems for the MADC staff or the home health clinician to report
absences to the home health care coordinator. This coordinator then tracked down the reason for
the absence and rescheduled the service for the home or scheduled a new MADC visit.
Quality. The only potential quality of care issue that arose in the site visits was related to the
effectiveness of physical and occupational therapy in the home versus the MADC setting.
Having dedicated MADC therapy space and equipment reportedly improved outcomes, but only
the WI and NY centers offered this. The other sites did not have such space and equipment, they
did not have therapists on staff, and they did not routinely offer therapy services in their MADC
42
INFORMATION NOT RELEASABLE TO THE PUBLIC UNLESS AUTHORIZED BY LAW:
This information has not been publicly disclosed and may be privileged and confidential. It is for internal government use only and must not be disseminated, distributed, or copied to persons not authorized to receive the information. Unauthorized disclosure may result in prosecution to the full extent of the law.
models. Home health staff at several sites, including one that used a MADC center with
dedicated space and equipment, reported that therapy outcomes were better at home for patients
who had mild to moderate dementia. This was because family members were at home but not at
the MADC center to learn and reinforce training. Except at the NY site, where MADC staff
provided home health therapies, it was uncommon for MADC staff to be sufficiently involved in
the home health therapy visit to learn how to reinforce training. Some staff believed that slower
progress in therapy in MADC centers for patients with dementia led to more home health therapy
services and less progress within the episode.
Summary. None of the changes in service delivery was difficult for home health agencies or
MADC centers to address, but the changes did involve new and extra work, particularly for
home health staff and managers.
C. Satisfaction of Beneficiaries
Methods: The evaluation assessed beneficiary satisfaction through in-person interviews with
participants (6 per site) and decliners (4 per site) during site visits that occurred a little more than
a year into operations, and through a telephone survey of participants and decliners during the
third year of the demonstration. In total, 1,219 beneficiaries were invited to participate in the
satisfaction survey, representing 871 decliners and 348 participants (Table 3). A three-point
satisfaction scale (Very satisfied, Somewhat satisfied, Dissatisfied) was administered to MADC
participants regarding MADC services. A four-part question about home health services was
administered regarding Medicare home health received in the home (asked of both decliners and
participants) and home health received in the MADC center (participants only). The four-part
question asked respondents whether (1) "the nurses give good care," (2) "the therapists give good
care," (3) "I get good information about conditions and treatments," and (4) "they showed up
when they said they would."
The evaluation team used unadjusted, bivariate analysis to compare the satisfaction with home
health services received in the home for beneficiaries who participated in the demonstration
compared to beneficiaries who declined to participate. Like the other satisfaction question,

43
INFORMATION NOT RELEASABLE TO THE PUBLIC UNLESS AUTHORIZED BY LAW:
This information has not been publicly disclosed and may be privileged and confidential. It is for internal government use only and must not be disseminated, distributed, or copied to persons not authorized to receive the information. Unauthorized disclosure may result in prosecution to the full extent of the law.
responses were very skewed toward satisfaction with home health, and respondents were
categorized as "very satisfied" if they said yes to three of the four questions and "not very
satisfied" if they said yes to two or fewer questions.
The analysis of satisfaction with MADC services included an examination of select subgroups –
defined by age, health status and other factors – to assess if and how satisfaction of participants
differed by selected factors.
At three of the four sites (FL, WI and PA), the evaluation team's goal for the survey was to
interview two decliners for each participant to maximize statistical power given lower than
expected demonstration participation rates at these sites. In TX the goal was to interview an
equal number of participants and decliners. Invitations were mailed monthly between June 2008
and March 2009 to waves of the sample that were completing their home health episodes.
Surveyors followed up the mailings by phoning beneficiaries to determine their willingness to
participate in the survey. These efforts yielded an overall response rate of 38%, representing 461
survey participants. Due to the withdrawals of the NY site six months before the survey and the
WI site two months into the survey, there were no survey data from NY and only 11 respondents
from WI. Thus, survey data adequate for site-specific analysis were available for only the FL
(78 respondents), PA (110 respondents), and TX (262 respondents) sites. Together, these three
sites represent 450 survey respondents.
Table 3: Survey Sample and Response Rates by Site and Respondent Type
FL
WI
TX
PA
Total Survey sample Decliners 160 (78%) 45 (90%) 336 (59%) 330 (84%) 871 (71%) Participants 45 (22%) 5 (10%) 236 (41%) 62 (16%) 348 (29%) Total 205 (100%) 50 (100%) 572 (100%) 392 (100%) 1219 (100%) Survey response Decliners 51 (65%) 9 (82%) 127 (48%) 75 (68%) 262 (57%) Participants 27 (35%) 2 (18%) 135 (52%) 35 (32%) 199 (43%) Total 78 (100%) 11 (100%) 262 (100%) 110 (100%) 461 (100%) Response rate Decliners 32% 20% 38% 23% 30% Participants 60% 40% 57% 56% 57% Total 38% 22% 46% 38% 38%

44
INFORMATION NOT RELEASABLE TO THE PUBLIC UNLESS AUTHORIZED BY LAW:
This information has not been publicly disclosed and may be privileged and confidential. It is for internal government use only and must not be disseminated, distributed, or copied to persons not authorized to receive the information. Unauthorized disclosure may result in prosecution to the full extent of the law.
Survey response rates varied by respondent type. Among participants, the response rate was
57% while the response rate among decliners was 30%. The lower response rate among decliners
was due to two main factors. Compared to participants, decliners were more difficult to recruit
into the survey. Additionally, the survey team’s follow-up efforts among decliners depended on
the response rate among participants, and the team attempted to maintain the target participant-
to-decliner ratios. Consequently, the decliners were liberally sampled to accommodate
unpredictable response rates among participants. Across sites, response rates varied. WI yielded
the lowest overall response rate (22%) and TX had the highest (46%). Because of the very low
number of survey respondents in WI, this site is not included in the analyses that follow.
Although there were more respondents in PA and FL, the numbers are still too low to support
multivariate analyses of differences in satisfaction across sites or between participants and
decliners.
Characteristics of respondents: Table 4 compares survey respondents who participated in the
demonstration with survey respondents who declined to participate according to demographic
characteristics, health status, and other characteristics (such as living arrangement, Medicaid
status, etc.). The findings indicate that these two groups differed significantly in age and health
status. On average, decliners were significantly older than participants (mean age 77 compared to
74). Compared to participants, decliners were also significantly more likely to have one or more
of the following health conditions: diabetes, congestive heart failure, specified heart arrhythmias,
chronic obstructive pulmonary disease (COPD), and renal failure. These findings are consistent
with the sample of beneficiaries interviewed during the site visits, in which decliners tended to
be more frail, old, and sick.
For all other characteristics examined, the team observed no significant differences between
participants and decliners. Among both groups, for instance, slightly more than half were
female, almost 30% lived alone, a little over one-third reported being able to walk independently,
and 46% had Medicaid. In summary, among survey respondents, declining to participate in the
demonstration was independent of all factors examined except age and health status.

45
INFORMATION NOT RELEASABLE TO THE PUBLIC UNLESS AUTHORIZED BY LAW:
This information has not been publicly disclosed and may be privileged and confidential. It is for internal government use only and must not be disseminated, distributed, or copied to persons not authorized to receive the information. Unauthorized disclosure may result in prosecution to the full extent of the law.
Table 5 compares several demographic measures for survey respondents across the three sites
with adequate survey data. It shows no differences in the proportions living alone but that a
slightly but significantly higher proportion of females were surveyed in FL. It also shows that
the TX respondents were significantly more likely to walk independently, to be covered by
Medicaid, and to be younger than respondents at the other two sites.
Table 4: Character istics of Par ticipants Versus Decliners (N=461) Variables and Significance1
Participants
Decliners
Total
Demographics Female 53.3% 56.6% 55.1% Mean age* 74.12 77.23 75.93 Other Lives alone 28.8% 29.4% 29.1% Walks independently 39.4% 35.5% 37.2% Mean number of 5 activities need help with2
2.19 2.15 2.17
Receives Medicaid 45.9% 45.7% 45.8% Patient/caregiver received training from HHA
32.9% 33.8% 33.4%
Health Status Diabetes without complications* 20.3% 25.2% 24.0% Congestive heart failure** 18.0% 31.9% 28.7% Specified heart arrhythmias** 11.3% 26.0% 22.5% Vascular disease 10.9% 13.2% 12.7% Chronic obstructive pulmonary disease** 13.6% 24.5% 21.9% Renal failure** 8.8% 15.9% 14.2%
1Significance results were based on Fisher exact test for differences in proportions, and T-test for differences in means. + = p <.10; * = p < .05; ** = p < .01; *** = p<.001 2Activities include bathing, dressing, using the toilet, shopping, and being able to take medications independently.
Table 5: Site Comparisons of Character istics of Survey Samples Variables and Significance1
PA
FL
TX
Total
Lives alone 32% 33% 27% 29% Female+ 45% 67% 54% 55% Walks independently** 26% 33% 44% 38% Medicaid participant** 8% 29% 69% 47% Mean age** 80.5 80.2 72.0 75.9
1Significance results were based on Fisher exact test for differences in proportions, and T-test for differences in means. + = p <.10; * = p < .05; ** = p < .01; *** = p<.001
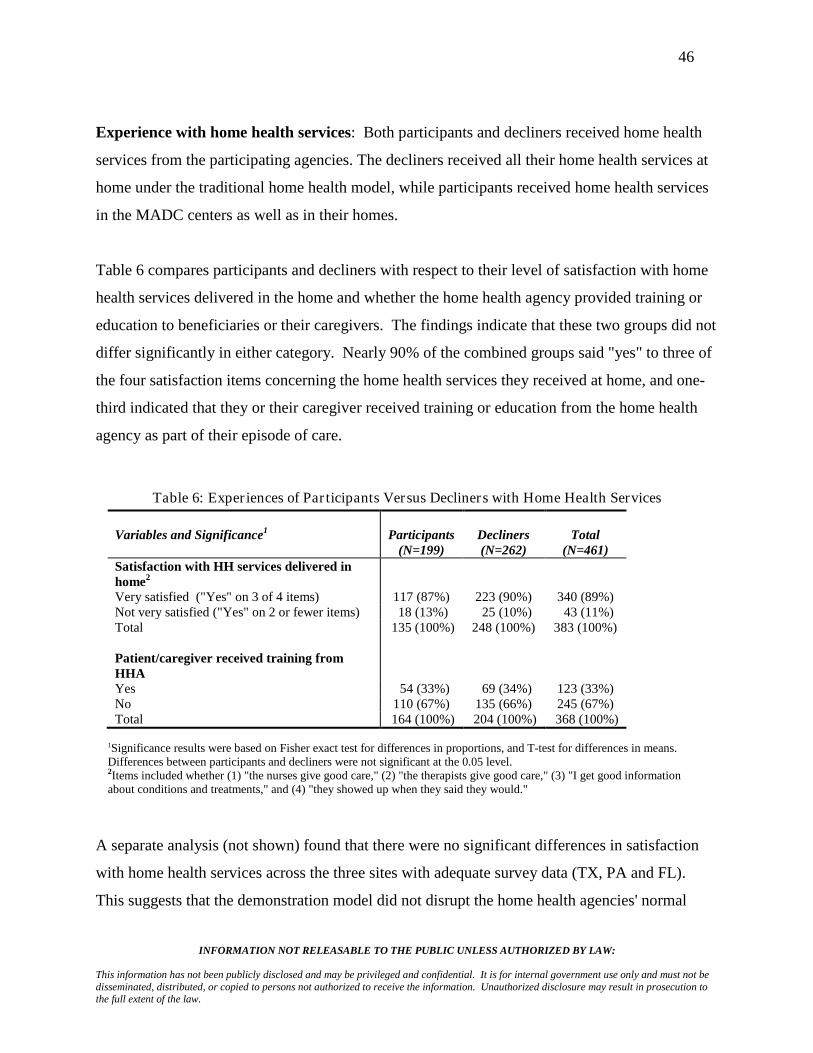
46
INFORMATION NOT RELEASABLE TO THE PUBLIC UNLESS AUTHORIZED BY LAW:
This information has not been publicly disclosed and may be privileged and confidential. It is for internal government use only and must not be disseminated, distributed, or copied to persons not authorized to receive the information. Unauthorized disclosure may result in prosecution to the full extent of the law.
Experience with home health services: Both participants and decliners received home health
services from the participating agencies. The decliners received all their home health services at
home under the traditional home health model, while participants received home health services
in the MADC centers as well as in their homes.
Table 6 compares participants and decliners with respect to their level of satisfaction with home
health services delivered in the home and whether the home health agency provided training or
education to beneficiaries or their caregivers. The findings indicate that these two groups did not
differ significantly in either category. Nearly 90% of the combined groups said "yes" to three of
the four satisfaction items concerning the home health services they received at home, and one-
third indicated that they or their caregiver received training or education from the home health
agency as part of their episode of care.
Table 6: Exper iences of Par ticipants Versus Decliners with Home Health Services Variables and Significance1
Participants
(N=199)
Decliners (N=262)
Total
(N=461) Satisfaction with HH services delivered in home2
Very satisfied ("Yes" on 3 of 4 items) 117 (87%) 223 (90%) 340 (89%) Not very satisfied ("Yes" on 2 or fewer items) 18 (13%) 25 (10%) 43 (11%) Total 135 (100%) 248 (100%) 383 (100%) Patient/caregiver received training from HHA
Yes 54 (33%) 69 (34%) 123 (33%) No 110 (67%) 135 (66%) 245 (67%) Total 164 (100%) 204 (100%) 368 (100%)
1Significance results were based on Fisher exact test for differences in proportions, and T-test for differences in means. Differences between participants and decliners were not significant at the 0.05 level. 2Items included whether (1) "the nurses give good care," (2) "the therapists give good care," (3) "I get good information about conditions and treatments," and (4) "they showed up when they said they would."
A separate analysis (not shown) found that there were no significant differences in satisfaction
with home health services across the three sites with adequate survey data (TX, PA and FL).
This suggests that the demonstration model did not disrupt the home health agencies' normal

47
INFORMATION NOT RELEASABLE TO THE PUBLIC UNLESS AUTHORIZED BY LAW:
This information has not been publicly disclosed and may be privileged and confidential. It is for internal government use only and must not be disseminated, distributed, or copied to persons not authorized to receive the information. Unauthorized disclosure may result in prosecution to the full extent of the law.
patterns of care around home-based services and education and training, at least from the
perspective of beneficiaries. During the site visits, home health agency staff expressed some
concern that the demonstration's delivery of services in MADC centers limited access to
caregivers and by extension limited the staff’s ability to provide training and education to this
group. This was because home health staffs were less often in the patient’s home and caregivers
seldom were in the MADC centers during home health visits. Staff were also concerned that the
mix of home-based and MADC-based home health services disrupted care continuity in cases
where different staff were used to provide services in these different settings.
Satisfaction with services in the MADC: In addition to their satisfaction with home health
services delivered in the home, the survey asked participants but not decliners about their
satisfaction with several aspects of the home health services delivered in the MADC centers, as
well as their satisfaction with the "overall experience" in the centers. Table 7 suggests that the
overwhelming majority of participants (86%) were very satisfied with the home health services
they received in the MADC centers. Similarly, when asked to rate their satisfaction with MADC,
82% were very satisfied. This is consistent with what was reported by the sample of
participants and their caregivers interviewed during the site visits.
The analysis also examined whether satisfaction with the overall experience in the MADC
differed for different types of beneficiaries. Table 8 compares participants who were very
satisfied with their MADC experience against beneficiaries who were not very satisfied
according to demographic and other characteristics (such as the living arrangement, Medicaid
status, etc). The findings indicate that satisfaction with the MADC experience was independent
of a beneficiary’s gender, residential status, ability to move around independently, need for
assistance with daily activities (such as bathing and dressing), and Medicaid enrollment. With
respect to age, however, participants who reported being very satisfied with their overall
experience in the MADC center were on average significantly younger than participants who
reported that they were not very satisfied (mean age 72.9 compared 81.1 respectively).
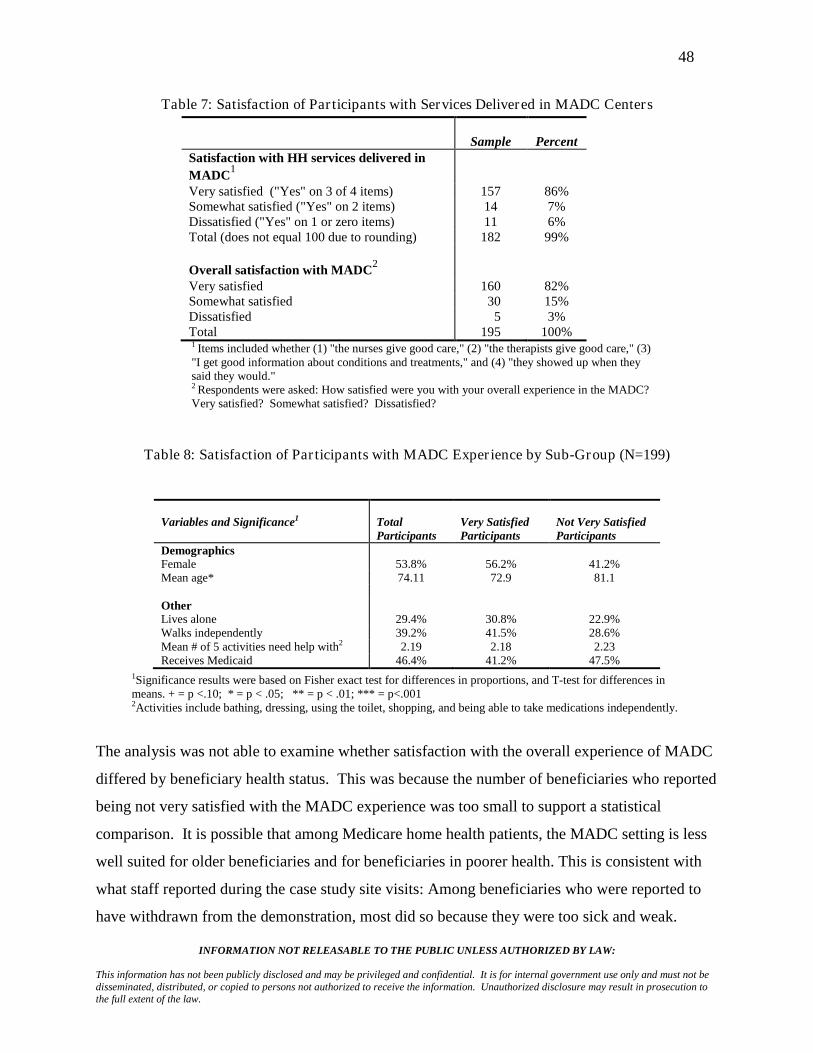
48
INFORMATION NOT RELEASABLE TO THE PUBLIC UNLESS AUTHORIZED BY LAW:
This information has not been publicly disclosed and may be privileged and confidential. It is for internal government use only and must not be disseminated, distributed, or copied to persons not authorized to receive the information. Unauthorized disclosure may result in prosecution to the full extent of the law.
Table 7: Satisfaction of Par ticipants with Services Delivered in MADC Centers
Sample
Percent
Satisfaction with HH services delivered in MADC1
Very satisfied ("Yes" on 3 of 4 items) 157 86% Somewhat satisfied ("Yes" on 2 items) 14 7% Dissatisfied ("Yes" on 1 or zero items) 11 6% Total (does not equal 100 due to rounding) 182 99% Overall satisfaction with MADC2 Very satisfied 160 82% Somewhat satisfied 30 15% Dissatisfied 5 3% Total 195 100% 1 Items included whether (1) "the nurses give good care," (2) "the therapists give good care," (3) "I get good information about conditions and treatments," and (4) "they showed up when they said they would." 2 Respondents were asked: How satisfied were you with your overall experience in the MADC? Very satisfied? Somewhat satisfied? Dissatisfied?
Table 8: Satisfaction of Par ticipants with MADC Exper ience by Sub-Group (N=199)
1Variables and Significance
Total Participants
Very Satisfied Participants
Not Very Satisfied Participants
Demographics Female 53.8% 56.2% 41.2% Mean age* 74.11 72.9 81.1 Other Lives alone 29.4% 30.8% 22.9% Walks independently 39.2% 41.5% 28.6% Mean # of 5 activities need help with2 2.19 2.18 2.23 Receives Medicaid 46.4% 41.2% 47.5%
1Significance results were based on Fisher exact test for differences in proportions, and T-test for differences in means. + = p <.10; * = p < .05; ** = p < .01; *** = p<.001
2Activities include bathing, dressing, using the toilet, shopping, and being able to take medications independently.
The analysis was not able to examine whether satisfaction with the overall experience of MADC
differed by beneficiary health status. This was because the number of beneficiaries who reported
being not very satisfied with the MADC experience was too small to support a statistical
comparison. It is possible that among Medicare home health patients, the MADC setting is less
well suited for older beneficiaries and for beneficiaries in poorer health. This is consistent with
what staff reported during the case study site visits: Among beneficiaries who were reported to
have withdrawn from the demonstration, most did so because they were too sick and weak.

49
INFORMATION NOT RELEASABLE TO THE PUBLIC UNLESS AUTHORIZED BY LAW:
This information has not been publicly disclosed and may be privileged and confidential. It is for internal government use only and must not be disseminated, distributed, or copied to persons not authorized to receive the information. Unauthorized disclosure may result in prosecution to the full extent of the law.
Other Experience with MADC: In addition to overall satisfaction with services, the survey
asked participants about their experiences with other dimensions of attending the MADC centers.
With respect to traveling to and from the MADC center, 69% relied on van services provided by
the MADC center. Only 14% reported relying on family or friends for transport (Table 9).
When asked how well their transportation arrangements worked, the overwhelming majority
(85%) reported that it worked very well. For most participants (84%), there was also no cost
associated with their transportation to and from the MADC center.
These findings are somewhat counter to what was reported by the participants who were
interviewed during the site visits. Among that group, beneficiaries from at least two sites (PA
and FL) expressed dissatisfaction with the transport services provided under the demonstration.
Complaints included the cost associated with the service (at one site), imprecise pick-up and
drop-off times, and the length of transport time. It is possible that transport services improved
between the time of the site visits and the implementation of the satisfaction survey. It is also
possible that the satisfaction survey results are skewed by the disproportionately large sample
from TX. The sample of beneficiaries interviewed during the site visit to TX did not complain
about transportation.
Under the demonstration, the home health agency paid the MADC for the days a participant
attended a MADC center to receive scheduled home health services. If participants wanted to
attend the MADC center on additional days, they could do so but needed to find another funding
source to pay (their own funds, Medicaid, etc). Only 15% of participants reported paying for
additional days in the MADC centers (Table 9).
Table 9: Exper ience of Par ticipants in the Demonstration (N=199)
Sample
Percent Transport to and from MADC Bus/van from program 134 69% Family/friend 28 14% Bus/van and family/friend 17 9% Other 16 8% Total 195 100%

50
INFORMATION NOT RELEASABLE TO THE PUBLIC UNLESS AUTHORIZED BY LAW:
This information has not been publicly disclosed and may be privileged and confidential. It is for internal government use only and must not be disseminated, distributed, or copied to persons not authorized to receive the information. Unauthorized disclosure may result in prosecution to the full extent of the law.
Sample
Percent
How well transport works Very well 159 85% OK 20 11% Not very well 8 4% Total 187 100% Costs associated with transport Yes 26 16% No 141 84% Total 167 100% Paying for any days in MADC Yes 29 15% No 166 85% Total 195 100% Would like to keep going to MADC Yes 183 93% No 13 7% Total 196 100% If yes, willing to pay for MADC Yes 58 32% Yes, I already pay 17 9% No 79 43% No – a public program pays 28 15% Total 182 99%1
1Totals do not equal 100% due to rounding.
Consistent with findings that most participants were very satisfied with their experiences in the
MADC, more than nine out of ten (93%) reported that they would like to continue attending the
MADC center after their episode of home health care ended. Of those who wanted to keep
attending the MADC, however, participants were split in their willingness to pay to attend a
MADC center. While 41% were willing to pay (and among them, some were already paying to
attend the MADC center on non-demonstration days), 43% were not willing to pay. Another
15% reported that they were not willing to pay because a public program was already paying for
their attendance. This is consistent with what was reported by the sample of beneficiaries
interviewed during the site visits, where many expressed a strong desire to continue going to the
MADC center, but few were willing or able to pay for the service.
A separate analysis of open-ended questions (not shown in a table) found that what participants
most liked about MADC was socializing, activities and games (true for 70% of the 190

51
INFORMATION NOT RELEASABLE TO THE PUBLIC UNLESS AUTHORIZED BY LAW:
This information has not been publicly disclosed and may be privileged and confidential. It is for internal government use only and must not be disseminated, distributed, or copied to persons not authorized to receive the information. Unauthorized disclosure may result in prosecution to the full extent of the law.
participants answering this question). The next most common response was "everything" (10%).
What respondents did not like about MADC included food (27% of 120 participants answering
this question), activities (15%), and not wanting to leave home (10%), often due to physical
problems. More than a quarter (26%) said there was nothing they did not like about MADC.
When asked how the "demonstration was good for you," the most common answer was
"everything" (28% of 129 respondents). The next-most common responses were that the:
• Caregiver received time off (22%);
• Respondent enjoyed getting out of the house and socializing (19%);
• Participant received good care and felt better for it (17%).
It is worth noting that only the third of these three specific responses refers to care, which may
include home health care, while the first two refer to things that MADC provides.
Out-of-pocket costs: Both the survey and the in-person interviews asked beneficiaries about
out-of-pocket costs for home-based and community-based services (HCBS), including MADC
services. According to the participants interviewed, the demonstration reduced out-of-pocket
expenditures for HCBS for a relatively small number of beneficiaries in two categories. These
involved (1) beneficiaries already attending and paying for MADC themselves, and (2) those that
had been paying for in-home care and that did not need to pay for it when they went to day care.
However, at the PA, WI, and FL sites, there were new transportation costs associated with day
care for some participants. This typically was approximately $2.50 to $5.00 per trip on a
subsidized senior citizens van. Fees were generally set on a sliding scale based on income.
Medicaid beneficiaries rode for free.
A separate analysis (not shown in a table) found that among survey respondents, 37% had paid
helpers in the home. More of the respondents who declined to participate had paid helpers
(42%) than participants (31%), and the difference was statistically significant. The helpers for
both groups were usually paid by public programs (79%), which left only 21% that had to pay
for their helpers themselves. Among the 60% of respondents that had out-of-pocket costs and
that reported their spending levels (N=22), the range was $12 to $750 per week, with a median of

52
INFORMATION NOT RELEASABLE TO THE PUBLIC UNLESS AUTHORIZED BY LAW:
This information has not been publicly disclosed and may be privileged and confidential. It is for internal government use only and must not be disseminated, distributed, or copied to persons not authorized to receive the information. Unauthorized disclosure may result in prosecution to the full extent of the law.
$110 and a mean of $236. There were no differences in out-of-pocket costs for participants and
decliners.
Limitations of the survey and interviews: The results of the survey could be biased if
beneficiaries who chose not to respond had unsatisfactory results with their home health care or
their MADC. The relatively high overall response rate achieved among participants (57 percent)
mitigates, but does not eliminate, this possibility for this group. Other limitations include
relatively high non-response rates to cost-related questions and the necessarily subjective nature
of responses to some questions. Another problem is common in studies of individuals'
satisfaction with health services: It is usual for very high proportions of respondents to be
generally satisfied with what they receive. This hampers detection and analysis of ways in
which beneficiaries may be less than satisfied. Finally, the results of the survey analysis are
based on unadjusted, bivariate comparisons of participants and decliners and as such do not
control for potential differences between these two groups that might affect satisfaction, such as
health status, caregiver support, income, etc. The evaluation team did not use adjusted,
multivariate models to estimate satisfaction because the data set did not support the specification
of adequate variables to control for these differences. Given this, conclusions from the analysis
of beneficiary satisfaction need to be treated cautiously since it is not possible to determine
whether satisfaction outcomes are due to demonstration effects or other unmeasured differences
between participants and decliners.
Summary: Results from the satisfaction survey suggest a very high level of satisfaction with the
demonstration among most participants. The Medicare services delivered by the demonstration
home health agencies to patients – whether in the home or the MADC – were rated very highly.
In fact, levels of satisfaction were comparable to patients who were receiving home health
services outside the demonstration.
The two groups for whom the demonstration model may be less well suited are older patients and
patients in poor health. It was these two groups that were most likely to decline to participate in
the demonstration. Furthermore, older patients who did participate were more likely to be
dissatisfied with their experience in the MADC center compared to their younger counterparts.

53
INFORMATION NOT RELEASABLE TO THE PUBLIC UNLESS AUTHORIZED BY LAW:
This information has not been publicly disclosed and may be privileged and confidential. It is for internal government use only and must not be disseminated, distributed, or copied to persons not authorized to receive the information. Unauthorized disclosure may result in prosecution to the full extent of the law.
In addition to high levels of satisfaction with home health services delivered under the
demonstration, participants were also very satisfied with their overall experience in the MADC
centers, including the transportation to and from the centers. Overwhelmingly, participants
expressed a desire to continue attending a MADC center after the demonstration was complete,
but they were split in their willingness and ability to pay for these services. Staff members that
tried hard to secure alternate funding of MADC services for beneficiaries who wanted to
continue attending a center echoed this tension.
D. Effects on Home Health Agency and MADC Finances
During the site visits, staff members at all home health agencies reported that for several reasons
the demonstration was contributing to financial losses rather than surpluses. This was due
primarily to the 5% reduction in Medicare reimbursement and to the added costs of operating the
demonstration, e.g., in marketing to agencies and patients and in managing information and
patient care. Additionally, except for the Texas site, there were seldom a sufficient number of
participants to realize the efficiencies of avoiding staff travel costs by delivering home health
services in a MADC center to multiple patients in sequence. The MADC staff interviewed
during site visits reported that the financial advantages of the very small increases in their census
associated with the demonstration were offset by small increases in their costs (mostly
administrative time) from participating.
Medicare cost report data add perspectives to these reports from home health agency staff.
However, cost report data have several limitations in providing understanding of the effects of
the demonstration. First, the most recent cost reports available are for agencies’ 2007 fiscal
years. This is less than half way into the demonstration, but it is the same period when the site
staff interviews were conducted. Second, cost reports cover an entire home health agency. In
three of the demonstration agencies, the demonstration occurred in only small sub-divisions of
very large agencies. Demonstration participants represented less than 1% of the Medicare
patients served by the NY and WI agencies, and 5% of patients served by the PA agency.

54
INFORMATION NOT RELEASABLE TO THE PUBLIC UNLESS AUTHORIZED BY LAW:
This information has not been publicly disclosed and may be privileged and confidential. It is for internal government use only and must not be disseminated, distributed, or copied to persons not authorized to receive the information. Unauthorized disclosure may result in prosecution to the full extent of the law.
Because Medicare cost reports cannot provide any plausible evidence of the demonstration's
impact on these three agencies, cost report analysis for them is not included in this report.
Given these limitations, the cost report data show the following patterns at the two remaining
sites (TX and FL) in terms of the proportion of agency patients that were Medicare, the
proportion of the agency's patients that were in the demonstration, the agency's focus on nursing
versus other services, the number of episodes per patient, and the agency's revenues:
• Texas: Doctors Care Home Health started and ended the period as a home health agency
serving nearly 100% Medicare patients, and demonstration participants represented about
22% of the agency's patients in 2007.5
It was the demonstration agency with the highest
proportion of its visits in skilled nursing – more than 70% throughout the period. The
agency sharply increased the number of episodes per patient for all Medicare
beneficiaries served from 1.0 in 2004 to 2.7 in 2007. Its total patient revenue increased
by a factor of five between 2004 and 2007, but the sharpest increases came before the
demonstration. Net revenue as a percent of total revenue (margin) was zero in 2004,
spiked to 13% in 2005, fell to 2% in 2006, and then fell back to near zero in 2007.
• Florida: Neighborly Care Network was focused almost exclusively on Medicare patients
both before and during the demonstration, and demonstration participants represented
about 13% of the agency's patients in 2007. Skilled nursing as a proportion of agency
visits increased from 2004 to 2006 (to 55%) and then fell in 2007. Episodes per patient
for all Medicare beneficiaries served fell after implementation from 1.4 per patient in
2006 to 1.0 in 2007. Patient revenue rose steadily, with an increase of about 80% over
5The estimate was calculated as follows. The 12 months of 2007 represented 36% of the total months (33) that Doctors participated in the demonstration; 36% of the 455 participants in the demonstration at Doctors is 165 participants for 2007. Overall, Doctors took in 672 new Medicare patients in 2007. The agency's total Medicare patients for the year would be the new patients plus the patients that were already being served at the start of 2007, which is estimated as one-twelfth of the 672, or 56 patients, yielding a total of 738 patients served. Therefore, 165 equals 22% of the 738 Medicare patients Doctors served in 2007. Figures on participants and demonstration months are from Table 1. Figures for Doctors' 2007 patients are from cost reports. The estimates for the FL site used the same calculations.

55
INFORMATION NOT RELEASABLE TO THE PUBLIC UNLESS AUTHORIZED BY LAW:
This information has not been publicly disclosed and may be privileged and confidential. It is for internal government use only and must not be disseminated, distributed, or copied to persons not authorized to receive the information. Unauthorized disclosure may result in prosecution to the full extent of the law.
2004 by 2007. Patient revenues net of patient costs appear to be inconsistent for this
agency for 2006 and 2007.6
Summary: The two agencies in which demonstration patients were a significant proportion of
business (FL and TX) had no clear patterns in the variables tracked with the onset of the
demonstration. The TX agency continued its sharp increase in total revenue and episodes per
patient, but its net revenue fell. The FL agency experienced modest growth in revenues, and its
episodes per patient fell after implementation. After implementation, the data for the FL agency
show a jump in net revenues to more than 80% in 2006 and 2007. These may be reporting
errors.6
E. Effects on Home Health Service Use, Medicare Expenditures, and Quality
Overview: The evaluation team used Medicare eligibility and Part A and B claims (but not Part
D) data to assess the effects of the demonstration on the utilization of home health services,
including an analysis of whether home health services were delivered in the MADC centers or in
the participants' homes. The team also used claims data to identify a comparison sample of
home health patients in the Medicare fee-for-service system in areas served by the demonstration
sites to assess the effects of the demonstration on Medicare expenditures and on the quality of
home health care delivered to participants. These analyses are presented in turn below.
Effects on the Use of Home Health Services: The evaluation team's goals in this analysis were
to answer two questions:
• How many beneficiaries were indicated to be demonstration participants based on the
appearance of the demonstration's billing code in their Medicare records?
• Among these participants, how was service delivery distributed between the home and
the MADC center, as indicated by a special code on the claim?
6 Reported data show an increase in margin from negative 10% in 2004 to positive 10%, 85%, and 85% in 2005, 2006, and 2007 respectively. Reconciling the inconsistencies was beyond the scope of this evaluation.

56
INFORMATION NOT RELEASABLE TO THE PUBLIC UNLESS AUTHORIZED BY LAW:
This information has not been publicly disclosed and may be privileged and confidential. It is for internal government use only and must not be disseminated, distributed, or copied to persons not authorized to receive the information. Unauthorized disclosure may result in prosecution to the full extent of the law.
The evaluation also analyzed the average number of each home health service delivered in the
two settings.
Findings from this analysis are reported in Table 10. Part A of the table shows the total number
of visits for each home health service provided by each site from the beginning of the
demonstration through the end of 2008. For all sites, nursing and PT were the predominant
services. Part B of Table 10 shows the percent of home health visits provided in MADC centers
for each site for all participants. For example, at the FL site, 59% of all PT visits occurred in
MADC centers. The remaining 41% were therefore provided in beneficiaries' homes. Across all
sites, nearly half of all visits (49%) were provided in MADC centers. The NY site was on the
high end, providing 60% of all visits in its MADC center, and the FL site was on the low end,
providing 39% of all visits in its MADC centers. By service type, PT visits were most likely to
be provided in the MADC center, and home health aide visits the least likely. Only two sites
(NY and WI) provided home health aide services in the MADC centers. The remaining three
sites (FL, PA, and TX) provided home health aide services exclusively in the home setting.
During site visit interviews, home health staff gave a number of reasons why such a significant
proportion of home health services for participants continued to be delivered at home, including:
• Almost all initial nursing visits were conducted at home;
• Sometimes participants were too sick and weak to attend MADC early in their episodes;
• It took time to set up transportation and complete application/admission processes for
MADC;
• Sometimes participants became ill and stayed at home after starting MADC;
• Patients who started MADC were allowed to change their minds about attending and
receive home health services at home for the rest of their episodes.
Part C of Table 10 shows the mean number of visits for each service per episode by site. With
the exception of WI, the sites were remarkably similar in the mean number of visits delivered per
episode of care (ranging between 15.7 and 19.5 visits). The mean number of visits per episode
for WI participants was 27.1. This is consistent with what was reported during the case study
visit in WI: At least initially, staff at this site tended to order more services for demonstration
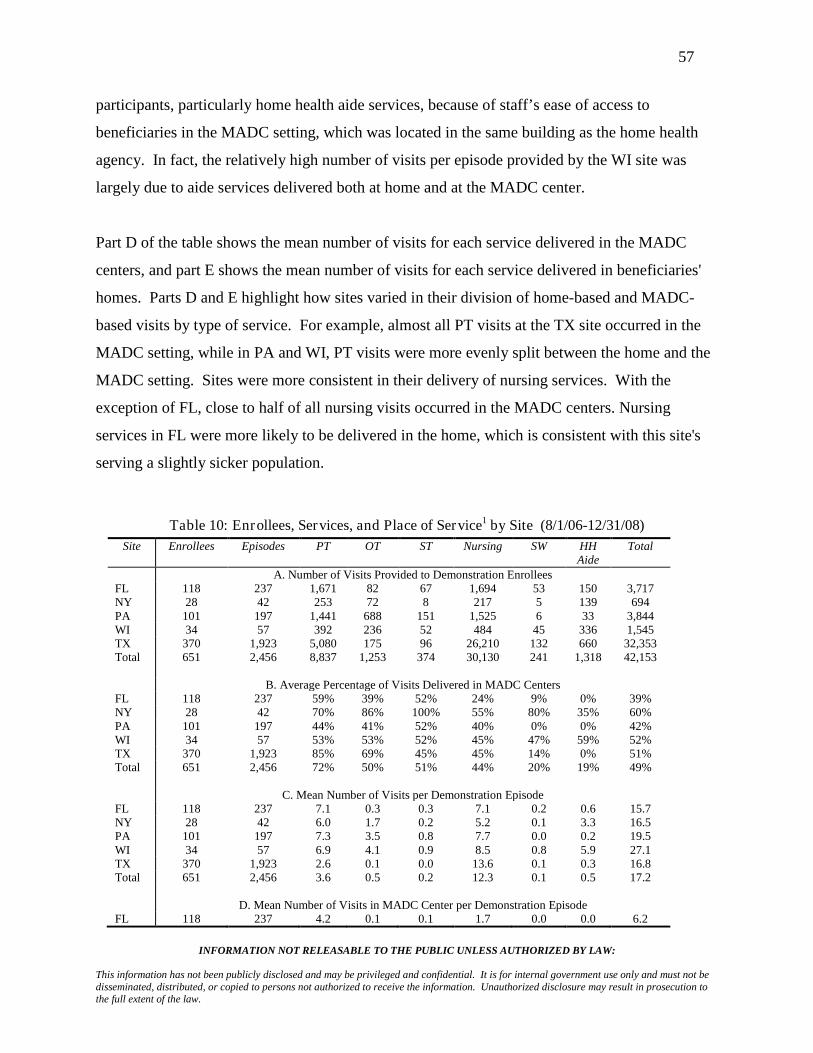
57
INFORMATION NOT RELEASABLE TO THE PUBLIC UNLESS AUTHORIZED BY LAW:
This information has not been publicly disclosed and may be privileged and confidential. It is for internal government use only and must not be disseminated, distributed, or copied to persons not authorized to receive the information. Unauthorized disclosure may result in prosecution to the full extent of the law.
participants, particularly home health aide services, because of staff’s ease of access to
beneficiaries in the MADC setting, which was located in the same building as the home health
agency. In fact, the relatively high number of visits per episode provided by the WI site was
largely due to aide services delivered both at home and at the MADC center.
Part D of the table shows the mean number of visits for each service delivered in the MADC
centers, and part E shows the mean number of visits for each service delivered in beneficiaries'
homes. Parts D and E highlight how sites varied in their division of home-based and MADC-
based visits by type of service. For example, almost all PT visits at the TX site occurred in the
MADC setting, while in PA and WI, PT visits were more evenly split between the home and the
MADC setting. Sites were more consistent in their delivery of nursing services. With the
exception of FL, close to half of all nursing visits occurred in the MADC centers. Nursing
services in FL were more likely to be delivered in the home, which is consistent with this site's
serving a slightly sicker population.
Table 10: Enrollees, Services, and Place of Service1 by Site (8/1/06-12/31/08) Site Enrollees Episodes PT OT ST Nursing SW HH
Aide Total
A. Number of Visits Provided to Demonstration Enrollees FL 118 237 1,671 82 67 1,694 53 150 3,717 NY 28 42 253 72 8 217 5 139 694 PA 101 197 1,441 688 151 1,525 6 33 3,844 WI 34 57 392 236 52 484 45 336 1,545 TX 370 1,923 5,080 175 96 26,210 132 660 32,353 Total 651 2,456 8,837 1,253 374 30,130 241 1,318 42,153 B. Average Percentage of Visits Delivered in MADC Centers FL 118 237 59% 39% 52% 24% 9% 0% 39% NY 28 42 70% 86% 100% 55% 80% 35% 60% PA 101 197 44% 41% 52% 40% 0% 0% 42% WI 34 57 53% 53% 52% 45% 47% 59% 52% TX 370 1,923 85% 69% 45% 45% 14% 0% 51% Total 651 2,456 72% 50% 51% 44% 20% 19% 49% C. Mean Number of Visits per Demonstration Episode FL 118 237 7.1 0.3 0.3 7.1 0.2 0.6 15.7 NY 28 42 6.0 1.7 0.2 5.2 0.1 3.3 16.5 PA 101 197 7.3 3.5 0.8 7.7 0.0 0.2 19.5 WI 34 57 6.9 4.1 0.9 8.5 0.8 5.9 27.1 TX 370 1,923 2.6 0.1 0.0 13.6 0.1 0.3 16.8 Total 651 2,456 3.6 0.5 0.2 12.3 0.1 0.5 17.2 D. Mean Number of Visits in MADC Center per Demonstration Episode FL 118 237 4.2 0.1 0.1 1.7 0.0 0.0 6.2

58
INFORMATION NOT RELEASABLE TO THE PUBLIC UNLESS AUTHORIZED BY LAW:
This information has not been publicly disclosed and may be privileged and confidential. It is for internal government use only and must not be disseminated, distributed, or copied to persons not authorized to receive the information. Unauthorized disclosure may result in prosecution to the full extent of the law.
Site Enrollees Episodes PT OT ST Nursing SW HH Aide
Total
NY 28 42 4.2 1.5 0.2 2.8 0.1 1.2 10.0 PA 101 197 3.2 1.4 0.4 3.1 0.0 0.0 8.1 WI 34 57 3.6 2.2 0.5 3.8 0.4 3.5 14.0 TX 370 1,923 2.2 0.1 0.0 6.2 0.0 0.0 8.5 Total 651 2,456 2.6 0.3 0.1 5.4 0.0 0.1 8.4 E. Mean Number of Visits at Home per Demonstration Episode FL 118 237 2.9 0.2 0.1 5.5 0.2 0.6 9.5 NY 28 42 1.8 0.2 0.0 2.3 0.0 2.1 6.5 PA 101 197 4.1 2.1 0.4 4.6 0.0 0.2 11.4 WI 34 57 3.2 1.9 0.4 4.7 0.4 2.4 13.1 TX 370 1,923 0.4 0.0 0.0 7.4 0.1 0.3 8.3 Total 651 2,456 1.0 0.3 0.1 6.9 0.1 0.4 8.7
1PT: Physical Therapy; OT: Occupational Therapy; ST: Speech Therapy; SW: Social Work; HH Aide: Home Health Aide.
In sum, all sites utilized the demonstration model, delivering a range of home health services in
the MADC settings. At the same time, despite this new option, home-based services remained a
significant delivery mode for all sites. On average, for a variety of reasons, half of all visits
continued to take place in the home. Four of the five sites were also similar in the number of
visits provided per episode (range of 15.7 to 19.5 visits). The exception was the WI site, which
tended to provide more visits per episode overall (27.1) and particularly in the MADC center
(14.0). All sites were similar in that the dominant services delivered were nursing and PT.
Where sites differed most was in how they managed particular services. For instance, all sites
except PA delivered most PT service in the MADC centers, and three sites (TX, PA, and FL)
delivered home health aide services exclusively in the home. These sites' MADC centers were
not equipped or staffed to provide grooming or bathing services, which were the most common
aide services delivered at the NY and WI sites.
Effects on Beneficiary Health Expenditures and Functional Status: By altering the setting for
provision of home health services from the home to a MADC center, the demonstration aimed to
reduce Medicare service expenditures while enhancing (or at least not diminishing) outcomes for
beneficiaries. The evaluation team's quantitative analysis of Medicare expenditures assessed
whether the demonstration affected a beneficiary's need for health services covered by Medicare,
both in total and by type of service. The team's quantitative analysis of health and functional

59
INFORMATION NOT RELEASABLE TO THE PUBLIC UNLESS AUTHORIZED BY LAW:
This information has not been publicly disclosed and may be privileged and confidential. It is for internal government use only and must not be disseminated, distributed, or copied to persons not authorized to receive the information. Unauthorized disclosure may result in prosecution to the full extent of the law.
status assessed whether the demonstration affected a beneficiary's capacity for independent
living.
The evaluation team used a standard quasi-experimental design to estimate demonstration effects
on Medicare expenditures and health and functional status outcomes. The steps in performing
the analysis involved identifying the participants to be included, selecting a comparison group of
home health patients in the community, collecting expenditure data from Medicare claims files,
collecting functional and health status data from Medicare's Outcome and Assessment
Information Set (OASIS) files, conducting multivariate regression analysis, and determining
whether data could be pooled across sites. Each of these steps is detailed below.
Participant identification. The evaluation team identified demonstration participants using the
rosters provided by the demonstration sites. The beneficiary Medicare identification number
provided on these rosters was also used to identify participants' Medicare claims. Because of the
need to have a full year of claims after the start of a beneficiary's home health episode, and
because of the 6-month lag between the submission of claims and the availability of full paid
claims records in DESY, only participants starting episodes by December 31, 2007 could be
included in the analyses of financial and functional status. Using the Medicare identification
number provided by the sites, the evaluation team was able to determine the Medicare claims for
61 of 68 participants in PA, 79 of 102 participants in FL, and 270 of 277 participants in TX who
met the cut-off date criterion. The early cut-off date of December 31, 2007 is the explanation for
why the sample sizes for the regression analyses are lower than the total numbers participating in
the demonstration as shown in Table 10. Because of low numbers of participants, the NY and
WI sites' participants could not be used for the statistical analyses.
Comparison group. The team identified a comparison group of Medicare home health patients
who were served by home health agencies located in the same market areas as the demonstration

60
INFORMATION NOT RELEASABLE TO THE PUBLIC UNLESS AUTHORIZED BY LAW:
This information has not been publicly disclosed and may be privileged and confidential. It is for internal government use only and must not be disseminated, distributed, or copied to persons not authorized to receive the information. Unauthorized disclosure may result in prosecution to the full extent of the law.
providers. The comparison patients were selected to match demonstration participants exactly
with respect to gender and age group, and HCC (Hierarchical Condition Categories) indicators7.
Collection of expenditure data. The team collected and summed Medicare expenditures for home
health, physician, inpatient, outpatient, and skilled nursing facility services for participants for
the 365 days prior to the start of their first home health episode in the demonstration and for the
365 days after that date. For the comparison beneficiaries, the team collected data on the same
measures prior to and after a pseudo-start date, which was determined as the start of a home
health episode in the same year as the matched participant’s start date. When a comparison
beneficiary had multiple home health episodes in the year, the pseudo-start date was selected so
that the comparison beneficiary had the same number of prior home health episodes as the
matching participant. The team used CMS’s Data Extract System (DESY) to access the
Medicare claims.
Collection of functional and health-status data. Data on health and functional status outcomes
for participants and comparison patients were derived from Medicare's OASIS data elements.
Although Medicare protocol calls for home health beneficiaries to receive OASIS assessments at
the beginning of their episode, at each subsequent payment authorization (commonly at 60-day
intervals), and at discharge, the evaluation team was not able to find the required pre- and post-
start OASIS assessments for all demonstration and comparison subjects.8 As a result, the
7 Hierarchical Condition Categories are a set of 184 diagnosis categories used for Medicare risk adjustment. 8 Specifically, 75 demonstration participants and 122 comparisons in Texas, 23 demonstration participants and 40 comparisons in Florida, and 14 demonstration participants and 31 comparisons in Pennsylvania failed to have records in OASIS with dates after demonstration start date (pseudo-start date in the case of comparisons). One possible reason for these omissions was that the beneficiary either died or was readmitted to a hospital. In such a circumstance, the home health agency might not have had the opportunity to perform its usual discharge processing. However, analyses of Medicare inpatient claims and the vital statistics file (providing date of death, if applicable) indicate that these were not major causes of the missing assessments. Only 7 study subjects in Texas, 10 subjects in Florida, and 2 subjects in Pennsylvania died or directly entered a hospital upon their home health discharge. A second contributing factor was that even when appropriately dated OASIS records on study subjects were found, they did not always include complete assessment information. This problem was more prevalent for IADL and cognitive function items and also more common among comparison subjects than demonstration participants. In Texas 119 demonstration participants and 80 comparisons had OASIS discharge

61
INFORMATION NOT RELEASABLE TO THE PUBLIC UNLESS AUTHORIZED BY LAW:
This information has not been publicly disclosed and may be privileged and confidential. It is for internal government use only and must not be disseminated, distributed, or copied to persons not authorized to receive the information. Unauthorized disclosure may result in prosecution to the full extent of the law.
functional status analyses in this report were based on 195 participants and 148 comparison
subjects in TX; 39 participants and 27 comparison subjects in PA; and 68 participants and 28
comparison subjects in FL. Individual OASIS items ranged in value from 0 to 1 for no/yes
questions and from 0 to 5 for other questions. Using 18 of these items, the evaluation team
developed simple scales in three categories: activities of daily living (ADLs - 7 measures),
instrumental ADLs (6), and cognitive/behavioral (5). For each category, the scale was
constructed by adding the values for each question and then dividing by the maximum possible
score. A higher value for a scale indicates that the beneficiary was assessed as having more
problems in that assessment domain. These scales together with 6 individual measures for
ambulation (1), incontinence (2), and medical problems (3) were used as outcomes in the
regression analyses. If a beneficiary’s value for one of these scales decreased between the pre-
and post-demonstration periods, this means that the patient was doing better in that domain on
the follow-up assessment compared to the initial assessment. Cronbach's alpha statistics were
computed for these scales and showed that they achieved high reliability. Details of the items
included in the scales and the results of reliability analysis are included in Appendix C.
Regression analysis. The evaluation team examined the difference between the demonstration
groups and the comparison groups by comparing the change in each outcome measure (i.e.,
expenditures for Medicare services and functional status) from the prior period to the post
period. This is called a "difference-in-difference" analysis. Regression analysis was used to
adjust individual beneficiary outcome variables for other factors affecting health services
utilization and expenditure. Covariates to adjust for these factors included age, gender, number
of prior home health episodes, and medical co-morbidity, as measured by Medicare's Diagnostic
Cost Groups (DCG) score. The team also included random effects for each beneficiary to adjust
for correlation between their pre- and post-period expenditures. To isolate the impact of
demonstration participation, each regression model included indicator variables for
demonstration status (participant versus comparison subject), time period (post versus pre
assessments with important functional status information missing. Similarly, in Florida 15 demonstration participants and 10 comparisons had discharge OASIS assessments with important assessment information missing, and in Pennsylvania the numbers were 7 demonstration participants and 4 comparisons.

62
INFORMATION NOT RELEASABLE TO THE PUBLIC UNLESS AUTHORIZED BY LAW:
This information has not been publicly disclosed and may be privileged and confidential. It is for internal government use only and must not be disseminated, distributed, or copied to persons not authorized to receive the information. Unauthorized disclosure may result in prosecution to the full extent of the law.
demonstration), and the interaction of these two variables. Only the estimated coefficients for
the interaction terms are reported below, because these represent the impact of the demonstration
taking into account the other factors. The table in Appendix C presents the definitions of all
outcome variables and all independent variables. It also reports the means and standard
deviations for each of the variables by site.
Site-specific analyses. The analysis of the demonstration's impact on expenditures and
beneficiary outcomes was conducted separately for each demonstration site before considering
whether demonstration and comparison groups for each site could be pooled. The site case
studies revealed varying approaches to implementing the demonstration, and there were
substantial differences across the demonstration service areas in the composition of the Medicare
population and area health expenditures. It became clear as the quantitative analysis proceeded
that pooled analysis was not warranted.
Demonstration impacts on Medicare expenditures. Table 11 summarizes the findings from the
multivariate regressions regarding the demonstration's impact on Medicare expenditures.9
9 The size of the analysis groups in Tables 11 and 12 differ from each other and from the figures on participants reported in Table 1. The explanations for this are as follows. First, the participant numbers reported in Section 4 of Table 1 include all participants starting as late as March and April 2009. In contrast, the analyses conducted for Tables 11 and 12 required a full year of claims data after a participant's start date in the demonstration, and this required a December 2007 cut-off date. For example, the 540 individuals in the analysis sample for TX in Table 11 include 270 participants plus 270 matched comparisons. There are only 270 TX participants (compared to the 455 participants in Table 1) because the analysis sample start dates had to be much earlier, The figures in Table 12 are smaller yet because of both an earlier cut-off date than spring 2009 and the unavailability of full OASIS data for some participants and comparisons, as explained in Footnote 8 on page 63.
First,
the coefficients for the demonstration effect on total Medicare expenditures (expressed in
average annual Medicare expenditures per person) indicate that there is no evidence of
expenditure savings from the demonstration. On the contrary, at all three sites the effect on total
Medicare expenditures is positive, indicating that adjusted prior-year to post-year expenditure
changes for demonstration participants were on average higher than adjusted expenditure
changes for comparison subjects. For participants from the TX agency, the difference was of
sufficient size and the group was large enough to produce a significant result. The mean

63
INFORMATION NOT RELEASABLE TO THE PUBLIC UNLESS AUTHORIZED BY LAW:
This information has not been publicly disclosed and may be privileged and confidential. It is for internal government use only and must not be disseminated, distributed, or copied to persons not authorized to receive the information. Unauthorized disclosure may result in prosecution to the full extent of the law.
difference-in-difference statistic was $5,398, indicating that the year-to-year change in Medicare
expenditures for the participants was $5,398 higher on average than the year-to-year change in
total expenditures for the matched control group. This finding was significant at the 0.001 level,
which means that there is only one chance in 1,000 that there is actually no difference between
the year-to-year changes for demonstration and comparison beneficiaries. For the other two
agencies analyzed, the demonstration effects were also positive but not significant even at the
0.10 level.
Table 11: Effects of MADC Demonstration on Medicare Expenditures1
Services Florida (N=158) Texas (N=540) Pennsylvania (N=122) Home Health $531 $5,861** $2,486** Inpatient $2,748 -$632 $2,025 Outpatient $369 -$42 -$309 Physician $970 $40 -$778 Skilled Nursing Facility -$111 $172 -$1,809 Total Medicare $4,507 $5,398** $1,614
1Demonstration effect (Observation of participant in Post Period = 1). Significance: + = p <.10; * = p < .01; ** p < .001
Second, the demonstration-effect coefficients by service type denote their contribution toward
the overall demonstration effect. For the TX and PA sites, the largest and only significant
contributions to overall expenditure increases came from home health services. Year-to-year
changes in home health expenditures for participants in TX were on average $5,861 higher than
the year-to-year changes for comparisons (Table 11). The $5,861 difference is based on a year-
to-year increase for TX participants of $8,381, more than three times the $2,520 increase of
comparisons. Similarly, in PA the change in participant home health expenditures was $2,486
higher than the equivalent change for comparisons (a year-to-year increase for PA participants of
$3,976 compared to a $1,490 increase for comparisons). Although for these two agencies, the
net changes across the other four service types were negative ($462 less for TX and $871 less for
PA), the expenditures for home health services increased so much that the total effects of the
demonstration on expenditures were positive (significantly positive in the case of TX).
In FL, the pattern was distinctly different. Although expenditures for all service types except
skilled nursing facilities increased more for FL demonstration participants than FL comparisons,

64
INFORMATION NOT RELEASABLE TO THE PUBLIC UNLESS AUTHORIZED BY LAW:
This information has not been publicly disclosed and may be privileged and confidential. It is for internal government use only and must not be disseminated, distributed, or copied to persons not authorized to receive the information. Unauthorized disclosure may result in prosecution to the full extent of the law.
the major contribution came from inpatient claims, which accounted for over 60% of the total
demonstration effect. The $531 difference in home health spending change between participants
and comparisons was not significant. The year-to-year increases were $3,329 for participants
and $2,798 for comparisons.10
These differentially higher expenditures were derived from regression models which adjusted for
demographic, health, and prior service utilization factors. These adjustment factors are not
displayed in Table 11, but their effects are worth noting. First, the gender and age variables had
only minor and usually not significant effects. Second, the variable for prior number of home
health episodes was usually highly significant in models concerning home health expenditures,
and consequentially this variable affected overall expenditures as well. Third, demonstration
participants in all three sites had more certifications for home health care in their first year under
the demonstration than their comparisons. The mean number of certifications of demonstration
and comparison beneficiaries in the year after the start of the home health demonstration were
1.72 for participants versus 1.53 for comparisons in FL, 1.75 versus 1.67 in PA, and 4.47 versus
3.46 in TX. In the case of Texas this difference was large enough to be significant.
Further, given the large number of recertifications, it is not surprising that a substantial
percentage of demonstration participants at each site came from beneficiaries that the home
health agencies had served previously as patients: 34 out of 79 (43%) in FL, 30 out of 61 (49%)
in PA, and 151 out of 270 (56%) in TX. Fourth, as might be expected, the variable for medical
co-morbidity at start date (specified by DCG score) had a significantly positive effect on overall
expenditures for all sites. For the FL site, higher DCG scores at start date were associated only
10 For the TX site, the mean home health spending in the year before the index episode was $3,729.49 versus $12,111.05 in the year after, for a difference of $8,381.56. For the TX comparisons, the figures are $6,183.66 pre, $8,703.83 post, and $2,520.17 difference. The difference between participants and comparisons was therefore $5,861.39. For the PA site participants, the figures are $1,778.35 pre, $5,754.33 post, for a difference of $3,975.98. For the PA comparisons, the figures are $2,116.13 pre, $3,606.42 post, for a difference of $1,490.30. The difference between participants and comparisons was therefore $2,485.68. For the FL participants, the figures are $1,750.71 pre, $5,079.76 post, for a difference of $3,329.05. For the FL comparisons, the figures are $2,718.76 pre, $5,516.68 post, for a difference of $2,797.92. The difference between participants and comparisons was therefore $531.13.

65
INFORMATION NOT RELEASABLE TO THE PUBLIC UNLESS AUTHORIZED BY LAW:
This information has not been publicly disclosed and may be privileged and confidential. It is for internal government use only and must not be disseminated, distributed, or copied to persons not authorized to receive the information. Unauthorized disclosure may result in prosecution to the full extent of the law.
with higher inpatient expenditures. For the TX and PA sites, higher DCG scores at start date
predicted significantly higher expenditures for all service types except skilled nursing facilities.
One factor on which the participants and comparison beneficiaries may have differed for which
no data are available for comparisons is whether they were MADC users. This might account for
some of the differential change in expenditure patterns.
Demonstration impact on hospitalization. Using Medicare inpatient claims, the evaluation team
determined for each participant and comparison patient whether he or she experienced a
hospitalization in the year prior to the start date or pseudo-start date and in the year after this
date. This allowed the team to use hierarchical logistic regression to estimate the impact of the
demonstration on the probability of hospitalization. The same set of variables employed in the
Medicare expenditure analyses were used to adjust for beneficiary differences. This analysis
(not shown in a table) found small increases in the likelihood of hospitalization among
demonstration participants, but none of the effects reached statistical significance at the 0.10
level. The only variable consistently significant in the three models (highly significant in the
case of FL and TX) was the health condition variable (the DCG score), a variable specifically
included in the model as a risk adjustor.
Demonstration impact on the quality of care. Table 12 provides key findings from multivariate
regressions on OASIS functional status outcomes for each of the three sites in the analysis. The
regression analysis provides no evidence that the demonstration led to greater improvement (or
less decline) in functional status or among selected medical outcomes for its participants. For the
FL site, the evidence suggests that demonstration participants improved differentially less than
comparison patients in ADLs (0.329), IADLs (0.516), bladder incontinence (0.364), and pain
(0.532). The positive scores indicate differentially less improvement for participants than
comparison patients in these areas of functioning. There were no significant quality impacts at
the PA or TX sites.

66
INFORMATION NOT RELEASABLE TO THE PUBLIC UNLESS AUTHORIZED BY LAW:
This information has not been publicly disclosed and may be privileged and confidential. It is for internal government use only and must not be disseminated, distributed, or copied to persons not authorized to receive the information. Unauthorized disclosure may result in prosecution to the full extent of the law.
Table 12: Effects of the MADC Demonstration on Health and Functional Status1
Outcomes2
Florida (N=96) Texas (N=343) Pennsylvania (N=66)
7 OASIS ADL items .329+ .011 .161 6 OASIS IADL items .516** .020 .095 Ambulation .163 .095 .189 Cognitive/behavior .104 -.065 .094 Bowel incontinence .087 .087 .089 Bladder incontinence .364** .079 .123 Short of breath -.166 -.020 -.218 Urinary tract infection .019 .015 -.046 Frequency of pain .532* -.044 .152
1Demonstration effect (Observation of participant in Post Period = 1). Significance: + = p <.10; * = p < .01; ** p < .001 2See Appendix C for definitions of outcome items.
Summary. The results of the quantitative analyses of Medicare expenditures and quality of care
do not show any advantages for the demonstration in either area compared to outcomes in non-
demonstration home health agencies. In fact, there are several instances in which the findings
tend to show poorer outcomes for the demonstration: higher overall Medicare expenditures at the
TX site, higher home health expenditures at the TX and PA sites, and poorer quality outcomes in
several domains at the FL site. The high costs at the TX site may be due to that site's relatively
high numbers of home health episodes per participant, which were discussed in Sections III.A
and III.C. There is nothing in other sections of the evaluation to explain the quality findings for
the FL site.
For several reasons, the health and functional status findings must be interpreted with caution.
First, there are no findings from two of the demonstration sites, whose numbers of participants
were too small to evaluate with multivariate methods. Among the other sites, missing post-start
OASIS assessments among both participants and comparisons could introduce selection bias in
the samples of beneficiaries that were analyzed. Finally, the sample sizes at two of the other
sites (PA and FL) were adequate but smaller than desirable for a highly discerning quality of care
analysis.
67
INFORMATION NOT RELEASABLE TO THE PUBLIC UNLESS AUTHORIZED BY LAW:
This information has not been publicly disclosed and may be privileged and confidential. It is for internal government use only and must not be disseminated, distributed, or copied to persons not authorized to receive the information. Unauthorized disclosure may result in prosecution to the full extent of the law.
With regard to expenditures, inadequate sample size was not the issue. The evidence
consistently pointed toward differentially higher expenditures for demonstration participants.
Indeed, one site (TX) showed statistically significant evidence of increases in total Medicare
expenditures. The significant increase in home health spending in PA was offset by decreases
for other services and did not demonstrate a significant increase in total spending. It should also
be noted that quasi-experimental designs, such as the one employed in the quantitative portion of
the evaluation, might contain unobserved biases that influence findings. Only a randomized
controlled trial, not possible for this demonstration evaluation, would be able to overcome all
concerns about bias.
68
INFORMATION NOT RELEASABLE TO THE PUBLIC UNLESS AUTHORIZED BY LAW:
This information has not been publicly disclosed and may be privileged and confidential. It is for internal government use only and must not be disseminated, distributed, or copied to persons not authorized to receive the information. Unauthorized disclosure may result in prosecution to the full extent of the law.
Chapter IV. Discussion of Findings, Challenges, Limitations, and Implications
This chapter summarizes the results of the evaluation regarding the implementation of the
demonstration, home health agency finances, beneficiary satisfaction, and impacts on Medicare
costs, quality and service utilization. Conclusions include recommendations for how to allow
delivery of home health services in MADC centers should this policy be adopted.
A. Demonstration Implementation
Four findings stand out regarding the implementation of the demonstration. First, it is feasible to
deliver Medicare home health services in MADC centers, but doing so effectively appears to
require professionals with home health experience. Coordinating the delivery of home health
services with beneficiaries' attendance at MADC centers adds work for home health staff.
Although participants agreed to receive home health services in MADC centers, about half of
home health services for participants continued to be delivered at home.
Second, there is a subset of the Medicare home health patient population who agreed to receive
home health services in MADC centers and who found aspects they liked about this model.
First, compared to other home health patients who declined to participate, the subset that agreed
to participate generally had similar levels of chronic physical and/or cognitive disabilities, but
they had fewer chronic health conditions and were somewhat younger. Second, results of the
survey indicated what participants liked about the model related to MADC itself: getting out of
the house, social activities, and respite for family caregivers. Finally, participants who were
younger tended to be more satisfied with their MADC experience than participants who were
older.
Third, working collaboratively, home health agencies and MADC centers were able to identify
and recruit the target population among beneficiaries who were not previously using MADC as
well as among beneficiaries already using MADC. However, at four of the five sites in the
demonstration, the target population was relatively small, and participation tended to be short-
term due to single home health episodes and inability to find a way to pay for MADC after the
demonstration payments ended. Only the TX site was able to recruit large numbers of
69
INFORMATION NOT RELEASABLE TO THE PUBLIC UNLESS AUTHORIZED BY LAW:
This information has not been publicly disclosed and may be privileged and confidential. It is for internal government use only and must not be disseminated, distributed, or copied to persons not authorized to receive the information. Unauthorized disclosure may result in prosecution to the full extent of the law.
participants. This seemed to be related to its operation in an area with widespread use of
Medicaid-funded MADC, and where multiple home health episodes for Medicare beneficiaries
were common. The TX site had 17 to 25 MADC centers under contract, compared to 7 in PA, 4
in FL, and one each in NY and WI. Fully 78% of the TX participants were in MADC in the 30
days prior to starting the demonstration, versus 66% in FL, 35% in WI, and 3% in both PA and
NY.
Fourth, the beneficiaries who were excluded from participation in the demonstration by the home
health agencies generally did not differ from those that were offered participation in terms of
their utilization of and expenditures for Medicare services. In turn, those that were offered but
declined to participate generally did not differ from those that accepted the offer. The exception
was the WI site, where participants tended to have lower pre- and post-utilization and
expenditures than beneficiaries that were excluded and that declined. Interviews and survey data
suggested decliners were more likely to perceive themselves as unsuitable for MADC
attendance.
B. Beneficiary Satisfaction
Generally, Medicare beneficiaries were very satisfied with both home health and MADC
services, according to in-person interviews and the telephone survey. First, nearly 90% of both
participants and decliners who were surveyed were very satisfied with the home health services
they received in their homes, as indicated by their saying "yes" on three of dimensions of
satisfaction. Second, 82% of participants were "very satisfied" with their "overall experiences"
in MADC, and 86% were very satisfied with the home health services they received in the
MADC. Fully 93% of participants wanted to continue with MADC. The things participants
liked most often about MADC were the activities and socialization and the time off for their
caregivers at home. The thing they liked least was the food. Beneficiaries who declined to
participate in the demonstration had similarly high levels of satisfaction with home health
services received at home.

70
INFORMATION NOT RELEASABLE TO THE PUBLIC UNLESS AUTHORIZED BY LAW:
This information has not been publicly disclosed and may be privileged and confidential. It is for internal government use only and must not be disseminated, distributed, or copied to persons not authorized to receive the information. Unauthorized disclosure may result in prosecution to the full extent of the law.
C. Effects of the Demonstration on Home Health Agency and MADC Finances
There was no evidence from either cost reports or site visit interviews that the demonstration
improved home health agency finances. On the contrary, site staff reported negative effects on
finances due to the 5% reduction in Medicare reimbursement for participants and the extra costs
of operating the demonstration, including paying the MADC centers their daily charges on the
days participants attended. Cost reports submitted by home health agencies to Medicare were
inconclusive but did not contradict the home health agency reports. In the years after the
demonstration began, net revenues were unchanged or falling at all participating agencies that
had credible data. The financial impact of the demonstration on participating MADC centers
was reported by MADC staff to be small, primarily because the demonstration had minimal
effects on their daily census.
D. Effects of the Demonstration on Use of Home Health Services, Medicare Expenditures,
and Quality
There was no evidence that the demonstration reduced Medicare expenditures or improved the
quality of home health care. On the contrary, for the limited number of expenditure and quality
measures for which there were significant differences for participants and comparison groups,
the demonstration tended to increase overall Medicare expenditures (in TX) and expenditures on
home health services (in TX and PA). The cost increases in TX appear to be associated in part
with high numbers of home health episodes per participant relative to comparison beneficiaries.
Quality measures showed no differences between participants and comparisons in TX and PA,
but quality outcomes in FL were poorer for participants for ADLs, IADLs, bladder incontinence,
and frequency of pain. Due to the small number of participants and comparison beneficiaries in
the analyses, these findings should be interpreted with caution.
E. Conclusions and Recommendations
The Demonstration sites case study shows that it is possible to provide Medicare home health
services in MADC centers and that a significant minority of new home health patients may be
interested in this model. When they were offered MADC at the start of their Medicare home

71
INFORMATION NOT RELEASABLE TO THE PUBLIC UNLESS AUTHORIZED BY LAW:
This information has not been publicly disclosed and may be privileged and confidential. It is for internal government use only and must not be disseminated, distributed, or copied to persons not authorized to receive the information. Unauthorized disclosure may result in prosecution to the full extent of the law.
health episodes at no cost to themselves, beneficiaries agreed to participate between 13% and
24% of the time at four of the five sites. At the TX site, where MADC was widely used and
available in the community through Medicaid funding, beneficiaries agreed to participate in 42%
of new episodes. Those who chose the demonstration reported high rates of satisfaction with
both attending MADC and receiving their home health in the MADC.
However, there was no evidence that the demonstration reduced Medicare expenditures or
improved quality of care. In fact, in relation to matched comparison groups, overall Medicare
expenditures were increased at the TX demonstration site, and home health quality was lower on
several measures at the FL demonstration site. No differences between comparison groups and
participants were found on these measures at the other sites. There was also no evidence that the
demonstration improved home health agency finances. Instead, finances may have been
negatively affected through increased costs and decreased revenues.
These findings from the quantitative analysis of demonstration impacts on expenditures and
quality need to be interpreted with caution, primarily due to the small study groups at the PA and
FL sites and to the fact that only three sites are included in the quantitative analysis. Having
small study groups decreases that chance of identifying significant findings, and having few
agencies increases the chance that characteristics of agencies interacted with the demonstration
model to affect results in idiosyncratic ways. These findings from the quantitative analysis
should also be weighed against the positive findings concerning satisfaction reported by
participants in the survey and in face-to-face interviews. They pointed to the benefits of the
socialization and activities at the MADC centers and the respite the service gave to family
caregivers. Staff members at both home health agencies and MADC centers echoed these
reports.
The decision about whether to continue to explore or expand the demonstration model for
delivering home health services is a matter for policy makers. If further testing is desired, it
would be useful to expand the testing to a larger sample, and to more accurately identify
comparable patient characteristics, which would support more reliable conclusions concerning
72
INFORMATION NOT RELEASABLE TO THE PUBLIC UNLESS AUTHORIZED BY LAW:
This information has not been publicly disclosed and may be privileged and confidential. It is for internal government use only and must not be disseminated, distributed, or copied to persons not authorized to receive the information. Unauthorized disclosure may result in prosecution to the full extent of the law.
expenditure and quality outcomes. Additionally, if there is additional testing, it is recommended
that four components of the design and implementation of the MADC benefit be modified:
• Beneficiary choice;
• Home health service delivery;
• MADC collaboration;
• Payment to the MADC.
First, home health agencies would need a consistent approach to offer beneficiaries the choice to
be served in a MADC center. This would involve ensuring that agencies ask new patients if they
are in adult day care and if they would prefer to receive some or all of their home health services
there. Agencies would also have to determine if this would be feasible and appropriate given
each patient's clinical, financial, and in-home support situation.
Second, home health agencies would need to ensure that their services are appropriately
delivered in MADC centers. The conservative approach to ensuring quality would be to require
Medicare services to be provided by staff of certified home health agencies. This was the
approach that most demonstration sites used.
Third, collaboration between home health agencies and day-care centers would be required. The
demonstration experience shows that having home health providers serve their patients in
MADC centers does not require substantial participation by MADC providers in clinical care. It
does, however, require some logistical coordination of days of attendance, transportation,
making participants available for treatments, providing space for treatments, and notifying home
health providers promptly about absences.
Finally, including the demonstration's requirement that the home health agency pay for the day in
the MADC appears to undermine financial feasibility and limit the appeal of the model for home
health agencies. Conversely, removing this requirement would mean that only patients who can
obtain Medicaid payment for MADC or who can pay out of pocket could participate.
73
INFORMATION NOT RELEASABLE TO THE PUBLIC UNLESS AUTHORIZED BY LAW:
This information has not been publicly disclosed and may be privileged and confidential. It is for internal government use only and must not be disseminated, distributed, or copied to persons not authorized to receive the information. Unauthorized disclosure may result in prosecution to the full extent of the law.
Appendix A
Text of Section 703 of the Medicare Prescription Drug, Improvement, and Modernization Act of 2003
SEC. 703. DEMONSTRATION PROJECT FOR MEDICAL ADULT DAY-CARE SERVICES.
(a) ESTABLISHMENT- Subject to the succeeding provisions of this section, the Secretary shall establish a demonstration project (in this section referred to as the `demonstration project') under which the Secretary shall, as part of a plan of an episode of care for home health services established for a medicare beneficiary, permit a home health agency, directly or under arrangements with a medical adult day-care facility, to provide medical adult day-care services as a substitute for a portion of home health services that would otherwise be provided in the beneficiary's home.
(b) PAYMENT- (1) IN GENERAL- Subject to paragraph (2), the amount of payment for an episode of care
for home health services, a portion of which consists of substitute medical adult day-care services, under the demonstration project shall be made at a rate equal to 95 percent of the amount that would otherwise apply for such home health services under section 1895 of the Social Security Act (42 U.S.C. 1395fff). In no case may a home health agency, or a medical adult day-care facility under arrangements with a home health agency, separately charge a beneficiary for medical adult day-care services furnished under the plan of care.
(2) ADJUSTMENT IN CASE OF OVERUTILIZATION OF SUBSTITUTE ADULT DAY-CARE SERVICES TO ENSURE BUDGET NEUTRALITY- The Secretary shall monitor the expenditures under the demonstration project and under title XVIII of the Social Security Act for home health services. If the Secretary estimates that the total expenditures under the demonstration project and under such title XVIII for home health services for a period determined by the Secretary exceed expenditures that would have been made under such title XVIII for home health services for such period if the demonstration project had not been conducted, the Secretary shall adjust the rate of payment to medical adult day-care facilities under paragraph (1) in order to eliminate such excess.
(c) DEMONSTRATION PROJECT SITES- The demonstration project established under this section shall be conducted in not more than 5 sites in States selected by the Secretary that license or certify providers of services that furnish medical adult day-care services.
(d) DURATION- The Secretary shall conduct the demonstration project for a period of 3 years.
(e) VOLUNTARY PARTICIPATION- Participation of medicare beneficiaries in the demonstration project shall be voluntary. The total number of such beneficiaries that may participate in the project at any given time may not exceed 15,000.
(f) PREFERENCE IN SELECTING AGENCIES- In selecting home health agencies to participate under the demonstration project, the Secretary shall give preference to those agencies that are currently licensed or certified through common ownership and control
74
INFORMATION NOT RELEASABLE TO THE PUBLIC UNLESS AUTHORIZED BY LAW:
This information has not been publicly disclosed and may be privileged and confidential. It is for internal government use only and must not be disseminated, distributed, or copied to persons not authorized to receive the information. Unauthorized disclosure may result in prosecution to the full extent of the law.
to furnish medical adult day-care services. (g) WAIVER AUTHORITY- The Secretary may waive such requirements of title XVIII of the
Social Security Act as may be necessary for the purposes of carrying out the demonstration project, other than waiving the requirement that an individual be homebound in order to be eligible for benefits for home health services.
(h) EVALUATION AND REPORT- The Secretary shall conduct an evaluation of the clinical and cost-effectiveness of the demonstration project. Not later than 6 months after the completion of the project, the Secretary shall submit to Congress a report on the evaluation, and shall include in the report the following:
(1) An analysis of the patient outcomes and costs of furnishing care to the medicare beneficiaries participating in the project as compared to such outcomes and costs to beneficiaries receiving only home health services for the same health conditions.
(2) Such recommendations regarding the extension, expansion, or termination of the project as the Secretary determines appropriate.
(i) DEFINITIONS- In this section: (1) HOME HEALTH AGENCY- The term `home health agency' has the meaning given such
term in section 1861(o) of the Social Security Act (42 U.S.C. 1395x(o)). (2) MEDICAL ADULT DAY-CARE FACILITY- The term `medical adult day-care facility'
means a facility that-- (A) has been licensed or certified by a State to furnish medical adult day-care services in the
State for a continuous 2-year period; (B) is engaged in providing skilled nursing services and other therapeutic services directly or
under arrangement with a home health agency; (C) is licensed and certified by the State in which it operates or meets such standards
established by the Secretary to assure quality of care and such other requirements as the Secretary finds necessary in the interest of the health and safety of individuals who are furnished services in the facility; and
(D) provides medical adult day-care services. (3) MEDICAL ADULT DAY-CARE SERVICES- The term `medical adult day-care
services' means-- (A) home health service items and services described in paragraphs (1) through (7) of section
1861(m) furnished in a medical adult day-care facility; (B) a program of supervised activities furnished in a group setting in the facility that-- (i) meet such criteria as the Secretary determines appropriate; and (ii) is designed to promote physical and mental health of the individuals; and (C) such other services as the Secretary may specify. (4) MEDICARE BENEFICIARY- The term `medicare beneficiary' means an individual entitled
to benefits under part A of this title, enrolled under part B of this title, or both.

75
INFORMATION NOT RELEASABLE TO THE PUBLIC UNLESS AUTHORIZED BY LAW:
This information has not been publicly disclosed and may be privileged and confidential. It is for internal government use only and must not be disseminated, distributed, or copied to persons not authorized to receive the information. Unauthorized disclosure may result in prosecution to the full extent of the law.
Appendix B: Glossary
ADL – activities of daily living, such as bathing, dressing, using the toilet, and eating.
CMS – Centers for Medicare & Medicaid Services.
DCG (Diagnostic Cost Groupings) – a model used by CMS to adjust payments to providers based on the costs associated with diagnoses of the provider's patients. See www.cms.hhs.gov/Reports/downloads/pope_2000_2.pdf for more information. Decliners – Medicare beneficiaries who were patients at the home health agencies in the demonstration and who declined the offer to participate in the demonstration. HCC (Hierarchical Condition Categories) – a set of 184 diagnosis categories used for Medicare risk adjustment. See www.cms.hhs.gov/Reports/downloads/pope_2000_2.pdf for more information. IADL – Instrumental activities of daily living, such as cleaning, cooking, shopping, and taking medications. MADC – Medical Adult Day Care. OT - Occupational therapy Participants – Medicare beneficiaries who were patients at the home health agencies in the demonstration and who accepted the offer to participate in the demonstration. PT - Physical therapy Patients – Medicare beneficiaries who received services from the home health agencies participating in the demonstration. Patients include those who were not offered participation, as well as those who were offered and accepted (participants) and who were offered and chose not to participate (decliners). ST - Speech therapy

76
INFORMATION NOT RELEASABLE TO THE PUBLIC UNLESS AUTHORIZED BY LAW:
This information has not been publicly disclosed and may be privileged and confidential. It is for internal government use only and must not be disseminated, distributed, or copied to persons not authorized to receive the information. Unauthorized disclosure may result in prosecution to the full extent of the law.
Appendix C: Descriptive Statistics for Expenditure and Quality Regression Analyses
(NOTE: These statistics are for the full groups of participants and fee-for-service comparison beneficiaries. If data on some variables were missing, regression analyses were based on subsamples of these groups.)
Florida Texas Pennsylvania Outcome Measures Definition mean sd N mean sd N mean sd N Total expenditures, pre-Demonstration
Sum of beneficiary's total Medicare expenditures for the 365 days prior to enrollment or pseudo-enrollment date
$18,134 $20,825 158 $13,143 $16,164 540 $26,955 $30,845 122
Total expenditures, post-Demonstration
Sum of beneficiary's total Medicare expenditures for the 365 days after enrollment or pseudo-enrollment date
$20,633 $22,324 158 $21,088 $22,204 540 $22,928 $24,712 122
Total expenditures, pre- and post
Combine pre- and post-enrollment total expenditures
$38,767 $31,411 158 $34,231 $30,747 540 $49,883 $45,001 122
Home health expenditures, pre-Demonstration
Sum of beneficiary's Home Health Medicare expenditures for the 365 days prior to enrollment or pseudo-enrollment date
$2,235 $5,262 158 $4,957 $6,621 540 $1,947 $3,043 122
Home health expenditures, post-Demonstration
Sum of beneficiary's Home Health Medicare expenditures for the 365 days after enrollment or pseudo-enrollment date
$5,298 $8,750 158 $10,407 $8,135 540 $4,680 $3,526 122
Home health expenditures, pre- and post
Combine pre- and post-enrollment Home Health expenditures
$7,533 $13,216 158 $15,364 $12,265 540 $6,628 $5,111 122
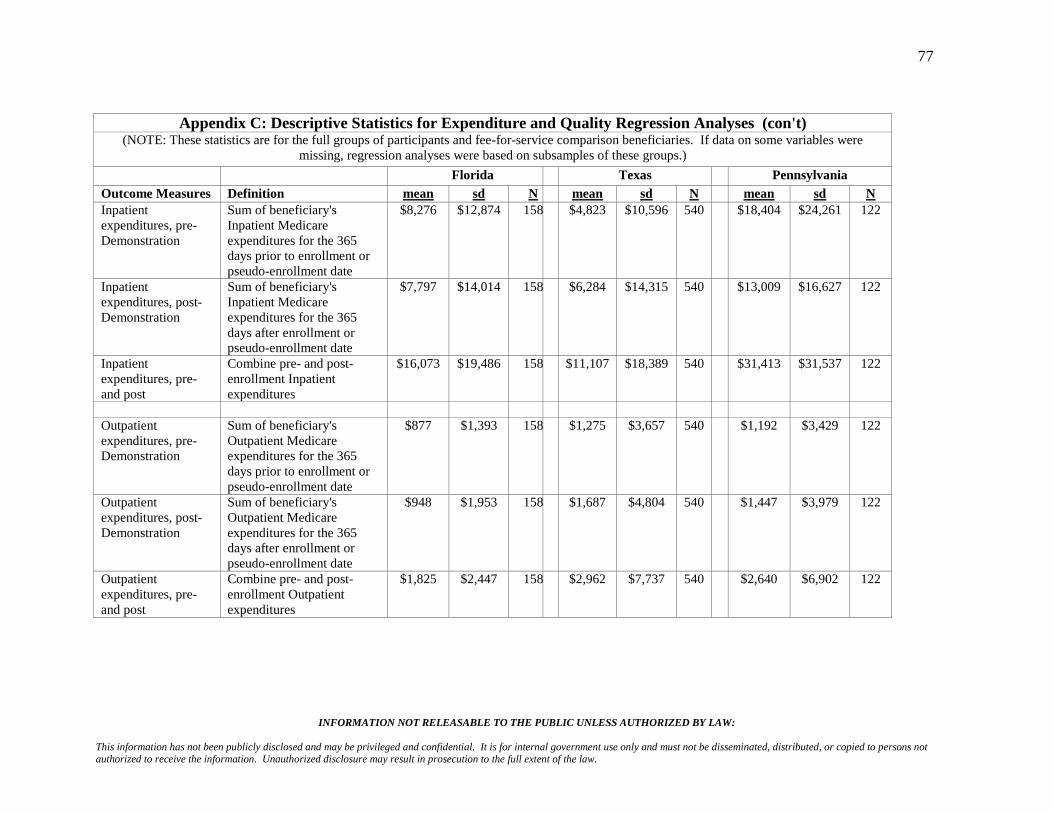
77
INFORMATION NOT RELEASABLE TO THE PUBLIC UNLESS AUTHORIZED BY LAW:
This information has not been publicly disclosed and may be privileged and confidential. It is for internal government use only and must not be disseminated, distributed, or copied to persons not authorized to receive the information. Unauthorized disclosure may result in prosecution to the full extent of the law.
Appendix C: Descriptive Statistics for Expenditure and Quality Regression Analyses (con't)
(NOTE: These statistics are for the full groups of participants and fee-for-service comparison beneficiaries. If data on some variables were missing, regression analyses were based on subsamples of these groups.)
Florida Texas Pennsylvania Outcome Measures Definition mean sd N mean sd N mean sd N Inpatient expenditures, pre-Demonstration
Sum of beneficiary's Inpatient Medicare expenditures for the 365 days prior to enrollment or pseudo-enrollment date
$8,276 $12,874 158 $4,823 $10,596 540 $18,404 $24,261 122
Inpatient expenditures, post-Demonstration
Sum of beneficiary's Inpatient Medicare expenditures for the 365 days after enrollment or pseudo-enrollment date
$7,797 $14,014 158 $6,284 $14,315 540 $13,009 $16,627 122
Inpatient expenditures, pre- and post
Combine pre- and post-enrollment Inpatient expenditures
$16,073 $19,486 158 $11,107 $18,389 540 $31,413 $31,537 122
Outpatient expenditures, pre-Demonstration
Sum of beneficiary's Outpatient Medicare expenditures for the 365 days prior to enrollment or pseudo-enrollment date
$877 $1,393 158 $1,275 $3,657 540 $1,192 $3,429 122
Outpatient expenditures, post-Demonstration
Sum of beneficiary's Outpatient Medicare expenditures for the 365 days after enrollment or pseudo-enrollment date
$948 $1,953 158 $1,687 $4,804 540 $1,447 $3,979 122
Outpatient expenditures, pre- and post
Combine pre- and post-enrollment Outpatient expenditures
$1,825 $2,447 158 $2,962 $7,737 540 $2,640 $6,902 122
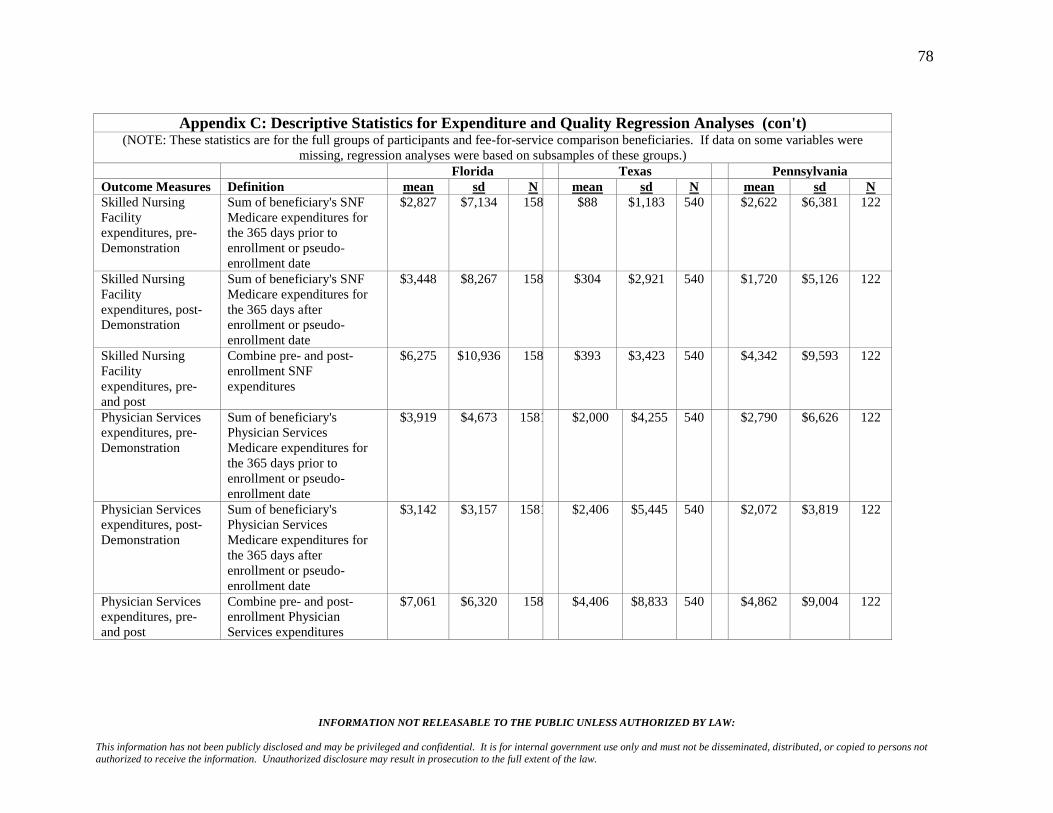
78
INFORMATION NOT RELEASABLE TO THE PUBLIC UNLESS AUTHORIZED BY LAW:
This information has not been publicly disclosed and may be privileged and confidential. It is for internal government use only and must not be disseminated, distributed, or copied to persons not authorized to receive the information. Unauthorized disclosure may result in prosecution to the full extent of the law.
Appendix C: Descriptive Statistics for Expenditure and Quality Regression Analyses (con't)
(NOTE: These statistics are for the full groups of participants and fee-for-service comparison beneficiaries. If data on some variables were missing, regression analyses were based on subsamples of these groups.)
Florida Texas Pennsylvania Outcome Measures Definition mean sd N mean sd N mean sd N Skilled Nursing Facility expenditures, pre-Demonstration
Sum of beneficiary's SNF Medicare expenditures for the 365 days prior to enrollment or pseudo-enrollment date
$2,827 $7,134 158 $88 $1,183 540 $2,622 $6,381 122
Skilled Nursing Facility expenditures, post-Demonstration
Sum of beneficiary's SNF Medicare expenditures for the 365 days after enrollment or pseudo-enrollment date
$3,448 $8,267 158 $304 $2,921 540 $1,720 $5,126 122
Skilled Nursing Facility expenditures, pre- and post
Combine pre- and post-enrollment SNF expenditures
$6,275 $10,936 158 $393 $3,423 540 $4,342 $9,593 122
Physician Services expenditures, pre-Demonstration
Sum of beneficiary's Physician Services Medicare expenditures for the 365 days prior to enrollment or pseudo-enrollment date
$3,919 $4,673 1581 $2,000 $4,255 540 $2,790 $6,626 122
Physician Services expenditures, post-Demonstration
Sum of beneficiary's Physician Services Medicare expenditures for the 365 days after enrollment or pseudo-enrollment date
$3,142 $3,157 1581 $2,406 $5,445 540 $2,072 $3,819 122
Physician Services expenditures, pre- and post
Combine pre- and post-enrollment Physician Services expenditures
$7,061 $6,320 158 $4,406 $8,833 540 $4,862 $9,004 122

79
INFORMATION NOT RELEASABLE TO THE PUBLIC UNLESS AUTHORIZED BY LAW:
This information has not been publicly disclosed and may be privileged and confidential. It is for internal government use only and must not be disseminated, distributed, or copied to persons not authorized to receive the information. Unauthorized disclosure may result in prosecution to the full extent of the law.
Appendix C: Descriptive Statistics for Expenditure and Quality Regression Analyses (con't)
(NOTE: These statistics are for the full groups of participants and fee-for-service comparison beneficiaries. If data on some variables were missing, regression analyses were based on subsamples of these groups.)
Florida Texas Pennsylvania Outcome Measures Definition mean sd N mean sd N mean sd N ADL - baseline Scale computed from initial
and followup assessments - based on seven OASIS measures for Activities of Daily Living: (M0640) Current Grooming (M0650) Current Ability to Dress Upper B (M0660) Current Ability to Dress Lower B (M0670) Current Bathing (M0680) Current Toileting (M0690) Current Transferring (M0710) Current Feeding/Eating
1.18 0.71 (Chronbach's Alpha:
.92)
95 1.22 0.47 (Chronbach's Alpha:
.91)
338 1.42 0.92 (Chronb
ach's Alpha:
.94)
64
ADL - followup 1.20 0.81 83 1.22 0.55 334 1.09 0.99 61 IADL - baseline Scale computed from initial
and followup assessments - based on six OASIS measures for Instrumental Activities of Daily Living: (M0720) Current Preparing Light Meal; (M0740) Current Laundry; (M0750) Current Housekeeping; (M0760) Current Shopping; (M0770) Current Ability to Use Telephone; (M0780) Current Management of Oral Medications
2.03 0.79 (Chronbach's Alpha:
.90)
91 1.33 0.55 (Chronbach's Alpha:
.87)
266 1.86 0.79 (Chronb
ach's Alpha:
.90)
60

80
INFORMATION NOT RELEASABLE TO THE PUBLIC UNLESS AUTHORIZED BY LAW:
This information has not been publicly disclosed and may be privileged and confidential. It is for internal government use only and must not be disseminated, distributed, or copied to persons not authorized to receive the information. Unauthorized disclosure may result in prosecution to the full extent of the law.
Appendix C: Descriptive Statistics for Expenditure and Quality Regression Analyses (con't)
(NOTE: These statistics are for the full groups of participants and fee-for-service comparison beneficiaries. If data on some variables were missing, regression analyses were based on subsamples of these groups.)
Florida Texas Pennsylvania Outcome Measures Definition mean sd N mean sd N mean sd N IADL - followup 1.90 0.96 76 1.20 0.69 144 1.72 0.87 57 Ambulation - baseline
(M0700) Current Ambulation/Locomotion from OASIS
1.29 0.67 95 1.11 0.53 338 1.63 1.12 64
Ambulation - followup
1.29 0.97 83 1.05 0.57 334 1.46 1.26 61
Urinary incontinence - baseline
(M0520) Urinary Incontinence from OASIS
0.57 0.56 91 0.90 0.37 268 0.48 0.57 60
Urinary incontinence - followup
0.48 0.53 78 0.79 0.42 196 0.46 0.50 57
Bowel incontinence - baseline
(M0540) Bowel Incontinence from OASIS
0.30 0.81 94 0.24 0.66 336 0.42 1.03 62
Bowel incontinence - followup
0.33 0.89 81 0.28 0.76 333 0.30 0.81 60
Short of breath - baseline
(M0490) Patient Dyspneic/Short of Breath
0.85 1.01 95 2.03 0.52 338 0.91 0.83 64

81
INFORMATION NOT RELEASABLE TO THE PUBLIC UNLESS AUTHORIZED BY LAW:
This information has not been publicly disclosed and may be privileged and confidential. It is for internal government use only and must not be disseminated, distributed, or copied to persons not authorized to receive the information. Unauthorized disclosure may result in prosecution to the full extent of the law.
Appendix C: Descriptive Statistics for Expenditure and Quality Regression Analyses (con't)
(NOTE: These statistics are for the full groups of participants and fee-for-service comparison beneficiaries. If data on some variables were missing, regression analyses were based on subsamples of these groups.)
Florida Texas Pennsylvania
Outcome Measures Definition mean sd N mean sd N mean sd N Short of breath - followup
0.76 0.98 83 1.96 0.63 334 0.80 0.81 61
Urinary tract infection - baseline
(M0510) Urinary Tract Infection
0.07 0.25 91 0.05 0.22 261 0.12 0.32 60
Urinary tract infection - folllowup 0.04 0.20 75 0.01 0.12 142 0.04 0.19 57
Frequency of pain - baseline
(M0420) Frequency of Pain 0.55 0.83 95 1.96 0.63 338 0.97 1.08 64
Frequency of pain - followup
0.70 0.95 83 1.72 0.79 334 0.70 0.95 61
Cognitive/Behavior - baseline
Scale computed from initial and followup assessments - based on five OASIS measures for Cognitive and Behavioral Function: (M0410) Speech; (M0570) When Confused; (M0560) Cognitive Functioning; M0580) When Anxious; (M0620) Frequency of Behavior Problems
1.40 0.98 (Chronbach's Alpha:
.80)
91 1.25 0.69 (Chronbach's Alpha:
.79)
266 0.81 0.71 (Chronbach's Alpha:
.74)
60
Cognitive/Behavior - followup 1.38 1.02 76 0.98 0.72 144 0.82 0.81 57

82
INFORMATION NOT RELEASABLE TO THE PUBLIC UNLESS AUTHORIZED BY LAW:
This information has not been publicly disclosed and may be privileged and confidential. It is for internal government use only and must not be disseminated, distributed, or copied to persons not authorized to receive the information. Unauthorized disclosure may result in prosecution to the full extent of the law.
Appendix C: Descriptive Statistics for Expenditure and Quality Regression Analyses (con't)
(NOTE: These statistics are for the full groups of participants and fee-for-service comparison beneficiaries. If data on some variables were missing, regression analyses were based on subsamples of these groups.)
Florida Texas Pennsylvania Outcome Measures Definition mean sd N mean sd N mean sd N Independent Variables
Baseline participant status
=1 if observation is for a Demonstration participant; = 0 for members of comparison group
0.50 0.50 158 0.50 0.50 540 0.50 0.50 122
Time period =1 if observation is for post-enrollment period, whether for Demonstration or comparison beneficiary; otherwise =0
0.50 0.50 158 0.50 0.50 540 0.50 0.50 122
Demonstration effect
=1 if observation is for a Demonstration participant for the post-enrollment period; otherwise = 0
0.25 0.43 158 0.25 0.43 540 0.25 0.43 122
Age category 0 for 30-34, 1 for 35-39, 2 for 36-39 …. 12 for 90+
9.65 1.40 158 7.54 2.25 540 9.46 0.36 122
Gender =1 if beneficiary is female 0.52 0.50 158 0.57 0.50 540 0.85 1.62 122 DCG score Regression-based estimate
of beneficiary's Medicare expenditure next year (e.g., 2.0 implies expenditure is estimated to be twice the average community-based Medicare beneficiary)
1.52 1.25 158 1.18 1.11 540 2.34 1.86 122
Number of prior episodes
Count of all home health episode in year of enrollment before index enrollment
0.68 1.16 158 2.20 2.52 540 0.89 1.25 122

83
INFORMATION NOT RELEASABLE TO THE PUBLIC UNLESS AUTHORIZED BY LAW:
This information has not been publicly disclosed and may be privileged and confidential. It is for internal government use only and must not be disseminated, distributed, or copied to persons not authorized to receive the information. Unauthorized disclosure may result in prosecution to the full extent of the law.