Embed Size (px)
Citation preview

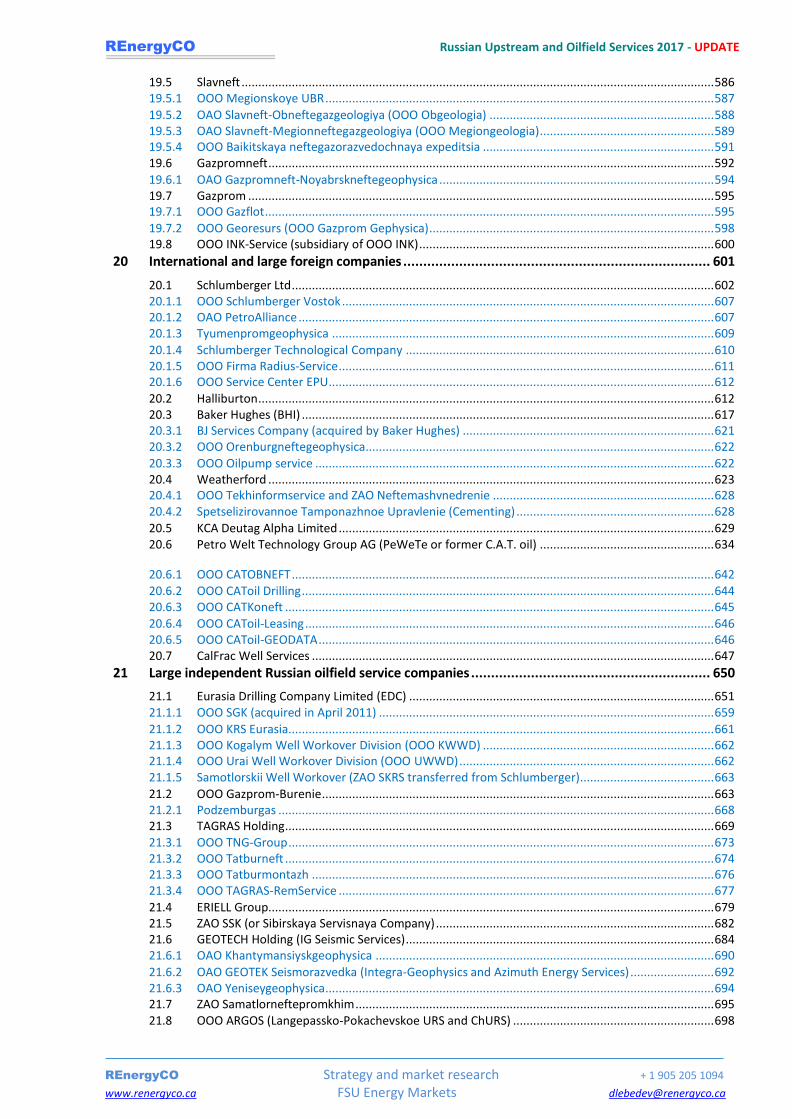
REnergyCO Russian Upstream and Oilfield Services 2017 - UPDATE
REnergyCO Strategy and market research + 1 905 205 1094 www.renergyco.ca FSU Energy Markets [email protected]
Report: Russian Upstream and Oilfield Services 2017
Over 730 pages and over 1000 figures and tables. Available in Russian and English (sold separately1). Data used in
the report is most recent (2016 full year and key data for 1st
Half of 2017). Report price: $12,000.00 (USD) excluding any applicable taxes (VAT or any other). Discounts available for existing clients. This report is unmatched by the depth of analysis and details of information presented. The author is the leading expert in the Russian oilfield services market with a proven track record of successful forecasting of the upstream activity. The forecasts used by the largest Russian Oilfield Services companies in presentations to investment community. The report provides invaluable insight and data intensity. All key data in the graphs is numerical. The author is available for detailed discussions and data clarifications. Profiles of key OFS service suppliers are included.
CONTENT
1 Abstract ................................................................................................................................. 30
2 Oil and gas industry’s development in 2001-2016 ..................................................................... 32
2.1 Industry structure and its role in Russian economy ............................................................................ 48 2.2 Industry regulation and OPEC agreement for 2017 ............................................................................ 55 2.3 Taxation .............................................................................................................................................. 66 2.3.1 Mineral Extraction Tax (MET) ............................................................................................................. 68 2.3.2 Export Duty ......................................................................................................................................... 69 2.4 Oil prices ............................................................................................................................................. 72 2.5 Crude and condensate production ..................................................................................................... 73 2.6 Gas production ................................................................................................................................... 75 2.7 Oil industry crude balance .................................................................................................................. 77 2.8 Balance of gas distribution ................................................................................................................. 78
3 Key upstream activities overview in 2002-2016 ........................................................................ 79
3.1 Drilling and wells completion in Russia .............................................................................................. 79 3.2 Well workover/well servicing operations ........................................................................................... 96
3.3 Effectiveness of well servicing/well workover operations ................................................................ 103 3.4 Hydraulic fracturing and effectiveness of fracturing jobs ................................................................. 105 3.5 Well bore stimulation (excluding hydro fracturing) and artificial lift optimization ........................... 106 3.6 Water injection ................................................................................................................................. 108 3.7 Seismic surveys ................................................................................................................................. 109
4 Russian oilfield services market in 2003-2016 and forecast for 2017-2022 ............................... 113
4.1 Market size estimates ....................................................................................................................... 113 4.2 Forecast methodology and cautionary notes ................................................................................... 122 4.3 Crude price shocks and their impact on dollar value of the market ................................................. 125 4.4 Drilling segment in 2003-2016 and forecast till 2020 ....................................................................... 132 4.5 Sidetracking market estimates in 2003-2016 and forecast till 2022 ................................................. 136
1 The second language copies are offered at a discount. Please contact REnergyCO for details.

REnergyCO Russian Upstream and Oilfield Services 2017 - UPDATE
REnergyCO Strategy and market research + 1 905 205 1094 www.renergyco.ca FSU Energy Markets [email protected]
4.6 Rig mobilization and assembly segment in 2003-2016 and forecast till 2022 .................................. 138 4.7 Drill bits and drill bits program segment in 2003-2016 and forecast till 2022 .................................. 141 4.8 Turbines and downhole motors in 2003-2016 and forecast till 2022 .............................................. 145 4.9 Drilling fluids in 2003-2016 and forecast till 2022 ............................................................................ 147 4.10 MWD/ LWD and directional drilling segment in 2003-2016 and forecast till 2022 .......................... 151 4.10.1 Telemetry /MWD/ LWD in 2003-2016 and forecast till 2022 ........................................................... 152 4.10.2 Rotary Steering Systems (RSS) in 2003-2016 and forecast till 2022 ................................................. 155 4.11 Pressure pumping services market in Russia in 2003-2016 and forecast till 2022 ........................... 157 4.11.1 Cementing in 2003-2016 and forecast till 2022 ................................................................................ 160 4.11.2 Hydro fracturing market in 2003-2016 and forecast till 2022 .......................................................... 163 4.11.3 Coiled tubing segment in 2003-2016 and forecast till 2020 ............................................................. 167 4.12 Wireline services market in 2003-2016 and forecast till 2022 .......................................................... 170 4.12.1 Open Hole Logging in 2003-2016 and forecast till 2022 ................................................................... 172 4.12.2 Cased hole logging segment in 2003-2016 and forecast till 2022 .................................................... 175 4.12.3 Perforation segment in 2003-2016 and forecast till 2022 ................................................................ 178 4.13 Well servicing/ workover market in Russia in 2003-2016 and forecast till 2022 .............................. 180 4.13.1 Workover in 2003-2016 and forecast till 2022 ................................................................................. 183 4.13.2 Well servicing in 2003-2016 and forecast till 2022 ........................................................................... 187 4.13.3 Completion services segment in Russia in 2003-2016 and forecast till 2022 ................................... 189 4.14 Seismic services market in 2003-2016 and forecast till 2022 ........................................................... 192 4.15 Artificial Lift Services segment in 2003-2015 and forecast till 2020 ................................................. 194 4.16 Oilfield market in key producing regions and forecast of regional market development ................. 196 4.17 Oil field services market growth impact on production costs .......................................................... 199 4.18 Market size estimates for key groups of equipment ........................................................................ 200
5 Forecast of physical volumes and OFS capacities in 2017-2022 ................................................ 201
5.1 Forecast of physical activity in Russia in 2017-2022 ......................................................................... 202
5.2 Forecast of capacities requirements ................................................................................................. 211
6 Oilfield services in key crude oil producing regions ................................................................. 214
6.1 Crude oil production by region ......................................................................................................... 214 6.2 Development drilling and production well completions ................................................................... 217 6.3 Workover operations by key regions ................................................................................................ 219
7 Khanty-Mansiysk Autonomous District (West Siberia) ............................................................... 223
7.1 KhMAD reserves and key OFS activities by an oil company.............................................................. 223 7.2 Oilfield market estimates for KhMAD ............................................................................................... 248
7.3 Oilfield market forecast for 2017-2022 for KhMAD .......................................................................... 257
8 Yamal-Nenets Autonomous District (West Siberia) ................................................................. 259
8.1 YaNAD reserves and key OFS activities by an oil company ............................................................... 259 8.2 Oilfield market estimates for YaNAD (excluding gas) ....................................................................... 280 8.3 Oilfield market forecast till 2022 for YaNAD ..................................................................................... 288
9 South Tyumen, Tomsk, Novosibirsk and Omsk oblasts (Western Siberia) ................................. 291
9.1 South of Tyumen and adjacent regions reserves and key OFS activities by an oil company ............. 291 9.2 Market estimates for South Tyumen, Tomsk and Other WS ............................................................ 307 9.3 Oilfield market forecast till 2022 for South Tyumen, Tomsk and Other WS ..................................... 315
10 Volga-Urals region ................................................................................................................ 317
10.1 Volga-Urals reserves and key OFS activities by an oil company ....................................................... 317 10.2 Oilfield market estimates for Volga-Urals ......................................................................................... 338 10.3 Oilfield market forecast till 2022 for Volga-Urals ............................................................................. 345
11 Timan-Pechora ..................................................................................................................... 348
11.1 Timan-Pechora reserves and key OFS activities by an oil company.................................................. 348 11.2 Oilfield market estimates for Timan-Pechora ................................................................................... 362 11.3 Oilfield market forecast till 2022 for Timan-Pechora ....................................................................... 370
12 Eastern Siberia ...................................................................................................................... 372
12.1 Eastern Siberia reserves and key OFS activities by an oil company .................................................. 372

REnergyCO Russian Upstream and Oilfield Services 2017 - UPDATE
REnergyCO Strategy and market research + 1 905 205 1094 www.renergyco.ca FSU Energy Markets [email protected]
12.2 Oilfield market estimates for East Siberia ......................................................................................... 381 12.3 Oilfield market forecast till 2022 for East Siberia ............................................................................. 389
13 Far East ................................................................................................................................ 391
13.1 Sakhalin reserves and key OFS activities by an oil company ............................................................ 391
13.2 Oilfield market estimates for Sakhalin .............................................................................................. 403 13.3 Oilfield market forecast till 2022 for Sakhalin .................................................................................. 408
14 North Caucasus ..................................................................................................................... 411
14.1 North Caucasus reserves and key OFS activities by company .......................................................... 411 14.2 Oilfield market estimates for North Caucasus .................................................................................. 421 14.3 Oilfield market forecast till 2020 for Caucasus ................................................................................. 426
15 Natural Gas and Caspian ....................................................................................................... 427
15.1 Oilfield market estimates for Natural Gas in YaNAD ....................................................................... 427 15.2 Oilfield market forecast till 2022 for Natural Gas in YaNAD ............................................................. 432 15.3 Oilfield market estimates for Caspian offshore development .......................................................... 433
16 Analysis of oilfield services customers (major companies) ...................................................... 435
16.1 Rosneft .............................................................................................................................................. 446 16.1.1 Rosneft (assets excluding TNK-BP and Bashneft) ............................................................................. 457 16.1.2 TNK-BP .............................................................................................................................................. 464 16.1.3 Bashneft ............................................................................................................................................ 472 16.2 LUKOIL .............................................................................................................................................. 481 16.3 Surgutneftegas ................................................................................................................................. 490 16.4 Gazpromneft ..................................................................................................................................... 497 16.5 Tatneft .............................................................................................................................................. 507 16.6 Slavneft ............................................................................................................................................. 512 16.7 RussNeft and Neftisa ........................................................................................................................ 518 16.8 OAO Gazprom ................................................................................................................................... 523
16.9 NOVATEK .......................................................................................................................................... 529
17 Review of Key Oilfield Capacities in Russia ............................................................................. 533
17.1 Estimates of the number of drill rigs fleet and number of active rigs............................................... 533 17.2 Workover rigs fleet estimates and workover crew-hour costs ......................................................... 536 17.3 Geophysical crews and key companies owning assets ..................................................................... 540
18 OFS competitive environment and shares of key players ........................................................... 541
19 Oil companies’ service divisions ................................................................................................. 547
19.1 OAO Surgutneftegas ......................................................................................................................... 548 19.2 Rosneft .............................................................................................................................................. 552 19.2.1 Rosneft’s TNK-BP assets ................................................................................................................... 556 19.2.2 OOO RN-Burenie ............................................................................................................................... 557 19.2.3 OOO Orenburg Drilling Company (merged into RN-Burenie) ........................................................... 560 19.2.4 ZAO Udmurtneft-Burenie ................................................................................................................. 562 19.2.5 OOO RN Service ................................................................................................................................ 563 19.2.6 Mamontovsky KRS ............................................................................................................................ 564 19.2.7 ZAO KRS ............................................................................................................................................ 566 19.2.8 OOO URS Samara .............................................................................................................................. 566 19.2.9 OAO PNO .......................................................................................................................................... 567 19.2.10 ZAO Nizhnevartovskburneft (acquired from WFT) ........................................................................... 568
19.2.11 ZAO Orenburgburneft (acquired from WFT and merged in RN-Burenie) ......................................... 569 19.2.12 OOO Chernogorservice (workover) (acquired from WFT) ................................................................ 570 19.2.13 OOO NPRS-1 (sidetracking) (acquired from WFT) ............................................................................ 571 19.2.14 OOO UKRS (acquired from WFT) ...................................................................................................... 572
19.2.15 Byelorussian UPNP and KRS (acquired from WFT) ........................................................................... 573 19.2.16 Trican Well Service Ltd (Russian assets acquired in August 2015) ................................................... 573 19.2.17 TARGIN (Bashneft Nefteservisnye Aktivy) ........................................................................................ 578
19.3 LUKOIL .............................................................................................................................................. 584 19.4 OOO RussNeft-Burenie (liquidated) .................................................................................................. 585
REnergyCO Russian Upstream and Oilfield Services 2017 - UPDATE
REnergyCO Strategy and market research + 1 905 205 1094 www.renergyco.ca FSU Energy Markets [email protected]
19.5 Slavneft ............................................................................................................................................. 586 19.5.1 OOO Megionskoye UBR .................................................................................................................... 587
19.5.2 OAO Slavneft-Obneftegazgeologiya (OOO Obgeologia) ................................................................... 588 19.5.3 OAO Slavneft-Megionneftegazgeologiya (OOO Megiongeologia) .................................................... 589 19.5.4 OOO Baikitskaya neftegazorazvedochnaya expeditsia ..................................................................... 591 19.6 Gazpromneft ..................................................................................................................................... 592
19.6.1 OAO Gazpromneft-Noyabrskneftegeophysica .................................................................................. 594 19.7 Gazprom ........................................................................................................................................... 595 19.7.1 OOO Gazflot ...................................................................................................................................... 595
19.7.2 OOO Georesurs (OOO Gazprom Gephysica) ..................................................................................... 598 19.8 OOO INK-Service (subsidiary of OOO INK) ........................................................................................ 600
20 International and large foreign companies ............................................................................. 601
20.1 Schlumberger Ltd .............................................................................................................................. 602 20.1.1 OOO Schlumberger Vostok ............................................................................................................... 607 20.1.2 OAO PetroAlliance ............................................................................................................................ 607 20.1.3 Tyumenpromgeophysica .................................................................................................................. 609
20.1.4 Schlumberger Technological Company ............................................................................................ 610 20.1.5 OOO Firma Radius-Service ................................................................................................................ 611 20.1.6 OOO Service Center EPU ................................................................................................................... 612
20.2 Halliburton ........................................................................................................................................ 612 20.3 Baker Hughes (BHI) ........................................................................................................................... 617 20.3.1 BJ Services Company (acquired by Baker Hughes) ........................................................................... 621 20.3.2 OOO Orenburgneftegeophysica........................................................................................................ 622
20.3.3 OOO Oilpump service ....................................................................................................................... 622 20.4 Weatherford ..................................................................................................................................... 623 20.4.1 OOO Tekhinformservice and ZAO Neftemashvnedrenie .................................................................. 628 20.4.2 Spetselizirovannoe Tamponazhnoe Upravlenie (Cementing) ........................................................... 628
20.5 KCA Deutag Alpha Limited ................................................................................................................ 629 20.6 Petro Welt Technology Group AG (PeWeTe or former C.A.T. oil) .................................................... 634
20.6.1 OOO CATOBNEFT .............................................................................................................................. 642 20.6.2 OOO CAToil Drilling ........................................................................................................................... 644 20.6.3 OOO CATKoneft ................................................................................................................................ 645
20.6.4 OOO CAToil-Leasing .......................................................................................................................... 646 20.6.5 OOO CAToil-GEODATA ...................................................................................................................... 646 20.7 CalFrac Well Services ........................................................................................................................ 647
21 Large independent Russian oilfield service companies ............................................................ 650
21.1 Eurasia Drilling Company Limited (EDC) ........................................................................................... 651 21.1.1 OOO SGK (acquired in April 2011) .................................................................................................... 659
21.1.2 OOO KRS Eurasia............................................................................................................................... 661 21.1.3 OOO Kogalym Well Workover Division (OOO KWWD) ..................................................................... 662 21.1.4 OOO Urai Well Workover Division (OOO UWWD) ............................................................................ 662 21.1.5 Samotlorskii Well Workover (ZAO SKRS transferred from Schlumberger)........................................ 663
21.2 OOO Gazprom-Burenie ..................................................................................................................... 663 21.2.1 Podzemburgas .................................................................................................................................. 668 21.3 TAGRAS Holding ................................................................................................................................ 669 21.3.1 OOO TNG-Group ............................................................................................................................... 673 21.3.2 OOO Tatburneft ................................................................................................................................ 674 21.3.3 OOO Tatburmontazh ........................................................................................................................ 676 21.3.4 OOO TAGRAS-RemService ................................................................................................................ 677
21.4 ERIELL Group..................................................................................................................................... 679 21.5 ZAO SSK (or Sibirskaya Servisnaya Company) ................................................................................... 682 21.6 GEOTECH Holding (IG Seismic Services) ............................................................................................ 684 21.6.1 OAO Khantymansiyskgeophysica ..................................................................................................... 690
21.6.2 OAO GEOTEK Seismorazvedka (Integra-Geophysics and Azimuth Energy Services) ......................... 692 21.6.3 OAO Yeniseygeophysica .................................................................................................................... 694 21.7 ZAO Samatlorneftepromkhim ........................................................................................................... 695 21.8 OOO ARGOS (Langepassko-Pokachevskoe URS and ChURS) ............................................................ 698

REnergyCO Russian Upstream and Oilfield Services 2017 - UPDATE
REnergyCO Strategy and market research + 1 905 205 1094 www.renergyco.ca FSU Energy Markets [email protected]
21.9 Integra Group of Companies ............................................................................................................ 699 21.10 Rimera (Chelyabinsky Pipe Factory).................................................................................................. 708 21.10.1 ZAO Taimyrnefterazvedka (liquidated) ............................................................................................. 709 21.10.2 OOO Yuganskneftegeophysica and OOO Tomskneftegasgeophysica ............................................... 709 21.11 ZAO SP MeKaMineft ......................................................................................................................... 710
22 Other drilling and workover companies ................................................................................. 711
22.1 INVESTGEOSERVICE and Nova Energy Services LLC .......................................................................... 711 22.2 OOO Neftserviceholding ................................................................................................................... 714 22.2.1 OOO NSH Asia Drilling ....................................................................................................................... 715 22.2.2 OOO Permnefteotdacha ................................................................................................................... 716
22.3 ZAO UPNP and KRS Samara .............................................................................................................. 717 22.4 NaftaGaz (former RU-Energy Group) ................................................................................................ 721 22.4.1 OOO NG-Burenie (OOO Service Drilling Company) .......................................................................... 722
22.4.2 OOO Noyabrskoe UPNP (former OOO KRS-Service) ......................................................................... 724 22.4.3 ООО RU-Energy KRS-MG (OOO MEGION-SERVICE) (liquidated) ....................................................... 725 22.4.4 OOO YamalServiceCenter (liquidated) .............................................................................................. 726 22.4.5 OOO Servisnaya Transportnaya Compania (liquidated) .................................................................... 727 22.5 OOO NK Krasnoleninskneftegas ....................................................................................................... 727 22.6 Usinskgeoneft ................................................................................................................................... 728 22.7 OOO VNBK (Varyogan Oil Drilling Company) .................................................................................... 730 22.8 ZAO Ermakovskii PRS ........................................................................................................................ 731 22.9 KOMIQUEST INTERNATIONAL.......................................................................................................... 731 22.10 OOO Rusintegral ............................................................................................................................... 732 22.10.1 OOO Rusintegral Pioneer .................................................................................................................. 732
22.10.2 OOO Rusintegral Variegan Remont (former Variegan-Remont) ....................................................... 733 22.11 OOO Tomskburneftegaz ................................................................................................................... 733 22.12 OJSC VTB Leasing .............................................................................................................................. 734
23 Large and medium wireline and seismic companies (Geophysical)........................................... 736
23.1 ROSGEOLOGIA .................................................................................................................................. 736
23.1.1 OAO Dalmorneftegeophysica (sea) ................................................................................................... 737 23.1.2 OAO Samaraneftegeophysica ........................................................................................................... 738 23.1.3 FGUP Sevmorgeo (sea) ..................................................................................................................... 740
23.1.4 OAO Sevmorneftegeophysica (sea) .................................................................................................. 741 23.1.5 OAO CGE (Central Geophysical Expedition) - liquidated................................................................... 743 23.1.6 OAO Sibneftegeophysica (in bankruptcy) ......................................................................................... 743 23.1.7 OAO Permneftegeophysica ............................................................................................................... 745 23.1.8 OAO Volgogradneftegeophysica ....................................................................................................... 747 23.1.9 OAO Stavropolneftegeophysica ........................................................................................................ 749 23.1.10 OAO Saratovneftegeophysica ........................................................................................................... 750 23.2 OAO Bashneftegeophysica ................................................................................................................ 751 23.3 OAO Kogalymneftegeophysica .......................................................................................................... 754 23.4 OAO Nizhnevartovskneftegeophysica .............................................................................................. 754
23.5 OAO MAGE (sea) ............................................................................................................................... 755 23.6 ZAO Polyarnaya Geophysical Expedition (liquidated) ....................................................................... 756 23.7 ZAO Krasnoyarskgeophysica ............................................................................................................. 756
24 Production of key equipment in Russia .................................................................................. 758
25 Drilling and workover rigs manufacturers ............................................................................... 763
25.1 Import of drilling rigs ........................................................................................................................ 765 25.2 OOO Uralmash NGO Holding (former ZAO URBO or Uralmash-BO) ................................................. 766
25.2.1 MK Uralmash (Oil and Gas division) .................................................................................................. 768 25.3 OOO Volgograd Drilling Equipment Plant (acquired by RU-Energy and was in bankruptcy) ............. 770 25.4 Honghua (China) ............................................................................................................................... 771 25.5 ОАО Mobile Drilling Systems (Kungur) (in bankruptcy) ................................................................... 772
26 Major manufacturers of ESP .................................................................................................. 774
26.1 MC Borets ......................................................................................................................................... 775
REnergyCO Russian Upstream and Oilfield Services 2017 - UPDATE
REnergyCO Strategy and market research + 1 905 205 1094 www.renergyco.ca FSU Energy Markets [email protected]
26.1.1 OOO Borets ....................................................................................................................................... 776 26.1.2 Lebedyan Machine-Building Factory (Lemaz) ................................................................................... 777 26.1.3 OOO Lysvaneftemash ....................................................................................................................... 778 26.2 OAO LIVGIDROMASH ........................................................................................................................ 779
26.3 OAO ALNAS ....................................................................................................................................... 779 26.4 ZAO Novomet-Perm and OOO Novomet-Service ............................................................................. 780
27 Rod pump systems ................................................................................................................ 782
27.1 OAO Izhneftemash (Rimera) ............................................................................................................. 783 27.2 Perm Oilfield Machinery Company ................................................................................................... 785 27.3 OAO Reduktor ................................................................................................................................... 786
28 Christmas tree producers ...................................................................................................... 787
28.1 OA AK Korvet .................................................................................................................................... 788
29 Cementing unit producers ..................................................................................................... 789
29.1 Pervomayskkhimmash ...................................................................................................................... 789
LIST OF FIGURES AND TABLES
Figure 1-1. Map of regional structure used in the report................................................................................................................. 31
Figure 2-4 a. Regional structure of incremental oil production in Russia in 1st
H 2017 to 1st
H 2016 (million tons) ......................... 37 Figure 2-1. Incremental crude production in 2016 to 2008and CAGR (mt and % per annum) ......................................................... 38 Figure 2-2. Regional structure of crude production in 2008 and 2014-2016 (% of total) ................................................................. 39 Figure 2-3. Incremental oil production in Russia in 2004-2016 (mt) ................................................................................................ 39 Figure 2-4. Regional structure of incremental oil production in Russia in 2016 to 2015 (million tons) ............................................ 40 Figure 2-5. Regional structure of incremental oil production in Russia in the 2015 to 2014 (mt) .................................................... 41 Figure 2-6. Regional structure of incremental oil production in Russia in 2014 to 2013 (mt) ......................................................... 42
Figure 2-7. Regional structure of incremental oil production in Russia in 2013 (mt) ....................................................................... 43 Figure 2-8. Regional structure of incremental oil production in Russia from 2010 to 2012 (mt) ..................................................... 44
Figure 2-9. Regional structure of incremental oil production in Russia from 2008 to 2010 (mt) ..................................................... 45
Figure 2-10 a. Structure of incremental oil production in Russia by company in the 1st
H 2017 to 1st
H 2016 (million tons) ........... 46 Figure 2-10. Structure of incremental oil production in Russia in 2016 to 2015 by company (mt) .................................................. 46 Figure 2-11. Structure of incremental oil production in Russia in 2015 by company (mt) ............................................................... 47
Figure 2-12. Structure of incremental oil production in Russia in 2014 by company (mt) ............................................................... 47 Figure 2-13. Structure of incremental oil production in Russia in 2013 by company (mt) ............................................................... 48 Figure 2-14. Oil production by key companies in Russia and apparent share of the state in 2000 .................................................. 48 Figure 2-15. Oil production by key companies in Russia and apparent state share in 2016 ............................................................ 49 Figure 2-16. Crude oil production and production drilling in Russia in 1990-2016 (million tons)..................................................... 50 Figure 2-17. Oil production and production drilling in Russia and global oil prices, 1990-2016 ....................................................... 51 Figure 2-18. Russian GDP and apparent income from oil industry in 2001-2016 (% to 2001) ......................................................... 52 Figure 2-19. Russian federal budget revenues from oil and gas in 2008-2016 (billion rubles) ......................................................... 54 Table 2-20. Russian federal budget in 2008-2015 (billion rubles) .................................................................................................... 55
Figure 2-21. Potential proportional reduction in crude production in mid 2017 by company (thousand tons a day) ..................... 56 Figure 2-22. Size of potential proportional reduction in crude production in mid 2017 by company (thousand tons a day) .......... 57
Figure 2-23. Size of potential loss in production in the 1st
H 2017 in Russia due to production cut agreement with OPEC ............. 57 Figure 2-24. Potential annual production in Russia depending on progress with the OPEC cut in 2017 (thousand tons a day and
million tons) ........................................................................................................................................................................... 58 Figure 2-25. New projects and legacy production in 2016-2017 (thousand tons per day) ............................................................... 59 Figure 2-26. Required reduction in legacy production in 2017 (thousand tons per day) ................................................................. 59
Figure 2-27. Apparent reduction in legacy production in 1st
Q 2017 (thousand tons per day) ........................................................ 60 Figure 2-28. Reduction in daily production by company in March 2017 to October 2016 (thousand tons per day) ........................ 61 Figure 2-29. Reduction in daily production by company in March 2017 to October 2016 (thousand tons per day and % from
October 2016) ........................................................................................................................................................................ 61 Figure 2-28 a. Change in daily production by company in June 2017 to October 2016 and June 2016 (thousand tons per day) ..62 Figure 2-30. Reduction in daily production by region in March 2017 to October 2016 (thousand tons per day) ............................ 62
Figure 2-31. Reduction in daily production by Rosneft in March 2017 to October 2016 (thousand tons per day) .......................... 63 Figure 2-32. Reduction in daily production by Gazprom Group in March 2017 to October 2016 (thousand tons per day) ............. 63 Figure 2-33. Reduction in daily production by LUKOIL in March 2017 to October 2016 (thousand tons per day) ........................... 64 Figure 2-34. Production by regions in 1
st Q 2017 to 1
st Q 2016 (thousand tons) ............................................................................. 64
Figure 2-35. Development drilling by regions in 1st
Q 2017 to 1st
Q 2016 (thousand meters) ......................................................... 65

REnergyCO Russian Upstream and Oilfield Services 2017 - UPDATE
REnergyCO Strategy and market research + 1 905 205 1094 www.renergyco.ca FSU Energy Markets [email protected]
Figure 2-34 a. Production by regions in 1st
H 2017 to 1st
H 2016 (thousand tons) ........................................................................... 65 Figure 2-36. Key taxes depending on crude oil price in 2015 taxation regime ($ bbl) ...................................................................... 67
Figure 2-37. Key taxes depending on crude oil price in 2016 taxation regime ($ bbl)...................................................................... 67 Figure 2-38. Key taxes depending on crude oil price in 2017 taxation regime ($ bbl) ...................................................................... 67 Table 2-39. Crude oil Export Duty formulas for various price ranges in 2017 .................................................................................. 70 Figure 2-40. Export duty time lag influence on Rosneft’s EBITDA in 2015-2016 (RUR bln) .............................................................. 70 Table 2-41. Changes to Export Duty calculations in September 2008 .............................................................................................. 70 Figure 2-42. Export duties for October 2008- August 2017 ($ per ton) ........................................................................................... 71 Figure 2-43. Export duties and MET and apparent export proceeds after taxes for January 2014 – July 2017 ($ per ton) ............. 72 Figure 2-44. Urals prices and discount to Brent in August 2008 – July 2017 (average monthly in $ bbl and in % to Brent) ............ 73 Table 2-45. Crude and condensate production in Russian in 2001-2016 (million tons) ................................................................... 73
Figure 2-46. Dynamics of oil production in 1992-2016 (% vs. previous year) .................................................................................. 74 Figure 2-47 Average daily oil production in Russia in 2007 – June 2017 (thousands tons per day) ............................................................. 74 Table 2-48. Gas production in Russia in 2001-2016 (bcm) ............................................................................................................... 75 Figure 2-49. Gas production in Russia by Gazprom and other producers in 2003- 2016 (billions of cubic meters) ......................... 76 Figure 2-50. Average daily gas production in Russia in 2008- February 2017 (average daily per month in mcm) ....................................... 76 Figure 2-51. Balance of oil distribution in Russia in 2002-2016 (millions of tons) ............................................................................ 77 Figure 2-52. Balance* of gas distribution in Russia, 2007-2016 (billions of cubic meters) ............................................................... 78 Figure 3-1. Drilling footage in Russia by type in 2001-2016 (million meters) ................................................................................... 79 Figure 3-2. Drilling footage in for crude oil and gas Russia by type in 2001-2016 (thousands of meters) ........................................ 79 Figure 3-3. Development drilling footage in key regions in 2003-2016 (millions of meters) ............................................................ 80 Figure 3-4 a. Change in development drilling by regions in 1
st H 2017 to 1
st H 2016 (thousand meters) ......................................... 80
Figure 3-4. Change in development drilling by regions in 1st
H 2017 to 1st
H 2016 (thousand meters) ........................................... 81 Figure 3-4. Change in development drilling by regions in 2016 (thousand meters) ......................................................................... 81 Figure 3-5. Change in development drilling by company in 2016 (million meters) .......................................................................... 82 Figure 3-6. Change in development drilling by regions in 2015 (thousand meters) ......................................................................... 82 Figure 3-7. Change in development drilling by company in 2015 (million meters) .......................................................................... 83 Figure 3-8. Change in development drilling by regions in 2014 (thousand meters) ......................................................................... 83 Figure 3-9. New production wells in key regions in 2003-2016 (thousands) .................................................................................... 84 Figure 3-10. Prospecting and exploratory drilling in 2003-2016 (thousands of meters) .................................................................. 84 Figure 3-11. Daily exploration drilling in 2002- June 2017 (thousand meters a day in a month) ..................................................... 85 Figure 3-12. Exploration drilling in key regions in 2003-2016 (thousands of meters) ...................................................................... 86
Figure 3-14 a. Exploration drilling change by regions in 1st
H 2017 (thousands of meters) ............................................................. 86 Figure 3-14. Exploration drilling change in 2016 by regions (thousands of meters) ........................................................................ 87
Figure 3-13. Exploration drilling change in 2015 by regions (thousands of meters) ........................................................................ 87 Figure 3-15. Average depth and effect of development drilling in Russia per new well in 2000-2016 ............................................. 88 Figure 3-16. Estimated daily flow of new oil wells in Russia in 2006-2016 (tons per day) ............................................................... 89 Figure 3-17. Additional production from production drilling and intensification methods in Russia, 2004-2016 (thousands tons)
...............................................................................................................................................................................................90 Figure 3-18. Decline of additional production from intensification methods in 2005-2016 (% to previous year) ............................ 90 Figure 3-19. Daily production and daily drilling footage in 2002- June 2017 (left scale in thousand tons a day and right hand scale
in thousand meters a day in a month) ................................................................................................................................... 91
Figure 3-20. Daily development drilling footage by month in 2002- June 2017 (thousand meters per day in a month) ................. 92 Table 3-21. Dynamics of daily development drilling in Russia by month in 2002- March 2017 (thousand meters per day and in %
to the same month year earlier) ............................................................................................................................................ 92 Figure 3-22. Horizontal drilling in Russia in 2003-2016 (million meters) .......................................................................................... 93 Figure 3-23. Horizontal drilling change in footage by region in 2016 to 2012 (thousand meters) ................................................... 94
Figure 3-24. Horizontal drilling change in footage by company in 2016 to 2015 (thousand meters) ............................................... 95 Figure 3-25. Horizontal drilling change in footage by company in Russia in 2015 (thousand meters) ............................................. 95 Figure 3-26. Horizontal wells completions in Russia in 2003-2016 (wells) ....................................................................................... 96 Figure 3-27. Well servicing/well workovers in Russia in 2003-2016 (thousand operations) ............................................................ 97 Figure 3-28. Operations of well servicing/well workover share in Russia in 2003-2016 (%) ............................................................ 97 Figure 3-29. The coverage of producing well stock with well servicing/well workover operations in Russia in 2003-2016
(thousands of wells) ............................................................................................................................................................... 98 Figure 3-30 Well servicing operations by key companies with high reduction rates in 2001-2016 (thousands of operations) ........ 99 Figure 3-31 Well servicing operations by ESP and Rod Pumps in 2007- 2016 (thousands of operations) ........................................ 99 Figure 3-32 Servicing jobs producing ESP and Rod Pumps well coverage in 2007- 2016 (% of wells serviced) .............................. 100 Figure 3-33. Market size of well servicing/workovers in 2003-2016 (million crew-hours) ............................................................. 100 Figure 3-34. Market size in millions of hours (the right-hand side index line) and the average duration of servicing jobs (the left-
hand side index line) in Russia in 2003-2016 (crew-hours) .................................................................................................. 101 Figure 3-35. Market size in million hours (right-hand side index line) and the average duration (the left-hand side index line) of
heavy workovers in Russia in 2003-2016 (crew-hours) ........................................................................................................ 101
Figure 3-36. Number of well servicing/well workover crews in Russia in 2003-2016..................................................................... 102 Figure 3-37. Operations per 1 well-servicing and well-workover crew in 2003-2016 (operations per crew per year) ................... 102
REnergyCO Russian Upstream and Oilfield Services 2017 - UPDATE
REnergyCO Strategy and market research + 1 905 205 1094 www.renergyco.ca FSU Energy Markets [email protected]
Figure 3-38. Thousand hours a year per well servicing and workover crew in 2003-2016 ............................................................. 103 Figure 3-39. Incremental production from activities of well servicing/well workover and the contribution of the activities to
additional production, 2004-2016 (million tons) ................................................................................................................. 104
Figure 3-40. Number of operations of production intensification in Russia in 2004-2016 (thousands of operations) ................... 104 Figure 3-41. Number of hydraulic fracturing operations in existing well stock in Russia in 2004-2016 (jobs-left hand scale and
incremental tons a day – right hand scale) .......................................................................................................................... 105 Figure 3-42. Additional production from hydro frack operations in existing well stock in Russia in 2004-2016 (mln. tons) .......... 105 Figure 3-43. Estimated number of jobs in Russia by type in 2004-2016 (thousand jobs) .............................................................. 106 Figure 3-44. Number of well bore stimulations and their effectiveness in Russia in 2003-2016 (# of jobs on the left scale and
incremental tons a day on the right) .................................................................................................................................... 107 Figure 3-45. Number and incremental daily flow from artificial lift optimization operations in Russia in 2003-2016 .................... 107 Figure 3-46. Water injection total and ton of crude in Russia in 2000-2016 (mln cubic meters) ................................................... 108 Figure 3-47. Active injection wells stock and water injection per injection well in Russia in 2001-2015 (wells and ‘000 cm per
well) ..................................................................................................................................................................................... 108 Figure 3-48 3D and 2D seismic activity including offshore in 2002-2016 ...................................................................................... 109 Figure 3-49 3D and 2D seismic land activity in 2005-2016 est. ..................................................................................................... 110 Figure 3-50 3D and 2D seismic land activity in 2005-2016 (thousand shot points) ....................................................................... 110 Figure 3-51 3D and 2D seismic activity by Rosneft in 2005-2012 (brown vs. green field) ............................................................. 111 Figure 3-52 Stratigraphic drilling and 2D seismic financed by the Federal Government in 2004-2016 ......................................... 111 Figure 3-53 2D seismic by the largest customers in 2005-2016 est (thousand linear km) ............................................................ 112 Figure 3-54 3D seismic by the largest customers in 2005-2016 est (thousand sq. km.) ................................................................ 112
Figure 4-1 Oilfield services market structure by key segments in 2016 ......................................................................................... 114 Figure 4-2 Market shares of key segments in 2003-2016 (% excluding casing) ............................................................................. 115 Figure 4-3 OFS market average annual growth rates in various periods in 2003-2016 (% excluding casing) ................................. 115 Figure 4-4 Oilfield services market dynamics in 2003-2016 (millions of US dollars) ...................................................................... 116 Figure 4-5 Oilfield services market dynamics in 2003-2016 excluding casing (millions of US dollars) ............................................ 117 Figure 4-6 Oilfield services market dynamics in 2003-2016 excluding casing (billions RUR) .......................................................... 118 Figure 4-7 Input of key segments in incremental market growth in 2003-2008 and decline in 2009 ($ mln) ................................ 118 Figure 4-8 Input of key segments in incremental market gain in 2009-2013 and decline in 2013-2016 ($ mln) ............................ 119 Figure 4-9 Input of key segments in incremental market gain in 2009-2013 and decline in 2013-2016 (RUR bln) ........................ 119 Figure 4-10 Average annual growth in key industry segments in 2003-2016 (%) .......................................................................... 121 Table 4-11 Market segments summary in Russia in 2005-2016 ($ millions) .................................................................................. 122 Figure 4-12 Crude and condensate production forecast by region till 2022 (mln. tons) ................................................................ 123 Figure 4-13 Urals price, ruble exchange rate (average monthly) and apparent oilfield services costs per ton of production in
2008, 2010 and 3 month 2011 ............................................................................................................................................. 127
Figure 4-14 Exchange rate and inflation forecast for 2017-2022 (rubles per $ and % per annum) ................................................ 128
Figure 4-15 Market forecast for 2017-2022 denominated in rubles and dollars (billions) ............................................................. 129 Figure 4-16 Forecast of the oil field services market segments in Russia in 2017-2022 (nominal $ millions) ................................. 129 Figure 4-17 Incremental market by segments by 2022 from 2016 ($ bln) ..................................................................................... 130
Figure 4-18 Annual average growth in different segments of the market in 2016-2022 in % .................................................................... 130 Table 4-19 Market forecasted size by key segments in Russia in 2017-2022 in mln USD .............................................................. 131 Figure 4-20 Contractual land drilling market development in 2003-2016 (millions of US dollars) ................................................. 132 Figure 4-21 Drilling market by regions in 2003-2016 (millions of US dollars)................................................................................. 133 Figure 4-22 Estimated spending on contractual drilling by large oil companies in 2003-2016 (millions of US dollars) .................. 133 Figure 4-23 Forecasted drilling segments in Russia in 2017-2022 (millions USD)........................................................................... 134 Figure 4-24 Forecasted drilling segment by key regions in 2017-2022 (millions USD) ................................................................... 135 Figure 4-25 Forecasted drilling segment by key oil companies in 2017-2022 (millions USD) ......................................................... 135 Figure 4-26 Sidetracking market estimates in 2003-2016 (millions of US dollars) ......................................................................... 136
Figure 4-27 Estimated large customers shares in Sidteracking in 2003-2016 and forecast in 2022 (%) ......................................... 137 Figure 4-28 Sidteracking by regions in Russia in 2003-2016 (millions USD) ................................................................................... 137 Figure 4-29 Forecast of sidetracking segment development in Russia in 2017-2022 (millions USD) ............................................. 138 Figure 4-30 Forecast of sidetracking segment development by region in 2017-2022 (millions USD) ............................................. 138 Figure 4-31 Rig mobilization and assembly in 2003-2016 (millions of US dollars) ......................................................................... 139 Figure 4-32 Rig mobilization and assembly by regions in 2003-2016 (millions of US dollars) ........................................................ 139 Figure 4-33 Forecast of rig mobilization and assembly segment development in Russia in 2016-2022 (millions USD) .................. 140 Figure 4-34 Forecast of rig mobilization and assembly segment development by regions in 2016-2022 (millions USD) ............... 140 Figure 4-35 Estimated customer share for rig mobilization and assembly in 2003-2016 and forecast in 2022 (%) ....................... 140 Figure 4-36 Drill bits and drill bit program supervising in 2003-2016 (millions of US dollars) ........................................................ 141 Figure 4-37 Drill bits by type of drilling estimates in 2003-2016 (millions of US dollars) ............................................................... 142
Figure 4-38 Estimated large customers shares for drill bits and drill bit program in 2003-2016 and forecast in 2022 (%)............. 143 Figure 4-39 Drill bit and bit supervising segment by regions in Russia in 2003-2016 (millions USD) ............................................. 143 Figure 4-40 Forecast of drill bit and bit supervising segment development in Russia in 2017-2022 (millions USD) ....................... 144 Figure 4-41 Forecast of drill bit segment by type of drilling in Russia in 2017-2022 (millions USD) ............................................... 144 Figure 4-42 Turbines and downhole motors in Russia by type of drilling in 2003-2016 (millions of US dollars) ............................ 145

REnergyCO Russian Upstream and Oilfield Services 2017 - UPDATE
REnergyCO Strategy and market research + 1 905 205 1094 www.renergyco.ca FSU Energy Markets [email protected]
Figure 4-43 Estimated large customers shares in turbines/ downhole motors in 2003-2016 and forecast in 2022 (%) ................. 146 Figure 4-44 Turbines/ downhole motors by regions in Russia in 2003-2016 (millions USD) .......................................................... 146 Figure 4-45 Forecast of turbine/ downhole motors segment development in Russia in 2017-2022 (millions USD)....................... 146 Figure 4-46 Forecast of turbines/ downhole motors segment development by regions in 2017-2022 (millions USD) .................. 147
Figure 4-47 Drilling fluids market development in 2003-2016 (millions of US dollars) .................................................................. 148 Figure 4-48 Drilling fluids split between engineers and chemicals in 2003-2016 (millions of US dollars) ...................................... 148 Figure 4-49 Estimated large customers shares in drilling fuids in 2003-2016 and forecast in 2022 (%) ......................................... 149 Figure 4-50 Drilling fluids by regions in Russia in 2003-2016 (millions USD) .................................................................................. 149 Figure 4-51 Forecast of drilling fluids market development in Russia in 2017-2022 (millions USD) ............................................... 150 Figure 4-52 Forecast of drilling fluids segment development by regions in 2017-2022 (millions USD) .......................................... 150 Figure 4-53 MWD/LWD and RSS segments size in 2003-2016 (millions of US dollars)................................................................... 151 Figure 4-54 MWD/LWD and RSS segments forecast in 2017-2022 (millions of US dollars)............................................................ 151 Figure 4-55 Telemetry/MWD/LWD segment size in 2003-2016 (millions of US dollars) ................................................................ 152
Figure 4-56 Estimated large customers shares in MWD/LWD in 2003-2016 and forecast in 2022 (%) .......................................... 153 Figure 4-57 MWD/LWD by regions in Russia in 2003-2016 (millions USD) .................................................................................... 153 Figure 4-58 Forecast of MWD/LWD segment development in Russia in 2017-2022 (millions USD) .............................................. 154 Figure 4-59 Forecast of MWD/LWD segment development by regions in 2017-2022 (millions USD) ............................................ 154 Figure 4-60 Rotary Steering Systems segment estimates in 2003-2016 (millions of US dollars) .................................................... 155 Figure 4-61 Estimated large customers shares in Rotary Steering Systems in 2003-2016 and forecast in 2022 (%) ...................... 155 Figure 4-62 Rotary Steering Systems by regions in Russia in 2003-2016 (millions USD) ................................................................ 156 Figure 4-63 Forecast of Rotary Steering Systems segment development in Russia in 2017-2022 (millions USD) .......................... 156 Figure 4-64 Forecast of Rotary Steering Systems segment development by regions in 2017-2022 (millions USD) ........................ 157
Figure 4-65 Pressure pumping market in 2003-2016 (millions of US dollars) ................................................................................ 157 Figure 4-66 Estimated large customers shares in Pressure pumping in 2003-2016 and forecast in 2022 (%) ................................ 158 Figure 4-67 Pressure Pumping by regions in Russia in 2003-2016 (millions USD) .......................................................................... 159 Figure 4-68 Forecast of pressure pumping market in Russia in 2016-2022 (millions USD) ............................................................ 159 Figure 4-69 Forecast of Pressure Pumping segment by regions in 2017-2022 (millions USD) ....................................................... 159 Figure 4-70 Cementing segment development in 2003-2016 (millions of US dollars) ................................................................... 160 Figure 4-71 Estimated large customers shares in Cementing in 2003-2016 and forecast in 2022 (%) ........................................... 161 Figure 4-72 Cementing by regions in Russia in 2003-2016 (millions USD) ..................................................................................... 162 Figure 4-73 Forecast of cementing sub segment development in Russia in 2017-2022 (millions USD) ......................................... 162 Figure 4-74 Forecast of Cementing sub segment by regions in 2017-2022 (millions USD) ............................................................ 163 Figure 4-75 Hydro fracturing market development in 2003-2016 (millions of US dollars) ............................................................. 164
Figure 4-76 Estimated large customers shares in Fracturing in 2003-2016 and forecast in 2022 (%) ............................................ 165 Figure 4-77 Fracturing by regions in Russia in 2003-2016 (millions USD) ...................................................................................... 165 Figure 4-78 Forecast of hydro fracturing sub segment in Russia in 2017-2022 (millions USD) ...................................................... 166
Figure 4-79 Forecast of Fracturing sub segment by regions in 2017-2022 (millions USD) ............................................................. 166 Figure 4-80 Coiled tubing segment in 2003-2016 (millions of US dollars) ...................................................................................... 167 Figure 4-81 Estimated large customers shares in Coiled Tubing in 2003-2016 and forecast in 2022 (%) ...................................... 168 Figure 4-82 Coiled Tubing by regions in Russia in 2003-2016 (millions USD) ................................................................................. 168
Figure 4-83 Forecast of coiled tubing sub segment in Russia in 2017-2022 (millions USD) ........................................................... 169 Figure 4-84 Forecast of Coiled Tubing sub segment by regions in 2017-2022 (millions USD) ........................................................ 169 Figure 4-85 Wireline segment of Russian OFS market in 2003-2016 (millions of US dollars) ......................................................... 170 Figure 4-86 Estimated large customers shares in Wireline in 2003-2016 and forecast in 2022 (%) ............................................... 171 Figure 4-87 Wireline by regions in Russia in 2003-2016 (millions USD) ......................................................................................... 171 Figure 4-88 Wireline market in Russia in 2017-2022 (millions USD) .............................................................................................. 172 Figure 4-89 Forecast of Wireline segment by regions in 2017-2022 (millions USD) ....................................................................... 172 Figure 4-90 Open hole logging in 2003-2016 (millions of US dollars) ............................................................................................ 173 Figure 4-91 Estimated large customers shares in Open Hole Logging in 2003-2016 and forecast in 2022 (%) .............................. 173
Figure 4-92 Open Hole Logging by regions in Russia in 2003-2016 (millions USD) ......................................................................... 174 Figure 4-93 Open hole logging market in Russia in 2016-2022 (millions USD) ............................................................................... 174 Figure 4-94 Forecast of Open Hole Logging sub segment by regions in 2017-2022 (millions USD) ................................................ 175 Figure 4-95 Cased hole logging in 2003-2016 (millions of US dollars) ........................................................................................... 176 Figure 4-96 Estimated large customers shares in Cased Hole Logging in 2003-2016 and forecast in 2022 (%) .............................. 176 Figure 4-97 Cased Hole Logging by regions in Russia in 2003-2016 (millions USD) ........................................................................ 177 Figure 4-98 Cased hole logging market in Russia in 2017-2022 (millions USD) .............................................................................. 177 Figure 4-99 Forecast of Cased Hole Logging sub segment by regions in 2017-2022 (millions USD) ............................................... 178 Figure 4-100 Perforation segment development in 2003-2016 (millions of US dollars) ................................................................. 178 Figure 4-101 Estimated large customers shares in Perforation in 2003-2016 and forecast in 2022 (%) ........................................ 179 Figure 4-102 Perforation by regions in Russia in 2003-2016 (millions USD) .................................................................................. 179
Figure 4-103 Forecast of perforation segment development in Russia in 2017-2022 (millions USD) ............................................. 180 Figure 4-104 Forecast of perforation sub segment by regions in 2017-2022 (millions USD) ......................................................... 180 Figure 4-105 Well servicing and workover market development in 2003-2016 (millions of US dollars) ........................................ 181 Figure 4-106 Estimated large customers shares in Workover/Servicing in 2003-2016 and forecast in 2022 (%) ........................... 181
REnergyCO Russian Upstream and Oilfield Services 2017 - UPDATE
REnergyCO Strategy and market research + 1 905 205 1094 www.renergyco.ca FSU Energy Markets [email protected]
Figure 4-107 Workover by regions in Russia in 2003-2016 (millions USD) ..................................................................................... 182 Figure 4-108 Forecast of well service/workover segment development in Russia in 2017-2022 (millions USD) ............................ 182 Figure 4-109 Forecast of well service/workover segment development by region in 2017-2022 (millions USD) ........................... 183 Figure 4-110 Well workover market development in 2003-2016 (millions of US dollars) .............................................................. 184 Figure 4-111 Estimated large customers shares in Workover in 2003-2016 and forecast in 2022 (%) ........................................... 185
Figure 4-112 Workover by regions in Russia in 2003-2016 (millions USD) ..................................................................................... 185 Figure 4-113 Forecast of well workover segment development in Russia in 2016-2022 (millions USD) ........................................ 186 Figure 4-114 Forecast of workover by regions in 2017-2022 (millions USD) .................................................................................. 186 Figure 4-115 Well servicing market development in 2003-2016 (millions of US dollars) ............................................................... 187 Figure 4-116 Estimated large customers shares in well servicing in 2003-2016 and forecast in 2022 (%) ..................................... 188 Figure 4-117 Well servicing by regions in Russia in 2003-2016 (millions USD) .............................................................................. 188 Figure 4-118 Forecast of well service segment development in Russia in 2017-2022 (millions USD) ............................................ 189 Figure 4-119 Forecast of well servicing by regions in 2017-2022 (millions USD) ........................................................................... 189 Figure 4-120 Completion services market development in 2003-2016 (millions of US dollars) ..................................................... 190
Figure 4-121 Estimated large customers shares in completion by WO and CT crews in 2003-2016 and forecast in 2022 (%) ....... 190 Figure 4-122 WO and CT crews by regions in Russia in 2003-2016 (millions USD) ......................................................................... 191 Figure 4-123 Forecast of completion by WO and CT in Russia in 2017-2022 (millions USD) .......................................................... 191 Figure 4-124 Forecast of completions by WO and CT by regions in 2017-2022 (millions USD) ...................................................... 192 Figure 4-125 Seismic market development in 2003-2015 (millions of US dollars) ......................................................................... 193 Figure 4-126 Forecast of seismic market in Russia in 2017-2022 (millions USD) ........................................................................... 194 Figure 4-127 Artificial Lift (ALS) segment development in 2003-2016 (millions of US dollars) ....................................................... 194 Figure 4-128 Estimated large customers shares in Artificial Lift Systems in 2003-2016 and forecast in 2022 (%) ......................... 195 Figure 4-129 Artificial Lift Systems by regions in Russia in 2003-2016 (millions USD) .................................................................... 195
Figure 4-130 Forecast of ALS segment development in Russia in 2016-2022 (millions USD) ......................................................... 196 Figure 4-131 Forecast of ALS segment by regions in 2016-2022 (millions USD)............................................................................. 196 Figure 4-132 Regional structure of oilfield service market in 2003-2016 (%)................................................................................. 197 Figure 4-133 Regional structure of oilfield service market in 2003-2016 (billions USD) ................................................................. 197 Figure 4-134 Market forecast by the major regions in 2016-2022 (billions USD) .......................................................................... 198 Figure 4-135 Forecasted shares of the market of the major regions in 2016-2022 (%) ................................................................. 198 Figure 4-136 Oil field services expenses in RUR per ton of production (left hand scale) and $ per barrel (right hand scale) in
2003-2022 ...........................................................................................................................................................................199 Figure 4-137 Combined revenues of largest oilfield services equipment manufacturers (mln USD) .............................................. 200 Figure 5-1 Forecast of crude oil production in Russia by key regions in 2017-2022 (mln tons) ..................................................... 202 Figure 5-2 Incremental production by key regions in millions tons till 2022 (2016 base year) ...................................................... 202
Figure 5-3 Relationship of production volumes to drilling footage (million tons and thousand meters) ....................................... 203 Figure 5-4 Forecast of sources of production maintenance in Russia in 2016-2022 (mln tons) ..................................................... 204 Figure 5-5 Forecast of development drilling in Russia by key regions in 2016-2022 (mln meters) ................................................. 204
Figure 5-6 Forecast of the average flow rate of new wells in 2016-2022 (tons per day) ............................................................... 205
Figure 5-7 Horizontal and total development drilling footage in 2017-2022 (mln meters) ............................................................ 205 Figure 5-8 Forecast of producing stock in Russia by key region in 2017-2022 ............................................................................... 206 Figure 5-9 Forecast of servicing/workover in Russia in 2017-2022 (jobs in thousand) .................................................................. 206
Figure 5-10 Forecast of well servicing jobs in Russia by key region in 2017-2022 (thousand jobs) ................................................ 207 Figure 5-11 Forecast of workovers in Russia by key region in 2017-2022 (thousand jobs) ............................................................ 207 Figure 5-12 Forecast of hydraulic fracturing by regions in 2017-2022 (jobs) ................................................................................. 207 Figure 5-13 Forecast of hydraulic fracturing by type of a well in Russia in 2016-2020 (jobs) ......................................................... 208 Figure 5-14 Forecast of the number of wells with multistage fracturing in Russia in 2017-2022 ................................................... 208 Figure 5-15 Forecast of sidetracking jobs by region in Russia in 2017-2022 .................................................................................. 209 Figure 5-16 Forecast of well bore stimulation jobs by key regions in Russia in 2017-2022 ........................................................... 209 Figure 5-17 forecast of ALS optimization jobs by key regions in Russia in 2017-2022 ................................................................... 210 Figure 5-18 Forecast of seismic activity in Russia in 2017-2022 (million shotpoints) ..................................................................... 210
Figure 5-19 Forecast of number of drill crews in 2017-2022 ......................................................................................................... 211 Figure 5-20 Forecast of drilling rigs stock in 2017-2022 ................................................................................................................. 212 Figure 5-21 Russian rig fleet by age in 2012 (%) ............................................................................................................................ 212 Figure 5-22 Forecast of drill rigs procurement in 2017-2022 ......................................................................................................... 213 Figure 5-23 Forecast of the growth in well-servicing and workover crews in 2017-2022 .............................................................. 213 Figure 5-24 Forecast of the needs for workover rigs in 2017-2022 ................................................................................................ 213 Figure 6-1. Oil production by key producing regions in 2003-2016 (millions of tons) .................................................................... 215 Table 6-2. Incremental production by region in 2016 to 2015 ...................................................................................................... 215 Figure 6-3. Regional shares in key oilfield activities in 2016 (% of footage or # of jobs) ................................................................ 216 Figure 6-4. Regional share in development drilling in 2003-2016 (% and mln meters) .................................................................. 217 Figure 6-5. Daily flows of new production wells estimates by key region in 2002, 2005 and 2010-2016 (tons/day) ..................... 218
Figure 6-6. Regional share in new production wells completions in 2003-2016 (% and thsnd wells) ............................................ 218 Figure 6-7. Horizontal drilling by region in 2003-2016 (% and million meters) .............................................................................. 219 Figure 6-8. Well servicing and workover jobs by key region in 2003-2016 (thousand jobs) ........................................................... 220

REnergyCO Russian Upstream and Oilfield Services 2017 - UPDATE
REnergyCO Strategy and market research + 1 905 205 1094 www.renergyco.ca FSU Energy Markets [email protected]
Figure 6-9. Producing wells by region in 2003-2016 (‘000 wells) ................................................................................................... 220 Table 6-10. Coverage of production wells with workovers and well services in 2004-2016 (as % of producing wells) .................. 220 Figure 6-11. Regional distribution of hydraulic fracturing of the existing well stock 2004-2016 (% and ‘000 jobs) ....................... 221 Figure 6-12. Regional distribution of stimulation of the existing well stock 2004-2016 (‘000 jobs) ............................................... 221 Figure 6-13. Regional distribution of ALS optimization of the existing well stock 2004-2016 (‘000 jobs) ...................................... 222 Figure 6-14. Producing well coverage by fracturing, stimulation and ALS optimization in 2005-2016 (% of well with intervention)
.............................................................................................................................................................................................222 Table 7-1. Largest oil fields in KhMAD and estimated production from these fields ..................................................................... 223 Figure 7-2. Oil production in KhMAD by company in 2003-2016 (million tons) ............................................................................. 225 Table 7-3. Oil companies share in production in KhMAD in 2016, growth rates to previous period and CAGR (%) ....................... 225
Figure 7-2 a. Oil production in KhMAD by company in 1st
H 2017 to 1st
H 2016 (thousand tons) ................................................. 226 Figure 7-4. Base production and effectiveness of key activities in KhMAD in 2004-2016 (millions of tons) .................................. 227 Figure 7-5. Development drilling in KhMAD by Company in 2003-2016 (million meters) .............................................................. 229 Table 7-6. Oil companies share in development drilling in KhMAD in 2016 and growth rates to previous period and CAGR (%) 229 Figure 7-5 a. Development drilling in KhMAD by Company in 1
st H 2017 to 1
st H 2016 (thousand meters) ................................... 230
Figure 7-7. Change in development drilling in KhMAD by Company in 2016 to 2015 (thousand meters) ..................................... 230 Figure 7-8. Change in development drilling in KhMAD by Company in 2015 to 2014 (thousand meters) ..................................... 231
Figure 7-9. Monthly drilling by company in KHMAD in 2016 and 1st
H 2017 (thousand meters a day in a month) ........................ 231 Figure 7-9 a. Change in daily drilling by company in June 2017 to December and June 2016 (thousand meters a day in a month)
.............................................................................................................................................................................................232 Figure 7-9 b. Daily drilling in KHMAD by company in June 2017 and June 2016 (thousand meters a dy) ...................................... 232 Figure 7-10. New production wells completed in KhMAD in 2003-2016 (wells) ............................................................................ 233 Table 7-11. Oil companies share in new wells completed in KhMAD in 2016 and growth rates to previous period and CAGR (%)
.............................................................................................................................................................................................233
Figure 7-12. Estimates of daily flow rates from new wells and average depths in KhMAD in 2003-2016 ...................................... 234 Figure 7-13. Horizontal drilling in KhMAD by company in 2003-2016 (thousands of meters)........................................................ 235
Figure 7-14. Change in Horizontal drilling in KhMAD by company in 1st
H 2017 to 1st
H 2016 (thousands of meters) ................... 235 Figure 7-14. Change in Horizontal drilling in KhMAD by company in 2016 to 2015 (thousands of meters) ................................... 235 Figure 7-15. Change in Horizontal drilling in KhMAD by company in 2015 to 2014 (thousands of meters) ................................... 236 Figure 7-16. Horizontal drilling in KhMAD as % of total development drilling (2005-2016) ........................................................... 237 Figure 7-17. Exploration drilling in KhMAD by company in 2003-2016 (thousands of meters) ...................................................... 238 Figure 7-18. Producing well stock by company in 2003-2016 ........................................................................................................ 239 Figure 7-19. Producing well stock by type of artificial lift in KhMAD in 2003-2016 (% of total) ..................................................... 239 Figure 7-20. Active wells in production well stock in KhMAD in 2001-2012 (%) ............................................................................ 240 Figure 7-21. Well servicing operations jobs in KhMAD in 2003-2016 (thousands) ......................................................................... 240
Table 7-22. Oil companies share in well servicing in KhMAD in 2016 and growth rates to previous period and CAGR (%) ........... 240 Figure 7-23. Well workover jobs in KhMAD by company in 2003-2016 (thousand jobs) ............................................................... 241 Table 7-24. Oil companies share in well workover in KhMAD in 2016, growth rates to previous periods and CAGR (%) ............... 242
Figure 7-25. Artificial lift optimization operations in KhMAD by company in 2003-2016 (jobs) ..................................................... 243 Table 7-26. Oil companies share in artificial lift optimization in KhMAD in 2016 and growth rates to previous period and CAGR
(%) ....................................................................................................................................................................................... 243 Figure 7-27. Effectiveness of artificial lift optimization activities in KhMAD in 2003-2016 (incremental flow rate—tons per day)
.............................................................................................................................................................................................244 Figure 7-28. Well bore stimulation operations in KhMAD by company in 2003-2016 (operations) ............................................... 244 Table 7-29. Oil companies share in well bore stimulation in KhMAD in 2016 and growth rates to previous period and CAGR (%)
.............................................................................................................................................................................................245 Figure 7-30. Effectiveness of bottom-hole zone treatment activities in KhMAD in 2003-2016 (flow rate- tons per day) .............. 245 Figure 7-31. Number of hydraulic fracturing in KhMAD by company in 2004-2016 (jobs) ............................................................ 246 Table 7-32. Oil companies share in fracs operations in KhMAD in 2016 and growth rates to previous period and CAGR (%) ....... 246 Figure 7-33. Effectiveness of hydraulic fracturing activities in KhMAD in 2004-2016 (tons per day per operation) ...................... 247 Figure 7-34. Water injection in KhMAD by company in 2003-2016 (millions of cubic meters) ...................................................... 247
Table 7-35. Oil companies share in water injection in KhMAD in 2016 and growth rates to previous period and CAGR (%) ......... 248 Figure 7-36. Water injection per ton of production in KhMAD in 2003-2016 (tons of water per ton of oil) .................................. 248 Figure 7-37 Oilfield services market structure by key segments in KhMAD in 2016 ...................................................................... 249 Figure 7-38 Oilfield services market development in KhMAD in 2003-2016 (millions of US dollars) ............................................. 249 Figure 7-39 Drilling related costs by type in KhMAD in 2003-2016 (millions of US dollars) ........................................................... 250 Figure 7-40 Contractual land drilling market development in KhMAD in 2003-2016 (millions of US dollars) ................................ 250 Figure 7-41 Sidetracking market estimates in KhMAD in 2003-2016 (millions of US dollars) ........................................................ 251 Figure 7-42 Rig mobilization and assembly in KhMAD in 2003-2016 (millions of US dollars)......................................................... 251 Figure 7-43 Drill bits and drill bit program supervising in KhMAD in 2003-2016 (millions of US dollars) ....................................... 252 Figure 7-44 Turbines, servicing and supervising in KhMAD in 2003-2016 (millions of US dollars) ................................................. 253 Figure 7-45 Drilling fluids market development in KhMAD in 2003-2016 (millions of US dollars).................................................. 253
Figure 7-46 MWD/LWD and RSS segments size in KhMAD in 2003-2016 (millions of US dollars) .................................................. 254 Figure 7-47 Pressure pumping market in KhMAD in 2003-2016 (millions of US dollars) ................................................................ 254
REnergyCO Russian Upstream and Oilfield Services 2017 - UPDATE
REnergyCO Strategy and market research + 1 905 205 1094 www.renergyco.ca FSU Energy Markets [email protected]
Figure 7-48 Wireline segment of Russian OFS market in KhMAD in 2003-2016 (millions of US dollars) ........................................ 255 Figure 7-49 Well servicing and workover market development in KhMAD in 2003-2016 (millions of US dollars) ......................... 256 Figure 7-50 Artificial Lift (ALS) segment development in KhMAD in 2003-2016 (millions of US dollars) ........................................ 256 Figure 7-51 Forecast of the oil field services in KhMAD in 2008-2022 (nominal $ bln and RUR bln) .............................................. 257 Figure 7-52 Forecast of the oil field services market segments in KhMAD in 2017-2022 (nominal $ millions) ............................... 257 Table 7-53 Market forecasted size by key segments in KhMAD in 2017-2022 in mln USD ............................................................ 258 Figure 7-54 Oil field services expenses in KhMAD RUR per ton of production (left hand scale) and $ per barrel (right hand scale)
in 2003-2022 ........................................................................................................................................................................ 258 Figure 7-55 KhMAD OFS costs per ton of production as percentage of Russia average in 2003-2022 ........................................... 258 Table 8-1. Largest oil fields in YaNAD and estimated production from these fields ....................................................................... 259 Figure 8-2. Production of natural gas in YaNAD and other regions of Russia in 2003-2016 (bcm) ................................................. 261 Figure 8-3. Production of crude oil and gas condensate in YaNAD in 2003-2015 (million tons)..................................................... 262 Table 8-4. Oil and condensates CAGR in 2003-2016 ...................................................................................................................... 262 Figure 8-5. Production of crude oil and gas condensate in YaNAD by Company in 2003-2016 (million tons) ................................ 262 Table 8-6. Oil companies share in production in YaNAD in 2016 and growth rates to previous period and CAGR (%) .................. 263
Figure 8-7 a. Change in production of crude oil and gas condensate in YaNAD by Company in 1st
H 2017 to 1st
H 2016 (thousand tons) ..................................................................................................................................................................................... 263
Figure 8-7. Change in production of crude oil and gas condensate in YaNAD by Company in 2016 to 2015 (thousand tons) ...... 263
Figure 8-8. Change in production of crude oil and gas condensate in YaNAD by Company in 2015 to 2014 (million tons) ............ 264 Figure 8-9. Base production (crude oil excluding NGL) and effectiveness of key activities in YaNAD in 2004-2016 (thousands of
tons) ..................................................................................................................................................................................... 264 Figure 8-10. Development drilling in YaNAD by company in 2003-2016 (thousands of meters) .................................................... 265 Table 8-11. Oil companies share in development drilling in YaNAD in 2016 and growth rates to previous period and CAGR in
2003-2016 (%) ...................................................................................................................................................................... 266
Figure 8-12. Change in development drilling in YaNAD by company in 1st
H 2017 to 1st
H 2016 (thousands of meters) ............... 266 Figure 8-12. Change in development drilling in YaNAD by company in 2016 to 2015 (thousands of meters)................................ 266 Figure 8-13. Change in development drilling in YaNAD by company in 2015 to 2014 (thousands of meters)................................ 267 Figure 8-14. Drilling for gas in YaNAD by company in 2003-2016 (thousand meters) ................................................................... 267 Figure 8-15. Drilling for oil in YaNAD by company in 2003-2016 (thousand meters) ..................................................................... 268 Figure 8-16. Oil and gas wells completion in YaNAD by company in 2003-2016 (wells) ................................................................ 268 Table 8-17. Oil companies’ oil and gas wells completed in YaNAD in 2016 and growth rates to previous period and CAGR in
2003-2016 (%) .....................................................................................................................................................................269 Figure 8-18. Oil wells completion in YaNAD by company in 2003-2016 (wells) ............................................................................. 269 Figure 8-19. Estimates of flow rates from new wells and average depths in YaNAD in 2003-2016 ............................................... 270 Figure 8-20. Horizontal drilling in YaNAD by company in 2003-2016 (thousand meters) .............................................................. 271
Figure 8-20. Horizontal drilling in YaNAD by company in 1st
H 2017 to 1st
H 2016 (thousand meters) .......................................... 271 Figure 8-21. Share of horizontal drilling in YaNAD by company in 2007-2016 (%) ......................................................................... 271 Figure 8-22. Exploration drilling in YaNAD by company in 2003-2016 (thousands of meters) ....................................................... 272 Figure 8-23. Producing well stock in YaNAD in 2003-2016 (wells) ................................................................................................. 272
Figure 8-24. Producing well stock by type of artificial lift in YaNAD in 2003-2016 (% of total) ...................................................... 273 Figure 8-25. Producing wells and operational water injection wells versus total production wells in YaNAD in 2001-2012 (%) .273 Figure 8-26. Well-servicing jobs in YaNAD by company in 2003-2016 (number of operations) ..................................................... 274 Table 8-27. Oil companies share in well servicing in YaNAD in 2016 and growth rates to previous period and CAGR in 2003-2016
(%) ....................................................................................................................................................................................... 275 Figure 8-28. Well-workover jobs in YaNAD by company in 2003-2016 (operations) ..................................................................... 276 Table 8-29. Oil companies share in well workovers in YaNAD in 2016 and growth rates to previous period and CAGR in 2003-
2016 (%) ............................................................................................................................................................................... 276
Figure 8-30. Artificial lift optimization jobs in YaNAD by company in 2003-2016 (units) ............................................................... 277 Figure 8-31. Effectiveness of artificial lift optimization activities in YaNAD in 2003-2016 (incremental daily flow rate- tons per
day) ...................................................................................................................................................................................... 277 Figure 8-32. Well bore stimulations in YaNAD by company in 2003-2016 (operations)................................................................. 278 Figure 8-33. Effectiveness of well bore stimulation activities in YaNAD in 2003-2016 (incremental daily flow rate- tons per day
per operation) ...................................................................................................................................................................... 278 Figure 8-34. Number of hydraulic fracturing jobs in old wells in YaNAD by company in 2004-2016 .............................................. 278 Figure 8-35. Effectiveness of hydraulic fracturing activities at existing wells in YaNAD in 2004-2015 (flow rate- tons per day)..279 Figure 8-36. Water injection in YaNAD by company in 2003-2016 (thousands of cubic meters) ................................................... 279
Figure 8-37. Water injection per ton of production in YaNAD, 2003-2016 (tons of water per ton of oil) ...................................... 280 Figure 8-38 Oilfield services market structure by key segments in YaNAD in 2016 ....................................................................... 281 Figure 8-39 Oilfield services market development in YaNAD in 2003-2016 (millions of US dollars)............................................... 281 Figure 8-40 Drilling related market in YaNAD in 2003-2016 (millions of US dollars) ...................................................................... 282 Figure 8-41 Contractual land drilling market development in YaNAD in 2003-2016 (millions of US dollars) ................................. 282 Figure 8-42 Sidetracking rigs and crews estimates in YaNAD in 2003-2016 (millions of US dollars) .............................................. 283 Figure 8-43 Rig mobilization and assembly in YaNAD in 2003-2016 (millions of US dollars) .......................................................... 283
Figure 8-44 Drill bits and drill bit program supervising in YaNAD in 2003-2016 (millions of US dollars) ........................................ 284

REnergyCO Russian Upstream and Oilfield Services 2017 - UPDATE
REnergyCO Strategy and market research + 1 905 205 1094 www.renergyco.ca FSU Energy Markets [email protected]
Figure 8-45 Turbines, servicing and supervising in YaNAD in 2003-2016 (millions of US dollars)................................................... 284 Figure 8-46 Drilling fluids market development in YaNAD in 2003-2016 (millions of US dollars) ................................................... 285 Figure 8-47 MWD/LWD/RSS segment size in YaNAD in 2003-2016 (millions of US dollars) ........................................................... 285 Figure 8-48 Pressure pumping market in YaNAD in 2003-2016 (millions of US dollars) ................................................................. 286 Figure 8-49 Wireline segment of Russian OFS market in YaNAD in 2003-2016 (millions of US dollars) ......................................... 287 Figure 8-50 Well servicing and workover market development in YaNAD in 2003-2016 (millions of US dollars) ........................... 287 Figure 8-51 Artificial Lift (ALS) segment development in YaNAD in 2003-2016 (millions of US dollars) ......................................... 288 Figure 8-52 Forecast of the oil field services in YaNAD in 2008-2022 (nominal $ bln and RUR bln) ............................................... 288
Figure 8-53 Forecast of the oil field services market segments in YaNAD in 2017-2022 (nominal $ millions) ............................... 289 Table 8-54 Market forecasted size by key segments in YaNAD in 2017-2022 in mln USD ............................................................. 289 Figure 8-55 Oil field services expenses in YaNAD RUR per ton of production (left hand scale) and $ per barrel (right hand scale)
in 2003-2022 ........................................................................................................................................................................ 290
Figure 8-56 YaNAD OFS costs per ton of production as percentage of Russia average in 2003-2022 ............................................ 290 Table 9-1. Largest oil fields in Tomsk, south Tyumen and other regions of West Siberia and estimated production from these
fields in 2009 in 2011 ........................................................................................................................................................... 291 Figure 9-2. Production of crude oil and gas condensate in South Tyumen, Tomsk and other West Siberia by Company in 2003-
2016 (million tons) ............................................................................................................................................................... 292 Table 9-3. Oil companies share in production in Other West Siberia in 2016 and growth rates to previous period and CAGR in
2003-2016 (%) ...................................................................................................................................................................... 292 Figure 9-4 a. Change in production of crude oil and gas condensate in South Tyumen, Tomsk and other West Siberia by
Company in 1st
H 2017 to 1st
H 2016 (thousand tons) ......................................................................................................... 293 Figure 9-4. Change in production of crude oil and gas condensate in South Tyumen, Tomsk and other West Siberia by Company
in 2016 to 2015 (mln tons) .................................................................................................................................................. 293 Figure 9-5. Change in production of crude oil and gas condensate in South Tyumen, Tomsk and other West Siberia by Company
in 2015 to 2014 (million tons) .............................................................................................................................................. 294 Figure 9-6. Base production and effectiveness of key activities in Other West Siberia in 2004-2016 (million tons) ...................... 294
Figure 9-7. Development drilling in Other West Siberia by company in 2003-2016 (thousands of meters) .................................. 295 Table 9-8. Oil companies share in development drilling in Other West Siberia in 2015 and growth rates to previous period and
CAGR in 2003-2016 (%) ........................................................................................................................................................ 295 Figure 9-9 a. Change in development drilling in Other West Siberia by company in 1
st H 2017 to 1
st H 2016 (thousands of meters)
.............................................................................................................................................................................................296 Figure 9-9. Change in development drilling in Other West Siberia by company in 2016 to 2015 (thousands of meters)............... 296 Figure 9-10. Change in development drilling in Other West Siberia by company in 2015 to 2014 (thousands of meters) ............. 296 Figure 9-11. Wells completion in Other West Siberia by company in 2003-2016 (units) ............................................................... 297 Table 9-12. Oil companies’ wells completed in Other West Siberia in 2016 and growth rates to previous period and CAGR in
2003-2016 (%) ...................................................................................................................................................................... 297 Figure 9-13. Estimates of flow rates from new wells and average depths in Other West Siberia in 2003-2016 ............................ 298 Figure 9-14. Horizontal drilling in Other West Siberia by company in 2003-2016 (thousand meters) ........................................... 298
Figure 9-14. Change in Horizontal drilling in Other West Siberia by company in 1st
H 2017 to 1st
H 2016 (thousand meters) ....... 299 Figure 9-15. Exploration drilling in Other West Siberia by company in 2003-2016 (thousands of meters) .................................... 299
Figure 9-16. Producing well stock in Other West Siberia in 2003-2016 by company (wells) .......................................................... 300 Figure 9-17. Producing well stock by type of artificial lift in Other West Siberia in 2003-2016 (% of total) ................................... 300 Figure 9-18. Producing wells and operational water injection wells versus total production wells in Other West Siberia in 2002-
2012 (%) ............................................................................................................................................................................... 301 Figure 9-19. Well-servicing jobs in Other West Siberia by company in 2003-2016 (number of operations) .................................. 301 Table 9-20. Oil companies share in well servicing in Other West Siberia in 2016 and growth rates to previous period and CAGR in
2003-2016 (%) ...................................................................................................................................................................... 302 Figure 9-21. Well-workover jobs in Tyumen/Tomsk by major company in 2003-2016 (operations) ............................................. 302 Figure 9-22. Artificial lift optimization jobs in Other West Siberia by company in 2003-2016 (units) ............................................ 303 Figure 9-23. Effectiveness of artificial lift optimization activities in Other West Siberia in 2003-2016 (incremental daily flow rate-
tons per day) ........................................................................................................................................................................ 304 Figure 9-24. Well bore stimulations in Other West Siberia by company in 2003-2016 (operations) ............................................. 304 Figure 9-25. Effectiveness of well bore stimulation activities in Other West Siberia in 2003-2016 (incremental daily flow rate-
tons per day per operation) ................................................................................................................................................. 305 Figure 9-26. Number of hydraulic fracturing jobs in Other West Siberia by company in 2004-2016 (units) .................................. 305 Figure 9-27. Effectiveness of hydraulic fracturing activities at existing wells in Other West Siberia in 2004-2016 (flow rate- tons
per day) ................................................................................................................................................................................ 306 Figure 9-28. Water injection in Other West Siberia by company in 2003-2016 (thousands of cubic meters) ................................ 306 Figure 9-29. Water injection per ton of production in Other West Siberia, 2003-2016 (tons of water per ton of oil) ................... 306 Figure 9-30 Oilfield services market structure by key segments in South Tyumen, Tomsk and Other WS in 2016 ........................ 307 Figure 9-31 Oilfield services market development in South Tyumen, Tomsk and Other WS in 2003-2016 (millions of US dollars)
.............................................................................................................................................................................................308 Figure 9-32 Drilling related market in Tomsk/Tyumen in 2003-2016 (millions of US dollars) ........................................................ 308 Figure 9-33 Contractual land drilling market development in South Tyumen, Tomsk and Other WS in 2003-2016 (millions of US
REnergyCO Russian Upstream and Oilfield Services 2017 - UPDATE
REnergyCO Strategy and market research + 1 905 205 1094 www.renergyco.ca FSU Energy Markets [email protected]
dollars) ................................................................................................................................................................................. 309 Figure 9-34 Sidetracking market estimates in South Tyumen, Tomsk and Other WS in 2003-2016 (millions of US dollars) .......... 309 Figure 9-35 Rig mobilization and assembly in South Tyumen, Tomsk and Other WS in 2003-2016 (millions of US dollars) .......... 310 Figure 9-36 Drill bits and drill bit program supervising in South Tyumen, Tomsk and Other WS in 2003-2016 (millions of US
dollars) ................................................................................................................................................................................. 310 Figure 9-37 Turbines, servicing and supervising in South Tyumen, Tomsk and Other WS in 2003-2016 (millions of US dollars) .311 Figure 9-38 Drilling fluids market development in South Tyumen, Tomsk and Other WS in 2003-2016 (millions of US dollars) .311 Figure 9-39 MWD/LWD/RSS segment size in South Tyumen, Tomsk and Other WS in 2003-2016 (millions of US dollars) 312 Figure 9-40 Pressure pumping market in South Tyumen, Tomsk and Other WS in 2003-2016 (millions of US dollars) ................. 312 Figure 9-41 Wireline segment of Russian OFS market in South Tyumen, Tomsk and Other WS in 2003-2016 (millions of US
dollars) ................................................................................................................................................................................. 313 Figure 9-42 Well servicing and workover market development in South Tyumen, Tomsk and Other WS in 2003-2016 (millions of
US dollars) ............................................................................................................................................................................ 313 Figure 9-43 Artificial Lift (ALS) segment development in South Tyumen, Tomsk and Other WS in 2003-2016 (millions of US
dollars) ................................................................................................................................................................................. 314
Figure 9-44 Forecast of the oil field services in Tyumen/Tomsk in 2008-2022 (nominal $ bln and RUR bln) ................................. 315 Figure 9-45 Forecast of the oil field services market segments in South Tyumen, Tomsk and Other WS in 2017-2022 (nominal $
millions) ............................................................................................................................................................................... 315 Table 9-46 Market forecasted size by key segments in South Tyumen, Tomsk and Other WS in 2016-2022 in mln USD .............. 315 Figure 9-47 Oil field services expenses in South Tyumen, Tomsk and Other WS RUR per ton of production (left hand scale) and $
per barrel (right hand scale) in 2003-2022 ........................................................................................................................... 316 Figure 9-48 South Tyumen, Tomsk and Other WS OFS costs per ton of production as percentage of Russia average in 2003-2022
.............................................................................................................................................................................................316 Table 10-1. Largest oil fields in Volga-Urals and estimated production from these fields ............................................................. 318 Figure 10-2. Oil and gas condensate production in the Volga-Urals region by company in 2003-2016 (thousands of tons) .......... 319 Table 10-3. Oil companies share in crude oil production in Volga-Urals in 2016 and growth rates to previous period and CAGR in
2003-2016 (%) ...................................................................................................................................................................... 319
Figure 10-4 a. Change in Oil and gas condensate production in the Volga-Urals region by company in 1st
H 2017 to 1st
H 2016 (thousands of tons) .............................................................................................................................................................. 320
Figure 10-4. Change in Oil and gas condensate production in the Volga-Urals region by company in 2016 to 2015 (mln of tons) .............................................................................................................................................................................................320
Figure 10-5. Change in Oil and gas condensate production in the Volga-Urals region by company in 2015 to 2014 (thousands of tons) ..................................................................................................................................................................................... 321
Figure 10-6. Base production and effectiveness of key activities in Volga-Urals in 2004-2016 (millions of tons) .......................... 322 Figure 10-7. Development drilling in the Volga-Urals region by company in 2003-2016 (million meters) ..................................... 322
Figure 10-8 a. Change in development drilling in the Volga-Urals region by company in the 1st
H 2017 to 1st
H 2016 (thousand meters) ................................................................................................................................................................................ 323
Figure 10-8. Change in development drilling in the Volga-Urals region by company in 2015 to 2014 (thousand meters) ............. 323 Figure 10-9. Change in development drilling in the Volga-Urals region by company in 2016 to 2015 (thousand meters) ............ 324 Table 10-10. Oil companies share in development drilling in Volga-Urals in 2016 and growth rates to previous period and CAGR
in 2003-2016 (%) .................................................................................................................................................................. 325
Figure 10-11. Completion of new production wells in the Volga-Urals region by company in 2003-2016 (units).......................... 326 Table 10-12. Oil companies share in new wells completed in Volga-Urals in 2016 and growth rates to previous period and CAGR
in 2003-2016 (%) .................................................................................................................................................................. 326 Figure 10-13. Estimates of flow rates from new wells and average depths in the Volga-Urals region in 2003-2016 ..................... 326
Figure 10-14. Horizontal drilling in the Volga-Urals region by company in 2003-2016 (thousand meters) .................................... 327 Figure 10-15. Horizontal drilling share in the Volga-Urals region by company in 2007-2016 (%) .................................................. 327
Figure 10-14 a. Change Horizontal drilling in the Volga-Urals region by company in the 1st
H 2017 to 1st
H 2016 (thousand meters) ................................................................................................................................................................................ 328
Figure 10-16. Exploration drilling in the Volga-Urals region by company, 2003-2016 (thousands of meters) ............................... 328 Figure 10-17. Producing well stock in the Volga-Urals region in 2003-2016 (thousand wells) ....................................................... 329 Figure 10-18. Producing well stock by type of artificial lift in Volga-Urals in 2003-2016 (% of total) ............................................. 329 Figure 10-19. Active wells share in the Volga-Urals region in 2001-2012 (units) ........................................................................... 330 Figure 10-20. Well-servicing in the Volga-Urals region by company in 2003-2016 (servicing – thousand jobs) ............................. 330 Table 10-21. Oil companies share in well servicing in Volga-Urals in 2016 and growth rates to previous period and CAGR in 2003-
2016 (%) ............................................................................................................................................................................... 331
Figure 10-22. Well-workover jobs in the Volga-Urals region in 2003-2016 (thousand jobs) .......................................................... 332 Table 10-23. Oil companies share in workovers in Volga-Urals in 2016 and growth rates to previous period and CAGR in 2003-
2016 (%) ............................................................................................................................................................................... 332 Figure 10-24. Artificial lift optimization in the Volga-Urals region by company in 2003-2016 (operations) ................................... 333 Table 10-25. Oil companies share in artificial lift optimization in Volga-Urals in 2016 and growth rates to previous period and
CAGR in 2003-2016 (%) ........................................................................................................................................................ 333 Figure 10-26. Effectiveness of artificial lift optimization activities in the Volga-Urals region in 2003-2016 (incremental flow rate-
tons per day per operations)................................................................................................................................................ 334

REnergyCO Russian Upstream and Oilfield Services 2017 - UPDATE
REnergyCO Strategy and market research + 1 905 205 1094 www.renergyco.ca FSU Energy Markets [email protected]
Figure 10-27. Well bore stimulation in the Volga-Urals region by company in 2003-2016 (operations) ........................................ 334 Table 10-28. Oil companies share in well bore stimulation in Volga-Urals in 2016 and growth rates to previous period and CAGR
in 2003-2016 (%) .................................................................................................................................................................. 334 Figure 10-29. Effectiveness of well bore stimulations in the Volga-Urals region in 2003-2016 (incremental flow rates—tons per
day per operation) ............................................................................................................................................................... 335
Figure 10-30. Number of hydraulic fracturing jobs in the Volga-Urals region by company in 2004-2016 (number of operations) .............................................................................................................................................................................................335
Table 10-31. Oil companies share in fracs in Volga-Urals in 2016 and growth rates to previous period and CAGR in 2003-2016 (%) ....................................................................................................................................................................................... 335
Figure 10-32. Effectiveness of fracturing activities in the Volga-Urals region in 2004-2016 (incremental flow rate- tons per day per operation) ...................................................................................................................................................................... 336
Figure 10-33. Effectiveness of hydraulic fracturing activities by key company in the Volga-Urals region in 2004-2016 (incremental flow rate - tons per day) ................................................................................................................................. 336
Figure 10-34. Water injection in the Volga-Urals region by company in 2003-2016 (millions of cubic meters) ............................. 337 Table 10-35. Oil companies share in water injection in Volga-Urals in 2016 and growth rates to previous period and CAGR in
2003-2016 (%) ...................................................................................................................................................................... 337 Figure 10-36. Water injection per ton of production in the Volga-Urals region in 2003-2015 (tons of water per ton of oil) ......... 337 Figure 10-37 Oilfield services market structure by key segments in Volga-Urals in 2016 .............................................................. 338 Figure 10-38 Oilfield services market development in Volga-Urals in 2003-2016 (millions of US dollars) ..................................... 339
Figure 10-39 Drilling related market in Volga-Urals in 2003-2016 (millions of US dollars) ............................................................. 339 Figure 10-40 Contractual land drilling market development in Volga-Urals in 2003-2016 (millions of US dollars) ........................ 340 Figure 10-41 Sidetracking market estimates in Volga-Urals in 2003-2016 (millions of US dollars) ................................................ 340 Figure 10-42 Rig mobilization and assembly in Volga-Urals in 2003-2016 (millions of US dollars) ................................................ 341 Figure 10-43 Drill bits and drill bit program supervising in Volga-Urals in 2003-2016 (millions of US dollars) ............................... 341 Figure 10-44 Turbines/ down hole motors in Volga-Urals in 2003-2016 (millions of US dollars) ................................................... 342 Figure 10-45 Drilling fluids market development in Volga-Urals in 2003-2016 (millions of US dollars) ......................................... 342 Figure 10-46 MWD/LWD/RSS segment size in Volga-Urals in 2003-2016 (millions of US dollars).................................................. 343 Figure 10-47 Pressure pumping market in Volga-Urals in 2003-2016 (millions of US dollars)........................................................ 343
Figure 10-48 Wireline segment of Russian OFS market in Volga-Urals in 2003-2015 (millions of US dollars) ................................ 344 Figure 10-49 Well servicing and workover market development in Volga-Urals in 2003-2012 (millions of US dollars) .................. 344 Figure 10-50 Artificial Lift (ALS) segment development in Volga-Urals in 2003-2016 (millions of US dollars) ................................ 345 Figure 10-51 Forecast of the oil field services market in Volga-Urals in 2008-2022 (nominal $ millions and RUR) ........................ 345 Figure 10-52 Forecast of the oil field services market segments in Volga-Urals in 2017-2022 (nominal $ millions) ...................... 346 Table 10-53 Market forecasted size by key segments in Volga-Urals in 2016-2022 in mln USD .................................................... 346 Figure 10-54 Oil field services expenses in Volga-Urals RUR per ton of production (left hand scale) and per barrel (right hand
scale) in 2003-2022 .............................................................................................................................................................. 346
Figure 10-55 Volga-Urals OFS costs per ton of production as +/- to Russia average in 2003-2022 ................................................ 347 Table 11-1. Largest oil fields in Timan-Pechora and estimated production from these fields ........................................................ 348 Figure 11-2. Oil and gas condensate production in Timan-Pechora by company in 2003-2016 (thousands of tons) ..................... 349 Table 11-3. Oil companies share in production in Timan-Pechora in 2016 and growth rates to previous period and CAGR in 2003-
2016 (%) ............................................................................................................................................................................... 349
Figure 11-4 a. Change in oil and gas condensate production in Timan-Pechora by company in the 1st
H 2017 to 1st
H 2016 (thousands of tons) .............................................................................................................................................................. 350
Figure 11-4. Change in oil and gas condensate production in Timan-Pechora by company in 2016 to 2015 (thousands of tons) .............................................................................................................................................................................................350
Figure 11-5. Change in oil and gas condensate production in Timan-Pechora by company in 2015 to 2014 (thousands of tons) .............................................................................................................................................................................................351
Figure 11-6. Base production in Timan-Pechora and effectiveness of key activities in 2004-2016 (mln tons) ............................... 351 Figure 11-7. Development drilling in Timan-Pechora by company in 2003-2016 (thousands of meters) ...................................... 352 Table 11-8. Oil companies share in development drilling in Timan-Pechora in 2016 and growth rates to previous period and
CAGR in 2003-2016 (%) ........................................................................................................................................................ 352
Figure 11-7. Change in Development drilling in Timan-Pechora by company in the 1st
H 2017 to 1st H 2016 (thousands of meters) ................................................................................................................................................................................ 353
Figure 11-9. New production wells completion in Timan-Pechora by company in 2003-2016 ...................................................... 353 Table 11-10. Oil companies share in production wells completions in Timan-Pechora in 2016 and growth rates to previous
period and CAGR in 2003-2016 (%) ...................................................................................................................................... 353 Figure 11-11. Estimates of daily flow rates from new wells and average depths in Timan-Pechora in 2003-2016 ........................ 354 Figure 11-12. Average depths in Timan-Pechora by major company in 2007-2016 (thousand meters) ........................................ 354 Figure 11-13. Horizontal drilling in Timan-Pechora by company in 2003-2016 (thousand meters) ............................................... 355
Figure 11-13 a. Change Horizontal drilling in Timan-Pechora by company in the 1st
H 2017 to 1st
H 2016 (thousand meters) ...... 355 Figure 11-14. Exploration drilling in Timan-Pechora by company in 2003-2016 (thousands of meters) ........................................ 356 Figure 11-15. Producing well stock in Timan-Pechora in 2003-2016 (thousands) ......................................................................... 356 Figure 11-16. Producing well stock by type of artificial lift in Timan-Pechora in 2003-2016 (% of total) ....................................... 357 Figure 11-17. Active wells as % of total production wells in Timan-Pechora in 2001-2012 (%) ..................................................... 357

REnergyCO Russian Upstream and Oilfield Services 2017 - UPDATE
REnergyCO Strategy and market research + 1 905 205 1094 www.renergyco.ca FSU Energy Markets [email protected]
Figure 11-18. Active wells per company in Timan-Pechora in 2012 (% of total) ............................................................................ 357
Figure 11-19. Well-servicing jobs in Timan-Pechora by company in 2003-2016 (jobs) .................................................................. 358 Table 11-20. Oil companies share in well servicing in Timan-Pechora in 2016 and growth rates to previous period and CAGR in
2003-2016 (%) ...................................................................................................................................................................... 358 Figure 11-21. Workover jobs in Timan-Pechora by company in 2003-2016 .................................................................................. 359 Figure 11-22. Artificial lift optimization jobs in Timan-Pechora by company in 2003-2016 ........................................................... 360 Figure 11-23. Effectiveness of artificial lift optimization activities in Timan-Pechora in 2003-2016 (incremental flow rate- tons
per day per operation) ......................................................................................................................................................... 360 Figure 11-24. Well bore stimulations in Timan-Pechora by company in 2003-2016 (operations) ................................................. 360 Figure 11-25. Effectiveness of well bore stimulation activities in Timan-Pechora in 2003-2016 (flow rate- tons per day) ............ 361
Figure 11-26. Hydraulic fracturing jobs in existing wells in Timan-Pechora by company in 2004-2016 (operations) ..................... 361 Figure 11-27. Effectiveness of hydraulic fracturing activities in Timan-Pechora in 2004-2016 (incremental flow rate- tons per day
per operation) ...................................................................................................................................................................... 361 Figure 11-28. Water injection in Timan-Pechora by company in 2003-2016 (thousands of cubic meters) .................................... 362 Figure 11-29. Water injection per ton of production in Timan-Pechora in 2003-2016 (tons of water per ton of oil) .................... 362 Figure 11-30 Oilfield services market structure by key segments in Timan-Pechora in 2016......................................................... 363 Figure 11-31 Oilfield services market development in Timan-Pechora in 2003-2016 (millions of US dollars) ............................... 363 Figure 11-32 Drilling related market in Timan-Pechora in 2003-2016 (millions of US dollars) ....................................................... 364 Figure 11-33 Contractual land drilling market development in Timan-Pechora in 2003-2016 (millions of US dollars) .................. 364
Figure 11-34 Sidetracking market estimates in Timan-Pechora in 2003-2016 (millions of US dollars) .......................................... 365 Figure 11-35 Rig mobilization and assembly in Timan-Pechora in 2003-2016 (millions of US dollars) ........................................... 365 Figure 11-36 Drill bits and drill bit program supervising in Timan-Pechora in 2003-2016 (millions of US dollars) ......................... 366 Figure 11-37 Turbines/ down hole motors in Timan-Pechora in 2003-2016 (millions of US dollars) ............................................. 366 Figure 11-38 Drilling fluids market development in Timan-Pechora in 2003-2016 (millions of US dollars) ................................... 367 Figure 11-39 MWD/LWD/ RSS segment size in Timan-Pechora in 2003-2016 (millions of US dollars) ........................................... 367 Figure 11-40 Pressure pumping market in Timan-Pechora in 2003-2016 (millions of US dollars) .................................................. 367 Figure 11-41 Wireline segment of Russian OFS market in Timan-Pechora in 2003-2016 (millions of US dollars) .......................... 368 Figure 11-42 Well servicing and workover market development in Timan-Pechora in 2003-2016 (millions of US dollars) ............ 369
Figure 11-43 Artificial Lift (ALS) segment development in Timan-Pechora in 2003-2016 (millions of US dollars) .......................... 369 Figure 11-44 Forecast of the oil field services in Timan-Pechora in 2016-2022 (bln RUR and $) ................................................... 370 Figure 11-45 Forecast of the oil field services market segments in Timan-Pechora in 2016-2022 (nominal $ millions) ................ 370 Table 11-46 Market forecasted size by key segments in Timan-Pechora in 2016-2022 in mln USD .............................................. 370 Figure 11-47 Oil field services expenses in Timan-Pechora $ per ton of production (left hand scale) and per barrel (right hand
scale) in 2003-2022 .............................................................................................................................................................. 371 Figure 11-48 Timan-Pechora OFS costs per ton of production +/- percentage of Russia average in 2003-2022 ............................ 371 Table 12-1. Largest oil fields in East Siberia and estimated production from these fields ............................................................. 373 Figure 12-2. Oil production in Eastern Siberia by company in 2005-2016 (mln of tons) ................................................................ 374
Figure 12-2 a. Change in Oil production in Eastern Siberia by company in the 1st
H 2017 (thousand of tons) ............................... 375 Figure 12-3. Development drilling footage in Eastern Siberia by company in 2005-2016 (thousands of meters) .......................... 376
Figure 12-3 a. Change in Development drilling footage in Eastern Siberia by company in the 1st
H 2017 (thousands of meters)376 Figure 12-3 a. Change in Horizontal drilling footage in Eastern Siberia by company in the 1
st H 2017 (thousands of meters) ....... 376
Figure 12-4. Development wells completions in Eastern Siberia by company in 2007-2016 ......................................................... 377
Figure 12-5. Incremental production in East Siberia from new wells in 2010-2016 (thousand tons) ............................................. 377 Figure 12-6. Apparent daily flows of new wells in East Siberia from new wells in 2010-2016 (tons a day) .................................... 378 Figure 12-7. Exploration drilling footage in Eastern Siberia by company in 2005-2016 (thousands meters) ................................. 378 Figure 12-8. Producing wells by key players in East Siberia in 2016 ............................................................................................... 379
Figure 12-9. well servicing by key players in East Siberia in 2009-2016 (jobs) ............................................................................... 379 Figure 12-10. Workovers by key players in East Siberia in 2009-2016 (jobs) ................................................................................. 380 Figure 12-11. Wellbore stimulation jobs in East Siberia by company in 2008-2016 (jobs) ............................................................. 380 Figure 12-12. Fracturing jobs in East Siberia by company in 2010-2016 (jobs) .............................................................................. 381 Figure 12-13. Water injection in East Siberia by company in 2009-2016 (million tons) ................................................................. 381 Figure 12-14 Oilfield services market structure by key segments in East Siberia in 2016 .............................................................. 382 Figure 12-15 Oilfield services market development in East Siberia in 2003-2016 (millions of US dollars) ..................................... 382 Figure 12-16 Drilling related market in East Siberia in 2003-2016 (millions of US dollars) ............................................................. 383 Figure 12-17 Contractual land drilling market development in East Siberia in 2003-2016 (millions of US dollars) ........................ 383
Figure 12-18 Sidetracking drilling market in East Siberia in 2003-2016 (millions of US dollars) ..................................................... 384 Figure 12-19 Rig mobilization and assembly in East Siberia in 2003-2016 (millions of US dollars) ................................................. 384 Figure 12-20 Drill bits and drill bit program supervising in East Siberia in 2003-2016 (millions of US dollars) ............................... 385 Figure 12-21 Turbines/ down hole motors in East Siberia in 2003-2016 (millions of US dollars) ................................................... 385 Figure 12-22 Drilling fluids market development in East Siberia in 2003-2016 (millions of US dollars) ......................................... 386 Figure 12-23 MWD/LWD/ RSS segment size in East Siberia in 2003-2016 (millions of US dollars)................................................. 386 Figure 12-24 Pressure pumping market in East Siberia in 2003-2016 (millions of US dollars) ....................................................... 387 Figure 12-25 Wireline segment of Russian OFS market in East Siberia in 2003-2016 (millions of US dollars) ................................ 387 Figure 12-26 Workover/ servicing in East Siberia in 2003-2016 (millions of US dollars) ................................................................ 388
REnergyCO Russian Upstream and Oilfield Services 2017 - UPDATE
REnergyCO Strategy and market research + 1 905 205 1094 www.renergyco.ca FSU Energy Markets [email protected]
Figure 12-27 Artificial Lift (ALS) segment development in East Siberia in 2003-2016 (millions of US dollars) ................................ 388 Figure 12-28 Forecast of the oil field services market in East Siberia in 2017-2022 (bln RUR and $) ............................................. 389
Figure 12-29 Forecast of the oil field services market segments in East Siberia in 2017-2022 (nominal $ millions) ...................... 389 Table 12-30 Market forecasted size by key segments in East Siberia in 2017-2022 in mln USD .................................................... 389 Figure 12-31 Oil field services expenses in East Siberia $ per ton of production (left hand scale) and per barrel (right hand scale)
in 2003-2022 ........................................................................................................................................................................ 390
Figure 12-32 East Siberia OFS costs per ton of production as +/- percentage to Russia average in 2011-2022 ............................. 390 Table 13-1. Largest oil fields in Far East and estimated production from these fields ................................................................... 391 Figure 13-2. Oil production in the Far East by company in 2003-2016 (million tons) .................................................................... 392
Figure 13-2. Change in Oil production in the Far East by company in 1st
H 2017 (thousand tons) ................................................. 393 Figure 13-3. Base production and reported activities in Far East in 2003-2016 (million tons) ....................................................... 395
Figure 13-4. Development drilling footage in the Far East by company in 2003-2016 (thousands of meters) ............................... 396 Figure 13-5. Commissioning of new production wells in the Far East by company in 2005-2016 (wells)....................................... 396 Figure 13-6. Horizontal drilling in the Far East in 2005-2016 (thousand meters) ........................................................................... 397 Figure 13-7. Apparent flow rates of Sakhalin I and Sakhalin II new wells in 2006-2016 (tons a day) ............................................. 397 Figure 13-8. Producing and active injection well stock in the Far East in 2003-2016 ..................................................................... 398 Figure 13-9. Producing well stock by type of artificial lift in Sakhalin in 2003-2016 (% of total) .................................................... 398 Figure 13-10. Well-servicing jobs in the Far East by company in 2003-2016 ................................................................................. 399 Figure 13-11. Well-workover jobs in the Far East by company in 2003-2016 ................................................................................ 399 Figure 13-12. Artificial lift optimization jobs in the Far East by company in 2003-2016 ................................................................. 400
Figure 13-13. Effectiveness of artificial lift optimization activities in the Far East in 2003-2016 (flow rate- tons/day) .................. 401 Figure 13-14. Bottom-hole zone treatment jobs by Rosneft in the Far East in 2003-2016 ............................................................ 401 Figure 13-15. Effectiveness of bottom-hole zone treatment activities in the Far East in 2003-2016 (incremental flow rate-
tons/day) ............................................................................................................................................................................. 401
Figure 13-16. Water injection in the Far East by company in 2003-2016 (thousands of cubic meters) ......................................... 402 Figure 13-17. Water injection per ton of production in the Far East by Rosneft and Sakhalin II in 2003-2016 (tons of water per
ton of oil) ............................................................................................................................................................................. 402 Table 13-18 Sakhalin I and Sakhalin II budgets in 2010- 2011........................................................................................................ 403 Figure 13-19 Oilfield services market structure by key segments in Sakhalin in 2016 ................................................................... 403
Figure 13-20 Oilfield services market development in Sakhalin in 2003-2016 (millions of US dollars) .......................................... 404 Figure 13-21 Drilling related market in Sakhalin in 2003-2016 (millions of US dollars) .................................................................. 404 Figure 13-22 Contractual land drilling market development in Sakhalin in 2003-2016 (millions of US dollars) ............................. 405 Figure 13-23 Drilling fluids estimate in Sakhalin in 2003-2016 (millions of US dollars) .................................................................. 405 Figure 13-24 MWD/LWD/RSS/bits in Sakhalin in 2003-2016 (millions of US dollars)..................................................................... 406 Figure 13-25 Pressure pumping market in Sakhalin in 2003-2016 (millions of US dollars) ............................................................ 406 Figure 13-26 Wireline segment of Russian OFS market in Sakhalin in 2003-2016 (millions of US dollars) ..................................... 407 Figure 13-27 Well servicing and workover market development in Sakhalin in 2003-2016 (millions of US dollars) ....................... 407 Figure 13-28 Artificial Lift (ALS) segment development in Sakhalin in 2003-2016 (millions of US dollars) ..................................... 408 Figure 13-29 Forecast of the oil field services market in Sakhalin in 2015-2022 (bln RUR and $) .................................................. 408 Figure 13-30 Forecast of the oil field services market segments in Sakhalin in 2015-2022 (nominal $ millions) ........................... 409
Table 13-31 Market forecasted size by key segments in Sakhalin in 2016-2022 in mln USD ......................................................... 409 Figure 13-32 Oil field services expenses in Sakhalin $ per ton of production (left hand scale) and per barrel (right hand scale) in
2003-2022 ............................................................................................................................................................................ 410
Figure 13-33 Sakhalin OFS costs per ton of production as percentage of Russia average in 2003-2022 ........................................ 410 Table 14-1. Largest oil fields in North Caucasus and estimated production from these fields ....................................................... 411 Figure 14-2. Oil production in the North Caucasus by company in 2003-2016 (thousands of tons) .............................................. 412 Figure 14-3. Base production and effect from key activities in 2003-2016 (thousands of tons) .................................................... 412
Figure 14-4. Development drilling in the North Caucasus in 2003-2016 (thousands of meters) .................................................... 413 Figure 14-5. New production wells completions in the North Caucasus in 2003-2016 .................................................................. 413 Figure 14-6. Estimates of flow rates from Rosneft’s new wells and average depths in the North Caucasus, 2003-2016 .............. 414 Figure 14-7. Exploration drilling in the North Caucasus by Rosneft in 2003-2016 (thousands of meters) ..................................... 414 Figure 14-8. Total producing well stock in the North Caucasus in 2003-2016 ............................................................................... 415 Figure 14-9. Producing well stock by type of artificial lift in North Caucasus in 2003-2016 (% of total) ........................................ 415 Figure 14-10. Active wells as % of the total operating well stock in the North Caucasus (%)......................................................... 416 Figure 14-11. Well-servicing jobs in the North Caucasus by company in 2003-2016 ..................................................................... 416 Figure 14-12. Number of workover operations in the North Caucasus by company in 2003-2016 ................................................ 417
Figure 14-13. Artificial lift optimization jobs in the North Caucasus by company in 2003-2016 .................................................... 418 Figure 14-14. Effectiveness of artificial lift optimization activities in the North Caucasus in 2003-2016 (flow rate- tons per day)
.............................................................................................................................................................................................418 Figure 14-15. Well bore stimulations jobs in the North Caucasus by company in 2003-2016 ........................................................ 418 Figure 14-16. Effectiveness of well bore stimulation activities in the North Caucasus in 2003-2016 (incremental flow rate- tons
per day) ................................................................................................................................................................................ 419
Figure 14-17. Number of hydraulic fracturing jobs in the North Caucasus by company in 2004-2016 (jobs) ................................ 419 Figure 14-18. Effectiveness of hydraulic fracturing activities in the North Caucasus in 2004-2016 (incremental flow rate- tons per
REnergyCO Russian Upstream and Oilfield Services 2017 - UPDATE
REnergyCO Strategy and market research + 1 905 205 1094 www.renergyco.ca FSU Energy Markets [email protected]
day per operation) ............................................................................................................................................................... 420 Figure 14-19. Water injection in the North Caucasus by company in 2003-2016 (millions of cubic meters) ................................. 420 Figure 14-20. Water injection per ton of production in the North Caucasus in 2003-2016 (tons of water per ton of oil) ............. 420
Figure 14-21 Oilfield services market structure by key segments in Caucasus in 2016 .................................................................. 421 Figure 14-22 Oilfield services market development in Caucasus in 2003-2016 (millions of US dollars) ......................................... 422 Figure 14-23 Drilling related market in Caucasus in 2003-2016 (millions of US dollars) ................................................................ 422 Figure 14-24 Contractual land drilling market development in Caucasus in 2003-2016 (millions of US dollars) ............................ 423 Figure 14-25 Rig transport and assembly in Caucasus in 2003-2016 (millions of US dollars) ......................................................... 423 Figure 14-26 Drill bits and drill bit program supervising in Caucasus in 2003-2016 (millions of US dollars) ................................... 423 Figure 14-27 Drilling fluids market development in Caucasus in 2003-2016 (millions of US dollars) ............................................. 424 Figure 14-28 Pressure pumping market in Caucasus in 2003-2016 (millions of US dollars) ........................................................... 424 Figure 14-29 Wireline segment of Russian OFS market in Caucasus in 2003-2016 (millions of US dollars) .................................... 424
Figure 14-30 Well servicing and workover market development in Caucasus in 2003-2016 (millions of US dollars) ..................... 425 Figure 14-31 Artificial Lift (ALS) segment development in Caucasus in 2003-2016 (millions of US dollars) ................................... 425 Figure 14-32 Forecast of the oil field services market segments in Caucasus in 2016-2022 (nominal $ millions) .......................... 426 Figure 14-33 Oil field services expenses in Caucasus $ per ton of production (left hand scale) and per barrel (right hand scale) in
2003-2022 ............................................................................................................................................................................ 426 Figure 15-1 Natural Gas in YaNAD share in the Russian OFS market in 2003-2016 ....................................................................... 427 Figure 15-2 Oilfield services market structure by key segments in Natural Gas in YaNAD in 2016 ................................................ 427 Figure 15-3 Oilfield services market development in Natural Gas in 2003-2016 (millions of US dollars) ...................................... 428 Figure 15-4 Drilling for Natural Gas in 2003-2016 in YaNAD and Astrakhan (thousand meters).................................................... 428
Figure 15-5 Drilling related market in Natural Gas in YaNAD in 2003-2016 (millions of US dollars) .............................................. 429 Figure 15-6 Contractual land drilling market development in Natural Gas in 2003-2015 (millions of US dollars) .......................... 429 Figure 15-7 Rig mobilization and assembly in Natural Gas in 2003-2016 (millions of US dollars) .................................................. 430 Figure 15-8 Drill bits/ Turbine and drill bit program supervising in Natural Gas in 2003-2016 (millions of US dollars) .................. 430 Figure 15-9 Drilling fluids market development in Natural Gas in 2003-2016 (millions of US dollars) ........................................... 430 Figure 15-10 MWD/LWD segment size in Natural Gas in 2003-2016 (millions of US dollars) ........................................................ 431 Figure 15-11 Pressure pumping market in Natural Gas in 2003-2016 (millions of US dollars) ....................................................... 431 Figure 15-12 Wireline segment of Russian OFS market in Natural Gas in 2003-2015 (millions of US dollars) ............................... 431 Figure 15-13 Well servicing and workover market development in Natural Gas in 2003-2016 (millions of US dollars) ................. 432
Figure 15-14 Forecast of the oil field services market segments in Natural Gas in 2017-2022 (nominal $ millions) ...................... 432 Table 15-15 Market forecasted size by key segments in Natural Gas in 2017-2022 in mln USD .................................................... 433 Figure 15-16 Oil field services expenses in Natural Gas $ per TOE (left hand scale) and per barrel (right hand scale) in 2003-2022
.............................................................................................................................................................................................433 Figure 15-17 Forecast of the oil field services market segments in Caspian offshore in 2009-2022 (nominal $ millions) .............. 434 Figure 16-1. Oil production by VIOCs and other types of producers in Russia in 2001-2016 (millions of tons per year) ............................ 435 Figure 16-2. Growth in production by VIOCs and other types of producers in Russia (2003=100%) ........................................................... 436 Figure 16-3. Shares of oil companies in crude oil and condensate production in 2003-2016 ........................................................ 436 Figure 16-4. Shares of oil companies in development drilling in 2003-2016 ................................................................................. 437 Figure 16-5. Development drilling intensity in 2003 - 2016 (meters per thousand tons)............................................................... 437 Figure 16-6. Development drilling intensity in 2014 (arrows for 2015 changes) ............................................................................ 438
Figure 16-7. Development drilling intensity in 2015 (arrows for 2016 changes) ............................................................................ 438 Figure 16-8. Shares of oil companies in horizontal drilling in 2003-2016 ....................................................................................... 439 Figure 16-9. Shares of oil companies in exploration drilling in 2003-2016..................................................................................... 439
Figure 16-10. Shares of oil companies in producing (active) well stock in 2003-2016 ................................................................... 440 Figure 16-11. Shares of oil companies in well servicing operations in 2003-2016 ......................................................................... 440 Figure 16-12. Well servicing operations intensity and well stock by company in 2016 .................................................................. 441 Figure 16-13. Shares of oil companies in workover operations in 2003-2016 ............................................................................... 441
Figure 16-14. Workover jobs and well stock by company in 2016 ................................................................................................. 442 Figure 16-15. Shares of oil companies in artificial lift optimizations in 2003-2016 ........................................................................ 442 Figure 16-16. Shares of oil companies in well bore stimulations in 2003-2016 ............................................................................. 443 Figure 16-17. Shares of oil companies in hydraulic fracturing at old wells in 2004-2016 ............................................................... 443 Figure 16-18. Shares of oil companies in water injection in 2003-2016......................................................................................... 444
Figure 16-19 a. Revenue of largest oil and gas companies in Russia in 1st
H 2017 and 1st
H 2016 (ruble bln and $ bln) ................ 445 Figure 16-19 b. Profit of largest oil and gas companies in Russia in 1
st H 2017 and 1
st H 2016 (ruble bln and $ bln) ..................... 445
Figure 16-19 b. CAPEX of largest oil and gas companies in Russia in 1st
H 2017 and 1st
H 2016 (ruble bln and $ bln).................... 445 Figure 16-20. Rosneft’s oil production 2001- 2016* as per the company report (mln tons) ......................................................... 446 Table 16-21. Summary of production activities of Rosneft (incl. TNK-BP and Bashneft) in 2006-2016 .......................................... 447 Figure 16-22. Rosneft’s oil production 2003- 2016 (mln tons) ...................................................................................................... 448
Figure 16-23a. Change in Rosneft’s oil production by regions in 1st
H 2017 to 1st
H 2016 (thousand tons) ................................... 448 Figure 16-23. Change in Rosneft’s oil production by regions in 2016 to 2015 (thousand tons) ..................................................... 449 Figure 16-24. Change in Rosneft’s oil production by regions in 2015 to 2014 (thousand tons) ..................................................... 449 Figure 16-25. Rosneft’s daily oil production by month in 2014-June 2017 (thousand tons a day monthly) .................................. 450

REnergyCO Russian Upstream and Oilfield Services 2017 - UPDATE
REnergyCO Strategy and market research + 1 905 205 1094 www.renergyco.ca FSU Energy Markets [email protected]
Figure 16-26. Rosneft’s development drilling in 2003-2016 (million meters) ................................................................................ 450
Figure 16-27a. Change in Rosneft’s development drilling in 1st
H 2017 to 1st
H 2016 (thousand meters) ..................................... 451 Figure 16-27. Change in Rosneft’s development drilling in 2016 to 2015 (thousand meters) ....................................................... 451 Figure 16-28. Change in Rosneft’s development drilling in 2015 to 2014 (thousand meters) ....................................................... 452
Figure 16-29. 2D and 3D Seismic in Rosneft in 2005 - 2016........................................................................................................... 453 Figure 16-30. Revenue, net income and CAPEX of Rosneft per 1 ton of produced oil 2003-2016 (US GAAP and IFRS $/t) ............ 454 Table 16-31. Revenue, net income and CAPEX of Rosneft in 2005-2016 (millions of US dollars) ................................................... 455 Figure 16-32. Rosneft’s drilling and equipment costs in 2004 -2016 (millions of US dollars) .................................................................................. 456 Table 16-33. Summary of production activities of Rosneft legacy assets in 2006-2016 ................................................................. 457 Figure 16-34. Production from the pre-acquisition Rosneft assets by region in 2003- 2016 (mln of tons) .................................... 458
Figure 16-35a. Change in production from Rosneft (excl TNK-BP) by region in 1st
H 2017 to 1st
H 2016 (thousand tons) ............. 458 Figure 16-35. Change in production from Rosneft (excl TNK-BP) by region in 2016 to 2015 (thousand tons) ............................... 459 Figure 16-36. Change in production from Rosneft (excl TNK-BP) by region in 2015 to 2014 (thousand of tons) ........................... 459
Figure 16-37. Rosneft’s (excl TNK-BP) daily oil production by month in 2014 - June 2017 (thousand tons a day monthly) ........... 460 Figure 16-38. Development drilling footage by Rosneft by region in 2003-2016 (million meters) ................................................. 461
Figure 16-39. Change in development drilling footage by Rosneft by region in 1st
H 2017 to 1st
H 2016 (thousand meters) ......... 461 Figure 16-39. Change in development drilling footage by Rosneft by region in 2016 to 2015 (thousand meters)......................... 461 Figure 16-40. Change in development drilling footage by Rosneft by region in 2015 to 2014 (thousand meters)......................... 462 Figure 16-41. Well servicing crew hours by region in Rosneft in 2003-2016 (thousand hours) ..................................................... 462 Figure 16-42. Workover crew hours by region in Rosneft in 2003-2016 (thousand hours) ............................................................ 463 Figure 16-43. Estimated daily flows from drilling and fracs by key Rosneft regions in 2010, 2012,2014- 2016 (tons a day of
incremental flow) ................................................................................................................................................................. 464 Figure 16-44. TNK-BP oil production 2003- 2011 as reported by the company (mln tons) ............................................................ 465 Table 16-45. Summary of production activity of TNK-BP in 2006-2016 ........................................................................................ 465 Figure 16-46. Rosneft (TNK-BP) oil production by region in Russia in 2003-2016 (million tons) .................................................... 466
Figure 16-47. Change in Rosneft (TNK-BP assets) oil production by region in Russia in 1st
H 2017 to 1st
H 2016 (thousand tons) .............................................................................................................................................................................................466
Figure 16-47. Change in Rosneft (TNK-BP assets) oil production by region in Russia in 2016 to 2015 (thousand tons) ................. 466 Figure 16-48. Change in Rosneft (TNK-BP assets) oil production by region in Russia in 2015 to 2014 (thousand tons) ................. 467 Figure 16-49. Ro sneft’s (T NK -BP assets) daily oil production by month in 2014-June 2017 (thousand tons a day monthly) ......... 467 Figure 16-50. Development drilling by TNK-BP by region in 2003-2016 (millions of meters) ........................................................ 468
Figure 16-51. Change in development drilling by Rosneft (TNK-BP) by region in 1st
H 2017 to 1st
H 2016 (thousand meters) ....... 469 Figure 16-51. Change in development drilling by Rosneft (TNK-BP) by region in 2016 to 2014 (thousand meters)....................... 469 Figure 16-52. Well servicing crew hours by region in TNK-BP in 2003-2016 (thousand hours) ...................................................... 470 Figure 16-53. Workover crew hours by region in TNK-BP in 2003-2016 (thousand hours) ............................................................ 470 Figure 16-54. Estimated daily flows from various activities by key TNK-BP regions in 2010, 2012, 2014- 2015 (tons a day of
incremental production) ...................................................................................................................................................... 471
Figure 16-55 2D and 3D seismic in TNK-BP in 2007-2012 .............................................................................................................. 471 Figure 16-56. Key financial indices of TNK-BP* per 1 ton of oil in 2003-2012 ................................................................................ 472 Table 16-57. Revenue, net profit and CAPEX of TNK-BP in 2004-2012 (millions of US dollars) ...................................................... 472 Figure 16-58. TNK-BP's drilling and equipment expenses in 2001-2013 (millions of US dollars) .......................................................................... 472 Figure 16-59. Bashneft oil production 2002- 2016 (mln tons) ....................................................................................................... 473
Table 16-60. Summary indices of production activity of Bashneft in 2006-2016 ........................................................................... 474 Figure 16-61. Crude production by Bashneft by region in 2003-2015 (million tons) ..................................................................... 474
Figure 16-62a. Change in crude production by Bashneft by region in 1st
H 2017 to 1st
H 2016 (thousand tons) ........................... 475
Figure 16-62. Change in crude production by Bashneft by region in 2016 to 2014 (thousand tons) ............................................. 475
Figure 16-63. Bashneft daily oil production by month in 2014- June 2017 (thousand tons a day monthly) ................................. 476 Figure 16-64. Development drilling by Bashneft by region in 2003-2016 (thousand meters) ........................................................ 476
Figure 16-65a. Change in Development drilling by Bashneft by region in 1st
H 2017 to 1st
H2016 (thousand meters) .................. 477 Figure 16-65. Change in Development drilling by Bashneft by region in 2016 to 2014 (thousand meters) ................................... 477 Figure 16-66. Well servicing crew hours by region in Bashneft in 2003-2016 (thousand hours) ................................................... 478 Figure 16-67. Workover crew hours by region in Bashneft in 2003-2016 (thousand hours) .......................................................... 478 Figure 16-68. Estimated daily flows from new wells and fracs by key Bashneft regions in 2010, 2012, 2014 - 2016 (tons a day)
.............................................................................................................................................................................................479 Figure 16-69. 3D and 2D seismic by Bashneft in 2008-2015 .......................................................................................................... 479 Figure 16-70. Revenue and net income of Bashneft in 2002-2016 in $ per 1 ton of produced oil ................................................. 479 Table 16-71. Revenue, profit and CAPEX of Bashneft in 2006-2016 (mln USD).............................................................................. 480 Figure 16-72. Bashneft CAPEX breakdown in 2014-2015 (RUR bln) ............................................................................................... 480
Figure 16-73. Bashneft drilling and equipment expenses in 2001-2016 (millions of US dollars) ........................................................................... 481 Figure 16-74. LUKOIL oil production 2001- 2016 (million tons) ..................................................................................................... 481 Table 16-75. LUKOIL production activity in 2006-2016 .................................................................................................................. 482 Figure 16-76. LUKOIL's oil production by region in Russia in 2003-2016 (million tons) ................................................................. 483
Figure 16-77. Change in LUKOIL's oil production by region in Russia in 1st
H 2017 to 1st
H 2016 (thousand tons) ........................ 483 Figure 16-77. Change in LUKOIL's oil production by region in Russia in 2014-2016 (thousand tons) ............................................ 484

REnergyCO Russian Upstream and Oilfield Services 2017 - UPDATE
REnergyCO Strategy and market research + 1 905 205 1094 www.renergyco.ca FSU Energy Markets [email protected]
Figure 16-78. LUKOIL’s daily oil production by month in 2014- June 2017 (thousand tons a day monthly) .................................. 484 Figure 16-79. Development drilling by LUKOIL by region in 2003-2016 (millions of meters) ......................................................... 485
Figure 16-80a. Change in Development drilling by LUKOIL by region in the 1st
H 2017 to 1st
H 2016 (thousand meters).............. 486 Figure 16-80. Change in Development drilling by LUKOIL by region in 2016 to 2014 (thousand meters) ...................................... 486 Figure 16-81. Well servicing crew hours by region in LUKOIL in 2003-2016 (thousand hours) ...................................................... 487
Figure 16-82. Workover crew hours by region in LUKOIL in 2003-2016 (thousand hours) ............................................................ 487 Figure 16-83. Estimated daily flows from new wells and fracs by key LUKOIL regions in 2010, 2012, 2014- 2016 (tons a day)..488 Figure 16-84. Reported seismic exploratory works, carried out by LUKOIL in Russia in 2002-2016 ............................................... 488 Figure 16-85. Key financial indices of LUKOIL in 2001-2016 per 1 ton crude (US GAAP and IFRS $/t) ........................................... 489 Table 16-86. Revenue, net profit and CAPEX of LUKOIL in 2006-2016 (millions of US dollars) ...................................................... 489 Figure 16-87. Reported drilling and equipment expenses of LUKOIL in 2004-2016 (millions of US dollars)................................... 490 Figure 16-88. Surgutneftegas oil production 2001- 2016 (million tons) ........................................................................................ 491 Table 16-90. Summary production activity of Surgutneftegas in 2006-2016 ................................................................................. 491 Figure 16-89. Surgutneftegas oil production by region in Russia in 2003-2016 (million tons) ....................................................... 492
Figure 16-80a. Surgutneftegas daily oil production by month in 2014- June 2017 (thousand tons a day monthly) ...................... 492 Figure 16-91. Development drilling by Surgutneftegas by region in 2003-2016 (million meters) .................................................. 493 Figure 16-92. Well servicing crew hours by region in Surgutneftegas in 2003-2016 (thousand hours) .......................................... 493 Figure 16-93. Workover crew hours by region in Surgutneftegas in 2003-2016 (‘000 hours) ........................................................ 494 Figure 16-94. Estimated daily flows from various activities by key Surgutneftegas regions in 2016 (tons a day) .......................... 494 Figure 16-95. Reported seismic exploratory works, carried out by Surgutneftegas in 2005-2016P ............................................... 495 Figure 16-96. Revenue, income and CAPEX of Surgutneftegas in 2001-2016 per 1 ton of produced oil ........................................ 496 Table 16-97. Key financial* indices of Surgutneftegas in 2004-2016 (millions of US dollars) ......................................................... 496 Figure 16-98. Drilling and equipment expenses of Surgutneftegas in 2001-2016 (millions of US dollars) ..................................... 497
Figure 16-99. Gazpromneft oil production 2001- 2016 (mln ton) .................................................................................................. 498 Figure 16-100. Gazpromneft oil production from JV 2004- 2016 (mln tons) ................................................................................. 498 Table 16-101. Summary indices of production activity of Gazpromneft in 2006-2016 .................................................................. 499 Figure 16-102. Gazpromneft oil production by region in 2003-2016 (million tons) ....................................................................... 499
Figure 16-103a. Change in Gazpromneft oil production by region in 1st
H 2017 to 1st
H 2016 (thousand tons) ............................ 500 Figure 16-103. Change in Gazpromneft oil production by region in 2016 to 2014 (thousand tons) .............................................. 500 Figure 16-104. Gazpromneft daily oil production by month in 2014 – June 2017 (thousand tons a day monthly) ....................... 501 Figure 16-105. Development drilling by Gazpromneft by region in 2003-2016 (million meters) ................................................... 501
Figure 16-106a. Change in Development drilling by Gazpromneft’s legacy assets by region in 1st
H 2017 to 1st
H 2016 (thousand meters) ................................................................................................................................................................................ 502
Figure 16-106. Change in Development drilling by Gazpromneft’s legacy assets by region in 2016 to 2014 (thousand meters) 502 Figure 16-107. Well servicing crew hours by region in Gazpromneft in 2003-2016 (thousand hours) ........................................... 503 Figure 16-108. Workover crew hours by region in Gazpromneft in 2003-2016 (thousand hours) ................................................. 503 Figure 16-109. Estimated daily flows from new wells and fracs by key Gazpromneft regions in 2010, 2012, 2014 - 2016 (tons a
day) ...................................................................................................................................................................................... 504
Figure 16-110. Reported seismic exploratory works, carried out by Gazpromneft in 2002-2016 .................................................. 505 Figure 16-111. Financial indices of Gazpromneft in 2006-2016 per 1 ton of produced oil ............................................................. 505 Table 16-112. Revenue, net income, CAPEX* and debt of Gazpromneft in 2005-2016 (millions of US dollars) ............................. 505 Figure 16-113. Gazpromneft CAPEX breakdown in 2014-2016 (bln RUR) ........................................................................................................ 506 Figure 16-114. Gazpromneft – NNG drilling and equipment expenses in 2004-2016 (millions of US dollars) .................................................... 507
Figure 16-115. Tatneft oil production 2001- 2016 (mln tons) ........................................................................................................ 507 Table 16-116. Summary indices of production activity of Tatneft in 2006-2016 ........................................................................... 508 Figure 16-117. Tatneft daily oil production by month in 2014- June 2017 (thousand tons a day monthly) .................................. 508
Figure 16-118. Development drilling by Tatneft by region in 2003-2016 (thousand meters) ........................................................ 509
Figure 16-119. Well servicing crew hours by region in Tatneft in 2003-2016 (‘000 hours) ............................................................ 509 Figure 16-120. Workover crew hours by region in Tatneft in 2003-2016 (‘000 hours) .................................................................. 510 Figure 16-121. Estimated daily flows from various activities in Tatneft in 2010- 2016 (tons a day) ............................................... 510
Figure 16-122. Financial indices of Tatneft in 2002-2016 per 1 ton of produced oil ($ per ton) .................................................... 511 Table 16-123. Key financial* indices of Tatneft in 2007-2016 (US GAAP millions of US dollars) .................................................... 511 Figure 16-124. Tatneft drilling and equipment expenses in 2004-2016 (millions of US dollars) ............................................................................ 512 Figure 16-125. Slavneft oil production 2001- 2016 (mln tons) ...................................................................................................... 513 Table 16-126. Summary indices of production activity of Slavneft in 2006-2016 ......................................................................... 513 Figure 16-127. Slavneft’s daily oil production by month in 2014 – June 2017 (thousand tons a day monthly) ............................. 514 Figure 16-128. Development drilling by Slavneft by region in 2003-2016 (millions of meters) ...................................................... 514 Figure 16-129. Well servicing crew hours by region in Slavneft in 2003-2016 (‘000 hours)........................................................... 515 Figure 16-130. Workover crew hours by region in Slavneft in 2003-2016 (‘000 hours) ................................................................. 515
Figure 16-131. Estimated daily flows from various activities by key Slavneft regions in 2010-2016 (tons a day) .......................... 515 Figure 16-132. 3D and 2D seismic for Slavneft in 2002-2016 ........................................................................................................ 516 Figure 16-133. Slavneft revenue and net income in USD per 1 ton of produced oil in 2002-2016 ................................................ 516 Table 16-134. Sales, net income and CAPEX* of Slavneft in 2005-2016 (millions of US dollars) .................................................... 517 Figure 16-135. Slavneft drilling and equipment expenses in 2004-2016 (millions of US dollars) .......................................................................... 517

REnergyCO Russian Upstream and Oilfield Services 2017 - UPDATE
REnergyCO Strategy and market research + 1 905 205 1094 www.renergyco.ca FSU Energy Markets [email protected]
Figure 16-136. Russneft oil production 2002- 2016 (mln tons) ...................................................................................................... 518 Table 16-137. Summary indices of production activity of Russneft in 2006-2016 ......................................................................... 519 Figure 16-138. Russneft and Neftfisa oil production by region in 2003-2016 (million tons) .......................................................... 519 Figure 16-139. Russneft and Neftisa daily oil production by month in 2014- June 2017 (thousand tons a day monthly).............. 520 Figure 16-140. Development drilling by Russneft by region in 2003-2016 (thousand meters) ...................................................... 520 Figure 16-141. Well servicing crew hours by region in Russneft in 2003-2016 (‘000 hours) .......................................................... 521
Figure 16-142. Workover crew hours by region in Russneft in 2003-2016 (‘000 hours) ................................................................ 521 Figure 16-143. Estimated daily flows new wells and fracs by key Russneft regions in 2010, 2012, 2014 - 2016 (tons a day) ........ 522 Figure 16-144. Revenue and CAPEX of Russneft in USD per 1 ton of produced oil in 2006-2016 .................................................. 522 Table 16-145. Revenue and Capex* indices of Russneft in 2006-2016 (millions US dollars) .......................................................... 523 Figure 16-146. Russneft drilling and equipment expenses in 2004-2016 (millions of US dollars) ......................................................................... 523 Figure 16-147. Regional gas production by Gazprom in 2003-2016 (bcm) .................................................................................... 524 Figure 16-148. Gazprom crude oil and condensate production by region in 2003-2016 (mln tons) .............................................. 525 Figure 16-149a. Change in Gazprom crude oil and condensate production by region in 2016 to 2015 (thousand tons) .............. 525 Figure 16-149. Change in Gazprom crude oil and condensate production by region in 2016 to 2015 (thousand tons) ................ 525
Figure 16-150. Change in Gazprom crude oil and condensate production by region in 2015 to 2014 (thousand tons)................. 526 Figure 16-151. Gazprom’s daily oil and condensate production in 2014 – June 2017 (thousand tons a day monthly) .................. 526 Table 16-152. Summary indices of production activity of Gazprom in 2005-2014 excluding Gazpromneft ................................... 526 Figure 16-153. Gazprom total drilling by region in 2014-2016 (thousand meters) ........................................................................ 527 Figure 16-154. 3D and 2D seismic for Gazprom in 2005-2016 ....................................................................................................... 527 Figure 16-155. Financials of Gazprom in 2001-2016 per ton of oil equivalent ($ per TOE) ............................................................ 528 Table 16-156. Revenue and CAPEX of Gazprom in 2006- 2016 (millions of US dollars) ................................................................. 528 Figure 16-157. NOVATEK liquids production in 2006-2016 (thousand tons) ................................................................................. 529 Figure 16-158. NOVATEK daily oil and condensate production in 2014 – June 2017 (thousand tons a day monthly) ................... 530 Figure 16-159. NOVATEK gas production in 2007-2016 (bcmpa)................................................................................................... 530 Figure 16-160. NOVATEK drilling in 2009-2016 (thousand meters) ............................................................................................... 531 Figure 16-161. 3D and 2D seismic for NOVATEK in 2008-2015 ...................................................................................................... 531 Figure 16-162. Revenue of NOVATEK in 2011-2016 ($ per tcm and ton) ....................................................................................... 532 Table 16-163. Revenue and CAPEX of NOVATEK in 2007-2016 (millions of US dollars) ................................................................. 532 Figure 17-1 Estimated number of days in drilling by type in 2003-2016 (thousand days) ............................................................. 533 Figure 17-2 Estimated number drilling rigs by type in 2003-2016 (rigs) ........................................................................................ 533 Figure 17-3 Illustration of fleet structure in Russia in 2013-2015 (active, in mobilization and construction) ................................ 534 Table 17-4 Key players in land drilling market in Russia and their capacities in 2016 .................................................................... 535
Figure 17-5 Estimated Russian rig fleet structure by hook load ..................................................................................................... 535 Figure 17-6 Sidetracking rigs estimates in 2003-2016 ................................................................................................................... 536 Figure 17-7 Estimated number of active workover rigs in Russia by region in 2003-2016 ............................................................. 536 Figure 17-8 Number of well servicing and workover crews in 2003-2016 (crews) ......................................................................... 537 Figure 17-9 Costs of one crew-hour (average well servicing/workover) by companies in 2006-2016 in $ per hour ...................... 537 Figure 17-10 Cost of one crew-hour on workover and well servicing by companies in 2016 in $ per hour ................................... 538 Figure 17-11 Apparent cost per well-servicing job in 2003-2015 (thousands) ............................................................................... 538 Figure 17-12 Apparent cost per workover job in 2003-2016 (thousands) ..................................................................................... 539 Table 17-13 Seismic and logging crews by largest companies in 2014........................................................................................... 540 Table 18-1 Key land drilling service contractors and their shares in footage of large oil and gas companies in 2016 .................... 543 Figure 18-2 Key oil field service companies’ market shares estimate for 2010 ............................................................................. 544
Figure 18-3 Key oil field service companies’ market shares estimate for 2014 ............................................................................. 544 Figure 18-4 Key oil field service companies’ market shares estimate for 2016 ............................................................................. 545 Figure 19-1 Own subsidiaries share in the ‘in-house service providers’ segment in 2016 ............................................................. 547
Figure 19-2 Surgutneftegas share in key segments of OFS market in 2008-2016 (shares based on physical activity).................... 548 Table 19-3 Capacities of Surgutneftegas ........................................................................................................................................ 549 Figure 19-4 Horizontal wells and average depth drilled by Surgutneftegas in KHMAD in 2002-2016 ............................................ 549 Figure 19-5 Hydro fracturing operations by Surgutneftegas 2003-2016 (number of jobs) ............................................................ 550
Figure 19-6 Apparent daily flows from hydro fracturing operations by Surgutneftegas 2004-2016 (incremental tons a day) ....... 551 Figure 19-7 Sidetracking operations at Surgutneftegas in 1998-2013 and estimates for 2014-2015 ............................................. 551 Figure 19-8 Effectiveness of coiled tubing units use at Surgutneftegas 1999- 2004 ...................................................................... 552 Figure 19-9 Historical revenue of companies included in Rosneft by September 2016 (RUR bln) ................................................. 554 Figure 19-10 Rosneft share in key segments of OFS market in 2008-2016 (shares based on physical activity) ............................. 554 Figure 19-11 Rosneft and TNK-BP share in key segments of OFS market in 2008-2016 (shares based on physical activity) .......... 555 Figure 19-12 Rosneft (including TNK-BP and Bashneft) share in key segments of OFS market in 2008-2016 (shares based on
physical activity)................................................................................................................................................................... 555 Figure 19-13 TNK-BP share in key segments of OFS market in 2008-2016 (shares based on physical activity) .............................. 556
Table 19-14 RN-Burenie Capacities and location of crews prior to 2014 acquisitions and in 2015-2016 ....................................... 558 Figure 19-15 Rosneft drilling crews expansion in 2014 (drilling and sidetracking crews)............................................................... 558 Figure 19-16 RN-Burenie drilling in 2006-2016Est (thousand meters)........................................................................................... 559 Table 19-17 Condensed income statement of OOO RN-Burenie for 2008-2016 (thousand USD) .................................................. 560

REnergyCO Russian Upstream and Oilfield Services 2017 - UPDATE
REnergyCO Strategy and market research + 1 905 205 1094 www.renergyco.ca FSU Energy Markets [email protected]
Figure 19-18 Orenburg Drilling Company drilling footage and completed wells in 2006-2013 and estimates for 2015 ................. 560 Table 19-19 Orenburg drilling company capacities ........................................................................................................................ 561 Table 19-20 Condensed income statement of OOO Orenburg Drilling Company for 2006-2015 (thousand USD) ......................... 562 Table 19-21 ZAO Udmurtneft-Burenie capacities .......................................................................................................................... 562 Table 19-22 Condensed income statement of ZAO Udmurtneft-Burenie for 2007-2016 (thousand USD) ..................................... 563 Table 19-23 Condensed income statement of OOO RN-Service for 2008-2016 (thousand USD) ................................................... 564 Table 19-24 Mamontovsky KRS capacities in 2008-2015 ............................................................................................................... 564
Figure 19-25 MKRS workovers in 2005-2016 est (jobs) ................................................................................................................. 565 Figure 19-26 MKRS share in crew numbers in Yuganskneftegas 2010 and 2015 (crews) ............................................................... 565 Table 19-27 Condensed income statement of Mamontovsky KRS for 2006-2015 (thousand USD) ............................................... 565 Table 19-28 Condensed income statement of ZAO KRS 2007-2016 (thousands USD) ................................................................... 566 Figure 19-29 Condensed income statement of URS Samara in 2007-2016 in thousand USD ........................................................ 566 Figure 19-30 Fracturing jobs by PNO in 2008-2014 (jobs) ............................................................................................................. 567 Figure 19-31 PNO wireline operations and revenue per operation 2008-2014 (jobs and revenue per job in thousand USD) ....... 568 Table 19-32 Condensed income statement of OAO PNO 2006-2015 (thousands USD) ................................................................. 568 Table 19-33 Nizhnevartovskburneft capacities .............................................................................................................................. 568
Table 19-34 Condensed income statement of ZAO Nizhnevartovskburneft for 2007-2016 in thousand USD .............................. 569 Table 19-35 Orenburgburneft capacities ....................................................................................................................................... 570 Table 19-36 Condensed income statement of Orenburgburneft for 2007-2016 (thousand USD).................................................. 570 Table 19-37 OOO Chernogorservice capacities .............................................................................................................................. 570 Figure 19-38 OOO Chernogorservice servicing, workover and other activities in 2010-2012 ........................................................ 571 Table 19-39 Condensed income statement of OOO Chernogornefteservice in 2006-2015 (thousands of USD) ............................ 571 Table 19-40 Condensed income statement of OOO NPRS-1 in 2007-2016 in thousands of US dollars ......................................... 572 Table 19-41 Condensed income statement of OOO NPRS in 2003-2005 in thousands of USD ..................................................... 572 Table 19-42 Condensed income statement of OOO UKRS in 2006-2015 in thousands of USD ..................................................... 572
Table 19-43 Capacities of Beylorussian UPNP and KRS .................................................................................................................. 573 Table 19-44 Condensed income statement of Byelorussian UPNP and KRS for 2007-2016 in thousand USD ................................ 573 Figure 19-45 Global revenue of Trican 2006-2015 (millions CAD) ................................................................................................. 574 Figure 19-46 Condensed income statement of TRICAN’s International segment for 2005-2014* (mln CAD) ................................ 575
Table 19-47 Condensed income statement of TRICAN International segment for 2005-1st
H 2015 (CAD translated into mln USD) .............................................................................................................................................................................................575
Table 19-48 Capacities of TRICAN in CIS in 2004-2014 .................................................................................................................. 576 Table 19-49 Capacities and activity levels of TRICAN in Russia in 2011-2015 ................................................................................ 576 Figure 19-50 Revenue per type of job by Trican International segment in 24 quarters in 2008-2014 (CAD millions) .................... 577
Figure 19-51 Revenue per job by TRICAN in 8 quarters of 2008-2009 and in 2010- 1st
H 2015 (thousand CAD and USD) ............. 577 Table 19-52 Condensed income statement of TRICAN for 2007-2016 (RAS in thousand USD) ...................................................... 578 Table 19-53 TARGIN Capacities ...................................................................................................................................................... 579 Figure 19-54 Bashneft Nefteservice drilling footage in 2009-2013 (thousand meters) .................................................................. 579 Figure 19-55 Bashneft Nefteservice workovers/ servicing and coiled tubing in 2009-2013 (thousand jobs) ................................. 580 Figure 19-56 Bashneft Nefteservice sidetracking in 2009-2013 (jobs) ........................................................................................... 580 Table 19-57 Consolidated revenue and net income of TARGIN in 2013-2014 (RAS $ mln) ............................................................ 581 Table 19-58 Condensed income statement of BurKan for 2003-2007 ........................................................................................... 581 Table 19-59 Condensed income statement of Bashneft-Burenie (new name Targin-Burenie) for 2008-2016 (thousand USD)...581 Table 19-60 Condensed income statement of UFA UPKRS for 2007-2016 (thousand USD) ........................................................... 582 Table 19-61 Condensed income statement of BURS for 2007-2013 (thousand USD) .................................................................... 583
Table 19-62 Equipment servicing activities of Neftekamsk NZO and Oktyabrsk NZO in 2009-2012 ............................................... 583 Table 19-63 Condensed income statement for Neftekamsky Zavod Neftepromyslovogo Oborudovania for 2007-2013 and TARGIN
Mechonoservice in 2014-2016 (thousand USD) ................................................................................................................... 583
Table 19-64 Condensed income statement for Oktyabrsky Zavod Neftepromyslovogo Oborudovania for 2007-2012 (thousand USD) ..................................................................................................................................................................................... 583
Table 19-65 Capacities of Neftekamsk UBR .................................................................................................................................. 584 Table 19-66 Condensed income statement of Neftekamsk UBR for 2003-2008 in thousands USD ............................................... 584 Figure 19-67 LUKOIL share in key segments of OFS market in 2008-2016 (shares based on physical activity) .............................. 584 Table 19-68 Condensed income statement of Russneft-Burenie for 2007-2012 in thousands USD ............................................... 585 Figure 19-69 Apparent Russneft-Burenie revenue per meter and footage in 2007-2013 .............................................................. 585 Figure 19-70 Slavneft subsidiaries apparent drilling footage in 2007-2014 (thousand meters) ..................................................... 586 Figure 19-71 Slavneft share in key segments of OFS market in 2008-2016 (shares based on physical activity) ............................. 587 Figure 19-72 Megionskoe UBR drilling footage by client groups in 2006-2010 (thousand meters) ............................................... 587 Table 19-73 Megionskoe UBR capacities ....................................................................................................................................... 588 Table 19-74 Condensed income statement of OOO Megionskoe UBR for 2007-2016 (thousand USD) ......................................... 588 Table 19-75 Slavneft-Obneftegasgeologia OFS activities in 2008 -2011 ........................................................................................ 588
Table 19-76 Condensed income statement of OAO Slavneft-Obneftegazogeologiya for 2004-2012 (thousand USD) ................... 589 Figure 19-77 Revenue of OAO Slavneft-Obneftegazogeologiya attributed to exploration drilling in 2004-2011 (mln USD) .......... 589 Table 19-78 Condensed income statement of OOO Obgeologiya for 2010-2011 (thousand USD) ................................................ 589
REnergyCO Russian Upstream and Oilfield Services 2017 - UPDATE
REnergyCO Strategy and market research + 1 905 205 1094 www.renergyco.ca FSU Energy Markets [email protected]
Table 19-79 OAO Slavneft-Megionneftegazgeologiya capacities ................................................................................................... 590 Table 19-80 Operating data of OAO Slavneft-Megioneftegazgeologiya for 2005- 2011 ................................................................ 590 Table 19-81 OAO Slavneft-Megionneftegazgeologiya activities in three quarters of 2010 ............................................................ 590 Table 19-82 Condensed income statement of OAO Slavneft-Megionneftegazgeologiya for 2005-2012 (thousand USD) .............. 590 Table 19-83 Condensed income statement of OOO Megion Geologiya for 2010-2016 (thousand USD) ....................................... 591 Table 19-84 Condensed income statement of Baikitskaya Expedititsia for 2007-2016 (thousand USD) ........................................ 591 Figure 19-85 Gazpromneft share in key segments of OFS market in 2008-2016 (shares based on physical activity)..................... 592 Table 19-86 Revenue and net income of OOO Gazpromneft-NefteService in 2008-2009 in thousands USD ................................ 593
Figure 19-87 Gazpromneft-Nefteservice subsidiaries share in revenue in 2008 and 2010 ............................................................ 593 Table 19-88 Capacities of OAO Gazpromneft-Noyabrskneftegeophysica ...................................................................................... 594 Figure 19-89 OAO Gazpromneft-Noyabrskneftegeophysica revenue by client in 2010 (%) ........................................................... 594 Figure 19-90 OAO Gazpromneft-Noyabrskneftegeophysica revenue from logging and perforation in 2006-2011 and 9 months
2010 and 9 months 2011 ..................................................................................................................................................... 594 Table 19-91 Condensed income statement of OAO Gazpromneft- Noyabrskneftegeophysica in 2006- 2015 in thousands USD 595 Figure 19-92 Gazflot drilling footage in 2005-2009 (meters) ......................................................................................................... 597 Table 19-93 Condensed income statement of OOO Gazflot for 2007-2016 (thousand USD) ........................................................ 598 Table 19-94 Condensed income statement of OOO Georesurs for 2008-2016 in thousand USD .................................................. 599
Table 19-95 Condensed income statement of OOO Gazprom Geophysica for 2005-2009 in thousand USD ................................. 599 Table 19-96 Georesurs seismic activity in 2011 ............................................................................................................................. 599 Figure 19-97 OOO INK-Service drilling in 2009-2015 (wells drilled) ............................................................................................... 600 Table 19-98 Condensed income statement of OOO INK-Service for 2009-2016 in thousand USD ................................................. 600 Figure 20-1 Estimated large oilfield services companies’ share in “International providers segment” in 2016 ............................. 601 Figure 20-2 Schlumberger revenue by geo-region breakdown in 2007-2016 (millions US) ........................................................... 603 Figure 20-3 Schlumberger revenue 2009-2016 by oilfield segments (millions US) ........................................................................ 604 Figure 20-4 Estimated Schlumberger revenue in Russia in 1999-2016 (billions US) ...................................................................... 605 Figure 20-5 Estimated Schlumberger revenue breakdown of by key assets acquired in Russia in 2012 ........................................ 606
Table 20-6 Schlumberger capacities .............................................................................................................................................. 606 Table 20-7 Schlumberger and EDC 2010 deal as described by the parties ..................................................................................... 606 Table 20-8 Condensed income statement of OOO Schlumberger Vostok in 2007-2016 (thousands of USD) ............................... 607 Table 20-9 Capacities of the Petroalliance Company ..................................................................................................................... 608 Figure 20-10 Number of sidetracking operations performed by Petroalliance in 2002-2007......................................................... 608 Table 20-13 Condensed income statement of OOO SK Petroalliance in 2008-2016 (thousands of USD) ..................................... 609 Table 20-11 Condensed income statement of OOO TEKHGEOSERVICE in 2006-2016 (thousands of USD) ................................... 609 Table 20-12 Condensed income statement of OOO MEGION TAMPONAZHNOE UPRAVLENIE in 2006-2016 (thousands of USD)
.............................................................................................................................................................................................609
Table 20-14 Condensed income statement of Tyumenpromgeophysica in 2007-2016 (thousands of USD) ................................. 610 Figure 20-15 Condensed income statement of Schlumberger Technological Company in 2007-2016 in thousands USD .............. 611 Figure 20-16 Condensed income statement of OOO Firma Radius-Service in 2007-2016 in thousands USD................................. 612 Figure 20-17 Condensed income statement of OOO Service Center EPU in 2008-2016 in thousands USD ................................... 612 Figure 20-18 Halliburton oilfield revenues by two segments in 2006-2016 (millions USD) ............................................................ 613 Figure 20-19 Halliburton oilfield revenues by regions in 2006-2016 (million USD) ........................................................................ 614 Figure 20-20 Halliburton oilfield revenues by segments in Europe/Africa/CIS region in 2006-2015 (million USD) ........................ 614 Figure 20-21 Operating income of Halliburton in Europe/Africa/CIS in 2008 - 2015 (mln USD) .................................................... 615 Figure 20-22 Approximate revenue of Halliburton in Russia in 2004-2016 (mln USD) ................................................................... 616 Table 20-23 Estimated capacities of Halliburton ........................................................................................................................... 617 Figure 20-24 Baker Hughes regional revenues globally in 2006-2016 ($ mln) ............................................................................... 619
Figure 20-25 Baker Hughes estimated revenues in Russia and Caspian region in 2002-2016 (millions USD) ................................. 620 Figure 20-26 Baker Hughes possible breakdown of revenues between Russia and Caspian region in 2009-2010 (millions USD)620 Figure 20-27 BJ revenues in Russia in 2003-2009 and loss in 2007-2009 (millions USD) ............................................................... 621
Table 20-28 Condensed income statement of OOO Orenbrugneftegeophysica in 2007-2016 in thousands USD ......................... 622
Table 20-29 Condensed income statement of OOO OIlpump Service in 2008- 2016 in thousands USD ........................................ 622 Figure 20-30 Weatherford revenues by region in 2007-2016 ($ mln) ............................................................................................ 624 Figure 20-31 Weatherford operating margin by region and share in total in 2011-2015 (%) ........................................................ 625
Figure 20-32 Estimates of TNK-BP assets contribution to Weatherford revenues in Europe/West Africa/ FSU area in 2010 ($ mln) .............................................................................................................................................................................................625
Figure 20-33 TNK-BP OFS assets purchased by Weatherford revenue 2003-2013 RAS ($ mln) ..................................................... 626 Figure 20-34 TNK-BP OFS assets purchased by Weatherford net income 2003-2013 RAS ($ mln) ................................................ 626 Table 20-35 Condensed income statement of OOO Weatherford in 2012-2016 in thousands of USD ......................................... 628 Table 20-36 Condensed income statement of OOO Tekhinformservice in 2006-2013 in thousands of USD ................................ 628 Table 20-37 Condensed income statement of ZAO Neftemashvnedrenie in 2006-2014 in thousands of USD ............................. 628 Table 20-38 Condensed income statement of OOO Spetselizirovannoe Tamponazhnoe Upravlenie in 2007-2016 in thousands of
USD ...................................................................................................................................................................................... 629
Table 20-39 Oil field services capacities of KCA Deutag Ltd .......................................................................................................... 630 Table 20-40 KCA Deutag land drilling rigs location ........................................................................................................................ 631
REnergyCO Russian Upstream and Oilfield Services 2017 - UPDATE
REnergyCO Strategy and market research + 1 905 205 1094 www.renergyco.ca FSU Energy Markets [email protected]
Table 20-41 KCA Deutag drilling rigs technical description ............................................................................................................ 631 Figure 20-42 KCA Deutag revenues by segments in 2011-2016 (millions USD) ............................................................................. 632
Figure 20-42 a. KCA Deutag revenues by segments in 1st
H 2017 to 1st
H 2016 (millions USD) ..................................................... 633 Figure 20-43 KCA Deutag EBITDA by segments in 2011-2016 (millions USD) ................................................................................ 633
Figure 20-43 a. KCA Deutag EBITDA by segments in 1st
H 2017 to 1st
H 2016 (millions USD) ........................................................ 633 Figure 20-44 KCA Deutag revenue by region in 2013-2016 (millions USD) ................................................................................... 634 Figure 20-45 Condensed income statement of PeWeTe/C.A.T. Oil in 2005-2016 in millions EUR ................................................. 636 Figure 20-46 PeWeTe/C.A.T oil subsidiaries revenue in 2005-2014 (USD millions at average exchange rates) ............................ 636 Figure 20-47 Key capacities of PeWeTe /C.A.T. Oil in 2005-2016 in fracturing fleets/sidetracking rigs (end of the year) .............. 637
Figure 20-48 PeWeTe/ C.A.T. Oil revenue by segment in 2007-2016 (millions EUR) .................................................................... 638 Figure 20-49 PeWeTe/ C.A.T. Oil revenue by segment in 2014-2016 (EUR mln and USD mln) ..................................................... 639 Figure 20-50 PeWeTe/C.A.T. Oil apparent revenue per fracturing fleet and drilling rigs in 2014-2016 (USD millions) .................. 639 Figure 20-51 PeWeTe/C.A.T. Oil apparent revenue per fracturing fleet and drilling rigs in 2014-2016 (RUR thousand) ............... 639 Figure 20-52 PeWeTe/C.A.T. Oil number of jobs in 2007-2016 ..................................................................................................... 640 Figure 20-53 PeWeTe/C.A.T. Oil number of jobs and revenue per job in USD in 2012-2016 by the segments (drilling and well
service) ................................................................................................................................................................................ 641 Figure 20-54 PeWeTe/C.A.T. Oil revenues from key customers in 2005-2016 (EUR millions) ........................................................ 641 Table 20-55 Capacities of CATOBNEFT ........................................................................................................................................... 642
Table 20-56 Sidetracking crews CATOBNEFT in 2005-2015 ............................................................................................................ 642 Figure 20-57 CATOBNEFT fracturing and sidetracking jobs in 1995-2009 ...................................................................................... 643 Figure 20-58 CATOBNEFT sidetracking jobs by type in 2005-9 m 2011 ......................................................................................... 643 Table 20-59 Condensed income statement of CATOBNEFT for 2007 -2016 (thousand USD) ......................................................... 644 Figure 20-60 CAToil-Drilling drilling footage in 2012-2014............................................................................................................. 644 Table 20-61 Condensed income statement of CAToil-Drilling for 2008-2013 (thousand USD) ...................................................... 644 Table 20-62 Capacities of CATKoneft ............................................................................................................................................. 645 Figure 20-63 Hydraulic fracturing performed by CATkoneft in 1991-2009 (number of operations) .............................................. 645 Table 20-64 Condensed income statement of CATkoneft for 2007-2016 (thousand USD) ............................................................ 646
Table 20-65 Condensed income statement of CAToil-Leasing for 2008-2016 (thousand USD) ...................................................... 646 Table 20-66 Condensed income statement of CAToil-GEODATA for 2007-2009 (thousand USD) .................................................. 646 Figure 20-67 Calfrac global revenues and operating income for 2008-2016 (mln CAD) ................................................................ 647 Table 20-68 CalFrac Well Services capacity and revenue per job in 2009-2016 ............................................................................ 648 Figure 20-69 Calfrac revenue per fracturing and coiled tubing job in Russia in 12 quarters of 2013- 2016 (thousand US dollars at
average exchange rate for the period) ................................................................................................................................. 648
Table 20-70 CalFrac Well Services sales and operating revenue in Russia in 2009-2016 (mln CAD) ............................................. 649 Table 20-71 Condensed income statement of CalFrac Well Services (Russian subsidiary in RAS) for 2007-2016 (thousand USD)
.............................................................................................................................................................................................649
Figure 21-1 Estimated revenue of large Russian oilfield services in 2016 ...................................................................................... 650 Table 21-2 EDC land rigs in 2012-2015 by type of the drive .......................................................................................................... 652 Table 21-3 EDC land rigs in 2012-2013 by type hook (tons) .......................................................................................................... 652 Table 21-4 Capacities of the EDC in 2007 and 2010-2014 ..................................................................................................... 652 Figure 21-5 EDC crews in 2005-2013 ............................................................................................................................................. 653 Figure 21-6 Monthly Drilling footage of EDC in 2015- June 2017 (thousand meters) .................................................................... 653 Figure 21-7 Drilling footage of EDC in 2005- 2016 (thousand meters) ........................................................................................... 654 Figure 21-8 EDC’s drilling footage by regions in 2012 -2013.......................................................................................................... 655 Figure 21-9 EDC drilling estimates for key customers in 2006-2015 (thousand meters) ................................................................ 656 Table 21-10 EDC’s workover/well servicing job count by regions in 2012 ..................................................................................... 656 Table 21-11 EDC’s revenue and net income in 2006-2016 (million USD) ....................................................................................... 657
Figure 21-12 EDC’s Revenue structure estimates for 2005-2016 (millions USD)............................................................................ 657 Figure 21-13 Apparent EDC’s Revenue per rig in 2007-2016 (millions USD) .................................................................................. 658 Table 21-14 Condensed income statement of BKE for 2007 - 2016 in thousands USD .................................................................. 658
Table 21-15 OOO SGK assets in 2009-2012 ................................................................................................................................... 659 Table 21-16 Drilling by SGK for 2007-2016 (thousand meters) ...................................................................................................... 659 Figure 21-17 Number of vertical and horizontal wells completed by SGK in 2004-2016 (wells) .................................................... 660 Figure 21-18 Wells completed by SGK in 2009-2016 by clients (wells) .......................................................................................... 660
Figure 21-19 Sidetracks by SGK in 2011-2012 by clients (wells) .................................................................................................... 661 Table 21-20 Condensed income statement of SGK for 2008-2016 in thousands USD .................................................................... 661 Table 21-21 Condensed income statement of KRS Eurasia for 2011-2016 in thousands USD ....................................................... 661 Figure 21-22 Kogalym Well Workover jobs breakdown in 2004-2011 (jobs) ................................................................................. 662 Table 21-23 Condensed income statement of Kogalym Well Workover apparent revenues in 2009-2011 ($ thousands) ............ 662 Figure 21-24 Urai Well Workover jobs breakdown in 2004-2011 (jobs) ........................................................................................ 662 Table 21-25 Condensed income statement of Urai Well Workover in 2009-2011 (thousands) .................................................... 663 Figure 21-26 Condensed income statement of ZAO SKRS 2005-2012 thousands of dollars U. S ................................................... 663 Table 21-27 Drilling by Gazprom Burenie in 2003-2015................................................................................................................. 664
Table 21-28 Capacities of Gazprom Burenie and rig location in 2012-2016 ................................................................................... 664

REnergyCO Russian Upstream and Oilfield Services 2017 - UPDATE
REnergyCO Strategy and market research + 1 905 205 1094 www.renergyco.ca FSU Energy Markets [email protected]
Figure 21-29 Footage of Gazprom-Burenie by subsidiaries 2009-2016 (thousand meters) ........................................................... 665 Figure 21-30 Wells completed by Gazprom-Burenie by subsidiaries 2009-2016 ........................................................................... 665 Table 21-31 Condensed income statement of Gazprom Burenie for 2007-2016 in thousand USD ................................................ 666 Table 21-32 Condensed income statement of Center for Cementing Wells for 2012-2016 in thousand USD ............................... 667 Table 21-33 Condensed income statement of Center for Horizontal Drilling for 2012-2016 in thousand USD .............................. 667 Figure 21-34 Podzemburgas drilling in 2007-2012 (thousand meters) .......................................................................................... 668 Table 21-35 Condensed income statement of Podzemburgas for 2009-2016 in thousand USD .................................................... 668 Figure 21-36 Podzemburgas cost per meter by drilling type in 2007-2011 (RUR per meter) ......................................................... 668 Figure 21-37 Tatneft share in key segments of OFS market in 2008-2016 (shares based on physical activity) .............................. 669 Figure 21-38 TAGRAS revenues by company in 2013-2016 ........................................................................................................... 670
Figure 21-39 TAGRAS customers in 2015-2016 .............................................................................................................................. 670 Table 21-40 Drilling and wells completion by Tatneft OFS companies in 2006-2016 ..................................................................... 671 Table 21-41 Hydraulic fracturing and coiled tubing operations by Tatneft in 2006-2016 .............................................................. 672 Table 21-42 OFS capacities controlled by TAGRAS......................................................................................................................... 672 Table 21-43 TNG-Group 3D/2D seismic and logging in 2009-2016 ................................................................................................ 673 Figure 21-44 TNG-Group customers in 2015-2016 and in previous years ...................................................................................... 674 Table 21-45 Condensed income statement of TNG-Group for 2007-2016 (thousand USD) ........................................................... 674 Table 21-46 Tatnurneft drilling and heavy workover rigs in 2009-2013......................................................................................... 675 Figure 21-47 Tatburneft customers in 2014-2016 ......................................................................................................................... 676
Table 21-48 Condensed income statement of Tatburneft for 2008-2016 (thousand USD) ............................................................ 676 Table 21-49 Condensed income statement of OOO Burenie for 2008-2015 (thousand USD) ........................................................ 676 Table 21-50 Condensed income statement of OOO Tatburmontazh for 2010-2015 (thousand USD) ............................................ 677 Table 21-51 TAGRAS-Remservice activity levels in 2009-2016 ....................................................................................................... 677 Table 21-52 Production capacities of Tatneft-RemService (transferred from Tatneft) .................................................................. 678 Figure 21-53 Condensed income statement of OOO Tatneft-Remservice in 2008-2016 in thousands USD................................... 679 Figure 21-54 Eriell rig fleet by type in 2015 ................................................................................................................................... 680 Table 21-55 Capacities of ERIELL and placing in 2012 .................................................................................................................... 680 Figure 21-56 Drilling footage of ERIELL in 2009-2016 (thousand meters) ...................................................................................... 681
Table 21-57 Eriell revenue and footage by type and region in 2009-2014 .................................................................................... 681 Table 21-58 Condensed income statement of Eriell Neftegasservice in 2011- 2016 in thousands USD ......................................... 682 Table 21-59 Capacities SSK ............................................................................................................................................................ 683 Figure 21-60 SSK revenue breakdown by type of services ............................................................................................................. 683 Figure 21-61 Condensed income statement of ZAO SSK in 2007-2016 (thousand USD) ................................................................ 684 Table 21-63 Companies for consolidation in IG Seismic Services ................................................................................................... 686 Figure 21-64 IGSS shareholders as of 2012 -2016 .......................................................................................................................... 686 Table 21-65 Change in IGSS capacity in 2012-2015 ....................................................................................................................... 687 Table 21-66 Key capacities and geographical locations of IGSS in 2012 ........................................................................................ 687
Table 21-67 Key activity of IGSS in 2009*- 2016 ............................................................................................................................ 688 Figure 21-68 IGSS clients in 2012-2015 (%) ................................................................................................................................... 688 Figure 21-69 GEOTECH Holding revenues in 2006-2011 in old and new structure in 2010-2012 ($ mln) ...................................... 689 Figure 21-70 GEOTECH Holding revenues by legal entities in 2012-2014 ($ mln) .......................................................................... 689 Figure 21-71 Condensed income statement* of IGSS in 2011-2016 (thousand USD) .................................................................... 690 Table 21-72 OAO Khantymansiyskgeophysica activity and key clients 2010.................................................................................. 691 Table 21-73 Condensed income statement of OAO Khantymansiyskgeophysica in 2007-2016 in thousands USD ........................ 691 Figure 21-74 OAO Khantymansiyskgeophysica revenue from key activities in 2006-2014 (RUR mln) ........................................... 691 Figure 21-75 OAO GEOTEK Seismorazvedka activity levels in 2012-2014 ...................................................................................... 692 Table 21-76 Condensed income statement of OAO Integra-Geophysics in 2008-2012 and OAO GEOTEK Seismorazvedka in 2013-
2016 in thousands USD ........................................................................................................................................................ 692 Table 21-77 Azimuth Energy Services revenue and net income in 2007- 2014 (thousand USD) .................................................... 694 Table 21-78 Condensed income statement of OAO Yeniseygeophysica in 2004-2014 in thousands USD ...................................... 695 Figure 21-79 ZAO Samatlorneftekhimprom crew count and composition in 2004-2016 ............................................................... 695
Table 21-80 ZAO Samatlorneftekhimprom workover crews regional distribution prior to expansion ........................................... 696
Table 21-81 ZAO Samatlorneftekhimprom workover crews regional distribution after the acquisitions (2011) .......................... 696 Figure 21-82 ZAO Samatlorneftekhimprom rigs fleet by type in 2014 (hook load) ........................................................................ 696 Figure 21-83 ZAO Samatlorneftekhimprom drilling in 2010-2016 (thousand meters) ................................................................... 697
Figure 21-84 Condensed income statement of ZAO Samatlorneftepromkhim in 2007-2016 in thousand USD ............................. 697 Table 22-6 ARGOS capacities and activity in 2014 ......................................................................................................................... 698 Table 22-7 Condensed income statement of OOO ARGOS in 2011-2016 in thousands USD ......................................................... 698 Table 22-8 Condensed income statement of OOO Langepassko-Pokachevskoe URS in 2009-2016 in thousands USD .................. 699 Table 21-85 Integra overview in 2011 ........................................................................................................................................... 701 Table 21-86 Integra overview in 2010 ........................................................................................................................................... 701 Table 21-87 Integra overview in 2009 ........................................................................................................................................... 702 Table 21-88 Condensed income statement of Integra in 2006-2013 (mln USD) ............................................................................ 702 Figure 21-89 Segments revenue of Integra in 2006-2013 (millions USD) ....................................................................................... 703

REnergyCO Russian Upstream and Oilfield Services 2017 - UPDATE
REnergyCO Strategy and market research + 1 905 205 1094 www.renergyco.ca FSU Energy Markets [email protected]
Table 21-90 Operational results for Integra for 2006 -2013 .......................................................................................................... 704 Table 21-91 Regional distribution of assets in Integra in 2007 ...................................................................................................... 705 Figure 21-92 Customer client base of Integra in 2009-2013 ($ mln) .............................................................................................. 705 Figure 21-93 Order book of Integra by segments in 2009 - 2013 ($ mln) ...................................................................................... 706 Figure 21-94 Revenue of Integra subsidiaries in 2010-2015 (RAS in mln USD) .............................................................................. 706 Table 21-95 Condensed income statement of Integra-Burenie in 2010- 2016 in thousands USD .................................................. 706 Table 21-96 Condensed income statement of SSS (Smith Siberian) in 2010-2016 in thousands USD ............................................ 707 Table 21-97 Condensed income statement of Integra-Services in 2010- 2016 in thousands USD ................................................. 707 Table 21-98 Condensed income statement of Obnefteremont in 2010- 2016 in thousands USD .................................................. 707 Table 21-99 Condensed income statement of VNIIBT in 2010- 2016 in thousands USD ................................................................ 707 Table 21-100 Condensed income statement of ChTPZ for 2008-2016 (million USD) ..................................................................... 708
Figure 21-101 RAS revenue in 2005-2016 of key companies acquired by Rimera ($ mln) ............................................................. 708 Table 21-102 Condensed income statement of Taimyrnefterazvedka for 2003-2010 (thousand USD) ......................................... 709 Table 21-103 Condensed income statement of Yuganskneftegasgeophysica for 2007-2016 (thousand USD)............................... 709 Table 21-104 Condensed income statement of Tomskneftegasgeophysica for 2005-2008 (thousand USD) ................................. 709 Table 22-52 Capacities of MeKaMineft in 2008-2015 .................................................................................................................... 710 Table 22-53 Condensed income statement of ZAO MeKaMineft for 2007-2016 (thousand USD) ................................................. 710 Table 22-1 Ingeoservice capacities in 2011 and 2013 .................................................................................................................... 711 Table 22-2 Ingeoservice drilling rigs fleet by age (actual and plan till 2016) and listed in 2017 ..................................................... 712 Figure 22-3 Nova Energy Services drilling footage in 2006-2016 and plan until 2015 (thousand meters) ..................................... 712
Figure 22-4 Nova Energy Services average and maximum horizontal legs in 2009-2011 and plan until 2015 (thousand meters) .............................................................................................................................................................................................713
Table 22-5 Condensed income statement of Nova Energy Services for 2007-2016 (thousand USD) ............................................. 713 Table 22-9 Capacities of Neftserviceholding .................................................................................................................................. 714 Table 22-10 OOO Neftserviceholding companies and structure of their revenue in 2005 ............................................................. 714 Table 22-11 Condensed income statement of OOO Nefteserviceholding 2007-2016 in thousand USD ........................................ 715 Figure 22-12 Condensed income statement of OOO Universal Service in 2006-2010 in thousand USD ........................................ 715 Table 22-13 Capacities of NSH Asia Drilling ................................................................................................................................... 715 Figure 22-14 Condensed income statement of OOO NSH Asia Drilling in 2010-2015 in thousand USD......................................... 716
Table 22-15 Capacities of Permnefteotdacha ................................................................................................................................ 716 Figure 22-16 Condensed income statement of OOO Permnefteotdacha in 2007-2016 in thousand USD ..................................... 716 Table 22-17 Structural units of OAO UPNP and KRS ...................................................................................................................... 717 Figure 22-18 Number of sidetracking and workover jobs by OAO UPNP and KRS Samara in 2002- 2015 ...................................... 718 Figure 22-19 Planned and actual operations by OAO UPNP and KRS Samara in 2008 - 2012 ........................................................ 718 Table 22-20 Key operational data of OAO UPNP and KRS Samara in 2008-2015 .......................................................................... 719 Table 22-21 Revenue per job of OAO UPNP and KRS Samara by customer and type of job in 2008-2009 (thousand USD per job)
.............................................................................................................................................................................................720 Table 22-22 Productive crew time and Shift-working coefficient in OAO UPNP and KRS Samara .................................................. 720
Figure 22-23 Condensed income statement of OAO UPNP and KRS Samara in 2007- 2016 in thousand USD ............................... 721 Table 22-24 Condensed income statement of OAO RU-Energy Group in 2009-2014 in thousands USD ....................................... 722 Table 22-25 Capacities of the Service Drilling Company and NG-Burenie in 2017 ......................................................................... 722 Figure 22-26 Drilling by SBK in 2006-2013 and estimates for 2014 (thousand meters) ................................................................. 723 Figure 22-27 SBK share in regional wells completions by Gazpromneft in 2009 (wells) ................................................................ 724 Table 22-28 Condensed income statement of OOO Service Drilling Company in 2007-2013 and for HG-Burenie in 2015-2016 in
thousands USD ..................................................................................................................................................................... 724 Table 22-29 Capacities of the Vyshkomontazhnoe Upravlenie (rig assembly) ............................................................................... 724 Table 22-30 Capacities of OOO KRS-Service .................................................................................................................................. 725 Table 22-31 Condensed income statement of OOO KRS-Service in 2005-2013 and OOO Noyabrskoe UPNP in 2015-2016 in
thousands USD ..................................................................................................................................................................... 725 Table 22-32 Capacities of OOO Megion-Service ............................................................................................................................ 725 Figure 22-33 Megion-Service share in Slavneft workover/servicing costs in 2004-2013 ($ mln) ................................................... 726 Table 22-34 Condensed income statement of OOO Megion-Service in 2004-2013 in thousands of USD ...................................... 726
Table 22-35 A Condensed income statement of OOO YamalServiceCenter in 2007-2013 in thousands of USD ............................ 726
Table 22-36 A Condensed income statement of OOO Servisnaya Transportnaya Compania 2007-2013 in thousands of USD ...... 727 Table 22-37 Condensed income statement of Krasnoleninskneftegas for 2009-2016 (thousand USD) ......................................... 728 Figure 22-38 Exploration drilling of Usinskgeoneft for 2003-2014 and planned for 2015 (thousand meters) ............................... 728 Figure 22-39 Usinskgeoneft customer by revenue breakdown in 2012 and in 2014 ..................................................................... 729 Table 22-40 Condensed income statement of Usinskgeoneft for 2007-2016 (thousand USD) ...................................................... 730 Table 22-41 Capacities of OOO VNBK ............................................................................................................................................ 730 Figure 22-42 Drilling footage of OOO VNBK in 2004-2014 (thousand meters) ............................................................................... 730 Table 22-43 Condensed income statement of OOO VNBK in 2007-2016 in thousand USD ........................................................... 731 Figure 22-44 Condensed income statement of ZAO Ermakovsky PRS in 2007-2016 in thousand USD .......................................... 731 Table 22-45 Condensed income statement of OOO KomiQuest International in 2007-2016 in thousand USD ............................ 732 Figure 22-46 Rusintegral Pioneer drilling footage in 2007-2014 (thousand meters) ..................................................................... 732

REnergyCO Russian Upstream and Oilfield Services 2017 - UPDATE
REnergyCO Strategy and market research + 1 905 205 1094 www.renergyco.ca FSU Energy Markets [email protected]
Table 22-47 Condensed income statement of OOO Rusintegral Pioneer 2010-2016 in thousand USD ......................................... 733
Table 22-48 Rusintegral crew count and utilization in 2007-2012 ................................................................................................. 733 Table 22-49 Condensed income statement of OOO VR 2007-2016 in thousand USD .................................................................... 733 Table 22-50 OOO Tomskburneftegaz capacities ............................................................................................................................ 734 Table 22-51 Condensed income statement of OOO Tomskburneftegaz for 2007-2016 (thousand USD) ....................................... 734 Table 23-1 Rosgeologia companies in hydrocarbons exploration .................................................................................................. 736 Table 23-2 Condensed income statement of OAO ROSGEOLOGIA in 2008-2016 in thousands USD .............................................. 737 Figure 23-3 Dalmorneftegeophysica revenue by type of client in 2012-2014 ($ mln) .................................................................. 738 Table 23-4 Condensed income statement of OAO Dalmorneftegeophysica in 2008-2016 in thousands USD ............................... 738 Table 23-5 OAO Samaraneftegeophysica capacities and location in 2013 ..................................................................................... 738 Figure 23-6 Samaraneftegeophysica revenue from seismic and wireline activities in 2006-2014 (thousand USD) ....................... 739 Figure 23-7 Samaraneftegeophysica revenue regional split in 2009, 2011 and 2013-2014 (%) .................................................... 739
Table 23-8 Condensed income statement of OAO Samaraneftegeophysica in 2007- 2016 in thousands USD .............................. 740 Table 23-9 Condensed income statement of Sevmorgeo in 2006-2014 in thousands USD ........................................................... 740 Figure 23-35 Sevmorneftegeophysica revenue breakdown by type of a customer in 2008-2010 (thousand USD) ....................... 741 Figure 23-36 Sevmorneftegeophysica seismic surveys by type in 2007-2014 ............................................................................... 741 Table 23-37 Breakdown of Sevmorneftegeophysica vessel load in 2008-2011 ............................................................................. 742 Figure 23-38 Sevmorneftegeophysica revenue from 2D and 3D in 2008-2014 (thousand USD) ................................................... 742 Table 23-39 Condensed income statement of OAO Sevmorneftegeophysica in 2006-2015 in thousands USD ............................. 742 Table 23-10 Condensed income statement of OAO CGE in 2005- 2013 in thousands USD ............................................................ 743 Figure 23-11 OAO Sibneftegeophysica in winter seasons in 2005-2013 (# of shots) ..................................................................... 744
Figure 23-12 OAO Sibneftegeophysica 3D and 2D in 2011 -2014 (thousand linear and square km) .............................................. 744 Figure 23-13 OAO Sibneftegeophysica customer breakdown for 2010-2011 and 2012-2013 seasons (# of shots) ....................... 745 Table 23-14 Condensed income statement of OAO Sibneftegeophysica in 2006 - 2015 (thousands USD) .................................... 745 Figure 23-15 OAO Permneftegeophysica seismic and wireline revenue split in 2010 (%) ............................................................ 746 Table 23-16 Seismic line of business activities of OAO Permneftegeophysica in 2008-2013 ......................................................... 746 Table 23-17 Wireline line of business activities of OAO Permneftegeophysica in 2008-2013 ........................................................ 746 Table 23-18 Condensed income statement of OAO Permneftegeophysica in 2007- 2016 in thousands USD ................................ 747 Table 23-19 Key activities of OAO Volgogradneftegeophysica in 2008-2014 ................................................................................. 747 Figure 23-20 OAO Volgogradneftegeophysica seismic field activities in 2005-2013 (sq. km. and km accordingly) ....................... 748
Table 23-21 Condensed income statement of OAO Volgogradneftegeophysica in 2007-2016 in thousands USD ......................... 748 Figure 23-22 Stavropolneftegeophysica seismic and wireline revenue in 2013-2014 ( %) ........................................................... 749 Figure 23-23 Stavropolneftegeophysica seismic and wireline revenue by regions in 2012-2014 ( RUR mln) ............................... 749 Table 23-24 Condensed income statement of OAO Stavropolneftegeophysica in 2007-2016 in thousands USD .......................... 750 Figure 23-25 Saratovneftegeophysica revenue from seismic and other activities in 2006-2011 (thousand USD) ......................... 750 Figure 23-26 Saratovneftegeophysica revenue from various countries in 2007-2010 (thousand USD) ........................................ 751 Table 23-27 Condensed income statement of OAO Saratovneftegeophysica in 2006-2016 in thousands USD ............................. 751 Table 23-28 Capacities of OAO Bashneftegeophysica .................................................................................................................... 752 Figure 23-29 Bashneftegeophysica clients in 2009 - 2012 (share in revenue in mln dollars) ........................................................ 752
Table 23-30 Key operating data of Bashneftegeophysica in 2008-2015 and plan for 2016 ........................................................... 753 Table 23-31 Condensed income statement of OAO Bashneftegeophysica in 2006-2016 in thousands USD.................................. 753 Table 23-32 Condensed income statement of OAO Kogalymneftegeophysica in 2007-2016 in thousands USD ........................... 754 Table 23-33 Condensed income statement of OAO Nizhnevartovskneftegeophysica in 2007-2016 in thousands USD ................. 755 Table 23-34 Condensed income statement of OAO MAGE in 2008-2016 in thousands USD ......................................................... 756 Table 23-40 Condensed income statement of ZAO Polyarnaya Geophysical Expedition in 2006-2013 in thousands USD ............. 756 Table 23-41 Condensed income statement of ZAO Krasnoyarskgeophysica in 2003-2009 in thousands USD ............................... 757 Figure 24-1 Supply of drilling rigs in 2001-2014 (units) ................................................................................................................. 759 Figure 24-2 Production of workover rigs in 2000-2010 (units) ...................................................................................................... 759 Figure 24-3 Production of cementing units in 2001-2009 (units)................................................................................................... 760 Figure 24-4 Production of wellhead and Christmas tree fittings in 2000-2009 (units) ................................................................... 760
Figure 24-5 Production of deep well sucker-rod pumps and ESP Systems in Russia in 2001-2009 (‘000) ...................................... 761 Figure 24-6 Production of rod pump surface units in Russia in 2001-2008 (units) ........................................................................ 761 Figure 24-7 Production of well logging aggregates in 2002-2006 (units) ....................................................................................... 762
Figure 25-1 Drilling rigs fleet estimates in 2006, 2008-2012 .......................................................................................................... 763 Figure 25-2 Breakdown of sourcing of additional rigs supplied to the market between 2006 and 2012 ....................................... 763 Figure 25-3 Production of workover rigs in 2001-2009 (units) ...................................................................................................... 764 Figure 25-4 Drilling rigs import by hook load 2006-2009 ............................................................................................................... 765
Figure 25-5 Drilling rigs import by country of origin 2006-2011 .................................................................................................... 766 Figure 25-6 Production of drilling rigs by Uralmash in 2001-2014 and plan for 2015 .................................................................... 767 Table 25-7 Condensed income statement of the Uralmash Burovoe Oborudovanie in 2006-2015 ............................................... 768 Table 25-8 Condensed income statement of the Uralmash NGO in 2010-2016 thousands US dollars .......................................... 768 Figure 25-9 Production of drilling rigs by Volgograd Drilling Equipment Plant in 2001-2013 ......................................................... 770 Table 25-10 Condensed income statement of the Volgograd Plant of Drilling Equipment in 2005-2014 (USD thousand) ............. 770 Figure 25-11 Honghua revenue by product line in 2008-2016 ($ mln) .......................................................................................... 771
REnergyCO Russian Upstream and Oilfield Services 2017 - UPDATE
REnergyCO Strategy and market research + 1 905 205 1094 www.renergyco.ca FSU Energy Markets [email protected]
Figure 25-12 Honghua revenue by region line in 2008-2016 ($ mln) ............................................................................................. 771 Table 25-13 Condensed income statement of the Honghua in 2008-2016 (USD thousand) .......................................................... 772
Table 25-14 Production of workover rigs by Kungur Machine-Building Equipment Plant in 2006-2011 (units) ............................ 772 Table 25-15 Condensed income statement of Kungur Machine Building Plant for 2007- 2016 (thousand USD) ........................... 773 Table 25-16 Production of workover rigs by Ishimbai machine building plant in 2001-2011 (units) .............................................. 773 Table 25-17 Condensed income statement Ishimbai machine building plant for 2007- 2016 (thousand USD) .............................. 773 Figure 26-1 ESP production by major manufacturers in the Russian Federation in 2001-2009* ................................................... 774 Figure 26-2 Production wells equipped with ESP by region in 2001-2016 (‘000) ........................................................................... 775 Figure 26-2 a. Borets global revenue and Russia’s share in 2011-2013 (mln USD) ....................................................................... 776 Table 26-3 Condensed income statement of MC Borets for 2007-2016 in thousand USD ............................................................. 776 Figure 26-4 Borets key product (ESP) production dynamics in 2001-2008 ................................................................................... 777 Table 26-5 Condensed income statement of OOO Borets for 2004-2009 in thousand USD .......................................................... 777 Figure 26-6 Production of centrifugal electric submersible pumps by Lemaz in 2001-2009 (units) ............................................... 778
Table 26-7 Condensed income statement of Lemaz for 2006-2015 (thousand USD)..................................................................... 778 Figure 26-8 Production of centrifugal electric submersible pumps by Lysvaneftemash in 2006-2008 (units) ................................ 778 Table 26-9 Condensed income statement of Lysvaneftemash for 2006-2016 (thousand USD) ..................................................... 779 Figure 26-10 Production of centrifugal electric submersible pumps by Livgidromash in 2004-2009 (units) .................................. 779 Table 26-11 Condensed income statement of LIVGIDROMASH for 2007- 2016 (thousand USD) ................................................... 779 Figure 26-12 Production of ESPs by ALNAS in 2001-2009 (units) .................................................................................................. 780 Table 26-13 Condensed income statement of ALNAS for 2007- 2016 (thousand USD) ................................................................. 780 Table 26-14 Condensed income statement of NOVOMET - Perm for 2007-2016 (thousand USD) ................................................ 781 Table 26-15 Condensed income statement of NOVOMET - Service for 2007-2016 (thousand USD) .............................................. 781
Figure 27-1 Rod sucker pumps production in Russia for 2004-2009 (units) ................................................................................... 782 Figure 27-2 Rod lift pump equipped wells in key regions of Russia in 2002-2016 (‘000) ............................................................... 782 Figure 27-3 Surface equipment for rod pumps production by key manufacturers in Russia for 2003-2009 (units) ....................... 783 Figure 27-4 Rod lift pumps production at Izhneftemash 101 in 2002-2009 (thousands) ............................................................... 784 Figure 27-5 Key equipment production at Izhneftemash in 2006-2007 (units) .............................................................................. 784 Table 27-6 Condensed income statement of Izhneftemash for 2006- 2016 (thousand USD) ........................................................ 785 Table 27-7 Condensed income statement of Izhneftemash 101 for 2004-2008 (thousand USD) .................................................. 785 Table 27-8 Condensed income statement of the Perm Oilfield Machinery Company for 2004-2009 (thousand USD) .................. 785 Figure 27-9 Production of rod lift pump surface units by Reduktor in 2001-2009 (units) .............................................................. 786
Table 27-10 Condensed income statement of Reduktor for 2006- 2016 (thousand USD) ............................................................. 786 Figure 28-1 Major manufacturers of Christmas trees for the oil industry in 2004-2008 (units) .................................................... 787 Figure 28-2 Korvet Christmas tree production data for 2004-2009 (units) ................................................................................... 788 Table 28-3 Condensed income statement of Korvet for 2007- 2016 (thousand USD) ................................................................. 788 Figure 29-1 Cementing units production by main producers for 2001-2008 ............................................................................... 789 Figure 29-2 Cementing unit production at Pervomaiskkhimmash for 2000-2008 (units) ............................................................. 790 Table 29-3 Condensed income statement of Pervomaiskkhimmash for 2005- 2016 (thousand USD) ......................................... 790