Embed Size (px)
Citation preview
WATER USES AND THEIR SOCIO-
ECONOMIC IMPACT IN THE KAT RIVER
CATCHMENT: A REPORT BASED ON
PRIMARY DATA
AUGUST 2005
STEFANO FAROLFI & MARTHE ABRAMS WRC Project no. K5/1496
Based on data and information collected by:
Jane Burt, Hlengiwe Goumede, Bruno Bonté, Stefano Farolfi, Marthe Abrams,
Ntando Mlilo, Merle Naidoo, Anel Muikanovic, and John Edgren
Centre of International Co-operation in
Agronomic Research for Development
Centre for Environmental Economics and Policy in Africa
University of Pretoria
1
This report forms part of a greater WRC funded project:
A STAKEHOLDER DRIVEN PROCESS TO DEVELOP A CATCHMENT MANAGEMENT
PLAN FOR THE KAT RIVER VALLEY
WRC Project no. K5/1496 This Project is being undertaken as a partnership between the Kat River Water User Association, and the Institute for Water Research and Catchment Research Group of Rhodes University, who are providing technical and scientific support.

i
Report should be cited as: Farolfi, S. & Abrams, M. 2005: Water uses and their socio-economic impact in the Kat River Catchment: a report based on primary data. Unpublished report to the Water\Research Commission, the Institute of Water Research. Rhodes University. Grahamstown.
ii
WATER USES AND THEIR SOCIO-ECONOMIC IMPACT IN THE KAT RIVER CATHCMENT
Table of Contents
Terminology and Acronyms...................................................................................iii
List of Tables ...........................................................................................................iv
List of Figures..........................................................................................................iv
1. INTRODUCTION........................................................................................1
2. AGRICULTURE IN THE KAT RIVER CATCHMENT........................3
2.1 Small-scale farms...................................................................................4
2.2 Citrus Production in the Kat River Catchment ......................................6
2.2.1 Emerging farms..............................................................................7
2.2.2 Large-scale farms ..........................................................................9
2.2.3 Export and packaging ..................................................................10
2.2.4 Labour in citrus farms .................................................................11
2.2.5 Water and citrus...........................................................................12
3. DOMESTIC USERS..................................................................................14
4. STAKEHOLDERS’ FUTURE PERSPECTIVES ..................................21
4.1 Emerging and Large-scale Farmers .....................................................22
4.2 Small-scale Farmers.............................................................................24
4.3 Domestic Users ....................................................................................25
5. CONCLUSION ..........................................................................................27
REFERENCES.......................................................................................................28
APPENDIX.............................................................................................................29
iii
Terminology and Acronyms
AWARE Action research and Watershed Analyses for Resource and
Economic Sustainability
DWAF Department of Water Affairs and Forestry
IWR Institute for Water Research
IWRM Integrated Water Resource Management
KATCO The Kat River Citrus Co-operative
KRCF Kat River Catchment Forum
KRWUA Kat River Water User Association
WMA Water Management Area
WRC Water Research Commission
iv
List of Tables Table 2.1 Costs, income and profit in a 30ha community irrigation scheme
producing cabbage, in the Upper Kat River Catchment (Adapted from
Ngqangweni, 2000)....................................................................................5
Table 2.2 Labour needs in a 30ha community irrigation scheme producing cabbage
(Direct surveys, 2005)................................................................................5
Table 2.3 Costs and Income for 1ha of cabbage production in the Upper Kat River
Catchment (Adapted from Ngqangweni, 2000).........................................5
Table 2.4 Costs and income for an emerging Citrus farm (18ha) (Direct surveys,
2005). .........................................................................................................7
Table 2.5 Citrus production and use of water in three large-scale farms in the Kat
River Catchment (Edgren, 2005). ............................................................10
Table 2.6 Labour force and wages in the three large-scale citrus farm surveyed
(Mujkanovic, 2005)..................................................................................11
Table 2.7 Water and citrus production on three large-scale citrus farms in the Kat
River Catchment (Edgren, 2005). ............................................................12
Table 2.8 General environmental factors affecting citrus production in the Kat
River Catchment, at farms C, K and R (Edgren, 2005). ..........................13
Table 3.1 Villages and Farms surveyed by M.Naidoo (2005). ................................14
Table 3.2 Domestic water users in the Kat River Catchment Rural areas: socio-
economic data referring to the surveyed villages (Naidoo, 2005). ..........16
Table 3.3 Domestic water use characteristics in selected villages and farms in the
Kat River Catchment rural areas (Naidoo, 2005). ...................................18
Table 3.4 Rural households interviewed that pay for water (Naidoo, 2005). ..........18
Table 4.1 Participants to the first workshop for the construction of the AWARE
model (Burt et al., 2005). .........................................................................21
Table 4.2 Kat River Catchment Forum (KRCF) Villages’ plans for future
infrastructure. ...........................................................................................25
List of Figures
Figure 3.1 Villages in the Kat River Catchment surveyed by M.Naidoo (2005)..15
1
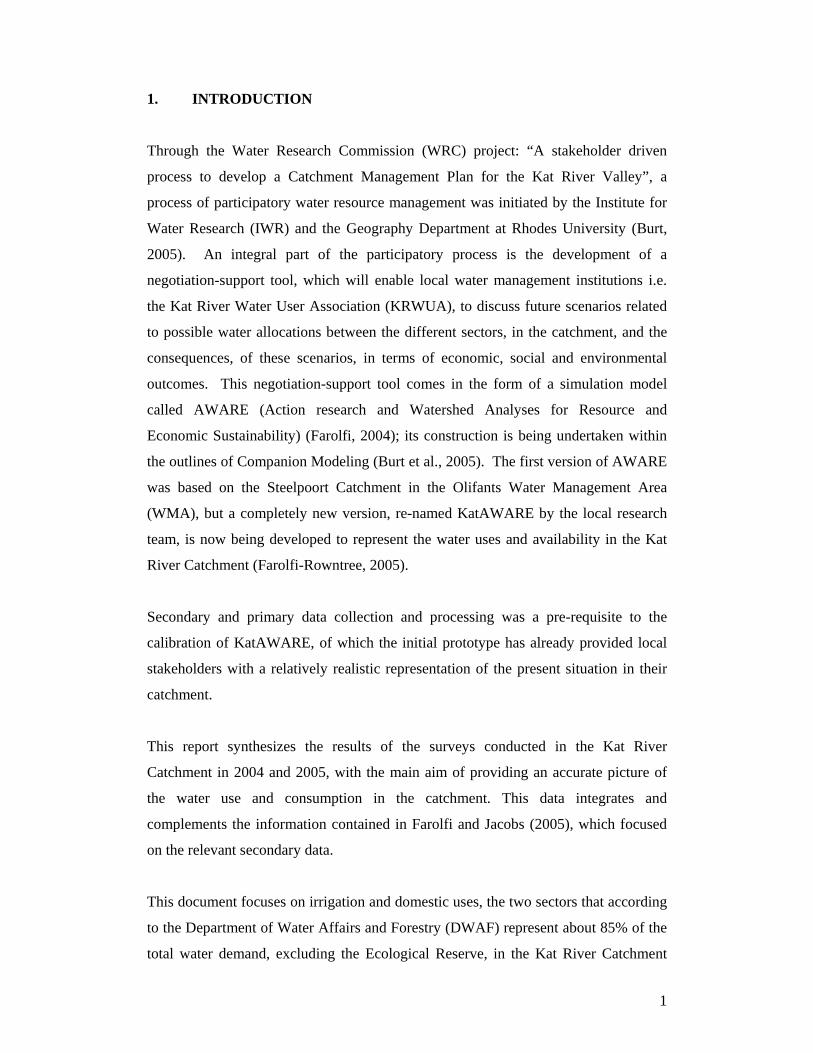
1. INTRODUCTION
Through the Water Research Commission (WRC) project: “A stakeholder driven
process to develop a Catchment Management Plan for the Kat River Valley”, a
process of participatory water resource management was initiated by the Institute for
Water Research (IWR) and the Geography Department at Rhodes University (Burt,
2005). An integral part of the participatory process is the development of a
negotiation-support tool, which will enable local water management institutions i.e.
the Kat River Water User Association (KRWUA), to discuss future scenarios related
to possible water allocations between the different sectors, in the catchment, and the
consequences, of these scenarios, in terms of economic, social and environmental
outcomes. This negotiation-support tool comes in the form of a simulation model
called AWARE (Action research and Watershed Analyses for Resource and
Economic Sustainability) (Farolfi, 2004); its construction is being undertaken within
the outlines of Companion Modeling (Burt et al., 2005). The first version of AWARE
was based on the Steelpoort Catchment in the Olifants Water Management Area
(WMA), but a completely new version, re-named KatAWARE by the local research
team, is now being developed to represent the water uses and availability in the Kat
River Catchment (Farolfi-Rowntree, 2005).
Secondary and primary data collection and processing was a pre-requisite to the
calibration of KatAWARE, of which the initial prototype has already provided local
stakeholders with a relatively realistic representation of the present situation in their
catchment.
This report synthesizes the results of the surveys conducted in the Kat River
Catchment in 2004 and 2005, with the main aim of providing an accurate picture of
the water use and consumption in the catchment. This data integrates and
complements the information contained in Farolfi and Jacobs (2005), which focused
on the relevant secondary data.
This document focuses on irrigation and domestic uses, the two sectors that according
to the Department of Water Affairs and Forestry (DWAF) represent about 85% of the
total water demand, excluding the Ecological Reserve, in the Kat River Catchment
2
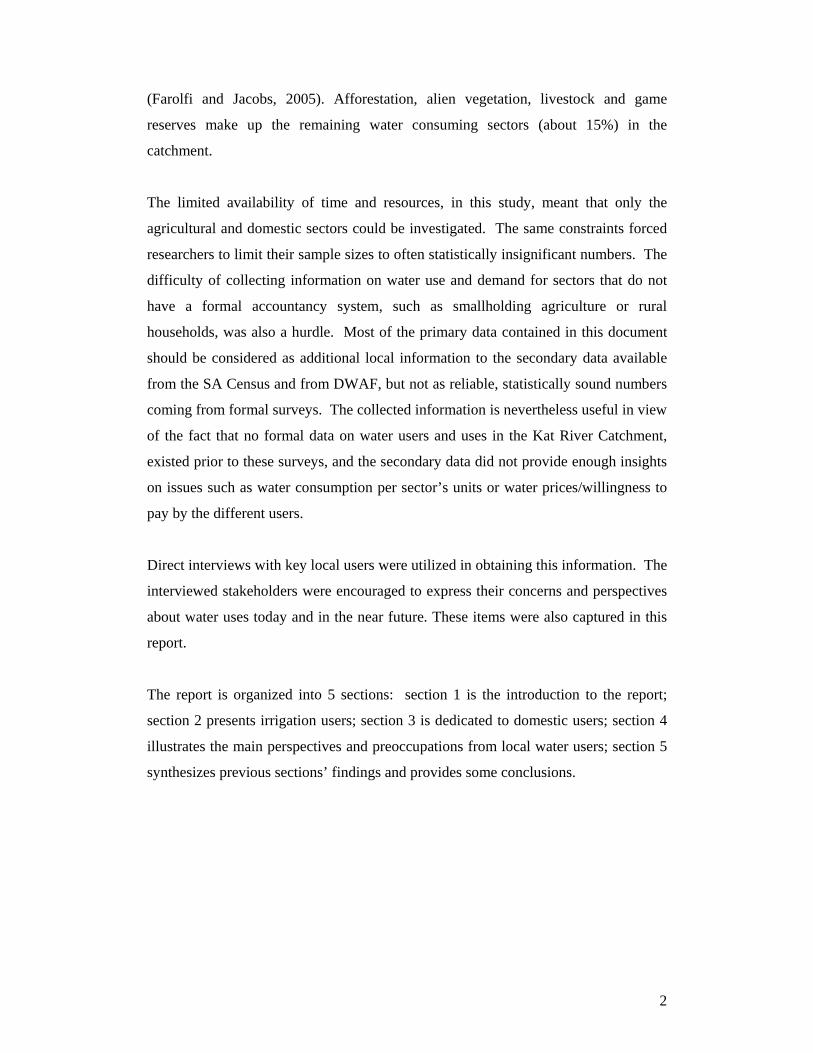
(Farolfi and Jacobs, 2005). Afforestation, alien vegetation, livestock and game
reserves make up the remaining water consuming sectors (about 15%) in the
catchment.
The limited availability of time and resources, in this study, meant that only the
agricultural and domestic sectors could be investigated. The same constraints forced
researchers to limit their sample sizes to often statistically insignificant numbers. The
difficulty of collecting information on water use and demand for sectors that do not
have a formal accountancy system, such as smallholding agriculture or rural
households, was also a hurdle. Most of the primary data contained in this document
should be considered as additional local information to the secondary data available
from the SA Census and from DWAF, but not as reliable, statistically sound numbers
coming from formal surveys. The collected information is nevertheless useful in view
of the fact that no formal data on water users and uses in the Kat River Catchment,
existed prior to these surveys, and the secondary data did not provide enough insights
on issues such as water consumption per sector’s units or water prices/willingness to
pay by the different users.
Direct interviews with key local users were utilized in obtaining this information. The
interviewed stakeholders were encouraged to express their concerns and perspectives
about water uses today and in the near future. These items were also captured in this
report.
The report is organized into 5 sections: section 1 is the introduction to the report;
section 2 presents irrigation users; section 3 is dedicated to domestic users; section 4
illustrates the main perspectives and preoccupations from local water users; section 5
synthesizes previous sections’ findings and provides some conclusions.
3
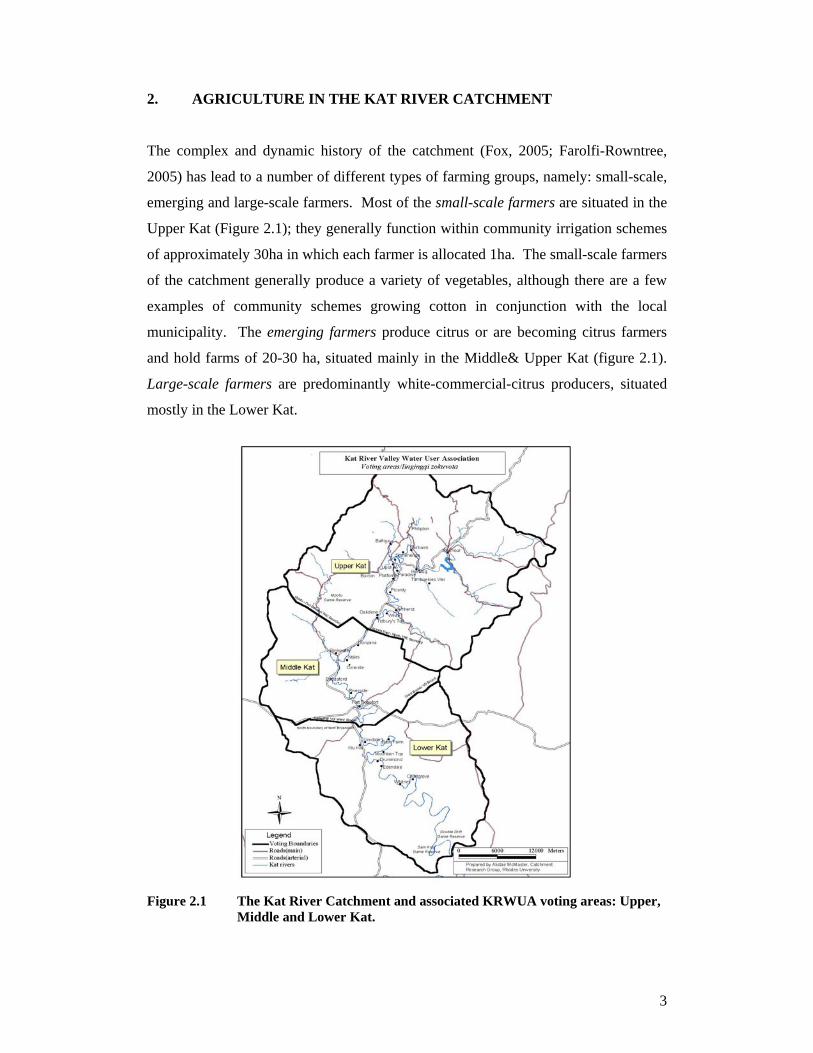
2. AGRICULTURE IN THE KAT RIVER CATCHMENT
The complex and dynamic history of the catchment (Fox, 2005; Farolfi-Rowntree,
2005) has lead to a number of different types of farming groups, namely: small-scale,
emerging and large-scale farmers. Most of the small-scale farmers are situated in the
Upper Kat (Figure 2.1); they generally function within community irrigation schemes
of approximately 30ha in which each farmer is allocated 1ha. The small-scale farmers
of the catchment generally produce a variety of vegetables, although there are a few
examples of community schemes growing cotton in conjunction with the local
municipality. The emerging farmers produce citrus or are becoming citrus farmers
and hold farms of 20-30 ha, situated mainly in the Middle& Upper Kat (figure 2.1).
Large-scale farmers are predominantly white-commercial-citrus producers, situated
mostly in the Lower Kat.
Figure 2.1 The Kat River Catchment and associated KRWUA voting areas: Upper, Middle and Lower Kat.
4
2.1 Small-scale farms
Small-scale farmers consists of community members who have organised themselves
into collective irrigation schemes. An example is the Kat River Irrigation Scheme in
Stonehenge, in the Upper Kat (figure 2.1), which is supported by the local Nkonkobe
Municipality. It is here that Ms Ntando Mlilo, an honours student in the Rhodes
Geography Department conducted most of her interviews (Mlilo, 2005).
Small-scale farmers in the Kat River Catchment produce exclusively annual crops,
mainly cabbages, butternut, potatoes and recently, through a municipal initiative,
cotton.
Despite the recent liberal trends of the national SA policy, irrigation schemes often
benefit from the financial and technical support provided by local and/or national
development projects, which provide capital, machinery, inputs and training.
Several surveys were conducted amongst the Upper Kat irrigation schemes; these
aimed at obtaining the necessary information on the economic aspects of annual
productions and water use amongst this sector. Nevertheless, because of the lack of
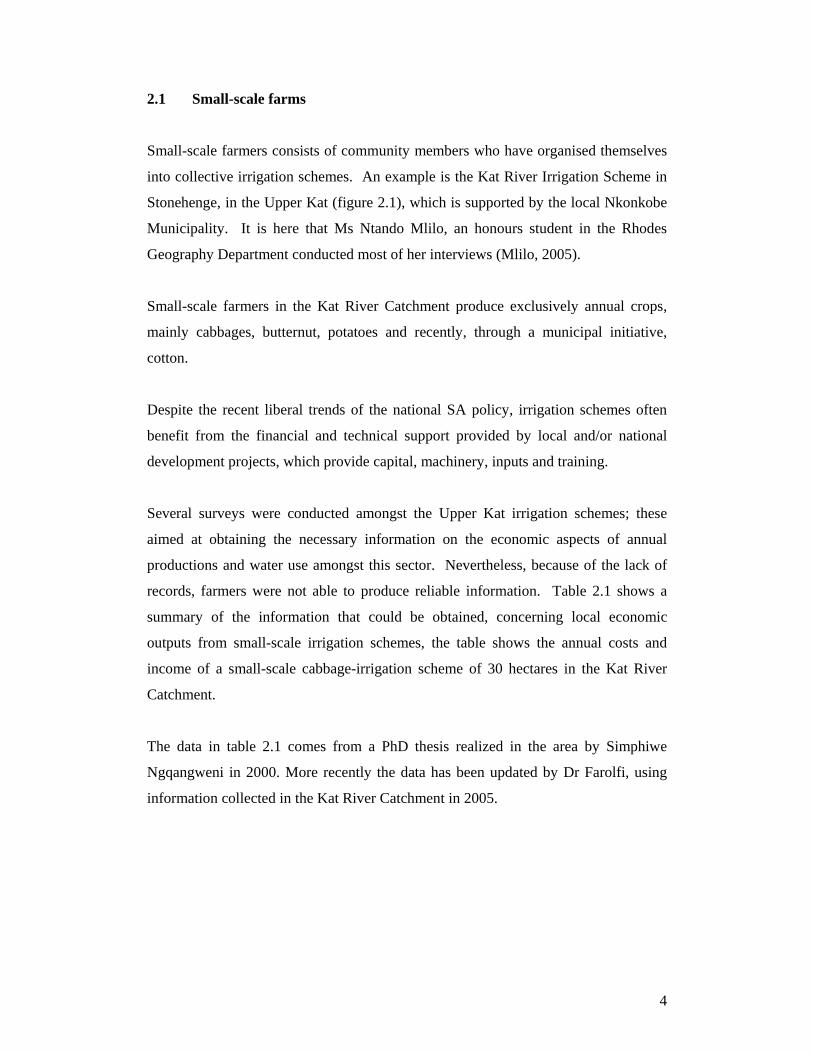
records, farmers were not able to produce reliable information. Table 2.1 shows a
summary of the information that could be obtained, concerning local economic
outputs from small-scale irrigation schemes, the table shows the annual costs and
income of a small-scale cabbage-irrigation scheme of 30 hectares in the Kat River
Catchment.
The data in table 2.1 comes from a PhD thesis realized in the area by Simphiwe
Ngqangweni in 2000. More recently the data has been updated by Dr Farolfi, using
information collected in the Kat River Catchment in 2005.
5
Table 2.1 Costs, income and profit in a 30ha community irrigation scheme producing cabbage, in the Upper Kat (Adapted from Ngqangweni, 2000).
Budget for 30 ha Community Irrigation Scheme. Size of Scheme (hectares ha)
30
Costs R/ha Total Labour 670 20100 General variable costs 7320 219600 Total Costs 239700 Income R/ha Total Cabbage 10050 301500 Total Income 301500 Total Profit 61800
Direct surveys on labour, enabled the estimation of the seasonal labour needs for the
same 30 ha irrigation scheme - excluding the local farmers managing a plot included
in the scheme (table 2.2).
Table 2.2 Labour needs in a 30ha community irrigation scheme producing cabbage
(Direct surveys, 2005). Labour for 30ha community irrigation scheme Type of labour Hours/ha area h/employee Number of
employees Seasonal 536 30 420 38.29
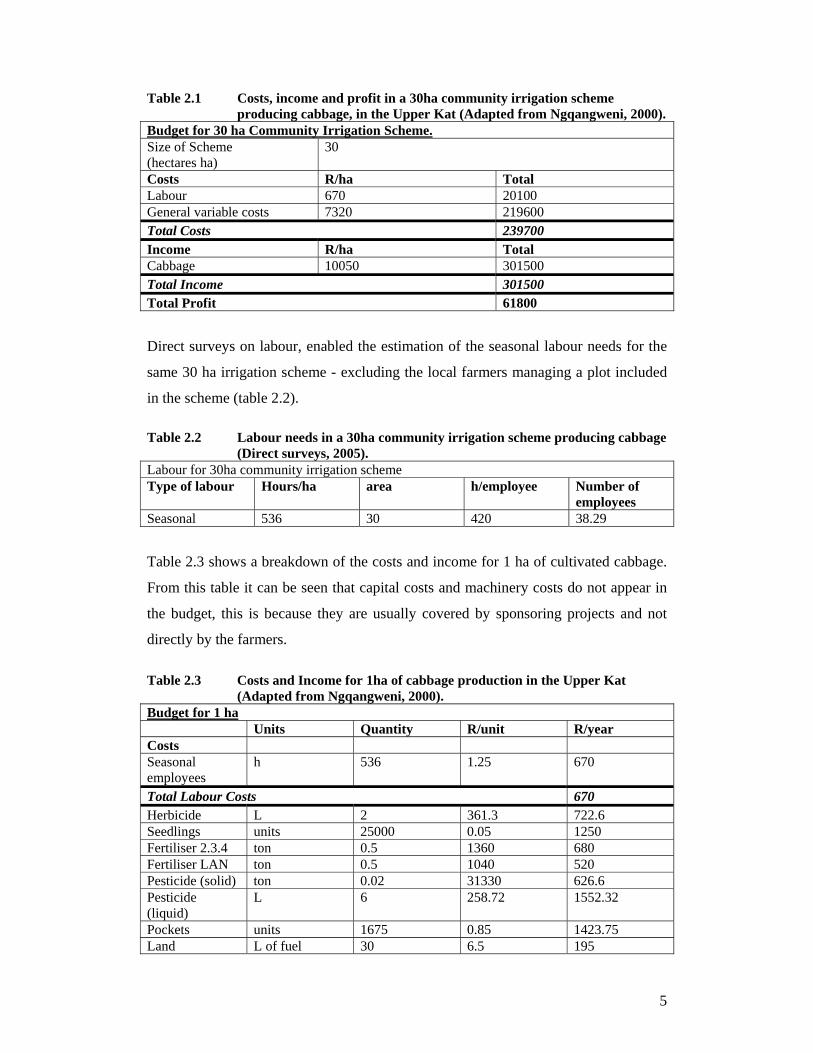
Table 2.3 shows a breakdown of the costs and income for 1 ha of cultivated cabbage.
From this table it can be seen that capital costs and machinery costs do not appear in
the budget, this is because they are usually covered by sponsoring projects and not
directly by the farmers.
Table 2.3 Costs and Income for 1ha of cabbage production in the Upper Kat
(Adapted from Ngqangweni, 2000). Budget for 1 ha Units Quantity R/unit R/year Costs Seasonal employees
h 536 1.25 670
Total Labour Costs 670 Herbicide L 2 361.3 722.6 Seedlings units 25000 0.05 1250 Fertiliser 2.3.4 ton 0.5 1360 680 Fertiliser LAN ton 0.5 1040 520 Pesticide (solid) ton 0.02 31330 626.6 Pesticide (liquid)
L 6 258.72 1552.32
Pockets units 1675 0.85 1423.75 Land L of fuel 30 6.5 195
6
Preparation Transport ha 1 200 200 Water, repair and maintenance
ha 1 150 150
Total Variable Costs 7320 Income Units Quantity Market price Total Production bags 1675 6 10050 Total Income 10050
2.2 Citrus Production in the Kat River Catchment
Citrus has become the chief agricultural export in the Kat River Catchment over the
last decade. Currently 874ha, in the catchment, are under large-scale commercial
citrus production, of which 418ha are situated north of Fort Beaufort (6 farms, all
scheduled1), and 456 south of Fort Beaufort (5 farms, only 30ha scheduled). In
addition to this, about 400ha are held by emerging farmers (+/-22 farms) mainly
located in the Middle and Upper Kat (figure 1). According to local producers, about
700 additional hectares can be irrigated in the catchment under the present water
allocation scheme. The large-scale farms situated north of Fort Beaufort produce 12
500 tons per year, corresponding to an average of 30 tons per hectare, the majority of
these farms are marketed through the Riverside packing shed. Riverside is a large
private corporation which not only packs and ships much of the citrus produced in the
catchment, but also actively assists numerous of the emerging-citrus farmers in
growing and selling their crops. The rest of the large-scale and emerging farmers,
predominantly in the Lower Kat, south of Fort Beaufort, are members of the Kat
River Citrus Co-operative (KATCO). This cooperative of citrus producers, packs and
markets the remaining citrus produced in the catchment.
Citrus production needs a combination of factors in order to succeed (Mlilo, N.,
2005), these include: farm business skills; financial and labour management;
1 While all farms in the middle and lower Kat rely on the Kat River for irrigation water, two systems of access to water are in place. The first is that of scheduled use. Annual allocation fees are paid according to the area of a farm that has been scheduled for irrigation. All farms in the middle Kat, above the town of Fort Beaufort, are part of the scheduled area. Below Fort Beaufort, the lower Kat farmers opted out of the scheduled scheme and therefore do not pay an annual sum for their water. They rely on storing the excess water flowing past the upstream farmers in large instream weirs. We can see from the above overview that there are four groups of irrigators in the Kat River Catchment: small-scale black farmers, often forming cooperatives, large-scale ‘emerging’ black farmers, white commercial farmers with scheduled water rights, white commercial farmers without scheduled water rights (Farolfi & Rowntree, 2005).
7
accountancy skills; knowledge about climate; type of soil; water quantity and quality;
information concerning the various markets and their requirements for each cultivar.
Also good equipment and safe sheds are crucial for citrus production. These factors
are often lacking in emerging and especially in small-scale agriculture, hampering the
development of citrus production in the Kat River Catchment.
The following section presents Ms Ntando Mlilo’s 2005 findings. Her research
focused on citrus production amongst emerging farms. She interviewed 16 farmers (4
small, 8 emerging and 2 large-scale) and key members of the local Nkonkobe
Municipality. The interviews were more qualitative then quantitative.
2.2.1 Emerging farms
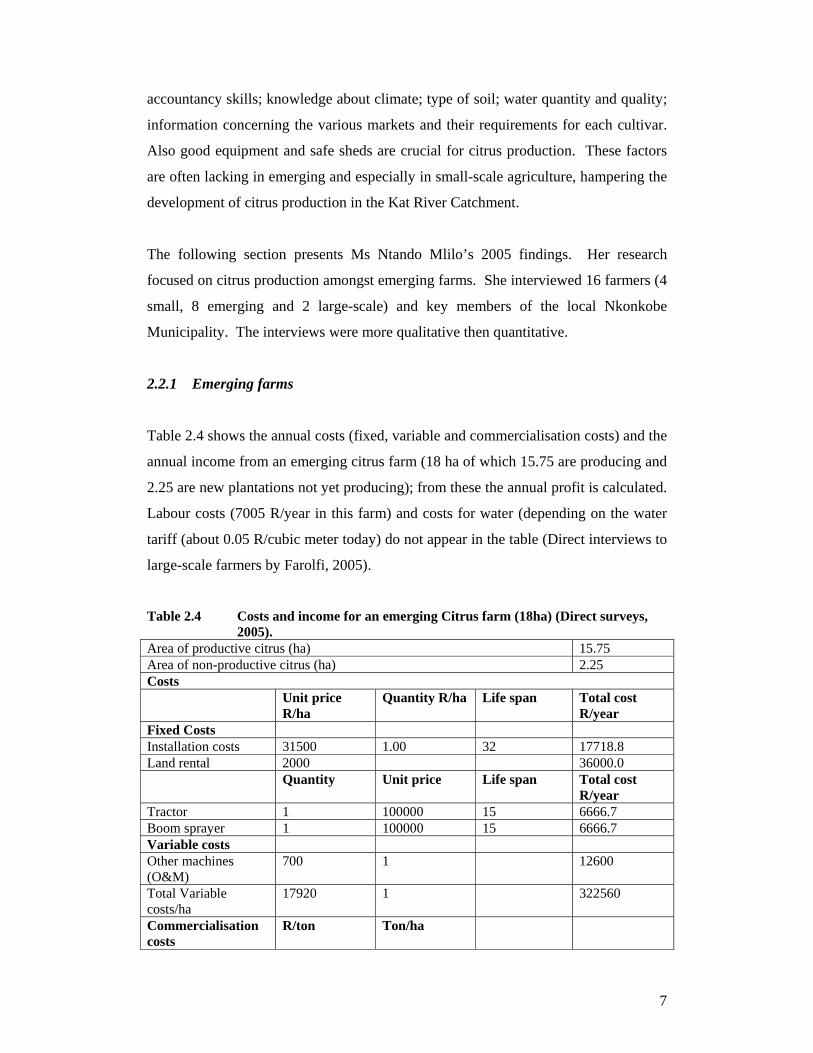
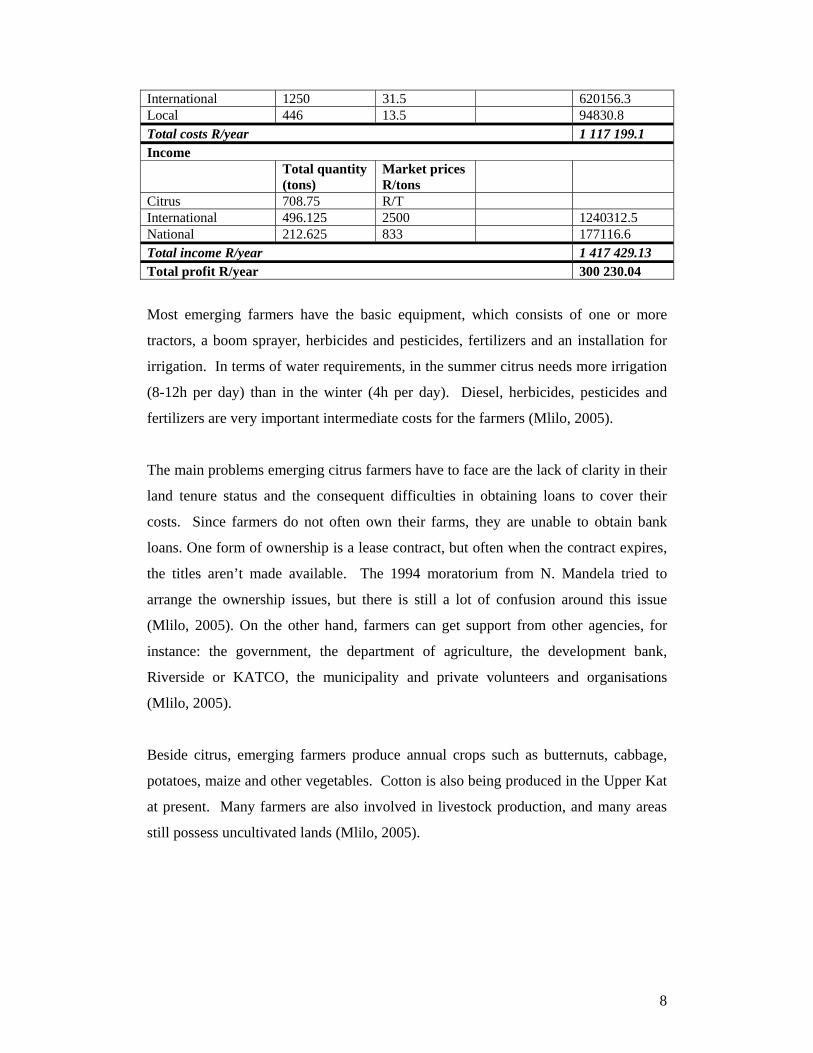
Table 2.4 shows the annual costs (fixed, variable and commercialisation costs) and the
annual income from an emerging citrus farm (18 ha of which 15.75 are producing and
2.25 are new plantations not yet producing); from these the annual profit is calculated.
Labour costs (7005 R/year in this farm) and costs for water (depending on the water
tariff (about 0.05 R/cubic meter today) do not appear in the table (Direct interviews to
large-scale farmers by Farolfi, 2005).
Table 2.4 Costs and income for an emerging Citrus farm (18ha) (Direct surveys, 2005).
Area of productive citrus (ha) 15.75 Area of non-productive citrus (ha) 2.25 Costs Unit price
R/ha Quantity R/ha Life span Total cost
R/year Fixed Costs Installation costs 31500 1.00 32 17718.8 Land rental 2000 36000.0 Quantity Unit price Life span Total cost
R/year Tractor 1 100000 15 6666.7 Boom sprayer 1 100000 15 6666.7 Variable costs Other machines (O&M)
700 1 12600
Total Variable costs/ha
17920 1 322560
Commercialisation costs
R/ton Ton/ha
8
International 1250 31.5 620156.3 Local 446 13.5 94830.8 Total costs R/year 1 117 199.1 Income Total quantity
(tons) Market prices R/tons
Citrus 708.75 R/T International 496.125 2500 1240312.5 National 212.625 833 177116.6 Total income R/year 1 417 429.13 Total profit R/year 300 230.04
Most emerging farmers have the basic equipment, which consists of one or more
tractors, a boom sprayer, herbicides and pesticides, fertilizers and an installation for
irrigation. In terms of water requirements, in the summer citrus needs more irrigation
(8-12h per day) than in the winter (4h per day). Diesel, herbicides, pesticides and
fertilizers are very important intermediate costs for the farmers (Mlilo, 2005).
The main problems emerging citrus farmers have to face are the lack of clarity in their
land tenure status and the consequent difficulties in obtaining loans to cover their
costs. Since farmers do not often own their farms, they are unable to obtain bank
loans. One form of ownership is a lease contract, but often when the contract expires,
the titles aren’t made available. The 1994 moratorium from N. Mandela tried to
arrange the ownership issues, but there is still a lot of confusion around this issue
(Mlilo, 2005). On the other hand, farmers can get support from other agencies, for
instance: the government, the department of agriculture, the development bank,
Riverside or KATCO, the municipality and private volunteers and organisations
(Mlilo, 2005).
Beside citrus, emerging farmers produce annual crops such as butternuts, cabbage,
potatoes, maize and other vegetables. Cotton is also being produced in the Upper Kat
at present. Many farmers are also involved in livestock production, and many areas
still possess uncultivated lands (Mlilo, 2005).
9
2.2.2 Large-scale farms
The following section outlines the findings of Mr Anel Mujkanovic and Mr Johan
Edgren, two Swedish honour students working under the supervision of Prof. Kate
Rowntree (Rhodes University Geography Department) and Dr. Stefano Farolfi
(Ceepa, University of Pretoria). Mr Mujkanovic investigated labour-related issues on
three large-scale citrus farms in the Middle and Lower Kat; these farms will be
indicated in this report as: C, K and R. The surveyed farms create important job
opportunities and the farms’ employees are completely dependent on the income they
earn on the farms. Primary information was collected through six interviews, three
with the owners, and three with an employee of each farm. Mr Edgren also worked
on the same three farms (C, K and R), but focused on critical production factors
related to citrus production. Mr Edgren also utilised interview techniques and
observations to obtain his information.
In general the larger commercial citrus farms are owned by families who have been in
the catchment since the 1820s, and the first European settlement in the catchment.
Their farms are therefore well established and quite extensive. Farm C and K have
been producing citrus for more then 80 years and R has been running even longer that
that, however, it has only been producing citrus since the 1990s (Mujkanovic, 2005).
The recognised definition of a large-scale citrus farm, in the Kat River Catchment,
corresponds to those farms which cultivate more than 25 hectares of citrus. The three
surveyed farms have a citrus surface corresponding to: 37 ha for C, 70 ha for K and
280ha for R (Mujkanovic, 2005).
Annual citrus production of C is around 1320 tons, for K it is 2500 tons, and for R
12000 tons. About 70% of the production is exported; the remaining goes to the
domestic market. Those farmers interviewed would prefer to export their whole crop
to international markets, however, the high quality standards set by international
markets prevent many from doing so (Mujkanovic, 2005; Edgren, 2005).
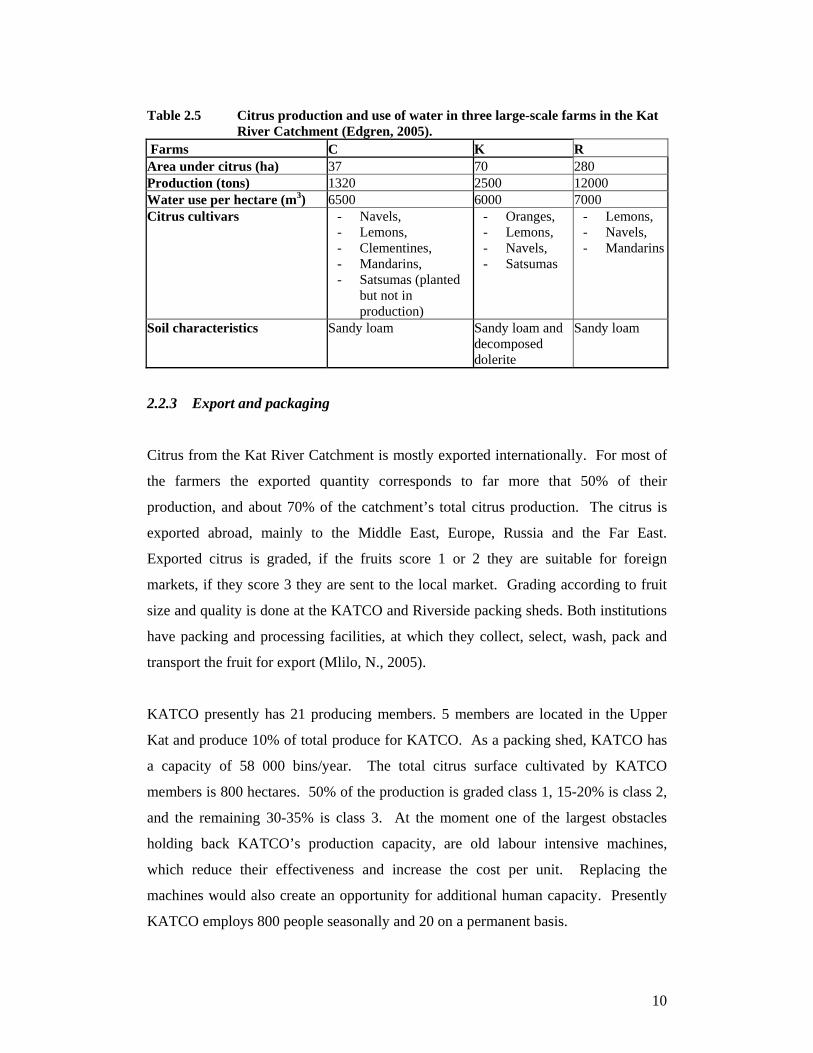
The citrus cultivars produced varied slightly between the three investigated farms,
likewise does the amount of water used per hectare and the type of soil (table 2.5)
(Edgren, J., 2005).
10
Table 2.5 Citrus production and use of water in three large-scale farms in the Kat
River Catchment (Edgren, 2005). Farms C K R Area under citrus (ha) 37 70 280 Production (tons) 1320 2500 12000 Water use per hectare (m3) 6500 6000 7000 Citrus cultivars - Navels,
- Lemons, - Clementines, - Mandarins, - Satsumas (planted
but not in production)
- Oranges, - Lemons, - Navels, - Satsumas
- Lemons, - Navels, - Mandarins
Soil characteristics Sandy loam Sandy loam and decomposed dolerite
Sandy loam
2.2.3 Export and packaging
Citrus from the Kat River Catchment is mostly exported internationally. For most of
the farmers the exported quantity corresponds to far more that 50% of their
production, and about 70% of the catchment’s total citrus production. The citrus is
exported abroad, mainly to the Middle East, Europe, Russia and the Far East.
Exported citrus is graded, if the fruits score 1 or 2 they are suitable for foreign
markets, if they score 3 they are sent to the local market. Grading according to fruit
size and quality is done at the KATCO and Riverside packing sheds. Both institutions
have packing and processing facilities, at which they collect, select, wash, pack and
transport the fruit for export (Mlilo, N., 2005).
KATCO presently has 21 producing members. 5 members are located in the Upper
Kat and produce 10% of total produce for KATCO. As a packing shed, KATCO has
a capacity of 58 000 bins/year. The total citrus surface cultivated by KATCO
members is 800 hectares. 50% of the production is graded class 1, 15-20% is class 2,
and the remaining 30-35% is class 3. At the moment one of the largest obstacles
holding back KATCO’s production capacity, are old labour intensive machines,
which reduce their effectiveness and increase the cost per unit. Replacing the
machines would also create an opportunity for additional human capacity. Presently
KATCO employs 800 people seasonally and 20 on a permanent basis.
11
Farmers (associates) pay annual fees to be part of KATCO. Each 500 bins
commercialised, the farmers have to pay KATCO the corresponding income of selling
40 – 50 bins (about 10% of their income). The board is composed of 7 elected
members and 1 chairman. A nominated manager, who is not a farmer, refers back to
the board.
In addition to supporting its members, KATCO provides technical assistance and
training to associate emerging and small-scale farmers. KATCO has a training
facility where basic literacy, numeracy, health and safety issues, home economics and
prevention of aids are taught. As mentioned above, KATCO grades the fruit from its
members and provides training to graders (Mlilo, N., 2005).
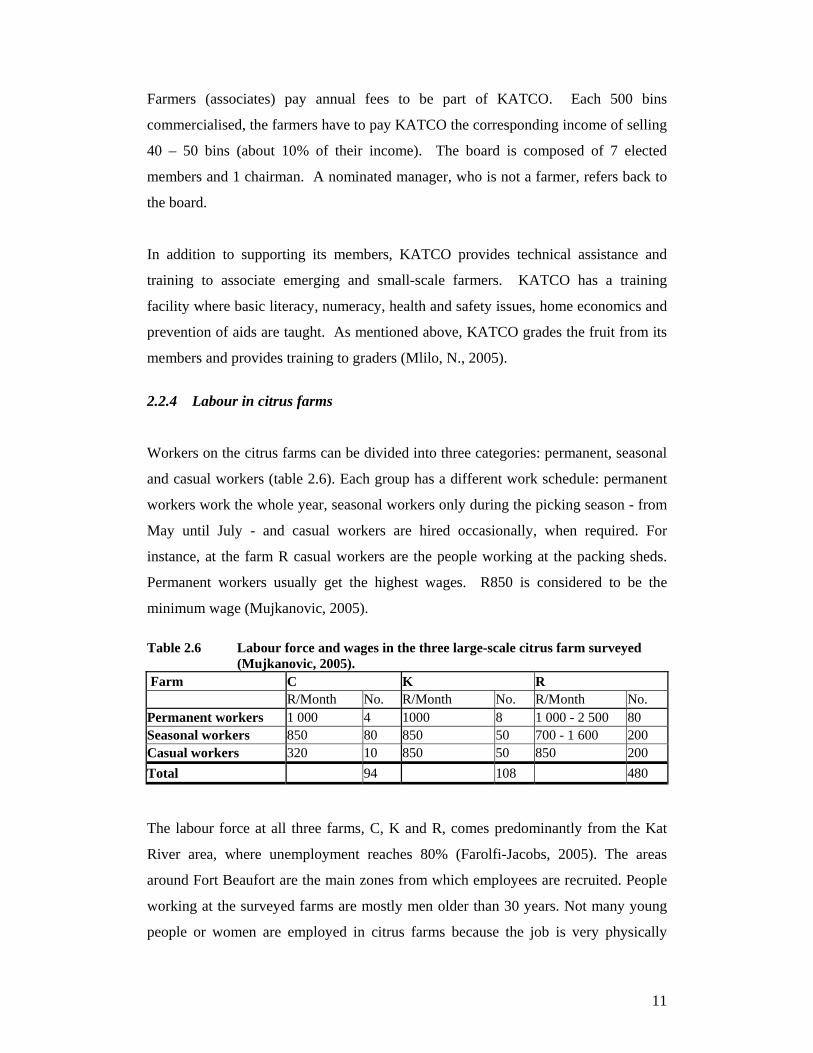
2.2.4 Labour in citrus farms
Workers on the citrus farms can be divided into three categories: permanent, seasonal
and casual workers (table 2.6). Each group has a different work schedule: permanent
workers work the whole year, seasonal workers only during the picking season - from
May until July - and casual workers are hired occasionally, when required. For
instance, at the farm R casual workers are the people working at the packing sheds.
Permanent workers usually get the highest wages. R850 is considered to be the
minimum wage (Mujkanovic, 2005).
Table 2.6 Labour force and wages in the three large-scale citrus farm surveyed
(Mujkanovic, 2005). Farm C K R R/Month No. R/Month No. R/Month No. Permanent workers 1 000 4 1000 8 1 000 - 2 500 80 Seasonal workers 850 80 850 50 700 - 1 600 200 Casual workers 320 10 850 50 850 200
Total 94 108 480
The labour force at all three farms, C, K and R, comes predominantly from the Kat
River area, where unemployment reaches 80% (Farolfi-Jacobs, 2005). The areas
around Fort Beaufort are the main zones from which employees are recruited. People
working at the surveyed farms are mostly men older than 30 years. Not many young
people or women are employed in citrus farms because the job is very physically
12
demanding (Mujkanovic, A., 2005). Although presently, labour supply is not a
concern because of the high unemployment, there are worries about the availability of
labour in the future. The area is heavily affected by HIV/AIDS and therefore, there is
a concern that within a few years there might be a shortage of labour, pushing local
employers to hire workers from outside the Kat River Catchment (Mujkanovic, A.,
2005). Mujkanovic (2005) interviewed three employees from farms C, K and R, all of
them indicated that for them the job at the farm is the only source of income for
him/herself and his/her family; they indicated that the average amount earned is about
R850 per month for seasonal and causal workers. Worth mentioning is that the
interviewed employees do not get any other benefits on top of their salary. They do
not get money towards food, transportation, housing, or any pension funds
(Mujkanovic, 2005).
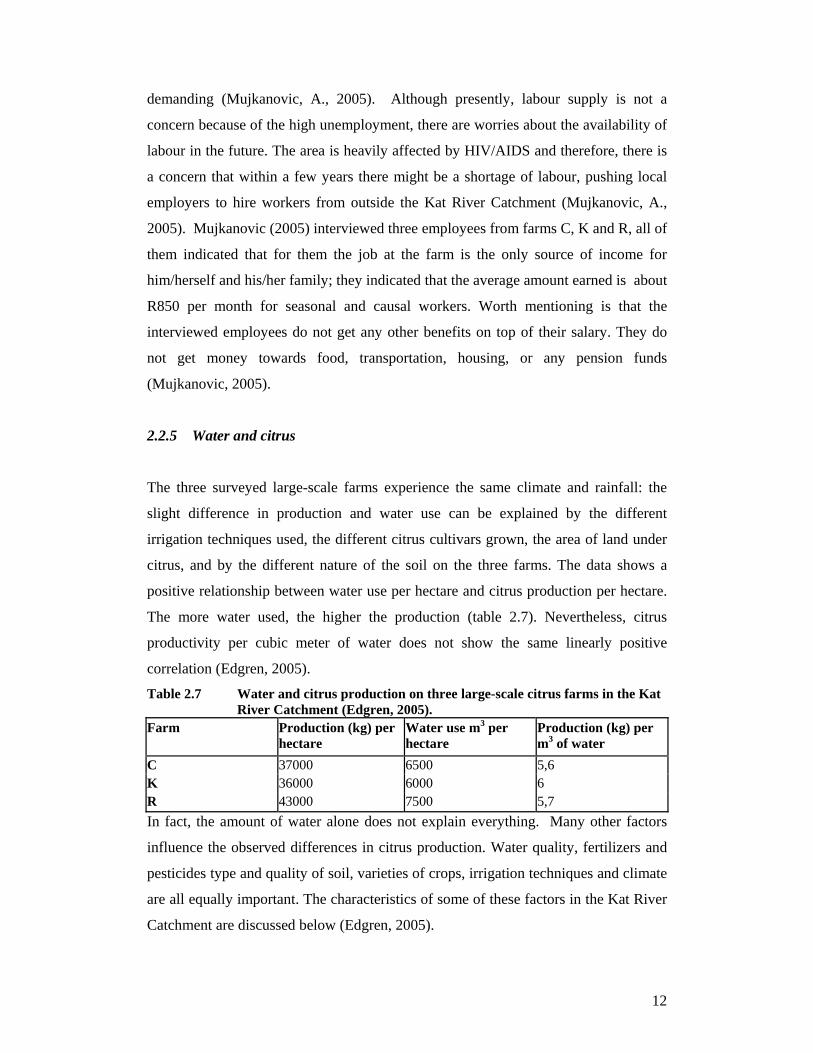
2.2.5 Water and citrus
The three surveyed large-scale farms experience the same climate and rainfall: the
slight difference in production and water use can be explained by the different
irrigation techniques used, the different citrus cultivars grown, the area of land under
citrus, and by the different nature of the soil on the three farms. The data shows a
positive relationship between water use per hectare and citrus production per hectare.
The more water used, the higher the production (table 2.7). Nevertheless, citrus
productivity per cubic meter of water does not show the same linearly positive
correlation (Edgren, 2005).
Table 2.7 Water and citrus production on three large-scale citrus farms in the Kat River Catchment (Edgren, 2005).
Farm Production (kg) per hectare
Water use m3 per hectare
Production (kg) per m3 of water
C 37000 6500 5,6 K 36000 6000 6 R 43000 7500 5,7
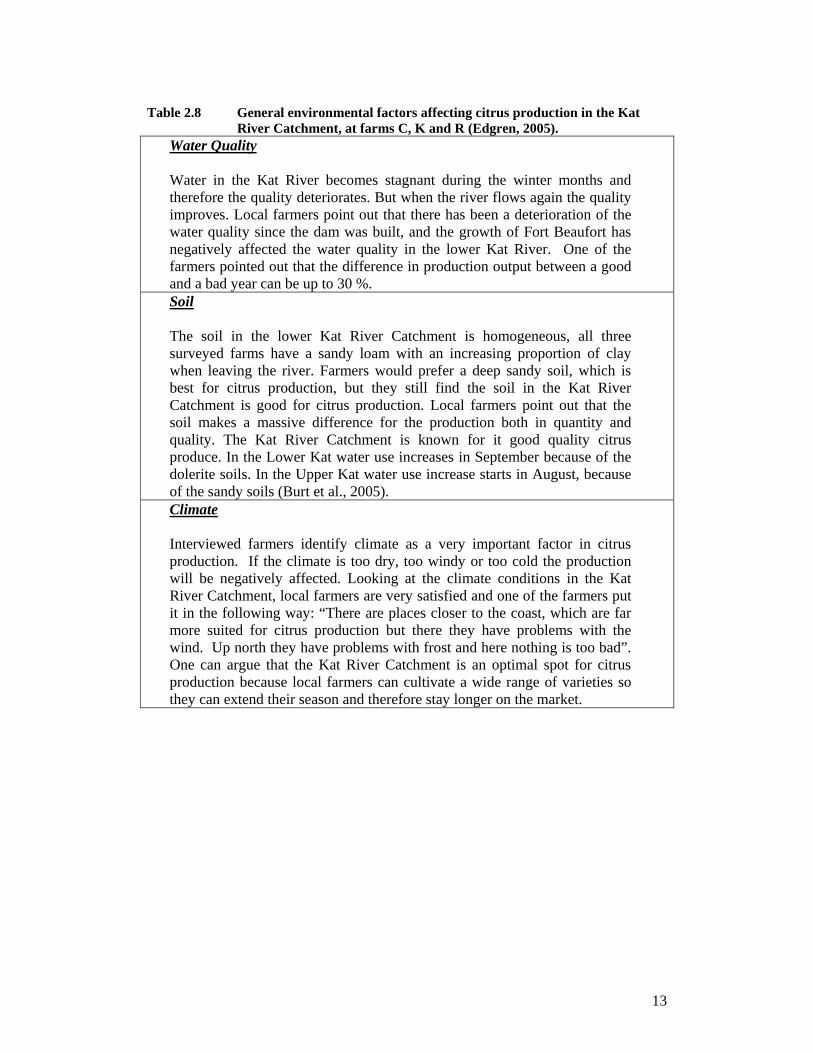
In fact, the amount of water alone does not explain everything. Many other factors
influence the observed differences in citrus production. Water quality, fertilizers and
pesticides type and quality of soil, varieties of crops, irrigation techniques and climate
are all equally important. The characteristics of some of these factors in the Kat River
Catchment are discussed below (Edgren, 2005).
13
Table 2.8 General environmental factors affecting citrus production in the Kat
River Catchment, at farms C, K and R (Edgren, 2005). Water Quality Water in the Kat River becomes stagnant during the winter months and therefore the quality deteriorates. But when the river flows again the quality improves. Local farmers point out that there has been a deterioration of the water quality since the dam was built, and the growth of Fort Beaufort has negatively affected the water quality in the lower Kat River. One of the farmers pointed out that the difference in production output between a good and a bad year can be up to 30 %. Soil The soil in the lower Kat River Catchment is homogeneous, all three surveyed farms have a sandy loam with an increasing proportion of clay when leaving the river. Farmers would prefer a deep sandy soil, which is best for citrus production, but they still find the soil in the Kat River Catchment is good for citrus production. Local farmers point out that the soil makes a massive difference for the production both in quantity and quality. The Kat River Catchment is known for it good quality citrus produce. In the Lower Kat water use increases in September because of the dolerite soils. In the Upper Kat water use increase starts in August, because of the sandy soils (Burt et al., 2005). Climate Interviewed farmers identify climate as a very important factor in citrus production. If the climate is too dry, too windy or too cold the production will be negatively affected. Looking at the climate conditions in the Kat River Catchment, local farmers are very satisfied and one of the farmers put it in the following way: “There are places closer to the coast, which are far more suited for citrus production but there they have problems with the wind. Up north they have problems with frost and here nothing is too bad”. One can argue that the Kat River Catchment is an optimal spot for citrus production because local farmers can cultivate a wide range of varieties so they can extend their season and therefore stay longer on the market.
14
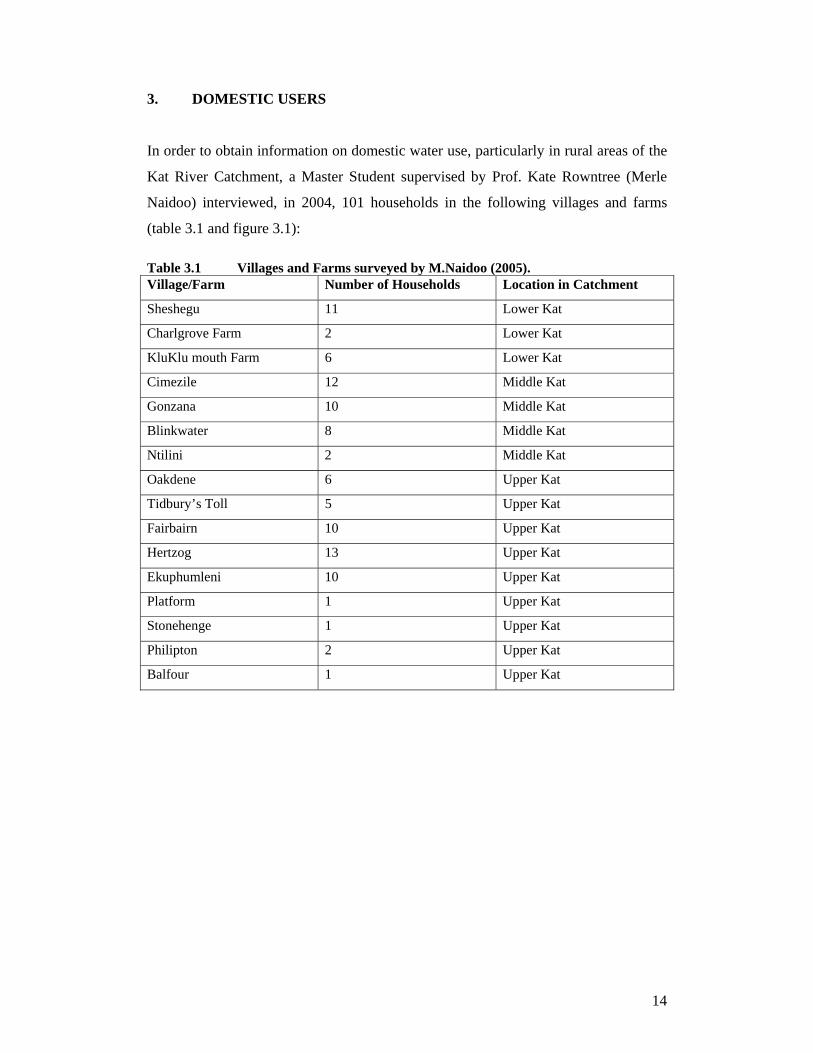
3. DOMESTIC USERS
In order to obtain information on domestic water use, particularly in rural areas of the
Kat River Catchment, a Master Student supervised by Prof. Kate Rowntree (Merle
Naidoo) interviewed, in 2004, 101 households in the following villages and farms
(table 3.1 and figure 3.1):
Table 3.1 Villages and Farms surveyed by M.Naidoo (2005). Village/Farm Number of Households Location in Catchment
Sheshegu 11 Lower Kat
Charlgrove Farm 2 Lower Kat
KluKlu mouth Farm 6 Lower Kat
Cimezile 12 Middle Kat
Gonzana 10 Middle Kat
Blinkwater 8 Middle Kat
Ntilini 2 Middle Kat
Oakdene 6 Upper Kat
Tidbury’s Toll 5 Upper Kat
Fairbairn 10 Upper Kat
Hertzog 13 Upper Kat
Ekuphumleni 10 Upper Kat
Platform 1 Upper Kat
Stonehenge 1 Upper Kat
Philipton 2 Upper Kat
Balfour 1 Upper Kat
15
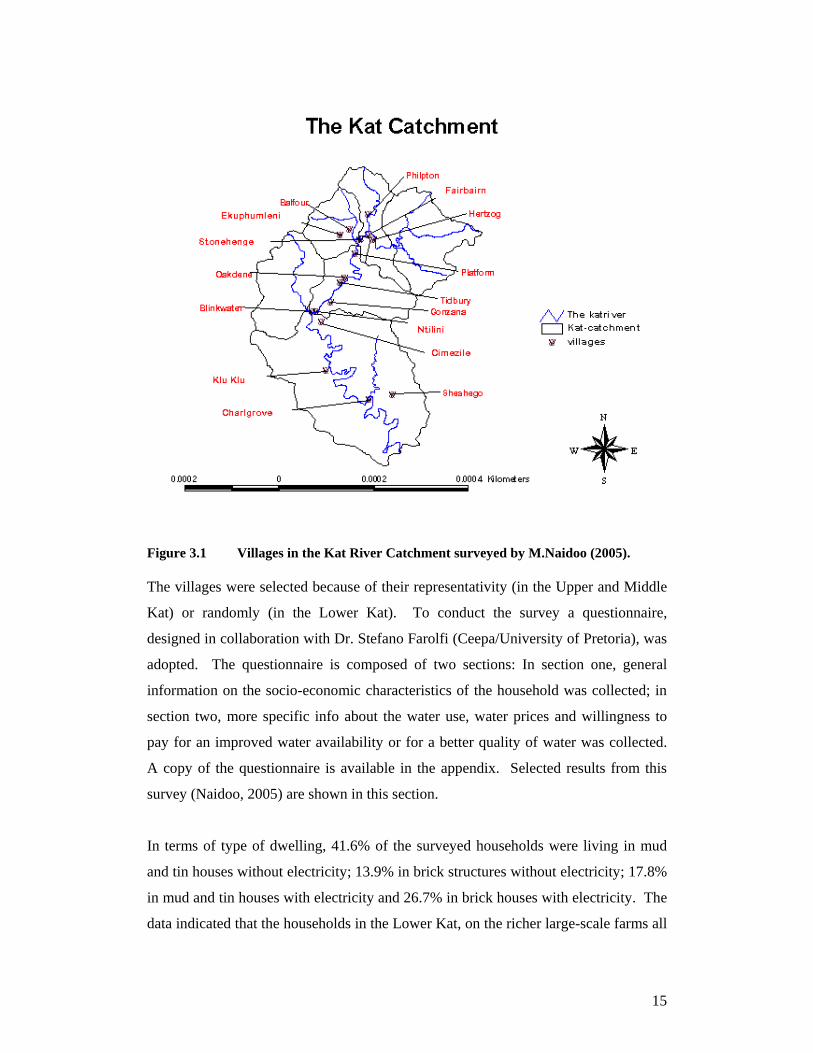
Figure 3.1 Villages in the Kat River Catchment surveyed by M.Naidoo (2005). The villages were selected because of their representativity (in the Upper and Middle
Kat) or randomly (in the Lower Kat). To conduct the survey a questionnaire,
designed in collaboration with Dr. Stefano Farolfi (Ceepa/University of Pretoria), was
adopted. The questionnaire is composed of two sections: In section one, general
information on the socio-economic characteristics of the household was collected; in
section two, more specific info about the water use, water prices and willingness to
pay for an improved water availability or for a better quality of water was collected.
A copy of the questionnaire is available in the appendix. Selected results from this
survey (Naidoo, 2005) are shown in this section.
In terms of type of dwelling, 41.6% of the surveyed households were living in mud
and tin houses without electricity; 13.9% in brick structures without electricity; 17.8%
in mud and tin houses with electricity and 26.7% in brick houses with electricity. The
data indicated that the households in the Lower Kat, on the richer large-scale farms all
16
had electricity. The average distance between the villages and the Kat River is 2.5
km, but a high variance exists from village to village (figure 3.1).
The average age of the household head was 58 years, 51 of them were male, 47
female, and 3 unknown. The mean educational level of the household head on a scale
from 0 (no education) to 12 (last year of high school) was around 6, varying between
3 and 9 (table 3.2).
The average household size is 5.5, varying between 4 and 6. Most of the time, only
one person per household is employed, often nobody is working. This is consistent
with the high level of unemployment in the area. The average income per head of
household was about R800 per month. It was lower if the head was a pensioner or
unemployed, it was higher if the head worked in the service-providing sector (teacher,
nurse, etc.). Government grants (200 R/month as an average) are very common in the
form of child grants, pensions and disability grants. Only a little minority of the
households owned their own land. The land is mainly owned by the state, the farm
chief or the community (Naidoo, 2005).
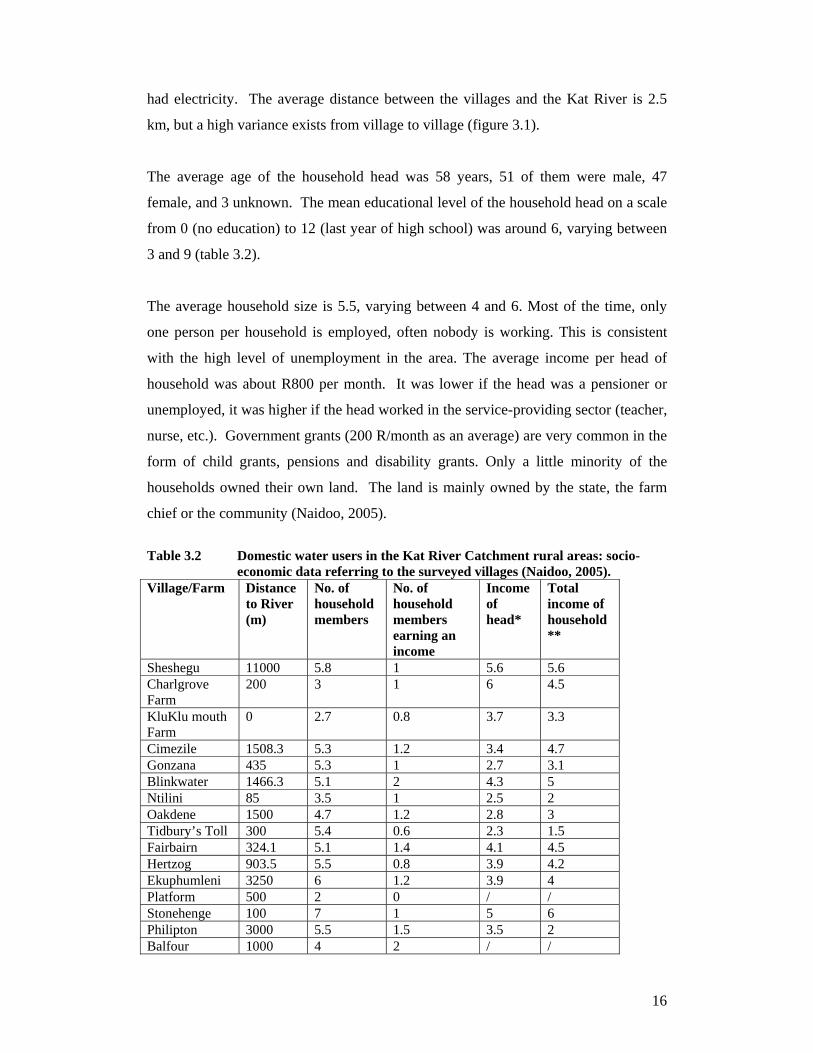
Table 3.2 Domestic water users in the Kat River Catchment rural areas: socio-
economic data referring to the surveyed villages (Naidoo, 2005). Village/Farm Distance
to River (m)
No. of household members
No. of household members earning an income
Income of head*
Total income of household **
Sheshegu 11000 5.8 1 5.6 5.6 Charlgrove Farm
200 3 1 6 4.5
KluKlu mouth Farm
0 2.7 0.8 3.7 3.3
Cimezile 1508.3 5.3 1.2 3.4 4.7 Gonzana 435 5.3 1 2.7 3.1 Blinkwater 1466.3 5.1 2 4.3 5 Ntilini 85 3.5 1 2.5 2 Oakdene 1500 4.7 1.2 2.8 3 Tidbury’s Toll 300 5.4 0.6 2.3 1.5 Fairbairn 324.1 5.1 1.4 4.1 4.5 Hertzog 903.5 5.5 0.8 3.9 4.2 Ekuphumleni 3250 6 1.2 3.9 4 Platform 500 2 0 / / Stonehenge 100 7 1 5 6 Philipton 3000 5.5 1.5 3.5 2 Balfour 1000 4 2 / /
17
* and ** : The values in the table correspond to the average answer for each village according to the following scales: *: < R200: 1, R200-R500: 2, R500-800: 3, R800-R1200: 4, R1200 –R1500: 5,
R1500-R2000: 6, R2000-R2500: 7, R2500-R3000: 8, >R3000: 9 **: < R500: 1, R500-R700: 2, R700-R1000: 3, R1000-R1300: 4, R1300-R1700: 5, R1700-R2000:
6, R2000-R2500: 7, R2500-R3000: 8, 3000-R3500: 9, R3500-R4000: 10, >R4000: 11 Rural domestic users in the Kat River Catchment get water for drinking, washing,
cooking, gardening and livestock. In the interviewed villages, 70.3% of the
households mainly used water from the river. The least river water was used in
villages like Cimezile, Sheshegu and Klu Klu Mouth Farm, most of them being
situated further from the river (figure 3.1). A large majority of the households
collected rainwater in a drum or a tank (77.2%). Very few households (5%) used
water from a dam. In Cimezile, Ekuphumleni, Sheshegu, Klu Klu Mouth Farm,
Charlgrove and Blinkwater, households get water from either private or community
taps.
For the whole sample the main water source is the river (52.5%) followed by
community tap (42%). Very few households have a pipe connection to their house.
In general people in the Kat River Catchment have to walk to get their water, and
sometimes they bring a wheelbarrow or a donkey. On average people collect water 10
to 15 times per week. Mostly women and children do the collecting. Everyone in the
household generally makes the decisions about the water used, if not it is the head that
decides.
The amount of water usually collected during one week is about 500 litres (table 3.3).
This amount corresponds to an average of 13 l/capita/day for an average household of
5.5 members, well below the indicated minimum requirement of 25 l/capita/day
prescribed by DWAF.
18
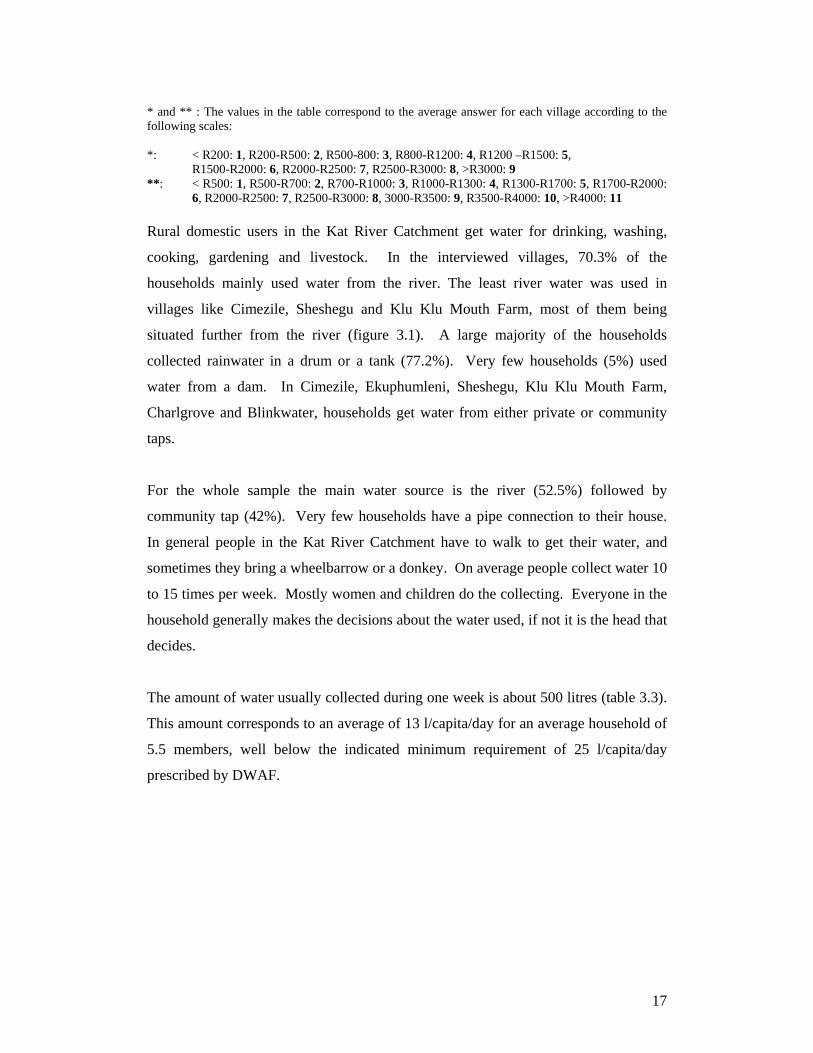
Table 3.3 Domestic water use characteristics in selected villages and farms in the Kat River Catchment rural areas (Naidoo, 2005).
Village/Farm Distance from main water source (m)
Number of trips per week to fetch water.
Litres collected per week.
Sheshegu 26.5 20.1 567.8 Charlgrove Farm 150 0 / KluKlu mouth Farm 76.7 14 392 Cimezile 175.4 12.9 585.9 Gonzana 700 13.3 577 Blinkwater 212.5 12.3 437.5 Ntilini / / / Oakdene 1500 12.2 437.5 Tidbury’s Toll 300 28 840 Fairbairn 400.1 10.8 586.9 Hertzog 883.1 15.3 498.8 Ekuphumleni 138.6 4.9 395 Platform 0 7 420 Stonehenge 100 14 700 Philipton 55 7 560 Balfour 1 3 300
The average distance to the main water source is just above 0.4 km (table 3.3). The
distance to the tap is shorter than the distance to the river.
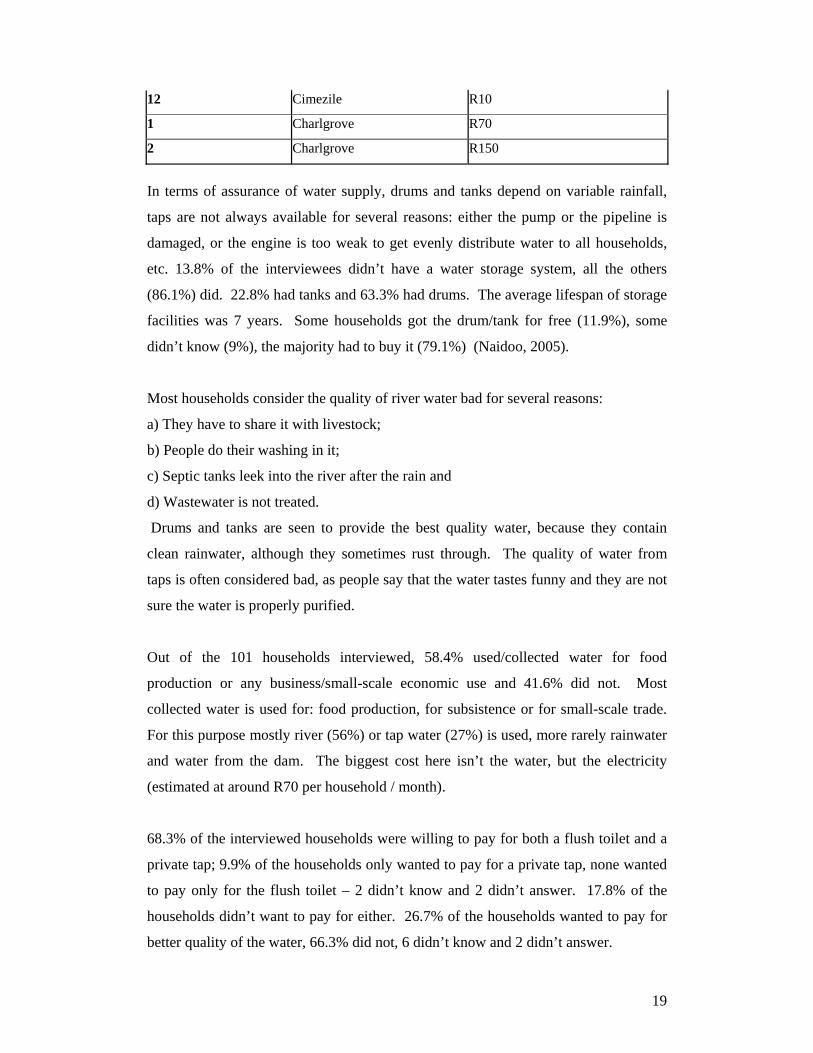
Households pay for tap water on Charlgrove Farm (R110/month) and Cimezile
(R20/month). Table 3.4 shows the monthly payments for community tap water as
referred by interviewed households.
Table 3.4 Rural households interviewed that pay for water (Naidoo, 2005). Household Village Amount paid per month
1 Cimezile R20
2 Cimezile R10
3 Cimezile R15
4 Cimezile R20
5 Cimezile R15
6 Cimezile R30
7 Cimezile R20
8 Cimezile R20
9 Cimezile R20
10 Cimezile R20
11 Cimezile R20 - R30
19
12 Cimezile R10
1 Charlgrove R70
2 Charlgrove R150
In terms of assurance of water supply, drums and tanks depend on variable rainfall,
taps are not always available for several reasons: either the pump or the pipeline is
damaged, or the engine is too weak to get evenly distribute water to all households,
etc. 13.8% of the interviewees didn’t have a water storage system, all the others
(86.1%) did. 22.8% had tanks and 63.3% had drums. The average lifespan of storage
facilities was 7 years. Some households got the drum/tank for free (11.9%), some
didn’t know (9%), the majority had to buy it (79.1%) (Naidoo, 2005).
Most households consider the quality of river water bad for several reasons:
a) They have to share it with livestock;
b) People do their washing in it;
c) Septic tanks leek into the river after the rain and
d) Wastewater is not treated.
Drums and tanks are seen to provide the best quality water, because they contain
clean rainwater, although they sometimes rust through. The quality of water from
taps is often considered bad, as people say that the water tastes funny and they are not
sure the water is properly purified.
Out of the 101 households interviewed, 58.4% used/collected water for food
production or any business/small-scale economic use and 41.6% did not. Most
collected water is used for: food production, for subsistence or for small-scale trade.
For this purpose mostly river (56%) or tap water (27%) is used, more rarely rainwater
and water from the dam. The biggest cost here isn’t the water, but the electricity
(estimated at around R70 per household / month).
68.3% of the interviewed households were willing to pay for both a flush toilet and a
private tap; 9.9% of the households only wanted to pay for a private tap, none wanted
to pay only for the flush toilet – 2 didn’t know and 2 didn’t answer. 17.8% of the
households didn’t want to pay for either. 26.7% of the households wanted to pay for
better quality of the water, 66.3% did not, 6 didn’t know and 2 didn’t answer.
20
Reasons for desiring a private tap were: “we won't have to worry about safety of
water; we won't have to travel long distances; we would no longer have to worry
about diseases; taps will make our lives better; we will know that the water we are
drinking is clean; this will ensure that we always get water; we also need clean and
fresh water like everybody else”. The main reason for not wanting a private tap was
lack of funds to pay for the service.
The most mentioned reason for desiring a flush toilet was that pit latrines are not at all
hygienic and not good for health. Also digging a new hole or destroying the old one
takes time. Here also money was the critical problem: the households who didn’t
want to pay for better water quality were too poor to afford this commodity (Naidoo,
2005).
21
4. STAKEHOLDERS’ FUTURE PERSPECTIVES
As part of the development of the KatAWARE model, with the local stakeholders, the
Project’s ‘social team’ and Dr Farolfi and his team organised a first workshop in Fort
Beaufort, June 2005. An objective of the workshop was: “making the model our
model, giving the stakeholders the opportunity to contribute to the development of the
model by discussing water use under current practices and proposed future
practices”. Methods to obtain these objectives included:
• Visual representation of identity as a representative of particular water users
on a map of the catchment;
• Facilitated group discussions;
• Mixed stakeholders discussions and activities;
• Use of a 3-D model (wooden blocks and wooden panel representing water use
over a year);
• Group discussions presented back to everyone with the opportunity for all
participants to ask questions (Burt et al., 2005).
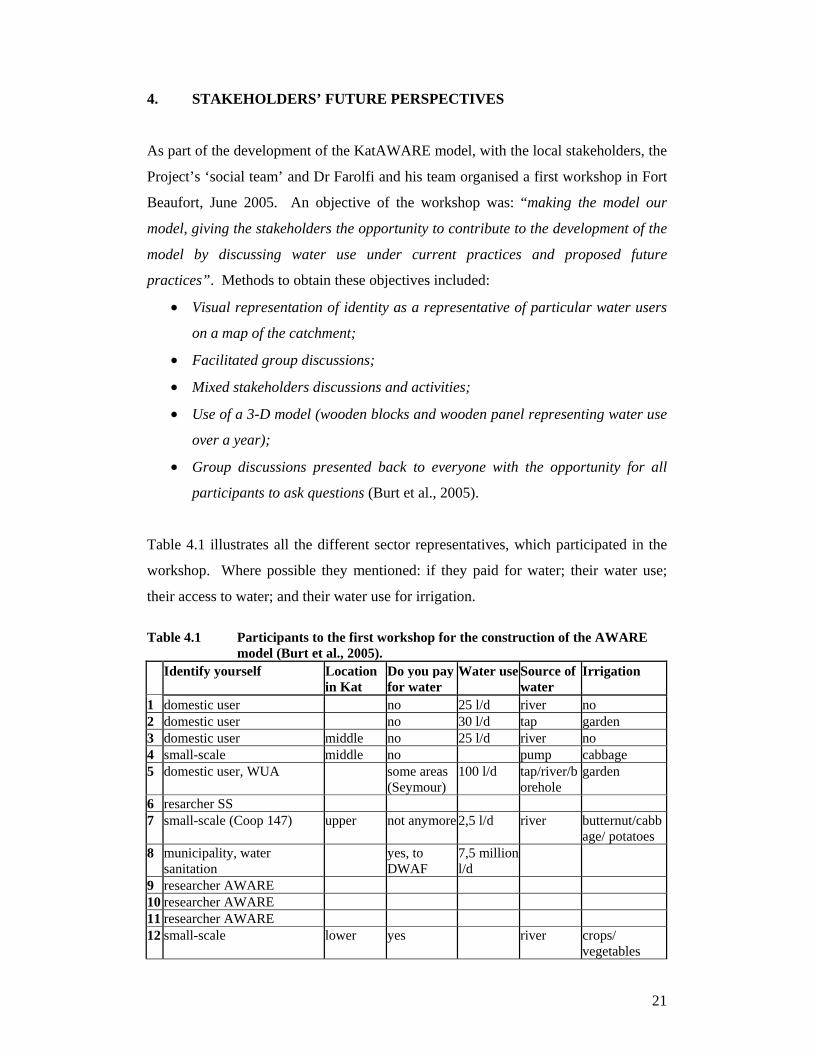
Table 4.1 illustrates all the different sector representatives, which participated in the
workshop. Where possible they mentioned: if they paid for water; their water use;
their access to water; and their water use for irrigation.
Table 4.1 Participants to the first workshop for the construction of the AWARE
model (Burt et al., 2005). Identify yourself Location
in Kat Do you pay for water
Water use Source of water
Irrigation
1 domestic user no 25 l/d river no 2 domestic user no 30 l/d tap garden 3 domestic user middle no 25 l/d river no 4 small-scale middle no pump cabbage 5 domestic user, WUA some areas
(Seymour) 100 l/d tap/river/b
orehole garden
6 resarcher SS 7 small-scale (Coop 147) upper not anymore 2,5 l/d river butternut/cabb
age/ potatoes 8 municipality, water
sanitation yes, to
DWAF 7,5 million l/d
9 researcher AWARE 10 researcher AWARE 11 researcher AWARE 12 small-scale lower yes river crops/
vegetables
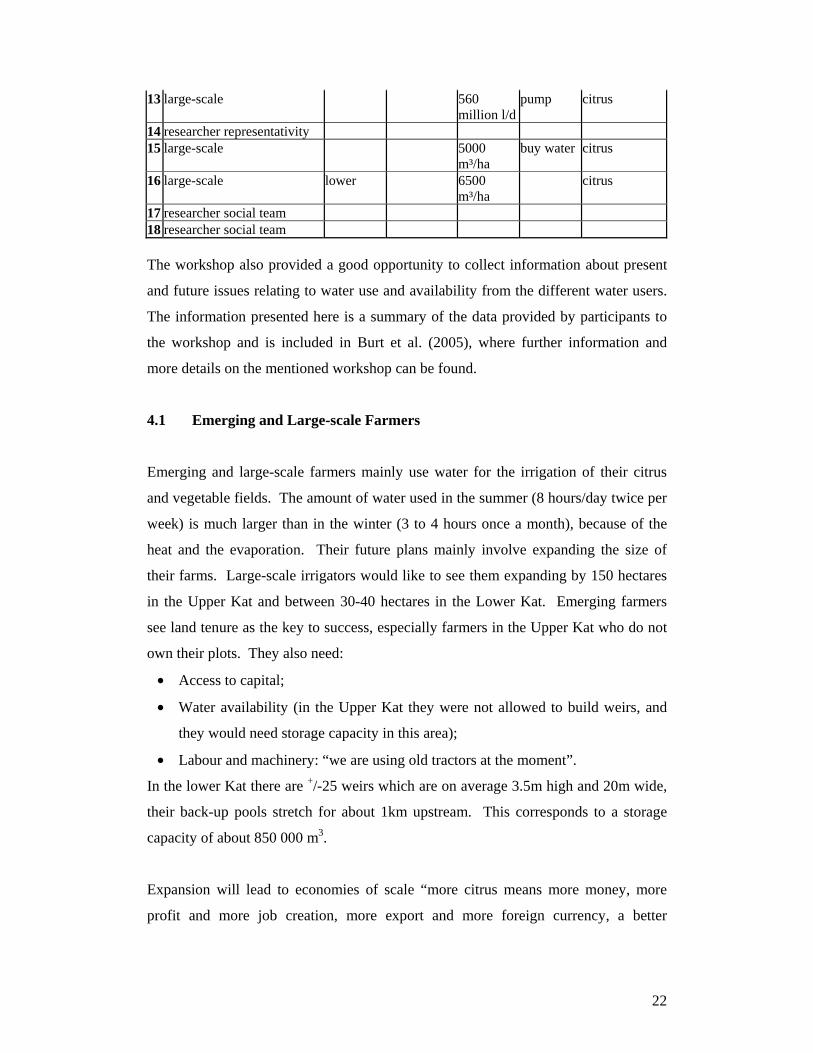
22
13 large-scale 560 million l/d
pump citrus
14 researcher representativity 15 large-scale 5000
m³/ha buy water citrus
16 large-scale lower 6500 m³/ha
citrus
17 researcher social team 18 researcher social team The workshop also provided a good opportunity to collect information about present
and future issues relating to water use and availability from the different water users.
The information presented here is a summary of the data provided by participants to
the workshop and is included in Burt et al. (2005), where further information and
more details on the mentioned workshop can be found.
4.1 Emerging and Large-scale Farmers
Emerging and large-scale farmers mainly use water for the irrigation of their citrus
and vegetable fields. The amount of water used in the summer (8 hours/day twice per
week) is much larger than in the winter (3 to 4 hours once a month), because of the
heat and the evaporation. Their future plans mainly involve expanding the size of
their farms. Large-scale irrigators would like to see them expanding by 150 hectares
in the Upper Kat and between 30-40 hectares in the Lower Kat. Emerging farmers
see land tenure as the key to success, especially farmers in the Upper Kat who do not
own their plots. They also need:
• Access to capital;
• Water availability (in the Upper Kat they were not allowed to build weirs, and
they would need storage capacity in this area);
• Labour and machinery: “we are using old tractors at the moment”.
In the lower Kat there are +/-25 weirs which are on average 3.5m high and 20m wide,
their back-up pools stretch for about 1km upstream. This corresponds to a storage
capacity of about 850 000 m3.
Expansion will lead to economies of scale “more citrus means more money, more
profit and more job creation, more export and more foreign currency, a better
23
concurrence position”. Water use in 5 to 10 years is likely to change proportionally
with this expansion (Burt et al., 2005).
When asked how the emerging and large-scale farmers think their present and future
use of water would impact other water users and how other water users would impact
them, they said the creation of employment through their expansion would be a
positive effect. More water use could potentially have a negative impact on the
availability of water for others. While more land will be used, farmers pointed out
that citrus need less water then other crops. Non-scheduled farmers from the Lower
Kat could be disadvantaged if farmers from the Upper and Middle Kat use more
water. Farmers from the Lower Kat are also more vulnerable for water quality and
salinity, with highest salinities occurring during spring. The Fort Beaufort town
barrage needs water every 10 days due to the silting up of barrage. Before the silting,
water in the barrage lasted up to 4 months (Burt et al., 2005).
Emerging farmers will have to deal with several problems:
1. Land title is the biggest issue.
2. Access to capital: because of land tenure issues farmers cannot get bank loans:
“The only way you can get money for investments is from profits”.
3. Water assurance of supply: it might not be enough in the future. In the past
farmers in the Upper Kat have been prevented from building weirs because of
concerns that these upper farmers would limit or stop the water flowing to the
Lower Kat.
4. Labour: people might migrate out of the catchment and then there will be an
insufficient workforce; HIV/AIDS is also a crucial concern in this sense.
5. Machinery: it is often very old and it “breaks all the time”.
6. Water supply. No water rights (no licences), means no water security. When
you are a scheduled user you do have water rights. There is generally scarcity
once every twenty years, then the farmers have to use ground water. This
groundwater is however, very brackish and bad for the trees if used for an
extended period of time (Bur et al, 2005).
24
4.2 Small-scale Farmers
Small-scale farmers mainly use water for the irrigation of their vegetables. In summer
they use more water than in winter, because of the heat and evaporation. Water use
increases in October/November when growing butternut and cabbage. In December
they are harvesting and use less water. In January/February use increases because
new crops are planted. February is the month during which the highest water
consumption is observed. In March/April water use drops again. May and August are
similarly low.
Small-scale users would like to be able, in the future, to expand their land from the
current 1ha to 5ha and become emerging farmers. They would like to have
equipment, e.g. tractors and irrigation pipes to accompany their expansion. Small-
scale users would like to expand the number of crops grown and expand their market.
Small-scale users are at the moment negotiating with the municipality for vacant land.
“More land means more crops and more widespread market”.
Water use in the future will follow this expansion. A better access to equipment and
technique of irrigation (e.g. from furrow to pipe) would diminish the amount of water
used through a reduced evaporation and would make the maintenance cheaper (Burt et
al., 2005).
When asked how the small-scale farmers think their present and future use of water
would impact other water users and how other water users would impact them, they
said that they would not affect other stakeholders, but cooperation shall be required.
A potential problem will be that some people pay and some do not, some people use
more water than others, and some people have better access than others.
There is a continual concern amongst downstream users, that upstream users will take
the water, especially in summer (Burt et al., 2005).
25
4.3 Domestic Users
Domestic users use water for household use and for watering their gardens. In the
summer more water is used because relatives living elsewhere come home for the
festive season, additionally more water is needed for the gardens. In the future they
would like to have the opportunity to irrigate for commercial agriculture. Rural
domestic users want land because they believe that without land there is nothing they
can do. Flush toilets should be realized in five years, private indoor taps in ten years
(Burt et al., 2005).
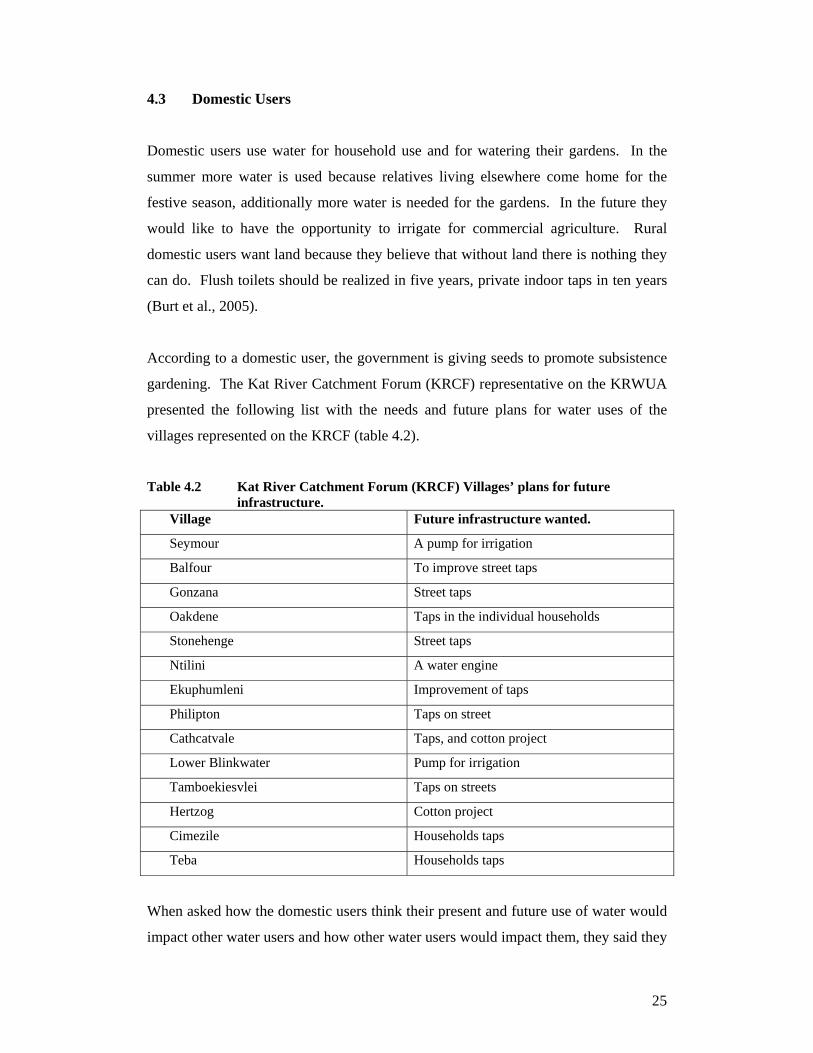
According to a domestic user, the government is giving seeds to promote subsistence
gardening. The Kat River Catchment Forum (KRCF) representative on the KRWUA
presented the following list with the needs and future plans for water uses of the
villages represented on the KRCF (table 4.2).
Table 4.2 Kat River Catchment Forum (KRCF) Villages’ plans for future infrastructure.
Village Future infrastructure wanted.
Seymour A pump for irrigation
Balfour To improve street taps
Gonzana Street taps
Oakdene Taps in the individual households
Stonehenge Street taps
Ntilini A water engine
Ekuphumleni Improvement of taps
Philipton Taps on street
Cathcatvale Taps, and cotton project
Lower Blinkwater Pump for irrigation
Tamboekiesvlei Taps on streets
Hertzog Cotton project
Cimezile Households taps
Teba Households taps
When asked how the domestic users think their present and future use of water would
impact other water users and how other water users would impact them, they said they
26
would have no impact on others but they indicated that there must be negotiations.
They consider that water taken from the river might influence the farmers, whereas
water taken from the tap would not (Burt et al., 2005).
In the future, downstream users will be concerned that upstream users will take the
water, especially in summer. Their main problem is access to water. Nobody takes
care of taps because they are public property. Taps are often far away. One must
engage stakeholders to inform them on the institutions they can approach to address
their problems and ideas, e.g. Department of Land Affairs, DWAF, Municipality and
Department of Agriculture. These departments are supposed to help with land
ownership issues, financial and equipment assistance i.e. provide tractors, pipes and
pumps. They said they need an advisor to help them determine what channels to take
in order to achieve their future plans. They don’t know the steps that would need to
be taken. Representatives of domestic users also pointed out that funding could be a
problem. The biggest problem they identified is land ownership.
The future plans for the local Municipality were illustrated in this way: “We want to
enlarge the treatment plants, because the quality of the water collected from rivers
decreases during winter. We also are installing water meters in houses for payment
purposes. There will be an increase in water demand caused by development
(housing)” (Burt et al., 2005).
27
5. CONCLUSION
Primary data on water users and uses were collected in the Kat River Catchment to
complement the secondary information contained in Farolfi-Jacobs (2005). Both
secondary and primary data are currently being used to calibrate the KatAWARE
simulation model (Farolfi-Rowntreee, 2005) that will be adopted within a Companion
Modelling Approach with the KRWUA to implement a strategy for participatory
water management in the Kat River Catchment.
Despite the mentioned difficulties in obtaining reliable data from field surveys, this
report contains valuable information on the socio-economic aspects of water use by
the main groups of water users in the catchment, namely irrigators (large scale,
emerging, and small scale) and domestic users.
The section on local stakeholders’ perspectives and preoccupations about future water
use and availability is a precious complement of information to simulate water users’
behaviours and defining scenarios to be tested through the KatAWARE model and
discussed with the KRWUA members during the next workshop (set to occur in
September 2005).
28
REFERENCES Burt, J. (2005) A strategy for participatory water resource management in the Kat
River Catchment, Unpublished Water Research Commission Report. Project no K5/1496. Institute of Water Research, Rhodes University, Grahamstown.
Burt, J. Fox, H. de Jong, M. Gumede, H. Ntshudu, M. & Vanderford, P. (2005)
Workshop 1: The construction of the AWARE model for the Kat River Catchment, Unpublished Water Research Commission Report. Project no K5/1496. Institute of Water Research, Rhodes University, Grahamstown.
Edgren J. (2005) Water the most critical factor in Citrus Production? A case study of
commercial citrus production in Kat River Catchment, South Africa. Unpublished Research Report, Rhodes University, Grahamstown.
Farolfi, S. (2004) Action research for the development of a negotiation support tool
towards decentralized water management in South Africa, Working paper n. 04-01. Dpt. of Agricultural Economics, University of Pretoria.
Farolfi, S., Jacobs, J. (2005) Water availability, requirements, and water-related
socio-economic aspects of the Kat River Catchment : a survey on secondary data, Unpublished Water Research Commission Report. Project no K5/1496. Institute of Water Research, Rhodes University, Grahamstown.
Farolfi, S., Rowntree, K. (2005) Accompanying local stakeholders in negotiation
processes related to water allocation through simulation models and role-playing games: an experience from South Africa. Paper submitted to the int. workshop: End-user ownership and involvement in Integrated Water Resource Management, Cairo, Egypt. 13-17 November 2005.
Fox, H.E. (2005) The role of anthropogenic disturbance in the creation of a socio-
ecological landscape. Unpublished MSc thesis, Rhodes University, South Africa.
Mlilo N. (2005) Research about emerging Citrus Farmers in the Kat River Valley.
Unpublished Research Report, Rhodes University, Grahamstown. Mujkanovic A. (2005) Citrus Farmers as Employers in South Africa, a case study of
Kat River Valley in Eastern Cape. Unpublished Research Report, Rhodes University, Grahamstown.
Naidoo M. (2005) An investigation into the public participation component of water
resource management in the Kat River Valley, Eastern Cape, South Africa. Unpublished Msc Thesis, Rhodes University, Grahamstown.
Ngqangweni, S. (2000) Promoting income and employment growth in the rural
economy of the Eastern Cape through smallholder agriculture, PhD Thesis, University of Pretoria, 191 p. + annexes.
29
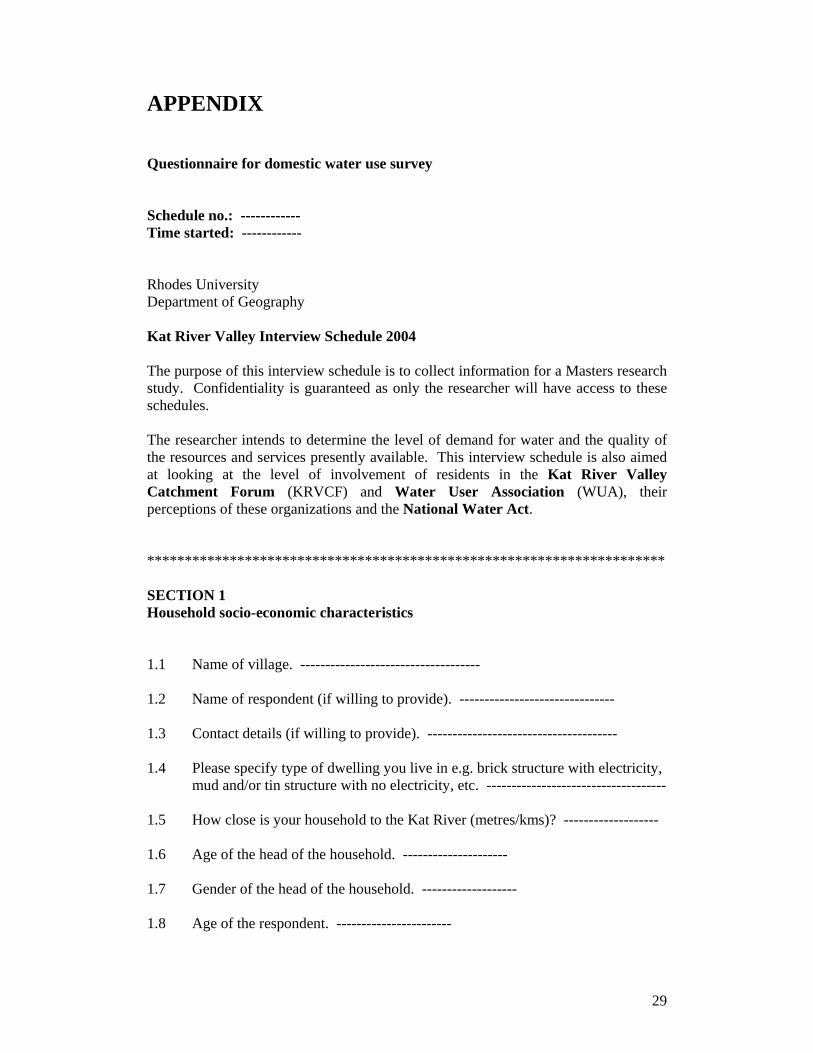
APPENDIX
Questionnaire for domestic water use survey
Schedule no.: ------------ Time started: ------------ Rhodes University Department of Geography Kat River Valley Interview Schedule 2004 The purpose of this interview schedule is to collect information for a Masters research study. Confidentiality is guaranteed as only the researcher will have access to these schedules. The researcher intends to determine the level of demand for water and the quality of the resources and services presently available. This interview schedule is also aimed at looking at the level of involvement of residents in the Kat River Valley Catchment Forum (KRVCF) and Water User Association (WUA), their perceptions of these organizations and the National Water Act. ********************************************************************* SECTION 1 Household socio-economic characteristics
1.1 Name of village. ------------------------------------ 1.2 Name of respondent (if willing to provide). ------------------------------- 1.3 Contact details (if willing to provide). -------------------------------------- 1.4 Please specify type of dwelling you live in e.g. brick structure with electricity,
mud and/or tin structure with no electricity, etc. ------------------------------------ 1.5 How close is your household to the Kat River (metres/kms)? ------------------- 1.6 Age of the head of the household. --------------------- 1.7 Gender of the head of the household. ------------------- 1.8 Age of the respondent. -----------------------
30
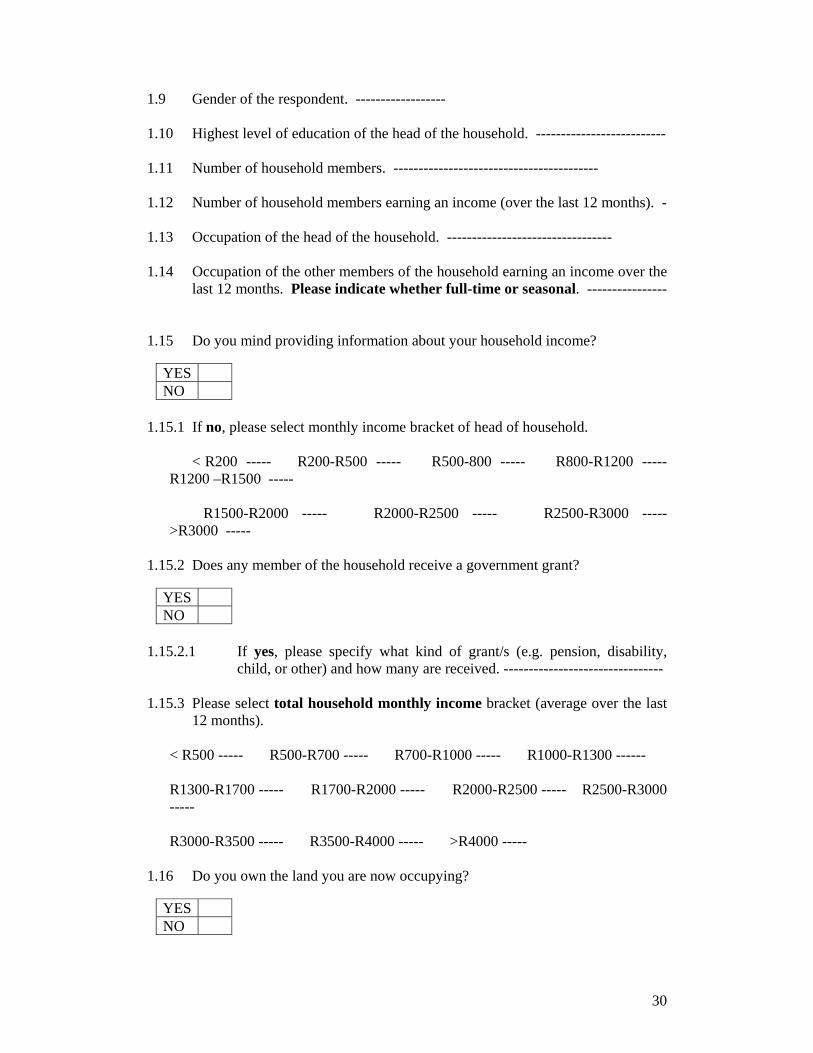
1.9 Gender of the respondent. ------------------ 1.10 Highest level of education of the head of the household. -------------------------- 1.11 Number of household members. ----------------------------------------- 1.12 Number of household members earning an income (over the last 12 months). - 1.13 Occupation of the head of the household. --------------------------------- 1.14 Occupation of the other members of the household earning an income over the
last 12 months. Please indicate whether full-time or seasonal. ----------------
1.15 Do you mind providing information about your household income?
1.15.1 If no, please select monthly income bracket of head of household.
< R200 ----- R200-R500 ----- R500-800 ----- R800-R1200 ----- R1200 –R1500 ----- R1500-R2000 ----- R2000-R2500 ----- R2500-R3000 ----- >R3000 -----
1.15.2 Does any member of the household receive a government grant?
1.15.2.1 If yes, please specify what kind of grant/s (e.g. pension, disability,
child, or other) and how many are received. -------------------------------- 1.15.3 Please select total household monthly income bracket (average over the last
12 months). < R500 ----- R500-R700 ----- R700-R1000 ----- R1000-R1300 ------ R1300-R1700 ----- R1700-R2000 ----- R2000-R2500 ----- R2500-R3000 ----- R3000-R3500 ----- R3500-R4000 ----- >R4000 -----
1.16 Do you own the land you are now occupying?
YES NO
YES NO
YES NO
31
1.16.1 If no, who does own the land? --------------------------------------- 1.16.2 What is your security of tenure i.e. legally, do you have a right to be here e.g.
title deed? --------------------------------------------------------------------------------- 1.16.3 Have any land claims been made on the land you live on?
1.16.3.1 If yes, by whom (you or an outside party)? --------------------------------- 1.16.3.2 When was the claim made? ------------------------- 1.16.3.3 What have been the results so far? ------------------------------------------- 1.16.4 Who controls what you can do on the land? ---------------------------------------------------------- 1.16.5 What restrictions regarding the use of land and water are there?
----------------------------------------------------------------------------------------------
1.16.6 Are decisions regarding the use of land and other natural resources made by individuals or the community? Please explain. -------------------------------------
1.17 Does the household have any property rights/access to land for agricultural
use?
1.17.1 If yes, please list whether private or communal property rights. -----------------
-------------- ********************************************************************* SECTION 2 Water sources and water uses 2.1 From what source/s do you get your water supply for household use (not
irrigation/business) e.g. drinking, cooking, washing, etc? Please list the different sources and next to them the different uses for each source. (* very important: drinking water source). Source Use/s --------------------- -------------------------------------------------------------------------------------------------------------------------- -- -------------------------------------------
YES NO
YES NO
32
2.2 Do you pay for any of the above water sources?
2.2.1 If yes, please list source/s and approximate amount paid per month.
Source ------------------------------ R ------------------- --------------------------------------- -------------------
Is water always available from all your sources?
2.3.1 If no, please state source(s) and reason/s why. --------------------------------------------------------------------------------------------------------------------------------------------------------------------------------------------
2.3.2 How would you rate the quality of water from each of the sources you utilize (good, very good, satisfactory, bad or very bad)? Please provide a reason for your answer?
Source Rating Reason/s --------------------------- --------------------- ---------------------------------------------------------------------------------------------- ---------------------
2.5 What is your main source of water for household use (select one from answer
to 1.1)? -------------- 2.6 How far is this main water supply from your home (round trip)? Km ---- m -
--- 2.7 What means of transport do you use to collect water? -----------------------------
---------- 2.8 How often do you collect water from this supply (if daily, please specify no. of
trips per day)? ------------ -------------------------------------------------------------------
2.9 Who usually collects the water in your household? -------------------------------- 2.10 Who decides how this water is used? -------------------------------------- 2.11 How much water do you collect per day/week (container/s size in litres x no.
of trips)? -------------------------------- 2.12 Do you use/collect water for food production or any business/small-scale
economic use? YES NO
YES NO
YES NO
33
If no for 2.12 please proceed to question 2.14. 2.12.1 If yes, please specify for what purpose e.g. subsistence or small-scale
agriculture, small-scale economic use e.g. spaza shop, hairdressing business, etc. Please specify if other (e.g. citrus farming). ----------------------------------------------------------------------------------------------------------
2.12.2 What is your source of water for this use? -------------------------------
2.12.3 Do you pay for this water?
YES NO
2.12.3.1 If yes, please provide approximate amount paid per month. R ----------
-------- 2.12.4 Is the water supply always available from this source?
YES NO
2.12.4.1 If no, please provide reason/s why. ------------------------------------------
---------------------------------------------------------------------------------------------- 2.12.5 How far is this water source from your irrigation plot/business (round trip)?
Km ---- m ----
2.12.6 How do you transport water to your plot/business location? ----------------------------------
2.12.7 How often is this done? --------------------------- 2.12.8 Who in your household undertakes this task? --------------------------------- 2.12.9 Approximately how much water do you use for irrigating/your business each
day/week (in litres)? ------------------
2.13 Do you sell any of the crops you grow?
2.13.1 If yes, how important is this income source to you i.e. is it the only source of
income, the most important source or is it a supplement? --------------------------------------------------------------------------------------------------------------------------------------------------------------------------------------------
2.13.2 Do you eat any of the crops grown?
YES NO N/A
34
2.13.2.1 If yes, how does this contribute to your overall food consumption? ----
------------------------------------------------------------------------------------------------------------------------------------------------------------
2.13.3 Do you belong to an irrigation group e.g. HACOP? If yes, please provide
details. ------------------------------------------------------------------------------------------------------------------------
******************************************************************* Answer only if answer to 2.12 is no. If answer to 2.12 is yes, please proceed to 2.15.
2.14.1 If no, please state reasons why. -----------------------------------------------------------------------------------------------------------------------------------------------------
2.14.1 Would you like to do so in the future?
2.14.1.1 Please provide a reason/s for the above answer? ---------------------------
---------------------------------------------------------------------------------------------- ********************************************************************* 2.14.2 What are the main challenges you face with respect to water supply? ----------
---------------------------------------------------------------------------------------------- 2.14.3 How can these challenges be addressed? --------------------------------------------
---------------------------------------------------------------------------------------------- 2.14.4 What does “better access” to water mean to you? --------------------------------
---------------------------------------------------------------------------------------------- 2.14.5 If you and your household were given “better access” to water resources
how would this benefit you? ---------------------------------------------------------------------------------------------------------------------------------------------------------
2.14.6 If you and your household were given “better access” to water services (i.e.
household taps & flush toilets) how would this benefit you? -------------------------------------------------------------------------------------------------------------------
YES NO
YES NO
35
2.20. Can you think of any way your household monthly income or quality of life could be increased/improved if the above were to happen (2.18 and 2.19)? -----------------------------------------------------------------------------------------------------------------------------------------------------------------------------------------------
2.21 Who in your household would benefit the most from this (women, children or
men)? Please provide reasons for your answer. ----------------------------------------------------------------------------------------------------------------------------------
2.22 What benefits to the water resources in your area (e.g. Kat River, nearby
streams) would there be if you were given “better access” to water services? --------------------------------------------------------------------------------------------------------------------------------------------------------------------------------------------
2.23 How would you rate the quality of water from the nearby streams and river in
your area (good, very good, satisfactory, bad or very bad)? Please provide a reason for your answer. -------------------------------------------------------------------------------------------------------------------------------------------------------------
2.24 Does your household boil the water used for drinking?
2.24.1 Please provide a reason for your answer.
------------------------------------------------------------------------------------------------------------------------
2.25 Are water-borne diseases prevalent in your area? (E.g. cholera)
2.26 Is diarrhoea a problem in your area? 2.26.1 If yes, please state known or assumed causes. --------------------------------------
------------------------- 2.27 Does your household have a water storage system/facility (e.g. rainwater
storage tank)?
YES NO
YES NO
YES NO
YES NO
36
If no, please proceed to question 2.28. 2.27.1 If yes, please specify type of storage system/facility. ------------------------------
---------------------------- 2.27.2 Period of use of system. ------------------------- 2.27.3 Cost of system. ------------- 2.27.4 What is this water used for? -----------------------------------------------------------
------------------------ 2.27.5 Is water always available from this source?
2.27.5.1 If no, please state maximum duration of water availability from this
source. -------------- ********************************************************************* 2.28.1 Are there any other sources of water you utilize that we have not talked about?
If yes, please list them. --------------------------------------------------------------------------------------------------------------------------------------
2.29 Please list all water uses of your household that are not mentioned above,
together with their sources (e.g. water for livestock from river). ------------------------------------------------------------------------------------------------------------------------------------
2.30 Are you willing to pay to have a tap and flush toilet system installed in your
house?
2.30.1 Please provide reasons for your answer. ---------------------------------------------
---------------------------------------------------------------------------------------------- 2.30.2 If yes, please state how much you would be willing to pay per month for each
service. 2.30.2.1 Flush toilet system R ----------- per month 2.30.2.2 Household tap R ----------- per month
YES NO
YES NO Tap only Flush toilet only
37
2.31 Would you be willing to pay for better water quality from your present water source/s?
2.31.1 Please provide reasons for the above answer. ---------------------------------------
---------------------------------------------------------------------------------------------- 2.32 Would you consider leaving the KRV for good if you were offered
accommodation with formal water services elsewhere (i.e. household tap and flush toilet system)? Please provide reasons for your answer. --------------------------------------------------------------------------------------------------------------------------------------------------------------------------------------------
Time of completion of questionnaire: ----------- Date of completion: ----------- Does the respondent mind being quoted in the researcher’s master thesis? ------------------------ Thank you for your time and effort in completing this questionnaire!!!
YES NO