Embed Size (px)
Citation preview

LIMITEDLC/CAR/L.89/Rev. 1 30 October 2006 ORIGINAL: ENGLISH
REPORT ON THE WORKSHOP ON DAMAGE AND LOSS ASSESSMENT AND THE IMPACT OF DISASTERS IN BELIZE
This document has been reproduced without formal editing.

Table of contents
Introduction.............................................................................................................................................. 1
Annex 1: Opening remarks from the Director o f N E M O ............................................................. 5
Annex 2: Participants for damage assessment workshop............................................................. 7
Annex 3: Case study: Exercise applied in the training course..................................................... 8
INTRODUCTION
In collaboration with the National Emergency M anagement Organization (NEMO), ECLAC conducted a three-day damage assessment workshop on the ECLAC methodology to assess sectoral, social, environmental and macro economic effects o f natural disasters. 1 The workshop was held at the NEM O Headquarters in Belmopan from 10 to 12 January. The training was funded by the Inter American Development Bank (IDB).
In 2000, ECLAC in collaboration with the IDB, the Inter American Institute for Cooperation on Agriculture (IICA), the United Nations Development Programme (UNDP), the Pan American Health Organization (PAHO) and the United Nations Children’s Fund (UNICEF) conducted an assessment on the macroeconomic, social and environmental consequences following the impact o f hurricane Keith. 2
BackgroundTo increase capacity in Belize, ECLAC conducted an initial damage assessment training course in 2001 and a refresher course in 2004. However because o f staff changes in NEMO and in the damage assessment teams, a request was made to conduct a full assessment course before the 2006 hurricane season. In response to this request NEM O and ECLAC organized and conducted a three-day training seminar on the application o f the ECLAC methodology for the assessment of the impact o f disasters. Part o f the training will be an exercise for participants to conduct an assessment in a specific context. The sectors selected are ecotourism and the agricultural sector.
InaugurationIn his opening remarks, the Co-ordinator o f NEMO stated that the Government o f Belize
was committed to undertake a Damage Assessment and Needs Analysis (DANA) immediately following the impact o f the disaster and to increase the DANA Committee’s capacity with trained and competent assessors. The Co-ordinator indicated that the ECLAC methodology would provide Belize with a useful tool in preparing disaster and risk management reports. The opening remarks are appended in Annex 1.
The main objective o f the workshop was to expose the DANA teams to the ECLAC damage assessment methodology, the fundamental concepts that underlay the ECLAC approach, sectoral applications o f the methodology and estimating the impact o f a disaster on the main macroeconomic parameters.
1 ECLAC (2003), Handbook for Estimating the Socio-Economic and Environmental Effects o f Disasters (LC/MEX/G.5) or (LC/L.1874).
2 ECLAC (2002), Belize: Assessment o f the Damage Caused by Hurricane Keith, 2000 (LC/CAR/G.627) or (LC/MEX/G.4).

2
Attendants and trainersThe workshop was conducted by a jo in t mission o f the ECLAC M exico and Port o f Spain
offices and included the ECLAC disaster focal point, Ricardo Zapata, Asha Kambon, Esteban Perez and Erik Blommestein.
Thirty-one people attended the workshop. However some o f the participants only attended part o f the workshop, in particularly those sessions that were o f immediate relevance to their day- to-day work. As a result 15 people participated in the case study and completed the questionnaire. The list o f participants is appended in Annex 2.
Agenda and programmeThe agreed agenda for the training covered the following topics: the vulnerability
conditions in Belize and, to set the stage for the training, a detailed presentation o f the ECLAC methodology and the application o f the exercises prepared especially for this training.
The programme is detailed as follows:
Tuesday 10 January
Op e n in g (NEMO Di r e c t o r )9.00 -9.15
W elcome remarksIntroduction o f trainers and participants - R. Zapata / NEM O
Se s s i o n 1: Vu l n e r a b i l i t y - Se t t i n g t h e s t a g e9.15 - 10.30
The concept o f vulnerability - R. Zapata Profile o f the Caribbean and its vulnerability - E. Blommestein The coastal zone - Summary o f hazards and vulnerabilities
10:30-11:30Introduction to the ECLAC Methodology - R. Zapata Key concepts and definitions
Coffee
Se s s i o n 2: Th e ECLAC Me t h o d o l o g y11.30 - 12.30
The human dimension: Affected population: gender differentiation, loss o f life, displaced population, homelessness, migration, employment effects, - A. Kambon
Lunch
Se s s i o n 3: Ap p l y i n g t h e m e t h o d o l o g y14.00 - 16.00
Basic services and Infrastructure:Transport, Communications, Energy, W ater supply - R. Zapata
16:00 - 17:00
3
Economic SectorsTourism - E. Blommestein Agriculture and fisheries- R. Zapata
We d n e s d a y 11 Ja n u a r y
Se s s i o n 3: Ap p l y i n g t h e m e t h o d o l o g y , c o n t i n u e d9.00 - 10.30
Economic Sectors: Continued - E. Pérez / O. Paddison M anufacturing/ Commercial sector - E. Pérez
Coffee
11.00 - 12:30Social Sectors: Housing, education, health - A. Kambon Restoring livelihoods
Lunch
14.00 - 15.00Environment and cultural heritage - E. Blommestein / R. Zapata
Se s s i o n 4: Pu t t i n g i t a l l t o g e t h e r - Su m m a r y o f e f f e c t s15.00 -17.00
Overall effects o f damages on the economy: macro economic im pacts- O. Paddison Overall effects o f damages: macro economic impacts continued Planning for vulnerability reduction - R. Zapata
Th u r s d a y 12 Ja n u a r y
Se s s i o n 5: Ca s e s t u d y9.00 - 10.30Presentation o f case study - R. Jovel (R. Zapata)
Description o f case study Organization o f working groups
Coffee
11.00 - 16:00Breakdown sessions for group work and preparation o f case study solution by groups. W ork is encourage to continue over lunch, for presentation in the afternoon
16:00 - 17:00Presentation o f case study results by each groupComments on results and solution to the case by case-study monitor - R. Zapata / E. Blommestein

4
17:00 - 17.30Closing o f the training (including distribution o f certificates o f attendance) - NEMO Director or designate
Evaluation of the courseA questionnaire was disseminated to all participants. O f those who completed the
questionnaire, 13 participants felt that the course had met their expectations, one indicated that the course exceeded and another one that it partially met expectations. No person indicated that the workshop had not met expectations.
With respect to the usefulness o f the workshop to their current work, nine people indicated that attending was very useful, five indicated that the course was useful and one indicated that the workshop was somewhat useful.
This assessment changed marginally with respect to the anticipated usefulness for future work. Eight people thought that the course was very useful, four indicated it was useful, two believed it to be somewhat useful and one person indicated that the course was not very useful.
M ost participants believed that there was just enough material presented (12 responses). One person did not respond to the question and the response o f the two others was equally divided between too much and not enough.
M ore practical exercises and the practical collection o f data were areas identified by eight participants for future training. Other future training aspects included social sector assessment.
5
Opening remarks from the Director of NEMO
Good morning:
Chief Executive Officer to the Ministry o f Natural Resources, Mr. Ismael Fabro, Mr. Ricardo Zapata and other ECLAC facilitators, various governmental and non-governmental representatives, my colleague from NEMO Secretariat, all;
Please allow me to express our deepest appreciation for your presence here today to participate in this very important workshop.
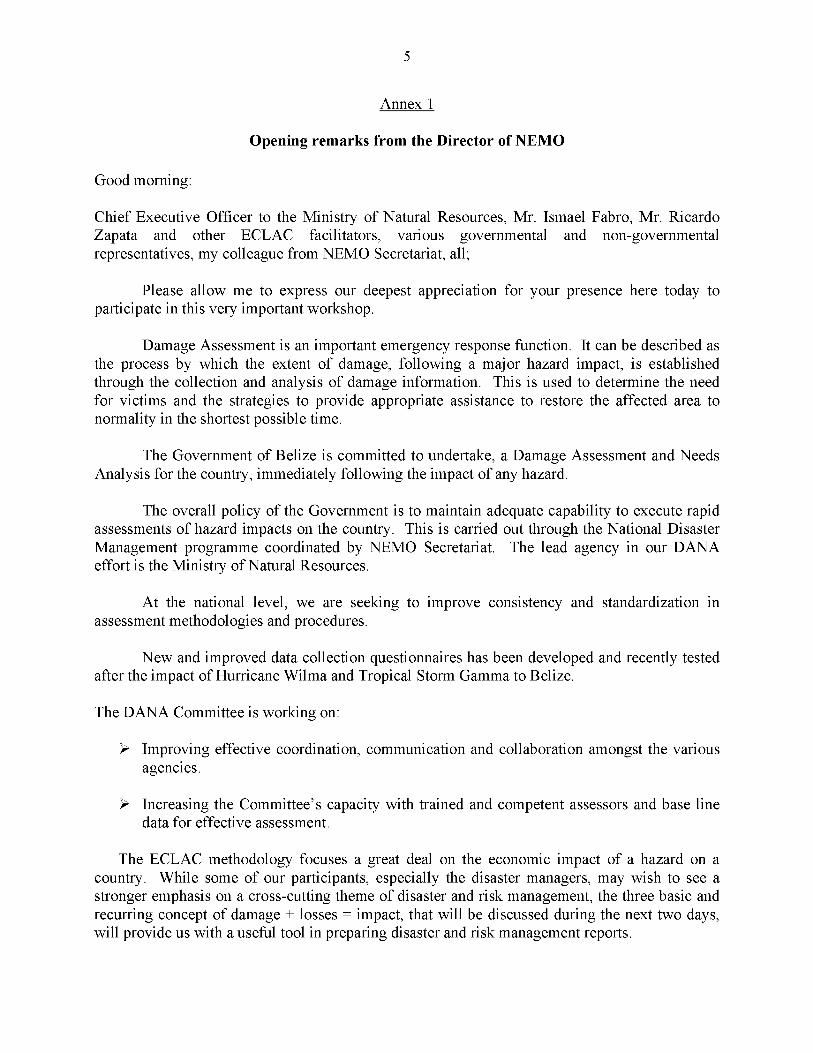
Damage Assessment is an important emergency response function. It can be described as the process by which the extent o f damage, following a major hazard impact, is established through the collection and analysis o f damage information. This is used to determine the need for victims and the strategies to provide appropriate assistance to restore the affected area to normality in the shortest possible time.
The Government o f Belize is committed to undertake, a Damage Assessment and Needs Analysis for the country, immediately following the impact o f any hazard.
The overall policy o f the Government is to maintain adequate capability to execute rapid assessments o f hazard impacts on the country. This is carried out through the National Disaster M anagement programme coordinated by NEMO Secretariat. The lead agency in our DANA effort is the Ministry o f Natural Resources.
At the national level, we are seeking to improve consistency and standardization in assessment methodologies and procedures.
N ew and improved data collection questionnaires has been developed and recently tested after the impact o f Hurricane W ilma and Tropical Storm Gamma to Belize.
The DANA Committee is working on:
> Improving effective coordination, communication and collaboration amongst the variousagencies.
> Increasing the Committee’s capacity with trained and competent assessors and base linedata for effective assessment.
The ECLAC methodology focuses a great deal on the economic impact o f a hazard on a country. W hile some o f our participants, especially the disaster managers, may wish to see a stronger emphasis on a cross-cutting theme o f disaster and risk management, the three basic and recurring concept o f damage + losses = impact, that will be discussed during the next two days, will provide us with a useful tool in preparing disaster and risk management reports.
Annex 1

6
Our participants from the business, health and social sectors will note that the methodology affords for the economic, social and environmental systems to be naturally integrated.
It is hoped that the knowledge, experiences and best practices that will be shared, will yield to sound environmental planning and management, improvement o f standards and codes as a long term focus to reduce vulnerability to our country and its people from the various hazards that threatened the nation.
I want to ask the facilitators to make the sessions as informal and interactive as they can possible make it; and, if they allow me I want to invite you the participants to put aside your inhibitions and indulged in open and frank discussion, use the experiences that have been assembled here for this workshop to gain maximum value from it.
Many thanks once again for your presence.

7
Annex 2
participants at damage assessment workshop 10-12 January 2006
Ser. Name Organization1 Elida Brown Local Government2 Lee Van Chan Works3 Esmond Segura Works4 Ricardo Thompson Agriculture5 Capt. Lawrence Lorenzo Defence force6 Lt. Robert Guerra Defence force7 A. Bautista Agriculture8 Eugene Palacio Natural Resources9 Francis Martinez Environment10 Glenroy Ferguson Natural Resources11 Dirk Francisco Belize Audubon Society12 Netty Johnson District Coordinator13 M ario Hoare Agriculture14 Kurk Hyde Coast Guard15 James Janmohamed Special Coordinator16 Linsford Coleman Central Bank17 Elsa Vasquez District Coordinator18 Mary Ann Sutherland Natural Resources19 Noreen Fairweather Natural Resources20 R udolf Williams Jr. Meteorology Services21 Jeromey Timrose Augustine District Coordinator22 Cpl. Eloy Cacho Defence force23 Omar Vasquez Natural Resources24 Santiago Acosta Sr Asst. Training Officer25 Col. George Lovell National Coordinator26 Cecilia Velasquez NEM O Support Staff27 Brain Flowers W arehouse M anager28 John Suazo District Coordinator29 Yadira Lotiff NEMO Support Staff30 Delvorine August NEMO Support Staff31 Steve Solis Agriculture
8
Case study: Exercise applied in the training course
I. BACKGROUND
Since 1972, the Economic Commission for Latin America and the Caribbean (ECLAC) has carried out numerous assessments o f the social, economic and environmental impact o f disasters in the region, and has developed a well-known methodology for such undertakings. 3 Due to the usefulness o f this methodology, and in cooperation with the World Bank, it is being applied in other regions o f the world, especially in Asia.
The National Emergency M anagement Organization o f Belize (NEMO) has requested assistance from ECLAC to carry out a training seminar for Belize Government officials on the subject o f disaster damage assessment, with special reference to the subject o f drought. Similar training courses - with special reference to the case o f hurricanes - were provided by ECLAC in 2001 after the assessment o f the impact o f hurricane Keith,4 and in 2004.
Since 2003 - and in some locations since 2001 - rainfall has been below average and, in some cases, has been insufficient to meet the water requirements o f crops. At the end o f 2001, an assessment was carried out by ECLAC on the impact o f a drought in the Central American Isthmus that affected Belize only marginally. 5 However, the deficit has been very clear in Belize since the beginning o f the 2004 rainy season.
In view o f the above, NEMO authorities requested that the training seminar have a special emphasis in the methodologies and procedures for the assessment o f droughts, and further requested that real data from the recent drought in said country be used for exercises to be carried out as part o f the training seminar.
To comply with this request, ECLAC engaged the services o f Roberto Jovel, an international consultant on damage and loss assessment following disasters who led the development and updating o f the ECLAC methodology. From 22 to 30 June 2005, Mr. Jovel undertook a field mission to Belize in order to collect relevant information for the estimation of drought impact on the economy. Since not sufficient data was available during Mr. Jovel's mission, extensive use was made o f electronic communications to gather the missing information. NEM O and other Government officials provided support to Mr. Jovel in his data collection efforts.
This report summarizes Mr. Jovel's findings and provides the background data for the assessment o f the economic impact o f the 2004-2005 droughts in Belize. Furthermore, the
Annex 3
3 See ECLAC, Handbook for Estimating the Socio-Economic and Environmental Effects o f Disasters,2003.
4 See ECLAC, Assessment o f the damage caused by Hurricane Keith in Belize: Implications for economic, social and environmental development, Mexico City, November 2000.
5 See ECLAC and Comisión Centroamericana de Ambiente y Desarrollo (CCAD), El impacto socioeconómico y ambiental de la sequía de 2001 en Centroamérica, January, 2002.

9
procedure for the assessment is described in the last chapter, together with the basic assumptions to be adopted, which are to be used during the training seminar.
II. THE DROUGHT IN 2004-2005
Long-term records available for the Capital City o f Belize indicate that annual rainfall seems to have entered an extended period o f below-average rainfall since the early 1940s. On the other hand, the period from 1887 to the end o f the 1920s, can be recognized as a w et one; and a transition seems to have occurred in between. An analysis o f the cumulative departure o f annual rainfall from its long-term mean value is shown in the graph below.
Figure 2-1
CUMULATIVE DEPARTURE OF ANNUAL RAINFALL FROM THE LONG-TERM MEANIN BELIZE CITY (1887 THROUGH 2004) 6
M onthly rainfall data for several rain-gauging stations located throughout the country (See table 2-1 and figure 2-2 below) was analyzed for the years 2003 to mid-2005, to determine the extent and location o f the drought.
6 Rainfall data provided by Meteorological Department of Belize; the analysis of information was made by the Consultant.

Figure 2-2
MAP OF BELIZE SHOWING LOCATION OF SELECTED RAIN STATIONS
10
Banco f j / Chinchorro*
Base 802759AI (CQ0493) 2-03
11
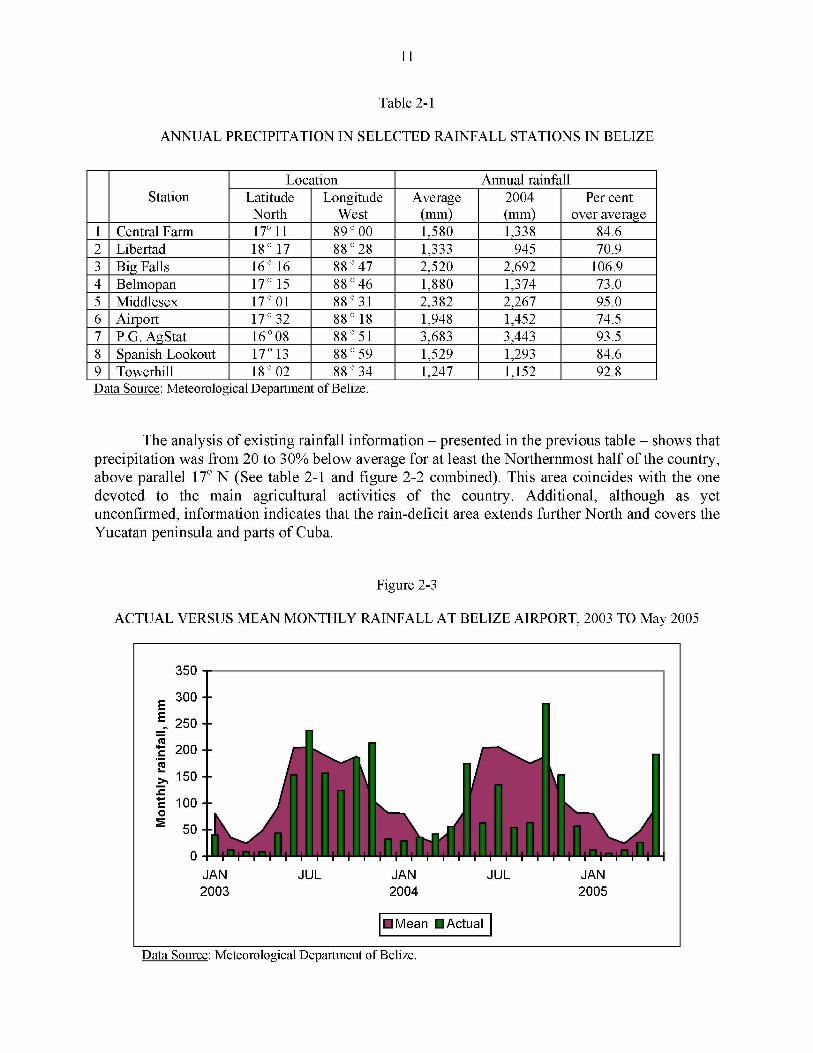
Table 2-1
ANNUAL PRECIPITATION IN SELECTED RAINFALL STATIONS IN BELIZE
StationLocation Annual rainfall
LatitudeNorth
LongitudeWest
Average(mm)
2004(mm)
Per cent over average
1 Central Farm 17o 11 89 o 00 1,580 1,338 84.62 Libertad 18 o 17 88 o 28 1,333 945 70.93 Big Falls 16 o 16 88 o 47 2,520 2,692 106.94 Belmopan 17 o 15 88 o 46 1,880 1,374 73.05 Middlesex 17 o 01 88 o 31 2,382 2,267 95.06 Airport 17 o 32 88 o 18 1,948 1,452 74.57 P.G. AgStat 16 o 08 88 o 51 3,683 3,443 93.58 Spanish Lookout 17 o 13 88 o 59 1,529 1,293 84.69 Towerhill 18 o 02 88 o 34 1,247 1,152 92.8Data Source: Meteorological Department of Belize.
The analysis o f existing rainfall information - presented in the previous table - shows that precipitation was from 20 to 30% below average for at least the Northernmost half o f the country, above parallel 17o N (See table 2-1 and figure 2-2 combined). This area coincides with the one devoted to the main agricultural activities o f the country. Additional, although as yet unconfirmed, information indicates that the rain-deficit area extends further North and covers the Yucatan peninsula and parts o f Cuba.
Figure 2-3
Data Source: Meteorological Department of Belize.

Figure 2-4
ACTUAL VERSUS MEAN MONTHLY RAINFALL AT CENTRAL FARM RAIN STATION
12
2004 2005
□ Mean □ Actual
Data Source: Meteorological Department of Belize.
Figure 2-5
ACTUAL VERSUS MEAN MONTHLY RAINFALL AT TOWER HILLS RAIN STATION
2004 2005
□ Mean □ Actual
Data Source: Meteorological Department of Belize.
13
The data for the station located at Belize International Airport indicates that monthly rainfall rates since early 2003 have been - with few exceptions - below average. In 2003, except for the months o f July, November and December, the entire dry and rainy seasons had below- average precipitation. The situation continued in 2004, where from June to September rainfall was well below average; October and November were wet months, and from December 2004 through April 2005, rainfall was very scarce (See figure 2-3).
Data for the Central Farm rainfall station show that for the entire period between January2004 and May 2005 rainfall has been below average, except for two months (May 2004 and February 2005). This is probably typical o f the Central-W estern part o f the country, where this station is located (Figure 2-4).
Data for Tower Hills (shown in Figure 2-5) indicate that, since July 2004, monthly rainfall has consistently been below average, with the exception o f September and October 2004. This is considered typical o f conditions in the northernmost portion o f the country.
The fact that rainfall has been below average throughout the period under consideration has resulted in w ater deficits for many economic activities. In fact, the months from June to November are the ones where agricultural crops require more water for their growth; during the first half o f each year, availability o f w ater for hydropower generation is critical. Therefore, it is no surprise to note that production losses occurred in these and other sectors o f the economy, as will be described later on in this report.
Limited information on surface water features indicate that water availability has followed a decreasing pattern that resembles the trends in rainfall. W ater level records for a station located at Crooked Tree Lagoon, show that water levels in 2004-2005 have closely followed the 25-year minimum values, as indicated in Figure 2-6 below. This graph shows that in April 2004, the actual water stage coincided with the 25-year minimum, and that until October of same year both values were very closely related. Then the actual level rose in response to heavy rainfall, but began decreasing at a high rate from November 2004 onwards, until in February2005 it dropped below the recorded lows and dried up the following month.
It is reported that groundwater levels have steadily declined for the same time period of the analysis, and that pumping costs have risen accordingly, although no hard data is available at the time this report is being written.
It is reported that air temperature increased significantly during the drought period (See figure 2-7), inducing higher water requirements from people and crops. Forest fires were more common during the drought period due to the increased air temperatures as well as higher radiation rates.

14
Figure 2-6
MONTHLY WATER LEVEL AT CROOKED TREE LAGOON
^ — 2004-2005 Low 1981-2004 Max 1981-2004
Data Source: Meteorological Department of Belize.
Figure 2-7
MONTHLY AIR TEMPERATURE IN 2004-2005 VERSUS AVERAGE MONTHLY VALUES
Average ^ ^ 2 0 0 4 -2 0 0 5

15
III. IMPACT ON SELECTED SECTORS
Drought affects different sectors, generating losses to the economy that may last beyond the actual recovery o f rainfall rates. M ost affected are usually the sectors o f agriculture and livestock, as well as agro-industry as the second link in the food production chain. In addition, other sectors and activities than depend on normal w ater availability suffer from the lack o f sufficient water: the water supply and sanitation and the electricity generation sectors.
No sufficient information was available to attempt an estimation o f the damage to environmental assets and the loss o f environmental services caused by the limited water availability and by the forest fires that occurred during the study period 2004-2005.
1. Agriculture
In order to appreciate more clearly the impact o f the drought on the agriculture sector, the following table shows the agricultural calendar for Belize.
Table 3-1
CALENDAR OF AGRICULTURAL PRACTICES IN BELIZE
ProductAgriculture season
1st calendar year 2nd calendar yearJ F M A M J J A S O N D J F M A M J
Seasonal cropsCorn X X X X XRice X X X XXSoybeans X X X X X X X X X XRed kidney beans X X XBlack beans X X X
PlantationsBanana X XX X X X X XX X X X X XX X X XSugarcane X X X XX X X X X XX X XCitrus X XX X X X X XX X X X X XX X X X
Agro-processingSugar milling X X X X X XSource: Agriculture Department of Belize.

16
Based on the above calendar o f production and making use o f the modified Blaney- Criddle formulae, 7 estimates were made o f the water requirements o f selected agricultural products for the case o f Belize. These were compared to the value o f effective precipitation that occurred during the period 2004-2005, to ascertain possible water deficits as shown below.
Figure 3-1
COMPARISON OF ESTIMATED WATER REQUIREMENTS FOR GRAIN CROPS AND EFFECTIVE RAINFALL IN BELIZE, 2004-2005 AGRICULTURAL SEASON
Agriculture Year
• Efective rainfall Beans CornSoybean Rice Sorghum
Similar comparisons were made for the case o f vegetables and o f plantations such as banana and sugarcane. In all cases, the comparison indicates that during the 2004-2005 agricultural season rainfall was not sufficient to meet crop water needs at all times, especially during the most critical periods for some o f the crops. The result was either wilting o f some crops and/or lower unit yield o f other crops and plantations. The most notable example is that of soybean.
7 A description of the methodology used for the estimation of water requirements of agricultural products can be found in: Jovel, R. and Martinez, H., El cálculo del uso consuntivo, Ministry of Agriculture and Livestock, El Salvador, 1964; Jovel, Roberto, El cálculo de los requerimientos de agua para la irrigación en Costa Rica, Proyecto Hidrometeorológico Centroamericano, San Jose, Costa Rica, 1968; and in FAO, Irrigation Water Management, Irrigation Water Needs, Rome, 1986.

17
The banana plantations were spared from that problem since most are under irrigation.
a) Impact on grains and vegetables
As a result o f the water deficit, production o f most seasonal crops dropped due to lower unit yields. Information on the production, acreage planted and average unit yield for grains and selected vegetables are given in the following tables.
Table 3-2
PRODUCTION AND ACREAGE OF GRAIN CROPS IN BELIZE, 2000-2004
ProductYear
2000 2001 2002 2003 2004CornProduction, thousand poundsPlanted area, acresAvg. Yield, pounds per acre
69,93335,019
1,997
80,98730,168
2,684
73,61135,335
2,083
78,47431,567
2,486
67,15031,416
2,137RiceProduction, thousand poundsPlanted area, acresAvg. Yield, pounds per acre
21,7108,9532,425
26,7229,9352,690
24,13911,7932,047
28,11411,2002,510
23,0187,7462,972
Black beansProduction, thousand poundsPlanted area, acresAvg. Yield, pounds per acre
2,0182,413
836
1,2411,337
928
3,2844,475
734
2,5823,476
743
2,1802,548
855Red kidney beans Production, thousand pounds Planted area, acres Avg. Yield, pounds per acre
10,90813,467
810
12,79617,056
750
4,93911,582
426
9,66811,790
820
6,63011,429
580SoybeansProduction, thousand poundsPlanted area, acresAvg. Yield, pounds per acre
1,092609
1,794
1,160730
1,588
2,0583,047
675
3,5162,6021,351
700600
1,167SorghumProduction, thousand poundsPlanted area, acresAvg. Yield, pounds per acre
13,9014,9282,821
18,5425,5253,356
26,6519,7852,723
20,1805,9773,376
17,9549,0161,991
Source: Policy Analysis and Economics Unit, MAFC.
It is to be noted here that the data on acreage planted, especially referred to the 2004 calendar year, may not always reflect the actual area that was planted at the beginning o f the agricultural season; rather, it may reflect the area that was subject to harvest, after the drought.

18
Table 3-3
PRODUCTION AND ACREAGE OF SELECTED VEGETABLES IN BELIZE, 2000-2004
YearProduct 2000 2001 2002 2003 2004
CabbaseProduction, thousand pounds 4,068 3,855 4,222 2,470 3,387Planted area, acres 184 161 170 154 143Yield, thousand pounds per acre 22.1 23.9 24.8 16.0 23.7CucumberProduction, thousand pounds 241 432 417 547 222Planted area, acres 39 33 38 63 36Yield, thousand pounds per acre 6.2 13.1 11.0 8.7 6.2Hot pepperProduction, thousand pounds 732 818 446 580 408Planted area, acres 195 81 72 58Yield, thousand pounds per acre 4.2 5.5 8.1 7.0Sweet BennerProduction, thousand pounds 1,121 884 1,183 930 695Planted area, acres 148 97 126 131 97Yield, thousand pounds per acre 7.6 9.1 9.4 7.1 7.2TomatoesProduction, thousand pounds 4,923 3,113 3,155 2,767 1,301Planted area, acres 246 235 155 147 84Yield, thousand pounds per acre 20.0 13.2 20.4 18.8 15.5OnionProduction, thousand pounds 280 746 1,181 1,798 1,304Planted area, acres 30 155 103 112 89Yield, thousand pounds per acre 9.3 4.8 11.5 16.0 14.7Irish PotatoProduction, thousand pounds 2,726 2,384 1,387 1,055 1,599Planted area, acres 285 255 209 195 132Yield, thousand pounds per acre 9.6 9.3 6.6 5.4 12.1CarrotsProduction, thousand pounds 348 294 232 503 569Planted area, acres 46 35 32 52 59Yield, thousand pounds per acre 2.1 8.4 7.2 9.7 9.6
Source: Policy Analysis and Economics Unit, MAFC.
As in the case o f grains, the area planted indicated for 2004 may not reflect the area initially planted but, rather, the area where harvest was collected.
In any case, it can be easily seen that many o f these products (grains and vegetables) were affected significantly by the drought, since both their total production and the average yield show considerable decline in 2004. According to the available information, some vegetables (notably cabbage, Irish potato and carrots) were not affected by the drought, as they are probably grown in areas where rainfall was adequate for the crops.

19
b) Impact on sugarcane production
Since the area devoted to the production o f sugarcane is located within the zones most affected by the drought, the impact on its production was significant, as indicated in the table below.
It is to be noted here that the data on sugarcane and sugar production must be given by agricultural season, which goes through the next calendar year. Statistics on the production of these two items, as shown in the publications o f the Policy Analysis and Economics Unit o f the MAFC, indicate figures for the calendar year only. Thus, the Consultant resorted to information given by the Sugar Industry Control Board - which provides monthly data on cane reception at the mills and on sugar production - to revise the data on this issue, as shown in the table below.
Table 3-4
PRODUCTION OF SUCARCANE IN BELIZE, 2000-2004
Agriculture season20002001
20012002
20022003
20032004
20042005
Production, thousand long tonsPlanted area, acresAverage yield, long tons per acre
1,01157,322
17.64
1,15157,322
20.07
1,07359,500
18.04
1,14961,300
18.75
92959,000
15.75Source: Sugar Industry Control Board.
The above information shows that the drought had a significant impact on the production o f sugarcane in the 2004-2005 season equivalent to a decline o f 20 per cent. I f the information on planted area is correct, then the decline in sugarcane yield was o f 15% only.
c) Impact on other products
There is only partial information on the possible impact o f the drought on other products. However, they have a lower economic value in the overall picture, and will not be included in the analysis.
2. Livestock
The cattle and poultry producer associations reported that due to the lack o f water and o f pasture, many cattle heads perished and many more lost weight; a significant number o f broiler chicken and layers also perished. As a result, the stock o f these species was diminished and the production o f meat, milk and eggs dropped during part o f 2004.
20
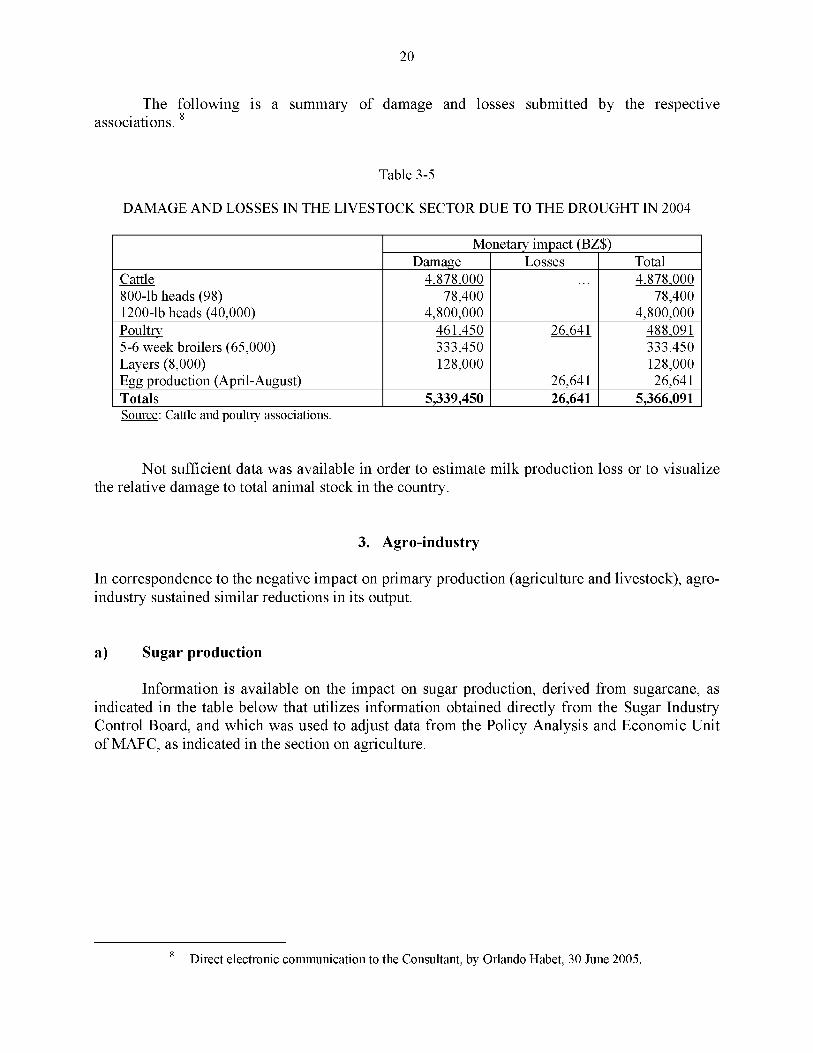
The following is a summary o f damage and losses submitted by the respective associations. 8
Table 3-5
DAMAGE AND LOSSES IN THE LIVESTOCK SECTOR DUE TO THE DROUGHT IN 2004
Monetary impact (BZ$)Damage Losses Total
Cattle 4,878,000 4,878,000800-lb heads (98) 78,400 78,4001200-lb heads (40,000) 4,800,000 4,800,000Poultry 461,450 26,641 488,0915-6 week broilers (65,000) 333,450 333.450Layers (8,000) 128,000 128,000Egg production (April-August) 26,641 26,641Totals 5,339,450 26,641 5,366,091Source: Cattle and poultry associations.
N ot sufficient data was available in order to estimate milk production loss or to visualize the relative damage to total animal stock in the country.
3. Agro-industry
In correspondence to the negative impact on primary production (agriculture and livestock), agroindustry sustained similar reductions in its output.
a) Sugar production
Information is available on the impact on sugar production, derived from sugarcane, as indicated in the table below that utilizes information obtained directly from the Sugar Industry Control Board, and which was used to adjust data from the Policy Analysis and Economic Unit o f MAFC, as indicated in the section on agriculture.
8 Direct electronic communication to the Consultant, by Orlando Habet, 30 June 2005.

Table 3-6
21
PRODUCTION OF SUGAR IN BELIZE, 2000-2004
Agriculture season20002001
20012002
20022003
20032004
20042005
Production (thousand tons) Sugarcane to sugar ratio
103.869.74
111.3110.34
103.5810.36
116.589.86
100.49.26
Source: Sugar Industry Control Board.
Data from the above table shows that after the good production obtained during the 20032004 season, a significant decline o f 14% occurred in the 2004-2005 season. The decline in sugar production at the mills was due to the combined effect o f lower sugarcane volumes processed (by about 20%) due to the drought, and o f higher sugar content in the cane. The latter was probably due to the higher air temperatures that prevailed during the maturation o f the sugarcane crop.
b) Other agro-industries
N o direct information was made available concerning the production declines that other agro-industries may have sustained. However, unless timely substitution o f food products through imports from abroad was accomplished, these industries will surely have sustained significant financial losses.
4. Drinking water supply
Drinking water supply and waste-water disposal is carried out by Belize W ater Services (BWS), a privately owned enterprise. In 1994, BWS had a total o f 39,500 connections; the individual water systems had different sources o f w ater supply, as shown in the table below.
In recent years, BWS has been making significant efforts to reduce conveyance and distribution losses, as well as illegal water tapping. Total losses accounted for 53% of total production in 2002-03, 44% in 2003-04 and 36% in the most recent year. Together with other measures, loss reductions have enabled BWS to show a net operating surplus in 2003-04 for the first time. 9
9 See Annual Report, 2003-2004, Belize Water Services, Belize City.

22
Table 3-7
CONNECTIONS AND WATER SOURCE IN THE MAIN CITIES OF BELIZE, 2004 10
Water system Number of connections Water sourceBelize City 15,760 Surface River WaterHattieville 515 Ground Water WellsCorozal 3,515 Ground Water WellsProgresso 200 Ground Water WellsOrange Walk 3,595 Ground Water WellsBelmopan 4,070 Surface River WaterSan Ignacio 4,190 Ground Water WellsBenque Viejo 1,660 Springs, and WellsDangriga 2,490 Surface River WaterPunta Gorda 1,420 Ground Water WellsSan Pedro 2,095 Sea Water (Rev. Osmosis)
During the drought period, the prevailing higher air temperatures caused an increase in w ater demand for the BWS systems that went beyond the increase in number o f connections (See figure below). This increased water demand was met by BWS through an increased number of hours and cost o f operation o f its plants, and no significant rationing. Thus, the drought had two effects: one, an increased consumption o f w ater by users - with a corresponding higher cost - and, two, an increased cost o f operation at BWS.
Figure 3-2
MONTHLY DRINKING WATER SALES IN 2003-2004 AND 2004-2005
□ 2004-2005 □2003-2004
Data Source: BWS.Table 3-8
10 Electronic-mail communication by BWS to the Consultant, 29 June 2005.

23
INCREASE IN ELECTRICITY USE FOR WATER SUPPLY,
FEBRUARY TO MAY 2005
Sub-systemIncrease in
electricity use (per cent)
Belize City 15.6Hattiesville 19.2Corozal 23.0Orange Walk 24.4Belmopan 22.5
5. Electricity
The total electricity demand o f the country is met by the system operated by Belize Electricity Limited (BEL), a privately owned enterprise. With a total o f 66,000 customers - in residential, industrial and commercial sectors, as well as public lighting - the system has a peak demand o f 66 Megawatts. Total energy demand for the system is met through generation in B EL’s diesel- powered units, purchases o f electricity from the M ollejon hydropower plant, and imports of energy from M exico’s Comisión Federal de Electricidad (CFE) grid.
Figure 3-3
STRUCTURE OF ELECTRICITY PRODUCTION IN BELIZE DURING 2003
Source: BEL.

24
Since early 2004 and up to June 2005, two factors have modified the previous pattern of energy production. First, the drought caused the generation in the Mollejon hydropower plant to be seriously curtailed, as water availability was drastically reduced. Second, the significant rise in international oil prices made thermal plant generation less attractive than energy imports from Mexico.
Actual hydro generation was much lower than the originally envisaged production forecast (See figure 3-4). The shortage o f hydropower generation was met through generation at the thermal power plant, with its increasing production costs. 11 To meet the country total demand, more imports were made from the CFE grid (See Figure 3-5 below).
Figure 3-4
ACTUAL VERSUS FORECASTED HYDROPOWER GENERATION, 2004-2005
.c 25000
JUN AUG OCT DEC FEB APR
□ A c tu a l □ F o re c a s t
Source: BEL.
11 To have substituted hydropower generation through imports from Mexico, the unit cost of electricity would have been nearly 700 Bz$/MWh.
25
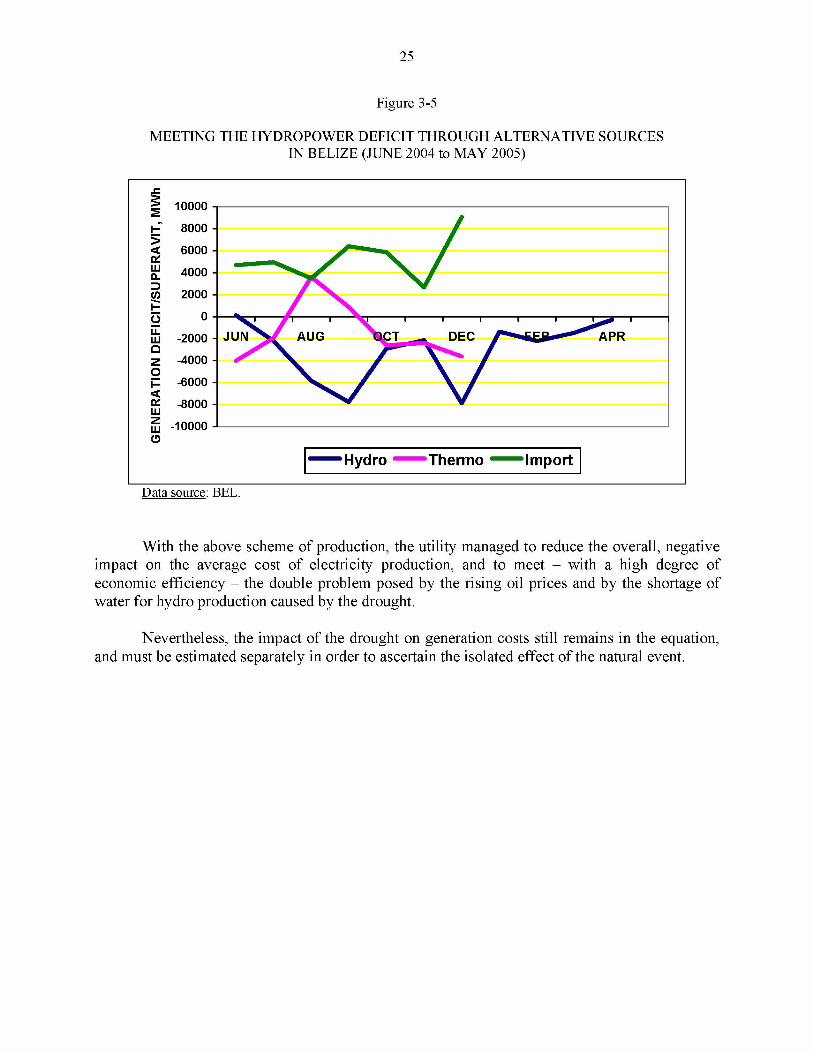
Figure 3-5
MEETING THE HYDROPOWER DEFICIT THROUGH ALTERNATIVE SOURCES IN BELIZE (JUNE 2004 to MAY 2005)
Data source: BEL.
W ith the above scheme o f production, the utility managed to reduce the overall, negative impact on the average cost o f electricity production, and to meet - with a high degree of economic efficiency - the double problem posed by the rising oil prices and by the shortage of w ater for hydro production caused by the drought.
Nevertheless, the impact o f the drought on generation costs still remains in the equation, and must be estimated separately in order to ascertain the isolated effect o f the natural event.

26
IV. ESTIMATION OF DAMAGE AND LOSSES CAUSED BY THE DROUGHT
1. General considerations
As indicated in the Background section o f this report, the estimation o f the impact o f the drought in Belize is to be used as an exercise in the training seminar to be undertaken during August 2005.
The available data on the effects o f the drought on the main affected sectors is described in chapter three o f this report. The information contained herewith, however, is not sufficient to carry out a full, comprehensive damage and loss assessment for the disaster. Nevertheless, it is more than sufficient to illustrate the manner in which the assessment should be carried out, and provides the necessary inputs for the training exercise.
In this final chapter o f the report, the Consultant outlines the methodological procedures to be used, and the basic assumptions to be made, for the assessment o f drought impact. From this, participants in the training seminar should be able to conduct the exercise for the assessment o f drought impact on the most affected sectors o f the Belizean economy.
In the assessment o f damage and losses use is to be made o f the ad hoc methodology developed by ECLAC, 12 with some recent simplifications and with an adaptation to the specific case o f drought. The simplifications refer to the adoption o f the following definitions:
D am age : the total or partial destruction o f physical assets, measured in physical terms andexpressed in monetary value at replacement cost: and
Losses: changes in economic flows arising as a result o f the disaster, including productionthat will not be obtained, its increased production costs, diminished revenues andincreased operational costs in the provision o f services, and unexpected expenditures.
The main general assumption, in addition to those specific for each sector that will be described later on, is that the drought has already ended by June 2005. W hile there is no scientific evidence to support this assertion, the time frame for the analysis o f the drought will therefore be the period from June 2004 to May 2005.
For the assessment o f losses, the ECLAC methodology bases its results in the estimation o f the difference in economic performance between the non-disaster situation and the actual situation after the disaster. In this special case o f drought in Belize, the economic performance of the affected sectors during the period June 2004 to May 2005 is to be compared with the one that would have occurred in the same period had the drought not taken place. To put it differently, the baseline for the assessment is the forecasted performance o f the sectors made at the beginning of 2004, when no news had been received about the probable occurrence o f a drought.
12 Economic Commission for Latin America and the Caribbean, Handbook for Estimating the SocioEconomic and Environmental Effects o f Disasters, 2003.

27
Nearly all countries make such sectoral forecasts at the beginning o f each calendar year, with varying accuracy. Belize is no exception, except in the cases o f a limited number o f sectors, as will be described in the following sections o f this chapter. In any case, analyzing the recent trends o f sectoral development and making educated projections o f performance for the drought period can overcome such gaps. Each sectoral analysis and assessment is described in the following sections.
2. Agriculture
The analysis o f the agriculture sector requires the utilization o f the agricultural year, rather than the calendar year. This is due to the fact that some o f the crops and plantations extend their growth and collection cycle beyond the month o f December.
Data on the actual performance o f the sector is described in Chapter III o f this report, with breakdowns by individual products including grain and vegetables crops as well as plantation crops.
The Agriculture Department does not make any forecasts on the expected acreage and unit production or yield for each agricultural year, due to lack o f sufficient resources in the field. Therefore, in order to determine the baseline for comparison o f expected versus actual sector performance, an ex p ost fa c to analysis will have to be made for each product.
In addition to the above described information gap, no detailed statistics on prices at different levels are available for the analysis. In this case, again, some assumptions will have to be made that will be described in the case o f each product under consideration.
28
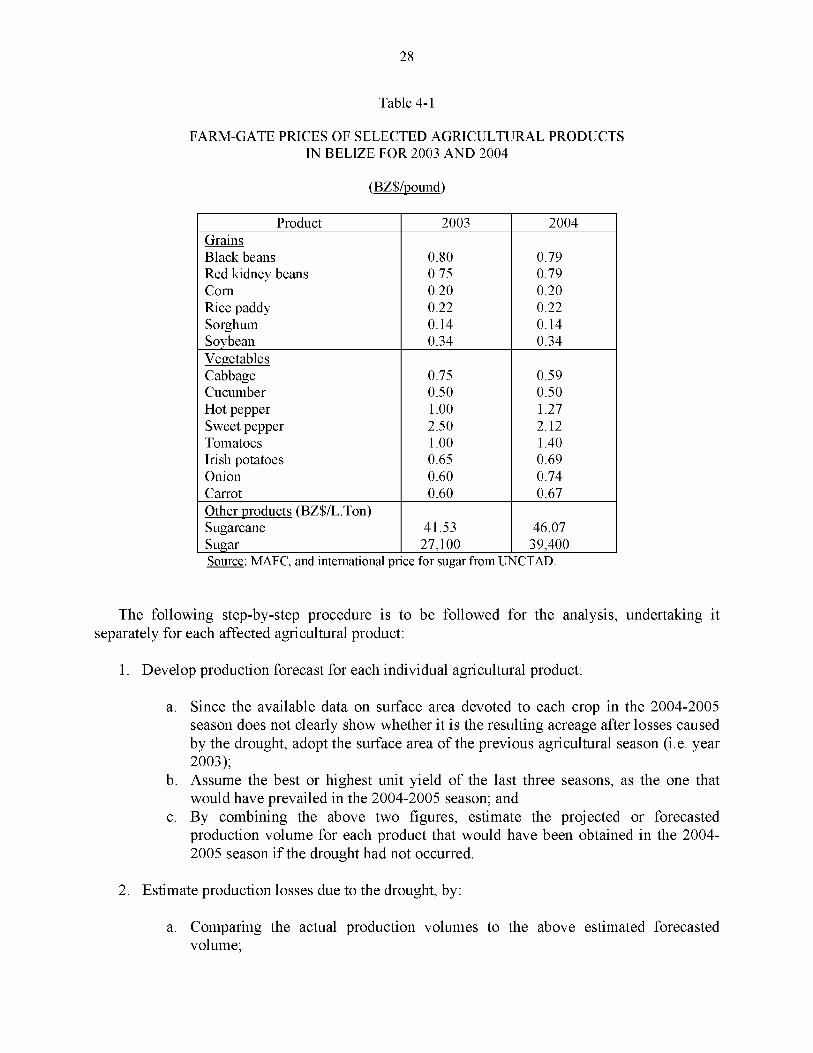
Table 4-1
FARM-GATE PRICES OF SELECTED AGRICULTURAL PRODUCTS IN BELIZE FOR 2003 AND 2004
(BZ$/pound)
Product 2003 2004GrainsBlack beans 0.80 0.79Red kidney beans 0.75 0.79Corn 0.20 0.20Rice paddy 0.22 0.22Sorghum 0.14 0.14Soybean 0.34 0.34VegetablesCabbage 0.75 0.59Cucumber 0.50 0.50Hot pepper 1.00 1.27Sweet pepper 2.50 2.12Tomatoes 1.00 1.40Irish potatoes 0.65 0.69Onion 0.60 0.74Carrot 0.60 0.67Other products (BZ$/L.Ton)Sugarcane 41.53 46.07Sugar 27,100 39,400Source: MAFC, and international price for sugar from UNCTAD.
The following step-by-step procedure is to be followed for the analysis, undertaking it separately for each affected agricultural product:
1. Develop production forecast for each individual agricultural product:
a. Since the available data on surface area devoted to each crop in the 2004-2005 season does not clearly show whether it is the resulting acreage after losses caused by the drought, adopt the surface area o f the previous agricultural season (i.e. year 2003);
b. Assume the best or highest unit yield o f the last three seasons, as the one that would have prevailed in the 2004-2005 season; and
c. By combining the above two figures, estimate the projected or forecasted production volume for each product that would have been obtained in the 20042005 season if the drought had not occurred.
2. Estimate production losses due to the drought, by:
a. Comparing the actual production volumes to the above estimated forecasted volume;
29
b. Adopt unit price - paid at farm-gate levels - for each product that are not affected by scarcity or speculation, such as those o f the previous season (See Table 4-1 above), and
c. Combine the two figures to obtain the production loss value due to the drought.
3. Livestock
N o estimates are required since the cattle and poultry growers associations have made their own calculations, as presented in table 3-5.
4. Agro-industry and commerce
In the case o f the agro-industry and commerce sectors, separate estimates must be made for the case o f the sugar milling process and for the processing o f other agricultural products. In all cases, however, the general procedure involves making use o f the data on production losses in the primary production o f the processed goods, derived in Section 2 above, and applying slightly different criteria for the estimation o f the actual agro-industrial losses.
a) Sugar milling
For this case o f agro-industry, the following procedure and steps must be followed in order to estimate the losses due to the drought:
1. Adopt the production volume forecast o f the primary product (sugarcane) as developed under Section 2;
2. Adopt the best sugarcane/sugar ratio that prevailed before the drought occurred (as given in table 3-6);
3. Combine these two figures to obtain the forecasted volume o f sugar that would have been obtained in the 2004-2005 season if the drought had not occurred;
4. Estimate agro-industrial volume production losses by comparing the following figures:
a. The forecasted volume o f sugar for the non-drought condition, and
b. The actual volume o f sugar produced by the mills in the 2004-2005 season (given in table 3-6);
5. Adopt the international unit price o f sugar for the 2004-2005 season (BZ$ 39,400 per long ton, from table 4-1), and

30
6. Estimate the value o f agro-industrial and marketing losses in the sugar milling operation due to the drought, by combining the figures obtained in steps 4 and 5 above.
b) Other food processing industries and commerce
Since no detailed information is available on losses in the processing and marketing of other food products, due to the absence o f special surveys, an indirect method is to be used for their assessment.
This is possible in cases o f disasters when the installed capacity o f the agro-industrial and commerce sectors is not directly affected, but where their production sustains losses due to reductions in the inputs that they derive from the (primary) agricultural sector. This case usually occurs after disasters caused by natural phenomena o f hydro-meteorological origin - mainly drought 13 and floods 14 - that negatively affect the production o f the primary sector. The agrobased industrial and commercial sectors become indirectly affected in view o f their forward linkage along the production chain.
It is to be noted that this alternative, indirect procedure can only be applied to disaster cases where no damage has been sustained by the agro-industrial and commercial facilities, since it enables the estimation o f losses in value added due to the absence o f primary production as an input for the processing industry and the marketing sector.
The following steps are to be followed for the indirect estimation o f losses in the agroindustry and commerce sectors:
1. Ascertain the volume o f primary production losses that will not be available as inputs for the agro-processing industry, for each o f the individual agricultural products affected by the drought, by:
a. Adopt the volume o f production loss for each affected agricultural product, as obtained under Section 2 o f this chapter;
b. Estimate the volumes o f said products that are normally retained by the producers for their direct consumption, 15 and
c. Determine the net volumes o f each product that will then not reach agroprocessing industries and commerce, as the difference between a) and b).
13 A very similar case to that of the 2004-2005 Belize drought was that of the Central American drought in 2001, where the same indirect method was successfully used. See ECLAC and CCAD, El impacto socioeconómico y ambiental de la sequía de 2001 en Centroamérica, January, 2002.
14 But other similar cases as well, such as the December 2004 tsunami that affected fishery and agricultural production in the Indonesian Provinces of Aceh and North Sumatra. See Indonesia: Preliminary Damage and Loss Assessment; The 26 December 2004 Natural Disaster. The Consultative Group on Indonesia, 19 January 2005, where this indirect loss assessment procedure was used.
15 This is to take into consideration that farmers normally retain part of their production for direct use as food for their families, and they sell the remainder for processing and marketing (In the case of grains, 15 to 25%; vegetables, around 10%; and other products, 4%).

31
2. Analyze statistical data on unit prices for all the affected products, measured at farm-gate, wholesale and retail levels, for at least the year when the disaster occurred and the preceding one. It is assumed here that the price differential between wholesale and farm- gate prices is representative o f the added value that is obtained through agro-industrial processing, and that the differential between retail and wholesale prices reflects the value added in the marketing o f the products. Special care must be exercised in order to use unit prices that are not affected by the scarcity caused by the disaster, as this would affect the results and provide invalid estimations o f the losses.
3. Estimate the (value added) production losses in agro-industry and commerce due to the disaster, by combining the price differentials described in point 2 above and the net volumes obtained in point 1c).
In the case o f Belize, no comprehensive statistics on prices were available, except in the case o f farm-gate or producer prices. W holesale prices are available for some products, especially those under control by the Government. Thus, the procedure described above cannot be followed in detail. A further, simplified procedure must therefore be adopted, even though the accuracy of its results will be lower than usual. Nevertheless, an order o f magnitude result will be possible to achieve, until detailed information on different price levels o f agricultural products can be obtained in the future.
Based on experience accumulated by ECLAC in many past, similar exercises, the order- of-magnitude levels o f prices shown in table 4-2 can be adopted for the analysis.
Table 4-2
THEORETICAL STRUCTURE OF PRICE LEVELS FOR SELECTED AGRICULTURAL PRODUCTS
Price levelPer cent in producer
relation to prices for:
Grains VegetablesFarm-gate or producer price 100 100Wholesale price 166 135Retail price 184 145
By using the data on producer prices included in table 4-1, in combination with the values given in table 4-2, it will be possible to estimate the value added losses in the agro-processing and commerce sectors, using the step-by-step procedure described in the preceding pages o f this report. It must be noted, however, that losses in the marketing o f processed agricultural products will be negligible since the commerce sector entrepreneurs will most likely have imported the goods that were not processed in the local agro-industries, and thus did not sustain losses. It is also possible that the profit margin in the commerce sector may be smaller, though, due to the higher unit price and transport costs o f the goods acquired abroad, but at this point in time there
32
is no information that may enable any better estimation o f this losses. Thus, in the exercise, only losses in the agro-industry process are to be estimated.
4. Drinking water supply
As described in the preceding chapter, the drought caused two types o f losses for the drinking w ater supply sector: increased consumption and cost o f water to users due to the higher air temperatures, and higher pumping and other energy costs to the water utility (BWS). These losses are to be estimated separately.
For the estimation o f higher water consumption costs, in the absence o f more detailed information, it should be assumed that no new users were added to the water supply system in the past two years, and that the increase in water sales in 2004-2005 vis a vis that o f the previous year are due exclusively to the higher demand o f the users in view o f the drought.
A comparison is to be made o f monthly water volume sales for the period May 2004 to April 2005, to those o f the previous year (see table 4-3 below). An average water rate o f BZ$ 0.0175 per gallon should be used for the estimation o f the value o f increased costs paid by the users.
In order to make a first estimation o f increased energy costs for the w ater supply utility, the partial data provided by BWS on per-cent power cost increases for the period February-May 2005 and included in Table 3-8, is to be used. A reference value o f BZ$ 1.96 million must be used for total energy consumption in 2003.
Since no information is available on the value o f the power consumption in each o f the above subsystems under normal circumstances, some assumptions will have to be made in order to extrapolate the above values, and to arrive at a preliminary estimate o f total energy cost increases in the utility due to the drought in the period February to May 2005. First, it should be assumed that each subsystem has a weight in total energy consumption proportional to the number o f users that it serves (as shown in Table 3-7). Second, it should be assumed that under normal conditions, there exists a constant relation between electricity costs and water sales.

33
Table 4-3
MONTHLY DRINKING WATER SALES BY BWS IN 2003-2004 AND 2004-2005
(Million gallons)
MonthMonth y sales
2003-2004 2004-2005May 146.7 141.5June 143.5 147.9July 137.8 139.4August 134.5 149.8September 139.7 158.9October 134.1 150.8November 129.6 136.3December 128.3 133.4January 129.7 134.8February 130.0 129.1March 133.2 142.5April 162.5 176.2Source: BWS.
5. Electricity
The estimation o f losses for the electrical sector must reflect the higher costs incurred by BEL in substituting the hydropower that it was not able to acquire from the M ollejon power plant during the drought months, by generation in its own thermal power plant. The forecasted and the actual generation obtained at M ollejon during the drought months is shown in Figure 3-5 and given in Table 4-4 below.
It will be assumed that given the expected very high rates o f the M exico electricity at peak load times, the hydropower shortage was met exclusively through generation at B EL 's thermal power plant.
Since no actual unit cost o f electricity generation in each o f the available sources (thermal, hydropower and imports from Mexico) have been made available, use should be made o f the following unit values, adapted from an electric sector diagnosis prepared in 2003: 16
16 See Energy for Sustainable Development; Toward a National Energy Strategy for Belize, Energy Sector Diagnostic, 5 November 2003.

34
Bz$/KWh
Hydropower plant 0.134Thermal power 0.170CFE Off-Peak 0.140CFE Peak 0.760
Despite the above figures, it should be taken into consideration that the price for thermal power plant generation varies in direct relation to the international price o f fuel. Thus, the rate of BZ$ 0.170 per KW h that prevailed in 2003 must be adjusted according to the recent international fuel price increases (See Table 4-5).
Table 4-4
FORECASTED AND ACTUAL MONTHLY HYDROPOWER GENERATION AT MOLLEJON PLANT, 2004-2005
Power generation, MWhForecasted Actual
June 2004 4,485.2 4,626.0July 11,276.0 9,043.6August 8,843.6 3,021.7September 11,688.1 3,931.0October 12,516.3 9,605.0November 10,068.9 7,923.1December 11,342.2 3,466.5January 2005 5,960.0 4,596.6February 3,840.0 1,635.3March 2,520.0 1,067.6April 790.0 515.4May N.A. N.A.
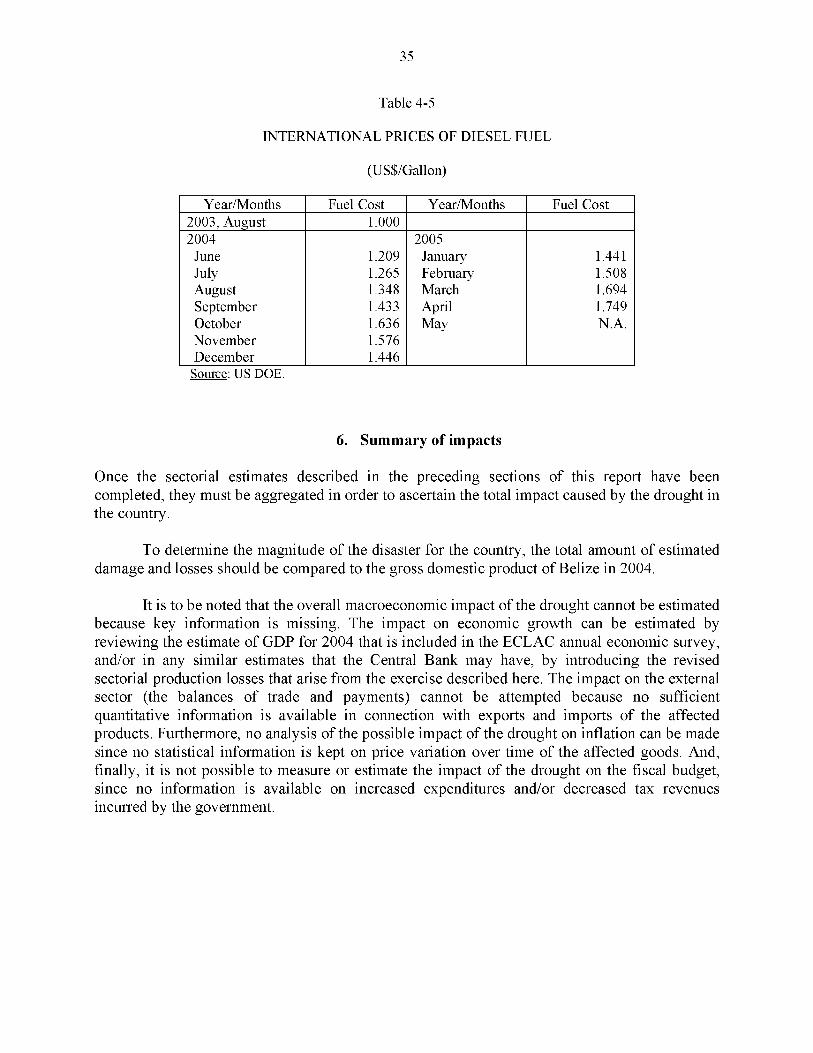
Table 4-5
INTERNATIONAL PRICES OF DIESEL FUEL
35
(US$/Gallon)
Year/Months Fuel Cost Year/Months Fuel Cost2003, August 1.0002004 2005
June 1.209 January 1.441July 1.265 February 1.508August 1.348 March 1.694September 1.433 April 1.749October 1.636 May N.A.November 1.576December 1.446
Source: US DOE.
6. Summary of impacts
Once the sectorial estimates described in the preceding sections o f this report have been completed, they must be aggregated in order to ascertain the total impact caused by the drought in the country.
To determine the magnitude o f the disaster for the country, the total amount o f estimated damage and losses should be compared to the gross domestic product o f Belize in 2004.
It is to be noted that the overall macroeconomic impact o f the drought cannot be estimated because key information is missing. The impact on economic growth can be estimated by reviewing the estimate o f GDP for 2004 that is included in the ECLAC annual economic survey, and/or in any similar estimates that the Central Bank may have, by introducing the revised sectorial production losses that arise from the exercise described here. The impact on the external sector (the balances o f trade and payments) cannot be attempted because no sufficient quantitative information is available in connection with exports and imports o f the affected products. Furthermore, no analysis o f the possible impact o f the drought on inflation can be made since no statistical information is kept on price variation over time o f the affected goods. And, finally, it is not possible to measure or estimate the impact o f the drought on the fiscal budget, since no information is available on increased expenditures and/or decreased tax revenues incurred by the government.