Embed Size (px)
Citation preview

The financial statements included in this quarterly report fairly presents in all material respects the financial position,results of operations and cash flow of the Group as of, and for the periods presented in this report.
Oct 23, 2020
| Mobile Services I Mobile Money |
Report on the results for the second quarter and half year ended September 30, 2020
Airtel Africa plc
Airtel Africa

Page 1 of 61
Supplemental Disclosures
Basis of preparation: - The results for the six months ended 30
September 2020 are unaudited and in the opinion of management, include all adjustments necessary for the fair presentation of the results of the same period. The financial information has been prepared based on International Accounting Standard 34 (IAS 34) and apply the same accounting policies, presentation and methods of calculation as those followed in the preparation of the Group’s annual consolidated financial statements for the year ended 31 March 2020 except to the extent required/ prescribed by IAS 34. This report should be read in conjunction with audited consolidated financial statements and related notes for the year ended 31 March 2020. The comparative information has been drawn based on Airtel Africa plc’s Audited Consolidated Financial Statements for the year ended 31 March 2020 prepared under International Financial Reporting Standard (IFRS).
Use of certain Alternative performance measures (APM):- This result
announcement contains certain information on the Group’s results of
operations and cash flows that have been derived from amounts
calculated in accordance with International Financial Reporting Standard
(IFRS), but are not in themselves IFRS measures. They should not be
viewed in isolation as alternatives to the equivalent IFRS measures and
should be read in conjunction with the equivalent IFRS measures.
Further, disclosures are also provided under “7.2 Use of Alternative performance measures (APM) Financial Information” on page 34
Safe Harbor: The IAS 34 financials considered for the purpose of this
report is unaudited.
Convenience translation: - We publish our financial statements in
United States Dollars. All references herein to “US dollars”, “USD”, “$”
and “US$” are to United States dollars. Translation of income statement
items have been made from local currencies of Africa operating units to
USD (unless otherwise indicated) using the respective monthly average
rates. Translation of statement of financial position items has been made
using the closing rate. All amounts translated as described above are
provided solely for the convenience of the reader, and no representation
is made that the local currencies or USD amounts referred to herein could
have been or could be converted into USD or local currencies
respectively, as the case may be, at any particular rate, the above rates
or at all. Any discrepancies in any table between totals and sums of the
amounts listed are due to rounding off.
Others: In this report, the terms “we”, “us”, “our”, “ Airtel - Africa”, or
“Africa”, unless otherwise specified or the context otherwise implies, refer
to the Airtel Africa plc and its subsidiaries and its associate, Bharti Airtel
International (Netherlands) B.V., Africa Towers N.V., Airtel (Seychelles)
Limited, Airtel Congo S.A, Airtel Gabon S.A., Airtel Madagascar S.A.,
Airtel Malawi plc, Airtel Mobile Commerce B.V., Airtel Mobile Commerce
Holdings B.V., Airtel Mobile Commerce Kenya Limited, Airtel Mobile
Commerce Limited (Malawi), Airtel Mobile Commerce Madagascar S.A.,
Airtel Mobile Commerce Rwanda Limited, Airtel Mobile Commerce
(Seychelles) Limited, Airtel Mobile Commerce Tanzania Limited, Airtel
Mobile Commerce Tchad SARL, Airtel Mobile Commerce Uganda
Limited, Airtel Mobile Commerce Zambia Limited , Airtel Money RDC
S.A., Airtel Money Niger S.A., Airtel Money S.A. (Gabon), Airtel Networks
Kenya Limited, Airtel Networks Limited, Airtel Networks Zambia plc, Airtel
Rwanda Limited, Airtel Tanzania plc (formerly known as Airtel Tanzania
Limited), Airtel Tchad S.A., Airtel Uganda Limited, Bharti Airtel Africa
B.V., Bharti Airtel Chad Holdings B.V. , Bharti Airtel Congo Holdings B.V.,
Bharti Airtel Developers Forum Limited, Bharti Airtel Gabon Holdings
B.V. , Bharti Airtel Kenya B.V., Bharti Airtel Kenya Holdings B.V., Bharti
Airtel Madagascar Holdings B.V. , Bharti Airtel Malawi Holdings B.V. ,
Bharti Airtel Mali Holdings B.V., Bharti Airtel Niger Holdings B.V. , Bharti
Airtel Nigeria B.V. , Bharti Airtel Nigeria Holdings II B.V. , Bharti Airtel
RDC Holdings B.V. , Bharti Airtel Services B.V. , Bharti Airtel Tanzania
B.V., Bharti Airtel Uganda Holdings B.V., Bharti Airtel Zambia Holdings
B.V., Celtel (Mauritius) Holdings Limited, Airtel Congo RDC S.A., Celtel
Niger S.A., Channel Sea Management Company (Mauritius) Limited,
Congo RDC Towers S.A., Gabon Towers S.A. (under dissolution), Indian
Ocean Telecom Limited, Madagascar Towers S.A., Malawi Towers
Limited, Mobile Commerce Congo S.A., Montana International,
Partnership Investments S.A.R.L, Société Malgache de Telephonie
Cellulaire SA, Tanzania Towers Limited, Bharti Airtel Rwanda Holdings
Limited , Airtel Money Transfer Ltd, Airtel Money Tanzania Limited , Airtel
Mobile Commerce Nigeria Limited (incorporate w.e.f. August 31, 2017),
Airtel Mobile Commerce Nigeria B.V.(incorporated w.e.f. 5th December,
2018), Airtel Mobile Commerce (Seychelles) B.V. (incorporated w.e.f.
29th January, 2019), Airtel Mobile Commerce Congo B.V. (incorporated
w.e.f. 29th January, 2019), Airtel Mobile Commerce Kenya B.V.
(incorporated w.e.f. 29th January, 2019), Airtel Mobile Commerce
Madagascar B.V. (incorporated w.e.f. 29th January, 2019), Airtel Mobile
Commerce Malawi B.V. (incorporated w.e.f. 29th January, 2019), Airtel
Mobile Commerce Rwanda B.V. (incorporated w.e.f. 29th January,
2019), Airtel Mobile Commerce Tchad B.V. (incorporated w.e.f. 29th
January, 2019), Airtel Mobile Commerce Uganda B.V. (incorporated
w.e.f. 29th January, 2019), Airtel Mobile Commerce Zambia B.V.
(incorporated w.e.f. 29th January, 2019), Airtel International LLP
(incorporated w.e.f. 27th March, 2019, Tigo Rwanda Limited (merged
with Airtel Rwanda Ltd w.e.f. July 3, 2018), Airtel Money Trust,
Seychelles Cable Systems Company Limited (Associate), Airtel Mobile
Commerce Gabon B.V., Airtel Mobile Commerce Niger B.V., Airtel
Mobile Commerce DRC B.V. and Airtel Money Kenya Limited.
Disclaimer: By reading this presentation you agree to be bound by the
following conditions.
The information contained in this presentation in relation to Airtel Africa
plc ("Airtel Africa") and its subsidiaries has been prepared solely for use
at this presentation. The presentation is not directed to, or intended for
distribution to or use by, any person or entity that is a citizen or resident
or located in any jurisdiction where such distribution, publication,
availability or use would be contrary to law or regulation or which would
require any registration or licensing within such jurisdiction.
References in this presentation to "Airtel Africa", "Group", "we", "us" and
"our" when denoting opinion refer to Airtel Africa plc and its subsidiaries.
Forward-looking statement
This document contains certain forward-looking statements including
"forward-looking" statements made within the meaning of Section 21E of
the United States Securities Exchange Act of 1934, regarding our
intentions, beliefs or current expectations concerning, amongst other
things, our results of operations, financial condition, liquidity, prospects,
growth, strategies and the economic and business circumstances
occurring from time to time in the countries and markets in which the
Group operates.
These statements are often, but not always, made through the use of
words or phrases such as "believe," "anticipate," "could," "may," "would,"
"should," "intend," "plan," "potential," "predict," "will," "expect," "estimate,"
"project," "positioned," "strategy," "outlook", "target" and similar
expressions.
It is believed that the expectations reflected in this document are
reasonable, but they may be affected by a wide range of variables that
could cause actual results to differ materially from those currently
anticipated.

Page 2 of 61
All such forward-looking statements involve estimates and assumptions
that are subject to risks, uncertainties and other factors that could cause
actual future financial condition, performance and results to differ
materially from the plans, goals, expectations and results expressed in
the forward-looking statements and other financial and/or statistical data
within this communication.
Among the key factors that could cause actual results to differ materially
from those projected in the forward-looking statements are uncertainties
related to the following: the impact of competition from illicit trade; the
impact of adverse domestic or international legislation and regulation;
changes in domestic or international tax laws and rates; adverse litigation
and dispute outcomes and the effect of such outcomes on Airtel Africa’s
financial condition; changes or differences in domestic or international
economic or political conditions; the ability to obtain price increases and
the impact of price increases on consumer affordability thresholds;
adverse decisions by domestic or international regulatory bodies; the
impact of market size reduction and consumer down-trading;
translational and transactional foreign exchange rate exposure; the
impact of serious injury, illness or death in the workplace; the ability to
maintain credit ratings; the ability to develop, produce or market new
alternative products and to do so profitably; the ability to effectively
implement strategic initiatives and actions taken to increase sales
growth; the ability to enhance cash generation and pay dividends and
changes in the market position, businesses, financial condition, results
of operations or prospects of Airtel Africa.
Past performance is no guide to future performance and persons needing
advice should consult an independent financial adviser. The forward-
looking statements contained in this document reflect the knowledge and
information available to Airtel Africa at the date of preparation of this
document and Airtel Africa undertakes no obligation to update or revise
these forward-looking statements, whether as a result of new
information, future events or otherwise. Readers are cautioned not to
place undue reliance on such forward-looking statements.
No statement in this communication is intended to be, nor should be
construed as, a profit forecast or a profit estimate and no statement in
this communication should be interpreted to mean that earnings per
share of Airtel Africa plc for the current or any future financial periods
would necessarily match, exceed or be lower than the historical
published earnings per share of Airtel Africa plc.
Financial data included in this document are presented in US$ rounded
to the nearest million. Therefore, discrepancies in the tables between
totals and the sums of the amounts listed may occur due to such
rounding. The percentages included in the tables throughout the
document are based on numbers calculated to the nearest $1,000 and
therefore minor rounding differences may results in the tables.
No profit or earnings per share forecasts
No statement in this communication is intended to be, nor should be
construed as, a profit forecast or a profit estimate and no statement in
this communication should be interpreted to mean that earnings per
share of Airtel Africa for the current or any future financial periods would
necessarily match, exceed or be lower than the historical published
earnings per share of Airtel Africa.
Audience
The material in this presentation is provided for the purpose of giving
information about Airtel Africa and its subsidiaries to investors only and
is not intended for general consumers. Airtel Africa, its directors,
employees, agents or advisers do not accept or assume responsibility to
any other person to whom this material is shown or into whose hands it
may come and any such responsibility or liability is expressly disclaimed.

Page 3 of 61
TABLE OF CONTENTS
Section 1 Performance at a glance 4
Section 2 Financial Highlights
2.1 Consolidated - Summary of Consolidated Financial Statements 5
2.2 Consolidated - Summary of Statement of Financial Position 6
Section 3 Segment Wise – Summary of Financial Statements
3.1 Summarized Statement of Operations 7
3.2 Segment Wise Contribution 10
Section 4 Product wise – Summary of Financial Statements
4.1 Mobile Services – Summarized Statement of Operations 11
4.2 Mobile Services – Segment Wise Contribution 15
4.3 Mobile Money – Summarized Statement of Operations 16
4.4 Product Wise Contribution 17
Section 5 Operating Highlights 18
Section 6 Management Discussion and Analysis
6.1 Reporting Methodology 22
6.2 Key Company Developments 22
6.3 Results of Operations 25
Section 7 Detailed Financial and Related Information 30
Section 8 Net Debt and Cost Schedules 37
Section 9 Trends and Ratio Analysis 39
Section 10 Key Accounting Policies 52
Section 11 Glossary 57
Page 4 of 61
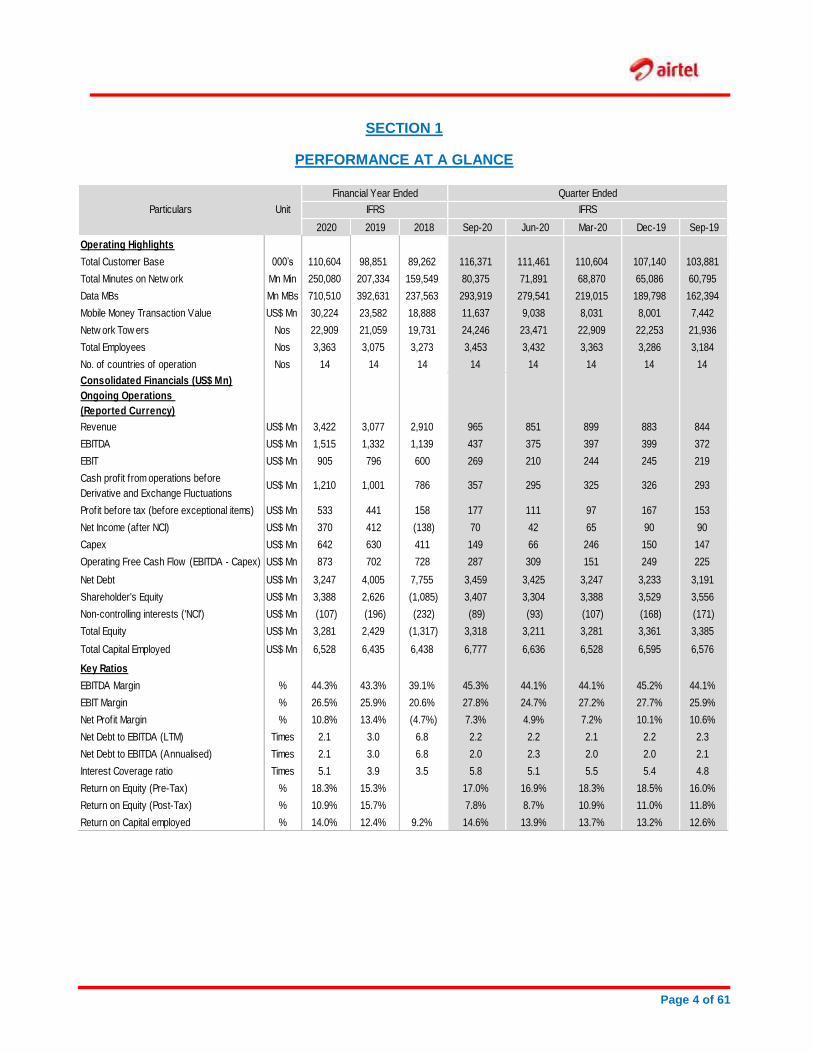
SECTION 1
PERFORMANCE AT A GLANCE
Financial Year Ended Quarter Ended
2020 2019 2018 Sep-20 Jun-20 Mar-20 Dec-19 Sep-19
Operating Highlights
Total Customer Base 000’s 110,604 98,851 89,262 116,371 111,461 110,604 107,140 103,881
Total Minutes on Netw ork Mn Min 250,080 207,334 159,549 80,375 71,891 68,870 65,086 60,795
Data MBs Mn MBs 710,510 392,631 237,563 293,919 279,541 219,015 189,798 162,394
Mobile Money Transaction Value US$ Mn 30,224 23,582 18,888 11,637 9,038 8,031 8,001 7,442
Netw ork Tow ers Nos 22,909 21,059 19,731 24,246 23,471 22,909 22,253 21,936
Total Employees Nos 3,363 3,075 3,273 3,453 3,432 3,363 3,286 3,184
No. of countries of operation Nos 14 14 14 14 14 14 14 14
Consolidated Financials (US$ Mn)
Ongoing Operations
(Reported Currency)
Revenue US$ Mn 3,422 3,077 2,910 965 851 899 883 844
EBITDA US$ Mn 1,515 1,332 1,139 437 375 397 399 372
EBIT US$ Mn 905 796 600 269 210 244 245 219
Cash profit from operations before
Derivative and Exchange FluctuationsUS$ Mn 1,210 1,001 786 357 295 325 326 293
Profit before tax (before exceptional items) US$ Mn 533 441 158 177 111 97 167 153
Net Income (after NCI) US$ Mn 370 412 (138) 70 42 65 90 90
Capex US$ Mn 642 630 411 149 66 246 150 147
Operating Free Cash Flow (EBITDA - Capex) US$ Mn 873 702 728 287 309 151 249 225
Net Debt US$ Mn 3,247 4,005 7,755 3,459 3,425 3,247 3,233 3,191
Shareholder's Equity US$ Mn 3,388 2,626 (1,085) 3,407 3,304 3,388 3,529 3,556
Non-controlling interests ('NCI') US$ Mn (107) (196) (232) (89) (93) (107) (168) (171)
Total Equity US$ Mn 3,281 2,429 (1,317) 3,318 3,211 3,281 3,361 3,385
Total Capital Employed US$ Mn 6,528 6,435 6,438 6,777 6,636 6,528 6,595 6,576
Key Ratios
EBITDA Margin % 44.3% 43.3% 39.1% 45.3% 44.1% 44.1% 45.2% 44.1%
EBIT Margin % 26.5% 25.9% 20.6% 27.8% 24.7% 27.2% 27.7% 25.9%
Net Profit Margin % 10.8% 13.4% (4.7%) 7.3% 4.9% 7.2% 10.1% 10.6%
Net Debt to EBITDA (LTM) Times 2.1 3.0 6.8 2.2 2.2 2.1 2.2 2.3
Net Debt to EBITDA (Annualised) Times 2.1 3.0 6.8 2.0 2.3 2.0 2.0 2.1
Interest Coverage ratio Times 5.1 3.9 3.5 5.8 5.1 5.5 5.4 4.8
Return on Equity (Pre-Tax) % 18.3% 15.3% 0.0% 17.0% 16.9% 18.3% 18.5% 16.0%
Return on Equity (Post-Tax) % 10.9% 15.7% 0.0% 7.8% 8.7% 10.9% 11.0% 11.8%
Return on Capital employed % 14.0% 12.4% 9.2% 14.6% 13.9% 13.7% 13.2% 12.6%
IFRSParticulars Unit IFRS

Page 5 of 61
SECTION 2
FINANCIAL HIGHLIGHTS
The financial information contained in this report is drawn from Airtel Africa plc’s interim unaudited condensed consolidated financial
statements prepared under IAS 34 for the six months ended 30 September 2020 and from Airtel Africa plc’s Audited Consolidated Financial
Statements for the year ended 31 March 2020 prepared under International Financial Reporting Standard (IFRS) for the comparative periods
presented.
2.1 Summary of Consolidated Financial Statements
2.1.1 Consolidated Summarized Statement of Operations – (in Reported Currency)
Amount in US$ Mn, except ratios
Quarter Ended Half Year Ended
Sep-20 Sep-19Y-on-Y
ChangeSep-20 Sep-19
Y-on-Y
Change
Revenue 965 844 14% 1,815 1,640 11%
EBITDA 437 372 17% 812 719 13%
EBITDA / Revenue 45.3% 44.1% 1.2 pp 44.7% 43.9% 0.8 pp
EBIT 269 219 23% 479 416 15%
Finance cost (net) 92 66 39% 191 148 29%
Share of results of Associate (0) (0) (129%) (1) (0) (40%)
Profit before tax (before exceptional items) 177 153 16% 288 270 7%
Income tax expense 85 68 26% 146 116 26%
Profit after tax (before exceptional items) 92 85 8% 142 154 (8%)
Non Controlling Interest (before exceptional items) 17 6 166% 29 13 130%
Net Income (before exceptional items) 75 79 (5%) 113 141 (20%)
Exceptional Items (net of tax) 4 (11) 136% (3) (74) 96%
Profit after tax (after exceptional items) 88 96 (9%) 145 228 (37%)
Non Controlling Interest 18 6 207% 33 13 162%
Net Income (after NCI) 70 90 (21%) 112 215 (48%)
Capex 149 147 2% 216 246 (12%)
Operating Free Cash Flow (EBITDA - Capex) 287 225 28% 596 473 26%
Total Capital Employed 6,777 6,576 3% 6,777 6,576 3%
Particulars

Page 6 of 61
2.1.2 Consolidated Summarized Statement of Operations – (in Constant Currency)
Amount in US$ Mn, except ratios
Quarter Ended Half Year Ended
Sep-20 Sep-19Y-on-Y
ChangeSep-20 Sep-19
Y-on-Y
Change
Revenue 963 805 20% 1,818 1,562 16%
EBITDA 436 353 24% 813 681 19%
EBITDA / Revenue 45.3% 43.8% 1.5 pp 44.7% 43.6% 1.1 pp
EBIT 269 205 31% 480 390 23%
Capex 149 147 2% 216 246 (12%)
Operating Free Cash Flow (EBITDA - Capex) 287 206 39% 597 435 37%
Particulars
Closing currency rates as on March 31, 2020 considered for Constant currency. Reported currency rates considered for Capex.
2.2 Consolidated - Summary of Statement of Financial Position (in Reported Currency)
Amount in US$ Mn
As at As at
Sep 30, 2020 Mar 31, 2020
Assets
Non-current assets 7,782 7,654
Current assets 1,830 1,671
Total assets 9,612 9,325
Liabilities
Current liabilities 3,243 2,488
Non-current liabilities 3,051 3,556
Total liabilities 6,294 6,044
Net current liability (1,413) (817)
Net Assets 3,318 3,281
Equity
Equity attributable to ow ners of the company 3,407 3,388
Non-controlling interests ('NCI') (89) (107)
Total equity 3,318 3,281
Total Equity and liabilities 9,612 9,325
Particulars

Page 7 of 61
SECTION 3
SEGMENT WISE – SUMMARY OF FINANCIAL STATEMENTS Segmental reporting includes all businesses of that geography.
3.1 Summarized Statement of Operations
3.1.1 Nigeria In Reported Currency
Amount in US$ Mn, except ratios
Quarter Ended Half Year Ended
Sep-20 Sep-19Y-on-Y
ChangeSep-20 Sep-19
Y-on-Y
Change
Revenue 377 327 15% 718 640 12%
EBITDA 204 174 18% 386 341 13%
EBITDA / Revenue 54.2% 53.1% 1.1 pp 53.8% 53.2% 0.6 pp
EBIT 141 129 10% 271 252 8%
Capex 67 62 8% 97 115 (15%)
Operating Free Cash Flow
(EBITDA - Capex)137 112 23% 289 226 28%
Particulars
In Constant Currency
Amount in US$ Mn, except ratios
Quarter Ended Half Year Ended
Sep-20 Sep-19Y-on-Y
ChangeSep-20 Sep-19
Y-on-Y
Change
Revenue 379 307 23% 721 600 20%
EBITDA 205 163 26% 388 319 22%
EBITDA / Revenue 54.2% 53.1% 1.1 pp 53.8% 53.2% 0.6 pp
EBIT 142 121 17% 272 236 16%
Capex 67 62 8% 97 115 (15%)
Operating Free Cash Flow
(EBITDA - Capex)138 101 37% 290 204 43%
Particulars
Closing currency rates as on March 31, 2020 considered for Constant currency. Reported currency rates considered for Capex.

Page 8 of 61
3.1.2 East Africa (Uganda, Zambia, Tanzania, Kenya, Malawi and Rwanda)
In Reported Currency
Amount in US$ Mn, except ratios
Quarter Ended Half Year Ended
Sep-20 Sep-19Y-on-Y
ChangeSep-20 Sep-19
Y-on-Y
Change
Revenue 355 301 18% 659 578 14%
EBITDA 163 123 33% 292 233 25%
EBITDA / Revenue 46.0% 40.7% 5.4 pp 44.3% 40.3% 4.0 pp
EBIT 110 65 70% 184 116 59%
Capex 62 30 106% 81 60 36%
Operating Free Cash Flow
(EBITDA - Capex)101 93 10% 211 173 22%
Particulars
In Constant Currency
Amount in US$ Mn, except ratios
Quarter Ended Half Year Ended
Sep-20 Sep-19Y-on-Y
ChangeSep-20 Sep-19
Y-on-Y
Change
Revenue 358 284 26% 664 545 22%
EBITDA 164 114 44% 293 217 35%
EBITDA / Revenue 45.8% 40.2% 5.6 pp 44.2% 39.9% 4.3 pp
EBIT 110 59 87% 185 106 74%
Capex 62 30 106% 81 60 36%
Operating Free Cash Flow
(EBITDA - Capex)102 84 21% 212 157 35%
Particulars
Closing currency rates as on March 31, 2020 considered for Constant currency. Reported currency rates considered for Capex.

Page 9 of 61
3.1.3 Francophone Africa (DRC, Gabon, Congo B, Madagascar, Niger, Chad and Seychelles)
In Reported Currency
Amount in US$ Mn, except ratios
Quarter Ended Half Year Ended
Sep-20 Sep-19Y-on-Y
ChangeSep-20 Sep-19
Y-on-Y
Change
Revenue 236 217 9% 445 426 5%
EBITDA 73 76 (4%) 146 140 4%
EBITDA / Revenue 30.8% 34.9% -4.1 pp 32.8% 32.9% 0.0 pp
EBIT 23 29 (20%) 47 47 1%
Capex 20 54 (63%) 36 69 (48%)
Operating Free Cash Flow
(EBITDA - Capex)53 22 145% 110 71 55%
Particulars
In Constant Currency
Amount in US$ Mn, except ratios
Quarter Ended Half Year Ended
Sep-20 Sep-19Y-on-Y
ChangeSep-20 Sep-19
Y-on-Y
Change
Revenue 230 216 6% 441 422 4%
EBITDA 71 76 (6%) 145 139 4%
EBITDA / Revenue 30.9% 35.0% -4.0 pp 32.9% 33.0% -0.1 pp
EBIT 23 29 (21%) 47 47 (0%)
Capex 20 54 (63%) 36 69 (48%)
Operating Free Cash Flow
(EBITDA - Capex)51 21 142% 109 71 54%
Particulars
Closing currency rates as on March 31, 2020 considered for Constant currency. Reported currency rates considered for Capex.

Page 10 of 61
3.2 Segment Wise Contribution (in Constant Currency)
Quarter Ended:
Amount in US$ Mn, except ratios
Quarter Ended Sep-20
Revenue % of Total EBITDA % of Total Capex % of Total
Nigeria 379 39% 205 47% 67 45%
East Africa 358 37% 164 38% 62 41%
Francophone Africa 230 24% 71 16% 20 13%
Total before Elimnation/Others 966 100% 440 101% 149 99%
Eliminations / Others (3) (0%) (4) (1%) 1 1%
Total 963 100% 436 100% 149 100%
Region
Closing currency rates as on March 31, 2020 considered for Constant currency. Reported currency rates considered for Capex.
Half Year Ended:
Amount in US$ Mn, except ratios
Half Year Ended Sep-20
Revenue % of Total EBITDA % of Total Capex % of Total
Nigeria 721 40% 388 48% 97 45%
East Africa 664 37% 293 36% 81 38%
Francophone Africa 441 24% 145 18% 36 17%
Total before Elimnation/Others 1,826 100% 826 102% 215 100%
Eliminations / Others (7) (0%) (13) (2%) 1 0%
Total 1,818 100% 813 100% 216 100%
Region
Closing currency rates as on March 31, 2020 considered for Constant currency. Reported currency rates considered for Capex.

Page 11 of 61
SECTION 4
PRODUCT WISE – SUMMARY OF FINANCIAL STATEMENTS
4.1 Mobile Services- Summarized Statement of Operations
4.1.1 Consolidated Summarized Statement of Operations In Reported Currency
Amount in US$ Mn, except ratios
Quarter Ended Half Year Ended
Sep-20 Sep-19Y-on-Y
ChangeSep-20 Sep-19
Y-on-Y
Change
Revenue 891 790 13% 1,689 1,540 10%
EBITDA 392 335 17% 737 644 14%
EBITDA / Revenue 44.0% 42.4% 1.6 pp 43.6% 41.8% 1.8 pp
EBIT 228 186 23% 420 347 21%
Capex 147 145 1% 211 241 (12%)
Operating Free Cash Flow
(EBITDA - Capex)245 189 29% 526 403 31%
Particulars
In Constant Currency
Amount in US$ Mn, except ratios
Quarter Ended Half Year Ended
Sep-20 Sep-19Y-on-Y
ChangeSep-20 Sep-19
Y-on-Y
Change
Revenue 889 754 18% 1,692 1,468 15%
EBITDA 392 317 24% 738 608 21%
EBITDA / Revenue 44.1% 42.0% 2.0 pp 43.6% 41.5% 2.2 pp
EBIT 229 174 31% 421 324 30%
Capex 147 145 1% 211 241 (12%)
Operating Free Cash Flow
(EBITDA - Capex)245 172 43% 528 368 43%
Particulars
Closing currency rates as on March 31, 2020 considered for Constant currency. Reported currency rates considered for Capex.

Page 12 of 61
4.1.2 Nigeria In Reported Currency
Amount in US$ Mn, except ratios
Quarter Ended Half Year Ended
Sep-20 Sep-19Y-on-Y
ChangeSep-20 Sep-19
Y-on-Y
Change
Revenue 377 326 16% 718 637 13%
EBITDA 204 172 19% 386 337 14%
EBITDA / Revenue 54.2% 52.9% 1.4 pp 53.8% 53.0% 0.8 pp
EBIT 142 127 11% 271 248 9%
Capex 67 62 8% 97 115 (15%)
Operating Free Cash Flow
(EBITDA - Capex)137 110 25% 289 222 30%
Particulars
In Constant Currency
Amount in US$ Mn, except ratios
Quarter Ended Half Year Ended
Sep-20 Sep-19Y-on-Y
ChangeSep-20 Sep-19
Y-on-Y
Change
Revenue 378 306 24% 721 597 21%
EBITDA 205 162 27% 388 316 23%
EBITDA / Revenue 54.2% 52.9% 1.4 pp 53.8% 53.0% 0.8 pp
EBIT 142 120 19% 273 233 17%
Capex 67 62 8% 97 115 (15%)
Operating Free Cash Flow
(EBITDA - Capex)138 99 39% 291 201 44%
Particulars
Closing currency rates as on March 31, 2020 considered for Constant currency. Reported currency rates considered for Capex.
Page 13 of 61
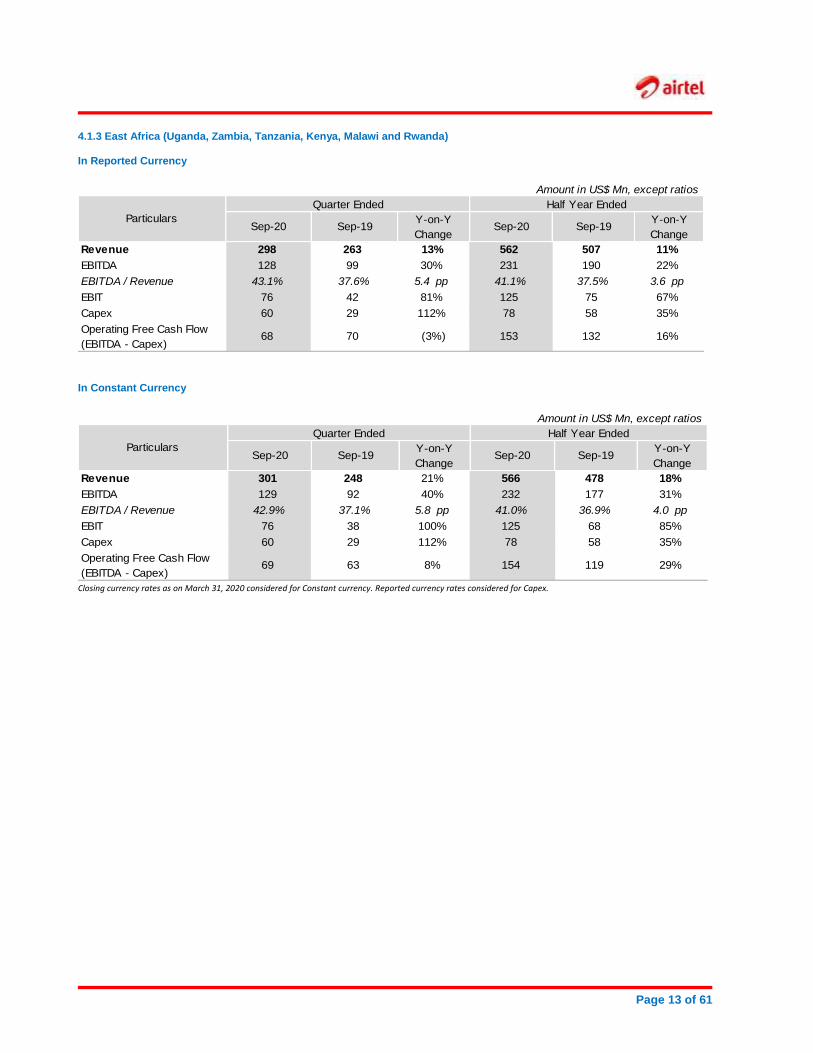
4.1.3 East Africa (Uganda, Zambia, Tanzania, Kenya, Malawi and Rwanda) In Reported Currency
Amount in US$ Mn, except ratios
Quarter Ended Half Year Ended
Sep-20 Sep-19Y-on-Y
ChangeSep-20 Sep-19
Y-on-Y
Change
Revenue 298 263 13% 562 507 11%
EBITDA 128 99 30% 231 190 22%
EBITDA / Revenue 43.1% 37.6% 5.4 pp 41.1% 37.5% 3.6 pp
EBIT 76 42 81% 125 75 67%
Capex 60 29 112% 78 58 35%
Operating Free Cash Flow
(EBITDA - Capex)68 70 (3%) 153 132 16%
Particulars
In Constant Currency
Amount in US$ Mn, except ratios
Quarter Ended Half Year Ended
Sep-20 Sep-19Y-on-Y
ChangeSep-20 Sep-19
Y-on-Y
Change
Revenue 301 248 21% 566 478 18%
EBITDA 129 92 40% 232 177 31%
EBITDA / Revenue 42.9% 37.1% 5.8 pp 41.0% 36.9% 4.0 pp
EBIT 76 38 100% 125 68 85%
Capex 60 29 112% 78 58 35%
Operating Free Cash Flow
(EBITDA - Capex)69 63 8% 154 119 29%
Particulars
Closing currency rates as on March 31, 2020 considered for Constant currency. Reported currency rates considered for Capex.

Page 14 of 61
4.1.4 Francophone Africa (DRC, Gabon, Congo B, Madagascar, Niger, Chad and Seychelles) In Reported Currency
Amount in US$ Mn, except ratios
Quarter Ended Half Year Ended
Sep-20 Sep-19Y-on-Y
ChangeSep-20 Sep-19
Y-on-Y
Change
Revenue 218 203 8% 414 398 4%
EBITDA 60 64 (6%) 121 116 4%
EBITDA / Revenue 27.5% 31.4% -3.9 pp 29.3% 29.2% 0.1 pp
EBIT 10 16 (36%) 23 23 (2%)
Capex 20 54 (64%) 35 68 (48%)
Operating Free Cash Flow
(EBITDA - Capex)40 9 335% 86 49 77%
Particulars
In Constant Currency
Amount in US$ Mn, except ratios
Quarter Ended Half Year Ended
Sep-20 Sep-19Y-on-Y
ChangeSep-20 Sep-19
Y-on-Y
Change
Revenue 213 202 6% 410 395 4%
EBITDA 59 63 (7%) 120 116 4%
EBITDA / Revenue 27.6% 31.4% -3.9 pp 29.4% 29.3% 0.1 pp
EBIT 10 16 (37%) 23 24 (3%)
Capex 20 54 (64%) 35 68 (48%)
Operating Free Cash Flow
(EBITDA - Capex)39 9 333% 85 48 77%
Particulars
Closing currency rates as on March 31, 2020 considered for Constant currency. Reported currency rates considered for Capex.

Page 15 of 61
4.2 Mobile Services - Segment Wise Contribution (in Constant Currency) Quarter Ended:
Amount in US$ Mn, except ratios
Quarter Ended Sep-20
Revenue % of Total EBITDA % of Total Capex % of Total
Nigeria 378 43% 205 52% 67 46%
East Africa 301 34% 129 33% 60 41%
Francophone Africa 213 24% 59 15% 20 13%
Total before Elimnation/Others 892 100% 393 100% 147 100%
Eliminations / Others (3) (0%) (1) (0%) 0 0%
Total 889 100% 392 100% 147 100%
Region
Closing currency rates as on March 31, 2020 considered for Constant currency. Reported currency rates considered for Capex.
Half Year Ended:
Amount in US$ Mn, except ratios
Half Year Ended Sep-20
Revenue % of Total EBITDA % of Total Capex % of Total
Nigeria 721 43% 388 53% 97 46%
East Africa 566 33% 232 31% 78 37%
Francophone Africa 410 24% 120 16% 35 17%
Total before Elimnation/Others 1,697 100% 740 100% 211 100%
Eliminations / Others (5) (0%) (2) (0%) 0 0%
Total 1,692 100% 738 100% 211 100%
Region
Closing currency rates as on March 31, 2020 considered for Constant currency. Reported currency rates considered for Capex.
Page 16 of 61
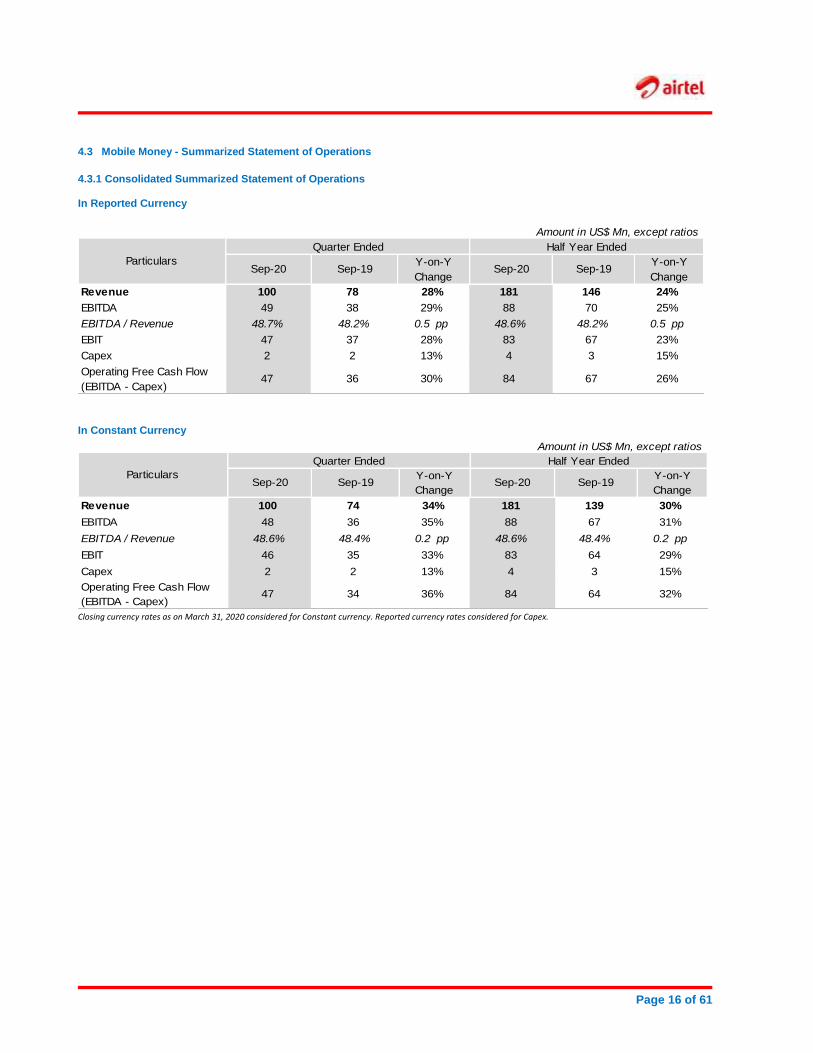
4.3 Mobile Money - Summarized Statement of Operations
4.3.1 Consolidated Summarized Statement of Operations In Reported Currency
Amount in US$ Mn, except ratios
Quarter Ended Half Year Ended
Sep-20 Sep-19Y-on-Y
ChangeSep-20 Sep-19
Y-on-Y
Change
Revenue 100 78 28% 181 146 24%
EBITDA 49 38 29% 88 70 25%
EBITDA / Revenue 48.7% 48.2% 0.5 pp 48.6% 48.2% 0.5 pp
EBIT 47 37 28% 83 67 23%
Capex 2 2 13% 4 3 15%
Operating Free Cash Flow
(EBITDA - Capex)47 36 30% 84 67 26%
Particulars
In Constant Currency
Amount in US$ Mn, except ratios
Quarter Ended Half Year Ended
Sep-20 Sep-19Y-on-Y
ChangeSep-20 Sep-19
Y-on-Y
Change
Revenue 100 74 34% 181 139 30%
EBITDA 48 36 35% 88 67 31%
EBITDA / Revenue 48.6% 48.4% 0.2 pp 48.6% 48.4% 0.2 pp
EBIT 46 35 33% 83 64 29%
Capex 2 2 13% 4 3 15%
Operating Free Cash Flow
(EBITDA - Capex)47 34 36% 84 64 32%
Particulars
Closing currency rates as on March 31, 2020 considered for Constant currency. Reported currency rates considered for Capex.

Page 17 of 61
4.4 Product Wise Contribution (in Constant Currency)
Quarter Ended:
Amount in US$ Mn, except ratios
Quarter Ended Sep-20
Revenue % of Total EBITDA % of Total Capex % of Total
Mobile Services 889 92% 392 90% 147 98%
Mobile Money 100 10% 48 11% 2 1%
Total before Elimnation/Others 989 103% 440 101% 149 99%
Eliminations / Others (26) (3%) (4) (1%) 1 1%
Total 963 100% 436 100% 149 100%
Products
Closing currency rates as on March 31, 2020 considered for Constant currency. Reported currency rates considered for Capex.
Half Year Ended:
Amount in US$ Mn, except ratios
Half Year Ended Sep-20
Revenue % of Total EBITDA % of Total Capex % of Total
Mobile Services 1,692 93% 738 91% 211 98%
Mobile Money 181 10% 88 11% 4 2%
Total before Elimnation/Others 1,873 103% 826 102% 215 100%
Eliminations / Others (55) (3%) (13) (2%) 1 0%
Total 1,818 100% 813 100% 216 100%
Products
Closing currency rates as on March 31, 2020 considered for Constant currency. Reported currency rates considered for Capex.

Page 18 of 61
SECTION 5
OPERATING HIGHLIGHTS
The financial figures used for computing ARPU & Revenue per Site are based on Constant Currency. 5.1 Operational Performance (Quarter Ended)
5.1.1 Consolidated Operational Performance
Parameters Unit Sep-20 Jun-20Q-on-Q
ChangeSep-19
Y-on-Y
Change
Customer Base 000's 116,371 111,461 4.4% 103,881 12.0%
Net Additions 000's 4,910 857 473.1% 4,211 16.6%
Monthly Churn % 5.3% 5.7% -0.4 pp 4.5% 0.8 pp
Average Revenue Per User (ARPU) US$ 2.8 2.6 8.8% 2.6 6.8%
Voice
Voice Revenue US$ Mn 517 456 13.4% 464 11.5%
Minutes on the netw ork Mn 80,375 71,891 11.8% 60,795 32.2%
Voice Average Revenue Per User (ARPU) US$ 1.5 1.4 9.6% 1.5 (0.4%)
Voice Usage per customer min 235 218 8.1% 199 18.1%
Data
Data Revenue US$ Mn 283 267 6.0% 215 31.3%
Data Customer Base 000's 39,596 36,972 7.1% 31,910 24.1%
As % of Customer Base % 34.0% 33.2% 0.9 pp 30.7% 3.3 pp
Total MBs on the netw ork Mn MBs 293,919 279,541 5.1% 162,394 81.0%
Data Average Revenue Per User (ARPU) US$ 2.5 2.5 (0.4%) 2.3 6.9%
Data Usage per customer MBs 2,576 2,607 (1.2%) 1,748 47.3%
M obile M oney
Transaction Value US$ Mn 11,637 9,038 28.7% 7,442 56.4%
Transaction Value per Sub US$ 199 164 21.4% 166 20.3%
Mobile Money Revenue US$ Mn 100 81 22.3% 74 33.9%
Active Customers 000's 20,120 18,529 8.6% 15,521 29.6%
Mobile Money ARPU US$ 1.7 1.5 15.4% 1.7 3.0%
Network and Coverage
Netw ork tow ers Nos 24,246 23,471 775 21,936 2,310
Owned Towers Nos 4,561 4,569 (8) 4,461 100
Leased Towers Nos 19,685 18,902 783 17,475 2,210
Of w hich Mobile Broadband tow ers Nos 22,250 21,171 1,079 18,274 3,976
Total Mobile Broadband Base stations Nos 63,705 51,963 11,742 40,187 23,518
Data Capacity TB/day 10,253 8,371 22.5% 6,146 66.8%
Revenue Per Site Per Month US$ 13,408 12,257 9.4% 12,361 8.5%
Revenue & KPIs in Constant Currency rates. Closing currency rates as on March 31, 2020 considered for Constant currency.

Page 19 of 61
5.2 Nigeria Operational Performance
Parameters Unit Sep-20 Jun-20Q-on-Q
ChangeSep-19
Y-on-Y
Change
Customer Base 000's 44,054 42,513 3.6% 39,512 11.5%
Net Additions 000's 1,541 757 103.7% 2,044 (24.6%)
Monthly Churn % 6.1% 5.7% 0.4 pp 4.7% 1.4 pp
Average Revenue Per User (ARPU) US$ 2.9 2.7 6.6% 2.7 9.4%
Voice
Voice Revenue US$ Mn 217 198 9.8% 188 15.8%
Minutes on the netw ork Mn 20,867 19,275 8.3% 15,687 33.0%
Voice Average Revenue Per User (ARPU) US$ 1.7 1.6 5.9% 1.6 2.9%
Voice Usage per customer min 161 154 4.5% 136 18.2%
Data
Data Revenue US$ Mn 135 122 10.5% 99 36.7%
Data Customer Base 000's 19,003 17,334 9.6% 15,471 22.8%
As % of Customer Base % 43.1% 40.8% 2.4 pp 39.2% 4.0 pp
Total MBs on the netw ork Mn MBs 147,471 139,285 5.9% 80,247 83.8%
Data Average Revenue Per User (ARPU) US$ 2.5 2.4 4.0% 2.2 14.4%
Data Usage per customer MBs 2,743 2,752 (0.3%) 1,784 53.8%
Network and Coverage
Netw ork tow ers Nos 10,347 9,802 545 8,878 1,469
Owned Towers Nos 199 204 (5) 261 (62)
Leased Towers Nos 10,148 9,598 550 8,617 1,531
Of which Mobile Broadband towers Nos 10,002 9,326 676 7,695 2,307
Total Mobile Broadband Base stations Nos 30,091 19,258 10,833 13,209 16,882
Data Capacity TB/day 5,245 3,489 50.3% 2,343 123.9%
Revenue Per Site Per Month US$ 12,500 11,904 5.0% 11,760 6.3%
Revenue & KPIs in Constant Currency rates. Closing currency rates as on March 31, 2020 considered for Constant currency.

Page 20 of 61
5.3 East Africa Operational Performance (Uganda, Zambia, Tanzania, Kenya, Malawi and Rwanda)
Parameters Unit Sep-20 Jun-20Q-on-Q
ChangeSep-19
Y-on-Y
Change
Customer Base 000's 51,265 48,757 5.1% 45,007 13.9%
Net Additions 000's 2,508 123 1,940.1% 1,955 28.2%
Monthly Churn % 4.5% 5.7% -1.2 pp 3.8% 0.7 pp
Average Revenue Per User (ARPU) US$ 2.4 2.1 12.8% 2.2 10.8%
Voice
Voice Revenue US$ Mn 171 144 19.2% 146 17.2%
Minutes on the netw ork Mn 51,335 45,107 13.8% 38,290 34.1%
Voice Average Revenue Per User (ARPU) US$ 1.1 1.0 15.0% 1.1 3.0%
Voice Usage per customer min 342 311 9.8% 290 17.9%
Data
Data Revenue US$ Mn 89 86 3.0% 69 28.7%
Data Customer Base 000's 14,924 14,041 6.3% 12,142 22.9%
As % of Customer Base % 29.1% 28.8% 0.3 pp 27.0% 2.1 pp
Total MBs on the netw ork Mn MBs 115,048 110,172 4.4% 66,644 72.6%
Data Average Revenue Per User (ARPU) US$ 2.0 2.1 (4.2%) 2.0 3.0%
Data Usage per customer MBs 2,632 2,711 (2.9%) 1,905 38.2%
Network and Coverage
Netw ork tow ers Nos 9,193 9,039 154 8,678 515
Owned Towers Nos 2,544 2,535 9 2,421 123
Leased Towers Nos 6,649 6,504 145 6,257 392
Of which Mobile Broadband towers Nos 8,039 7,880 159 7,386 653
Total Mobile Broadband Base stations Nos 22,567 22,071 496 19,564 3,003
Data Capacity TB/day 3,426 3,355 2.1% 2,805 22.2%
Revenue Per Site Per Month US$ 13,025 11,264 15.6% 10,937 19.1%
Revenue & KPIs in Constant Currency rates. Closing currency rates as on March 31, 2020 considered for Constant currency.

Page 21 of 61
5.4 Francophone Africa Operational Performance (DRC, Gabon, Congo B, Madagascar, Niger, Chad and Seychelles)
Parameters Unit Sep-20 Jun-20Q-on-Q
ChangeSep-19
Y-on-Y
Change
Customer Base 000's 21,052 20,190 4.3% 19,362 8.7%
Net Additions 000's 862 (23) 3,908.1% 212 307.1%
Monthly Churn % 5.5% 5.9% -0.4 pp 5.8% -0.3 pp
Average Revenue Per User (ARPU) US$ 3.7 3.5 6.5% 3.7 (0.4%)
Voice
Voice Revenue US$ Mn 131 117 11.7% 132 (0.9%)
Minutes on the netw ork Mn 8,173 7,509 8.8% 6,818 19.9%
Voice Average Revenue Per User (ARPU) US$ 2.1 1.9 9.0% 2.3 (7.2%)
Voice Usage per customer min 132 125 6.2% 118 12.2%
Data
Data Revenue US$ Mn 59 58 0.9% 47 23.6%
Data Customer Base 000's 5,669 5,596 1.3% 4,297 31.9%
As % of Customer Base % 26.9% 27.7% -0.8 pp 22.2% 4.7 pp
Total MBs on the netw ork Mn MBs 31,400 30,083 4.4% 15,503 102.5%
Data Average Revenue Per User (ARPU) US$ 3.5 3.6 (3.0%) 3.7 (4.1%)
Data Usage per customer MBs 1,889 1,882 0.4% 1,202 57.2%
Network and Coverage
Netw ork tow ers Nos 4,706 4,630 76 4,380 326
Owned Towers Nos 1,818 1,830 (12) 1,779 39
Leased Towers Nos 2,888 2,800 88 2,601 287
Of which Mobile Broadband towers Nos 4,209 3,965 244 3,193 1,016
Total Mobile Broadband Base stations Nos 11,047 10,634 413 7,414 3,633
Data Capacity TB/day 1,582 1,527 3.6% 999 58.4%
Revenue Per Site Per Month US$ 16,363 15,222 7.5% 16,575 (1.3%)
Revenue & KPIs in Constant Currency rates. Closing currency rates as on March 31, 2020 considered for Constant currency.
.

Page 22 of 61
SECTION 6
MANAGEMENT DISCUSSION AND ANALYSIS
6.1 Reporting Methodology
The results for the six months ended 30 September 2020 are
unaudited and in the opinion of management, include all
adjustments necessary for the fair presentation of the results
of the same period. The financial information has been
prepared based on International Accounting Standard 34
(IAS 34) and apply the same accounting policies,
presentation and methods of calculation as those followed in
the preparation of the Group’s annual consolidated financial
statements for the year ended 31 March 2020 except to the
extent required/ prescribed by IAS 34. This report should be
read in conjunction with audited consolidated financial
statements and related notes for the year ended 31 March
2020. The comparative information has been drawn based
on Airtel Africa plc’s Audited Consolidated Financial
Statements for the year ended 31 March 2020 prepared
under International Financial Reporting Standard (IFRS).
The information, apart from the extract of the Financial
Statements in Section 7, is on underlying basis and
exceptional items are shown separately. This enables an
organic comparison of results with past periods.
6.2 Key company developments
COVID-19
At the beginning of the pandemic, most governments in the
countries where we operate acted swiftly to implement and enforce
restrictions on the movement of people at the very early stage of
the contagion. These swift actions coupled with a continent which
benefits from low population density, less frequent travel, and
experience in dealing with contagious diseases has resulted in
lower infection rates in sub-Saharan Africa. In subsequent months
some of these restrictions were eased with local economies
improving, although consumers still feel cautious about social and
working habits.
During these times, the telecoms industry has emerged as a key
and essential service for these economies, allowing customers to
work remotely, reduce their travels, keep them connected and
allow access to affordable entertainment.
At Airtel Africa we worked to ensure the safety of our employees,
customers and partners and we have continued to work closely
with governments, regulators, and suppliers to ensure our network
remained fully operational and customers could access our
services, and continued to support the economies of these
countries and the communities we serve.
A strong focus on execution and a strong risk management
approach, coupled with the resilience of the telecom sector,
contributed to delivering revenue growth of 13% in constant
currency for the 3 months ended on 30 June 2020, which was the
peak of the pandemic in our footprint. Afterwards, social distancing
rules were eased, during the 3 months ended 30 September 2020,
and performance also improved as the business was largely
unaffected by COVID-19 and delivered revenue growth of 19.6%
in constant currency.
In other parts of the world, a so called second wave has already
started, with many governments reintroducing stricter social
distancing rules, which were relaxed during the summer months.
As Africa lagged the spread of the first wave, it may also lag the
spread of a second wave. Despite the resilience demonstrated by
the business during the course of the first wave, we are constantly
monitoring how the situation is evolving to identify key risks and
put in place adequate mitigation plans to minimise any potential
disruptions from the re-introduction of stricter social distancing
rules.
GOVERNANCE: We have a dedicated executive COVID-19
committee mandated to regularly identify risks, agree on action
plans and monitor their execution. As an outcome of the
committee’s role, the CEO and CFO have updated the Board on
the risks and actions identified whenever relevant. This ensures a
direct channel between local management and executive and non-
executive directors to ensure actions are agreed and executed
quickly.
SAFETY: Our priority is the health and wellbeing of our
employees, outsourced partners and customers, and we are
making every effort to ensure that our OPCOs have taken all
necessary steps to ensure their safety. All offices have an agreed
policy in place for remote working, working in shifts and social
distancing practices, depending on the critical needs of individual
functions. All employees continue to be on full pay and continue to
receive full medical insurance cover which includes any diagnostic
testing and associated physician visits related to COVID 19. We
have also granted immediate paid medical leave for any
employees diagnosed with COVID-19.
The outsourced staff in our call centres continue to work from
home or in a shift rotation where necessary but following strict
social distancing practices. They have all been given the option
and equipment to either work from home or, if necessary, from the
office following strict social distancing practices and regulatory
guidelines. Safety protective equipment and hand sanitisers have
also been made available within our shops to keep both our staff
and customers safe.
The safety of our customers is paramount to us. We have
executed various social educational digital campaigns explaining
best practices during the COVID-19 outbreak, and the importance
of being safe. We have also made a number of sites across our
businesses accessible free of charge to give students continuous

Page 23 of 61
access to quality education. Our staff across all our OPCOs have
also generously contributed and sacrificed from their salaries a
total of $362k which we have matched like for like as a company
and donated to the respective governments to support the
communities where we operate.
NETWORK and CAPEX: our network remains the main source for
many customers for social interactions, work and entertainment.
The key business continuity plans we implemented at the start of
the pandemic ensured that both active and passive maintenance
services could be safely carried out even when the movement of
people was restricted. During the last 6 months, despite an
increase in data traffic of more than 40%, our network did not
experience any significant disruption.
Our strategy of diversifying sourcing across four major providers
of network equipment is also protecting us from a company or
country-specific supply chain risk.
DISTRIBUTION: our priority was to ensure customers access to
our services. When lockdown restrictions were implemented, we
increased stock levels of SIM cards and recharge vouchers to
ensure availability in our shops and ensure customers could buy
recharges whenever convenient. We also encouraged customers
to use digital methods of recharge, including through USSD, bank
portals or our app. In April 2020 we launched the new MyAirtel
selfcare app in all 14 countries. Using the app, a customer can
check Airtime or Bundles and purchase them using Airtel Money
or any credit or debit cards. It also has Airtel Money features such
as Send Money to Airtel and other operators, Pay Bills, Pay
Merchants, Scan and pay using Airtel’s or Mastercard’s QR codes
and virtual cards Airtel Money and E-Recharge to minimise the
impact of any possible disruption to our distribution network. As
lockdown restrictions were eased we expanded our distribution, in
line with our strategy, and we continued to carry a higher amount
of stock to mitigate the risks possible future restrictions on the
movement of people could have on our stock levels and the ability
of customers to access our recharge vouchers.
MOBILE MONEY: during the initial phase of the pandemic mobile
revenue growth slowed down to 26.3% as the business was
impacted by social distancing measures and non-essential service
closures, reducing the ability of customers to deposit and withdraw
cash. Additionally, several governments asked mobile money
operators to waive fees on certain transactions, including person-
to-person and merchant payments. Afterwards, in the 3 months
ended 30 September 2020, as lockdown restrictions were eased
and most fees on transaction reinstated, revenue growth for the
period was 33.9%, up 7.6% from the prior quarter. We also
continue to engage with governments and regulators to allow
certain mobile money outlets to be classified as essential services
so that customers can fully access mobile money services despite
restrictions on the movement of people. Mobile money represents
10% of the Group’s revenue.
LIQUIDITY: we continue to benefit from a strong financial position.
Free cash flow increased 52% in the last 6 months and EBITDA
margin continued to improve by 0.8pp to 44.7%. Our net debt to
EBITDA ratio decreased to 2.2x, compared to the same period in
the prior year (from 2.3x), and cash balances in conjunction with
nearly $700 Mn of committed undrawn facilities ensure we can
meet our financial obligations. We have $2.4 bn in long-term bonds
with the first repayment of €750 Mn due in May 2021. The next
major bond repayment of $505 Mn is due in March 2023. In the
last financial year, we extended the maturity of $254 Mn of loans
due in December 2020 and January 2021 by an average of 18
months to two years, further improving our liquidity position in this
financial year. Additionally, we agreed longer payment terms up to
around 12 months with strategic vendors in certain markets in
order to continue invest in modernising the network while
increasing liquidity.
We have identified several ways to retain cash, reduce costs and
mitigate risks from COVID-19. We have continued to invest in
revenue driven expenditures while reducing discretionary spend.
Additionally, we benefited from lower travel and facility expenses
during the period as a result of travel bans and work from home
practices.
We continued to invest in our network and our commitment to
spend our planned $650 Mn to $700 Mn has not changed. Capex
in the 6 months ended 30 September was $216 Mn, a reduction of
12.4% compared to the comparable period in the prior year,
however this was largely due the impact of import logistics during
the pandemic period. In a worst-case scenario, we would be able
to reduce our capex budget significantly without compromising
network quality by prioritising expenditure.
FOREIGN EXCHANGE: The global economic slowdown
combined with lower oil and commodity prices has resulted in
currencies devaluing across our markets, including the Nigerian
naira, Kenyan shilling, Ugandan shilling and Zambian kwacha. By
far our largest exposure is in Nigeria, which represents 40% of our
revenue and 48% of EBITDA. On a 12-month basis, we estimate
that a 1% Nigerian naira devaluation will have a negative $14 Mn
impact on revenue, $8 Mn on EBITDA and $7 Mn on finance costs.
Other significant updates
Dividend
The Board approved a new progressive dividend policy as a result
of the continued strong business performance, significant
opportunities to invest in future growth and the aim to continue to
reduce leverage.
The newly adopted dividend policy aims to grow the dividend
annually by a mid to high single digit percentage from a base of $4
cents per share for FY 2021, until reported leverage (calculated as
net debt to EBITDA) falls below 2.0x.
At the point when reported leverage (calculated as net debt to
EBITDA) is below 2.0x, the Board will reassess the dividend policy
in light of the growth outlook for the Group.
Additional spectrum
In June 2020, Airtel Malawi plc was allocated a spectrum of 10
MHz in the 2600 band.
Abandonment of merger of Airtel Networks Kenya Limited
with Telkom Kenya Limited

Page 24 of 61
In August 2020, Airtel Africa plc announced that its subsidiary
Airtel Networks Kenya Limited ("Airtel Kenya") and Telkom Kenya
Limited ("Telkom") have decided to no longer pursue completion
of the M&A transaction. The transaction was announced in
February 2019 and was subject to the satisfaction of various
conditions precedent, including regulatory approvals. Despite
Airtel Africa plc and Telkom’s respective endeavours to reach a
successful closure, the transaction has gone through a very
lengthy process which has led the parties to reconsider their
stance.
Partnership with UNICEF
In May 2020, Airtel Africa announced a partnership with UNICEF
aimed at providing children with access to remote learning and
enabling access to cash assistance for their families via mobile
cash transfers. Under this partnership, UNICEF and Airtel Africa
will use mobile technology to benefit an estimated 133 Mn school
age children currently affected by school closures in 13 countries
across sub-Saharan Africa during the COVID-19 pandemic.
Mobile money
(a) Partnership with remittance leading institutions
Airtel Africa entered into several strategic partnerships with
MoneyGram, Mukuru and WorldRemit. Through these
partnerships, more than 20 Mn Airtel Money customers in 12
countries can transfer and receive funds across the globe directly
from and into their mobile money wallets on their phone. Mobile
money service alliances with these leading international money
transfer or remittance service providers will extensively enhance
the customer access to the digital world.
(b) Partnership with Standard Charted Bank
In August 2020, Airtel Africa announced a strategic partnership
with Standard Chartered Bank, a leading international banking
group, to drive financial inclusion across key markets in Africa by
providing customers with increased access to mobile financial
services. Standard Chartered and Airtel Africa work together to co-
create new, innovative products aimed at enhancing the
accessibility of financial services and ultimately, better serve
people across Africa. In line with this, Airtel Money's customers will
be able to make real-time online deposits and withdrawals from
Standard Chartered bank accounts, receive international money
transfers directly to their wallets, and access savings products
amongst other services.
(c) Partnership with Mastercard, Samsung and Asante
In September 2020, Airtel Africa announced an expansion of its
partnership with Mastercard by launching a Pay-on-Demand
payments platform and drive the digital economy across Africa.
This Pay-on-Demand platform enables safe, secure, and
convenient consumer financing via Samsung devices with an
embedded Knox security platform, through Airtel Africa’s network.
The partnership facilitates usage-based payments and builds
creditworthiness.
These partnerships align with the Group’s strategy of expanding
the range and depth of Airtel Money offerings to drive customer
growth and penetration.
Page 25 of 61
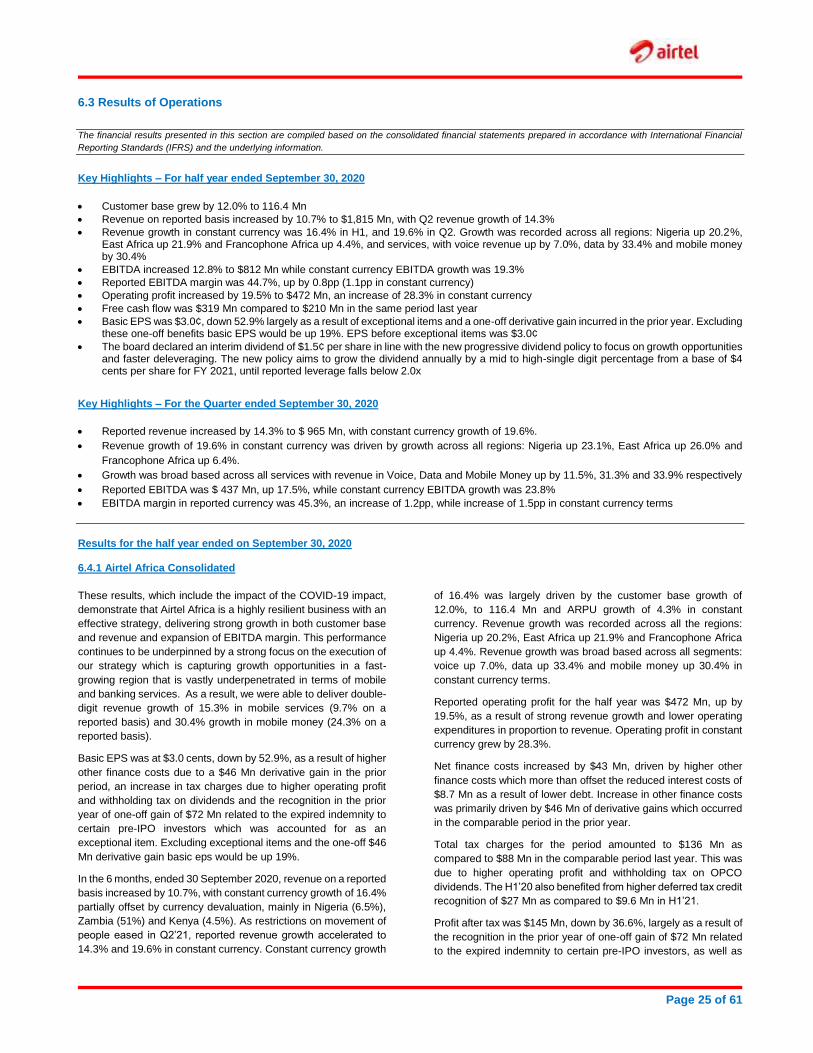
6.3 Results of Operations
The financial results presented in this section are compiled based on the consolidated financial statements prepared in accordance with International Financial
Reporting Standards (IFRS) and the underlying information.
Key Highlights – For half year ended September 30, 2020
Customer base grew by 12.0% to 116.4 Mn
Revenue on reported basis increased by 10.7% to $1,815 Mn, with Q2 revenue growth of 14.3%
Revenue growth in constant currency was 16.4% in H1, and 19.6% in Q2. Growth was recorded across all regions: Nigeria up 20.2%, East Africa up 21.9% and Francophone Africa up 4.4%, and services, with voice revenue up by 7.0%, data by 33.4% and mobile money by 30.4%
EBITDA increased 12.8% to $812 Mn while constant currency EBITDA growth was 19.3%
Reported EBITDA margin was 44.7%, up by 0.8pp (1.1pp in constant currency)
Operating profit increased by 19.5% to $472 Mn, an increase of 28.3% in constant currency
Free cash flow was $319 Mn compared to $210 Mn in the same period last year
Basic EPS was $3.0¢, down 52.9% largely as a result of exceptional items and a one-off derivative gain incurred in the prior year. Excluding these one-off benefits basic EPS would be up 19%. EPS before exceptional items was $3.0¢
The board declared an interim dividend of $1.5¢ per share in line with the new progressive dividend policy to focus on growth opportunities and faster deleveraging. The new policy aims to grow the dividend annually by a mid to high-single digit percentage from a base of $4 cents per share for FY 2021, until reported leverage falls below 2.0x
Key Highlights – For the Quarter ended September 30, 2020
Reported revenue increased by 14.3% to $ 965 Mn, with constant currency growth of 19.6%.
Revenue growth of 19.6% in constant currency was driven by growth across all regions: Nigeria up 23.1%, East Africa up 26.0% and
Francophone Africa up 6.4%.
Growth was broad based across all services with revenue in Voice, Data and Mobile Money up by 11.5%, 31.3% and 33.9% respectively
Reported EBITDA was $ 437 Mn, up 17.5%, while constant currency EBITDA growth was 23.8%
EBITDA margin in reported currency was 45.3%, an increase of 1.2pp, while increase of 1.5pp in constant currency terms
Results for the half year ended on September 30, 2020
6.4.1 Airtel Africa Consolidated
These results, which include the impact of the COVID-19 impact,
demonstrate that Airtel Africa is a highly resilient business with an
effective strategy, delivering strong growth in both customer base
and revenue and expansion of EBITDA margin. This performance
continues to be underpinned by a strong focus on the execution of
our strategy which is capturing growth opportunities in a fast-
growing region that is vastly underpenetrated in terms of mobile
and banking services. As a result, we were able to deliver double-
digit revenue growth of 15.3% in mobile services (9.7% on a
reported basis) and 30.4% growth in mobile money (24.3% on a
reported basis).
Basic EPS was at $3.0 cents, down by 52.9%, as a result of higher
other finance costs due to a $46 Mn derivative gain in the prior
period, an increase in tax charges due to higher operating profit
and withholding tax on dividends and the recognition in the prior
year of one-off gain of $72 Mn related to the expired indemnity to
certain pre-IPO investors which was accounted for as an
exceptional item. Excluding exceptional items and the one-off $46
Mn derivative gain basic eps would be up 19%.
In the 6 months, ended 30 September 2020, revenue on a reported
basis increased by 10.7%, with constant currency growth of 16.4%
partially offset by currency devaluation, mainly in Nigeria (6.5%),
Zambia (51%) and Kenya (4.5%). As restrictions on movement of
people eased in Q2’21, reported revenue growth accelerated to
14.3% and 19.6% in constant currency. Constant currency growth
of 16.4% was largely driven by the customer base growth of
12.0%, to 116.4 Mn and ARPU growth of 4.3% in constant
currency. Revenue growth was recorded across all the regions:
Nigeria up 20.2%, East Africa up 21.9% and Francophone Africa
up 4.4%. Revenue growth was broad based across all segments:
voice up 7.0%, data up 33.4% and mobile money up 30.4% in
constant currency terms.
Reported operating profit for the half year was $472 Mn, up by
19.5%, as a result of strong revenue growth and lower operating
expenditures in proportion to revenue. Operating profit in constant
currency grew by 28.3%.
Net finance costs increased by $43 Mn, driven by higher other
finance costs which more than offset the reduced interest costs of
$8.7 Mn as a result of lower debt. Increase in other finance costs
was primarily driven by $46 Mn of derivative gains which occurred
in the comparable period in the prior year.
Total tax charges for the period amounted to $136 Mn as
compared to $88 Mn in the comparable period last year. This was
due to higher operating profit and withholding tax on OPCO
dividends. The H1’20 also benefited from higher deferred tax credit
recognition of $27 Mn as compared to $9.6 Mn in H1’21.
Profit after tax was $145 Mn, down by 36.6%, largely as a result of
the recognition in the prior year of one-off gain of $72 Mn related
to the expired indemnity to certain pre-IPO investors, as well as

Page 26 of 61
higher finance costs and tax in the current period. Excluding
benefit of exceptional items and one-off derivative gain of $46 Mn
in prior period, profit after tax has increased by 31.8%.
Basic EPS was at $3.0 cents, down by 52.9%, as a result of higher
other finance costs due to a $46 Mn derivative gain in the prior
period, increase in tax charges due to higher operating profit and
withholding tax on dividend, higher non-controlling interest, and
the recognition in the prior year of one-off gain of $72 Mn related
to the expired indemnity to certain pre-IPO investors which was
accounted for as an exceptional item. Excluding exceptional items
and the one-off $46 Mn derivative gain basic eps would be up 19%.
Alternative performance measures
EBITDA amounted to $812 Mn, up by 12.8% in reported currency
and 19.3% in constant currency. The EBITDA growth was driven
by revenue growth of 16.4% and efficiency in operating expenses.
Reported EBITDA margin was 44.7%, an improvement of 0.8pp,
and 1.1pp in constant currency.
Foreign exchange had an adverse impact of $80 Mn on revenue
and $39 Mn on EBITDA, largely driven by the devaluation of the
Nigerian naira and Zambian kwacha.
The effective tax rate was 47% broadly in line with the same period
in the prior year. The effective tax rate at 47% is higher than the
weighted average statutory tax rate of approximately 33%, largely
due to the profit mix between various OPCOs and higher
withholding tax on OPCO dividends. The adjusted effective tax
rate was 44% compared to 37%, largely as a result of recognition
of higher deferred tax credit of $27 Mn in the prior period as against
to $9.6 Mn during the half year ended 30 September 2020.
An exceptional item gain of $3 Mn in September 2020 consisted
of deferred tax credit in Tanzania amounting to $9.6 Mn which was
partially offset by one-off costs of $6.7 Mn in Francophone Africa.
Exceptional items for the half year ended 30 September 2019
mainly consisted of $72 Mn gain related to the expired indemnity
to certain pre-IPO investors.
Free cash flow was $319 Mn, up by 52% largely due to the higher
EBITDA, $5 Mn of reduced interest payments as a result of lower
debt and $31 Mn of lower capex partially offset by an increase of
$49 Mn in cash tax as a result of higher operating profit.
EPS before exceptional items was $3 cents, down by 27.2%, as a
result of higher other finance costs due to the recognition of a $46
Mn derivative gain in the prior period, higher non-controlling
interest, and increase in tax charges due to the higher operating
profit and withholding tax on the dividend. Excluding the one-time
derivative gain of $ 46 Mn, restated eps grew 19%.
6.4.2 Net Debt
Net debt to EBITDA decreased to 2.2x, as the increase in EBITDA
largely offset a slight increase in net debt.
6.4.3 Segment Wise – Africa
6.4.3.1 Nigeria
Constant currency revenue grew by 20.2% while in reported
currency revenue grew by 12.1% as a result of the Nigerian naira
devaluation by 6.5% (YoY). Revenue growth in Q2’21 was 23.1%
as a result of the easing of restrictions on movement of people
which was implemented in the first quarter due the COVID-19
pandemic.
Voice revenue increased 11.4% to $413 Mn, this was driven by
customer base increase of 11.5% which was partially offset by a
0.8% drop in voice ARPU. The customer base growth was driven
by the expansion of our distribution network and the expansion of
network infrastructure. Voice usage per customer increased by
13.5%. On the other hand, the ARPU decline of 0.8% was a result
of a change in the customer mix due to the COVID-19 pandemic
in first quarter.
Data revenue growth of 38.1% in constant currency was supported
by 22.8% growth in data customers and 17.4% growth in data
ARPU. Data customer penetration was up by 4pp from the
previous period and reached 43.1% as of September 2020. The
data customer base growth of 22.8% was a result of the expansion
of 4G network, with 76% of total sites now on 4G. The total data
usage on our network grew by 89.5%, almost double the previous
period. 4G data usage almost tripled and now contributes to 60%
of the total data usage. Data usage per customer was up by 61%
and the data revenue accounted for 35.7% of total revenue, up by
4.6pp from 31.1% in previous period.
EBITDA grew by 13.4% in reported currency, with constant
currency growth of 21.5%. EBITDA margin improved by 0.6pp in
constant currency as a result of opex efficiencies. In Q2’21,
EBITDA grew by 25.7%, with margin improvement of 1.1pp, mainly
as a result of the bad debt collection of Q1’21 from enterprise
customers.
Capital expenditure amounted to $97 Mn as against $115 Mn in
previous period. Capex expenditure was lower during the period
because of lockdown measures in April and May 2020.
Operating free cash flow was $289 Mn, up by 42.6%, largely as a
result of double-digit EBITDA growth and slightly lower capital
expenditure in first half of the year.
6.4.3.2 East Africa
In East Africa, performance continued to be strong with 14.1%
revenue growth in reported currency and 21.9% in constant
currency. Revenue growth in Q2’21 accelerated to 17.7% and
constant currency growth of 26% was supported by growth in all
key business segments. Growth was broad-based across all
services and all markets, as 5 out of 6 OPCOs delivered more than
20% revenue growth. Constant currency revenue growth was
partially offset by the currency devaluation mainly in Zambia and
Kenya.
Voice revenue was $312 Mn, with double-digit growth of 12.8% in
constant currency as a result of a 13.9% customer base growth
and 20.1% growth of voice usage per customer, which was
marginally offset by a 0.4% voice ARPU drop. Total minutes on

Page 27 of 61
the network were up by 36% led by an increase in voice usage per
customer.
Data revenue amounted to $174 Mn, up by 29.6% supported by
data customer base growth of 22.9% and data ARPU increase of
5.1%. Growth was recorded across all OPCOs, driven by the
expansion of network infrastructure, with 68.6% of the sites now
on our 4G network as compared to 60% during the previous
period. Our mobile network in Zambia, Malawi and Uganda now
consists of 100% of 4G sites. The total data usage on our network
grew by 83.8% and 4G data usage almost tripled and now
contributes 44.6% to the total data usage. Data usage per
customer reached 2.6GB, up by 49.1% from 1.7GB per customer
in previous period.
During the period “Pay as you Go tariffs” in certain markets were
updated and this resulted in a revenue reallocation of bundle
products of voice and data in such tariffs. On a like for like basis
voice and data revenue growth was 8.7% and 38% respectively.
Mobile money revenue grew by 42.9% in constant currency,
largely driven by growth in Zambia, Tanzania, Uganda and Malawi.
Revenue growth of 50.1% in Q2’21 was largely driven by the
removal of certain restrictions on movement as a result of the
COVID-19 pandemic and the reinstatement of P2P fees in the
majority of markets which were temporarily waived in the first
quarter. The revenue growth of 42.9% was driven by a 29.5%
increase in our customer base and a 23.9% growth in the
transaction value per customer, supported by the expansion of our
distribution network.
EBITDA margin was 44.3%, an improvement of 4.0pp in reported
currency and 4.3pp in constant currency, as a result of accelerated
growth in revenue and efficiency improvement in operating
expenses.
Capital expenditure during the period was $81 Mn as against $60
Mn in the previous period. Capex expenditure was higher during
the period as a result of planned network expansion.
Operating free cash flow was at $211 Mn, up by 34.9% as a result
of improvement in EBITDA.
6.4.3.3 Francophone Africa
Performance in Francophone Africa continued to improve, as
reported revenue was up 4.6% and constant currency growth was
4.4%. In Q2’21, reported currency growth of 8.6% benefitted from
a 6.6% appreciation of the Central African and West Africa franc
and 6.4% constant currency growth. Revenue growth of data,
mobile money and other revenue was partially offset by a decline
in voice revenue. Performance across the region was mixed, with
growth in Democratic Republic of the Congo (DRC), Gabon and
Chad partially offset by revenue decline in other countries in the
region.
Voice revenue decreased by 5.3%, largely due to a drop in
interconnect charges in Gabon and Chad, and overall market
weakness in some countries in the region caused by
macroeconomic conditions. Total minutes on network grew by
14.7% while voice usage per customer was up by 7.8%.
Data revenue increased by 29.2% in constant currency, supported
by strong customer growth of 31.9% and data ARPU growth of
1.4%. Additionally, smartphone penetration increased by 4.7pp
and reached 29.4%. Total data usage more than doubled and data
usage per customer was up 73.5%. Our expansion of 4G network
and “More for More” bundle offerings resulted in a data customer
base increase. The 4G data usage more than doubled and now
contributes to 50.6% of total data usage on network.
Mobile money revenue was $49 Mn, with constant currency growth
of 12.5% largely driven by a 31.9% increase in customer base
supported by the expansion of our distribution network through
more agents, kiosks and Airtel Money branches.
EBITDA margin of 32.8%, was broadly flat. In Q2’21, the decline
in EBITDA margin was largely due to a $6 Mn settlement of indirect
tax related to prior years.
Capital expenditure during the period was $36 Mn, lower due to
increased network modernisation in the previous period.
Operating free cash flow was at $110 Mn, up 54.5% as a result of
an improvement in EBITDA and lower capital expenditure.
6.4.4 Product wise Africa
6.4.4.1 Mobile services:
Revenue increased by 9.7% on a reported basis and 15.3%
growth in constant currency, with both voice and data revenue
contributing to mobile services revenue growth.
Voice revenue in constant currency growth was 7%, driven by
customer base growth of 12%, as a result of the expansion of the
distribution network and network infrastructure, partially offset by
a 4.1% drop in voice ARPU. Total minutes on the network were up
31.1% as a result of the increase in voice usage per customer by
17.5%. ARPU declined by 4.1% in constant currency terms, largely
driven by a drop in interconnect charges across key markets in
East Africa and Francophone Africa.
Data revenue increased 33.4% in constant currency, as a result of
growth in our data customer base by 24.1%, an increase in data
ARPU and the accelerated 4G network rollout. Data customer
base was 34.0% of our total customer base, from 30.7% compared
to the previous period. Total data usage was up 90.1% driven by
both a customer base increase of 24.1% and a 56.9% growth in
data usage per customer. Total data usage per customer per
month was 2.5GB, largely resulting from our 4G network
expansion and popular data bundles offerings. Growing
penetration on our 3G and 4G network resulted in data ARPU
growth of 10.1%. 4G data usage almost tripled and now
contributes 52.8% to the total data usage on the network.
Data revenue now contributes 30.2% to the total revenue, up from
26.4% in the previous period.
6.4.4.2 Mobile Money
Reported mobile money revenue was $181 Mn, up 24.3%, with a
constant currency growth of 30.4%. Revenue growth of 33.9% in
Q2’21 benefitted from the easing of lockdown restrictions which
impacted the first quarter. Additionally, P2P fees, which were
temporarily waived in the first quarter to support economies and
communities, were mostly reinstated during Q2’21 in majority of
markets.
The revenue growth of 30.4% was driven by a customer base
growth of 29.6% and a 45.7% growth in transaction value. Our

Page 28 of 61
distribution network continued to expand through the addition of
exclusive kiosks, Airtel Money branches and the mobile money
agent network.
EBITDA amounted to $88 Mn, up by 25.5% in reported currency
and 30.9% in constant currency. EBITDA margin was 48.6%, an
increase of 0.5pp in reported currency and 0.2pp in constant
currency. Total transaction value increased by 45.7% in constant
currency, as a result of our customer base growth of 29.6% and a
14.5% growth in transaction value per customer per month. The
Q2’21 annualised transaction value reached $47 bn and mobile
money revenue accounted for 10.3% of total revenue.
The mobile money customer base grew to 20.1 Mn, up 29.6% over
the previous period, with Airtel Money customers representing
17.3% of our total customers. Mobile money ARPU was up 2.4%,
driven by the increase in transaction values and a higher
contribution from merchant payments, cash out and recharge of
mobile services through Airtel Money.
Results for the Quarter ended September 30, 2020
6.5.1 Airtel Africa Consolidate
As on 30 Sep 2020, the group had an aggregate customer base of
116 Mn as compared to 104 Mn in the corresponding quarter last
year, an increase of 12.0%. Total minutes on network during the
quarter registered a growth of 32.2% to 80.4 bn as compared to
60.8 bn in the corresponding quarter last year.
Data customers increased by 7.7 Mn to 39.6 Mn as compared to
31.9 Mn in the corresponding quarter last year. Increase in data
subscribers was mainly led by increase in smartphone penetration,
up 2.7pp to 33.2%, and expansion of 4G network (70% of the total
sites are now on 4G). Total MBs on the network grew by 81.0% to
293.9 bn MBs as compared to 162.4 bn MBs in the corresponding
quarter last year. Data usage per customer during the quarter was
at 2,576 MBs as compared to 1,748 MBs in the corresponding
quarter last year, an increase of 47.3%.
Mobile Money revenue in constant currency grew by 33.9% driven
by customer growth of 29.6% and transaction value growth of
56.4%. The Group continued to expand the distribution network
through kiosks, mini shops and dedicated Airtel Money branches.
It also introduced additional mobile money services, including
merchant and commercial payments, benefits transfers, loans and
savings, building international money transfer services through
partnerships. Mobile money business now serves over 20 Mn
mobile money customers, representing 17.3% of our total
customers and almost 27.8% excluding Nigeria.
Reported revenue grew by 14.3%, whereas constant currency
revenue grew by 19.6%, which was partially offset by currency
devaluation. Constant currency revenue growth was largely driven
by 12.0% increase in the customer base, to 116.4 Mn, and a
increase in ARPU by 6.8% to $ 2.8. Revenue growth was recorded
across all the regions: Nigeria up 23.1%, East Africa up 26.0% and
Francophone Africa up 6.4% and services with voice revenue up
11.5%, data revenue up 31.3% and mobile money revenue up
33.9% in constant currency terms.
For the quarter, EBITDA in reported currency was $ 437 Mn, up
17.5% and 23.8% in constant currency terms. EBITDA growth
largely driven by revenue growth of 19.6% in constant currency
and efficiencies in operating expense. EBITDA margin was at
45.3%, an improvement of 1.5pp in constant currency.
On reported basis, Profit after Tax before exceptional item was
$ 92 Mn, an increase of 8% compared to the prior year.
Capital expenditure during the quarter was $ 149 Mn.
Operating free cash flow during the quarter was at $ 287 Mn.
6.5.2 Segment Wise – Africa
6.5.2.1 Nigeria
Reported revenue in Nigeria grew by 15.2% whereas constant
currency growth was 23.1%, which was partially offset by currency
devaluation. The revenue growth was largely driven by voice
revenue growth of 15.8% and sustained growth in data with
revenue up 36.7% in constant currency.
Voice revenue growth of 15.8% was supported by 11.5% growth
in customer base which was driven by expansion of our distribution
network as well as network infrastructure.
Data revenue growth of 36.7% in constant currency was supported
by 22.8% growth in data customers and 14.4% growth in data
ARPU. Data customer penetration was up by 4pp from the
previous period and reached 43.1% as of September 2020. The
data customer base growth of 22.8% was a result of the expansion
of 4G network, with 76% of total sites now on 4G. The total data
usage on our network grew by 83.8%. 4G data usage now
contributes to 60% of the total data usage. Data usage per
customer was up by 53.8%.
EBITDA margin in constant currency at 54.2%, increased by 1.1pp
as a result of revenue growth and efficiencies in operating
expenses.
During the period, capital expenditure was $ 67 Mn.
Operating Free Cash Flow was $ 138 Mn, up 37%, largely as a
result of double-digit EBITDA growth.
6.5.2.2 East Africa
Reported revenue in East Africa grew by 17.7%, whereas constant
currency growth was 26.0%, which was partially offset by currency
devaluation. Revenue growth of 26.0% in constant currency was
driven by growth across all services with voice revenue up by
17.2%, data revenue up by 28.7% and mobile money revenue up
by 50.1%.
Voice revenue was up by 17.2%, largely driven by customer
growth of 13.9% and voice usage per customer up by 17.9%.
Data revenue increased 28.7%, driven by the increase in data
customer base, up 22.9% and increase in data usage per
customer, up 38.2%. Growth was recorded across all OPCOs,
driven by the expansion of network infrastructure, with 68.6% of
the sites now on our 4G network as compared to 60% during the
previous period. Our mobile network in Zambia, Malawi and
Uganda now consists of 100% of 4G sites.
Mobile Money revenue increased by 50.1% supported by increase
in customer base by 29.5% and transaction value per customer up
by 26.9%. Revenue growth of 50.1% in Q2’21 was largely driven
by the removal of certain restrictions on movement as a result of

Page 29 of 61
the COVID-19 pandemic and the reinstatement of P2P charges in
majority of markets which were temporarily waived off during the
first quarter. We continued to expand our Mobile Money
distribution network (Agents, Kiosks and Airtel Money Branches).
EBITDA margin in constant currency at 45.8%, improved by 5.6pp
as a result of revenue growth and cost efficiencies.
Capital expenditure during the period was $ 62 Mn.
Operating free cash flow was at $ 102 Mn, up by 21.4% as a result
of improvement in EBITDA.
6.5.2.3 Francophone Africa
Reported revenue grew by 8.6%, whereas constant currency
growth was 6.4%. Revenue growth was largely driven by data,
mobile money and other revenue partially offset by a decline in
voice revenue.
Voice revenue decreased by 0.9% largely due to a reduction in
interconnect charges in few markets as well as decrease in
international and roaming revenue. Total minutes on network grew
by 19.9% while voice usage per customer was up by 12.2%.
Data revenue grew by 23.6% in constant currency, supported by
data customer base growth of 31.9%. Additionally, smartphone
penetration increased by 4.7 pp to reach 29.4%. Total data usage
more than doubled and data usage per customer was up 57.2%.
Mobile money revenue grew by 8.9% largely driven by 31.9%
growth in mobile money customer base supported by the
expansion of our distribution network through increase in agents,
kiosks and Airtel Money branches.
EBITDA margin in constant currency at 30.9%, decreased by
4.0pp. The decline in EBITDA margin was largely due to a $6m
settlement of indirect tax related to prior years.
Capital expenditure during the period was $20 Mn,
6.5.3 Product wise Africa
6.5.3.1 Mobile services
Reported mobile services revenue was up by 12.8%, with 17.9%
growth in constant currency, with both voice and data revenue
contributing to mobile services revenue growth.
Voice revenue in constant currency grew by 11.5%, driven by
customer base growth of 12%, as a result of the expansion of the
distribution network and network infrastructure, partially offset by
0.4% drop in voice ARPU in constant currency. Total minutes on
the grew by 32.2% as a result of the increase in voice usage per
customer by 18.1%.
Data revenue grew by 31.3% in constant currency, supported by
data customer base growth of 24.1%, increase in data ARPU and
the accelerated 4G network rollout. Data customer base was
34.0% of our total customer base, from 30.7% compared to the
previous period. Total data usage was up by 81.0% driven by both
customer base increase of 24.1% and 47.3% growth in data usage
per customer.
6.5.3.2 Mobile Money
Reported mobile money revenue was $100 Mn, up 27.9%, with a
constant currency growth of 33.9%.
The revenue growth of 33.9% was driven by a customer base
growth of 29.6% and a 56.4% growth in transaction value. Our
distribution network continued to expand through the addition of
exclusive kiosks, Airtel Money branches and the mobile money
agent network.
The mobile money customer base grew to 20.1 Mn, up 29.6% over
the previous period, with Airtel Money customers representing
17.3% of our total customers. Mobile money ARPU was up 3.0%,
driven by the increase in transaction values and a higher
contribution from merchant payments, cash out and recharge of
mobile services through Airtel Money.
EBITDA amounted to $49 Mn, an increase of 29.3% in reported
currency and 34.6% in constant currency. EBITDA margin was at
48.6%, an increase of 0.2 pp in constant currency.

Page 30 of 61
SECTION 7
DETAILED FINANCIAL AND RELATED INFORMATION
7.1 Summarized extracts from interim unaudited condensed consolidated financial statements prepared under IAS 34
for the second quarter and half year ended 30 September 2020 and audited consolidated financial statements for
the year ended 31 March 2020 prepared in accordance with IFRS.
7.1.1 Consolidated Statement of Comprehensive Income
Amount in US$ Mn, except ratios
Quarter Ended Half Year Ended
Sep-20 Sep-19Y-on-Y
ChangeSep-20 Sep-19
Y-on-Y
Change
Income
Revenue 965 844 14.3% 1,815 1,640 11%
Other income 5 7 (24%) 8 11 (21%)
970 851 14% 1,823 1,651 10%
Expenses
Netw ork operating expenses 174 156 11% 330 297 11%
Access Charges 93 94 (2%) 177 184 (4%)
License fee / spectrum usage charges 47 48 (1%) 95 94 2%
Employee benefits expense 77 61 26% 142 111 28%
Sales and marketing expenses 47 46 2% 86 83 4%
Impairment loss/(reversal) on f inancial assets (2) (3) 21% 3 2 90%
Other expenses 105 76 38% 190 166 15%
Depreciation and amortisation 167 162 3% 328 319 3%
708 641 10% 1,351 1,256 8%
Operating profit 262 210 25% 472 395 20%
Finance costs 94 90 5% 196 197 (1%)
Finance income (2) (32) 94% (4) (49) 91%
Non-operating income - 2 (100%) - (70) 100%
Share of profit of associate (0) (0) (129%) (1) (0) (40%)
Profit before tax 170 150 13% 281 316 (11%)
Tax expense 82 54 53% 136 88 56%
Profit for the period 88 96 (9%) 145 228 (37%)
Profit before tax (as presented above) 170 150 13% 281 316 (11%)
Add: Exceptional items (net) 7 3 92% 7 (46) 114%
Underlying profit before tax 177 153 15% 288 270 7%
Profit after tax (as presented above) 88 96 (9%) 145 228 (37%)
Add: Exceptional items (net) 4 (11) 136% (3) (74) 96%
Underlying profit after tax 92 85 7% 142 154 (8%)
Particulars
Exceptional items are included within their respective heads

Page 31 of 61
7.1.2 Consolidated Statement of Comprehensive Income
Amount in US$ Mn, except ratios
Quarter Ended Half Year Ended
Sep-20 Sep-19Y-on-Y
ChangeSep-20 Sep-19
Y-on-Y
Change
Other comprehensive income ('OCI')
Items to be reclassified subsequently to profit or loss:
Net gain/(loss) due to foreign currency translation differences 39 7 428% 29 (24) 221%
Net( loss)/gain on net investments hedge (8) 7 (209%) (11) 7 (257%)
Net loss on cash flow hedge - (1) 100% - (3) 100%
31 13 145% 18 (20) 190%
Items not to be reclassified subsequently to profit or loss:
Re-measurement loss on defined benefit plans (1) (0) (39%) (1) (1) 28%
Tax credit on above 0 - 0 0 (90%)
(1) (0) (39%) (1) (1) 28%
Other comprehensive income/(loss) for the period 30 13 141% 17 (21) 183%
Total comprehensive income for the period 118 109 9% 162 207 (22%)
Profit for the period attributable to: 88 96 (9%) 145 228 (37%)
Ow ners of the Company 70 90 (21%) 112 215 (48%)
Non-controlling interests 18 6 207% 33 13 162%
Other comprehensive income/(loss) for the period attributable to: 30 13 143% 17 (21) 181%
Ow ners of the Company 32 13 154% 19 (21) 191%
Non-controlling interests (2) (0) (352%) (2) (0) (286%)
Total comprehensive income for the period attributable to: 118 109 8% 162 207 (22%)
Ow ners of the Company 102 103 (1%) 131 194 (33%)
Non-controlling interests 16 6 152% 31 13 151%
Earnings per share
Basic 1.9c 2.4c 3.0c 6.3c
Diluted 1.9c 2.4c 3.0c 6.3c
Particulars

Page 32 of 61
7.1.3 Consolidated Summarized Financial Position
Amount in US$ Mn
As at As at
Sep 30, 2020 Mar 31, 2020
Assets
Non-current assets
Property, plant and equipment 1,941 1,832
Capital w ork-in-progress 183 259
Right of use assets 730 639
Goodw ill 3,960 3,943
Other intangible assets 482 456
Intangible assets under development 31 30
Investment in associate 3 3
Financial Assets
- Investments 0 0
- Derivative instruments 0 0
- Security deposits 8 7
- Others 0 1
Income tax assets (net) 28 39
Deferred tax assets (net) 314 333
Other non-current assets 102 112
7,782 7,654
Current assets
Inventories 6 3
Financial Assets
- Derivative instruments 6 10
- Trade receivables 138 132
- Cash and cash equivalents 1,072 1,010
- Other Bank balance 7 6
- Balance held under mobile money trust 376 295
- Others 62 66
Other current assets 163 149
1,830 1,671
Total Assets 9,612 9,325
Current liabilities
Financial Liabilities
- Borrow ings 359 235
- Current maturities of long-term borrow ings 1,103 429
- Lease liabilities 222 199
- Derivative instruments 4 3
- Trade payables 431 416
- Mobile money w allet balance 372 292
- Others 298 461
Provisions 72 70
Deferred revenue 134 124
Current tax liabilities (net) 110 144
Other current liabilities 138 115
3,243 2,488
Net current liability (1,413) (817)
Non-current liabilities
Financial Liabilities
- Borrow ings 1,859 2,446
- Lease liabilities 1,008 970
- Derivative instruments 4 4
- Others 63 15
Provisions 25 23
Deferred tax liabilities (net) 66 69
Other non-current liabilities 26 29
3,051 3,556
Total liabilities 6,294 6,044
Net Assets 3,318 3,281
Equity
Share capital 3,420 3,420
Retained earnings 2,803 2,805
Other reserve (2,816) (2,837)
Equity attributable to owners of the company 3,407 3,388
Non-controlling interests ('NCI') (89) (107)
Total equity 3,318 3,281
Particulars

Page 33 of 61
7.1.4 Consolidated Summarized Statement of Cash Flows
Half Year Ended
Sep-20 Sep-19
Cash flows from operating activities
Profit before tax 281 316
Adjustments for -
Depreciation and amortisation 328 319
Finance income (4) (49)
Finance cost 196 197
Share of profit of associate (1) (0)
Non-operating adjustments - (70)
Other adjustments 5 (7)
Operating cash flow before changes in working capital 805 707
Changes in working capital
Increase in trade receivables (0) (12)
(Increase)/decrease in inventories (3) 0
Decrease in trade payables (7) (20)
Increase in mobile money w allet balance 80 27
(Increase)/decrease in provisions (0) 1
Increase in deferred revenue 9 8
Decrease in income received in advance (1) (8)
Decrease in other f inancial and non f inancial liabilities (0) (9)
Increase in other f inancial and non f inancial assets (21) (2)
Net cash generated from operations before tax 862 692
Income taxes paid (118) (69)
Net cash generated from operating activities (a) 744 623
Cash flows from investing activities
Purchase of property, plant and equipment and capital w ork-in-progress (359) (349)
Purchase of intangible assets (8) (35)
Interest received 10 14
Net cash used in investing activities (b) (357) (370)
Cash flows from financing activities
Proceeds from issue of shares to Airtel Africa plc shareholders - 680
Proceeds from sale of shares to non-controlling interests - 3
Acquisition of non-controlling interests (0) -
Purchase of ow n shares by ESOP trust (0) -
Payment of share issue expenses - (16)
Proceeds from borrow ings 253 144
Repayment of borrow ings (121) (319)
Repayment of lease liabilities (109) (89)
Dividend paid to non-controlling interests (6) -
Dividend paid to Company's shareholders (113) -
Interest and other f inance charges paid (167) (176)
Share stabilisation proceeds - 7
Proceeds from cancellation of derivatives - 122
Net cash (used) in/generated from financing activities (c) (263) 356
Increase in cash and cash equivalents during the period (a+b+c) 124 609
Currency translation differences relating to cash and cash equivalents (3) 3
Cash and cash equivalents as at beginning of the period 1,087 870
Cash and cash equivalents as at end of the period (1) 1,208 1,482
Particulars
(1) Includes balance held under mobile money trust of USD 376 Mn (September 2019: USD 265 Mn) on behalf of mobile money customers which are not available for use by the group.

Page 34 of 61
7.2 Use of Alternative performance measures (APM) Financial Information In presenting and discussing the Group’s reported financial position, operating results and cash flows, certain information is derived from
amounts calculated in accordance with IFRS, but this information is not in itself an expressly permitted GAAP measure. Such Alternative
performance measures (APM) should not be viewed in isolation as alternatives to the equivalent GAAP measures, if any.
A summary of Alternative performance measures (APM) included in this report, together with details where additional information and
reconciliation to the nearest equivalent GAAP measure can be found, is shown below.
Alternative performance measures (APM) Equivalent GAAP measure for IFRSLocation in this results announcement
of reconciliation and further information
Earnings before Interest, Taxation, Depreciation and
Amortization (EBITDA)
Operating profit Page 34
Underlying Operating Expenses Expenses Page 35
Finance Cost (net) Finance Cost and Finance Income Page 35
Profit / (loss) before tax (before exceptional item) Profit / (Loss) Before Tax Page 35
Profit / (loss) after tax (before exceptional item) Profit / (loss) after tax Page 35
Cash Profit from Operations before Derivative &
Exchange (Gain)/Loss
Profit from operating activities Page 36
Effective tax rate and adjusted Effective tax rate Reported Tax Rate Page 36
Capital Expenditure (Capex) Refer glossary NA
Operating free cash flow Refer glossary NA
Capital Employed Refer glossary NA
7.2.1 Reconciliation between GAAP and Alternative performance measures (APM)
7.2.1.1: EBITDA and Margin
Sep-20 Sep-19
Operating profit US$ Mn 472 395
Add:
Depreciation and amortization US$ Mn 328 319
Charity and donation US$ Mn 5 3
Exceptional items US$ Mn 7 2
EBITDA US$ Mn 812 719
Revenue US$ Mn 1,815 1,640
EBITDAMargin (%) US$ Mn 44.7% 43.9%
Particulars UoMHalf year ended

Page 35 of 61
7.2.1.2: Underlying Operating Expenditure
Sep-20 Sep-19
Expenses US$ Mn 1,351 1,256
Less:
Access charges US$ Mn (177) (184)
Depreciation and amortization US$ Mn (328) (319)
Charity and donation US$ Mn (5) (3)
Exceptional items US$ Mn (7) (2)
Underlying Operating Expenditure US$ Mn 834 748
Particulars UoMHalf year ended
7.2.1.3: Finance Cost (net)
Half Year Ended
Sep-20 Sep-19
Finance cost US$ Mn 196 197
Finance income US$ Mn (4) (49)
Exceptional items US$ Mn 0 0
Finance cost (net) US$ Mn 191 148
Particulars UOM
7.2.1.4: Profit / (Loss) Before Tax
Sep-20 Sep-19
Profit / (loss) for the year Before Tax US$ Mn 281 316
Exceptional items US$ Mn 7 (46)
Profit / (loss) before tax (before exceptional item) US$ Mn 288 270
Particulars UoMHalf year ended
7.2.1.5: Profit / (Loss) After Tax
Sep-20 Sep-19
Profit / (loss) after tax US$ Mn 145 228
Exceptional items US$ Mn (3) (74)
Profit / (loss) after tax (before exceptional item) US$ Mn 142 154
Particulars UoMHalf year ended
7.2.1.6: Operating Free Cash Flow
Sep-20 Sep-19
Net Cash Generated from Operating Activities US$ Mn 744 623
Add: Income tax paid US$ Mn 118 69
Cash Generation from Operation before tax US$ Mn 862 692
Less: Changes in working capital US$ Mn 56 (15)
Operating cash flow before changes in working capital US$ Mn 805 707
Other adjustments US$ Mn (5) 7
Charity and donation US$ Mn 5 3
Exceptional items US$ Mn 7 2
EBITDA US$ Mn 812 719
Less: Capital Expenditure US$ Mn (216) (246)
Operating Free Cash Flow US$ Mn 596 473
Particulars UoMHalf year ended

Page 36 of 61
7.2.1.7: Cash Profit from Operations before Derivative and Exchange Fluctuation
Half Year Ended
Sep-20 Sep-19
Operating profit US$ Mn 472 395
Finance cost (net) US$ Mn (191) (148)
Depreciation and Amortisation US$ Mn 328 319
Derivatives and exchange (gain)/loss US$ Mn 35 (9)
Exceptional items US$ Mn 7 3
Cash Profit from Operations before Derivative and
Exchange FluctuationUS$ Mn 651 559
Particulars UOM
7.2.1.8: Effective tax rate and adjusted Effective tax rate
Profit before
taxation
Income tax
expenseTax Rate %
Profit before
taxation
Income tax
expenseTax Rate %
Reported Effective tax rate US$ Mn 281 136 48.5% 316 88 27.7%
Adjusted for :
Exceptional Items (provided below ) US$ Mn 7 10 (46) 28
Foreign exchange rate movements for non-DTA
operating companies & holding companiesUS$ Mn 36 (28)
One-off tax adjustment US$ Mn 6 1
Effective tax rate US$ Mn 324 152 46.9% 242 117 48.2%
Deferred tax trigerred during the year US$ Mn (10) (27)
Adjusted effective tax rate US$ Mn 324 142 43.9% 242 90 37.0%
Exceptional items
1. Deferred tax asset recognition US$ Mn (10) (27)
2. Netw ork modernisation US$ Mn 19 (1)
3. Employee restructuring US$ Mn 7
4. Reversal of indemnities US$ Mn (72)
5. Share issue and IPO related expenses US$ Mn 6
6. Finance Cost US$ Mn 1
Total US$ Mn 7 (10) (46) (28)
Particulars UoM
Half year ended
Sep-20 Sep-19

Page 37 of 61
SECTION 8
NET DEBT AND COST SCHEDULES
8.1 Consolidated Schedule of Net Debt
Amount in US$ Mn
As at As at
Sep 30, 2020 Mar 31, 2020
Long term borrow ing, net of current portion 1,839 2,424
Short-term borrow ings and current portion of long-term borrow ing 1,462 664
Less:
Cash and Cash Equivalents 1,072 1,010
Net Debt excluding Lease Obligations 2,229 2,078
Lease Obligations 1,230 1,169
Net Debt including Lease Obligations 3,459 3,247
Particulars
8.2 Consolidated Schedule of Net Finance Cost (in Reported Currency)
Amount in US$ Mn
Quarter Ended Half Year Ended
Sep-20 Sep-19 Sep-20 Sep-19
Interest on borrow ings and Finance charges 48 55 94 108
Interest on Lease Obligation 33 32 67 64
Investment (income)/ loss (2) (9) (5) (15)
Finance cost excluding Derivatives and Forex 79 78 156 157
Add : Derivatives and exchange (gain)/ loss 14 (12) 35 (9)
Finance cost (net of Derivatives and Forex) 92 66 191 148
Particulars
8.3 Consolidated Schedule of Operating Expenses (in Constant Currency)
Amount in US$ Mn
Quarter Ended Half Year Ended
Sep-20 Sep-19 Sep-20 Sep-19
Access charges 93 90 178 175
Cost of goods sold 48 32 85 61
License fee / spectrum charges (revenue share) 47 46 95 91
Netw ork operations costs 174 145 332 274
Employee benefits expense 72 64 138 115
Selling, general and adminstration expense 99 82 190 178
Operating Expenses 533 460 1,019 895
Particulars
Closing currency rates as on March 31, 2020 considered for Constant currency.

Page 38 of 61
8.4 Consolidated Schedule of Depreciation and Amortization before exceptional item (in Constant Currency)
Amount in US$ Mn
Quarter Ended Half Year Ended
Sep-20 Sep-19 Sep-20 Sep-19
Depreciation 137 126 276 248
Amortization 29 20 52 40
Depreciation and Amortization 166 146 328 288
Particulars
Closing currency rates as on March 31, 2020 considered for Constant currency.
8.5 Consolidated Schedule of Operating Expenses (in Reported Currency)
Amount in US$ Mn
Quarter Ended Half Year Ended
Sep-20 Sep-19 Sep-20 Sep-19
Access charges 93 94 177 184
Cost of goods sold 48 34 85 65
License fee / spectrum charges (revenue share) 47 48 95 94
Netw ork operations costs 174 152 331 287
Employee benefits expense 72 65 138 119
Selling, general and adminstration expense 99 86 190 185
Operating Expenses 534 480 1,017 934
Particulars
8.6 Consolidated Schedule of Depreciation and Amortization before exceptional item (in Reported Currency)
Amount in US$ Mn
Quarter Ended Half Year Ended
Sep-20 Sep-19 Sep-20 Sep-19
Depreciation 138 131 276 259
Amortization 29 21 52 42
Depreciation and Amortization 167 152 328 300
Particulars
8.7 Consolidated Schedule of Income Tax before exceptional item (in Reported Currency)
Amount in US$ Mn
Quarter Ended Half Year Ended
Sep-20 Sep-19 Sep-20 Sep-19
Current tax expense 55 39 102 71
Deferred tax expense / (income) 30 28 44 44
Income tax expense 85 68 146 116
Particulars

Page 39 of 61
SECTION 9
TRENDS AND RATIO ANALYSIS
9.1 Based on Statement of Operations
9.1.1 Consolidated Statement of Operations: (in Reported Currency)
Amount in US$ Mn, except ratios
Quarter Ended
Sep-20 Jun-20 Mar-20 Dec-19 Sep-19
Revenue 965 851 899 883 844
Access charges 93 84 94 98 94
Cost of goods sold 48 37 39 38 34
Net revenues 824 729 766 747 715
Operating Expenses (Excl Access Charges, cost of
goods sold and License Fee)345 310 321 308 302
Licence Fee 47 48 51 44 48
EBITDA 437 375 397 399 372
Cash Profit from operations before Derivative and
Exchange Fluctuations357 295 325 326 293
EBIT 269 210 244 245 219
Share of results of associate (0) (0) (0) 0 (0)
Profit before Tax 177 111 97 167 153
Profit after Tax (before exceptional items) 92 50 70 73 85
Non Controlling Interest (before exceptional items) 17 12 12 10 6
Net Income (before exceptional items) 75 38 57 62 79
Exceptional items (net) 4 (7) (7) (30) (11)
Profit after Tax (after exceptional items) 88 57 77 103 96
Non Controlling Interest 18 15 12 13 6
Net Income 70 42 65 90 90
Capex 149 66 246 150 147
Operating Free Cash Flow (EBITDA - Capex) 287 309 151 249 225
Total Capital Employed 6,777 6,636 6,528 6,595 6,576
Sep-20 Jun-20 Mar-20 Dec-19 Sep-19
As a % of Revenue
Access charges 9.6% 9.9% 10.5% 11.1% 11.2%
Cost of goods sold 5.0% 4.4% 4.3% 4.3% 4.1%
Net revenues 85.4% 85.7% 85.2% 84.6% 84.7%
Operating Expenses (excluding access charges,
cost of goods sold and license fee)35.7% 36.5% 35.7% 34.9% 35.8%
Licence Fee 4.9% 5.6% 5.7% 5.0% 5.7%
EBITDA 45.3% 44.1% 44.1% 45.2% 44.1%
Cash Profit from operations before Derivative and
Exchange Flucations37.0% 34.6% 36.1% 36.9% 34.7%
EBIT 27.8% 24.7% 27.2% 27.7% 25.9%
Share of results of associate (0.0%) (0.0%) (0.0%) 0.0% (0.0%)
Profit before Tax 18.3% 13.1% 10.8% 18.9% 18.1%
Profit after Tax (before exceptional items) 9.5% 5.9% 7.8% 8.2% 10.0%
Non Controlling Interest (before exceptional items) 1.7% 1.4% 1.4% 1.2% 0.7%
Net Income (before exceptional items) 7.7% 4.5% 6.4% 7.0% 9.3%
Exceptional items (net) 0.4% (0.8%) (0.8%) (3.4%) (1.3%)
Profit after Tax (after exceptional items) 9.1% 6.7% 8.6% 11.6% 11.3%
Non Controlling Interest 1.8% 1.8% 1.4% 1.5% 0.7%
Net Income 7.3% 4.9% 7.2% 10.1% 10.6%
Particulars

Page 40 of 61
9.1.2 Consolidated Statement of Operations: (in Constant Currency)
Amount in US$ Mn, except ratios
Quarter Ended
Sep-20 Jun-20 Mar-20 Dec-19 Sep-19
Revenue 963 856 870 845 805
Access charges 93 85 91 93 90
Cost of goods sold 48 37 37 36 32
Net revenues 822 733 742 716 683
Operating Expenses (Excl Access Charges, cost of
goods sold and License Fee)343 312 313 297 290
Licence Fee 47 48 50 43 46
EBITDA 436 377 382 380 353
EBIT 269 211 233 231 205
Capex 149 66 246 150 147
Operating Free Cash Flow (EBITDA - Capex) 287 310 136 230 206
Sep-20 Jun-20 Mar-20 Dec-19 Sep-19
As a % of Revenue
Access charges 9.7% 9.9% 10.4% 11.1% 11.2%
Cost of goods sold 5.0% 4.4% 4.3% 4.3% 4.0%
Net revenues 85.4% 85.7% 85.3% 84.7% 84.8%
Operating Expenses (excluding access charges,
cost of goods sold and license fee)35.7% 36.5% 36.0% 35.2% 36.1%
Licence Fee 4.9% 5.6% 5.8% 5.1% 5.8%
EBITDA 45.3% 44.0% 43.9% 44.9% 43.8%
EBIT 27.9% 24.7% 26.8% 27.3% 25.5%
Particulars
Closing currency rates as on March 31, 2020 considered for Constant currency. Reported currency rates considered for Capex.

Page 41 of 61
9.2 Based on Segment Wise Statement of Operations
9.2.1 Nigeria
In Reported Currency
Amount in US$ Mn, except ratios
Quarter Ended
Sep-20 Jun-20 Mar-20 Dec-19 Sep-19
Revenue 377 341 377 355 327
EBITDA 204 182 209 194 174
EBITDA / Revenue 54.2% 53.3% 55.5% 54.7% 53.1%
EBIT 141 130 163 146 129
Capex 67 30 145 64 62
Operating Free Cash Flow (EBITDA - Capex) 137 152 64 130 112
Particulars
In Constant Currency
Amount in US$ Mn, except ratios
Quarter Ended
Sep-20 Jun-20 Mar-20 Dec-19 Sep-19
Revenue 379 343 359 334 307
EBITDA 205 183 199 183 163
EBITDA / Revenue 54.2% 53.3% 55.5% 54.7% 53.1%
EBIT 142 130 154 138 121
Capex 67 30 145 64 62
Operating Free Cash Flow (EBITDA - Capex) 138 153 54 119 101
Particulars
Closing currency rates as on March 31, 2020 considered for Constant currency. Reported currency rates considered for Capex.

Page 42 of 61
9.2.2 East Africa (Uganda, Zambia, Tanzania, Kenya, Malawi and Rwanda)
In Reported Currency
Amount in US$ Mn, except ratios
Quarter Ended
Sep-20 Jun-20 Mar-20 Dec-19 Sep-19
Revenue 355 305 310 313 301
EBITDA 163 129 125 127 123
EBITDA / Revenue 46.0% 42.4% 40.3% 40.5% 40.7%
EBIT 110 74 70 70 65
Capex 62 19 61 61 30
Operating Free Cash Flow (EBITDA - Capex) 101 110 64 66 93
Particulars
In Constant Currency
Amount in US$ Mn, except ratios
Quarter Ended
Sep-20 Jun-20 Mar-20 Dec-19 Sep-19
Revenue 358 306 299 297 284
EBITDA 164 130 120 120 114
EBITDA / Revenue 45.8% 42.3% 40.2% 40.2% 40.2%
EBIT 110 74 67 65 59
Capex 62 19 61 61 30
Operating Free Cash Flow (EBITDA - Capex) 102 110 60 59 84
Particulars
Closing currency rates as on March 31, 2020 considered for Constant currency. Reported currency rates considered for Capex.

Page 43 of 61
9.2.3 Francophone Africa (DRC, Gabon, Congo B, Madagascar, Niger, Chad and Seychelles)
In Reported Currency
Amount in US$ Mn, except ratios
Quarter Ended
Sep-20 Jun-20 Mar-20 Dec-19 Sep-19
Revenue 236 209 215 218 217
EBITDA 73 74 70 82 76
EBITDA / Revenue 30.8% 35.1% 32.7% 37.5% 34.9%
EBIT 23 25 24 32 29
Capex 20 16 40 24 54
Operating Free Cash Flow (EBITDA - Capex) 53 58 31 57 22
Particulars
In Constant Currency
Amount in US$ Mn, except ratios
Quarter Ended
Sep-20 Jun-20 Mar-20 Dec-19 Sep-19
Revenue 230 211 215 217 216
EBITDA 71 74 70 81 76
EBITDA / Revenue 30.9% 35.0% 32.7% 37.5% 35.0%
EBIT 23 24 24 32 29
Capex 20 16 40 24 54
Operating Free Cash Flow (EBITDA - Capex) 51 58 31 57 21
Particulars
Closing currency rates as on March 31, 2020 considered for Constant currency. Reported currency rates considered for Capex.

Page 44 of 61
9.3 Based on Product Wise Statement of Operations
9.3.1 Mobile Services - Summarized Statement of Operations
9.3.1.1 Consolidated Mobile:
In Reported Currency
Amount in US$ Mn, except ratios
Quarter Ended
Sep-20 Jun-20 Mar-20 Dec-19 Sep-19
Revenue 891 799 844 826 790
EBITDA 392 345 366 363 335
EBITDA / Revenue 44.0% 43.2% 43.3% 43.9% 42.4%
EBIT 228 192 220 210 186
Capex 147 64 240 145 145
Operating Free Cash Flow (EBITDA - Capex) 245 281 125 217 189
Particulars
In Constant Currency
Amount in US$ Mn, except ratios
Quarter Ended
Sep-20 Jun-20 Mar-20 Dec-19 Sep-19
Revenue 889 803 816 791 754
EBITDA 392 347 351 345 317
EBITDA / Revenue 44.1% 43.1% 43.0% 43.6% 42.0%
EBIT 229 192 209 198 174
Capex 147 64 240 145 145
Operating Free Cash Flow (EBITDA - Capex) 245 283 111 200 172
Particulars
Closing currency rates as on March 31, 2020 considered for Constant currency. Reported currency rates considered for Capex.
9.3.1.2 Nigeria Mobile Services
In Reported Currency
Amount in US$ Mn, except ratios
Quarter Ended
Sep-20 Jun-20 Mar-20 Dec-19 Sep-19
Revenue 377 341 377 354 326
EBITDA 204 182 209 194 172
EBITDA / Revenue 54.2% 53.3% 55.5% 54.7% 52.9%
EBIT 142 130 163 146 127
Capex 67 30 145 64 62
Operating Free Cash Flow (EBITDA - Capex) 137 152 64 130 110
Particulars

Page 45 of 61
In Constant Currency
Amount in US$ Mn, except ratios
Quarter Ended
Sep-20 Jun-20 Mar-20 Dec-19 Sep-19
Revenue 378 343 359 333 306
EBITDA 205 183 199 182 162
EBITDA / Revenue 54.2% 53.3% 55.5% 54.7% 52.9%
EBIT 142 130 154 137 120
Capex 67 30 145 64 62
Operating Free Cash Flow (EBITDA - Capex) 138 153 54 118 99
Particulars
Closing currency rates as on March 31, 2020 considered for Constant currency. Reported currency rates considered for Capex.
9.3.1.3 East Africa Mobile Services (Uganda, Zambia, Tanzania, Kenya, Malawi and Rwanda)
In Reported Currency
Amount in US$ Mn, except ratios
Quarter Ended
Sep-20 Jun-20 Mar-20 Dec-19 Sep-19
Revenue 298 264 268 272 263
EBITDA 128 103 100 101 99
EBITDA / Revenue 43.1% 38.9% 37.2% 37.1% 37.6%
EBIT 76 50 46 45 42
Capex 60 18 56 57 29
Operating Free Cash Flow (EBITDA - Capex) 68 85 44 44 70
Particulars
In Constant Currency
Amount in US$ Mn, except ratios
Quarter Ended
Sep-20 Jun-20 Mar-20 Dec-19 Sep-19
Revenue 301 266 259 258 248
EBITDA 129 103 96 95 92
EBITDA / Revenue 42.9% 38.8% 37.0% 36.8% 37.1%
EBIT 76 50 44 42 38
Capex 60 18 56 57 29
Operating Free Cash Flow (EBITDA - Capex) 69 85 40 38 63
Particulars
Closing currency rates as on March 31, 2020 considered for Constant currency. Reported currency rates considered for Capex.

Page 46 of 61
9.3.1.4 Francophone Africa Mobile Services (DRC, Gabon, Congo B, Madagascar, Niger, Chad and Seychelles)
In Reported Currency
Amount in US$ Mn, except ratios
Quarter Ended
Sep-20 Jun-20 Mar-20 Dec-19 Sep-19
Revenue 218 196 200 202 203
EBITDA 60 62 58 68 64
EBITDA / Revenue 27.5% 31.4% 28.7% 33.7% 31.4%
EBIT 10 13 11 18 16
Capex 20 16 39 24 54
Operating Free Cash Flow (EBITDA - Capex) 40 46 18 44 9
Particulars
In Constant Currency
Amount in US$ Mn, except ratios
Quarter Ended
Sep-20 Jun-20 Mar-20 Dec-19 Sep-19
Revenue 213 197 200 201 202
EBITDA 59 62 58 68 63
EBITDA / Revenue 27.6% 31.3% 28.7% 33.7% 31.4%
EBIT 10 13 11 18 16
Capex 20 16 39 24 54
Operating Free Cash Flow (EBITDA - Capex) 39 46 18 43 9
Particulars
Closing currency rates as on March 31, 2020 considered for Constant currency. Reported currency rates considered for Capex.

Page 47 of 61
9.3.2 Mobile Money - Summarized Statement of Operations
9.3.2.1 Mobile Money:
In Reported Currency
Amount in US$ Mn, except ratios
Quarter Ended
Sep-20 Jun-20 Mar-20 Dec-19 Sep-19
Revenue 100 81 83 82 78
EBITDA 49 39 39 40 38
EBITDA / Revenue 48.7% 48.5% 47.3% 49.0% 48.2%
EBIT 47 37 36 39 37
Capex 2 2 5 4 2
Operating Free Cash Flow (EBITDA - Capex) 47 37 34 36 36
Particulars
In Constant Currency
Amount in US$ Mn, except ratios
Quarter Ended
Sep-20 Jun-20 Mar-20 Dec-19 Sep-19
Revenue 100 81 81 79 74
EBITDA 48 39 38 39 36
EBITDA / Revenue 48.6% 48.5% 47.5% 49.2% 48.4%
EBIT 46 37 36 37 35
Capex 2 2 5 4 2
Operating Free Cash Flow (EBITDA - Capex) 47 37 33 35 34
Particulars
Closing currency rates as on March 31, 2020 considered for Constant currency. Reported currency rates considered for Capex.

Page 48 of 61
9.4 Operational Performance Trends (Quarter Ended)
9.4.1 Consolidated - Operational Performance
Parameters Unit Sep-20 Jun-20 Mar-20 Dec-19 Sep-19
Customer Base 000's 116,371 111,461 110,604 107,140 103,881
Net Additions 000's 4,910 857 3,464 3,258 4,211
Monthly Churn % 5.3% 5.7% 5.3% 5.2% 4.5%
Average Revenue Per User (ARPU) US$ 2.8 2.6 2.7 2.7 2.6
Voice
Voice Revenue US$ Mn 517 456 494 484 464
Minutes on the netw ork Mn 80,375 71,891 68,870 65,086 60,795
Voice Average Revenue Per User (ARPU) US$ 1.5 1.4 1.5 1.5 1.5
Voice Usage per customer min 235 218 211 206 199
Data
Data Revenue US$ Mn 283 267 245 232 215
Data Customer Base 000's 39,596 36,972 35,443 32,887 31,910
As % of Customer Base % 34.0% 33.2% 32.0% 30.7% 30.7%
Total MBs on the netw ork Mn MBs 293,919 279,541 219,015 189,798 162,394
Data Average Revenue Per User (ARPU) US$ 2.5 2.5 2.4 2.4 2.3
Data Usage per customer MBs 2,576 2,607 2,145 1,967 1,748
M obile M oney
Transaction Value US$ Mn 11,637 9,038 8,031 8,001 7,442
Transaction Value per Subs US$ 199 164 155 166 166
Mobile Money Revenue US$ Mn 100 81 81 79 74
Active Customers 000's 20,120 18,529 18,294 16,634 15,521
Mobile Money ARPU US$ 1.7 1.5 1.6 1.6 1.7
Network and Coverage
Netw ork tow ers Nos 24,246 23,471 22,909 22,253 21,936
Owned towers Nos 4,561 4,569 4,548 4,454 4,461
Leased towers Nos 19,685 18,902 18,361 17,799 17,475
Of w hich Mobile Broadband tow ers Nos 22,250 21,171 20,378 19,133 18,274
Total Mobile Broadband Base stations Nos 63,705 51,963 47,082 43,174 40,187
Data Capacity TB/day 10,253 8,371 7,572 6,780 6,146
Revenue Per site Per Month US$ 13,408 12,257 12,809 12,718 12,361
Revenue & KPIs in Constant Currency rates. Closing currency rates as on March 31, 2020 considered for constant currency.

Page 49 of 61
9.4.2 Nigeria - Operational Performance
Parameters Unit Sep-20 Jun-20 Mar-20 Dec-19 Sep-19
Customer Base 000's 44,054 42,513 41,757 39,855 39,512
Net Additions 000's 1,541 757 1,902 343 2,044
Monthly Churn % 6.1% 5.7% 5.8% 6.8% 4.7%
Average Revenue Per User (ARPU) US$ 2.9 2.7 2.9 2.8 2.7
Voice
Voice Revenue US$ Mn 217 198 222 205 188
Minutes on the netw ork Mn 20,867 19,275 20,447 18,812 15,687
Voice Average Revenue Per User (ARPU) US$ 1.7 1.6 1.8 1.7 1.6
Voice Usage per customer min 161 154 166 158 136
Data
Data Revenue US$ Mn 135 122 114 109 99
Data Customer Base 000's 19,003 17,334 16,715 15,234 15,471
As % of Customer Base % 43.1% 40.8% 40.0% 38.2% 39.2%
Total MBs on the netw ork Mn MBs 147,471 139,285 108,561 96,313 80,247
Data Average Revenue Per User (ARPU) US$ 2.5 2.4 2.4 2.4 2.2
Data Usage per customer MBs 2,743 2,752 2,252 2,105 1,784
Network and Coverage
Netw ork tow ers Nos 10,347 9,802 9,352 8,924 8,878
Owned towers Nos 199 204 200 177 261
Leased towers Nos 10,148 9,598 9,152 8,747 8,617
Of w hich Mobile Broadband tow ers Nos 10,002 9,326 8,796 8,093 7,695
Total Mobile Broadband Base stations Nos 30,091 19,258 15,788 13,865 13,209
Data Capacity TB/day 5,245 3,489 2,980 2,486 2,343
Revenue Per site Per Month US$ 12,500 11,904 13,060 12,491 11,760
Revenue & KPIs in Constant Currency rates. Closing currency rates as on March 31, 2020 considered for constant currency.

Page 50 of 61
9.4.3 East Africa - Operational Performance (Uganda, Zambia, Tanzania, Kenya, Malawi and Rwanda)
Parameters Unit Sep-20 Jun-20 Mar-20 Dec-19 Sep-19
Customer Base 000's 51,265 48,757 48,634 47,366 45,007
Net Additions 000's 2,508 123 1,268 2,359 1,955
Monthly Churn % 4.5% 5.7% 4.7% 3.8% 3.8%
Average Revenue Per User (ARPU) US$ 2.4 2.1 2.1 2.2 2.2
Voice
Voice Revenue US$ Mn 171 144 147 149 146
Minutes on the netw ork Mn 51,335 45,107 41,049 39,177 38,290
Voice Average Revenue Per User (ARPU) US$ 1.1 1.0 1.0 1.1 1.1
Voice Usage per customer min 342 311 285 284 290
Data
Data Revenue US$ Mn 89 86 79 77 69
Data Customer Base 000's 14,924 14,041 13,322 12,903 12,142
As % of Customer Base % 29.1% 28.8% 27.4% 27.2% 27.0%
Total MBs on the netw ork Mn MBs 115,048 110,172 85,983 74,285 66,644
Data Average Revenue Per User (ARPU) US$ 2.0 2.1 2.1 2.1 2.0
Data Usage per customer MBs 2,632 2,711 2,227 1,991 1,905
Network and Coverage
Netw ork tow ers Nos 9,193 9,039 8,987 8,838 8,678
Owned towers Nos 2,544 2,535 2,499 2,475 2,421
Leased towers Nos 6,649 6,504 6,488 6,363 6,257
Of w hich Mobile Broadband tow ers Nos 8,039 7,880 7,809 7,542 7,386
Total Mobile Broadband Base stations Nos 22,567 22,071 21,162 20,340 19,564
Data Capacity TB/day 3,426 3,355 3,147 3,009 2,805
Revenue Per site Per Month US$ 13,025 11,264 11,156 11,261 10,937
Revenue & KPIs in Constant Currency rates. Closing currency rates as on March 31, 2020 considered for constant currency.
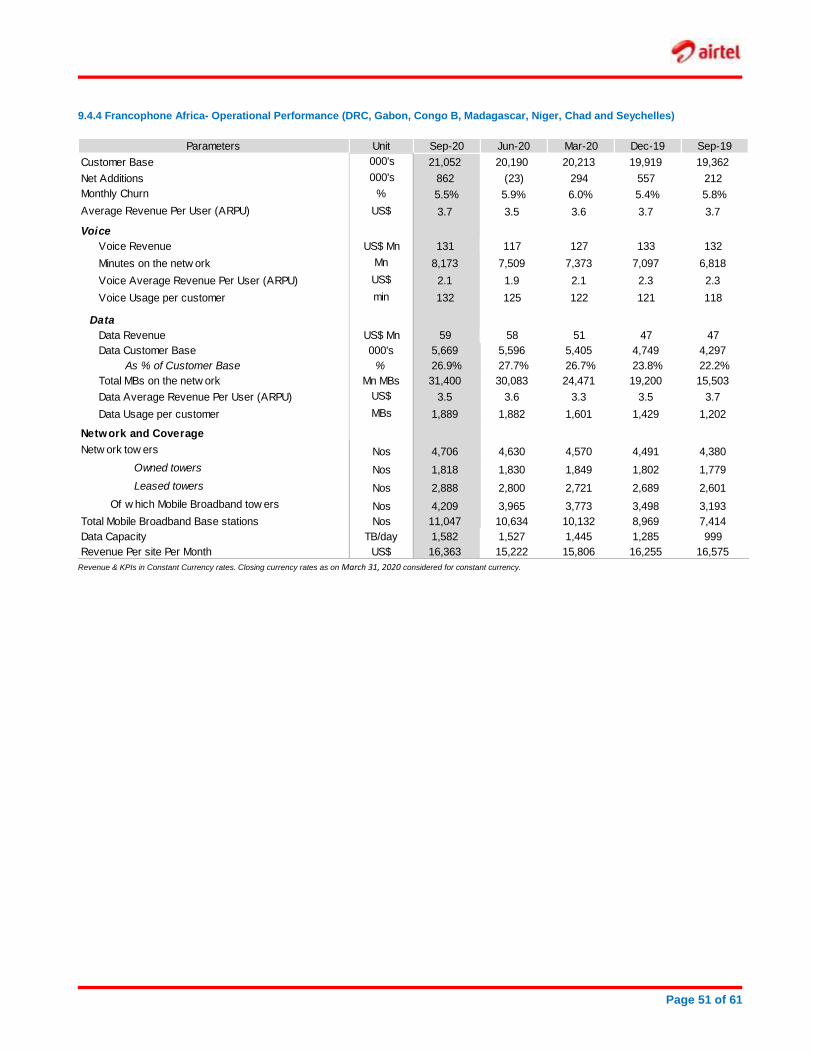
Page 51 of 61
9.4.4 Francophone Africa- Operational Performance (DRC, Gabon, Congo B, Madagascar, Niger, Chad and Seychelles)
Parameters Unit Sep-20 Jun-20 Mar-20 Dec-19 Sep-19
Customer Base 000's 21,052 20,190 20,213 19,919 19,362
Net Additions 000's 862 (23) 294 557 212
Monthly Churn % 5.5% 5.9% 6.0% 5.4% 5.8%
Average Revenue Per User (ARPU) US$ 3.7 3.5 3.6 3.7 3.7
Voice
Voice Revenue US$ Mn 131 117 127 133 132
Minutes on the netw ork Mn 8,173 7,509 7,373 7,097 6,818
Voice Average Revenue Per User (ARPU) US$ 2.1 1.9 2.1 2.3 2.3
Voice Usage per customer min 132 125 122 121 118
Data
Data Revenue US$ Mn 59 58 51 47 47
Data Customer Base 000's 5,669 5,596 5,405 4,749 4,297
As % of Customer Base % 26.9% 27.7% 26.7% 23.8% 22.2%
Total MBs on the netw ork Mn MBs 31,400 30,083 24,471 19,200 15,503
Data Average Revenue Per User (ARPU) US$ 3.5 3.6 3.3 3.5 3.7
Data Usage per customer MBs 1,889 1,882 1,601 1,429 1,202
Network and Coverage
Netw ork tow ers Nos 4,706 4,630 4,570 4,491 4,380
Owned towers Nos 1,818 1,830 1,849 1,802 1,779
Leased towers Nos 2,888 2,800 2,721 2,689 2,601
Of w hich Mobile Broadband tow ers Nos 4,209 3,965 3,773 3,498 3,193
Total Mobile Broadband Base stations Nos 11,047 10,634 10,132 8,969 7,414
Data Capacity TB/day 1,582 1,527 1,445 1,285 999
Revenue Per site Per Month US$ 16,363 15,222 15,806 16,255 16,575
Revenue & KPIs in Constant Currency rates. Closing currency rates as on March 31, 2020 considered for constant currency.

Page 52 of 61
SECTION 10
KEY ACCOUNTING POLICIES (AS PER IFRS)
Property, plant and equipment and capital work-in-progress
An item is recognised as an asset, if and only if, it is probable that the future economic benefits associated with the item will flow to the Group and its cost can be measured reliably. PPE is initially recognised at cost. The initial cost of PPE comprises its purchase price (including non-refundable duties and taxes but excluding any trade discounts and rebates), and any directly attributable cost of bringing the asset to its working condition and location for its intended use. Further, it includes assets installed on the premises of customers as the associated risks, rewards and control remain with the Group. Subsequent to initial recognition, PPE is stated at cost less accumulated depreciation and any impairment losses. When significant parts of PPE are required to be replaced at regular intervals, the Group recognises such parts as separate component of assets. When an item of PPE is replaced, then its carrying amount is de-recognised from the consolidated statement of financial position and cost of the new item of PPE is recognised. The expenditures that are incurred after an item of PPE has been ready to use, such as repairs and maintenance, are normally charged to the consolidated statement of comprehensive income in the period in which such costs are incurred. However, in situations where the said expenditure can be measured reliably, and is probable that future economic benefits associated with it will flow to the Group, it is included in the asset’s carrying value or as a separate asset, as appropriate. Depreciation on PPE is computed using the straight-line method over the estimated useful lives. Freehold land is not depreciated as it has an unlimited useful life. The Group has established the estimated range of useful lives for different categories of PPE as follows: Asset Categories Years
Leasehold improvementPeriod of lease or 10-20 years,
as applicable, w hichever is less
Buildings 20
Plant and equipment
- Netw ork equipment (including passive
infrastructure)3 - 25
Computer equipment 3-5
Furniture & fixture and office equipment 1-5
Vehicles 3-5 The useful lives, residual values and depreciation method of PPE are reviewed, and adjusted appropriately, at-least as at each reporting date so as to ensure that the method and period of depreciation are consistent with the expected pattern of economic benefits from these assets. The effect of any change in the estimated useful lives, residual values and / or depreciation method are accounted prospectively, and accordingly, the depreciation is calculated over the PPE’s remaining revised useful life. The cost and the accumulated depreciation for PPE sold, scrapped, retired or otherwise disposed of are de-recognised from the consolidated statement of financial position and the resulting gains / (losses) are included in the consolidated statement of comprehensive income within other expenses / other income. PPE in the course of construction is carried at cost, less any accumulated impairment and presented separately as capital work-in-progress (CWIP) including capital advances in the consolidated statement of financial position until capitalised. Such
cost comprises of purchase price (including non-refundable duties and taxes but excluding any trade discounts and rebates), and any directly attributable cost.
Goodwill Goodwill represents the cost of the acquired businesses in excess of the fair value of identifiable net assets acquired. Goodwill is not amortised; however, it is tested for impairment and carried at cost less any accumulated impairment losses. The gains/ (losses) on the disposal of a cash-generating unit (‘CGU’) include the carrying amount of goodwill relating to the CGU sold (in case goodwill has been allocated to Group of CGUs; it is determined on the basis of the relative fair value of the operations sold). Goodwill is tested for impairment, at least annually or earlier, in case circumstances indicate that their carrying value may exceed the recoverable amount (higher of fair value less costs of sell and the value -in- use). For the purpose of impairment testing, the goodwill is allocated to a cash-generating-unit (‘CGU’) or group of CGUs (‘CGUs’) which are expected to benefit from the acquisition-related synergies and represent the lowest level within the entity at which the goodwill is monitored for internal management purposes, but not higher than an operating segment. A CGU is the smallest identifiable group of assets that generates cash inflows that are largely independent of the cash inflows from other assets or group of assets. Impairment occurs when the carrying value of a CGU/CGUs including the goodwill, exceeds the estimated recoverable amount of the CGU/CGUs. The recoverable amount of a CGU/CGUs is the higher of its fair value less costs to sell and its value in use. Value-in-use is the present value of future cash flows expected to be derived from the CGU/CGUs. The total impairment loss of a CGU/CGUs is allocated first to reduce the carrying value of goodwill allocated to that CGU/CGUs and then to the other assets of that CGU/CGUs - on pro-rata basis of the carrying value of each asset.
Other Intangible assets Identifiable intangible assets are recognised when the Group controls the asset, it is probable that future economic benefits attributed to the asset will flow to the Group and the cost of the asset can be measured reliably. The intangible assets that are acquired in a business combination are recognised at fair value as on acquisition date. Other intangible assets are recognised at cost. These assets having a definite useful life are carried at cost less accumulated amortisation and any impairment losses. Amortisation is computed using the straight-line method over the expected useful life of intangible assets. The Group has established the estimated useful lives of different categories of intangible assets as follows: a. Licenses (including spectrum) Acquired licenses and spectrum are amortised commencing from the date when the related network is available for intended use in the relevant jurisdiction. The useful lives range from two to twenty-five years.

Page 53 of 61
In addition, the Group also incurs a fee on licenses/spectrum that is calculated based on the revenue amount of the period. Such revenue-share based fee is recognised as a cost in the consolidated statement of comprehensive income when incurred. b. Software: Software are amortised over the period of the license, generally not exceeding three years. c. Other acquired intangible assets: Other acquired intangible assets include the following: Customer relationships: Over the estimated life of such relationships which ranges from one year to five years. The useful lives and amortisation method are reviewed, and adjusted appropriately, at least at each financial year end so as to ensure that the method and period of amortisation are consistent with the expected pattern of economic benefits from these assets. The effect of any change in the estimated useful lives and / or amortisation method is accounted prospectively, and accordingly, the amortisation is calculated over the remaining revised useful life. Further, the cost of intangible assets under development includes the amount of spectrum allotted to the Group and related costs for which services are yet to be rolled out and are presented separately in the consolidated statement of financial position.
Investment in Associates An associate is an entity over which the Group has significant influence. Significant influence is the power to participate in the financial and operating policy decisions of the investee but is not control or joint control over those policies. Investment in associate is accounted for using equity method; from the date on which the Group starts exercising significant influence over the associate. At each reporting date, the Group determines whether there is objective evidence that the investment is impaired. If there is such evidence, the Group calculates the amount of impairment as the difference between the recoverable amount of investment and its carrying value.
Leases At inception of a contract, the Group assesses a contract as, or containing, a lease if the contract conveys the right to control the use of an identified asset for a period of time in exchange for consideration. To assess whether a contract conveys the right to control the use of an identified asset, the Group assesses whether the contract involves the use of an identified asset, the Group has the right to obtain substantially all of the economic benefits from use of the asset throughout the period of use; and the Group has the right to direct the use of the asset. a. Group as a lessee The Group recognises a right-of-use asset and a corresponding lease liability with respect to all lease agreements in which it is the lessee in the consolidated statement of financial position. The lease liability is initially measured at the present value of the lease payments that are not paid at the commencement date, discounted by using the rate implicit in the lease. If this rate cannot be readily determined, the Group uses its incremental borrowing rate. Lease liabilities include the net present value of fixed payments (including in-substance fixed payments), variable lease payments that are based on consumer price index (‘CPI’), the
exercise price of a purchase option if the lessee is reasonably certain to exercise that option, and payments of penalties for terminating the lease, if the lease term reflects the lessee exercising that option. Subsequently, the lease liability is measured at amortised cost using the effective interest method. It is remeasured when there is a change in future lease payments including due to changes in CPI or if the Group changes its assessment of whether it will exercise a purchase, extension or termination option or when the lease contract is modified and the lease modification is not accounted for as a separate lease. The corresponding adjustment is made to the carrying amount of the right-of-use asset, or is recorded in profit or loss if the carrying amount of the related right-of-use asset has been reduced to zero. Right-of-use assets are measured at cost comprising the amount of the initial measurement of lease liability, any lease payments made at or before the commencement date less any lease incentives received, any initial direct costs, and restoration costs. Subsequent to initial recognition, right-of-use assets are stated at cost less accumulated depreciation and any impairment losses and adjusted for certain re-measurements of the lease liability. Depreciation is computed using the straight-line method from the commencement date to the end of the useful life of the underlying asset or the end of the lease term, whichever is shorter. The estimated useful lives of right-of-use assets are determined on the same basis as those of the underlying property and equipment. In the consolidated statement of financial position, the right-of-use assets and lease liabilities are presented separately. When a contract includes lease and non-lease components, the Group allocates the consideration in the contract on the basis of the relative stand-alone prices of each lease component and the aggregate stand-alone price of the non-lease components. Short-term leases The Group has elected not to recognise right-of-use assets and lease liabilities for short term leases that have a lease term of 12 months or less. The Group recognises the lease payments associated with these leases as an expense on a straight-line basis over the lease term. b. Group as a lessor Whenever the terms of the lease transfer substantially all the risks and rewards of ownership to the lessee, the contract is classified as a finance lease. All other leases are classified as operating leases. Amounts due from lessees under a finance lease are recognised as receivables at an amount equal to the net investment in the leased assets. Finance lease income is allocated to the periods so as to reflect a constant periodic rate of return on the net investment outstanding in respect of the finance lease. Rental income from operating leases is recognised on a straight-line basis over the term of the relevant lease. Initial direct costs incurred in negotiating and arranging an operating lease are added to the carrying amount of the leased asset and recognised on a straight line basis over the lease term. When a contract includes lease and non-lease components, the Group applies IFRS 15 to allocate the consideration under the contract to each component.

Page 54 of 61
The Group enters into ‘Indefeasible right to use’ (‘IRU’) arrangements wherein the right to use the assets is given over the substantial part of the asset life. However, as the title to the assets and the significant risks associated with the operation and maintenance of these assets remains with the Group, such arrangements are recognised as operating lease. The contracted price is recognised as revenue during the tenure of the agreement. Unearned IRU revenue received in advance is presented as deferred revenue within liabilities in the consolidated statement of financial position.
Derivative financial instruments
Derivative financial instruments, including separated embedded derivatives that are not designated as hedging instruments in a hedging relationship are classified as financial instruments at fair value through profit or loss. Such derivative financial instruments are initially recognised at fair value. They are subsequently measured at their fair value, with changes in fair value being recognised in profit or loss within finance income / finance costs.
Hedging activities
i. Fair value hedge
Some of the Group’s entities use derivative financial instruments (e.g. interest rate / currency swaps) to manage / mitigate their exposure to the risk of change in fair value of the borrowings. The Group designates certain interest swaps to hedge the risk of changes in fair value of recognised borrowings attributable to the hedged interest rate risk. The effective and ineffective portion of changes in the fair value of derivatives that are designated and qualify as fair value hedges are recorded in profit and loss within finance income / finance costs, together with any changes in the fair value of the hedged liability that is attributable to the hedged risk. If the hedge no longer meets the criteria for hedge accounting, the adjustment to the carrying amount of the hedged item is amortised to profit or loss over the period to remaining maturity of the hedged item.
ii. Cash flow hedge Some of the Group’s entities use derivative financial instruments (e.g. foreign currency forwards, options, swaps) to manage their exposure to foreign exchange and price risk. Further, the Group designates certain derivative financial instruments (or its components) as hedging instruments for hedging the exchange rate fluctuation risk attributable to either a recognised item or a highly probable forecast transaction (‘Cash flow hedge’). The effective portion of changes in the fair value of derivative financial instruments (or its components) that are designated and qualify as cash flow hedges, are recognised in other comprehensive income and held as cash flow hedge reserve (‘CFHR’) – within other components of equity. Any gains / (losses) relating to the ineffective portion, are recognised immediately in profit or loss within finance income / finance costs. The amounts accumulated in equity are re-classified to the profit and loss in the periods when the hedged item affects profit / (loss). When a hedging instrument expires or is sold, or when a cash flow hedge no longer meets the criteria for hedge accounting, any cumulative gains / (losses) existing in equity at that time remains in equity and is recognised (on the basis as discussed in the above paragraph) when the forecast transaction is ultimately recognised in the profit and loss. However, at any point of time, when a forecast transaction is no longer expected to occur, the cumulative gains / (losses) that were reported in equity is immediately
transferred to the profit and loss within finance income / finance costs. iii. Net investment hedge The Group hedges its net investment in certain foreign subsidiaries. Accordingly, any foreign exchange differences on the hedging instrument (e.g. borrowings) relating to the effective portion of the hedge is recognised in other comprehensive income as foreign currency translation reserve (‘FCTR’) – within other components of equity, so as to offset the change in the value of the net investment being hedged. The ineffective portion of the gain or loss on these hedges is immediately recognised in profit or loss. The amounts accumulated in equity are included in the profit and loss when the foreign operation is disposed or partially disposed.
Revenue
Revenue is recognised upon transfer of control of promised products or services to the customer at the consideration which the Group has received or expects to receive in exchange of those products or services, net of any taxes / duties and discounts. When determining the consideration to which the Group is entitled for providing promised products or services via intermediaries, the Group assesses whether the intermediary is a principal or agent in the onward sale to the end customer. To the extent that the intermediary is considered a principal, the consideration to which the Group is entitled is determined to be that received from the intermediary. To the extent that the intermediary is considered an agent, the consideration to which the Group is entitled is determined to be the amount received from the customer; the discount provided to the intermediary is recognised as a cost of sale. The Group has entered into certain multiple-element revenue arrangements which involve the delivery or performance of multiple products, services or rights to use assets. At the inception of the arrangement, all the deliverables therein are evaluated to determine whether they represent distinct performance obligations, and if so, they are accounted for separately. Total consideration related to the multiple element arrangements is allocated to each performance obligation based on their relative standalone selling prices. The stand-alone selling prices are determined based on the prices at which the Group sells equipment and network services separately. Revenue is recognised when, or as, each distinct performance obligation is satisfied. The main categories of revenue and the basis of recognition are as follows: a. Service revenue
Service revenue is derived from the provision of telecommunication services and mobile money services to customers. The majority of the customers of the Group subscribe to the services on a pre-paid basis. Telecommunication service revenues mainly pertain to usage, subscription charges for voice, data, messaging and value added services and customer onboarding charges, which include activation charges. Telecommunication services (comprising voice, data and SMS) are considered to represent a single performance obligation as all are provided over the Group’s network and transmitted as data representing a digital signal on the network. The transmission consumes network bandwidth and therefore, irrespective of the nature of the communication, the customer ultimately receives
Page 55 of 61
access to the network and the right to consume network bandwidth. Customers pay in advance for services of the Group, these cash amounts are recognised in deferred income on the consolidated statement of financial position and transferred to the consolidated income statement when the service obligation has been performed/when the usage of services becomes remote. The Group recognises revenue from these services over time as they are provided. Revenue is recognised based on actual units of telecommunication services provided during the reporting period as a proportion of the total units of telecommunication services to be provided. Subscription charges are recognised over the subscription pack validity period. Customer onboarding revenue is recognised upon successful onboarding of customer i.e. upfront. Revenues recognised in excess of amounts invoiced are classified as unbilled revenue. If amounts invoiced / collected from a customer are in excess of revenue recognised, a deferred revenue / advance income is recognised. Service revenues also includes revenue from interconnection / roaming charges for usage of the Group’s network by other operators for voice, data, messaging and signaling services. These are recognised upon transfer of control of services being transferred over time. Revenues from long distance operations comprise of voice services and bandwidth services (including installation), which are recognised on provision of services and over the period of respective arrangements. The Group has interconnect agreements with local and foreign operators. This allows customers from either network to originate or terminate calls to each others’ network. Revenue is earned and recognised as per bilateral agreements when other operators’ calls are terminated to the Group’s network i.e. the service is rendered. As part of the mobile money services, the Group earns commission from merchants for facilitating recharges, bill payments and other merchant payments. It also earns commissions on transfer of monies from one customer wallet to another. Such commissions are recognised as revenue on provision of these services by the Group. Costs to obtain or fulfil a contract with a customer The company has estimated that the historic average customer life is longer than 12 months and believes that its churn rate provides the best indicator of anticipated average customer life and has changed its policy on cost deferral recognition in these financial statements. Accordingly, the company has deferred such costs over expected average customer life. b. Equipment sales
Equipment sales mainly pertain to sale of telecommunication equipment and related accessories for which revenue is recognised when the control of equipment is transferred to the customer i.e. transferred at a point in time.
Alternative performance measures (APM)- Exceptional items
Management exercises judgment in determining the adjustments to apply to IFRS measurements in order to derive APMs which provide additional useful information on the underlying trends,
performance and position of the Group. This assessment covers the nature of the item being one-off or non-routine, whether the cause of occurrence was within the Group’s control or not and the scale of impact of that item on reported performance in accordance with the exceptional items policy. To monitor the performance, the Group uses the following APMs:
‘Underlying profit before tax’ representing profit before tax for the period excluding the impact of exceptional items,
‘Underlying profit after tax’ representing profit after tax for the period excluding the impact of exceptional items and tax on exceptional items.
Exceptional items refer to items of income or expense within the consolidated statement of comprehensive income which are of such size, nature or incidence that their exclusion is considered necessary to explain the performance of the Group and improve the comparability between periods. Reversals of previous exceptional items are also considered as exceptional items. When applicable, these items include network modernisation, share issue expenses, restructuring costs, impairments, initial recognition of deferred tax assets, impact of mergers etc.
Foreign currency transactions
a. Functional and presentation currency
The items included in financial statements of each of the Group’s entities are measured using the currency of primary economic environment in which the entity operates (i.e. ‘functional currency’). The financial statements are presented in US Dollar which is the functional and presentation currency of the company. b. Transactions and balances Transactions in foreign currencies are initially recorded in the relevant functional currency at the rates prevailing at the date of the transaction. Monetary assets and liabilities denominated in foreign currencies are translated into the functional currency at the closing exchange rate prevailing as at the reporting date with the resulting foreign exchange differences, on subsequent re-statement / settlement, recognised in the consolidated statement of comprehensive income within finance costs / finance income. Non-monetary assets and liabilities denominated in foreign currencies are translated into the functional currency using the exchange rate prevalent, at the date of initial recognition (in case they are measured at historical cost) or at the date when the fair value is determined (in case they are measured at fair value) – with the resulting foreign exchange difference, on subsequent re-statement / settlement, recognised in the profit and loss, except to the extent that it relates to items recognised in the other comprehensive income or directly in equity. The equity items denominated in foreign currencies are translated at historical exchange rate. c. Foreign operations
The assets and liabilities of foreign operations (including the goodwill and fair value adjustments arising on the acquisition of foreign entities) are translated into US Dollar at the exchange rates prevailing at the reporting date whereas their statements of profit and loss are translated into US Dollar at monthly average exchange rates and the equity is recorded at the historical rate.

Page 56 of 61
The resulting exchange differences arising on the translation are recognised in other comprehensive income and held in foreign currency translation reserve (‘FCTR’), a component of equity. On disposal of a foreign operation (that is, disposal involving loss of control), the component of other comprehensive income relating to that particular foreign operation is reclassified to profit or loss.
Income-taxes The income tax expense comprises of current and deferred income tax. Income tax is recognised in the profit and loss, except to the extent that it relates to items recognised in the same or a different period, outside profit or loss, in other comprehensive income or directly in equity, in which case the related income tax is also recognised accordingly. a. Current tax Current tax is calculated on the basis of the tax rates, laws and regulations, which have been enacted or substantively enacted as at the reporting date in the respective countries where the Group entities operate and generate taxable income. The payment made in excess / (shortfall) of the respective Group entities’ income tax obligation for the period are recognised in the consolidated statement of financial position under non-current income tax assets / liabilities. Any interest, related to accrued liabilities for potential tax assessments are not included in Income tax charge or (credit), but are rather recognised within finance costs. A provision is recognised for those matters for which the tax determination is uncertain but it is considered probable that there will be a future outflow of funds to a tax authority. The provisions are measured at the best estimate of the amount expected to become payable or based on expected value approach, as applicable. The assessment is based on the judgement of tax professionals within the company supported by previous experience in respect of such activities and in certain cases based on specialist independent tax advice. b. Deferred tax Deferred tax is recognised, using the liability method, on temporary differences arising between the tax bases of assets and liabilities and their carrying values. However, deferred tax is not recognised if it arises from initial recognition of an asset or liability in a transaction other than a business combination that at the time of the transaction affects neither accounting nor taxable profit or loss. Further, deferred tax liabilities are not recognised if they arise from the initial recognition of goodwill. Deferred tax assets are recognised only to the extent that it is probable that future taxable profit will be available against which the temporary differences can be utilised. Moreover, deferred tax
is recognised on temporary differences arising on investments in subsidiaries and associate - unless the timing of the reversal of the temporary difference can be controlled and it is probable that the temporary difference will not reverse in the foreseeable future. Deferred tax assets, recognised and unrecognised, are reviewed at each reporting date and assessed for recoverability based on best estimates of future taxable profits. Deferred tax is determined using tax rates (and laws) that have been enacted or substantively enacted by the reporting date and are expected to apply when the related deferred income tax asset is realised or the deferred income tax liability is settled. Income tax assets and liabilities are off-set against each other and the resultant net amount is presented in the consolidated statement of financial position, if and only when, (a) the Group currently has a legally enforceable right to set-off the current income tax assets and liabilities, and (b) when it relate to income tax levied by the same taxation authority and where there is an intention to settle the current income tax balances on net basis.
Transactions with non-controlling interests A change in the ownership interest of a subsidiary, without a change of control, is accounted for as a transaction with equity holders. Any difference between the amount of the adjustment to non-controlling interests and any consideration exchanged is recognised in ‘transactions with NCI reserve’, within equity.
Provisions Provisions are recognised when the Group has a present obligation (legal or constructive) as a result of a past event, it is probable that an outflow of resources will be required to settle the obligation, and the amount of the obligation can be reliably estimated. Provisions are measured at the present value of the expenditures expected to be required to settle the relevant obligation, using a pre-tax rate that reflects current market assessments of the time value of money (if the impact of discounting is significant) and the risks specific to the obligation. The increase in the provision due to un-winding of discount over passage of time is recognised within finance costs. Contingencies A disclosure for a contingent liability is made when there is a possible obligation or a present obligation that may, but probably will not, require an outflow of resources. When there is a possible obligation or a present obligation in respect of which the likelihood of outflow of resources is remote, no provision or disclosure is made. Contingent assets are not recognised unless virtually certain and disclosed only where an inflow of economic benefits is probable.

Page 57 of 61
SECTION 11
GLOSSARY
Technical and Industry Terms
Company Related
Average Customers Average Revenue per user (ARPU)
Average customers are derived by computing the average of the monthly average customers for the relevant period. Average revenue per user per month, which is derived by dividing total revenue during the relevant period by the average number of customers and dividing the result by the number of months in the relevant period.
Basic Earnings Per Share Basic Earnings Per Share is computed by dividing the profit for the period attributable to the owners of the parent by the weighted average number of shares outstanding during the period.
Capital Expenditure (Capex)
It is not a GAAP measure and is defined as investment in capital work in progress (CWIP) gross fixed assets (tangible and intangible excluding spectrum/licence) and excluding provision on capital work in progress (CWIP).
Capital Employed Capital Employed is defined as sum of equity attributable to equity holders of parent, Non-controlling interests ('NCI') and net debt. The definition has been revised to include Non-controlling interests ('NCI') and the related KPIs have been reinstated for all the reported periods.
Cash Profit from Operations before Derivative and Exchange Fluctuation
It is not a GAAP measure and is defined as profit from operating activities before depreciation, amortization and exceptional items adjusted for finance cost (net of finance income) before adjusting for derivative and exchange (gain)/ loss.
Churn
Churn is derived by dividing the total number of customer disconnections during the relevant period by the average number of customers and dividing the result by number of months in the relevant period.
Constant currency Customer Customer Base
The Group has presented certain financial information that is calculated by translating the results for the current financial year and prior financial years at a fixed ‘constant currency’ exchange rate, which is done to measure the Organic performance of the Group. A customer is defined as a unique subscriber with a unique mobile telephone number who used any of Airtel’s services in the last 30 days. Total number of subscribers that used any of our services (voice calls, SMS, data usage or Airtel Money transaction) in the last 30 days.
Data Average Revenue Per User (ARPU) Data Capacity Data Customer Base
Data ARPU is derived by dividing total data revenue during the relevant period by the average number of Data customers and dividing the result by the number of months in the relevant period. Total data capacity per day for the Region. Total subscribers who consumed at least 1MB on the Group’s GPRS, 3G or 4G network in the last 30 days.
Data customer penetration Data Usage per Customer
It is computed by dividing the data customer base by total customer base. It is calculated by dividing the total MBs consumed on the Group’s network during the relevant period by the average data customer base over the same period, and dividing the result by the number of months in the relevant period.
Diluted Earnings per share Earnings per share (EPS)
Diluted EPS is computed by adjusting, the profit for the year attributable to the shareholders and the weighted average number of shares considered for deriving basic EPS, for the effects of all the shares that could have been issued upon conversion of all dilutive potential shares. The dilutive potential shares are adjusted for the proceeds receivable had the shares been actually issued at fair value. Further, the dilutive potential shares are deemed converted as at beginning of the period, unless issued at a later date during the period. EPS is computed by dividing the profit for the period attributable to the owners of the company by the weighted average number of ordinary shares outstanding during the period.
EBITDA It is not a GAAP measure and is defined as operating profit before depreciation, amortisation, CSR cost and
exceptional items.

Page 58 of 61
EBITDA Margin It is not a GAAP measure and is computed by dividing EBITDA for the relevant period by total revenue for the
relevant period.
EBIT Free Cash Flow
It is not a GAAP measure and is defined as EBITDA adjusted for depreciation and amortization. Free cash flow defined as Operating free cash flow less cash interest, cash tax and change in operating working capital.
Francophone Africa Interest Coverage Ratio
One of the Group’s segments called earlier `Rest of Africa`. EBITDA for the relevant period divided by interest on borrowing for the relevant period.
Lease Obligation
Lease obligation represents the present value of the future lease payment obligation for assets taken on finance lease.
Mobile Broadband Base stations
It includes all the 3G and 4G Base stations deployed across all technologies/spectrum bands.
Mobile Money active customers Mobile Money ARPU Mobile Money transaction value Mobile Money transaction value per customer per month
Total number of subscribers who have done any Mobile Money usage event in last 30 days. Mobile Money ARPU, which is derived by dividing total Mobile Money revenue during the relevant period by the average number of Mobile Money customers and dividing the result by the number of months in the relevant period. It is defined as value of any financial transaction performed on Mobile Money platform. It is computed by dividing the total Mobile Money transaction value on Group’s Mobile Money platform during the relevant period by the average number of Mobile Money customers and dividing the result by number of months in the relevant period.
Mobile service Network Towers/Sites
Mobile service is defined as the core Telecom services including revenue from tower operation services provided by the Group and excludes Airtel Money services. Comprises of base transmission system (BTS) which holds the radio transceivers (TRXs) that define a cell and coordinates the radio links protocols with the mobile device. It includes all the ground based, roof top and in building solutions as at the end of the period.
Net Debt It is not a GAAP measure and is defined as the long-term borrowings, short term borrowings and leased liability less cash and cash equivalents.
Net Debt to EBITDA (LTM)
It is not a GAAP measure and is computed by dividing Net Debt as at the end of the relevant period by EBITDA for preceding last 12 months (from the end of the relevant period). This is also referred to as leverage ratio.
Net Debt to EBITDA (Annualized)
It is not a GAAP measure and is computed by dividing net debt as at the end of the relevant period by EBITDA for the relevant period (annualized).
Net Revenue It is not a GAAP measure and is defined as total revenue adjusted for IUC (Interconnection Usage charges) charges, cost of goods sold and Airtel Money commission.
Net profit margin Operating company
It is computed by dividing Cash Profit from Operations before Derivative and Exchange Fluctuation by total revenue. Operating company is defined as business units providing telecommunication services and mobile money services across the Group’s footprint.
Operating Profit
It is a GAAP measure and is computed as revenue less operating expenditure including depreciation & amortisation and operating exceptional items.
Operating Free Cash flow
It is computed by subtracting Capital Expenditure from EBITDA.
Profit / (Loss) after current tax expense Reported currency
It is not a GAAP measure and is defined as Profit / (Loss) before taxation adjusted for current tax expense. Reported currency is the currency where actual periodic exchange rates are used to translate the local currency financial statements of OPCO into US dollar. Under Reported currency the assets and liabilities are translated

Page 59 of 61
into US dollar at the exchange rates prevailing at the reporting date whereas the statements of profit and loss are translated into US dollar at monthly average exchange rates.
Return On Capital Employed (ROCE) Return on Equity (ROE)- Pre-Tax
For the full year ended, ROCE is computed by dividing the earnings before interest and tax for the period by
average (of opening and closing) capital employed. Capital employed used for ROCE is defined as sum of Total
Equity and Net Debt. For the quarterly computation, it is computed by dividing the earnings before interest and
tax for the preceding (last) 12 months from the end of the relevant period by average capital employed. Average
capital employed is calculated by considering average of quarterly average for the preceding (last) four quarters
from the end of the relevant period.
For the full year ended, it is computed by dividing profit before tax (including exceptional item) for the period by the closing Total Equity. For the quarterly computations, it is computed by dividing profit before tax (including exceptional items) for the preceding last 12 months from the end of the relevant period by the closing Total Equity for the relevant period.
Return on Equity (ROE)- Post-Tax
For the full year ended, it is computed by dividing net profit for the period by the closing Equity attributable to equity holders of parent. For the quarterly computations, it is computed by dividing net profit for the preceding last 12 months from the end of the relevant period by the closing Equity attributable to equity holders of parent.
Revenue per Site per month
Revenue per Site per month is computed by: dividing the total revenues, excluding sale of goods (if any) during the relevant period by the average sites; and dividing the result by the number of months in the relevant period.
Smartphone Smartphone Penetration
Smartphone is defined as mobile phone with interactive touch screen that allows the user to access internet apart from making calls and sending text messages. It is computed by dividing the smartphone devices by total customer.
Total Employees Total on-roll employees as at the end of respective period.
Total MBs on Network Total MBs consumed (uploaded & downloaded) by customers on the Group’s GPRS, 3G and 4G network during the relevant period.
Voice Minutes on Network
Duration in minutes for which a customer uses the Group’s network. It is typically expressed over a period of one month. It includes incoming, outgoing and in-roaming minutes.
Voice Minutes of Usage per Customer per month
It is computed by dividing the total voice minutes of usage on Group’s network during the relevant period by the average number of customers and dividing the result by number of months in the relevant period.
Abbreviations 2G
Second-Generation Technology
3G
4G
ARPU
bn
EBITDA
EPS
Third - Generation Technology
Fourth - Generation Technology
Average revenue per user
Billion
Earnings Before Interest, Tax, Depreciation and Amortization
Earnings Per Share
GAAP
GB
Group
Generally Accepted Accounting Principles
Gigabyte
The Airtel Africa plc, together with its subsidiary undertakings referred to as the ‘Group’
IAS
IFRS
International Accounting Standards
International Financial Reporting Standards

Page 60 of 61
KPIs
KYC
Key performance indicators
Know Your Customer
LTM
Last twelve months
MB
MI
Megabyte
Minority Interest (Non-Controlling Interest)
Mn
Million
OpCo Operating company
pp
P2P
PPE
SMS
TB
UoM
Percentage points
Person to Person
Property, Plant and equipment
Short Messaging Service
Terabyte
Unit of measure

Page 61 of 61
Written correspondence to be sent to:
Airtel Africa Investor Relations
E-mail address: [email protected]
Website: https://airtel.africa/investors Tel: (+44) 20 7493 9315