Embed Size (px)
Citation preview
1
REPORT ON THE RADIOACTIVITY MONITORING PROGRAMME IN THE MOOI RIVER(WONDERFONTEINSPRUIT) CATCHMENT.
EXECUTIVE SUMMARY
A radioactivity monitoring study was conducted by the Institute for Water Quality Studies (IWQS) ofthe Department of Water Affairs and Forestry (DWAF) in collaboration with a wide group of interestedparties, in the Mooi River Catchment during 1997. The study served to establish the drinking waterhealth risk, as well as the radiological status of the water resources, in the catchment from theviewpoint of drinking water. The intensive monitoring, both in time as well as in number ofradionuclides measured served to clear up many areas of doubt, and has established with reasonablecertainty the representative radiological status of the water resources in the catchment. The studycovered surface streams and groundwater sources in the catchment. The evaluation of health riskwas based on the levels of radioactivity in raw water samples that had been filtered prior to analysis,and on the use of such water for drinking purposes on a continuous basis. The relative contributionsto the health risk from ingestion of the suspended solids in the water and from radiation exposurescenarios other than drinking water use were, with the possible exception of fish consumption, shownto be insignificant. The study did not consider radioactivity in sediments.
The radiological variables measured were all from the natural radioactive decay chains of uranium-238, uranium-235, and thorium-232. In addition to radiological variables, a full set of chemicalvariables was also monitored.
The radiation doses calculated in the study were based on the conservative assumption that the waterat every sampling point was used continuously as the sole source of drinking water.
In view of the controversy surrounding the radiological status of water sources in the catchment,extensive efforts were made to validate the accuracy of the radiological measurements, as well as tocross check the validity of the total yearly doses calculated for each monitoring point. The total yearlydose was independently calculated by two different methods, which gave very similar radiation doses.
The set of dose criteria, used to evaluate the dose values found for drinking water, ranged from theideal level of the World Health Organisation of 0,1 mSv/year, through the 0,25 mSv/year single facilitydose limit used by the Council for Nuclear Safety, to the 1,0 mSv/year dose limit of the InternationalAtomic Energy Agency for public exposure from anthropogenic sources. These dose criteria havebeen incorporated into proposed interim radioactivity water quality guidelines, with associated actionsand interpretation.
The natural background radiation dose in drinking water in the catchment was estimated at 0,020mSv/year. The great majority of sampling sites in the catchment showed a total drinking waterradiation dose below 0,1 mSv/year, implying that no radiological problem exists from the viewpoint ofdrinking water. The general conclusion was that of the 41 sites monitored, 39 showed a water qualitywhich is either ideal or acceptable for continuous lifetime use in terms of the proposed interim waterquality guidelines for radioactivity in drinking water. Five sites had a dose between 0,1 and 0,25mSv/year, showing a slightly larger increase above local natural background, but still fully acceptablefor lifetime use with no significant detrimental effects to the user. Only two sites had significantelevation of the radiation dose which showed the need for planning to reduce the exposure over thecourse of time. Both these sites involved the discharge of mine water that had been pumped to thesurface.
A highly relevant and comforting finding of the study was that the total radiation dose for bothPotchefstroom untreated raw drinking water supply points was very low, and in fact not significantlydifferent from the natural background dose value estimated for the study.
2
A valuable finding of the study was the good linear correlation between total radiation dose from allradionuclides and the uranium concentration. This will, in the future, make it possible to use theuranium concentration for screening and routine monitoring purposes within the catchment.
As regards the two classical screening parameters for radiation, viz., alpha and beta activity, theformer showed a reasonably good correlation with total radiation dose, when compared on an annualaverage basis. The gross beta activity measurements were considered to be unreliable because ofmeasurement difficulties at the low levels encountered. As regards chemical variables, while it wasfound that elevated radiation dose is usually associated with elevated sulphate concentrations, theconverse was not true, consequently sulphate concentration cannot be used as an indicator ofradioactivity in the water.
The water analysis technique involves filtering of the raw water samples prior to radiometric analysis,and the primary intention of the study was to measure only the radioactivity in the water passingthrough the filter. In the final month of the study, however, the radioactivity in the suspended solidstrapped by the filter was also measured, as a preliminary indication of whether the suspended solidswere of any significance as regard the possible radiation dose from ingestion of untreated water.
While an important aim of the study was to measure the concentrations of a large range ofradionuclides in the natural uranium and thorium decay chains, it was not the intention to look atradon gas dissolved in the water. Dissolved radon, even at relatively high concentrations, does notcontribute significantly to the drinking water health risk, and is generally considered to be of possibleconcern only where significantly elevated radon concentrations are associated with conditions thatpromote the dissolution and release of the gas into poorly ventilated enclosures. Such scenarios,which might include indoor spa baths and underground water treatment plants, are not known to existin the Mooi River catchment.

3
4
1. INTRODUCTION
1.1 Background
Preliminary screening surveys of radioactivity in water sources was carried out by the Institutefor Water Quality Studies in 1995 and 1996 [1,2]. The levels of the radioactive elementsuranium and radium, found in streams in the vicinity of gold mining activities, were found to beelevated such that, in some cases, these streams might be regarded as unsuitable forcontinuous lifetime use as drinking water. Many radionuclides had not been measured, andthere was no information on the variability of the radionuclide concentrations in the watersources. Due to the lack of detailed and definitive data on radionuclide concentrations, it wasnot possible to determine the safety or otherwise of the water sources when used for drinkingwater purposes without a more thorough and intensive monitoring programme. In order toobtain certain knowledge on the radiological status of the water sources to establish humanhealth risk, it was essential that a more detailed investigation be conducted. This reportsummarizes the findings of an intensive radiological monitoring programme that wasconducted in the Mooi River catchment during 1997.
1.2 Aims of the Study and Strategy Adopted
The aims of the radioactivity monitoring programme were:
(i) To measure and report on the most important radioactive components in surfacestreams and in groundwater at selected sampling locations, at regular intervals over ahydrological year.
(ii) To establish the radiation dose from untreated water for the purposes of use asdrinking water, the emphasis being placed on the dissolved component of theradionuclides present in the water samples, and not on the suspended component.
(iii) To estimate, from such measurements, the incremental radiation doses aboveestimated background that could be received by users of the water.
(iv) To establish, on the basis of international practice, guidelines for interpreting thesignificance of these incremental radiation doses with a view to identifying the needfor remedial action at any particular location. The recommendations would be broughtto the attention of the relevant authorities within DWAF.
(v) To identify where further investigative work, beyond the scope of this study, wasneeded.
(vi) To identify strategies for efficient monitoring.
For clarity it is important to note what the study aims did not address. The studyfocussed on the radioactivity status of raw water, filtered before analysis. Somepreliminary work was done on the suspended solids. All the possible uptake routeswere investigated in detail, of which only the drinking water route and possibly the fishconsumption route were found to be significant. Sediments, dissolved radon gas andairborne gas and dust were outside the scope of the study.
The strategy adopted to achieve the aims comprised the following:
(a) To focus on one catchment at a time, in order of priority - the Mooi Rivercatchment (also known as and also containing the Wonderfonteinspruitcatchment) was selected as the first catchment to be studied, and forms thebasis of this report.
(b) To undertake the monitoring programme in a coordinated, transparentmanner with the participation of relevant governmental and non-governmental stakeholders.

5
1.3 Management and Co-ordination of the Programme
The IWQS was responsible for the management and coordination of the radioactivitymonitoring programme in the Mooi River catchment. The establishment of a CoordinatingCommittee and Technical Committee, involving representation from a wide spectrum oforganizations interested or involved in monitoring of radioactivity, assured transparency andthe involvement of a range of scientific opinion and decision making on the issue. TheCoordinating Committee consisted of numerous individuals and role players including RandWater, Goldfields Water, the Western Transvaal Water Company, the LowerWonderfonteinspruit Catchment Forum, Anglogold Limited, Gold Fields of South Africa andother representative mining companies such as Randfontein Estates, the School of ChemicalEngineering of the University of Potchefstroom, the Directorate: Water Quality Managementand the Gauteng Regional Office of DWAF, the Council for Nuclear Safety (CNS), the AtomicEnergy Corporation (AEC), the Chamber of Mines, the Council for Geoscience and theDepartment of Minerals and Energy.
The Technical Committee included representation from the AEC, the Chamber of Mines, theGauteng Regional Office, the Council for Geoscience, the Council for Nuclear Safety, and theIWQS.
2. MONITORING PROGRAMME
2.1 Selection of Catchment
The Mooi River Catchment (Figures 1 and 2), was selected as the first priority catchment forintensive radioactivity monitoring for reasons including the following:
(i) Major gold mining activity is carried out in the region, with the potential for pollution ofsurface and ground water. The region has several large active gold mines whichdischarge fissure and process water into the aquatic environment.
(ii) The upper section of the catchment has numerous diffuse sources from old and
abandoned mine workings and mine residue deposits. (iii) There are many informal settlements within the region, giving rise to possible
consumption of untreated surface and ground water. (iv) Formal townships, closely related to the mining activities, occur in the catchment.
Carletonville municipality abstracts a small portion for water use from boreholes andPotchefstroom municipality abstracts water from the Boskop dam for domestic wateruse. During the course of the study, questions were raised regarding elevated levelsof radioactivity in streams, within the catchment, that could have a negative impact onthe quality of the untreated raw water supplied to Potchefstroom, located at the lowerend of the catchment.
2.2 Characterisation of the Mooi River Catchment and Water Use
The Mooi River catchment consists of the Mooi River, Wonderfontein Spruit (Mooi RiverLoop) and Loop Spruit. The various dams situtated in the catchment include the Donaldson,Klipdrift, Boskop and Potchefstroom (Lakeside) Dams. The catchment is situated on the FarWest Rand with the upper section in the Gauteng Province and the lower part of thecatchment in the North West Province. The Mooi River and its tributaries receivecontamination from a wide variety of point and diffuse sources. The headwaters of theWonderfontein Spruit originate around the mine residue deposits of several old andabandoned mines. These mine tailings dams, sand dumps and rock dumps are potentiallysignificant contributors to diffuse contamination. Furthermore, numerous active gold minesare discharging fissure and process water into the water environment.
6
Most of the area is underlain by dolomite of which three of the dolomite compartments aredewatered by the gold mines. The water in the Wonderfontein Spruit is diverted into a one-metre diameter pipeline, which transports the water over two of the dewatered compartments.The Mooi River and its tributaries run through the magisterial districts of Potchefstroom,Westonaria, Oberholzer, Fochville and Carletonville. A number of growing communities arelocated in the catchment, including Kagiso, Mohlakeng, Toekomsrus, Rietvallei andBekkersdal. These developments, as well as informal developments, contribute to the diffusesources of pollution.
Rand Water supplies nearly all the water required for domestic use in the area, excludingPotchefstroom and the lower Mooi River area which is supplied by Potchefstroom municipalityfrom the Boskop Dam. Carletonville Municipality sometimes extracts water for Welverdiendfrom a borehole in the Turffontein compartment.
Industrial use of water from the Mooi River is concentrated in and around Potchefstroom.Some water is abstracted by farmers along the lower reaches of the river for livestockwatering and domestic supplies. The Mooi River is further used for angling and generalrecreational purposes.
Data on water usage by the various informal communities in the catchment were gatheredprimarily to establish usage for drinking water purposes (Appendix 1). This was important fordetermining the degree of conservatism inherent in assuming sole continuous use of thewater for drinking purposes.
2.3 Selection of Monitoring Sites
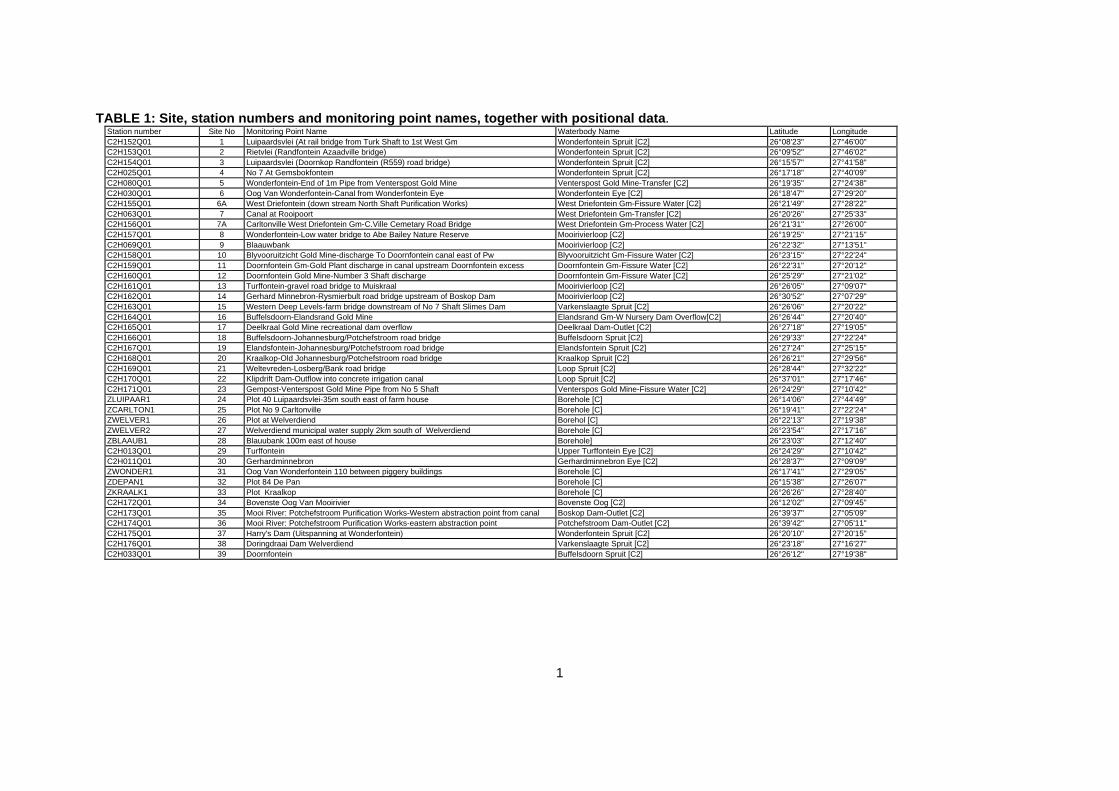
During the initial stages of the monitoring programme 39 sampling locations (28 surface watersites, and 11 groundwater sites) were selected on the recommendation of the Gauteng RegionalOffice (Figure 2). Sampling was started in January 1997. In addition to the sites selected initially,the two untreated, raw water abstraction points at the Potchefstroom purification works wereadded, some time after initiation of the monitoring programme.
Table 1 summarises the sampling site information and identifies the location of the sites.

7
1
TABLE 1: Site, station numbers and monitoring point names, together with positional data.Station number Site No Monitoring Point Name Waterbody Name Latitude LongitudeC2H152Q01 1 Luipaardsvlei (At rail bridge from Turk Shaft to 1st West Gm Wonderfontein Spruit [C2] 26°08'23" 27°46'00"C2H153Q01 2 Rietvlei (Randfontein Azaadville bridge) Wonderfontein Spruit [C2] 26°09'52" 27°46'02"C2H154Q01 3 Luipaardsvlei (Doornkop Randfontein (R559) road bridge) Wonderfontein Spruit [C2] 26°15'57" 27°41'58"C2H025Q01 4 No 7 At Gemsbokfontein Wonderfontein Spruit [C2] 26°17'18" 27°40'09"C2H080Q01 5 Wonderfontein-End of 1m Pipe from Venterspost Gold Mine Venterspost Gold Mine-Transfer [C2] 26°19'35" 27°24'38"C2H030Q01 6 Oog Van Wonderfontein-Canal from Wonderfontein Eye Wonderfontein Eye [C2] 26°18'47" 27°29'20"C2H155Q01 6A West Driefontein (down stream North Shaft Purification Works) West Driefontein Gm-Fissure Water [C2] 26°21'49" 27°28'22"C2H063Q01 7 Canal at Rooipoort West Driefontein Gm-Transfer [C2] 26°20'26" 27°25'33"C2H156Q01 7A Carltonville West Driefontein Gm-C.Ville Cemetary Road Bridge West Driefontein Gm-Process Water [C2] 26°21'31" 27°26'00"C2H157Q01 8 Wonderfontein-Low water bridge to Abe Bailey Nature Reserve Mooirivierloop [C2] 26°19'25" 27°21'15"C2H069Q01 9 Blaauwbank Mooirivierloop [C2] 26°22'32" 27°13'51"C2H158Q01 10 Blyvooruitzicht Gold Mine-discharge To Doornfontein canal east of Pw Blyvooruitzicht Gm-Fissure Water [C2] 26°23'15" 27°22'24"C2H159Q01 11 Doornfontein Gm-Gold Plant discharge in canal upstream Doornfontein excess Doornfontein Gm-Fissure Water [C2] 26°22'31" 27°20'12"C2H160Q01 12 Doornfontein Gold Mine-Number 3 Shaft discharge Doornfontein Gm-Fissure Water [C2] 26°25'29" 27°21'02"C2H161Q01 13 Turffontein-gravel road bridge to Muiskraal Mooirivierloop [C2] 26°26'05" 27°09'07"C2H162Q01 14 Gerhard Minnebron-Rysmierbult road bridge upstream of Boskop Dam Mooirivierloop [C2] 26°30'52" 27°07'29"C2H163Q01 15 Western Deep Levels-farm bridge downstream of No 7 Shaft Slimes Dam Varkenslaagte Spruit [C2] 26°26'06" 27°20'22"C2H164Q01 16 Buffelsdoorn-Elandsrand Gold Mine Elandsrand Gm-W Nursery Dam Overflow[C2] 26°26'44" 27°20'40"C2H165Q01 17 Deelkraal Gold Mine recreational dam overflow Deelkraal Dam-Outlet [C2] 26°27'18" 27°19'05"C2H166Q01 18 Buffelsdoorn-Johannesburg/Potchefstroom road bridge Buffelsdoorn Spruit [C2] 26°29'33" 27°22'24"C2H167Q01 19 Elandsfontein-Johannesburg/Potchefstroom road bridge Elandsfontein Spruit [C2] 26°27'24" 27°25'15"C2H168Q01 20 Kraalkop-Old Johannesburg/Potchefstroom road bridge Kraalkop Spruit [C2] 26°26'21" 27°29'56"C2H169Q01 21 Weltevreden-Losberg/Bank road bridge Loop Spruit [C2] 26°28'44" 27°32'22"C2H170Q01 22 Klipdrift Dam-Outflow into concrete irrigation canal Loop Spruit [C2] 26°37'01" 27°17'46"C2H171Q01 23 Gempost-Venterspost Gold Mine Pipe from No 5 Shaft Venterspos Gold Mine-Fissure Water [C2] 26°24'29" 27°10'42"ZLUIPAAR1 24 Plot 40 Luipaardsvlei-35m south east of farm house Borehole [C] 26°14'06" 27°44'49"ZCARLTON1 25 Plot No 9 Carltonville Borehole [C] 26°19'41" 27°22'24"ZWELVER1 26 Plot at Welverdiend Borehol [C] 26°22'13" 27°19'38"ZWELVER2 27 Welverdiend municipal water supply 2km south of Welverdiend Borehole [C] 26°23'54" 27°17'16"ZBLAAUB1 28 Blauubank 100m east of house Borehole] 26°23'03" 27°12'40"C2H013Q01 29 Turffontein Upper Turffontein Eye [C2] 26°24'29" 27°10'42"C2H011Q01 30 Gerhardminnebron Gerhardminnebron Eye [C2] 26°28'37" 27°09'09"ZWONDER1 31 Oog Van Wonderfontein 110 between piggery buildings Borehole [C] 26°17'41" 27°29'05"ZDEPAN1 32 Plot 84 De Pan Borehole [C] 26°15'38" 27°26'07"ZKRAALK1 33 Plot Kraalkop Borehole [C] 26°26'26" 27°28'40"C2H172Q01 34 Bovenste Oog Van Mooirivier Bovenste Oog [C2] 26°12'02" 27°09'45"C2H173Q01 35 Mooi River: Potchefstroom Purification Works-Western abstraction point from canal Boskop Dam-Outlet [C2] 26°39'37" 27°05'09"C2H174Q01 36 Mooi River: Potchefstroom Purification Works-eastern abstraction point Potchefstroom Dam-Outlet [C2] 26°39'42" 27°05'11"C2H175Q01 37 Harry's Dam (Uitspanning at Wonderfontein) Wonderfontein Spruit [C2] 26°20'10" 27°20'15"C2H176Q01 38 Doringdraai Dam Welverdiend Varkenslaagte Spruit [C2] 26°23'18" 27°16'27"C2H033Q01 39 Doornfontein Buffelsdoorn Spruit [C2] 26°26'12" 27°19'38"

2

4
Factors taken into account in the selection of the sites included:- the potential for large-scale drinking water use,- the identification of significant point-source discharges from mines,- the need to establish, as far as possible, natural background levels.
2.4 Sampling Frequency and Duration
Since, for chronic radiation exposures, it is the cumulative radiation dose that is important,doses to the public are normally integrated over a full year of exposure for the purposes ofassessment. The exact yearly dose from environmental radioactivity, which varies over time,particularly in water sources, can only be determined with high frequency monitoring, ideallyon a continuous basis. This was, however, not possible in practice due both to analyticalcapacity constraints and to budgetary constraints. A compromise had to be reached to ensurereasonable accuracy of the estimation of the integrated annual dose. Thus to achieve areasonable estimate of integrated annual radiation dose, a weekly sampling frequency and a25 week sampling duration was adopted for the first phase of the study (7 January to 25 June1997). Preliminary analysis of the data from the first phase of the study showed thatsignificant autocorrelation existed for the radioactivity data gathered at intervals of less thanone month (see Appendix 3). This implied that the sampling frequency could be reduced toonce a month without a significant loss in the ability to estimate the annual dose with areasonable degree of accuracy. Thus, during the second phase of the study (July toDecember 1997), data was gathered on a monthly rather than on a weekly basis.
2.5 Geological and Radiological Characteristics of the Catchment
Because gold mining was established in the Mooi River catchment long before radioactivitymeasurements were made, it was not possible to establish unequivocally the true naturalbackground level, especially as the natural ground water recharge constitutes a significantproportion of the base flow of the river. Recent gamma ray spectrometric surveys and a largebody of radioactivity measurements on geologically similar areas for airborne radiometricmapping of the environmental impact of gold and uranium mining in Gauteng Province, SouthAfrica, were also reported by Coetzee, H, (1995) [10]. The pertinent geological factors are asfollows:
• The dolomitic areas (most of the Mooi River catchment is underlain by dolomite) havevery low (~10% of crustal average) radio-element contents. These dolomites alsoconstitute the major groundwater source in the area.
• The quartzites and shales in the area tend to be enriched in potassium, uranium andthorium and consequently, the daughter nuclides of uranium and thorium reach levelsgenerally at 1.5-3 times the crustal average.
• The granites tend to contain slightly elevated uranium concentrations and elevatedpotassium and thorium concentrations.
The highest naturally occurring uranium series activities in the area are found in the gold reefsof the Witwatersrand Supergroup. These, however, are extremely limited in outcrop, generallysub-outcropping below hundreds or thousands of metres of younger cover rocks.
2.6 Variables Measured and Data Collected
2.6.1 Radionuclides
The three natural radioactive decay series of relevance are those headed by theradionuclides uranium-238, uranium-235 and thorium-232. Details of these decay series andan explanation of terms are given in Appendix 2. The radiological variables originallyrequested from the AEC for analysis were gross alpha activity and the individual activities ofuranium-238, radium-226 and thorium-232. The AEC contributed significantly to the study bydetermining, in addition, gross beta activity and the individual activities of radium-223, radium-224 and uranium-235. During the second phase of the study the number of radiologicalnuclides measured was increased to include polonium-210, lead-210, thorium-230, thorium-227, uranium-234, and radium-228. This was done in order to clarify uncertainties in the dose
5
calculated, relating to the non-equilibrium of nuclides with the parent nuclides in the waterphase. It was also decided that the protactinium-231 and actinium-227 in the water sampleshad to be determined on a limited set of samples.
Additional analyses on the last batch of samples were also performed. These analysisincluded radiological variables on the suspended solids that were left on the filter in thesamples.
The use of gross beta measurements for estimating the contributions of beta emitters to thetotal radiation dose could not be considered, because the measurements were deemed to beunreliable owing to analysis problems caused by the effects of water chemistry. The AECconcurred that the well-established gross beta measurement techniques used by them couldnot be regarded as suitable for the determination of very low beta activity concentrations inwaters characteristic of those sampled in this study. It was accordingly decided not to acceptthe gross beta data set, but rather to measure those beta emitters likely to contributesignificantly to the total ingestion dose, in phase two of the study. Beta emitters measuredincluded lead-210, radium-228, and actininium-227
The methods used for radiological analysis of the samples are given in Appendix 2.
2.6.2 Chemical Variables
Chemical variables, both major inorganic and trace metal constituents, were measured by theIWQS laboratories. The primary reason for collecting chemical variables was to establishwhether a relationship could be found between dose and the chemical variables, so as toanswer the question as to whether any of the chemical variables could be used as surrogateparameters.
The chemical variables measured were:
a. The following metals (dissolved fraction): aluminium, barium, bismuth, iron, manganese,lead, yttrium and germanium.
b. The following major inorganic determinands: pH, electrical conductivity, total alkalinity,sodium, potassium, calcium, magnesium, ammonium, chloride, fluoride, sulphate, nitrate+ nitrite (as N), phosphate as P, and silicate as Si.
The most significant of the chemical variables measured was possibly sulphate, which isformed by the oxidation of pyrite in the mine residue deposits, leading to acidic conditionsconducive to the mobilization of some radionuclides into water.
2.6.3 Other Data
Although the radiological data gathered in this study related primarily to radioactivity in thedissolved constituents of the water, limited data were gathered also on radioactivity in thesuspended solids. No data on environmental levels of radioactivity in sediments, river banks,vegetation or other possible elements of the human food chain were gathered. Instead,potential radiological impacts from exposure pathways other than drinking water wereestimated on an order-of-magnitude basis through the use of screening models.
Other data collected were flow and rainfall data where available. From the very limited riverflow and rainfall data that was available for the catchment, no correlation could be establishedwith the radiological data. Unfortunately very few radiation monitoring sites corresponded withflow gauging sites. In the few sites that did correspond, the flow was heavily influenced by manmade structures such as dams, weirs, canals and treatment works. This resulted in a highlymodified pattern of flow which displayed little or no correlation with radioactivity.
2.6.4 Access to Analytical Data
Analytical results collected during the study can be obtained from the Hydrological InformationSystem (HIS) of the Department of Water Affairs and Forestry. Requests for data from theHIS can be sent directly to:
6
Directorate: HydrologyDepartment of Water Affairs and ForestryPaterson 536Private Bag X313Pretoria 0001Tel: (012) 338 7500, ask for the Data Supply Section in Directorate: HydrologyFax: (012) 326 1488
The official departmental station numbers, provided elsewhere in the report (exampleC2H073) should be provided with all data requests. Data can be provided in an ASCII formatand files can be provided via e-mail.
2.7 Quality Control
A number of actions were taken to address quality control. As a quality control measure, splitsamples were analyzed by three laboratories, as part of phase two (Appendix 5). Theseconfirmed the accuracy of the radiological analyses.
The AEC conducted the radiometric analyses of the water samples for the study. As a CNS-recognised laboratory, the AEC adopts approved methods and procedures for analysis, andincorporates specific quality control methods. The quality control and validation done by theAEC’s Radioanalytical Laboratory is shown in Appendix 6.Measurements of uranium by both radiochemical and ICP-MS techniques, during the secondphase of the study, allowed comparisons to be made as an additional quality control check.The following good correlation for uranium concentration in mg/l was obtained by linearregression from the 98 samples analysed:
[U]ICP-MS = 0,993 x [U]Radiochemical - 0,563 (r2 = 0,906)
Thorium-232 was also measured by both techniques in the second phase, but a correlationbetween the two techniques could not be established because the ICP-MS measurementswere frequently at the lower limit of detection and therefore inapplicable.
In natural uranium, the activity ratio between uranium-238 and uranium-235 is 21,719. Thefollowing good correlations, between the data for the two isotopes, were obtained by linearregression:
Radiochemical (phase 2), 98 data: 238U / 235U = 21,341 ± 0,115 (r2 = 0,996)
ICP-MS (phase 1), 570 data: 238U / 235U = 20,785 ± 0,030 (r2 = 0,999)
ICP-MS (phase 2), 63 data: 238U / 235U = 22,171 ± 0,571 (r2 = 0,860)
3. BASIC RADIOLOGICAL CONSIDERATIONS
3.1 Exposure from Natural Background Radioactivity and Medical Procedures
Most of the ionizing radiation to which people are exposed comes from sources which arenatural features of the environment. These sources include radon gas and its decay productsin the atmosphere (originating from natural uranium in soil and rocks), gamma rays from theground, cosmic rays from outer space, naturally-occurring radioactivity in foodstuffs anddrinking water, derived from radionuclides in the soil, as well as inhalation of respirableairborne dust. The total radiation dose received by an individual, from these natural sources,is typically about 2,4 mSv/a (millisieverts per annum), but geological and geographical factorscan cause doses from any one of such sources to be elevated by a factor of 10 in high-background regions [3].
In addition to radiation from natural sources, man is exposed to radiation during medicaltreatment (X-rays, radiotherapy and nuclear medicine). Internationally, average doses toindividuals from all medical sources range from 0,07 mSv/a to 1,8 mSv/a [3].
7
Thus, a typical member of the public will receive, as a matter of course, a radiation dose ofbetween 2,5 and 4,2 mSv/a. In regions with high natural background, doses of 10 mSv/a arenot uncommon.
3.2 Exposure Pathways
Exposure of humans, to ionizing radiation, may occur via various routes or ‘pathways’ thatcan be grouped simply as:
- exposures to penetrating radiation from sources external to the body, and
- exposures to both penetrating and non-penetrating radiation from radioactivesubstances taken into the body by ingestion, inhalation, or absorption through theskin.
Exposures from water containing radioactive contaminants essentially occur internally throughingestion, either by direct consumption or indirectly by consumption of animal or vegetableproducts that have themselves taken up the water.
A detailed study of the potential major ingestion pathways, relevant to the Mooi Rivercatchment, revealed only two pathways with potential for giving rise to significant exposures (Appendix 7).
- direct ingestion resulting from regular and continuous use of the water for drinkingpurposes, and
- regular consumption of fish obtained from contaminated water bodies.
With respect to the latter, there is very little information on the bioaccumulation rates ofradionuclides in local fish species, and international experience shows that bioaccumulationcan vary by as much as three orders of magnitude. The fish pathway therefore requires moreresearch, and could not be addressed in the present study. Accordingly, the decision wastaken to address only the drinking water pathway in this study.
3.3 Health Effects of Ionizing Radiation
The process of ionization changes atoms and molecules. In cells, such changes may result indamage which, if not adequately repaired, may:
- prevent the cell from surviving or reproducing, or
- result in a viable but modified cell.
The two outcomes have profoundly different implications for the organism as a whole.
In the case of the former, the loss of large numbers of cells in a tissue can result in a loss intissue function. Such effects are known as deterministic effects, and are characterized by adose threshold above which the probability of causing harm increases steeply from zero to100%. Above the threshold, the severity of harm also increases with dose. Threshold dosesare generally two or three orders of magnitude above background doses, and deterministiceffects are thus only now seen in the case of accidents or as a side effect of medical radiationtherapy.
The outcome is very different if the irradiated cell is modified rather than killed. It may then beable to produce a clone of modified daughter cells which, in spite of the highly effectivedefence mechanisms within the body, may cause, after a prolonged and variable delay, amalignant condition - a cancer. The probability, but not the severity, of the cancer increaseswith dose. This effect is called stochastic (meaning of random or statistical nature).
Epidemiological studies have shown, with good statistical significance, that this dose-response relationship is linear for accumulated doses of more than about 200 mSv. It iswidely assumed that this linear relationship, with certain corrections, holds true also at lowerdoses, all the way down to zero - that is, there is no dose threshold for stochastic effects.This linear relationship yields, for low doses and dose rates, a nominal probability of fatal
8
cancer induction of 5 x 10⁻⁵ per mSv. Due to the high incidence of cancer induced by othercarcinogens, it will be difficult, if not impossible, to obtain conclusive epidemiological evidencesupporting this linear relationship at low doses. Some evidence suggests the opposite, in thatthere is actually a beneficial effect.
Stochastic effects can also take the form of hereditary effects which may be of many differentkinds and severity, and are expressed in the progeny of the exposed person. Although theexistence of hereditary effects in man is not in doubt, the risk estimates appear to be so smallthat it is not surprising that epidemiology has not yet detected hereditary effects of radiation inhumans with a statistically significant degree of confidence.
Notwithstanding the fact that there is no evidence of statistically significant health effectsassociated with exposure to low levels of radiation, the internationally accepted principle is tokeep radiation exposures as low as reasonably achievable.
3.4 Radiation Protection Principles and the System of Radiation Protection
Internationally a system of radiation protection has been agreed upon, based on the healtheffects described in section 3.3. This system has been recommended by the InternationalCommission on Radiological Protection (ICRP), which is a non-governmental scientificorganization that has been publishing this and related recommendations for over half acentury. Different countries evaluate and implement the recommendations in a manner that isappropriate to their circumstances.
The following recommendations of the ICRP [4] are based on the assumption that there isindeed a linear non-threshold relationship between radiation dose and the probability ofcontracting cancer. Central to the system of radiation protection for proposed and continuinghuman activities that increase exposure to radiation are the following general principles:
1. No activity, which results in the exposure of persons to radiation, should be adoptedunless the activity produces a net positive benefit.
2. All radiation doses should be kept as low as reasonably achievable (ALARA), takingeconomic and social factors into account.
3. The radiation doses should not exceed limits recommended by the ICRP.
For situations where the sources of exposure are already in place and radiation protectionhas to be considered retrospectively, remedial action to reduce the exposures should bebased on the following general principles:
a) The remedial action should be justified in the sense that the costs, including socialcosts, should be more than offset by the reduction in radiation dose likely to beachieved.
b) The form, scale and duration of the remedial action should be optimized so that thenet benefit to society is maximized.
To apply the above principles to, for instance, radioactivity in water, it is necessary tocalculate the radiation doses which result from the use of the water.
3.5 Calculation of Dose for the Drinking Water Ingestion Pathway
The annual radiation dose from any given radionuclide and for any given age group isexpressed as:
Annualdose
(mSv/a) =
Activityconcentration
(Bq/l)X
Annualconsumption
(l/a)X
DoseConversion
Factor
(mSv/Bq)
9
The total radiation dose for that age group is, then, the sum of the doses from individualradionuclides. This implies that the activity concentration of every radionuclide must beknown. However, it was not feasible to measure every radionuclide, and this had to be takeninto account in the calculation of age group specific doses. The method used to calculatelifetime average doses doses in this report is given in Appendix 8.
Two methods (IWQS and AEC) are presented in the Appendices for calculating the dose.Both need to address the problem that fewer nuclides were measured in the first phase thanin the second. The so-called IWQS method handled this problem in two ways :-
1. Where a suitable set of predictor variables (chemical or radioactive) could be found,the missing nuclides were regressed onto a set of predictor variables. The multilinearregression was used to predict what the value of the nuclide was during the firstphase.
2. Where no set of predictor variables could be found that performed better than justusing the average, the average value was used.
The so called AEC method handled this problem by regressing, for the period of Phase II,those nuclides measured in Phase I onto the dose calculated from all the nuclides measuredin Phase II. This regression was used to predict the dose for Phase I. The IWQS and AECmethods differed in the assumptions used of how to deal with unmeasured nuclides.
The second problem that needed to be addressed by both methods was the fact that even inPhase II, not all the nuclides in the decay chains were measured. The so-called IWQSmethod took a simpler approach to this for the purpose of estimating the uncertainty in thedose arising from not measuring these nuclides. The IWQS method simply assumed that allthe unmeasured nuclides had the same value. This implied that the uncertainty remaining inthe dose due to the unmeasured nuclides was about 0,003 mSv/a. The AEC method had amore advanced model, based on which nuclide was related to which other via a decay chainof the shortest half-life.
3.5.1 Dose Conversion Factor
Each of the radionuclides in the three decay chains of interest has its own ‘dose conversionfactor’ (DCF) for the ingestion pathway, relating the dose received, in mSv, to the amount ofradioactivity ingested, in Bq (becquerels, or number of nuclear disintegrations per second).The DCFs used are those published by the International Atomic Energy Agency (IAEA) [5].The IAEA gives different dose conversion factors for the various age groups. There arevarious ways in which the exposure dose per year for the various age groups can becombined. Investigation into the possible ways in which to combine the age groups specificdoses showed that differences for the various ways of determining lifetime exposure were infact trivial, and a “lifetime average” method was adopted for the purposes of this study.
3.5.2 Activity Concentration
In many solid materials such as rocks and soil, the mobility of the elements in the decaychains is limited, even over long periods of time, and the mixture of radionuclides is thereforerelatively undisturbed. In such cases, the radionuclides may be said to be in secularequilibrium, meaning that all the radionuclides in a given decay chain have similar activityconcentrations.
In water systems, however, the dissolution and precipitation characteristics of the variousdecay chain elements may differ significantly, leading to a high degree of disequilibrium.Assumptions of equilibrium are, therefore, no longer valid. On the other hand, measurementof the activity concentration of every single radionuclide is neither economically feasible nornecessary in order to obtain a reasonable estimate of the ingestion dose. Certainradionuclides will contribute very little to the overall radiation dose because they have verysmall DCFs and / or their parents may be present only at very low activity concentrations.
In the first phase of the study, the parent radionuclides of the three decay series, plus thethree radium isotopes radium-226, radium-223 and radium-224 that occur near the mid-points
10
of each series, were measured. In addition, uranium-234 was assumed to be in equilibriumwith uranium-238 on the basis of results from other studies [6]. From the results of this firstphase, it was established that only three radionuclides of major importance remainedunaccounted for: thorium-230, lead-210 and polonium-210. These were measured in phase 2of the study, together with three radionuclides of lesser importance: actinium-227,protactinium-231 and radium-228, and, therefore, made it possible to calculate the estimatedannual dose with a high degree of certainty.
Consideration was initially given to the use of gross alpha measurements for estimating thedose contributions from the radionuclides that were not individually measured. In practice,however, the uncertainties inherent in the determination of gross alpha activity, typicallyaround 20% to 30%, lead to unacceptably large uncertainties in the final dose determination.
The use of gross beta measurements for estimating the contributions of beta emitters to thetotal radiation dose could not be considered, because the measurements were deemed to beunreliable owing to elevation of the beta measurements caused by water chemistry. The AECconcurred that the well-established gross beta measurement techniques used by them couldnot be regarded as suitable for the determination of the very low beta levels in the waterscharacteristic of those sampled in this study. It was accordingly decided not to use the grossbeta data in dose calculation, but rather to directly measure the more important beta emitters,with the highest dose conversion factors during the second phase of the study.
4. DRINKING WATER QUALITY CONSIDERATIONS
From the preliminary screening surveys [1,2] uranium was found to be the main radioactiveelement present, and has both a potential for a chemical toxicity and a radiological hazard.Current DWAF Water Quality Guidelines [7] give criteria for uranium-238 concentrations indrinking water. These criteria are based on the chemical toxicity of uranium to the kidneyrather than its radiological toxicity.
From a radiological perspective, it is the total radiation dose from all radionuclides in the waterthat is important, and the Technical Committee has proposed interim guidelines in this regard,taking into account the following:
(i) The World Health Organization (WHO) recommends a reference level for radiationdose, received from the continuous consumption of drinking water for a full year, of0,1 mSv/a [8]. This value is only about 5% of the dose from the total naturalbackground, and can therefore be regarded as an ideal situation. From section 3.3 itcan be deduced that, on the conservative basis of the linear non-threshold theory, aradiation dose of 0,1 mSv/a represents a probability of attributable fatal cancer of 4 in10 000 over a 70 year lifetime. By contrast, cancer from all causes is responsible forabout 2 000 in 10 000 deaths, it thus being evident that, for the WHO reference levelof 0,1 mSv/a, the increase in the probability of cancer induction, if it exists at all, isinsignificantly small.
(ii) The dose limit to members of the public due to all anthropogenic sources is currentlyrecommended internationally at 1 mSv/a [4,5], and this has been implemented inseveral countries. This value is based on acceptance of the linear non-thresholdtheory, and can therefore be regarded as conservative.
(iii) The dose limit for members of the public, recommended internationally, waspreviously 5 mSv/a, and many countries still adopt this limit. It is common practice inuranium mining remedial action programmes to design the programmes such thatcompliance with the 5 mSv/a limit is achieved in the short term, and with the 1 mSv/alimit in the longer term.
(iv) Dose limits to members of the public relate to the combined effect of all exposuresfrom human activities. It is common practice to place a dose constraint on releasesfrom individual facilities. Such a constraint is normally set at some fraction of thedose limit of 1mSv/a - commonly of the order of 0,25 mSv/a, i.e., allowing for thecombined dose from up to four separate facilities on a single individual not exceedingthe 1mSv/a limit. Although this approach is intended for new rather than existingoperations, it may have some relevance to water systems in gold mining areas in that
11
it embodies the concept of allowing for doses from other sources of exposure withoutcausing the 1 mSv/a dose limit to be exceeded. The reference value of 0,25 mSv/a isthe dose limit already imposed by the CNS on individual mines in the Mooi Rivercatchment.
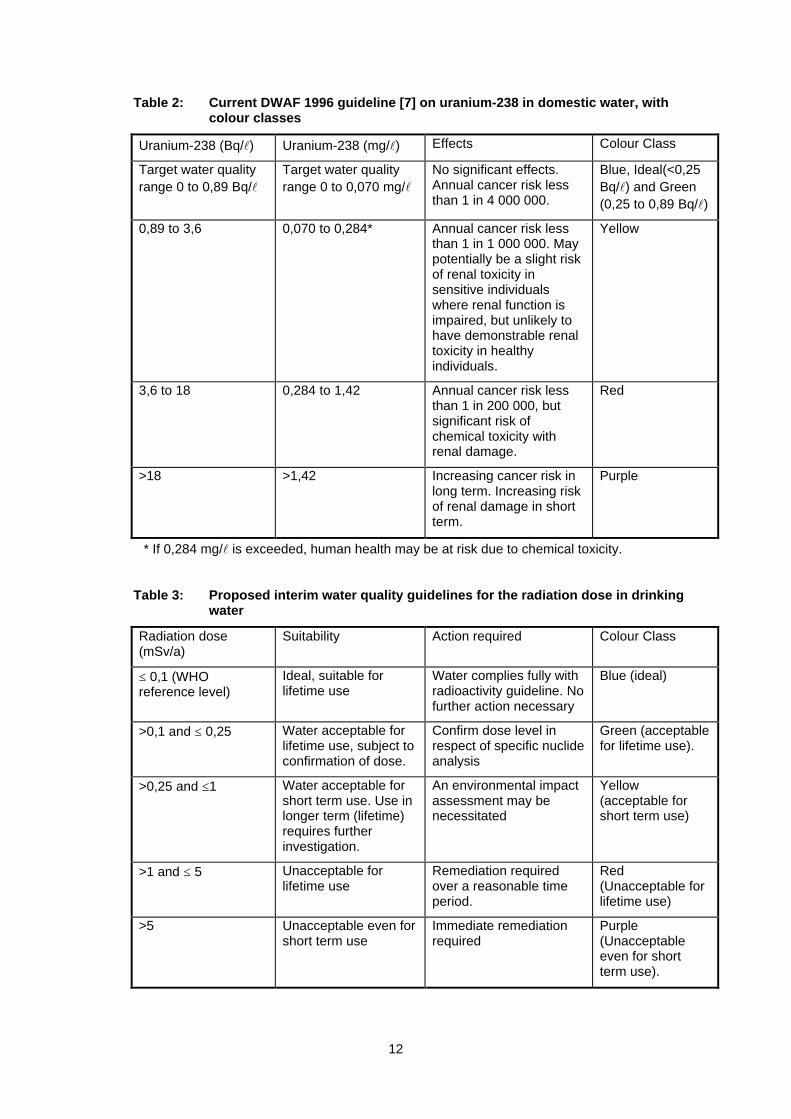
Table 2 gives information on the DWAF guidelines for uranium, while Table 3 embodies theproposed guidelines on radiation dose in drinking water. The DWAF guidelines have takeninto consideration all the above limits for the protection of the public from anthropogenicsources of radiation.
The basis for the colour coded classification system was chosen to be in line with theapproach used in the joint Assessment Guide, published by DWAF, the Department of Health,and the Water Research Commission [9]. The meaning of the colour classes for chemicalconstituents given in this DWAF/DOH/WRC guide are as follows:
• Blue, class 0 = Ideal water quality. Suitable for lifetime use.
• Green, class I = Good water quality. Suitable for use, rare instances of negativeeffects.
• Yellow, class II = Marginal water quality. Conditionally acceptable. Negative effectsmay occur in some sensitive groups.
• Red, class III = Poor water quality. Unsuitable for use without treatment. Chroniceffects may occur.
• Purple, class IV = Dangerous water quality. Totally unsuitable for use. Acute effectsmay occur.
The practical meaning intended for interpretation of the classes is that “blue” or “green” wateris fit for lifetime use without any further questions. Yellow class or marginal water, is however,only fit for interim use, and should not be used for a lifetime if at all possible. Red and purpleclass water are seen as unfit for use.
12
Table 2: Current DWAF 1996 guideline [7] on uranium-238 in domestic water, withcolour classes
Uranium-238 (Bq/l) Uranium-238 (mg/l) Effects Colour Class
Target water qualityrange 0 to 0,89 Bq/l
Target water qualityrange 0 to 0,070 mg/l
No significant effects.Annual cancer risk lessthan 1 in 4 000 000.
Blue, Ideal(<0,25Bq/l) and Green(0,25 to 0,89 Bq/l)
0,89 to 3,6 0,070 to 0,284* Annual cancer risk lessthan 1 in 1 000 000. Maypotentially be a slight riskof renal toxicity insensitive individualswhere renal function isimpaired, but unlikely tohave demonstrable renaltoxicity in healthyindividuals.
Yellow
3,6 to 18 0,284 to 1,42 Annual cancer risk lessthan 1 in 200 000, butsignificant risk ofchemical toxicity withrenal damage.
Red
>18 >1,42 Increasing cancer risk inlong term. Increasing riskof renal damage in shortterm.
Purple
* If 0,284 mg/l is exceeded, human health may be at risk due to chemical toxicity.
Table 3: Proposed interim water quality guidelines for the radiation dose in drinkingwater
Radiation dose(mSv/a)
Suitability Action required Colour Class
≤ 0,1 (WHOreference level)
Ideal, suitable forlifetime use
Water complies fully withradioactivity guideline. Nofurther action necessary
Blue (ideal)
>0,1 and ≤ 0,25 Water acceptable forlifetime use, subject toconfirmation of dose.
Confirm dose level inrespect of specific nuclideanalysis
Green (acceptablefor lifetime use).
>0,25 and ≤1 Water acceptable forshort term use. Use inlonger term (lifetime)requires furtherinvestigation.
An environmental impactassessment may benecessitated
Yellow(acceptable forshort term use)
>1 and ≤ 5 Unacceptable forlifetime use
Remediation requiredover a reasonable timeperiod.
Red(Unacceptable forlifetime use)
>5 Unacceptable even forshort term use
Immediate remediationrequired
Purple(Unacceptableeven for shortterm use).
13
5. DISCUSSION OF RESULTS
5.1 Annual Doses within the Mooi River Catchment for the Drinking Water Exposure Route
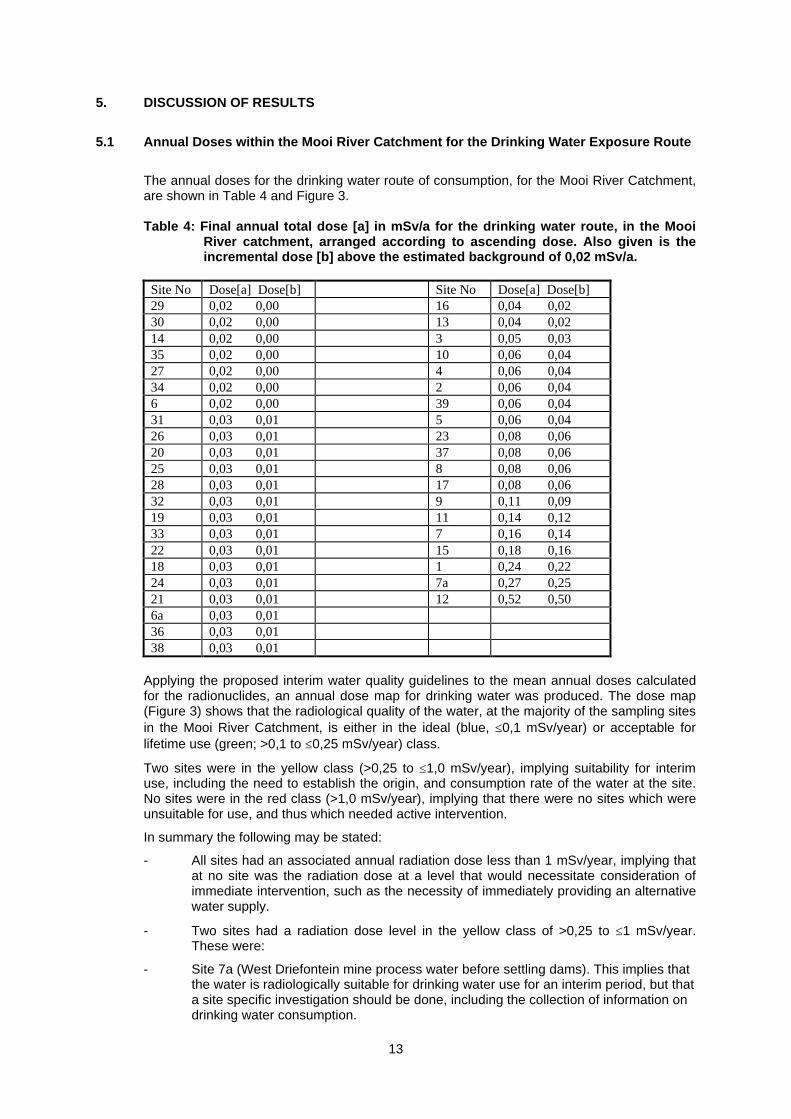
The annual doses for the drinking water route of consumption, for the Mooi River Catchment,are shown in Table 4 and Figure 3.
Table 4: Final annual total dose [a] in mSv/a for the drinking water route, in the MooiRiver catchment, arranged according to ascending dose. Also given is theincremental dose [b] above the estimated background of 0,02 mSv/a.
Site No Dose[a] Dose[b] Site No Dose[a] Dose[b]29 0,02 0,00 16 0,04 0,0230 0,02 0,00 13 0,04 0,0214 0,02 0,00 3 0,05 0,0335 0,02 0,00 10 0,06 0,0427 0,02 0,00 4 0,06 0,0434 0,02 0,00 2 0,06 0,046 0,02 0,00 39 0,06 0,0431 0,03 0,01 5 0,06 0,0426 0,03 0,01 23 0,08 0,0620 0,03 0,01 37 0,08 0,0625 0,03 0,01 8 0,08 0,0628 0,03 0,01 17 0,08 0,0632 0,03 0,01 9 0,11 0,0919 0,03 0,01 11 0,14 0,1233 0,03 0,01 7 0,16 0,1422 0,03 0,01 15 0,18 0,1618 0,03 0,01 1 0,24 0,2224 0,03 0,01 7a 0,27 0,2521 0,03 0,01 12 0,52 0,506a 0,03 0,0136 0,03 0,0138 0,03 0,01
Applying the proposed interim water quality guidelines to the mean annual doses calculatedfor the radionuclides, an annual dose map for drinking water was produced. The dose map(Figure 3) shows that the radiological quality of the water, at the majority of the sampling sitesin the Mooi River Catchment, is either in the ideal (blue, ≤0,1 mSv/year) or acceptable forlifetime use (green; >0,1 to ≤0,25 mSv/year) class.
Two sites were in the yellow class (>0,25 to ≤1,0 mSv/year), implying suitability for interimuse, including the need to establish the origin, and consumption rate of the water at the site.No sites were in the red class (>1,0 mSv/year), implying that there were no sites which wereunsuitable for use, and thus which needed active intervention.
In summary the following may be stated:
- All sites had an associated annual radiation dose less than 1 mSv/year, implying thatat no site was the radiation dose at a level that would necessitate consideration ofimmediate intervention, such as the necessity of immediately providing an alternativewater supply.
- Two sites had a radiation dose level in the yellow class of >0,25 to ≤1 mSv/year.These were:
- Site 7a (West Driefontein mine process water before settling dams). This implies thatthe water is radiologically suitable for drinking water use for an interim period, but thata site specific investigation should be done, including the collection of information ondrinking water consumption.
14
- Site 12 (Doornfontein gold mine service water). It was determined that this site driedup, and that water was no longer being discharged. The radionuclide input to thesurface water from this site ceased for the further duration of the 1997 monitoringsurvey.
- Five of the sites were in the green class (acceptable for lifetime use), with radiationdose levels between >0,1 and ≤0,25 mSv/year.
- The large majority of the sites monitored (34 sites) had insignificant radiation doselevels, and complied fully with the World Health Organization’s ideal screeningguideline for radioactivity in drinking water of ≤0,1 mSv/year. With respect to thosesites at which there was no radiation problem from a drinking water point of view, itwas noteworthy that such sites included:
(i) The two raw water intakes for drinking water treatment to the town ofPotchefstroom.
(ii) Most of the groundwater sites, including the Gerhardminnebron, and theTurffontein eye.
(iii) The drinking water supply borehole of Welverdiend in the municipality ofCarletonville.
(iv) All but two of the mine water discharge points.
5.2 Discussion of Predominance of Uranium
The results of the monitoring in the Mooi River catchment have shown that of theradionuclides measured, the parent radioactive element uranium, is responsible for the majorportion of the measured alpha activity.
A map representing the measured uranium-238 chemical toxicity values is given in Figure 4,with the proposed colour classes. It can be seen immediately from this map that at the lowerend of the catchment the sites are all in the ideal (blue) class, and that specifically the waterof Potchefstroom is in the ideal class. The great majority of the sampling sites in thecatchment were acceptable as far as uranium is concerned, with only 7 sites requiring furtherinvestigation from the viewpoint of uranium chemical toxicity (6 in the yellow class and 1 in thered class). The six sites in the yellow class for uranium chemical toxicity were:
- Site 1: Luipardsvlei.
- Site 7a: West Driefontein process water.
- Site 7: West Drienfontein transfer water.
- Site 11: Doornfontein Gold plant discharge in canal, upstream Doornfontein
- Site 15: Western Deep levels farm bridge down stream, no 7 Shaft Slimes dam.
- Site 9: Mooirivierloop at Blaubank.
The single site in the red class for uranium chemical toxicity was site 12: Doornfontein GoldMine no 3 shaft discharge.
It is noticeable from Figure 4, that the majority of sites of elevated uranium concentrationoccur around the centre of the Mooi River catchment, with the concentrations againdecreasing as the river flows further west on course to Boskop Dam. It is debatable what thereasons are for the decrease in uranium concentration after the initial increase around themiddle section of the Mooi River. It is noticeable that the sites with elevated uraniumconcentrations almost all have contributions from mine water. Important attenuatingmechanisms downstream of the points of contamination are probably a combination ofsediment adsorption and dilution effects.
15
The majority of the sites not complying with the chemical drinking water criterion for uraniumare associated directly with discharges from gold mining activities.
5.3 Annual Radiation Dose from Background Radiation Levels in Water
The radiation dose arising from the ingestion of the water at the various sampling locations ismade up of two components, the dose attributable to background radioactivity in the waterand the dose attributable to the additional radioactivity originating from mining activities in theregion. As explained in section 2.5, it is not possible to establish unequivocally thebackground radioactivity levels in the water. However, for some sampling locations theradioactivity levels were very low, and the dose corresponding to these levels was about 0,02mSv/year. For one of those sampling locations (C2H172Q01, site no. 34), there is nopossibility of upstream mining influence. It can be assumed, therefore that a value of 0,02mSv/year represents an upper bound value for the annual ingestion dose arising frombackground radioactivity in water. World wide reference values for non-elevated levels of naturally occurring radionuclides inwater [3] correspond to an annual ingestion dose of between 0,01 and 0,02 mSv/year. It was therefore assumed for the purposes of this investigation that the annual radiation doseattributable to background radioactivity in water was 0,02 mSv/year. It will be seen from theresults presented in Table 4 that this value is so small that the uncertainty in its estimation isnot critical to the outcome of the investigation.
5.4 Relationship between Uranium Concentration and the Annual Dose
The IWQS (Appendix 8) and AEC (Appendix 9) methods of calculating mean annual dose ateach site, while they differed in the assumptions used to deal with unmeasured nuclides,nevertheless gave very similar results, and essentially verified one another.
As shown in Appendices 8 and 9, an excellent linear correlation exists between the annualmean uranium concentration at a site and the annual radiation dose for the drinking waterroute at that same site. This correlation holds for the Mooi River catchment, but it should benoted that it may not hold equally well for other catchments due to possible differences inradiochemical water quality characteristics.
For all sites in the Mooi River catchment, the following correlation between uranium in µg/land the total average annual lifetime dose in mSv/a was found:
D = 0,0012895 Cu + 0,02128 (r2 = 0,98)
Where D is the annual radiation dose from continuous drinking water use in mSv/year,
And Cu is the uranium concentration in the water in µg/l.
The implication of the existence of this correlation is that for further monitoring purposes in theMooi River catchment, only the uranium concentration need be measured, from which the allnuclide dose can be accurately estimated. To illustrate the high degree of accuracy withwhich the total annual radiation dose from drinking water may be estimated from the uraniumconcentration alone, a comparison of the total dose calculation from the full nuclide analyses(dose[a]) as compared to the all nuclide dose as estimated from the uranium concentrationalone (dose[c]) is shown in Table 5.
16
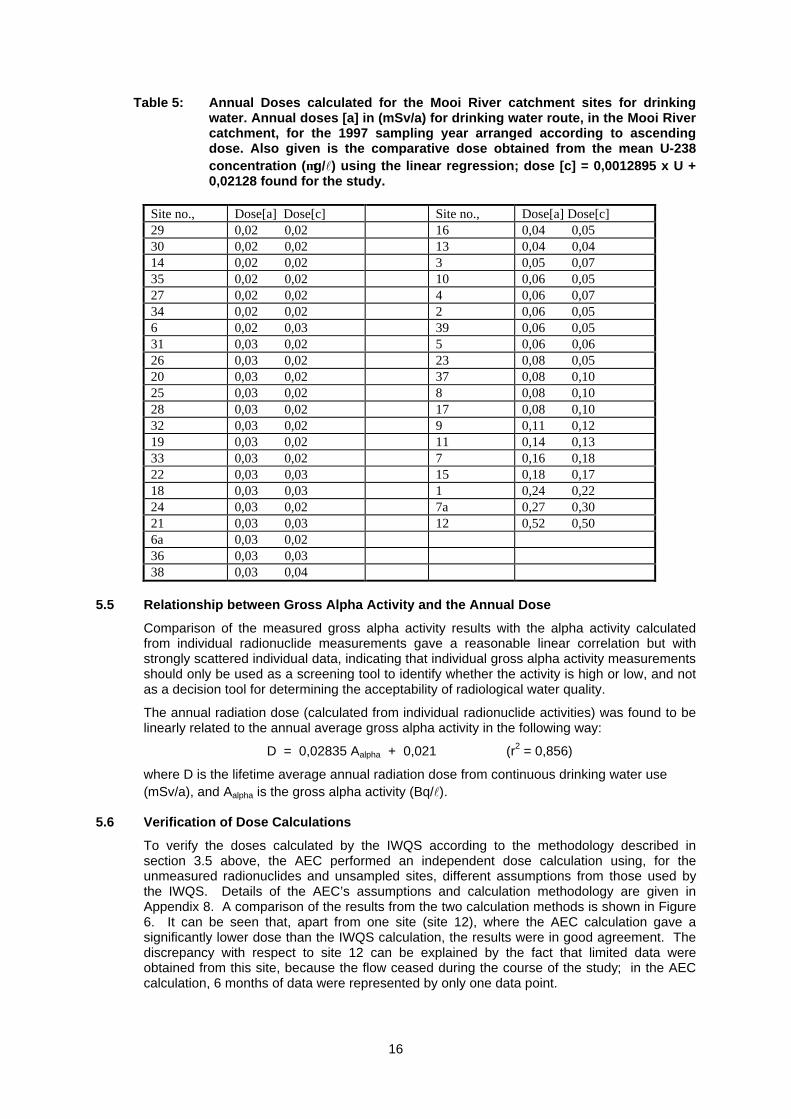
Table 5: Annual Doses calculated for the Mooi River catchment sites for drinkingwater. Annual doses [a] in (mSv/a) for drinking water route, in the Mooi Rivercatchment, for the 1997 sampling year arranged according to ascendingdose. Also given is the comparative dose obtained from the mean U-238concentration (µg/l) using the linear regression; dose [c] = 0,0012895 x U +0,02128 found for the study.
Site no., Dose[a] Dose[c] Site no., Dose[a] Dose[c] 29 0,02 0,02 16 0,04 0,05 30 0,02 0,02 13 0,04 0,04 14 0,02 0,02 3 0,05 0,07 35 0,02 0,02 10 0,06 0,05 27 0,02 0,02 4 0,06 0,07 34 0,02 0,02 2 0,06 0,05 6 0,02 0,03 39 0,06 0,05 31 0,03 0,02 5 0,06 0,06 26 0,03 0,02 23 0,08 0,05 20 0,03 0,02 37 0,08 0,10 25 0,03 0,02 8 0,08 0,10 28 0,03 0,02 17 0,08 0,10 32 0,03 0,02 9 0,11 0,12 19 0,03 0,02 11 0,14 0,13 33 0,03 0,02 7 0,16 0,18 22 0,03 0,03 15 0,18 0,17 18 0,03 0,03 1 0,24 0,22 24 0,03 0,02 7a 0,27 0,30 21 0,03 0,03 12 0,52 0,50 6a 0,03 0,02 36 0,03 0,03 38 0,03 0,04
5.5 Relationship between Gross Alpha Activity and the Annual Dose
Comparison of the measured gross alpha activity results with the alpha activity calculatedfrom individual radionuclide measurements gave a reasonable linear correlation but withstrongly scattered individual data, indicating that individual gross alpha activity measurementsshould only be used as a screening tool to identify whether the activity is high or low, and notas a decision tool for determining the acceptability of radiological water quality.
The annual radiation dose (calculated from individual radionuclide activities) was found to belinearly related to the annual average gross alpha activity in the following way:
D = 0,02835 Aalpha + 0,021 (r2 = 0,856)
where D is the lifetime average annual radiation dose from continuous drinking water use(mSv/a), and Aalpha is the gross alpha activity (Bq/l).
5.6 Verification of Dose Calculations
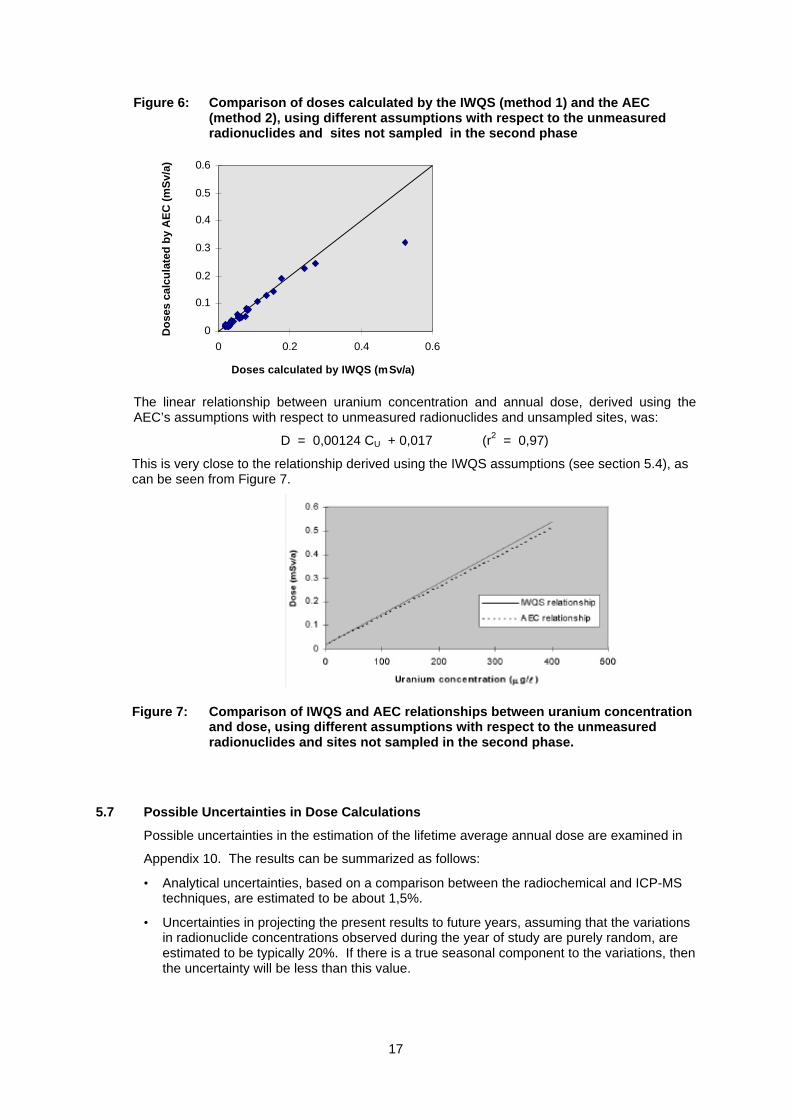
To verify the doses calculated by the IWQS according to the methodology described insection 3.5 above, the AEC performed an independent dose calculation using, for theunmeasured radionuclides and unsampled sites, different assumptions from those used bythe IWQS. Details of the AEC’s assumptions and calculation methodology are given inAppendix 8. A comparison of the results from the two calculation methods is shown in Figure6. It can be seen that, apart from one site (site 12), where the AEC calculation gave asignificantly lower dose than the IWQS calculation, the results were in good agreement. Thediscrepancy with respect to site 12 can be explained by the fact that limited data wereobtained from this site, because the flow ceased during the course of the study; in the AECcalculation, 6 months of data were represented by only one data point.
17
Figure 6: Comparison of doses calculated by the IWQS (method 1) and the AEC(method 2), using different assumptions with respect to the unmeasuredradionuclides and sites not sampled in the second phase
0
0.1
0.2
0.3
0.4
0.5
0.6
0 0.2 0.4 0.6
Doses calculated by IWQS (mSv/a)
Do
ses
calc
ula
ted
by
AE
C (
mS
v/a)
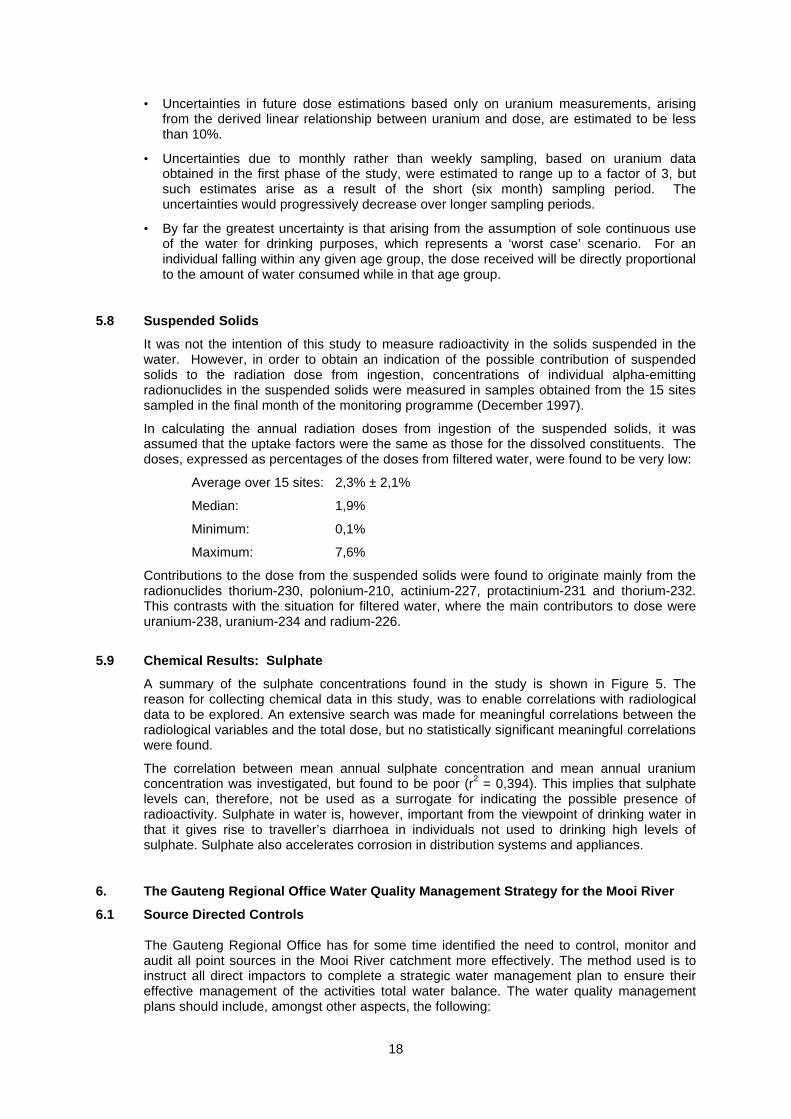
The linear relationship between uranium concentration and annual dose, derived using theAEC’s assumptions with respect to unmeasured radionuclides and unsampled sites, was:
D = 0,00124 CU + 0,017 (r2 = 0,97)
This is very close to the relationship derived using the IWQS assumptions (see section 5.4), ascan be seen from Figure 7.
Figure 7: Comparison of IWQS and AEC relationships between uranium concentration
and dose, using different assumptions with respect to the unmeasuredradionuclides and sites not sampled in the second phase.
5.7 Possible Uncertainties in Dose Calculations
Possible uncertainties in the estimation of the lifetime average annual dose are examined in
Appendix 10. The results can be summarized as follows:
• Analytical uncertainties, based on a comparison between the radiochemical and ICP-MStechniques, are estimated to be about 1,5%.
• Uncertainties in projecting the present results to future years, assuming that the variationsin radionuclide concentrations observed during the year of study are purely random, areestimated to be typically 20%. If there is a true seasonal component to the variations, thenthe uncertainty will be less than this value.
18
• Uncertainties in future dose estimations based only on uranium measurements, arisingfrom the derived linear relationship between uranium and dose, are estimated to be lessthan 10%.
• Uncertainties due to monthly rather than weekly sampling, based on uranium dataobtained in the first phase of the study, were estimated to range up to a factor of 3, butsuch estimates arise as a result of the short (six month) sampling period. Theuncertainties would progressively decrease over longer sampling periods.
• By far the greatest uncertainty is that arising from the assumption of sole continuous useof the water for drinking purposes, which represents a ‘worst case’ scenario. For anindividual falling within any given age group, the dose received will be directly proportionalto the amount of water consumed while in that age group.
5.8 Suspended Solids
It was not the intention of this study to measure radioactivity in the solids suspended in thewater. However, in order to obtain an indication of the possible contribution of suspendedsolids to the radiation dose from ingestion, concentrations of individual alpha-emittingradionuclides in the suspended solids were measured in samples obtained from the 15 sitessampled in the final month of the monitoring programme (December 1997).
In calculating the annual radiation doses from ingestion of the suspended solids, it wasassumed that the uptake factors were the same as those for the dissolved constituents. Thedoses, expressed as percentages of the doses from filtered water, were found to be very low:
Average over 15 sites: 2,3% ± 2,1%
Median: 1,9%
Minimum: 0,1%
Maximum: 7,6%
Contributions to the dose from the suspended solids were found to originate mainly from theradionuclides thorium-230, polonium-210, actinium-227, protactinium-231 and thorium-232.This contrasts with the situation for filtered water, where the main contributors to dose wereuranium-238, uranium-234 and radium-226.
5.9 Chemical Results: Sulphate
A summary of the sulphate concentrations found in the study is shown in Figure 5. Thereason for collecting chemical data in this study, was to enable correlations with radiologicaldata to be explored. An extensive search was made for meaningful correlations between theradiological variables and the total dose, but no statistically significant meaningful correlationswere found.
The correlation between mean annual sulphate concentration and mean annual uraniumconcentration was investigated, but found to be poor (r2 = 0,394). This implies that sulphatelevels can, therefore, not be used as a surrogate for indicating the possible presence ofradioactivity. Sulphate in water is, however, important from the viewpoint of drinking water inthat it gives rise to traveller’s diarrhoea in individuals not used to drinking high levels ofsulphate. Sulphate also accelerates corrosion in distribution systems and appliances.
6. The Gauteng Regional Office Water Quality Management Strategy for the Mooi River
6.1 Source Directed Controls
The Gauteng Regional Office has for some time identified the need to control, monitor andaudit all point sources in the Mooi River catchment more effectively. The method used is toinstruct all direct impactors to complete a strategic water management plan to ensure theireffective management of the activities total water balance. The water quality managementplans should include, amongst other aspects, the following:
19
§ Water quality management measures in order to minimise pollution should beimplemented at source. The fundamental principle is to prevent, inhibit, retard or stop thehydrological, chemical, microbiological, radioactive or thermodynamic processes, whichresult in the contamination of the water environment.
§ If the water/waste water problems cannot be solved by the above water quality
management measures at source, water/waste water reuse and minimisation measuresshould be implemented. This includes the prevention of the inflow of ground and surfacewater into the industry and mining related activities.
§ If the water/waste water problems cannot be solved by reuse and minimisation measures,
then water/waste water treatment applications should be implemented.
It should be appreciated that all of the above entails intensive negotiations between therelevant role players including catchment forums, consultants and specialists wherenecessary. This ensures participation, collaboration and transparency in decision making.
6.2 Water User Assessments
To assess the extent of water use in the catchment, impactors were requested to initiate, incollaboration with the Region, water user assessments in the catchment. The results arecaptured in Appendix 1.
6.3 Actions taken at Sites 7a and 12
The application of water quality management measures has resulted in specific actions beingtaken to address the sites showing elevated levels of radioactivity. These are as follows:
§ West Driefontein Gold Mine (Site 7a)
The source of the water at Site 7a is excess mine water which is a mixture of recycledunderground water, stormwater and final sewage effluent. The mine is currently investigatingall options to control at source, reuse and minimise their excess water. This investigationincludes the quantification of their total impact on the water environment.
§ Doornfontein Gold Mine (Site 12)
The source of the water at Site 12 is excess mine water which is a mixture of recycledunderground water and fissure water. The mine has investigated all options to control atsource, reuse and minimise their excess water. This investigation included the quantificationof their total impact on the water environment. The permit application was lodged atDepartment of Water Affairs and Forestry in December 1998.
Both these sites have been identified as currently not posing a threat for use as drinking waterin the short term. Further investigation will be required to establish whether the water qualityis radiologically acceptable in the long term.
6.4 Monitoring
As part of their functions in the catchment the Gauteng Region undertakes river and auditmonitoring at point sources. The analysis of chemical uranium at specifically identified siteswas initiated during phase 1 of the study. Following phase 1 of the study the routinemonitoring program has been extended to include the sites of elevated activity.
20
7. CONCLUSIONS AND RECOMMENDATIONS
7.1 General ConclusionsThe aim of the radioactivity monitoring programme in the Mooi River was to address the riskof radioactivity in water to human health, and to determine the total dose from surface andsome ground water sources that are, or could be, used potentially as drinking water supplies.After a year of data collection, the results showed that of the 41 monitoring sites covered bythe study, 39 sites exhibited a water quality that is ideal or acceptable for continuous lifetimeuse in terms of proposed interim water quality guidelines for radioactivity in drinking water. Atthe two remaining sites, both of which are associated with the discharge of water from goldmining activities, the elevation of radionuclides is such that the water is still radiologicallyacceptable for use as drinking water in the short term, but further investigation would berequired to establish whether the water quality is radiologically acceptable in the longer term.It should be noted that at no site was the radiological quality such that immediate remediationwas called for.
7.2 Municipal Water Supplies
The only water in the Mooi River catchment used as a source of municipal drinking water isthat supplied to Potchefstroom from the Mooi River and the ground water supplied toWelverdiend in the municipality of Carletonville. In both cases, there was no significantelevation of radioactivity above background levels, and the water falls into the ‘ideal’classification in terms of proposed interim water quality guidelines for radioactivity in drinkingwater.
7.3 Indicators of Radiological Water Quality
The search for simple indicators of radiological quality revealed the following:
(a) Some correlation exists between annual mean gross alpha activity and annual radiationdose from ingestion, but is not particularly strong.
(b) The correlation between gross beta activity and radiation dose is poor.
(c) Although waters with elevated radioactivity levels generally exhibit elevated sulphateconcentrations, the converse is not always true. Consequently, sulphate concentration isnot a reliable indicator of radiological water quality.
(d) An excellent linear correlation exists between annual mean uranium concentration andthe annual radiation dose from ingestion. The best-fit linear relationship for the datagathered in this study is given by:
D = 0,0012895 CU + 0,02128 (r2 =0,98)
where: D = average lifetime annual radiation dose from continuous drinking water use(mSv/a)
CU = uranium concentration in the water (µg/l)
The estimated uncertainty arising from the use of this relationship to predict annual radiationdoses arising from the use of waters in the Mooi River catchment for continuous drinkingpurposes is less than 10%.
It remains to be seen at this stage whether different relationships will apply to differentcatchments or whether a single, more general relationship can be established that will beapplicable across several catchments. The validity of the correlation between total dose anduranium concentration for the Mooi River catchment should be checked periodically whereused for long term monitoring.
21
7.4 Suspended Solids
Preliminary indications were that the additional radiation dose resulting from the ingestion ofthe suspended solids in the water is minimal (≈2% on average) and can therefore be ignored.
7.5 Guideline Development
Provisional guidelines for evaluating the significance of the drinking water pathway ofradiation exposure were developed, based on a synthesis of the dose limits given by theWorld Health Organisation, the Council for Nuclear Safety, and the IAEA recommendations.
7.6 Recommendations
The following recommendations can be made from the results of the study:
(i) Action
No immediate action is required to reduce radioactivity levels in surface and groundwaters in the Mooi River catchment.
(ii) Management approach
The future monitoring and control of radioactivity in surface and ground waters shouldbe integrated into the existing approach used in the management of the catchment, interms of which all pollutants of concern are addressed.
(iii) Application of relevant International Commission on Radiation Protection (ICRP)
principles
The ongoing regulation, at source, of intended radioactive discharges from miningoperations affecting water quality in the catchment should be conducted inaccordance with relevant ICRP principles, which are as follows:
Firstly, radiation doses should be kept as low as reasonably achievable (ALARA),economic and social factors being taken into account. This should involve a periodicreview of existing practices to see that they conform to the ALARA principle.
Secondly, the exposure of individuals should not exceed 1 mSv in a year, taking intoaccount other radiation sources subject to control. To enable regulation to be appliedat source, this will require that the optimization of protection according to the ALARAprinciple be constrained by source-related dose constraints of less than 1 mSv in ayear. Discharges of radioactivity in water should accordingly be subject to appropriatelimitation on a mine-specific basis.
(iv) Monitoring strategy
The experience and knowledge gained in this study should be used as input to theformulation of a national strategy and action plan for routine and follow-up monitoringof radioactivity in public water streams, as part of an integrated approach to waterquality management. The principal approach to radioactivity monitoring should be asfollows: Where no data exists, then a full nuclide analysis is advisable. For the Mooi Rivercatchment, monitoring of uranium on a monthly basis only may be used, with use ofthe relationship between uranium and running average annual dose as a monitoringand evaluation tool. Within this catchment, monitoring of chemical uraniumconcentrations (or surveillance in the absence of water flow) should continue on amonthly basis at those sites associated with radiation doses greater than 0,1 mSv/a(sites 1, 7, 7A, 9, 11, 12 and 15) and at those sites associated with municipal waterabstraction (sites 27, 35 and 36), as part of the integrated catchment management
22
approach referred to in (ii) above. The average uranium concentrations over a yearshould be used to estimate the annual radiation dose at each site from solecontinuous use of the water for drinking purposes, using the relationship derived inthis study. Site 12 needs to be kept under surveillance if and when water flowrecommences at this point.
(v) Chemical uranium as an indicator
The use of chemical uranium as a monitoring parameter for radioactivity should beinvestigated for other catchments to determine its applicability outside the Mooi Rivercatchment.
(vi) Mine closure
The potential for ongoing radiological impacts, after mine closure, on water sources inthe Mooi River catchment should be taken into account in the site-specific minedecommissioning plans that are required as part of the mines’ EnvironmentalManagement Programme (EMP) obligations. Such plans address all potentialsources of environmental pollution, such as acid mine drainage, in a holistic manner,so that interdependencies are taken into account. Radioactivity should be included inthis holistic approach. Decommissioning plans will specify the nature and duration ofany aftercare arrangements that might be required, and these will include appropriateongoing monitoring requirements with respect to chemical and radiological pollutants.
(vii) Radioactivity in sediments
Since this study was concerned only with radioactivity in water sources, the questionof radioactivity in the sediments in the Mooi River catchment remains largelyunexplored. An investigation of radioactivity in sediments needs to be undertaken,with a view to understanding the role played by water chemistry, and it should benoted that this is indeed the subject of a project funded by the Water ResearchCommission starting in 1999 (Project No. K5/1095: Tier 1 Risk Assessment ofRadionuclides in Selected Sediments of the Mooi River).
(viii) Radionuclides in fish
Because of the huge uncertainties in the uptake of radionuclides in fish, studies onthe fish consumption exposure pathway should be conducted. It needs to beestablished whether potential radiation dose from this route in the first instance islikely to be significant or not.
(ix) Continuation of Technical Committee
The current Technical Committee should continue in order to ensure continuity of themonitoring efforts in catchments other than the Mooi River catchment as part of thenational radiological monitoring programme.

23
8. REFERENCES
1. Institute for Water Quality Studies, Department of Water Affairs and Forestry, Radioactivity inWater Sources: A Preliminary Survey, Department of Water Affairs & Forestry, Project Report NoP554001, April, 1995.
2. Institute for Water Quality Studies, Department of Water Affairs and Forestry, Overview ofRadioactivity in Water Sources: Uranium, Radium and Thorium, Department of Water Affairs &Forestry, Report No N/0000/00/RPQ/0196, April 1996.
3. Sources and Effects of Ionizing Radiation, United Nations Scientific Committee on the Effects ofAtomic Radiation (UNSCEAR), Report to the General Assembly with Scientific Annexes, UnitedNations, New York, 1993.
4. Recommendations of the International Commission on Radiological Protection, Annals of theICRP, 1990, Vol. 21, no. 1-3, ICRP Publication 60, Pergamon Press, Oxford, 1991.
5. International Basic Safety Standards for Protection against Ionizing Radiation and for the Safetyof Radiation Sources, Safety Series No. 115, International Atomic Energy Agency, Vienna, 1996.
6. Measurement and Application of Uranium Isotopes for Human and Environmental Monitoring,Goldstein, S J, Rodriguez, J M and Lujan, N, Health Phys. 72(1):10-18, 1997.
7. South African Water Quality Guidelines Department of Water Affairs and Forestry - DomesticUse, Department of Water Affairs and Forestry, Pretoria, 1996.
8. World Health Organization Guidelines for Drinking Water Quality, Geneva, 1993.
9. Department of Water Affairs and Forestry, Department of Health, Water Research Commission,Quality of Domestic Water Supplies, Volume 1: Assessment Guide, Water Research Commissionnumber TT 101/98, Pretoria, 1998.
10. Coetzee, H. in Proceedings of the Symposium on the Application of Geophysics to Engineeringand Environmental Problems, Orlando, Florida, 23-26 April 1995, p860-863.