Embed Size (px)
Citation preview

CENSUS INDEPENDENT ASSURANCE PANEL TO THE AUSTRALIAN STATISTICIAN
Report on the Quality of 2016 Census Data
June 2017
CENSUS INDEPENDENT ASSURANCE PANEL TO THE AUSTRALIAN STATISTICIANii
The Independent Assurance Panel acknowledges that our work was undertaken and our lives are lived on the lands of
Aboriginal and Torres Strait Islander Peoples.
We pay our respect to the Elders of these lands, past and present.
Census Independent Assurance Panel:
Panel Chair Professor Sandra Harding
Professor Lisa Jackson Pulver AM
Professor Peter McDonald AM
Peter Morrison
Dennis Trewin AO
Anton Voss
Recommended citation: Harding, S,. Jackson Pulver, L., McDonald, P., Morrison, P., Trewin, D., Voss, A. (2017). Report on the quality of 2016 Census data. Retrieved from http://www.abs.gov.au/websitedbs/d3310114.nsf/Home/Independent+Assurance+Panel
Report on the Quality of 2016 Census Data iii
Executive summary
In August 2016, following Census night, the Australian Bureau of Statistics made a decision to establish an Independent Assurance Panel (the Panel) to provide assurance and transparency of 2016 Census data quality. The Panel was tasked with reviewing the 2016 Census data, having considered issues including, but not limited to the Census design, enumeration, processing and quality assurance, and using the quality of outputs from the 2011 and 2006 Censuses as benchmarks.
The Panel has concluded that the 2016 Census data is fit-for-purpose and can be used with confidence. The 2016 Census data is of comparable quality to the 2011 and 2006 Census data.
The 2016 Census continued to collect a comprehensive, detailed picture of Australia’s population with the retention of all 45 topics from the 2011 Census. The Panel examined a number of key topics including population counts, sex, age, income, Indigenous status, country of birth, language, ancestry and family structure. The Panel’s analysis revealed that the levels and distribution of characteristics matched expectations well and were comparable to other independent data sources where applicable.
The response rate for the 2016 Census is lower but comparable to that from the 2011 and 2006 Censuses, and is similar to response rates seen in other countries, such as New Zealand, Canada, and the United Kingdom.
The 2016 Census population counts compare well against the preliminary 2016 Estimated Resident Population data with key quality indicators from the Post Enumeration Survey lending further support for the comparability of the 2016 and 2011 Censuses. Net undercount for persons on Census forms is comparable to 2011, while over-imputation is larger in 2016 than in 2011, largely due to some non-responding dwellings being incorrectly classified as occupied on 2016 Census night.
Counts of the population at the state and/or territory level derived from the 2016 Census also compare well to the Estimated Resident Population, Australia’s official population estimate and can be reliably used to rebase these estimates. The Panel is not in a position to make a judgment below the state and/or territory level.
In summary, the Panel has determined that the 2016 Census data is of a comparable quality to previous Censuses, is useful and useable, and will support the same variety of uses of Census data as was the case for previous Censuses.
Alongside these findings, the Panel has made several observations.
A changed approach to the CensusThe 2016 Census was conducted with a new ‘digital first’ approach, that centred on the use of a recently established Address Register. Notwithstanding the withdrawal of the online Census form on Census night, the digital approach appears to have been well-received by the public. Nearly all people in Australia completed Census forms, with the majority completing the Census online.
While using an Address Register as the Census frame achieved important efficiencies, there were new challenges in the determination of whether dwellings were occupied on Census night. This impacted on the number of people who were imputed into private dwellings. Furthermore, the response rate in non-private dwellings was lower than in previous Censuses, which put additional pressure on the imputation process.
While challenges were experienced and should be addressed for the 2021 Census, the changed approach led to a more efficient, effective and modern Census operation. The Panel strongly supports the changed approach to the Census and its further refinement in order to secure a high quality and financially sustainable Census into the future.
CENSUS INDEPENDENT ASSURANCE PANEL TO THE AUSTRALIAN STATISTICIANiv
Privacy concernsPrior to Census night, public concerns were raised about privacy. Impacts are apparent with more persons reporting age rather than date of birth and the percentage of persons agreeing to have their Census form archived for 99 years declining when compared with previous Censuses. However, the Panel has concluded that while some changes in response were observed, their impact on the accuracy of the Census data was minimal.
Withdrawal of the online Census form on Census nightThe withdrawal of the online Census form on Census night may have led to more people opting to use paper forms than otherwise would have been the case. This is an undesirable outcome as online completions had higher response rates for individual Census items. This does not appear to have had a major impact on dwelling response rates.
Opportunities for future CensusesIn reviewing the 2016 Census data, the Panel identified some opportunities to enhance future Censuses. The Australian Bureau of Statistics should consider:
1. New approaches to improve the accuracy of occupancy determination.
2. New approaches to person imputation, including post-Census adjustments based on the Post Enumeration Survey down to small area geographies.
3. New approaches to field procedures and the possible use of administrative files to improve the Address Register information on dwelling structure.
4. Methods to improve the enumeration of Aboriginal and Torres Strait Islander people, explored in consultation with Aboriginal and Torres Strait Islander communities.
5. Methods to improve the response rate and/or the accuracy of identifying the number of non-responding persons in non-private dwellings for whom imputation is necessary.
6. How best to respond to privacy concerns and provide assurances to the public, in particular considering the sourcing of an external Privacy Impact Assessment.
7. Continuing the practice of an Independent Assurance Panel reviewing the quality of the Census data to provide greater transparency and accountability.

Report on the Quality of 2016 Census Data v
Contents
Executive summary .................................................................................................................iii
1. Introduction.................................................................................................................. 1
1.1 Background ................................................................................................................... 1
1.2 Purpose of this report .................................................................................................... 2
1.3 The Census Independent Assurance Panel ...................................................................... 2
1.4 Scope and approach of this report .................................................................................. 2
2. About the Census ......................................................................................................... 5
2.1 Uses of the Census......................................................................................................... 5
2.2 How the Census, Post Enumeration Survey, and Estimated Resident Population are related ..................................................................................................................... 6
2.3 Key features of the 2016 Census ..................................................................................... 7
3. How the results of the 2016 Census compare................................................................. 9
3.1 Measures of quality ........................................................................................................ 93.1.1 Undercount and overcount .............................................................................. 93.1.2 Response rates ............................................................................................... 93.1.3 Consistency with other data sources .............................................................. 10
3.2 Census Post Enumeration Survey estimates of net undercount ........................................103.2.1 Australia as a whole ......................................................................................113.2.2 Analysis of net undercount .............................................................................113.2.3 State or territory of usual residence ................................................................ 133.2.4 Age and sex ................................................................................................. 143.2.5 Indigenous status ......................................................................................... 163.2.6 Country of birth ............................................................................................ 173.2.7 Implications for Census quality ...................................................................... 18
3.3 Response rates .............................................................................................................183.3.1 Person response ........................................................................................... 193.3.2 Dwelling response......................................................................................... 203.3.3 Mode of response ......................................................................................... 213.3.4 Item non-response ........................................................................................ 223.3.5 Implications for Census quality ...................................................................... 24
3.4 Population counts and age-sex distributions ..................................................................243.4.1 Comparisons of the 2016 Census and the 2016 Estimated Resident Population
by age .......................................................................................................... 253.4.2 Sex ratios ..................................................................................................... 303.4.3 Implications for Census quality ...................................................................... 31
CENSUS INDEPENDENT ASSURANCE PANEL TO THE AUSTRALIAN STATISTICIANvi
3.5 Dwellings......................................................................................................................313.5.1 Occupancy .................................................................................................... 323.5.2 Structure ...................................................................................................... 333.5.3 Non-private dwellings ................................................................................... 343.5.4 Implications for Census quality ...................................................................... 34
3.6 Data items and key population groups .......................................................................... 343.6.1 Implications for Census quality ...................................................................... 41
4. Conclusions and observations ..................................................................................... 43
Appendix A: The Census, Post Enumeration Survey, and Estimated Resident Population .......... 47
Appendix B: Accuracy of the Census and the Post Enumeration Survey ................................... 55
Appendix C: Terms of reference of the Panel .......................................................................... 63
Glossary ............................................................................................................................... 65

Report on the Quality of 2016 Census Data vii
List of FiguresFigure 3.2.1 Net undercount rate, state/territory of usual residence: 2006–2016 .................. 13
Figure 3.2.2 Net undercount rate, sex by age group: 2016 ....................................................15
Figure 3.2.3 Overcount and undercount rate by age group: 2016 ..........................................15
Figure 3.2.4 Census night population of usual residents: 2016 Census versus Post Enumeration Survey estimates by age group ............................................. 16
Figure 3.2.5 Net undercount rate, country of birth: 2011 and 2016 .......................................17
Figure 3.3.1 Person response rate by state of enumeration: 2006–2016 .............................. 19
Figure 3.3.2 Person response rate by state of usual residence: 2006–2016 .......................... 19
Figure 3.3.3 Occupied private dwelling response rate: 2006–2016....................................... 20
Figure 3.3.4 Item non-response rates, Australia: 2006–2016 ............................................... 23
Figure 3.3.5 Item non-response rates, Australia: 2006–2016 ............................................... 23
Figure 3.4.1 Australia: Preliminary 2016 Estimated Resident Population versus 2016 Census count by age ................................................................................................... 25
Figure 3.4.2 New South Wales: Preliminary 2016 Estimated Resident Population versus 2016 Census count by age .............................................................................. 26
Figure 3.4.3 Victoria: Preliminary 2016 Estimated Resident Population versus 2016 Census count by age ................................................................................................... 26
Figure 3.4.4 Queensland: Preliminary 2016 Estimated Resident Population versus 2016 Census count by age .............................................................................. 27
Figure 3.4.5 South Australia: Preliminary 2016 Estimated Resident Population versus 2016 Census count by age .............................................................................. 27
Figure 3.4.6 Western Australia: Preliminary 2016 Estimated Resident Population versus 2016 Census count by age .............................................................................. 28
Figure 3.4.7 Tasmania: Preliminary 2016 Estimated Resident Population versus 2016 Census count by age ................................................................................................... 28
Figure 3.4.8 Northern Territory: Preliminary 2016 Estimated Resident Population versus 2016 Census count by age .............................................................................. 29
Figure 3.4.9 Australian Capital Territory: Preliminary 2016 Estimated Resident Population versus 2016 Census count by age .................................................................... 29
Figure 3.4.10 Sex ratio, Australia: Preliminary 2016 Estimated Resident Population versus 2016 Census by age ........................................................................................ 30
Figure 3.6.1 People who need assistance with core activities by age group, Australia: 2006–2016 .................................................................................................... 35
Figure 3.6.2 Top 10 Countries of birth excluding Australia: 2015 Estimated Resident Population versus 2016 Census .................................. 36
Figure 3.6.3 Date of birth reporting by state/territory of usual residence: 2006–2016 ........... 38
Figure 3.6.4 National Archives retention by state/territory of usual residence: 2006–2016 .... 39
Figure 3.6.5 Religious affiliation, Australia: 2006–2016 ....................................................... 40
Figure 3.6.6 Weekly personal income by income group, Australia: 2013–2014 Survey of Income and Housing versus 2016 Census ........................ 41

CENSUS INDEPENDENT ASSURANCE PANEL TO THE AUSTRALIAN STATISTICIANviii
Figure A.1 Estimating the population using the Census and the Post Enumeration Survey ... 48
Figure A.2 Using the Census and the Post Enumeration Survey to rebase Estimated Resident Population..........................................................................51
Figure B.3.1 Imputed people by Age, Australia: 2016 .......................................................... 57
List of TablesTable 3.2.1 Net undercount rate, Australia: 1996–2016 ......................................................11
Table 3.2.2 Components of undercount and overcount: 2011 and 2016 ...............................12
Table 3.2.3 Components of overcount and undercount rates, state/territory of usual residence: 2006–2016 ........................................................................... 14
Table 3.2.4 Net Undercount, Post Enumeration Survey population estimates and Census counts, by Indigenous status: 2011 and 2016 ....................................... 16
Table 3.3.1 Dwelling response rates .................................................................................. 20
Table 3.3.2 Dwelling online form uptake ............................................................................ 21
Table 3.3.3 Mode of response for occupied private dwellings ............................................. 21
Table 3.5.1 Total dwellings ................................................................................................ 31
Table 3.5.2 Occupancy of private dwellings........................................................................ 32
Table 3.5.3 Proportion of dwellings by dwelling structure ................................................... 33
Table 3.5.4 Response rate in non-private dwellings by type ................................................ 34
Table 3.6.1 Aboriginal and Torres Strait Islander identification: Census counts by state/territory of usual residence ...................................................................... 37
Table 3.6.2 Name reporting: 2011–2016 ........................................................................... 39
Table B.4.1 Net undercount rate, by state/territory of usual residence: 2011 and 2016 ......... 59
Table B.4.2 Response rates, by state/territory: 2011 and 2016 ............................................ 60
Report on the Quality of 2016 Census Data 1
1. Introduction
1.1 BackgroundOn 9 August 2015, the Australian Government announced that the 2016 Census of Population and Housing (2016 Census) would be conducted a year later on 9 August 20161. A number of changes were introduced for the 2016 Census. It was to be Australia’s first predominantly digital Census, with the expectation that approximately 65 per cent of Australia’s population would complete the Census form online1. To do this, the majority of people would receive a login code in the mail, enabled by the use of a recently established Address Register to identify dwellings, which could then be used to fill out the Census form online. This change to the data collection approach meant that Census field officers would no longer visit every house in Australia to drop-off and pick up Census forms. Paper forms would still be supplied to particular areas of the country according to a range of criteria, such as areas where there had been low online response in 2011, in regional areas with low internet connectivity and in areas where there were high concentrations of older people. Paper forms would also be provided to anyone who requested them through the Census Inquiry Service. The development and implementation of the online Census promised numerous benefits, including making the Census form easier to complete, increased efficiencies, better quality data, a reduced overall cost to the taxpayer and environmental benefits through reduction in the number of paper forms produced and distributed.
On 18 December 2015, the Australian Bureau of Statistics (ABS) announced that it would retain the names and addresses collected in the 2016 Census in order to “provide a richer and dynamic statistical picture of Australia through the combination of Census data with other survey and administrative data”2. This decision followed a Privacy Impact Assessment (PIA) conducted by the ABS which found that the retention of names and addresses had very low risks to privacy, confidentiality and security3. The PIA process undertaken by the ABS included consultation with the Australian Privacy Commissioner, as well as State and Territory Privacy Commissioners. Despite the PIA finding, the decision to retain names and addresses collected in the 2016 Census was met with some criticism and public concern in early 2016, with some members of the public and Parliament stating they would refuse to report their name on the Census.
The media widely reported on the legislative power of the Census and Statistics Act 1905 that provides for a fine to be issued to people who do not respond to the Census. This led to further public debate in the lead up to the Census.
On Census night, 9 August 2016, the online Census website experienced a series of Distributed Denial of Service attacks and the ABS made the decision to take down the online Census form as a “precautionary step … to protect people’s data”4. The online Census form remained unavailable for almost 43 hours and was reopened on 11 August 2016. This event attracted significant media attention, with a press conference addressing the events held on 10 August 2016 by: the Minister responsible for the ABS, the Hon Michael McCormack MP; the Australian Statistician, David Kalisch; and the Special Adviser to the Prime Minister on Cyber Security, Alastair MacGibbon5.
1 Australian Bureau of Statistics. (2015). Get ready to get digital with the 2016 Census [Media release]. Retrieved from http://www.abs.gov.au/websitedbs/censushome.nsf/home/CO-78?opendocument&navpos=620
2 Australian Bureau of Statistics. (2016). ABS response to Privacy Impact Assessment [Media release]. Retrieved from http://www.abs.gov.au/AUSSTATS/[email protected]/mediareleasesbyReleaseDate/C9FBD077C2C948AECA257F1E00205BBE?OpenDocument
3 Australian Bureau of Statistics. (2015). Privacy Impact Assessment – Retention of names and addresses collected in the 2016 Census of Population and Housing [Government report]. Retrieved from http://www.abs.gov.au/websitedbs/d3310114.nsf/home/privacy+impact+assessment
4 Australian Bureau of Statistics. (2016). Still time to complete your Census [Media release]. Retrieved from http://www.abs.gov.au/websitedbs/censushome.nsf/home/CO-103
5 Commonwealth Treasury. (2016). Joint Press Conference, Parliament House, Canberra [Transcript]. Retrieved from http://mfm.ministers.treasury.gov.au/transcript/005-2016/
CENSUS INDEPENDENT ASSURANCE PANEL TO THE AUSTRALIAN STATISTICIAN2
In the following days, the Prime Minister of Australia, the Hon Malcolm Turnbull MP, asked Alastair MacGibbon to conduct a review into the events of Census night. The Review of the events surrounding the 2016 eCensus was released on 13 October 20166. The Review found that:
On Census night, and in the subsequent outage period, system failure and the slow and inadequate communication with the public caused confusion, contributed to concerns about data security and reduced public confidence in the Census. The actual impact on data quality is uncertain, but the outages have raised public concerns about Census quality. (2016, p. 80)
The Review further noted that, at the time, “the current perception, even among many well-informed users, is that Census quality will be significantly affected by the outage.” (2016, p. 81)
In August 2016, following the events of Census night, the Australian Statistician made a decision to establish an Independent Assurance Panel (the Panel) to provide assurance and transparency of Census data quality. This decision was supported by the MacGibbon Review, which stated “the ABS’s decision in August to assemble an independent panel to provide assurance and transparency of Census quality is supported and the resulting report should be made public.” (2016, p. 11)
1.2 Purpose of this reportThis report presents the findings of the Panel following its review of the quality of the 2016 Census data and provides information to enable governments, the community, and other stakeholders to make an informed judgment about the fitness-for-purpose and credibility of the 2016 Census data, as required by the Panel’s Terms of Reference.
1.3 The Census Independent Assurance PanelThe Panel, comprising a group of experts with diverse experience, was tasked by the Australian Statistician to provide an independent assessment of the quality and fitness-for-purpose of the 2016 Census of Population and Housing data.
The Terms of Reference for and membership of the Panel are at Appendix C.
The Panel undertook this review as a body independent to the Australian Statistician.
1.4 Scope and approach of this reportThis report provides a high-level analysis of the quality of the 2016 Census data and focuses on key aspects of the Census data. It does not provide detailed quality reports on all data items or geographies.
The Panel was provided access to data from the 2016, 2011 and 2006 Censuses, data from the 2016 Post Enumeration Survey, information on Census processes, and other information as requested. The Panel was also provided Secretariat support from the ABS.
Under its Terms of Reference, the Panel was required to consider issues such as Census design, enumeration and processing, and to benchmark the 2016 Census results against the previous two Censuses. The Panel also compared the quality indicators of the Census outputs against selected international censuses. The Panel’s assessment of quality was also guided by the use of an accuracy framework as described in Appendix B.
6 MacGibbon, A. (2016). Review of the Events Surrounding the 2016 eCensus [Government report]. Retrieved from http://parlinfo.aph.gov.au/parlInfo/search/display/display.w3p;query=Id%3A%22publications%2Ftabledpapers%2Fa41f4f25-a08e-49a7-9b5f-d2c8af94f5c5%22

Report on the Quality of 2016 Census Data 3
1. Introduction
In determining whether the 2016 Census is fit-for-purpose as required under its Terms of Reference, the Panel assessed this requirement with reference to the purpose and uses of the Census as described in Section 2.1. In making this assessment, the Panel considered whether the 2016 Census data could be used with confidence by stakeholders when compared to the data from previous Censuses. Given the limited time and data availability, the Panel made this assessment at the national and state and/or territory levels for selected variables. Specifically, it was not possible to assess the accuracy of statistics for small geographic areas.
Given the high level nature of this report and the role of the Panel, the Panel has not audited specific Census processes, for example, compliance of data collection and processing with ABS policy and procedures. The ABS has its own data quality assurance processes and will produce detailed material on the quality of 2016 Census data items. This includes the Understanding the Census and Census data publication, which will be available on the ABS website on 27 June 2017.
This Panel report does not make assessments of Census policy related matters, information security or similar issues.
Data included in this report are sourced from the 2016, 2011, and 2006 Censuses, 2016 Post Enumeration Survey, and other relevant ABS statistics.

CENSUS INDEPENDENT ASSURANCE PANEL TO THE AUSTRALIAN STATISTICIAN4

Report on the Quality of 2016 Census Data 5
2. About the Census
The ABS conducts a Census of Population and Housing every five years as required by the Census and Statistics Act 1905. Regularly taking a Census provides a comprehensive snapshot of the nation, and enables the updating and maintenance of an accurate time series of Australia’s official population estimates7.
The Census counts everyone based on where they were on Census night (referred to as their place of enumeration) and asks about their place of usual residence. While Census night is the reference night about which people are asked to complete their Census forms, there is no requirement for people to complete their Census form on Census night. In 2016, Census night was designated as August 9, but the online Census form was open between 26 July and 23 September, and paper forms were accepted for as long as practical to allow as many people as possible to respond, with the last paper form included in Census processing in December 2016.
The Census collects data on a broad range of topics including marital status, family size, occupation, language spoken, country of birth, income, and ancestry.
2.1 Uses of the CensusThe purpose of the Census is to measure the number and key characteristics of persons and dwellings in Australia on Census night. This provides a reliable basis to estimate the population for each state and territory and local government area.
The Census also provides the characteristics of the Australian population and its housing for small areas and specific population groups. Census data is used by individuals, organisations and government to make informed decisions on issues that impact the lives of all Australians.
The ABS broadly divides the uses for the Census into the following four main groups8.
1. Allocation of government funds and support for elections
The official population estimates, which are based on Census population counts, are used in the process of allocation of Commonwealth funds to state and local governments, and to determine the number of seats each state and territory has in the House of Representatives. Furthermore, they are used as part of the process for determining electoral boundaries.
2. Planning and administration
The Census provides the characteristics of the population and its housing to support the planning, administration and policy development activities of governments, business and other users. For example, these characteristics have been used to inform the planning of new hospitals and schools.
While some of this information is available from other sources, only the Census can provide accurate information for the country as a whole, and for small geographic areas and small population groups.
7 Australian Bureau of Statistics. (2012). Ensuring the Quality of Rebased Population Estimates, June 2011 – The Rebasing Process [Government Paper]. Retrieved from http://www.abs.gov.au/ausstats/[email protected]/Latestproducts/3250.0Main%20Features2June%202011?opendocument&tabname=Summary&prodno=3250.0&issue=June%202011&num=&view=
8 Australian Bureau of Statistics. (2011). How Australia Takes a Census, 2011: Uses of Census Data [Government Paper]. Retrieved from http://www.abs.gov.au/ausstats/[email protected]/lookup/2903.0Main%20Features132011

CENSUS INDEPENDENT ASSURANCE PANEL TO THE AUSTRALIAN STATISTICIAN6
3. Use in other ABS statistics
Census data form the basis of many of the ABS’s most widely used products and services. One is the official population estimates which are updated each quarter. Population estimates are used in compiling the monthly employment and unemployment statistics and the national accounts. The Census counts of people for each geographic area are also used in the framework for selecting the samples for ABS household surveys.
4. Community uses
The ABS releases Census results in analytical articles, QuickStats, Community Profiles, TableBuilder and DataPacks. Governments, members of the public, businesses, researchers and community groups use these products to find comprehensive information for small geographic areas and population groups as well as for states, territories and the country as a whole. In addition to direct engagement with ABS products, many people access ABS statistics indirectly, such as through media articles reporting aspects of ABS findings.
2.2 How the Census, Post Enumeration Survey, and Estimated Resident Population are related
One of the most important and well-known uses of the Census is its contribution to Australia’s official population estimates, the Estimated Resident Population. The Estimated Resident Population is compiled through a combination of Census population counts, Post Enumeration Survey estimates, and other administrative sources9.
The Post Enumeration Survey10 is a survey of about 50,000 dwellings, conducted soon after the completion of the Census period. It is an independent area based survey where information is collected through a face-to-face interview or over the telephone. The interview process determines whether a person in the sample should have been counted in the Census, and the category in which they should have been counted (such as age, sex, Indigenous status, or state of usual residence). A matching process determines if they were counted, how many times they were counted, and the characteristics they were counted with. This is done by directly linking Post Enumeration Survey persons and dwellings to their matching Census forms (where they exist). This enables estimates of net overcount or net undercount, which are then applied as part of the five yearly rebasing of the Estimated Resident Population.
The Estimated Resident Population is a population estimate by geographic area, age and sex and is used to inform many planning decisions by governments and investment decisions by businesses. It is used to plan and forecast needs for housing, schools, hospitals, shopping centres, child and aged care services and transport infrastructure. The Estimated Resident Population is also used to guide the distribution of government funds to states and territories, which flows on to smaller areas such as local governments, and is a major factor in the determination of electoral boundaries. Calculation and frequent updating of the Estimated Resident Population is part of the statutory role of the ABS. The Estimated Resident Population is also the basis of the population projections into the future made from time to time by the ABS.
After every Census, the Estimated Resident Population is recalibrated, or rebased. Rebasing is done by adding the net overcount or net undercount from the Post Enumeration Survey to the new Census population counts. Further demographic and time adjustments are then made before the Estimated Resident Population data is finalised. Further information on this process is provided at Appendix A.
The Post Enumeration Survey is important as it provides:
» An independent measure of the completeness of the Census counts;
» A critical component for rebasing of the Estimated Resident Population to the latest Census; and
» Assistance in identifying improvements for future Censuses.
9 For more information on the Estimated Resident Population, see Australian Demographic Statistics (2016). This can be accessed at: http://www.abs.gov.au/Ausstats/[email protected]/0/72998BF081BECAE5CA2577FF0012082F?OpenDocument
10 Information regarding the structure and methodology of the Post Enumeration Survey was sourced from the ABS Information Paper: Measuring Overcount and Undercount in the 2016 Population Census, Jul 2016. This can be accessed at http://abs.gov.au/ausstats/[email protected]/0/7917204DF9CC8DE3CA257FE20017DFDA?Opendocument

Report on the Quality of 2016 Census Data 7
2. About the Census
2.3 Key features of the 2016 CensusThe ABS significantly changed the approach to the 2016 Census. This change featured a ‘digital first’ design and relied upon a newly established Address Register as the Census frame.
For Censuses prior to 2016, paper forms were delivered by hand to every household. For 2011, this required a record 45,000 temporary field staff knocking on nine million front doors in Australia with less than 50 per cent being answered. The absence of centralised management information meant there was limited ability to identify potential data response issues in specific locations until after the Census was complete. This meant that rectification in real time was not possible, and led to uneven data quality across Australia. The 2016 Census was originally forecast by the ABS to cost $575m over five years, however this estimated cost was reduced to $470m through the new approach. From the ABS’s perspective, the traditional Census method was neither sustainable nor affordable, and was falling behind a society with an increasing uptake of technology and expectations toward giving and receiving information digitally.
The aim of the 2016 Census ‘digital first’ design was to achieve online form completion by 65 per cent of households. This required the development of a new and improved online form and the creation and use of digital enumeration management information to manage field staff in real time. In this, the ABS drew on the successful experience of the Canadian Census, which used a similar approach.
The other key element of the change to the 2016 Census was the development of a national Address Register. The Address Register was initially based on data from the Geocoded National Address File and was enhanced by manual canvassing exercises. For approximately 80 per cent of residential addresses, the Address Register was used to populate the Census frame. The Census frame was then added to, removed from, and otherwise updated by field staff or the Census Inquiry Service during the Census data collection period. This differs to 2011, when the Census frame was created and updated entirely by field staff during the data collection period.
For enumeration, the country was divided into two types of field areas: mail-out areas and drop-off areas. Dwellings in mail-out field areas received contact from the ABS by mail in the first instance, whereas an ABS field officer initially contacted dwellings in drop-off field areas. Approximately 80 per cent of dwellings in Australia were in mail-out areas, with the remaining 20 per cent in drop-off areas.
Australia Post’s mail service was used to deliver and return materials for the majority of dwellings. This was a different approach to previous Censuses, where form delivery had been completed only by Census field staff. According to the ABS, this new approach required 40 per cent less field staff effort (based on hours worked) compared with the 2011 Census.
The 2016 Census collection, or enumeration, period was split into three main phases. These phases were:
» The Approach phase, when letters that contained log-on details for the online Census form were sent to dwellings that were on the Census frame (dwellings in mail-out areas), and paper forms were hand delivered to 20 per cent of Australia (dwellings in drop-off areas);
» The Reminder phase, which began after Census night, and was used to prompt responses from residents who had not yet responded. During the reminder phase, a standard reminder letter was mailed to non-responding dwellings in mail-out areas; and
» The Visit phase, which was designed to gain a response from residents who had not responded within 17 days of Census night. Dwellings were visited by Census field staff, who would provide paper forms (that also contained online access codes and instructions).
Throughout the three phases, people who preferred to complete the Census on a paper form, rather than complete the Census online, were able to request paper forms through an automated phone service.
Special strategies were also implemented to increase the coverage of specific populations including people with disabilities, people experiencing homelessness, people from culturally and linguistically diverse backgrounds as well as remote Aboriginal and Torres Strait Islander peoples.

CENSUS INDEPENDENT ASSURANCE PANEL TO THE AUSTRALIAN STATISTICIAN8
Nevertheless, as expected some non-responding dwellings remained after the implementation of the three phases and special strategies. Some dwellings would have been unoccupied on Census night so no response was required. Other dwellings would have been occupied on Census night so a Census form should have been returned. For those non-responding dwellings deemed to have been occupied on Census night, a Census form is imputed using a hot-decking methodology. Only a limited number of Census data items are imputed: age, sex, marital status, and place of usual residence.
The 2016 Census form content was minimally changed from 2011. The Government made this decision following the public consultation process conducted by the ABS on the content of the Census form. However, there were changes to how the questions were asked for some topics.
A greater reliance on the online form in 2016 provided opportunities to improve data quality. The ABS outlines that the additional functionality deployed in the online form included11:
» Adapting questions to the characteristics of the respondent to increase accuracy. For example, questions about relationships used the names reported on the Census form to help make the questions clearer, such as “What is Mary’s relationship to John?”;
» The introduction of targeted supplementary questions to achieve a finer level of data, such as occupation sub-types. For example, if the occupation response was “nurse”, a supplementary question was asked to confirm the specific type of nurse;
» Sequencing respondents to relevant questions and away from non-applicable questions based on information they had provided; and
» The implementation of mandatory fields on the Census form so that respondents could not progress to complete the form until data were provided in those mandatory fields.
As part of the changes to the 2016 Census, the ABS aimed to increase the value and usefulness of the Census data through data integration. To enable this, the ABS made the decision to extend retention of name and address information for up to four years, beyond the Census processing period. These data were previously retained for up to 18 months. The intent of this change was to “… provide a richer and more dynamic statistical picture of Australia through the combination of Census data with other survey and administrative data”12.
The decision by the ABS to retain names and addresses collected in the 2016 Census was made following an internal ABS Privacy Impact Assessment process, which found that the change had very low risks to privacy, confidentiality, and security13. However, the decision and the consultation process were met with some criticism and public concern in early 2016 and immediately prior to Census night.
11 Australian Bureau of Statistics (2017). Understanding the Census and Census data [Government report]. Forthcoming publication.
12 Australian Bureau of Statistics. (2016). ABS response to Privacy Impact Assessment [Media release]. Retrieved from http://www.abs.gov.au/AUSSTATS/[email protected]/mediareleasesbyReleaseDate/C9FBD077C2C948AECA257F1E00205BBE?OpenDocument
13 Australian Bureau of Statistics. (2015). Privacy Impact Assessment – Retention of names and addresses collected in the 2016 Census of Population and Housing [Government report]. Retrieved from http://www.abs.gov.au/websitedbs/d3310114.nsf/home/privacy+impact+assessment

Report on the Quality of 2016 Census Data 9
3. How the results of the 2016 Census compare
A key data quality focus for the Panel has been the comparison of 2016 Census data against data from the 2006 and 2011 Censuses. These comparisons represent an important data quality check. The data chosen by the Panel for assessment were either based on direct relevance to quality such as response rates or their importance to users of the Census such as counts of persons.
In addition to this analysis, the Panel developed an accuracy framework to explore what is meant by a high quality census, and examined the accuracy achieved by the 2016 Census against that framework. This analysis is presented in Appendix B.
3.1 Measures of qualityThere are three key measures of statistical quality used internationally that the Panel employed to assess the quality of the 2016 Census data:
» Undercount and overcount (see Section 3.2);
» Response rates, including item non-response rates (see Section 3.3); and
» Consistency with other data sources (see Sections 3.4, 3.5 and 3.6).
The undercount and overcount estimates produced by the Post Enumeration Survey were used to obtain information on the number of people missed or counted more than once by the Census.
Dwelling and person response rates and item non-response rates for the Census were reviewed to see if there were any unusual observations in response patterns.
The data from the 2016 Census were compared against the 2011 and 2006 Censuses to check for unexpected or unexplainable differences.
3.1.1 Undercount and overcountUsing the Post Enumeration Survey results, it is possible to estimate the number of people who were counted more than once or in error in the Census (gross overcount), the number of people who should have been counted in the Census but were missed (gross undercount), and the net error for Census imputation into dwellings determined to be occupied on Census night (net overcount for persons imputed). The net difference is called the net undercount (or overcount).
3.1.2 Response ratesResponse rates are standard measures used internationally to assess data quality for population and housing censuses. The Panel considered three types of response rates: dwelling response, person response, and item non-response. These measures are defined and are used in this report to assess overall data quality.
The dwelling response rate is used to measure how many occupied private dwellings in Australia completed the Census. Dwelling response occurs when a form is returned for a private dwelling identified as occupied on Census night. The dwelling response rate is calculated as a percentage by dividing the number of responding private dwellings by the number of private dwellings identified as occupied on Census night (including those where no form was returned). The dwelling response rate excludes non-private dwellings. Most people were counted in a private dwelling on Census night.
CENSUS INDEPENDENT ASSURANCE PANEL TO THE AUSTRALIAN STATISTICIAN10
The person response rate is used to measure how many people in Australia completed the Census. Person response occurs when a person is included on a form returned from either a private dwelling identified as occupied on Census night, or from a non-private dwelling. The person response rate is also calculated as a percentage by dividing the number of responding people by the total number of people in the Census counts (including those imputed into dwellings where no form was returned).
Unlike the dwelling response rate, the person response rate includes people in non-private dwellings. This takes into consideration responses on Census night from people who were in dwellings such as hotels, hospitals, nursing homes, boarding houses, mining camps and other staff quarters, among other non-private dwelling types.
It is important to note that the quality of these response measures depend on how well the ABS has determined the occupancy of private dwellings on Census night. If unoccupied dwellings are incorrectly classified as non-responding occupied dwellings this will make the response rates appear lower than they actually were. Conversely, if non-responding occupied dwellings were mistakenly categorised as unoccupied this will make the response rates appear higher.
Item non-response rates are important for understanding the quality of individual data items. Item non-response is calculated as a percentage by dividing the number of households or people who provided a response to a particular question (item) by the number of households or people (including imputed people) for whom the question (item) would have been applicable.
3.1.3 Consistency with other data sourcesTo assess the quality of key indicators and particular data items, 2016 Census data were compared against their equivalents from the 2011 and 2006 Censuses. While differences were anticipated (and found) given 10 years of population growth and societal change, analysis was focussed on identifying unexpected and unexplainable differences that might point to data quality issues.
Comparisons were also made against the Estimated Residential Population as at June 2016.
3.2 Census Post Enumeration Survey estimates of net undercountNet undercount is the difference between the Post Enumeration Survey estimate of the number of people who should have been counted and the actual Census count of people, including people imputed into non-responding dwellings during Census processing14.
Net undercount is often presented as a rate. The rate is the net undercount (or overcount) as a percentage of the Post Enumeration Survey estimate for a given population (i.e. as a percentage of the number of people who should have been counted in the Census)15.
The net undercount (together with Census and other administrative data) is used in the compilation of the official population estimates for Australia, the Estimated Resident Population.
The total net undercount from the Post Enumeration Survey can be broken down by the components of persons counted on Census forms, and persons imputed (see Section 3.2.2). This enables examination of the number of persons missed in the Census, the number of persons counted more than once or in error in the Census, and overcount due to over-imputation. Each of these components is important for understanding the quality of the 2016 Census data.
For comparability with the Post Enumeration Survey, all Census counts in Section 3.2 are presented on a usual residence basis and exclude Other Territories.
14 Australian Bureau of Statistics. (2012). Census of Population and Housing - Details of Undercount, 2011– Estimates of net undercount [Government Paper]. Retrieved from http://www.abs.gov.au/ausstats/[email protected]/Products/2940.0~2011~Main+Features~Estimates+of+net+undercount
15 For more information on Post Enumeration Survey or net undercount, see Appendix A: The Census, Post Enumeration Survey, and Estimated Resident Population. The 2016 Post Enumeration Survey population estimates, Census counts, net undercount, and the net undercount rate, by population characteristics will be published in Census of Population and Housing: Details of Overcount and Undercount, Australia – 2016 (cat. no. 2940.0) on 27 June 2017.
Report on the Quality of 2016 Census Data 11
3. How the results of the 2016 Census compare
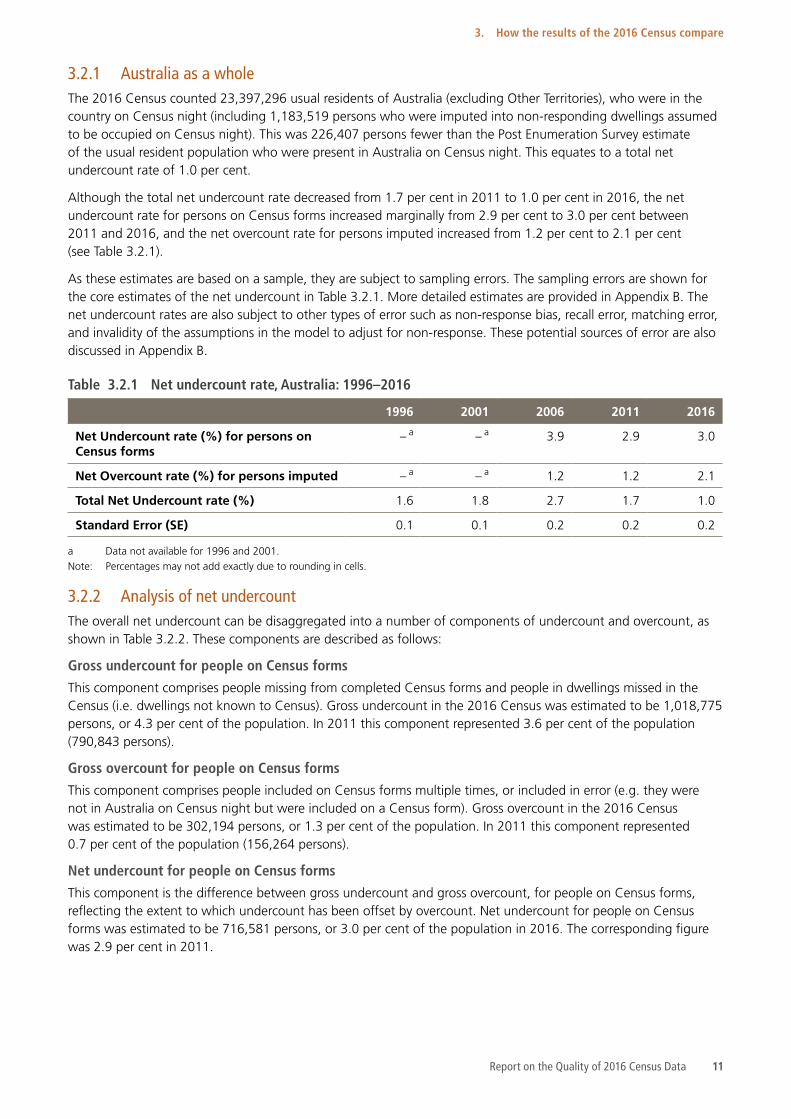
3.2.1 Australia as a wholeThe 2016 Census counted 23,397,296 usual residents of Australia (excluding Other Territories), who were in the country on Census night (including 1,183,519 persons who were imputed into non-responding dwellings assumed to be occupied on Census night). This was 226,407 persons fewer than the Post Enumeration Survey estimate of the usual resident population who were present in Australia on Census night. This equates to a total net undercount rate of 1.0 per cent.
Although the total net undercount rate decreased from 1.7 per cent in 2011 to 1.0 per cent in 2016, the net undercount rate for persons on Census forms increased marginally from 2.9 per cent to 3.0 per cent between 2011 and 2016, and the net overcount rate for persons imputed increased from 1.2 per cent to 2.1 per cent (see Table 3.2.1).
As these estimates are based on a sample, they are subject to sampling errors. The sampling errors are shown for the core estimates of the net undercount in Table 3.2.1. More detailed estimates are provided in Appendix B. The net undercount rates are also subject to other types of error such as non-response bias, recall error, matching error, and invalidity of the assumptions in the model to adjust for non-response. These potential sources of error are also discussed in Appendix B.
Table 3.2.1 Net undercount rate, Australia: 1996–2016
1996 2001 2006 2011 2016
Net Undercount rate (%) for persons on Census forms
– a – a 3.9 2.9 3.0
Net Overcount rate (%) for persons imputed – a – a 1.2 1.2 2.1
Total Net Undercount rate (%) 1.6 1.8 2.7 1.7 1.0
Standard Error (SE) 0.1 0.1 0.2 0.2 0.2
a Data not available for 1996 and 2001.Note: Percentages may not add exactly due to rounding in cells.
3.2.2 Analysis of net undercountThe overall net undercount can be disaggregated into a number of components of undercount and overcount, as shown in Table 3.2.2. These components are described as follows:
Gross undercount for people on Census formsThis component comprises people missing from completed Census forms and people in dwellings missed in the Census (i.e. dwellings not known to Census). Gross undercount in the 2016 Census was estimated to be 1,018,775 persons, or 4.3 per cent of the population. In 2011 this component represented 3.6 per cent of the population (790,843 persons).
Gross overcount for people on Census formsThis component comprises people included on Census forms multiple times, or included in error (e.g. they were not in Australia on Census night but were included on a Census form). Gross overcount in the 2016 Census was estimated to be 302,194 persons, or 1.3 per cent of the population. In 2011 this component represented 0.7 per cent of the population (156,264 persons).
Net undercount for people on Census formsThis component is the difference between gross undercount and gross overcount, for people on Census forms, reflecting the extent to which undercount has been offset by overcount. Net undercount for people on Census forms was estimated to be 716,581 persons, or 3.0 per cent of the population in 2016. The corresponding figure was 2.9 per cent in 2011.
CENSUS INDEPENDENT ASSURANCE PANEL TO THE AUSTRALIAN STATISTICIAN12
Net overcount for people imputedThis component largely represents over-imputation of persons during Census processing. Over-imputation occurs when too many people are imputed into non-responding dwellings, either because non-responding dwelling were incorrectly deemed to be occupied on Census night, or because too many people were imputed into a dwelling that was correctly deemed to be occupied. The net contribution of the latter was relatively small. People were incorrectly imputed into non-private dwellings on Census night, due to either an overestimate of the Census night occupancy of non-private dwellings, or because people were counted a second time on a form at their private dwelling residence. This provides the balance of the over-imputation.
In the 2016 Census, net overcount for imputed persons was estimated to be 490,174, or 2.1 per cent of the population. The corresponding figure for 2011 was 260,039 persons (1.2 per cent of the population).
The ABS has informed the Panel that the process of determining whether a home is occupied on Census night has become more difficult with the increase in the number of people living in high-density, secure buildings and the decreasing likelihood of making doorstep contact. Further, the changes to the 2016 Census approach increased this challenge through reducing the number of field officers and extending the period of collection. More details of the impact of occupancy determination and imputation are provided in Appendix B.
Total net undercountThis is the net result of the components of undercount and overcount. Total net undercount for 2016 was 226,407 persons, or 1.0 per cent of the population. This was a decrease of 39.6 per cent from the corresponding figure for 2011 (374,540 persons or 1.7 per cent of the population).
This section refers to total net undercount when distinguishing from the components of overcount and undercount for persons on Census forms or persons imputed. For the remainder of this report, total net undercount is abbreviated to net undercount unless an explicit distinction is required.
Table 3.2.2 Components of undercount and overcount: 2011 and 2016
Persons on Census Forms a Persons Imputed b Total
Gross
undercount cGross
overcount dNet
undercount Net overcount e Net undercount
no. no. no. no. no.
2016 1,018,775 302,194 716,581 490,174 226,407
2011 790,843 156,264 634,579 260,039 374,540
Change (%) +28.8 +93.4 +12.9 +88.5 -39.6
% f % f % f % f % f
2016 4.3 1.3 3.0 2.1 1.0
2011 3.6 0.7 2.9 1.2 1.7
Change (% pts.) +0.7 +0.6 +0.1 +0.9 -0.7
a Excludes Late Returns and Quality Flagged Census records.b Persons are imputed into dwellings that were non-responding in the Census and deemed to be occupied on Census night.c Persons missing from Census forms and persons in dwellings missed in the Census.d Persons included in error, or multiple times.e Net overcount for Census imputed persons represents over-imputation. This column includes a small contribution from Late Returns and
Quality Flagged Census records.f Percentages are calculated using Post Enumeration Survey population estimate as the denominator.

Report on the Quality of 2016 Census Data 13
3. How the results of the 2016 Census compare
It is important to note that the Post Enumeration Survey is designed to provide the best measure of Census coverage at a single point in time rather than as a time series across Censuses. Therefore, the Post Enumeration Survey estimates of undercount and overcount are not strictly comparable over time due to changes in both Census and Post Enumeration Survey methodologies. For example:
» a new estimation process was introduced in the 2006 Post Enumeration Survey, along with the inclusion of remote areas and Discrete Communities in the Post Enumeration Survey sample;
» Automated Data Linking between Post Enumeration Survey and Census person records was introduced in 2011; and
» the 2016 Census underwent a number of changes to its collection methodology, with some changes to Post Enumeration Survey enumeration procedures as a result.
Despite these challenges to comparability, these comparisons are useful in providing context for the 2016 Post Enumeration Survey results.
3.2.3 State or territory of usual residenceFigure 3.2.1 shows the total net undercount rate for all states and territories for the past three Censuses.
In 2016, the Northern Territory recorded the highest total net undercount rate of all states and territories (5.0 per cent), while the Australian Capital Territory (ACT) recorded the lowest total net undercount rate (-1.1 per cent, i.e. a net overcount). This is consistent with previous Post Enumeration Surveys, although the ACT is showing a net overcount for the first time.
While the two territories continue to reflect the minimum and maximum total net undercount rates, trends across the states have shifted for 2016. The largest decreases in total net undercount in 2016 were for Western Australia (2.5 per cent in 2011 to 0.4 per cent in 2016) and Tasmania (2.0 per cent in 2011 to 0.1 per cent in 2016). Along with South Australia (0.2 per cent), they now have the lowest total net undercount rates across the six states. In contrast, Victoria was the only state or territory to exhibit an increase in total net undercount (1.1 per cent in 2011 to 1.4 per cent in 2016).
Figure 3.2.1 Net undercount rate, state/territory of usual residence: 2006–2016
-2-10123456789
NTTASWASAQLDVICNSW ACT
Net
und
erco
unt
(%)
2011 20162006
Note: A negative value indicates a net overcount.
The components of overcount and undercount for the states and territories are shown separately in Table 3.2.3. The net undercount rates for persons on Census forms are similar for the six states, but differ markedly for the Northern Territory (8.4 per cent) and the ACT (0.9 per cent). The largest improvements between 2011 and 2016 have been in Western Australia (3.9 per cent to 2.9 per cent) and the ACT (1.6 per cent to 0.9 per cent). The largest deterioration has been in Victoria (2.1 per cent to 3.0 per cent). The net overcount for persons imputed is higher in all states and territories in 2016 when compared with 2011, and is highest in the Northern Territory (3.4 per cent). This is not surprising given the Census non-response rate was also the highest in the Northern Territory.

CENSUS INDEPENDENT ASSURANCE PANEL TO THE AUSTRALIAN STATISTICIAN14
Table 3.2.3 Components of overcount and undercount rates, state/territory of usual residence: 2006–2016
NSW Vic. Qld SA WA Tas. NT ACT
2016
Net Undercount rate for Persons on forms
2.9 3.0 3.4 2.5 2.9 2.5 8.4 0.9
Net Overcount rate for Persons imputed
2.2 1.6 2.1 2.3 2.5 2.4 3.4 2.0
Total Net Undercount rate
0.8 1.4 1.3 0.2 0.4 0.1 5.0 -1.1
2011
Net Undercount rate for Persons on forms
3.2 2.1 3.1 2.0 3.9 2.9 8.2 1.6
Net Overcount rate for Persons imputed
1.2 1.1 1.3 0.9 1.4 0.9 1.2 0.8
Total Net Undercount rate
1.9 1.1 1.8 1.1 2.5 2.0 6.9 0.7
2006
Net Undercount rate for Persons on forms
3.8 3.5 4.6 3.5 4.4 3.4 9.2 2.6
Net Overcount rate for Persons imputed
1.4 1.2 0.9 1.1 1.3 1.5 1.5 1.4
Total Net Undercount rate
2.4 2.3 3.7 2.3 3.2 2.0 7.6 1.2
Note: Percentages may not add exactly due to rounding in cells.
3.2.4 Age and sexThe results of previous censuses (both in Australia and overseas) have shown that young adults are more likely to be missed in a census, and older adults are more likely to be counted or overcounted in a census. Newborn children are often mistakenly omitted from census forms. Males are historically more likely to be missed than females.
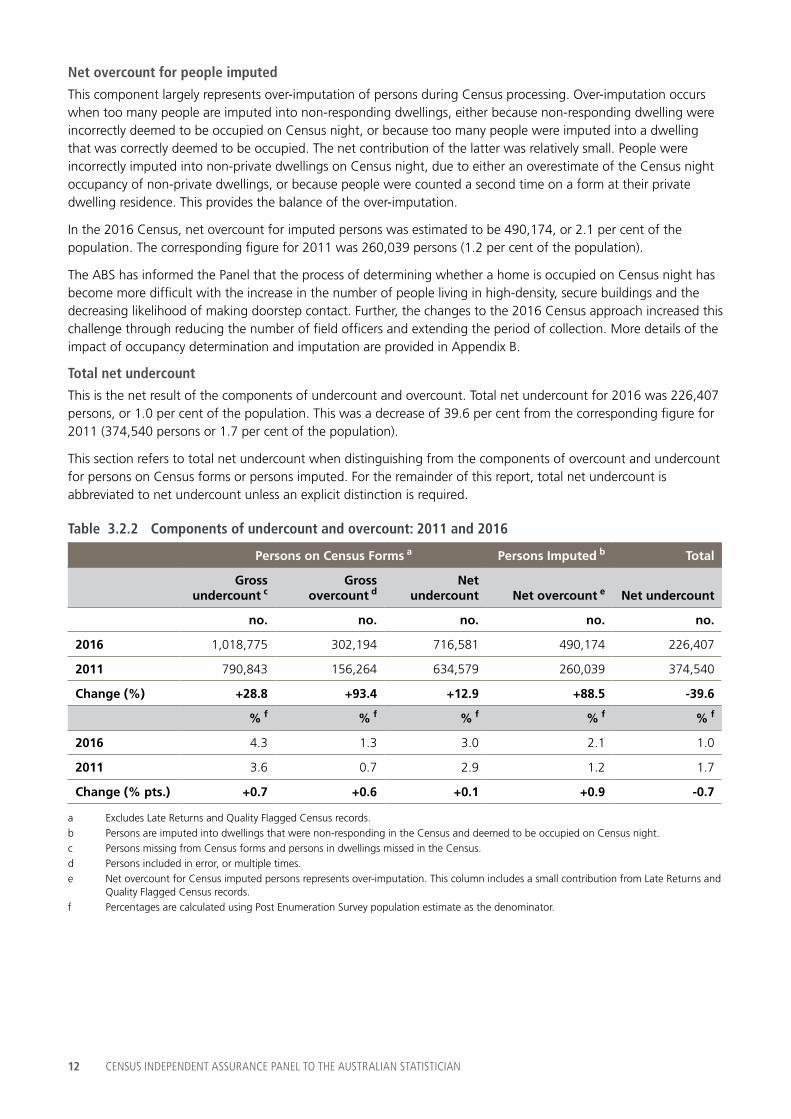
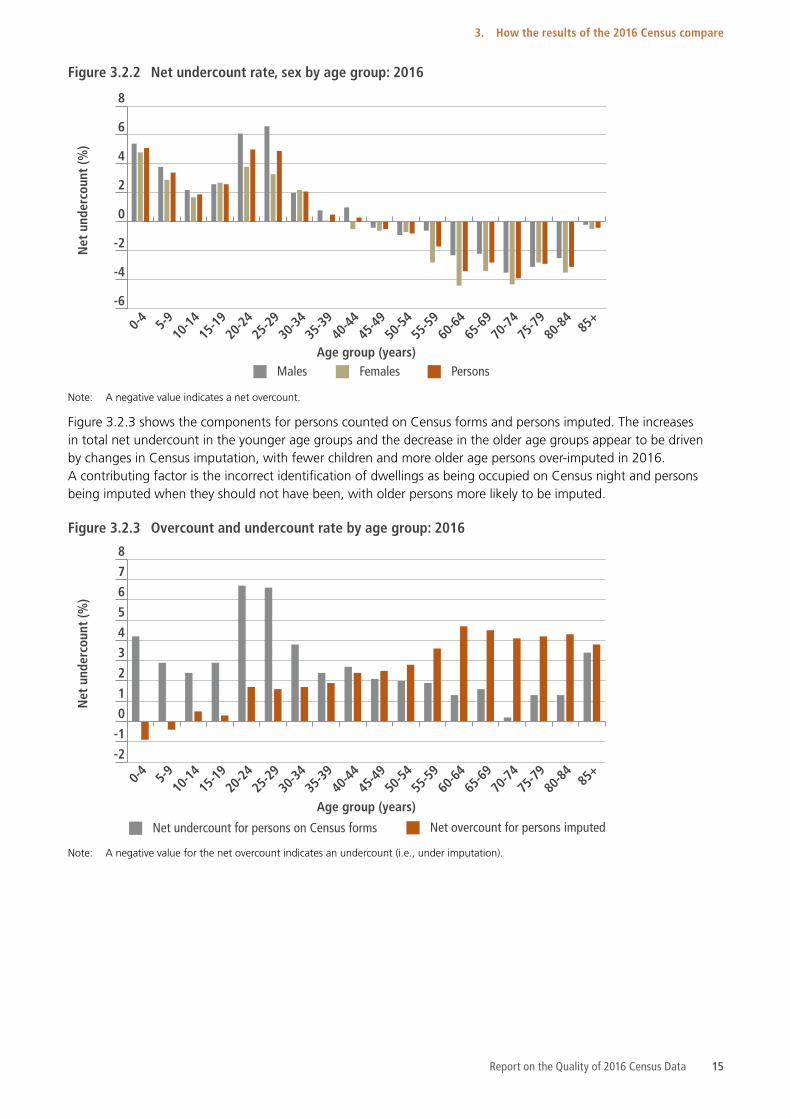
As can be seen from Figure 3.2.2, these trends hold true for the 2016 Census. Relatively high total net undercount rates were observed for the 20–24 and 25–29 year age groups (5.0 per cent and 4.9 per cent, respectively) and the highest total net undercount rate was observed for 0–4 year olds (5.1 per cent). In contrast, older age groups had lower total net undercounts (usually overcounts), with the largest net overcount of 3.9 per cent observed for people aged 70–74 years.
An increase in total net undercount for children was seen in 2016. Compared to 2011, the total net undercount rate for 0–4 year olds increased from 1.2 per cent to 5.1 per cent, for 5–9 year olds from 1.5 per cent to 3.4 per cent, and for 10–14 year olds from 0.4 per cent to 1.9 per cent in 2016.
Males were more likely to be missed in the 2016 Census compared to females by about one percentage point, which is consistent with 2011 Census. The total net undercount rates for males and females were 1.5 per cent and 0.4 per cent, respectively, for 2016, and 2.2 per cent and 1.2 per cent, respectively, for 2011.
For males, those aged 25–29 years had the highest total net undercount rate of all age groups (6.6 per cent) followed by 20–24 year olds (6.1 per cent), and 0–4 year olds (5.4 per cent). For females, 0–4 year olds had the highest total net undercount rate (4.8 per cent) followed by 20–24 year olds (3.8 per cent) and 25–29 year olds (3.3 per cent). This was similar to the pattern observed in the 2011 Census.
Report on the Quality of 2016 Census Data 15
3. How the results of the 2016 Census compare
Figure 3.2.2 Net undercount rate, sex by age group: 2016
-6
-4
-2
0
2
4
6
8
Age group (years)
Net
und
erco
unt
(%)
0-4 85+
80-84
75-79
70-74
65-69
60-64
55-59
50-54
45-49
40-44
35-39
30-34
25-29
20-24
15-19
10-145-9
Males Females Persons
Note: A negative value indicates a net overcount.
Figure 3.2.3 shows the components for persons counted on Census forms and persons imputed. The increases in total net undercount in the younger age groups and the decrease in the older age groups appear to be driven by changes in Census imputation, with fewer children and more older age persons over-imputed in 2016. A contributing factor is the incorrect identification of dwellings as being occupied on Census night and persons being imputed when they should not have been, with older persons more likely to be imputed.
Figure 3.2.3 Overcount and undercount rate by age group: 2016
-2
-1
0
1
2
3
4
5
6
7
8
Age group (years)
Net undercount for persons on Census forms Net overcount for persons imputed
Net
und
erco
unt
(%)
0-4 85+
80-84
75-79
70-74
65-69
60-64
55-59
50-54
45-49
40-44
35-39
30-34
25-29
20-24
15-19
10-145-9
Note: A negative value for the net overcount indicates an undercount (i.e., under imputation).

CENSUS INDEPENDENT ASSURANCE PANEL TO THE AUSTRALIAN STATISTICIAN16
Figure 3.2.4 illustrates the overall outcome: the total Census count (responses plus imputations) is below the Post Enumeration Survey population estimate for younger age groups, and above the Post Enumeration Survey population estimate for older age groups. This figure suggests that imputation improves the Census data, however, as noted elsewhere in this report, there are some difficulties with the accuracy of the imputation process.
Figure 3.2.4 Census night population of usual residents: 2016 Census versus Post Enumeration Survey estimates by age group
0
200 000
400 000
600 000
800 000
1 000 000
1 200 000
1 400 000
1 600 000
1 800 000
2 000 000
0-4 85+
80-84
75-79
70-74
65-69
60-64
55-59
50-54
45-49
40-44
35-39
30-34
25-29
20-24
15-19
10-145-9
Age group (years)
Response Imputation Post Enumeration Survey estimate
Pers
ons
Note: Excludes Other Territories and overseas visitors.
3.2.5 Indigenous statusThe 2016 Post Enumeration Survey estimated that 786,689 Aboriginal and Torres Strait Islander people should have been counted in the Census, compared to the 648,939 people who were actually counted. This is equivalent to a net undercount of 137,750 people, or a rate of 17.5 per cent of the estimated Post Enumeration Survey population count. This is marginally higher than 2011, which estimated a net undercount of 114,188 people, or a rate of 17.2 per cent of the population count.
Table 3.2.4 Net Undercount, Post Enumeration Survey population estimates and Census counts, by Indigenous status c: 2011 and 2016
Post Enumeration Survey population
estimate
Census count ab
Net undercount Net undercount rate
no.Standard
error no. no.Standard
error %Standard
error
2016
Indigenous 786,689 19,776 648,939 137,750 19,776 17.5 2.1
Non-Indigenous 22,837,014 46,483 21,337,326 1,499,688 46,483 6.6 0.2
Not stated – – 1,411,031 – – – –
2011
Indigenous 662,335 14,274 548,147 114,188 14,274 17.2 1.8
Non-Indigenous 21,216,926 37,272 19,898,127 1,318,799 37,272 6.2 0.2
Not stated – – 1,058,447 – – – –
– Nil or rounded to zero (including null cells).a Includes imputed persons in non-responding dwellings. These were all given an Indigenous status of ‘not-stated’.b Refers to Census counts which correspond to the scope of the Post Enumeration Survey and may differ slightly from aggregate counts in
other Census products.c Net undercount is based on Census counts for a category. In the Census, Indigenous status is set to not-stated where the response was
blank or where imputed person records were created for non-responding dwellings. Hence components of undercount for Indigenous status do not sum to the Australia total.

Report on the Quality of 2016 Census Data 17
3. How the results of the 2016 Census compare
In the Census, people can choose to indicate that they are of Aboriginal origin, Torres Strait Islander origin, of both, or of neither, or they can choose to not answer the question at all. If no answer is provided, Indigenous status is not imputed for this missing response. Indigenous status is also not imputed for imputed people.
If an Indigenous status response is missing, the person (real or imputed) will continue to be counted in broad level Census counts, but they will not be included in the Census counts of either Aboriginal and Torres Strait Islander or non-Indigenous persons. They will be recognised as having not answered that question. There were 1,411,031 people (6.0 per cent) in 2016 whose Indigenous status was not stated in the Census, an increase from 1,058,447 people (4.9 per cent) in 2011. The difference was largely due to more imputed persons in 2016.
The ABS should consider ways to improve the enumeration of Aboriginal and Torres Strait Islander people for future Censuses in consultation with Aboriginal and Torres Strait Islander communities and organisations16.
3.2.6 Country of birthThe net undercount rates by country of birth are displayed in Figure 3.2.5 for the 10 highest ranked countries (in terms of population residing in Australia) according to the 2016 Census.
Of those countries listed, persons born in Australia had the highest net undercount rate (8.1 per cent), followed by Vietnam (7.3 per cent) and South Africa (7.2 per cent). This is a change from 2011 Census, where Australia-born persons had the seventh highest net undercount, behind China and India as the top two.
A particularly significant improvement in Census coverage was seen for persons born in China, with a reduction in net undercount from 14.9 per cent (2011) to 6.2 per cent (2016). Other countries that showed sizeable improvements in coverage included India, the Philippines and New Zealand.
Figure 3.2.5 Net undercount rate, country of birth: 2011 and 2016
0
2
4
6
8
10
12
14
16
Austra
lia
Sout
h Afri
caIta
ly
Vietna
m
Philip
pines
Country of birth
India
China
(excl
SARS &
Taiw
an)
Engla
nd
Other
over
seas
Net
und
erco
unt
(%)
New Ze
aland
20162011
People who have come to Australia from other countries and whose first language is not English may find completing a Census form more difficult than other people in Australia. For several Censuses, special strategies have been employed to promote an understanding of the Census among migrants and to provide assistance for the Census in a range of languages.
16 More information about these issues, presented in the context of intercensal estimates of the Aboriginal and Torres Strait Islander population, are discussed in the following publication: Australian Bureau of Statistics. (2014). Exploring Methods to Estimate the Intercensal Population of Aboriginal and Torres Strait Islander Australians (Methodology Advisory Committee) [Research paper]. Retrieved from http://www.abs.gov.au/ausstats/[email protected]/mf/1352.0.55.140

CENSUS INDEPENDENT ASSURANCE PANEL TO THE AUSTRALIAN STATISTICIAN18
Similar to Indigenous status, country of birth may be left blank in the Census. Since the Census does not impute a country of birth if the response is missing or for imputed people, people (real or imputed) who have a missing country of birth response are not included in Census counts for these categories. However, they contribute to net undercount estimates based on the category in which they should have been counted, as reported in the Post Enumeration Survey. There were 1,622,118 people (6.9 per cent) whose country of birth was not stated in the 2016 Census, an increase from 1,195,432 people (5.6 per cent) in 2011.
3.2.7 Implications for Census qualityThe Post Enumeration Survey shows that the Census population data, adjusted by the Post Enumeration Survey, is fit-for-purpose for rebasing the Estimated Resident Population at the national and state and/or territory level.
The total net undercount is relatively small at the national level (1.0 per cent) and for the states and territories except the Northern Territory which continues to have the highest under-enumeration, although there have been some improvements since 2011.
The net undercount rate for persons on Census forms (3.0 per cent) has increased slightly compared to 2011 (2.9 per cent) but this disguises the fact that two contributing components of the net undercount have both increased in 2016: persons missing from Census forms increased from 3.6 per cent to 4.3 per cent, and persons counted more than once or in error increased from 0.7 per cent to 1.3 per cent.
The net overcount rate for persons imputed has increased from 1.2 per cent to 2.1 per cent. This over-imputation is the combined result of dwellings being incorrectly identified as occupied on Census night and too many people on average being imputed into dwellings that were correctly identified as occupied on Census night. For non-private dwellings, the lower response rate in 2016 made occupancy counts more important for imputation purposes than in previous Censuses. In light of these outcomes, the ABS should consider methods to improve identification of whether a non-responding dwelling was occupied or not on Census night and to improve the low response rate from non-private dwellings.
The Post Enumeration Survey also shows there is some age skewing in the Census data with too many persons aged 45 to 84 and not enough persons 39 and under.
Aboriginal and Torres Strait Islander peoples continue to be under-represented in the Census. The net undercount rate is about 17 per cent for each of the last two Censuses. This continues to be a priority area for attention by ABS17. Despite this high net undercount, the Post Enumeration Survey will enable the Estimated Resident Population estimates for this population to be rebased.
There have been some improvements in the coverage of people born overseas most likely due to the special efforts made by the ABS to engage with a number of migrant communities.
3.3 Response ratesWhile the 2016 Census overall response rates are lower than the 2006 and 2011 Australian Censuses, the results are broadly comparable and similar to response rates achieved in other censuses in New Zealand, Canada, and the United Kingdom.
Almost every country conducts a census in some form or another. The Australian Census is the most similar, and therefore the most comparable, to the censuses of New Zealand, Canada and the United Kingdom. Similarities include the governmental and cultural environment, and in the case of Canada, the geographic challenges of counting a population dispersed across a large country.
17 More information about these issues, presented in the context of intercensal estimates of the Aboriginal and Torres Strait Islander population, are discussed in the following publication: Australian Bureau of Statistics. (2014). Exploring Methods to Estimate the Intercensal Population of Aboriginal and Torres Strait Islander Australians (Methodology Advisory Committee) [Research paper]. Retrieved from http://www.abs.gov.au/ausstats/[email protected]/mf/1352.0.55.140

Report on the Quality of 2016 Census Data 19
3. How the results of the 2016 Census compare
3.3.1 Person responseThe person response rate for the 2016 Census was 94.8%, declining from 96.3% in 2011 and 95.8% in 2006. Notwithstanding this decline, person response rates for the 2016 Census are comparable to 2006 and 2011.
Person response rates can be examined as state and/or territory response rates two ways:
» where people were on Census night (their state of enumeration); and
» where people usually live (their state of usual residence).
In reviewing both indicators, the response rates achieved were lower than but comparable to results achieved in the 2006 and 2011 Censuses. The higher non-response rates for non-private dwellings (see Section 3.5.3) would have been a contributing factor to the lower person response rates in 2016.
Figure 3.3.1 Person response rate by state of enumeration: 2006–2016
0
10
20
30
40
50
60
70
80
90
100
Austra
lia NTTA
SWASAQLDVIC
NSW ACT
Pers
on r
espo
nse
(%)
2011 20162006
Notes: Includes overseas visitors. Includes Other Territories in the total for Australia.
Figure 3.3.2 Person response rate by state of usual residence: 2006–2016
0
10
20
30
40
50
60
70
80
90
100
Austra
lia NTTA
SWASAQLDVIC
NSW ACT
Pers
on r
espo
nse
(%)
2011 20162006
Notes: Excludes overseas visitors. Includes Other Territories in the total for Australia.

CENSUS INDEPENDENT ASSURANCE PANEL TO THE AUSTRALIAN STATISTICIAN20
3.3.2 Dwelling responseThe occupied private dwelling response rates are lower but comparable to the response rates achieved in 2006 and 2011, and are comparable to response rates achieved in other countries (see Table 3.3.1).
Table 3.3.1 Dwelling response rates a
Year Australia New Zealand c Canada UK – England & Wales d
2006 95.8% 97.1% 96.5%
2011 96.5% 96.0% b 97.1% 95%
2016 95.1% 97.4%
a Response rates are dependent on determination of occupancy for private dwellings.b The 2011 New Zealand Census was rescheduled due to the Christchurch earthquake in early 2011, and was held in 2013.c Figures based on the substitution rate for the New Zealand Census as this is conceptually equivalent to how the Australian and
Canadian response rates are calculated. The response rates published by Stats NZ have not been used because they include net undercount and so are not directly comparable.
d Figures are not directly comparable because they include net undercount.
In the Northern Territory, the drop in response rate is smaller for occupied private dwellings than it is for persons. This is because the main contributor to the drop in response was people in non-private dwellings, who are not included in the dwelling response rate.
Figure 3.3.3 Occupied private dwelling response rate: 2006–2016
Dw
ellin
g re
spon
se (%
)
0
10
20
30
40
50
60
70
80
90
100
Austra
lia NTTA
SWASAQLDVIC
NSW ACT
2011 20162006
Note: Includes Other Territories in the total for Australia.
Analysis of the Post Enumeration Survey results indicates that the number of non-responding homes that were assessed as occupied was too high, which means the actual proportion of households that responded to the Census would be higher than shown in Figure 3.3.3. While similar under-reporting of response existed in 2011 and previous Censuses, it was greater in 2016. This means that the actual response rate in 2016 is closer to that for 2011 than what is indicated in Figure 3.3.3.

Report on the Quality of 2016 Census Data 21
3. How the results of the 2016 Census compare
3.3.3 Mode of responseAs was the case in Australia, censuses in other countries have included an online form to meet the demand for an online completion option. Uptake has varied considerably from nation to nation, with much higher uptake seen in the 2016 Australian and Canadian censuses where online completion was strongly encouraged and the majority of citizens completed their census online.
Table 3.3.2 Dwelling online form uptake
Year Australia a New Zealand Canada UK – England and Wales
2006 10.6% 18.3%
2011 34.3% 34.0% b 53.9% 16.4%
2016 58.8% 68.3%
a Only includes occupied private dwellings that responded by paper or online form. This comparison excludes the special form types that the ABS includes in its calculation of mode of response.
b The 2011 New Zealand Census was rescheduled due to the Christchurch earthquake in early 2011, and was held in 2013.
About 59 per cent of responses from occupied private dwellings were received online in 2016, up from 34 per cent in 2011. The Australian Capital Territory had the highest online response of all the states and territories (79 per cent) while Tasmania had the lowest (45 per cent).
Table 3.3.3 Mode of response for occupied private dwellings
State and/or territory 2006 (%) 2011 (%) 2016 (%) % point change 2006–2011
% point change 2011–2016
New South Wales Online 10.7 35.5 60.0 24.8 24.5
Paper 89.3 64.5 40.0 -24.8 -24.5
Victoria Online 10.4 32.7 58.9 22.3 26.2
Paper 89.6 67.3 41.1 -22.3 -26.2
Queensland Online 10.8 34.0 58.3 23.1 24.3
Paper 89.2 66.0 41.7 -23.1 -24.3
South Australia Online 8.4 30.7 52.0 22.3 21.3
Paper 91.6 69.3 48.0 -22.3 -21.3
Western Australia
Online 11.7 37.1 61.5 25.4 24.3
Paper 88.3 62.9 38.5 -25.4 -24.3
Tasmania Online 8.3 31.1 45.0 22.8 14.0
Paper 91.7 68.9 55.0 -22.8 -14.0
Northern Territory
Online 9.5 33.8 49.4 24.2 15.6
Paper 90.5 66.2 50.6 -24.2 -15.6
Australian Capital Territory
Online 17.8 46.3 78.9 28.5 32.7
Paper 82.2 53.7 21.1 -28.5 -32.7
Australia a Online 10.6 34.3 58.8 23.7 24.5
Paper 89.4 65.7 41.2 -23.7 -24.5
a Includes Other Territories in total for Australia.Note: Only includes occupied private dwellings that responded by paper or online form. This comparison excludes the special form types that
the ABS includes in its calculation of mode of response.

CENSUS INDEPENDENT ASSURANCE PANEL TO THE AUSTRALIAN STATISTICIAN22
The proportion of Australians who completed their 2016 Census form online is encouraging, and provides benefits in terms of data quality, lower data capture costs, requiring less follow-up with respondents resulting in greater savings compared with a paper form approach. Data quality for online response is aided by better sequencing through the form (skipping over questions that are irrelevant based on prior responses, for example, where a response has indicated the person is less than 15 years old they are not required to answer questions on marital status or labour force), and the use of error messages and targeted supplementary questions to obtain more detailed responses from respondents.
3.3.4 Item non-responseAs with overall non-response rates, total item non-response has increased compared with 2011 for non-imputed items but remains reasonably close to levels achieved in 2006.
The main contributor to total item non-response is people who do not respond to the Census at all. While key variables (age, sex, marital status and usual residence) for a non-responding person are imputed, the remainder of questions (items) are set to either not stated (treated as “item non-response”) or not applicable, dependant on the imputed age of the person.
If we look at people who responded to the Census but did not answer a particular question, item non-response is lower than in previous Censuses. The 2016 Census was more successful compared with previous Censuses in getting people to complete more items. For the variables listed in Figures 3.3.4 and 3.3.5, overall item non-response was 1.8 per cent in 2016, down from 2.4 per cent in 2011 and 3.0 per cent in 2006.
These findings are similar to those observed internationally18 and demonstrate a benefit of the online form in improving data quality. An online response option offers many advantages over a paper form and strives to be more effective in getting responses to questions that respondents might overlook using a paper option and in correcting errors that are unintentionally provided. All of the features of an online option such as embedded edits, help features and explanations as to why questions are asked are intended to improve item non-response and overall quality.
18 For examples see the following papers:
Grondin, C., & Sun, L. (2008, August). 2006 Census Internet Mode Effect Study. American Statistical Association. Joint Statistical Meeting. Section on Survey Research Methods.
Laroche, D., & Grondin, C. (2008). Impact of Online edits and internet features in the 2006 Canadian Census. United Nations Statistical Commission and Economic Commission for Europe, Work Session on Statistical Data Editing.
Roy, L., & Laroche, D. (2006). The Internet Response Method: Impact on the Canadian Census of Population data. In Proceedings of the Survey Research Methods Section, American Statistical Association.

Report on the Quality of 2016 Census Data 23
3. How the results of the 2016 Census compare
Figure 3.3.4 Item non-response rates, Australia: 2006–2016
0
2
4
6
8
10
12
Age Sex a Marital status Indigenousstatus
Birthplace
2006 Non-response 2006 Non-response (excl. imputed persons)
2011 Non-response 2011 Non-response (excl. imputed persons)
Item
non
-res
pons
e (%
)
2016 Non-response 2016 Non-response (excl. imputed persons)
a Non-response rates for sex are unavailable prior to 2016 due to limitations in the previous imputation method.Notes: Includes Other Territories.
Excludes overseas visitors.
Figure 3.3.5 Item non-response rates, Australia: 2006–2016
0
2
4
6
8
10
12
Income Citizenship Religion Language Ancestry Number ofchildren
2011 Non-response 2011 Non-response (excl. imputed persons)
2016 Non-response 2016 Non-response (excl. imputed persons)
Item
non
-res
pons
e (%
)
2006 Non-response 2006 Non-response (excl. imputed persons)
Notes: Excludes overseas visitors. Includes Other Territories.
The Post Enumeration Survey results indicate that the over-imputation of persons was approximately two per cent (including those incorrectly imputed in non-private dwellings). This means that the reported item non-response rates in Figures 3.3.4 and 3.3.5 are higher by this amount than the rates would be without this over-imputation.

CENSUS INDEPENDENT ASSURANCE PANEL TO THE AUSTRALIAN STATISTICIAN24
3.3.5 Implications for Census qualityThere has been a small decline in the person response rate between 2011 and 2016. The decline has been greater in the Northern Territory. The impact on quality depends on the accuracy of the imputation process (see Section 3.2).
Item non-response rates were higher in 2016 than in 2011. This was due to the higher number of imputed persons in 2016. Without the effect of imputed persons, item non-response rates would have been lower in 2016 than they were in 2011.
3.4 Population counts and age-sex distributionsThis section provides a comparison of the 2016 Census counts with the Estimated Resident Population at 30 June 2016. The 2016 Estimated Resident Population was estimated from the 2011 Census-based Estimated Resident Population and the numbers of births, deaths and migrants between 2011 and 2016. This is referred to as the preliminary 2016 Estimated Resident Population. Both the 2016 Census data and the 2016 Estimated Resident Population may contribute to differences observed between the two measures. The ABS considers these differences and, using data from the Post Enumeration Survey and after adding in numbers of Australian residents who were overseas on Census night, re-estimates the 2016 Estimated Resident Population. This rebased Estimated Resident Population is the basis of all population estimates from 2016 until the next Census in 2021. This is referred to as rebased Estimated Resident Population.
At the level of Australia as a whole, errors in the preliminary Estimated Resident Population can arise from processing delays related to the registration of births and deaths, and the use of preliminary estimates of net overseas migration. For the Estimated Resident Population, a usual resident of Australia is defined as a person who has spent 12 months over a 16 month period residing in Australia as measured by passport movements. This means that any estimate relating to a date less than 16 months ago (plus additional time for processing and receipt of data) is a preliminary estimate based upon a statistical predictive model. This also means that part of the international migration component of the Estimated Resident Population between 2011 and 2016 is preliminary as at 30 June 2016. For geographic areas within Australia, Estimated Resident Population is also affected by the accuracy of measurement of people changing their place of usual residence in Australia. Data to measure these movements is far from perfect and, in this regard, the Census is used to recalibrate or rebase the Estimated Resident Population every five years.
The Census counts used in this section eliminate overseas visitors before the comparison with preliminary Estimated Resident Population is made. A challenge in this regard is that the Census definition of a usual resident is not the same as the definition of a usual resident in the Estimated Resident Population calculation. The Census asks for the address at which the person has lived, or intends to live, for a total of six months or more in the Census year. A usual resident for Estimated Resident Population is a person who is in Australia for 12 months over a 16 month period around the reference date.
The preliminary 2016 Estimated Resident Population that is being compared with 2016 Census counts here is also updated from a 2011 base that includes 2011 net undercount and residents temporarily overseas.
The comparisons shown below are based on the 2016 Census before any adjustment is made for the 2016 Post Enumeration Survey. This means, for example, that the people that the Post Enumeration Survey showed to have been incorrectly added (imputed) to non-responding dwellings (see Section 3.2, Table 3.2.2) are not removed from the Census counts before the comparisons with Estimated Resident Population are made. This approach is taken because the published Census data also include these incorrectly imputed people.

Report on the Quality of 2016 Census Data 25
3. How the results of the 2016 Census compare
3.4.1 Comparisons of the 2016 Census and the 2016 Estimated Resident Population by ageAustraliaFor Australia (Figure 3.4.1), the peaks and troughs of the preliminary Estimated Resident Population age distribution are mirrored by the 2016 Census data. Note that the comparison of the two sources is truncated at age 85 because the numbers get much smaller after age 85. The ABS will make adjustments to the Census counts at older ages as part of the recalculation of the Estimated Resident Population. Numerically, the 2016 Census and the Estimated Resident Population are very close from age 40 onwards. The largest differences between the two measures are in the early childhood years and the young adult years (15–29 years). At these ages, the Census results are lower than the Estimated Resident Population. This means that fewer people were counted in the 2016 Census in these age groups than would have been expected using the Estimated Resident Population. The Estimated Resident Population in the early childhood years is likely to be quite accurate because it is based on the number of births that occurred in the few years prior to the Census. The omission of children at very young ages is a common feature of censuses not only in Australia but also in other countries. Undercount of young people aged 15–29 years is also commonly observed in censuses because people of these ages are generally harder for censuses and surveys to make contact with. It should be noted that these undercounts generally add to 2016 Census counts if compared with the Post Enumeration Survey estimates of the population.
Figure 3.4.1 Australia: Preliminary 2016 Estimated Resident Population versus 2016 Census count by age
0
50 000
100 000
150 000
200 000
250 000
300 000
350 000
400 000
706050403020100 80
Pers
ons
Estimated Resident Population Census
Age (years)
Notes: Preliminary Estimated Resident Population based on the 2011 Census. Census count excludes overseas visitors. Census count includes Other Territories.
States and territoriesThe pattern of differences between the Census and the preliminary Estimated Resident Population is similar for New South Wales and Queensland as it is for Australia, although, in proportional terms, the differences are larger for New South Wales and Queensland. For Victoria, South Australia and Tasmania, the age pattern of differences is also similar to that of Australia but the two measures are relatively closer in Victoria and especially so in South Australia and Tasmania.
For Western Australia there are greater differences between the Census and the Estimated Resident Population, with the Estimated Resident Population noticeably higher over a wider range of ages, specifically for every age until about age 65. In the years immediately before the 2016 Census, there were considerable falls in net overseas and interstate migration to Western Australia that may have affected the precision of the Estimated Resident Population.

CENSUS INDEPENDENT ASSURANCE PANEL TO THE AUSTRALIAN STATISTICIAN26
For the Northern Territory, the most striking variation from the Australian pattern of differences by age is the large differences for children aged between five and 20 years. As indicated by the Post Enumeration Survey, this is likely to be due to Census undercount, especially of the Aboriginal and Torres Strait Islander populations. The Estimated Resident Population for the Northern Territory is also noticeably higher than the Census count for those in their thirties.
Finally, in the ACT, the differences are very small at all ages except ages 15–30. In addition, the ACT shows the quite unusual result that the Census count is higher than that of the Estimated Resident Population for those in their twenties, possibly because of improved coverage of the student population. This result requires more detailed investigation by the ABS.
Figure 3.4.2 New South Wales: Preliminary 2016 Estimated Resident Population versus 2016 Census count by age
706050403020100 80
Estimated Resident Population Census
0
20 000
40 000
60 000
80 000
100 000
120 000
Pers
ons
Age (years)
Notes: Preliminary Estimated Resident Population based on the 2011 Census. Census count of usual residents of New South Wales, which excludes overseas visitors.
Figure 3.4.3 Victoria: Preliminary 2016 Estimated Resident Population versus 2016 Census count by age
706050403020100 80
0
10 000
20 000
30 000
40 000
50 000
60 000
70 000
80 000
90 000
100 000
Estimated Resident Population Census
Pers
ons
Age (years)
Notes: Preliminary Estimated Resident Population based on the 2011 Census. Census count of usual residents of Victoria, which excludes overseas visitors.

Report on the Quality of 2016 Census Data 27
3. How the results of the 2016 Census compare
Figure 3.4.4 Queensland: Preliminary 2016 Estimated Resident Population versus 2016 Census count by age
706050403020100 80
0
10 000
20 000
30 000
40 000
50 000
60 000
70 000
80 000
Estimated Resident Population Census
Pers
ons
Age (years)
Notes: Preliminary Estimated Resident Population based on the 2011 Census. Census count of usual residents of Queensland, which excludes overseas visitors.
Figure 3.4.5 South Australia: Preliminary 2016 Estimated Resident Population versus 2016 Census count by age
706050403020100 80
0
5 000
10 000
15 000
20 000
25 000
30 000
Estimated Resident Population Census
Pers
ons
Age (years)
Notes: Preliminary Estimated Resident Population based on the 2011 Census. Census count of usual residents of South Australia, which excludes overseas visitors.

CENSUS INDEPENDENT ASSURANCE PANEL TO THE AUSTRALIAN STATISTICIAN28
Figure 3.4.6 Western Australia: Preliminary 2016 Estimated Resident Population versus 2016 Census count by age
706050403020100 80
0
5 000
10 000
15 000
20 000
25 000
30 000
35 000
40 000
45 000
50 000
Estimated Resident Population Census
Pers
ons
Age (years)
Notes: Preliminary Estimated Resident Population based on the 2011 Census. Census count of usual residents of Western Australia, which excludes overseas visitors.
Figure 3.4.7 Tasmania: Preliminary 2016 Estimated Resident Population versus 2016 Census count by age
706050403020100 80
0
1 000
2 000
3 000
4 000
5 000
6 000
7 000
8 000
9 000
Estimated Resident Population Census
Pers
ons
Age (years)
Notes: Preliminary Estimated Resident Population based on the 2011 Census. Census count of usual residents of Tasmania, which excludes overseas visitors.

Report on the Quality of 2016 Census Data 29
3. How the results of the 2016 Census compare
Figure 3.4.8 Northern Territory: Preliminary 2016 Estimated Resident Population versus 2016 Census count by age
706050403020100 80
0
500
1 000
1 500
2 000
2 500
3 000
3 500
4 000
4 500
5 000
Estimated Resident Population Census
Pers
ons
Age (years)
Notes: Preliminary Estimated Resident Population based on the 2011 Census. Census count of usual residents of Northern Territory, which excludes overseas visitors.
Figure 3.4.9 Australian Capital Territory: Preliminary 2016 Estimated Resident Population versus 2016 Census count by age
706050403020100 80
0
1 000
2 000
3 000
4 000
5 000
6 000
7 000
8 000
Estimated Resident Population Census
Pers
ons
Age (years)
Notes: Preliminary Estimated Resident Population based on the 2011 Census. Census count of usual residents of Australian Capital Territory, which excludes overseas visitors.
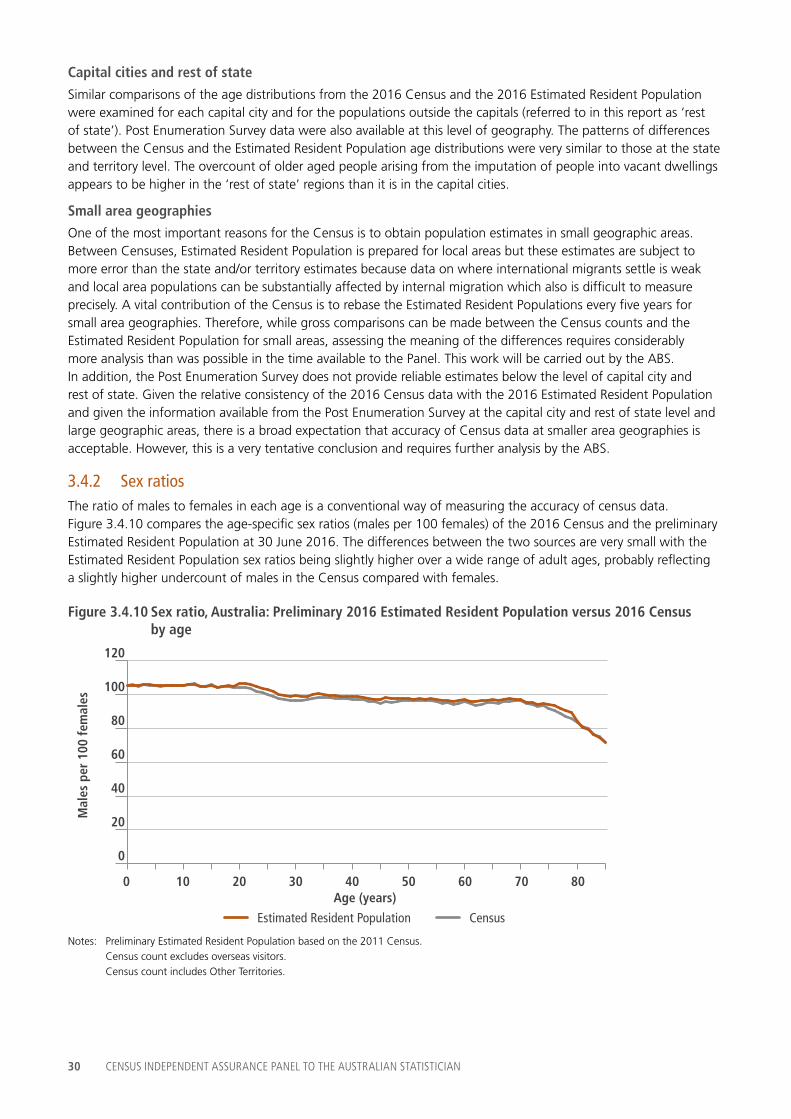
CENSUS INDEPENDENT ASSURANCE PANEL TO THE AUSTRALIAN STATISTICIAN30
Capital cities and rest of stateSimilar comparisons of the age distributions from the 2016 Census and the 2016 Estimated Resident Population were examined for each capital city and for the populations outside the capitals (referred to in this report as ‘rest of state’). Post Enumeration Survey data were also available at this level of geography. The patterns of differences between the Census and the Estimated Resident Population age distributions were very similar to those at the state and territory level. The overcount of older aged people arising from the imputation of people into vacant dwellings appears to be higher in the ‘rest of state’ regions than it is in the capital cities.
Small area geographiesOne of the most important reasons for the Census is to obtain population estimates in small geographic areas. Between Censuses, Estimated Resident Population is prepared for local areas but these estimates are subject to more error than the state and/or territory estimates because data on where international migrants settle is weak and local area populations can be substantially affected by internal migration which also is difficult to measure precisely. A vital contribution of the Census is to rebase the Estimated Resident Populations every five years for small area geographies. Therefore, while gross comparisons can be made between the Census counts and the Estimated Resident Population for small areas, assessing the meaning of the differences requires considerably more analysis than was possible in the time available to the Panel. This work will be carried out by the ABS. In addition, the Post Enumeration Survey does not provide reliable estimates below the level of capital city and rest of state. Given the relative consistency of the 2016 Census data with the 2016 Estimated Resident Population and given the information available from the Post Enumeration Survey at the capital city and rest of state level and large geographic areas, there is a broad expectation that accuracy of Census data at smaller area geographies is acceptable. However, this is a very tentative conclusion and requires further analysis by the ABS.
3.4.2 Sex ratiosThe ratio of males to females in each age is a conventional way of measuring the accuracy of census data. Figure 3.4.10 compares the age-specific sex ratios (males per 100 females) of the 2016 Census and the preliminary Estimated Resident Population at 30 June 2016. The differences between the two sources are very small with the Estimated Resident Population sex ratios being slightly higher over a wide range of adult ages, probably reflecting a slightly higher undercount of males in the Census compared with females.
Figure 3.4.10 Sex ratio, Australia: Preliminary 2016 Estimated Resident Population versus 2016 Census by age
706050403020100 80
0
20
40
60
80
100
120
Mal
es p
er 1
00 fe
mal
es
Estimated Resident Population Census
Age (years)
Notes: Preliminary Estimated Resident Population based on the 2011 Census. Census count excludes overseas visitors. Census count includes Other Territories.

Report on the Quality of 2016 Census Data 31
3. How the results of the 2016 Census compare
3.4.3 Implications for Census qualityIncluding the imputed records, the Census and Estimated Resident Population comparisons are reasonably close from age 40 upwards. However, for early childhood years and young adults, the Census estimate is lower. This pattern is true for all states and territories. This analysis suggests the Census is satisfactory for rebasing Estimated Resident Population in conjunction with the results of the Post Enumeration Survey.
3.5 DwellingsInformation gathered in the Census about dwellings is used to determine changes in levels of housing stock and patterns of use, including changes in housing density. It also assists in urban and neighbourhood design, transport planning, and land use forecasting.
Overall, there is nothing surprising in the 2016 Census dwelling counts data, with steady growth observed across all states and territories. The growth rates are broadly comparable to increases observed in previous Censuses as well as other data sources such as building approvals.
Table 3.5.1 Total dwellings a
State 2006 2011 2016 % change 2006–2011
% change 2011–2016
New South Wales 2,735,241 2,871,555 3,066,986 5.0 6.8
Victoria 2,089,491 2,282,750 2,525,540 9.2 10.6
Queensland 1,664,884 1,831,961 1,992,674 10.0 8.8
South Australia 681,188 729,172 767,267 7.0 5.2
Western Australia
851,166 963,327 1,073,723 13.2 11.5
Tasmania 217,454 233,136 242,513 7.2 4.0
Northern Territory
74,699 81,917 90,740 9.7 10.8
Australian Capital Territory
131,589 145,472 163,541 10.6 12.4
Australia b 8,446,721 9,140,231 9,924,975 8.2 8.6
a Includes private and non-private dwellings.b Includes Other Territories in total for Australia.
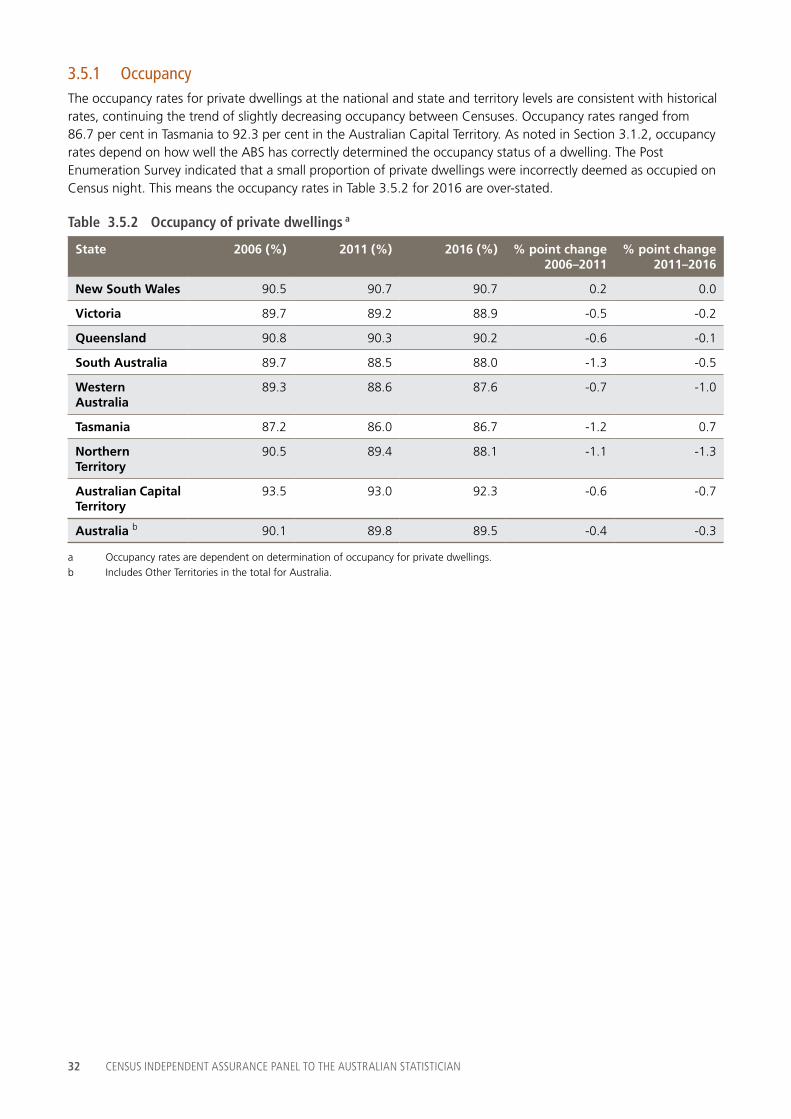
CENSUS INDEPENDENT ASSURANCE PANEL TO THE AUSTRALIAN STATISTICIAN32
3.5.1 OccupancyThe occupancy rates for private dwellings at the national and state and territory levels are consistent with historical rates, continuing the trend of slightly decreasing occupancy between Censuses. Occupancy rates ranged from 86.7 per cent in Tasmania to 92.3 per cent in the Australian Capital Territory. As noted in Section 3.1.2, occupancy rates depend on how well the ABS has correctly determined the occupancy status of a dwelling. The Post Enumeration Survey indicated that a small proportion of private dwellings were incorrectly deemed as occupied on Census night. This means the occupancy rates in Table 3.5.2 for 2016 are over-stated.
Table 3.5.2 Occupancy of private dwellings a
State 2006 (%) 2011 (%) 2016 (%) % point change 2006–2011
% point change 2011–2016
New South Wales 90.5 90.7 90.7 0.2 0.0
Victoria 89.7 89.2 88.9 -0.5 -0.2
Queensland 90.8 90.3 90.2 -0.6 -0.1
South Australia 89.7 88.5 88.0 -1.3 -0.5
Western Australia
89.3 88.6 87.6 -0.7 -1.0
Tasmania 87.2 86.0 86.7 -1.2 0.7
Northern Territory
90.5 89.4 88.1 -1.1 -1.3
Australian Capital Territory
93.5 93.0 92.3 -0.6 -0.7
Australia b 90.1 89.8 89.5 -0.4 -0.3
a Occupancy rates are dependent on determination of occupancy for private dwellings.b Includes Other Territories in the total for Australia.

Report on the Quality of 2016 Census Data 33
3. How the results of the 2016 Census compare
3.5.2 StructureThe 2016 Census has seen an increase in the number of dwellings which had their structure type listed as not stated. This category accounted for 0.5 per cent of dwelling structure responses in 2016, compared to 0.1 per cent in the 2006 and 2011 Censuses. The ABS believes this outcome is most likely attributable to the absence of field staff knocking on every door in Australia and making a determination of dwelling structure at that point (as was done in 2011).
This change in approach also likely resulted in larger percentage changes for a number of dwelling structure categories when compared to results for the 2006 and 2011 Censuses. In particular, the proportion of dwellings categorised as ‘flat or apartment attached to a house’ decreased from 0.1 per cent in 2011 to 0.0 per cent of dwellings in 2016. This change could be due to a change in classification, or the dwellings may have been missed by the new approach. If the dwellings were missed, the people associated to the dwellings may have been enumerated as part of the house their dwelling is attached to.
Table 3.5.3 Proportion of dwellings by dwelling structure
Dwelling structure 2006 (%) 2011 (%) 2016 (%) % point change 2006–2011
% point change 2011–2016
Separate house 74.1 73.7 71.0 -0.5 -2.7
Semi-detached, row or terrace house, townhouse etc. with one storey
5.8 5.9 7.3 0.1 1.4
Semi-detached, row or terrace house, townhouse etc. with two or more storeys
3.5 4.0 5.5 0.5 1.4
Flat or apartment in a one or two storey block
7.4 6.9 5.0 -0.5 -1.9
Flat or apartment in a three storey block
3.4 3.4 3.7 0.1 0.2
Flat or apartment in a four or more storey block
3.8 4.1 5.4 0.3 1.3
Flat or apartment attached to a house
0.1 0.1 0.0 0.0 -0.1
Caravan 1.2 1.1 0.7 -0.1 -0.4
Cabin, houseboata a
0.3a a
Improvised home, tent, sleepers out
0.2 0.2 0.2 0.0 0.0
House or flat attached to a shop, office, etc.
0.3 0.2 0.3 0.0 0.1
Not stated 0.1 0.1 0.5 0.1 0.4
Not applicable b 0.2 0.3 0.2 0.0 0.0
a In 2006 and 2011 caravans, cabins, and houseboats were one category.b Dwelling structure is only applicable to private dwellings.

CENSUS INDEPENDENT ASSURANCE PANEL TO THE AUSTRALIAN STATISTICIAN34
3.5.3 Non-private dwellingsApproximately four per cent of the persons in the 2016 Census population counts were counted in non-private dwellings. Response rates for people in non-private dwellings have decreased from the levels observed in the 2006 and 2011 Censuses. This may be due in part to the change in collection method (which relied heavily on identification and classification of the non-private dwellings ahead of Census night), and also in part to the online form being unavailable on Census night to short term occupants such as overnight hotel guests.
Table 3.5.4 Response rate in non-private dwellings by type
Non-private Dwelling Type 2006 (%) 2011 (%) 2016 (%) % point change 2006–2011
% point change 2006–2016
Hotel, motel, bed and breakfast
83.0 79.8 63.4 -3.2 -16.4
Staff & Nurses' quarters 81.4 75.2 67.7 -6.2 -7.5
Boarding school, residential college, hall of residence
96.8 94.0 93.0 -2.8 -1.0
Hospital 95.5 94.0 78.7 -1.5 -15.3
Accommodation for the aged, nursing home
98.5 98.2 93.5 -0.3 -4.7
Other 94.5 94.2 86.9 -0.4 -7.3
Overall 91.7 88.4 78.5 -3.3 -9.9
Note: Response rate is calculated for people in non-private dwellings.
3.5.4 Implications for Census qualityThe growth in private dwellings aligns well with other data sources. Occupancy rates are over-stated due to some dwellings being incorrectly identified as being occupied on Census night. The response rate for non-private dwellings is lower than for previous Censuses which has put pressure on the accuracy of the imputation process, however the impact on overall data quality is minimal.
3.6 Data items and key population groupsIn this section, attention is given to the accuracy of reporting of individual Census questions (data items). The criterion that is used for assessment is whether or not the 2016 Census data item is as fit-for-purpose (or of similar quality) as the same data item in previous Censuses. To do this, the Panel used three approaches:
» comparison of results of the 2016 Census with the results for the same data item from previous Censuses;
» comparison of the results of the 2016 Census with some other independent data source for the same data item; and
» examination of the 2016 Census results to see if they look broadly reasonable based upon expectations.
There are specific considerations that arise in relation to the assessment of the validity of responses to survey and census questions. Five such considerations are examined in relation to the 2016 Census questions, including:
» the degree of subjectivity of the question;
» the knowledge required to answer the question or the extent to which a person’s characteristics are acknowledged;
» the compulsory or voluntary nature of the question;
» changes in the response boxes to the question across Censuses; and
» the complexity of what is being measured or the precision of the measurement being made.
The Panel examined responses to 2016 Census questions in relation to these five considerations.

Report on the Quality of 2016 Census Data 35
3. How the results of the 2016 Census compare
Degree of SubjectivityThe first consideration is that Census questions vary in their degree of subjectivity. For example, the age data item is objective because most people know their age accurately. For some people born in a country where there was no birth registration system at the time the person was born or where precise age was not a culturally important consideration, age may be subjective. Country of birth is also objective except for people whose country of birth no longer exists, such as Yugoslavia. At the other end of the spectrum, the Census asks whether a person has a need for assistance in self-care, mobility and communication because of a disability, long-term health condition or old age. Some people may interpret this question in terms of high-end nursing or medical care while others may consider that an occasional lift to the doctor or to the shops constitutes a need for care. Another subjective question is whether or not the person spent time doing unpaid voluntary work at any time in the last 12 months.
Where a question is subjective, it is possible that community perceptions can change across time. This can be examined using the question on the need for assistance. Figure 3.6.1 shows that the proportion of people in need of assistance was concentrated in the older ages as expected. Also, the proportions fell at older ages between 2011 and 2016 again as would be expected given improvement in the health of older people over time. However, at ages under 50 and especially for children, the proportions stated as needing assistance rose between 2011 and 2016. Whether this is a real trend or a result of changing community perceptions is unclear.
Figure 3.6.1 People who need assistance with core activities by age group, Australia: 2006–2016
0
10
20
30
40
50
60
70
80
90
100
Peop
le w
ho n
eed
assi
stan
ce (%
)
0-485
-8980
-8495
-99 100+
90-94
75-79
70-74
65-69
60-64
55-59
50-54
45-49
40-44
35-39
30-34
25-29
20-24
15-19
10-145-9
Age group (years)2011 20162006
Notes: Excludes overseas visitors. Includes Other Territories.
The Panel examined data for multiple data items across the 2006, 2011 and 2016 Censuses and found changes that were broadly consistent with the expected direction and order of change. These included marital status, language used at home, family type, relationship in the household, numbers of children ever born to women and usual address (at or away from home on Census night or overseas visitor). For example, the percentages of persons who had ever married at ages in the twenties fell slightly across the three Censuses from 2006 to 2016 as would be expected on the basis of other data sources such as the ABS Labour Force Survey.
In relation to the country of birth data item, it is possible to compare Census results to a data set independent to the 2016 Census, the preliminary Estimated Resident Population (see Figure 3.6.2). For this data item, there is broad similarity in the numbers across the two data sources. Where there are noticeable differences, they may be the result of errors in the 2016 Census data, or errors in the migration data used for the Estimated Resident Population data. In particular, migration data may be problematic for people born in New Zealand because no data are available on the country of birth of New Zealand citizens who move to Australia and historically data has shown that sizeable proportions of New Zealand citizens were not born in New Zealand. Given the lack of opposing evidence, it can be concluded that the Census data on country of birth are fit-for-purpose. This conclusion was supported by the Post Enumeration Survey results.

CENSUS INDEPENDENT ASSURANCE PANEL TO THE AUSTRALIAN STATISTICIAN36
Figure 3.6.2 Top 10 Countries of birth excluding Australia: 2015 Estimated Resident Population versus 2016 Census
0
200 000
400 000
600 000
800 000
1 000 000
1 200 000
Engla
nd
Sout
h Afri
caIta
ly
Vietna
m
Philip
pines
India
China
(excl
SARS &
Taiw
an)
New Ze
aland
Malays
ia
Scot
land
2016 Census2015 Estimated Resident Population
Pers
ons
Country of birth
Notes: Preliminary Estimated Resident Population based on the 2011 Census. Census count excludes overseas visitors. Census count includes Other Territories.
Knowledge and AcknowledgementA second consideration is that it is possible that a person’s response to a question may change across Censuses because they gain knowledge that they did not have at the previous Census. For example, a person may discover a new line of their ancestry and, as a result, change their answer across the Censuses to either the Ancestry question or the Aboriginal or Torres Strait Islander Origin question. The proportion of Australians identifying as Aboriginal and Torres Strait Islander origin has increased in recent Censuses for reasons of knowledge and acknowledgement19. This appears to have occurred again in 2016, especially in the three largest states where the intercensal growth rates of the Aboriginal and Torres Strait Islander population are well above likely levels of natural increase by birth or interstate migration. However, from the 1970s onwards, more intensive field procedures improved the enumeration of persons of Aboriginal and Torres Strait Islander origin. The results of the Post Enumeration Survey indicate that the total net undercount of Aboriginal and Torres Strait Islander peoples did not fall between the 2011 and 2016 Censuses. Like most Census variables, Indigenous status is not imputed when non-responding dwellings are deemed by field staff to be occupied.
19 Australian Bureau of Statistics. (2014). Australian Historical Population Statistics, 2014. Retrieved from: http://www.abs.gov.au/AUSSTATS/[email protected]/Lookup/3105.0.65.001Main+Features12014?OpenDocument

Report on the Quality of 2016 Census Data 37
3. How the results of the 2016 Census compare
Table 3.6.1 Aboriginal and Torres Strait Islander identification: Census counts by state/territory of usual residence
Australia a NSW VIC QLD SA WA TAS NT ACT
2016
Non-Indigenous 21,341,231 6,826,286 5,532,275 4,211,020 1,557,001 2,237,541 455,137 147,327 370,748
Aboriginal and/or Torres Strait Islander population subtotal
649,168 216,175 47,787 186,489 34,183 75,986 23,578 58,248 6,506
Aboriginal 590,056 207,256 44,592 148,943 32,616 72,924 21,570 55,805 6,140
Torres Strait Islander
32,345 4,839 2,024 21,053 938 1,434 1,119 744 183
Both Aboriginal & Torres Strait Islander
26,767 4,080 1,171 16,493 629 1,628 889 1,699 183
Not Stated 1,411,491 437,762 346,563 305,685 85,464 160,891 31,255 23,257 20,143
Total 23,401,890 7,480,223 5,926,625 4,703,194 1,676,648 2,474,418 509,970 228,832 397,397
2011
Non-Indigenous 19,900,764 6,402,112 5,069,157 3,952,706 1,503,206 2,038,784 456,345 137,774 338,030
Aboriginal and/or Torres Strait Islander population subtotal
548,366 172,622 37,988 155,825 30,429 69,669 19,627 56,777 5,184
Aboriginal 495,754 164,610 34,947 122,897 28,831 67,063 17,742 54,571 4,858
Torres Strait Islander
31,408 4,768 2,158 20,095 1,039 1,309 1,171 674 188
Both Aboriginal and Torres Strait Islander
21,204 3,244 883 12,833 559 1,297 714 1,532 138
Not stated 1,058,586 342,923 246,894 224,206 62,934 130,718 19,379 17,392 14,005
Total 21,507,716 6,917,657 5,354,039 4,332,737 1,596,569 2,239,171 495,351 211,943 357,219
2006
Non-Indigenous 18,266,813 6,019,395 4,636,251 3,552,043 1,419,463 1,773,046 436,811 122,733 305,137
Aboriginal and/or Torres Strait Islander population subtotal
455,027 138,507 30,145 127,580 25,556 58,714 16,765 53,664 3,870
Aboriginal 407,700 130,787 27,072 98,717 24,082 56,648 14,877 51,703 3,602
Torres Strait Islander
29,516 4,772 2,219 18,375 1,042 1,059 1,257 614 164
Both Aboriginal and Torres Strait Islander
17,811 2,948 854 10,488 432 1,007 631 1,347 104
Not stated 1,133,446 391,275 266,027 224,909 69,318 127,327 22,904 16,503 15,027
Total 19,855,286 6,549,177 4,932,423 3,904,532 1,514,337 1,959,087 476,480 192,900 324,034
a Includes Other Territories in total for Australia.

CENSUS INDEPENDENT ASSURANCE PANEL TO THE AUSTRALIAN STATISTICIAN38
Voluntary questionsA third consideration is that some Census questions are voluntary. This includes religion, date of birth, and whether or not the record can be kept in the National Archives. Across Censuses, people may change the extent to which they answer voluntary questions perhaps because of societal changes to privacy awareness. In 2016, people completing the Census were more likely than in previous Censuses to provide a response to the religion question (95 per cent in 2011 and 96 per cent in 2016), but less likely to provide their date of birth (90 per cent in 2011 and 81 per cent in 2016) and less likely to have stated agreement that their form be kept in the National Archives (63 per cent in 2011 to 50 per cent in 2016). The falls in the statement of date of birth (Figure 3.6.3) and National Archives retention (Figure 3.6.4) probably reflect heightened privacy concerns at the 2016 Census taking into account that there were no sanctions for not providing the information. The same result is not shown for religion because religion does not identify a person nearly as definitively as date of birth or the retention and future release of the entire form through the National Archives. It is worth noting that the level of date of birth reporting also fell between 2006 and 2011 but not as much as it did between the 2011 and 2016 Censuses. In contrast, agreement to National Archive retention rose between 2006 and 2011 so the strong downward movement between 2011 and 2016 has greater meaning. Agreement to National Archive retention was higher for those who answered online compared with those who answered on a paper form. Where date of birth was not stated, most people provided their age so the impact on Census age data of the absence of date of birth is very small.
Figure 3.6.3 Date of birth reporting by state/territory of usual residence: 2006–2016
0
10
20
30
40
50
60
70
80
90
100
Austra
lia NTTA
SWASAQLDVIC
NSW ACTResp
onde
nts
repo
rtin
g da
te o
f bir
th (%
)
2011 20162006
Notes: Excludes overseas visitors. Includes Other Territories in total for Australia. Rate of people reporting date of birth is calculated as a proportion of all people reporting any age information.
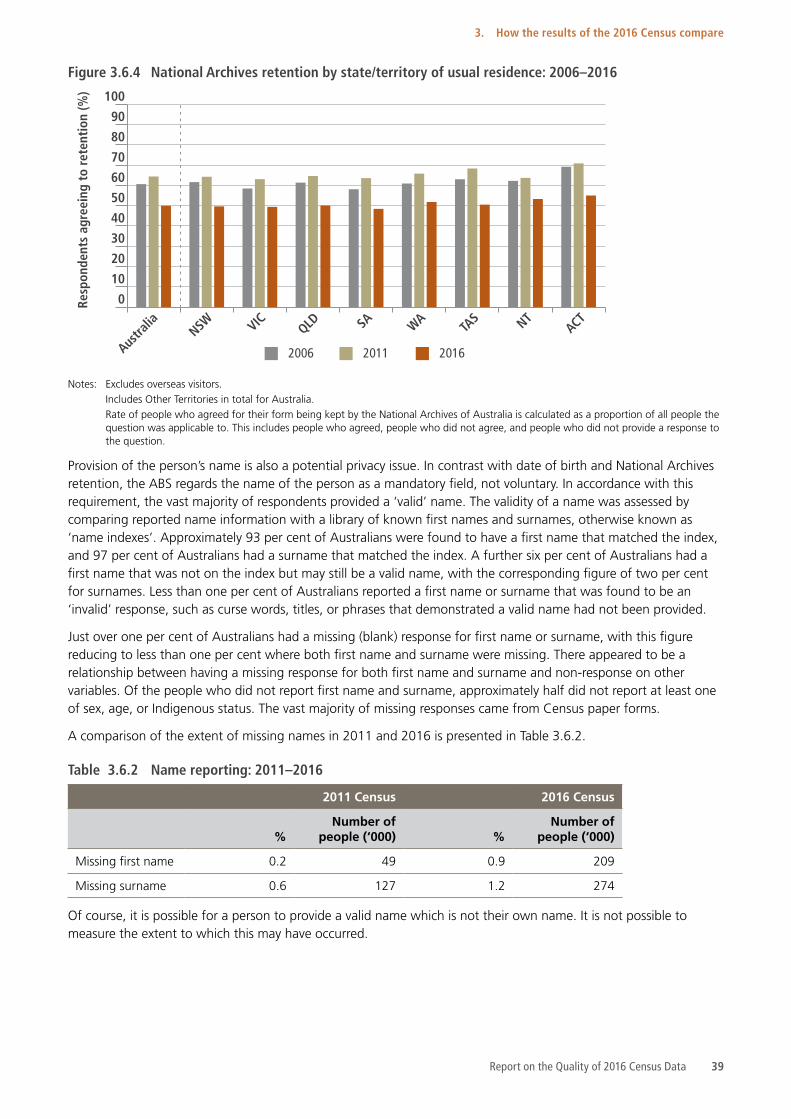
Report on the Quality of 2016 Census Data 39
3. How the results of the 2016 Census compare
Figure 3.6.4 National Archives retention by state/territory of usual residence: 2006–2016
0
10
20
30
40
50
60
70
80
90
100
Austra
lia NTTA
SWASAQLDVIC
NSW ACT
Resp
onde
nts
agre
eing
to
rete
ntio
n (%
)
2011 20162006
Notes: Excludes overseas visitors. Includes Other Territories in total for Australia. Rate of people who agreed for their form being kept by the National Archives of Australia is calculated as a proportion of all people the
question was applicable to. This includes people who agreed, people who did not agree, and people who did not provide a response to the question.
Provision of the person’s name is also a potential privacy issue. In contrast with date of birth and National Archives retention, the ABS regards the name of the person as a mandatory field, not voluntary. In accordance with this requirement, the vast majority of respondents provided a ‘valid’ name. The validity of a name was assessed by comparing reported name information with a library of known first names and surnames, otherwise known as ‘name indexes’. Approximately 93 per cent of Australians were found to have a first name that matched the index, and 97 per cent of Australians had a surname that matched the index. A further six per cent of Australians had a first name that was not on the index but may still be a valid name, with the corresponding figure of two per cent for surnames. Less than one per cent of Australians reported a first name or surname that was found to be an ‘invalid’ response, such as curse words, titles, or phrases that demonstrated a valid name had not been provided.
Just over one per cent of Australians had a missing (blank) response for first name or surname, with this figure reducing to less than one per cent where both first name and surname were missing. There appeared to be a relationship between having a missing response for both first name and surname and non-response on other variables. Of the people who did not report first name and surname, approximately half did not report at least one of sex, age, or Indigenous status. The vast majority of missing responses came from Census paper forms.
A comparison of the extent of missing names in 2011 and 2016 is presented in Table 3.6.2.
Table 3.6.2 Name reporting: 2011–2016
2011 Census 2016 Census
%Number of
people (‘000) %Number of
people (‘000)
Missing first name 0.2 49 0.9 209
Missing surname 0.6 127 1.2 274
Of course, it is possible for a person to provide a valid name which is not their own name. It is not possible to measure the extent to which this may have occurred.
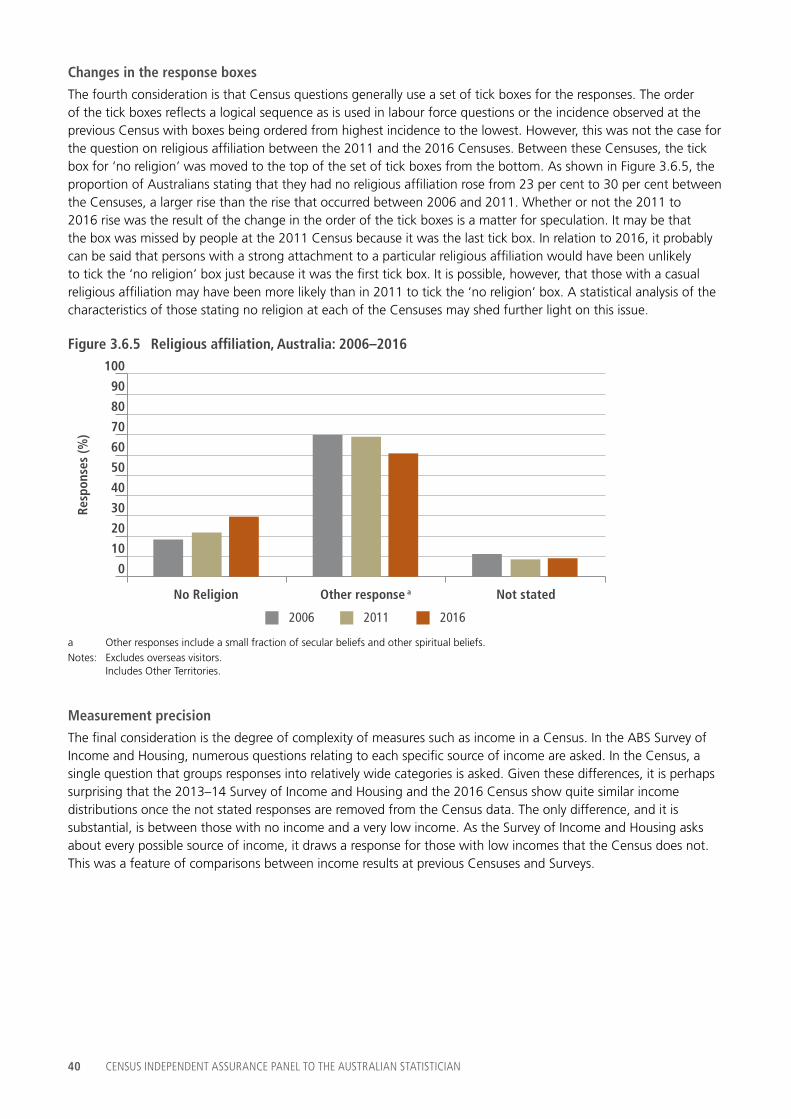
CENSUS INDEPENDENT ASSURANCE PANEL TO THE AUSTRALIAN STATISTICIAN40
Changes in the response boxesThe fourth consideration is that Census questions generally use a set of tick boxes for the responses. The order of the tick boxes reflects a logical sequence as is used in labour force questions or the incidence observed at the previous Census with boxes being ordered from highest incidence to the lowest. However, this was not the case for the question on religious affiliation between the 2011 and the 2016 Censuses. Between these Censuses, the tick box for ‘no religion’ was moved to the top of the set of tick boxes from the bottom. As shown in Figure 3.6.5, the proportion of Australians stating that they had no religious affiliation rose from 23 per cent to 30 per cent between the Censuses, a larger rise than the rise that occurred between 2006 and 2011. Whether or not the 2011 to 2016 rise was the result of the change in the order of the tick boxes is a matter for speculation. It may be that the box was missed by people at the 2011 Census because it was the last tick box. In relation to 2016, it probably can be said that persons with a strong attachment to a particular religious affiliation would have been unlikely to tick the ‘no religion’ box just because it was the first tick box. It is possible, however, that those with a casual religious affiliation may have been more likely than in 2011 to tick the ‘no religion’ box. A statistical analysis of the characteristics of those stating no religion at each of the Censuses may shed further light on this issue.
Figure 3.6.5 Religious affiliation, Australia: 2006–2016
0
10
20
30
40
50
60
70
80
90
100
No Religion Other response a Not stated
Resp
onse
s (%
)
2011 20162006
a Other responses include a small fraction of secular beliefs and other spiritual beliefs.Notes: Excludes overseas visitors.
Includes Other Territories.
Measurement precisionThe final consideration is the degree of complexity of measures such as income in a Census. In the ABS Survey of Income and Housing, numerous questions relating to each specific source of income are asked. In the Census, a single question that groups responses into relatively wide categories is asked. Given these differences, it is perhaps surprising that the 2013–14 Survey of Income and Housing and the 2016 Census show quite similar income distributions once the not stated responses are removed from the Census data. The only difference, and it is substantial, is between those with no income and a very low income. As the Survey of Income and Housing asks about every possible source of income, it draws a response for those with low incomes that the Census does not. This was a feature of comparisons between income results at previous Censuses and Surveys.

Report on the Quality of 2016 Census Data 41
3. How the results of the 2016 Census compare
Figure 3.6.6 Weekly personal income by income group, Australia: 2013–2014 Survey of Income and Housing versus 2016 Census
0
2
4
6
8
10
12
Resp
onse
s (%
)
Negat
ive in
come
$1,50
0-$1,7
49
$1,25
0-$1,4
99
$1,00
0-$1,2
49
$3,00
0 or m
ore
$2,00
0-$2,9
99
$1,75
0-$1,9
99
$800
-$999
$650
-$799
$500
-$649
$400
-$499
$300
-$399
$150
-$299
$1-$1
49
Nil inc
ome
2016 Census2013-2014 Survey of Income and Housing
Income group
Notes: Census count excludes overseas visitors and Other Territories Survey of Income and Housing data for the 2013–14 financial year that has been inflation adjusted to the July–September 2016 quarter
3.6.1 Implications for Census qualityAt the national and state and/or territory levels, changes observed in the data items reviewed by the Panel aligned with expectations.
There has been a reduction in the number of persons providing their date of birth in response to the age question, and a reduction in the number of people agreeing to have their Census form retained by the National Archive. While higher public concern and awareness of online privacy issues may have been a factor, these changes are likely due to the debate about Census privacy issues in the lead up to the 2016 Census. Neither change will have an impact on the quality of 2016 Census data.

CENSUS INDEPENDENT ASSURANCE PANEL TO THE AUSTRALIAN STATISTICIAN42

Report on the Quality of 2016 Census Data 43
4. Conclusions and observations
Overall assessmentThe Independent Assurance Panel has concluded that the quality of the 2016 Census data is comparable with the Censuses conducted in 2011 and 2006, is fit-for-purpose and can be used with confidence.
In assessing whether the 2016 Census was fit-for-purpose, the Panel considered how the data compared with previous Australian and international censuses. It is considered impossible to have a perfect Census, and common quality challenges exist across most censuses. While some quality challenges exist in the 2016 Census, such as undercounts of younger age groups, and of Aboriginal and Torres Strait Islander peoples, these issues were also present in previous Australian Censuses and have not changed significantly. The similarity of the 2016 Census data quality to that of the 2011 and 2006 Censuses contributes to the Panel’s assessment that the 2016 Census data quality is comparable and fit-for-purpose.
The response rate for 2016 is lower but comparable to that from the 2011 and 2006 Censuses, and is similar to response rates seen in other countries. Nearly all people in Australia completed Census forms, with the majority completing the Census online. The lower 2016 response rate is partly due to the ABS over-estimating occupied private dwellings on Census night.
The 2016 Census data aligns well with expectations. Counts of the population at the national and state and/or territory level derived from the 2016 Census compare well to the Estimated Resident Population, Australia’s official population estimate and can be used to rebase these estimates. The Panel is not in a position to make a judgment below the state and/or territory level.
The 2016 Census continued to collect a comprehensive, detailed picture of Australia’s population with the retention of all 45 topics from the 2011 Census. The Panel examined a number of key topics including population counts, sex, age, income, Indigenous status, country of birth, language, ancestry and family structure. The Panel’s analysis revealed that the levels and distribution of characteristics matched expectations well and were comparable to other independent data sources where available. There was some change observed in responses to the religion question. While the observed change is part of a continuing trend, it is difficult to be sure how much of the observed change is real world change and how much is a result of changes to the question introduced in the 2016 Census.
Key quality indicators from the Post Enumeration Survey support the comparability of the 2016 and 2011 Censuses. Net undercount for persons on Census forms is comparable to 2011, while over-imputation is larger in 2016 than in 2011, largely due to some non-responding dwellings being incorrectly classified as occupied on 2016 Census night. Net undercount in 2016 is lower than both 2011 and 2006. Comparisons with the 2016 Estimated Resident Population also provide confidence in the quality of the 2016 Census data.
Appendix B provides more details on the accuracy of the Census and the Post Enumeration Survey.
The Panel notes that there are a few areas that deserve specific consideration, as follows.

CENSUS INDEPENDENT ASSURANCE PANEL TO THE AUSTRALIAN STATISTICIAN44
A changed approach to the Census » Digital first: Notwithstanding the withdrawal of the online Census form for almost 43 hours from
Census night, the digital approach seems to have been well received by the public. Online completion featured more accurate responses and lower levels of item non-response compared with paper form completions for the 2016 Census, and compared with previous Censuses that used paper form and household delivery approaches.
» Address Register: New approaches introduced by the ABS in the 2016 Census included the use of an Address Register as the basis of enumeration, supported by a new digital collection management system. It is the Panel’s view that this approach led to a more efficient, effective and modern Census operation.
» Dwelling structure: The change in collection approach, particularly the use of the Address Register, appears to have led to a reduction in the proportion of dwellings classified as flats or apartments attached to houses. There was an increase in the number of dwellings that have no information for their structure type. Given the small number of these dwellings the impact on Census counts is minimal.
» Person imputation: The changed approach resulted in some expected challenges. The results of the Post Enumeration Survey indicate the determination of whether dwellings were occupied on Census night may have been negatively affected, which in turn impacts on the number of people who are imputed in private dwellings. The results of the Post Enumeration Survey also indicated that there was some age skewing of the imputed population.
Overall, the Panel concluded that the changes made by the ABS to the Census collection approach, particularly the use of the Address Register and the emphasis of the use of the online form, were positive and should be continued for the next Census, while ensuring that the online system is adequately protected. The combination of the new approaches substantially reduces the costs of the Census.
Non-ResponseThe non-response rate for the 2016 Census was slightly higher than for 2011. The main means for mitigating non-response is by imputing for missing dwellings and persons. This requires identification of non-responding dwellings that were occupied on Census night as well as accurately imputing persons in these dwellings. If this could be done perfectly, non-response would not be an issue. In practice, it cannot be done perfectly. For this Census, the main issues were: incorrectly deeming too many non-responding dwellings as occupied on Census night, and a tendency to impute too many persons aged 40 and over and not enough for younger age groups. The higher imputation rate has also had an impact on item non-response rates.
Non-private dwellingsResponse rates in non-private dwellings, particularly in short term accommodation such as hotels, are lower than seen previously. Non-private dwellings that provide longer term accommodation appear to be less affected than those that provide short term accommodation. The non-response rate for all types of non-private dwellings increased by 9.9 per cent. This put additional pressure on the accuracy of the imputation process and the Post Enumeration Survey found that too many persons were imputed. Approximately four per cent of the population are counted in non-private dwellings on Census night.

Report on the Quality of 2016 Census Data 45
4. Conclusions and observations
PrivacyThe Panel observed some change in the 2016 Census data that may be a response to public concerns about privacy raised prior to Census night.
» Age versus date of birth: While the 2011 Census showed an increase in the number of people reporting their age rather than their date of birth, the increase was greater in the 2016 Census. Broader social changes regarding privacy, for example increased awareness that date of birth should not be shared freely online, may have affected responses to this item. This makes it difficult to know the extent to which the changes observed in the Census respond to privacy concerns about the Census specifically, or to increases in privacy awareness more generally. The Panel noted that the provision of a date of birth is optional in the Census, and does not impact on the quality of Census data or population estimates but will affect data integration activities.
» Census form retention: There was a large decrease in the proportion of people choosing to have their Census form retained for 99 years by the National Archives compared with previous Censuses. Interestingly, online respondents tended to agree to having their form retained, while respondents using paper form tended to decline. Despite the decrease in those agreeing to have their Census forms retained by the National Archives, this reduction does not have a negative effect on Census data quality or population estimates.
» Retention of Names: In light of the public discussion on privacy and the completion of names on the Census form, analysis was undertaken on the quality of reported names. While there is no way of knowing to what extent, if any, respondents reported acceptable names that were not their own, ABS analysis showed that few names were withheld or false names reported. While name data is not published as Census data, the provision of high quality name information supports the processing and quality assurance of the Census, and will support data integration activities following the Census.
Withdrawal of the online Census form on Census nightAlthough it cannot be proven, the withdrawal of the online Census form for almost 43 hours from Census night may have led to more people opting to use paper forms than otherwise would have been the case. This is an undesirable outcome from the perspective of accuracy because online completions had somewhat higher response rates for individual Census items.
Aboriginal and Torres Strait Islander people countsThe 2016 Census results for people who identified as being of Aboriginal or Torres Strait Islander origin are comparable to those from the 2011 Census, although the coverage of this population remains lower than that of the general population. The large undercount (about 17 per cent) of Aboriginal and Torres Strait Islander people as indicated by the Post Enumeration Survey remains a matter of concern.20
20 More information about these issues, presented in the context of intercensal estimates of the Aboriginal and Torres Strait Islander population, are discussed in the following publication: Australian Bureau of Statistics. (2014). Exploring Methods to Estimate the Intercensal Population of Aboriginal and Torres Strait Islander Australians (Methodology Advisory Committee) [Research paper]. Retrieved from http://www.abs.gov.au/ausstats/[email protected]/mf/1352.0.55.140
CENSUS INDEPENDENT ASSURANCE PANEL TO THE AUSTRALIAN STATISTICIAN46
Opportunities for future CensusesIn reviewing the 2016 Census data, the Panel identified some opportunities for future Censuses that the ABS should consider.
1. The change in collection approach led to challenges in the determination of whether dwellings were occupied on Census night, which impacts on the number of people that are imputed and the overall Census response rate. The ABS should consider new approaches to improve the accuracy of occupancy determination in future Censuses. This could involve administrative data sources or a special survey of non-responding dwellings as is done in Canada.
2. The results of the Post Enumeration Survey indicated that the Census person imputation can be improved. The ABS should consider new approaches to person imputation for future Censuses, including post-Census adjustments based on the Post Enumeration Survey down to small area geographies.
3. The use of the Address Register likely led to the increase in the number of dwellings that have no information for their structure type, as well as a decrease in the proportion of dwellings classified as flats and apartments attached to houses. While the proportion of the overall dwelling stock that these issues affect is small, improved field procedures or access to administrative files could lessen the impact of this in future Censuses.
4. The 2016 Census results for Aboriginal and Torres Strait Islander peoples are comparable to those from the 2011 Census, although the coverage of these populations remains lower than that of the general population. Given the importance of producing representative information about Aboriginal and Torres Strait Islander peoples, the ABS should consider ways of improving the coverage of these populations ahead of future Censuses20, in consultation with Aboriginal and Torres Strait Islander communities.
5. Even though their contribution to the overall population is small, the lower response rate for non-private dwellings has had some effect on quality. Methods for improving the response rate and/or the accuracy of identifying the number of non-responding persons in non-private dwellings for whom imputation is necessary should be investigated.
6. Given the decline in the reporting of date of birth and the reduced proportion of people choosing to have their form retained by the National Archives, the ABS should consider how it can best respond to privacy concerns for future Censuses and provide appropriate assurances to the public. In particular, the ABS should consider sourcing an external Privacy Impact Assessment for future Censuses.
7. The establishment of an Independent Assurance Panel to review the quality of Census data provides greater transparency and accountability. The establishment of such a Panel should be repeated for future Censuses to provide additional assurance on the quality of the valuable national resource that is the Australian Census. If this measure is pursued for future Censuses, the ABS should have regard to the timeframe for completion of this work, noting the limitations associated with delivering a report coincident with the release of the Census data.
In conclusion, the Independent Assurance Panel has determined that the 2016 Census data is of a comparable quality to previous Censuses, is useful and useable, and will support the same variety of uses of Census data as was the case for previous Censuses.
20 More information about these issues, presented in the context of intercensal estimates of the Aboriginal and Torres Strait Islander population, are discussed in the following publication: Australian Bureau of Statistics. (2014). Exploring Methods to Estimate the Intercensal Population of Aboriginal and Torres Strait Islander Australians (Methodology Advisory Committee) [Research paper]. Retrieved from http://www.abs.gov.au/ausstats/[email protected]/mf/1352.0.55.140

Report on the Quality of 2016 Census Data 47
Appendix A: The Census, Post Enumeration Survey, and Estimated Resident Population
The ABS produces a range of collections related to population statistics: the Census, the Census Post Enumeration Survey, and the Estimated Resident Population.
It is important to note that the following description of these collections is drawn from pre-existing ABS documents. Therefore, the text that follows is either taken directly from those documents or informed by them.
A.0.1 The Census of Population and HousingThe ABS conducts a Census of Population and Housing every five years as required by the Census and Statistics Act 190521. Regularly taking a Census provides a comprehensive snapshot of the nation and enables the updating and maintenance of an accurate time series of Australia’s official population estimates.
The Census counts everyone based on where they actually were on Census night (place of enumeration) and asks about their place of usual residence. The Census also collects data on a broad range of personal, family, and dwelling topics including ancestry, country of birth, income, language spoken at home, marital status, family size, occupation, and dwelling type.
21 Census and Statistics Act: Census and Statistics Act 1905 (Cth).
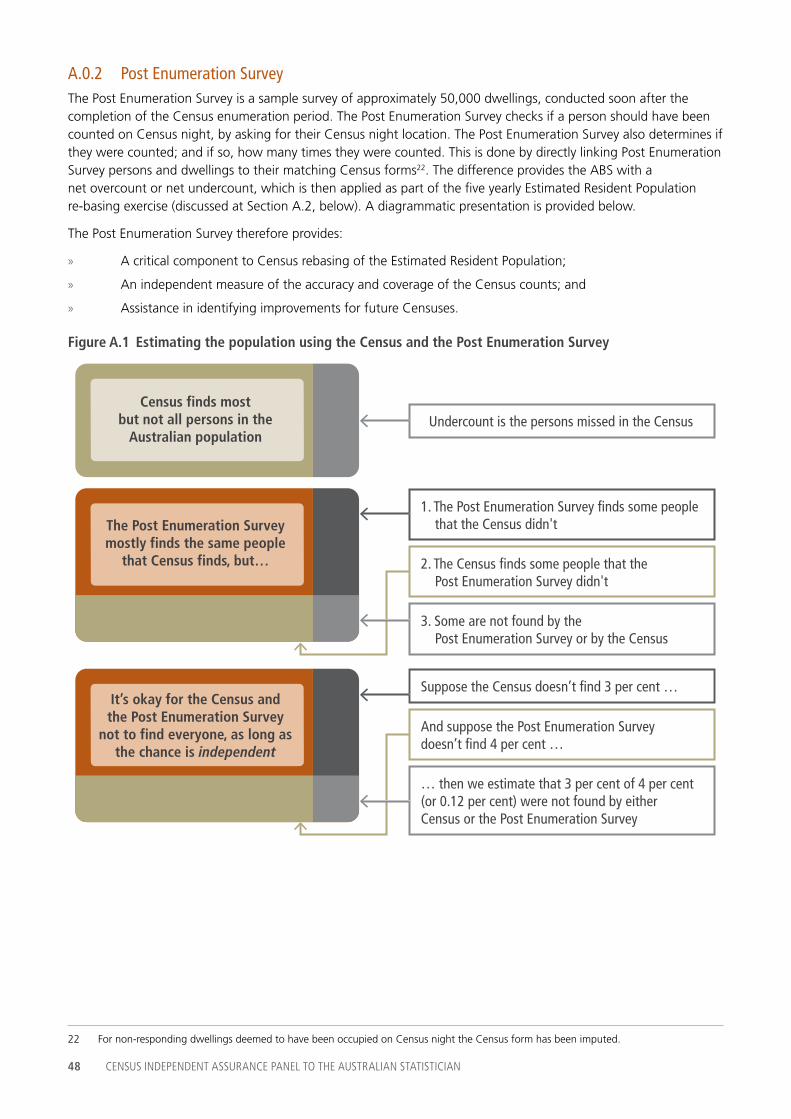
CENSUS INDEPENDENT ASSURANCE PANEL TO THE AUSTRALIAN STATISTICIAN48
A.0.2 Post Enumeration SurveyThe Post Enumeration Survey is a sample survey of approximately 50,000 dwellings, conducted soon after the completion of the Census enumeration period. The Post Enumeration Survey checks if a person should have been counted on Census night, by asking for their Census night location. The Post Enumeration Survey also determines if they were counted; and if so, how many times they were counted. This is done by directly linking Post Enumeration Survey persons and dwellings to their matching Census forms22. The difference provides the ABS with a net overcount or net undercount, which is then applied as part of the five yearly Estimated Resident Population re-basing exercise (discussed at Section A.2, below). A diagrammatic presentation is provided below.
The Post Enumeration Survey therefore provides:
» A critical component to Census rebasing of the Estimated Resident Population;
» An independent measure of the accuracy and coverage of the Census counts; and
» Assistance in identifying improvements for future Censuses.
Figure A.1 Estimating the population using the Census and the Post Enumeration Survey
Census finds mostbut not all persons in the
Australian population
The Post Enumeration Surveymostly finds the same people
that Census finds, but…
It’s okay for the Census andthe Post Enumeration Survey
not to find everyone, as long asthe chance is independent
Undercount is the persons missed in the Census
1. The Post Enumeration Survey finds some people that the Census didn't
2. The Census finds some people that the Post Enumeration Survey didn't
3. Some are not found by the Post Enumeration Survey or by the Census
Suppose the Census doesn’t find 3 per cent …
And suppose the Post Enumeration Survey doesn’t find 4 per cent …
… then we estimate that 3 per cent of 4 per cent (or 0.12 per cent) were not found by eitherCensus or the Post Enumeration Survey
22 For non-responding dwellings deemed to have been occupied on Census night the Census form has been imputed.

Report on the Quality of 2016 Census Data 49
Appendix A: The Census, Post Enumeration Survey, and Estimated Resident Population
A.0.3 Estimated Resident PopulationThe official estimate of Australia’s population is Estimated Resident Population. It provides the number of usual residents in each state and/or territory, by age and sex. Usual residence is defined as the place where a person has lived, or where they intend to live, for six months or more.
Estimated Resident Population statistics are used to inform evidence-based decisions such as:
» allocating funds to the states and territories; and
» allocating the number of seats for the House of Representatives between the states and territories.
Estimated Resident Population is prepared quarterly and is based on data from the last Census (adjusted for the Post Enumeration Survey), to which components of natural increase and decrease (births and deaths) and migration are added. Data for these components are from government administrative sources.
A.1 How the Post Enumeration Survey is used to assess the quality of the Census
A.1.1 Assessment of Census coverage – overcount and undercountThe Post Enumeration Survey provides an assessment of Census coverage, or how successful the Census was in counting the total Australian population. This assessment is determined in terms of overcount and undercount.
Some of the reasons why people are counted more than once (i.e. overcounted) include:
» they were included on the Census form at the dwelling where they usually live, even though they stayed and were counted elsewhere on Census night; and
» they were overseas on Census night and so should not have been counted at all, but were included on the Census form at the dwelling where they usually live.
Some of the reasons why people may be missed (i.e. undercounted) include:
» they were travelling and were difficult to contact;
» they mistakenly thought they were counted elsewhere;
» the person completing the form thought that, for example, young babies, the elderly or visitors should not be included;
» they did not wish to participate;
» the dwelling in which they were located was missed because it was difficult to find (e.g. in a remote or non-residential area); and
» the dwelling in which they were located was mistakenly determined to be unoccupied.
Rates of overcount and undercount can also vary significantly for different population groups depending on factors such as sex, age, ethnicity, Indigenous status, and geographic location.

CENSUS INDEPENDENT ASSURANCE PANEL TO THE AUSTRALIAN STATISTICIAN50
A.1.2 Occupancy and an assessment of Census imputationThe Post Enumeration Survey can also provide an assessment of the total number of persons present in dwellings where Census have imputed persons. For these dwellings, the Post Enumeration Survey makes an entirely independent assessment of the number of persons who usually reside in these dwellings, based on the subset of sampled dwellings that match to Census dwellings where imputation has occurred. The net overcount for persons imputed, sometimes abbreviated to over-imputation23, is derived by subtracting the Post Enumeration Survey estimate from the total of Census imputed persons.
Because the Post Enumeration Survey cannot directly associate person records with Census imputed persons, there is no precise way to break down the components of overcount and undercount. Approximate comparisons can be made by examining the characteristics and occupancy of Post Enumeration Survey dwellings that match to Census dwellings where imputation has occurred.
Some of the reasons why Census may over-impute include:
» private dwellings were incorrectly identified as occupied on Census night;
» private dwellings were correctly identified as occupied on Census night, but too many persons were imputed;
» non-private dwellings had too many persons imputed.
Rates of over-imputation can also vary significantly for different population groups depending on factors such as sex, age, ethnicity, Indigenous status, and geographic location.
A.1.3 Assessment of Census data qualityThe Post Enumeration Survey outputs information on overcount and undercount for the following variables, and as such, is able to provide an indication of their quality:
» geography (national, state and/or territory, and part of state and/or territory);
» age;
» sex;
» marital status;
» country of birth; and
» Indigenous status.
Note that ‘not-stated’ or missing values for Country of birth and Indigenous status are not imputed in the Census. Those persons who have a value of ‘not-stated’ contribute to net undercount estimates for the category in which they should have been counted, as reported in the Post Enumeration Survey.
23 For technical reasons, the Post Enumeration Survey groups dwellings where Census has imputed people together with dwellings where a Census form was received after the start of the Post Enumeration Survey collection (‘Late Returns’) and people who provided insufficient personal identifier information on their Census form, as these groups all require the Post Enumeration Survey to make an independent estimate of the true population. However, the size of net overcount for imputed people is much larger than the undercount or overcount from the other components, so the net overcount for this group can safely be interpreted as over-imputation.

Report on the Quality of 2016 Census Data 51
Appendix A: The Census, Post Enumeration Survey, and Estimated Resident Population
A.2 How the Census and Post Enumeration Survey combine to produce Estimated Resident Population
After every Census the Estimated Resident Population is recalibrated, or rebased. Rebasing is done by adding the net overcount or net undercount from the Post Enumeration Survey to the new Census population counts. The result is adjusted further to include Australian residents who were temporarily overseas on Census night (as identified from completed passenger cards). The final step in calculating Estimated Resident Population is to backdate to 30 June of the Census year. This small adjustment is undertaken by adding the deaths and subtracting the births and net overseas migration which occurred between 1 July and the Census date. The diagram below outlines the Estimated Resident Population rebasing calculations and adjustments.
As part of the population estimates rebasing exercise, the Post Enumeration Survey adjusted age and sex distributions are compared with independent population data sources, including the national demographic data bank, Medicare enrolments numbers, and estimated resident population updated from the previous Census. Where the Post Enumeration Survey does not result in plausible undercount adjustments for population sub-groups, demographic adjustments can be applied for the rebased estimates based on these other data sources.
Figure A.2 Using the Census and the Post Enumeration Survey to rebase Estimated Resident Population
Moving peopleback home
Including peoplewho have
been missed
Backdating fromCensus nightto 30 June
Census count,place of enumeration
Census count,place of usual residence
Census basedEstimated Resident
Population as at 30 June,Census year
Estimated ResidentPopulation as at
Census night
Residents absent interstate+ Add
Interstate visitors
Overseas visitors- Subtract
- Subtract
Net adjustment for interstate migration
Deaths
Births
+ Add
Net adjustment for overseas migration
- Subtract
Net Post Enumeration Survey adjustment
Net demographic adjustment
+ Add Residents temporarily overseas

CENSUS INDEPENDENT ASSURANCE PANEL TO THE AUSTRALIAN STATISTICIAN52
A.3 Limitations of the Post Enumeration SurveyThe reliability of the Post Enumeration Survey affects the extent to which estimates can be used to accurately assess the quality of the Census. As a result, it is important to understand the quality of the Post Enumeration Survey itself and the factors that may limit its usefulness as a measure. The conceptual framework for population estimates are described in Appendix B. The key sources of error in the Post Enumeration Survey are outlined below.
A.3.1 Sampling errorSampling error is random error resulting in either an underestimate or an overestimate because Post Enumeration Survey is a sample survey.
The Post Enumeration Survey has relatively low sampling errors at the national level due to a large sample, but the relative sampling errors will be higher for estimates for lower level geographies.
The final Margin of Error on the Post Enumeration Survey estimates is reported in the Post Enumeration Survey publication
A.3.2 Correlation and non-response biasCorrelation bias is systematic error that results in an underestimate when Census and the Post Enumeration Survey tend to miss the same people. The Post Enumeration Survey relies on statistical independence to accurately adjust for Census undercount and/or overcount. If population groups are systematically missing from both the Post Enumeration Survey and the Census, correlation bias occurs, which can lead to an underestimate of the population.
Correlation bias is partially treated by fitting mathematical models to account for the drivers of Census and Post Enumeration Survey non-response in estimation, such as age characteristics. This has been shown to be effective in reducing correlation bias, although some residual bias will remain. A detailed description of the prediction regression estimator used in Post Enumeration Survey can be found in Research Paper: An Estimating Equation Approach to Census Coverage Adjustment, May 200724.
There is also a risk of non-response bias when selected persons respond to the Census but do not respond to the Post Enumeration Survey.
Non-response bias occurs when the people who do not respond to the Post Enumeration Survey have different characteristics to those who do respond. This risk is greater if the characteristics of the non-respondents vary significantly from respondents especially in their propensity to complete the Census. Non-response bias is treated through the Prediction Regression Estimation model referred to above.
A.3.3 Bias due to missed linksSystematic error resulting in an overestimate when the Census and the Post Enumeration Survey find the same people but fail to match them, leading to those people being treated as missing from the Census. The Post Enumeration Survey relies on linking to Census to establish which persons in the Post Enumeration Survey were counted in Census and which were not.
If a person is counted in both the Post Enumeration Survey and the Census, but the link between them is missed, the Post Enumeration Survey mistakenly reports that they are missing from the Census. This can lead to an overestimate of the population.
This bias is predominantly treated through a high level of scrutiny and quality assurance attached to the linking and matches processes in the Post Enumeration Survey.
In 2016, a quality adjustment was also introduced to identify and treat Census records that had insufficient personal identifier information, which is required for linking to the Post Enumeration Survey. These records were moved to the Census non-contact sector and treated in a similar fashion to late returns, to remove the potential for any upward bias on the Post Enumeration Survey estimates.
24 Research Paper: Bell, P. A., Clarke, C. F., Whiting, J. P. (2007). An Esimating Equation Approach to Census Coverage Adjustment. Canberra, Australia: The Australian Bureau of Statistics. (cat. no. 1351.0.55.019).

Report on the Quality of 2016 Census Data 53
Appendix A: The Census, Post Enumeration Survey, and Estimated Resident Population
A.3.4 Recall errorThis occurs if the Post Enumeration Survey respondents do not accurately recall where they were enumerated on Census night.
The 2016 Post Enumeration Survey was completed later than previous Post Enumeration Surveys increasing the possibility of recall error.
Recall error is treated in the Post Enumeration Survey processing by looking at a wider range of possible addresses in the matching process.
A.4 Key aspects of the 2016 Census and their implication on the Post Enumeration Survey
A number of significant changes implemented for the 2016 Census warranted changes to the 2016 Post Enumeration Survey. Key changes made to the Post Enumeration Survey field collection phase were:
» A sample size increase of 20 per cent. This was predominantly done to deal with a number of operational unknowns when the Post Enumeration Survey sample was being designed (e.g. potential overlap in Census and Post Enumeration Survey enumeration) that could have significantly impacted the Post Enumeration Survey response rates and sample size.
» Later commencement of Post Enumeration Survey enumeration to minimise Census and Post Enumeration Survey overlap in field operations (i.e. increase the opportunity for Census returns prior to the commencement of the Post Enumeration Survey); and
» Extending the Post Enumeration Survey enumeration period to cater for the larger sample although this increased the risk of recall error.
Also introduced into the 2016 Post Enumeration Survey was the opportunity to opt for a telephone interview instead of a face to face interview. This option was implemented in 2016 to provide greater flexibility for respondents and to improve operational efficiencies. This new mode of collection was successfully field tested in 2015. There was a strong response to the new mode, with uptake of telephone interviewing exceeding expectation (an uptake of 32 per cent of the sample, compared to a 20 per cent target). Analysis of the Post Enumeration Survey data confirmed that there was no identifiable mode effect.
There were no fundamental changes to the Post Enumeration Survey sampling and processing methodologies in 2016 as a result of changes to the Census. In particular:
» area-based Post Enumeration Survey sample selection methodology was retained in contrast to the list-based Census model to ensure statistical independence through sourcing dwelling lists with independent procedures;
» Data linking of persons through the use of Automated Data Linking (ADL) is comparable with the 2011 Post Enumeration Survey;
» Some redevelopment of the Match and Search System (MSS) was necessary to ensure the system aligned with the changes made to the 2016 Census enumeration model. Data linking of persons through the MSS is comparable with the 2011 Post Enumeration Survey;
» Prediction Regression Estimation continued to be used for the Post Enumeration Survey estimation. There were minor enhancements in 2016, involving the removal of three marginal benchmarks and the introduction of a Census quality adjustment, however the 2016 estimation process remains comparable to the 2011 cycle; and
» the identification question for Aboriginal and Torres Strait Islander peoples in the 2016 Post Enumeration Survey is comparable with 2011.
Overall, the 2016 Post Enumeration Survey estimates were compiled using methods that are largely consistent with those of 2011.

CENSUS INDEPENDENT ASSURANCE PANEL TO THE AUSTRALIAN STATISTICIAN54

Report on the Quality of 2016 Census Data 55
Appendix B: Accuracy of the Census and the Post Enumeration Survey
This Appendix provides an outline of an accuracy framework the Panel created to assist in its assessment of the accuracy of the Census and the Post Enumeration Survey. Furthermore, it provides an assessment of the accuracy of the Census and the Post Enumeration Survey according to this framework in Sections B.3 and B.4.
B.1 Census accuracy frameworkThe first component of the accuracy framework focuses on the quality of the Census data, and identifies four main groups of potential errors that can impact on quality. These are:
1. Non-response
Non-response error occurs when people refuse to participate in the Census or do not return their Census forms in time for their data to be processed. Key considerations for this error type are:
» The distribution of non-response. If particular sub-populations are more likely than others to non-respond, then the data may not be representative of the entire population. The impact can be reduced by the imputation of persons in non-responding occupied dwellings depending on the accuracy of the imputation process;
» The accuracy of the imputation process determines how well non-response bias is mitigated. Imputation refers to the process whereby missing or erroneous responses are inferred from likely or appropriate information. An important aspect is the determination of whether non-responding dwellings were occupied on Census night or not. This applies to both private and non-private dwellings;
» Item non-response. Some items are not completed on the Census form, either accidentally or deliberately. As forms are processed, these are coded as ‘not stated’ and will have impacts on the quality of the Census data if the item non-response rate is high. Also, for imputed persons, there will be item non-response for all items except for age, sex, registered marital status, and place of usual residence, which are imputed. This will add to the effective item non-response rate.
2. Coverage
After adjusting for non-response, coverage error in the Census is the difference between the number of people and dwellings counted in the Census, compared to the actual number of people and dwellings in Australia on Census night. Coverage error can be due to overcoverage or undercoverage:
» Overcoverage of dwellings can occur when dwellings are listed or counted more than once, or out of scope dwellings are mistakenly included. Overcoverage of persons may occur when people are counted more than once, or when forms for people who do not exist or are outside Australia on Census night are submitted.
» Undercoverage of dwellings can occur when dwellings are missed from the count (e.g. not listed on the Address Register), or are mistakenly considered out of scope. Undercoverage of persons can occur when the Census misses people from the count, which can be due to their dwelling being missed, or because they did not respond and were not correctly identified as a non-respondent.

CENSUS INDEPENDENT ASSURANCE PANEL TO THE AUSTRALIAN STATISTICIAN56
3. Measurement
Measurement error is the difference between what the Census questions are trying to measure and the responses people give to them. Difference can occur due to the way people interpret questions. As the questions and interpretations change over time, this can lead to challenges comparing historical series. Key considerations for this error type are:
» Comparability over time;
» Consistency with external data sources; and
» Internal consistency within the Census data set.
4. Processing
Processing error encompasses all errors introduced in processing the data after collection is complete. Two key types of processing errors are:
» Coding errors, which occur when a response is incorrectly coded (or misclassified) into the wrong category; and
» Imputation errors, which occur when imputed values do not accurately represent the true missing value.
There is a small possibility of some error during the data capture process due to misreading of the paper forms.
B.2 Population estimates accuracy frameworkThe second component of the accuracy framework focuses on the accuracy of the Census data in its use in contributing to population estimates. This component looks at potential errors that may impact on the quality of population estimates from the Post Enumeration Survey and its interaction with the Census, and categorises them into six main groups:
1. Coverage
Coverage error in the Post Enumeration Survey is the difference between the population in scope for selection in the survey and the population that ideally should have been in scope. Dwellings and people could be missed due to deficiencies in the area frame used for the survey or imperfect field procedures, leading to undercoverage.
2. Sampling
Sampling error is random error resulting in either an underestimate or an overestimate as the Post Enumeration Survey is a sample survey. Sampling errors will be relatively higher for the more detailed estimates.
3. Non-response
Similar to that for the Census, non-response error for the Post Enumeration Survey occurs when people do not return their forms in time for their data to be processed. Key considerations for this error type are also the distribution of non-response (i.e. representativeness of the achieved sample), and the level of item non-response.
4. Measurement
Similar to that for the Census, measurement error for population estimates is the difference between what the Census questions are trying to measure and the responses people give to them. Of particular interest for population estimates is consistency between the way people respond to the Post Enumeration Survey and the Census.
5. Processing
Processing error encompasses all errors introduced in processing the data after the Post Enumeration Survey collection is complete. A key processing error is matching error, which occurs if processing does not correctly match persons counted in the Post Enumeration Survey sample to their corresponding record in the Census.
6. Model Model error occurs when the underlying assumptions in the model used to estimate Census overcoverage and undercoverage. For example, the model makes assumptions of statistical independence within population sub-groups when the Post Enumeration Survey and the Census miss the same people. This may not be a valid assumption in practice.

Report on the Quality of 2016 Census Data 57
Appendix B: Accuracy of the Census and the Post Enumeration Survey
B.3 Assessment of the Census against the accuracy framework1. Coverage (see Section 3.2)
Net overcount for persons imputed is 2.1 per cent, increased from 1.2 per cent in 2011. This is a statistically significant increase. This is due to incorrect determination of dwellings as occupied on Census night when in reality they were unoccupied, and too many persons imputed especially for non-private dwellings.
Net undercount for persons on Census forms in 2016 at 3.0 per cent is slightly higher than 2.9 per cent in 2011. This is not statistically significant. However, gross undercount and gross overcount have both increased. One component of the undercount is persons missed on the Census form and persons in dwellings missed by the Census. This component has increased from 3.6 per cent in 2011 to 4.3 per cent but only part of this increase would be due to missed dwellings. These small increases suggest that there is no significant difference in the coverage from using the Address Register rather than the address canvassing method used in the 2011 and earlier Censuses. This is discussed further under non-response error.
There seems to have been improved coverage of people born in specific countries (e.g. China) as a result of engagement activities with these communities. However, this has been offset by reduced coverage of people who were born in Australia.
2. Non-response (see Section 3.3)
Non-response increases the risk of bias. The dwelling response rate for private dwellings is calculated as 95.1 per cent in 2016 compared with 96.5 per cent for 2011, however the 2016 calculation is likely to be an underestimation as detailed below. Upon completion of the field phase, imputation is the main method for dealing with potential non-response bias. Its effectiveness for dealing with non-response bias depends on the accuracy of the imputation process. There are two aspects to imputation accuracy:
1. Determining which non-responding dwellings were occupied on Census night; and
2. The imputation process accurately reflects the age, sex and marital status characteristics of non-responding dwellings.
On the first point, the Post Enumeration Survey suggests that a small proportion of dwellings were incorrectly imputed because they were incorrectly determined as being occupied on Census night when they were actually unoccupied. On the second point, it appears that the hot-deck imputation method did not sufficiently impute younger age groups and over-imputed older age groups but the extent of this not known.
Figure B.3.1 Imputed people by Age, Australia: 2016
0
20 000
40 000
60 000
80 000
100 000
120 000
0-4 85+
80-84
75-79
70-74
65-69
60-64
55-59
50-54
45-49
40-44
35-39
30-34
25-29
20-24
15-19
10-145-9
Age group (years)
Pers
ons
Note: Excludes overseas visitors and Other Territories.

CENSUS INDEPENDENT ASSURANCE PANEL TO THE AUSTRALIAN STATISTICIAN58
Both issues are likely to have existed in 2011 as well but the impact is higher in 2016. The ABS has informed the Panel that the process of determining whether a home is occupied has become more difficult with the increase in the number of people living in high-density, secure buildings and the decreasing likelihood of making doorstep contact. Further, the changes to the 2016 Census approach increased this challenge through reducing the number of field officers and extending the period of collection.
When a home is classified as occupied on Census night the ABS will create the residents of this dwelling using a process called imputation. This aims to produce households that are representative of the people missed in the Census in relation to household size, sex, ages and marital status.
The Post Enumeration Survey provides a comparison of the number of people created through imputation and the number of people that should have been created. As in previous Censuses, the ABS has created more people in 2016 than were actually missed and, as noted above, this increases over-imputation in the 2016 Census from 1.2 per cent to 2.1 per cent.
In addition to the issues noted above, this change had a number of other observable impacts to 2016 Census data and quality measures:
1. Lower reporting of the number of vacant homes – the percentage of unoccupied private dwellings reported on Census night was 10.5 per cent, however could have been roughly one percentage point higher;
2. Lower reporting of Census response rate – the Census response rate is reported at 95.1 per cent, however if all unoccupied homes were excluded from the calculation the response rate could have been roughly one percentage point higher;
3. Higher reporting of Census item non-response – created persons are the biggest contributor to records that have ‘not stated’ characteristics; without the additional persons created the level of item non-response would have been around one per cent lower; and
4. Uneven impact across ages – the process of creating persons is not perfect and the estimates of the age and sex of created persons may differ from reality. While the creation of records has reduced the net undercount from ages 15 to 40, the net undercount has increased from ages 0 to 14 and a net overcount has been introduced from ages 45 and over.
Item non-response rates tend to be slightly higher than 2011 mainly due to the increased number of imputed records where ‘not stated’ will be recorded for all Census variables except age, sex and marital status. Without the imputed records, item non-response rates would be lower than 2011 mainly due to the increased use of the online form where questions tend to be answered more accurately.
3. Measurement (See Section 3.6)
For the variables examined, the Panel could not identify any significant new measurement errors by comparing 2016 and 2011 Census results. For religion, the ‘no religion’ category was moved to the top of the set of tick boxes. This is likely to have increased the propensity of persons to tick this category. There has been a significant increase in the number of persons identifying as no religion. This is consistent with past trends but an unknown proportion of the increase is likely to be due to the tick box ordering.
4. Processing
The Panel did not examine the accuracy of the coding process. As noted above, there are shortcomings in the imputation process. These would have existed in 2011 but the impact appears to be greater in 2016.

Report on the Quality of 2016 Census Data 59
Appendix B: Accuracy of the Census and the Post Enumeration Survey
B.4 Assessment of the Post Enumeration Survey against the accuracy framework1. Coverage
There has been no change in the target population of the Post Enumeration Survey in 2016 compared with 2011, which includes all private dwellings in Australia but excludes non-private dwellings. An area based multi-stage area sample is still used.
2. Sampling
The sample size has been increased by 20 per cent. However, the sampling error has increased slightly overall, due to an increase in the variability of components of overcount and undercount in the Census. The actual sampling errors are shown in Table B.4.1.
Table B.4.1 presents net undercount rates and standard errors for each state and territory. As can be seen, the level of variance in 2016 is comparable with 2011.
Table B.4.1 Net undercount rate, by state/territory of usual residence: 2011 and 2016
2016 2011
% Standard error % Standard error
New South Wales 0.8 0.4 1.9 0.4
Victoria 1.4 0.4 1.1 0.3
Queensland 1.3 0.5 1.8 0.4
South Australia 0.2 0.5 1.1 0.4
Western Australia 0.4 0.6 2.5 0.5
Tasmania 0.1 0.7 2.0 0.6
Northern Territory 5.0 1.5 6.9 1.3
Australian Capital Territory
-1.1 1.4 0.7 0.8
Australia 1.0 0.2 1.7 0.2
Note: A negative value indicates a net overcount.

CENSUS INDEPENDENT ASSURANCE PANEL TO THE AUSTRALIAN STATISTICIAN60
3. Non-response/Correlated Response Bias
The total number of fully responding dwellings in the 2016 Post Enumeration Survey was 42,463. This represented a response rate of 91.2 per cent for the general population sample (a decrease from 94.0 per cent in 2011) and 92.7 per cent for the Discrete Community sample (a decrease from 96.4 per cent in 2011). This increase in non-response rate increases the risk of non-response bias and correlated response bias in particular. This could lead to a negative bias in estimates but there is no evidence of this being an issue.
Table B.4.2 Response rates, by state/territory: 2011 and 2016
NSW Vic. Qld SA WA Tas. NT ACT Aust.
2016
General Population
89.1 91.3 92.4 93.2 93.3 94.9 84.4 91.6 91.2
Discrete Communities
78.6 – 92.7 100.0 89.5 – 93.4 – 92.7
2011
General Population
92.2 93.2 93.9 95.8 95.7 95.5 93.6 96.5 94.0
Discrete Communities
– – 97.7 92.3 96.2 – 96.4 – 96.4
– Nil or rounded to zero (including null cells).
A technique known as propensity analysis was conducted on both the Census and Post Enumeration Survey to assess the main drivers of non-response25. Broadly speaking, this analysis used Post Enumeration Survey data to model the propensity for a person to complete a Census form and Census data to model the propensity for a person to complete the Post Enumeration Survey. Outcomes from this analysis were used to determine benchmarks for use in the weighting used in the Post Enumeration Survey estimation process. The variables used in the weighting process included state and/or territory, and part of the state and/or territory of usual residence, sex, five year age groups, marital status, country of birth, Indigenous status, and whether located in a discrete Aboriginal or Torres Strait Islander community.
4. Measurement
Recall error may be more significant in 2016 because of the longer Census enumeration period. Recall error depends on whether there is an anchor point to assist people’s recollection. The significant publicity around the Census night outage makes it more likely that respondents would be able to recall where they were on Census night.
Recall bias was assessed as being no more a risk in 2016 than in previous Post Enumeration Surveys.
» Memory effects for major events (which Census is designed to be) tend to wane after 1 to 2 weeks, and would have been little worse after 9 to 10 weeks for the 2016 Post Enumeration Survey than they would have been after 5 to 6 weeks for the 2011 Post Enumeration Survey.
» In addition, the requirement to recall information about Census night in 2016 was examined in the context of Automated Data Linking. Automated Data Linkage provides an enhanced ability to search for, and match, Post Enumeration Survey persons to their Census form, utilising a variety of search addresses and personal identifier information. Therefore, the requirement for persons to recall their exact whereabouts on Census night is reduced, provided they can correctly recall whether or not they were in Australia (i.e. whether they should have been counted at all).
Modal effects related to the increased use of telephone interviewing for the Post Enumeration Survey were assessed by the ABS as not a significant risk. There was an assessment of possible modal effects during Post Enumeration Survey processing.
25 Chipperfield J, Brown J, and Bell P. Estimating the Error Count in the Australian Census. Journal of Official Statistics, Vol 33, Issue 1.
Report on the Quality of 2016 Census Data 61
Appendix B: Accuracy of the Census and the Post Enumeration Survey
5. Processing
Matching error should be lower in the 2016 post Enumeration Survey because of the improved matching procedures.
Outcomes from linking and matching processes underwent a high level of scrutiny and quality assurance in 2016, to ensure that the Post Enumeration Survey did not miss links for Post Enumeration Survey persons who were actually counted in the Census, and did not link a Post Enumeration Survey person to a Census record in error.
Final match rates for the general population for persons with at least one link to 2016 Census were lower than the 2011 equivalents (91.1 per cent and 92.6 per cent, respectively). This decrease was driven by a reduction in Census response rates. However, more high quality links were found by Automated Data Linking in 2016 that did not require clerical review, compared to 2011 (65.1 per cent and 59.8 per cent, respectively). This is likely to be a result of improved capture of text fields such as names resulting from increased online Census uptake.
Given a key requirement for successfully linking a Post Enumeration Survey person to their corresponding Census record is a sufficient level of data quality, a quality adjustment was introduced in 2016. This method identified Census records that had insufficient personal identifier information, which is required for linking to records in the Post Enumeration Survey (e.g. where Census data was missing or imputed for multiple linking variables, such as name, age or date of birth, and sex).
To remove the potential for any upward bias on the Post Enumeration Survey estimate of population totals (and level of net undercount), these records were treated in a similar fashion to late returns. This adjustment moved 33,000 Census persons or 0.14 per cent of all persons counted in the Census. Analysis of the impact of this quality adjustment shows that it reduced the estimated net undercount rate for Australia by 0.10 percentage points.
6. Model
The ABS advises that the estimation model referred to in the section on non-response/correlated response bias, which is used to produce estimates and adjust for non-response appears to have worked effectively. However, there are no measures of the residual non-response bias.

CENSUS INDEPENDENT ASSURANCE PANEL TO THE AUSTRALIAN STATISTICIAN62
Report on the Quality of 2016 Census Data 63
Appendix C: Terms of reference of the Panel
C.1 RoleThe Australian Statistician is establishing the 2016 Census Independent Assurance Panel to provide an independent view of the quality of statistical outputs from the 2016 Census of Population and Housing. The Panel should request and review all information it considers relevant in order to form a judgment and report on the quality of 2016 Census statistics.
C.2 ResponsibilitiesThe Panel shall provide a written report no later than 16 June 2017 to the Australian Statistician giving its view on aspects of quality of 2016 Census outputs, having considered issues including, but not limited to Census design, enumeration, processing and quality assurance. The quality should be assessed using the quality of outputs from the 2011 and 2006 Censuses as benchmarks.
This report will be made publicly available on 27 June 2017, so that government, the community and other stakeholders can make their own informed judgments about the fitness-of-purpose of 2016 Census data.
C.3 Composition and tenureThe membership of the Panel is:
» Chair – Professor Sandra Harding, Vice Chancellor and President of James Cook University
» Professor Lisa Jackson Pulver AM, Pro Vice-Chancellor Engagement, Pro Vice-Chancellor Aboriginal and Torres Strait Islander Leadership, University of Western Sydney, and member of the Australian Statistical Advisory Council
» Professor Peter McDonald AM, Head of Demography within the Centre for Health Policy, University of Melbourne
» Peter Morrison, former Assistant Chief Canadian Statistician who was responsible for running the Canadian Census
» Dennis Trewin AO, ex-Australian Statistician (2000–2007)
» Anton Voss, Deputy Secretary, Tasmanian Department of Treasury and Finance, and member of the Australian Statistical Advisory Council
The Panel will be active from November 2016 until late June 2017, when the Panel’s report is released on 27 June 2017. The official release of 2016 Census data, rebased Estimated Resident Population data, and results of the Post Enumeration Survey will also be released on 27 June 2017.

CENSUS INDEPENDENT ASSURANCE PANEL TO THE AUSTRALIAN STATISTICIAN64
C.4 Committee practicesIt is anticipated that the Panel will meet approximately 7 times during its tenure, particularly around key times in Census processing i.e. as relevant information becomes available.
The Panel shall be free to request any information from the ABS it sees as relevant in order for it to form its view, and the ABS shall comply with all such requests in a timely manner (as long as they are consistent with relevant legislation such as the Census and Statistics Act 1905).
The Panel will be supported by a Secretariat, headed by Sue Taylor, Director, Census Data Assurance.
C.5 How the Terms of Reference have been addressedThe Panel have examined each of the four aspects of the Terms of Reference and are comfortable that these are covered throughout the report.

Report on the Quality of 2016 Census Data 65
GlossaryTerm Meaning
Aboriginal and Torres Strait Islander person
According to the Commonwealth definition26, an Aboriginal or Torres Strait Islander is a person of a. Aboriginal and Torres Strait Islander descent, b. who identifies as an Aboriginal or Torres Strait Islander and c. is accepted as such by the community in which he or she lives.
The Census and Post Enumeration Survey collect information on a person’s reported Indigenous Status. See Indigenous Status.
Accuracy Framework A framework developed by the Census Independent Assurance Panel for use in assessing the sources and types of error that might affect the accuracy of the Census and population estimates. This framework is covered in detail in Appendix B.
Address register A comprehensive list of Australian addresses developed using the Geocoded National Address File and supplemented by a manual canvassing exercise. The Address Register does not contain any information about the occupants of the address. The Address Register was built by the ABS in the lead up to the 2016 Census, and is regularly updated by its management team. The Address Register is a national resource that is owned and hosted by the ABS.
Anchor point In the context of the Census, an anchor point is an event that assists in the recollection of a person, dwelling or family’s circumstances on Census night.
Australian States and Territories
The ABS identifies six states and six territories in Australia. The six states are New South Wales, Victoria, Queensland, South Australia, Western Australia, and Tasmania. The six territories are Northern Territory, Australian Capital Territory, Jervis Bay Territory, Territories of Christmas Island, Cocos (Keeling) Islands, and Norfolk Island.
Automated Data Linking Automated processes used to determine possible links between Census and Post Enumeration Survey data, before any clerical matching processes (such as the match and search system) has begun. It links records by using a range of personal and addresses characteristics to evaluate the likelihood that a Post Enumeration Survey and Census record pertain to the same individual.
Census The Australian Census of Population and Housing is an official count of population and dwellings, and collects details of age, sex, and other characteristics of that population. The Census is conducted every five years, and asks respondents to complete their Census form about their circumstances on Census night.
Census accuracy framework
See accuracy framework
Census form The questionnaire used by people to provide person and dwelling information as part of the Census. The Census form is available online or on paper.
Census frame The collection of Census-relevant address information based on the Address Register and other information obtained from Census field officers, the Census Inquiry Service and other ABS staff. This includes information such as dwelling type and structure and street address.
Census Inquiry Service A service that people could call or email to provide updated information or otherwise enquire for information about obtaining Census forms, completing the Census or any other Census related concern. The Census Inquiry Service opened on 22 July 2016 and closed on 30 September 2016. Following 30 September, calls to the Census Inquiry Service were redirected to the ABS.
Census night For the 2016 Census, Census night was the night of 9 August 2016. People are asked to complete their Census form about their personal circumstances on Census night, but do not have to complete their Census form on Census night.
26 Department of Aboriginal Affairs, 1981. Report on a review of the administration of the working definition of Aboriginal and Torres Strait Islander, Canberra: Commonwealth of Australia. Department of the Parliamentary Library, 2003. Defining Aboriginality in Australia, Canberra. Commonwealth of Australia.

CENSUS INDEPENDENT ASSURANCE PANEL TO THE AUSTRALIAN STATISTICIAN66
Term Meaning
Contact sector In the context of the Post Enumeration Survey, the Census contact sector comprises all dwellings that were determined to be occupied on Census night and from which a form was received before the Post Enumeration Survey commenced data collection.
For simplicity, this report refers to “Persons on Census forms” in place of the technical term “Contact Sector”.
See non-contact sector
Correlation bias A bias that can result for Post Enumeration Survey estimates if Statistical Independence is not preserved, that is to say if persons are systematically missing from both the Census and Post Enumeration Survey, beyond what demographic or geographic variables can explain.
See statistical independence
Coverage Coverage describes the extent to which people or dwellings that are in scope of the Census are counted in the Census.
Data item A Census data item (or variable) is a characteristic of a person, dwelling or family that is collected in the Census.
Derivation The process where some variables are assigned values based on responses to other questions, or (where no response has been provided) from other family members present in the same dwelling. For example, if a person provides their date of birth on their Census form and does not provide an age, then their age is derived (calculated) based on their provided date of birth.
Discrete Communities A Discrete Community is a geographic location, bounded by physical or legal boundaries, which is inhabited or intended to be inhabited predominantly by Aboriginal or Torres Strait Islander peoples, with housing or infrastructure that is managed on a community basis.
Drop off field area See field area
Dwelling A dwelling is a structure which is intended to have people live in it, and which is habitable on Census night. Some examples of dwellings are houses, motels, flats, caravans, prisons, tents, humpies and houseboats. The two main types of dwelling are private and non-private dwellings.
A private dwelling is one that accommodates a person or a group of people and is not generally available for public use. The main purpose of a dwelling is as a place of habitation, and it is usually built (or converted) to function as a self-contained housing unit.
A non-private dwelling is one that provides short or long-term communal or transitory type accommodation. Non-private dwellings are generally available to people for reasons of employment, study, special need, legal requirement or recreation. For example, hotels, hospitals, and prisons are all classified as non-private dwellings.
Dwelling non-response Occurs when a completed Census form has not been returned for a private dwelling determined to be occupied on Census night.
Dwelling non-response rate
The percentage of private dwellings identified as occupied on Census night that did not return a Census form.
Dwelling response Occurs when a Census form is returned for a private dwelling identified as occupied on Census night.
Dwelling response rate The percentage of private dwellings identified as occupied on Census night that returned a Census form.
Enumeration The process by which Census information is collected about people and dwellings in Australia on Census night. The enumeration process takes many months to complete, and includes the delivery of Census forms or online login codes, the completion of the Census by members of the public, and the return of Census responses to the ABS, as well as other associated activities.
Estimated Resident Population
The official measure of the population of Australia based on the concept of usual residence. It refers to all people, regardless of nationality, citizenship or legal status, who usually live in Australia, with the exception of foreign diplomatic personnel and their families. It includes usual residents who are overseas for less than 12 months over a 16 month period. It excludes overseas visitors who are in Australia for less than 12 months over a 16 month period.

Report on the Quality of 2016 Census Data 67
Glossary
Term Meaning
Field area A geographical area that is designed to help the ABS conduct the Census. There are two types of field areas: drop off field areas and mail out field areas.
Dwellings within a drop off field area are visited by field officers to deliver paper Census forms to each dwelling.
Dwellings within a mail out field area are first contacted by the ABS via mail, and are posted log in details to complete the online Census form, or a paper Census form.
Field officer An ABS employee who is responsible for conducting Census enumeration within a designated field area.
Fitness-for-purpose Fitness-for-purpose refers to data that are able to be used for its stated and intended purpose.
Gross overcount Number of persons counted more than once on Census forms, or otherwise counted on Census forms when they should not have been, as measured by the Post Enumeration Survey.
Gross undercount Number of persons missed from Census forms or in dwellings missed by the Census, as measured by the Post Enumeration Survey.
Hot-decking The primary imputation method used for the 2016 Census. The method involves locating a donor record and copying the relevant responses to the record requiring imputation. The donor record must have similar characteristics to the record requiring imputation, and must also have responses to some specific data item(s). In addition, the donor record must be located geographically as close as possible to the location of the record to be imputed.
Imputation A statistical process for predicting values where no response was provided to a question and a response could not be derived (see derivation). The Census imputes persons into non-responding dwellings that are determined to be occupied on Census night. This is known as person imputation. The Census also imputes missing responses for some data items (age, sex, marital status, and place of usual residence) for responding persons who left these fields blank.
Indigenous status The Census and the Post Enumeration Survey use the ABS Standard Indigenous Question27 to collect information for the ‘Indigenous Status’ variable. The ABS Standard Indigenous Question is based upon the Commonwealth working definition (see Aboriginal and Torres Strait Islander person) but does not include the third element of the Commonwealth definition, namely that ‘an Aboriginal or Torres Strait Islander is a person who is accepted as such by the community in which he or she lives’. Collecting information on the basis of community acceptance is often impractical in a survey or administrative data collection setting and can lead to inaccuracies. For these reasons, it is not included in the ABS Standard. The definition of Indigenous Status is therefore operationalised as whether or not a person identifies as being of Aboriginal or Torres Strait Islander origin.
The term ‘origin’, when used in the context of the operational definition, is considered to relate to a person’s Australian Aboriginal and/or Torres Strait Islander descent and for some, but not all, their cultural identity.
The standard term for this variable is ‘Indigenous Status.’ ‘Indigenous status’ is an acceptable term for use in data collection only, and only in terms of identifying a characteristic of a person. A person’s Indigenous status is determined by their response to the ABS Standard Indigenous Question: “Are you of Aboriginal or Torres Strait Islander origin?” for which categories are: No; Yes, Aboriginal; or Yes, Torres Strait Islander. This question also allows respondents to report that they are both ‘Aboriginal’ and ‘Torres Strait Islander’ if that is how they identify.
27 Australian Bureau of Statistics (2014). 1200.0.55.008 Indigenous Status Standard, 2014, Version 1.5. Retrieved from http://www.abs.gov.au/ausstats/[email protected]/mf/1200.0.55.008
CENSUS INDEPENDENT ASSURANCE PANEL TO THE AUSTRALIAN STATISTICIAN68
Term Meaning
Item non-response Item non-response occurs in two situations:
» where a household or person returns a form but does not answer one or more questions - these are “item non-response”, and
» where key variables for a non-responding person have been imputed, the remainder of questions are either set to “item non-response” or “not applicable”, dependant on the imputed age of the person.
Item non-response rate The item non-response rate is calculated by dividing the number of households or persons who provided a response to a particular question by the number of persons for whom the question would have been applicable, and is expressed as a percentage.
Mail out field area See field area
Match and search system The main clerical tool used in the processing of the Post Enumeration Survey data, which allows processors to search, view, compare, and record matches between Post Enumeration Survey and Census records.
Net overcount See net undercount
Net undercount Net undercount is the difference between an estimate of the number of people who should have been counted in the Census and the actual Census count (including imputations). This estimate is based on the Post Enumeration Survey conducted after each Census. For a category of person (e.g. based on age, sex and state of usual residence), net undercount is the result of Census undercount, overcount, differences in classification between the Post Enumeration Survey and Census, and imputation error.
A positive net undercount indicates that there are more people that should have been counted in the Census than there were counted in the Census.
A negative net undercount is often referred to as a net overcount. A net overcount indicates that there are more people counted in the Census than there should have been. This can be the result of too many people being imputed in the Census.
Non-contact sector In the context of the Post Enumeration Survey, the Census non-contact sector comprises dwellings that were determined to be occupied on Census night, from which no Census form was received (imputed dwellings) or a Census form was received after the Post Enumeration Survey commenced data collection (late returns), and person responses that had insufficient identifier information.
For simplicity, this report refers to “Persons imputed” in place of the technical term “non-contact sector”.
See contact sector
Non-private dwelling See dwelling
Non-response In the context of the Census, there are three types of non-response: dwelling non-response, person non-response, and item non-response. If it is not specified, typically “non-response” refers to dwelling non-response.
Non-response rate In the context of the Census, there are three types of non-response rates: dwelling non-response rate, person non-response rate, and item non-response rate. If it is not specified, typically “non-response rate” refers to the dwelling non-response rate.
Occupied private dwelling A private dwelling at which it was determined that a person or people were present on Census night.
Other Territories A category of the Australian Statistical Geography Standard at the State and/or Territory level that has been created for statistical purposes. In 2016, Other Territories includes the territories of Jervis Bay Territory, Territories of Christmas Island, Cocos (Keeling) Islands, and Norfolk Island. The inclusion of Norfolk Island in Other Territories in new for 2016.
Overcount Any effect where the Census count exceeds the true population.
See gross overcount
Person imputation See imputation
Person response Occurs when a person is included on a returned Census form or their information is provided to the Census via administrative data.

Report on the Quality of 2016 Census Data 69
Glossary
Term Meaning
Person response rate The percentage of all people identified in the Census (including those who are imputed) that are included on a returned Census form or that have their information provided to the Census via administrative data.
Place of enumeration The address at which a person spent Census night.
Place of usual residence The address at which a person has lived, or intends to live, for a total of six months or more in a given year.
Post Enumeration Survey The Census Post Enumeration Survey is a household survey conducted following the Census. The Post Enumeration Survey allows the ABS to estimate the number of people missed in the Census and the number counted more than once or in error. The Post Enumeration Survey is conducted independently to the Census.
Results obtained in the Post Enumeration Survey are used to adjust Census counts in the calculation of Estimated Resident Population figures for Australia.
Post Enumeration Survey population estimate
An estimate (based on the Post Enumeration Survey and Census data) of the number of people who should have been counted in the Census.
Population estimates See Estimated Resident Population
Population estimates accuracy framework
See accuracy framework
Prediction regression estimation
A statistical process used in the Post Enumeration Survey to estimate net undercount.
Private dwelling See dwelling
Rebased/rebasing After every Census, the Estimated Resident Population is recalibrated, or ‘rebased’. Rebasing is the process of adding the net overcount or net undercount from the Post Enumeration Survey to the new Census population counts separately at the State/Territory, age and sex group level. Further demographic and time adjustments are then made before the Estimated Resident Population data is finalised.
After each Census, the ABS uses Census counts by place of usual residence which are adjusted for undercount to construct a new base population figure for 30 June of the Census year. Because this new population estimate uses the Census as its main data source, it is said to be ‘based’ on that Census and is referred to as a population base.
Rebasing refers to the process by which the ABS uses this new base to update all previously published quarterly population estimates from the previous Census to the most recent Census (the intercensal period).
Response In the context of the Census, there are three types of response: dwelling response, person response, and item response. If it is not specified, typically “response” refers to dwelling response.
Response rate In the context of the Census, there are three types of response rates: dwelling response rate, person response rate, and item response rate. If it is not specified, typically “response rate” refers to the dwelling response rate.
Scope of the Census The Census includes all people who spent Census night in Australia in one of the six Australian states, the Northern Territory, the Australian Capital Territory, Jervis Bay Territory or the Territories of Christmas Island, Cocos (Keeling) Islands and Norfolk Island. All occupied and unoccupied private dwellings are included.
The only groups of people who spend Census night in Australia but are excluded from the Census are foreign diplomats and their families. Unoccupied private temporary dwellings (for example caravans and tents), unoccupied typically uninhabitable dwellings (for example sheds or structurally unsound houses) and unoccupied non-private dwellings are excluded from the Census.
Secondary dwellings Flats and other structures attached to houses, dwellings, shops and offices for the purpose of habitation.

CENSUS INDEPENDENT ASSURANCE PANEL TO THE AUSTRALIAN STATISTICIAN70
Term Meaning
Special strategies A range of approaches used by the ABS for specific population groups to improve the coverage of people in Australia, and ensure these groups participate in the Census and accurate information is collected. Special strategies exist for a range of population groups, such as Aboriginal and Torres Strait Islander peoples, people with disabilities, people experiencing homelessness, people from culturally and linguistically diverse backgrounds, people travelling or away from their home on Census night, and people staying in non-private dwellings on Census night.
Statistical independence Statistical independence is a mathematical assumption that underlies the Post Enumeration Survey estimation. In the context of the Post Enumeration Survey, statistical independence requires both population independence (that people who were not counted in the Census are no more likely to be missed by the Post Enumeration Survey than people who were counted) and operational independence (that Census operations do not influence Post Enumeration Survey operations and vice versa).
Targeted supplementary questions
A new feature of the online Census form in 2016 designed to achieve a finer level of data for the occupation and industry topics. For example, if the response to the occupation question is provided as “nurse”, a targeted supplementary question would be asked to confirm the specific type of nurse.
Total net undercount The total net undercount is the same as net undercount. The use of the word “Total” is to distinguish from components such as net undercount for persons on Census forms and net overcount for persons imputed.
Undercount Any effect whereby the Census count falls short of the true population.
See gross undercount
Unoccupied private dwelling
A private dwelling at which it was determined no people were present on Census night.
Usual residence See place of usual residence
Variable See data item

Report on the Quality of 2016 Census Data 71

CENSUS INDEPENDENT ASSURANCE PANEL TO THE AUSTRALIAN STATISTICIAN72