Embed Size (px)
Citation preview
All in format ion embargoed unt i l ?day, ?? ?, 12:01 a .m. EDT.
Report on the MLA Job Information List, 2016–17
MLA Office of ResearchWeb publication, December 2017
All material published by the Modern Language Association in any medium is protected by copyright. Users may link to this report freely and may quote from MLA publications as allowed by the doctrine of fair use. Written permis-sion is required for any other reproduction of material from any MLA publication.
Send requests for permission to reprint material to the MLA permissions manager by mail (85 Broad Street, suite 500, New York, NY 10004-2434) or e-mail ([email protected]).
© 2017 by The Modern Language Association of America
the modern language association of america 1
All in format ion embargoed unt i l ?day, ?? ?, 12:01 a .m. EDT.
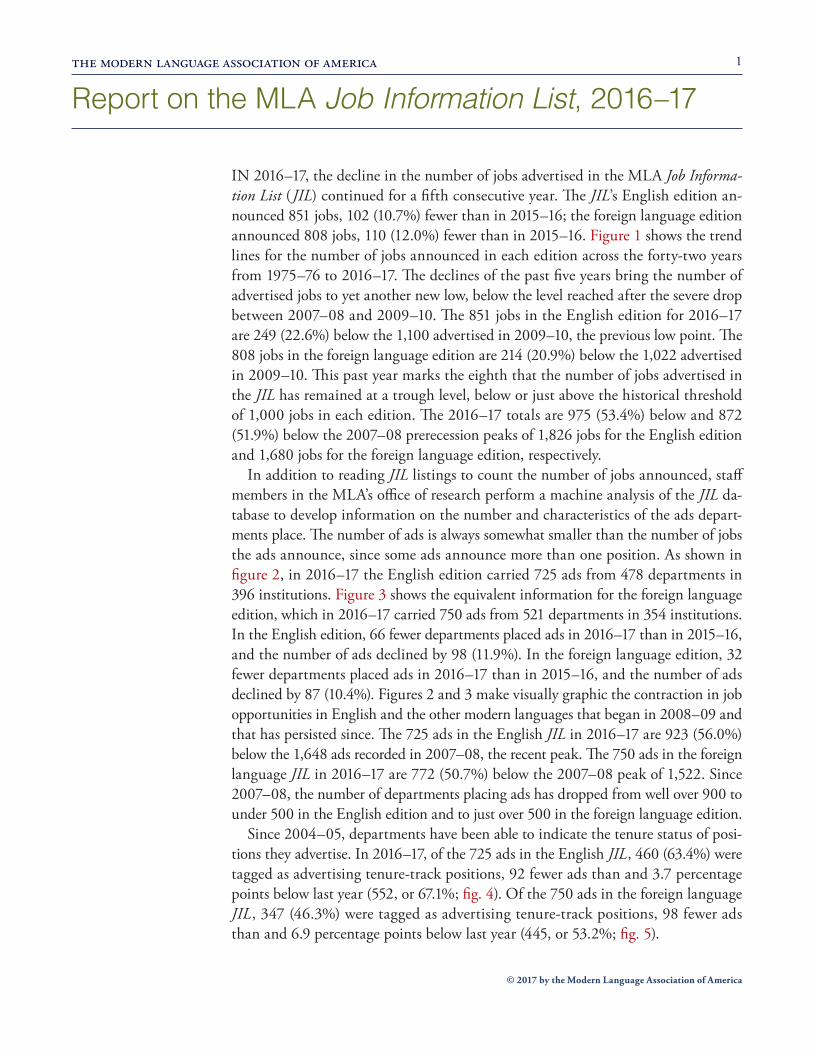
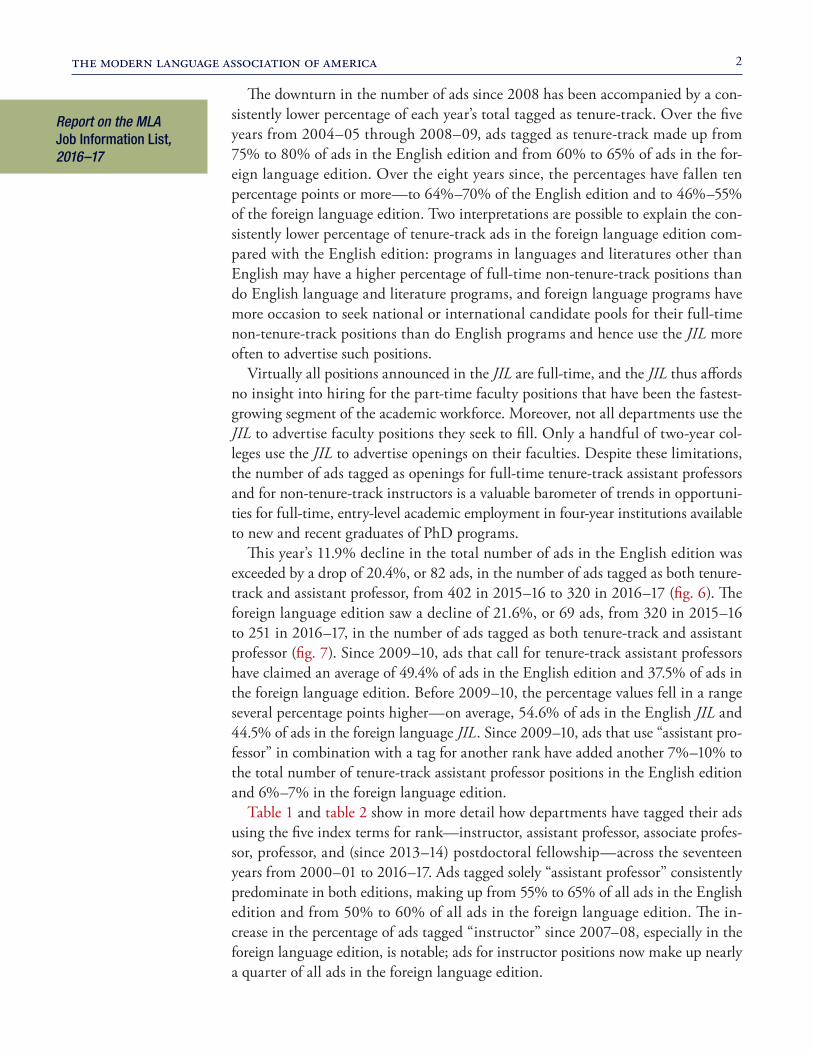
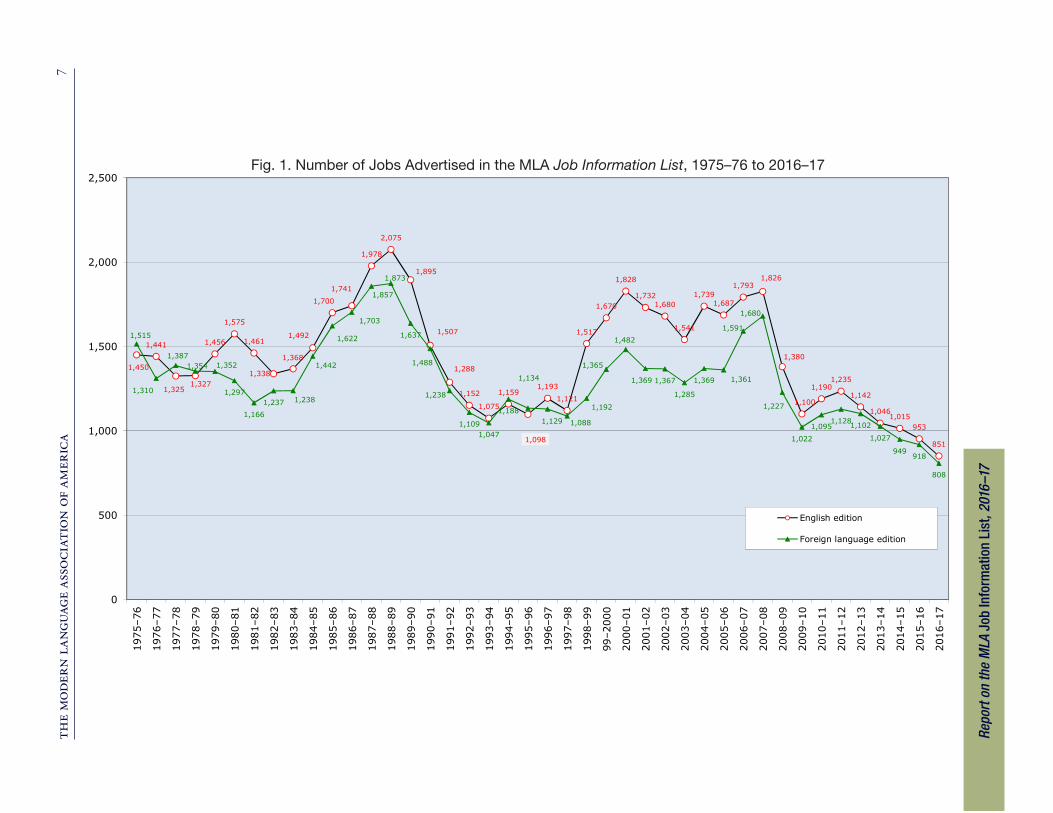
IN 2016–17, the decline in the number of jobs advertised in the MLA Job Informa-tion List (JIL) continued for a fifth consecutive year. The JIL’s English edition an-nounced 851 jobs, 102 (10.7%) fewer than in 2015–16; the foreign language edition announced 808 jobs, 110 (12.0%) fewer than in 2015–16. Figure 1 shows the trend lines for the number of jobs announced in each edition across the forty-two years from 1975–76 to 2016–17. The declines of the past five years bring the number of advertised jobs to yet another new low, below the level reached after the severe drop between 2007–08 and 2009–10. The 851 jobs in the English edition for 2016–17 are 249 (22.6%) below the 1,100 advertised in 2009–10, the previous low point. The 808 jobs in the foreign language edition are 214 (20.9%) below the 1,022 advertised in 2009–10. This past year marks the eighth that the number of jobs advertised in the JIL has remained at a trough level, below or just above the historical threshold of 1,000 jobs in each edition. The 2016–17 totals are 975 (53.4%) below and 872 (51.9%) below the 2007–08 prerecession peaks of 1,826 jobs for the English edition and 1,680 jobs for the foreign language edition, respectively.
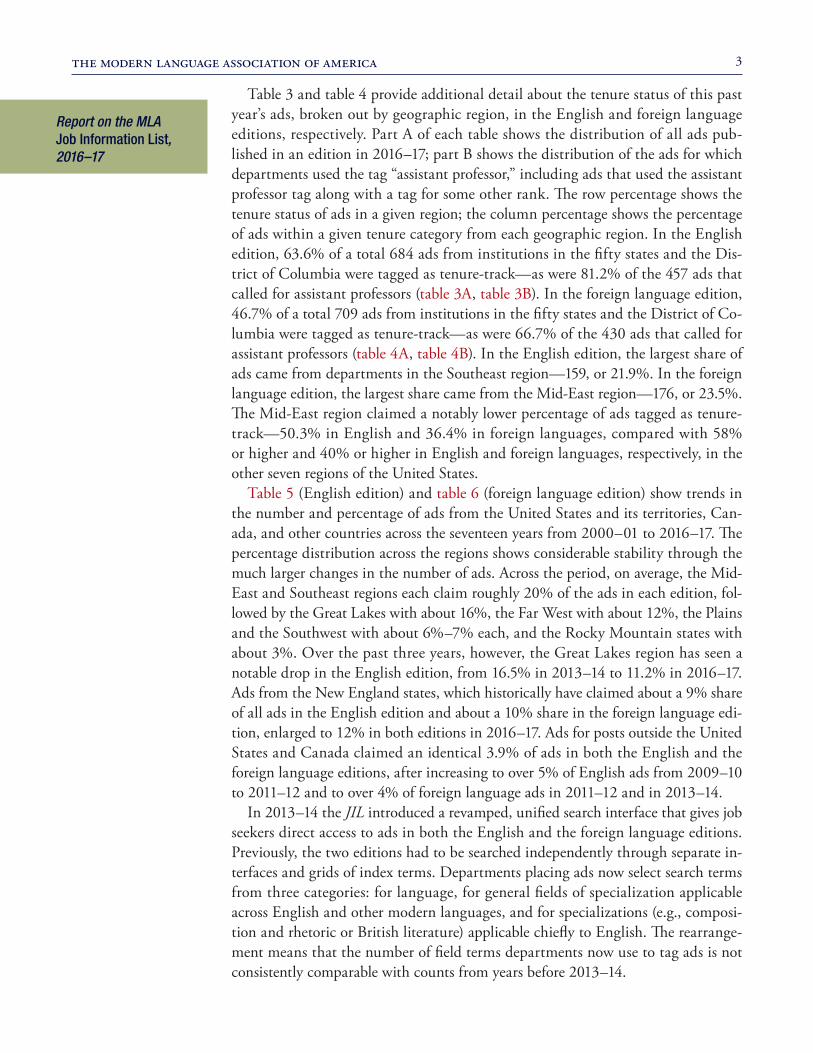
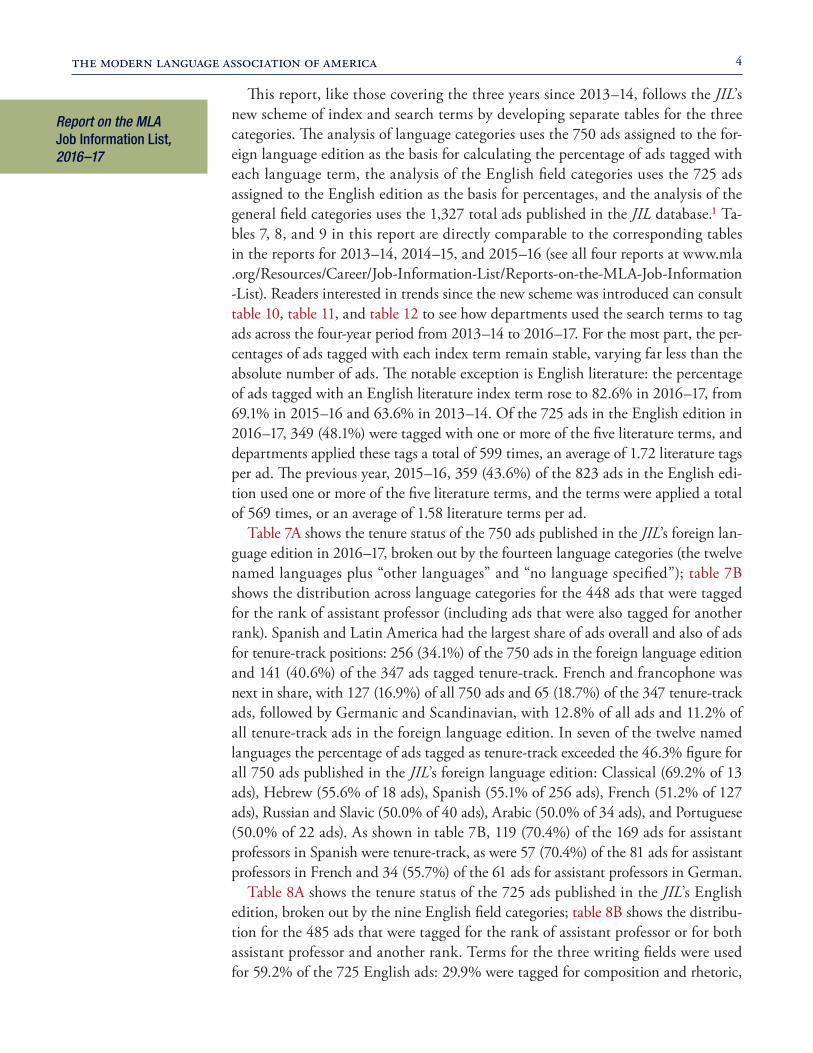
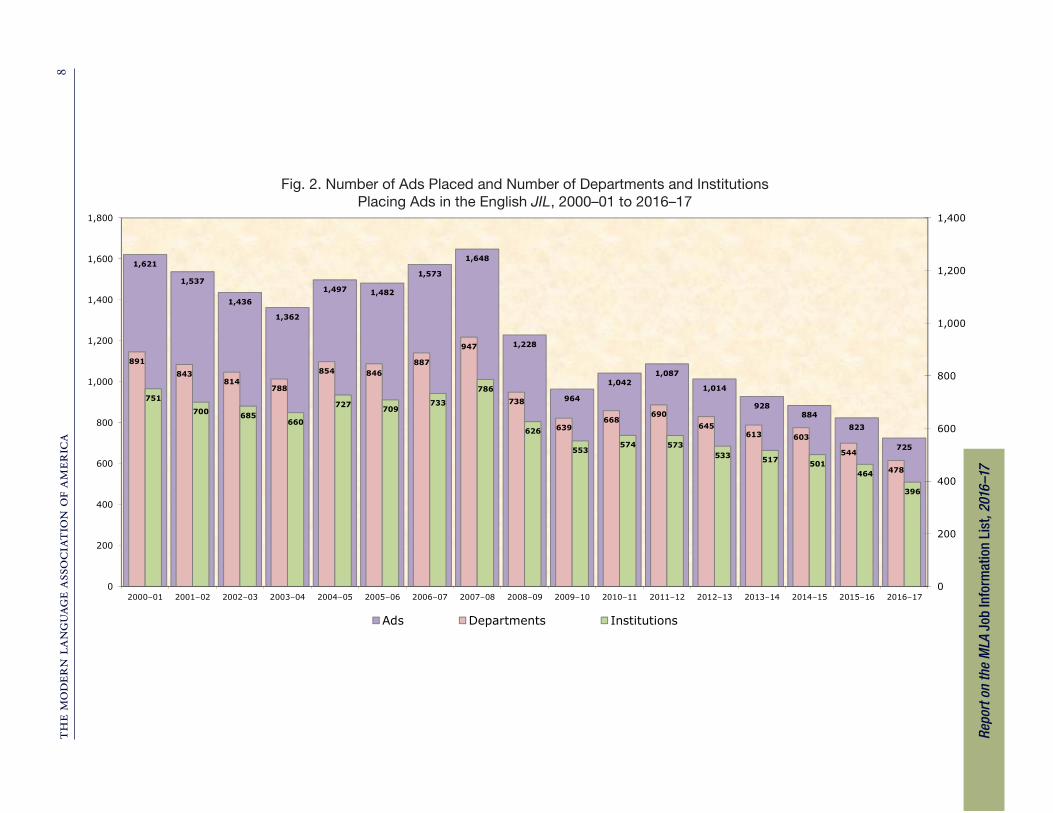
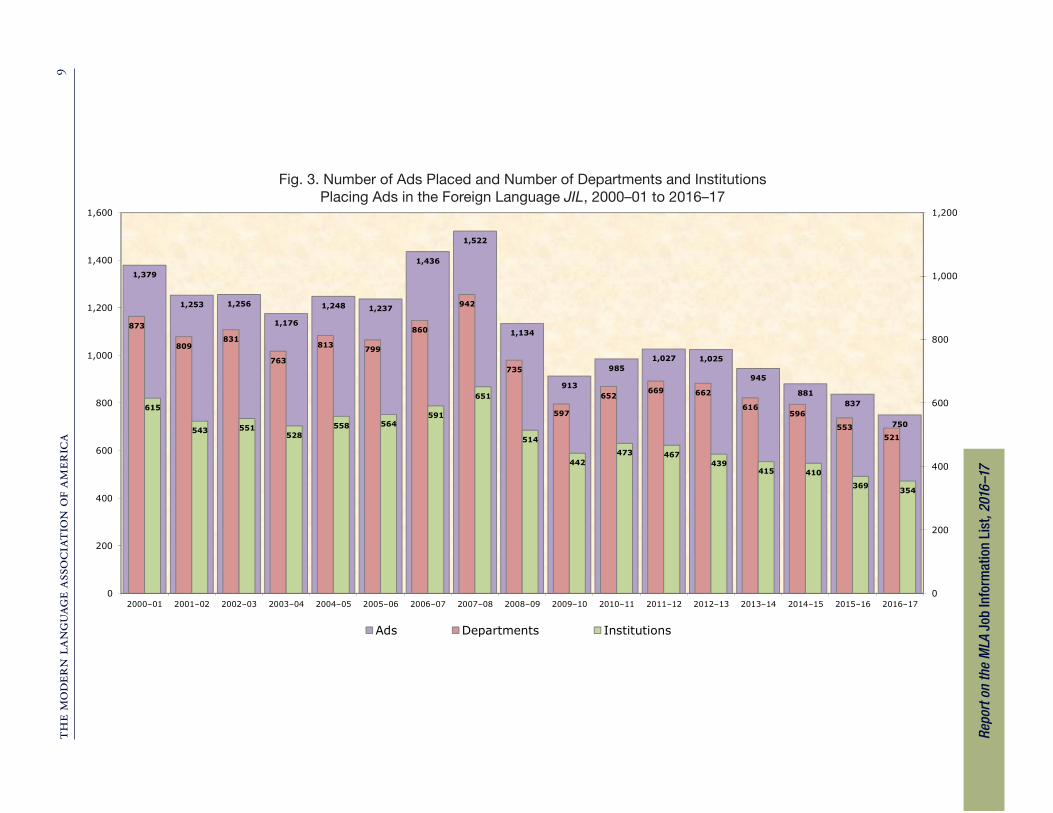
In addition to reading JIL listings to count the number of jobs announced, staff members in the MLA’s office of research perform a machine analysis of the JIL da-tabase to develop information on the number and characteristics of the ads depart-ments place. The number of ads is always somewhat smaller than the number of jobs the ads announce, since some ads announce more than one position. As shown in figure 2, in 2016–17 the English edition carried 725 ads from 478 departments in 396 institutions. Figure 3 shows the equivalent information for the foreign language edition, which in 2016–17 carried 750 ads from 521 departments in 354 institutions. In the English edition, 66 fewer departments placed ads in 2016–17 than in 2015–16, and the number of ads declined by 98 (11.9%). In the foreign language edition, 32 fewer departments placed ads in 2016–17 than in 2015–16, and the number of ads declined by 87 (10.4%). Figures 2 and 3 make visually graphic the contraction in job opportunities in English and the other modern languages that began in 2008–09 and that has persisted since. The 725 ads in the English JIL in 2016–17 are 923 (56.0%) below the 1,648 ads recorded in 2007–08, the recent peak. The 750 ads in the foreign language JIL in 2016–17 are 772 (50.7%) below the 2007–08 peak of 1,522. Since 2007–08, the number of departments placing ads has dropped from well over 900 to under 500 in the English edition and to just over 500 in the foreign language edition.
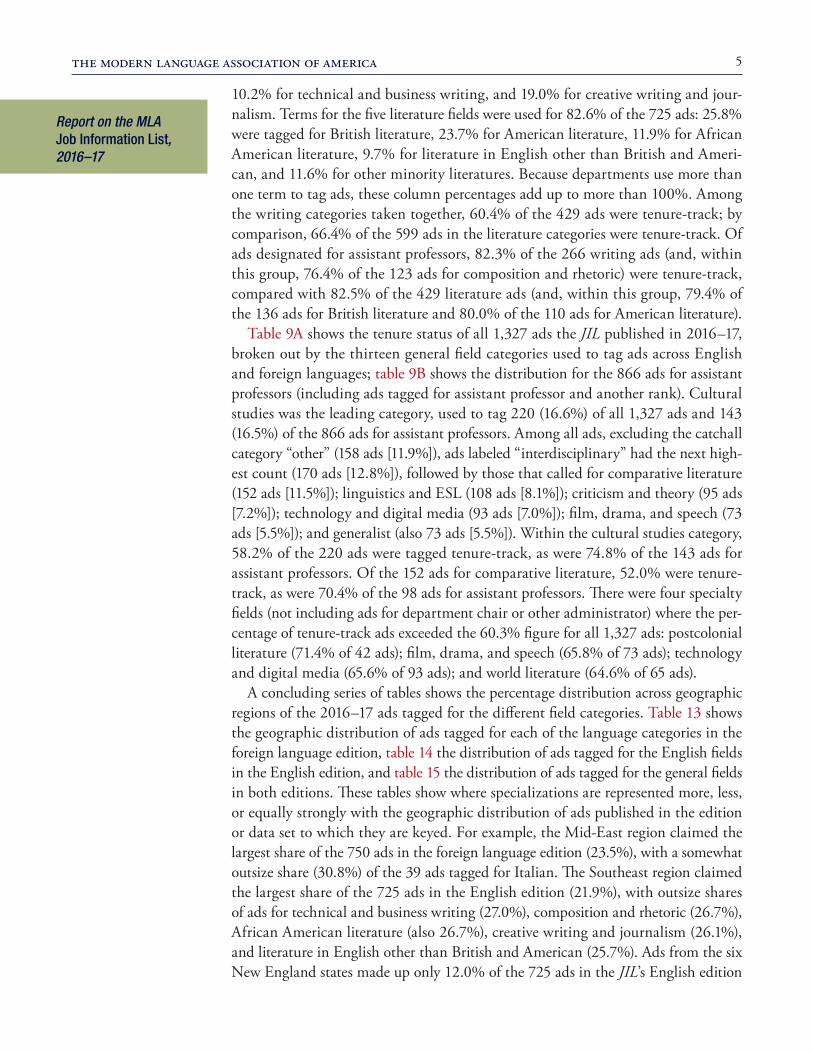
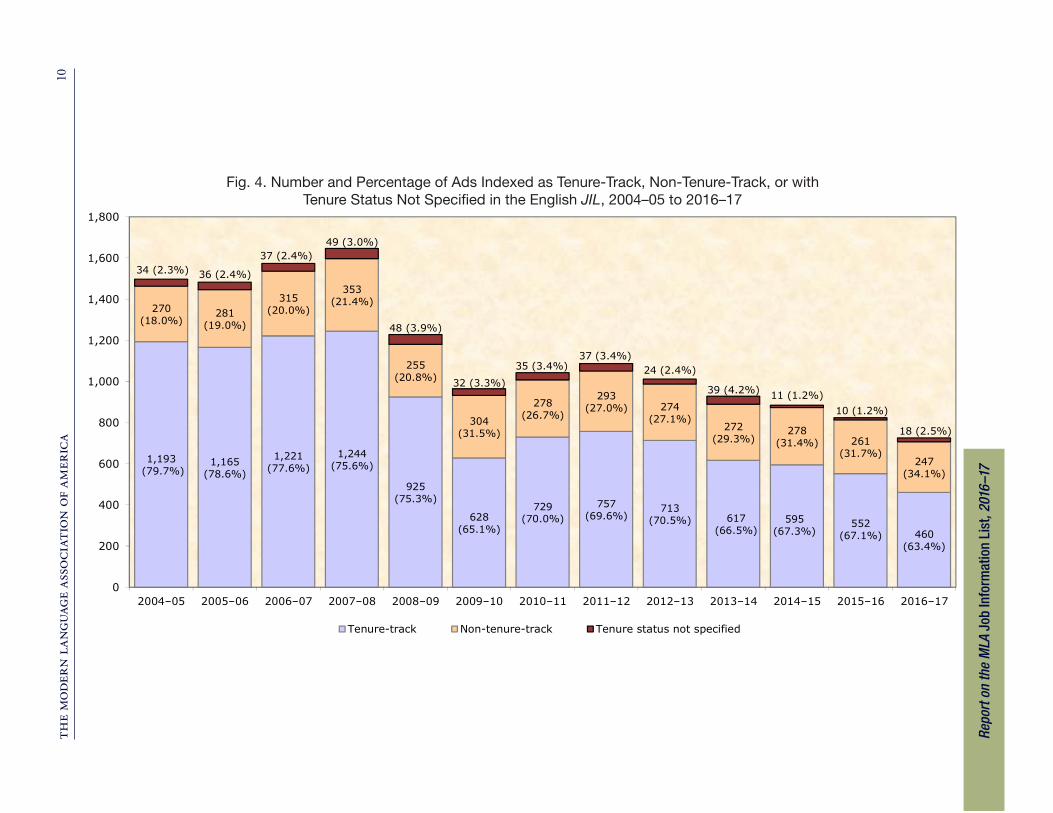
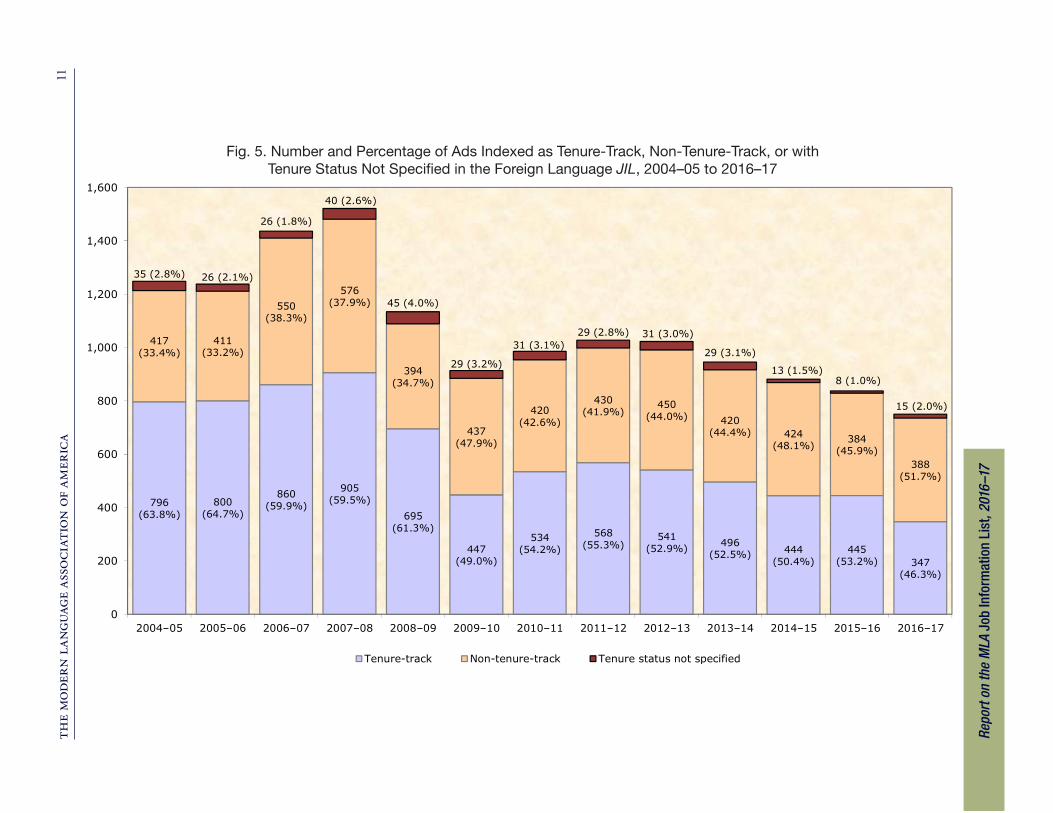
Since 2004–05, departments have been able to indicate the tenure status of posi-tions they advertise. In 2016–17, of the 725 ads in the English JIL, 460 (63.4%) were tagged as advertising tenure-track positions, 92 fewer ads than and 3.7 percentage points below last year (552, or 67.1%; fig. 4). Of the 750 ads in the foreign language JIL, 347 (46.3%) were tagged as advertising tenure-track positions, 98 fewer ads than and 6.9 percentage points below last year (445, or 53.2%; fig. 5).
Report on the MLA Job Information List, 2016–17
© 2017 by the Modern Language Association of America
the modern language association of america 2
All in format ion embargoed unt i l ?day, ?? ?, 12:01 a .m. EDT.
Report on the MLA Job Information List, 2016–17
The downturn in the number of ads since 2008 has been accompanied by a con-sistently lower percentage of each year’s total tagged as tenure-track. Over the five years from 2004–05 through 2008–09, ads tagged as tenure-track made up from 75% to 80% of ads in the English edition and from 60% to 65% of ads in the for-eign language edition. Over the eight years since, the percentages have fallen ten percentage points or more—to 64%–70% of the English edition and to 46%–55% of the foreign language edition. Two interpretations are possible to explain the con-sistently lower percentage of tenure-track ads in the foreign language edition com-pared with the English edition: programs in languages and literatures other than English may have a higher percentage of full-time non-tenure-track positions than do English language and literature programs, and foreign language programs have more occasion to seek national or international candidate pools for their full-time non-tenure-track positions than do English programs and hence use the JIL more often to advertise such positions.
Virtually all positions announced in the JIL are full-time, and the JIL thus affords no insight into hiring for the part-time faculty positions that have been the fastest-growing segment of the academic workforce. Moreover, not all departments use the JIL to advertise faculty positions they seek to fill. Only a handful of two-year col-leges use the JIL to advertise openings on their faculties. Despite these limitations, the number of ads tagged as openings for full-time tenure-track assistant professors and for non-tenure-track instructors is a valuable barometer of trends in opportuni-ties for full-time, entry-level academic employment in four-year institutions available to new and recent graduates of PhD programs.
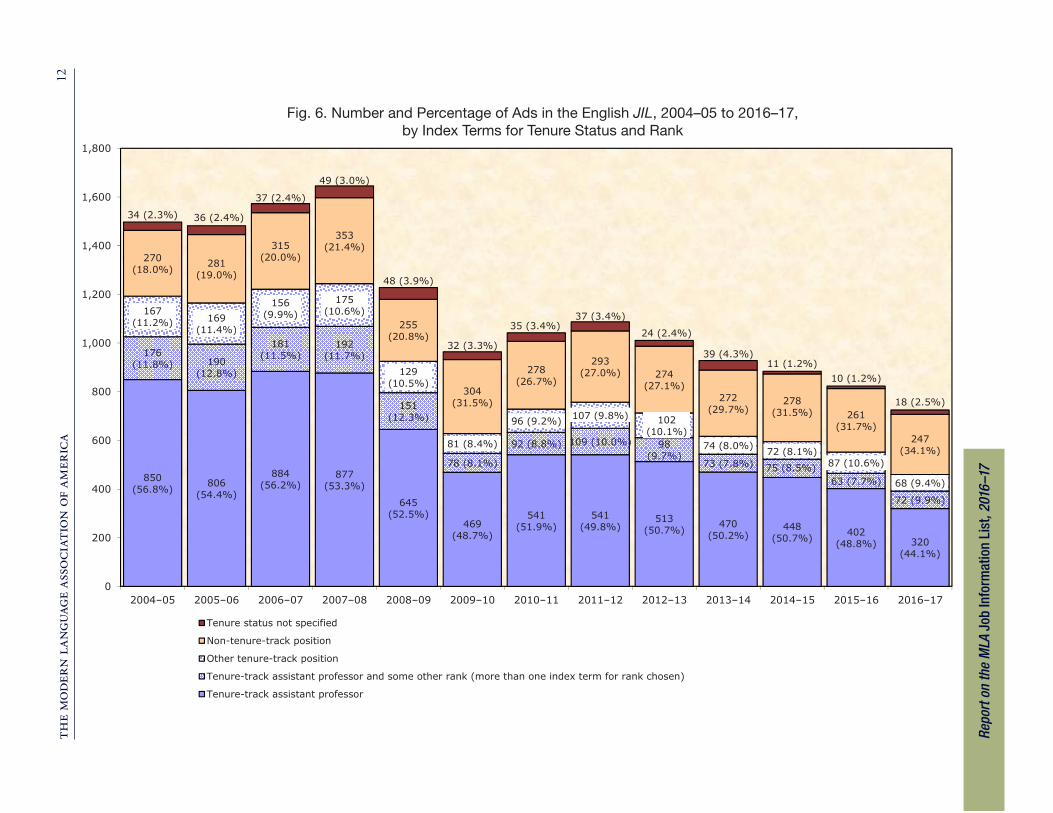
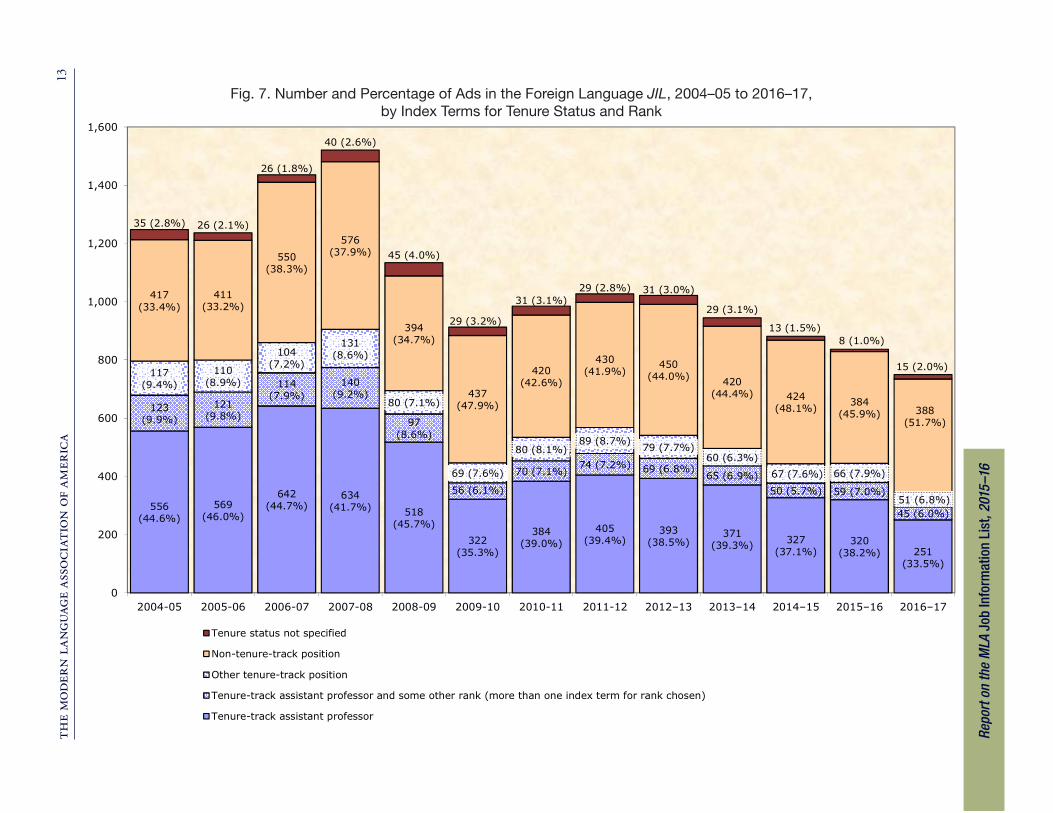
This year’s 11.9% decline in the total number of ads in the English edition was exceeded by a drop of 20.4%, or 82 ads, in the number of ads tagged as both tenure-track and assistant professor, from 402 in 2015–16 to 320 in 2016–17 (fig. 6). The foreign language edition saw a decline of 21.6%, or 69 ads, from 320 in 2015–16 to 251 in 2016–17, in the number of ads tagged as both tenure-track and assistant professor (fig. 7). Since 2009–10, ads that call for tenure-track assistant professors have claimed an average of 49.4% of ads in the English edition and 37.5% of ads in the foreign language edition. Before 2009–10, the percentage values fell in a range several percentage points higher—on average, 54.6% of ads in the English JIL and 44.5% of ads in the foreign language JIL. Since 2009–10, ads that use “assistant pro-fessor” in combination with a tag for another rank have added another 7%–10% to the total number of tenure-track assistant professor positions in the English edition and 6%–7% in the foreign language edition.
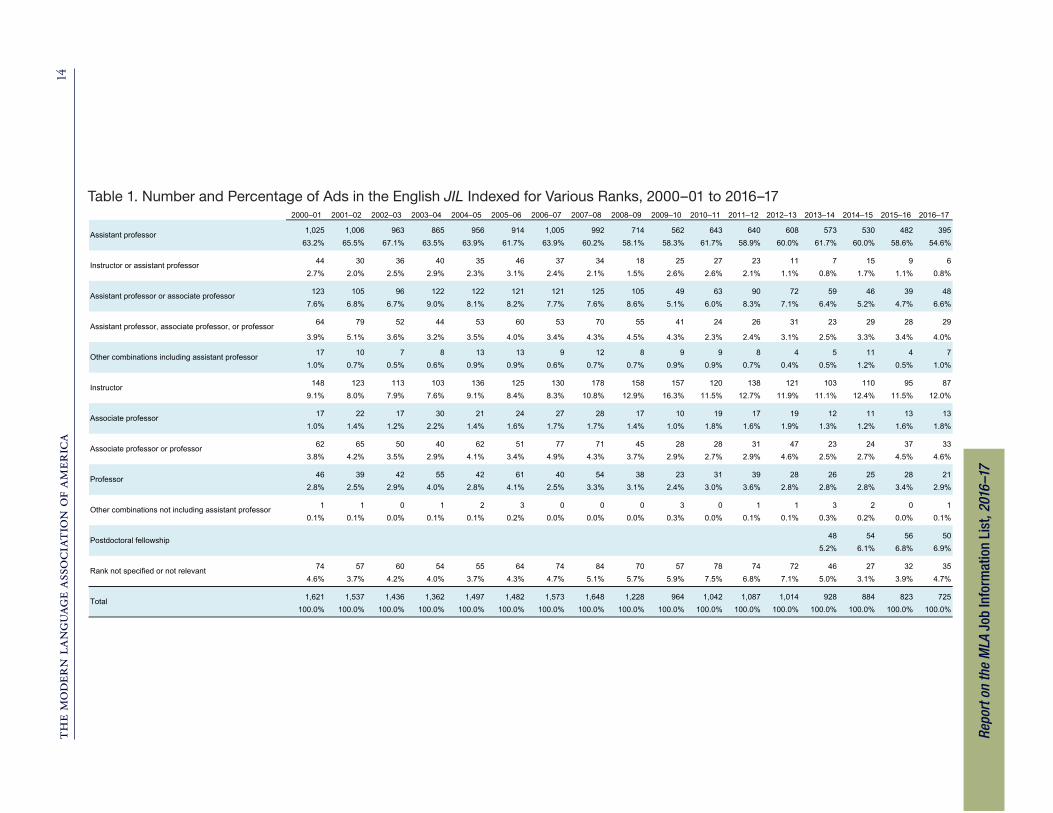
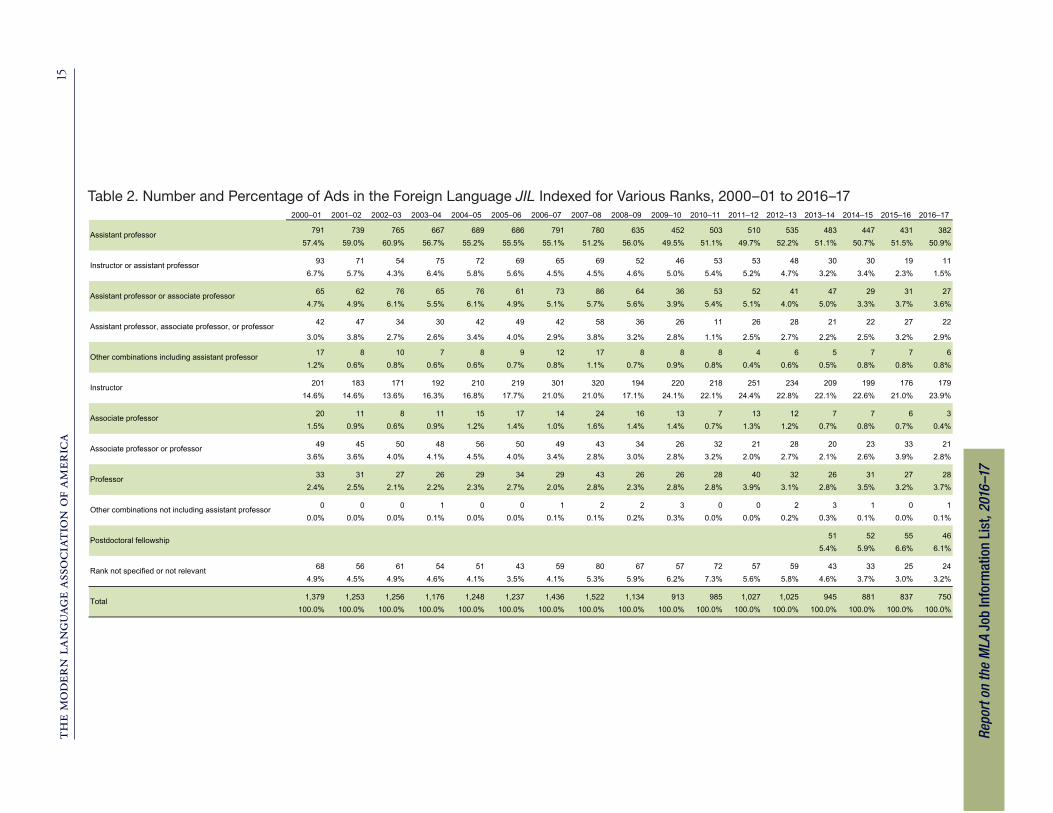
Table 1 and table 2 show in more detail how departments have tagged their ads using the five index terms for rank—instructor, assistant professor, associate profes-sor, professor, and (since 2013–14) postdoctoral fellowship—across the seventeen years from 2000–01 to 2016–17. Ads tagged solely “assistant professor” consistently predominate in both editions, making up from 55% to 65% of all ads in the English edition and from 50% to 60% of all ads in the foreign language edition. The in-crease in the percentage of ads tagged “instructor” since 2007–08, especially in the foreign language edition, is notable; ads for instructor positions now make up nearly a quarter of all ads in the foreign language edition.
the modern language association of america 3
All in format ion embargoed unt i l ?day, ?? ?, 12:01 a .m. EDT.
Report on the MLA Job Information List, 2016–17
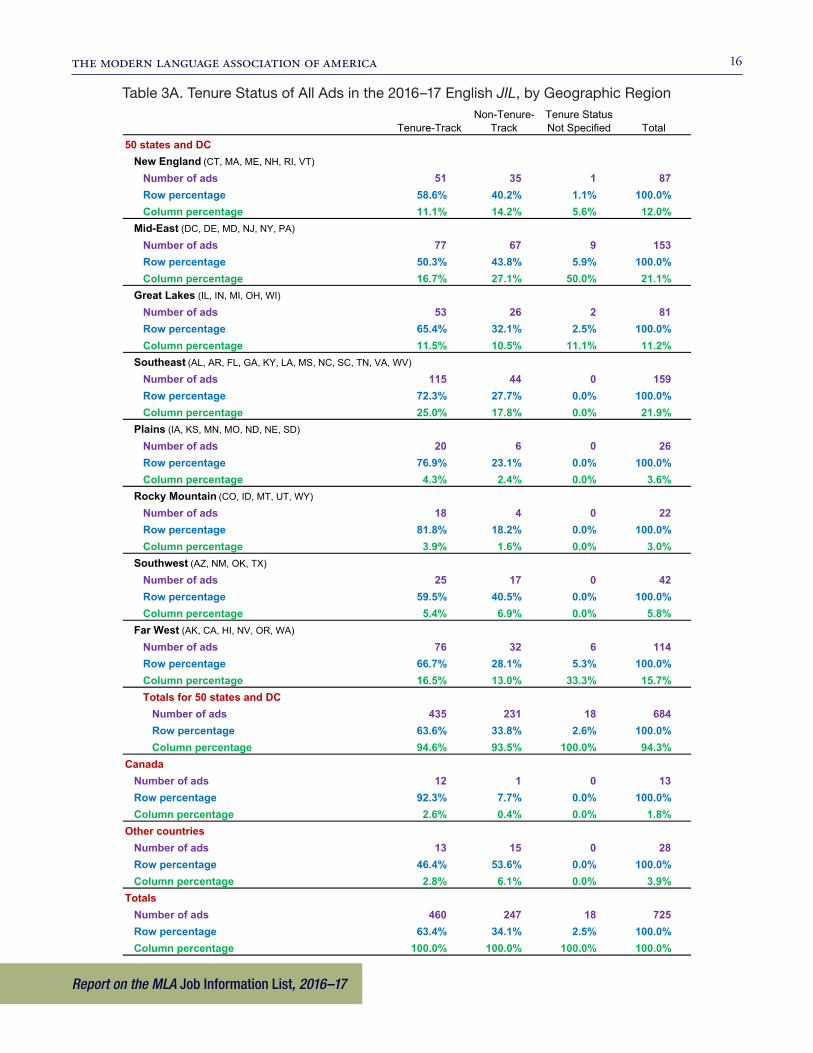
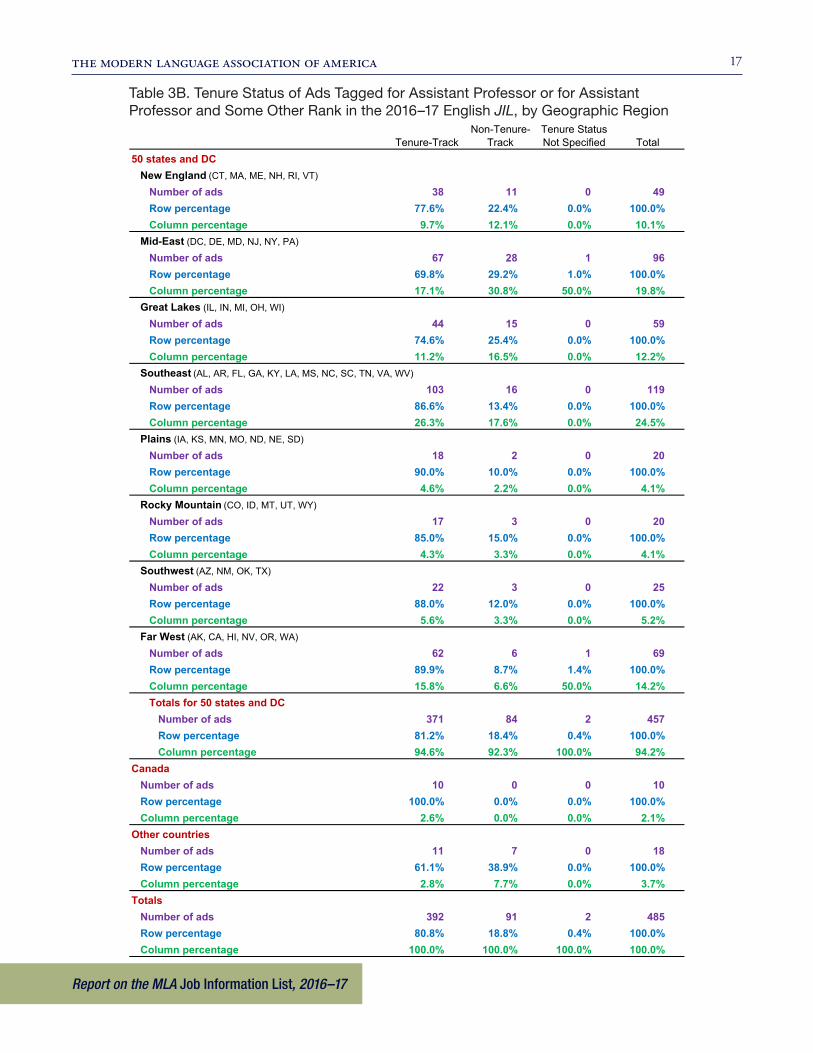
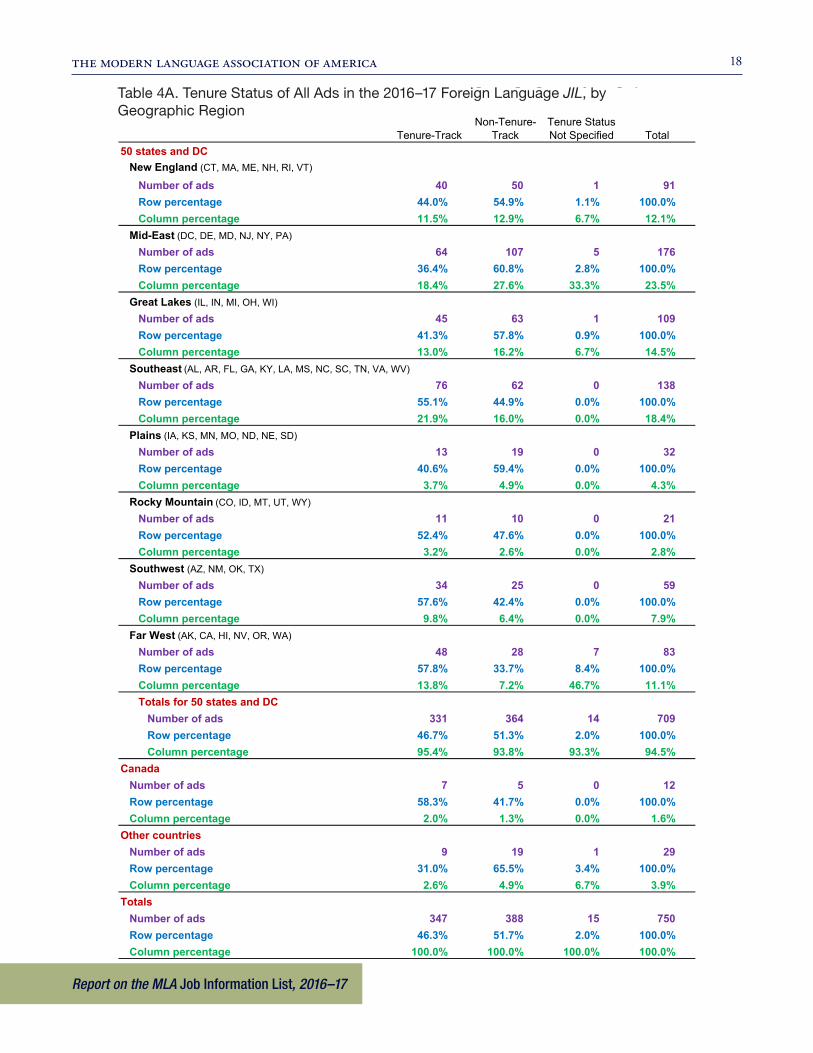
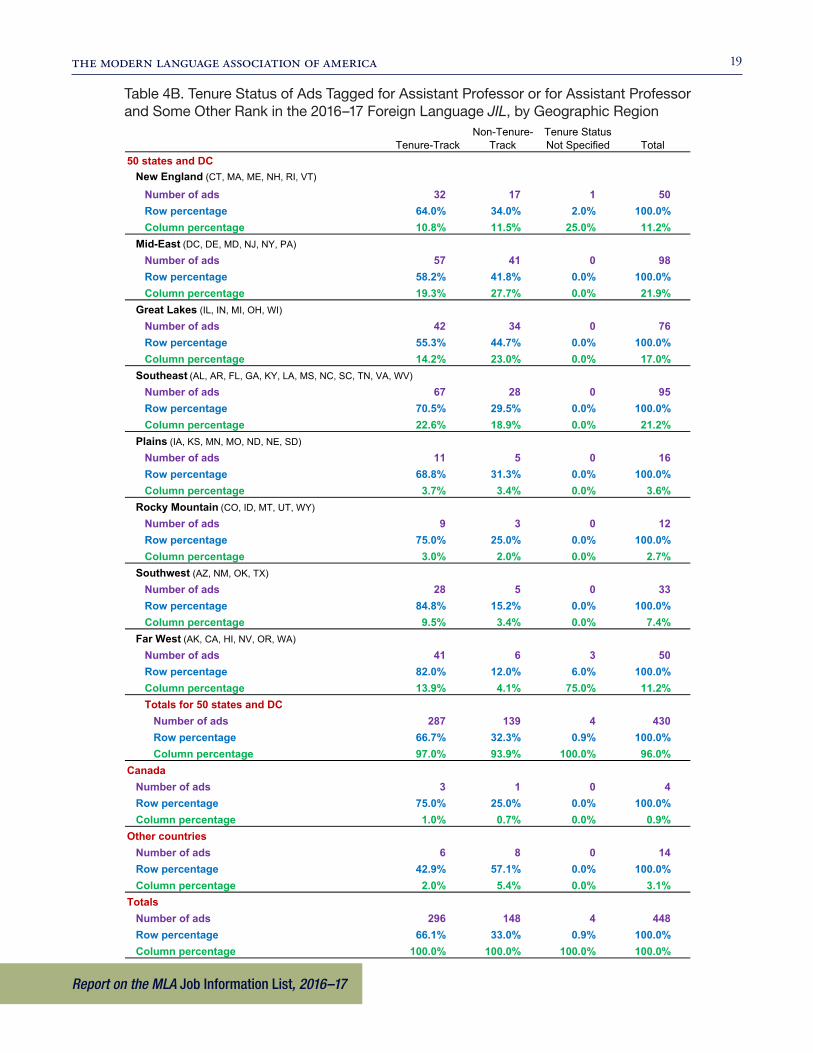
Table 3 and table 4 provide additional detail about the tenure status of this past year’s ads, broken out by geographic region, in the English and foreign language editions, respectively. Part A of each table shows the distribution of all ads pub-lished in an edition in 2016–17; part B shows the distribution of the ads for which departments used the tag “assistant professor,” including ads that used the assistant professor tag along with a tag for some other rank. The row percentage shows the tenure status of ads in a given region; the column percentage shows the percentage of ads within a given tenure category from each geographic region. In the English edition, 63.6% of a total 684 ads from institutions in the fifty states and the Dis-trict of Columbia were tagged as tenure-track—as were 81.2% of the 457 ads that called for assistant professors (table 3A, table 3B). In the foreign language edition, 46.7% of a total 709 ads from institutions in the fifty states and the District of Co-lumbia were tagged as tenure-track—as were 66.7% of the 430 ads that called for assistant professors (table 4A, table 4B). In the English edition, the largest share of ads came from departments in the Southeast region—159, or 21.9%. In the foreign language edition, the largest share came from the Mid-East region—176, or 23.5%. The Mid-East region claimed a notably lower percentage of ads tagged as tenure-track—50.3% in English and 36.4% in foreign languages, compared with 58% or higher and 40% or higher in English and foreign languages, respectively, in the other seven regions of the United States.
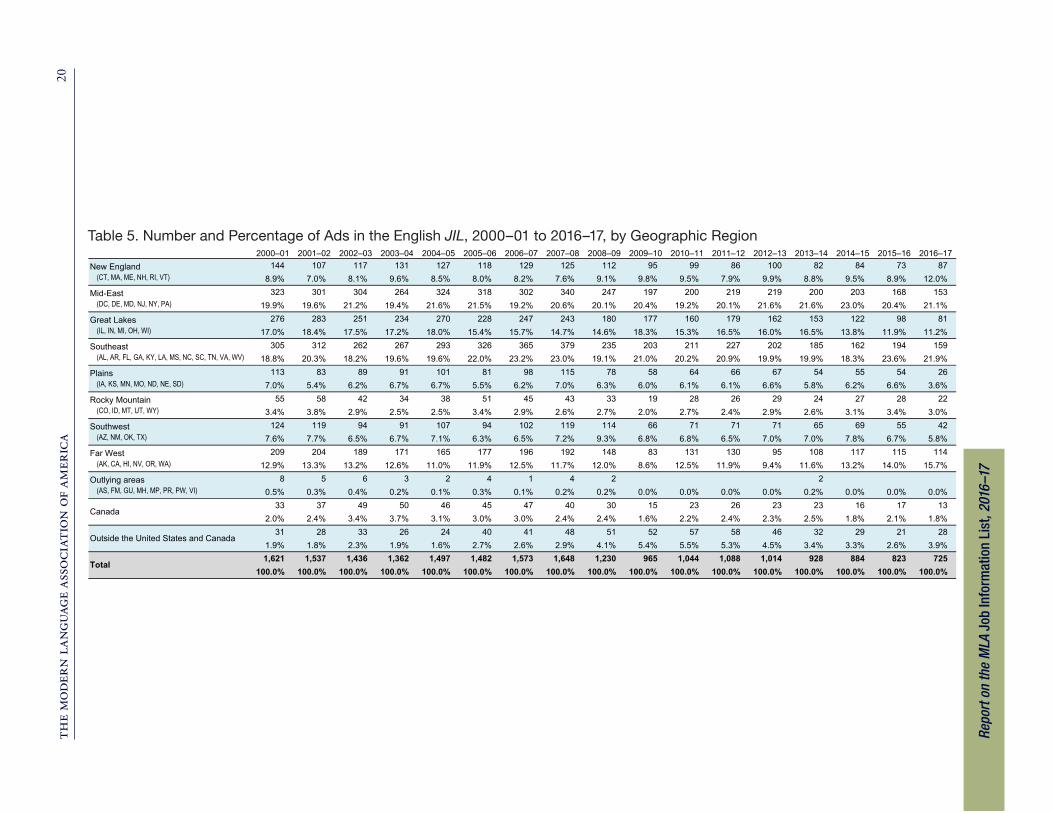
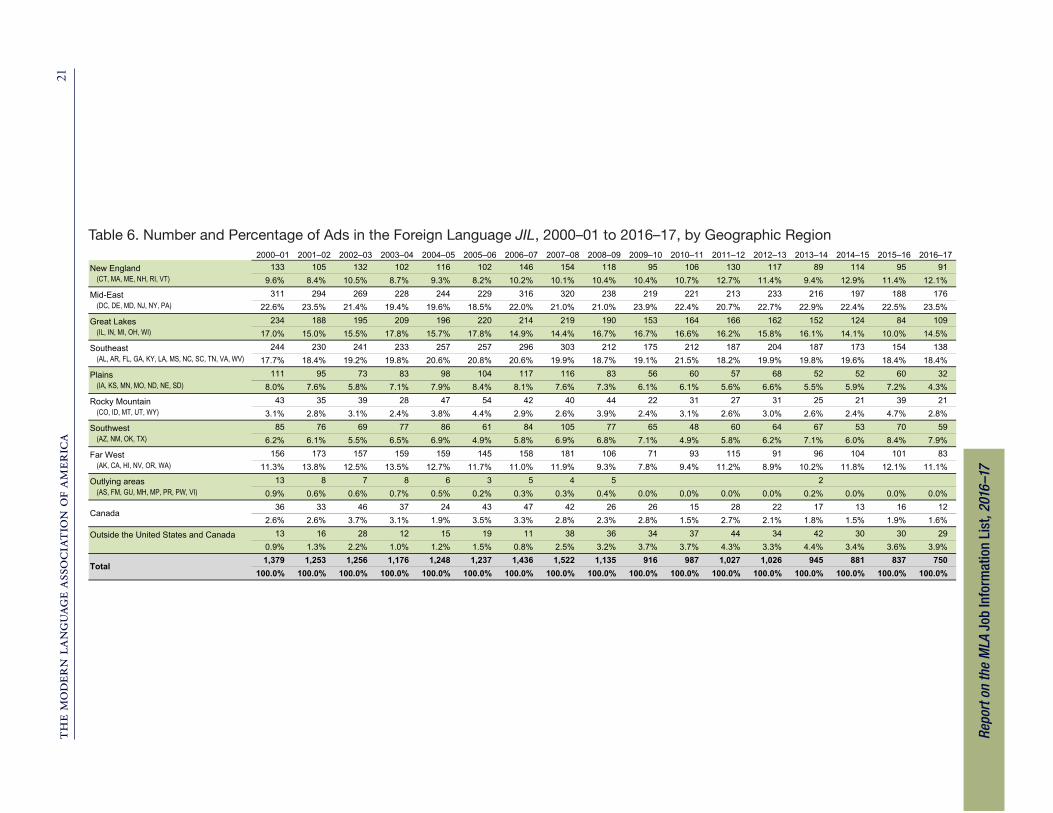
Table 5 (English edition) and table 6 (foreign language edition) show trends in the number and percentage of ads from the United States and its territories, Can-ada, and other countries across the seventeen years from 2000–01 to 2016–17. The percentage distribution across the regions shows considerable stability through the much larger changes in the number of ads. Across the period, on average, the Mid-East and Southeast regions each claim roughly 20% of the ads in each edition, fol-lowed by the Great Lakes with about 16%, the Far West with about 12%, the Plains and the Southwest with about 6%–7% each, and the Rocky Mountain states with about 3%. Over the past three years, however, the Great Lakes region has seen a notable drop in the English edition, from 16.5% in 2013–14 to 11.2% in 2016–17. Ads from the New England states, which historically have claimed about a 9% share of all ads in the English edition and about a 10% share in the foreign language edi-tion, enlarged to 12% in both editions in 2016–17. Ads for posts outside the United States and Canada claimed an identical 3.9% of ads in both the English and the foreign language editions, after increasing to over 5% of English ads from 2009–10 to 2011–12 and to over 4% of foreign language ads in 2011–12 and in 2013–14.
In 2013–14 the JIL introduced a revamped, unified search interface that gives job seekers direct access to ads in both the English and the foreign language editions. Previously, the two editions had to be searched independently through separate in-terfaces and grids of index terms. Departments placing ads now select search terms from three categories: for language, for general fields of specialization applicable across English and other modern languages, and for specializations (e.g., composi-tion and rhetoric or British literature) applicable chiefly to English. The rearrange-ment means that the number of field terms departments now use to tag ads is not consistently comparable with counts from years before 2013–14.
the modern language association of america 4
All in format ion embargoed unt i l ?day, ?? ?, 12:01 a .m. EDT.
Report on the MLA Job Information List, 2016–17
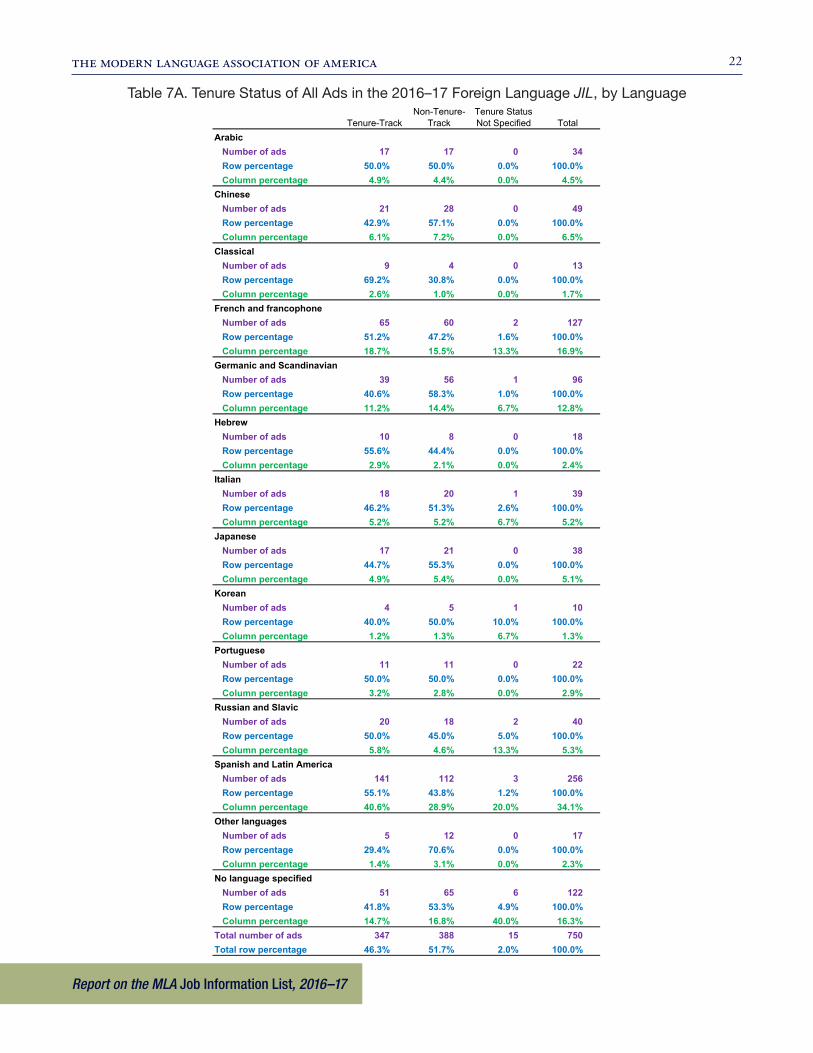
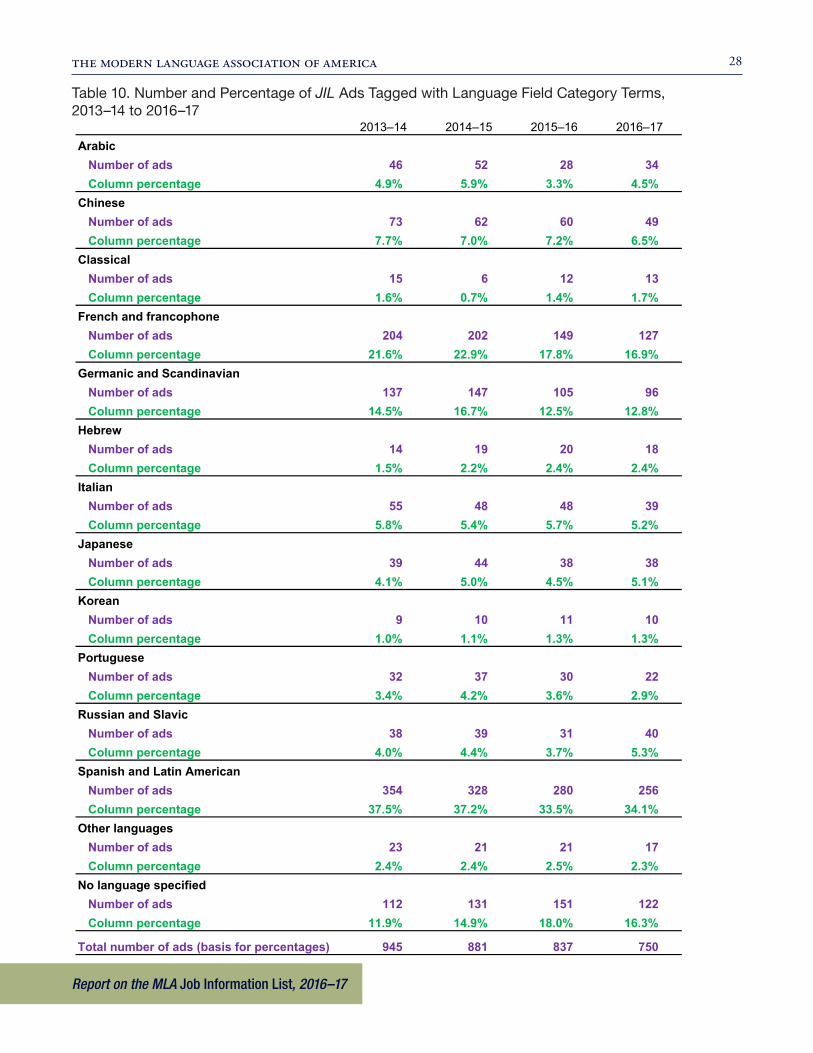
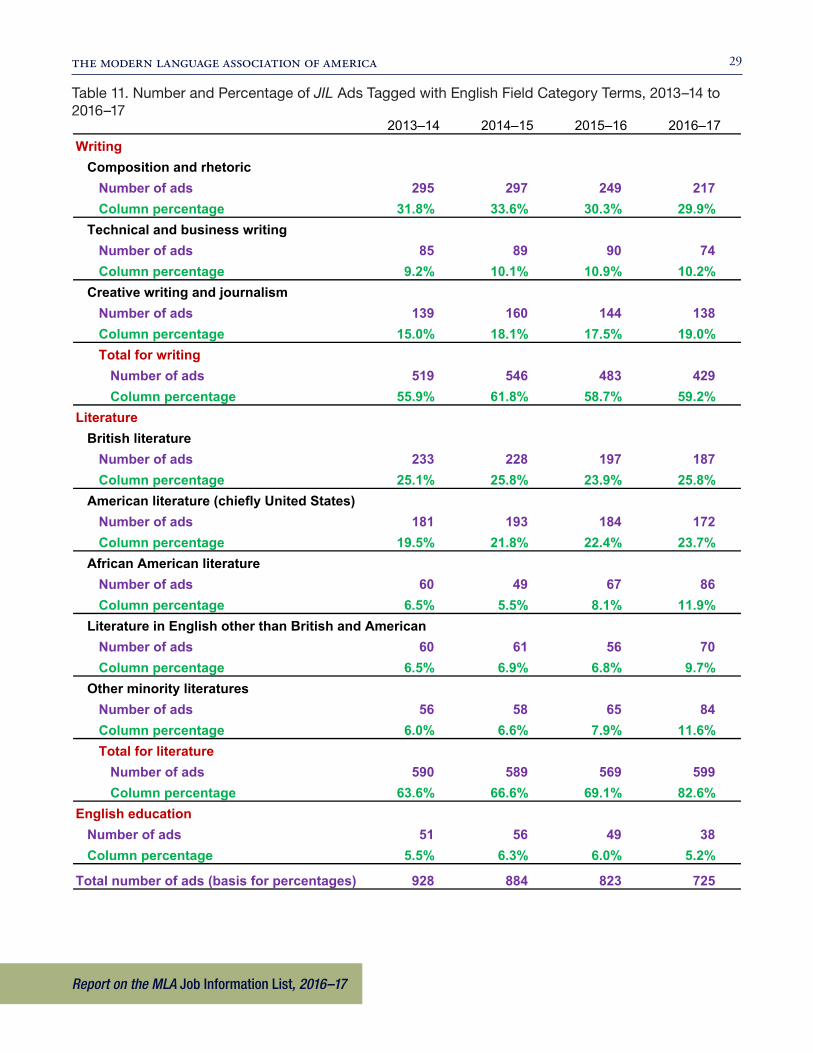
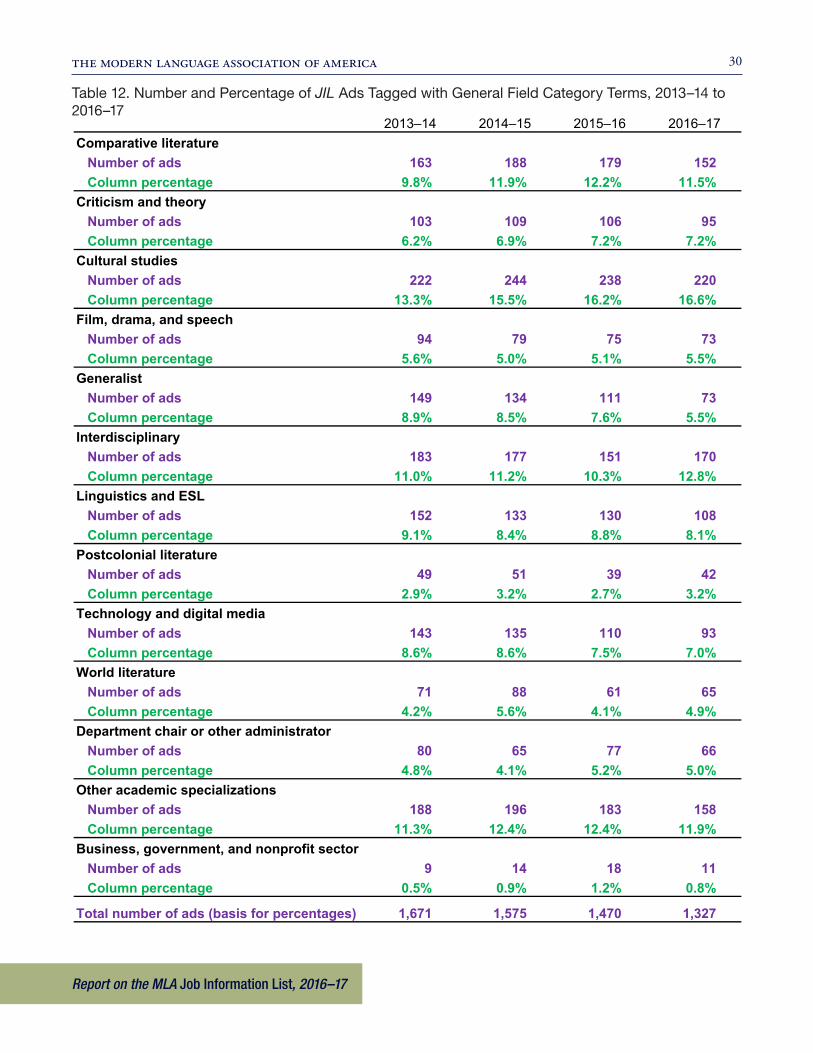
This report, like those covering the three years since 2013–14, follows the JIL’s new scheme of index and search terms by developing separate tables for the three categories. The analysis of language categories uses the 750 ads assigned to the for-eign language edition as the basis for calculating the percentage of ads tagged with each language term, the analysis of the English field categories uses the 725 ads assigned to the English edition as the basis for percentages, and the analysis of the general field categories uses the 1,327 total ads published in the JIL database.1 Ta-bles 7, 8, and 9 in this report are directly comparable to the corresponding tables in the reports for 2013–14, 2014–15, and 2015–16 (see all four reports at www .mla .org/ Resources/ Career/ Job -Information -List/ Reports -on -the -MLA -Job -Information -List). Readers interested in trends since the new scheme was introduced can consult table 10, table 11, and table 12 to see how departments used the search terms to tag ads across the four-year period from 2013–14 to 2016–17. For the most part, the per-centages of ads tagged with each index term remain stable, varying far less than the absolute number of ads. The notable exception is English literature: the percentage of ads tagged with an English literature index term rose to 82.6% in 2016–17, from 69.1% in 2015–16 and 63.6% in 2013–14. Of the 725 ads in the English edition in 2016–17, 349 (48.1%) were tagged with one or more of the five literature terms, and departments applied these tags a total of 599 times, an average of 1.72 literature tags per ad. The previous year, 2015–16, 359 (43.6%) of the 823 ads in the English edi-tion used one or more of the five literature terms, and the terms were applied a total of 569 times, or an average of 1.58 literature terms per ad.
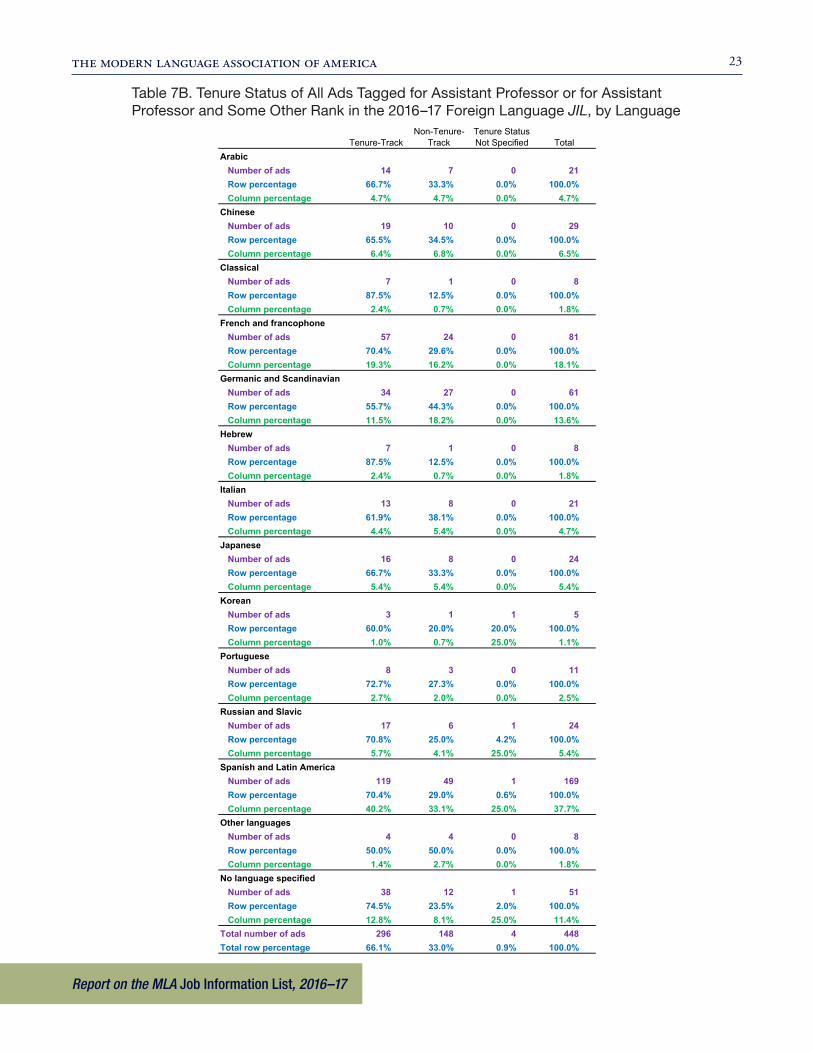
Table 7A shows the tenure status of the 750 ads published in the JIL’s foreign lan-guage edition in 2016–17, broken out by the fourteen language categories (the twelve named languages plus “other languages” and “no language specified”); table 7B shows the distribution across language categories for the 448 ads that were tagged for the rank of assistant professor (including ads that were also tagged for another rank). Spanish and Latin America had the largest share of ads overall and also of ads for tenure-track positions: 256 (34.1%) of the 750 ads in the foreign language edition and 141 (40.6%) of the 347 ads tagged tenure-track. French and francophone was next in share, with 127 (16.9%) of all 750 ads and 65 (18.7%) of the 347 tenure-track ads, followed by Germanic and Scandinavian, with 12.8% of all ads and 11.2% of all tenure-track ads in the foreign language edition. In seven of the twelve named languages the percentage of ads tagged as tenure-track exceeded the 46.3% figure for all 750 ads published in the JIL’s foreign language edition: Classical (69.2% of 13 ads), Hebrew (55.6% of 18 ads), Spanish (55.1% of 256 ads), French (51.2% of 127 ads), Russian and Slavic (50.0% of 40 ads), Arabic (50.0% of 34 ads), and Portuguese (50.0% of 22 ads). As shown in table 7B, 119 (70.4%) of the 169 ads for assistant professors in Spanish were tenure-track, as were 57 (70.4%) of the 81 ads for assistant professors in French and 34 (55.7%) of the 61 ads for assistant professors in German.
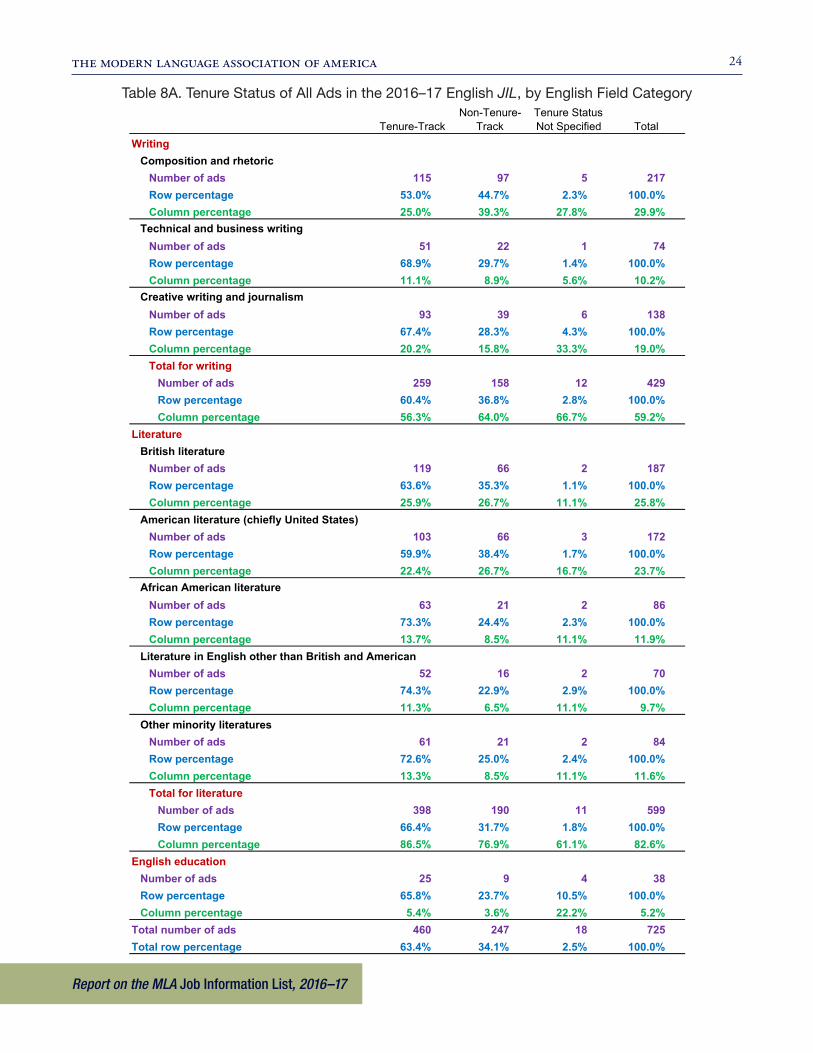
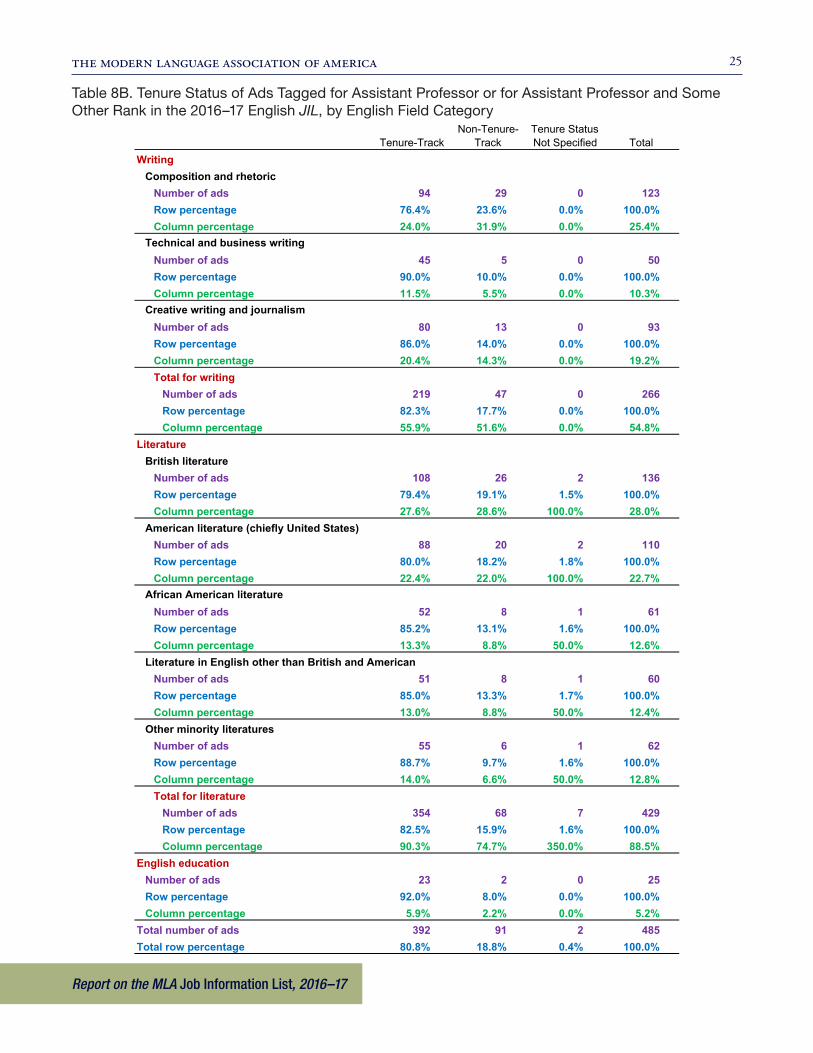
Table 8A shows the tenure status of the 725 ads published in the JIL’s English edition, broken out by the nine English field categories; table 8B shows the distribu-tion for the 485 ads that were tagged for the rank of assistant professor or for both assistant professor and another rank. Terms for the three writing fields were used for 59.2% of the 725 English ads: 29.9% were tagged for composition and rhetoric,
the modern language association of america 5
All in format ion embargoed unt i l ?day, ?? ?, 12:01 a .m. EDT.
Report on the MLA Job Information List, 2016–17
10.2% for technical and business writing, and 19.0% for creative writing and jour-nalism. Terms for the five literature fields were used for 82.6% of the 725 ads: 25.8% were tagged for British literature, 23.7% for American literature, 11.9% for African American literature, 9.7% for literature in English other than British and Ameri-can, and 11.6% for other minority literatures. Because departments use more than one term to tag ads, these column percentages add up to more than 100%. Among the writing categories taken together, 60.4% of the 429 ads were tenure-track; by comparison, 66.4% of the 599 ads in the literature categories were tenure-track. Of ads designated for assistant professors, 82.3% of the 266 writing ads (and, within this group, 76.4% of the 123 ads for composition and rhetoric) were tenure-track, compared with 82.5% of the 429 literature ads (and, within this group, 79.4% of the 136 ads for British literature and 80.0% of the 110 ads for American literature).
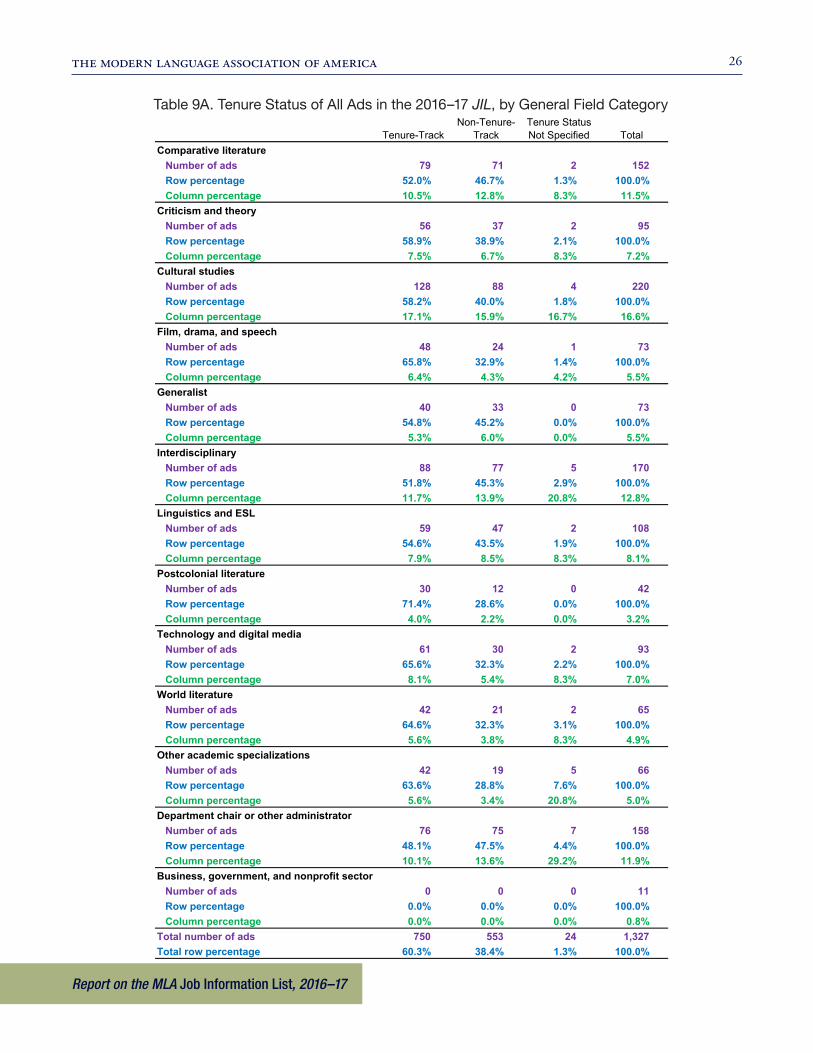
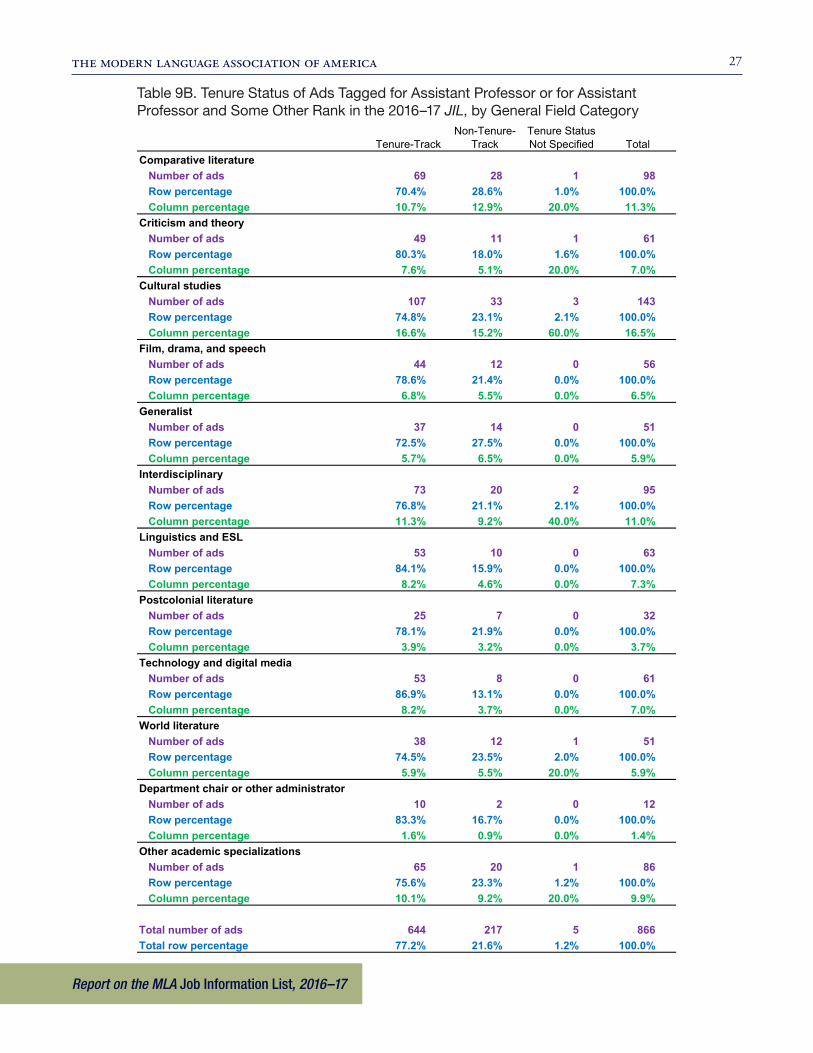
Table 9A shows the tenure status of all 1,327 ads the JIL published in 2016–17, broken out by the thirteen general field categories used to tag ads across English and foreign languages; table 9B shows the distribution for the 866 ads for assistant professors (including ads tagged for assistant professor and another rank). Cultural studies was the leading category, used to tag 220 (16.6%) of all 1,327 ads and 143 (16.5%) of the 866 ads for assistant professors. Among all ads, excluding the catchall category “other” (158 ads [11.9%]), ads labeled “interdisciplinary” had the next high-est count (170 ads [12.8%]), followed by those that called for comparative literature (152 ads [11.5%]); linguistics and ESL (108 ads [8.1%]); criticism and theory (95 ads [7.2%]); technology and digital media (93 ads [7.0%]); film, drama, and speech (73 ads [5.5%]); and generalist (also 73 ads [5.5%]). Within the cultural studies category, 58.2% of the 220 ads were tagged tenure-track, as were 74.8% of the 143 ads for assistant professors. Of the 152 ads for comparative literature, 52.0% were tenure-track, as were 70.4% of the 98 ads for assistant professors. There were four specialty fields (not including ads for department chair or other administrator) where the per-centage of tenure-track ads exceeded the 60.3% figure for all 1,327 ads: postcolonial literature (71.4% of 42 ads); film, drama, and speech (65.8% of 73 ads); technology and digital media (65.6% of 93 ads); and world literature (64.6% of 65 ads).
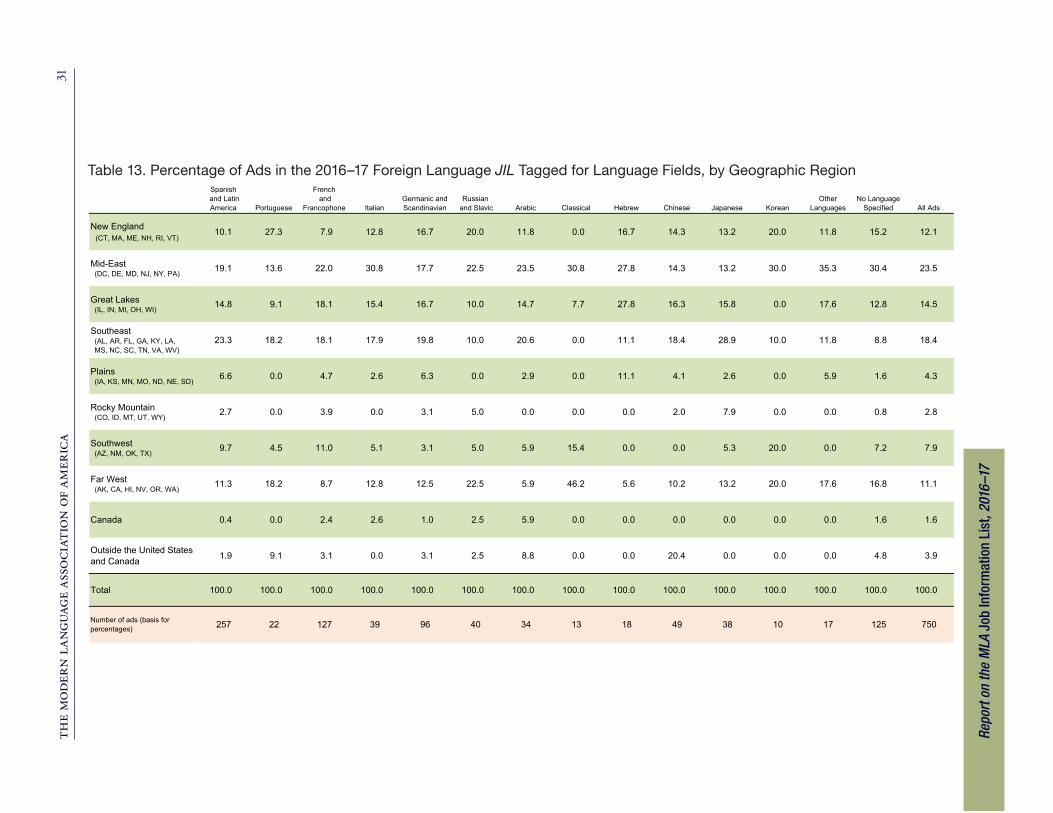
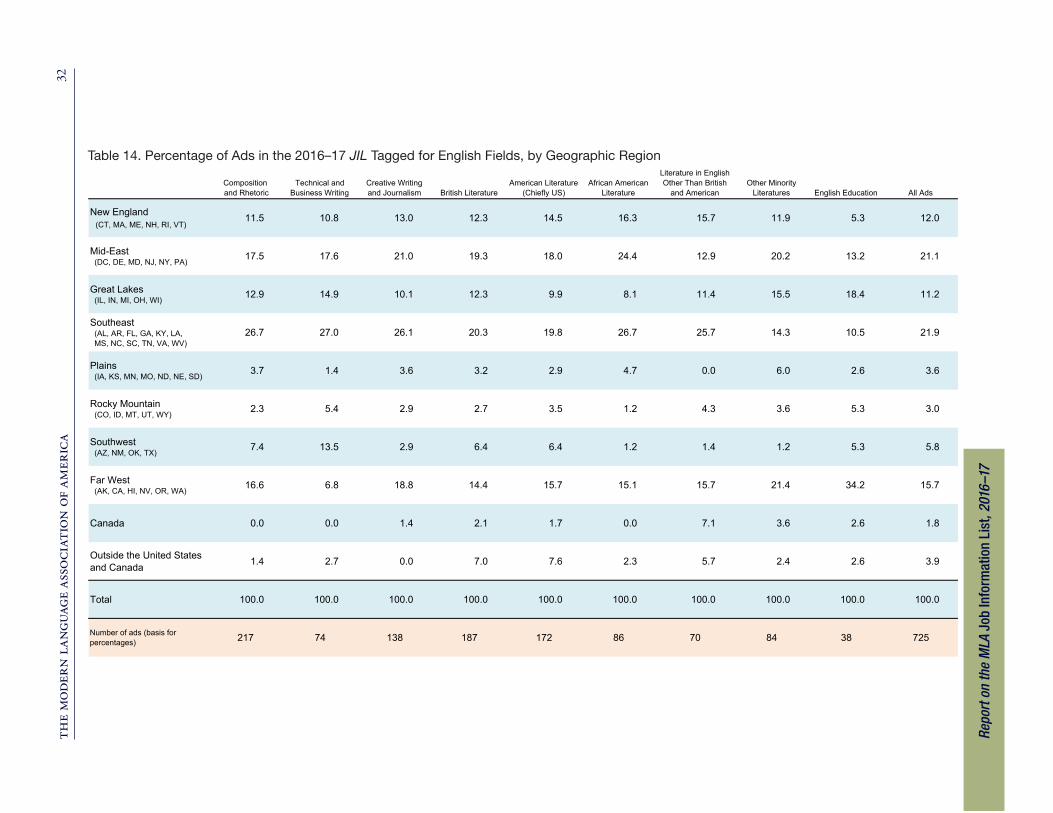
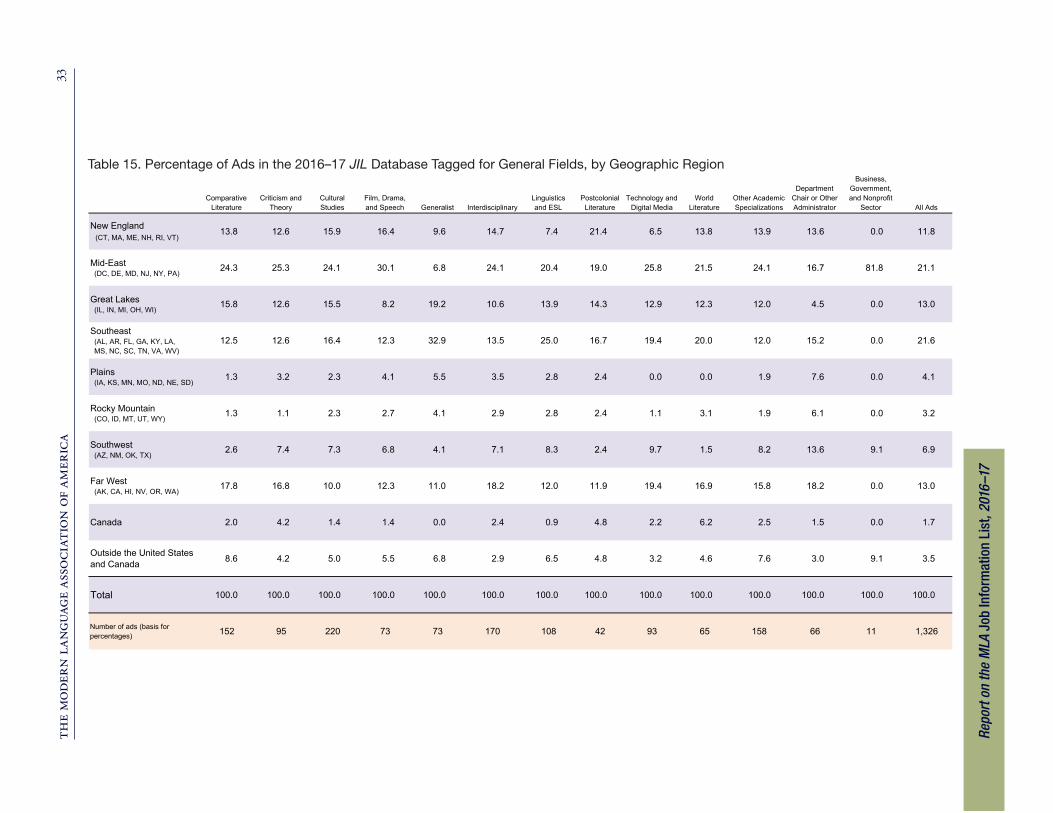
A concluding series of tables shows the percentage distribution across geographic regions of the 2016–17 ads tagged for the different field categories. Table 13 shows the geographic distribution of ads tagged for each of the language categories in the foreign language edition, table 14 the distribution of ads tagged for the English fields in the English edition, and table 15 the distribution of ads tagged for the general fields in both editions. These tables show where specializations are represented more, less, or equally strongly with the geographic distribution of ads published in the edition or data set to which they are keyed. For example, the Mid-East region claimed the largest share of the 750 ads in the foreign language edition (23.5%), with a somewhat outsize share (30.8%) of the 39 ads tagged for Italian. The Southeast region claimed the largest share of the 725 ads in the English edition (21.9%), with outsize shares of ads for technical and business writing (27.0%), composition and rhetoric (26.7%), African American literature (also 26.7%), creative writing and journalism (26.1%), and literature in English other than British and American (25.7%). Ads from the six New England states made up only 12.0% of the 725 ads in the JIL’s English edition
the modern language association of america 6
All in format ion embargoed unt i l ?day, ?? ?, 12:01 a .m. EDT.
Report on the MLA Job Information List, 2016–17
but claimed 16.3% of the 86 ads tagged for African American literature and 15.7% of the 70 ads tagged for literature in English other than British or American. The larg-est percentage of ads tagged for composition and rhetoric were from the Southeast, Mid-East, and Far West regions—26.9%, 17.5%, and 16.6%, respectively. Of ads from departments in United States institutions tagged for British literature, only the New England, Great Lakes, and Southwest regions claimed shares that were slightly above the shares the regions claimed for the English edition as a whole. Among the ads tagged for general fields, the Southeast claimed an outsize 32.9% share of ads for generalist positions, the Mid-East 30.1% of ads in film, drama, and speech.
Note
1. The 725 ads assigned to the English edition and the 750 assigned to the foreign language edition sum to a total greater than 1,327 because 148 interdisciplinary ads were placed in both editions.
the
mod
ern
lang
uage
ass
ocia
tion
of
amer
ica
7
All
in
form
ati
on
em
bar
go
ed u
nti
l ?d
ay,
??
?,
12:0
1 a
.m.
EDT.
Repo
rt on
the
MLA
Job
Info
rmat
ion
List
, 201
6–17
Fig. 1. Number of Jobs Advertised in the MLA Job Information List, 1975–76 to 2016–17
1,450
1,441
1,3251,327
1,456
1,575
1,461
1,338
1,368
1,492
1,700
1,741
1,978
2,075
1,895
1,507
1,288
1,152
1,075
1,159
1,098
1,1931,121
1,517
1,670
1,828
1,7321,680
1,541
1,7391,687
1,7931,826
1,380
1,100
1,1901,235
1,142
1,0461,015
953
851
1,515
1,310
1,3871,354 1,352
1,297
1,1661,237 1,238
1,442
1,622
1,703
1,857
1,873
1,637
1,488
1,238
1,1091,047
1,188
1,134
1,129 1,088
1,192
1,365
1,482
1,369 1,367
1,285
1,369 1,361
1,591
1,680
1,227
1,022
1,0951,1281,102
1,027
949918
808
0
500
1,000
1,500
2,000
2,500
1975
–76
1976
–77
1977
–78
1978
–79
1979
–80
1980
–81
1981
–82
1982
–83
1983
–84
1984
–85
1985
–86
1986
–87
1987
–88
1988
–89
1989
–90
1990
–91
1991
–92
1992
–93
1993
–94
1994
–95
1995
–96
1996
–97
1997
–98
1998
–99
1999
–200
0
2000
–01
2001
–02
2002
–03
2003
–04
2004
–05
2005
–06
2006
–07
2007
–08
2008
–09
2009
–10
2010
–11
2011
–12
2012
–13
2013
–14
2014
–15
2015
–16
2016
–17
Fig. 1. Number of Jobs Advertised in the MLA Job Information List, 1975–76 to 2016–17
English edition
Foreign language edition
the
mod
ern
lang
uage
ass
ocia
tion
of
amer
ica
8
All
in
form
ati
on
em
bar
go
ed u
nti
l ?d
ay,
??
?,
12:0
1 a
.m.
EDT.
1,621
1,537
1,436
1,362
1,497 1,482
1,573
1,648
1,228
964
1,0421,087
1,014
928884
823
725
891843
814788
854 846887
947
738
639668
690645
613 603
544
478
751
700 685660
727 709733
786
626
553574 573
533 517 501464
396
0
200
400
600
800
1,000
1,200
1,400
0
200
400
600
800
1,000
1,200
1,400
1,600
1,800
2000–01 2001–02 2002–03 2003–04 2004–05 2005–06 2006–07 2007–08 2008–09 2009–10 2010–11 2011–12 2012–13 2013–14 2014–15 2015–16 2016–17
Fig. 2. Number of Ads Placed and Number of Departments and Institutions Placing Ads in the English JIL, 2000–01 to 2016–17
Ads Departments Institutions
Fig. 2. Number of Ads Placed and Number of Departments and Institutions Placing Ads in the English JIL, 2000–01 to 2016–17
Repo
rt on
the
MLA
Job
Info
rmat
ion
List
, 201
6–17
the
mod
ern
lang
uage
ass
ocia
tion
of
amer
ica
9
All
in
form
ati
on
em
bar
go
ed u
nti
l ?d
ay,
??
?,
12:0
1 a
.m.
EDT.
Repo
rt on
the
MLA
Job
Info
rmat
ion
List
, 201
6–17
1,379
1,253 1,256
1,176
1,248 1,237
1,436
1,522
1,134
913
9851,027 1,025
945
881837
750
873
809831
763
813 799
860
942
735
597
652669 662
616596
553521
615
543 551528
558 564591
651
514
442473 467
439415 410
369 354
0
200
400
600
800
1,000
1,200
0
200
400
600
800
1,000
1,200
1,400
1,600
2000–01 2001–02 2002–03 2003–04 2004–05 2005–06 2006–07 2007–08 2008–09 2009–10 2010–11 2011–12 2012–13 2013–14 2014–15 2015–16 2016–17
Fig. 3. Number of Ads Placed and Number of Departments and Institutions Placing Ads in the Foreign Language JIL, 2000–01 to 2016–17
Ads Departments Institutions
Fig. 3. Number of Ads Placed and Number of Departments and Institutions Placing Ads in the Foreign Language JIL, 2000–01 to 2016–17
the
mod
ern
lang
uage
ass
ocia
tion
of
amer
ica
10
All
in
form
ati
on
em
bar
go
ed u
nti
l ?d
ay,
??
?,
12:0
1 a
.m.
EDT.
Repo
rt on
the
MLA
Job
Info
rmat
ion
List
, 201
6–17
1,193(79.7%)
1,165(78.6%)
1,221(77.6%)
1,244(75.6%)
925(75.3%)
628(65.1%)
729(70.0%)
757(69.6%)
713(70.5%) 617
(66.5%)595
(67.3%)552
(67.1%) 460(63.4%)
270(18.0%)
281(19.0%)
315(20.0%)
353(21.4%)
255(20.8%)
304(31.5%)
278(26.7%)
293(27.0%) 274
(27.1%)272
(29.3%)278
(31.4%) 261(31.7%)
247(34.1%)
34 (2.3%) 36 (2.4%)
37 (2.4%)49 (3.0%)
48 (3.9%)
32 (3.3%)
35 (3.4%)37 (3.4%)
24 (2.4%)
39 (4.2%) 11 (1.2%)10 (1.2%)
18 (2.5%)
0
200
400
600
800
1,000
1,200
1,400
1,600
1,800
2004–05 2005–06 2006–07 2007–08 2008–09 2009–10 2010–11 2011–12 2012–13 2013–14 2014–15 2015–16 2016–17
Fig. 4. Number and Percentage of Ads Indexed as Tenure-Track, Non-Tenure-Track, or with Tenure Status Not Specified in the English JIL, 2004–05 to 2016–17
Tenure-track Non-tenure-track Tenure status not specified
Fig. 4. Number and Percentage of Ads Indexed as Tenure-Track, Non-Tenure-Track, or with Tenure Status Not Specified in the English JIL, 2004–05 to 2016–17
the
mod
ern
lang
uage
ass
ocia
tion
of
amer
ica
11
All
in
form
ati
on
em
bar
go
ed u
nti
l ?d
ay,
??
?,
12:0
1 a
.m.
EDT.
Repo
rt on
the
MLA
Job
Info
rmat
ion
List
, 201
6–17
796(63.8%)
800(64.7%)
860(59.9%)
905(59.5%)
695(61.3%)
447(49.0%)
534(54.2%)
568(55.3%)
541(52.9%) 496
(52.5%) 444(50.4%)
445(53.2%) 347
(46.3%)
417(33.4%)
411(33.2%)
550(38.3%)
576(37.9%)
394(34.7%)
437(47.9%)
420(42.6%)
430(41.9%)
450(44.0%) 420
(44.4%) 424(48.1%)
384(45.9%)
388(51.7%)
35 (2.8%) 26 (2.1%)
26 (1.8%)
40 (2.6%)
45 (4.0%)
29 (3.2%)
31 (3.1%)29 (2.8%) 31 (3.0%)
29 (3.1%)
13 (1.5%)8 (1.0%)
15 (2.0%)
0
200
400
600
800
1,000
1,200
1,400
1,600
2004–05 2005–06 2006–07 2007–08 2008–09 2009–10 2010–11 2011–12 2012–13 2013–14 2014–15 2015–16 2016–17
Fig. 5. Number and Percentage of Ads Indexed as Tenure-Track, Non-Tenure-Track, or with Tenure Status Not Specified in the Foreign Language JIL, 2004–05 to 2016–17
Tenure-track Non-tenure-track Tenure status not specified
Fig. 5. Number and Percentage of Ads Indexed as Tenure-Track, Non-Tenure-Track, or with Tenure Status Not Specified in the Foreign Language JIL, 2004–05 to 2016–17
the
mod
ern
lang
uage
ass
ocia
tion
of
amer
ica
12
All
in
form
ati
on
em
bar
go
ed u
nti
l ?d
ay,
??
?,
12:0
1 a
.m.
EDT.
850(56.8%) 806
(54.4%)
884(56.2%)
877(53.3%)
645(52.5%)
469(48.7%)
541(51.9%)
541(49.8%)
513(50.7%) 470
(50.2%) 448
(50.7%) 402(48.8%) 320
(44.1%)
176(11.8%) 190
(12.8%)
181(11.5%)
192(11.7%)
151(12.3%)
78 (8.1%)
92 (8.8%) 109 (10.0%) 98(9.7%)
73 (7.8%) 75 (8.5%)63 (7.7%)
72 (9.9%)
167(11.2%) 169
(11.4%)
156(9.9%)
175(10.6%)
129(10.5%)
81 (8.4%)
96 (9.2%) 107 (9.8%) 102(10.1%)
74 (8.0%) 72 (8.1%)87 (10.6%)
68 (9.4%)
270(18.0%) 281
(19.0%)
315(20.0%)
353(21.4%)
255(20.8%)
304(31.5%)
278(26.7%)
293(27.0%) 274
(27.1%)272
(29.7%)278
(31.5%) 261(31.7%)
247(34.1%)
34 (2.3%) 36 (2.4%)
37 (2.4%)
49 (3.0%)
48 (3.9%)
32 (3.3%)
35 (3.4%)37 (3.4%)
24 (2.4%)
39 (4.3%)11 (1.2%)
10 (1.2%)
18 (2.5%)
0
200
400
600
800
1,000
1,200
1,400
1,600
1,800
2004–05 2005–06 2006–07 2007–08 2008–09 2009–10 2010–11 2011–12 2012–13 2013–14 2014–15 2015–16 2016–17
Fig. 6. Number and Percentage of Ads in the English JIL, 2004–05 to 2016–17,by Index Terms for Tenure Status and Rank
Tenure status not specified
Non-tenure-track position
Other tenure-track position
Tenure-track assistant professor and some other rank (more than one index term for rank chosen)
Tenure-track assistant professor
Fig. 6. Number and Percentage of Ads in the English JIL, 2004–05 to 2016–17,by Index Terms for Tenure Status and Rank
Repo
rt on
the
MLA
Job
Info
rmat
ion
List
, 201
6–17
the
mod
ern
lang
uage
ass
ocia
tion
of
amer
ica
13
All
in
form
ati
on
em
bar
go
ed u
nti
l ?d
ay,
??
?,
12:0
1 a
.m.
EDT.
556(44.6%)
569(46.0%)
642(44.7%)
634(41.7%) 518
(45.7%)322
(35.3%)
384(39.0%)
405(39.4%)
393(38.5%)
371(39.3%) 327
(37.1%)320
(38.2%) 251(33.5%)
123(9.9%)
121(9.8%)
114(7.9%)
140(9.2%)
97(8.6%)
56 (6.1%)
70 (7.1%)74 (7.2%) 69 (6.8%)
65 (6.9%)50 (5.7%) 59 (7.0%)
45 (6.0%)
117(9.4%)
110(8.9%)
104(7.2%)
131(8.6%)
80 (7.1%)
69 (7.6%)
80 (8.1%)89 (8.7%) 79 (7.7%)
60 (6.3%)67 (7.6%) 66 (7.9%)
51 (6.8%)
417(33.4%)
411(33.2%)
550(38.3%)
576(37.9%)
394(34.7%)
437(47.9%)
420(42.6%)
430(41.9%)
450(44.0%) 420
(44.4%) 424(48.1%) 384
(45.9%) 388(51.7%)
35 (2.8%) 26 (2.1%)
26 (1.8%)
40 (2.6%)
45 (4.0%)
29 (3.2%)
31 (3.1%)29 (2.8%) 31 (3.0%)
29 (3.1%)
13 (1.5%)8 (1.0%)
15 (2.0%)
0
200
400
600
800
1,000
1,200
1,400
1,600
2004-05 2005-06 2006-07 2007-08 2008-09 2009-10 2010-11 2011-12 2012–13 2013–14 2014–15 2015–16 2016–17
Fig. 7. Number and Percentage of Ads in the Foreign Language JIL, 2004–05 to 2016–17,by Index Terms for Tenure Status and Rank
Tenure status not specified
Non-tenure-track position
Other tenure-track position
Tenure-track assistant professor and some other rank (more than one index term for rank chosen)
Tenure-track assistant professor
Repo
rt on
the
MLA
Job
Info
rmat
ion
List
, 201
5–16
Fig. 7. Number and Percentage of Ads in the Foreign Language JIL, 2004–05 to 2016–17, by Index Terms for Tenure Status and Rank
the
mod
ern
lang
uage
ass
ocia
tion
of
amer
ica
14
All
in
form
ati
on
em
bar
go
ed u
nti
l ?d
ay,
??
?,
12:0
1 a
.m.
EDT.
Repo
rt on
the
MLA
Job
Info
rmat
ion
List
, 201
6–17
Table 1. Number and Percentage of Ads in the English JIL Indexed for Various Ranks, 2000–01 to 2016–17
1,025 1,006 963 865 956 914 1,005 992 714 562 643 640 608 573 530 482 39563.2% 65.5% 67.1% 63.5% 63.9% 61.7% 63.9% 60.2% 58.1% 58.3% 61.7% 58.9% 60.0% 61.7% 60.0% 58.6% 54.6%
44 30 36 40 35 46 37 34 18 25 27 23 11 7 15 9 62.7% 2.0% 2.5% 2.9% 2.3% 3.1% 2.4% 2.1% 1.5% 2.6% 2.6% 2.1% 1.1% 0.8% 1.7% 1.1% 0.8%
123 105 96 122 122 121 121 125 105 49 63 90 72 59 46 39 487.6% 6.8% 6.7% 9.0% 8.1% 8.2% 7.7% 7.6% 8.6% 5.1% 6.0% 8.3% 7.1% 6.4% 5.2% 4.7% 6.6%
64 79 52 44 53 60 53 70 55 41 24 26 31 23 29 28 29
3.9% 5.1% 3.6% 3.2% 3.5% 4.0% 3.4% 4.3% 4.5% 4.3% 2.3% 2.4% 3.1% 2.5% 3.3% 3.4% 4.0%
17 10 7 8 13 13 9 12 8 9 9 8 4 5 11 4 71.0% 0.7% 0.5% 0.6% 0.9% 0.9% 0.6% 0.7% 0.7% 0.9% 0.9% 0.7% 0.4% 0.5% 1.2% 0.5% 1.0%
148 123 113 103 136 125 130 178 158 157 120 138 121 103 110 95 879.1% 8.0% 7.9% 7.6% 9.1% 8.4% 8.3% 10.8% 12.9% 16.3% 11.5% 12.7% 11.9% 11.1% 12.4% 11.5% 12.0%
17 22 17 30 21 24 27 28 17 10 19 17 19 12 11 13 131.0% 1.4% 1.2% 2.2% 1.4% 1.6% 1.7% 1.7% 1.4% 1.0% 1.8% 1.6% 1.9% 1.3% 1.2% 1.6% 1.8%
62 65 50 40 62 51 77 71 45 28 28 31 47 23 24 37 333.8% 4.2% 3.5% 2.9% 4.1% 3.4% 4.9% 4.3% 3.7% 2.9% 2.7% 2.9% 4.6% 2.5% 2.7% 4.5% 4.6%
46 39 42 55 42 61 40 54 38 23 31 39 28 26 25 28 212.8% 2.5% 2.9% 4.0% 2.8% 4.1% 2.5% 3.3% 3.1% 2.4% 3.0% 3.6% 2.8% 2.8% 2.8% 3.4% 2.9%
1 1 0 1 2 3 0 0 0 3 0 1 1 3 2 0 10.1% 0.1% 0.0% 0.1% 0.1% 0.2% 0.0% 0.0% 0.0% 0.3% 0.0% 0.1% 0.1% 0.3% 0.2% 0.0% 0.1%
48 54 56 505.2% 6.1% 6.8% 6.9%
74 57 60 54 55 64 74 84 70 57 78 74 72 46 27 32 354.6% 3.7% 4.2% 4.0% 3.7% 4.3% 4.7% 5.1% 5.7% 5.9% 7.5% 6.8% 7.1% 5.0% 3.1% 3.9% 4.7%
1,621 1,537 1,436 1,362 1,497 1,482 1,573 1,648 1,228 964 1,042 1,087 1,014 928 884 823 725100.0% 100.0% 100.0% 100.0% 100.0% 100.0% 100.0% 100.0% 100.0% 100.0% 100.0% 100.0% 100.0% 100.0% 100.0% 100.0% 100.0%
Professor
Other combinations not including assistant professor
Postdoctoral fellowship
Rank not specified or not relevant
Total
2009–10 2012–132011–12 2015–162014–152013–14 2016–172003–04 2004–05 2005–06 2007–08 2010–112006–07 2008–092000–01 2001–02 2002–03
Assistant professor
Instructor or assistant professor
Assistant professor or associate professor
Assistant professor, associate professor, or professor
Other combinations including assistant professor
Instructor
Associate professor
Associate professor or professor
Table 1. Number and Percentage of Ads in the English JIL Indexed for Various Ranks, 2000–01 to 2016–17
the
mod
ern
lang
uage
ass
ocia
tion
of
amer
ica
15
All
in
form
ati
on
em
bar
go
ed u
nti
l ?d
ay,
??
?,
12:0
1 a
.m.
EDT.
Repo
rt on
the
MLA
Job
Info
rmat
ion
List
, 201
6–17
Table 2. Number and Percentage of Ads in the Foreign Language JIL Indexed for Various Ranks, 2000–01 to 2016–17
791 739 765 667 689 686 791 780 635 452 503 510 535 483 447 431 38257.4% 59.0% 60.9% 56.7% 55.2% 55.5% 55.1% 51.2% 56.0% 49.5% 51.1% 49.7% 52.2% 51.1% 50.7% 51.5% 50.9%
93 71 54 75 72 69 65 69 52 46 53 53 48 30 30 19 116.7% 5.7% 4.3% 6.4% 5.8% 5.6% 4.5% 4.5% 4.6% 5.0% 5.4% 5.2% 4.7% 3.2% 3.4% 2.3% 1.5%
65 62 76 65 76 61 73 86 64 36 53 52 41 47 29 31 274.7% 4.9% 6.1% 5.5% 6.1% 4.9% 5.1% 5.7% 5.6% 3.9% 5.4% 5.1% 4.0% 5.0% 3.3% 3.7% 3.6%
42 47 34 30 42 49 42 58 36 26 11 26 28 21 22 27 22
3.0% 3.8% 2.7% 2.6% 3.4% 4.0% 2.9% 3.8% 3.2% 2.8% 1.1% 2.5% 2.7% 2.2% 2.5% 3.2% 2.9%
17 8 10 7 8 9 12 17 8 8 8 4 6 5 7 7 61.2% 0.6% 0.8% 0.6% 0.6% 0.7% 0.8% 1.1% 0.7% 0.9% 0.8% 0.4% 0.6% 0.5% 0.8% 0.8% 0.8%
201 183 171 192 210 219 301 320 194 220 218 251 234 209 199 176 17914.6% 14.6% 13.6% 16.3% 16.8% 17.7% 21.0% 21.0% 17.1% 24.1% 22.1% 24.4% 22.8% 22.1% 22.6% 21.0% 23.9%
20 11 8 11 15 17 14 24 16 13 7 13 12 7 7 6 31.5% 0.9% 0.6% 0.9% 1.2% 1.4% 1.0% 1.6% 1.4% 1.4% 0.7% 1.3% 1.2% 0.7% 0.8% 0.7% 0.4%
49 45 50 48 56 50 49 43 34 26 32 21 28 20 23 33 213.6% 3.6% 4.0% 4.1% 4.5% 4.0% 3.4% 2.8% 3.0% 2.8% 3.2% 2.0% 2.7% 2.1% 2.6% 3.9% 2.8%
33 31 27 26 29 34 29 43 26 26 28 40 32 26 31 27 282.4% 2.5% 2.1% 2.2% 2.3% 2.7% 2.0% 2.8% 2.3% 2.8% 2.8% 3.9% 3.1% 2.8% 3.5% 3.2% 3.7%
0 0 0 1 0 0 1 2 2 3 0 0 2 3 1 0 10.0% 0.0% 0.0% 0.1% 0.0% 0.0% 0.1% 0.1% 0.2% 0.3% 0.0% 0.0% 0.2% 0.3% 0.1% 0.0% 0.1%
51 52 55 465.4% 5.9% 6.6% 6.1%
68 56 61 54 51 43 59 80 67 57 72 57 59 43 33 25 244.9% 4.5% 4.9% 4.6% 4.1% 3.5% 4.1% 5.3% 5.9% 6.2% 7.3% 5.6% 5.8% 4.6% 3.7% 3.0% 3.2%
1,379 1,253 1,256 1,176 1,248 1,237 1,436 1,522 1,134 913 985 1,027 1,025 945 881 837 750100.0% 100.0% 100.0% 100.0% 100.0% 100.0% 100.0% 100.0% 100.0% 100.0% 100.0% 100.0% 100.0% 100.0% 100.0% 100.0% 100.0%
Postdoctoral fellowship
Rank not specified or not relevant
Total
Instructor
Associate professor
Associate professor or professor
Professor
Other combinations not including assistant professor
Assistant professor
Instructor or assistant professor
Assistant professor or associate professor
Assistant professor, associate professor, or professor
Other combinations including assistant professor
2011–12 2012–132009–10 2015–162014–152013–14 2016–172005–06 2006–072003–04 2004–05 2010–112007–08 2008–092000–01 2001–02 2002–03
Table 2. Number and Percentage of Ads in the Foreign Language JIL Indexed for Various Ranks, 2000–01 to 2016–17
the modern language association of america 16
All in format ion embargoed unt i l ?day, ?? ?, 12:01 a .m. EDT.
Report on the MLA Job Information List, 2016–17
Tenure-TrackNon-Tenure-
TrackTenure Status Not Specified Total
50 states and DCNew England (CT, MA, ME, NH, RI, VT)
Number of ads 51 35 1 87Row percentage 58.6% 40.2% 1.1% 100.0%Column percentage 11.1% 14.2% 5.6% 12.0%
Mid-East (DC, DE, MD, NJ, NY, PA)
Number of ads 77 67 9 153Row percentage 50.3% 43.8% 5.9% 100.0%Column percentage 16.7% 27.1% 50.0% 21.1%
Great Lakes (IL, IN, MI, OH, WI)
Number of ads 53 26 2 81Row percentage 65.4% 32.1% 2.5% 100.0%Column percentage 11.5% 10.5% 11.1% 11.2%
Southeast (AL, AR, FL, GA, KY, LA, MS, NC, SC, TN, VA, WV)
Number of ads 115 44 0 159Row percentage 72.3% 27.7% 0.0% 100.0%Column percentage 25.0% 17.8% 0.0% 21.9%
Plains (IA, KS, MN, MO, ND, NE, SD)
Number of ads 20 6 0 26Row percentage 76.9% 23.1% 0.0% 100.0%Column percentage 4.3% 2.4% 0.0% 3.6%
Rocky Mountain (CO, ID, MT, UT, WY)
Number of ads 18 4 0 22Row percentage 81.8% 18.2% 0.0% 100.0%Column percentage 3.9% 1.6% 0.0% 3.0%
Southwest (AZ, NM, OK, TX)
Number of ads 25 17 0 42Row percentage 59.5% 40.5% 0.0% 100.0%Column percentage 5.4% 6.9% 0.0% 5.8%
Far West (AK, CA, HI, NV, OR, WA)
Number of ads 76 32 6 114Row percentage 66.7% 28.1% 5.3% 100.0%Column percentage 16.5% 13.0% 33.3% 15.7%Totals for 50 states and DC
Number of ads 435 231 18 684Row percentage 63.6% 33.8% 2.6% 100.0%Column percentage 94.6% 93.5% 100.0% 94.3%
CanadaNumber of ads 12 1 0 13Row percentage 92.3% 7.7% 0.0% 100.0%Column percentage 2.6% 0.4% 0.0% 1.8%
Other countriesNumber of ads 13 15 0 28Row percentage 46.4% 53.6% 0.0% 100.0%Column percentage 2.8% 6.1% 0.0% 3.9%
TotalsNumber of ads 460 247 18 725Row percentage 63.4% 34.1% 2.5% 100.0%Column percentage 100.0% 100.0% 100.0% 100.0%
Table 3A. Tenure Status of All Ads Placed in the 2016–17 English JIL , by Geographic RegionTable 3A. Tenure Status of All Ads in the 2016–17 English JIL, by Geographic Region
the modern language association of america 17
All in format ion embargoed unt i l ?day, ?? ?, 12:01 a .m. EDT.
Report on the MLA Job Information List, 2016–17
Tenure-TrackNon-Tenure-
TrackTenure Status Not Specified Total
50 states and DCNew England (CT, MA, ME, NH, RI, VT)
Number of ads 38 11 0 49Row percentage 77.6% 22.4% 0.0% 100.0%Column percentage 9.7% 12.1% 0.0% 10.1%
Mid-East (DC, DE, MD, NJ, NY, PA)
Number of ads 67 28 1 96Row percentage 69.8% 29.2% 1.0% 100.0%Column percentage 17.1% 30.8% 50.0% 19.8%
Great Lakes (IL, IN, MI, OH, WI)
Number of ads 44 15 0 59Row percentage 74.6% 25.4% 0.0% 100.0%Column percentage 11.2% 16.5% 0.0% 12.2%
Southeast (AL, AR, FL, GA, KY, LA, MS, NC, SC, TN, VA, WV)
Number of ads 103 16 0 119Row percentage 86.6% 13.4% 0.0% 100.0%Column percentage 26.3% 17.6% 0.0% 24.5%
Plains (IA, KS, MN, MO, ND, NE, SD)
Number of ads 18 2 0 20Row percentage 90.0% 10.0% 0.0% 100.0%Column percentage 4.6% 2.2% 0.0% 4.1%
Rocky Mountain (CO, ID, MT, UT, WY)
Number of ads 17 3 0 20Row percentage 85.0% 15.0% 0.0% 100.0%Column percentage 4.3% 3.3% 0.0% 4.1%
Southwest (AZ, NM, OK, TX)
Number of ads 22 3 0 25Row percentage 88.0% 12.0% 0.0% 100.0%Column percentage 5.6% 3.3% 0.0% 5.2%
Far West (AK, CA, HI, NV, OR, WA)
Number of ads 62 6 1 69Row percentage 89.9% 8.7% 1.4% 100.0%Column percentage 15.8% 6.6% 50.0% 14.2%Totals for 50 states and DC
Number of ads 371 84 2 457Row percentage 81.2% 18.4% 0.4% 100.0%Column percentage 94.6% 92.3% 100.0% 94.2%
CanadaNumber of ads 10 0 0 10Row percentage 100.0% 0.0% 0.0% 100.0%Column percentage 2.6% 0.0% 0.0% 2.1%
Other countriesNumber of ads 11 7 0 18Row percentage 61.1% 38.9% 0.0% 100.0%Column percentage 2.8% 7.7% 0.0% 3.7%
TotalsNumber of ads 392 91 2 485Row percentage 80.8% 18.8% 0.4% 100.0%Column percentage 100.0% 100.0% 100.0% 100.0%
Table 3B. Tenure Status of Ads Tagged for Assistant Professor or for Assistant Professor and Some Other Rank in the 2016–17 English JIL , by Geographic RegionTable 3B. Tenure Status of Ads Tagged for Assistant Professor or for Assistant Professor and Some Other Rank in the 2016–17 English JIL, by Geographic Region
the modern language association of america 18
All in format ion embargoed unt i l ?day, ?? ?, 12:01 a .m. EDT.
Report on the MLA Job Information List, 2016–17
Tenure-TrackNon-Tenure-
TrackTenure Status Not Specified Total
50 states and DCNew England (CT, MA, ME, NH, RI, VT)
Number of ads 40 50 1 91Row percentage 44.0% 54.9% 1.1% 100.0%Column percentage 11.5% 12.9% 6.7% 12.1%
Mid-East (DC, DE, MD, NJ, NY, PA)
Number of ads 64 107 5 176Row percentage 36.4% 60.8% 2.8% 100.0%Column percentage 18.4% 27.6% 33.3% 23.5%
Great Lakes (IL, IN, MI, OH, WI)
Number of ads 45 63 1 109Row percentage 41.3% 57.8% 0.9% 100.0%Column percentage 13.0% 16.2% 6.7% 14.5%
Southeast (AL, AR, FL, GA, KY, LA, MS, NC, SC, TN, VA, WV)
Number of ads 76 62 0 138Row percentage 55.1% 44.9% 0.0% 100.0%Column percentage 21.9% 16.0% 0.0% 18.4%
Plains (IA, KS, MN, MO, ND, NE, SD)
Number of ads 13 19 0 32Row percentage 40.6% 59.4% 0.0% 100.0%Column percentage 3.7% 4.9% 0.0% 4.3%
Rocky Mountain (CO, ID, MT, UT, WY)
Number of ads 11 10 0 21Row percentage 52.4% 47.6% 0.0% 100.0%Column percentage 3.2% 2.6% 0.0% 2.8%
Southwest (AZ, NM, OK, TX)
Number of ads 34 25 0 59Row percentage 57.6% 42.4% 0.0% 100.0%Column percentage 9.8% 6.4% 0.0% 7.9%
Far West (AK, CA, HI, NV, OR, WA)
Number of ads 48 28 7 83Row percentage 57.8% 33.7% 8.4% 100.0%Column percentage 13.8% 7.2% 46.7% 11.1%Totals for 50 states and DC
Number of ads 331 364 14 709Row percentage 46.7% 51.3% 2.0% 100.0%Column percentage 95.4% 93.8% 93.3% 94.5%
CanadaNumber of ads 7 5 0 12Row percentage 58.3% 41.7% 0.0% 100.0%Column percentage 2.0% 1.3% 0.0% 1.6%
Other countriesNumber of ads 9 19 1 29Row percentage 31.0% 65.5% 3.4% 100.0%Column percentage 2.6% 4.9% 6.7% 3.9%
TotalsNumber of ads 347 388 15 750Row percentage 46.3% 51.7% 2.0% 100.0%Column percentage 100.0% 100.0% 100.0% 100.0%
Table 4A. Tenure Status of All Ads Placed in the 2016–17 Foreign Language JIL , by Geographic RegionTable 4A. Tenure Status of All Ads in the 2016–17 Foreign Language JIL, by Geographic Region
the modern language association of america 19
All in format ion embargoed unt i l ?day, ?? ?, 12:01 a .m. EDT.
Report on the MLA Job Information List, 2016–17
Tenure-TrackNon-Tenure-
TrackTenure Status Not Specified Total
50 states and DCNew England (CT, MA, ME, NH, RI, VT)
Number of ads 32 17 1 50Row percentage 64.0% 34.0% 2.0% 100.0%Column percentage 10.8% 11.5% 25.0% 11.2%
Mid-East (DC, DE, MD, NJ, NY, PA)
Number of ads 57 41 0 98Row percentage 58.2% 41.8% 0.0% 100.0%Column percentage 19.3% 27.7% 0.0% 21.9%
Great Lakes (IL, IN, MI, OH, WI)
Number of ads 42 34 0 76Row percentage 55.3% 44.7% 0.0% 100.0%Column percentage 14.2% 23.0% 0.0% 17.0%
Southeast (AL, AR, FL, GA, KY, LA, MS, NC, SC, TN, VA, WV)
Number of ads 67 28 0 95Row percentage 70.5% 29.5% 0.0% 100.0%Column percentage 22.6% 18.9% 0.0% 21.2%
Plains (IA, KS, MN, MO, ND, NE, SD)
Number of ads 11 5 0 16Row percentage 68.8% 31.3% 0.0% 100.0%Column percentage 3.7% 3.4% 0.0% 3.6%
Rocky Mountain (CO, ID, MT, UT, WY)
Number of ads 9 3 0 12Row percentage 75.0% 25.0% 0.0% 100.0%Column percentage 3.0% 2.0% 0.0% 2.7%
Southwest (AZ, NM, OK, TX)
Number of ads 28 5 0 33Row percentage 84.8% 15.2% 0.0% 100.0%Column percentage 9.5% 3.4% 0.0% 7.4%
Far West (AK, CA, HI, NV, OR, WA)
Number of ads 41 6 3 50Row percentage 82.0% 12.0% 6.0% 100.0%Column percentage 13.9% 4.1% 75.0% 11.2%Totals for 50 states and DC
Number of ads 287 139 4 430Row percentage 66.7% 32.3% 0.9% 100.0%Column percentage 97.0% 93.9% 100.0% 96.0%
CanadaNumber of ads 3 1 0 4Row percentage 75.0% 25.0% 0.0% 100.0%Column percentage 1.0% 0.7% 0.0% 0.9%
Other countriesNumber of ads 6 8 0 14Row percentage 42.9% 57.1% 0.0% 100.0%Column percentage 2.0% 5.4% 0.0% 3.1%
TotalsNumber of ads 296 148 4 448Row percentage 66.1% 33.0% 0.9% 100.0%Column percentage 100.0% 100.0% 100.0% 100.0%
Table 4B. Tenure Status of Ads Tagged for Assistant Professor or for Assistant Professor and Some Other Rank in the 2016–17 Foreign Language JIL , by Geographic RegionTable 4B. Tenure Status of Ads Tagged for Assistant Professor or for Assistant Professor and Some Other Rank in the 2016–17 Foreign Language JIL, by Geographic Region
the
mod
ern
lang
uage
ass
ocia
tion
of
amer
ica
20
All
in
form
ati
on
em
bar
go
ed u
nti
l ?d
ay,
??
?,
12:0
1 a
.m.
EDT.
Repo
rt on
the
MLA
Job
Info
rmat
ion
List
, 201
6–17
Table 5. Number and Percentage of Ads in the English JIL , 2000–01 to 2016–17, by Geographic Region
2000–01 2001–02 2002–03 2003–04 2004–05 2005–06 2006–07 2007–08 2008–09 2009–10 2010–11 2011–12 2012–13 2013–14 2014–15 2015–16 2016–17New England 144 107 117 131 127 118 129 125 112 95 99 86 100 82 84 73 87
(CT, MA, ME, NH, RI, VT) 8.9% 7.0% 8.1% 9.6% 8.5% 8.0% 8.2% 7.6% 9.1% 9.8% 9.5% 7.9% 9.9% 8.8% 9.5% 8.9% 12.0%
Mid-East 323 301 304 264 324 318 302 340 247 197 200 219 219 200 203 168 153(DC, DE, MD, NJ, NY, PA) 19.9% 19.6% 21.2% 19.4% 21.6% 21.5% 19.2% 20.6% 20.1% 20.4% 19.2% 20.1% 21.6% 21.6% 23.0% 20.4% 21.1%
Great Lakes 276 283 251 234 270 228 247 243 180 177 160 179 162 153 122 98 81(IL, IN, MI, OH, WI) 17.0% 18.4% 17.5% 17.2% 18.0% 15.4% 15.7% 14.7% 14.6% 18.3% 15.3% 16.5% 16.0% 16.5% 13.8% 11.9% 11.2%
Southeast 305 312 262 267 293 326 365 379 235 203 211 227 202 185 162 194 159(AL, AR, FL, GA, KY, LA, MS, NC, SC, TN, VA, WV) 18.8% 20.3% 18.2% 19.6% 19.6% 22.0% 23.2% 23.0% 19.1% 21.0% 20.2% 20.9% 19.9% 19.9% 18.3% 23.6% 21.9%
Plains 113 83 89 91 101 81 98 115 78 58 64 66 67 54 55 54 26(IA, KS, MN, MO, ND, NE, SD) 7.0% 5.4% 6.2% 6.7% 6.7% 5.5% 6.2% 7.0% 6.3% 6.0% 6.1% 6.1% 6.6% 5.8% 6.2% 6.6% 3.6%
Rocky Mountain 55 58 42 34 38 51 45 43 33 19 28 26 29 24 27 28 22(CO, ID, MT, UT, WY) 3.4% 3.8% 2.9% 2.5% 2.5% 3.4% 2.9% 2.6% 2.7% 2.0% 2.7% 2.4% 2.9% 2.6% 3.1% 3.4% 3.0%
Southwest 124 119 94 91 107 94 102 119 114 66 71 71 71 65 69 55 42(AZ, NM, OK, TX) 7.6% 7.7% 6.5% 6.7% 7.1% 6.3% 6.5% 7.2% 9.3% 6.8% 6.8% 6.5% 7.0% 7.0% 7.8% 6.7% 5.8%
Far West 209 204 189 171 165 177 196 192 148 83 131 130 95 108 117 115 114(AK, CA, HI, NV, OR, WA) 12.9% 13.3% 13.2% 12.6% 11.0% 11.9% 12.5% 11.7% 12.0% 8.6% 12.5% 11.9% 9.4% 11.6% 13.2% 14.0% 15.7%
Outlying areas 8 5 6 3 2 4 1 4 2 2(AS, FM, GU, MH, MP, PR, PW, VI) 0.5% 0.3% 0.4% 0.2% 0.1% 0.3% 0.1% 0.2% 0.2% 0.0% 0.0% 0.0% 0.0% 0.2% 0.0% 0.0% 0.0%
33 37 49 50 46 45 47 40 30 15 23 26 23 23 16 17 132.0% 2.4% 3.4% 3.7% 3.1% 3.0% 3.0% 2.4% 2.4% 1.6% 2.2% 2.4% 2.3% 2.5% 1.8% 2.1% 1.8%
31 28 33 26 24 40 41 48 51 52 57 58 46 32 29 21 281.9% 1.8% 2.3% 1.9% 1.6% 2.7% 2.6% 2.9% 4.1% 5.4% 5.5% 5.3% 4.5% 3.4% 3.3% 2.6% 3.9%1,621 1,537 1,436 1,362 1,497 1,482 1,573 1,648 1,230 965 1,044 1,088 1,014 928 884 823 725
100.0% 100.0% 100.0% 100.0% 100.0% 100.0% 100.0% 100.0% 100.0% 100.0% 100.0% 100.0% 100.0% 100.0% 100.0% 100.0% 100.0%Total
Outside the United States and Canada
Canada
Table 5. Number and Percentage of Ads in the English JIL, 2000–01 to 2016–17, by Geographic Region
the
mod
ern
lang
uage
ass
ocia
tion
of
amer
ica
21
All
in
form
ati
on
em
bar
go
ed u
nti
l ?d
ay,
??
?,
12:0
1 a
.m.
EDT.
Repo
rt on
the
MLA
Job
Info
rmat
ion
List
, 201
6–17
Table 6. Number and Percentage of Ads in the Foreign Language JIL , 2000–01 to 2016–17, by Geographic Region
2000–01 2001–02 2002–03 2003–04 2004–05 2005–06 2006–07 2007–08 2008–09 2009–10 2010–11 2011–12 2012–13 2013–14 2014–15 2015–16 2016–17New England 133 105 132 102 116 102 146 154 118 95 106 130 117 89 114 95 91
(CT, MA, ME, NH, RI, VT) 9.6% 8.4% 10.5% 8.7% 9.3% 8.2% 10.2% 10.1% 10.4% 10.4% 10.7% 12.7% 11.4% 9.4% 12.9% 11.4% 12.1%
Mid-East 311 294 269 228 244 229 316 320 238 219 221 213 233 216 197 188 176(DC, DE, MD, NJ, NY, PA) 22.6% 23.5% 21.4% 19.4% 19.6% 18.5% 22.0% 21.0% 21.0% 23.9% 22.4% 20.7% 22.7% 22.9% 22.4% 22.5% 23.5%
Great Lakes 234 188 195 209 196 220 214 219 190 153 164 166 162 152 124 84 109(IL, IN, MI, OH, WI) 17.0% 15.0% 15.5% 17.8% 15.7% 17.8% 14.9% 14.4% 16.7% 16.7% 16.6% 16.2% 15.8% 16.1% 14.1% 10.0% 14.5%
Southeast 244 230 241 233 257 257 296 303 212 175 212 187 204 187 173 154 138(AL, AR, FL, GA, KY, LA, MS, NC, SC, TN, VA, WV) 17.7% 18.4% 19.2% 19.8% 20.6% 20.8% 20.6% 19.9% 18.7% 19.1% 21.5% 18.2% 19.9% 19.8% 19.6% 18.4% 18.4%
Plains 111 95 73 83 98 104 117 116 83 56 60 57 68 52 52 60 32(IA, KS, MN, MO, ND, NE, SD) 8.0% 7.6% 5.8% 7.1% 7.9% 8.4% 8.1% 7.6% 7.3% 6.1% 6.1% 5.6% 6.6% 5.5% 5.9% 7.2% 4.3%
Rocky Mountain 43 35 39 28 47 54 42 40 44 22 31 27 31 25 21 39 21(CO, ID, MT, UT, WY) 3.1% 2.8% 3.1% 2.4% 3.8% 4.4% 2.9% 2.6% 3.9% 2.4% 3.1% 2.6% 3.0% 2.6% 2.4% 4.7% 2.8%
Southwest 85 76 69 77 86 61 84 105 77 65 48 60 64 67 53 70 59(AZ, NM, OK, TX) 6.2% 6.1% 5.5% 6.5% 6.9% 4.9% 5.8% 6.9% 6.8% 7.1% 4.9% 5.8% 6.2% 7.1% 6.0% 8.4% 7.9%
Far West 156 173 157 159 159 145 158 181 106 71 93 115 91 96 104 101 83(AK, CA, HI, NV, OR, WA) 11.3% 13.8% 12.5% 13.5% 12.7% 11.7% 11.0% 11.9% 9.3% 7.8% 9.4% 11.2% 8.9% 10.2% 11.8% 12.1% 11.1%
Outlying areas 13 8 7 8 6 3 5 4 5 2(AS, FM, GU, MH, MP, PR, PW, VI) 0.9% 0.6% 0.6% 0.7% 0.5% 0.2% 0.3% 0.3% 0.4% 0.0% 0.0% 0.0% 0.0% 0.2% 0.0% 0.0% 0.0%
36 33 46 37 24 43 47 42 26 26 15 28 22 17 13 16 122.6% 2.6% 3.7% 3.1% 1.9% 3.5% 3.3% 2.8% 2.3% 2.8% 1.5% 2.7% 2.1% 1.8% 1.5% 1.9% 1.6%
Outside the United States and Canada 13 16 28 12 15 19 11 38 36 34 37 44 34 42 30 30 290.9% 1.3% 2.2% 1.0% 1.2% 1.5% 0.8% 2.5% 3.2% 3.7% 3.7% 4.3% 3.3% 4.4% 3.4% 3.6% 3.9%1,379 1,253 1,256 1,176 1,248 1,237 1,436 1,522 1,135 916 987 1,027 1,026 945 881 837 750
100.0% 100.0% 100.0% 100.0% 100.0% 100.0% 100.0% 100.0% 100.0% 100.0% 100.0% 100.0% 100.0% 100.0% 100.0% 100.0% 100.0%
Canada
Total
Table 6. Number and Percentage of Ads in the Foreign Language JIL, 2000–01 to 2016–17, by Geographic Region
the modern language association of america 22
All in format ion embargoed unt i l ?day, ?? ?, 12:01 a .m. EDT.
Report on the MLA Job Information List, 2016–17
Tenure-TrackNon-Tenure-
TrackTenure Status Not Specified Total
ArabicNumber of ads 17 17 0 34Row percentage 50.0% 50.0% 0.0% 100.0%Column percentage 4.9% 4.4% 0.0% 4.5%
ChineseNumber of ads 21 28 0 49Row percentage 42.9% 57.1% 0.0% 100.0%Column percentage 6.1% 7.2% 0.0% 6.5%
ClassicalNumber of ads 9 4 0 13Row percentage 69.2% 30.8% 0.0% 100.0%Column percentage 2.6% 1.0% 0.0% 1.7%
French and francophoneNumber of ads 65 60 2 127Row percentage 51.2% 47.2% 1.6% 100.0%Column percentage 18.7% 15.5% 13.3% 16.9%
Germanic and ScandinavianNumber of ads 39 56 1 96Row percentage 40.6% 58.3% 1.0% 100.0%Column percentage 11.2% 14.4% 6.7% 12.8%
HebrewNumber of ads 10 8 0 18Row percentage 55.6% 44.4% 0.0% 100.0%Column percentage 2.9% 2.1% 0.0% 2.4%
ItalianNumber of ads 18 20 1 39Row percentage 46.2% 51.3% 2.6% 100.0%Column percentage 5.2% 5.2% 6.7% 5.2%
JapaneseNumber of ads 17 21 0 38Row percentage 44.7% 55.3% 0.0% 100.0%Column percentage 4.9% 5.4% 0.0% 5.1%
KoreanNumber of ads 4 5 1 10Row percentage 40.0% 50.0% 10.0% 100.0%Column percentage 1.2% 1.3% 6.7% 1.3%
PortugueseNumber of ads 11 11 0 22Row percentage 50.0% 50.0% 0.0% 100.0%Column percentage 3.2% 2.8% 0.0% 2.9%
Russian and SlavicNumber of ads 20 18 2 40Row percentage 50.0% 45.0% 5.0% 100.0%Column percentage 5.8% 4.6% 13.3% 5.3%
Spanish and Latin AmericaNumber of ads 141 112 3 256Row percentage 55.1% 43.8% 1.2% 100.0%Column percentage 40.6% 28.9% 20.0% 34.1%
Other languagesNumber of ads 5 12 0 17Row percentage 29.4% 70.6% 0.0% 100.0%Column percentage 1.4% 3.1% 0.0% 2.3%
No language specifiedNumber of ads 51 65 6 122Row percentage 41.8% 53.3% 4.9% 100.0%Column percentage 14.7% 16.8% 40.0% 16.3%
Total number of ads 347 388 15 750Total row percentage 46.3% 51.7% 2.0% 100.0%
Table 7A. Tenure Status of All Ads in the 2016–17 Foreign Language JIL , by Language
Table 7A. Tenure Status of All Ads in the 2016–17 Foreign Language JIL, by Language
the modern language association of america 23
All in format ion embargoed unt i l ?day, ?? ?, 12:01 a .m. EDT.
Report on the MLA Job Information List, 2016–17
Tenure-TrackNon-Tenure-
TrackTenure Status Not Specified Total
ArabicNumber of ads 14 7 0 21Row percentage 66.7% 33.3% 0.0% 100.0%Column percentage 4.7% 4.7% 0.0% 4.7%
ChineseNumber of ads 19 10 0 29Row percentage 65.5% 34.5% 0.0% 100.0%Column percentage 6.4% 6.8% 0.0% 6.5%
ClassicalNumber of ads 7 1 0 8Row percentage 87.5% 12.5% 0.0% 100.0%Column percentage 2.4% 0.7% 0.0% 1.8%
French and francophoneNumber of ads 57 24 0 81Row percentage 70.4% 29.6% 0.0% 100.0%Column percentage 19.3% 16.2% 0.0% 18.1%
Germanic and ScandinavianNumber of ads 34 27 0 61Row percentage 55.7% 44.3% 0.0% 100.0%Column percentage 11.5% 18.2% 0.0% 13.6%
HebrewNumber of ads 7 1 0 8Row percentage 87.5% 12.5% 0.0% 100.0%Column percentage 2.4% 0.7% 0.0% 1.8%
ItalianNumber of ads 13 8 0 21Row percentage 61.9% 38.1% 0.0% 100.0%Column percentage 4.4% 5.4% 0.0% 4.7%
JapaneseNumber of ads 16 8 0 24Row percentage 66.7% 33.3% 0.0% 100.0%Column percentage 5.4% 5.4% 0.0% 5.4%
KoreanNumber of ads 3 1 1 5Row percentage 60.0% 20.0% 20.0% 100.0%Column percentage 1.0% 0.7% 25.0% 1.1%
PortugueseNumber of ads 8 3 0 11Row percentage 72.7% 27.3% 0.0% 100.0%Column percentage 2.7% 2.0% 0.0% 2.5%
Russian and SlavicNumber of ads 17 6 1 24Row percentage 70.8% 25.0% 4.2% 100.0%Column percentage 5.7% 4.1% 25.0% 5.4%
Spanish and Latin AmericaNumber of ads 119 49 1 169Row percentage 70.4% 29.0% 0.6% 100.0%Column percentage 40.2% 33.1% 25.0% 37.7%
Other languagesNumber of ads 4 4 0 8Row percentage 50.0% 50.0% 0.0% 100.0%Column percentage 1.4% 2.7% 0.0% 1.8%
No language specifiedNumber of ads 38 12 1 51Row percentage 74.5% 23.5% 2.0% 100.0%Column percentage 12.8% 8.1% 25.0% 11.4%
Total number of ads 296 148 4 448Total row percentage 66.1% 33.0% 0.9% 100.0%
Table 7B. Tenure Status of All Ads Tagged for Assistant Professor or for Assistant Professor and Some Other Rank in the 2016–17 Foreign Language JIL , by Language
Table 7B. Tenure Status of All Ads Tagged for Assistant Professor or for Assistant Professor and Some Other Rank in the 2016–17 Foreign Language JIL, by Language
the modern language association of america 24
All in format ion embargoed unt i l ?day, ?? ?, 12:01 a .m. EDT.
Report on the MLA Job Information List, 2016–17
Table 8A. Tenure Status of All Ads in the 2016–17 English JIL , by English Field Category
Tenure-TrackNon-Tenure-
TrackTenure Status Not Specified Total
WritingComposition and rhetoric
Number of ads 115 97 5 217Row percentage 53.0% 44.7% 2.3% 100.0%Column percentage 25.0% 39.3% 27.8% 29.9%
Technical and business writingNumber of ads 51 22 1 74Row percentage 68.9% 29.7% 1.4% 100.0%Column percentage 11.1% 8.9% 5.6% 10.2%
Creative writing and journalismNumber of ads 93 39 6 138Row percentage 67.4% 28.3% 4.3% 100.0%Column percentage 20.2% 15.8% 33.3% 19.0%Total for writing
Number of ads 259 158 12 429Row percentage 60.4% 36.8% 2.8% 100.0%Column percentage 56.3% 64.0% 66.7% 59.2%
LiteratureBritish literature
Number of ads 119 66 2 187Row percentage 63.6% 35.3% 1.1% 100.0%Column percentage 25.9% 26.7% 11.1% 25.8%
American literature (chiefly United States)Number of ads 103 66 3 172Row percentage 59.9% 38.4% 1.7% 100.0%Column percentage 22.4% 26.7% 16.7% 23.7%
African American literatureNumber of ads 63 21 2 86Row percentage 73.3% 24.4% 2.3% 100.0%Column percentage 13.7% 8.5% 11.1% 11.9%
Literature in English other than British and AmericanNumber of ads 52 16 2 70Row percentage 74.3% 22.9% 2.9% 100.0%Column percentage 11.3% 6.5% 11.1% 9.7%
Other minority literaturesNumber of ads 61 21 2 84Row percentage 72.6% 25.0% 2.4% 100.0%Column percentage 13.3% 8.5% 11.1% 11.6%Total for literature
Number of ads 398 190 11 599Row percentage 66.4% 31.7% 1.8% 100.0%Column percentage 86.5% 76.9% 61.1% 82.6%
English educationNumber of ads 25 9 4 38Row percentage 65.8% 23.7% 10.5% 100.0%Column percentage 5.4% 3.6% 22.2% 5.2%
Total number of ads 460 247 18 725Total row percentage 63.4% 34.1% 2.5% 100.0%
Table 8A. Tenure Status of All Ads in the 2016–17 English JIL, by English Field Category
the modern language association of america 25
All in format ion embargoed unt i l ?day, ?? ?, 12:01 a .m. EDT.
Report on the MLA Job Information List, 2016–17
Tenure-TrackNon-Tenure-
TrackTenure Status Not Specified Total
WritingComposition and rhetoric
Number of ads 94 29 0 123Row percentage 76.4% 23.6% 0.0% 100.0%Column percentage 24.0% 31.9% 0.0% 25.4%
Technical and business writingNumber of ads 45 5 0 50Row percentage 90.0% 10.0% 0.0% 100.0%Column percentage 11.5% 5.5% 0.0% 10.3%
Creative writing and journalismNumber of ads 80 13 0 93Row percentage 86.0% 14.0% 0.0% 100.0%Column percentage 20.4% 14.3% 0.0% 19.2%Total for writing
Number of ads 219 47 0 266Row percentage 82.3% 17.7% 0.0% 100.0%Column percentage 55.9% 51.6% 0.0% 54.8%
LiteratureBritish literature
Number of ads 108 26 2 136Row percentage 79.4% 19.1% 1.5% 100.0%Column percentage 27.6% 28.6% 100.0% 28.0%
American literature (chiefly United States)Number of ads 88 20 2 110Row percentage 80.0% 18.2% 1.8% 100.0%Column percentage 22.4% 22.0% 100.0% 22.7%
African American literatureNumber of ads 52 8 1 61Row percentage 85.2% 13.1% 1.6% 100.0%Column percentage 13.3% 8.8% 50.0% 12.6%
Literature in English other than British and AmericanNumber of ads 51 8 1 60Row percentage 85.0% 13.3% 1.7% 100.0%Column percentage 13.0% 8.8% 50.0% 12.4%
Other minority literaturesNumber of ads 55 6 1 62Row percentage 88.7% 9.7% 1.6% 100.0%Column percentage 14.0% 6.6% 50.0% 12.8%Total for literature
Number of ads 354 68 7 429Row percentage 82.5% 15.9% 1.6% 100.0%Column percentage 90.3% 74.7% 350.0% 88.5%
English educationNumber of ads 23 2 0 25Row percentage 92.0% 8.0% 0.0% 100.0%Column percentage 5.9% 2.2% 0.0% 5.2%
Total number of ads 392 91 2 485Total row percentage 80.8% 18.8% 0.4% 100.0%
Table 8B. Tenure Status of Ads Tagged for Assistant Professor or for Assistant Professor and Some Other Rank in the 2016–17 English JIL , by English Field CategoryTable 8B. Tenure Status of Ads Tagged for Assistant Professor or for Assistant Professor and Some
Other Rank in the 2016–17 English JIL, by English Field Category
the modern language association of america 26
All in format ion embargoed unt i l ?day, ?? ?, 12:01 a .m. EDT.
Report on the MLA Job Information List, 2016–17
Tenure-TrackNon-Tenure-
TrackTenure Status Not Specified Total
Comparative literatureNumber of ads 79 71 2 152Row percentage 52.0% 46.7% 1.3% 100.0%Column percentage 10.5% 12.8% 8.3% 11.5%
Criticism and theoryNumber of ads 56 37 2 95Row percentage 58.9% 38.9% 2.1% 100.0%Column percentage 7.5% 6.7% 8.3% 7.2%
Cultural studiesNumber of ads 128 88 4 220Row percentage 58.2% 40.0% 1.8% 100.0%Column percentage 17.1% 15.9% 16.7% 16.6%
Film, drama, and speechNumber of ads 48 24 1 73Row percentage 65.8% 32.9% 1.4% 100.0%Column percentage 6.4% 4.3% 4.2% 5.5%
GeneralistNumber of ads 40 33 0 73Row percentage 54.8% 45.2% 0.0% 100.0%Column percentage 5.3% 6.0% 0.0% 5.5%
InterdisciplinaryNumber of ads 88 77 5 170Row percentage 51.8% 45.3% 2.9% 100.0%Column percentage 11.7% 13.9% 20.8% 12.8%
Linguistics and ESLNumber of ads 59 47 2 108Row percentage 54.6% 43.5% 1.9% 100.0%Column percentage 7.9% 8.5% 8.3% 8.1%
Postcolonial literatureNumber of ads 30 12 0 42Row percentage 71.4% 28.6% 0.0% 100.0%Column percentage 4.0% 2.2% 0.0% 3.2%
Technology and digital mediaNumber of ads 61 30 2 93Row percentage 65.6% 32.3% 2.2% 100.0%Column percentage 8.1% 5.4% 8.3% 7.0%
World literatureNumber of ads 42 21 2 65Row percentage 64.6% 32.3% 3.1% 100.0%Column percentage 5.6% 3.8% 8.3% 4.9%
Other academic specializationsNumber of ads 42 19 5 66Row percentage 63.6% 28.8% 7.6% 100.0%Column percentage 5.6% 3.4% 20.8% 5.0%
Department chair or other administratorNumber of ads 76 75 7 158Row percentage 48.1% 47.5% 4.4% 100.0%Column percentage 10.1% 13.6% 29.2% 11.9%
Business, government, and nonprofit sectorNumber of ads 0 0 0 11Row percentage 0.0% 0.0% 0.0% 100.0%Column percentage 0.0% 0.0% 0.0% 0.8%
Total number of ads 750 553 24 1,327Total row percentage 60.3% 38.4% 1.3% 100.0%
Table 9A. Tenure Status of All Ads in the 2016–17 JIL , by General Field CategoryTable 9A. Tenure Status of All Ads in the 2016–17 JIL, by General Field Category
the modern language association of america 27
All in format ion embargoed unt i l ?day, ?? ?, 12:01 a .m. EDT.
Report on the MLA Job Information List, 2016–17
Tenure-TrackNon-Tenure-
TrackTenure Status Not Specified Total
Comparative literatureNumber of ads 69 28 1 98Row percentage 70.4% 28.6% 1.0% 100.0%Column percentage 10.7% 12.9% 20.0% 11.3%
Criticism and theoryNumber of ads 49 11 1 61Row percentage 80.3% 18.0% 1.6% 100.0%Column percentage 7.6% 5.1% 20.0% 7.0%
Cultural studiesNumber of ads 107 33 3 143Row percentage 74.8% 23.1% 2.1% 100.0%Column percentage 16.6% 15.2% 60.0% 16.5%
Film, drama, and speechNumber of ads 44 12 0 56Row percentage 78.6% 21.4% 0.0% 100.0%Column percentage 6.8% 5.5% 0.0% 6.5%
GeneralistNumber of ads 37 14 0 51Row percentage 72.5% 27.5% 0.0% 100.0%Column percentage 5.7% 6.5% 0.0% 5.9%
InterdisciplinaryNumber of ads 73 20 2 95Row percentage 76.8% 21.1% 2.1% 100.0%Column percentage 11.3% 9.2% 40.0% 11.0%
Linguistics and ESLNumber of ads 53 10 0 63Row percentage 84.1% 15.9% 0.0% 100.0%Column percentage 8.2% 4.6% 0.0% 7.3%
Postcolonial literatureNumber of ads 25 7 0 32Row percentage 78.1% 21.9% 0.0% 100.0%Column percentage 3.9% 3.2% 0.0% 3.7%
Technology and digital mediaNumber of ads 53 8 0 61Row percentage 86.9% 13.1% 0.0% 100.0%Column percentage 8.2% 3.7% 0.0% 7.0%
World literatureNumber of ads 38 12 1 51Row percentage 74.5% 23.5% 2.0% 100.0%Column percentage 5.9% 5.5% 20.0% 5.9%
Department chair or other administratorNumber of ads 10 2 0 12Row percentage 83.3% 16.7% 0.0% 100.0%Column percentage 1.6% 0.9% 0.0% 1.4%
Other academic specializationsNumber of ads 65 20 1 86Row percentage 75.6% 23.3% 1.2% 100.0%Column percentage 10.1% 9.2% 20.0% 9.9%
Total number of ads 644 217 5 866Total row percentage 77.2% 21.6% 1.2% 100.0%
Table 9B. Tenure Status of Ads Tagged for Assistant Professor or for Assistant Professor and Some Other Rank in the 2016–17 JIL , by General Field CategoryTable 9B. Tenure Status of Ads Tagged for Assistant Professor or for Assistant Professor and Some Other Rank in the 2016–17 JIL, by General Field Category
the modern language association of america 28
All in format ion embargoed unt i l ?day, ?? ?, 12:01 a .m. EDT.
Report on the MLA Job Information List, 2016–17
2013–14 2014–15 2015–16 2016–17Arabic
Number of ads 46 52 28 34Column percentage 4.9% 5.9% 3.3% 4.5%
ChineseNumber of ads 73 62 60 49Column percentage 7.7% 7.0% 7.2% 6.5%
ClassicalNumber of ads 15 6 12 13Column percentage 1.6% 0.7% 1.4% 1.7%
French and francophoneNumber of ads 204 202 149 127Column percentage 21.6% 22.9% 17.8% 16.9%
Germanic and ScandinavianNumber of ads 137 147 105 96Column percentage 14.5% 16.7% 12.5% 12.8%
HebrewNumber of ads 14 19 20 18Column percentage 1.5% 2.2% 2.4% 2.4%
ItalianNumber of ads 55 48 48 39Column percentage 5.8% 5.4% 5.7% 5.2%
JapaneseNumber of ads 39 44 38 38Column percentage 4.1% 5.0% 4.5% 5.1%
KoreanNumber of ads 9 10 11 10Column percentage 1.0% 1.1% 1.3% 1.3%
PortugueseNumber of ads 32 37 30 22Column percentage 3.4% 4.2% 3.6% 2.9%
Russian and SlavicNumber of ads 38 39 31 40Column percentage 4.0% 4.4% 3.7% 5.3%
Spanish and Latin AmericanNumber of ads 354 328 280 256Column percentage 37.5% 37.2% 33.5% 34.1%
Other languagesNumber of ads 23 21 21 17Column percentage 2.4% 2.4% 2.5% 2.3%
No language specifiedNumber of ads 112 131 151 122Column percentage 11.9% 14.9% 18.0% 16.3%
Total number of ads (basis for percentages) 945 881 837 750
Table 10. Number and Percentage of Ads Tagged with Language Field Category Terms, 2013–14 to 2016–17
Table 10. Number and Percentage of JIL Ads Tagged with Language Field Category Terms, 2013–14 to 2016–17
the modern language association of america 29
All in format ion embargoed unt i l ?day, ?? ?, 12:01 a .m. EDT.
Report on the MLA Job Information List, 2016–17
2013–14 2014–15 2015–16 2016–17Writing
Composition and rhetoricNumber of ads 295 297 249 217Column percentage 31.8% 33.6% 30.3% 29.9%
Technical and business writingNumber of ads 85 89 90 74Column percentage 9.2% 10.1% 10.9% 10.2%
Creative writing and journalismNumber of ads 139 160 144 138Column percentage 15.0% 18.1% 17.5% 19.0%Total for writing
Number of ads 519 546 483 429Column percentage 55.9% 61.8% 58.7% 59.2%
LiteratureBritish literature
Number of ads 233 228 197 187Column percentage 25.1% 25.8% 23.9% 25.8%
American literature (chiefly United States)Number of ads 181 193 184 172Column percentage 19.5% 21.8% 22.4% 23.7%
African American literatureNumber of ads 60 49 67 86Column percentage 6.5% 5.5% 8.1% 11.9%
Literature in English other than British and AmericanNumber of ads 60 61 56 70Column percentage 6.5% 6.9% 6.8% 9.7%
Other minority literaturesNumber of ads 56 58 65 84Column percentage 6.0% 6.6% 7.9% 11.6%Total for literature
Number of ads 590 589 569 599Column percentage 63.6% 66.6% 69.1% 82.6%
English educationNumber of ads 51 56 49 38Column percentage 5.5% 6.3% 6.0% 5.2%
Total number of ads (basis for percentages) 928 884 823 725
Table 11. Number and Percentage of Ads Tagged with English Field Category Terms, 2013–14 to 2016–17Table 11. Number and Percentage of JIL Ads Tagged with English Field Category Terms, 2013–14 to 2016–17
the modern language association of america 30
All in format ion embargoed unt i l ?day, ?? ?, 12:01 a .m. EDT.
Report on the MLA Job Information List, 2016–17
2013–14 2014–15 2015–16 2016–17Comparative literature
Number of ads 163 188 179 152Column percentage 9.8% 11.9% 12.2% 11.5%
Criticism and theoryNumber of ads 103 109 106 95Column percentage 6.2% 6.9% 7.2% 7.2%
Cultural studiesNumber of ads 222 244 238 220Column percentage 13.3% 15.5% 16.2% 16.6%
Film, drama, and speechNumber of ads 94 79 75 73Column percentage 5.6% 5.0% 5.1% 5.5%
GeneralistNumber of ads 149 134 111 73Column percentage 8.9% 8.5% 7.6% 5.5%
InterdisciplinaryNumber of ads 183 177 151 170Column percentage 11.0% 11.2% 10.3% 12.8%
Linguistics and ESLNumber of ads 152 133 130 108Column percentage 9.1% 8.4% 8.8% 8.1%
Postcolonial literatureNumber of ads 49 51 39 42Column percentage 2.9% 3.2% 2.7% 3.2%
Technology and digital mediaNumber of ads 143 135 110 93Column percentage 8.6% 8.6% 7.5% 7.0%
World literatureNumber of ads 71 88 61 65Column percentage 4.2% 5.6% 4.1% 4.9%
Department chair or other administratorNumber of ads 80 65 77 66Column percentage 4.8% 4.1% 5.2% 5.0%
Other academic specializationsNumber of ads 188 196 183 158Column percentage 11.3% 12.4% 12.4% 11.9%
Business, government, and nonprofit sectorNumber of ads 9 14 18 11Column percentage 0.5% 0.9% 1.2% 0.8%
Total number of ads (basis for percentages) 1,671 1,575 1,470 1,327
Table 12. Number and Percentage of Ads Tagged with General Field Category Terms, 2013–14 to 2016–17Table 12. Number and Percentage of JIL Ads Tagged with General Field Category Terms, 2013–14 to
2016–17
the
mod
ern
lang
uage
ass
ocia
tion
of
amer
ica
31
All
in
form
ati
on
em
bar
go
ed u
nti
l ?d
ay,
??
?,
12:0
1 a
.m.
EDT.
Repo
rt on
the
MLA
Job
Info
rmat
ion
List
, 201
6–17
Spanish and Latin America Portuguese
French and
Francophone ItalianGermanic and Scandinavian
Russian and Slavic Arabic Classical Hebrew Chinese Japanese Korean
OtherLanguages
No Language Specified All Ads
New England (CT, MA, ME, NH, RI, VT)
10.1 27.3 7.9 12.8 16.7 20.0 11.8 0.0 16.7 14.3 13.2 20.0 11.8 15.2 12.1
Mid-East (DC, DE, MD, NJ, NY, PA)
19.1 13.6 22.0 30.8 17.7 22.5 23.5 30.8 27.8 14.3 13.2 30.0 35.3 30.4 23.5
Great Lakes (IL, IN, MI, OH, WI)
14.8 9.1 18.1 15.4 16.7 10.0 14.7 7.7 27.8 16.3 15.8 0.0 17.6 12.8 14.5
Southeast (AL, AR, FL, GA, KY, LA, MS, NC, SC, TN, VA, WV)
23.3 18.2 18.1 17.9 19.8 10.0 20.6 0.0 11.1 18.4 28.9 10.0 11.8 8.8 18.4
Plains (IA, KS, MN, MO, ND, NE, SD)
6.6 0.0 4.7 2.6 6.3 0.0 2.9 0.0 11.1 4.1 2.6 0.0 5.9 1.6 4.3
Rocky Mountain (CO, ID, MT, UT, WY)
2.7 0.0 3.9 0.0 3.1 5.0 0.0 0.0 0.0 2.0 7.9 0.0 0.0 0.8 2.8
Southwest (AZ, NM, OK, TX)
9.7 4.5 11.0 5.1 3.1 5.0 5.9 15.4 0.0 0.0 5.3 20.0 0.0 7.2 7.9
Far West (AK, CA, HI, NV, OR, WA)
11.3 18.2 8.7 12.8 12.5 22.5 5.9 46.2 5.6 10.2 13.2 20.0 17.6 16.8 11.1
Canada 0.4 0.0 2.4 2.6 1.0 2.5 5.9 0.0 0.0 0.0 0.0 0.0 0.0 1.6 1.6
Outside the United States and Canada 1.9 9.1 3.1 0.0 3.1 2.5 8.8 0.0 0.0 20.4 0.0 0.0 0.0 4.8 3.9
Total 100.0 100.0 100.0 100.0 100.0 100.0 100.0 100.0 100.0 100.0 100.0 100.0 100.0 100.0 100.0
Number of ads (basis for percentages) 257 22 127 39 96 40 34 13 18 49 38 10 17 125 750
Table 13. Percentage of Ads in the 2016–17 Foreign Language JIL Tagged for Language Fields, by Geographic RegionTable 13. Percentage of Ads in the 2016–17 Foreign Language JIL Tagged for Language Fields, by Geographic Region
the
mod
ern
lang
uage
ass
ocia
tion
of
amer
ica
32
All
in
form
ati
on
em
bar
go
ed u
nti
l ?d
ay,
??
?,
12:0
1 a
.m.
EDT.
Repo
rt on
the
MLA
Job
Info
rmat
ion
List
, 201
6–17
Composition and Rhetoric
Technical and Business Writing
Creative Writing and Journalism British Literature
American Literature(Chiefly US)
African American Literature
Literature in English Other Than British
and American Other Minority
Literatures English Education All Ads
New England (CT, MA, ME, NH, RI, VT)
11.5 10.8 13.0 12.3 14.5 16.3 15.7 11.9 5.3 12.0
Mid-East (DC, DE, MD, NJ, NY, PA)
17.5 17.6 21.0 19.3 18.0 24.4 12.9 20.2 13.2 21.1
Great Lakes (IL, IN, MI, OH, WI)
12.9 14.9 10.1 12.3 9.9 8.1 11.4 15.5 18.4 11.2
Southeast (AL, AR, FL, GA, KY, LA, MS, NC, SC, TN, VA, WV)
26.7 27.0 26.1 20.3 19.8 26.7 25.7 14.3 10.5 21.9
Plains (IA, KS, MN, MO, ND, NE, SD)
3.7 1.4 3.6 3.2 2.9 4.7 0.0 6.0 2.6 3.6
Rocky Mountain (CO, ID, MT, UT, WY)
2.3 5.4 2.9 2.7 3.5 1.2 4.3 3.6 5.3 3.0
Southwest (AZ, NM, OK, TX)
7.4 13.5 2.9 6.4 6.4 1.2 1.4 1.2 5.3 5.8
Far West (AK, CA, HI, NV, OR, WA)
16.6 6.8 18.8 14.4 15.7 15.1 15.7 21.4 34.2 15.7
Canada 0.0 0.0 1.4 2.1 1.7 0.0 7.1 3.6 2.6 1.8
Outside the United States and Canada 1.4 2.7 0.0 7.0 7.6 2.3 5.7 2.4 2.6 3.9
Total 100.0 100.0 100.0 100.0 100.0 100.0 100.0 100.0 100.0 100.0
Number of ads (basis for percentages) 217 74 138 187 172 86 70 84 38 725
Table 14. Percentage of Ads in the 2016–17 English JIL Tagged for English Fields, by Geographic Region Table 14. Percentage of Ads in the 2016–17 JIL Tagged for English Fields, by Geographic Region
the
mod
ern
lang
uage
ass
ocia
tion
of
amer
ica
33
All
in
form
ati
on
em
bar
go
ed u
nti
l ?d
ay,
??
?,
12:0
1 a
.m.
EDT.
Repo
rt on
the
MLA
Job
Info
rmat
ion
List
, 201
6–17
Table 15. Percentage of Ads in the 2016–17 JIL Database Tagged for General Fields, by Geographic Region
ComparativeLiterature
Criticism and Theory
CulturalStudies
Film, Drama, and Speech Generalist Interdisciplinary
Linguisticsand ESL
PostcolonialLiterature
Technology and Digital Media
WorldLiterature
Other Academic Specializations
DepartmentChair or Other Administrator
Business,Government,and Nonprofit
Sector All Ads
New England (CT, MA, ME, NH, RI, VT)
13.8 12.6 15.9 16.4 9.6 14.7 7.4 21.4 6.5 13.8 13.9 13.6 0.0 11.8
Mid-East (DC, DE, MD, NJ, NY, PA)
24.3 25.3 24.1 30.1 6.8 24.1 20.4 19.0 25.8 21.5 24.1 16.7 81.8 21.1
Great Lakes (IL, IN, MI, OH, WI)
15.8 12.6 15.5 8.2 19.2 10.6 13.9 14.3 12.9 12.3 12.0 4.5 0.0 13.0
Southeast (AL, AR, FL, GA, KY, LA, MS, NC, SC, TN, VA, WV)
12.5 12.6 16.4 12.3 32.9 13.5 25.0 16.7 19.4 20.0 12.0 15.2 0.0 21.6
Plains (IA, KS, MN, MO, ND, NE, SD)
1.3 3.2 2.3 4.1 5.5 3.5 2.8 2.4 0.0 0.0 1.9 7.6 0.0 4.1
Rocky Mountain (CO, ID, MT, UT, WY)
1.3 1.1 2.3 2.7 4.1 2.9 2.8 2.4 1.1 3.1 1.9 6.1 0.0 3.2
Southwest (AZ, NM, OK, TX)
2.6 7.4 7.3 6.8 4.1 7.1 8.3 2.4 9.7 1.5 8.2 13.6 9.1 6.9
Far West (AK, CA, HI, NV, OR, WA)
17.8 16.8 10.0 12.3 11.0 18.2 12.0 11.9 19.4 16.9 15.8 18.2 0.0 13.0
Canada 2.0 4.2 1.4 1.4 0.0 2.4 0.9 4.8 2.2 6.2 2.5 1.5 0.0 1.7
Outside the United States and Canada 8.6 4.2 5.0 5.5 6.8 2.9 6.5 4.8 3.2 4.6 7.6 3.0 9.1 3.5
Total 100.0 100.0 100.0 100.0 100.0 100.0 100.0 100.0 100.0 100.0 100.0 100.0 100.0 100.0
Number of ads (basis for percentages) 152 95 220 73 73 170 108 42 93 65 158 66 11 1,326
Table 15. Percentage of Ads in the 2016–17 JIL Database Tagged for General Fields, by Geographic Region