Embed Size (px)
Citation preview
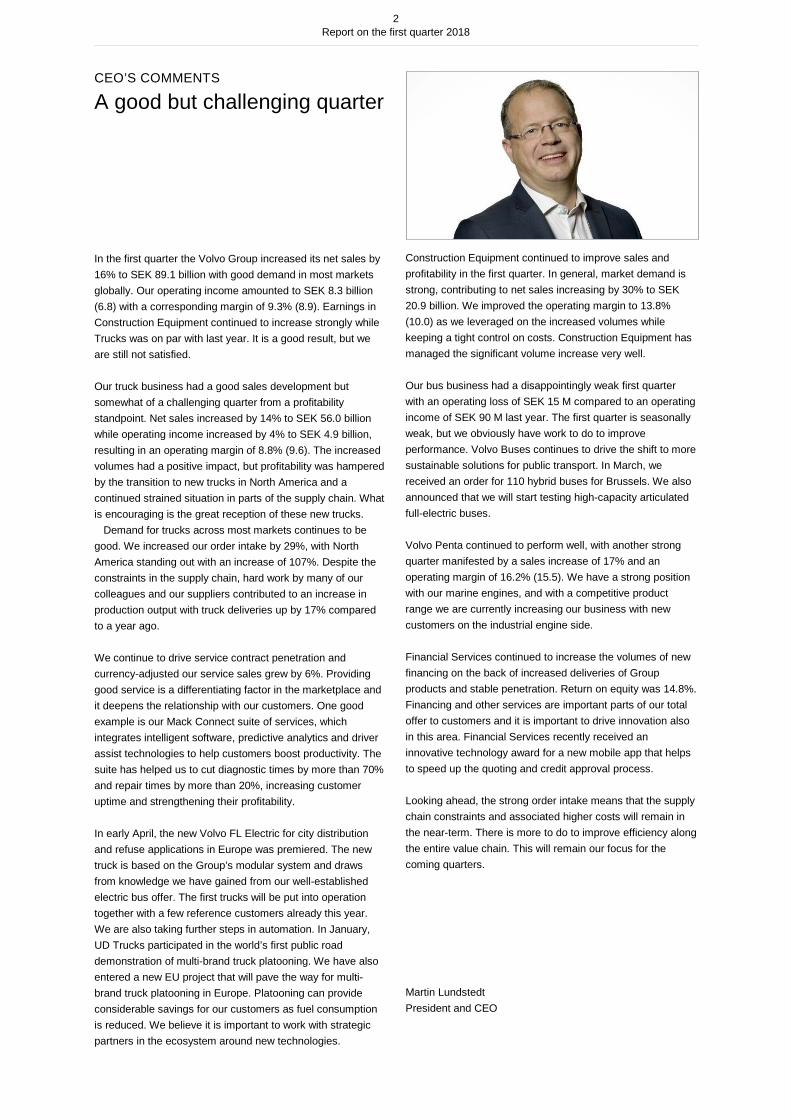
REPORT ON THE FIRST QUARTER 2018
In Q1 2018 net sales increased by 16% to SEK 89.1 billion (76.9). Adjusted for currency movements and acquired and divested units sales increased by 19%.
Both adjusted and reported operating income amounted to SEK 8,297 M (6,834), corresponding to an operating margin of 9.3% (8.9).
Currency movements had a negative impact on operating income of SEK 730 M.
Operating cash flow in the Industrial Operations amounted to SEK 1.5 billion (1.5).
In April, Volvo Trucks premiered its new all-electric medium-duty truck, the Volvo FL Electric.
The new Volvo FL Electric for urban distribution and refuse operations.
SEK M unless otherwise stated 2018 2017
Net sales 89,143 76,930 Adjusted operating income ¹ 8,297 6,834 Adjusted operating margin, % 9.3 8.9
Operating income 8,297 6,834 Operating margin, % 9.3 8.9 Income after financial items 7,727 6,245 Income for the period 5,796 4,666 Diluted earnings per share, SEK 2.78 2.25Operating cash flow in Industrial Operations 1,489 1,512 Return on shareholders' equity, 12 months rolling, % 21.0 15.3
Net order intake, number of trucks 71,965 55,622 Deliveries, number of trucks 51,574 43,927 Net order intake, number of construction equipment 23,938 17,487 Deliveries, number of construction equipment 22,102 16,369 ¹ For more information on adjusted operating income, please see note 7.
The comparative financial information is restated due to the implementation of IFRS 15 Revenue from Contracts with Customers.For more information, please see Note 1.
First quarter
2
Report on the first quarter 2018
CEO’S COMMENTS
A good but challenging quarter In the first quarter the Volvo Group increased its net sales by 16% to SEK 89.1 billion with good demand in most markets globally. Our operating income amounted to SEK 8.3 billion (6.8) with a corresponding margin of 9.3% (8.9). Earnings in Construction Equipment continued to increase strongly while Trucks was on par with last year. It is a good result, but we are still not satisfied. Our truck business had a good sales development but somewhat of a challenging quarter from a profitability standpoint. Net sales increased by 14% to SEK 56.0 billion while operating income increased by 4% to SEK 4.9 billion, resulting in an operating margin of 8.8% (9.6). The increased volumes had a positive impact, but profitability was hampered by the transition to new trucks in North America and a continued strained situation in parts of the supply chain. What is encouraging is the great reception of these new trucks. Demand for trucks across most markets continues to be good. We increased our order intake by 29%, with North America standing out with an increase of 107%. Despite the constraints in the supply chain, hard work by many of our colleagues and our suppliers contributed to an increase in production output with truck deliveries up by 17% compared to a year ago. We continue to drive service contract penetration and currency-adjusted our service sales grew by 6%. Providing good service is a differentiating factor in the marketplace and it deepens the relationship with our customers. One good example is our Mack Connect suite of services, which integrates intelligent software, predictive analytics and driver assist technologies to help customers boost productivity. The suite has helped us to cut diagnostic times by more than 70% and repair times by more than 20%, increasing customer uptime and strengthening their profitability. In early April, the new Volvo FL Electric for city distribution and refuse applications in Europe was premiered. The new truck is based on the Group’s modular system and draws from knowledge we have gained from our well-established electric bus offer. The first trucks will be put into operation together with a few reference customers already this year. We are also taking further steps in automation. In January, UD Trucks participated in the world’s first public road demonstration of multi-brand truck platooning. We have also entered a new EU project that will pave the way for multi-brand truck platooning in Europe. Platooning can provide considerable savings for our customers as fuel consumption is reduced. We believe it is important to work with strategic partners in the ecosystem around new technologies.
Construction Equipment continued to improve sales and profitability in the first quarter. In general, market demand is strong, contributing to net sales increasing by 30% to SEK 20.9 billion. We improved the operating margin to 13.8% (10.0) as we leveraged on the increased volumes while keeping a tight control on costs. Construction Equipment has managed the significant volume increase very well. Our bus business had a disappointingly weak first quarter with an operating loss of SEK 15 M compared to an operating income of SEK 90 M last year. The first quarter is seasonally weak, but we obviously have work to do to improve performance. Volvo Buses continues to drive the shift to more sustainable solutions for public transport. In March, we received an order for 110 hybrid buses for Brussels. We also announced that we will start testing high-capacity articulated full-electric buses. Volvo Penta continued to perform well, with another strong quarter manifested by a sales increase of 17% and an operating margin of 16.2% (15.5). We have a strong position with our marine engines, and with a competitive product range we are currently increasing our business with new customers on the industrial engine side. Financial Services continued to increase the volumes of new financing on the back of increased deliveries of Group products and stable penetration. Return on equity was 14.8%. Financing and other services are important parts of our total offer to customers and it is important to drive innovation also in this area. Financial Services recently received an innovative technology award for a new mobile app that helps to speed up the quoting and credit approval process. Looking ahead, the strong order intake means that the supply chain constraints and associated higher costs will remain in the near-term. There is more to do to improve efficiency along the entire value chain. This will remain our focus for the coming quarters. Martin Lundstedt President and CEO
3
Report on the first quarter 2018
FINANCIAL SUMMARY OF THE FIRST QUARTER 2018
Net sales In Q1 2018, the Volvo Group’s net sales increased by 16% to SEK 89,143 M (76,930). Adjusted for currency movements and acquired and divested units, net sales increased by 19%. Vehicle sales increased by 23% adjusted for currency movements, primarily due to higher truck and construction equipment volumes. Adjusted for currency movements, service sales increased by 6%, reflecting higher utilization of customer fleets. Operating income Both adjusted and reported operating income in Q1 2018 amounted to SEK 8,297 M (6,834), corresponding to an operating margin of 9.3% (8.9). Compared with Q1 2017, the higher operating income is primarily an effect of higher truck and construction equipment volumes and higher capacity utilization. This
was partly offset by costs related to a stretched situation in parts of the supply chain and the production changeover in North America, higher selling expenses as well as higher R&D expenses. Currency movements, compared to Q1 2017, had a negative impact of SEK 730 M. Financial items Compared with Q1 2017 interest income decreased by SEK 12 M to SEK 38 M while interest expenses decreased by SEK 39 M to SEK 424 M. In Q1 2018 other financial income and expenses amounted to SEK -184 M (-177). Income taxes In Q1 2018 the tax expense amounted to SEK 1,932 M (1,579) corresponding to a tax rate of 25% (25).
Net sales by market areaSEK M 2018 2017
Europe 37,791 33,046 14 North America 23,147 18,353 26 South America 4,469 3,654 22 Asia 18,400 16,801 10 Africa and Oceania 5,337 5,076 5 Total 89,143 76,930 16
Of which:Vehicles¹ 67,547 56,148 20 Services 18,757 18,069 4 Financial Services revenue 3,026 2,892 5 Eliminations -186 -179 -4 ¹ Including construction equipment and Volvo Penta engines
Consolidated Income Statement, Volvo GroupSEK M 2018 2017
Net sales 89,143 76,930 Cost of sales -67,809 -57,596 Gross income 21,335 19,335
Research and development expenses -4,268 -3,994 Selling expenses -7,344 -6,942 Administrative expenses -1,431 -1,286 Other operating income and expenses -392 -616 Income/loss from investments in Joint Ventures and associated companies 385 340 Income from other investments 12 -2 Operating income 8,297 6,834
Interest income and similar credits 38 50 Interest expenses and similar charges -424 -463 Other financial income and expenses -184 -177 Income after financial items 7,727 6,245
Income taxes -1,932 -1,579 Income for the period * 5,796 4,666
* Attributable to:Equity holders of the parent company 5,654 4,580Minority interests 142 85 5,796 4,666
Basic earnings per share, SEK 2.78 2.25 Diluted earnings per share, SEK 2.78 2.25
First quarter
First quarter Change%
4
Report on the first quarter 2018
Income for the period and earnings per share During Q1 2018 income for the period amounted to SEK 5,796 M (4,666). Diluted earnings per share amounted to SEK 2.78 (2.25). Operating cash flow in the Industrial Operations During Q1 2018, operating cash flow in the Industrial Operations was positive in an amount of SEK 1,489 M (1,512). The positive cash flow is an effect of the operating income being partly offset by the seasonal build-up of working capital. Volvo Group financial position During the first quarter net financial assets in the Industrial Operations, excluding provisions for post-employment benefits increased by SEK 1.1 billion, resulting in a net financial asset position of SEK 27.5 billion on March 31, 2018. This equals 26.2% of shareholders equity. Including provisions for post- employment benefits, the Industrial Operations net financial assets amounted to SEK 13.9 billion.
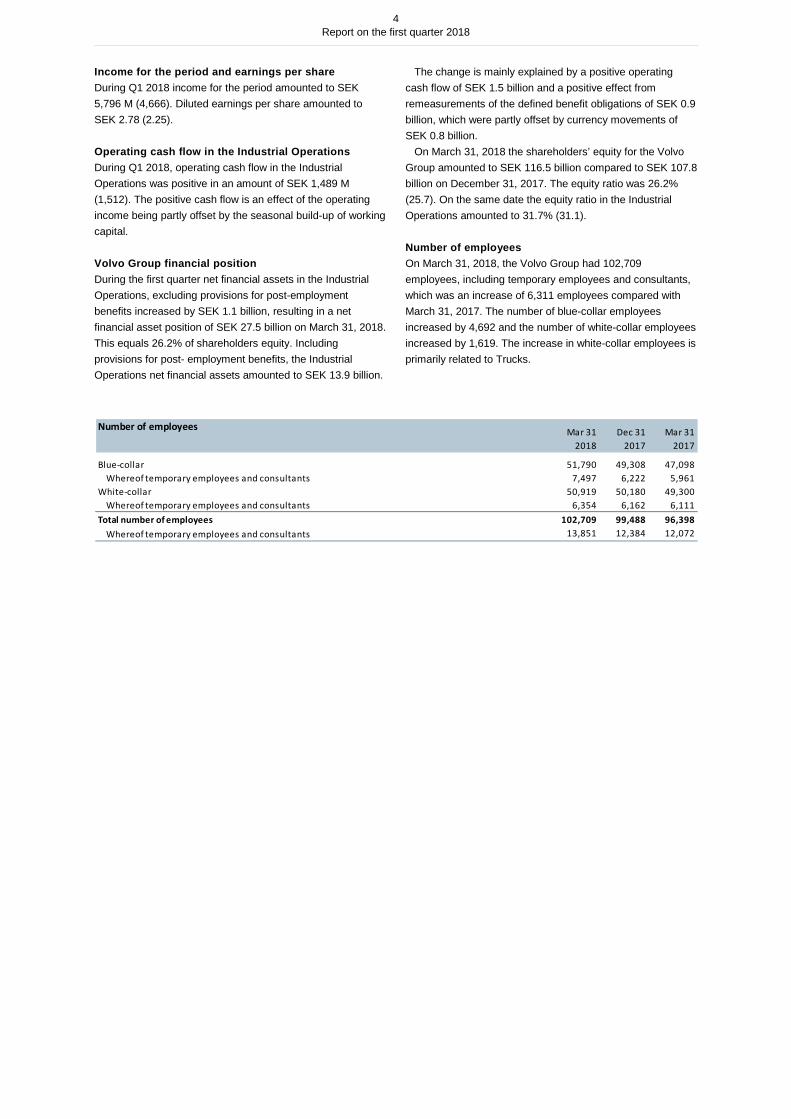
The change is mainly explained by a positive operating cash flow of SEK 1.5 billion and a positive effect from remeasurements of the defined benefit obligations of SEK 0.9 billion, which were partly offset by currency movements of SEK 0.8 billion. On March 31, 2018 the shareholders’ equity for the Volvo Group amounted to SEK 116.5 billion compared to SEK 107.8 billion on December 31, 2017. The equity ratio was 26.2% (25.7). On the same date the equity ratio in the Industrial Operations amounted to 31.7% (31.1). Number of employees On March 31, 2018, the Volvo Group had 102,709 employees, including temporary employees and consultants, which was an increase of 6,311 employees compared with March 31, 2017. The number of blue-collar employees increased by 4,692 and the number of white-collar employees increased by 1,619. The increase in white-collar employees is primarily related to Trucks.
Number of employees Mar 31 2018
Dec 31 2017
Mar 31 2017
Blue-collar - 51,790 49,308 47,098Whereof temporary employees and consultants - 7,497 6,222 5,961
White-collar - 50,919 50,180 49,300Whereof temporary employees and consultants - 6,354 6,162 6,111
Total number of employees - 102,709 99,488 96,398Whereof temporary employees and consultants - 13,851 12,384 12,072
5
Report on the first quarter 2018
BUSINESS SEGMENT OVERVIEW
Net salesSEK M 2018 2017
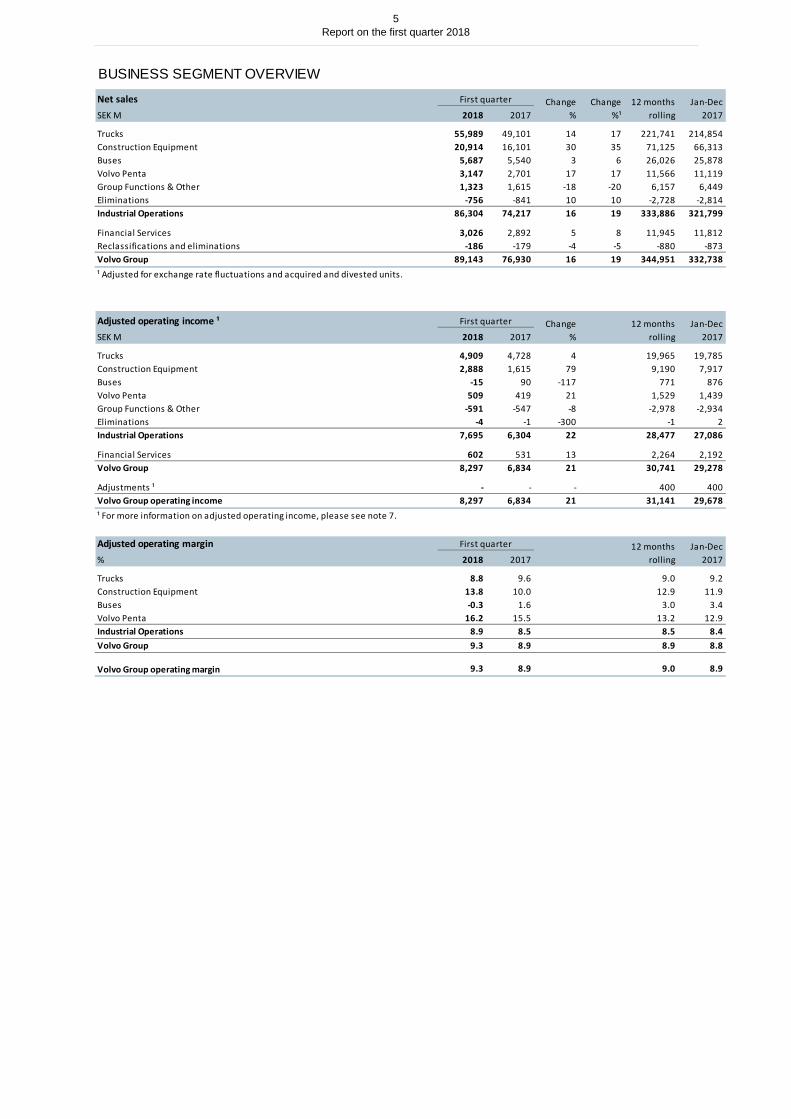
Trucks 55,989 49,101 14 17 221,741 214,854 Construction Equipment 20,914 16,101 30 35 71,125 66,313 Buses 5,687 5,540 3 6 26,026 25,878 Volvo Penta 3,147 2,701 17 17 11,566 11,119 Group Functions & Other 1,323 1,615 -18 -20 6,157 6,449 Eliminations -756 -841 10 10 -2,728 -2,814 Industrial Operations 86,304 74,217 16 19 333,886 321,799
Financial Services 3,026 2,892 5 8 11,945 11,812 Reclassifications and eliminations -186 -179 -4 -5 -880 -873 Volvo Group 89,143 76,930 16 19 344,951 332,738 ¹ Adjusted for exchange rate fluctuations and acquired and divested units.
Adjusted operating income ¹SEK M 2018 2017
Trucks 4,909 4,728 4 19,965 19,785 Construction Equipment 2,888 1,615 79 9,190 7,917 Buses -15 90 -117 771 876 Volvo Penta 509 419 21 1,529 1,439 Group Functions & Other -591 -547 -8 -2,978 -2,934 Eliminations -4 -1 -300 -1 2 Industrial Operations 7,695 6,304 22 28,477 27,086
Financial Services 602 531 13 2,264 2,192 Volvo Group 8,297 6,834 21 30,741 29,278
Adjustments ¹ - - - 400 400 Volvo Group operating income 8,297 6,834 21 31,141 29,678
Adjusted operating margin% 2018 2017
Trucks 8.8 9.6 9.0 9.2 Construction Equipment 13.8 10.0 12.9 11.9 Buses -0.3 1.6 3.0 3.4 Volvo Penta 16.2 15.5 13.2 12.9 Industrial Operations 8.9 8.5 8.5 8.4 Volvo Group 9.3 8.9 8.9 8.8
Volvo Group operating margin 9.3 8.9 9.0 8.9
Jan-Dec 2017
First quarter 12 months rolling
¹ For more information on adjusted operating income, please see note 7.
12 months rolling
Jan-Dec 2017
First quarter Change%
12 months rolling
Jan-Dec 2017
Change%¹
First quarter Change%
6
Report on the first quarter 2018
TRUCKS
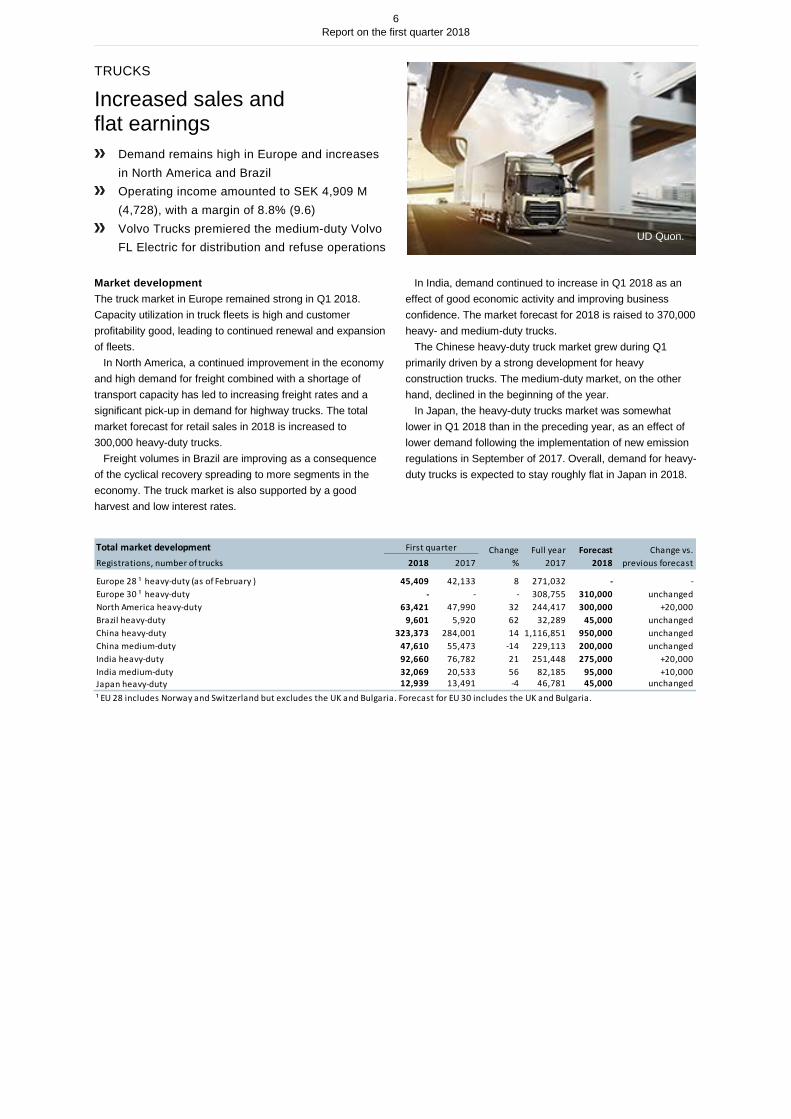
Increased sales and flat earnings
Demand remains high in Europe and increases in North America and Brazil
Operating income amounted to SEK 4,909 M (4,728), with a margin of 8.8% (9.6)
Volvo Trucks premiered the medium-duty Volvo FL Electric for distribution and refuse operations
Market development The truck market in Europe remained strong in Q1 2018. Capacity utilization in truck fleets is high and customer profitability good, leading to continued renewal and expansion of fleets. In North America, a continued improvement in the economy and high demand for freight combined with a shortage of transport capacity has led to increasing freight rates and a significant pick-up in demand for highway trucks. The total market forecast for retail sales in 2018 is increased to 300,000 heavy-duty trucks. Freight volumes in Brazil are improving as a consequence of the cyclical recovery spreading to more segments in the economy. The truck market is also supported by a good harvest and low interest rates.
In India, demand continued to increase in Q1 2018 as an effect of good economic activity and improving business confidence. The market forecast for 2018 is raised to 370,000 heavy- and medium-duty trucks. The Chinese heavy-duty truck market grew during Q1 primarily driven by a strong development for heavy construction trucks. The medium-duty market, on the other hand, declined in the beginning of the year. In Japan, the heavy-duty trucks market was somewhat lower in Q1 2018 than in the preceding year, as an effect of lower demand following the implementation of new emission regulations in September of 2017. Overall, demand for heavy-duty trucks is expected to stay roughly flat in Japan in 2018.
UD Quon.
Total market developmentRegistrations, number of trucks 2018 2017
Europe 28 ¹ heavy-duty (as of February ) 45,409 42,133 8 271,032 - -Europe 30 ¹ heavy-duty - - - 308,755 310,000 unchangedNorth America heavy-duty 63,421 47,990 32 244,417 300,000 +20,000Brazil heavy-duty 9,601 5,920 62 32,289 45,000 unchangedChina heavy-duty 323,373 284,001 14 1,116,851 950,000 unchangedChina medium-duty 47,610 55,473 -14 229,113 200,000 unchangedIndia heavy-duty 92,660 76,782 21 251,448 275,000 +20,000India medium-duty 32,069 20,533 56 82,185 95,000 +10,000Japan heavy-duty 12,939 13,491 -4 46,781 45,000 unchanged¹ EU 28 includes Norway and Switzerland but excludes the UK and Bulgaria. Forecast for EU 30 includes the UK and Bulgaria.
First quarter Change%
Forecast 2018
Full year2017
Change vs.previous forecast
7
Report on the first quarter 2018
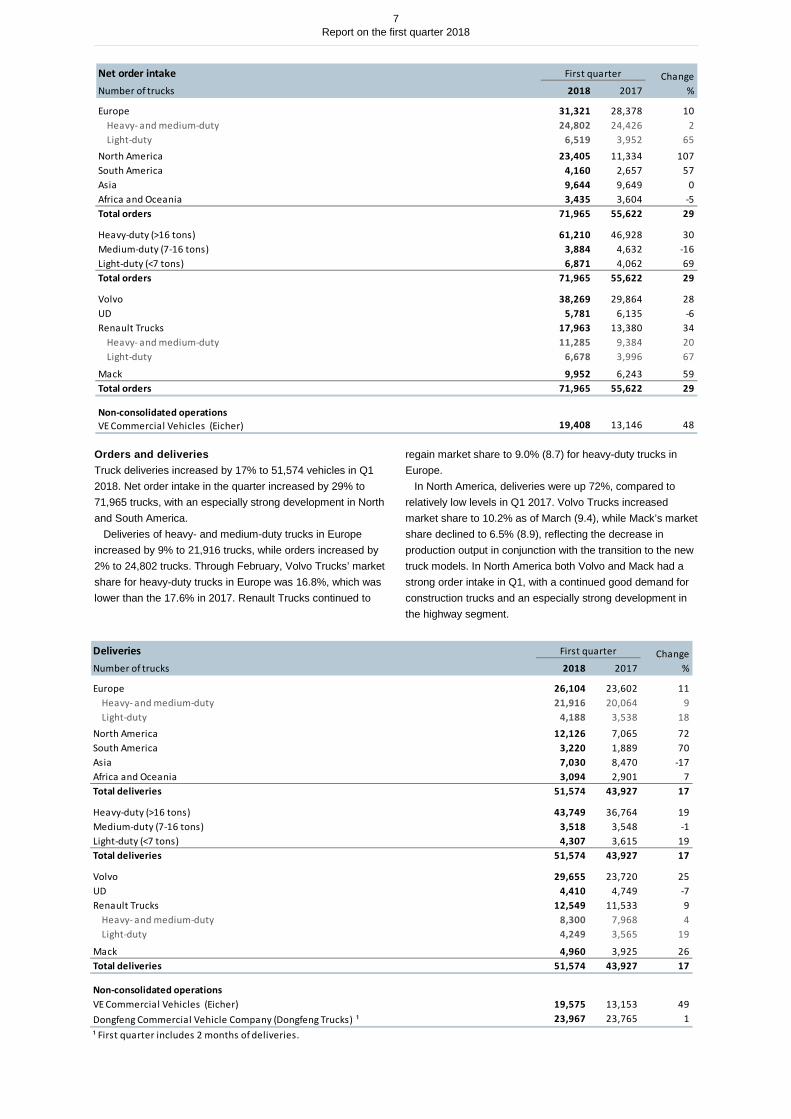
Orders and deliveries Truck deliveries increased by 17% to 51,574 vehicles in Q1 2018. Net order intake in the quarter increased by 29% to 71,965 trucks, with an especially strong development in North and South America. Deliveries of heavy- and medium-duty trucks in Europe increased by 9% to 21,916 trucks, while orders increased by 2% to 24,802 trucks. Through February, Volvo Trucks’ market share for heavy-duty trucks in Europe was 16.8%, which was lower than the 17.6% in 2017. Renault Trucks continued to
regain market share to 9.0% (8.7) for heavy-duty trucks in Europe. In North America, deliveries were up 72%, compared to relatively low levels in Q1 2017. Volvo Trucks increased market share to 10.2% as of March (9.4), while Mack’s market share declined to 6.5% (8.9), reflecting the decrease in production output in conjunction with the transition to the new truck models. In North America both Volvo and Mack had a strong order intake in Q1, with a continued good demand for construction trucks and an especially strong development in the highway segment.
Net order intake Number of trucks 2018 2017
Europe 31,321 28,378 10Heavy- and medium-duty 24,802 24,426 2Light-duty 6,519 3,952 65
North America 23,405 11,334 107South America 4,160 2,657 57Asia 9,644 9,649 0Africa and Oceania 3,435 3,604 -5Total orders 71,965 55,622 29
Heavy-duty (>16 tons) 61,210 46,928 30Medium-duty (7-16 tons) 3,884 4,632 -16Light-duty (<7 tons) 6,871 4,062 69Total orders 71,965 55,622 29
Volvo 38,269 29,864 28UD 5,781 6,135 -6Renault Trucks 17,963 13,380 34
Heavy- and medium-duty 11,285 9,384 20Light-duty 6,678 3,996 67
Mack 9,952 6,243 59Total orders 71,965 55,622 29
Non-consolidated operations VE Commercial Vehicles (Eicher) 19,408 13,146 48
First quarter Change%
Deliveries Number of trucks 2018 2017
Europe 26,104 23,602 11Heavy- and medium-duty 21,916 20,064 9Light-duty 4,188 3,538 18
North America 12,126 7,065 72South America 3,220 1,889 70Asia 7,030 8,470 -17Africa and Oceania 3,094 2,901 7Total deliveries 51,574 43,927 17
Heavy-duty (>16 tons) 43,749 36,764 19Medium-duty (7-16 tons) 3,518 3,548 -1Light-duty (<7 tons) 4,307 3,615 19Total deliveries 51,574 43,927 17
Volvo 29,655 23,720 25UD 4,410 4,749 -7Renault Trucks 12,549 11,533 9
Heavy- and medium-duty 8,300 7,968 4Light-duty 4,249 3,565 19
Mack 4,960 3,925 26Total deliveries 51,574 43,927 17
Non-consolidated operations VE Commercial Vehicles (Eicher) 19,575 13,153 49Dongfeng Commercial Vehicle Company (Dongfeng Trucks) ¹ 23,967 23,765 1¹ First quarter includes 2 months of deliveries.
First quarter Change%
8
Report on the first quarter 2018
Deliveries in South America increased by 70% while order intake increased by 57% in Q1 2018, reflecting a rebound in Brazil and continued good demand in Argentina and Chile. In Brazil Volvo’s market share in heavy-duty trucks increased to 18.6% (17.8). In Asia, truck deliveries decreased by 17% in the quarter, primarily because of lower deliveries for Volvo. In Japan, UD Trucks’ market share in heavy-duty trucks was stable compared to a year ago on 15.2% (15.5). Net order intake in Asia was on the same level as in the preceding year. Net sales and operating income The truck operation’s net sales amounted to SEK 55,989 M, which was 14% higher than in Q1 2017. Adjusted for currency movements net sales increased by 17%, with sales of vehicles increasing by 21% and service sales increasing by 6%. Both adjusted and reported operating income in Q1 2018 amounted to SEK 4,909 M (4,728) corresponding to an operating margin of 8.8% (9.6).
Compared to Q1 2017, the operating income was positively impacted by higher vehicle sales and capacity utilization. This was partly offset by costs related to a stretched situation in parts of the supply chain and the production changeover in North America, higher selling expenses as well as increased R&D expenses. Compared with Q1 2017, currency movements had a negative impact of SEK 503 M. Important events In January, both Volvo Trucks and Renault Trucks announced that they will start selling electric medium-duty trucks in Europe in 2019. The first of these trucks will be put into operation together with a few selected reference customers already in 2018. Subsequently, on April 12, Volvo Trucks premiered the Volvo FL Electric for urban distribution and refuse operations, among other applications.
Net sales and operating incomeSEK M 2018 2017
Europe 25,932 22,543 15North America 15,338 11,478 34South America 3,327 2,568 30Asia 7,916 9,115 -13Africa and Oceania 3,477 3,398 2Total net sales 55,989 49,101 14
Of which: Vehicles 42,001 35,666 18Services 13,988 13,435 4
Adjusted operating income ¹ 4,909 4,728 4Adjustments ¹ - - - -Operating income 4,909 4,728 4
Adjusted operating margin, % 8.8 9.6 Operating margin, % 8.8 9.6
First quarter Change%
¹ For more information on adjusted operating income, please see note 7.
9
Report on the first quarter 2018
CONSTRUCTION EQUIPMENT
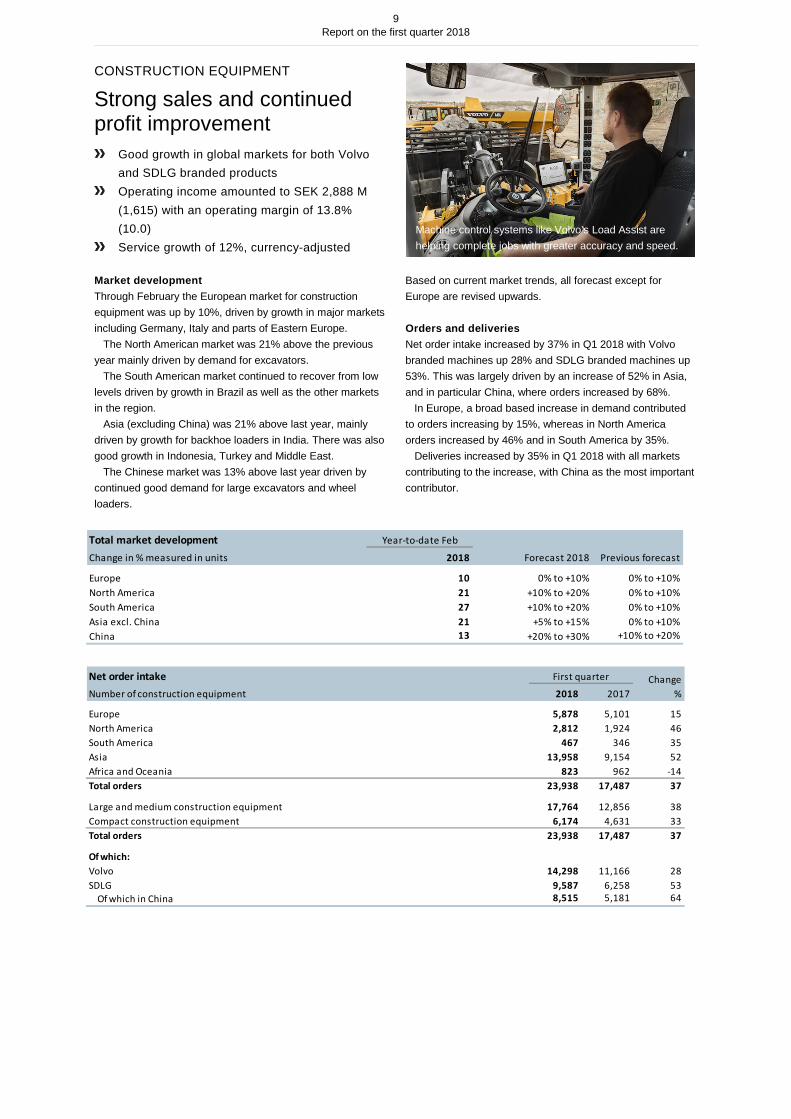
Strong sales and continued profit improvement
Good growth in global markets for both Volvo and SDLG branded products
Operating income amounted to SEK 2,888 M (1,615) with an operating margin of 13.8% (10.0)
Service growth of 12%, currency-adjusted Market development Through February the European market for construction equipment was up by 10%, driven by growth in major markets including Germany, Italy and parts of Eastern Europe. The North American market was 21% above the previous year mainly driven by demand for excavators. The South American market continued to recover from low levels driven by growth in Brazil as well as the other markets in the region. Asia (excluding China) was 21% above last year, mainly driven by growth for backhoe loaders in India. There was also good growth in Indonesia, Turkey and Middle East. The Chinese market was 13% above last year driven by continued good demand for large excavators and wheel loaders.
Based on current market trends, all forecast except for Europe are revised upwards. Orders and deliveries Net order intake increased by 37% in Q1 2018 with Volvo branded machines up 28% and SDLG branded machines up 53%. This was largely driven by an increase of 52% in Asia, and in particular China, where orders increased by 68%. In Europe, a broad based increase in demand contributed to orders increasing by 15%, whereas in North America orders increased by 46% and in South America by 35%. Deliveries increased by 35% in Q1 2018 with all markets contributing to the increase, with China as the most important contributor.
Machine control systems like Volvo’s Load Assist are helping complete jobs with greater accuracy and speed.
Total market developmentChange in % measured in units 2018 Forecast 2018
Europe 10 0% to +10% 0% to +10%North America 21 +10% to +20% 0% to +10%South America 27 +10% to +20% 0% to +10%Asia excl. China 21 +5% to +15% 0% to +10%China 13 +20% to +30% +10% to +20%
Year-to-date Feb
Previous forecast
Net order intake Number of construction equipment 2018 2017
Europe 5,878 5,101 15North America 2,812 1,924 46South America 467 346 35Asia 13,958 9,154 52Africa and Oceania 823 962 -14Total orders 23,938 17,487 37
Large and medium construction equipment 17,764 12,856 38Compact construction equipment 6,174 4,631 33Total orders 23,938 17,487 37
Of which:Volvo 14,298 11,166 28SDLG 9,587 6,258 53
Of which in China 8,515 5,181 64
First quarter Change%
10
Report on the first quarter 2018
Net sales and operating income Net sales in Q1 2018 increased by 30% to SEK 20,914 M (16,101). Adjusted for currency movements net sales increased by 33%, of which net sales of machines increased by 37% and service sales by 12%. Both adjusted and reported operating income amounted to SEK 2,888 M (1,615), corresponding to an operating margin of 13.8% (10.0). Earnings were positively impacted by higher sales and utilization in the industrial system combined with continued cost control. Currency movements had a negative impact on operating income in an amount of SEK 109 M.
Important events At the World of Asphalt construction show in Houston, Texas, in March Volvo Construction Equipment unveiled a range of new road machines anchored by a trio of new compactors equipped with the latest intelligent machine control technology. Volvo Construction Equipment’s fully-electric compact excavator prototype, known as the EX2, was awarded the prestigious Equipment & Machinery Award in the Earthmoving & Demolition category of the Intermat Innovation Awards.
Deliveries Number of construction equipment 2018 2017
Europe 5,331 4,804 11North America 1,703 1,256 36South America 437 339 29Asia 13,795 9,141 51Africa and Oceania 836 829 1Total deliveries 22,102 16,369 35
Large and medium construction equipment 16,048 11,465 40Compact construction equipment 6,054 4,904 23Total deliveries 22,102 16,369 35
Of which: Volvo 12,462 10,048 24SDLG 9,587 6,258 53
Of which in China 8,515 5,181 64Total deliveries 22,102 16,369 35
Net sales and operating incomeSEK M 2018 2017
Europe 6,599 5,730 15North America 3,433 2,890 19South America 516 399 29Asia 9,091 6,136 48Africa and Oceania 1,275 946 35Total net sales 20,914 16,101 30
Of which: Construction equipment 18,173 13,562 34Services 2,741 2,539 8
Adjusted operating income ¹ 2,888 1,615 79Adjustments ¹ - - - -Operating income 2,888 1,615 79
Adjusted operating margin, % 13.8 10.0 Operating margin, % 13.8 10.0 ¹ For more information on adjusted operating income, please see note 7.
First quarter Change%
First quarter Change%
11
Report on the first quarter 2018
BUSES
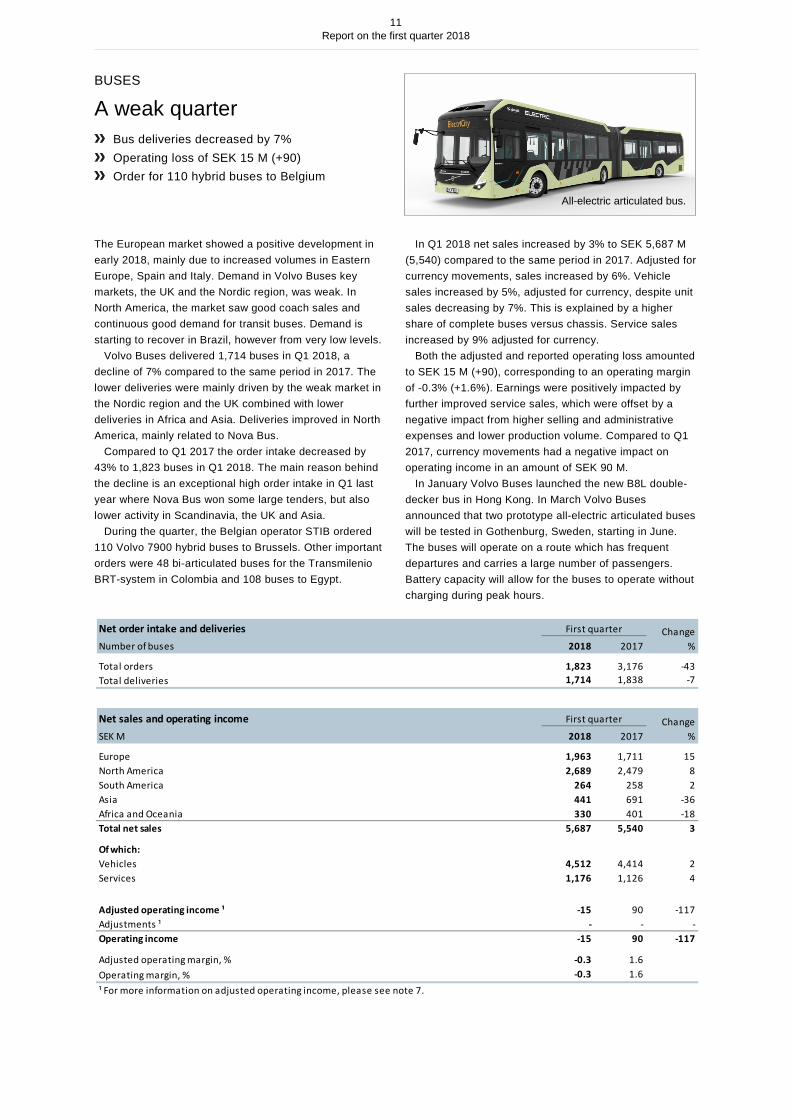
A weak quarter Bus deliveries decreased by 7% Operating loss of SEK 15 M (+90) Order for 110 hybrid buses to Belgium
The European market showed a positive development in early 2018, mainly due to increased volumes in Eastern Europe, Spain and Italy. Demand in Volvo Buses key markets, the UK and the Nordic region, was weak. In North America, the market saw good coach sales and continuous good demand for transit buses. Demand is starting to recover in Brazil, however from very low levels. Volvo Buses delivered 1,714 buses in Q1 2018, a decline of 7% compared to the same period in 2017. The lower deliveries were mainly driven by the weak market in the Nordic region and the UK combined with lower deliveries in Africa and Asia. Deliveries improved in North America, mainly related to Nova Bus. Compared to Q1 2017 the order intake decreased by 43% to 1,823 buses in Q1 2018. The main reason behind the decline is an exceptional high order intake in Q1 last year where Nova Bus won some large tenders, but also lower activity in Scandinavia, the UK and Asia. During the quarter, the Belgian operator STIB ordered 110 Volvo 7900 hybrid buses to Brussels. Other important orders were 48 bi-articulated buses for the Transmilenio BRT-system in Colombia and 108 buses to Egypt.
In Q1 2018 net sales increased by 3% to SEK 5,687 M (5,540) compared to the same period in 2017. Adjusted for currency movements, sales increased by 6%. Vehicle sales increased by 5%, adjusted for currency, despite unit sales decreasing by 7%. This is explained by a higher share of complete buses versus chassis. Service sales increased by 9% adjusted for currency. Both the adjusted and reported operating loss amounted to SEK 15 M (+90), corresponding to an operating margin of -0.3% (+1.6%). Earnings were positively impacted by further improved service sales, which were offset by a negative impact from higher selling and administrative expenses and lower production volume. Compared to Q1 2017, currency movements had a negative impact on operating income in an amount of SEK 90 M. In January Volvo Buses launched the new B8L double-decker bus in Hong Kong. In March Volvo Buses announced that two prototype all-electric articulated buses will be tested in Gothenburg, Sweden, starting in June. The buses will operate on a route which has frequent departures and carries a large number of passengers. Battery capacity will allow for the buses to operate without charging during peak hours.
All-electric articulated bus.
Net order intake and deliveriesNumber of buses 2018 2017
Total orders 1,823 3,176 -43Total deliveries 1,714 1,838 -7¹ Net order intake as of March 2017 and March 2018.
Net sales and operating incomeSEK M 2018 2017
Europe 1,963 1,711 15North America 2,689 2,479 8South America 264 258 2Asia 441 691 -36Africa and Oceania 330 401 -18Total net sales 5,687 5,540 3
Of which: Vehicles 4,512 4,414 2Services 1,176 1,126 4
Adjusted operating income ¹ -15 90 -117Adjustments ¹ - - - -Operating income -15 90 -117
Adjusted operating margin, % -0.3 1.6 Operating margin, % -0.3 1.6 ¹ For more information on adjusted operating income, please see note 7.
First quarter Change%
First quarter Change%
12
Report on the first quarter 2018
VOLVO PENTA
Continued profit improvement Sales growth continues, especially for industrial
off-road engines Operating income of SEK 509 M (419) with an
operating margin of 16.2% (15.5) New connected technology launched for marine
leisure boat owners The market for marine leisure engines shows positive signs and Volvo Penta continues to gain market share. The marine commercial market shows positive development in several sub-segments, such as offshore energy and people transportation. There is increased interest for hybrid and electrified solutions – an area where Volvo Penta has ambitions to develop further in the future. The market for industrial off-road engines continues to grow. There is increased demand in mining and material handling segments as well as growth in construction and agriculture. Customers in the off-road engine segment are showing interest in Volvo Penta’s European Stage V range, which fulfills the upcoming emissions regulation taking effect in 2019. Volvo Penta continues to grow within off-road engines, including increased business in the construction and mining segments. The market for industrial power generation engines is improving, with positive signs in construction and data centers/e-commerce. Net order intake in Q1 2018 increased by 19% to 13,305 units, while deliveries increased by 13% to 11,707 units. This was primarily driven by growth in the industrial segment.
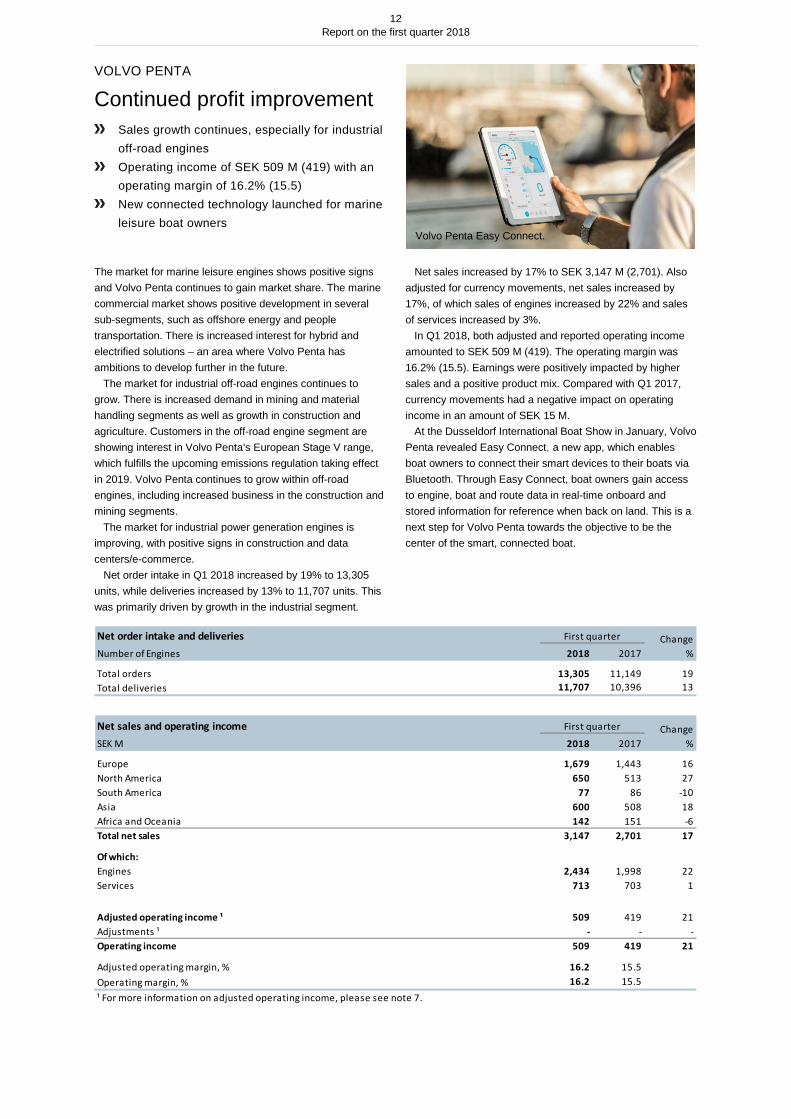
Net sales increased by 17% to SEK 3,147 M (2,701). Also adjusted for currency movements, net sales increased by 17%, of which sales of engines increased by 22% and sales of services increased by 3%. In Q1 2018, both adjusted and reported operating income amounted to SEK 509 M (419). The operating margin was 16.2% (15.5). Earnings were positively impacted by higher sales and a positive product mix. Compared with Q1 2017, currency movements had a negative impact on operating income in an amount of SEK 15 M. At the Dusseldorf International Boat Show in January, Volvo Penta revealed Easy Connect, a new app, which enables boat owners to connect their smart devices to their boats via Bluetooth. Through Easy Connect, boat owners gain access to engine, boat and route data in real-time onboard and stored information for reference when back on land. This is a next step for Volvo Penta towards the objective to be the center of the smart, connected boat.
Volvo Penta Easy Connect.
Net order intake and deliveriesNumber of Engines 2018 2017
Total orders 13,305 11,149 19Total deliveries 11,707 10,396 13¹ Net order intake as of March 2017 and March 2018.
Net sales and operating incomeSEK M 2018 2017
Europe 1,679 1,443 16North America 650 513 27South America 77 86 -10Asia 600 508 18Africa and Oceania 142 151 -6Total net sales 3,147 2,701 17
Of which: Engines 2,434 1,998 22Services 713 703 1
Adjusted operating income ¹ 509 419 21Adjustments ¹ - - -Operating income 509 419 21
Adjusted operating margin, % 16.2 15.5 Operating margin, % 16.2 15.5 ¹ For more information on adjusted operating income, please see note 7.
First quarter Change%
First quarter Change%
13
Report on the first quarter 2018
FINANCIAL SERVICES
Improved financial results Good new business volume Strong portfolio performance Asset-backed securitization
Volvo Financial Services (VFS) continued to improve the financial results on the basis of stable spreads, generally low credit losses and portfolio growth. New business volume increased due to increased deliveries of Group products while penetration was stable. Adjusted for currency, the credit portfolio grew by 8% on a year over year basis. The portfolio continued to perform well during the quarter, highlighted by low customer overdues and credit losses in most markets. Operating income increased to SEK 602 M (531). Com-pared with Q1 2017, currency movements had a negative impact of SEK 35 M. Return on shareholders’ equity improved
to 14.8% (13.8), excluding a positive impact from the revaluation of deferred tax liabilities due to the enacted tax reform legislation in the United States. Reported return on shareholders’ equity amounted to 23.0%. In February, VFS successfully completed an asset-backed securitization transaction, under which SEK 6.0 billion of securities tied to US-based loans on trucking and construction equipment assets were issued. In addition, SEK 2.0 billion of assets were syndicated in the quarter, effectively reducing concentration risks and freeing up credit capacity to support sales.
Financial ServicesSEK M 2018 2017
Number of financed units, 12 months rolling 53,342 48,643Total penetration rate, 12 months rolling, % ¹ 25 25New retail financing volume, SEK billion 13.2 11.7Credit portfolio net, SEK billion 135 126Credit provision expenses 108 147Operating income 602 531Credit reserves, % of credit portfolio ² 1.69 1.46Return on shareholders’ equity, 12 months rolling, % 23.0 13.8Return on shareholders’ equity excluding effect from US tax reform 2017, 12 months rolling, % ³ 14.8 13.8¹ Share of unit sales financed by Volvo Financial Services in relation to the total number of units sold by the Volvo Group in markets where financial services are offered.² As from January 1, 2018 Volvo Group applies IFRS 9, Financial instruments, which compared with the former incurred loss model, requires earlier recognition of credit losses.³ Excluding the positive impact of SEK 897 M from the revaluation of deferred tax liabilities related to the year 2017 tax reform in the United States.
First quarter
14
Report on the first quarter 2018
IMPORTANT EVENTS FOR THE VOLVO GROUP
Electric trucks from Volvo Trucks and Renault Trucks In January it was announced that both Volvo Trucks and Renault Trucks will start selling all-electric medium-duty trucks in Europe in 2019, and that the first units will be put into operation together with a few selected reference customers already this year. Subsequently, on April 12, Volvo Trucks for the first time showed the Volvo FL Electric for urban distribution and refuse operations, among other applications. Agreement to divest a subsidiary holding shares in NHL On March 26, it was announced that Volvo Group had entered into an agreement to divest a Chinese subsidiary, which is holding 25.2% of the shares in the Chinese company Inner Mongolia North Hauler Joint Stock Co., Ltd (NHL) for approximately SEK 0.9 billion. The divestment is expected to generate a capital gain of approximately SEK 0.7 billion, which will affect the Volvo Group’s operating income when the transaction is closed. Closing of the transaction is expected within six months and is subject to approval by Chinese authorities. Annual General Meeting of AB Volvo The Annual General Meeting of AB Volvo held on April 5, approved the Board of Directors’ proposal that a dividend of SEK 4.25 per share be paid to the company’s shareholders.
Matti Alahuhta, Eckhard Cordes, James W. Griffith, Martin Lundstedt, Kathryn V. Marinello, Martina Merz, Hanne de Mora, Helena Stjernholm and Carl-Henric Svanberg were reelected as members of the Board. Eric Elzvik was elected as new member of the Board. Carl-Henric Svanberg was reelected as Chairman of the Board. Bengt Kjell, representing AB Industrivärden, Yngve Slyngstad, representing Norges Bank Investment Management, Pär Boman, representing Svenska Handelsbanken, SHB Pension Fund, SHB Employee Fund, SHB Pensionskassa and Oktogonen, Ramsay Brufer, representing Alecta, and the Chairman of the Board were elected members of the Election Committee. A remuneration policy for senior executives was adopted in accordance with the Board of Directors’ proposal. Detailed information about the events is available at www.volvogroup.com
15
Report on the first quarter 2018
CONSOLIDATED INCOME STATEMENT FIRST QUARTER
CONSOLIDATED OTHER COMPREHENSIVE INCOME FIRST QUARTER
SEK M 2018 2017 2018 2017 2018 2017 2018 2017
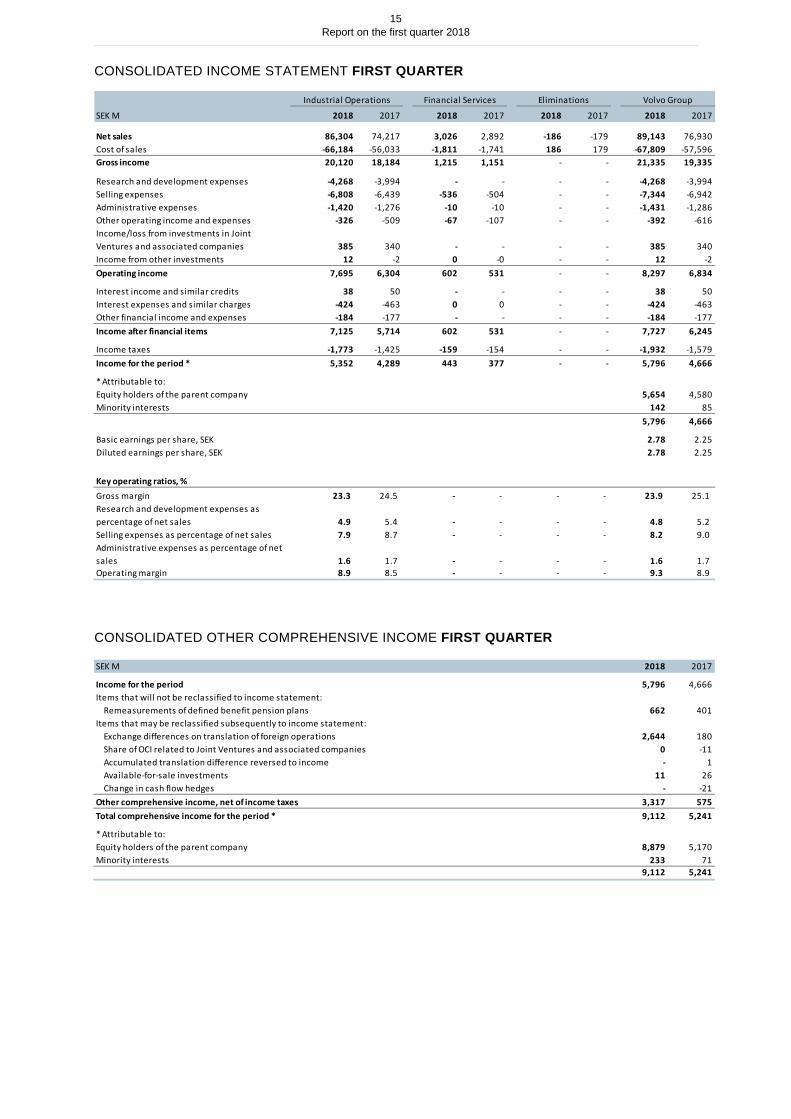
Net sales 86,304 74,217 3,026 2,892 -186 -179 89,143 76,930 Cost of sales -66,184 -56,033 -1,811 -1,741 186 179 -67,809 -57,596 Gross income 20,120 18,184 1,215 1,151 - - 21,335 19,335
Research and development expenses -4,268 -3,994 - - - - -4,268 -3,994 Selling expenses -6,808 -6,439 -536 -504 - - -7,344 -6,942 Administrative expenses -1,420 -1,276 -10 -10 - - -1,431 -1,286 Other operating income and expenses -326 -509 -67 -107 - - -392 -616 Income/loss from investments in Joint Ventures and associated companies 385 340 - - - - 385 340 Income from other investments 12 -2 0 -0 - - 12 -2 Operating income 7,695 6,304 602 531 - - 8,297 6,834
Interest income and similar credits 38 50 - - - - 38 50 Interest expenses and similar charges -424 -463 0 0 - - -424 -463 Other financial income and expenses -184 -177 - - - - -184 -177 Income after financial items 7,125 5,714 602 531 - - 7,727 6,245
Income taxes -1,773 -1,425 -159 -154 - - -1,932 -1,579 Income for the period * 5,352 4,289 443 377 - - 5,796 4,666
* Attributable to: Equity holders of the parent company 5,654 4,580Minority interests 142 85 5,796 4,666
Basic earnings per share, SEK 2.78 2.25 Diluted earnings per share, SEK 2.78 2.25
Key operating ratios, % Gross margin 23.3 24.5 - - - - 23.9 25.1Research and development expenses as percentage of net sales 4.9 5.4 - - - - 4.8 5.2Selling expenses as percentage of net sales 7.9 8.7 - - - - 8.2 9.0Administrative expenses as percentage of net sales 1.6 1.7 - - - - 1.6 1.7Operating margin 8.9 8.5 - - - - 9.3 8.9
Industrial Operations Financial Services Eliminations Volvo Group
SEK M 2018 2017
Income for the period 5,796 4,666Items that will not be reclassified to income statement:
Remeasurements of defined benefit pension plans 662 401Items that may be reclassified subsequently to income statement:
Exchange differences on translation of foreign operations 2,644 180Share of OCI related to Joint Ventures and associated companies 0 -11Accumulated translation difference reversed to income - 1Available-for-sale investments 11 26Change in cash flow hedges - -21
Other comprehensive income, net of income taxes 3,317 575Total comprehensive income for the period * 9,112 5,241
* Attributable to: Equity holders of the parent company 8,879 5,170Minority interests 233 71 9,112 5,241
16
Report on the first quarter 2018
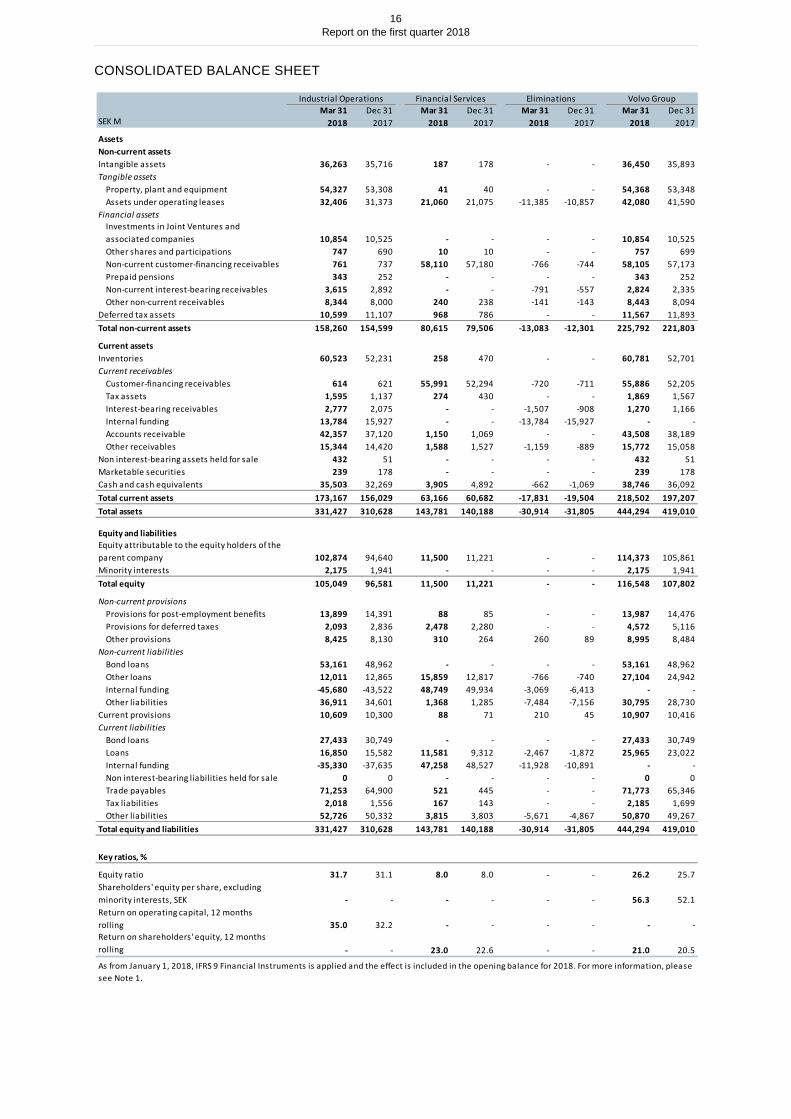
CONSOLIDATED BALANCE SHEET
SEK MMar 31
2018Dec 31
2017Mar 31
2018Dec 31
2017Mar 31
2018Dec 31
2017Mar 31
2018Dec 31
2017
AssetsNon-current assetsIntangible assets 36,263 35,716 187 178 - - 36,450 35,893Tangible assets
Property, plant and equipment 54,327 53,308 41 40 - - 54,368 53,348Assets under operating leases 32,406 31,373 21,060 21,075 -11,385 -10,857 42,080 41,590
Financial assetsInvestments in Joint Ventures and associated companies 10,854 10,525 - - - - 10,854 10,525Other shares and participations 747 690 10 10 - - 757 699Non-current customer-financing receivables 761 737 58,110 57,180 -766 -744 58,105 57,173Prepaid pensions 343 252 - - - - 343 252Non-current interest-bearing receivables 3,615 2,892 - - -791 -557 2,824 2,335Other non-current receivables 8,344 8,000 240 238 -141 -143 8,443 8,094
Deferred tax assets 10,599 11,107 968 786 - - 11,567 11,893Total non-current assets 158,260 154,599 80,615 79,506 -13,083 -12,301 225,792 221,803
Current assetsInventories 60,523 52,231 258 470 - - 60,781 52,701Current receivables
Customer-financing receivables 614 621 55,991 52,294 -720 -711 55,886 52,205Tax assets 1,595 1,137 274 430 - - 1,869 1,567Interest-bearing receivables 2,777 2,075 - - -1,507 -908 1,270 1,166Internal funding 13,784 15,927 - - -13,784 -15,927 - -Accounts receivable 42,357 37,120 1,150 1,069 - - 43,508 38,189Other receivables 15,344 14,420 1,588 1,527 -1,159 -889 15,772 15,058
Non interest-bearing assets held for sale 432 51 - - - - 432 51Marketable securities 239 178 - - - - 239 178Cash and cash equivalents 35,503 32,269 3,905 4,892 -662 -1,069 38,746 36,092Total current assets 173,167 156,029 63,166 60,682 -17,831 -19,504 218,502 197,207Total assets 331,427 310,628 143,781 140,188 -30,914 -31,805 444,294 419,010
Equity and liabilitiesEquity attributable to the equity holders of the parent company 102,874 94,640 11,500 11,221 - - 114,373 105,861Minority interests 2,175 1,941 - - - - 2,175 1,941Total equity 105,049 96,581 11,500 11,221 - - 116,548 107,802
Non-current provisionsProvisions for post-employment benefits 13,899 14,391 88 85 - - 13,987 14,476Provisions for deferred taxes 2,093 2,836 2,478 2,280 - - 4,572 5,116Other provisions 8,425 8,130 310 264 260 89 8,995 8,484
Non-current liabilitiesBond loans 53,161 48,962 - - - - 53,161 48,962Other loans 12,011 12,865 15,859 12,817 -766 -740 27,104 24,942Internal funding -45,680 -43,522 48,749 49,934 -3,069 -6,413 - -Other liabilities 36,911 34,601 1,368 1,285 -7,484 -7,156 30,795 28,730
Current provisions 10,609 10,300 88 71 210 45 10,907 10,416Current liabilities
Bond loans 27,433 30,749 - - - - 27,433 30,749Loans 16,850 15,582 11,581 9,312 -2,467 -1,872 25,965 23,022Internal funding -35,330 -37,635 47,258 48,527 -11,928 -10,891 - -Non interest-bearing liabilities held for sale 0 0 - - - - 0 0Trade payables 71,253 64,900 521 445 - - 71,773 65,346Tax liabilities 2,018 1,556 167 143 - - 2,185 1,699Other liabilities 52,726 50,332 3,815 3,803 -5,671 -4,867 50,870 49,267
Total equity and liabilities 331,427 310,628 143,781 140,188 -30,914 -31,805 444,294 419,010
Key ratios, %
Equity ratio 31.7 31.1 8.0 8.0 - - 26.2 25.7Shareholders' equity per share, excluding minority interests, SEK - - - - - - 56.3 52.1Return on operating capital, 12 months rolling 35.0 32.2 - - - - - -Return on shareholders' equity, 12 months rolling - - 23.0 22.6 - - 21.0 20.5
Industrial Operations Financial Services Eliminations Volvo Group
As from January 1, 2018, IFRS 9 Financial Instruments is applied and the effect is included in the opening balance for 2018. For more information, please see Note 1.
17
Report on the first quarter 2018
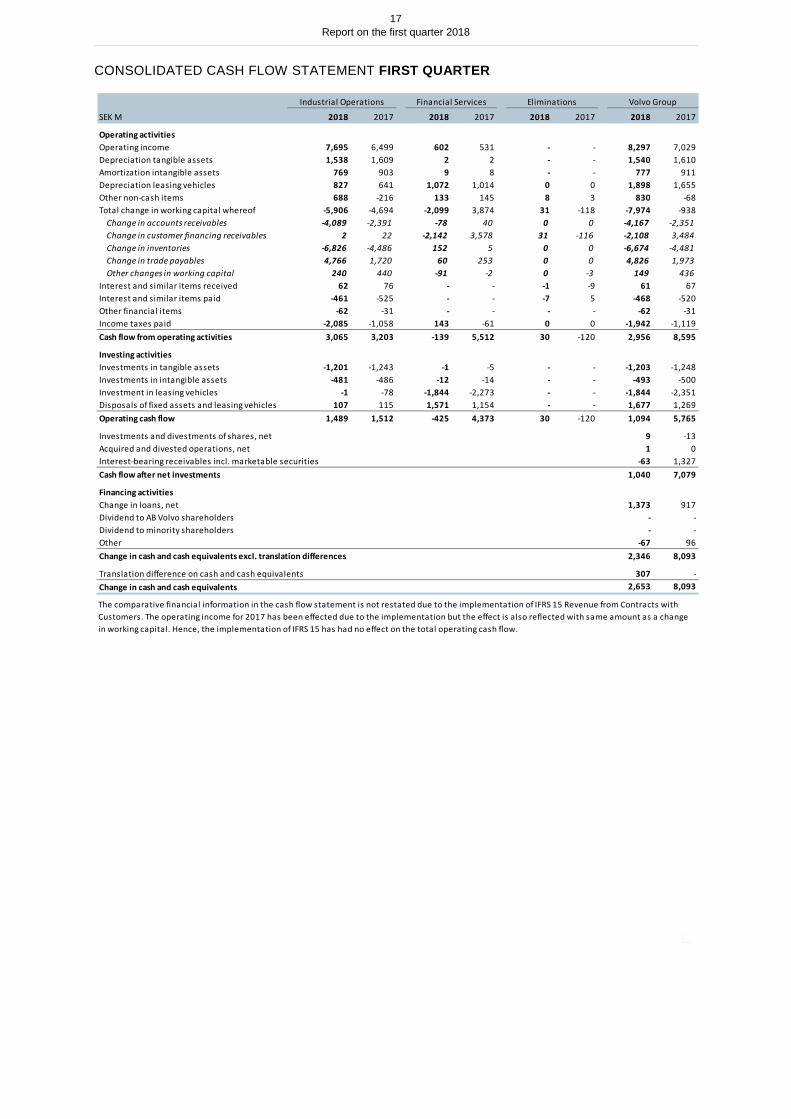
CONSOLIDATED CASH FLOW STATEMENT FIRST QUARTER
SEK Bn20142013201420132014201320142013
Operating activitiesOperating income (loss)1.82.10.50.30.10.02.32.4Depreciation tangible assets1.81.50.00.00.00.01.81.5Amortization intangible assets0.90.90.00.00.00.00.90.9Depreciation leasing vehicles0.30.90.90.7(0.1)0.01.21.6Other non-cash items0.2(0.1)0.20.30.10.00.60.2Total change in working capital whereof(1.9)(6.2)(2.9)0.20.1(0.2)(4.7)(6.2) Change in accounts receivable2.72.1(0.1)0.00.00.02.72.1 Change in customer financing receivable(0.1)0.0(2.9)0.40.20.0(2.8)0.4 Change in inventories(0.1)(1.5)0.00.00.0(0.2)(0.1)(1.7) Change in trade payables(2.9)(5.1)0.00.00.0(0.1)(2.9)(5.2) Other changes in working capital(1.5)(1.7)0.1(0.2)(0.1)0.1(1.5)(1.8)Interest and similar items received0.10.10.00.00.00.00.10.1Interest and similar items paid(0.4)(0.6)0.00.00.0(0.1)(0.3)(0.7)Other financial items0.0(0.1)0.00.00.10.00.0(0.1)Income taxes paid(0.3)(0.6)(0.2)(0.1)(0.1)0.0(0.5)(0.7)Cash flow from operating activities2.6(2.1)(1.5)1.40.2(0.3)1.4(1.0)
Investing activitiesInvestments in tangible assets(1.8)(2.2)0.00.00.00.0(1.8)(2.2)Investments in intangible assets(0.2)(0.6)0.00.00.00.0(0.2)(0.6)Investment in leasing vehicles(0.1)(0.5)(1.9)(1.7)0.00.1(2.0)(2.1)Disposals of fixed assets and leasing vehicles0.40.10.70.80.00.01.00.9Operating cash flow0.9(5.3)(2.7)0.50.2(0.2)(1.6)(5.0)
Acquired and divested operations, net0.00.3Interest-bearing receivables incl marketable securites(0.1)0.5Cash-flow after net investments(1.7)(4.2)
Financing activitiesChange in loans, net3.52.7Dividend to minority shareholders0.0(0.2)Other(0.1)0.2Change in cash and cash equivalents excl. translation differences1.7(1.5)
Translation difference on cash and cash equivalents0.4(0.4)Change in cash and cash equivalents2.1(1.9)
Industrial operationsCustomer FinanceEliminationsVolvo Group Total
The comparative financial information in the cash flow statement is not restated due to the implementation of IFRS 15 Revenue from Contracts with Customers. The operating income for 2017 has been effected due to the implementation but the effect is also reflected with same amount as a change in working capital. Hence, the implementation of IFRS 15 has had no effect on the total operating cash flow.
SEK M 2018 2017 2018 2017 2018 2017 2018 2017
Operating activities Operating income 7,695 6,499 602 531 - - 8,297 7,029Depreciation tangible assets 1,538 1,609 2 2 - - 1,540 1,610Amortization intangible assets 769 903 9 8 - - 777 911Depreciation leasing vehicles 827 641 1,072 1,014 0 0 1,898 1,655Other non-cash items 688 -216 133 145 8 3 830 -68Total change in working capital whereof -5,906 -4,694 -2,099 3,874 31 -118 -7,974 -938
Change in accounts receivables -4,089 -2,391 -78 40 0 0 -4,167 -2,351Change in customer financing receivables 2 22 -2,142 3,578 31 -116 -2,108 3,484Change in inventories -6,826 -4,486 152 5 0 0 -6,674 -4,481Change in trade payables 4,766 1,720 60 253 0 0 4,826 1,973Other changes in working capital 240 440 -91 -2 0 -3 149 436
Interest and similar items received 62 76 - - -1 -9 61 67Interest and similar items paid -461 -525 - - -7 5 -468 -520Other financial items -62 -31 - - - - -62 -31Income taxes paid -2,085 -1,058 143 -61 0 0 -1,942 -1,119Cash flow from operating activities 3,065 3,203 -139 5,512 30 -120 2,956 8,595
Investing activities Investments in tangible assets -1,201 -1,243 -1 -5 - - -1,203 -1,248Investments in intangible assets -481 -486 -12 -14 - - -493 -500Investment in leasing vehicles -1 -78 -1,844 -2,273 - - -1,844 -2,351Disposals of fixed assets and leasing vehicles 107 115 1,571 1,154 - - 1,677 1,269Operating cash flow 1,489 1,512 -425 4,373 30 -120 1,094 5,765
Investments and divestments of shares, net 9 -13Acquired and divested operations, net 1 0Interest-bearing receivables incl. marketable securities -63 1,327Cash flow after net investments 1,040 7,079
Financing activities Change in loans, net 1,373 917Dividend to AB Volvo shareholders - -Dividend to minority shareholders - -Other -67 96Change in cash and cash equivalents excl. translation differences 2,346 8,093
Translation difference on cash and cash equivalents 307 -Change in cash and cash equivalents 2,653 8,093
Industrial Operations Financial Services Eliminations Volvo Group
18
Report on the first quarter 2018
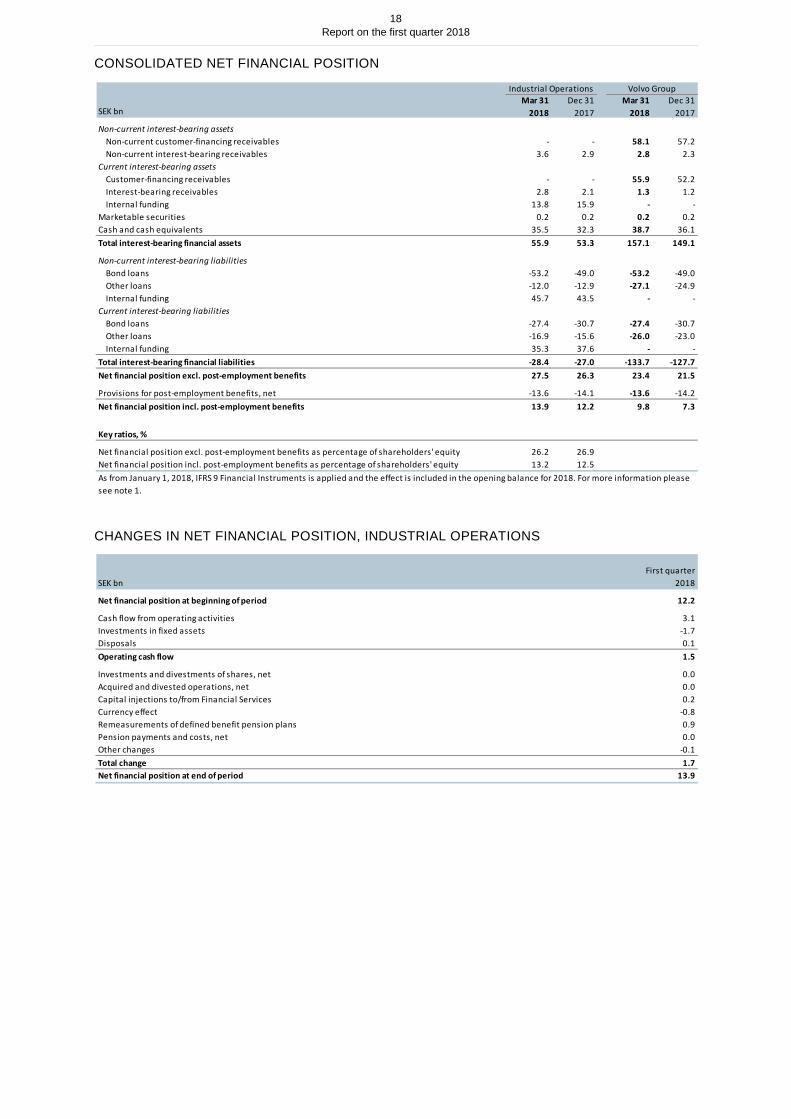
CONSOLIDATED NET FINANCIAL POSITION
CHANGES IN NET FINANCIAL POSITION, INDUSTRIAL OPERATIONS
SEK bnMar 31
2018Dec 31
2017Mar 31
2018Dec 31
2017
Non-current interest-bearing assetsNon-current customer-financing receivables - - 58.1 57.2Non-current interest-bearing receivables 3.6 2.9 2.8 2.3
Current interest-bearing assetsCustomer-financing receivables - - 55.9 52.2Interest-bearing receivables 2.8 2.1 1.3 1.2Internal funding 13.8 15.9 - -
Marketable securities 0.2 0.2 0.2 0.2Cash and cash equivalents 35.5 32.3 38.7 36.1Total interest-bearing financial assets 55.9 53.3 157.1 149.1
Non-current interest-bearing liabilitiesBond loans -53.2 -49.0 -53.2 -49.0Other loans -12.0 -12.9 -27.1 -24.9Internal funding 45.7 43.5 - -
Current interest-bearing liabilitiesBond loans -27.4 -30.7 -27.4 -30.7Other loans -16.9 -15.6 -26.0 -23.0Internal funding 35.3 37.6 - -
Total interest-bearing financial liabilities -28.4 -27.0 -133.7 -127.7Net financial position excl. post-employment benefits 27.5 26.3 23.4 21.5
Provisions for post-employment benefits, net -13.6 -14.1 -13.6 -14.2Net financial position incl. post-employment benefits 13.9 12.2 9.8 7.3
Key ratios, %
Net financial position excl. post-employment benefits as percentage of shareholders' equity 26.2 26.9Net financial position incl. post-employment benefits as percentage of shareholders' equity 13.2 12.5As from January 1, 2018, IFRS 9 Financial Instruments is applied and the effect is included in the opening balance for 2018. For more information please see note 1.
Industrial Operations Volvo Group
SEK bn
Net financial position at beginning of period 12.2
Cash flow from operating activities 3.1Investments in fixed assets -1.7Disposals 0.1Operating cash flow 1.5
Investments and divestments of shares, net 0.0Acquired and divested operations, net 0.0Capital injections to/from Financial Services 0.2Currency effect -0.8Remeasurements of defined benefit pension plans 0.9Pension payments and costs, net 0.0Other changes -0.1Total change 1.7Net financial position at end of period 13.9
2018
First quarter 2018
19
Report on the first quarter 2018
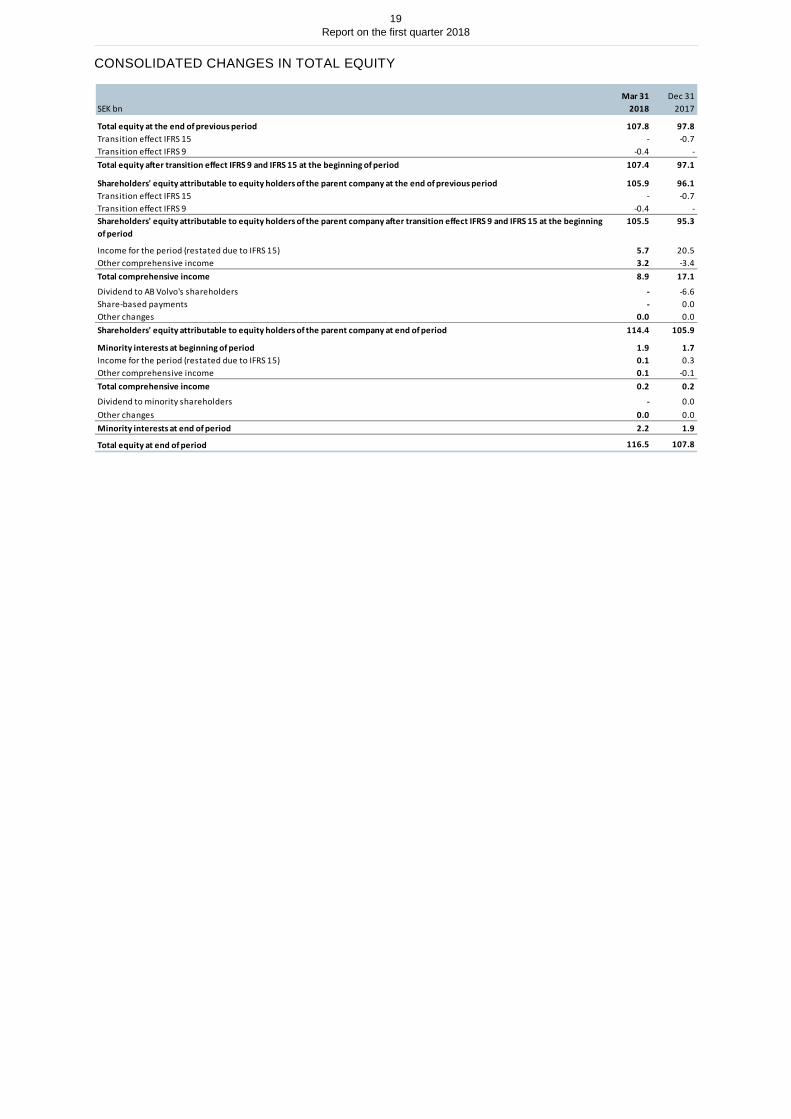
CONSOLIDATED CHANGES IN TOTAL EQUITY
SEK bnMar 31
2018Dec 31
2017
Total equity at the end of previous period 107.8 97.8Transition effect IFRS 15 - -0.7Transition effect IFRS 9 -0.4 -Total equity after transition effect IFRS 9 and IFRS 15 at the beginning of period 107.4 97.1
Shareholders' equity attributable to equity holders of the parent company at the end of previous period 105.9 96.1Transition effect IFRS 15 - -0.7Transition effect IFRS 9 -0.4 -
105.5 95.3
Income for the period (restated due to IFRS 15) 5.7 20.5Other comprehensive income 3.2 -3.4Total comprehensive income 8.9 17.1
Dividend to AB Volvo's shareholders - -6.6Share-based payments - 0.0Other changes 0.0 0.0Shareholders' equity attributable to equity holders of the parent company at end of period 114.4 105.9
Minority interests at beginning of period 1.9 1.7Income for the period (restated due to IFRS 15) 0.1 0.3Other comprehensive income 0.1 -0.1Total comprehensive income 0.2 0.2
Dividend to minority shareholders - 0.0Other changes 0.0 0.0Minority interests at end of period 2.2 1.9
Total equity at end of period 116.5 107.8
Shareholders' equity attributable to equity holders of the parent company after transition effect IFRS 9 and IFRS 15 at the beginning of period
20
Report on the first quarter 2018
QUARTERLY FIGURES
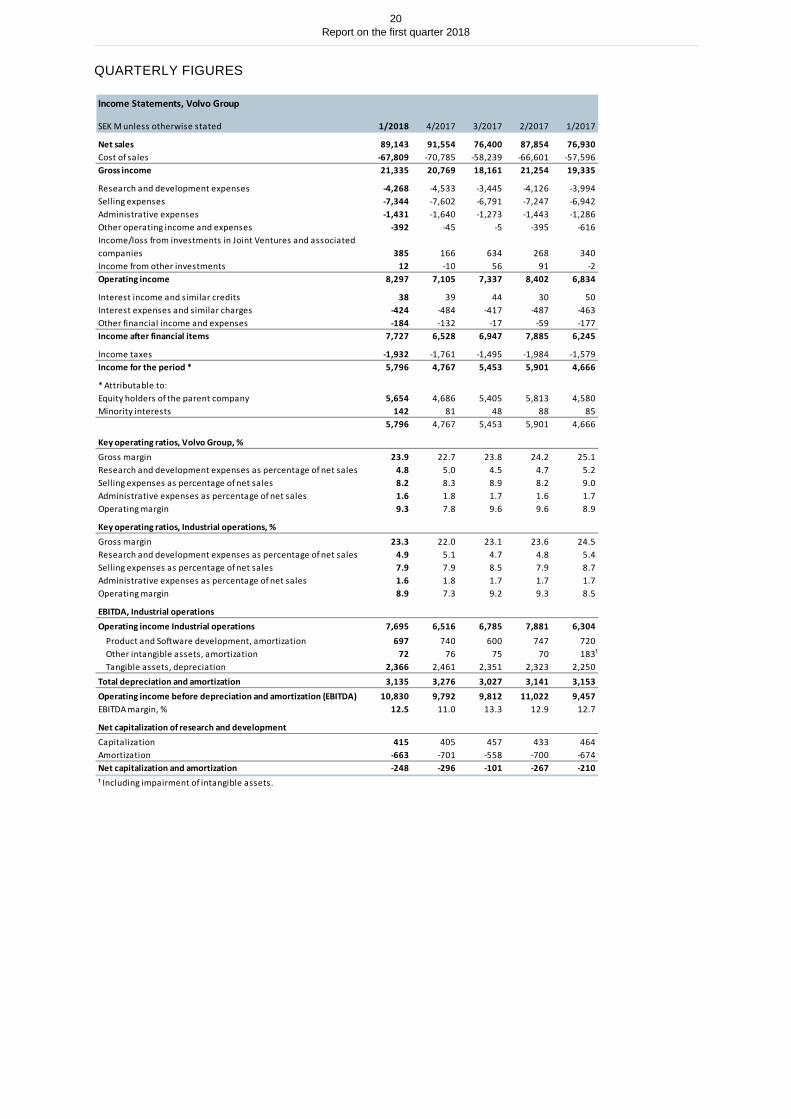
Income Statements, Volvo Group
SEK M unless otherwise stated 1/2018 4/2017 3/2017 2/2017 1/2017
Net sales 89,143 91,554 76,400 87,854 76,930Cost of sales -67,809 -70,785 -58,239 -66,601 -57,596Gross income 21,335 20,769 18,161 21,254 19,335
Research and development expenses -4,268 -4,533 -3,445 -4,126 -3,994Selling expenses -7,344 -7,602 -6,791 -7,247 -6,942Administrative expenses -1,431 -1,640 -1,273 -1,443 -1,286Other operating income and expenses -392 -45 -5 -395 -616Income/loss from investments in Joint Ventures and associated companies 385 166 634 268 340Income from other investments 12 -10 56 91 -2Operating income 8,297 7,105 7,337 8,402 6,834
Interest income and similar credits 38 39 44 30 50Interest expenses and similar charges -424 -484 -417 -487 -463Other financial income and expenses -184 -132 -17 -59 -177Income after financial items 7,727 6,528 6,947 7,885 6,245
Income taxes -1,932 -1,761 -1,495 -1,984 -1,579Income for the period * 5,796 4,767 5,453 5,901 4,666
* Attributable to:Equity holders of the parent company 5,654 4,686 5,405 5,813 4,580Minority interests 142 81 48 88 85 5,796 4,767 5,453 5,901 4,666
Key operating ratios, Volvo Group, %Gross margin 23.9 22.7 23.8 24.2 25.1Research and development expenses as percentage of net sales 4.8 5.0 4.5 4.7 5.2Selling expenses as percentage of net sales 8.2 8.3 8.9 8.2 9.0Administrative expenses as percentage of net sales 1.6 1.8 1.7 1.6 1.7Operating margin 9.3 7.8 9.6 9.6 8.9
Key operating ratios, Industrial operations, %Gross margin 23.3 22.0 23.1 23.6 24.5Research and development expenses as percentage of net sales 4.9 5.1 4.7 4.8 5.4Selling expenses as percentage of net sales 7.9 7.9 8.5 7.9 8.7Administrative expenses as percentage of net sales 1.6 1.8 1.7 1.7 1.7Operating margin 8.9 7.3 9.2 9.3 8.5
EBITDA, Industrial operationsOperating income Industrial operations 7,695 6,516 6,785 7,881 6,304
Product and Software development, amortization 697 740 600 747 720Other intangible assets, amortization 72 76 75 70 183 Tangible assets, depreciation 2,366 2,461 2,351 2,323 2,250
Total depreciation and amortization 3,135 3,276 3,027 3,141 3,153Operating income before depreciation and amortization (EBITDA) 10,830 9,792 9,812 11,022 9,457EBITDA margin, % 12.5 11.0 13.3 12.9 12.7
Net capitalization of research and developmentCapitalization 415 405 457 433 464Amortization -663 -701 -558 -700 -674Net capitalization and amortization -248 -296 -101 -267 -210¹ Including impairment of intangible assets.
¹
21
Report on the first quarter 2018
QUARTERLY FIGURES
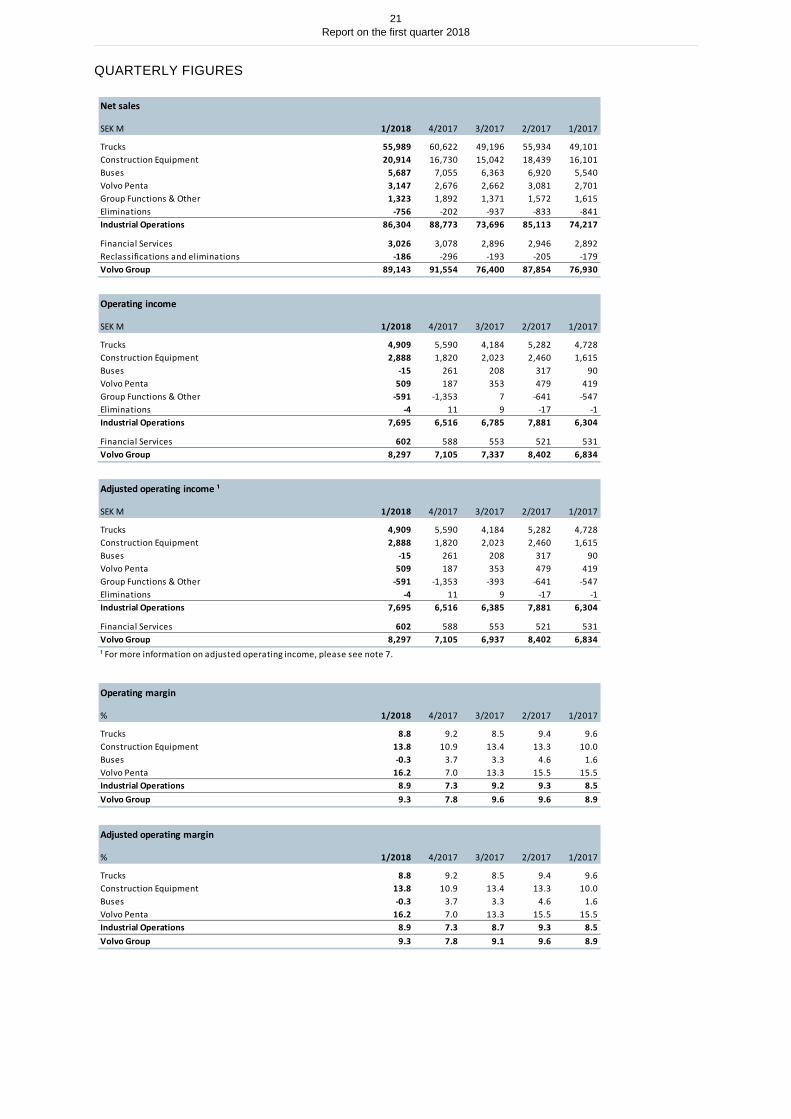
Net sales
SEK M 1/2018 4/2017 3/2017 2/2017 1/2017
Trucks 55,989 60,622 49,196 55,934 49,101Construction Equipment 20,914 16,730 15,042 18,439 16,101Buses 5,687 7,055 6,363 6,920 5,540Volvo Penta 3,147 2,676 2,662 3,081 2,701Group Functions & Other 1,323 1,892 1,371 1,572 1,615Eliminations -756 -202 -937 -833 -841Industrial Operations 86,304 88,773 73,696 85,113 74,217
Financial Services 3,026 3,078 2,896 2,946 2,892Reclassifications and eliminations -186 -296 -193 -205 -179Volvo Group 89,143 91,554 76,400 87,854 76,930
Operating income
SEK M 1/2018 4/2017 3/2017 2/2017 1/2017
Trucks 4,909 5,590 4,184 5,282 4,728Construction Equipment 2,888 1,820 2,023 2,460 1,615Buses -15 261 208 317 90Volvo Penta 509 187 353 479 419Group Functions & Other -591 -1,353 7 -641 -547Eliminations -4 11 9 -17 -1Industrial Operations 7,695 6,516 6,785 7,881 6,304
Financial Services 602 588 553 521 531Volvo Group 8,297 7,105 7,337 8,402 6,834
Adjusted operating income ¹
SEK M 1/2018 4/2017 3/2017 2/2017 1/2017
Trucks 4,909 5,590 4,184 5,282 4,728Construction Equipment 2,888 1,820 2,023 2,460 1,615Buses -15 261 208 317 90Volvo Penta 509 187 353 479 419Group Functions & Other -591 -1,353 -393 -641 -547Eliminations -4 11 9 -17 -1Industrial Operations 7,695 6,516 6,385 7,881 6,304
Financial Services 602 588 553 521 531Volvo Group 8,297 7,105 6,937 8,402 6,834¹ For more information on adjusted operating income, please see note 7.
Operating margin
% 1/2018 4/2017 3/2017 2/2017 1/2017
Trucks 8.8 9.2 8.5 9.4 9.6Construction Equipment 13.8 10.9 13.4 13.3 10.0Buses -0.3 3.7 3.3 4.6 1.6Volvo Penta 16.2 7.0 13.3 15.5 15.5Industrial Operations 8.9 7.3 9.2 9.3 8.5Volvo Group 9.3 7.8 9.6 9.6 8.9
Adjusted operating margin
% 1/2018 4/2017 3/2017 2/2017 1/2017
Trucks 8.8 9.2 8.5 9.4 9.6Construction Equipment 13.8 10.9 13.4 13.3 10.0Buses -0.3 3.7 3.3 4.6 1.6Volvo Penta 16.2 7.0 13.3 15.5 15.5Industrial Operations 8.9 7.3 8.7 9.3 8.5Volvo Group 9.3 7.8 9.1 9.6 8.9
22
Report on the first quarter 2018
QUARTERLY FIGURES
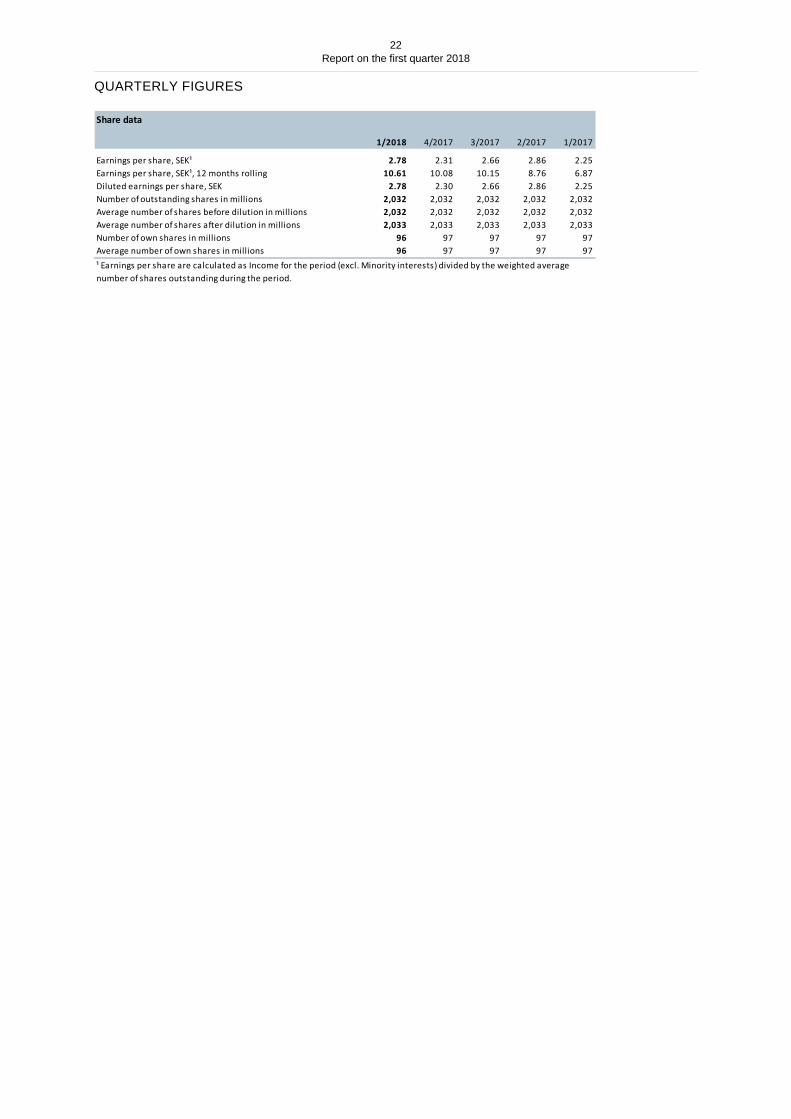
Share data
1/2018 4/2017 3/2017 2/2017 1/2017
Earnings per share, SEK¹ 2.78 2.31 2.66 2.86 2.25Earnings per share, SEK¹, 12 months rolling 10.61 10.08 10.15 8.76 6.87Diluted earnings per share, SEK 2.78 2.30 2.66 2.86 2.25Number of outstanding shares in millions 2,032 2,032 2,032 2,032 2,032Average number of shares before dilution in millions 2,032 2,032 2,032 2,032 2,032Average number of shares after dilution in millions 2,033 2,033 2,033 2,033 2,033Number of own shares in millions 96 97 97 97 97Average number of own shares in millions 96 97 97 97 97¹ Earnings per share are calculated as Income for the period (excl. Minority interests) divided by the weighted average number of shares outstanding during the period.
23
Report on the first quarter 2018
NOTE 1 | ACCOUNTING POLICIES
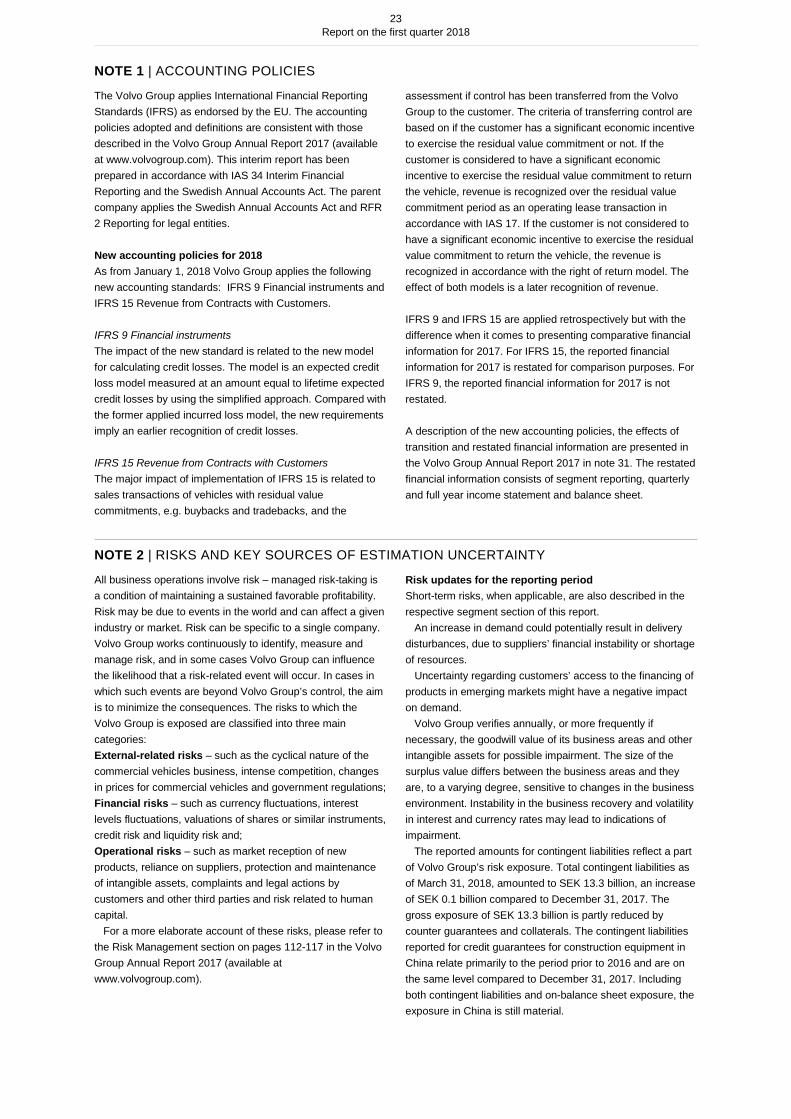
The Volvo Group applies International Financial Reporting Standards (IFRS) as endorsed by the EU. The accounting policies adopted and definitions are consistent with those described in the Volvo Group Annual Report 2017 (available at www.volvogroup.com). This interim report has been prepared in accordance with IAS 34 Interim Financial Reporting and the Swedish Annual Accounts Act. The parent company applies the Swedish Annual Accounts Act and RFR 2 Reporting for legal entities. New accounting policies for 2018 As from January 1, 2018 Volvo Group applies the following new accounting standards: IFRS 9 Financial instruments and IFRS 15 Revenue from Contracts with Customers. IFRS 9 Financial instruments The impact of the new standard is related to the new model for calculating credit losses. The model is an expected credit loss model measured at an amount equal to lifetime expected credit losses by using the simplified approach. Compared with the former applied incurred loss model, the new requirements imply an earlier recognition of credit losses. IFRS 15 Revenue from Contracts with Customers The major impact of implementation of IFRS 15 is related to sales transactions of vehicles with residual value commitments, e.g. buybacks and tradebacks, and the
assessment if control has been transferred from the Volvo Group to the customer. The criteria of transferring control are based on if the customer has a significant economic incentive to exercise the residual value commitment or not. If the customer is considered to have a significant economic incentive to exercise the residual value commitment to return the vehicle, revenue is recognized over the residual value commitment period as an operating lease transaction in accordance with IAS 17. If the customer is not considered to have a significant economic incentive to exercise the residual value commitment to return the vehicle, the revenue is recognized in accordance with the right of return model. The effect of both models is a later recognition of revenue. IFRS 9 and IFRS 15 are applied retrospectively but with the difference when it comes to presenting comparative financial information for 2017. For IFRS 15, the reported financial information for 2017 is restated for comparison purposes. For IFRS 9, the reported financial information for 2017 is not restated. A description of the new accounting policies, the effects of transition and restated financial information are presented in the Volvo Group Annual Report 2017 in note 31. The restated financial information consists of segment reporting, quarterly and full year income statement and balance sheet.
NOTE 2 | RISKS AND KEY SOURCES OF ESTIMATION UNCERTAINTY
All business operations involve risk – managed risk-taking is a condition of maintaining a sustained favorable profitability. Risk may be due to events in the world and can affect a given industry or market. Risk can be specific to a single company. Volvo Group works continuously to identify, measure and manage risk, and in some cases Volvo Group can influence the likelihood that a risk-related event will occur. In cases in which such events are beyond Volvo Group’s control, the aim is to minimize the consequences. The risks to which the Volvo Group is exposed are classified into three main categories: External-related risks – such as the cyclical nature of the commercial vehicles business, intense competition, changes in prices for commercial vehicles and government regulations; Financial risks – such as currency fluctuations, interest levels fluctuations, valuations of shares or similar instruments, credit risk and liquidity risk and; Operational risks – such as market reception of new products, reliance on suppliers, protection and maintenance of intangible assets, complaints and legal actions by customers and other third parties and risk related to human capital. For a more elaborate account of these risks, please refer to the Risk Management section on pages 112-117 in the Volvo Group Annual Report 2017 (available at www.volvogroup.com).
Risk updates for the reporting period Short-term risks, when applicable, are also described in the respective segment section of this report. An increase in demand could potentially result in delivery disturbances, due to suppliers’ financial instability or shortage of resources. Uncertainty regarding customers’ access to the financing of products in emerging markets might have a negative impact on demand. Volvo Group verifies annually, or more frequently if necessary, the goodwill value of its business areas and other intangible assets for possible impairment. The size of the surplus value differs between the business areas and they are, to a varying degree, sensitive to changes in the business environment. Instability in the business recovery and volatility in interest and currency rates may lead to indications of impairment. The reported amounts for contingent liabilities reflect a part of Volvo Group’s risk exposure. Total contingent liabilities as of March 31, 2018, amounted to SEK 13.3 billion, an increase of SEK 0.1 billion compared to December 31, 2017. The gross exposure of SEK 13.3 billion is partly reduced by counter guarantees and collaterals. The contingent liabilities reported for credit guarantees for construction equipment in China relate primarily to the period prior to 2016 and are on the same level compared to December 31, 2017. Including both contingent liabilities and on-balance sheet exposure, the exposure in China is still material.
24
Report on the first quarter 2018
Following the adoption of the European Commission’s settlement decision, the Volvo Group has received and will be dealing with numerous private damages claims from customers and other third parties alleging that they suffered loss by reason of the conduct covered in the decision. At this stage it is not possible to make a reliable estimate of the amount of any liability that could arise from any such
proceedings. The other legal proceedings and investigations described in note 21 and note 24 in the Volvo Group Annual Report 2017 are progressing but no material changes have occurred in these matters in the first quarter of 2018.
NOTE 3 | REVENUE
The two major revenue streams within the Volvo Group are vehicles and services. Vehicles include sales of vehicles, machinery and engines. Revenue is recognized when the control of the vehicle has been transferred to the customer, normally at one point in time which is when the vehicle has been delivered to the customer. If the sale of a vehicle is combined with a residual value commitment the revenue is recognized over the residual value commitment period.
Services include sale of spare parts, maintenance services and other aftermarket products. Revenue is recognized when the control of the service has been transferred to the customer which is when the customer can benefit from the use of the delivered services. For spare parts, revenue is normally recognized at one point in time and for maintenance services and other aftermarket products, revenue is normally recognized over time. When payments for maintenance contracts are received in advance from the customers, the payments are recognized as contract liabilities.
NOTE 4 | ACQUISITIONS AND DIVESTMENTS
Acquisitions and divestments The Volvo Group has not made any acquisitions or divestments of operations during the first quarter that have had a significant impact on the Volvo Group.
Assets and liabilities held for sale At the end of first quarter assets amounting to SEK 432 M are classified as held for sale, which is an increase of SEK 381 M compared to December 31, 2017. Assets and liabilities held for sale has increased in the first quarter mainly due to the planned divestment of a subsidiary that holds the Groups shares in Inner Mongolia North Hauler Joint Stock Co., Ltd (NHL).
25
Report on the first quarter 2018
NOTE 5 | CURRENCY AND FINANCIAL INSTRUMENTS
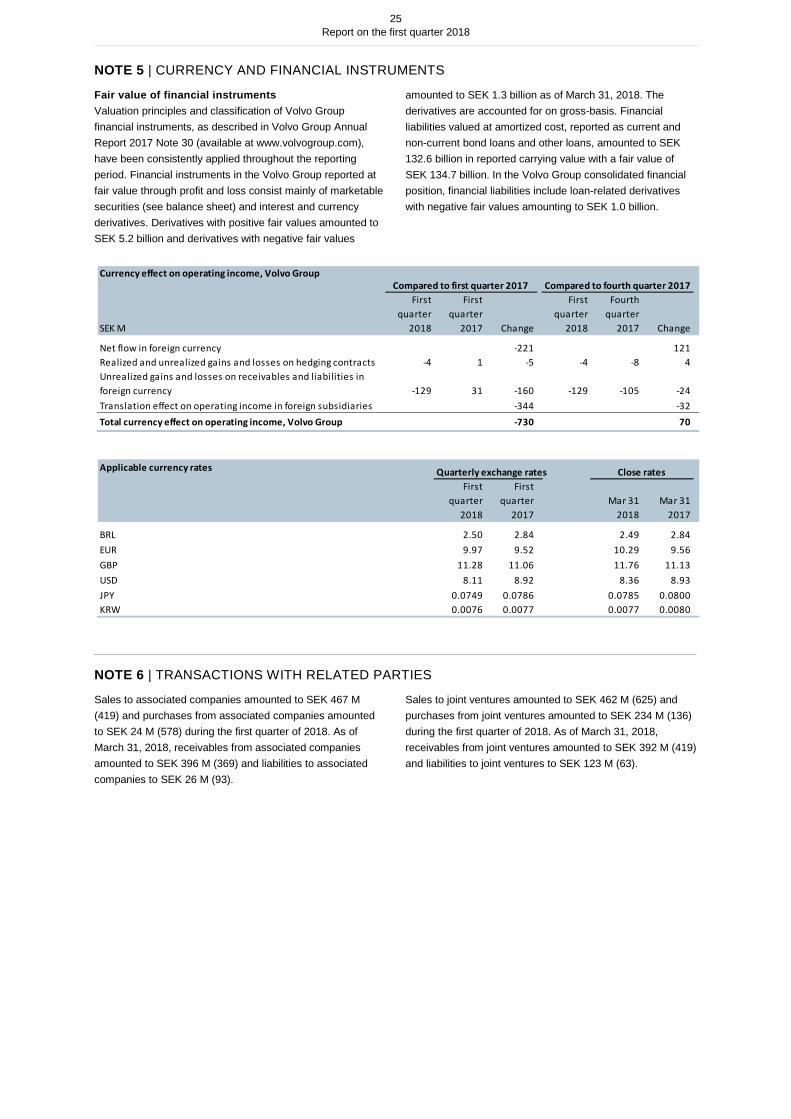
Fair value of financial instruments Valuation principles and classification of Volvo Group financial instruments, as described in Volvo Group Annual Report 2017 Note 30 (available at www.volvogroup.com), have been consistently applied throughout the reporting period. Financial instruments in the Volvo Group reported at fair value through profit and loss consist mainly of marketable securities (see balance sheet) and interest and currency derivatives. Derivatives with positive fair values amounted to SEK 5.2 billion and derivatives with negative fair values
amounted to SEK 1.3 billion as of March 31, 2018. The derivatives are accounted for on gross-basis. Financial liabilities valued at amortized cost, reported as current and non-current bond loans and other loans, amounted to SEK 132.6 billion in reported carrying value with a fair value of SEK 134.7 billion. In the Volvo Group consolidated financial position, financial liabilities include loan-related derivatives with negative fair values amounting to SEK 1.0 billion.
NOTE 6 | TRANSACTIONS WITH RELATED PARTIES
Sales to associated companies amounted to SEK 467 M (419) and purchases from associated companies amounted to SEK 24 M (578) during the first quarter of 2018. As of March 31, 2018, receivables from associated companies amounted to SEK 396 M (369) and liabilities to associated companies to SEK 26 M (93).
Sales to joint ventures amounted to SEK 462 M (625) and purchases from joint ventures amounted to SEK 234 M (136) during the first quarter of 2018. As of March 31, 2018, receivables from joint ventures amounted to SEK 392 M (419) and liabilities to joint ventures to SEK 123 M (63).
Currency effect on operating income, Volvo Group
SEK M
First quarter
2018
First quarter
2017 Change
First quarter
2018
Fourth quarter
2017 Change
Net flow in foreign currency -221 121Realized and unrealized gains and losses on hedging contracts -4 1 -5 -4 -8 4Unrealized gains and losses on receivables and liabilities in foreign currency -129 31 -160 -129 -105 -24Translation effect on operating income in foreign subsidiaries -344 -32Total currency effect on operating income, Volvo Group -730 70
Applicable currency rates Quarterly exchange rates First
quarter 2018
First quarter
2017Mar 31
2018Mar 31
2017
BRL 2.50 2.84 2.49 2.84EUR 9.97 9.52 10.29 9.56GBP 11.28 11.06 11.76 11.13USD 8.11 8.92 8.36 8.93JPY 0.0749 0.0786 0.0785 0.0800KRW 0.0076 0.0077 0.0077 0.0080
Compared to first quarter 2017 Compared to fourth quarter 2017
Close rates
26
Report on the first quarter 2018
NOTE 7 | RECONCILIATION OF ADJUSTED OPERATING INCOME
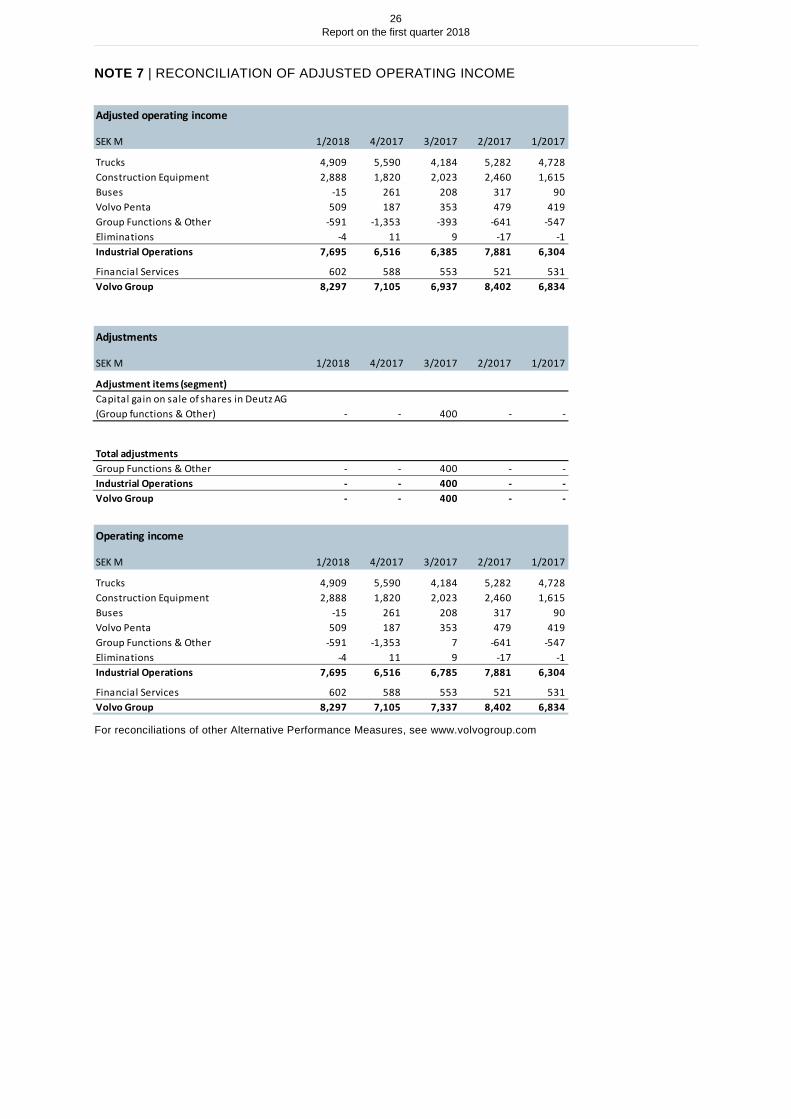
For reconciliations of other Alternative Performance Measures, see www.volvogroup.com
Adjusted operating income
SEK M 1/2018 4/2017 3/2017 2/2017 1/2017
Trucks 4,909 5,590 4,184 5,282 4,728 Construction Equipment 2,888 1,820 2,023 2,460 1,615 Buses -15 261 208 317 90 Volvo Penta 509 187 353 479 419 Group Functions & Other -591 -1,353 -393 -641 -547 Eliminations -4 11 9 -17 -1 Industrial Operations 7,695 6,516 6,385 7,881 6,304
Financial Services 602 588 553 521 531 Volvo Group 8,297 7,105 6,937 8,402 6,834
Adjustments
SEK M 1/2018 4/2017 3/2017 2/2017 1/2017
Adjustment items (segment)Capital gain on sale of shares in Deutz AG (Group functions & Other) - - 400 - -
Total adjustments Group Functions & Other - - 400 - - Industrial Operations - - 400 - - Volvo Group - - 400 - -
Operating income
SEK M 1/2018 4/2017 3/2017 2/2017 1/2017
Trucks 4,909 5,590 4,184 5,282 4,728 Construction Equipment 2,888 1,820 2,023 2,460 1,615 Buses -15 261 208 317 90 Volvo Penta 509 187 353 479 419 Group Functions & Other -591 -1,353 7 -641 -547 Eliminations -4 11 9 -17 -1 Industrial Operations 7,695 6,516 6,785 7,881 6,304
Financial Services 602 588 553 521 531 Volvo Group 8,297 7,105 7,337 8,402 6,834
27
Report on the first quarter 2018
PARENT COMPANY
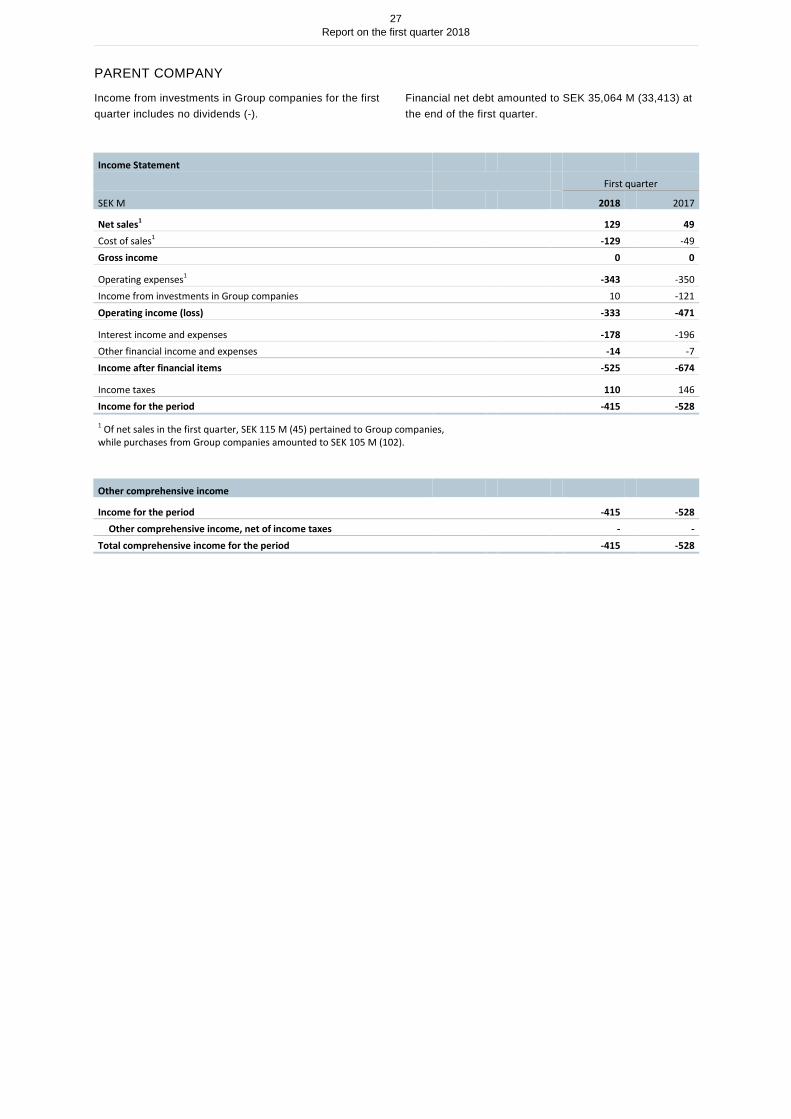
Income from investments in Group companies for the first quarter includes no dividends (-).
Financial net debt amounted to SEK 35,064 M (33,413) at the end of the first quarter.
Income Statement
First quarter
SEK M 2018 2017
Net sales1 129 49 Cost of sales1 -129 -49 Gross income 0 0
Operating expenses1 -343 -350 Income from investments in Group companies 10 -121 Operating income (loss) -333 -471
Interest income and expenses -178 -196 Other financial income and expenses -14 -7 Income after financial items -525 -674
Income taxes 110 146 Income for the period -415 -528
1 Of net sales in the first quarter, SEK 115 M (45) pertained to Group companies, while purchases from Group companies amounted to SEK 105 M (102).
Other comprehensive income
Income for the period -415 -528 Other comprehensive income, net of income taxes - -
Total comprehensive income for the period -415 -528
28
Report on the first quarter 2018
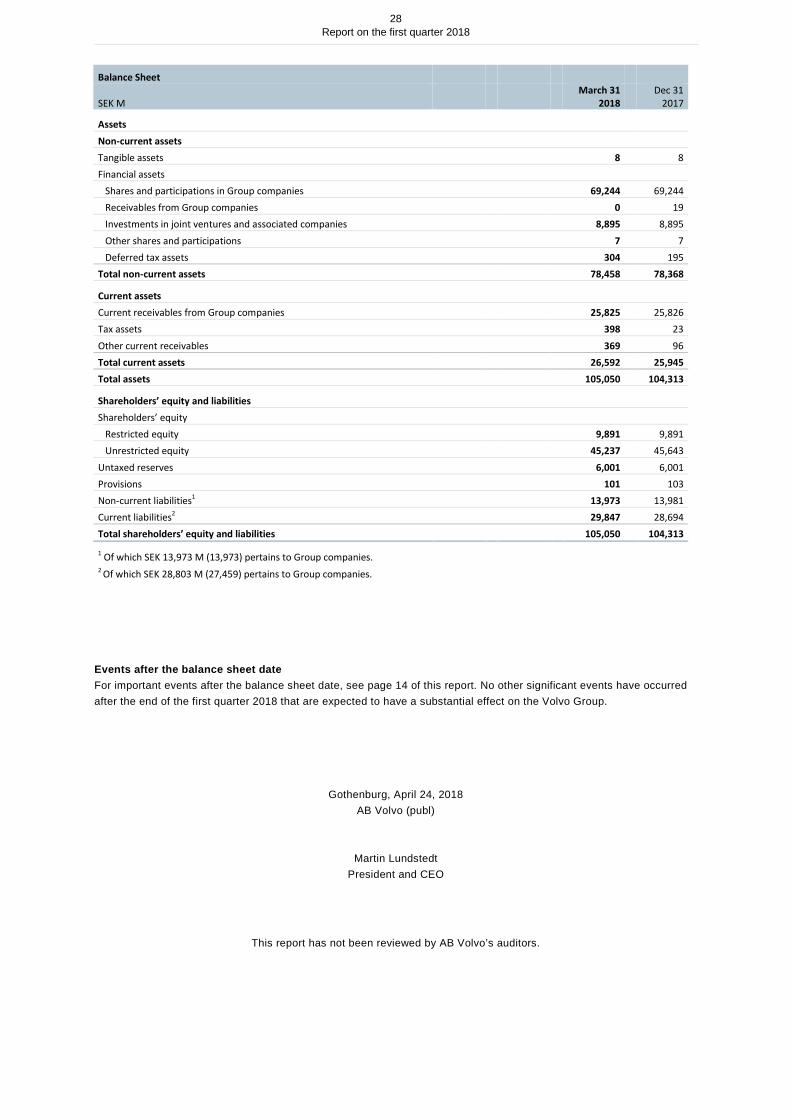
Balance Sheet
SEK M March 31
2018 Dec 31
2017
Assets Non-current assets Tangible assets 8 8 Financial assets Shares and participations in Group companies 69,244 69,244 Receivables from Group companies 0 19 Investments in joint ventures and associated companies 8,895 8,895 Other shares and participations 7 7 Deferred tax assets 304 195 Total non-current assets 78,458 78,368
Current assets Current receivables from Group companies 25,825 25,826 Tax assets 398 23 Other current receivables 369 96 Total current assets 26,592 25,945 Total assets 105,050 104,313
Shareholders’ equity and liabilities Shareholders’ equity Restricted equity 9,891 9,891 Unrestricted equity 45,237 45,643 Untaxed reserves 6,001 6,001 Provisions 101 103 Non-current liabilities1 13,973 13,981 Current liabilities2 29,847 28,694 Total shareholders’ equity and liabilities 105,050 104,313
1 Of which SEK 13,973 M (13,973) pertains to Group companies. 2 Of which SEK 28,803 M (27,459) pertains to Group companies.
Events after the balance sheet date For important events after the balance sheet date, see page 14 of this report. No other significant events have occurred after the end of the first quarter 2018 that are expected to have a substantial effect on the Volvo Group.
Gothenburg, April 24, 2018 AB Volvo (publ)
Martin Lundstedt President and CEO
This report has not been reviewed by AB Volvo’s auditors.
29
Report on the first quarter 2018
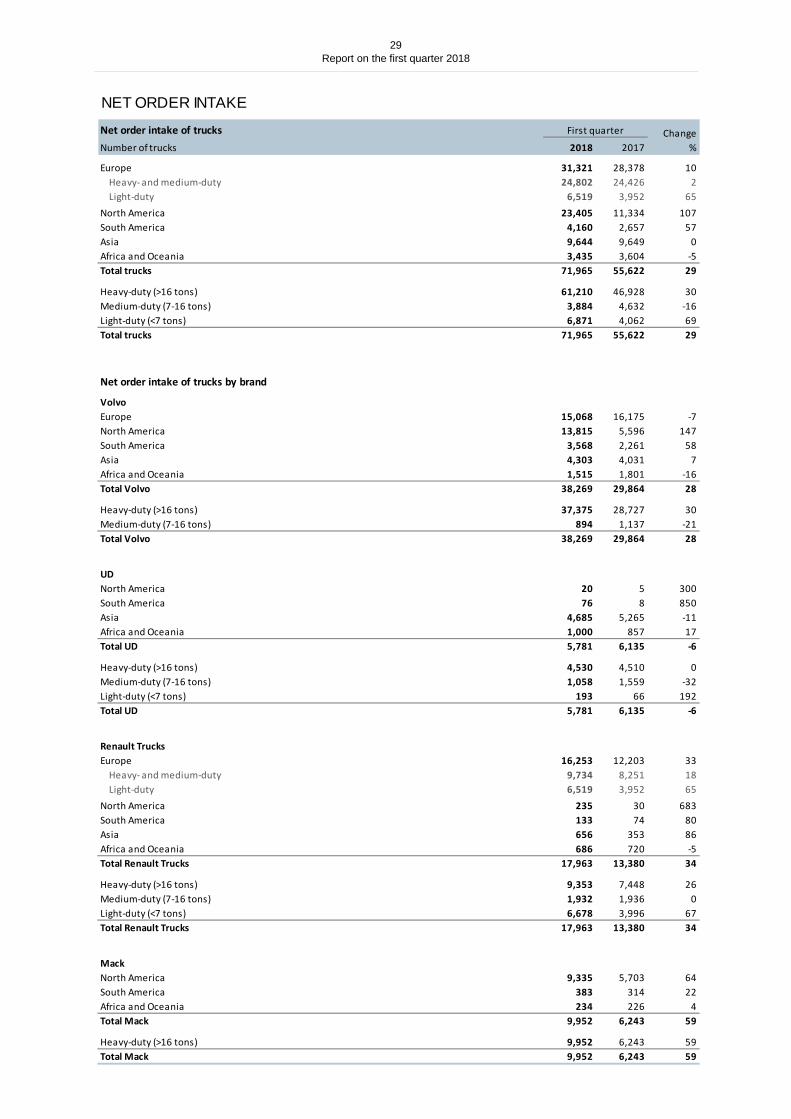
NET ORDER INTAKE
Net order intake of trucks Number of trucks 2018 2017
Europe 31,321 28,378 10Heavy- and medium-duty 24,802 24,426 2Light-duty 6,519 3,952 65
North America 23,405 11,334 107South America 4,160 2,657 57Asia 9,644 9,649 0Africa and Oceania 3,435 3,604 -5Total trucks 71,965 55,622 29
Heavy-duty (>16 tons) 61,210 46,928 30Medium-duty (7-16 tons) 3,884 4,632 -16Light-duty (<7 tons) 6,871 4,062 69Total trucks 71,965 55,622 29
Net order intake of trucks by brand
Volvo Europe 15,068 16,175 -7North America 13,815 5,596 147South America 3,568 2,261 58Asia 4,303 4,031 7Africa and Oceania 1,515 1,801 -16Total Volvo 38,269 29,864 28
Heavy-duty (>16 tons) 37,375 28,727 30Medium-duty (7-16 tons) 894 1,137 -21Total Volvo 38,269 29,864 28
UD North America 20 5 300South America 76 8 850Asia 4,685 5,265 -11Africa and Oceania 1,000 857 17Total UD 5,781 6,135 -6
Heavy-duty (>16 tons) 4,530 4,510 0Medium-duty (7-16 tons) 1,058 1,559 -32Light-duty (<7 tons) 193 66 192Total UD 5,781 6,135 -6
Renault Trucks Europe 16,253 12,203 33
Heavy- and medium-duty 9,734 8,251 18Light-duty 6,519 3,952 65
North America 235 30 683South America 133 74 80Asia 656 353 86Africa and Oceania 686 720 -5Total Renault Trucks 17,963 13,380 34
Heavy-duty (>16 tons) 9,353 7,448 26Medium-duty (7-16 tons) 1,932 1,936 0Light-duty (<7 tons) 6,678 3,996 67Total Renault Trucks 17,963 13,380 34
Mack North America 9,335 5,703 64South America 383 314 22Africa and Oceania 234 226 4Total Mack 9,952 6,243 59
Heavy-duty (>16 tons) 9,952 6,243 59Total Mack 9,952 6,243 59
First quarter Change%
30
Report on the first quarter 2018
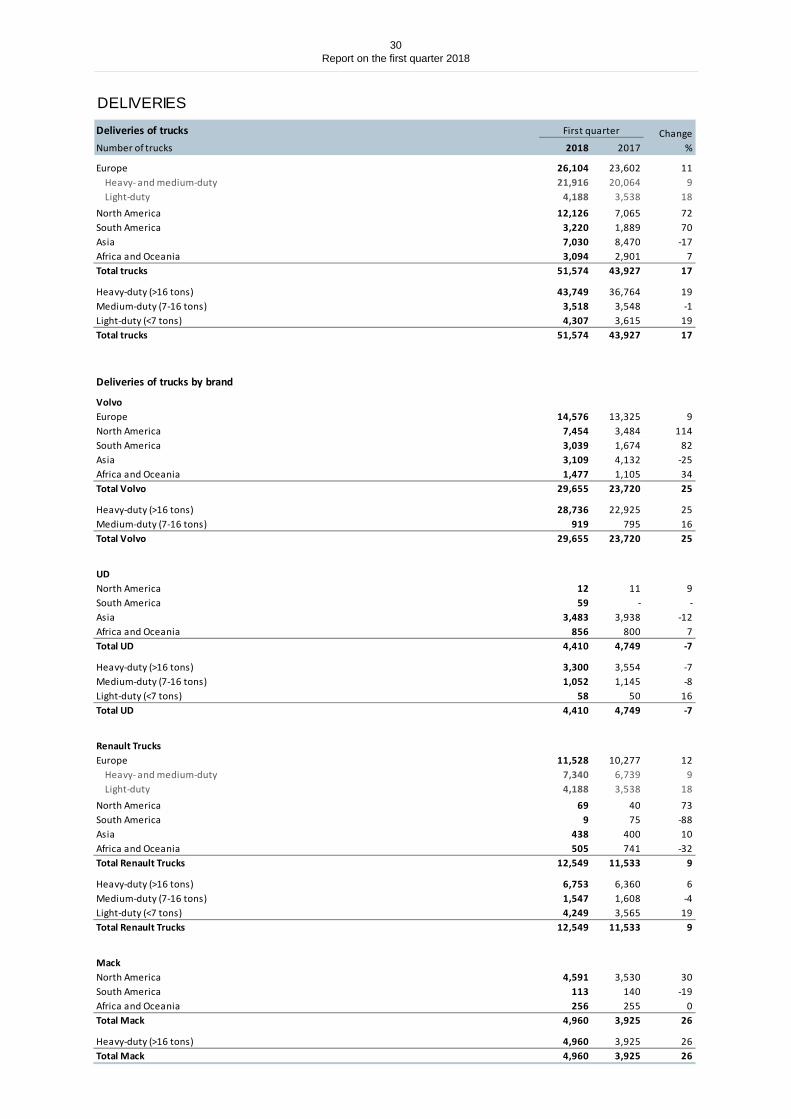
DELIVERIES
Deliveries of trucks Number of trucks 2018 2017
Europe 26,104 23,602 11Heavy- and medium-duty 21,916 20,064 9Light-duty 4,188 3,538 18
North America 12,126 7,065 72South America 3,220 1,889 70Asia 7,030 8,470 -17Africa and Oceania 3,094 2,901 7Total trucks 51,574 43,927 17
Heavy-duty (>16 tons) 43,749 36,764 19Medium-duty (7-16 tons) 3,518 3,548 -1Light-duty (<7 tons) 4,307 3,615 19Total trucks 51,574 43,927 17
Deliveries of trucks by brand
Volvo Europe 14,576 13,325 9North America 7,454 3,484 114South America 3,039 1,674 82Asia 3,109 4,132 -25Africa and Oceania 1,477 1,105 34Total Volvo 29,655 23,720 25
Heavy-duty (>16 tons) 28,736 22,925 25Medium-duty (7-16 tons) 919 795 16Total Volvo 29,655 23,720 25
UD North America 12 11 9South America 59 - -Asia 3,483 3,938 -12Africa and Oceania 856 800 7Total UD 4,410 4,749 -7
Heavy-duty (>16 tons) 3,300 3,554 -7Medium-duty (7-16 tons) 1,052 1,145 -8Light-duty (<7 tons) 58 50 16Total UD 4,410 4,749 -7
Renault Trucks Europe 11,528 10,277 12
Heavy- and medium-duty 7,340 6,739 9Light-duty 4,188 3,538 18
North America 69 40 73South America 9 75 -88Asia 438 400 10Africa and Oceania 505 741 -32Total Renault Trucks 12,549 11,533 9
Heavy-duty (>16 tons) 6,753 6,360 6Medium-duty (7-16 tons) 1,547 1,608 -4Light-duty (<7 tons) 4,249 3,565 19Total Renault Trucks 12,549 11,533 9
Mack North America 4,591 3,530 30South America 113 140 -19Africa and Oceania 256 255 0Total Mack 4,960 3,925 26
Heavy-duty (>16 tons) 4,960 3,925 26Total Mack 4,960 3,925 26
First quarter Change%
31
Report on the first quarter 2018
This information is information that AB Volvo (publ) is obliged to make public pursuant to the EU Market Abuse Regulation. The information was submitted for publication, through the agency of the contact person set out in the press release concerning this report, at 7.20 CET on April 24, 2018. This report contains forward-looking statements that reflect the Board of Directors’ and management’s current views with respect to certain future events and potential financial performance. Although the Board of Directors and the management believe that the expectations reflected in such forward-looking statements are reasonable, no assurance can be given that such expectations will prove to have been correct. Accordingly, results could differ materially from those set out in the forward-looking statements as a result of, among other factors, (i) changes in economic, market and competitive conditions, (ii) success of business and operating initiatives, (iii) changes in the regulatory environment and other government actions, (iv) fluctuations in exchange rates and (v) business risk management. This report does not imply that the Company has undertaken to revise these forward-looking statements, beyond what is required under the company’s registration contract with Nasdaq Stockholm, if and when circumstances arise that will lead to changes compared to the date when these statements were provided.
Financial calendar
Report on the second quarter 2018 July 19, 2018
Report on the third quarter 2018 October 19, 2018
Report on the fourth quarter 2018 January 30, 2019
Contacts
Media relations:
Joakim Kenndal +46 31 323 72 29
Investor Relations:
Christer Johansson +46 31 66 13 34
Anders Christensson +46 31 66 11 91
Aktiebolaget Volvo (publ) 556012–5790 Investor Relations, VHQ SE-405 08 Göteborg, Sweden Tel +46 31 66 00 00 www.volvogroup.com