Embed Size (px)
Citation preview
Report on the Effects of Wildfire on Drinking Water Utilities and Effective Practices for Wildfire Risk Reduction and Mitigation

Report on the Effects of Wildfire on Drinking Water Utilities and Effective Practices for Wildfire Risk Reduction and Mitigation
August 2013
Prepared by: Chi Ho Sham, Mary Ellen Tuccillo, and Jaime Rooke The Cadmus Group, Inc. 100 5th Ave., Suite 100 Waltham, MA 02451 Jointly Sponsored by: Water Research Foundation 6666 West Quincy Avenue, Denver, CO 80235-3098 and U.S. Environmental Protection Agency Washington, D.C. Published by: [Insert WaterRF logo]

DISCLAIMER
This study was jointly funded by the Water Research Foundation (Foundation) and the U.S. Environmental Protection Agency (USEPA). The Foundation and USEPA assume no
responsibility for the content of the research study reported in this publication or for the opinions or statements of fact expressed in the report. The mention of trade names for commercial
products does not represent or imply the approval or endorsement of either the Foundation or USEPA. This report is presented solely for informational purposes
Copyright © 2013 by Water Research Foundation
ALL RIGHTS RESERVED.
No part of this publication may be copied, reproduced or otherwise utilized without permission.
ISBN [inserted by the Foundation]
Printed in the U.S.A.

v
CONTENTS
DISCLAIMER.............................................................................................................................. iv
CONTENTS................................................................................................................................... v
LIST OF TABLES ....................................................................................................................... ix
LIST OF FIGURES ..................................................................................................................... xi
FOREWORD.............................................................................................................................. xiii
ACKNOWLEDGMENTS .......................................................................................................... xv
LIST OF ACRONYMS ............................................................................................................ xvii
EXECUTIVE SUMMARY ....................................................................................................... xix
Chapter 1 INTRODUCTION ...................................................................................................... 1 Project Methodology ...................................................................................................... 1
Literature Review ............................................................................................... 1 Wildfire Impact Survey ...................................................................................... 2 Wildfire Readiness and Response Workshop .................................................... 2
Report Overview ............................................................................................................ 3
Chapter 2 LITERATURE REVIEW ON THE IMPACTS OF WILDFIRE .......................... 5 Vulnerability of Ecosystems to Wildfires ...................................................................... 5
Methodology and Factors Affecting Vulnerability ............................................ 5 Vulnerability Studies .......................................................................................... 8
Mitigating the Risk of Wildfires to Water Systems ....................................................... 9 Quantification of Vulnerability of Water Systems ............................................. 9 Emergency Preparedness and Response Plans ................................................. 10 Factors Affecting Vulnerability ....................................................................... 11
Source Water Protection and Forest Management Measures ....................................... 12 Tools for Source Water Protection and Forest Management ........................... 13 Community Wildfire Protection Plans ............................................................. 13 Examples of Organized Efforts and Wildfire Mitigation Plans ....................... 14 Funding Sources for Source Water Protection and Forest Management ......... 15
Water Quality Effects of Wildfires .............................................................................. 16 Nutrients ........................................................................................................... 16 Organic Carbon ................................................................................................ 19 Other Chemical Constituents ........................................................................... 19 Suspended Sediments and Turbidity ................................................................ 20 Effects of Fire Retardant Chemicals ................................................................ 21
Hydrologic Effects, Sediment Yields, and Debris Flows ............................................. 21 Total Runoff ..................................................................................................... 22 Peak Flows ....................................................................................................... 23

Sediment Mobilization ..................................................................................... 25 Debris Flows .................................................................................................... 26
Implications for Drinking Water Supply and Treatment .............................................. 27 Reservoir Sedimentation .................................................................................. 28 Water Quality ................................................................................................... 28
Watershed and Water Quality Recovery ...................................................................... 30 Post-Fire Monitoring ........................................................................................ 31
Watershed Rehabilitation ............................................................................................. 33 Emergency Recovery ....................................................................................... 33 BAER Treatments ............................................................................................ 33 Effectiveness of Emergency Rehabilitation Treatments .................................. 34 Funding for Wildfire Rehabilitation ................................................................ 34 Long-term Recovery ........................................................................................ 35
Summary ...................................................................................................................... 35
Chapter 3 SURVEY ON THE IMPACTS OF WILDFIRE ON DRINKING WATER SYSTEMS .................................................................................................................................... 37
Wildfires And Survey Respondents ............................................................................. 37 Mitigating The Risk Of Wildfire .................................................................................. 40
Wildfire Hazard Assessments .......................................................................... 40 Watershed-based Risk Mitigation Activities ................................................... 42 Infrastructure-based Risk Mitigation Activities ............................................... 45
Potential Challenges To Conducting Watershed Wildfire Mitigation Activities ......... 46 Coordination and Collaboration ....................................................................... 46 Permits ............................................................................................................. 48 Strategic Partnerships and Communication ..................................................... 48 Wildfire Risk Mitigation Best Practices .......................................................... 51
Costs Associated With Watershed Risk Mitigation Activities ..................................... 52 Funding Watershed Risk Mitigation Activities................................................ 52 Leveraging Funding through Partnerships ....................................................... 53 Leveraging Funding in Australia and Canada .................................................. 54 Funding Drinking Water Infrastructure Risk Reduction/Relocation Activities55
Damages Resulting from Wildfire ............................................................................... 55 Adapting to Changes Caused by Wildfires ...................................................... 57
Emergency Preparedness in the Event of a Wildfire .................................................... 59 Preparedness Plans ........................................................................................... 59 Fire Suppression Equipment ............................................................................ 61
Summary ...................................................................................................................... 61 Wildfire Risk Mitigation .................................................................................. 61 Challenges to Conducing Wildfire Mitigation ................................................. 62 Collaboration and Partnership .......................................................................... 62
Chapter 4 WILDFIRE READINESS AND RESPONSE WORKSHOP ............................... 63 Workshop Preparation .................................................................................................. 63 Wildfire Readiness and Response Workshop .............................................................. 63
Day 1 ................................................................................................................ 64 Day 2 ................................................................................................................ 64

vii
Recommendations ........................................................................................................ 65
Appendix A: Workshop Summary ............................................................................................ 67
Appendix B: Wildfire Survey .................................................................................................... 81
References .................................................................................................................................... 91


ix
LIST OF TABLES
Table 2-1 Criteria for determining potential soil erodibility .......................................................... 7
Table 2-2 A summary of the changes in hydrologic processes caused by wildfires .................... 22
Table 2-3 Effects of harvesting and fire on peakflows. ................................................................ 24
Table 2-4 Summary of monitoring design for each priority management question ..................... 32
Table 3-1 Summary of drinking water utilities represented by survey respondents ..................... 38
Table 3-2 Populations served by drinking water utilities that reported effects from wildfires .... 38
Table 3-3 Wildfires that affected survey respondents .................................................................. 39
Table 3-4 Interviewed drinking water utilities .............................................................................. 40
Table 3-5 Funding sources for watershed risk mitigation activities – U.S. respondents .............. 52
Table 3-6 Funding sources for watershed risk mitigation activities – Australian and Canadian respondents ....................................................................................................................... 55


xi
LIST OF FIGURES
Figure 2-1 Predicted post-fire erosion one year after wildfire ........................................................ 8
Figure 2-2 General scheme for vulnerability analysis and mitigation measures .......................... 11
Figure 2-3 Stream discharge at 5-minute intervals and selected water quality characteristics in 2010–2011 measured in Fourmile Creek, Colorado ......................................................... 18
Figure 2-4 Effects of a post-fire debris flow ................................................................................. 27
Figure 3-1 FlamMap 5.0 logo (left) and FlamMap simulation of fire burns around a filled barrier (right) ................................................................................................................................ 41
Figure 3-2 Precautions taken to reduce watershed's risk to wildfire ............................................ 43
Figure 3-3 Lexington Hills community hazard rating map .......................................................... 45
Figure 3-4 Precautions to reduce the risk of wildfire to drinking water infrastructure ................ 46
Figure 3-5 Collaboration entities for reducing wildfire risk and assisting in recovery after a wildfire .............................................................................................................................. 49
Figure 3-6: Damages sustained by drinking water utilities during a wildfire ............................... 56
Figure 3-7 Short term and long term impacts resulting from wildfire .......................................... 57
Figure 3-8 Water intake following wildfire sedimentation ........................................................... 58
Figure 3-9 Steps taken to ensure the delivery of water to customers in the event of a wildfire ... 59


xiii
FOREWORD
The Water Research Foundation (Foundation) is a nonprofit corporation dedicated to the development and implementation of scientifically sound research designed to help drinking water utilities respond to regulatory requirements and address high-priority concerns. The Foundation’s research agenda is developed through a process of consultation with Foundation subscribers and other drinking water professionals. The Foundation’s Board of Trustees and other professional volunteers help prioritize and select research projects for funding based upon current and future industry needs, applicability, and past work. The Foundation sponsors research projects through the Focus Area, Emerging Opportunities, and Tailored Collaboration programs, as well as various joint research efforts with organizations such as the U.S. Environmental Protection Agency and the U.S. Bureau of Reclamation.
This publication is a result of a research project fully funded or funded in part by Foundation subscribers. The Foundation’s subscription program provides a cost-effective and collaborative method for funding research in the public interest. The research investment that underpins this report will intrinsically increase in value as the findings are applied in communities throughout the world. Foundation research projects are managed closely from their inception to the final report by the staff and a large cadre of volunteers who willingly contribute their time and expertise. The Foundation provides planning, management, and technical oversight and awards contracts to other institutions such as drinking water utilities, universities, and engineering firms to conduct the research.
A broad spectrum of water supply issues is addressed by the Foundation's research agenda, including resources, treatment and operations, distribution and storage, water quality and analysis, toxicology, economics, and management. The ultimate purpose of the coordinated effort is to assist water suppliers to provide a reliable supply of safe and affordable drinking water to consumers. The true benefits of the Foundation’s research are realized when the results are implemented at the utility level. The Foundation's staff and Board of Trustees are pleased to offer this publication as a contribution toward that end.
Roy L. Wolfe, Ph.D. Robert C. Renner, P.E. Chair, Board of Trustees Executive Director Water Research Foundation Water Research Foundation

xv
ACKNOWLEDGMENTS
The authors of this report would like to express our thanks to the U.S. Environmental Protection Agency (USEPA) Source Water Protection Program and Urban Waters Federal Partnership and Water Research Foundation (Foundation) for funding this project. We especially would like to thank Kenan Ozekin, the Foundation’s Project Manager, for his guidance and assistance through each stage of the project. In addition, we would like to thank the drinking water utilities that participated in the workshop/survey and provided input for this report.
In particular, we would like to thank the following drinking water utilities for providing
interviews to enhance the survey: City of Boulder Utilities Division, CO.; East Bay Municipal Utility District, CA.; Medford Water Commission, OR.; City of Santa Cruz, CA.; San Jose Water Company, CA. Additionally, the following drinking water utilities provided survey responses and, in some cases, photographs to enhance this report:
Board of Water Works of Pueblo, Colo. Denver Water, Colo. City of Fort Collins Utilities, Colo. Gippsland Water, Victoria, Australia Town of Golden, British Columbia,
Canada City of Golden, Colo. Goulburn Valley Water, Victoria,
Australia City of Gresham Water Division, Ore. Halifax Regional Water Commission,
Nova Scotia, Canada Irvine Ranch Water District, Calif. North Marin Water District, Calif. City of Phoenix, Ariz.
City of Seattle Public Utilities, Wash. South East Kelowna Irrigation District,
British Columbia, Canada Sydney Catchment Authority, New South
Wales, Australia Tacoma Water, Wash. Topaz Ranch Estates General
Improvement District, Nev. Truckee Meadows Water Authority, Nev. Vancouver Island Health Authority,
British Columbia, Canada Washoe County Health District, Nev. Washoe County Department of Water
Resources, Nev.
The author would also like to thank the individuals who contributed their time to aid in
the development of the literature review, including Polly Hayes (U.S. Forest Service), Penny Luehring (U.S. Forest Service), Frank McCormick (U.S. Forest Service), and Don Kennedy (Denver Water).
In addition, the author would like to thank those who contributed to the success of the
workshop, including the individuals on the workshop steering committee: Darcy Campbell (USEPA Region 8), Polly Hayes (U.S. Forest Service), Don Kennedy (Denver Water), Michael Wallis (East Bay Municipal Utility District), Amy LaBarge (Seattle Public Utilities), Djanette Khiari (Water Research Foundation), Shonnie Cline (Water Research Foundation), and Mary Smith (Water Research Foundation).

xvi
Furthermore, the following participants presented during the workshop:
Kevin R. Gertig, City of Fort Collins Utilities, Colo.
Dick Fleishman, Four Forest Restoration Initiative, Ariz.
Brad Piehl, JW Associates Monica B. Emelko, University of
Waterloo, Ontario, Canada Fernando L. Rosario-Ortiz, University of
Colorado
Deborah Martin, U.S. Geological Survey Carol Ekarius, Coalition for the Upper
South Platte, Colo. Don Kennedy, Denver Water, Colo. Penny Luehring, U.S. Forest Service,
National BAER & Watershed Improvement Program
Felicity Broennan, Santa Fe Watershed Association, NM
Finally, Kelsey Wallace and Chris Herlich at The Cadmus Group generously contributed their time, thought, and efforts on this project. Kelsey also took notes and developed the workshop summary. Special thanks also to Patrick Field at the Consensus Building Institute for facilitating the workshop so effectively.

xvii
LIST OF ACRONYMS
ANC Acid Neutralizing Capacity
AWWA American Water Works Association
BAER Burned Area Emergency Response
BAER VAR Burned Area Emergency Response Values at Risk
BLM Bureau Of Land Management
CAL FIRE California Department of Forestry and Fire Protection
CBI Consensus Building Institute
CDF California Department of Forestry and Fire Protection
CRAM California's Rapid Assessment Methodology
CSFS Colorado State Forest Service
CWPP Community Wildfire Protection Plan
DBPS Disinfection By-products
DOC Dissolved Organic Carbon
EBMUD East Bay Municipal Utility District
ERMIT Erosion Risk Management Tool
EWP Emergency Watershed Protection
FOFEM First Order Fire Effects Model
FORWARD Forest Watershed and Riparian Disturbance
GEOWEPP Geospatial Interface For The Water Erosion Prediction Project
GIS Geographic Information Systems
HFRA Healthy Forests Restoration Act
HUCS Hydrologic Unit Code
IBI Index of Biotic Integrity
LIDAR Light Detection and Ranging
MS4 Municipal Separate Storm Sewer System
MWC Medford Water Commission
NGO Non-governmental Organization
NMFS National Marine Fisheries Service
NRCS Natural Resources Conservation Service
NTMP Non-industrial Timber Management Plan
NTU Nephelometric Turbidity Units
xviii
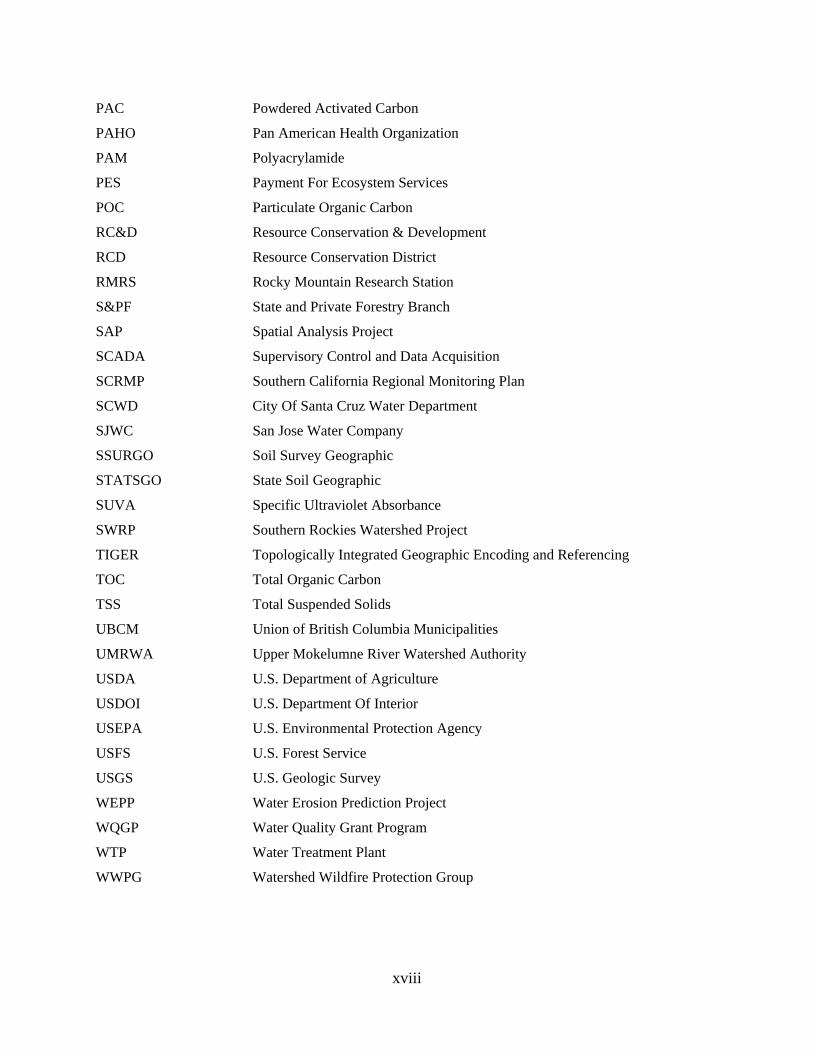
PAC Powdered Activated Carbon
PAHO Pan American Health Organization
PAM Polyacrylamide
PES Payment For Ecosystem Services
POC Particulate Organic Carbon
RC&D Resource Conservation & Development
RCD Resource Conservation District
RMRS Rocky Mountain Research Station
S&PF State and Private Forestry Branch
SAP Spatial Analysis Project
SCADA Supervisory Control and Data Acquisition
SCRMP Southern California Regional Monitoring Plan
SCWD City Of Santa Cruz Water Department
SJWC San Jose Water Company
SSURGO Soil Survey Geographic
STATSGO State Soil Geographic
SUVA Specific Ultraviolet Absorbance
SWRP Southern Rockies Watershed Project
TIGER Topologically Integrated Geographic Encoding and Referencing
TOC Total Organic Carbon
TSS Total Suspended Solids
UBCM Union of British Columbia Municipalities
UMRWA Upper Mokelumne River Watershed Authority
USDA U.S. Department of Agriculture
USDOI U.S. Department Of Interior
USEPA U.S. Environmental Protection Agency
USFS U.S. Forest Service
USGS U.S. Geologic Survey
WEPP Water Erosion Prediction Project
WQGP Water Quality Grant Program
WTP Water Treatment Plant
WWPG Watershed Wildfire Protection Group

xix
EXECUTIVE SUMMARY
OBJECTIVES
Although wildfire is an integral part of a healthy environment, it can have significant impacts on the drinking water industry due to its widespread effects on source water quality and associated treatment needs. In an effort to promote a more complete understanding of these effects and the steps drinking water utilities can take to mitigate wildfire risk and damage to their infrastructure and watershed, The Cadmus Group, Inc. (Cadmus), with funding from the Water Research Foundation (Foundation) and the U.S. Environmental Protection Agency (USEPA) Source Water Protection Program and Urban Waters Federal Partnership, developed this report, which presents 1) current information on the impacts from wildfires on drinking water utilities and 2) lessons learned and recommendations for future research that were discussed during the Wildfire Readiness and Response Workshop held in Denver, Colo. April 4-5, 2013.
BACKGROUND
Wildfires can produce dramatic physical and chemical effects on soils and streams, which can translate downstream to negatively affect drinking water utilities. Raw water quality may be degraded from soil erosion, which can increase turbidity, or from added inputs of organic carbon, nutrients, and other constituents. Hydrologic effects in a severely burned watershed can give rise to flooding, increased peak flows, and debris flows. These various effects may necessitate changes to water treatment operations or significant new capital investments (e.g., relocating intakes, dredging reservoirs, or finding new water sources).
APPROACH
The information in this report was collected in three stages: 1) a comprehensive review of literature on wildfire risk mitigation, effects of wildfire on watershed and water systems, and post-fire rehabilitation; 2) a survey administered to drinking water utilities that experienced or are at risk of experiencing effects from wildfire; and 3) materials presented and discussion among experts during a workshop. These efforts focused on developing a comprehensive understanding of wildfires, their effects, and effective practices available for mitigating the risks on water utilities.
RESULTS/CONCULSIONS
Steps to prepare for wildfires can include assessment of the vulnerability of the watershed to wildfire, assessment of the vulnerability of the drinking water system, and development of emergency response plans. A range of options exist for risk reduction, but additional information is needed on source water protection specifically geared towards wildfire risks. Wildfires have a range of both short- and long-term effects on watersheds. In the event of a wildfire, these effects may alter source water quality and quantity enough to require utilities to adjust their treatment processes. More information is needed on appropriate post-fire monitoring strategies for drinking water utilities because they may need water quality information on a more frequent basis than is typically acquired when a watershed is studied. In some instances, effects such as debris flows
xx
may negatively affect infrastructure and may necessitate capital investments. A number of short-term rehabilitation measures may be employed immediately after a fire to help stabilize the land surface. Furthermore, it may be beneficial for utilities to become familiar with available funding sources for both risk mitigation/reduction and watershed rehabilitation.
Through the survey, drinking water utilities indicated that conducting wildfire hazard assessments in their watersheds was an important first step to reducing and mitigating the effects of wildfire. Drinking water utility staff indicated that they were better able to identify serious wildfire risks and develop mitigation plans once they were informed about the risks within their watershed. Survey participants reported that collaboration with other drinking water systems, landowners, non-profit organizations, and local, state, and federal government agencies was a critical aspect of wildfire mitigation. Collaboration helped survey respondents conduct more effective and comprehensive wildfire mitigation activities, expand their knowledge base, and leverage financial resources.
The 1½ day workshop in Denver, Colo. provided a range of participants in the water industry with the opportunity to share lessons learned and best practices for mitigating the impacts of wildfire on water quality and quantity at drinking water systems. During Day 1 of the workshop, various experts gave presentations on 1) assessing and reducing risk of wildfire, 2) characterizing effects of wildfire on water quality and quantity, and 3) evaluating post-fire restoration and management practices. Workshop participants were encouraged to ask questions and gain as much insight on these issues from the presenting panels as possible. During Day 2 of the workshop, a smaller group of participants gathered to reflect on the previous day’s discussions and identify research topics that would be useful for the Foundation or other organizations to pursue in helping the water industry to be more effectively prepared for and recover from wildfire.
RECOMMENDATIONS
The results of this research effort indicate that drinking water utilities have several tools available to them to develop and conduct wildfire risk reduction/mitigation activities as well as to build partnerships and leverage funding to carry out such activities. However, further research is needed to better understand the effects of wildfires on utilities’ source water quality and quantity, and to develop effective wildfire management plans.
The workshop provided the opportunity for water industry representatives and other key stakeholders to share knowledge and lessons learned to promote effective wildfire risk mitigation. It also provided the project team with a more thorough understanding of the challenges drinking water utilities face in the current political/financial climate as well as the research needs that, if pursued, could provide for a more comprehensive understanding of short- and long-term effects of wildfire and the measures that may be taken to mitigate such effects.
This project identified the following topics that merit further research:
Short- and long-term effects of wildfire on drinking water quality, quantity, availability, and treatability
Relative costs, benefits, and effectiveness of various pre- and post-forest management approaches to reducing the risk of wildfire or mitigating the effects on drinking water quality and quantity
Effects of wildfire on drinking water treatment processes

xxi
Effects of wildfire on groundwater-based drinking water supplies Lessons learned from integrating science, policy, politics, and community in water supply
protection and wildfire prevention, emergency response, and long-term response Methods of pricing ecosystem services provided by forests and other ecosystems for
drinking water protection Effective communication for promoting actions for watershed wildfire prevention and
remediation focusing on reducing risk, increasing resiliency, and taking a “no regrets” approach
Long-term (10 years or longer) effects of wildfire on drinking water supplies Information on watershed resiliency to wildfire across various geographies, ecosystems,
and climatic regions.


1
CHAPTER 1 INTRODUCTION
Although wildfire is an integral part of a healthy environment, it can have significant consequences for the drinking water industry due to widespread effects on source water quality and associated treatment needs. Furthermore, the severity and frequency of wildfires in the western U.S. has increased over the past decade due to both long-term fire suppression efforts as well as climate change. In 2012, approximately 43,000 wildfires were reported in the U.S., burning a total of 6.4 million acres.
Wildfires can produce dramatic physical and chemical changes in soils and streams that can translate downstream to negatively affect drinking water utilities. Raw water quality may be degraded from soil erosion, which can increase turbidity, or from added inputs of organic carbon, nutrients, and other constituents. Hydrologic effects in a severely burned watershed can give rise to flooding, increased peak flows, and debris flows. These various effects may necessitate changes in water treatment operations or significant new capital investments (e.g., relocating intakes, dredging reservoirs, or finding new water sources).
In an effort to promote a more complete understanding of these effects and the steps drinking water utilities can take to mitigate the risk of damage to their watersheds and infrastructure, The Cadmus Group, Inc., with funding from the Water Research Foundation (Foundation) and the U.S. Environmental Protection Agency (USEPA) Source Water Protection Program and Urban Waters Federal Partnership developed this report, which presents 1) current information on the effects wildfires may have on drinking water utilities and 2) lessons learned and recommendations for future research that were discussed during the Wildfire Readiness and Response Workshop held in Denver, Colo. on April 4-5, 2013.
PROJECT METHODOLOGY
The information in this report was collected in three stages: 1) a comprehensive review of literature on wildfire risk reduction and mitigation, effects of wildfire on watershed and water systems, and post-fire rehabilitation; 2) a survey administered to drinking water utilities at risk of experiencing effects from wildfire; and 3) materials presented and discussion among experts during a workshop. These efforts focused on developing a comprehensive understanding of wildfires, their effects, and effective practices available for mitigating the risks on water utilities. The following sections provide a brief description of each of these efforts.
Literature Review
A literature review was conducted of available published literature related to pre-fire preparedness, wildfire effects on ecosystems and water systems, post-fire rehabilitation, and funding opportunities. Sources of this literature review included published reports, peer reviewed journals, and gray literature (such as internal agency working reports). Topics discussed include the vulnerability of ecosystems to wildfire, emergency planning approaches for utilities, watershed protection and forest management measures, water quality and hydrologic perturbations that result from wildfire, and post-fire emergency rehabilitation measures and watershed recovery. This literature review was sponsored by the Foundation and the USEPA’s Source Water Protection Program and the Urban Waters Federal Partnership.

2 | Wildfire and Drinking Water Utilities
Wildfire Impact Survey
A survey was developed under the guidance of a Foundation project steering committee with the intention of gathering information regarding drinking water systems’ wildfire risk reduction/mitigation and response activities. This information is intended to serve as guidance for drinking water utilities that are vulnerable to wildfires. Survey respondents included drinking water utilities located both within the U.S. and internationally. Results of the literature review and survey guided the objectives and agenda of a Wildfire Readiness and Response Workshop.
Wildfire Readiness and Response Workshop
The Wildfire Readiness and Response Workshop, conducted by the Foundation, gathered drinking water utility managers and other interested participants to share information about the effects of wildfires on water quality and watershed ecology, as well as how these effects can be mitigated or minimized. Experts from the water industry, academia, and government agencies addressed topics in the following key areas:
1. Assessing and Reducing Risk 2. Effects of Wildfire on Water Quality and Quantity 3. Post-Fire Restoration and Management Practices
The 1½ day workshop was held in April 2013 in Denver, CO. One hundred twelve attendees participated in Day 1 of the workshop, and 25 selected experts from academia, government agencies, and water utilities throughout the U.S. and Canada continued the conversation on Day 2. The workshop was designed to facilitate the exchange of information and ideas on research, experiences, and effective practices among the various participants who are working on wildfire issues and whose operations are affected by wildfires. The specific objectives of the workshop were to:
Evaluate the potential for wildfire in specific source water protection areas Understand the effects of wildfire on water quality Identify and characterize strategies that are effective for mitigating or minimizing
wildfire impacts Assess the implications of land disturbance on water quality and drinking water
treatability Determine the mechanisms and timeframes for watersheds to recover from wildfires Understand challenges faced by drinking water utilities after wildfires and solutions that
have been effective Improve awareness of the effects of fire-fighting techniques on drinking source water
quality Assess strategies for managing and protecting water quality with proven restoration and
management practices Provide case studies of inter-municipal cooperation and management strategies
During this workshop, key members of the water industry, academia, and government
agencies gathered to identify knowledge gaps and make recommendations for future research
Chapter 1: Introduction | 3
topics that could better prepare utilities to deal with wildfires within the context of the fiscal and political challenges they face today.
REPORT OVERVIEW
This report presents the results of the literature review, survey, and workshop introduced above. The literature review is presented in Chapter 2. Chapter 3 presents wildfire risk mitigation and response activities implemented by drinking water utilities as discussed in the survey responses and during the follow-up interviews. Chapter 4 describes the workshop approach, agenda, and recommendations for future research. The survey materials and workshop summary are included in an Appendix at the end of this document.

4 | Wildfire and Drinking Water Utilities

5
CHAPTER 2 LITERATURE REVIEW ON THE IMPACTS OF WILDFIRE
This chapter presents a literature review that covers a number of issues related to anticipated water quality and quantity changes in the event of wildfire, and understanding of the rehabilitation and recovery that will take place after wildfire. The literature review covers: vulnerability of ecosystems to wildfire; mitigating the risk of wildfires to water systems; source water protection and forest management measures; water quality effects of wildfires; hydrologic effects, sediment yields, and debris flows; implications for drinking water supply and treatment; watershed and water quality recovery; and watershed rehabilitation. Sources included published reports, peer reviewed journals, and gray literature such as conference proceedings and technical reports by government agencies.
VULNERABILITY OF ECOSYSTEMS TO WILDFIRES
In response to a series of major wildfires that caused flooding, erosion, and sediment deposition in the watersheds that supply water in the Front Range of Colorado, the Front Range Watershed Protection Data Refinement Working Group was formed. The goals of this group are to develop a methodology to identify watersheds at risk for wildfire and associated flooding and erosion and to prioritize those watersheds that provide or convey water for communities and municipalities. The work done by this group has been useful for Colorado and other areas in the western United States. The methodology developed by the group, which is described below, is an adaptation of methods used by the Pinchot Institute for Conservation.
Methodology and Factors Affecting Vulnerability
The method developed by the Front Range Watershed Protection Data Refinement Working Group (2009) considers four critical components when evaluating the vulnerability of watersheds to disturbances from wildfire: 1) the hazard and risk of a wildfire occurring; 2) the risk of subsequent flooding or debris flow; 3) soil erodibility; and 4) the composite hazard ranking of the watershed. These four components are described in subsections below to illustrate which characteristics of the watershed are important for understanding vulnerability. Forest and soil conditions, as well as weather and the physical configuration of the watershed, can be analyzed to predict erosion and flooding that would be associated with wildfires. To develop a composite hazard ranking of a watershed, the location of critical water supply collection points must be considered with respect to flood and erosion risks (Front Range Watershed Protection Data Refinement Work Group, 2009).
Wildfire Hazard and Risk
The Colorado State Forest Service (CSFS) defines wildfire hazard as the vegetative and topographical features that affect the intensity and rate of spread of a wildfire (Edel, 2002). CSFS developed a formula for assessing the wildfire hazard for a particular region that takes into account quantitative measures, such as the slope and aspect of the land, as well as qualitative rankings based on factors, such as fuel hazard (i.e., the flammability of vegetation in an average burning day) and disturbance regime, which is based on the average return interval. These factors are combined using the following formula:
6 | Wildfire and Drinking Water Utilities
Wildfire Hazard = Fuel Hazard*0.40 + Disturbance Regime*0.35 + Aspect*0.10 + Slope*0.15 The results of this formula are placed into five categories that range from 1 (low) to 5
(high). When evaluating the threat of wildfire in a particular area, this hazard ranking should be
combined with the risk of wildfire ignition, which is determined by road or railroad density and weather. Road and railroad densities are defined as the miles of road and railroad per square mile of watershed area. Road and railroad density is an important contributing factor to wildfire risk because over 90% of all wildfires occur within ½ mile of a road (Morrison, 2007). Critical weather patterns, such as lightning strike frequency in an area, may increase the probability of ignition/extreme fire behavior (Communities Committee et al., 2004).
Flooding or Debris Flow Risk
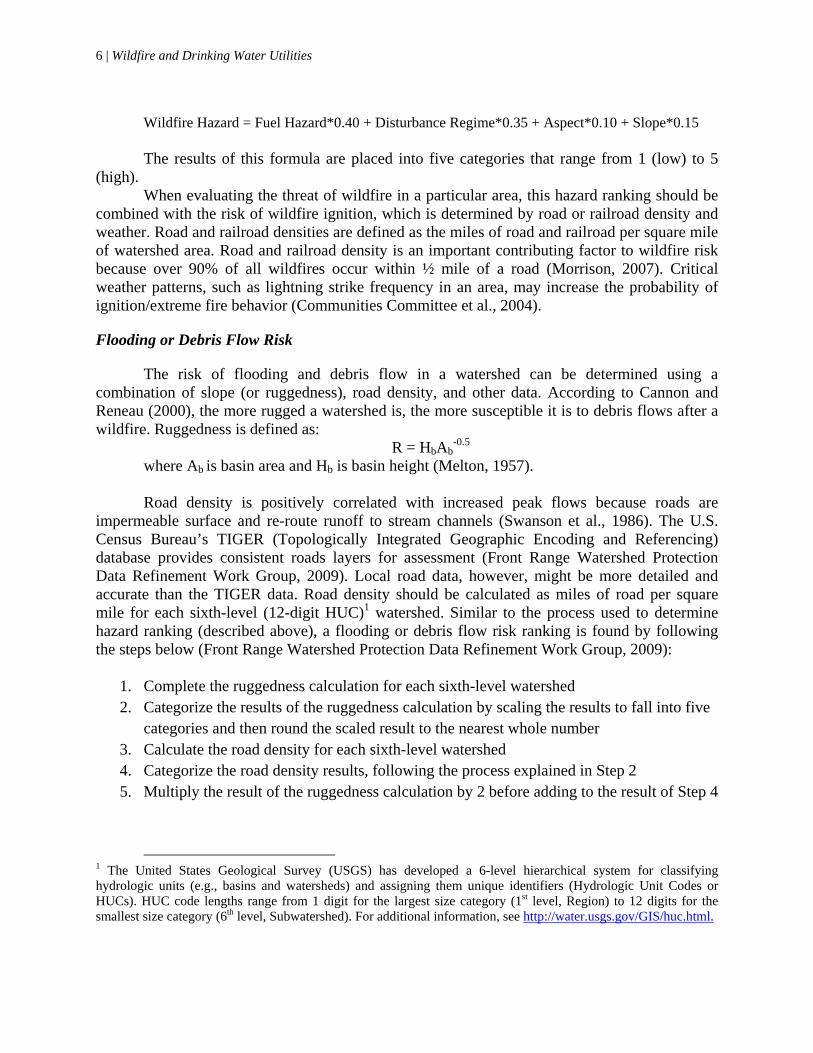
The risk of flooding and debris flow in a watershed can be determined using a combination of slope (or ruggedness), road density, and other data. According to Cannon and Reneau (2000), the more rugged a watershed is, the more susceptible it is to debris flows after a wildfire. Ruggedness is defined as:
R = HbAb-0.5
where Ab is basin area and Hb is basin height (Melton, 1957). Road density is positively correlated with increased peak flows because roads are
impermeable surface and re-route runoff to stream channels (Swanson et al., 1986). The U.S. Census Bureau’s TIGER (Topologically Integrated Geographic Encoding and Referencing) database provides consistent roads layers for assessment (Front Range Watershed Protection Data Refinement Work Group, 2009). Local road data, however, might be more detailed and accurate than the TIGER data. Road density should be calculated as miles of road per square mile for each sixth-level (12-digit HUC)1 watershed. Similar to the process used to determine hazard ranking (described above), a flooding or debris flow risk ranking is found by following the steps below (Front Range Watershed Protection Data Refinement Work Group, 2009):
1. Complete the ruggedness calculation for each sixth-level watershed 2. Categorize the results of the ruggedness calculation by scaling the results to fall into five
categories and then round the scaled result to the nearest whole number 3. Calculate the road density for each sixth-level watershed 4. Categorize the road density results, following the process explained in Step 2 5. Multiply the result of the ruggedness calculation by 2 before adding to the result of Step 4
1 The United States Geological Survey (USGS) has developed a 6-level hierarchical system for classifying hydrologic units (e.g., basins and watersheds) and assigning them unique identifiers (Hydrologic Unit Codes or HUCs). HUC code lengths range from 1 digit for the largest size category (1st level, Region) to 12 digits for the smallest size category (6th level, Subwatershed). For additional information, see http://water.usgs.gov/GIS/huc.html.
Chapter 2: Literature Review on the Impacts of Wildfire | 7
6. Scale the results so they fall into five categories and round to the nearest whole number. A map of these results can be created, where Category 1 is “low risk” and Category 5 is “very high risk”
Soil Erodibility
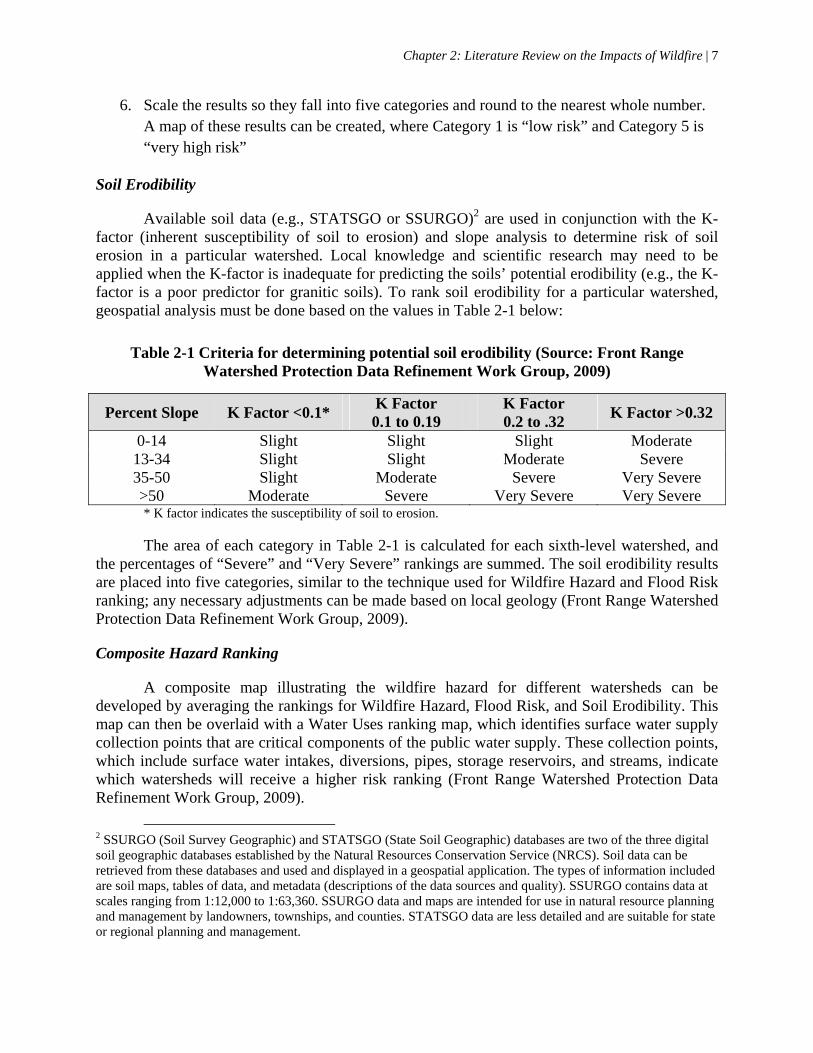
Available soil data (e.g., STATSGO or SSURGO)2 are used in conjunction with the K-factor (inherent susceptibility of soil to erosion) and slope analysis to determine risk of soil erosion in a particular watershed. Local knowledge and scientific research may need to be applied when the K-factor is inadequate for predicting the soils’ potential erodibility (e.g., the K-factor is a poor predictor for granitic soils). To rank soil erodibility for a particular watershed, geospatial analysis must be done based on the values in Table 2-1 below:
Table 2-1 Criteria for determining potential soil erodibility (Source: Front Range Watershed Protection Data Refinement Work Group, 2009)
Percent Slope K Factor <0.1* K Factor 0.1 to 0.19
K Factor 0.2 to .32
K Factor >0.32
0-14 Slight Slight Slight Moderate 13-34 Slight Slight Moderate Severe 35-50 Slight Moderate Severe Very Severe >50 Moderate Severe Very Severe Very Severe * K factor indicates the susceptibility of soil to erosion. The area of each category in Table 2-1 is calculated for each sixth-level watershed, and
the percentages of “Severe” and “Very Severe” rankings are summed. The soil erodibility results are placed into five categories, similar to the technique used for Wildfire Hazard and Flood Risk ranking; any necessary adjustments can be made based on local geology (Front Range Watershed Protection Data Refinement Work Group, 2009).
Composite Hazard Ranking
A composite map illustrating the wildfire hazard for different watersheds can be developed by averaging the rankings for Wildfire Hazard, Flood Risk, and Soil Erodibility. This map can then be overlaid with a Water Uses ranking map, which identifies surface water supply collection points that are critical components of the public water supply. These collection points, which include surface water intakes, diversions, pipes, storage reservoirs, and streams, indicate which watersheds will receive a higher risk ranking (Front Range Watershed Protection Data Refinement Work Group, 2009).
2 SSURGO (Soil Survey Geographic) and STATSGO (State Soil Geographic) databases are two of the three digital soil geographic databases established by the Natural Resources Conservation Service (NRCS). Soil data can be retrieved from these databases and used and displayed in a geospatial application. The types of information included are soil maps, tables of data, and metadata (descriptions of the data sources and quality). SSURGO contains data at scales ranging from 1:12,000 to 1:63,360. SSURGO data and maps are intended for use in natural resource planning and management by landowners, townships, and counties. STATSGO data are less detailed and are suitable for state or regional planning and management.

8 | Wildfire and Drinking Water Utilities
Vulnerability Studies
Severe wildfires tend to consume large tracts of forest and associated organic matter, significantly increasing soil erosion rates to the detriment of a watershed and the quality of its runoff. Predicting soil erosion can help in predicting which areas may be severely affected by wildfire. In a 2011 study by Miller et al., researchers developed a model to predict soil erosion rates over a large geographical region in the year following a wildfire. They used historical fire and weather data and the First Order Fire Effects Model (FOFEM) to predict post-fire ground cover. Parameter files from the Disturbed Water Erosion Prediction Project (WEPP) and a geospatial interface for the WEPP (GeoWEPP) were then used to predict post-fire erosion from individual hillslopes. Figure 2-1 shows a map of predicted soil erosion rates in regions where modeling was completed for the first year following a wildfire.
Source: Miller et al. (2011)
Figure 2-1 Predicted post-fire erosion one year after wildfire
Precipitation, rather than surface cover, was found to be the primary factor affecting predicted erosion rates. Although predicted erosion rates were significantly lower than measured values, predicted and measured rates were positively correlated. This model can be used to
Chapter 2: Literature Review on the Impacts of Wildfire | 9
predict erosion rates at a large scale and also to prioritize areas for fuel-reduction treatment at a more local scale (Miller et al., 2011).
MITIGATING THE RISK OF WILDFIRES TO WATER SYSTEMS
Wildfires can have serious and lasting negative consequences for a water systems’ ability to provide clean drinking water to its customers. In addition to understanding the vulnerability of a region’s ecosystem to wildfire as described above, the vulnerability of the drinking water utility itself should be evaluated as a first step towards protection and emergency preparedness. Vulnerability can be defined as “the degree of loss or damage which may be suffered as the result of a forest fire by the population, property and the environment” (Aragoneses and Rabade, 2008). Fire protection planning for watersheds should consider this measure of vulnerability in addition to the estimated intrinsic value of the woodlands.
Taking careful stock of response plans, prevention and recovery resources, and drinking water utility vulnerability will help operators identify the most effective mitigation strategies. Advance planning is an important part of mitigating the risk of wildfires to water systems. This can take the form of a community wildfire protection plan and an emergency preparedness plan.
Quantification of Vulnerability of Water Systems
If possible, quantifying the vulnerability of the water system may be a useful early step in identifying wildfire mitigation measures. A comprehensive cost-benefit analysis can be conducted once the risks and impacts of a wildfire are understood. A probabilistic method for approximating drinking water utility vulnerability to various natural disasters is described by the Pan American Health Organization (PAHO, 1998); the concepts presented by PAHO may have utility in assessing vulnerability of water system to wildfire. The method involves estimating the probability of a certain level of damage given the occurrence of a specific hazard and requires a comprehensive accounting of infrastructure components.
A vulnerability assessment should be carried out by professionals familiar with the water system. They should have extensive experience with the design, operation, maintenance, and repair of the system’s components. The information necessary for an accurate vulnerability assessment includes a detailed description of the organizational and legal structure of the system; the availability of internal resources for responding to an emergency; the characteristics of the areas where drinking water supply components are sited; the vulnerability of physical components of the system; and the response capacity of the system’s services. Prior to such an assessment, diagrams and plans should be identified and assembled; information on pertinent materials, dimensions, and volumes should be collected; and other helpful information specific to the drinking water utility should be gathered (PAHO, 1998).
The Rocky Mountain Research Station (RMRS) provides useful tools for quantifying ecosystem and capital asset vulnerability. For example, the RMRS Burned Area Emergency Response (BAER) Values at Risk (VAR) calculation tool can help drinking water utilities identify and organize capital assets as well as natural resources that may be vulnerable to wildfire. The tool is available in the form of a Microsoft Excel spreadsheet at http://www.fs.fed.us/rmrs/ (Rocky Mountain Research Station, 2010).

10 | Wildfire and Drinking Water Utilities
Emergency Preparedness and Response Plans
One of the best methods for determining vulnerability is establishing an emergency preparedness and response plan. In addition to making responses more effective, the process of establishing such a plan will help identify areas of particular vulnerability for drinking water utilities (PAHO, 1998).
At a minimum, the PAHO has recommended that the components of an emergency preparedness and response plan include:
1. Objective: hazards to which plan is directed 2. Geographic area of application 3. Relationship to the national emergency plan
(that of the national emergency commission or civil defense agency)
4. Organization: central, regional, and local emergency committees, and those responsible for drafting the plan (functions and responsibilities)
5. Description and operation of the system (document with sketches)
6. Emergency operations centers 7. Warning and emergency declarations 8. Personnel plan (training); key personnel and
their addresses 9. Security plan 10. Transportation plan 11. Communications 12. Supply plan 13. Emergency supply warehouse/stores 14. Institutional coordination 15. Coordination with private companies and
suppliers 16. Response to neighboring supply systems
operated by other companies 17. Damage assessment
18. Priorities for water supply 19. Alternative sources of water supply and
disposal measures for wastewater 20. Information for the press and public 21. Procedures for operation in emergency
situations 22. Procedures for inspection following an
emergency 23. Use of water tank trucks, portable tanks, and
other means of transporting drinking water 24. Management of funds 25. Emergency committee 26. Drafting, evaluation, and control committee
for emergency plan 27. Emergency operations centers 28. Warning and emergency declarations 29. Necessary budgets for implementation of the
plan, including: a. System plans b. Operation plans c. Results of first phase of vulnerability
analysis d. Training of clients in the correct use
of water in emergency situations e. Management of information
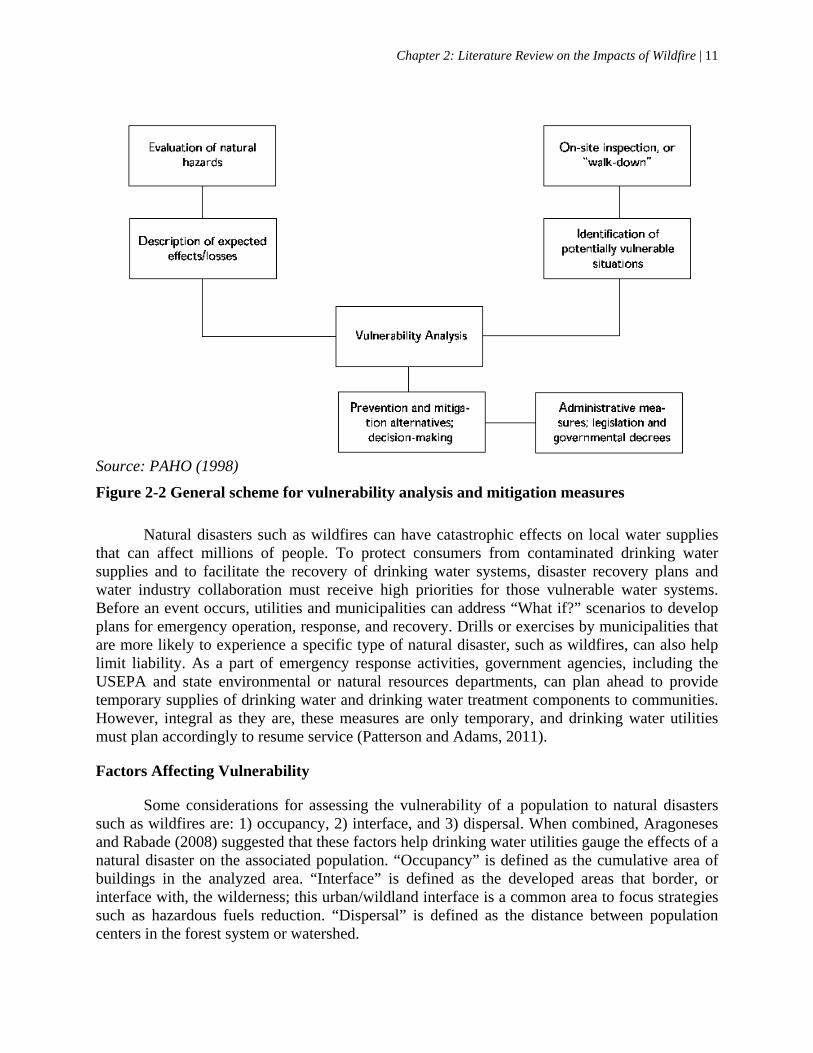
during the emergency The process of determining a water system’s vulnerability to wildfire damage includes
several steps, and starts with the collection of preliminary information. Figure 2-2 presents a general approach to evaluating drinking water utility vulnerability and developing a mitigation measures system.
Chapter 2: Literature Review on the Impacts of Wildfire | 11
Source: PAHO (1998)
Figure 2-2 General scheme for vulnerability analysis and mitigation measures
Natural disasters such as wildfires can have catastrophic effects on local water supplies that can affect millions of people. To protect consumers from contaminated drinking water supplies and to facilitate the recovery of drinking water systems, disaster recovery plans and water industry collaboration must receive high priorities for those vulnerable water systems. Before an event occurs, utilities and municipalities can address “What if?” scenarios to develop plans for emergency operation, response, and recovery. Drills or exercises by municipalities that are more likely to experience a specific type of natural disaster, such as wildfires, can also help limit liability. As a part of emergency response activities, government agencies, including the USEPA and state environmental or natural resources departments, can plan ahead to provide temporary supplies of drinking water and drinking water treatment components to communities. However, integral as they are, these measures are only temporary, and drinking water utilities must plan accordingly to resume service (Patterson and Adams, 2011).
Factors Affecting Vulnerability
Some considerations for assessing the vulnerability of a population to natural disasters such as wildfires are: 1) occupancy, 2) interface, and 3) dispersal. When combined, Aragoneses and Rabade (2008) suggested that these factors help drinking water utilities gauge the effects of a natural disaster on the associated population. “Occupancy” is defined as the cumulative area of buildings in the analyzed area. “Interface” is defined as the developed areas that border, or interface with, the wilderness; this urban/wildland interface is a common area to focus strategies such as hazardous fuels reduction. “Dispersal” is defined as the distance between population centers in the forest system or watershed.

12 | Wildfire and Drinking Water Utilities
Other factors influencing water system vulnerability include emergency preparedness, organizational and maintenance history and practices, location and geography, operator experience, and the water system’s ability to access outside assistance (PAHO, 1998).
SOURCE WATER PROTECTION AND FOREST MANAGEMENT MEASURES
Source water protection strategies that can mitigate the risks from wildfires beforehand include practices such as buffer strips and hazardous fuels reduction. Properly designed forest riparian buffer strips can protect source waters from wildfire-related runoff problems. Buffer strips are riparian lands immediately adjacent to rivers and streams that are vegetated and maintained specifically to protect water or habitat quality (Belt et al., 1992). The most commonly cited reason for installing buffer strips is the need to trap sediment and associated nutrients. Buffer strips can effectively reduce sediment flow rates and transport distances. However, in forested areas with mountainous terrain, sediment-laden water regularly moves through buffer strips as channelized flow, which can move sediment greater distances than sheet flow. Where slopes are less steep, buffer strips tend to limit overland sediment movement to less than 300 feet (Belt et al. 1992).
The need for buffer strips is often associated with trapping or filtering sediment from logging roads, but because sediment transport is a significant result of wildfire, they can be used for wildfire risk mitigation. Fires and landslides are two of the most common sources of sediment load in runoff from forested watersheds (Belt et al., 1992). Properly constructed riparian buffers can mitigate sedimentation in source waters, ultimately reducing treatment costs significantly for drinking water utilities in the wake of a wildfire.
Hazardous fuels reduction is another wildfire risk mitigation strategy. Hazardous fuels can be defined as any materials that increase the likelihood of severe wildfire, such as dry brush or trees. Unnaturally large accumulations of hazardous fuels are believed by some to contribute to severe wildfires (Gorte, 2009). Hazardous fuels reduction is often focused on the wildland/urban interface (where buildings are at risk from wildfire); it may entail the thinning out of tree stands by using fire (e.g., prescribed burn), biological, or mechanical methods to remove fuels. Manual thinning may entail removing underbrush or tree limbs. Biological methods may involve grazing, but they are not used in national parks and wilderness areas. Generally, prescribed burning causes minimal hydrologic disturbance in watersheds and can be used as a management tool to prevent more significant and damaging wildfires that can have more serious consequences (Baker 1988). Graham et al. (2010) suggest focusing on reducing ground level vegetation and fine fuels through controlled burning, reducing the continuity of the forest canopy, and increasing the height of the forest crown. Further information on fire management may be found at: http://www.nps.gov/fire/wildland-fire/learning-center/fire-in-depth/hazardous-fuel-reduction.cfm.
Limiting the scope and burn intensity of wildfires can significantly mitigate sediment-related problems by reducing sediment flow into source waters. Furthermore, reducing hazardous fuels can reduce nutrient loads in flowing streams and reservoirs. It is recommended that
Source water protection measures may include buffer strips and hazardous fuels reduction.
Hazardous fuels reduction is often focused at the wildland/urban interface.
A U.S. Forest Service Geographic Information Systems (GIS)-based decision support tool is available to help establish hazardous fuels reduction needs.

Chapter 2: Literature Review on the Impacts of Wildfire | 13
hazardous fuels reduction via prescribed burning be undertaken during the spring months when moisture content in the American West is typically higher and temperatures are lower (Graham, et al., 2010). Hazardous fuels reduction is generally performed in upland areas. However, a recent survey indicates that U.S. Forest Service (USFS) fire managers are also beginning to use fuels reduction treatments in riparian areas in national forests in the western United States (Stone et al., 2011).
Tools for Source Water Protection and Forest Management
One informative online resource for source water protection related to wildfires is the LANDFIRE.gov website, which is chartered by the Wildland Fire Leadership Council. LANDFIRE was initiated on the basis of agencies’ needs for mapped data that support prioritization of hazardous fuel reduction, ecological conservation activities, and strategic resource management initiatives.
LANDFIRE products include landscape-scale map data used to support strategic vegetation, fire, and fuels management planning, as well as to evaluate the effectiveness of such management alternatives. One of its objectives is to facilitate national- and regional-level strategic planning and reporting of wildfire and natural resource management activities. This website and its resources can provide drinking water utilities with geographic information on wildfires, which can be helpful for planning purposes. The BAER VAR calculation tool is another useful resource for drinking water utilities that are trying to protect capital assets from wildfires. This tool allows operators to more easily compare expected effects on various capital assets.
Furthermore, the USFS has a GIS-based decision support tool, the Spatial Analysis Project (SAP; http://www.fs.fed.us/na/sap), which can be used for the management of private as well as public lands. The SAP allows participating state forestry agencies to identify and display important forest lands. The two components of this project are: 1) a statewide assessment of lands eligible for the forest stewardship program, including an assessment of known threats such as wildfire; and 2) a database with information on stewardship plans. Combining these two aspects can help set priorities, including how to address hazardous fuel reduction needs.
Community Wildfire Protection Plans
The passage of the 2003 Healthy Forests Restoration Act (HFRA) provided an impetus for the USFS and the Bureau of Land Management (BLM) to consider the priorities of local communities when developing forest management and hazardous fuels reduction projects. Local communities can influence where and how federal agencies conduct fuels reduction and how federal funds are distributed for use on non-federal lands. For their part, a community must prepare a Community Wildfire Protection Plan (CWPP) that addresses issues such as wildfire response, hazard mitigation, and community preparedness.
A CWPP must have certain minimum requirements as described in the HFRA (Communities Committee et al., 2004):
1. “Collaboration: A CWPP must be collaboratively developed by local and state
government representatives, in consultation with federal agencies and other interested parties.
14 | Wildfire and Drinking Water Utilities
2. Prioritized Fuel Reduction: A CWPP must identify and prioritize areas for hazardous fuel reduction treatments and recommend the types and methods of treatment that will protect one or more at-risk communities and essential infrastructure.
3. Treatment of Structural Ignitability: A CWPP must recommend measures that homeowners and communities can take to reduce the ignitability of structures throughout the area addressed by the plan.”
In their guide for preparing a CWPP, Communities Committee et al. (2004) describes the
steps involved, from convening decision-makers and engaging federal agencies and interested parties, to establishing a common base map and developing a community risk assessment with priorities and recommendations, to the ultimate development of an action plan and monitoring strategy (http://www.stateforesters.org/files/cwpphandbook.pdf).
Examples of Organized Efforts and Wildfire Mitigation Plans
The Front Range Fuels Treatment Partnership is an alliance of federal, state, and local governments, land management agencies, private landowners, conservation organizations, and other stakeholders with an interest in fuels treatment to reduce wildfire risks. Work by the partnership includes a number of fuels reduction projects; information can be found at http://www.frftp.org/.
Nationwide efforts to mitigate wildfire risk (both regulatory and voluntary) are compiled in a national database intended to serve as a resource to help fire officials, public officials, planners, and land managers in developing wildfire risk mitigation programs (Haines et al., 2008). The types of programs covered include public outreach and education, assessment of wildfire risk, designation of high-risk areas, homeowner assistance, and regulatory programs. The database is titled National Wildfire Mitigation Programs Database and can be located at http://www.wildfireprograms.usda.gov/.
The Coalition for the Upper South Platte (CUSP; originally the Upper South Platte Watershed Protection and Restoration Project; Culver et al., 2001) began in 1998 and includes Denver Water, CSFS, Colorado State University, USEPA, and USFS (http://www.uppersouthplatte.org/). The project addresses concerns related to vegetation, soil erosion, and water quality in the Upper South Platte River Basin as a result of the 1996 Buffalo Creek Fire, with the goal of restoring and protecting the watershed. Strategies include prescribed burns and mechanical treatments to reduce the risk of crown fires, in addition to education and vegetation treatments on private lands.
CUSP is also involved in the Hayman Restoration Partnership, which aims to reduce erosion and sediment flows of the South Platte watershed burned by the 2002 Hayman Fire. The public-private partnership, which involves major financial partners like Vail Resorts, Aurora Water, and Coca-Cola, includes planting trees, restoring wetlands and riparian areas, treating land for invasive plant species, improving recreation trails, restoring roads and engaging hundreds of volunteers and youth in the area.
Also in the South Platte watershed, Denver Water has agreed to match the USFS’s $16.5 million investment through a Forest to Faucets partnership to protect priority watersheds critical to Denver Water’s water supply by way of hazardous fuel removal and tree planting projects.

Chapter 2: Literature Review on the Impacts of Wildfire | 15
Funding Sources for Source Water Protection and Forest Management
The federal government and state agencies are generally good sources for funding source water protection and forest management. States are responsible for fire protection on nonfederal lands, with certain exceptions for cooperative agreements. However, USFS does oversee a number of programs that provide assistance to states, local governments, and communities for the protection of nonfederal lands, both government and private. Most of these programs are funded through USFS’s State and Private Forestry (S&PF) branch. The activities funded through this branch include financial and technical assistance for fire prevention, control, and prescribed burning. These forms of assistance are provided to state foresters and, through them, to other organizations and agencies (Gorte, 2011).
Furthermore, the 2002 Farm Bill created a new Community Fire Protection Program that authorized USFS to assist communities in their own wildfire protection efforts. This program also authorized USFS to act on nonfederal lands with the permission of affected landowners to protect structures and communities from wildfires (Gorte, 2011).
State agencies, such as the Colorado Department of Local Affairs, can provide funding for wildfire mitigation efforts. When funding is not available through state or federal agencies, drinking water utilities can form partnerships with other utilities, agencies, and nonprofit organizations in generating and leveraging funds.
Some municipalities and regional water authorities have helped organize interagency groups to provide wildfire mitigation funding. The nonprofit organization Carpe Diem West, for example, describes Santa Fe, New Mexico as a model of successful source water protection (Carpe Diem West, undated). After a particularly devastating wildfire, the 2000 Cerro Grande fire, the city began searching for ways to pay for preventive measures. The city secured a sizable congressional earmark for hazardous fuels reduction, but concluded that a long-term, sustainable plan would be necessary for appropriate source water protection measures. The Santa Fe Municipal Watershed 20 Year Protection Plan (City of Santa Fe, 2009) provides recommendations for long term management and funding for the Santa Fe municipal watershed. The plan seeks to fund restoration using a Payment for Ecosystem Services (PES) model in the form of an agreement between the City of Santa Fe and the Santa Fe National Forest. This would be cost effective because the cost to retain a restored forest condition is expected to average $200,000 per year, whereas the financial burden associated with a fire would be an estimated $22 million. There were, however, concerns regarding public support for a rate increase associated with a PES arrangement, and Santa Fe looked for other funding sources for the first five years of the PES while generating public support and eventually implementing a modest rate increase. A partnership was developed among the city fire department, the water division, and The Nature Conservancy in New Mexico. Also, a grant was procured from the New Mexico Water Trust to help delay the rate increase.
Another option for funding is via bonds. The city of Flagstaff, Arizona recently passed a measure to fund a forest health and water supply protection project. The project will restore forests in two high-threat areas that would pose severe risks to Flagstaff’s water supply in the event of a fire: the Rio de Flag/Dry Lake Hills and Lake Mary watersheds. Treatment will be carried out on 11,000 acres, mostly on USFS lands, but also on state lands. The formation of a citizen’s group to promote the measure is believed to have helped secure its passage.

16 | Wildfire and Drinking Water Utilities
WATER QUALITY EFFECTS OF WILDFIRES
Wildfires can cause changes in a number of water quality parameters of interest or concern to water systems, including nutrients, sulfate, pH, total dissolved solids, turbidity, organic carbon, chloride, iron, color, taste, and odor. The magnitude of these changes will depend upon several factors including the severity, intensity, and duration of the fire, the slope of the terrain, and the amount and intensity of precipitation during post-fire rain events (Landsberg and Tiedemann, 2000; Neary et al., 2005). Changes in water quality may be manifest under different runoff conditions. Effects tend to be the greatest soon after a fire; a “first flush” storm (i.e., the first substantial post-fire rain event) can produce significant increases in dissolved organic carbon (DOC), turbidity, nitrate, and other constituents (Writer and Murphy, 2012). Thunderstorms in some terrains (e.g., the Colorado Front Range) can produce intense rain and generate spikes in various constituents. Rapid snowmelt conditions may also provide increased discharge and associated changes in water quality. The subsections below provide additional detail on some water quality alterations that may be seen in source waters after a wildfire.
Nutrients
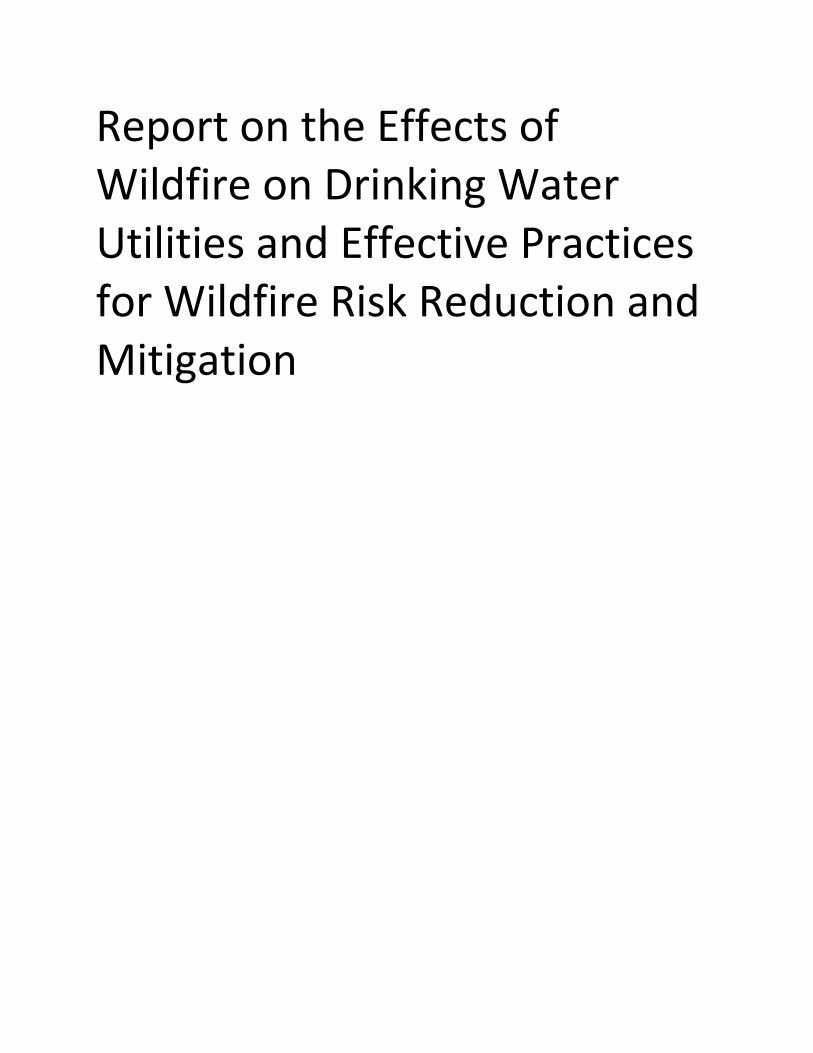
Nutrient exports from watersheds generally increase after wildfires. Nitrogen in particular increases immediately after a fire, reaches a peak in the first or second year post-fire, and then slowly declines as vegetation reestablishes (Ranalli, 2004). Writer and Murphy (2012) have documented increased nitrate in Fourmile Creek during thunderstorms in the first year after the 2010 Fourmile Canyon Fire. The Fourmile Canyon fire in Boulder County, Colorado burned more than 6,425 acres (26 square kilometers) (about 23% of the Fourmile Creek watershed) in September 2010 (McClesky et al., 2012). The watershed is located upstream from the city of Boulder. The USGS has several monitoring stations on Fourmile Creek upstream of, within, and downstream of the burned area, as well as on a number of tributaries. Monitoring over the course of the first year demonstrated post-fire effects on water quality in Fourmile Creek during intense thunderstorms; concentrations of nitrate increased, in addition to turbidity and dissolved organic carbon (Figure 2-3) (Writer and Murphy, 2012).
In the Rocky Mountain Region of southern Alberta, the 2003 Lost Creek wildfire burned more than 51,892 acres (210 square kilometers) in the Crowsnest Pass area. This was a severe crown fire that affected the headwater regions of the Castle and Crowsnest rivers in the Oldman River Basin, an important area for water supply (Bladon et al., 2008). Three burned watersheds, two post-fire salvaged watersheds, and two unburned watersheds were studied by the Southern Rockies Watershed Project (SWRP) (Silins et al., 2009). Data show that during the first year after the fire, total nitrogen concentrations in the burned watersheds were 5.3 times higher than in the reference (unburned) streams (Silins et al., 2009; Bladon et al., 2008). All forms of phosphorus were also higher in streams in the burned watersheds.
Water quality effects can include changes in nutrients, turbidity, organic carbon, metals, major ions, and alkalinity.
Water quality changes are variable and are greatest immediately after a fire (“first flush”).
Storm intensity affects water quality.
Greater burn severity can induce greater water quality effects.

Chapter 2: Literature Review on the Impacts of Wildfire | 17
The increased nutrient exports post-fire can be attributed to various factors. Some nitrogen is lost from a burned area by volatilization from plants, litter, and soil (Ranalli, 2004).
There is reduced plant demand and stimulated nitrogen mineralization (due to changes in pH and electrolytes; Baker, 1988) and increased nitrification (Rhoades et al., 2011; Boerner et al., 2012). Also, because the fire removes forest cover and litter, rain is not intercepted as much and is more likely to transport nutrients via infiltration as well as in runoff (Bladon et al., 2008). In addition to nitrate, ammonium loading may increase by an order of magnitude; ammonium is volatilized during a fire and can dissolve into stream water or lake water (Ranalli, 2004). Ammonium may also be retained in exchangeable form in the
soil, and may subsequently be leached. Organic and total nitrogen concentrations in stream water can also increase, most likely due to transport of sediment and organic detritus in high flows (Baker, 1988). In Salt River (as affected by the 2002 Rodeo-Chediski Fire in Arizona), Gill (2004) documented an increase in average total nitrogen from 0.74 mg/L (milligrams per liter) to 52.8 mg/L. Post-fire nitrite and nitrate combined, which are dissolved, averaged only 0.42 mg/L. This indicates that much of the increase in nitrogen was particulate associated.
Burn severity plays an important role in post-fire water quality, including export of nutrients. Plants, surface litter, and soil organic matter are pools of nutrients; a high severity fire consumes the overstory and understory vegetation, roots and rhizomes, and burns surface organic matter (Rhoades et al., 2011; Ice et al., 2004), whereas lower intensity fires affect these pools much less (Rhoades et al., 2011). Thus, for a lower intensity fire, water quality is disturbed less, and recovery is faster. For example, in the streams draining areas affected by the 2002 Hayman Fire, nitrate in streams was found to increase linearly with both the extent and severity of burning (Rhoades et al., 2011).
Nitrate concentrations and export are greater under conditions of higher discharge. Stream nitrate concentrations in areas burned by the 2002 Hayman Fire had been observed to increase during spring snowmelt (Rhoades et al., 2011). In the Rocky Mountains in Alberta, Bladon et al. (2008) studied the effects of the 2003 Lost Creek Fire on nitrogen in headwater streams. In the first year post-fire, the concentrations and exports of nitrogen species increased dramatically with greater discharge, especially during rapid snowmelt or storms, as compared to similar conditions in reference watersheds. Nitrate concentrations in excess of 20 mg/L were recorded, with one value over 50 mg/L; the highest total nitrogen concentrations were over 60 mg/L. The difference between the burned and reference watersheds diminished by the third post-fire year.
The following charts show the discharge rates at 5-minute intervals and selected water quality characteristics measured in Fourmile Creek, Colorado. Horizontal lines indicate the thresholds for drinking water treatment.
Nutrient exports from a watershed increase post-fire.
Increases can include both dissolved and particulate nutrients.
Nutrient pools (vegetation, leaf litter, soil organic matter) are combusted, and nitrification rates increase post-fire.
Dissolved and sediment-associated phosphorous concentrations can increase.
Magnitude of effect increases with burn severity.

18 | Wildfire and Drinking Water Utilities
Source: Writer and Murphy (2012)
Figure 2-3 Stream discharge at 5-minute intervals and selected water quality characteristics in 2010–2011 measured in Fourmile Creek, Colorado
Both dissolved and sediment-associated phosphorus concentrations can increase post-fire due to the mobilization of sediment and dissolution of ash deposited into streams or lakes

Chapter 2: Literature Review on the Impacts of Wildfire | 19
(Ranalli, 2004). In a study of the 1998 Virginia Hills Wildfire in the Boreal Plain watersheds of Canada, Burke et al. (2005) showed that, when compared to reference watersheds, burned watersheds exported more phosphorus by a factor of more than three. Gill (2004) documented a substantial increase in maximum and average concentrations of both dissolved and total phosphorous in Salt River in Arizona (affected by the 2002 Rodeo-Chediski Fire). Average total phosphorous increased from 0.12 mg/L to 3.89 mg/L, and average dissolved phosphorous increased from 0.019 mg/L to 0.12 mg/L.
Organic Carbon
Particulate organic carbon (POC) may be elevated in surface water following a fire due to deposition of ash, which can have high organic carbon content, combined with increased erosion (Smith et al., 2011). Dissolved organic carbon (DOC) may increase in surface water as rain and snowmelt percolate through ash; acidic functional groups in the organic carbon become ionized at the higher pH of snowmelt or rain and become more water soluble (Ranalli, 2004). Boerner et al. (2012) describe the effects of wildfire on the water supply for the city of Golden, Colorado; they note that after the 2002 Missionary Ridge Fire, total organic carbon (TOC) concentrations reached as high as 18.7 mg/L after the first major runoff event. In their study of water quality after the 2003 Lost Creek wildfire in Alberta, Emelko et al. (2011) reported that median DOC concentrations were elevated in burned watersheds (3 mg/L) and in post-fire salvage logged watersheds (5 mg/L) as compared to reference watersheds (1-2 mg/L). These elevated concentrations persisted into the third and fourth years of the study. After the 2010 Fourmile Canyon Fire, first flush DOC concentrations of up to 17 mg/L were measured downstream of the burned Fourmile Canyon area, compared to a baseflow concentration of 1.5 mg/L; thunderstorms produced DOC spikes greater than 70 mg/L.
Other Chemical Constituents
A number of other chemical constituents may increase post-fire. Burning may increase sulfate concentrations in soils due to oxidation of sulfur in soil organic matter. When ash is produced by fire, base cations in the organic compounds in wood are mineralized. The resulting ash contains oxides of calcium and magnesium and chlorides, carbonates of sodium and potassium, polyphosphates of calcium and magnesium (Ranalli, 2004), and small amounts of phosphorous, sulfur, and nitrogen. Leaching of ash can mobilize these cations and chloride and allow them to reach streams and lakes (Ranalli et al. 2004; Smith et al., 2005; Rhoades et al., 2011). The chemical effects of ash on stream water chemistry decline once ash has been transported out of a watershed (Rhoades et al., 2011).
The degree to which stream water exhibits post-fire changes in major ions depends in part on the bedrock and the pre-existing stream chemistry. For example, stream response to the 2002
Base cations and chloride may leach from ash and affect streamwater chemistry until the ash is flushed out of the watershed.
Sensitivity to effects of wildfire varies with bedrock and pre-fire stream chemistry.
Iron and manganese associated with particulate matter may increase.
Other metals such as copper, zinc, and selenium may increase.
Mercury may be mobilized, and monomethylmercury may be generated.

20 | Wildfire and Drinking Water Utilities
Hayman Fire was greater in areas that are underlain by granite and therefore have lower acid neutralizing capacity (ANC), which is the measure of the stream’s ability to buffer against acidification (Rhoades et al., 2011). Areas affected by the 2003 wildfires in Glacier National Park did not show extreme stream chemistry response to the fires because of the underlying carbonate bedrock and related stream chemistry (higher calcium and ANC) (Rhoades et al., 2011). In unburned areas, surface waters can be susceptible to disturbance from wildfire if wind and rain deposit smoke and ash into the watersheds (Ranalli, 2004).
Substantial post-fire increases in total iron (Fe) and total manganese (Mn) have been reported (Gill, 2004) for the 2002 Hayman and Rodeo-Chediski Fires, indicating an added influx of these metals as part of an increase in particulates. Researchers have also noted that heavy metals may be exported post-fire (Emelko et al., 2011; Stein, 2008). After a wildfire in Simi Valley, California (October 2003), copper (Cu) loading from a February 2004 storm was 15 times that of the unburned watershed. One year later, however, the Cu loading was less than that of the unburned watershed (Stein, 2008). After the 2007 Santiago Canyon Fire, zinc (Zn) concentrations spiked at .16 mg/L but dropped down to less than .02 mg/L by February 2008. Data from the 2002 Hayman and Rodeo-Chediski Fires (Gill, 2004) shows that increased Cu and Zn occur in the particulate fraction; dissolved fractions of metals actually decreased post-fire.
A notable potential consequence of wildfire is the mobilization of mercury (Hg). In New Mexico in 1995, a wildfire took place in the Black Range of the Gila National Forest, affecting the Caballo Reservoir. Concentrations of total mercury in reservoir sediments increased from 7.5 ng/g (nanogram per gram) to 46.1 ng/g. Concentrations of monomethylmercury, the most toxic mercury compound, increased from 0.428 ng/g to 12.46 ng/g. Fire had mobilized atmospherically-deposited mercury from the soil, and organic carbon may have promoted methylation, producing the higher concentrations of monomethylmercury (Caldwell et al., 2000).
Suspended Sediments and Turbidity
Very high turbidity and total suspended solids (TSS) due to suspension of ash and clay-sized soil particles in the water are a serious water quality impairment associated with wildfire and are often the most prominent post-fire effect (e.g., Near et al., 2005). TSS and turbidity values can vary widely, and they often approach extreme values. After the 2010 Fourmile Canyon Fire, summer thunderstorms produced turbidity values of thousands of NTU3, compared to background values of 20 NTU or less (Figure 2-3) (Writer and Murphy, 2012). TSS values in Bush Creek following the 2002 Hayman Fire were as high as 4,600 mg/L (as compared to the baseline TSS of 16 mg/L) (Boerner et al., 2012). In their study of water quality following the 2003 Lost Creek wildfire, Emelko et al. (2011) found that streams in unburned watersheds had 95th percentile turbidity values of 5.1 NTU and TSS of 3.8 mg/L, whereas the stream in the burned watershed had 95th percentile turbidity values of 15.3 NTU and TSS of 4.6 mg/L. Watersheds that had been salvaged had higher values (18.8 NTU, 9.9 mg/L). Factors affecting turbidity levels and sediment mobilization are discussed in the section below on sediment mobilization.
3 Nephelometric Turbidity Unit (NTU): a unit of measurement for turbidity.

Chapter 2: Literature Review on the Impacts of Wildfire | 21
Effects of Fire Retardant Chemicals
Fire-fighting chemicals include long-term fire retardants, short-term fire retardants, fire-fighting foams, and wetting agents. The most common active ingredients in modern fire retardants are ammonium sulfates and diammonium phosphates (Kalabokidis, 2000). The fire-fighting formulations are described by Kalabokidis (2000) as mixtures of water and inorganic salts (fertilizers) with thickeners (clays), corrosion inhibitors, and bactericides. These chemicals may reach streams directly, via overland flow, or through infiltration/percolation through soils to become incorporated in stream baseflow. Potential water quality problems include eutrophication (and subsequent fish kills) and inputs of cyanide (from corrosion inhibitors). A 1989 experimental study (Norris and Webb, 1989) demonstrated that changes in water quality could be detected up to 8,858 feet (2,700 meters) downstream of fire-fighting chemical application. These changes were, however, of short duration. A compilation of data from post-fire surface water monitoring programs for four fire-affected areas (Crouch et al., 2005) showed that ammonia, phosphorus, and cyanide were found to not differ between streams where retardants had been used and reference streams.
HYDROLOGIC EFFECTS, SEDIMENT YIELDS, AND DEBRIS FLOWS
Hydrologic effects of wildfire can include increased total runoff volume, increased peak flow in streams, flooding, and increased sediment mobilization. Flooding may be life-threatening, and sediment mobilization may seriously impair recreation, stream ecology, and water supply systems (e.g., Moody and Martin, 2001; Burke et al., 2005). These responses are the result of changes in a variety of hydrologic processes (see Table 2-2) (Baker, 1988; Neary et al., 2005). Precipitation interception is reduced by loss of overstory; without the protection of vegetation, raindrops hit the soil with greater intensity, promoting detachment of soil particles and also sealing pores in the soil (Baker, 1988); this increases runoff and erosion. With vegetation removed by burning, evapotranspiration is also reduced. Furthermore, the burning itself can render soils water repellent; volatilized organic compounds condense on cooler soil particles and cause them to become hydrophobic or water repelling (DeBano, 2000).
Water repellency in particular, with the associated loss of infiltration, can have a marked effect; infiltration can be reduced by as much as one to two orders of magnitude, and rills can form, increasing erosion. Lighter fires over moist soil result in less water repellency than severe fires in areas with dry soils (Ice et al., 2004). On a watershed scale, water repellency contributes to increases in peak flow as well as greater erosion and sedimentation rates (Ice et al., 2004).
Fire retardant chemicals may reach streams either in runoff or baseflow.
Effects may include increases in ammonia, phosphorous, or cyanide.
Water quality changes due to fire retardants have been detected, but were of short duration.

22 | Wildfire and Drinking Water Utilities
Table 2-2 A summary of the changes in hydrologic processes caused by wildfires
Hydrologic Process Type of Change Specific Effect
1. Interception Reduced Reduced moisture storage
Greater runoff in small storms
Increased water yield
2. Litter storage of water Reduced Less water stored (0.05 in/in or 0.5 mm/cm litter)
Overland flow increased
3. Transpiration Temporary elimination Streamflow increased
Soil moisture increased
4. Infiltration Reduced Overland flow increased
Stormflow increased
5. Streamflow Changed Increased in most ecosystems
Decreased in snow systems
Decreased in fog-drip systems
6. Baseflow Changed Decreased (less infiltration)
Increased (less evapotranspiration)
Summer low flows (+ and -)
7. Stormflow Increased Volume greater
Peakflows larger
Time to peakflow shorter
Flash flood frequency greater
Flood levels higher
Stream erosive power increased
8. Snow Accumulation Changed Fires <10 ac (<.04 sq. km.), increased snowpack
Fires >10 ac (>.04 sq. km.), decreased snowpack
Snowmelt rate increased
Evaporation and sublimation greater
Source: Neary et al (2005)
Total Runoff
Streams draining burned areas tend to have higher annual discharge. As part of their Forest Watershed and Riparian Disturbance (FORWARD) study, Burke et al. (2005) have described the hydrologic effects of wildfire in the Boreal Plain (the western Canadian Boreal Forest). They discuss runoff measured during May through October before and after a 1998 wildfire in the Virginia Hills. The ratio of base flow runoff in the burned watershed compared to

Chapter 2: Literature Review on the Impacts of Wildfire | 23
the reference watershed increased from 1.5 pre-fire to 1.6-3.8 in the four years post-fire. Streams draining areas affected by the 1933 Tillamook Burn had a 10% increase in annual water yield (Neary et al., 2005). Examples of data collected for fire-affected areas in the Cascade Mountain Ecoregions of the United States (both wildfire and prescribed burn) show increases in first year runoff of 18-42% (Neary et al., 2005).
The Santa Monica Mountains of southern California, which is a chaparral landscape, have experienced 10 large wildfires since 1949. Loaiciga et al. (2001) used decades of historical data to analyze how burning alters catchment streamflow in this area. A paired-catchment analysis allowed reconstruction of the expected natural streamflow in Malibu Creek during fire-impacted years. The estimated annual streamflow increase was up to 20-30% relative to non-fire years.
In contrast, however, a simulated rainfall study by Pierson et al. (2001) in burned rangeland did not find differences in infiltration, runoff/rainfall ratio, or cumulative runoff between burned and unburned hillslopes (Denio Fire, 85,004 acres (344 square kilometers), July 1999, Nevada). In that setting, the unburned soils were covered with dense dry litter and senescent grasses and were, therefore, relatively impermeable. However, the vegetation and litter on the unburned slopes did slow runoff and protect the soil from erosion.
Peak Flows
A critical consequence of forest disturbance by wildfire and the resulting loss of vegetation and decreased soil infiltration is an increase in peak flows. This effect can be variable and depends upon a number of factors (e.g., burn severity, terrain steepness, and climate) (Neary et al., 2005). Low-severity prescribed burns do not significantly increase peak flows, but severe wildfires can cause dramatic hydrologic changes due to a greater loss of vegetation and increased soil hydrophobicity; peak flow can vary from several times to over 100 times of those in unburned watersheds (Neary et al., 2011; Neary et al., 2005). Increased peak flows can be a particular problem in the Intermountain West, where short but intense precipitation events are common (Neary et al., 2005). During one thunderstorm in the area affected by the 2010 Fourmile Canyon Fire, stream discharge increased from 30 to 800 cubic feet per second (cfs) in less than five minutes (Writer and Murphy, 2012).
Table 2-3 provides examples of the effects of fire on peakflows in various ecosystem types; note that the factors for peakflow increases due to wildfires range from 1.4 to in excess of 2,000, with the very highest values associated with severe fire. Similarly large values (90-fold and 2,350-fold) have been reported due to intense rainfall following the 2002 Rodeo-Chediski Fire (ponderosa pine forest in Arizona; Ice et al., 2004).
Damming by large debris from a fire can further contribute to elevated peak flow; large pieces of wood can obstruct channels, causing water to pool. If a dam breaks, the water is released, triggering failures of downstream dams and a tremendous increase in discharge (Neary et al., 2005).

24 | Wildfire and Drinking Water Utilities
Table 2-3 Effects of harvesting and fire on peakflows.
Location Treatment Peakflow Increase
Factor Adirondack-New England Mixed Forest Province Hardwoods, NH Clearcut +2.0
Central Appalachian Broadleaf-Conifer Forest Province Hardwoods, NC Clearcut +1.1 Hardwoods, WV Clearcut +1.2
Coastal Plain Mixed Forest Province Loblolly Pine, NC Prescribed Fire +0.0
Cascade Mixed-Conifer-Meadow Forest Province Douglas-fir, OR Cut 50%, burn +1.1
Clearcut, burn +1.3 Wildfire +1.4
California Coastal Range Woodland-Shrub-Conifer Province Chaparral, CA Wildfire +20.0
+870.0 +6.5
Colorado Plateau Semi-Desert Province Chaparral, AZ Wildfire +5.0 (Summer)
+150.0 (Summer) +5.8 (Fall) +0.0 (Winter)
AZ-NM Mountains Semidesert-Woodland-Conifer Province Ponderosa pine, AZ Wildfire +96.1
Wildfire, Mod. +23.0 Wildfire, Severe +406.6
Wildfire, Severe +2232.0
Southern Rocky Mountains Steppe-Woodland-Conifer Province
Aspen-conifer, CO Clearcut, Prescribed burn +1.5
Ponderosa pine, NM Wildfire +100.0 Source: Neary et al, (2005)
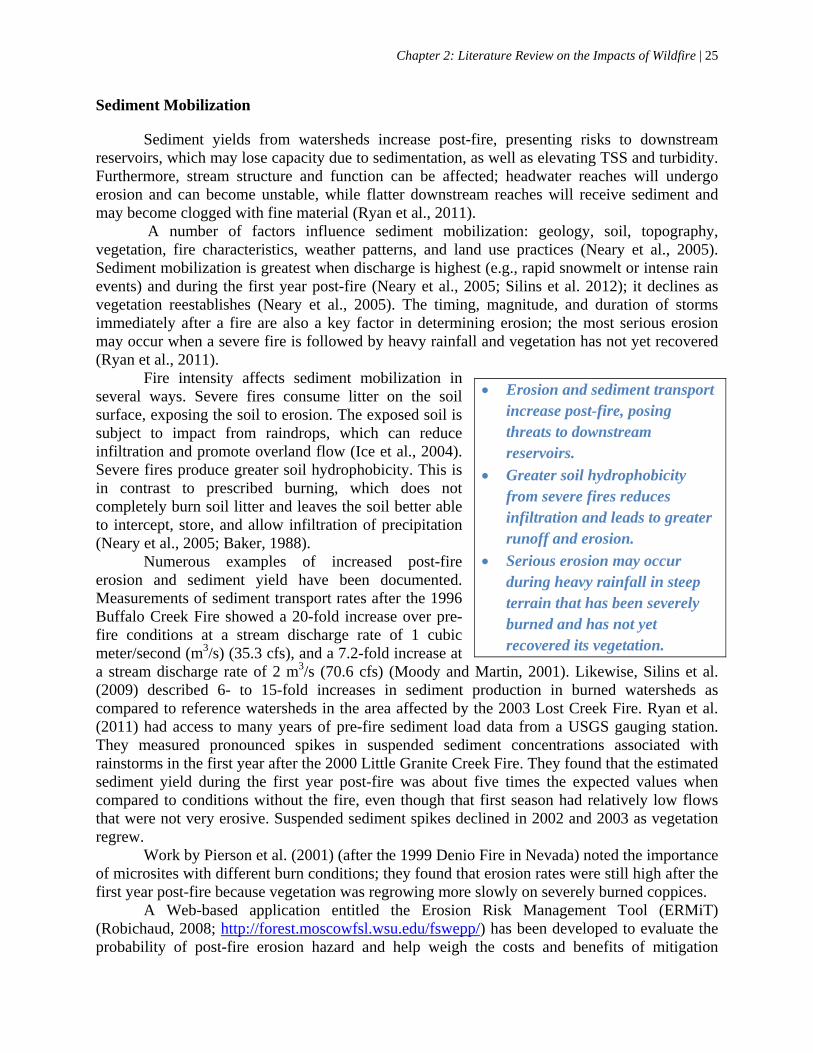
Chapter 2: Literature Review on the Impacts of Wildfire | 25
Sediment Mobilization
Sediment yields from watersheds increase post-fire, presenting risks to downstream reservoirs, which may lose capacity due to sedimentation, as well as elevating TSS and turbidity. Furthermore, stream structure and function can be affected; headwater reaches will undergo erosion and can become unstable, while flatter downstream reaches will receive sediment and may become clogged with fine material (Ryan et al., 2011).
A number of factors influence sediment mobilization: geology, soil, topography, vegetation, fire characteristics, weather patterns, and land use practices (Neary et al., 2005). Sediment mobilization is greatest when discharge is highest (e.g., rapid snowmelt or intense rain events) and during the first year post-fire (Neary et al., 2005; Silins et al. 2012); it declines as vegetation reestablishes (Neary et al., 2005). The timing, magnitude, and duration of storms immediately after a fire are also a key factor in determining erosion; the most serious erosion may occur when a severe fire is followed by heavy rainfall and vegetation has not yet recovered (Ryan et al., 2011).
Fire intensity affects sediment mobilization in several ways. Severe fires consume litter on the soil surface, exposing the soil to erosion. The exposed soil is subject to impact from raindrops, which can reduce infiltration and promote overland flow (Ice et al., 2004). Severe fires produce greater soil hydrophobicity. This is in contrast to prescribed burning, which does not completely burn soil litter and leaves the soil better able to intercept, store, and allow infiltration of precipitation (Neary et al., 2005; Baker, 1988).
Numerous examples of increased post-fire erosion and sediment yield have been documented. Measurements of sediment transport rates after the 1996 Buffalo Creek Fire showed a 20-fold increase over pre-fire conditions at a stream discharge rate of 1 cubic meter/second (m3/s) (35.3 cfs), and a 7.2-fold increase at a stream discharge rate of 2 m3/s (70.6 cfs) (Moody and Martin, 2001). Likewise, Silins et al. (2009) described 6- to 15-fold increases in sediment production in burned watersheds as compared to reference watersheds in the area affected by the 2003 Lost Creek Fire. Ryan et al. (2011) had access to many years of pre-fire sediment load data from a USGS gauging station. They measured pronounced spikes in suspended sediment concentrations associated with rainstorms in the first year after the 2000 Little Granite Creek Fire. They found that the estimated sediment yield during the first year post-fire was about five times the expected values when compared to conditions without the fire, even though that first season had relatively low flows that were not very erosive. Suspended sediment spikes declined in 2002 and 2003 as vegetation regrew.
Work by Pierson et al. (2001) (after the 1999 Denio Fire in Nevada) noted the importance of microsites with different burn conditions; they found that erosion rates were still high after the first year post-fire because vegetation was regrowing more slowly on severely burned coppices.
A Web-based application entitled the Erosion Risk Management Tool (ERMiT) (Robichaud, 2008; http://forest.moscowfsl.wsu.edu/fswepp/) has been developed to evaluate the probability of post-fire erosion hazard and help weigh the costs and benefits of mitigation
Erosion and sediment transport increase post-fire, posing threats to downstream reservoirs.
Greater soil hydrophobicity from severe fires reduces infiltration and leads to greater runoff and erosion.
Serious erosion may occur during heavy rainfall in steep terrain that has been severely burned and has not yet recovered its vegetation.

26 | Wildfire and Drinking Water Utilities
treatments. ERMiT uses probabilistic methods to predict erosion on burned and recovering forest, range, and chaparral lands, both with and without treatments. It allows managers to model hillslopes to determine the probabilities of erosion due to rain events and to prioritize mitigation efforts.
Debris Flows
Severe fire followed by intense rain can trigger devastating, dangerous debris flows and significant hillside erosion (e.g., Goode et al., 2012). See Figure 2-4 for a post-fire debris flow in Cable Canyon in California. These fast-moving flows are triggered by intense rainfall and can occur with little warning. Total rainfall may not have to be large to trigger debris flows, as some debris flows have been initiated by as little as 0.3 inches of rainfall in 30 minutes (Cannon, 2005). Because soil infiltration is often reduced after a wildfire, debris flows are generally caused by excessive erosion associated with large amounts of runoff. However, if rainfall is heavy and prolonged, infiltration and increased pore pressure in the soil may trigger a landslide (USGS, 2005).
Areas susceptible to debris flows have sedimentary or metamorphic bedrock and have had more than 65 percent of their area burned at moderate to high intensity. The thicker the sediments and soil, the more likely the area is to produce numerous debris flows. Steep slope is an additional factor. Cannon (2001) has studied fire-related debris flows in Colorado, New Mexico, and Southern California, noting that lithology, morphology, and the presence (or absence) of hydrophobic soils are key to triggering debris flows. Debris flows are unusual beyond the second rainy season after a fire because much of the available debris material would have eroded during the first rainy season (Cannon, 2005).
Neary et al. (2011) describe the consequences of the 2010 Schultz Fire in Arizona, which burned 15,073 acres (61 square kilometers) in the San Francisco Peaks area. The landscape in that area is steep (mostly greater than 30% grade and up to 100%), and vegetation consists of Ponderosa Pine and mixed conifers. The authors note that a heavy rainstorm produced debris flows; soil erosion in this area created a rill and gully system, and mineral soil loss was estimated to be greater than 3.9 inches (10 centimeters) in the upper parts of the watersheds.
Debris flows are, however, not a given. Little Granite Creek, near Bondurant, Wyoming, where a fire burned the area in August 2000, did not experience
debris flows although there was increased sediment yield. The area exhibited export of ash and charcoal-rich discharges and sediment-laden flows (Ryan et al., 2011). The authors note that drought conditions may be one reason for the lack of debris flows. They emphasize that watersheds’ responses to fires occur on a continuum, ranging from modest increases in runoff to flooding and debris flows.
The USGS’s Landslide Hazards Program (http://landslides.usgs.gov/) has been involved in multi-agency efforts with USFS, NRCS, and state geological surveys in western states to develop methods for estimating the likely locations and probability of occurrence of debris flows. This information can be used for planning emergency response, as well as rehabilitation.
Debris flows can occur with little warning under conditions of intense rainfall.
Risk is greater in areas with steep slopes.
Areas with thicker sediments and soil can produce multiple debris flows.
Debris flows are unusual after the second rainy season post-fire.

Chapter 2: Literature Review on the Impacts of Wildfire | 27
Source: USGS (2005)
Figure 2-4 Effects of a post-fire debris flow
IMPLICATIONS FOR DRINKING WATER SUPPLY AND TREATMENT
Utilities may be faced with several types of challenges arising from wildfires. An initial debris flow may affect reservoirs and intakes; the first heavy rain may bring significant changes in water quality; and longer-term watershed and water quality effects may occur for more than a year (Clark, 2010). The proximity of the water treatment plant (WTP) to the surface water source will affect how strongly the WTP is affected by wildfire-related water quality changes (Gill, 2004). Fire burning in the area of tributaries (e.g., Rodeo-Chediski fire in 2002) will have less of an impact than a fire that directly affects the raw water source (e.g., Hayman Fire in 2002). The effects of a fire on a drinking water utility may be mitigated by a reservoir located upstream of the WTP, which would allow particulates to settle and nutrients to be trapped before the raw water reaches the WTP (Gill, 2004).
Examples of fires that have affected WTPs include the 2002 Missionary Ridge Fire, which affected source water for the Durango treatment plant, and the 2009 Old Stage Fire, 2003 Overland Fire, and 2010 Fourmile Creek Fire, which all occurred within the Boulder Reservoir watershed. Of these, Boulder’s water supply was not affected by the 2009 Old Stage Fire because of the mitigating effects of two reservoirs. However, potential difficulties from the 2003 Overland Fire and the 2010 Fourmile Creek Fire were anticipated and were avoided by controlling which water sources were used after the fires (http://www.bouldercolorado.gov/files/Utilities/WRAB/2012/2012-5/WRAB%20Agenda%20Item%20May%2021%202012_Source%20Water.pdf). In 2012, the

28 | Wildfire and Drinking Water Utilities
Waldo Canyon Fire burned forests surrounding two reservoirs that provide 60% of the water supply for Colorado Springs. Rains carrying soil, debris, and black, sooty water have necessitated diversion of water around the main WTP (Arrandale, 2012). Fort Collins needed to close one of its intakes after the 2012 High Park Fire and continued to monitor ash and debris flow (Arrandale, 2012). Below are some of the specific water quality and other effects that utilities may encounter.
Reservoir Sedimentation
Excess sediment and debris flows may fill or otherwise disrupt reservoirs, infiltration basins, or treatment works (Meixner et al., 2004). An article by Kennedy (2011) of Denver Water emphasizes the high costs to utilities from wildfires. Denver Water spent more than $30 million during 2011 to dredge sediment and deal with water quality concerns related to both the 1996 Buffalo Creek Fire and the 2002 Hayman Fire. In particular, mobilization of sediment can result in reservoir sedimentation, curtailing the useful life of a reservoir. For example, the Buffalo Creek Fire took place upstream of the Strontia Springs Reservoir, which serves as a water source for Denver and Aurora. Kennedy notes that one storm after the Buffalo Creek Fire produced 15 acres of debris, deposited 10 years’ worth of sediment, and clogged the water delivery system. The reservoir lost about 30 years of its planned life; emergency cleanup operations were needed as a result of the debris flow; and the water supply now has a chronic turbidity problem (Miller and Yates, 2006). As another example, a thunderstorm after the 1994 Rabbit Creek Fire in Idaho deposited an estimated 500,056 cubic yards (382,320 cubic meters) of sediment in the watershed’s streams and reservoirs (Ice et al., 2004). In addition to sediment transport, debris flows may carry large boulders that may damage infrastructure such as intakes (Boerner et al., 2012).
Moody and Martin (2004) have developed a wildfire impact index to predict the effects of wildfires on reservoir sedimentation in the western United States. The method focuses on tall grass and short grass prairie ecoregions. It is based on sediment transport principles and takes into account fire frequency, soil erodibility, channel slope, and 30-minute maximum rainfall intensity. Of 8,106 dams within the chosen study area, 319 were predicted to have the highest vulnerability. In addition, there may be other dams downstream of the study area that may also receive sedimentation.
Water Quality
Variable source water quality arising after a wildfire presents challenges for drinking water treatment plants, which operate most efficiently when raw water quality is consistent. Furthermore, monitoring done at the watershed scale, which may be done monthly or annually, may not be adequate for drinking water utilities, who need continuous monitoring of critical parameters such as turbidity to make adjustments to treatment processes (Emelko et al., 2011). The following are example considerations regarding water quality.
Elevated turbidity
Meixner and Wohlgemuth (2004) note that the 2003 wildfires in southern California affected treatment works as far as 100 miles from the fire by causing elevated sediment loads (see Santa Ana Watershed Project Authority; www.sawpa.org). Although turbidity values can be

Chapter 2: Literature Review on the Impacts of Wildfire | 29
expected to decrease in subsequent storms, they may remain high enough to necessitate increased pre-treatment in order to remove suspended sediments. High turbidity loads into a conventional WTP require the use of additional coagulant and result in shorter filter run times and increased backwashing frequency. These treatment adjustments in turn produce greater volumes of sludge and backwash water that need to be disposed of. If a drinking water utility relies on membrane filtration, the increased turbidity may be too excessive for the membrane filters, and it may become necessary to retrofit the plant to handle the additional suspended solids load (Emelko et al., 2011).
The first major storm after the 2002 Missionary Ridge Fire resulted in a raw water turbidity value of 3,640 NTU at the Durango Stream intake. The pre-fire value was only 1.8 NTU, and the first light rain produced a value of 38.5 NTU (Clark, 2010). Spring runoff in May 2003 produced a value of 23.2 NTU. In Santa Barbara, the 2007 Sedgewick Fire affected the Gibraltar and Lake Cachuma reservoirs. Turbidity values of 23 and 15 NTU, respectively, were associated with the January 2008 first flush. By January 2009, turbidity had decreased to 12 and 4.6 NTU, respectively (Clark, 2010). In the Lake Tahoe area, after the 2007 Angora Fire, turbidity in Angora Creek increased 3.9-fold in the two years after the fire. Fort Collins registered turbidity spikes in the Poudre River up into the hundreds of NTUs coinciding with increases in river stage (Voytko, 2010).
Dissolved Organic Carbon
Changes in dissolved organic carbon can affect coagulant dosing and oxidant demand during drinking water treatment. Taste and odor problems may also occur or worsen, and if the natural organic matter reacts with chlorine and other disinfectants, increased concentrations of disinfection by-products (DBPs) such as trihalomethanes and haloacetic acids will result (Edzwald, 2010). Organic carbon resulting from fire is more humic and aromatic than pre-fire organic carbon and, therefore, more likely to produce DBPs. Boerner et al. (2012) note that data collected after the 2002 Hayman Fire showed increases in DOC-normalized specific ultraviolet absorbance (SUVA) values, which are correlated with the potential for formation of trihalomethanes. They recommend use of activated carbon to remove the additional organic load.
The first major storm after the Missionary Ridge Fire (in 2002) resulted in a raw water DOC content of 18.7 mg/L. The pre-fire value was 1.4 mg/L, and the first light rain resulted in raw water with 3.32 mg/L. By May, 2003, spring runoff produced raw water with a DOC concentration of 21.2 mg/L (Clark, 2002). At the Santa Barbara reservoirs (Gibraltar and Lake Cachuma), the first flush in January 2008 resulted in DOC concentrations of 23 and 4.8 mg/L, respectively. In January 2009, DOC concentrations were 7.9 and 4.1 mg/L, respectively (Clark, 2010). Treatment upgrades at Durango included a new rapid mix, flocculation, and powdered activated carbon (PAC) feed (Clark, 2010). At Durango, Clark (2010) reports that the raw water affected by fire can have high chlorine demand. As noted above, the organic material in post-fire
Wildfires cause variability and spikes in water quality, for which the water treatment plant may need to compensate.
Elevated turbidity has been documented at water treatment plants.
Changes in DOC may necessitate changes in coagulant dosing and affect oxygen demand.
Pulses of nitrate may exceed the MCL of 10 mg/L.
Jar testing can be useful for adjusting treatment to respond to fire-related water quality changes.

30 | Wildfire and Drinking Water Utilities
raw water is predominantly humic; Santa Barbara used a PAC dose of 20 mg/L to remove TOC (Clark, 2010).
Other Constituents
As discussed previously, export of nitrate and other nutrients from watersheds can increase post-fire. Increased nitrate concentrations can exceed the federal drinking water standard of 10 mg/L (Riggan et al., 1994; Meixner and Wohlgemuth, 2004), and increased dissolved organic nitrogen contributes to DBP formation (Emelko et al., 2011). At Lake Tahoe, nitrate increased approximately 8.5 fold post-fire, in addition to a 2-fold increase in total Kjeldhal nitrogen/total nitrogen and a nearly 2-fold increase in total phosphorous (Sciuto, 2010).
Deposition of ash after a fire can increase pH and alkalinity in soil and water; pH can exceed 8.5 and has been documented as high as 10, while alkalinity has been measured as high as 300 mg/L in Santa Barbara after the 2007 Zaca Fire (Boerner et al., 2012). Durango saw an increase in their raw water alkalinity from 102 mg/L (pre-fire) to 123 mg/L in the first light rain, 361 mg/L in the first major flush, and a decrease to 103 in the 2003 spring runoff. The Santa Barbara reservoirs, however, saw lower alkalinity values in the first flush (January 2008) after the 2007 fires than in January 2009 or January 2010 (Clark, 2010).
Some elevation of metals may occur post-fire, with elevated Fe and Mn possibly causing treatment issues. Boerner et al. (2012) note that for the 2002 Hayman Fire, only aluminum (Al), Fe, and Mn exceeded secondary standards. However, no metal standards were exceeded due to the Fourmile Canyon Fire. The first major flush after the 2002 Missionary Ridge Fire produced Fe and Mn concentrations of 5.55 and 5.60 mg/L, respectively (Clark, 2010). In spring runoff (May 2003), Fe and Mn concentrations had decreased to 0.17 and 0.08 mg/L, respectively. Durango instituted a potassium permanganate (KMnO4) feed at the terminal reservoir entrance to reduce Fe and Mn levels (Clark, 2010).
Treatability Studies
When considering the effects of wildfire on Golden, Colorado’s water supply, Boerner et al. (2012) explored treatment and mitigation strategies via bench and pilot-scale studies. Using the results of isotherm experiments, they provided recommendations for coagulant doses to control turbidity and the use of granular activated carbon to control TOC concentrations. Emelko et al. (2011) conducted jar tests to determine optimal coagulant doses for treating water affected by the 2003 Lost Creek Fire in Alberta. Jar testing may increase in importance as a treatment tool after a wildfire due to the associated changes in pH and alkalinity as well as turbidity.
WATERSHED AND WATER QUALITY RECOVERY
Recovery of watersheds generally takes 4 to 8 years, and streams can be affected for approximately 4 to 5 years after a fire (Clark, 2010). Key factors in determining the changes that a fire will cause in a watershed are the predominant soil type, bedrock, and pre-fire baseline stream chemistry. Streams draining granitic bedrock are particularly likely to react to wildfire, as in the case of the 2002 Hayman Fire, which burned areas underlain by the Pikes Peak Granite and where basins typically had low pre-fire concentrations of dissolved solids (Rhoades et al., 2011). Such areas may take a long time to recover; areas affected by the 2002 Hayman Fire are still recovering ten years after the fire.

Chapter 2: Literature Review on the Impacts of Wildfire | 31
Rates of hillslope erosion have been thought to typically return to pre-burn levels within a few years to a decade (Ryan et al., 2011; MacDonald and Robichaud, 2008; Moody and Martin, 2001). In a study of 600 plots in the southern Sierra Nevada (2004-2006), Berg and Azuma (2010) found that rilling was generally not seen beyond four years post-fire. Recent work by Ryan and Dwire (2012) on the 2000 Boulder Creek Fire, however, has documented elevated suspended sediment yields eight years post-fire, thought to be the result of channel destabilization due to large wood debris from the burned areas.
Return to pre-fire erosion rates depends on many site-specific characteristics, including fire severity, vegetation type, soil type, and climate (Berg and Azuma, 2010). Erosion rates can remain high in areas with coarse
textured soils, where the recovery of plant life tends to be much slower (MacDonald and Robichaud, 2008; Rhoades et al., 2011). If revegetation is rapid, erosion rates will recover more quickly. If soils are heavily burned and are more hydrophobic, revegetation and recovery will be slower; hydrophobic conditions have been documented to last up to a year (Kolb, 2002).
A number of studies have monitored recovery with respect to water quality over the first several years. Recovery rates vary according to different conditions. For example, in headwater streams in Alberta’s Rocky Mountains nutrient export in stream water has been documented three years after the 2003 Lost Creek Fire (Bladon et al., 2008). On the Canadian Boreal Plain, increased export of particulate phosphorus has been seen four years post-fire (associated with the 1998 Virginia Hills Fire) (Burket et al., 2005). However, monitoring of water quality associated with the 2002 Hayman and Rodeo-Chediski Fires showed that concentrations returned to normal within two years for most constituents (Gill, 2004). Water quality recovery is site-specific, and several years’ worth of monitoring is warranted.
Post-Fire Monitoring
In the event of a wildfire, a well-planned watershed monitoring program is needed to answer key questions about the severity and duration of changes in water quality, quantity, and sediment transport. Watershed managers and utilities need to understand pollutant loadings from burned areas, how long such loadings may persist, and what types of management strategies may be required (Stein, 2008; Voytko, 2012). There have generally been no standard protocols for post-fire water quality monitoring, funding is scarce, and there has been little coordination among relevant local and regional entities. The Southern California Coastal Water Research Project (Stein and Brown, 2009) has attempted to address the need for water quality monitoring after a wildfire by producing a step-by-step guide to creating a regional monitoring program (see Table 2-4), including strategies for implementation and funding.
Stein and Brown (2009) propose designing monitoring programs around three management questions:
1. How does post-fire runoff affect contaminant flux? 2. What is the effect of post-fire runoff on downstream receiving waters?
Watershed recovery is highly variable. It generally takes 4-8 years, but some areas (e.g., Hayman Fire) may take longer.
Bedrock, soils, vegetation type, and climate affect recovery times.
Although the worse effects occur within the first year or two post-fire, water quality changes may persist for several years, depending upon the watershed and its rate of recovery.
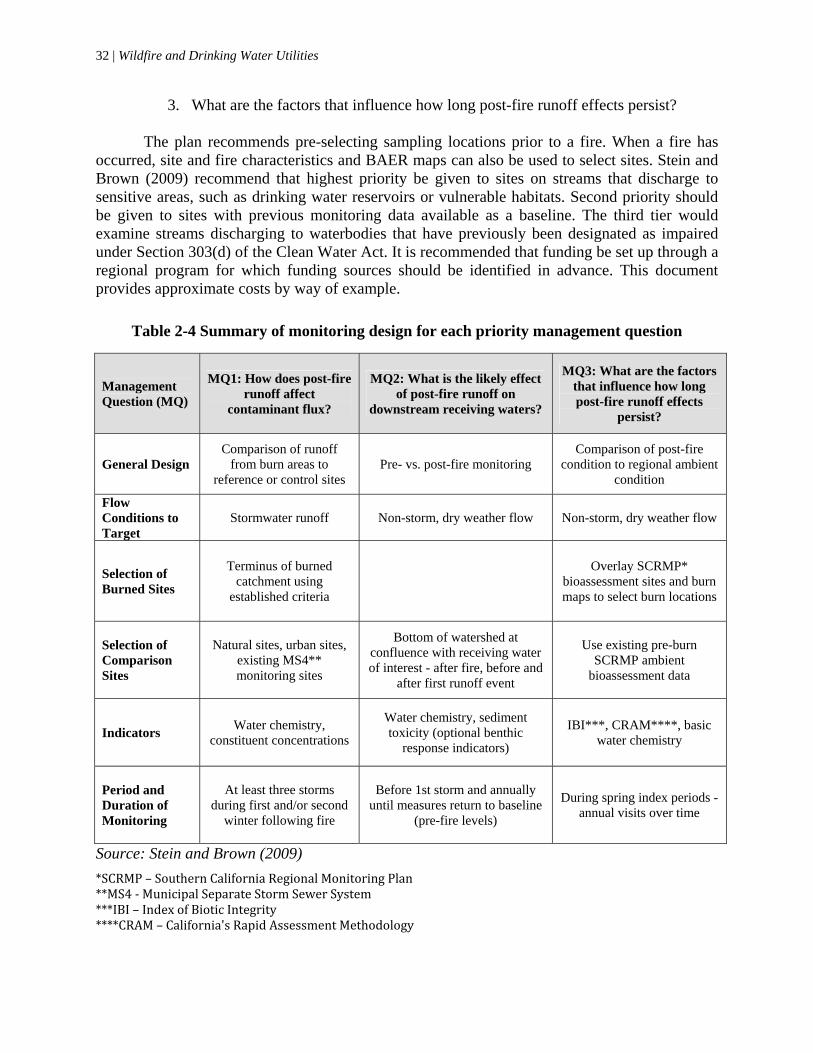
32 | Wildfire and Drinking Water Utilities
3. What are the factors that influence how long post-fire runoff effects persist? The plan recommends pre-selecting sampling locations prior to a fire. When a fire has
occurred, site and fire characteristics and BAER maps can also be used to select sites. Stein and Brown (2009) recommend that highest priority be given to sites on streams that discharge to sensitive areas, such as drinking water reservoirs or vulnerable habitats. Second priority should be given to sites with previous monitoring data available as a baseline. The third tier would examine streams discharging to waterbodies that have previously been designated as impaired under Section 303(d) of the Clean Water Act. It is recommended that funding be set up through a regional program for which funding sources should be identified in advance. This document provides approximate costs by way of example.
Table 2-4 Summary of monitoring design for each priority management question
Management Question (MQ)
MQ1: How does post-fire runoff affect
contaminant flux?
MQ2: What is the likely effect of post-fire runoff on
downstream receiving waters?
MQ3: What are the factors that influence how long post-fire runoff effects
persist?
General Design Comparison of runoff
from burn areas to reference or control sites
Pre- vs. post-fire monitoring Comparison of post-fire
condition to regional ambient condition
Flow Conditions to Target
Stormwater runoff Non-storm, dry weather flow Non-storm, dry weather flow
Selection of Burned Sites
Terminus of burned catchment using
established criteria
Overlay SCRMP* bioassessment sites and burn maps to select burn locations
Selection of Comparison Sites
Natural sites, urban sites, existing MS4** monitoring sites
Bottom of watershed at confluence with receiving water of interest - after fire, before and
after first runoff event
Use existing pre-burn SCRMP ambient
bioassessment data
Indicators Water chemistry,
constituent concentrations
Water chemistry, sediment toxicity (optional benthic
response indicators)
IBI***, CRAM****, basic water chemistry
Period and Duration of Monitoring
At least three storms during first and/or second
winter following fire
Before 1st storm and annually until measures return to baseline
(pre-fire levels)
During spring index periods - annual visits over time
Source: Stein and Brown (2009)
*SCRMP–SouthernCaliforniaRegionalMonitoringPlan**MS4‐MunicipalSeparateStormSewerSystem***IBI–IndexofBioticIntegrity****CRAM–California'sRapidAssessmentMethodology
Chapter 2: Literature Review on the Impacts of Wildfire | 33
WATERSHED REHABILITATION
Emergency Recovery
The USFS’s Burn Area Emergency Response (BAER) process is a short-term mitigation strategy for federal lands. It is designed to stabilize a burned area following wildfire and focuses on ecological recovery, particularly with respect to restoring native vegetation and reducing the risk of severe erosion. A BAER team is assembled in response to fire and typically includes a range of local experts, such as soil scientists, hydrologists, ecologists, and archaeologists. This team is responsible for: 1) assessing post-fire effects, 2) identifying at-risk values, and 3) recommending cost-effective treatments to reduce the risk of damage or loss (Robichaud et al., 2009; Ice, 2004). BAER teams are particularly interested in evaluating how fire affects ground cover and soil because of the consequences for hydrologic functions. A map that indicates the severity of soil burn following a wildfire is an important component of the initial assessment; it allows BAER teams to identify which burned areas may pose a risk to downstream areas.
A Burned Area Report is filed by the BAER team. It describes the hydrologic and soil conditions as well as predicted increases in runoff, erosion, and sedimentation (Robichaud et al., 2005). Watershed descriptions include location, size, vegetation, geology, soils, streams, and other information. Areas of different burn severities are identified as well as areas with water repellent soils. Parsons et al. (2010) have published a field guide to help with mapping soil burn severity using indicators of soil conditions associated with different severity classes. After initial assessments are completed, models (e.g., Water Erosion Prediction Project or WEPP) are used to predict runoff, peak flows, and erosion, and a standardized valuation tool rates the need for and cost of particular treatments (e.g., ERMiT). The information in the report is evaluated along with onsite and downstream values to plan emergency rehabilitation measures.
BAER Treatments
BAER treatments can be grouped into three different categories: hillslope, channel, and road treatments. Hillslope treatments are designed to reduce erosion and hold soil and sediments on site. Such treatments may include straw mulching with dry material to control invasive species and reduce erosion, and hydromulching using a liquid mixture containing mulch and seeds. A good hydromulching system combines the careful selection of seeds, mulch, fertilizer, and soil stabilizer (King and Sims, 1989). Contour felling involves cutting down burned trees and placing the delimbed trunks on the land so that they can trap runoff and sediment (Wagenbrenner et al., 2006). Another technique involves the large-scale application of a polyacrylamide (PAM), which is intended to reduce soil sealing and sediment production (MacDonald and Robichaud, 2008). Other treatments, such as soil scarification, aim at increasing
BAER: U.S. Forest Service’s short term emergency program for post-fire landscape stabilization and erosion prevention on federal lands.
A BAER team performs an assessment, files a report, creates a map of the burned conditions, and recommends hillslope, channel, and road treatments such as seeding, mulching, check dams (i.e., small temporary or permanent dams across a minor channel, swale, or drainage ditch), and other measures.

34 | Wildfire and Drinking Water Utilities
the roughness of the terrain through techniques like tilling or contour trenching to trap eroding sediments (Robichaud et al., 2005).
A second category of treatments are channel treatments, which direct eroding sediments into channels to limit sediment transport. These may include the installation of check dams such as logs or straw bales, or grade stabilizers, which decrease the slope of a channel, thereby reducing the stream velocity.
The third category consists of road treatments, designed to protect roads from the increased flow and erosion resulting from wildfire. This includes culvert, ditch, and bridge improvements that protect the road from excess runoff and may involve the construction of overflow structures in areas prone to high stream stages (Neary et al., 2000). The Burned Area Emergency Response Treatments Catalog (Napper, 2006) provides additional detail on the array of BAER treatments that teams can use to determine the appropriate treatment for a specific post-wildfire emergency. Another available resource is The Interagency Burned Area Emergency Response Guidebook (U.S. Department of Interior [USDOI] et al., 2006), which is designed to help emergency responders develop the most effective and cost-conscious wildfire response plan.
Robichaud et al. (2003) provide an example of the post-fire rehabilitation of the 2002 Hayman Fire. The burn severity map for the Hayman Fire was derived from satellite imagery, with ground truthing. The team classified 35% of the burned area as high severity burn, 16% as moderate severity, 34% as low severity, and 15% as unburned. Fifty percent of the moderate severity area was considered for post-fire rehabilitation treatment. Runoff volumes were predicted using the NRCS’ WILDCAT4 model. Soil was taken into consideration; the granitic Pikes Peak bedrock gives rise to soils that are susceptible to erosion. Other potential problems evaluated included the potential for sediment mobilization from critical areas. Risks were evaluated for the following types of problems: flooding, filling ponds and threatening dams, debris flows, water quality effects, and threats to aquatic life. Based on these considerations, the BAER team formulated treatment objectives, including reducing impacts on the Denver water supply reservoirs. A variety of land, channel, and road treatments were then recommended for federal lands affected by the fire (Robichaud et al., 2005).
Effectiveness of Emergency Rehabilitation Treatments
Studies of the effectiveness of emergency rehabilitation treatments evaluate the abilities of the various methods to limit erosion and to promote the reestablishment of vegetation. Work by MacDonald and Robichaud (2008) to evaluate the effectiveness of four BAER treatments (straw mulching, hydromulching, scarification and seeding, and application of PAM) indicated that straw mulch and aerial hydromulch were the most effective forms of treatment because both significantly reduced post-fire erosion rates and increased the amount of ground cover on the test sites following severe wildfire. A study by Wagenbrenner et al. (2006) found mulching to be much more effective than seeding in reducing sediment yields. Fertilization in conjunction with seeding has been shown to be effective for increasing plant cover and promoting growth of natural vegetation (Peterson et al., 2007; Dodson et al., 2010).
Funding for Wildfire Rehabilitation
Federal funding is available for short-term wildfire recovery activities. The Emergency Watershed Program (EWP), within the U.S. Department of Agriculture (USDA) and administered by NRCS, is an emergency recovery program. It focuses on relieving imminent

Chapter 2: Literature Review on the Impacts of Wildfire | 35
hazards to life and property in the aftermath of natural disasters, including wildfires (USDA NRCS, http://www.nrcs.usda.gov). The EWP provides assistance to both public and private landowners who are able to provide matching funds. Also under the USDA, the USFS BAER program can provide funding for emergency post-wildfire response activities on National Forests and Grasslands, as discussed earlier in this section.
The DOI’s Emergency Stabilization (ES) program provides assistance for post-fire flood and landslide prevention on DOI federal lands. ES funds are available for activities conducted within one year of containment of the fire and for monitoring activities for up to three years after containment (http://www.doi.gov/pmb/owf/es_bar.cfm).
For long-term wildfire rehabilitation in the DOI, the majority of federal funding has been provided to the BLM for the purpose of rehabilitation of burned lands (Gorte, 2011). DOI’s Burned Area Rehabilitation (BAR) program also carries out non-emergency restoration on fire-damaged lands (http://www.fws.gov/fire/ifcc/esr/home.htm). This program’s funding is split between the Bureau of Indian Affairs, BLM, the Fish and Wildlife Service, and the National Park Service. The USFS receives no special funding that is specific for non-emergency or long-term wildfire site rehabilitation but utilizes funding from other accounts such as watershed protection to perform restoration.
Long-term Recovery
BAER treatments are typically selected to quickly stabilize burned areas and protect structures or watersheds. Their effectiveness is generally evaluated by their ability to mitigate the threats for which they were selected. However, within two to three years after a fire, land management priorities shift, and long-term effects of BAER treatments may no longer be reported. Robichaud et al. (2009) recommend that considerations for long-term environmental consequences of BAER treatments be analyzed and eventually integrated into the treatment selection process.
The intensity and duration of a wildfire are key factors in determining post-fire forest succession and how long it will take for a watershed to recover (Ice, 2004). In the case of the Hayman Fire, the slow pace of tree colonization and forest regrowth will cause the watershed to recover for decades to come. USFS has widely implemented prescribed burning and other techniques to reduce hazardous fuel loads and diminish the risk of severe wildfires. Although active forest management remains controversial, projections of longer fire seasons and the increasing frequency of severe wildfires underscores the need for long-term and comprehensive monitoring of watershed conditions.
SUMMARY
Wildfires have the potential to affect raw water quality and quantity for water systems. Effects may take the form of sedimentation in reservoirs, elevated turbidity, increased organic carbon, and increased nutrient concentrations; systems may find that they need to adapt their treatment processes to accommodate such changes. The most dramatic wildfire effects, such as very high peakflows in streams, excess sediment transport, and debris flows are manifest in the first wet season after a fire, but water quality may be altered for years after a fire. More information is needed on appropriate monitoring strategies for drinking water utilities because they may need information on a more frequent basis than is typically acquired when a watershed is studied.

36 | Wildfire and Drinking Water Utilities
Steps to prepare for wildfire can include assessment of the vulnerability of the watershed to wildfire, assessment of the vulnerability of the system, and development of emergency response plans. Options for risk reduction prior to a fire include hazardous fuels reduction in a vulnerable watershed and other source water protection measures (e.g., buffer strips), but additional information is needed on source water protection specifically geared towards wildfire risks. Post-fire, burned area emergency rehabilitation (BAER) measures may be employed to promote rapid stabilization of the land surface, reducing erosion.

37
CHAPTER 3 SURVEY ON THE IMPACTS OF WILDFIRE ON DRINKING WATER SYSTEMS
The Foundation administered a survey (Appendix B) to gather information regarding drinking water systems’ wildfire risk mitigation and response activities. The results of the survey are intended to serve as guidance for drinking water utilities that are vulnerable to wildfires. The survey was developed under the guidance of a Foundation project steering committee and consisted of multiple choice and open-ended questions addressing a variety of issues related to mitigating the risk of wildfires and their damages. A total of 27 individuals responded to the survey in part or in whole.
Following the close of the online survey, Cadmus staff interviewed five survey respondents who volunteered to provide additional information related to their wildfire risk mitigation and recovery activities. The purpose of the interviews was to collect additional information detailing the wildfire risk mitigation and response activities conducted by these drinking water utilities and to identify lessons learned.
This report summarizes wildfire risk mitigation and response activities implemented by drinking water utilities as discussed in the survey responses and during the follow-up interviews. Throughout this report, a survey “respondent” refers to a unique response to the survey. The report references some wildfire assessment tools and projects that respondents identified in their survey responses and during interviews. The Foundation does not endorse these tools or services and has included them here to serve as examples of the strategies other drinking water utilities have found successful. This report also includes a brief discussion of cost information and funding opportunities for wildfire risk mitigation and response activities, as identified by the survey respondents. Finally, the report includes a description of survey respondents’ wildfire emergency response and preparedness activities.
WILDFIRES AND SURVEY RESPONDENTS
According to the National Interagency Fire Center, the U.S. has experienced 144 wildfires that burned over 100,000 acres each in the past 15 years. In 2012 alone, there were 67,774 wildfires that burned a total of 9.3 million acres. 2012 was the second most destructive wildfire year on record in terms of acreage burned since 1960, exceeded only in 2006, during which a total of 9.8 million acres were burned.4 The respondents to this survey reported over 30 wildfires affecting their watersheds and drinking water operations, with burn areas ranging from approximately 300 to 138,000 acres.
Respondents to this survey included not only drinking water utility representatives, but also individuals who identified themselves as regulators responsible for helping drinking water utilities implement risk mitigation and recovery activities. Survey respondents also did not necessarily represent one specific drinking water system. Several respondents, representing drinking water regulators and drinking water utilities, are responsible for several drinking water systems.
The survey respondents represented a variety of drinking water utilities in different countries, using both ground and surface waters, and incorporating a range of utility sizes. Table
4 National Interagency Fire Center, http://www.nifc.gov/fireInfo/fireInfo_statistics

38 | Wildfire and Drinking Water Utilities
3-1 summarizes the types of drinking water utilities represented by the survey respondents as well as the populations served by these water systems.
Table 3-1 Summary of drinking water utilities represented by survey respondents
State/Country Number of
Water Systems Ground Water Surface Water Total Population
Arizona 1 0 1 1,533,582California 5 0 5 2,782,915Colorado 5 0 5 1,428,033Nevada* 20 13 7 368,907Oregon 2 0 2 156,932Washington 2 0 2 984,172Australia 1 Unknown Unknown 129,000Canada 4 Unknown Unknown 479,701Total 40 13 21 7,863,242*Washoe County Department of Water Resources is responsible for the day-to-day operation of the County's 18 water systems. These 18 systems and their populations are included in the totals for Nevada in this table but will be referenced as a single system throughout the remainder of this report. Eighteen unique drinking water utilities responded to this survey. Sixteen of these
drinking water utilities have been affected by wildfires. Combined, these 16 drinking water utilities serve approximately 6.3 million people. Table 3-2 provides a breakdown of the populations served by drinking water utilities that reported problems caused by wildfires.
Table 3-2 Populations served by drinking water utilities that reported effects from wildfires
State/Country Experienced Impacts
from Wildfire Arizona 1,533,582California 2,782,915Colorado 1,291,580Nevada 368,907Oregon 90,932Australia 129,000Canada 146,000Total 6,342,916
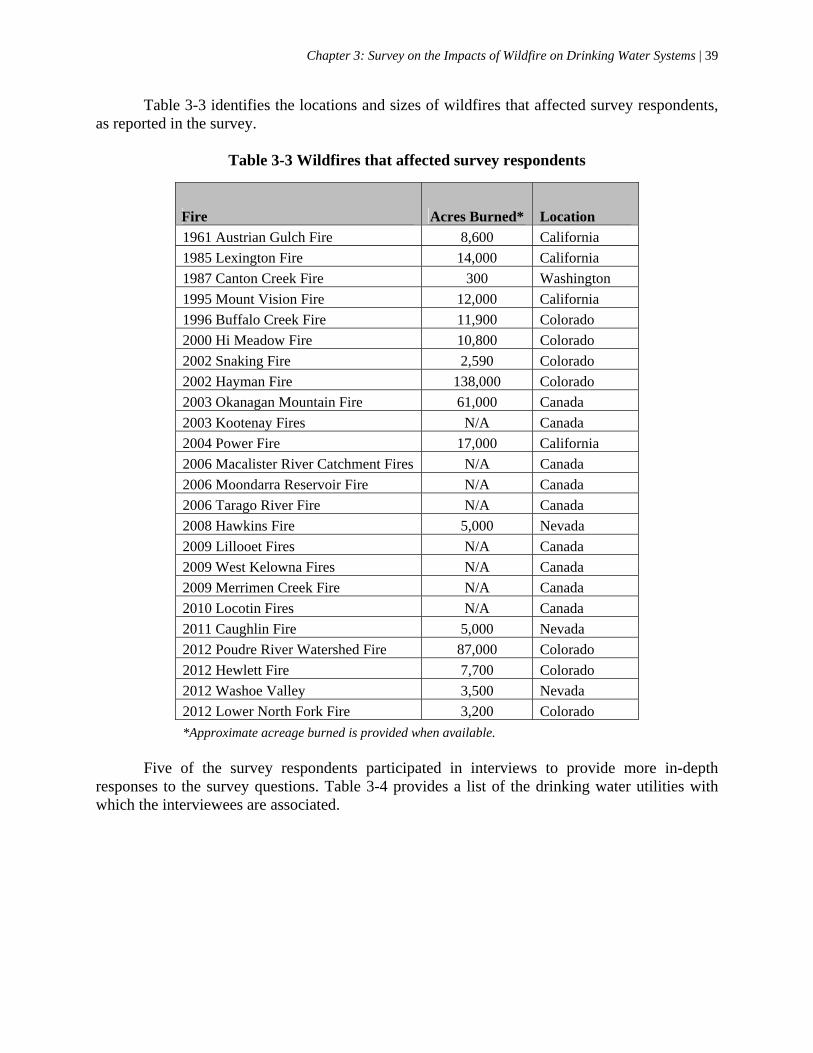
Chapter 3: Survey on the Impacts of Wildfire on Drinking Water Systems | 39
Table 3-3 identifies the locations and sizes of wildfires that affected survey respondents, as reported in the survey.
Table 3-3 Wildfires that affected survey respondents
Fire Acres Burned* Location
1961 Austrian Gulch Fire 8,600 California
1985 Lexington Fire 14,000 California
1987 Canton Creek Fire 300 Washington
1995 Mount Vision Fire 12,000 California
1996 Buffalo Creek Fire 11,900 Colorado
2000 Hi Meadow Fire 10,800 Colorado
2002 Snaking Fire 2,590 Colorado
2002 Hayman Fire 138,000 Colorado
2003 Okanagan Mountain Fire 61,000 Canada
2003 Kootenay Fires N/A Canada
2004 Power Fire 17,000 California
2006 Macalister River Catchment Fires N/A Canada
2006 Moondarra Reservoir Fire N/A Canada
2006 Tarago River Fire N/A Canada
2008 Hawkins Fire 5,000 Nevada
2009 Lillooet Fires N/A Canada
2009 West Kelowna Fires N/A Canada
2009 Merrimen Creek Fire N/A Canada
2010 Locotin Fires N/A Canada
2011 Caughlin Fire 5,000 Nevada
2012 Poudre River Watershed Fire 87,000 Colorado
2012 Hewlett Fire 7,700 Colorado
2012 Washoe Valley 3,500 Nevada
2012 Lower North Fork Fire 3,200 Colorado
*Approximate acreage burned is provided when available. Five of the survey respondents participated in interviews to provide more in-depth
responses to the survey questions. Table 3-4 provides a list of the drinking water utilities with which the interviewees are associated.

40 | Wildfire and Drinking Water Utilities
Table 3-4 Interviewed drinking water utilities
Drinking Water Utility State City of Boulder Utilities Division Colorado East Bay Municipal Utilities Division (EBMUD) California Medford Water Commission Oregon Santa Cruz Water Department (SCWD) California San Jose Water Company (SJWC) California
MITIGATING THE RISK OF WILDFIRE
Wildfire Hazard Assessments
The survey respondents use several approaches to better understand their drinking water systems’ infrastructure and watershed vulnerabilities to wildfire. Understanding and identifying these risks is critical for implementing targeted wildfire mitigation activities. Respondents commonly indicated that they have conducted some kind of wildfire hazard assessment and reported a variety of useful hazard assessment tools. These include fire behavior simulators (such as FlamMap5 [Figure 3-1] and the Fire and Fuels Extension of Forest Vegetation Simulator6) and topographic modeling (such as the use of Light Detection and Ranging (LIDAR) data and GIS).
Fire behavior simulators use input information such as the type and extent of groundcover, type of top level vegetation, soil type, topography, access routes, etc. to identify how a fire would burn throughout the assessed area, predicting key wildfire characteristics such as how quickly and in what direction it would burn. The benefits of using fire behavior simulators are multi-fold. First, they help drinking water utilities identify areas in their watersheds that are most vulnerable to wildfire. Drinking water utilities can use these results to prioritize areas for fuels reduction efforts and to better understand the most critical wildfire risk mitigation activities in the watershed. A drinking water utility can also use these assessments to target priority areas for additional access for firefighting activities. Hazard assessments can identify areas inaccessible to fire equipment, priority areas for fuel breaks, and areas where the system’s infrastructure is most vulnerable to wildfire. These results can also provide drinking water utilities with the information they need to develop comprehensive wildfire risk mitigation and response plans. Drinking water utilities with detailed wildfire risk information may also be better positioned to garner support and funding for their wildfire mitigation activities.
5 FlamMap is available at http://www.firemodels.org/index.php/national-systems/flammap 6 The Forest Vegetation Simulator is available from U.S. Forest Service at http://www.fs.fed.us/fmsc/fvs/
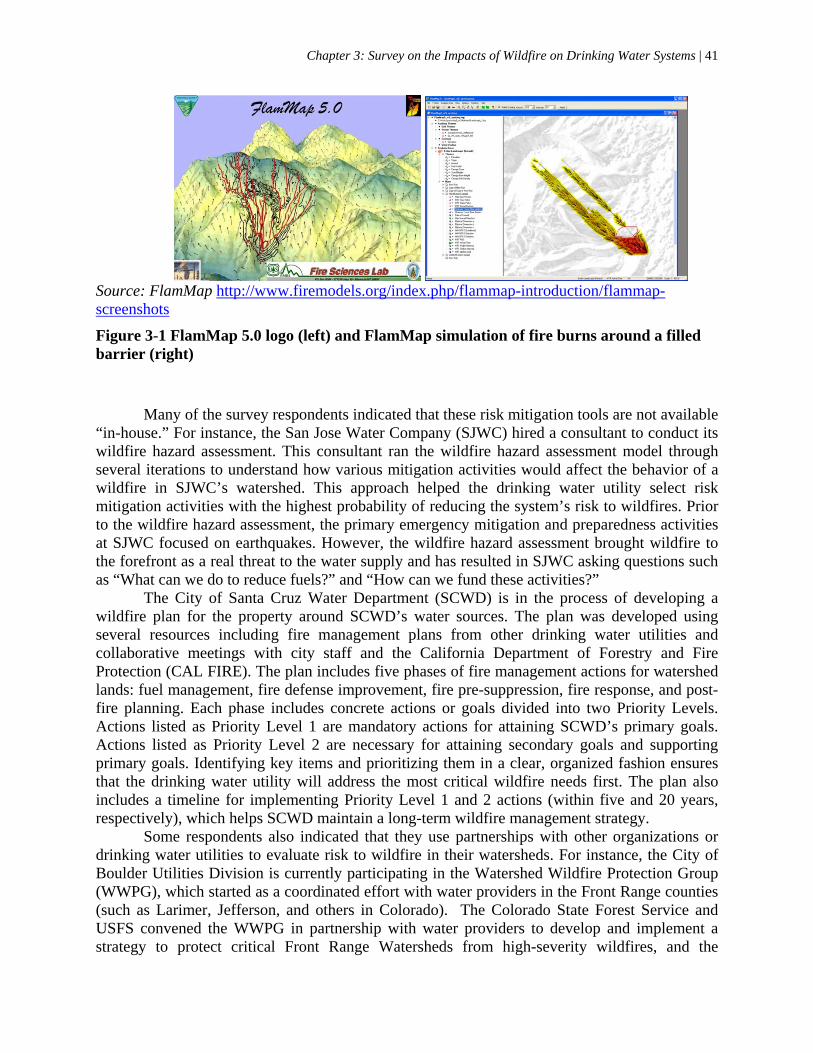
Chapter 3: Survey on the Impacts of Wildfire on Drinking Water Systems | 41
Source: FlamMap http://www.firemodels.org/index.php/flammap-introduction/flammap-screenshots
Figure 3-1 FlamMap 5.0 logo (left) and FlamMap simulation of fire burns around a filled barrier (right)
Many of the survey respondents indicated that these risk mitigation tools are not available
“in-house.” For instance, the San Jose Water Company (SJWC) hired a consultant to conduct its wildfire hazard assessment. This consultant ran the wildfire hazard assessment model through several iterations to understand how various mitigation activities would affect the behavior of a wildfire in SJWC’s watershed. This approach helped the drinking water utility select risk mitigation activities with the highest probability of reducing the system’s risk to wildfires. Prior to the wildfire hazard assessment, the primary emergency mitigation and preparedness activities at SJWC focused on earthquakes. However, the wildfire hazard assessment brought wildfire to the forefront as a real threat to the water supply and has resulted in SJWC asking questions such as “What can we do to reduce fuels?” and “How can we fund these activities?”
The City of Santa Cruz Water Department (SCWD) is in the process of developing a wildfire plan for the property around SCWD’s water sources. The plan was developed using several resources including fire management plans from other drinking water utilities and collaborative meetings with city staff and the California Department of Forestry and Fire Protection (CAL FIRE). The plan includes five phases of fire management actions for watershed lands: fuel management, fire defense improvement, fire pre-suppression, fire response, and post-fire planning. Each phase includes concrete actions or goals divided into two Priority Levels. Actions listed as Priority Level 1 are mandatory actions for attaining SCWD’s primary goals. Actions listed as Priority Level 2 are necessary for attaining secondary goals and supporting primary goals. Identifying key items and prioritizing them in a clear, organized fashion ensures that the drinking water utility will address the most critical wildfire needs first. The plan also includes a timeline for implementing Priority Level 1 and 2 actions (within five and 20 years, respectively), which helps SCWD maintain a long-term wildfire management strategy.
Some respondents also indicated that they use partnerships with other organizations or drinking water utilities to evaluate risk to wildfire in their watersheds. For instance, the City of Boulder Utilities Division is currently participating in the Watershed Wildfire Protection Group (WWPG), which started as a coordinated effort with water providers in the Front Range counties (such as Larimer, Jefferson, and others in Colorado). The Colorado State Forest Service and USFS convened the WWPG in partnership with water providers to develop and implement a strategy to protect critical Front Range Watersheds from high-severity wildfires, and the

42 | Wildfire and Drinking Water Utilities
collaborative effort is enabling drinking water utilities in the region to assess their watershed as a whole. The WWPG currently includes participation from state and federal forest services, state agencies (such as the Colorado Departments of Transportation, Public Health and Environment, and Parks and Wildlife), larger drinking water utilities, American Water Works Association (AWWA), and The Nature Conservancy. The WWPG is also considering expanding to include more local organizations such as fire protection districts, county planners, collaborative non‐profits, and homeowner’s associations.
Related to participation in this group, the City of Boulder worked with a consultant and focused stakeholder group in a wildfire assessment of its region and the sub-watershed specific to the utility.7 The assessment identified and prioritized watersheds based on hazards following wildfires that could impair water supplies. The City of Boulder determined that joining this wildfire protection group is a valuable opportunity to share experiences with other drinking water utilities, brainstorm about possible solutions to wildfire risks, and prioritize mitigation activities with other entities in the region. As a drinking water utility in the early process of planning wildfire mitigation activities, the City of Boulder benefits from this collaborative effort in many ways by gaining access to the expertise and experiences of other groups.
Several entities also collaborated to develop a Community Wildfire Protection Plan for the Santa Cruz and San Mateo Counties in California. The Santa Cruz Unit of CAL FIRE, the Resource Conservation District for San Mateo County, and Santa Cruz County developed the Plan using a National Fire Plan grant from the U.S. Fish and Wildlife Service through the California Fire Safe Council.8 The Plan takes a comprehensive look at the wildfire vulnerabilities to identify wildfire hazards, assets at risk, and high priority areas in need of fuel reduction in the two counties. The Plan provides details on how to reduce structural ignitability in structures vulnerable to wildfire, identifies best practices for landscape management and brush clearance, and addresses permitting needs in sensitive habitat areas.
Other survey respondents identified collaborative efforts as important to their wildfire assessment activities. Two respondents worked with USFS to evaluate tree density and potential fire severity in their watersheds. These tools and partnerships provided information needed to identify their drinking water systems’ vulnerabilities to wildfire, helping these systems to implement risk mitigation efforts in their watershed that are the most likely to mitigate some of their risk to wildfire.
Watershed-based Risk Mitigation Activities
Drinking water utilities indicated that they employ a variety of techniques to reduce the risk of wildfire in their watersheds. As illustrated in Figure 3-2, several respondents reported fuel reduction efforts as a form of wildfire risk reduction. Most commonly, survey respondents identified mechanical vegetation treatment for fuel reduction, such as thinning harvest through grazing or other means. Common fuel reduction techniques also include prescribed burns and clear cutting. Survey respondents also identified other forestry management activities that can help reduce the risk of wildfire, including wetlands and ecosystem protection.
7 More information about the Watershed Wildfire Protection Group and the watershed assessments results can be found on the JW Associates website at http://www.jw-associates.org/wwpg.html. 8 The Community Wildfire Protection Plan for Santa Cruz and San Mateo Counties can be found online at: http://www.santacruzcountyfire.com/resource_mgmt/cwpp/2010_cwpp_final.pdf

Chapter 3: Survey on the Impacts of Wildfire on Drinking Water Systems | 43
Figure 3-2 Precautions taken to reduce watershed's risk to wildfire
Survey respondents used several collaborative efforts to reduce the risk of wildfire in their watersheds. Nine respondents work with government entities to restrict land use activities in their watersheds. Collaborative forest management groups that involve watershed landowners (such as private, county, state, federal, and industrial) and stakeholders (such as the surrounding community) provide a way to employ mitigation techniques across several groups, and drinking water utilities can expand their wildfire risk mitigation activities through similar efforts.
SJWC also collaborates with its local California Fire Safe Council to implement chipping programs in privately owned lands in SJWC’s watershed. Chipping programs offer services to residents to remove brush safely at a low cost to the landowner. Similar services may be available to homeowners around the country. These survey responses illustrate that there are countless approaches to implementing wildfire risk mitigation activities in a watershed.
Drinking water utilities utilize several approaches for preventing the ignition and spread of wildfire. Gaining and maintaining access to vulnerable areas of the watershed is critical to controlling fire hazard. Several survey respondents identified creating watershed access as one of their wildfire risk mitigation activities. Specifically, respondents reported maintaining a road network along ridges to access key areas for fire suppression and conducting watershed patrols during times of high fire danger. Additionally, one respondent participated in several shaded fuel break projects on key watershed roads. Maintaining an active eye on the watershed area, stationing fire hazard signage with emergency contact information in the watershed, and enforcing fire restrictions in fire-sensitive areas are also techniques that can control or reduce the risk of wildfires.
One respondent indicated that entities other than the drinking water utility conduct all wildfire risk mitigation activities in the watershed primarily due to land ownership within the watershed. Successful collaboration with these outside entities is critical for implementing adequate wildfire risk mitigation activities. The respondent stated that the county government encourages homeowners to clear space around homes, and the county provides brush pile and hauling services to a local landfill to reduce fuel for wildfires. In other cases, drinking water

44 | Wildfire and Drinking Water Utilities
utilities may need to collaborate with regulating entities in order to gain approval to conduct their mitigation activities. For example, one respondent conducts timber management on federal lands under the supervision of USFS. These activities include thinning, clear cutting and prescribed burning. The drinking water utility conducts vegetation treatments on a smaller scale on city-owned land, mostly by hand or using small mechanized equipment.
East Bay Municipal Utility District (EBMUD) primarily implements vegetation management activities to mitigate the risk of wildfire in its watershed. On EBMUD-owned land, the utility district holds lease agreements with local livestock owners. Since the 1930s, EBMUD has leased out its property to livestock owners to allow their cattle, horses, and other livestock to graze on the land, thereby reducing the fuel load. These lease agreements are highly restrictive in order to protect the land and keep the soil and vegetation in good condition. For example, in its most sensitive areas, EBMUD only leases the land from the late spring to late summer or mid fall in order to avoid the rainy season. During rainy seasons, the livestock might damage the land and contribute pathogens to the runoff. When implemented properly, a program using livestock can keep fuel loads down and prevent the encroachment of brush into the rangeland.
Survey respondents reported that they have implemented other risk mitigation efforts that do not involve forest management. One example is the development of a Community Wildfire Prevention Plan. SJWC identified the “Lexington Hills Community Wildfire Prevention Plan” as a collaborative effort among several entities to provide a comprehensive analysis of wildfire hazards in the region surrounding Lexington Hills, California. The goal of the plan is to “reduce hazards through increased education about wildfires, hazardous fuels reduction, and other recommendations that will facilitate fire suppression efforts.”9 Collaborating entities included the California Department of Forestry and Fire Protection, the County of Santa Clara, and the Santa Clara County Fire Department. SJWC also participated in the effort.
9 The full Lexington Hills Community Wildfire Protection Plan can be found at http://www.sccfiresafe.org/community-wildfire-protection-plans/lexington-hills
Chapter 3: Survey on the Impacts of Wildfire on Drinking Water Systems | 45
Source: Lexington Hills Community Wildfire Protection Plan, courtesy of Anchor Point Group, LLC and Santa Clara Fire Safe Council.
Figure 3-3 Lexington Hills community hazard rating map
The “Other” activity reported by one survey respondent (Figure 3-2) was permit acquisition. SJWC applied for California’s Non-Industrial Timber Management Plan (from the California Department of Forestry), which would allow the drinking water utility to conduct thinning harvests and other vegetation management activities under an overarching permit rather than through individual timber harvest permits.
Infrastructure-based Risk Mitigation Activities
Survey respondents reported a number of activities to reduce the risk of damage to their drinking water infrastructure in the event of a wildfire. Several of these efforts to protect drinking water infrastructure focus on managing the grounds immediately surrounding facilities. Management activities include removing debris, trees or other fire-hazard materials. Additionally, several respondents have implemented new policies to restrict access to areas surrounding drinking water facilities and have instituted high fire danger procedures such as smoking and fire bans. Once again, these activities may require coordination with other regulatory entities or land owners. For example, one Canadian drinking water utility is conducting discussions with government land managers to reduce the threat of fire from

46 | Wildfire and Drinking Water Utilities
vegetation immediately adjacent to their infrastructure. Additional activities include the installation of fire resilient building materials in areas especially prone to bushfire and redundant or backup infrastructure.
Drinking water utilities may find that the strategic use of equipment can reduce damage to drinking water infrastructure. For example, one survey respondent reported the use of floating debris barriers in the water system’s reservoir to catch floating debris dislodged from fire-affected areas. However, the use of this equipment may be limited based on a drinking water system’s watershed land. For instance, the SCWD indicated that the topography in its watershed area restricts the use of equipment such as sediment traps and debris booms.
Figure 3-4 Precautions to reduce the risk of wildfire to drinking water infrastructure
Figure 3-4 provides a summary of the precautions respondents reported taking to reduce the risk of wildfire to their drinking water infrastructure. The most common activity reported by survey respondents is the management of grounds surrounding the facility. Respondents also commonly reported the installation of fire resilient materials and redundancy in their infrastructure. In Figure 3-4, “Other” includes the development of standard designs in bushfire prone areas, the development of business continuity plans and alternative water supply plans, restricted access to the facility grounds, and high fire danger procedures.
POTENTIAL CHALLENGES TO CONDUCTING WATERSHED WILDFIRE MITIGATION ACTIVITIES
Coordination and Collaboration
Many respondents identified coordination and collaboration with other organizations or governmental entities as one of their primary barriers to conducting wildfire mitigation activities. These collaborators include the federal and local forest service, entities with which the drinking water utility shares watershed use policies, the timber industry, environmentalists and anti-logging organizations, and other stakeholders.
The inability to access parts of a watershed as a result of land ownership was a common barrier to conducting wildfire mitigation activities. Partnerships and planning activities with

Chapter 3: Survey on the Impacts of Wildfire on Drinking Water Systems | 47
landowners and federal, state, local, and private stakeholders are important for implementing wildfire mitigation activities in areas that are not owned by the water system.
SJWC applied for a Non-Industrial Timber Management Plan (NTMP) permit with the California Department of Forestry and Fire Protection (CDF). A NTMP is a management plan that specifies a maximum allowable harvest and can promote objectives such as sustainable forest growth and wildfire risk reduction. Furthermore, the plan gives the landowner greater flexibility in forest management to improve economic yields from timber harvests and the ability to manage the land as a whole over a long period of time rather than through individual timber harvest plans, which require forestry activities to be completed in 3 years. The duration of the NTMP provides a long-term cost saving approach to gaining approval for timber harvesting activities. The NTMP requires permittees to follow approved environmental harvesting practices, which the CDF would periodically monitor and inspect. The plan is available only to landowners with less than 2,500 acres of timberland whose primary industry is not the manufacture of forest products.
SJWC invested approximately $250,000 in the development of its NTMP application. However, SJWC faced considerable opposition from local landowners who were concerned about timber harvest in their surrounding forest areas. Local opposition built a case that SJWC owned more than 2,500 acres of timberland, and the California Board of Forestry ultimately found SJWC ineligible for the NTMP. SJWC identified important lessons from this experience. Most notably, it indicated that it is critical to gain the support of stakeholders at the onset of forest management activities. SJWC conducted several activities in parallel (i.e., the wildfire hazard assessment, a wildfire mitigation study, and the application for environmental permits), but did not have adequate support from the community for the permit application. Many landowners surrounding the watershed were not familiar with proper forest management procedures or the risks of wildfire in the watershed. Consequently, the community acted as a barrier rather than a partner to SJWC’s proposed mitigation activities. Other drinking water utilities may experience this problem as areas in and surrounding watersheds become increasingly urbanized. SJWC emphasized the importance of defining the problem, educating the community, and involving the community at the onset of the process in order to gain their support.
In addition to partnerships with federal, county, and state resource management agencies, the SCWD has developed a partnership with the Resource Conservation District (RCD) of Santa Cruz County, a grassroots non-regulatory government organization that works to advance community natural resource management goals. The partnership was formed for the purpose of communicating and collaborating with landowners in the watershed. The majority of land in the watershed supplying water to the SCWD is outside the jurisdiction of the City of Santa Cruz, making collaboration with landowners especially critical to conducting wildfire mitigation activities. However, this collaboration has been a challenge for SCWD due to general wariness toward regulatory entities and a lack of SCWD jurisdiction over the majority of its drinking water source watersheds. SCWD’s partnership with RCD helps facilitate more successful collaboration with the landowners in the watershed because landowners identify the RCD of Santa Cruz County as an organization that will listen and address their concerns. However, SCWD also remarked that this arrangement requires trust between SCWD and the RCD that drinking water source protection goals would not be subverted in the course of working with landowners in a non-regulatory manner. Other drinking water utilities may find that similar relationships take time and considerable upfront effort to develop.
48 | Wildfire and Drinking Water Utilities
Permits
Some respondents identified difficulty in acquiring permits as a significant barrier to implementing wildfire mitigation activities in their watershed. The turnaround time for obtaining permits can vary greatly. The time reported by respondents for obtaining permits to implement various risk mitigation activities ranged from as little as three weeks to as much as a year. The speed of permit approval can depend on the issuing organization, the nature of the permit (e.g., whether the permit is allowing access for emergency activities or post fire activities such as installing sediment traps), and any current issues surrounding the proposed activities. For instance, the prevailing attitude toward timber harvest in SJWC’s watershed was the downfall of its NTMP application.
Drinking water utilities may identify alternative approaches that avoid or reduce permit requirements in order to meet their mitigation needs. For example, SCWD opted for installing water tanks that could be filled by water trucks rather than creating stream diversions because the permit requirements for diversions were too onerous. The Medford Water Commission (MWC) in Oregon indicated that it examines all existing authorities, programs, laws, and rules to identify its best avenue to implement or enforce mitigation activities.
Respondents identified several potential permitting entities, including local government, state departments (e.g., state departments of transportation, forestry, public utilities, fish and game, etc.), and federal entities such as the U.S. Fish and Wildlife Service and the Army Corps of Engineers. Additionally, some respondents suggested that drinking water utilities may need to acquire permits for risk mitigation activities from electrical companies.
Overarching permits to conduct wildfire mitigation activities, such as management plans and permits similar to the NTMP discussed on the previous page, can offer drinking water utilities long-term solutions to forest management practices. However, applications for these permits can require large up-front costs and risk the possibility of being denied. SJWC invested over three years pursuing the NTMP before it was ultimately denied.
The SCWD recently started a riparian conservation program in its watershed areas, which lie outside of its jurisdictional limits. SCWD has identified this approach as a way to benefit water quality and in-stream biotic values by reducing detrimental effects on riparian zones caused by development and illicit activities. Activities that repair and maintain riparian zones require easements and license agreements with landowners. This program is currently small, but SCWD will expand it throughout the watershed due to its success in giving SCWD increased ability to control and improve its drinking source waters. Landowners may also benefit from this riparian conservation program because SCWD has greater ability to patrol properties, partner with other agencies, and leverage funding for restoration work that can support the private landowner’s own conservation goals.
In some cases, permit criteria may conflict with watershed management mandates. For example, Seattle Public Utilities reported that watersheds that are designated as ecological reserves have forest management activities designed to restore late seral forest characteristics, including continuous forest canopy. However, this management technique conflicts with management practices aimed at reducing ladder fuel fire hazards.
Strategic Partnerships and Communication
Strategic partnerships can be critical to implementing successful risk reduction activities and to recovering from the effects of a wildfire. The Medford Water Commission in Oregon

Chapter 3: Survey on the Impacts of Wildfire on Drinking Water Systems | 49
emphasized that developing and maintaining strategic partnerships is the Commission’s single most important activity for successful wildfire risk mitigation. According to the survey, state and local governments were the most common collaborating partners for drinking water systems. Survey respondents also identified the U.S. and Canadian Forest Services as frequent collaborators for watershed risk mitigation activities. Figure 3-5 provides a detailed breakdown of all collaborating partners identified by survey respondents. Survey respondents identified other drinking water suppliers, catchment management authorities, sustainability departments, and fire services as possible groups with similar goals as drinking water systems. The SCWD has found that its watershed protection goals overlap with those of species and resource management agencies such as the National Marine Fisheries Service (NMFS), which is interested in activities that protect the steelhead trout and coho salmon population in the riparian areas of SCWD’s watershed. Ultimately, a healthy watershed benefits both entities. The “Other” partnerships in Figure 3-5 include the Union of British Columbia Municipalities and local coalitions.
Figure 3-5 Collaboration entities for reducing wildfire risk and assisting in recovery after a wildfire
The benefits of partnerships can take several forms. Partners can divide responsibilities and combine resources to expand risk mitigation activities. This benefit can be especially useful to small drinking water utilities with limited ability to fund activities on their own. One survey respondent indicated that their local Fire Division of the Washington State Department of Natural Resources helps the watershed inspectors patrol their watershed for fires. EBMUD is partnering with private landowners, local organizations, and state and federal entities to develop a comprehensive cost-benefit analysis of wildfire risk mitigation efforts. The SCWD worked with the local prison to use a prison labor crew to clear brush between urban areas and watershed property. The SCWD has also worked with job-training programs and the University of

50 | Wildfire and Drinking Water Utilities
California at Santa Cruz intern programs for fuel control and re-vegetation activities. Drinking water utilities may find other similar innovative opportunities to conduct mitigation activities on and off their property.
Drinking water utilities often face challenges in reconciling the differing priorities of
stakeholders when making land management decisions. SCWD emphasized that it can be difficult to garner support for a timber harvest plan even when it is predicated on sustainable stand management practices and overarching goals of watershed protection. Some stakeholders focus on profit and others may focus on environmental special interests, and it is difficult to find an acceptable balance that will gain the support of both sides. SCWD has identified a local land trust, the Santa Cruz County Land Trust, as an organization that implements forest stand management with an interest in sustainability. Drinking water utilities can look to organizations such as this one to develop partnerships to help balance ecosystem health with economic interest.
The Medford Water Commission described a Collaborative, referred to as the Southern Oregon Forest Restoration Collaborative, consisting of players that historically had difficulty agreeing on forest and land management decisions (e.g., environmental advocates, landowners, etc.). In the end, this collaborative group was able to identify and plan for the aspects they were able to agree upon and set aside those they could not. Their successful collaboration and widespread support also put them in a good position to receive funding for their plan.
SCWD also relies heavily on a working relationship with CAL FIRE and local fire agency crews. SCWD emphasized that the success of this relationship depends on the ability to develop personal ties with the people at the agency in order to communicate the concerns of the water system. The SCWD relies on CAL FIRE’s services every year. In turn, SCDW makes sure that the CAL FIRE team is familiar with gate locations, water access points, and has emergency contact information. This relationship also extends beyond wildfire concerns. For example, SCWD has identified invasive species as a large concern in its reservoir and is working with
Top Reasons for Stakeholder Involvement in the Watershed Wildfire Protection Group
Stakeholders in the WWPG recently identified the following goals and reasons for being involved in the WWPG, a coordinated effort convened by the Colorado State Forest Service among cities and other stakeholders in the “Front Range” counties of Colorado.
Top 10 Focus Areas and Goals:
1. Outreach – Increase Awareness Throughout State 2. Connect Implementers with Funders 3. State Action Plan – Watershed Driven 4. Leverage Funding Between Cooperators 5. Watershed Management: Colorado State Forest Service High Priority 6. Increasing Treatments on Non-Federal Land 7. Identify Obstacles and Barriers; How Do We Overcome Them? 8. Community-Based Prioritization of Treatments 9. Template/Checklist to Identify Various Players and Roles to Implement (Funding &
Permitting) 10. Mission/Vision for the Group: How to Lead, Empower, Be Good Stewards
Chapter 3: Survey on the Impacts of Wildfire on Drinking Water Systems | 51
CAL FIRE to implement disinfection protocols on its firefighting equipment. Open dialogue between drinking water utility personnel and entities such as CAL FIRE is critical for establishing effective working relationships.
EBMUD is a member of the Upper Mokelumne River Watershed Authority (UMRWA), which is a Joint Powers Authority consisting of six water agencies and three counties. The UMRWA broadly addresses water resources concerns and works to gain support for water resources solutions by involving local groups such as fisheries and environmental organizations. EBMUD recognized this authority as a way to identify interests and concerns in the watershed and to develop consensus-based solutions. EBMUD emphasized that UMRWA ensures that local input is incorporated into the decision-making process.
In order to reap the greatest benefits from partner organizations, drinking water utilities could actively and continually pursue and develop new and existing partnerships. The geologist of Medford Water Commission estimated that he spends sixty percent of his time outside of the Water Commission actively developing relationships with watershed councils, soil and water conservation districts, agencies for service (e.g., BLM), and large land managers, among others. In addition to working collaboratively with these entities, the Water Commission sees an opportunity to educate these outside entities on the value of minimizing treatment costs and maintaining a healthy forest to mitigate the risk of wildfires. According to the Water Commission, it is ideal if a drinking water provider has someone on staff to focus on partnership building and liaisons with land owners, agencies, and other land management organizations. Smaller water suppliers with limited staffing availability can partner with larger water suppliers who might be in a better position to allocate staffing resources to these efforts.
Wildfire Risk Mitigation Best Practices
Survey respondents provided the following best practices as mitigation activities that have provided the greatest enhancement in the resiliency of their watersheds and drinking water infrastructure to wildfire:
Conducting strategic fuel reduction activities (such as burning, mechanical removal, grazing, etc.) in the watershed and areas immediately surrounding reservoirs.
Ensuring proper maintenance in and around the wells, pumps, and storage tanks.
Providing education in the form of staff training and awareness among rural residents.
Encouraging state or county ordinances to require fire safety activities around rural residences.
Creating a network of shaded fuel breaks at key locations to provide firefighters access to remote areas.
Developing partnerships and cooperation with other organizations to ensure that upstream reservoirs have sediment containment capacity.
Being prepared in the event of a fire, including diversifying water intakes and establishing redundancy of treatment plants and raw water supplies.
Planning for wildfire appropriately, such as having a formal plan, implementing fuel hazard reduction/reducing wildfire severity, and developing pre-permitting sediment control structures downstream from high hazard areas.

52 | Wildfire and Drinking Water Utilities
Managing forest area in a way that will aid in delivering the highest water quality possible, taking into account factors such as the age and species composition of the forest.
COSTS ASSOCIATED WITH WATERSHED RISK MITIGATION ACTIVITIES
Access to funding or other types of resources poses a significant barrier to implementing wildfire risk mitigation activities. Some respondents specified non-financial barriers that limit wildfire risk mitigation activities such as inadequate staff time and institutional understanding of the drinking water system’s risk. Costs reported for watershed wildfire risk mitigation activities by North American respondents ranged from no cost to $1 million on an annual basis. Survey respondents incurred these costs on a variety of watershed activities. Spending on fire teams, engines, and patrol units, especially during the fire season, was common among survey respondents. One respondent indicated that approximately $35,000 per year covers patrolling activities (which include fire surveillance).
In many cases, expenditures on mitigation activities vary from year to year. For example, one drinking water utility in Canada indicated that it spent approximately $43,000 (in U.S. dollars) on prescribed burns in 2012 and anticipates the need to spend an additional $22,000 (in U.S. dollars) on prescribed burns in 2013 and 2014. As previously mentioned, SJWC reported spending approximately $250,000 on the NTMP permit application efforts alone; the water system’s annual fire mitigation expenses typically amount to approximately $20,000. Another respondent indicated that annual spending increased from $25,000 to $50,000 over a five-year period to implement a mitigation plan. On the higher end of the expenditure spectrum, one drinking water utility is spending at least $1 million on watershed restoration and mitigation activities and only expects these expenditures to increase in the future.
Funding Watershed Risk Mitigation Activities
Drinking water utilities use a variety of funding sources to implement watershed and infrastructure-related risk mitigation activities; the unique circumstances of each drinking water utility will determine the type of funding used. As illustrated in Table 3-5, U.S. survey respondents rely on cost share agreements with partner organizations and user fees as the most common funding sources for risk mitigation activities.
Table 3-5 Funding sources for watershed risk mitigation activities – U.S. respondents
Funding Source Number of
Respondents Cost share with partner organizations 8 User fees/rates 7 State grant funds 2 Federal grant funds 1 State loan program 1 Other 0 Not applicable 6

Chapter 3: Survey on the Impacts of Wildfire on Drinking Water Systems | 53
The funding source for a given drinking water utility may also depend on the water system’s watershed land ownership type. For example, some survey respondents indicated that the use of revenues from water sales provides the primary funding source for mitigation activities on lands owned by the water system. On the other hand, drinking water utilities may rely on other funding sources and cost-share agreements to implement risk mitigation activities for areas of the watershed outside of the drinking water system’s ownership. State and federal grants can provide funding for publicly owned lands, and stewardship contracting or collaborative efforts may provide funding and resources for risk mitigation activities on privately owned lands.
EBMUD owns only five percent of its watershed, and this portion of the watershed is primarily rangeland, where the risk of catastrophic wildfire is lower. However, the majority of the watershed is forested, and in many locations, there is potential for catastrophic wildfire. These areas are held in both public and private ownership. There is currently no comprehensive regional funding mechanism to conduct large scale mitigation, and wildfire mitigation activities in these areas rely primarily on federal or state funding or private donations.
Through the NTMP, SJWC planned to fund its watershed risk mitigation activities through the sale of harvested wood from its watershed. The benefits of this project would be two-fold. First, SJWC could reduce wildfire fuel in its watershed, and second, the harvested wood could be a source of revenue to fund non-merchantable forest clearing activities (such as clearing brush). SJWC uses most of its annual wildfire mitigation costs for fuels reduction, and clearing brush fuels is an annual activity since brush at the ground level returns every year.
SJWC identified the NTMP as an important tool for conducting these forest management activities. Currently, SJWC is conducting risk mitigation activities through individual harvest plans, which only allow timber harvesting activities in segments of the watershed. The NTMP would have enabled SJWC to efficiently conduct mitigation activities because, if approved, it would have allowed SJWC to conduct timber harvesting in perpetuity without applying for individual timber harvest permits.
Leveraging Funding through Partnerships
The Medford Water Commission has identified an innovative way to leverage funding and promote wildfire risk mitigation activities in its watershed. The Water Commission’s Water Quality Grant Program (WQGP) provides local matching funds to any entity wishing to conduct water quality improvement projects, which could include forest management activities in the watershed. The Water Commission uses grants to supply the matching funds to entities that need matching contributions for other funding sources. This program funds a variety of activities that improve water quality, including activities that will help to mitigate the effects of wildfire on the drinking water system (e.g., hazardous fuels reduction). Through this program, the Water Commission indicated that it can promote watershed management activities, leveraging the funding provided through the WQGP four-times over.
The Medford Water Commission also builds partnerships with other organizations with similar goals in order to leverage funding. For example, the Water Commission worked with the Little Butte Creek Water Quality Improvement Working Group, providing matching funds and staff resources. This partnership has resulted in water quality improvements in Little Butte Creek, which is a feeder to the Water Commission’s source water. The Water Commission also established a partnership with the local Resource Conservation & Development (RC&D) Council, a 501c3 non-profit funded by the National Resource Conservation Service (NRCS), which recently lost its funding. The Water Commission was able to rely on the RC&D Council
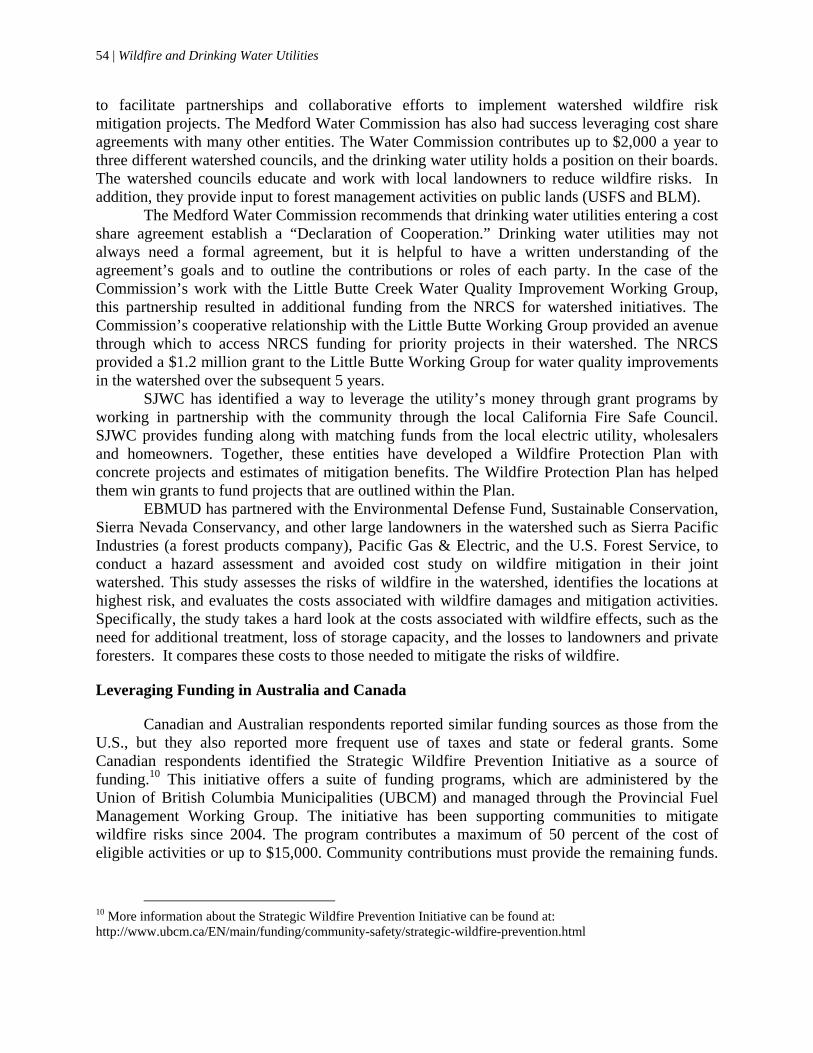
54 | Wildfire and Drinking Water Utilities
to facilitate partnerships and collaborative efforts to implement watershed wildfire risk mitigation projects. The Medford Water Commission has also had success leveraging cost share agreements with many other entities. The Water Commission contributes up to $2,000 a year to three different watershed councils, and the drinking water utility holds a position on their boards. The watershed councils educate and work with local landowners to reduce wildfire risks. In addition, they provide input to forest management activities on public lands (USFS and BLM).
The Medford Water Commission recommends that drinking water utilities entering a cost share agreement establish a “Declaration of Cooperation.” Drinking water utilities may not always need a formal agreement, but it is helpful to have a written understanding of the agreement’s goals and to outline the contributions or roles of each party. In the case of the Commission’s work with the Little Butte Creek Water Quality Improvement Working Group, this partnership resulted in additional funding from the NRCS for watershed initiatives. The Commission’s cooperative relationship with the Little Butte Working Group provided an avenue through which to access NRCS funding for priority projects in their watershed. The NRCS provided a $1.2 million grant to the Little Butte Working Group for water quality improvements in the watershed over the subsequent 5 years.
SJWC has identified a way to leverage the utility’s money through grant programs by working in partnership with the community through the local California Fire Safe Council. SJWC provides funding along with matching funds from the local electric utility, wholesalers and homeowners. Together, these entities have developed a Wildfire Protection Plan with concrete projects and estimates of mitigation benefits. The Wildfire Protection Plan has helped them win grants to fund projects that are outlined within the Plan.
EBMUD has partnered with the Environmental Defense Fund, Sustainable Conservation, Sierra Nevada Conservancy, and other large landowners in the watershed such as Sierra Pacific Industries (a forest products company), Pacific Gas & Electric, and the U.S. Forest Service, to conduct a hazard assessment and avoided cost study on wildfire mitigation in their joint watershed. This study assesses the risks of wildfire in the watershed, identifies the locations at highest risk, and evaluates the costs associated with wildfire damages and mitigation activities. Specifically, the study takes a hard look at the costs associated with wildfire effects, such as the need for additional treatment, loss of storage capacity, and the losses to landowners and private foresters. It compares these costs to those needed to mitigate the risks of wildfire.
Leveraging Funding in Australia and Canada
Canadian and Australian respondents reported similar funding sources as those from the U.S., but they also reported more frequent use of taxes and state or federal grants. Some Canadian respondents identified the Strategic Wildfire Prevention Initiative as a source of funding.10 This initiative offers a suite of funding programs, which are administered by the Union of British Columbia Municipalities (UBCM) and managed through the Provincial Fuel Management Working Group. The initiative has been supporting communities to mitigate wildfire risks since 2004. The program contributes a maximum of 50 percent of the cost of eligible activities or up to $15,000. Community contributions must provide the remaining funds.
10 More information about the Strategic Wildfire Prevention Initiative can be found at: http://www.ubcm.ca/EN/main/funding/community-safety/strategic-wildfire-prevention.html

Chapter 3: Survey on the Impacts of Wildfire on Drinking Water Systems | 55
Canadian respondents also identified receiving in-kind services from the British Columbia (BC) Forest Service and funding through the BC Provincial Emergency Program (through taxation).
In 2004, the UBCM piloted a Community Sprinkler Protection Unit project that deploys sprinkler units during wildland/urban interface fires. These units dampen structures and their surrounding areas to reduce the risk of the ignition of the associated structures. The UBCM implements the program with funding from the Province.11
Canadian respondents also identified cost share agreements with the Crown and logging companies for road maintenance as well as operational expenses for forest management activities. Table 3-6 summarizes the funding sources that Canadian and Australian respondents identified in the survey.
Table 3-6 Funding sources for watershed risk mitigation activities – Australian and Canadian respondents
Funding Sources Number of
Respondents Cost share with partner organizations 3 State grant funds 2 Federal grant funds 2 User fees 1 Taxation 1 Provincial Forestry and Environment Departments 1 Not applicable 2
Funding Drinking Water Infrastructure Risk Reduction/Relocation Activities
Survey respondents largely indicated that the costs to mitigate the risk of wildfire for their drinking water utility infrastructure were incorporated into the costs of their normal business activities. Several survey respondents identified user fees or water rates as their primary source of funding for these infrastructure risk mitigation activities. For nine survey respondents, user fees or water rates were the only sources of funding for these activities.
DAMAGES RESULTING FROM WILDFIRE
Sixteen survey respondents reported specific damages sustained by their drinking water utility or, in the case of health authorities, drinking water utilities they work with as a result of wildfire. Most commonly, respondents reported having difficulty reaching the drinking water utility during or after the fire due to road closures, fire hazards, or debris in the road. More than half of the survey respondents reporting damages (9 out of 14) also reported that their drinking water utility lost power as a result of a wildfire.
Figure 3-6 identifies other damages reported by survey respondents, including physical damage to the well house or treatment plant from fire, fire-fighting activities, or power outages; loss of telemetry/ SCADA (supervisory control and data acquisition) equipment or other
11 More information about the Community Sprinkler Protection Unit program can be found online at: http://www.ubcm.ca/EN/main/services/structural-protection-units.html

56 | Wildfire and Drinking Water Utilities
electrical components; long-term reduction in source water quality; short-term contamination of drinking water sources; need for additional water sampling; loss of source water; and water demand in excess of water production.
Figure 3-6: Damages sustained by drinking water utilities during a wildfire
Maintaining sufficient redundancy of drinking water infrastructure and sources affords drinking water utilities with the best protection against the detrimental effects of wildfires. Redundancy within the drinking water utility can help provide uninterrupted water service in the case of water quality impairment and damage to infrastructure. One survey respondent indicated that a wildfire destroyed one of the system’s finished water storage tanks and damaged two others. Additionally, the fire affected 45 service laterals and required the replacement of most of the system’s polybutelyne service pipes. Ultimately, the drinking water utility drained the distribution system serving the district as a result of the fire.
Loss of power and damage to electrical control equipment were among the top impairments reported by survey respondents, and respondents identified these problems as some of the most difficult to repair. Damage to electrical equipment may require costly replacements or repairs. Furthermore, one survey respondent indicated that damage to power systems during wildfire events are the most difficult to address due to access restrictions during the fire.
In addition to damage to electrical control equipment, survey respondents identified source water quality and sedimentation in their source water among the problems that were most difficult to remediate. Source water quality is often the longest term challenge; it can take years
Chapter 3: Survey on the Impacts of Wildfire on Drinking Water Systems | 57
or even decades to recover, and in some cases, water sources may have to be abandoned altogether. In other cases, drinking water utilities may need to suspend the use of the affected source while working to restore water quality. Long-term reductions in source water quality may also require expensive treatment alterations. One respondent reported that sediment in reservoirs affected by fires 11 and 17 years ago still affect the water system’s source water quality and quantity. Figure 3-7 illustrates the long-term and short-term water quality issues identified by survey respondents.
Figure 3-7 Short term and long term impacts resulting from wildfire
Adapting to Changes Caused by Wildfires
Several survey respondents indicated that they have addressed water quality problems through both long-term and short-term treatment adaptations. For example, one drinking water utility needed to add an oxidant to its river supply to improve taste and odor problems from a wildfire. Another drinking water utility reported the use of acidified alum to reduce the pH in their source water and to assist with settling solids. For long-term adaptation, drinking water utilities reported installing physical treatment units, such as a powdered activated carbon (PAC) filter unit. Another drinking water utility indicated that water quality impairments from a wildfire accelerated the need for improvements to its treatment process.
However, drinking water utilities that need new treatment processes to address the effects of wildfire may have to deal with a lack of space to accommodate new equipment, as one respondent noted for their system. Also, two respondents reported variability in their post-fire source water quality, making it difficult to select the appropriate type of treatment process. Another respondent reported that their source water was unusable due to contamination from wildfires.
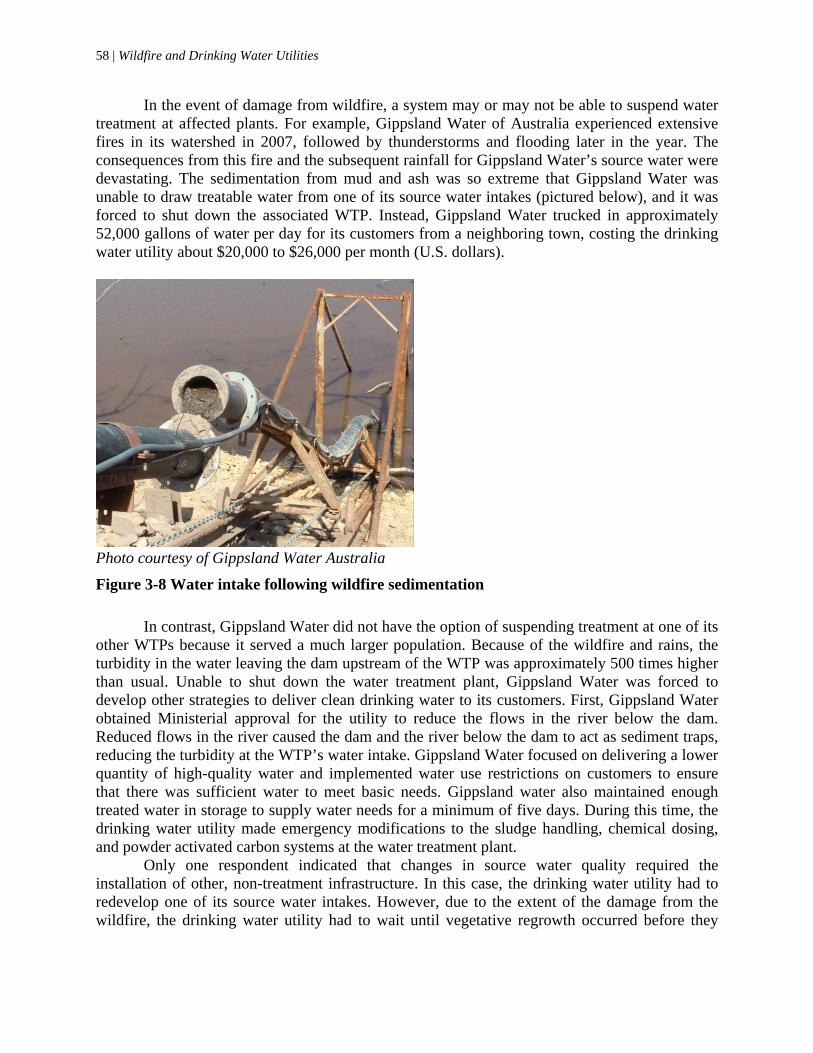
58 | Wildfire and Drinking Water Utilities
In the event of damage from wildfire, a system may or may not be able to suspend water treatment at affected plants. For example, Gippsland Water of Australia experienced extensive fires in its watershed in 2007, followed by thunderstorms and flooding later in the year. The consequences from this fire and the subsequent rainfall for Gippsland Water’s source water were devastating. The sedimentation from mud and ash was so extreme that Gippsland Water was unable to draw treatable water from one of its source water intakes (pictured below), and it was forced to shut down the associated WTP. Instead, Gippsland Water trucked in approximately 52,000 gallons of water per day for its customers from a neighboring town, costing the drinking water utility about $20,000 to $26,000 per month (U.S. dollars).
Photo courtesy of Gippsland Water Australia
Figure 3-8 Water intake following wildfire sedimentation
In contrast, Gippsland Water did not have the option of suspending treatment at one of its other WTPs because it served a much larger population. Because of the wildfire and rains, the turbidity in the water leaving the dam upstream of the WTP was approximately 500 times higher than usual. Unable to shut down the water treatment plant, Gippsland Water was forced to develop other strategies to deliver clean drinking water to its customers. First, Gippsland Water obtained Ministerial approval for the utility to reduce the flows in the river below the dam. Reduced flows in the river caused the dam and the river below the dam to act as sediment traps, reducing the turbidity at the WTP’s water intake. Gippsland Water focused on delivering a lower quantity of high-quality water and implemented water use restrictions on customers to ensure that there was sufficient water to meet basic needs. Gippsland water also maintained enough treated water in storage to supply water needs for a minimum of five days. During this time, the drinking water utility made emergency modifications to the sludge handling, chemical dosing, and powder activated carbon systems at the water treatment plant.
Only one respondent indicated that changes in source water quality required the installation of other, non-treatment infrastructure. In this case, the drinking water utility had to redevelop one of its source water intakes. However, due to the extent of the damage from the wildfire, the drinking water utility had to wait until vegetative regrowth occurred before they
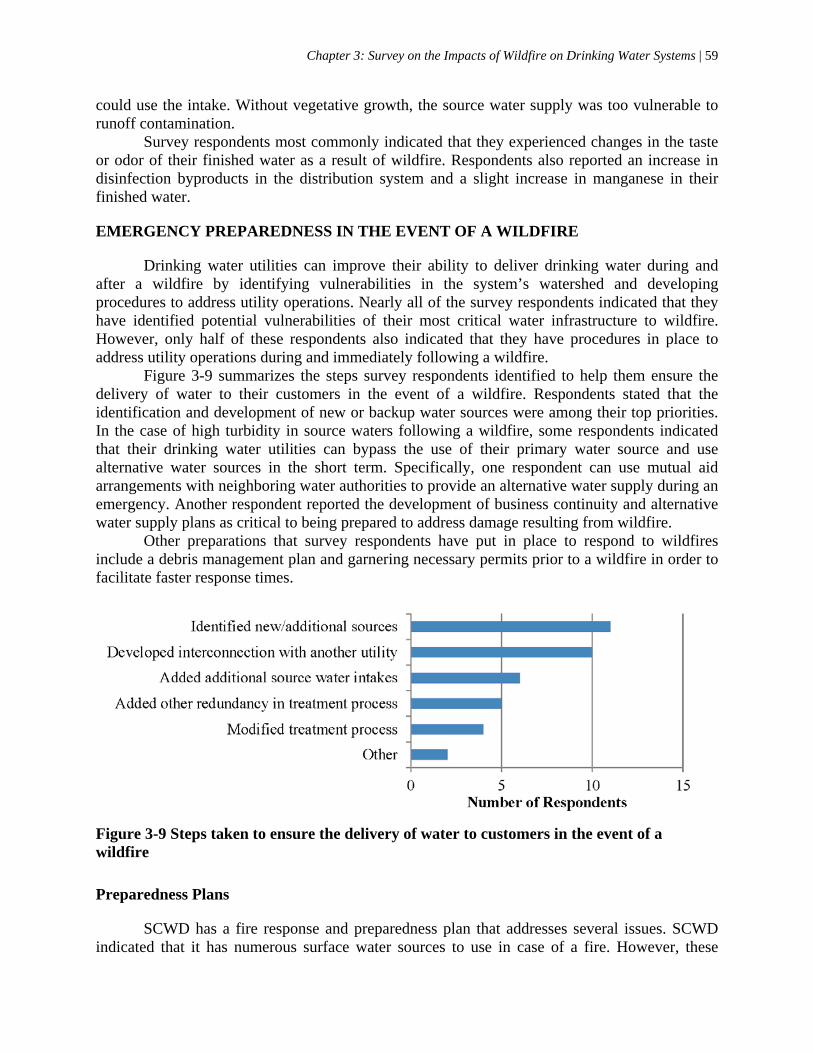
Chapter 3: Survey on the Impacts of Wildfire on Drinking Water Systems | 59
could use the intake. Without vegetative growth, the source water supply was too vulnerable to runoff contamination.
Survey respondents most commonly indicated that they experienced changes in the taste or odor of their finished water as a result of wildfire. Respondents also reported an increase in disinfection byproducts in the distribution system and a slight increase in manganese in their finished water.
EMERGENCY PREPAREDNESS IN THE EVENT OF A WILDFIRE
Drinking water utilities can improve their ability to deliver drinking water during and after a wildfire by identifying vulnerabilities in the system’s watershed and developing procedures to address utility operations. Nearly all of the survey respondents indicated that they have identified potential vulnerabilities of their most critical water infrastructure to wildfire. However, only half of these respondents also indicated that they have procedures in place to address utility operations during and immediately following a wildfire.
Figure 3-9 summarizes the steps survey respondents identified to help them ensure the delivery of water to their customers in the event of a wildfire. Respondents stated that the identification and development of new or backup water sources were among their top priorities. In the case of high turbidity in source waters following a wildfire, some respondents indicated that their drinking water utilities can bypass the use of their primary water source and use alternative water sources in the short term. Specifically, one respondent can use mutual aid arrangements with neighboring water authorities to provide an alternative water supply during an emergency. Another respondent reported the development of business continuity and alternative water supply plans as critical to being prepared to address damage resulting from wildfire.
Other preparations that survey respondents have put in place to respond to wildfires include a debris management plan and garnering necessary permits prior to a wildfire in order to facilitate faster response times.
Figure 3-9 Steps taken to ensure the delivery of water to customers in the event of a wildfire
Preparedness Plans
SCWD has a fire response and preparedness plan that addresses several issues. SCWD indicated that it has numerous surface water sources to use in case of a fire. However, these

60 | Wildfire and Drinking Water Utilities
sources can be limited during fire season because it coincides with the high production demand season and is also the period when stream flows are typically lowest. In response to a fire in 2008, SCWD was able to temporarily stop diverting from a fire-impacted source and used water from an alternate source. SCWD notes that this approach will become more challenging because it has increasingly less flexibility in its selection of water sources due to new requirements for compliance with the Endangered Species Act. Following a fire, the Water Department conducts water monitoring activities on its affected water sources to determine when it is feasible to bring them back into production. The Water Department’s fire plans also include field reconnaissance of the burn zone to identify damage and to note areas where runoff might degrade the water supply. SCWD also has plans in place to implement water rationing policies in response to fire; they have implemented these plans for other water quantity problems in the past.
SCWD notes that fires other than wildfires pose risks to water supplies. For example, fires at cabins adjacent to one of SCWD’s water sources have resulted in contamination of the water supply with firefighting foam. Fire retardants may reach water supplies via runoff, where they can contribute toxic substances and may also reduce dissolved oxygen. SCWD is currently working with emergency response agencies to develop alternatives for retardant use in and around drinking source waters. They are also working to implement prompt notification and other operational procedures for treatment plant operators when such pollutants are discharged into SCWD’s source waters.
Respondents commonly reported that their emergency response plans focus on safety and emergency response activities, which are critical aspects of emergency preparedness. However, they do not address potential operational changes at drinking water plants resulting from wildfires. Several respondents indicated that their wildfire response plans are part of larger emergency response plans, or that their plans are not geared towards wildfires. For example, EBMUD has an emergency response plan and team, but does not specifically address wildfire. EBMUD indicated that a general plan that is adaptable, flexible, and capable of being used for a variety of emergency scenarios is more practical for a drinking water utility than a plan unique to wildfire. SCWD incorporates information about past fires in the watershed, potential contaminants from wildfires, and emergency response to wildfire in its sanitary survey.12
The Halifax Regional Water Commission of Halifax, Canada, developed a Best Management Practices document that includes a section on Emergency Response and Reporting for fire. The document includes emergency contact information for Halifax Water and the local fire control offices. The document also provides a list of activities that are required or prohibited during the designated fire season.13
Drinking water utilities that are vulnerable to wildfire and have not developed emergency operational plans can coordinate with other entities to develop comprehensive operational plans. For example, one survey respondent is working with the state regulatory department to locate potential water sources and fire camp locations in case of wildfire. Effective plans to maintain utility operations during and after a wildfire can involve many entities (e.g., other drinking water utilities, land owners, regulatory offices, etc.), and each drinking water utility might benefit from working with the entities relevant to them to develop the best operational plan possible.
12 The Santa Cruz Water Department’s full sanitary survey can be found online at: http://www.cityofsantacruz.com/Modules/ShowDocument.aspx?documentid=30884 13 The full Halifax Water Best Management Practices document can be found online at: http://www.halifax.ca/hrwc/documents/2010ApprovedBMPs.pdf
Chapter 3: Survey on the Impacts of Wildfire on Drinking Water Systems | 61
Furthermore, operational response plans should be flexible as the availability of source water changes over time. One respondent indicated that the drinking water utility could previously bypass an affected water source, but that source water limitations now require the system to treat the water.
In Canada, the Town of Golden Operations and Public Works Department maintains a comprehensive, up-to-date emergency response plan and also delivers a Regional Emergency Preparedness Program on behalf of the Town and adjacent Electoral Area. The Department updates its Hazard, Risk and Vulnerability Analysis regularly and specifically addresses preparation for, response to, and recovery from wild land/urban interface fires. The Department also coordinates and conducts response exercises with staff of the BC Wildfire Protection Branch.
Fire Suppression Equipment
Survey respondents use a range of equipment to protect against and respond to wildfires. Survey respondents identified fire suppression equipment and fire safety kits as key components of their emergency response equipment. Fire suppression equipment enables drinking water staff, when there is minimal threat to staff safety, to conduct minor fire suppression activities and can include fire extinguishers, shovels, back pumps, water pumps and hoses, bulldozers, backhoes, and means of communication with an emergency contact. One survey respondent maintains small (250 gallons) pumper trucks in order to contain small fires on grassland areas immediately surrounding the facilities or along local roads prior to the arrival of fire response agencies. Another survey respondent indicated that the drinking water utility maintains compressed air tanks as part of its kit for the drinking water system’s inspectors. These air tanks can provide emergency oxygen to inspectors in case of a fire. Drinking water utilities that do not have the resources to purchase and obtain large equipment may consider using partnerships or mutual aid agreements to share large equipment. For example, one survey respondent in Canada indicated that the Fire Department shares a mobile equipment trailer with the Shuswap Regional District.
Protective fire gear is important for any drinking water utility that may need staff to conduct activities in areas affected by fire. However, “safety first” was a common theme among survey respondents, and drinking water staff should not conduct unsafe activities during a fire. None of the survey respondents indicated that they train drinking water staff in fire response activities. However, drinking water utilities may decide to establish standard procedures in their emergency response plans and conduct drills and training with their staff as appropriate.
SUMMARY
Wildfire Risk Mitigation
Drinking water utilities employ a range of techniques to reduce risk and mitigate the impacts of severe wildfire, including:
Conducting wildfire hazard assessments using assessment tools, such as fire behavior simulators, topographic modeling, and/or GIS.
Conducting fuel reduction efforts through techniques such as mechanical vegetation treatment, prescribed burns, or clear cutting.
Gaining and maintaining access to vulnerable areas of the watershed to control fire hazard.

62 | Wildfire and Drinking Water Utilities
Protecting drinking water infrastructure through management of the grounds immediately surrounding facilities.
Challenges to Conducing Wildfire Mitigation
Drinking water utilities face a variety of challenges that affect their ability to implement effective wildfire mitigation activities. Survey respondents identified the following barriers:
Being unable to access parts of a watershed as a result of land ownership. Obtaining buy-in for wildfire mitigation activities from other organizations, government
entities, and stakeholders with interest in wildfire mitigation activities. Acquiring permits to implement wildfire mitigation activities in the watershed in a timely
and low-cost manner. Gaining access to funding or other types of resources such as staff time and institutional
understanding of the drinking water system’s risk to wildfire.
Collaboration and Partnership
Survey responses indicated that collaboration among a variety of stakeholders can promote effective wildfire risk mitigation activities and also leverage funding for rehabilitation efforts by:
Using partnerships with other organizations or drinking water utilities to evaluate wildfire risk and implement a comprehensive strategy for protecting critical watersheds.
Working with regulating entities to restrict land use activities or conduct other mitigation activities in critical watersheds.
Building collaborative forest management groups to educate communities about wildfire risk and employ mitigation techniques across several groups.
Collaborating with regulating entities in order to gain approval to conduct mitigation activities.
Partnering with landowners and federal, state, local, and private stakeholders to implement wildfire mitigation activities in areas that are not owned by the water system.
Working in partnership with the community to leverage utility funds through grant programs.
63
CHAPTER 4 WILDFIRE READINESS AND RESPONSE WORKSHOP
To help drinking water utilities better understand, prepare for, and recover from wildfires, the Foundation conducted the Wildfire Readiness and Response Workshop, which provided a forum for a range of stakeholders in the water industry to exchange information, experiences, and best practices to achieve the following objectives:
Evaluate the potential for wildfire in specific source water protection areas. Understand the effects of wildfire on water quality. Identify and characterize strategies that are effective for preventing, mitigating, or
minimizing wildfire impacts. Assess implications of land disturbance on water quality and drinking water treatability. Determine the mechanisms and timeframes for watersheds to recover from wildfires. Understand challenges faced by drinking water utilities after wildfires and solutions that
have been effective. Improve awareness of the effects of fire-fighting techniques on source water quality. Assess strategies for managing and protecting water quality with proven restoration and
management practices. Provide case studies of inter-municipal cooperation and management strategies.
Workshop participants primarily included drinking water utility operators as well as representatives from federal and local government agencies, universities, and nonprofit organizations. The purpose of the workshop was to evaluate the state of knowledge regarding water quality issues associated with wildfires and to develop recommendations for future research to help drinking water utilities mitigate the effects of wildfires within the current fiscal and political landscape.
WORKSHOP PREPARATION
Because of devastating fires in recent history, the Foundation chose Denver, Colorado as the workshop location in order to capture recent experiences of utilities in the region. A steering committee was formed to help the Foundation staff with the workshop agenda and the selection of speakers. Advertisements for the workshop were sent to all Foundation subscribers as well as to local, state, and federal government officials.
WILDFIRE READINESS AND RESPONSE WORKSHOP
The 1½ day workshop was held in Denver, Colorado on April 4-5, 2013. Day 1 of the workshop was held at Kevin Taylor’s at the Opera House on 1355 Curtis Street. One hundred twelve individuals attended this workshop, representing drinking water utilities; local, state, and federal government agencies; and nonprofit organizations. Patrick Field, a professional facilitator from the Consensus Building Institute, led the workshop with assistance from other members of the project team.

64 | Wildfire and Drinking Water Utilities
Day 1
Day 1 of the workshop consisted of a full day of presentations by various water industry stakeholders to share best practices and lessons learned related to wildfire preparation and risk mitigation. Ms. Shonnie Cline (Water Research Foundation), Jim Lochhead (Denver Water), and Congresswoman Diana Degette provided opening remarks to help define the scope of the workshop and introduce the purpose of this project as a whole. Mr. Tim Sexton of the Rocky Mountain Research Station (RMRS) presented the recent history, context, and trends of wildfire in the U.S. He then outlined the potential for increasing challenges that drinking water utilities may face in the future. Mr. Chi Ho Sham concluded the introductory portion of this workshop with a summary of the survey results presented in Chapter 3 of this report.
The rest of the day consisted of presentations by a range of technical experts, followed by a question and answer session with each panel of presenters. Presentations were broken up into three sessions:
Session 1 – Assessing and Reducing Risk
o Kevin R. Gertig, City of Fort Collins Utilities o Dick Fleishman, Four Forest Restoration Initiative o Brad Piehl, JW Associates
Session 2 – Wildfire Impacts on Water Quality and Quantity o Monica B. Emelko, University of Waterloo o Fernando L. Rosario-Ortiz, University of Colorado o Deborah Martin, U.S. Geological Survey (USGS)
Session 3 – Restoration and Management Practices o Carol Ekarius, Coalition for the Upper South Platte o Don Kennedy, Denver Water o Penny Luehring, National BAER & Watershed Improvement Program o Felicity Broennan, Santa Fe Watershed Association
A meeting summary (for both Day 1 and Day 2 of the workshop) can be found in Appendix A of this report. In addition, presentations used on Day 1 of the workshop are available on the Foundation workshop page at http://www.waterrf.org/resources/expertsymposiums/Pages/wildfiresymposium2013.aspx.
Day 2
The second day of the workshop was open to a smaller group of individuals selected in advance by workshop organizers. The objective for Day 2 was to identify major knowledge gaps and develop research topics of value to the water industry based on the presentations and discussions from Day 1. Each presenter summarized their presentation with a few key bullet points, after which participants provided their reactions and asked each speaker questions. In addition to staff from the Foundation, The Cadmus Group, Inc., and the Consensus Building Institute (CBI), the following individuals participated in Day 2 of the workshop:
Amy LaBarge, Seattle Public Utilities, WA Ashley Dalton, City of Golden, CO

Chapter 4: Wildfire Readiness and Response Workshop | 65
Barry William Geddes, Halifax Water, N.S., Canada Bill Becker, Hazen & Sawyer Brad Piehl, JW Associates Carol Ekarius, Coalition for the Upper South Platte, CO Chad Seidel, Jacobs Engineering Group, Inc. Claudia Wheeler, Metropolitan Water District of Salt Lake & Sandy, UT Darcy Campbell, U.S. EPA Deborah Martin, USGS Dick Fleishman, Four Forest Restoration Initiative, AZ Don Kennedy, Denver Water, CO Eric Howell, Colorado Springs Utilities, CO Felicity Broennan, Santa Fe Watershed Association, NM Fernando Rosario-Ortiz, University of Colorado, CO Lisa J. Voytko, City of Fort Collins Utilities, CO Lucia Machado, Colorado Department of Public Health and Environment Michael F. McHugh, Aurora Water, CO Michael J. Wallis, Easy Bay Municipal Utility District, CA Monica Emelko, University of Waterloo, Ontario, Canada Paul Langowski, USDA Forest Service Penny Luehring, National BAER & Watershed Improvement Program Polly Hays, U.S. Forest Service Richard Robbins, Portland Water Bureau, OR Tim Sexton, RMRS Wildland Fire Management Research
Following the presenters’ summaries and subsequent discussion, participants broke up
into smaller groups to discuss what knowledge gaps exist and what research topics would be helpful for the Foundation or other organizations to pursue to help the water industry better understand, prepare for, and mitigate wildfire risk.
RECOMMENDATIONS
After independently discussing ideas, Day 2 participants reconvened to share and compile a list of recommendations for potential research topics. The following research topics were recommended as a result of Day 2 discussions:
A review and synthesis of the effects of wildfire on drinking water quality, quantity,
availability, and treatability, considered in terms of prevention, effects during and immediately after the fire, and over the longer term (e.g., as long as a decade or more).
o What is the current scientific consensus on effects? o What do utilities need to know to operate more effectively in the face of wildfire
risk? o What are our knowledge gaps?
The relative costs, benefits, and effectiveness of various preventative forest management approaches to reducing the risk or impacts of wildfire on drinking water quality and quantity, including but not limited to: 1) no management; 2) prescribed

66 | Wildfire and Drinking Water Utilities
burns; 3) thinning; 4) biomass recycling; and, 5) other best management practices (BMPs) or actions.
The relative short and long term costs, benefits, and effectiveness of various post-fire management approaches to mitigating effects of fire on drinking water quality and quantity, including application of various types of mulches, replanting, sediment trapping, and other measures.
Assess the effects of wildfire on drinking water treatment trains and technologies, including the risk of drinking water treatment system failure, and the various implications for retrofits, water treatment design, and increasing system supply redundancy. These should be considered in the context of spatial variability and wildfire risk intensity, severity, and probability, particularly on smaller water systems.
Assess the effects of wildfire on groundwater-based drinking water supplies, particularly for smaller systems.
Assess lessons learned from integrating science, policy, politics, and community in water supply protection and wildfire prevention, emergency response, and long-term response. Identify case studies demonstrating effective partnership across sectors, particularly with watershed groups and other NGOs (non-governmental organizations). Identify key lessons learned, underlying conditions for how such partnerships were created and flourished, and recommendations for supporting and/or building such community partners.
Develop a method of pricing ecosystem services provided by forests and other ecosystems (chaparral, grass, etc.) for drinking water protection.
Develop overall messages to communicate with the public about actions taken by utilities for watershed wildfire prevention and remediation focusing on reducing risk, increasing resiliency, and taking “no regrets” actions.
Sponsor and support studies on the longer-term effects of wildfire on drinking water supplies, considering study horizons of 10 years or longer.
Collect information on watershed resiliency to wildfire across various geographies, ecosystems, and climates; communicate the results effectively to utilities, stakeholders, and the public.
The workshop proved to be an essential piece of this project, as it provided the
opportunity for water industry representatives and other key stakeholders to share knowledge and lessons learned to promote effective wildfire risk mitigation. It also provided the project team with a more thorough understanding of the challenges drinking water utilities face in the current political/financial climate as well as the research needs that, if pursued, could provide for a more comprehensive understanding of short- and long-term effects of wildfires and the measures that may be taken to mitigate such impacts.

67
APPENDIX A: WORKSHOP SUMMARY
Wildfire Readiness and Response Workshop
Denver, Colorado | April 4-5, 2013
Recognizing the lasting negative impacts that the wildfires of the past two decades have had on drinking water utilities, the Foundation organized a workshop to facilitate the exchange of research, experiences, and best practices among drinking water utilities and affiliated stakeholders that may be affected by wildfire. The workshop helped the Foundation to assess the state of knowledge on:
The potential for wildfire in specific source water protection areas.
The effects of wildfire on water quality.
Implications of land disturbance on water quality and drinking water treatability.
Strategies that are effective for preventing, mitigating, or minimizing wildfire impacts.
The mechanisms and timeframes for watersheds to recover from wildfires.
The challenges faced by drinking water utilities after wildfires and solutions that have been effective.
The effects of fire-fighting techniques on drinking source water quality.
Strategies for managing and protecting water quality with proven restoration and management practices.
Inter-municipal cooperation and management strategies.
The PowerPoint presentations from Day 1 are available on the Foundation workshop page at http://www.waterrf.org/resources/expertsymposiums/Pages/wildfiresymposium2013.aspx. Day 1 Introduction
Ms. Shonnie Cline from the Water Research Foundation opened the workshop by introducing the founding and history of the Foundation, which receives approximately 85% of its funding from drinking water utilities. She discussed the research that the Foundation has done to help utilities deal with the challenges they face in providing safe drinking water to their customers, particularly in the face of a changing climate. Ms. Cline introduced an online resource being developed by the Foundation named the Water Quality Impacts of Extreme Weather-Related Events, which is intended to allow utilities to select their region of interest as well as the problem they are experiencing/anticipate having in order to review case studies of others who have faced similar experiences.
The workshop’s facilitator, Mr. Pat Field from Consensus Building Institute (CBI), then explained the agenda for the day and introduced the first presenter.

68 | Wildfire and Drinking Water Utilities
Opening Remarks Jim Lochhead, Denver Water
Mr. Lochhead discussed the challenges his utility has faced in the past two decades due to devastating wildfires, including the Buffalo Creek Fire (1996) and the Hayman Fire (2002). He emphasized the need to think holistically about drinking water protection, including considering the health of watersheds. Mr. Lochhead discussed collaborative efforts between his utility and a number of regional organizations and stakeholders that allowed Denver Water to prioritize projects to improve and protect safe drinking water for its customers. Mr. Lochhead also touched upon the recognition that climate change will increase challenges and elevate a need to proactively manage watersheds, engage in partnerships to expand water quality initiatives, engage private landowners, expand upon forest treatment to engage in broader water initiatives, develop new metrics to track level of success in reducing the number of damaging fires/improving watershed health, and manage the overall health of watersheds in a holistic way. Diana DeGette, Congresswoman
Congresswoman DeGette discussed her involvement with the Energy & Commerce Commission, where she is primarily involved in overseeing natural gas development. The Congresswoman also briefly touched upon a bi-partisan renewable energy bill she is involved with that will encourage the development of small hydro-power projects.
Wildfire in the United States: Recent History, Context and Trends Tim Sexton, the Rocky Mountain Research Station (RMRS) Wildland Fire Management Research
Mr. Sexton presented the recent history, context, and trends of wildfire in the U.S. and presented statistics comparing the number of wildfires (decreasing) with the number of acres burned (increasing) to illustrate the increasing severity of wildfires over the past two decades. He reviewed some of the possible reasons for this increase, including exotic invasive species, insects/disease, longer fire seasons, etc., and he demonstrated how future trends (e.g., asymmetric fire seasons) could cause an escalation in emergency response demands and the competition for resources. Mr. Sexton encouraged workshop attendees to visit www.forestsandrangelands.gov/strategy/index.shtml, which is a website that encourages collaboration among various interest groups to address wildfire issues. Mitigating Risks of Wildfire for Drinking Water Systems Chi Ho Sham, The Cadmus Group, Inc.
Mr. Sham reported on a survey conducted on behalf of the Foundation, which included twenty-seven survey participants, with the goal of gathering information on current wildfire risk mitigation and response activities. The goal of the survey was to learn from utilities and guide future decision-making. Survey respondents were primarily located in EPA Regions 6, 8, 9 and 10, which are associated with the areas of the U.S. most greatly affected by wildfire. A number of international respondents were also invited and included in the survey. Survey results demonstrated the need for collaboration among utilities, watershed protection groups, and other stakeholders to allow for a more comprehensive analysis of watersheds and the distribution of knowledge and expenses among multiple partners. Mr. Sham reviewed potential watershed mitigation activities as well as challenges utilities face implementing such measures. Mr. Sham pointed out the significant range in cost of such activities, and summarized recommended best management practices for before, during, and after a wildfire to advance water quality protection.

Appendix A: Workshop Summary | 69
Question and Answer Q: Scott Summers, University of Colorado at Boulder – Is there any potential for
increases in federal resources for fighting wildfires and studying long-term implications on water quality?
A: DeGette – The Commission has been trying to secure adequate funding for fires, as we recognize that with increasing severity/frequency of fires due to climate change, there will be greater impact on our watersheds. Obtaining these funds in the face of the government sequester will be challenging, but the good news is that we’re working on this in a bi-partisan way.
Q: Could beetle-kill reduce rather than increase the risk of severe fire because it reduces crown?
A: Sexton – When needles fall to the ground, there is less fuel up high; however, when dead trees go down, there is a significant increase in ground material that can fuel a severe wildfire.
Q: What is the interaction between the local timber condition and weather, in terms of moisture transfer (e.g., humidity)?
A: Sexton – Weather conditions affecting wildfires are very synoptic/large scale, so young trees may retain more moisture and be less flammable than older or dead trees. However, these localized forest characteristics do not have a significant impact on large scale fires.
Q: Is it possible that, due to their zero-tolerance policy regarding loss of human life, agencies responding to fire may back off because of the risk fires pose to human life, thus contributing to the growing size of wildfires?
A: Sexton – Lives are lost when people are aggressive and put themselves in harm’s way to no avail. The primary objective of firefighting is public safety and the secondary objective is to protect natural resources. However, prioritizing firefighter safety is unrelated to the growing size of devastating fires.
Q: Please discuss some of the tools that your team has made available to help strategize during a fire and do long-term planning.
A: Sexton – Tools such as RAVAR-Water and WFTUS help us to gather information from local stakeholders and prioritize federal resources. County map layers that include information about the location of important infrastructure like power stations and cell towers can be very important during a wildfire. By having this information readily available to our information management team, we are best equipped to protect these values. SESSION 1 – ASSESSING AND REDUCING RISK
This session addressed the assessment and reduction of wildfire risks for watersheds and water supply source areas. It included presentations by three panelists, followed by questions from the participants.
Integration of Emergency Preparedness for the High Park Fire – A Utility Perspective Kevin R. Gertig, City of Fort Collins Utilities
Mr. Gertig reviewed the extensive measures his utility has taken in terms of emergency preparedness. He focused, in particular, on the High Park Fire of June 2012 and its effects on Fort Collins Utility, using this fire as a case study for introducing mitigation activities undertaken by the utility. He also discussed lessons learned and emphasized the need to keep customers informed throughout the entire emergency preparation and response process.
70 | Wildfire and Drinking Water Utilities
Landscape Restoration and Watersheds – the Four Forest Restoration Initiative Dick Fleishman, Four Forest Restoration Initiative
Mr. Fleishman of the Four Forest Restoration Initiative (4FRI) made the case for forest restoration, explaining that the goal is not only to recover forest but also to restore an ecosystem’s function. He described 4FRI as a collaborative effort to restore forest ecosystems on portions of four national forests in northern Arizona. He described the overall goals of this effort, which include the mechanical restoration treatments of 1 million acres over 20 years to reestablish natural fire patterns across the landscape and to treat an additional 30,000 acres at no cost to the government over the next 10 years through private and non-profit actions. Mr. Fleishman explained 4FRI’s system for prioritizing watersheds of concern to determine where restoration treatments should be implemented, and he discussed restoration projects currently underway, focusing on the Flagstaff Watershed Protection Project, whose formation was motivated by the Schultz Fire in 2010 when different stakeholders gathered to discuss flood risk following a severe wildfire. He concluded with a summary of 4FRI, which he explained uses existing and additional National Environmental Policy Act (NEPA) planning to accelerate implementation of restoration efforts that minimize the effects of wildfire on watersheds.
Pre- and Post-Fire Watershed Protection – Focusing on Effectiveness Brad Piehl, JW Associates
Mr. Piehl’s presentation focused on the effectiveness of pre- and post-fire watershed protection in the context of the Watershed Wildfire Protection Group. He reviewed the technical components of a watershed assessment and those components that are used to create a priority ranking system for watersheds at risk. He explained that this priority ranking system is used to create a map that identifies high hazard areas that should be prioritized for protection. Mr. Piehl concluded with an explanation of how this analysis can be useful both in post-fire as well as pre-fire situations. Question and Answer Session
Q: Chris Rayburn, the Foundation – The 4FRI effort is very ambitious. Are there similar efforts going on in other watersheds?
A: Fleishman – Yes, there are 28 or 38 other projects going on across the western U.S. $40 million are set aside annually for implementation and monitoring, so it’s a solution-oriented program.
Q: What do you mean by mechanical treatment? A: Fleishman – Mechanical treatments involve reducing excess stocking and harvesting
physically. Material must be removed from the area so that it is not left on the ground to burn. To dispose of this material, a local industry of some kind needs to be established. In our case, a contractor will be building a plant in Winslow, Arizona for biofuels and wood laminate to make use of removed material.
Q: Deborah Martin, USGS – We are starting to gain a body of knowledge on the effectiveness of fuel treatments. How does that information feed back into assessments and management activities that you are doing? Further, how does fuel management alter fire behavior and the post-fire landscape?
A: Fleishman – It depends on the units of measurement. We do our analysis in terms of comparing the current post-fire effects (e.g., water and sediment runoff) with a no-action

Appendix A: Workshop Summary | 71
alternative, and we see significant fuel treatment effectiveness. The general rule of thumb is that mechanical treatment plus prescribed burning is most effective.
A: Gertig – As a utility, we separate organic versus inorganic constituents. We have established baselines and collaboration efforts, but our current treatment methodology may not be adequate to deal with future challenges.
A: Piehl –Various treatments have stopped different fires. Prescribed fire has proven to have positive results. However, prescribed fire is challenging from a regulatory and stakeholder standpoint. It is an important tool for treatment that has curbed many fires and needs to be put “back in the toolbox.”
Q: Monica Emelko, University of Waterloo – Comment on the different management tools. Are there any disturbances that will affect water quality? Do you have a sense of the relative tradeoffs of different options? What about the liberation of metals from prescribed burns versus harvesting?
A: Fleishman – Prescribed fire does cause smoke issues, so approval is required, and ventilation must be managed. Lower burn intensity means less impact on the watershed. We have multi-party best management practice monitoring in place to minimize water quality impact. I do not have any information regarding metals.
A: Gertig – It is difficult for an operator to adjust quickly to new water quality issues. We have done an extensive literature review and will hopefully have data to report on our own watershed within about a year.
Q: Richard Robbins, Portland Water Bureau – In the Pacific Northwest, if we suggest closing roads as part of a watershed protection technique, we get a lot of pushback. How did you deal with that issue?
A: Fleishman – We did not make the decision to close roads, so someone else took the hit on that controversy. We are just responsible for analyzing the impacts of closing the roads.
Q: Richard Robbins, Portland Water Bureau – By using straw mulch in post-fire mitigation, is there a risk of introducing invasive weeds, and how do you balance that risk?
A: Piehl – Yes, introducing invasive exotic species through straw application is a definite risk. I prefer to use wood mulch, but it is more expensive and weighs more than straw but stays in place more effectively. The U.S. Forest Service (USFS) put down wood mulch last year that was produced locally from beetle kill trees. Using a locally produced resource is a good way to avoid introduction of invasive species. My philosophy is that it is worth spending more money per acre for more effective treatment.
Q: Claudia Wheeler, Metropolitan Water District of Salt Lake & Sandy – When using reverse-911 to alert residents of wildfire, do residents without a home phone cause problems?
A: Gertig – Yes, it is an issue. Our county has promoted the idea that if you live in a wildland-urban-interface, we have to be able to get a hold of you. Emergency contact systems must be maintained as part of an emergency response plan, so phone numbers/pagers/cell numbers should be updated, though this is no small task.
Q: Amy LaBarge, City of Seattle – I’m impressed with 4FRI’s work and am particularly interested in the fact that the majority of dollars are going specifically to implementation, and yet we keep hearing about a need for planning/prioritization as well as monitoring. How exactly are partnership resources allocated so that planning can happen as well as monitoring, in order to make sure we have an adaptive management cycle that incorporates lessons learned?
A: Fleishman – 10% of funds have been set aside for multi-party monitoring. However, no mechanism has been established for distributing money to partners. Regarding adaptive

72 | Wildfire and Drinking Water Utilities
management, we are still working with stakeholder groups to work through monitoring issues. We take components of the plan they have developed for us and determine what is feasible. For implementation, they have given us candidate areas for treatments, and because everyone has similar goals, their concerns are similar. As an operations person, my task is to integrate input from forest supervisors and stakeholders when developing a 10-year plan and ensure that stakeholders are informed of the ramifications of pursuing different recommendations. SESSION 2 WILDFIRE IMPACTS ON WATER QUALITY AND QUANTITY
Session 2 addressed the effects of wildfire on water quality and quantity. It included presentations by three panelists, followed by questions from the participants. The Lost Creek Wildfire of Southern Alberta, Canada: 10 years, 7 Watersheds and Continued Impacts Monica B. Emelko, University of Waterloo
Ms. Emelko reviewed water quality and hydrologic data collected as part of the Southern Rockies Watershed Project (SRWP) since the 2003 Lost Creek Wildfire burned in Southern Alberta, Canada 10 years ago. Ms. Emelko’s presentation included figures that compared water quality parameters (e.g., levels of nitrogen, phosphorus, and total dissolved solids) among reference (unburned), burned, and salvaged regions of the watershed. She showed photos that demonstrated changes in the soil quality and hydrology of the region, and she noted that the health of the watershed has not improved substantially over time. While she submitted that treatment technologies exist to deal with the water quality effects of wildfire, Ms. Emelko emphasized that such intensive treatment comes at great cost. She also discussed the regional-scale implications of these water quality effects. She emphasized the significant operational and infrastructural challenges that utilities will continue to face as the severity and frequency of wildfires increases in the future, not only for the short-term post fire, but for the long-term. Impact of the High Park Fire on Water Quality Fernando L. Rosario-Ortiz, University of Colorado
Mr. Rosario-Ortiz discussed the immediate, intermediate, and long-term water quality effects of the 2012 High Park Fire. Pre-fire water quality data from a 2008/09 Foundation project established a baseline against which post-fire data could be compared. Mr. Rosario-Ortiz reviewed the sampling plan for the watershed, including the sites and parameters measured, and then focused on sampling following the first four storm events after the fire, including issues related to increased disinfection byproduct yields and implications for treatability. Mr. Rosario-Ortiz concluded by discussing a proposed sampling plan for the future, which should include continued source water monitoring and enhanced treatment. His research work is still underway. Wildfire Effects on Water Supplies: Understanding Impacts on the Timing and Quantity of Post-fire Runoff and Stream Flows Deborah Martin, U.S. Geological Survey (USGS)
Ms. Martin’s presentation focused on the dramatic increase in post-fire runoff (anywhere between 0 and 900 times base flows) that can result from severe wildfire. She explained that runoff from burned areas is a function of (1) heat (i.e., loss of soil cover, level of fire-induced water repellency, and other effects quantified as Burn Severity) and (2) sequence (i.e., the magnitude and location of storm events after a wildfire). She also pointed out that the hydrologic

Appendix A: Workshop Summary | 73
response of a watershed depends on the footprint of the storm over the burned area and emphasized a need to focus post-fire efforts in areas that typically receive higher levels of rainfall. Ms. Martin concluded that when evaluating a wildfire’s effects on a watershed, it is important to consider wildfire severity as well as post-fire events. She pointed out that we are unable to control rainfall, and to an extent, wildfire severity, but we are able to prepare the ground for both. Question and Answer Session
Q: If I were to shut the intake at my utility in anticipation of a storm, after a storm passes and flow returns to normal levels, is it safe for me to reopen my intake, or will dissolved organic carbon (DOC) and sediment levels remain elevated after a storm event?
A: Martin – A direct correlation exists between rainfall intensity and turbidity. In the short-term, turbidity will return to pre-storm levels and you can reopen your intake. However, continued flow in your stream channel could re-suspend legacy sediments and cause increased turbidity over time.
A: Emelko – There are different ways to analyze turbidity levels. While turbidity will drop as flow drops, the character of the turbidity may change. Low turbidity but with colloidal suspension can still cause a change in the bio-stability of the distribution system, and a utility’s ability to deal with this depends on its in-house infrastructure and treatment targets. The issue is more complicated than “low turbidity is better.”
Q: Sarah Clark, HDR Engineering – What type of coagulants did you use to address DOC?
A: Emelko – We used ferric polyaluminum chloride, which can bring DOC levels down, but the character of the carbon may change.
Q: Emelko – Deborah, your presentation included a lot of nitrogen data, and Fernando, yours included NDMA (N-Nitrosodimethylamine) data. Did you each measure for both parameters? I saw you had a lot of nitrogen data. I didn’t see any NDMA data, and Fernando, you showed NDMA and not nitrogen data. Did you see high levels of dissolved nitrogen?
A: Rosario-Ortiz – We also saw high levels of dissolved nitrogen, but the time limit for my presentation did not allow me to go into that.
A: Emelko – We did see NDMA in disturbed but not in undisturbed systems. Q: Rosario-Ortiz – Kevin Gertig, your utility was fortunate to have a secondary source of
water, so you did not need to draw from your primary source, which was colored black after the wildfire. Did you do any treatability studies of your primary source during the 100 days that it remained black following the fire? If it were your only source, could you have treated that water for drinking?
A: Gertig – We did basic turbidity evaluations but did not measure for volatiles. I am not sure what we would have done if we had no second source. I will let someone else answer who did not have the same options we had.
Q: In Phoenix, because we were not able to treat high turbidity, we dumped high levels of organic carbon into our reservoirs, and now we are paying the price to remove that organic carbon, which is having a dramatic economic impact on the water quality and treatment. Have you seen similar water quality impacts? DOC keeps going up in the water from those reservoirs – based on your experience, do you expect we will eventually see a drop in DOC levels?
A: Emelko – It depends on the systems. We do not fully understand what DOC is. In Southern Alberta, a system 100 miles downstream did not immediately see post-fire water

74 | Wildfire and Drinking Water Utilities
quality impacts and believed their system would be unaffected. However, over time, as ecosystems begin to restore themselves, both large and small systems are beginning to see changes in water quality they had never seen before.
A: Martin – The Foundation conducted a survey of water providers, which can be extended in the future to obtain useful information on the duration of post-fire impacts on water quality.
Q: Turbidity is a concern, at least in part, due to its implications for microbial water quality, with suspended solids as a “hiding” place for pathogens. Has anyone looked at issues related to that?
A: Rosario-Ortiz – No. A: Emelko – We have dabbled in this research. In order for there to be an issue related to
pathogen harboring, a system must have those pathogens in its sources to begin with. A: Martin – We currently have some studies underway related to this issue. Q: Are you familiar with the soil stabilization product called PAM 12, an engineered
paper product? And if so, are there potential implications for DOC as the product decomposes? Also, if most storm events following a wildfire are flood rains on snow, could you argue that less snow means less severe floods?
A: Martin – My recollection is that PAM is not found to be very effective, though I do not know of any studies that focus on the carbon breakdown issue. Regarding your second question, if the landscape is somewhat dominated by landslides, then it is possible to imagine a scenario where, if you do not have snowmelt, you are not saturating the landscape as much. However, if the landscape receives the same level of precipitation as rainfall rather than snow, then there will be no significant decrease in landslides. SESSION 3 - POST-FIRE RECOVERY OR RESTORATION AND MANAGEMENT PRACTICES
Session 3 addressed post-fire recovery or restoration and management practices. It included presentations by four panelists, followed by questions from the participants. The Power of Partnerships: Leveraging Resources to Get the Job Done Carol Ekarius, Coalition for the Upper South Platte
Ms. Ekarius discussed the benefits of partnering with a local Non-Governmental Organization (NGO) to advance wildfire protection efforts. She pointed out that NGOs can receive money from a variety of stakeholders and promote cooperation among government organizations, water providers, and other organizations to create buy-in and support in the local community, plus they help to distribute the financial burden of wildfire mitigation activities among many partners. Ms. Ekarius explained the large-scale partnership that was formed with a variety of funding/implementation partners to address the effects of the Hayman fire. She discussed techniques used in restoration efforts and concluded that a partnership with a nonprofit such as the one she represents (Coalition for the Upper South Platte) is a valuable and effective way to bring people and resources together to address wildfire effects. After the Wildfires – Permitting and Related Environmental Issues Don Kennedy, Denver Water
Mr. Kennedy discussed Denver Water’s experience with permitting. He reviewed Denver Water’s collection system and the effects of the 1996 Buffalo Creek Fire, which resulted in 15
Appendix A: Workshop Summary | 75
surface acres of debris flowing into their reservoir that took over a year to remove. He reviewed the extensive range of permits available and the process to obtain them, as well as the legal process for sediment removal by dredging. Mr. Kennedy explained that through the acquisition of a U.S. Army Corps of Engineers permit, his utility was able to construct a temporary structure to avoid the more severe consequences of a post-fire debris flow directed into the drinking water reservoir. The total project cost was approximately $3.9 million, which is significantly less expensive than the $16 million the utility spent to remove sediment from a reservoir after a previous wildfire. Mr. Kennedy concluded that moving quickly to obtain the necessary permits and install source protection measures before a storm event can save a significant amount of money. Burned Area Emergency Response (BAER) Program Overview and Treatment Effectiveness Penny Luehring, National BAER & Watershed Improvement Program
Ms. Luehring reviewed the purpose of the BAER Program, which is to identify imminent post-wildfire threats to human life, property, and critical natural/cultural resources on federal land and to take immediate action to manage unacceptable risks. She explained that assessments are done immediately after fire containment, and treatments are done as soon as possible and no later than one year following the wildfire. The money for BAER programs comes from federal fire operations appropriations for all federal land management agencies and totaled $46-48 million in 2011-2012. Ms. Luehring provided an overview of the process through which the BAER team prioritizes the location and type of treatment based on the category of values (e.g., land, road, safety) at risk. Ms. Luehring further provided an overview of land treatments and their relative effectiveness and concluded that erosion cannot be eliminated, but that rates can be reduced through increased longevity of mulches and resultant ground cover. Collaboration & Coffee Cake: They Have More in Common Than You Think! Felicity Broennan, Santa Fe Watershed Association
Ms. Broennan’s presentation focused on the Santa Fe Watershed Association (SFWA)’s efforts to promote collaboration among various stakeholders to protect the Santa Fe Watershed. This effort, Ms. Broennan noted, emerged following the 2000 Cerro Grande Fire in Los Alamos, near but not in the Santa Fe watershed. She explained how SFWA conducted a large-scale survey and public outreach campaign to educate the public about watersheds and ecosystem services. The SFWA has served as an effective translator for forestry groups and water providers to educate the general public regarding why forest management (e.g., thinning and prescribed burns) is important for the community’s safety and water supply. Ms. Broennan gave an overview of the education program and efforts the SFWA has made to suppress fire risk. Question and Answer Session
Q: How do utilities get involved with the BAER program? How do they receive emergency response treatments?
A: Luehring – An important part of the BAER team’s job is to interact as soon as possible with the agencies and organizations involved in risk mitigation to discuss impacts, responses, available resources, and task delegation. Inter-agency liaison work is an important part of the BAER program.
Q: Does the Army Corps of Engineers have a BAER program?

76 | Wildfire and Drinking Water Utilities
A: The Army Corps is not a large-scale land management agency. They do not have a BAER program but do have an emergency response program and provide technical assistance to both local governments and private land owners.
Q: In gardens in Boulder, people using straw treated with herbicides are seeing a diminishment in the growth of plants. Have you noticed that affect at all on forest growth?
A: Luehring – Straw that the government purchases might be different than that used in gardens. I have not heard of forests being negatively impacted by ground treatments; I am not sure if the straw used for BAER treatments is regulated, but there has been no decline in the diversity or plant cover of treated forest plots compared to controls. DAY 2
Approximately twenty-five drinking water utilities, researchers, and agencies convened on day 2 of the workshop to identify major knowledge gaps and develop research topics of value to the water industry based on the presentations and discussions from day 1. Each presenter summarized their presentation briefly, and participants then provided their reactions and asked questions of each speaker.
Monica Emelko, Fernando Rosario-Ortiz, and Deborah Martin began by refreshing participants’ memories of the previous day’s presentations on wildfire impacts on water quality and quantity; each listed a few points that they wanted to emphasize as take-home messages for the group. Emelko:
There is an important contrast between immediate and long-term water quality and quantity effects on utilities located downstream of burned areas.
It is necessary for utilities to understand the geology of their watershed to effectively understand the relationship between hydrology and water quality in their system and to make informed predictions about the long-term effects of wildfire.
Systems should consider which treatment systems are best equipped to handle the changing water quality associated with wildfire-impacted areas.
Agreements must be made on the most effective form of landscape management for a particular watershed (i.e., passive versus active management).
Rosario-Ortiz: Ongoing research and water-quality monitoring is important to analyze the reactiveness
of organics flowing downstream of fire-affected areas.
Research or literature should be compiled on the challenges associated with modifying a treatment process to account for changing water quality.
Microbial contamination may be an important parameter to monitor post-wildfire.
Martin: Runoff can increase up to 900 times above base levels in a burned watershed.
It is important to understand the pathway of contaminants from slopes/channels downstream to water treatment plants.

Appendix A: Workshop Summary | 77
Make use of available tools, such as Rapid Assessment of Values at Risk (RAVAR) to identify the primary resource values threatened by ongoing large fire events.
Discussion points following these summaries included the value of U.S. Department of Agriculture (USDA)’s Forest to Faucet program, the need for partnerships and collaboration across organizations that do not ‘speak the same language’ when it comes to drinking water protection, and the problems associated with the public’s expectation for stable water quality, which could entail costly treatment systems designed for extremes. Questions arose about the length of time that water quality issues last beyond a wildfire, the effects of wildfire on groundwater, and the availability of existing guidance for distributing water following a natural disaster.
Next, Dick Fleishman and Brad Piehl summarized their presentations on assessing and reducing the risk of wildfire. Fleishman:
Restoration, prioritization, and collaboration are keys to effective land management.
Continuous research is needed to maximize the effective implementation of best management practices.
There are some water quality effects associated with prescribed burns.
It is necessary to do a cost-benefit analysis of prevention versus recovery efforts.
Piehl: It is important to look at the big picture when considering the potential effects of wildfire
in order to maintain a stable and sustainable landscape.
Recognize the diversity among different watersheds as well as the diversity of interests and intentions that stakeholders have for watershed protection, and determine how to marry these interests to achieve a common goal.
Make use of available tools to comprehensively consider the risks and hazards in a watershed.
These summaries prompted conversation on the importance of land management as well as the need to assess the water quality effects of land management activities. It was also suggested that an extensive cost/benefit analysis be conducted of land management and wildfire prevention versus wildfire mitigation and recovery. It was pointed out that the benefits of fuel management vary based on geography and other watershed-specific factors.
Carol Ekarius, Don Kennedy, Penny Luehring, and Felicity Broennan wrapped up the overview session with summaries of their presentations on post-fire recovery. Broennan:
Bridge the disconnect between foresters, water providers, and the public by: o Choosing the right messenger for the target audience. o Choosing the right message. o Keeping the conversation positive.

78 | Wildfire and Drinking Water Utilities
Kennedy: If possible, obtain an emergency permit in order to get prevention/restoration measures in
place as quickly as possible.
Protect sources as much and as soon as possible (e.g., before the first major storm event), and take advantage of pre-permitting in areas of high risk.
Make use of the BAER team to help identify critical components of the watershed/system to protect.
Luehring: The discoveries made, information gathered, and assessments done through the BAER
effort are shareable and valuable for other stakeholders and organizations, even if they are not located on Federal land.
There are treatments that are effective in reducing erosion; it is cheaper to proactively reduce erosion than to dredge a reservoir after the fact.
There are no guarantees BAER treatments will be successful – treatments are at the mercy of the weather.
Ekarius: An NGO partner (or someone who can translate government/academic jargon to other
partners or the general public) is effective in getting things done.
Form local alliances with partners the public will trust.
Be persistent.
The main theme of this discussion revolved around the need for collaboration in order to establish partnerships and merge missions with a variety of stakeholders to better prepare for extreme events, which may have unforeseen impacts.
Next, individuals broke out into smaller groups to develop recommendations for potential research topics that may be pursued by the Foundation or other organizations. The following research topics were recommended as a part of this breakout session:
A review and synthesis of the effects of wildfire on drinking water quality, quantity,
availability, and treatability, considered in terms of prevention, effects during and immediately after the fire, and over the longer term (e.g., as long as a decade or more).
o What is the current scientific consensus on effects? o What do utilities need to know to operate more effectively in the face of wildfire
risk? o What are our knowledge gaps?
The relative costs, benefits, and effectiveness of various preventative forest management approaches to reducing the risk or impacts of wildfire on drinking water quality and quantity, including but not limited to: (1) no management; (2) prescribed burns; (3) thinning; (4) biomass recycling; and, (5) other best management practices (BMPs) or actions.
The relative short and longer term costs, benefits, and effectiveness of various post-fire management approaches to mitigating fire impacts on drinking water quality and

Appendix A: Workshop Summary | 79
quantity including application of various types of mulches, replanting, sediment trapping, and other measures.
Assess effects of wildfire on drinking water treatment trains and technologies, including the risk of drinking water treatment system failure, and the various implications for retrofits, water treatment design, and increasing system supply redundancy. These should be considered in the context of spatial variability and wildfire risk intensity, severity, and probability, particularly on smaller water systems.
Assess effects of wildfire on groundwater-based drinking water supplies, particularly for smaller systems.
Assess lessons learned from integrating science, policy, politics, and community in water supply protection and wildfire prevention, emergency response, and long-term response. Identify case studies of effective partnership across sectors, particularly with watershed groups and other NGOs (non-governmental organizations). Identify key lessons learned, underlying conditions for how such partnerships were created and flourished, and recommendations for supporting and/or building such community partners.
Develop method of pricing ecosystem services provided by forest and other ecosystems (chaparral, grass, etc.) for drinking water protection.
Develop overall messages for conveying a number of actions by utilities for watershed wildfire prevention and remediation focusing on reducing risk, increasing resiliency, and taking “no regrets” actions.
Sponsor and support studies on the longer-term impacts of wildfire on drinking water supplies, considering 10 year or longer study horizons.
Collect information on watershed resiliency to wildfire across various geographies, ecosystems, and climates and communicate results effectively to utilities, stakeholders, and the public.


81
APPENDIX B: WILDFIRE SURVEY
Impacts of Wildfires on Drinking Water Systems Background Wildfires can have significant impacts on the drinking water industry through direct
damages to infrastructure, as well as alterations to source water quality, including the associated need for additional treatment to address alterations in source water quality. The goal of this survey is to gather information regarding drinking water systems’ wildfire risk mitigation activities and the necessary actions taken by drinking water utilities to continue providing clean and safe drinking water following a wildfire.
This survey is comprised mostly of multiple choice questions; however, there are some open-ended questions. The Water Research Foundation is particularly interested in your responses to these open-ended questions and hope that you are able to take the time to answer them. We also ask for specific cost information regarding your wildfire risk mitigation and recovery activities.
We estimate that this survey will take approximately 30 minutes to complete. Please complete the survey by Friday, February 1, 2013. Thank you in advance for completing this survey.
1. Please provide us with your contact information. Your information will only be used
for the purpose of this survey; WaterRF will not directly attribute any of your survey responses to you or your drinking water utility without your permission.
a. Name of Respondent: b. Company: c. Responding on behalf of (facility name if different than above):
i. Population Served: ii. Number of Service Connections:
d. Title: e. Telephone number: f. E-mail address: g. Water utility name and address:
2. Has your drinking water system, including your watershed, been impacted by a
wildfire? a. Yes b. No c. Don’t know
Minimizing the Risk of Wildfires to your Drinking Water System This section includes a series of questions regarding precautions that you have taken to reduce the risk of wildfire to your watershed and drinking water infrastructure.
3. Have you conducted a vulnerability assessment of your watershed to wildfires?
a. Yes
82 | Wildfire and Drinking Water Utilities
b. No c. Do not know
4. If yes, what types of tools are you using? Please be specific and indicate if these tools would be easily transferable to another water utility.
Watershed Risk Mitigation Activities The following questions address wildfire risk mitigation activities in your water utility's watershed.
5. Has land ownership in your watershed impacted your drinking water system’s ability
to implement watershed wildfire risk mitigation activities? a. Yes b. No c. Don’t know d. Comments:
6. What precautions have you taken to reduce your watershed’s risk to wildfires? Please
check all that apply. a. Mechanical vegetation treatment (e.g., thinning harvest) b. Clear cutting c. Prescribed fire d. Created a buffer zone around your watershed e. Ecosystem protection and restoration activities f. Worked with local government to restrict land use in watershed g. Pest management activities (e.g., prevention of insect infestations) h. Building access roads for firefighting (and other) activities i. Restricted access to the watershed j. Wetlands protection and restoration activities k. Other forestry management activities l. Other (please list)
7. Please discuss any permit requirements (include the permitting organization’s name)
for watershed risk mitigation activities and how long the permit approval process took.
8. Please describe any barriers that you have encountered to implementing risk
mitigation activities in your watershed (e.g., Best Management Practice [BMP] installation, permits to conduct work, funding, etc.).
Funding Your Watershed Risk Mitigation Activities The following questions address funding for your water utility's watershed risk mitigation activities.
9. Please estimate the cost of your watershed wildfire risk mitigation activities on an
annual basis.

Appendix B: Wildfire Survey | 83
10. How do you fund these watershed risk mitigation activities? Please check all that
apply. a. User fees b. State grant funds c. Federal grant funds d. State loan program e. Federal loan program f. Cost share with partner organizations g. Other (please list) h. Not applicable
11. Please list the grant and loan programs utilized to fund watershed risk mitigation
activities, if any.
12. If any of these funding sources require matching funds, please explain how matching funds are provided (e.g., in kind support, partner funds, user fees, etc.).
Drinking Water Infrastructure Risk Mitigation Activities The following questions address steps your water utility has taken to protect its infrastructure from wildfire.
13. Have you identified the potential vulnerabilities of your most critical water
infrastructure assets to wildfires? a. Yes b. No c. Do not know d. Comments:
14. What precautions have you taken to reduce the risk to your drinking water infrastructure from wildfires (in addition to your watershed protection activities)? Please check all that apply.
a. Installation of more fire resilient building materials b. Relocated facilities c. Installation of redundant/backup infrastructure for critical components d. Manage grounds immediately surrounding the facility (e.g., regular removal
of debris, removal of trees, etc.) e. Sediment traps to protect source water f. Other (please list)
15. What steps have you taken to ensure that you are able to provide water to your customers in the event of a wildfire? Please check all that apply.
a. Identified new/additional sources b. Added additional source water intakes c. Moved source water intakes d. Modified treatment process
84 | Wildfire and Drinking Water Utilities
e. Added other redundancy in treatment process f. Developed an interconnection with another water utility g. Other (please list)
Funding your Drinking Water Infrastructure Risk Mitigation Activities The following questions address funding for your water utility's infrastructure risk mitigation activities
16. Please estimate the cost of any drinking water infrastructure risk reduction/relocation
activities you have undertaken to mitigate damage from wildfires. If possible, please provide a cost for individual activities or types of activities.
17. How do you fund these infrastructure risk mitigation activities? Please check all that
apply. a. User fees b. State grant funds c. Federal grant funds d. State loan program e. Federal loan program f. Other (please list) g. Not applicable
18. If utilized, please list the grant and loan programs, including the funding organization,
utilized to fund infrastructure risk mitigation activities.
19. If any of these funding sources require matching funds, please explain how matching funds are provided (e.g., in kind support, partner funds, user fees, etc.).
Minimizing the Risk of Wildfires to your Drinking Water Utility This section of the survey addresses wildfire risk mitigation activities that have been the most effective in providing your water utility with additional resiliency to wildfires and provides an opportunity to discuss any planned wildfire resiliency activities.
20. Please include any additional comments or activities related to wildfire risk
mitigation to your drinking water utility and watershed.
21. What risk mitigation activities (both infrastructure- and watershed- based) do you think provide the greatest enhancement in the resiliency of the watershed and drinking water infrastructure to wildfire?
22. Please describe any planned activities that your water utility will undertake in the future to reduce the risk of wildfires to your drinking water utility and watershed.
23. Do you have any wildfire risk mitigation resources, documents, case studies, or other
tools that you would be willing to share with other water utilities? a. Yes (Cadmus staff will contact you to discuss materials)

Appendix B: Wildfire Survey | 85
b. No c. If yes, please provide a list of available resources.
Wildfire Impacts Your responses to this section should describe the types and magnitude of damage that your water utility and customers have experienced as a result of wildfire(s).
24. Please describe the magnitude (in approximate acres burned) of wildfires that are
informing your responses to this survey. Please provide a name and date for each of the wildfires listed.
25. As a result of any damage sustained during a wildfire, please indicate whether you
experienced any of the following situations. Please check all that apply. a. Need to evacuate treatment plant(s) b. Difficulty reaching your water utility due to road closures, fire hazards, or
debris in the road c. Physical damage to well house or treatment plant from fire, firefighting
activities, or power outages d. Loss of telemetry/SCADA equipment or electrical components e. Insufficient or inadequate staff access to facilities f. Insufficient staff to repair damages and operate facility g. Lack of available administrative staff h. Disruption in service due to infrastructure damage i. Disruption in service due to administrative/data system j. Interruptions k. Problems repressurizing the distribution system l. Water demand in excess of production m. Loss of power n. Loss of water pressure o. Damage to distribution system pipes p. Loss of source water q. Loss of water storage r. Need for additional water sampling s. Need for additional treatment t. Short-term contamination of drinking water sources u. Contamination in distribution system v. Long-term reduction in source water quality w. Long-term reduction in source water quantity x. Loss of revenue from water sales y. Other (please list)
26. Which damages or types of damage have been the most difficult to repair/restore,
including alterations to your watershed and source water, as well as infrastructure damage. Please include approximate time frames for all repairs/restoration activities listed.
86 | Wildfire and Drinking Water Utilities
Wildfire Impacts: Source Water Your responses to this section of the survey should describe the types of alterations to your source water quality following a wildfire in your watershed.
27. What types of short-term impacts and impacts directly following rain events has
wildfire had on your source water? Please check all that apply. a. Source water was contaminated by firefighting b. Chemicals c. Contaminants in source water d. Unreliable source water quality e. Loss of storage capacity in storage reservoir due to increased sedimentation f. Unreliable water quantity/availability g. Debris in reservoirs h. None i. Other (please list)
28. If you put a check mark next to the “Contaminants in source water” in Question 27,
what changes occurred in the source water? Please check all that apply. a. I did not place a check mark next to "Contaminants in source water" in
Question 33. b. Increased total suspended solids c. Change in alkalinity d. Increase in conductivity e. Change in pH f. Increase in nitrates g. Increase in ammonia h. Increase in organic carbons i. Increase in iron j. Increase in manganese (dissolved and colloidal fractions) k. Increase in arsenic l. Increase in dissolved phosphorus m. Increase in lead n. Increase in mercury o. Increase in bacteria count p. Increase sedimentation/debris flows to reservoir q. Other (please list)
29. What types of long-term changes to your source water and reservoirs have occurred following a fire? Please check all that apply.
a. Unreliable water quality b. Increased total suspended solids c. Change in alkalinity d. Increase in conductivity e. Change in pH f. Increase in nitrates g. Increase in ammonia

Appendix B: Wildfire Survey | 87
h. Increase in organic carbons i. Increase in iron j. Increase in manganese (dissolved and colloidal fractions) k. Increase in arsenic l. Increase in dissolved phosphorus m. Increase in lead n. Increase in mercury o. Increase in bacteria count p. Increase sedimentation/debris flows to reservoir q. Loss of storage capacity in storage reservoir due to increased sedimentation r. Unreliable water quantity/availability s. None
Wildfire Impacts: New Infrastructure Your responses to this section of the survey should describe the impacts of a wildfire on your ability to treat your source water.
30. Did changes in your source water quality require the installation of new treatment
processes? a. Yes b. No c. Don’t know
31. If yes, please describe the treatment process and their purpose.
32. What were some of the obstacles you encountered when installing new treatment
processes? a. Funding for the technology and its installation b. Availability of space in the treatment facility c. Variable source water quality d. Source water was unusable due to contaminants e. Inadequate training or expertise of staff to operate new treatment technology f. Other (please describe)
33. Did changes in your source water quality require the installation of other
infrastructure (e.g. new intakes, distribution mains, etc.)? a. Yes b. No c. Don’t know
34. If yes, please describe the infrastructure installations and their purpose.
35. What types of impacts did wildfire have on your finished water? Please check all that
apply. a. Increased disinfection byproducts in distribution system b. Taste or odor issues
88 | Wildfire and Drinking Water Utilities
c. Reduced supply of finished water d. None e. Other (Pease list)
36. Please provide any additional comments regarding the impacts of wildfire to your
water utility's infrastructure and watershed.
Partnerships The following section includes a series of questions regarding inter-municipal cooperation and management partnerships you have established to reduce the risk of and recovery from a wildfire.
37. Have you worked with any federal, state, or local agencies or organizations to reduce
the risk of wildfires in your watershed? Please check all that apply. a. Local government b. Other water utilities (drinking water or wastewater) c. Other utilities (e.g., electric) d. State government e. Bureau of Land Management f. National Park Service g. Natural Resources Conservation Service h. U.S. Department of Defense i. U.S. Environmental Protection Agency j. U.S. Forest Service k. U.S. Geological Survey l. Local Universities m. Other (please list)
38. Have you worked with any federal, state, or local agencies or organizations during your recovery from a wildfire in your watershed? Please check all that apply.
a. Local government b. Other water utilities (drinking water or wastewater) c. Other utilities (e.g., electric) d. State government e. Bureau of Land Management f. National Park Service g. Natural Resources Conservation Service h. U.S. Department of Defense i. U.S. Environmental Protection Agency j. U.S. Forest Service k. U.S. Geological Survey l. Local universities m. Other (please list)
39. What beneficial partnerships have you established during your wildfire mitigation and recovery activities? Please describe these partnerships.

Appendix B: Wildfire Survey | 89
40. Please provide any additional comments regarding resources and partnerships utilized
during your wildfire risk mitigation and recovery activities.
Emergency Preparedness This section addresses the tools available to your water utility to prepare for and respond to a wildfire.
41. Does your water utility have procedures in place to address utility operations during
and immediately following a wildfire? a. Yes b. No c. Don’t know d. Please describe
42. If your water utility has procedures in place to address utility operations during and
immediately following a wildfire, are they adequate? a. Yes b. No c. Don’t know d. Comments
43. What equipment do you maintain specifically to respond to a wildfire? Please
describe what the equipment is used for.
44. Have you applied for any permits specifically to assist in your wildfire response and immediate recovery activities? Please provide the name of the permit(s), the permitting agency, and approximate length of time necessary for permit approval.
45. Please provide any additional comments regarding your emergency preparedness
planning.


91
REFERENCES
Aragoneses, C. and J.M. Rabade. 2008. Methodological Proposal for Analyzing the Vulnerability and Potential Gravity of Forest Fires Within the Framework of Civil Protection. Proceedings of the Second International Symposium on Fire Economics, Planning, and Policy: A Global View.
Arrandale, T. 2012. Wildfires Threaten Water Supplies. Governing the State and Localities. Available on the Internet at: http://www.governing.com/topics/energy-env/col-wildfires-threaten-water-supplies.html.
Baker Jr., M.B. 1988. Hydrologic and Water Quality Effects of Fire. Panel paper presented at the conference, Effects of Fire in Management of Southwestern Natural Resources (Tucson, AL, November 14-17, 1988).
Belt, G.H., O'Laughlin, J., and T. Merrill. 1992. Design of forest riparian buffer strips for the protection of water quality: analysis of scientific literature. University of Idaho, 35 pages.
Bladon, K.D. Silins, U., Wagner, M.J., Stone, M., Emelko, M.B., Mendoza, C.A., Devito, K.J., and S. Boon. 2008. Wildfire impacts on nitrogen concentration and production from headwater streams in southern Alberta’s Rocky Mountains. Canadian Journal of Forest Research, 2008, 38(9): 2359-2371.
Boerner, C., Bryan, C., Noble, J., Roa, P., Roux, V., Rucker, K., and A. Wing. 2012. Impacts of Wildfire in Clear Creek Watershed on the City of Golden's Drinking Water Supply. ESGN 530 Environmental Engineering Pilot Plant Colorado School of Mines.
Burke, J.M., Prepas, E.E. and S. Pinder. 2005. Runoff and phosphorus export patterns in large forested watersheds on the western Canadian Boreal Plain before and for 4 years after wildfire. J. Environ. Eng. Sci. 4: 319–325.
Caldwell, C.A., Canavan, C.M., and N.S Bloom. 2000. Potential effects of forest fire and storm flow on total mercury and methylmercury in sediments of an arid-lands reservoir. Science of the Total Environment. 260(1–3): 125–133.
Cannon, S. 2005. USGS. Southern California—Wildfires and Debris Flows. Fact Sheet 2005–3106, September 2005. Available on the Internet at: http://pubs.usgs.gov/fs/2005/3106/pdf/FS-3106.pdf.
Cannon, S., 2001. Debris-flow generation from recently burned watersheds. Environmental & Engineering Geoscience, 7(4), 321-341.
Cannon, S.H. and S.L. Reneau. 2000. Conditions for generation of fire-related debris flows, Capulin Canyon, New Mexico. Earth Surface Processes and Landforms. 25(10): 1103–1121.
Carpe Diem West. Undated. Healthy Headwater Success Story: Santa Fe, New Mexico – Sustaining the Watershed. Available on the Internet at: http://www.carpediemwest.org/sites/carpediemwest.org/files/Santa%20Fe%20Success%20Story_0.pdf.
City of Santa Fe, 2009. Santa Fe Municipal Watershed 20 Year Protection Plan. Available on the Internet at: http://www.santafenm.gov/DocumentCenter/Home/View/4354.
Clark, S. 2010. Water Quality and Treatment Impacts of a Watershed Forest Fire. Presented at: “Water Quality Technology Conference and Exposition (WQTC),” November 14-18, 2010, Savannah, Georgia.
Communities Committee, National Association of Counties, National Association of State Foresters, Society of American Foresters, and Western Governors’ Association. 2004.

92 | References
Preparing a Community Wildfire Protection Plan. Sponsored By: Communities Committee, National Association of Counties, National Association of State Foresters Society of American Foresters, Western Governors’ Association.
Crouch, R.L., Timmenga, H.J., Barber, T.R., and P.C. Fuchsman. 2005. Post-fire surface water quality: Comparison of fire retardant versus wildfire-related effects. Chemosphere. 62: 874–889.
Culver, S., Dean, C., Patten, F., and Thinnes, J. 2001. Upper South Platt Watershed Protection and Restoration Project USDA Forest Service Proceedings RMRS-P-22. 2001. Available on the Internet at: http://www.fs.fed.us/rm/pubs/rmrs_p022/rmrs_p022_110_117.pdf.
DeBano, L.F. 2000. The role of fire and soil heating on water repellency in wildland environments: a review. Journal of Hydrology. 231–232, 195–206.
Dodson, E.K., Peterson, D.W., and Harrod, R.J. 2010. Impacts of erosion control treatment on native vegetation recovery after severe wildfire in the Eastern Cascades, USA. International Journal of Wildland Fire, 19, 490-499. Available on the Internet at: http://www.firescience.gov/projects/05-1-2-02/project/05-1-2-02_Dodson_et_al_2010_-_IJWF_-_Pot_Peak_BAER.pdf.
Edel, S. 2002. Colorado Wildland Urban Interface Hazard. Colorado State Forest Service. Edzwald, J. K. 2010. Water Quality and Treatment: A Handbook on Drinking Water. 6 ed.;
McGraw-Hill Professional 2010; p 1696. Emelko, M.B., Silins, U., Bladon, K.D., and M. Stone. 2011. Implications of land disturbance on
drinking water treatability in a changing climate: Demonstrating the need for “source water supply and protection” strategies. Water Research. 45(2): 461-472.
Front Range Watershed Protection Data Refinement Work Group. 2009. Protecting Critical Watersheds in Colorado from Wildfire: A Technical Approach to Watershed Assessment and Prioritization. Available on the Internet at: http://www.jw-associates.org/Resources/Work%20Group%20Final%20Report%20V6b.pdf.
Gill, D.D.. 2004. The Impacts Of Forest Fires On Drinking Water Quality. Thesis Presented in Partial Fulfillment of the Requirement for the Degree Master of Science - Arizona State University.
Goode, J. R., Luce, C. H. and J. M. Buffington. 2012. Enhanced sediment delivery in a changing climate in semi-arid mountain basins: Implications for water resource management and aquatic habitat in the northern Rocky Mountains. Geomorphology 139-140: 1-15. Available on the Internet at: http://www.treesearch.fs.fed.us/pubs/40244.
Gorte, R.W. 2009. Wildfire Fuels and Fuel Reduction. Congressional Research Service Report for Congress. September 16, 2009. Available on the Internet at: http://crs.ncseonline.org/NLE/CRSreports/09Sept/R40811.pdf.
Gorte, R.W., 2011. Federal Funding for Wildfire Control and Management. Congressional Research Service Report for Congress. Available on the Internet at: http://www.fas.org/sgp/crs/misc/RL33990.pdf.
Graham, R., Jain, T., and S. Matthews. 2010. Cumulative Watershed Effects of Fuel Management in the Western United States: Chapter 3: Fuel Management in Forests of the Inland West. USDA Forest Service.
Haines, T., Renner, C., Reams, M. and J. Granskog. 2008. The National Wildfire Mitigation Programs Database: State, County, and Local Efforts to Reduce Wildfire Risk. Proceedings of the Second International Symposium on Fire Economics, Planning, and Policy: A Global View. Available on the Internet at:

References | 93
http://www.fs.fed.us/psw/publications/documents/psw_gtr208en/psw_gtr208en_505-512_haines.pdf.
Ice, G.G., Neary, D.G., and P.W. Adams. 2004. Effects of Wildfire on Soils and Watershed Processes. Journal of Forestry.
Kalabokidis, K.D. 2000. Effects of Wildfire Suppression Chemicals on People and the Environment- a Review. Global Nest: the Int. J. 2(2): 129-137.
Kennedy, D., 2011. Fire Fouls Water, Raises Costs. California Forests, Summer 2011. Available on the Internet at: http://www.foresthealth.org/magazine/Summer%202011/Don%20Kennedy%202011.pdf.
King, T.G. and J.O. Sims. 1989. Hydromulching May Help Control Erosion. Roads and Bridges: 27(2): 62-63.
Kolb, P.F. 2002. Tree and Forest Restoration Following Wildfire. In: After Wildfire, Information for landowners coping with the aftermath of wildfire. James Knight, Editor. Montana State University Extension Service Publication,
Landsberg, J.D. and A.R. Tiedemann. 2000. “Fire Management,” in Drinking water from forests and grasslands: A synthesis of the scientific literature.. Edited by G. Dessmeyer, p. 124-138. GTR-SRS-39. Ashville, NC: USDA Forest Service, Southern Research Station.
Loaiciga, H.A., Pedreros, D., and D. Roberts. 2001. Wildfire-streamflow interactions in a chaparral watershed. Advances in Environmental Research, 5, 295-305.
MacDonald, L.H. and P.R. Robichaud. 2008. Post-fire Erosion and the Effectiveness of Emergency Rehabilitation Treatments over Time. Stream Systems Technology Center: Stream Notes.
McCleskey, R.B., Writer, J.H., and S.F. Murphy. 2012, Water chemistry data for surface waters affected by the Fourmile Canyon wildfire, Colorado, 2010–2011: U.S. Geological Survey Open-File Report 2012–1104.
Meixner, T. and P. Wohlgemuth. 2004. Wildfire Impacts on Water Quality. Southwest Hydrology. 3(5):24-25.
Melton, M.A. 1957. An analysis of the relations among elements of climate, surface properties, and geomorphology. Technical Report 11. Department of Geology, Columbia University. New York, NY. p. 102.
Miller, K., and D. Yates. 2006. Climate Change and Water Resources: A Primer for Municipal Water Providers. Sponsored by American Water Works Association Research Foundation (AwwaRF) and University Corporation for Atmospheric Research (UCAR). Available on the Internet at: http://waterinstitute.ufl.edu/WorkingGroups/downloads/WRF%20Climate%20Change%20DocumentsSHARE/Project%202973%20-%20Climate%20Change%20and%20Water%20Resources.pdf.
Miller, M., MacDonald L.H., Robichaud, P.R., and W.J. Elliot. 2011. Predicting post-fire hillslope erosion in forest lands of the western United States. International Journal of Wildland Fire. 20: 982–999.
Moody, J.A., and D.A. Martin. 2001. Initial hydrologic and geomorphic response following a wildfire in the Colorado Front Range. Earth Surface Processes and Landforms. 26:1049–1070.
Moody, J.A., and D.A. Martin. 2004. Wildfire impacts on reservoir sedimentation in the western United States. Proceedings of the Ninth International Symposium on River Sedimentation. October 18 – 21, 2004, Yichang, China. Available on the Internet at:

94 | References
http://wwwbrr.cr.usgs.gov/projects/Burned_Watersheds/Files/fire_reservoir_sedimentation.pdf.
Morrison, P.H. 2007. Roads and Wildfires. Pacific Biodiversity Institute, Winthrop, Washington. 40 p.
Napper, C. 2006. Burned Area Emergency Response Treatments Catalog. USDA Forest Service. Available on the Internet at: http://www.fs.fed.us/eng/pubs/pdf/BAERCAT/lo_res/06251801L.pdf.
Neary, D.G., Koestner, K.A., and A. Youberg. 2010. Hydrologic Impacts of High Severity Wildfire: Learning from the Past and Preparing for the Future. Paper presented at the 24th Annual Symposium of the Arizona Hydrological Society; Watersheds near and far: Response to changes in climate and landscape; September 18-20; Flagstaff, AZ. 8 p.
Neary, D.G., Koestner, K.A., and A. Youberg. 2011. Hydrologic Impacts of High Severity Wildfire: Learning from the Past and Preparing for the Future. Available on the Internet at: http://www.fs.fed.us/rm/pubs_other/rmrs_2011_neary_d003.pdf.
Neary, D.G., Robichaud, P. R., and J.L. Beyers. 2000. Burned Area Emergency Watershed Rehabilitation: Program Goals, Techniques, Effectiveness, and Future Directions in the 21st Century. USDA Forest Service Proceedings RMRS–P–13.
Neary, D.G., Ryan, K.C., and L.F. DeBano. 2005. Wildland Fire in Ecosystems Effects of Fire on Soil and Water. Gen. Tech. Rep. RMRS-GTR-42-vol.4. Ogden, UT: U.S. Department of Agriculture, Forest Service, Rocky Mountain Research Station. 250 p.
Norris, L., and W. Webb. 1989. Effects of fire retardant on water quality. USDA Forest Service General Technical Report, PSW-109. 1989.
Pan American Health Organization (PAHO). 1998. Natural Disaster Mitigation in Drinking Water and Sewerage Systems - Guidelines for Vulnerability Analysis. Pan American Health Organization.
Parsons, A., Robichaud, P.R., Lewis, S.A., Napper, C. and J.T. Clark. 2010. Field guide for mapping post-fire soil burn severity. Gen. Tech. Rep. RMRS-GTR-243. Fort Collins, CO: U.S. Department of Agriculture, Forest Service, Rocky Mountain Research Station. 49 p. Available on the Internet at: http://forest.moscowfsl.wsu.edu/engr/library/Robichaud/Robichaud2010f/2010f.pdf.
Patterson, C.L. and J.Q. Adams. 2011. Protecting Consumers from Contaminated Drinking Water During Natural Disasters. Protecting Critical Infrastructure. 2: 265-284.
Peterson, D.W., Dodson, E.K., and R.J. Harrod. 2007. Assessing the effectiveness of seeding and fertilization treatments for reducing erosion potential following severe wildfires. USDA Forest Service Proceedings RMRS-46CD.
Pierson, F.B., Robichaud, P.R., and K.E. Spaeth. 2001. Spatial and temporal effects of wildfires on the hydrology of a steep rangeland watershed. Hydrological Processes, 15, 2905-2916.
Ranalli, A.J. 2004. A Summary of the Scientific Literature on the Effects of Fire on the Concentration of Nutrients in Surface Waters. USGS Open File Report 2004. 1296.
Rhoades, C.C., Entwistle, D. and D. Butler. 2011. The influence of wildfire extent and severity on streamwater chemistry, sediment and temperature following the Hayman Fire, Colorado. International Journal of Wildland Fire. 20:430–442.
Riggan, P.J., Lockwood, R.N., Jacks, P.M. and C.G. Coiver. 1994. Effects of Fire Severity on Nitrate Mobilization in Watersheds Subject to Chronic Atmospheric Deposition. Environ. Sci. Technol. 28(3).

References | 95
Robichaud, P., MacDonald, L., Freeouf, J., Neary, D., Martin, D., and L. Ashmun. 2003. Postfire Rehabilitation of the Hayman Fire. USDA Forest Service Gen. Tech. Rep. RMRS-GTR-114.
Robichaud, P.R. 2008. Erosion Risk Management Tool (ERMiT). Stream Notes. July: 1-4. Available on the Internet at: http://www.fs.fed.us/rm/pubs_other/rmrs_2008_robichaud_p002.pdf.
Robichaud, P.R., Beyers, J.L., and D.G. Neary. 2005. Chapter 10: Watershed Rehabilitation. In: USDA Forest Service Gen. Tech. Rep. RMRS-GTR-42-vol. 4.
Robichaud, P.R., Lewis, S.A. , Brown, R.E., and L.E. Ashmun. 2009. Emergency post-fire rehabilitation treatment effects on burned area ecology and long-term restoration. Fire Ecology 5(1): 115-128.
Rocky Mountain Research Station. 2010. BAER Values at Risk Calculation Tool, v8.0.1. Joint Fire Science Program, Rocky Mountain Research Station, US Forest Service. Available on the Internet at: forest.moscowfsl.wsu.edu/BAERTOOLS/VAR/VARWorksheet_Proto_V801.xls.
Ryan, S.E., and K.A. Dwire. 2012. Wildfire impacts on stream sedimentation: revisiting the Boulder Creek Burn in Little Granite Creek, Wyoming, USA. Wildfire and Water Quality: Processes, Impacts and Challenges (Proceedings of a conference held in Banff, Canada, 11-14 Hune 2012. (IAHS Publ. 354, 2012).
Ryan, S.E., Dwire, K.A., and M.K. Dixon. 2011. Impacts of wildfire on runoff and sediment loads at Little Granite Creek, western Wyoming. Geomorphology. 129: 113-130. Available on the Internet at: http://www.treesearch.fs.fed.us/pubs/37604.
Sciuto, P.A. 2010. Wildfire in the Lake Tahoe Basin – Water Utility Post-Fire Response. Presented at: “Water Quality Technology Conference and Exposition (WQTC),” November 14-18, 2010, Savannah, Georgia.
Silins U., Bladon K.D., Anderson A., Diiwu J., Emelko M.B., Stone M. and S. Boon. 2009. Alberta’s Southern Rockies Watershed Project— How Wildfire and Salvage Logging Affect Water Quality and Aquatic Ecology. Streamline. 12(2), 1-7.
Smith, H.G., Sheridan, G.J., Lane, P.N.J., Nyman, P. and S. Haydon. 2011. Wildfire effects on water quality in forest catchments: A review with implications for water supply. H.G. Smith et al. Journal of Hydrology. 396: 170–192.
Stein, E.D. 2008. Effects of Southern California Wildfires on Storm Water Metals and PAHs. http://www.waterboards.ca.gov/water_issues/programs/nps/docs/conference2008/presentation/session_a/may5/10_30am/effects_socal_sw_metals_pahs.pdf.
Stein, E.D. and J. Brown. 2009. Effects of Post-fire Runoff on Surface Water Quality: Development of a Southern California Regional Monitoring Program with Management Questions and Implementation Recommendations. Southern California Coastal Water Research Project, Technical Report 598.
Stone, M., Emelko, M.B., Droppo, I.G., and U. Silins. 2011. Biostabilization and erodibility of cohesive sediment deposits in wildfire-affected streams. Water Research. 45: 521-534.
Swanson, F.J., Benda, L.E., Duncan, S.H., Grant, G.E., Megahan, W.F., Reid, L.M., and R.R. Ziemer. 1986. Mass failures and other processes of sediment production in Pacific Northwest forest landscapes.
United States Department of Agriculture (USDA) Natural Resources Conservation Service. Emergency Watershed Protection Program. Available on the Internet at: http://www.nrcs.usda.gov/wps/portal/nrcs/main/national/programs/landscape/ewpp/.
96 | References
United States Department of the Interior (USDOI). Emergency Stabilization and Rehabilitation. Available on the Internet at: http://www.doi.gov/pmb/owf/es_bar.cfm.
USDA Forest Service Rocky Mountain Research Station Missoula Fire Sciences Laboratory, et al. Undated. LANDFIRE geospatial resources. Available on the Internet at: http://www.landfire.gov.
USDOI, USDA, National Park Service, United States Fish and Wildfire Service, USDOI Bureau of Indian Affairs. 2006. Interagency Burned Area Emergency Response Guidebook. Interpretation of Department of the Interior 620 DM 3 and USDA Forest Service Manual 2523.
Voytko, L. 2010. The Effects of Recent Wildfires on Water Quality and Water Treatment. Available on the Internet at: http://www.nocofoundation.org/assets/File/Speaker_Presentation_3_-_Lisa_Voytko(2).pdf.
Wagenbrenner, J.W., MacDonald, L.H., and D. Rough. 2006. Effectiveness of three post-fire rehabilitation treatments in the Colorado Front Range. Hydrological Processes, 20, 2989-3006.
Writer, J.H., and S. Murphy, 2012. Wildfire Effects on Source-Water Quality—Lessons from Fourmile Canyon Fire, Colorado, and Implications for Drinking-Water Treatment. U.S. Geological Survey Fact Sheet 2012–3095.