Embed Size (px)
Citation preview

www.accc.gov.au
Report on the Brisbane petrol market
October 2017

ISBN 978 1 920702 20 5
Australian Competition and Consumer Commission 23 Marcus Clarke Street, Canberra, Australian Capital Territory, 2601
© Commonwealth of Australia 2017
This work is copyright. In addition to any use permitted under the Copyright Act 1968, all material contained within this work is provided under a Creative Commons Attribution 3.0 Australia licence, with the exception of:• the Commonwealth Coat of Arms• the ACCC and AER logos• any illustration, diagram, photograph or graphic over which the Australian Competition and Consumer Commission does not hold
copyright, but which may be part of or contained within this publication.
The details of the relevant licence conditions are available on the Creative Commons website, as is the full legal code for the CC BY 3.0 AU licence.
Requests and inquiries concerning reproduction and rights should be addressed to the Director, Content and Digital Services, Australian Competition and Consumer Commission, GPO Box 3131, Canberra ACT 2601.
Important notice
The information in this publication is for general guidance only. It does not constitute legal or other professional advice, and should not be relied on as a statement of the law in any jurisdiction. Because it is intended only as a general guide, it may contain generalisations. You should obtain professional advice if you have any specific concern.
The ACCC has made every reasonable effort to provide current and accurate information, but it does not make any guarantees regarding the accuracy, currency or completeness of that information.
Parties who wish to republish or otherwise use the information in this publication must check this information for currency and accuracy prior to publication. This should be done prior to each publication edition, as ACCC guidance and relevant transitional legislation frequently change. Any queries parties have should be addressed to the Director, Content and Digital Services, Australian Competition and Consumer Commission, GPO Box 3131, Canberra ACT 2601.
ACCC 10/17_1216
www.accc.gov.au

Contents
Summary 1
Key messages 2
1 Petrol prices in Brisbane have been consistently higher than in the other four largest cities 9
1.1 Retail petrol prices in Brisbane have been higher than in the other four largest cities for many years 9
1.2 Average TGPs in Brisbane were almost the same as those in the other four largest cities 12
1.3 GIRDs in Brisbane were higher than in the other four largest cities 12
2 Higher retail margins are the primary contributor to higher retail prices in Brisbane 16
2.1 The petrol value chain and its components 16
2.2 Wholesale prices in Brisbane are similar to those in Sydney 17
2.3 Brisbane petrol value chain over time 18
3 Profits have increased in Brisbane in recent years, reflecting increased margins on petrol 19
3.1 Average net profit per site in Brisbane has been high, but varies substantially between companies 19
3.2 Average net profit per site in Brisbane was higher than in Sydney 19
3.3 Average net profit per site in Brisbane was also higher than the Australian average 20
3.4 Increases in average net profit per site in Brisbane were mainly due to increases in fuel profits 21
4 There are relatively fewer independent retailers in Brisbane 22
4.1 The Brisbane retail market includes a variety of retail operations 22
4.2 Brisbane has a lower proportion of retail sites operated by independent chains than Sydney 23
4.3 Independent chains in Brisbane have relatively low volumes per retail site 24
4.4 The Brisbane retail market has undergone significant change over the past 10 years 25
4.5 The degree of competition in the retail petrol market in Brisbane is less than in Sydney 26
4.6 Some in the industry have noted the lack of competition in the Brisbane market 26
5 Prices of independent retailers are relatively higher in Brisbane than in Sydney 28
5.1 The degree of price competition is lower in Brisbane 28
5.2 Prices of independent chains tend to be relatively higher in Brisbane than in Sydney 29
Appendix A: Background and process 32
Appendix B: Petrol retail prices, TGPs and GIRDs in Brisbane 34

1 Report on the Brisbane petrol market
SummaryPetrol prices in Brisbane have been significantly higher than those in the other four largest cities (i.e. Sydney, Melbourne, Adelaide and Perth) in Australia for the last eight years.1 Between 2009–10 and 2016–17, Brisbane motorists paid on average 3.3 cents per litre (cpl) more for petrol than motorists in the other four largest cities.
The main factor influencing the higher prices in Brisbane is higher retail margins on petrol, which have contributed to profits in Brisbane being significantly higher than the average across Australia.
Over the last 10 years the number of retail sites in Brisbane has been broadly stable, at around 400 sites. However, compared with Sydney, Brisbane has fewer independent chains operating in the retail market, and they do not price as aggressively.
The cost to motorists in Brisbane of higher petrol prices has been significant, at around $50 million per annum. Over the eight-year period the estimated cost is in the region of $400 million.
Increased transparency and promotion of vigorous and effective price competition can lead to lower petrol prices. In Brisbane there is usually a wide range of prices at retail petrol sites across the city. Readily available information about current retail petrol prices, from fuel price websites and apps, enables motorists to shop around and purchase petrol at relatively lower priced retail sites.
Not only do motorists benefit from those lower prices, but the availability of petrol price data may promote competitive market behaviour. It will reward those retailers that are prepared to actively compete on price, because their pricing behaviour can be seen, and acted upon, by motorists.
1 In this report references to petrol are to regular unleaded petrol (RULP) unless otherwise specified.

2 Report on the Brisbane petrol market
Key messages
Retail petrol prices in Brisbane have been higher than in the other four largest cities for many years
Between 2009–10 and 2016–17, Brisbane motorists paid on average 3.3 cpl more for petrol than motorists in the other four largest cities in Australia. The annual difference varied over this period, ranging from a high of 4.4 cpl (in 2014–15) to a low of 2.5 cpl (in 2010–11 and 2016–17). Brisbane petrol prices were also higher in comparison with each of the other four largest cities.
Retail margins and profits are also higher in Brisbane
Gross indicative retail differences (GIRDs) are the difference between retail prices and published terminal gate prices (TGPs). They are a broad indicator of gross retail margins. However, they should not be confused with actual retail profits as they also include retail costs, which vary through time.
Between 2009–10 and 2016–17, annual average GIRDs in Brisbane were 3.2 cpl higher than annual average GIRDs in the other four largest cities. Brisbane GIRDs were also higher in comparison with each of the other four largest cities.
As a result of higher retail margins, average net profits per site in Brisbane were significantly higher than the average net profit per site across Australia. In 2015–16, average net profit per site in Brisbane was around 55 per cent higher than the average net profit per site across Australia.
Retail pricing is less competitive in Brisbane
An indication of the degree of price competition in the retail petrol market is the extent to which prices are above TGPs at the troughs and peaks of the price cycle.2
Over the first four months of 2017, the difference between retail prices and TGPs at the bottom of the price cycle was significantly higher in Brisbane than in Sydney. Sydney was chosen as a comparator as it is the closest of the other four largest cities geographically to Brisbane. At the three troughs in Brisbane during this period, retail prices were on average 3.3 cpl higher than TGPs. At the three troughs in Sydney, retail prices were on average 0.3 cpl lower than TGPs.
Similarly, the difference between retail prices and TGPs at the top of the price cycle was significantly higher in Brisbane than in Sydney. At the two peaks in Brisbane during the four-month period, retail prices were on average 24.1 cpl higher than TGPs. At the three peaks in Sydney, retail prices were on average 21.5 cpl higher than TGPs.
Brisbane has fewer independent chains than other cities
Over its years monitoring the petroleum industry the ACCC has found that independent chains can be vigorous and competitive price setters in large metropolitan markets, and their absence can mean that prices are otherwise higher.
A feature of the Brisbane market is that it has fewer independent chains than Sydney. For the purposes of this analysis, the ACCC has considered an independent operator that runs 10 or more retail sites with the same brand, and sets the retail price at those sites, to be an independent chain.
In Brisbane there are four independent chains: 7-Eleven, Puma Energy, Freedom Fuels and United. As at 30 June 2017, they had 138 retail sites in total, accounting for 34 per cent of the total number of Brisbane retail sites.
2 A petrol price cycle is a movement in retail price from a low point (or trough) to a high point (or peak) to a subsequent low point. In these cycles, prices steadily decrease for a period followed by a sharp increase.
3 Report on the Brisbane petrol market
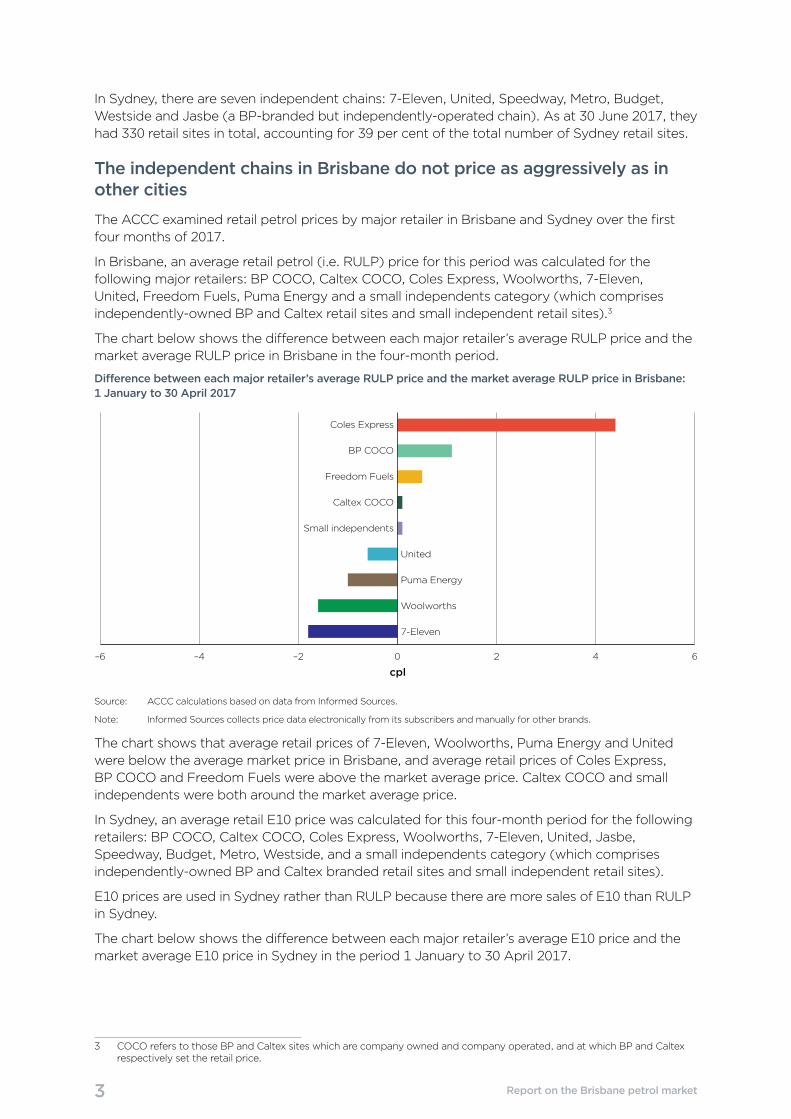
In Sydney, there are seven independent chains: 7-Eleven, United, Speedway, Metro, Budget, Westside and Jasbe (a BP-branded but independently-operated chain). As at 30 June 2017, they had 330 retail sites in total, accounting for 39 per cent of the total number of Sydney retail sites.
The independent chains in Brisbane do not price as aggressively as in other cities
The ACCC examined retail petrol prices by major retailer in Brisbane and Sydney over the first four months of 2017.
In Brisbane, an average retail petrol (i.e. RULP) price for this period was calculated for the following major retailers: BP COCO, Caltex COCO, Coles Express, Woolworths, 7-Eleven, United, Freedom Fuels, Puma Energy and a small independents category (which comprises independently-owned BP and Caltex retail sites and small independent retail sites).3
The chart below shows the difference between each major retailer’s average RULP price and the market average RULP price in Brisbane in the four-month period.
Difference between each major retailer’s average RULP price and the market average RULP price in Brisbane: 1 January to 30 April 2017
–6 –4 –2 0 2 4 6
7-Eleven
Woolworths
Puma Energy
United
Small independents
Caltex COCO
Freedom Fuels
BP COCO
Coles Express
cpl
Source: ACCC calculations based on data from Informed Sources.
Note: Informed Sources collects price data electronically from its subscribers and manually for other brands.
The chart shows that average retail prices of 7-Eleven, Woolworths, Puma Energy and United were below the average market price in Brisbane, and average retail prices of Coles Express, BP COCO and Freedom Fuels were above the market average price. Caltex COCO and small independents were both around the market average price.
In Sydney, an average retail E10 price was calculated for this four-month period for the following retailers: BP COCO, Caltex COCO, Coles Express, Woolworths, 7-Eleven, United, Jasbe, Speedway, Budget, Metro, Westside, and a small independents category (which comprises independently-owned BP and Caltex branded retail sites and small independent retail sites).
E10 prices are used in Sydney rather than RULP because there are more sales of E10 than RULP in Sydney.
The chart below shows the difference between each major retailer’s average E10 price and the market average E10 price in Sydney in the period 1 January to 30 April 2017.
3 COCO refers to those BP and Caltex sites which are company owned and company operated, and at which BP and Caltex respectively set the retail price.

4 Report on the Brisbane petrol market
Difference between each major retailer’s average E10 price and the market average E10 price in Sydney: 1 January to 30 April 2017
–6 –4 –2 0 2 4 6
Coles Express
BP COCO
Caltex COCO
Woolworths
7-Eleven
United
Small independents
Westside
Budget
Metro
Speedway
cpl
Jasbe
Source: ACCC calculations based on data from Informed Sources.
Note: Informed Sources collects price data electronically from its subscribers and manually for other brands. Data is also obtained from FuelCheck.
The chart shows that average retail prices of seven retailers (Speedway, Metro, Budget, Westside, United, 7-Eleven and Woolworths) and the small independents category were below the average market price in Sydney. The average retail prices of Coles Express, BP COCO, Caltex COCO and Jasbe were above the market average price.
A comparison of the average prices by major retailer in Brisbane with those in Sydney shows that the extent of aggressive retail pricing by independent chains was significantly greater in Sydney than in Brisbane. It also shows that the average price for the small independents category was around the average market price in Brisbane, but below it in Sydney.
In Brisbane, the four lowest priced retailers (7-Eleven, Woolworths, Puma Energy and United) were on average only around 1.3 cpl below the market average price, while in Sydney the four lowest priced retailers (Speedway, Metro, Budget and Westside) were on average around 3.8 cpl below the market average price.
The proportion of retail sites below the market average price was lower in Brisbane (around 45 per cent) than in Sydney (around 65 per cent).
There are a number of possible reasons for pricing being less competitive in Brisbane
Retail petrol markets are not the same across cities in Australia and some are more competitive than others. Historically, the Sydney and Melbourne retail petrol markets have tended to be more competitive than the other capitals. It can be difficult to identify reasons for the different degree of competition in each market.
There are a number of possible reasons why independent chains in Brisbane do not price as aggressively as in other cities, such as Sydney and Melbourne.
Until July 2009, the Queensland Government provided a petrol subsidy at the retail level of around 9.2 cpl (when GST is included). In the nine-year period 2000–01 to 2008–09 annual average petrol prices in Brisbane were only 7.8 cpl below the annual average in the other four largest cities.
When the Queensland Treasurer announced the abolition of the subsidy scheme, he noted that: “The recent independent Pincus inquiry identified that Queenslanders are not receiving the full

5 Report on the Brisbane petrol market
benefit of what taxpayers are spending on the scheme.”4 This may reflect that competition was not effective in fully passing on the subsidy to consumers. This lack of competitiveness appears to have persisted in the Brisbane market beyond the cessation of the subsidy in mid-2009.
Changes in market structure may also be a reason why independent chains price less aggressively in Brisbane than in other cities. The number of independent chains in Brisbane has declined over the last 10 years. In 2007, Matilda (an independent chain that operated around 26 retail sites in Brisbane) was acquired by another existing independent chain, Neumann Petroleum. In 2013, Neumann Petroleum was purchased by Puma Energy.
In contrast, in Sydney, the market share (by site number) of the four lowest priced independent chains (Speedway, Metro, Budget and Westside) increased from around 6 per cent in 2007 to around 18 per cent in 2017.
High prices and profits in Brisbane have imposed a significant cost on Brisbane motorists
The estimated cost to Brisbane motorists of having to pay 3.2 cpl more for RULP than the other four largest cities is around $30 million per year. As the retail margin on other types of petrol (such as E10 and premium unleaded petrol) in Brisbane is also higher than the other four largest cities by broadly the same amount, the total cost to motorists in Brisbane is around $50 million per year.
As retail prices in Brisbane have been consistently higher than those in the other four largest cities since July 2009, this suggests that the cost over the eight years since then would be in the region of $400 million.
Steps to promote competition
The ACCC has noted in its regional market studies that increased petrol price transparency and promotion of effective price competition can lead to lower prices.5 The regional petrol market studies have also noted the importance of monitoring and public reporting of high retail prices.
Increased transparency and promotion of vigorous and effective price competition can lead to lower prices
Readily available information about current retail petrol prices enables motorists to shop around and purchase petrol at relatively lower priced retail sites. Not only do motorists benefit from those lower prices, but the availability of petrol price data may promote competitive market behaviour. It will reward those retailers that are prepared to actively compete on price, because their pricing behaviour can be seen, and acted upon, by motorists.
During 2016 a number of websites and apps were introduced in Australia which provide consumers with near real-time retail petrol pricing information. 7-Eleven introduced an app in February 2016 which provides information about retail prices at all 7-Eleven sites, and GasBuddy commenced operations in Australia in March 2016. The NSW FuelCheck website and NRMA app commenced in August 2016. The existing MotorMouth app and website were modified in May 2016 to provide near real-time prices.
In 2017 the Northern Territory Government announced that it would introduce a similar scheme to NSW later this year, and the Tasmanian Government has helped facilitate a partnership between the Royal Automobile Club of Tasmania and GasBuddy.
These new and modified fuel pricing websites and apps joined other existing ones, such as the Woolworths fuel app, and the long-established Western Australian FuelWatch website.
4 The Hon. Anna Bligh, Premier and Minister for the Arts, and the Hon. Andrew Fraser, Treasurer and Minister for Employment and Economic Development, Fuel Subsidy abolished to boost budget bottom line, Joint media statement, 2 June 2009, at: http://statements.qld.gov.au/Statement/Id/64178, accessed on 1 September 2017.
5 See also the speech by the Chairman of the ACCC, Mr Rod Sims, to the Asia-Pacific Fuel Industry Forum in Melbourne on 13 September 2017, entitled ‘Fuel price transparency and retail industry competition’, available at: https://www.accc.gov.au/speech/fuel-price-transparency-and-retail-industry-competition.

6 Report on the Brisbane petrol market
Motorists in Brisbane can use the fuel price apps and websites relevant to Queensland to decide when to buy petrol and from which site. In the larger cities, at any point in time, there is often a wide range of retail prices.
For example, on 31 August 2017 in Brisbane the range between the highest and lowest retail petrol price at retail sites was over 30 cpl. The wide variation in retail prices is shown in the following screenshots from the GasBuddy and MotorMouth apps.
Screenshot of Brisbane petrol prices on the GasBuddy app as at 11.16 am on 31 August 2017
Source: GasBuddy app.

7 Report on the Brisbane petrol market
Screenshot of Brisbane petrol prices on the MotorMouth app as at 11.21 am on 31 August 2017
Source: MotorMouth app.
By timing their purchases of petrol, and choosing to buy from the lowest priced retailer, motorists filling up a vehicle with a 60 litre tank could save themselves in the region of $10–15 per tank of petrol.
Motorists in Brisbane may wish to note those retailers that generally have retail prices that are below the market average and use this as a guide when shopping around.
Monitoring and public reporting of high retail prices
The ACCC’s regional market studies have noted the importance of monitoring and public reporting of high retail prices. Transparency and close scrutiny of retailer pricing behaviour is likely to reduce the incentive of petrol retailers to increase and/or maintain high prices.
Public monitoring and publication of retail prices can shine a light on what is happening in the market. This could include monthly comparisons of average retail petrol prices in Brisbane with those in the capital cities and nearby locations, as well as with historical prices.
8 Report on the Brisbane petrol market
Queensland Government agencies, motoring organisations, media establishments and academics can use the publicly available retail price data to analyse and comment on retail petrol prices. This could include commentary and analysis about retail petrol prices by location and by brand/retailer over time.
Monitoring and reporting on TGPs and GIRDs over time would also be useful. It would allow Brisbane motorists to see if retailers are passing on decreases in wholesale prices when they occur. The ACCC currently reports on this information in petrol monitoring reports, but more continuous and local reporting may be more effective.
Background
On 9 December 2014 the then Minister for Small Business, the Hon. Bruce Billson MP, gave the ACCC a new direction to monitor the prices, costs and profits of unleaded petroleum products in Australia for a period of three years.
Under these arrangements the ACCC has published petrol market studies on Darwin, Launceston, Armidale and Cairns.
The ACCC obtained information about Brisbane as part of the Cairns market study and decided to prepare a short report on the Brisbane petrol market.6
6 More detail on the background to this market study is included in appendix A.

9 Report on the Brisbane petrol market
1 Petrol prices in Brisbane have been consistently higher than in the other four largest cities
1.1 Retail petrol prices in Brisbane have been higher than in the other four largest cities for many years
Over the period 2009–10 to 2016–17, annual average retail petrol prices in Brisbane were consistently higher than the average of the other four largest cities (i.e. Sydney, Melbourne, Adelaide, and Perth) (see chart 1.1).7
Chart 1.1: Annual average retail petrol prices in Brisbane and the average in the other four largest cities, and the difference: 2009–10 to 2016–17
cpl
cpl
Brisbane (LHS) Other four largest cities (LHS) Di�erence (RHS)
95
105
115
125
135
145
155
2016–172015–162014–152013–142011–122010–112009–10 2012–13
0
2
4
6
8
10
12
Source: ACCC calculations based on data from FUELtrac and Informed Sources.
Between 2009–10 and 2016–17, Brisbane motorists paid on average 3.3 cents per litre (cpl) more for petrol than motorists in the other four largest cities. The annual difference varied over this period, ranging from a high of 4.4 cpl in 2014–15 to a low of 2.5 cpl in 2010–11 and 2016–17.
Brisbane prices were also higher in comparison with each of the other four largest cities (see charts 1.2 to 1.5). The highest annual average difference over this period was 5.2 cpl in 2014–15 in Melbourne and Adelaide and the lowest was 1.0 cpl in Melbourne (2009–10) and Perth (2016–17).
7 The analysis of retail and wholesale price data in this report starts from 1 July 2009. Prior to that date, the Queensland Government provided a petrol subsidy at the retail level of 8.4 cpl (around 9.2 cpl when GST is included).
From July 2014 the ACCC has used E10 prices in Sydney instead of RULP, because sales of E10 are larger than sales of RULP there. These prices are also included in the average of the other four largest cities. Using E10 prices instead of RULP prices in Sydney reduces the average retail price in the other four largest cities by around 0.5 cpl.
Appendix B provides more data on retail prices, TGPs and GIRDs in Brisbane and the other four largest cities.

10 Report on the Brisbane petrol market
Chart 1.2: Annual average retail petrol prices in Brisbane and Sydney, and the difference: 2009–10 to 2016–17cp
l
cpl
Brisbane (LHS) Sydney (LHS) Di�erence (RHS)
95
105
115
125
135
145
155
2016–172015–162014–152013–142011–122010–112009–10 2012–13
0
2
4
6
8
10
12
Source: ACCC calculations based on data from FUELtrac and Informed Sources.
Chart 1.3: Annual average retail petrol prices in Brisbane and Melbourne, and the difference: 2009–10 to 2016–17
cpl
cpl
Brisbane (LHS) Melbourne (LHS) Di�erence (RHS)
95
105
115
125
135
145
155
2016–172015–162014–152013–142011–122010–112009–10 2012–13
0
2
4
6
8
10
12
Source: ACCC calculations based on data from FUELtrac and Informed Sources.

11 Report on the Brisbane petrol market
Chart 1.4: Annual average retail petrol prices in Brisbane and Adelaide, and the difference: 2009–10 to 2016–17
cpl
cpl
Brisbane (LHS) Adelaide (LHS) Di erence (RHS)
95
105
115
125
135
145
155
2016–172015–162014–152013–142011–122010–112009–10 2012–13
0
2
4
6
8
10
12
Source: ACCC calculations based on data from FUELtrac and Informed Sources.
Chart 1.5: Annual average retail petrol prices in Brisbane and Perth, and the difference: 2009–10 to 2016–17
cpl
cpl
Brisbane (LHS) Perth (LHS) Di erence (RHS)
95
105
115
125
135
145
155
2016–172015–162014–152013–142011–122010–112009–10 2012–13
0
2
4
6
8
10
12
Source: ACCC calculations based on data from FUELtrac and Informed Sources.
The charts show that in 2016–17 compared with 2015–16, annual average retail prices:
• decreased in Brisbane and Sydney (by 0.1 cpl and 0.6 cpl respectively)
• increased in Melbourne (by 2.7 cpl), Perth (by 1.6 cpl) and Adelaide (by 0.6 cpl).
As a result:
• the differential between Brisbane and Sydney annual average prices increased
• the differential between Brisbane annual average prices and those in Melbourne, Perth and Adelaide all decreased.

12 Report on the Brisbane petrol market
1.2 Average TGPs in Brisbane were almost the same as those in the other four largest cities
Terminal gate prices (TGPs) are the prices at which petrol can be purchased from wholesalers in the spot market and are posted on a regular basis on the websites of the major wholesalers. While many wholesale transactions do not occur at the terminal gate, TGPs can be regarded as indicative wholesale prices.
Over the period 2009–10 to 2016–17, the average annual difference between petrol TGPs in Brisbane and the average in the other four largest cities was –0.1 cpl (see chart 1.6).8 It ranged from a high of 0.2 cpl in 2015–16 and 2016–17 to a low of -0.4 cpl in 2009–10.
Chart 1.6: Annual average RULP TGPs in Brisbane and the average in the other four largest cities, and the difference: 2009–10 to 2016–17
cpl
cpl
Brisbane (LHS) Other four largest cities (LHS) Di�erence (RHS)
–1
0
1
2
3
4
2016–172015–162014–152013–142012–132011–122010–112009–10
95
105
115
125
135
145
Source: ACCC calculations based on data from BP, Caltex, Mobil, Viva Energy and WA FuelWatch.
1.3 GIRDs in Brisbane were higher than in the other four largest cities
Gross indicative retail differences (GIRDs) are the difference between retail prices and published TGPs. GIRDs can be treated as a useful approximate benchmark of the retail gross margin on petrol. They should not be confused with actual retail profits as they also include retail costs, which vary over time.
Between 2009–10 and 2016–17, GIRDs in Brisbane were on average 3.2 cpl higher than the average in the other four largest cities (see chart 1.7).9
8 Data in chart 1.6 is for RULP, including in Sydney. Using E10 TGPs for Sydney from July 2014 instead of RULP TGPs reduces the annual average TGP in the other four largest cities by around 0.5 cpl.
9 The GIRDs for Sydney are calculated using E10 retail prices and E10 TGPs. Sydney E10 GIRDs are used in the calculation of GIRDs in the other four largest cities.

13 Report on the Brisbane petrol market
Chart 1.7: Annual average petrol GIRDs in Brisbane and the average in the other four largest cities, and the difference: 2009–10 to 2016–17
cpl
cpl
Brisbane (LHS) Other four largest cities (LHS) Di�erence (RHS)
0
2
4
6
8
10
12
14
2016–172015–162014–152013–142012–132011–122010–112009–10
0
3
6
9
12
15
18
21
Source: ACCC calculations based on data from BP, Caltex, FUELtrac, Informed Sources, Mobil, Viva Energy and WA FuelWatch.
In 2016–17 annual average GIRDs in Brisbane were 13.0 cpl, which was 1.9 cpl higher than in the other four largest cities (11.1 cpl).
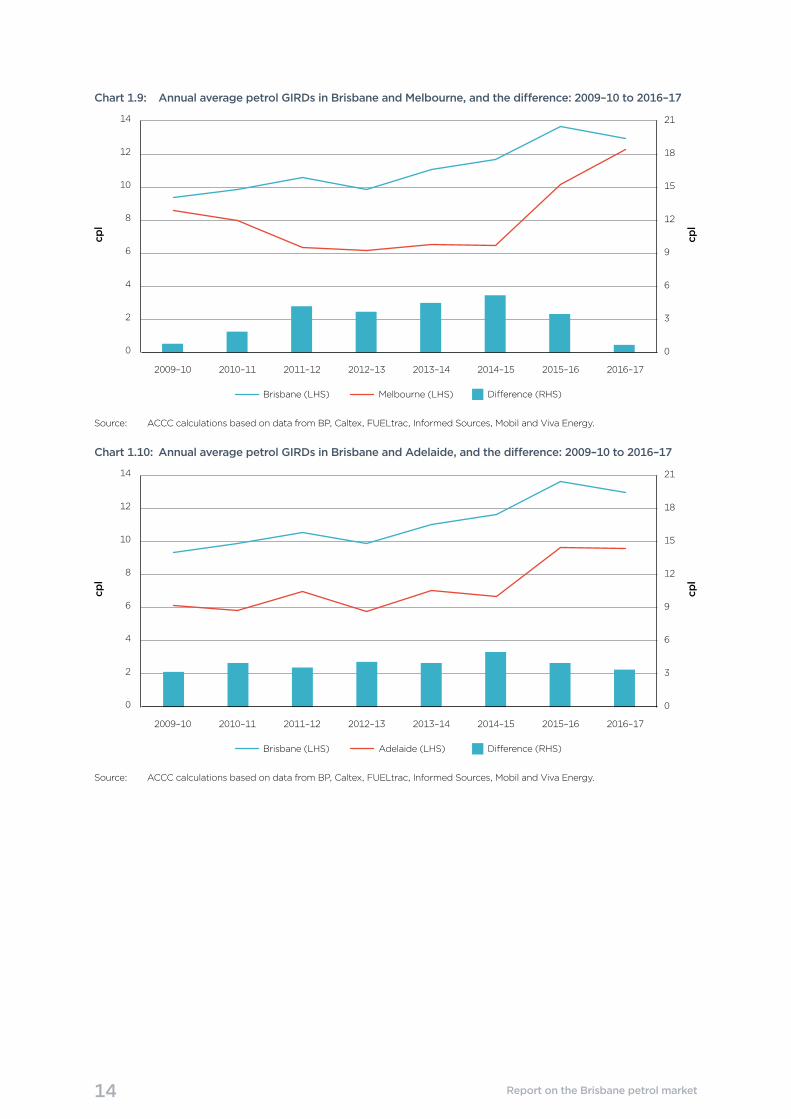
Brisbane annual average GIRDs were also higher in comparison with each of the other four largest cities between 2009–10 and 2016–17 (see charts 1.8 to 1.11).
Chart 1.8: Annual average petrol GIRDs in Brisbane and Sydney, and the difference: 2009–10 to 2016–17
cpl
cpl
Brisbane (LHS) Sydney (LHS) Di�erence (RHS)
0
2
4
6
8
10
12
14
2016–172015–162014–152013–142012–132011–122010–112009–10
0
3
6
9
12
15
18
21
Source: ACCC calculations based on data from BP, Caltex, FUELtrac, Informed Sources, Mobil and Viva Energy.
14 Report on the Brisbane petrol market
Chart 1.9: Annual average petrol GIRDs in Brisbane and Melbourne, and the difference: 2009–10 to 2016–17cp
l
cpl
Brisbane (LHS) Melbourne (LHS) Di�erence (RHS)
0
2
4
6
8
10
12
14
2016–172015–162014–152013–142012–132011–122010–112009–10
0
3
6
9
12
15
18
21
Source: ACCC calculations based on data from BP, Caltex, FUELtrac, Informed Sources, Mobil and Viva Energy.
Chart 1.10: Annual average petrol GIRDs in Brisbane and Adelaide, and the difference: 2009–10 to 2016–17
cpl
cpl
Brisbane (LHS) Adelaide (LHS) Di erence (RHS)
0
2
4
6
8
10
12
14
2016–172015–162014–152013–142012–132011–122010–112009–10
0
3
6
9
12
15
18
21
Source: ACCC calculations based on data from BP, Caltex, FUELtrac, Informed Sources, Mobil and Viva Energy.

15 Report on the Brisbane petrol market
Chart 1.11: Annual average petrol GIRDs in Brisbane and Perth, and the difference: 2009–10 to 2016–17cp
l
cpl
Brisbane (LHS) Perth (LHS) Di erence (RHS)
0
2
4
6
8
10
12
14
2016–172015–162014–152013–142012–132011–122010–112009–10
0
3
6
9
12
15
18
21
Source: ACCC calculations based on data from BP, Caltex, FUELtrac, Informed Sources, Mobil, Viva Energy and WA FuelWatch.
Over the eight-year period 2009–10 to 2016–17, the difference between GIRDs in Brisbane and those in one of the other capital cities was highest in Perth (5.3 cpl in 2009–10) and lowest in Melbourne (0.7 cpl in 2016–17).
The charts show that in 2016–17 compared with 2015–16, annual average GIRDs:
• decreased in Brisbane (by 0.7 cpl), Sydney (by 1.4 cpl) and Adelaide (by 0.1 cpl)
• increased in Melbourne (by 2.1 cpl) and Perth (by 0.7 cpl).
As a result:
• the differential between Brisbane and Sydney annual average GIRDs increased
• the differential between annual average GIRDs in Brisbane and those in Melbourne, Perth and Adelaide all decreased.
16 Report on the Brisbane petrol market
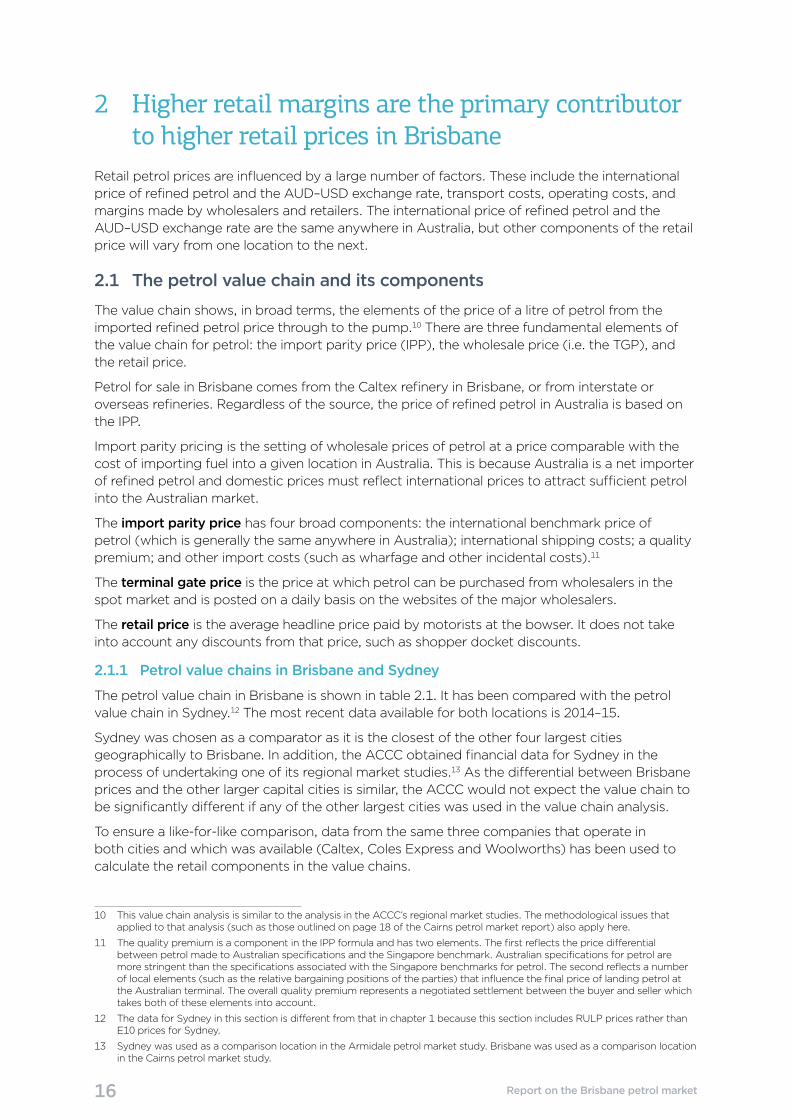
2 Higher retail margins are the primary contributor to higher retail prices in Brisbane
Retail petrol prices are influenced by a large number of factors. These include the international price of refined petrol and the AUD–USD exchange rate, transport costs, operating costs, and margins made by wholesalers and retailers. The international price of refined petrol and the AUD–USD exchange rate are the same anywhere in Australia, but other components of the retail price will vary from one location to the next.
2.1 The petrol value chain and its components
The value chain shows, in broad terms, the elements of the price of a litre of petrol from the imported refined petrol price through to the pump.10 There are three fundamental elements of the value chain for petrol: the import parity price (IPP), the wholesale price (i.e. the TGP), and the retail price.
Petrol for sale in Brisbane comes from the Caltex refinery in Brisbane, or from interstate or overseas refineries. Regardless of the source, the price of refined petrol in Australia is based on the IPP.
Import parity pricing is the setting of wholesale prices of petrol at a price comparable with the cost of importing fuel into a given location in Australia. This is because Australia is a net importer of refined petrol and domestic prices must reflect international prices to attract sufficient petrol into the Australian market.
The import parity price has four broad components: the international benchmark price of petrol (which is generally the same anywhere in Australia); international shipping costs; a quality premium; and other import costs (such as wharfage and other incidental costs).11
The terminal gate price is the price at which petrol can be purchased from wholesalers in the spot market and is posted on a daily basis on the websites of the major wholesalers.
The retail price is the average headline price paid by motorists at the bowser. It does not take into account any discounts from that price, such as shopper docket discounts.
2.1.1 Petrol value chains in Brisbane and Sydney
The petrol value chain in Brisbane is shown in table 2.1. It has been compared with the petrol value chain in Sydney.12 The most recent data available for both locations is 2014–15.
Sydney was chosen as a comparator as it is the closest of the other four largest cities geographically to Brisbane. In addition, the ACCC obtained financial data for Sydney in the process of undertaking one of its regional market studies.13 As the differential between Brisbane prices and the other larger capital cities is similar, the ACCC would not expect the value chain to be significantly different if any of the other largest cities was used in the value chain analysis.
To ensure a like-for-like comparison, data from the same three companies that operate in both cities and which was available (Caltex, Coles Express and Woolworths) has been used to calculate the retail components in the value chains.
10 This value chain analysis is similar to the analysis in the ACCC’s regional market studies. The methodological issues that applied to that analysis (such as those outlined on page 18 of the Cairns petrol market report) also apply here.
11 The quality premium is a component in the IPP formula and has two elements. The first reflects the price differential between petrol made to Australian specifications and the Singapore benchmark. Australian specifications for petrol are more stringent than the specifications associated with the Singapore benchmarks for petrol. The second reflects a number of local elements (such as the relative bargaining positions of the parties) that influence the final price of landing petrol at the Australian terminal. The overall quality premium represents a negotiated settlement between the buyer and seller which takes both of these elements into account.
12 The data for Sydney in this section is different from that in chapter 1 because this section includes RULP prices rather than E10 prices for Sydney.
13 Sydney was used as a comparison location in the Armidale petrol market study. Brisbane was used as a comparison location in the Cairns petrol market study.

17 Report on the Brisbane petrol market
In 2014–15 the annual average retail petrol price in Brisbane was 137.6 cpl, which was 2.9 cpl higher than in Sydney (134.7 cpl).
Table 2.1: Petrol value chain in Brisbane and Sydney: 2014–15 (cpl)
Brisbane Sydney Brisbane less Sydney
Retail price 137.6 134.7 2.9
Net margin 5 2 3
Operating costs 5 5 0
Freight 1 1 0
GST—retail (a) 1 1 0
Terminal gate price 125.9 126.5 –0.6
Wholesale GST and excise 50 50 0
Costs and margins 5 5 0
Import parity price 70.5 70.8 –0.3
Refined petrol 66 66 0
Freight 3 3 0
Costs and margins 1 1 0
Quality premium 0 0 0
Source: ACCC calculations based on retail price data from FUELtrac and financial data from Caltex, Coles Express, and Woolworths. TGPs and IPPs are based on data from BP, Caltex, Mobil and Viva Energy.
Notes: The components of each price level (i.e. retail, TGP and IPP) for each location have been rounded. As a result, they may not sum to the totals. (a) GST–retail is one-eleventh of the difference between the retail price and the TGP.
The value chain shows that in 2014–15 the factor contributing to higher retail petrol prices in Brisbane compared with Sydney was at the retail level.
Retailers in Brisbane achieved an average net retail margin of around 5 cpl, after accounting for retail operating costs, freight and taxes. This was 3 cpl higher than the average net retail margin in Sydney.
The relatively high retail margins in Brisbane compared with Sydney are likely to be the result of limited retail price competition in Brisbane. This is discussed further in chapters 4 and 5.
Fuel retailers incur a range of operating expenses including staff costs, energy costs, site rental costs and cleaning and maintenance. The margins fuel retailers make on the sale of fuel and other products (such as convenience store products) must cover these costs. Operating costs per litre allocated to fuel retailing in Brisbane were the same as in Sydney.
2.2 Wholesale prices in Brisbane are similar to those in Sydney
Annual average petrol TGPs in Brisbane and Sydney were broadly similar over the eight years 2009–10 to 2016–17.
Over that period annual average petrol TGPs in Brisbane were 0.3 cpl lower than annual average petrol TGPs in Sydney (see chart 2.1). The largest absolute difference was 0.6 cpl in 2013–14 and 2014–15 and the smallest difference was zero in 2015–16 and 2016–17.

18 Report on the Brisbane petrol market
Chart 2.1: Annual average petrol TGPs in Brisbane and Sydney, and the difference: 2009–10 to 2016–17cp
l
cpl
Brisbane (LHS) Sydney (LHS) Di�erence (RHS)
–1
0
1
2
3
4
5
2016–172015–162014–152013–142012–132011–122010–112009–10
90
100
110
120
130
140
150
Source: ACCC calculations based on data from BP, Caltex, Mobil and Viva Energy.
Table 2.1 indicates that there is minimal difference between Brisbane and Sydney in the components of the petrol TGPs. The IPP for Brisbane and Sydney is essentially the same, as is the estimated TGP wholesale costs and margins.
2.3 Brisbane petrol value chain over time
Table 2.2 shows the petrol value chain in Brisbane for the five-year period 2011–12 to 2015–16.
Table 2.2: Petrol value chain in Brisbane: 2011–12 to 2015–16 (cpl)
2011–12 2012–13 2013–14 2014–15 2015–16
Retail price 145.4 144.0 153.5 137.6 124.7
Net margin 5 4 4 5 6
Operating costs 4 4 5 5 5
Freight 1 1 1 1 1
GST—retail (a) 1 1 1 1 1
Terminal gate price 134.8 134.1 142.4 125.9 111.0
Wholesale GST and excise 50 50 51 50 50
Costs and margins 5 5 5 5 6
Import parity price 79.7 79.1 86.5 70.5 55.3
Refined petrol 76 75 82 66 51
Freight 2 2 3 3 3
Costs and margins 1 1 1 1 1
Quality premium 1 1 1 0 0
Source: ACCC calculations based on retail price data from FUELtrac and Informed Sources, and financial data from Caltex, Coles Express, and Woolworths. TGPs and IPPs are based on data from BP, Caltex, Mobil and Viva Energy.
Notes: The components of each price level (i.e. retail, TGP and IPP) for each location have been rounded. As a result, they may not sum to the totals. (a) GST–retail is one-eleventh of the difference between the retail price and the TGP.
It shows that over the period, in Brisbane:
• the retail net margin increased from 4 cpl to 6 cpl between 2012–13 and 2015–16
• the operating cost per litre remained broadly stable.

19 Report on the Brisbane petrol market
3 Profits have increased in Brisbane in recent years, reflecting increased margins on petrol
This chapter presents the analysis of retail site profitability in Brisbane, and compares this with Sydney and Australia as a whole.14
3.1 Average net profit per site in Brisbane has been high, but varies substantially between companies
Over the period 2011–12 to 2015–16 the annual average net profit per site in Brisbane ranged from a low of $435 000 in 2011–12 to a high of $648 000 in 2015–16 (see chart 3.1).15 Annual average net profit over the five-year period was $539 000 per site. Between 2011–12 and 2015–16, average profit per site increased by almost 50 per cent.
Chart 3.1: Annual average net profit per site in Brisbane: 2011–12 to 2015–16
0
100
200
300
400
500
600
700
2015–162014–152013–142012–132011–12
$ ’0
00
Source: ACCC calculations based on data obtained from 1 Riverside Quay (a subsidiary of BP), 7-Eleven, Caltex, Centrel (a subsidiary of BP), Coles Express, Freedom Fuels, Puma Energy, United and Woolworths.
Notes: The net profit figures are based on profit and loss statements and financial templates provided by the companies. Net profit per site is broadly equal to earnings before interest and tax.
Average net profit per site varied significantly across companies, ranging from under $200 000 per site to well over $1 million per site.
3.2 Average net profit per site in Brisbane was higher than in Sydney
Chart 3.2 shows annual average net profit per site in Brisbane and Sydney from 2011–12 to 2014–15. Data from Caltex, Coles Express and Woolworths sites was used for a like-for-like comparison across the two locations. Brisbane average net profit per site was higher than Sydney in each year during the period.
14 The profitability analysis in this chapter is similar to the analysis in the ACCC’s regional market studies. The methodological issues that applied to that analysis (such as outlined on page 18 of the Cairns petrol market report) also apply here. Profitability data in this chapter does not take account of head office costs.
15 In 2015–16 data for over 70 per cent of retail sites in Brisbane is included in the chart.

20 Report on the Brisbane petrol market
Chart 3.2: Annual average net profit per site in Brisbane and Sydney: 2011–12 to 2014–15
2014–152013–142012–132011–12
0
100
200
300
400
500
600
700
Brisbane Sydney
$ ’0
00
Source: ACCC calculations based on data obtained from Caltex, Coles Express and Woolworths.
Notes: The net profit figures are based on profit and loss statements and financial templates provided by the companies. Net profit per site is broadly equal to earnings before interest and tax.
Over the period 2011–12 to 2014–15 the average net profit per site in Brisbane was around $567 000 per site. This was around 26 per cent higher than the average net profit per site in Sydney (around $451 000).
The higher average net profit per site in Brisbane compared with Sydney was due to significantly higher profits from both fuel and non-fuel sales. The higher profits from fuel sales were due to higher volumes and margins and, combined with higher profits from non-fuel sales, they more than offset the higher operating costs (wages and rent in particular) per site in Brisbane.
3.3 Average net profit per site in Brisbane was also higher than the Australian average
Chart 3.3 shows that average net profit per site in Brisbane was higher than the average net profit per site across Australia in every year between 2011–12 and 2015–16.
The average net profit per site across Australia should be treated with a degree of caution when used as a comparator. It consists of sites with different types of operating structure (such as company-owned company-operated, commission agent sites and franchisees) which have significantly different revenue and cost structures.16
In addition, sites across Australia have different proportions of fuel types sold with different margins, depending on their location. For example, for sites in New South Wales there will be a higher proportion of premium unleaded petrol sold, which generally has higher margins than other types of fuel.
16 It also does not include small independent sites, which typically have lower profits. However, the profitability data for Brisbane in this chapter also does not include small independent sites.

21 Report on the Brisbane petrol market
Chart 3.3: Annual average net profit per site in Brisbane and Australia: 2011–12 to 2015–16
0
100
200
300
400
500
600
700
Brisbane Australia
2015-162014-152013-142012-132011-12
$ ’0
00
Source: ACCC calculations for Brisbane are based on data obtained from 1 Riverside Quay, 7-Eleven, Caltex, Centrel, Coles Express, Freedom Fuels, Puma Energy, United and Woolworths. ACCC calculations for Australia as a whole are based on data from 7-Eleven, BP, Caltex, Coles Express, Puma Energy, United and Woolworths.
3.4 Increases in average net profit per site in Brisbane were mainly due to increases in fuel profits
Net profit per site is broadly made up of gross profit on fuel sales and non-fuel sales, less total operating costs. Chart 3.4 shows these three components of net profit in Brisbane between 2011–12 and 2015–16.
Chart 3.4: Annual average gross profits on fuel and non-fuel sales, and total operating costs, per site in Brisbane: 2011–12 to 2015–16
$ ’0
00
0
100
200
300
400
500
600
700
800
900
1000
2015–162014–152013–142012–132011–12
Average total operating costs per siteAverage gross profit on non–fuel sales per siteAverage gross profit on fuel sales per site
Source: ACCC calculations based on data obtained from 1 Riverside Quay, 7-Eleven, Caltex, Centrel, Coles Express, Freedom Fuels, Puma Energy, United and Woolworths.
Chart 3.4 indicates that average gross profit on non-fuel sales per site was broadly stable between 2011–12 and 2015–16, as was average total operating costs per site. Therefore, the increase in average net profit per site in Brisbane over this period was primarily due to the increase in average gross profit on fuel sales.

22 Report on the Brisbane petrol market
4 There are relatively fewer independent retailers in Brisbane
4.1 The Brisbane retail market includes a variety of retail operations
As at 30 June 2017 there were 404 fuel retail sites in Brisbane. Chart 4.1 shows that BP, 7-Eleven, Caltex and Coles Express represent the major brands in the Brisbane market. These four brands combined account for around two-thirds of sites in the Brisbane market.
Chart 4.1: Brisbane retail petrol sites by brand as at 30 June 2017
0
10
20
30
40
50
60
70
80
Smallindependents
MatildaUnitedFreedomFuels
PumaEnergy
7-ElevenWoolworthsColesExpress
BPCaltex
Num
ber
of
site
s
62
74
59
41
70
3222
11 11
22
Source: ACCC calculations based on Informed Sources Netwatch data.
As at 30 June 2017 there were 843 retail sites in Sydney, more than double the number of retail sites in Brisbane (see chart 4.2). In Sydney, as in Brisbane, BP, 7-Eleven, Caltex and Coles Express represent the major brands. These four brands combined account for around 60 per cent of sites in the Sydney market.
Chart 4.2: Sydney retail petrol sites by brand as at 30 June 2017
Smallindepend-
ents
Budget UnitedMetro7-ElevenWool-worths
SpeedwayColesExpress
BPCaltex
Num
ber
of
site
s
0
20
40
60
80
100
120
140
160
180
Westside
129154
102
68
135
78 76
36 3410
21
Source: ACCC calculations based on Informed Sources Netwatch data.
23 Report on the Brisbane petrol market
4.2 Brisbane has a lower proportion of retail sites operated by independent chains than Sydney
A variety of types of retail sites operate in the Brisbane retail market, which have differing operating arrangements and differing pricing strategies. For the purposes of this analysis, retail sites have been broken down into four basic categories:
• Refiner-wholesaler controlled retail sites—these are BP and Caltex retail sites where the price is set by BP and Caltex.
• Supermarket retail sites—these retail sites are operated by the two large supermarket chains—Coles Express and Woolworths—with fuel supplied by Viva Energy and Caltex respectively.
• Independent chains—these are non-refiner-wholesaler owned retail sites. There are two main types: those that operate under their own brand (such as 7-Eleven, United, Puma Energy and Freedom Fuels), and those that operate under a refiner-wholesaler brand, but where the independent operator sets the retail price.
– For the purposes of this analysis, the ACCC has considered an independent operator that runs 10 or more retail sites with the same brand, and sets the retail price at those sites, to be an independent chain.
• Smaller independent retail sites—these are small, independently operated retail sites where the operator runs less than 10 retail sites. Like independent chains, they may operate under their own brand or that of a refiner-wholesaler.
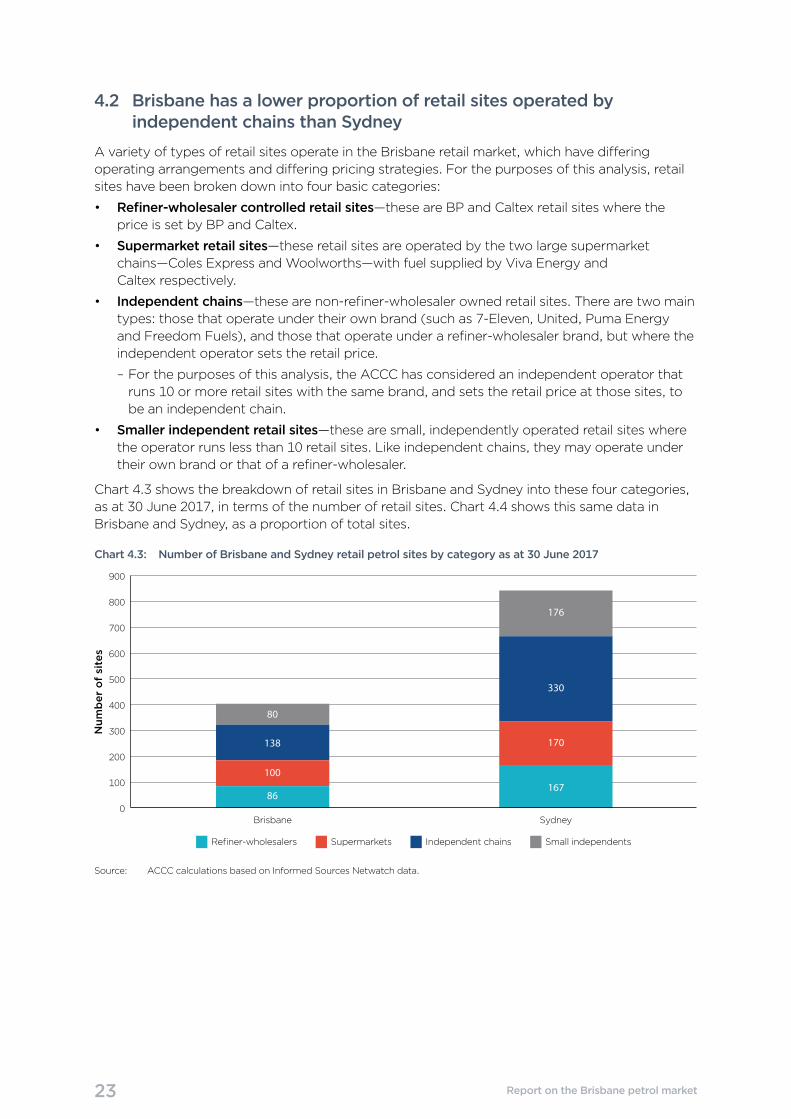
Chart 4.3 shows the breakdown of retail sites in Brisbane and Sydney into these four categories, as at 30 June 2017, in terms of the number of retail sites. Chart 4.4 shows this same data in Brisbane and Sydney, as a proportion of total sites.
Chart 4.3: Number of Brisbane and Sydney retail petrol sites by category as at 30 June 2017
0
100
200
300
400
500
600
700
800
900
SydneyBrisbane
Num
ber
of
site
s
Independent chains Small independentsRefiner-wholesalers Supermarkets
138
80
100
86
330
176
170
167
Source: ACCC calculations based on Informed Sources Netwatch data.

24 Report on the Brisbane petrol market
Chart 4.4: Proportion of Brisbane and Sydney retail petrol sites by category as at 30 June 2017
0
10
20
30
40
50
60
70
80
90
100
SydneyBrisbane
Per
cen
t
Independent chains Small independentsRefiner-wholesalers Supermarkets
34
20
25
21
39
21
20
20
Source: ACCC calculations based on Informed Sources Netwatch data.
The largest category of retail sites in both cities is ‘independent chains’. In Brisbane there are four independent chains: 7-Eleven, Puma Energy, Freedom Fuels and United.17 Combined they have a total of 138 retail sites, accounting for around 34 per cent of the total number of Brisbane retail sites. In Sydney, there are seven independent chains: 7-Eleven, United, Speedway, Metro, Budget, Westside and Jasbe (a BP-branded but independently operated chain). Combined they have a total of 330 retail sites, accounting for around 39 per cent of the total number of Sydney retail sites.
In Brisbane, the smallest category is ‘small independents’, which has 80 retail sites, accounting for around 20 per cent of the total number of Brisbane retail sites. In Sydney, the smallest category is ‘refiner-wholesalers’, which has 167 retail sites, accounting for around 20 per cent of the total number of Sydney retail sites.
4.3 Independent chains in Brisbane have relatively low volumes per retail site
Chart 4.5 shows market shares by RULP volume sold in 2015–16 for the major categories of retail operations in Brisbane. The chart shows the significance of the supermarket operators by volume. In Brisbane, the supermarket operators have around 40 per cent of the market by volume, while small independents, independent chains and refiner wholesalers all have around 20 per cent of the market.
When comparing chart 4.4 with chart 4.5, independent chains have around 34 per cent of the retail sites in the Brisbane market, but only 20 per cent of sales volume. On the other hand, the supermarket operators have only 25 per cent of the retail sites in Brisbane, but 40 per cent of sales volume. This indicates that the average retail site in the independent chain category would have significantly lower sales volumes by retail site than the average supermarket retail site.
17 Puma Energy also sets the price at a small number of Matilda-branded retail sites. The remainder of the Matilda-branded retail sites have been included in the ‘small independents’ category.

25 Report on the Brisbane petrol market
Chart 4.5: Market shares by volume of Brisbane retail petrol site categories: 2015–16
0
5
10
15
20
25
30
35
40
45
Small independentsIndependent chainsSupermarketsRefiner-wholesalers
Per
cen
t
19
40
2021
Source: ACCC calculations based on data obtained from 1 Riverside Quay, 7-Eleven, Caltex, Centrel, Coles Express, Freedom Fuels, Puma Energy, United and Woolworths.
4.4 The Brisbane retail market has undergone significant change over the past 10 years
Over the past 10 years, there has been little change in the overall number of retail sites in the Brisbane market, with the number of retail sites remaining at around 400. However, there has been significant change in the composition of the market. Chart 4.6 shows the number of retail petrol sites by brand in Brisbane as at 30 June 2007.
Chart 4.6: Brisbane retail petrol sites by brand as at 30 June 2007
Smallindependents
MatildaFreedomFuels
7-ElevenWoolworthsColesExpress
BPCaltex
0
10
20
30
40
50
60
70
80
90
MobilNeumann
Num
ber
of
site
s
46
79
49 4836
22 26
14
30
51
Source: ACCC calculations based on Informed Sources Netwatch data.
Comparing the composition of retail sites in Brisbane in June 2007 with the composition in June 2017 (in chart 4.1), the following changes have taken place in the Brisbane market:
• the number of small independent retail sites has more than halved, from 51 retail sites in 2007 to 22 retail sites in 2017
• 7-Eleven has almost doubled its number of retail sites (from 36 retail sites in 2007 to 70 retail sites in June 2017), largely due to its purchase of Mobil’s retail network in 2010
• Puma Energy purchased the Neumann retail network (which in turn had acquired Matilda), though some Matilda-branded retail sites still remain

26 Report on the Brisbane petrol market
• the number of Caltex retail sites increased, partly due to a number of the Caltex/Woolworths joint venture sites reverting to Caltex
• the number of Coles Express retail sites increased by 10
• the number of United retail sites increased from four in 2007 to 11 in June 2017.
As noted in section 4.1, BP, Caltex, Coles Express and 7-Eleven retail sites accounted for around 66 per cent of the total number of retail sites in Brisbane in 2017. This was a significant increase from 2007, when these four brands accounted for around 52 per cent of retail sites.
4.5 The degree of competition in the retail petrol market in Brisbane is less than in Sydney
Over its years monitoring the petroleum industry the ACCC has found that independent chains can be vigorous and competitive price setters in large metropolitan markets, and their absence can mean that prices are otherwise higher.
The ACCC’s recent petrol market studies have also indicated that small ‘maverick’ independent retailers may also have a pro-competitive influence on the market. Smaller independents may or may not be vigorous competitors depending on their type of operation, pricing strategy and the degree of competition they face.
As noted in section 4.1, Brisbane currently has four independent chains, while Sydney has seven. The number of independent chains in Brisbane has declined over the last 10 years. In 2007, Matilda (an independent chain that operated around 26 retail sites in Brisbane) was acquired by another existing independent chain, Neumann Petroleum. In 2013, Neumann Petroleum was purchased by Puma Energy.
The extent to which the independent chains aggressively set prices is also an important factor influencing competition in the market. This is examined in chapter 5. However, it appears that the independent chains in Brisbane are not as aggressive in their pricing behaviour as they are in Sydney.
Sydney has a number of independent chains that provide strong price competition. These include Speedway, Metro and Budget. Speedway expressly aims to have competitive prices. On its website, it states:
Speedway strives to be highly competitive and our presence means that Sydney isn’t dominated by a few multinational fuel retailers. Our ability to provide inexpensive fuel to motorists also helps keep the city’s overall fuel prices down.18
Similarly Budget state on their website:
Our fuels are of the highest quality, at some of the most competitive prices.19
The small independent retail sites taken as a group also do not appear to compete as vigorously in Brisbane as they do in Sydney.
4.6 Some in the industry have noted the lack of competition in the Brisbane market
In December 2016 the ACCC asked 10 major petrol retailers in Brisbane to provide any factors they were aware of which would explain why average retail petrol prices in Brisbane were generally higher than in the other four largest cities.
The responses received by the ACCC were largely disappointing. Most retailers stated that they were unable to provide an explanation, with a few noting that their pricing policy was to follow the market.
18 Speedway Petroleum, http://www.speedwaypetroleum.com.au/, accessed on 1 September 2017.
19 Budget Petrol, http://gascorp.com.au/, accessed on 1 September 2017.

27 Report on the Brisbane petrol market
However, one company responded that:
…the average RULP price differential between Brisbane and the other four largest cities reflects the fact that there are differing levels of price competitiveness in different local areas.20
This implies that the level of price competitiveness in Brisbane is less than in other locations.
The Royal Automobile Club of Queensland (RACQ) has also identified the relative level of competition as an influence. When commenting on higher relative retail prices in Brisbane compared with those in the other capital cities, the RACQ media spokesperson is quoted as follows, in a media release in November 2016:
Ms Smith said a lack of competition had played a part in Brisbane’s higher petrol prices. “We don’t have the same level of retail competition as Sydney and Melbourne and we believe that’s why we’re forced to pay more,” she said.21
20 The only other explanation for higher retail prices in Brisbane mentioned by one of the major retailers to the ACCC was that shipping inefficiencies due to the Port of Brisbane draft restrictions, and limited onshore tankage storage options, mean that imports of fuel into Brisbane are more costly than other capital cities.
21 RACQ Media, Brisbane petrol pain continues: RACQ, media release, 8 November 2016, at: https://live.racq.com.au/2016/11/brisbanes-petrol-pain-continues-racq/, accessed 1 September 2017.
28 Report on the Brisbane petrol market
5 Prices of independent retailers are relatively higher in Brisbane than in Sydney
As noted in chapter 4 both independent chains and small independents represent a smaller proportion of the retail market in Brisbane than they do in Sydney.
5.1 The degree of price competition is lower in Brisbane
An indication of the degree of competition in the retail petrol market is the extent to which prices are above TGPs at the troughs and peaks of the price cycle.
A petrol price cycle is a movement in retail price from a low point (or trough) to a high point (or peak) to a subsequent low point. In these cycles, prices steadily decrease for a period followed by a sharp increase.
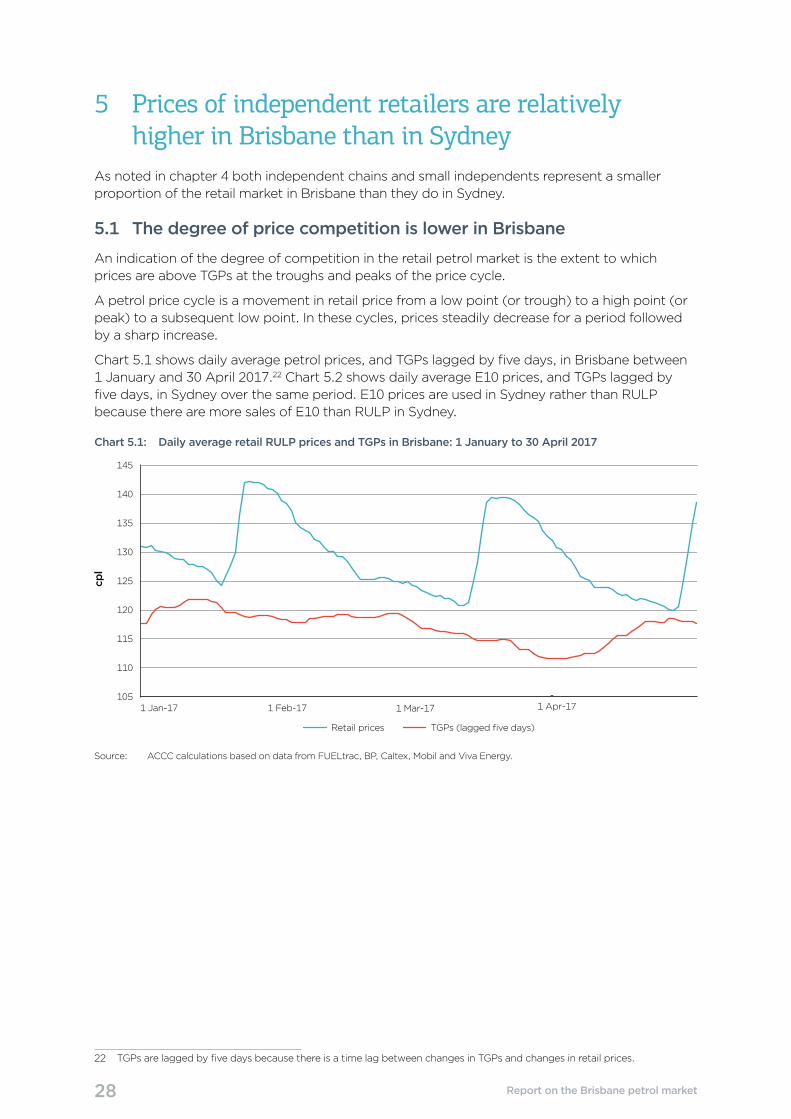
Chart 5.1 shows daily average petrol prices, and TGPs lagged by five days, in Brisbane between 1 January and 30 April 2017.22 Chart 5.2 shows daily average E10 prices, and TGPs lagged by five days, in Sydney over the same period. E10 prices are used in Sydney rather than RULP because there are more sales of E10 than RULP in Sydney.
Chart 5.1: Daily average retail RULP prices and TGPs in Brisbane: 1 January to 30 April 2017
cpl
105
110
115
120
125
130
135
140
145
Retail prices TGPs (lagged five days)
1 Jan-17 1 Feb-17 1 Mar-17 1 Apr-17
Source: ACCC calculations based on data from FUELtrac, BP, Caltex, Mobil and Viva Energy.
22 TGPs are lagged by five days because there is a time lag between changes in TGPs and changes in retail prices.

29 Report on the Brisbane petrol market
Chart 5.2 : Daily average retail E10 prices and TGPs in Sydney: 1 January to 30 April 2017cp
l
Retail prices TGPs (lagged five days)
105
110
115
120
125
130
135
140
145
1 Jan-17 1 Feb-17 1 Mar-17 1 Apr-17
Source: ACCC calculations based on data from FUELtrac, BP, Caltex, Mobil and Viva Energy.
The charts show that, over the four-month period, the difference between retail prices and TGPs at the bottom of the price cycle was significantly higher in Brisbane than in Sydney:
• in the three troughs in Brisbane, retail prices were on average 3.3 cpl higher than TGPs
• in the three troughs in Sydney, retail prices were on average 0.3 cpl lower than TGPs.
Similarly, over the four-month period, the difference between retail prices and TGPs at the top of the price cycle was significantly higher in Brisbane than in Sydney:
• in the two peaks in Brisbane, retail prices were on average 24.1 cpl higher than TGPs
• in the three peaks in Sydney, retail prices were on average 21.5 cpl higher than TGPs.
These charts indicate that there is a greater degree of price competition in Sydney compared with Brisbane.
5.2 Prices of independent chains tend to be relatively higher in Brisbane than in Sydney
The ACCC has examined retail RULP prices by major retailer in Brisbane, and retail E10 prices by major retailer in Sydney, over the four months between 1 January and 30 April 2017.23
In Brisbane, an average retail petrol price for this period was calculated for the following retailers: BP COCO, Caltex COCO, Coles Express, Woolworths, 7-Eleven, United, Freedom Fuels, Puma Energy and a small independents category (which comprises independently-owned BP and Caltex branded retail sites and small independent retail sites).
In Sydney, an average retail E10 price was calculated for the following retailers: BP COCO, Caltex COCO, Coles Express, Woolworths, 7-Eleven, United, Jasbe, Speedway, Budget, Metro, Westside, and a small independents category (which comprises independently-owned BP and Caltex branded retail sites and small independent retail sites).
Chart 5.3 shows the difference between each major retailer’s average RULP price and the market average RULP price in Brisbane in the period 1 January to 30 April 2017.
23 For a retail site to be included in this analysis, a daily average price had to be available for 105 out of 120 days during this period (i.e. 85 per cent). Prices were available for around 80 per cent of the total number of retail sites in Brisbane and around 82 per cent of the total number of retail sites in Sydney. Not all retail sites in Brisbane sell RULP and not all retail sites in Sydney sell E10.

30 Report on the Brisbane petrol market
Chart 5.3: Difference between each major retailer’s average RULP price and the market average RULP price in Brisbane: 1 January to 30 April 2017
–6 –4 –2 0 2 4 6
7-Eleven
Woolworths
Puma Energy
United
Small independents
Caltex COCO
Freedom Fuels
BP COCO
Coles Express
cpl
Source: ACCC calculations based on data from Informed Sources.
Note: Informed Sources collects price data electronically from its subscribers and manually for other brands.
The chart shows that average retail prices of 7-Eleven, Woolworths, Puma Energy and United were below the average market price in Brisbane and average retail prices of Coles Express, BP COCO and Freedom Fuels were above the market average price. Caltex COCO and small independents were both around the market average price.
Average retail prices at 7-Eleven retail sites were almost 2 cpl lower than the market average price in Brisbane, and average retail prices at Coles Express retail sites were over 4 cpl higher than the market average price.
The four retailers which had prices below the market average price in Brisbane accounted for around 45 per cent of the total number of retail sites for which price data was available. In terms of sales volumes in 2015–16, the proportion of retail operators below the market average price in Brisbane was around 35 per cent.
Chart 5.4 shows the difference between each major retailer’s average E10 price and the market average E10 price in Sydney in the period 1 January to 30 April 2017.

31 Report on the Brisbane petrol market
Chart 5.4: Difference between each major retailer’s average E10 price and the market average E10 price in Sydney: 1 January to 30 April 2017
–6 –4 –2 0 2 4 6
Coles Express
BP COCO
Caltex COCO
Woolworths
7-Eleven
United
Small independents
Westside
Budget
Metro
Speedway
cpl
Jasbe
Source: ACCC calculations based on data from Informed Sources.
Note: Informed Sources collects price data electronically from its subscribers and manually for other brands. Data is also obtained from FuelCheck.
The chart shows that average retail prices of seven retailers (Speedway, Metro, Budget, Westside, United, 7-Eleven and Woolworths) and the small independents category were below the average market price in Sydney. The average retail prices of Coles Express, BP COCO, Caltex COCO and Jasbe were above the market average price.
Average retail prices at Speedway retail sites were over 5 cpl lower than the market average price in Sydney, and average retail prices at Coles Express retail sites were over 4 cpl higher than the market average price. Average prices for four retailers (Speedway, Metro, Budget and Westside) were each over 2 cpl lower than the market average price in Sydney.
The total number of retail sites of the seven retailers and the small independents which had prices below the market average price in Sydney accounted for around 65 per cent of the total number of retail sites for which price data was available.
A comparison of the data for Brisbane with that for Sydney reveals that:
• the extent of aggressive pricing by independent chains was significantly greater in Sydney than in Brisbane
• in both markets an independent chain had average prices that were above the market average price. These were: Freedom Fuels in Brisbane and Jasbe in Sydney
• the average price for the small independents category was around the average market price in Brisbane, but below it in Sydney
• the proportion of retail sites below the market average was around 45 per cent in Brisbane compared with around 65 per cent in Sydney.

32 Report on the Brisbane petrol market
Appendix A: Background and process
Background to the ACCC petrol monitoring arrangements
On 9 December 2014 the then Minister for Small Business, the Hon. Bruce Billson MP, gave the ACCC a new direction to monitor the prices, costs and profits of unleaded petroleum products in Australia for a period of three years.24
The new arrangements enable the ACCC to undertake more timely and targeted monitoring and analysis of particular topics and fuel markets that are of concern to consumers.
Under these arrangements the ACCC has published petrol market studies on Darwin, Launceston, Armidale and most recently Cairns (which was released in May 2017).25
These market studies rely on compulsory information gathering powers under s. 95ZK of the Competition and Consumer Act 2010 (Cth).
The ACCC obtained information about the Brisbane petrol market as part of the Cairns market study.
How the study was conducted
Data collection
Financial and operational information about companies that operate in the Brisbane petrol market was collected as part of the Cairns petrol market study. Information was obtained from: BP, Caltex, Centrel (a subsidiary of BP), Coles Express, Freedom Fuels, 1 Riverside Quay (a subsidiary of BP), Puma Energy, 7-Eleven, United and Woolworths.
Financial information about companies that operated in the Sydney petrol market was collected as part of the Armidale petrol market study. Information was obtained from: Caltex, Coles Express and Woolworths.
Additional financial and petrol volume data were obtained from BP, Caltex, Mobil and Viva Energy as part of the annual formal fuel monitoring program.
This was augmented with data provided to the ACCC in the context of the proposed acquisition of Woolworths retail sites by BP.
Confidentiality
The information provided to the ACCC is mostly commercially sensitive and has generally been provided on a confidential basis. To protect confidentiality, this report presents primarily aggregated analysis of the petrol value chains, retail costs and profits.
Methodology
The methodology used in the financial analysis is the same as the methodology used in previous market studies. Please refer to the Cairns petrol market study for a detailed outline of the methodology, and discussion of such issues as coverage, cost allocation and retail business models.26
24 The Minister’s letter and direction are available from the ACCC website at: https://www.accc.gov.au/regulated-infrastructure/fuel/acccs-fuel-monitoring-role#monitoring-australia-s-unleaded-petrol-industry.
25 These are available from the ACCC website at: https://www.accc.gov.au/regulated-infrastructure/fuel/acccs-fuel-monitoring-role.
26 ACCC, Report on the Cairns petrol market, pp. 18, 56–58, at: https://www.accc.gov.au/publications/petrol-market-studies/report-on-the-cairns-petrol-market.

33 Report on the Brisbane petrol market
Key financial indicators for assessing the Brisbane retail market
Net profit per site
Net profit in chapter 3 is as reported in companies’ financial data templates for each site in Brisbane and in aggregate for Sydney and across Australia. While there may be some small differences in how net profit was calculated between companies, in general net profit broadly equates to net earnings before interest and tax.
Net retail margin on petrol
This is the net profit earned by companies from the sales of RULP only, i.e. revenue earned from sales of RULP less purchases of RULP less allocated operating costs. In this report this was calculated as the average retail RULP price less the average TGP, the average operating costs allocated to RULP sales, freight costs and retail GST.
34 Report on the Brisbane petrol market
Appendix B: Petrol retail prices, TGPs and GIRDs in BrisbaneThis appendix provides annual data on petrol retail prices, TGPs and GIRDs in Brisbane and the other four largest cities over the period 2009–10 to 2016–17.27
27 The source of all retail prices in this appendix is ACCC calculations based on data from FUELtrac and Informed Sources. The sources of TGP data are BP, Caltex, Mobil, Viva Energy and WA FuelWatch.

35 Report on the Brisbane petrol market
Tab
le B
1:
Ann
ual a
vera
ge
pet
rol r
etai
l pri
ces
in B
risb
ane
and
the
oth
er fo
ur la
rges
t ci
ties
, and
the
diff
eren
ce: 2
009–
10 t
o 20
16–1
7 (c
pl)
Year
Bris
bane
Oth
er fo
ur
larg
est
citie
s*Sy
dney
*M
elbo
urne
Ade
laid
ePe
rth
Oth
er fo
ur
larg
est
citie
s*Sy
dney
*M
elbo
urne
Ade
laid
ePe
rth
Retail
Retail d
ifferen
tial
2009
–10
126.3
123.7
123.4
125.3
123.6
122.3
2.6
2.9
1.0
2.7
4.0
2010
–11
133.7
131.2
131.7
131.6
130.0
131.5
2.5
2.0
2.1
3.7
2.2
2011
–12
145.4
142.1
141.9
141.1
142.1
143.3
3.3
3.5
4.3
3.3
2.1
2012
–13
144.0
140.6
140.4
140.2
140.1
141.9
3.4
3.6
3.8
3.9
2.1
2013
–14
153.5
149.9
149.8
149.0
149.7
151.3
3.6
3.7
4.5
3.8
2.2
2014
–15
137.6
133.2
132.6
132.4
132.4
135.3
4.4
5.0
5.2
5.2
2.3
2015
–16
124.7
120.9
120.8
120.8
120.3
122.0
3.8
3.9
3.9
4.4
2.7
2016
–17
124.6
122.1
120.2
123.5
120.9
123.6
2.5
4.4
1.1
3.7
1.0
* F
rom
201
4–15
, the
AC
CC
has
use
d E
10 p
rices
inst
ead
of
RU
LP p
rices
for
Syd
ney.
The
se a
re a
lso
use
d in
the
ave
rag
e o
f th
e o
ther
four
larg
est
citie
s.
Tab
le B
2:
Ann
ual a
vera
ge
pet
rol T
GP
s in
Bri
sban
e an
d t
he o
ther
four
larg
est
citi
es, a
nd t
he d
iffer
ence
: 200
9–10
to
2016
–17
(cp
l)*
Year
Bris
bane
Oth
er fo
ur
larg
est
citie
sSy
dney
Mel
bour
neA
dela
ide
Pert
hO
ther
four
la
rges
t ci
ties
Sydn
eyM
elbo
urne
Ade
laid
ePe
rth
TGPs
TGP differen
tial
2009
–10
116.9
117.3
117.0
116.7
117.4
118.2
-0.4
-0.1
0.2
-0.5
-1.3
2010
–11
123.8
124.1
124.1
123.6
124.1
124.8
-0.3
-0.3
0.2
-0.3
-1.0
2011
–12
134.8
135.1
135.2
134.7
135.1
135.4
-0.3
-0.4
0.1
-0.3
-0.6
2012
–13
134.1
134.2
134.6
134.0
134.3
134.0
-0.1
-0.5
0.1
-0.2
0.1
2013
–14
142.4
142.5
143.0
142.4
142.6
142.1
-0.1
-0.6
0.0
-0.2
0.3
2014
–15
125.9
126.0
126.5
125.9
125.7
126.0
-0.1
-0.6
0.0
0.2
-0.1
2015
–16
111.0
110.8
111.0
110.6
110.6
110.7
0.2
0.0
0.4
0.4
0.3
2016
–17
111.6
111.4
111.6
111.2
111.3
111.6
0.2
0.0
0.4
0.3
0.0
* A
ll p
rices
in t
his
tab
le a
re R
ULP
pric
es.
36 Report on the Brisbane petrol market
Tab
le B
3:
Ann
ual a
vera
ge
GIR
Ds
in B
risb
ane
and
the
oth
er fo
ur la
rges
t ci
ties
, and
the
diff
eren
ce: 2
009–
10 t
o 20
16–1
7 (c
pl)
Year
Bris
bane
Oth
er fo
ur
larg
est
citie
s*Sy
dney
*M
elbo
urne
Ade
laid
ePe
rth
Oth
er fo
ur
larg
est
citie
s*Sy
dney
*M
elbo
urne
Ade
laid
ePe
rth
GIRDs
GIRD differen
tial
2009
–10
9.4
6.4
6.4
8.6
6.2
4.1
3.0
3.0
0.8
3.2
5.3
2010
–11
9.9
7.1
7.6
8.0
5.9
6.7
2.8
2.3
1.9
4.0
3.2
2011
–12
10.6
7.0
6.7
6.4
7.0
7.9
3.6
3.9
4.2
3.6
2.7
2012
–13
9.9
6.4
5.8
6.2
5.8
7.9
3.5
4.1
3.7
4.1
2.0
2013
–14
11.1
7.4
6.8
6.6
7.1
9.2
3.7
4.3
4.5
4.0
1.9
2014
–15
11.7
7.8
8.5
6.5
6.7
9.3
3.9
3.2
5.2
5.0
2.4
2015
–16
13.7
10.6
11.5
10.2
9.7
11.3
3.1
2.2
3.5
4.0
2.4
2016
–17
13.0
11.1
10.1
12.3
9.6
12.0
1.9
2.9
0.7
3.4
1.0
* F
rom
201
4–15
, the
AC
CC
has
use
d E
10 G
IRD
s in
stea
d o
f R
ULP
GIR
Ds
for
Syd
ney.
The
se a
re a
lso
use
d in
the
ave
rag
e o
f th
e o
ther
four
larg
est
citie
s.


![Untitled-2 [petrol-is.org.tr]petrol-is.org.tr/sites/default/files/akademi.pdf · PROTOKOL TARAFLAR A-Petrol- i; Sendikasl Türkiye Petrol Kimya Lastik i;çileri Sendikast "PETROL-i$](https://img.pdfslide.us/doc/110x75/5e032b70d9e2ea2f204214f9/untitled-2-petrol-isorgtrpetrol-isorgtrsitesdefaultfiles-protokol-taraflar.jpg)