Embed Size (px)
Citation preview

STATE FINANCES OF KERALA PERFORMANCE, CHALLENGES AND THE WAY AHEAD
Indian Institute of Management Kozhikode
October 4, 2017
PROJECT COORDINATORS DR. STHANU R NAIR AND DR. RUDRA SENSARMA
Disclaimer
The Indian Institute of Management Kozhikode has received the grant
under the Research Scheme of NITI Aayog, 2015 to produce this document.
However, NITI Aayog shall not be held responsible for findings or opinions
expressed in the document prepared. This responsibility rests with the
Indian Institute of Management Kozhikode.
This study was sponsored with financial support of NITI
Aayog, Government of India and conducted by the
Indian Institute of Management Kozhikode

1
Acknowledgments
The work on this project commenced in September 2016 and an interim report was submitted
in November 2016. Comments were received from NITI Aayog and from participants in a
seminar held at IIM Kozhikode. Subsequently we significantly updated and revised the work
and submitted the final report (draft) on March 31, 2017 followed by a presentation at NITI
Aayog on May 15, 2017. Although the volume of work was quite significant we are pleased to
have been able to submit the final project completion report on time thanks to the support of a
number of people. We would like to gratefully acknowledge the excellent research assistance
of Miss Rajalakshmi T. We also appreciate the inputs provided by our students Mr Rakesh and
Mr Divyanshu. We would like to thank the Indian Institute of Management Kozhikode
especially the Research Office team led by Mr Raghupathy Hari for their support. We are
grateful to all the participants of the seminar on Kerala state finances organized at IIM
Kozhikode and during the presentation at NITI Aayog for their helpful comments. Finally we
thank the NITI Aayog for the opportunity to carry out this study and their continuous support,
feedback and cooperation. We hope that this report will be useful for taking informed policy
decisions on the subject.

2
Table of Contents
Acknowledgments 1
Executive summary 3
1 Introduction 10
2 Kerala Economy 14
3 Methodology 18
4 Analysis of Fiscal Imbalances 21
5 Expenditure Management 38
6 Analysis of Revenues 59
7 Summary and Recommendations 75
References 100
Appendix 103

3
Executive Summary
Background
Maintenance of fiscal discipline by state government is of paramount importance not only
from the point of view of macroeconomic stability but also to ensure adequate funding of
essential social and economic services as well as building the foundations for long term
economic growth. However the fiscal anatomy of the states in India are plagued by numerous
structural deficiencies such as high budgetary deficits and debt, unhealthy expenditure
pattern, limited resource base and adoption of populist fiscal measures.
Kerala is no exception to this trend and its public finances suffers from continued high
levels of fiscal and revenue deficits, low levels of public spending on capital works,
utilisation of borrowed funds more to fund revenue expenditure, mounting debt liabilities,
higher interest payment burden and falling own revenue mobilisation efforts. In this context,
the objectives of the present study are three-fold: (a) to examine the extent and causes of
fiscal stress of Kerala, (b) to identify the necessary policy initiatives to overcome the fiscal
stress of Kerala, in particular, the mounting revenue and fiscal deficits, (c) to identify the best
fiscal management practices and policies of selected other states and draw lessons for Kerala
wherever applicable. Kerala is widely known for its high human development indicators but
has also shown remarkable economic growth in the period since 2002-03. Our analysis shows
that this economic progress has not been associated with improvement in the public finances
of the state.
Results of analysis
We find that Kerala’s Debt-GDP ratio is the third highest among the comparable
states (after Andhra Pradesh and Rajasthan) in the third phase of accelerated growth (2002-03
to 2016-17). Although the debt ratio has been coming down over the years, it is currently at

4
27.36 per cent that is considerably higher than the 13 other major states of India for whom the
average figure stands at 23 per cent.
One of the major consequences of having a high debt ratio is the outflow in terms of
interest payments. Kerala’s Interest payments to Revenue receipts ratio in the recent period is
the next highest only to Gujarat. Although Kerala’s IP/RR has been coming down but is still
considerably higher than the average figure for 13 major states of India.
Kerala’s gross fiscal deficit is not too high compared with other states but what is of
more serious concern is the quality of the deficit. In fact the major states on an average show a
revenue balance in 2016-17 while Kerala’s revenue deficit remains rather high at 1.50 per cent.
The share of provident funds in Kerala’s outstanding liabilities is more than twice that of the
average for 13 major states.
A lion’s share of public expenditure in Kerala consists of current expenditure. However,
starting from the second half of the last decade, the share of public expenditure on capital asset
creation has increased notably. The key reason for the higher share of revenue expenditure in
Kerala has been the larger expenditure commitment on salaries and pensions and interest
payments. Significantly, as percentage of revenue expenditure, at present Kerala has highest
salary and pension burden among the comparable states.
As percentage of state GDP, the total expenditure on social and economic services has
declined significantly in Kerala over time, including during the phase of high economic growth
from 2002-03. However in Kerala, contrary to the trends in the comparable states, the
expenditure on capital formation in the crucial social services has declined both during
moderate and accelerated economic growth phases.
As percentage of GSDP the total expenditure incurred by Kerala on several social and
economic services namely education, public health, housing, agriculture and allied activities,

5
irrigation, and industry and minerals has declined during the phase of accelerated economic
growth. As regards the expenditure on capital formation in these individual heads, it has
declined during the phase of accelerated economic growth in Kerala.
Coming to revenue performance, the total revenue receipts of Kerala experienced a
declining trend as percentage of state GSDP since 1985-85. However, from mid-2000s the
revenue mobilisation improved owing to better utilisation of own non-tax revenue sources. All
the components of revenue receipts namely own tax revenues, own non-tax revenues and
central transfers have declined significantly as percentage of GSDP during the accelerated
economic growth phase since 2002-03.
An analysis of composition of Kerala’s own tax revenue reveals that only a handful
number of tax handles contribute to public revenue mobilisation in the state meaningfully. They
include sales tax/value added tax, state excise duties, motor vehicle tax, and stamps and
registration fees. However, the huge drop in the share of state excise duties and stamps and
registration fees in the own tax revenues over the years and in the recent past respectively is a
serious cause for concern.
All major own tax revenue sources namely sales tax/VAT, state excise duties and motor
vehicle tax grew at a lower rate in Kerala during the phase of accelerated economic growth
compared with the phase of economic stagnation. Moreover, the buoyancy of own tax revenue
was lower than the desired level in Kerala during the phase of economic stagnation as well as
the phase of accelerated economic growth.
Regarding non-tax revenue mobilization, the major concerns facing Kerala are
negligible contribution by way of dividends and profits from state public sector enterprises and
consistently falling contribution from economic and social services.

6
Policy recommendations
1) There is an urgent need for increasing the share of capital expenditure and outlay in the
total expenditure, including in the social sector.
2) To finance meaningful programmes which contribute to capital formation in the state,
the government needs to identify “fiscal space” through a combination of cut in
expenditure on ongoing or low-priority programmes, revenue increases and debt funds.
3) Within capital expenditure, focus must be on projects whose social benefits exceed their
economic costs.
4) In order to reduce its salaries and pension burden, the government has to generate more
jobs in the private sector by way of creating an appropriate environment. Also, the
practice of appointing large number of temporary staff (also called contract employees)
have to be discontinued. The government may put a freeze on recruitment except for
essential services and explore outsourcing or contracting or public private partnership
modes of functioning wherever possible. It may be prudent to raise the retirement age
in the state.
5) Adopt performance budgeting, which involves setting goals for each government
scheme, assessing how well particular schemes achieve them and terminating
ineffective and low priority schemes in favour of better ones.
6) Adopt zero-based budgeting in which at the time of preparing annual budget each
government programme would be viewed as new and therefore has to be justified by
the concerned department for their continuity. Outcome budgets can be included in the
annual budgetary exercise to link outlays with quantifiable deliverables or outcomes.
7) Programmes, say multiple social welfare programs, with similar nature could be
identified and merged to curb outlays. This would also help in achieving economies of
scale in expenditure.

7
8) The government can improve the control over expenditure through appropriate
targeting of beneficiaries of various government social welfare programmes.
9) To avoid expenditure overruns, off-budget expenditures have to be controlled or
minimized.
10) While designing or reviewing expenditure policy adequate emphasis must be given on
operation and maintenance of government facilities created in the past.
11) Loan/credit guarantees extended by the government has to be based on proper
assessment of cost-benefits associated with the projects and ranking of net present value
of the projects. Also, it is desirable to limit loan guarantees only to creditworthy PSEs.
12) Privatization of public sector enterprises which are loss making and are operating in
areas in which government has no comparative advantage can save substantial amount
of public money that could be spend on other productive purposes.
13) A comprehensive review of pay and employment policy with respect to government
employees has to be undertaken.
14) Subsidy programs have to be rationalised.
15) There is a serious need to strengthen own tax revenue mobilization in Kerala. In a state
which has been witnessing faster economic growth and retains top position in per capita
consumer expenditure, the decline in the growth of major own tax revenue sources
namely sales tax/VAT, state excise duties and motor vehicle tax, stamps and
registration fees and motor vehicle tax over the years has to be examined thoroughly
and corrective actions have to be taken accordingly. For instance, revenue can be
enhanced by way of rationalisation of tax/duty structure, use of technology, keeping
accurate and updated registries of property values and improving property records by
way of proper monitoring of property sales. The e-stamping facility followed in many

8
states such as Uttarakhand, Tamil Nadu and Karnataka can be introduced to prevent
malpractices in land registrations.
16) Tax sources namely land revenue, urban immovable property tax, entertainment tax
and taxes and duties on electricity have to be adequately tapped. Also new tax and non-
tax sources with good revenue potential can be identified and taxed. The state must
introduce a more prudent liquor policy which taxes premium brands at higher rates that
will generate revenues not only from domestic high income consumers but also from
tourists and business visitors. Mega sporting events can be organised in different parts
of the state (e.g. football or volleyball which are popular sports among locals) leading
to generation of economic activity and tourist inflow which in turn will generate tax
and non-tax revenues (including collection of license fees from the organisers).
17) The secular decline in the contribution of excise duties in Kerala’s own tax revenues
demands a detailed analysis of excise revenue system of Kerala.
18) Serious efforts have to be taken to avoid/reduce tax evasion. This may be achieved
with a tax system characterised by a broad base, low rates, limited exemptions, easy
compliance and effective use of big data and technology. More use of technology is
needed to check tax evasion. For instance, smart surveillance cameras at the state border
roads and bye-routes to capture the goods vehicles which have not uploaded their
invoices showing payment of integrated GST (IGST) to the GSTN portal. Big data on
commercial (including property) transactions can be analysed to identify potential tax
evasion and take necessary policy action.
19) Avoid granting tax amnesty to the tax payers.
20) Incentivising advance payments of VAT on the basis of annual turnover of the dealers
can increase tax collection and compliance.

9
21) Engage the tax administrators to mobilise revenue from sources or lucrative tax payers
that provide substantial revenue.
22) One useful way to prevent and reduce tax evasion would be to offer cash rewards to
citizens for sharing information on tax evaders with the tax department.
23) Ensure that the government collects a fair share of the income or profits generated in
the natural resource based industries such as granite mining operations.
24) Review, strengthen and update current tax administration with the goal of increasing
efficiency, simplifying and improving compliance, thereby raising the additional
revenues.
25) There is a serious need to enhance own non-tax revenues in Kerala particularly the
dividends and profits from state PSEs and user charges from economic and social
services. Potential sources of revenue in this sphere are raising tuition fees for public
universities, penalties for violation of traffic rules, and admission fees for museums and
public recreation facilities. There is considerable potential of collecting higher user fees
(with premium pricing for foreign tourists) at several tourist destinations across the state
(e.g. beaches, wildlife parks, heritage buildings, museums). Introducing online booking
and digital payments for collecting user fees can reduce leakages and increase revenues.
26) Considering that revenue from the sale of state lotteries (general services) constitute a
significant portion of Kerala’s own non-tax revenue, efforts have to be made to
consolidate and expand the gains from this revenue source e.g. e-lottery system (as in
Arunachal Pradesh) or offshore casinos (as in Goa).

10
1 Introduction
Government finances influence economic development in several ways (World Bank,
1988). Firstly, government revenue, expenditures and budget deficit affect consumption,
savings and investment and distribution of wealth and income in an economy. Secondly, fiscal
policy has to be prudent to avoid balance of payments crises, external debt crisis and prolonged
recession. Thirdly, size of fiscal deficits determines both the external (current account deficits,
capital flight, and external debts) and internal (real interest rates, private investment, and
inflation) macroeconomic imbalances. Fourthly, fiscal implications are important determinants
of the success of measures such as financial liberalization, currency devaluation, price
deregulation, and trade reform. Fifthly, the method of revenue mobilisation adopted by the
government can substantially affect economic efficiency. For instance, reliance on ad hoc
revenue mobilisation measures makes revenue systems complex and distortionary, thereby
affecting economic progress. Finally, the quality of government expenditure represented by
higher budgetary spending on productive capital investments can positively influence
economic development of a country.
India has a federal form of government comprising central/national, state and local
governments. Both central and state governments have expenditure responsibilities and
revenue sources. Considering macroeconomic stability, scale economies and national
importance, the following major functions are assigned to the centre: Currency, foreign
exchange, insurance, stock exchanges, defence, external affairs, railways, posts and
telecommunication, national highways, shipping and air transport, and atomic energy. The
major functions assigned to the states are: public order, police, health, relief of the disabled and
unemployed, agriculture, irrigation, land rights, fisheries, water supply/storage, trade and
commerce within the state and cooperative societies. All other services that are not included
11
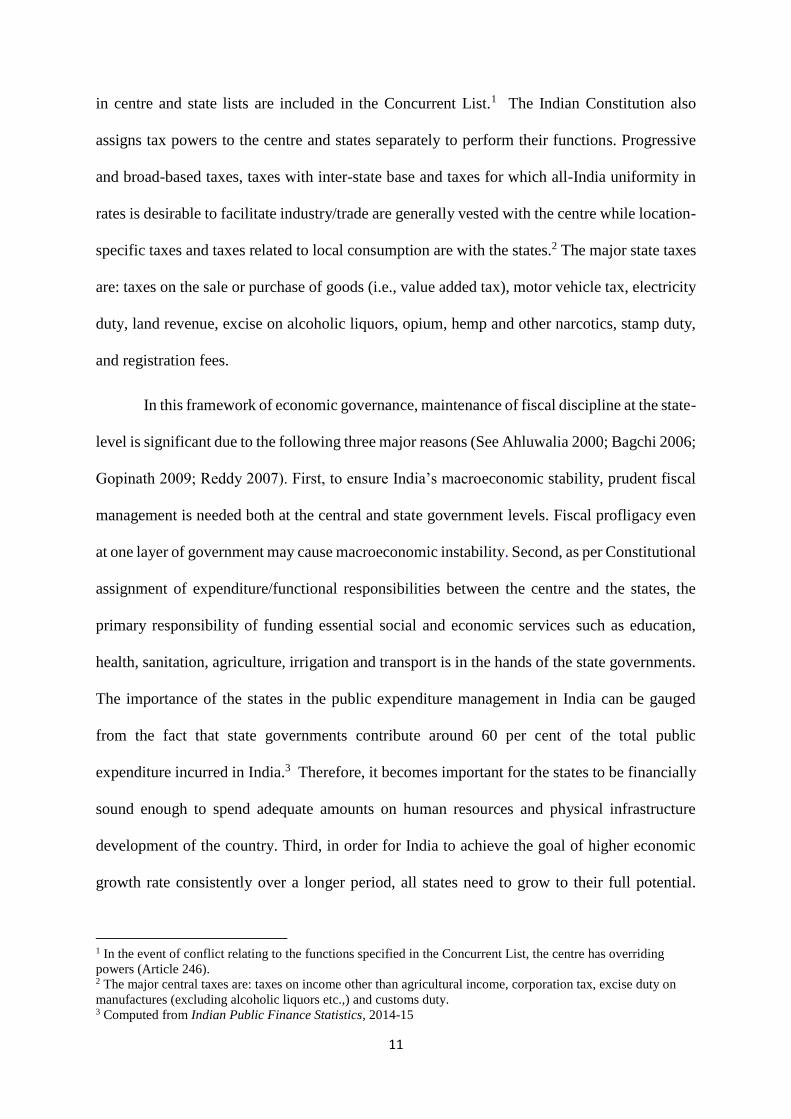
in centre and state lists are included in the Concurrent List.1 The Indian Constitution also
assigns tax powers to the centre and states separately to perform their functions. Progressive
and broad-based taxes, taxes with inter-state base and taxes for which all-India uniformity in
rates is desirable to facilitate industry/trade are generally vested with the centre while location-
specific taxes and taxes related to local consumption are with the states.2 The major state taxes
are: taxes on the sale or purchase of goods (i.e., value added tax), motor vehicle tax, electricity
duty, land revenue, excise on alcoholic liquors, opium, hemp and other narcotics, stamp duty,
and registration fees.
In this framework of economic governance, maintenance of fiscal discipline at the state-
level is significant due to the following three major reasons (See Ahluwalia 2000; Bagchi 2006;
Gopinath 2009; Reddy 2007). First, to ensure India’s macroeconomic stability, prudent fiscal
management is needed both at the central and state government levels. Fiscal profligacy even
at one layer of government may cause macroeconomic instability. Second, as per Constitutional
assignment of expenditure/functional responsibilities between the centre and the states, the
primary responsibility of funding essential social and economic services such as education,
health, sanitation, agriculture, irrigation and transport is in the hands of the state governments.
The importance of the states in the public expenditure management in India can be gauged
from the fact that state governments contribute around 60 per cent of the total public
expenditure incurred in India.3 Therefore, it becomes important for the states to be financially
sound enough to spend adequate amounts on human resources and physical infrastructure
development of the country. Third, in order for India to achieve the goal of higher economic
growth rate consistently over a longer period, all states need to grow to their full potential.
1 In the event of conflict relating to the functions specified in the Concurrent List, the centre has overriding
powers (Article 246). 2 The major central taxes are: taxes on income other than agricultural income, corporation tax, excise duty on
manufactures (excluding alcoholic liquors etc.,) and customs duty. 3 Computed from Indian Public Finance Statistics, 2014-15

12
Since private sector investment, which is essential for economic growth, exhibit the tendency
to flow to those states that manage to create an enabling business environment such as better
law and order situation and the provision for adequate and quality physical and social
infrastructure, it is imperative for the states to enhance public investment in such fields. Hence,
it becomes essential for the states to keep their fiscal house in order.
However, state finances are one of the major ‘unreformed parts’ of the Indian economy
even after two decades of economic liberalisation experience. The fiscal anatomy of the states
continues to be plagued by numerous structural deficiencies. They include high budgetary
deficits and debt, unhealthy expenditure pattern, limited resource base and adoption of populist
fiscal measures. This is despite the initiation of a series of fiscal reform measures at the state-
level aimed at achieving fiscal sustainability through restructuring of expenditure and tax
policies (see Bagchi 2006; Gopinath 2009; World Bank 2005 and several other studies whose
findings are summarised in Appendix 1).
The state of Kerala is no exception to this general trend. The fiscal edifice of Kerala
has been diagnosed with several cracks (George and Krishnakumar 2012). They mainly include
continued high levels of fiscal and revenue deficits, low levels of public spending on capital
works, utilisation of borrowed funds more to fund revenue expenditure, mounting debt
liabilities, higher interest payment burden and falling own revenue mobilisation efforts. To
highlight the state's precarious financial situation, the state government has recently brought
out a White Paper on State Finance, which warned that Kerala is heading for a financial crisis
owing to a failure both on expenditure control and resource mobilisation. Such a situation calls
for a detailed study on the fiscal management of Kerala and identification of corrective
measures to keep the fiscal house in order.

13
In this context, the objectives of the present study are three-fold: (a) to examine the
extent and causes of fiscal stress of Kerala, (b) to identify the necessary policy initiatives to
overcome the fiscal stress of Kerala, in particular, the mounting revenue and fiscal deficits, (c)
to identify the best fiscal management practices and policies of selected other states and draw
lessons for Kerala wherever applicable. The rest of the report is organized as follows. Chapter
2 provides an overview of Kerala economy with emphasis on its growth and fiscal challenges.
Chapter 3 presents the methodology, period of study, variables and data sources. Chapter 4
contains the analysis of fiscal imbalances based on a study of trends, sustainability indicators
and estimation of a fiscal reaction function for Kerala. Chapter 5 discusses the composition,
trends and quality of expenditure of Kerala government. Chapter 6 analyses revenue
performance of Kerala. Chapter 7 summarises the findings, generates some future scenarios
and provides recommendations to improve fiscal performance of Kerala.

14
2 Kerala Economy
Kerala’s economic status today is characterised by co-existence of high economic
performance and high human development indicators. On the human development front,
compared to all-India levels, Kerala has been characterised by low population growth,
favourable sex ratio, high literacy levels (particularly female literacy), high life expectancy,
high quality of health care, low infant mortality rate, low death rate, low fertility rate and low
level of poverty (see Table 2.1). All these achievements were made possible due to the social
welfare policies followed in the state, high level of public sector spending for social sector and
large amounts of remittances received from Keralites working outside Kerala, particularly in
the Middle Eastern countries.
On the economic front, even though Kerala economy was going through a phase of
prolonged stagnation until the mid-1980s, but starting from 1987-88 to 2001-02 the state
economy grew at a moderate growth. This was followed by a phase of accelerated economic
growth from 2002-03 (GoK 2015). The gross state domestic product (GSDP) of Kerala grew
at the average annual rate of 1.12 per cent between 1970-71 and 1986-87. On the other hand,
during the period 1987-88 to 2001-02 and 2002-03 to 2014-15 the figures for the same were
5.84 per cent and 7.83 per cent respectively. Moreover, during the post-economic reforms
period (1993-94 to 2013-14) as a whole, GSDP and per capita GSDP of Kerala grew at a higher
rate of 6.62 per cent and 5.97 per cent respectively compared with the figures of 6.56 per cent
and 5.08 per cent recorded for 21 major states of India. Kerala’s economic growth is driven
primarily by the following sectors: construction; transport, storage and communication; trade,
hotel and restaurants; real estate; and business, legal and other communication services.
As regards the structure of the Kerala economy, the share of agriculture and allied
services in state GSDP has declined from 30 per cent in 1990−91 to 10.6 per cent in 2010−11.

15
The growth rate of agriculture and allied sectors declined from 2.34 per cent in the 1990s to
0.46 per cent in the succeeding decade. Industrial sector accounts for 21 per cent of Kerala’s
GSDP, which is significantly lower than the national average of more than 28 per cent (GoK
2015). More disappointing is the lower share of manufacturing (10 per cent) in GSDP
compared to the national average (16 per cent). A comparative analysis of Kerala with the top
nine states of India reveals that Kerala lagged behind all of them in terms of the average share
of industry during 2004–05 to 2009–10 (GoK, 2015). Another notable feature of the structure
of industrial sector in Kerala is the disproportionately larger share of unregistered
manufacturing in total manufacturing. Today, the services sector is the backbone of Kerala
economy. The key segments within services sector contributing to the growth of the Kerala
economy are transport, storage and communication; trade, hotels and restaurants; banking and
insurance; real estate and legal services. ‘Travel and tourism’ has great economic significance
for Kerala due to the state’s clear comparative advantage in this sector and its capacity for
income generation and job creation.
Over the years, Kerala economy has gradually emerged out of the situation of high
social sector development with low economic growth though the higher economic growth was
contributed predominantly by the services sector. Few other factors have contributed to this
remarkable turnaround in Kerala’s economic growth from 1987 onwards. They are high level
of public spending on the social sectors; large flow of remittances, in particular after 1991, and
the resulting consumption boom, and welfare role of social organisations. It is also important
to note that during the accelerated economic growth phase, 77 per cent of growth was generated
through services sectors.
Despite the rapid economic growth achieved since the beginning of the last decade,
Kerala economy today faces several challenges (George 2011, GoK 2015). They include poor
industrial development, lack of adequate private investment and physical infrastructure, high

16
unemployment rate among the educated4; high dependence on external economy (other states
and countries); deteriorating public finances; growing number of elderly population;
environmental degradation; falling productive capacity of economy; rising economic
inequality; and challenges posed by rapid urbanization.5
It has been argued that the capacity of Kerala to address the above development
challenges effectively and to sustain high economic growth performance depends crucially on
the health of the public finances of the state (GoK 2006; 2015). First, in order for Kerala to
sustain its high growth performance, it is imperative to maintain high levels of public
expenditure on social sectors, public administration and welfare programme. However, this is
possible only if the state’s fiscal house is in order. Second, as noted above, Kerala has been
facing several problems associated with the developed countries such as large and growing
share of elderly population, higher level of educated unemployment, municipal waste
management, and rapid environmental degradation. To tackle such problems the state needs to
mobilise adequate public revenues and spend them efficiently. Third, due to mobility of private
investments between the states in pursuit of better business environment, today business
environment at the state level plays a very important role in attracting private investment
(Ahluwalia 2000). Hence it is imperative that states mobilise adequate financial resources to
shore up public investment in critical areas of socio and economic infrastructure. This is very
important for Kerala because due to increased inter-state competition for private investment
and weak physical infrastructure the inflow of private investment remains too small in the state.
Fourth, in the light of the rapid economic growth experienced during the last decade and having
attained the top position among states in terms of monthly per capita consumer expenditure
4In 2011-12 (regular) unemployment rate in Kerala was 9.8 per cent of labour force against 3.8 per cent for all
India. 5As per 2011 census, the percentage of urban population in Kerala was 47.72 per cent compared to 31.15 per
cent for all India.

17
(MPCE)6, it may be argued that Kerala today has greater capacity to mobilise more public
revenues than before and utilise the same for funding programmes aimed at addressing the
state’s development challenges.
Table 2.1: Basic Social Indicators: Kerala Vs India Unit Period Kerala India
Population Growth % 2001 to 2011 4.91 17.69
Population Density Per sq. km. 2011 860 382
Sex Ratio Females per 1000
of males
2011 1084 940
Literacy Rate % 2011 94 74.04
Female Literacy Rate % 2011 92.1 65.46
Average population served
per Government Hospital
bed
Nos As on
January 1,
2013
910 879
Total Fertility Rate Children
born/woman
2012 1.8 2.4
Infant Mortality Rate Per 1000 live
births
2010 13 47
Death Rate For 1000 persons 2013 6.9 7
Poverty ratio* % of persons 2011-12 7.1 21.9
* - Based on Tendulkar's methodology
Sources:
(i) India 2016 A Reference Annual, Publications Division, Ministry of Information
and Broadcasting, GoI
(ii) Selected Socio-Economic Statistics India, 2011
(iii) National Rural Health Mission, Ministry of Health and Family Welfare, GoI
(http://nrhm.gov.in/nrhm-in-state/state-wise-information/kerala.html#health_profile)
6Since the early 1980s Kerala has been among the top three Indian states in terms of MPCE (GoK 2015) and
currently, as per National Sample Survey 68th round (2011-12), the state is ranked first in MPCE in the rural areas
and second in the urban areas.
18
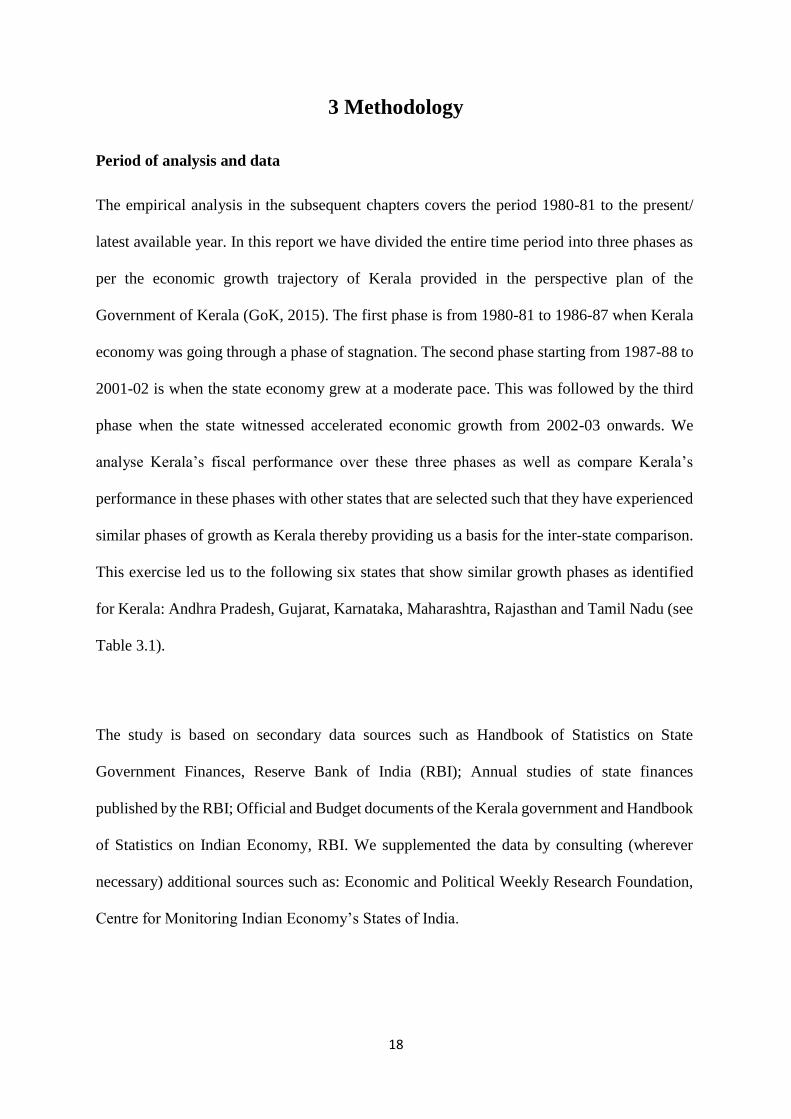
3 Methodology
Period of analysis and data
The empirical analysis in the subsequent chapters covers the period 1980-81 to the present/
latest available year. In this report we have divided the entire time period into three phases as
per the economic growth trajectory of Kerala provided in the perspective plan of the
Government of Kerala (GoK, 2015). The first phase is from 1980-81 to 1986-87 when Kerala
economy was going through a phase of stagnation. The second phase starting from 1987-88 to
2001-02 is when the state economy grew at a moderate pace. This was followed by the third
phase when the state witnessed accelerated economic growth from 2002-03 onwards. We
analyse Kerala’s fiscal performance over these three phases as well as compare Kerala’s
performance in these phases with other states that are selected such that they have experienced
similar phases of growth as Kerala thereby providing us a basis for the inter-state comparison.
This exercise led us to the following six states that show similar growth phases as identified
for Kerala: Andhra Pradesh, Gujarat, Karnataka, Maharashtra, Rajasthan and Tamil Nadu (see
Table 3.1).
The study is based on secondary data sources such as Handbook of Statistics on State
Government Finances, Reserve Bank of India (RBI); Annual studies of state finances
published by the RBI; Official and Budget documents of the Kerala government and Handbook
of Statistics on Indian Economy, RBI. We supplemented the data by consulting (wherever
necessary) additional sources such as: Economic and Political Weekly Research Foundation,
Centre for Monitoring Indian Economy’s States of India.

19
Hypothesis
We study whether Kerala’s fiscal situation has deteriorated over the years compared to the
average performance of the above named six comparison states as well as with respect to the
average figures for thirteen other major states of India. We further investigate the causes of
Kerala state’s fiscal stress by separately analysing fiscal imbalances, expenditure and revenue
performance. The thirteen other major states whose average figures we compare Kerala with
are: Andhra Pradesh, Bihar (including Jharkhand), Gujarat, Haryana, Karnataka, Madhya
Pradesh (including Chattisgarh), Maharashtra, Orissa, Punjab, Rajasthan, Tamil Nadu, Uttar
Pradesh (including Uttarakhand) and West Bengal.
Case studies
We have compiled a list of fiscal reforms carried out by various states (including Kerala) over
the past 5 years (see Appendix 2). We have conducted brief case studies of some of the relevant
fiscal reforms and drawn lessons from them as part of the recommendations presented in
Chapter 7.
Selection of study area
The study focuses on Kerala state but also compares the state’s performance with six other
comparable states as well as with the average figures for thirteen major states of India.
Statistical tools and software
In this report we have used trend analysis, ratio analysis, growth rates7 and period averages to
examine the trends in fiscal performance. We have also used advanced tests of debt
sustainability (e.g. indicator analysis, Bohn’s test) and revenue performance analysis (e.g.
buoyancy estimates) including multi-variate time series analysis wherever applicable using
7 Growth rates are calculated using Compound Annual Growth Rate (CAGR) method i.e. based on a semi-log
regression of the relevant variable on trend.
20
appropriate econometric software such as EViews and Stata. The empirical procedures are
described in the relevant chapters that present the analysis.
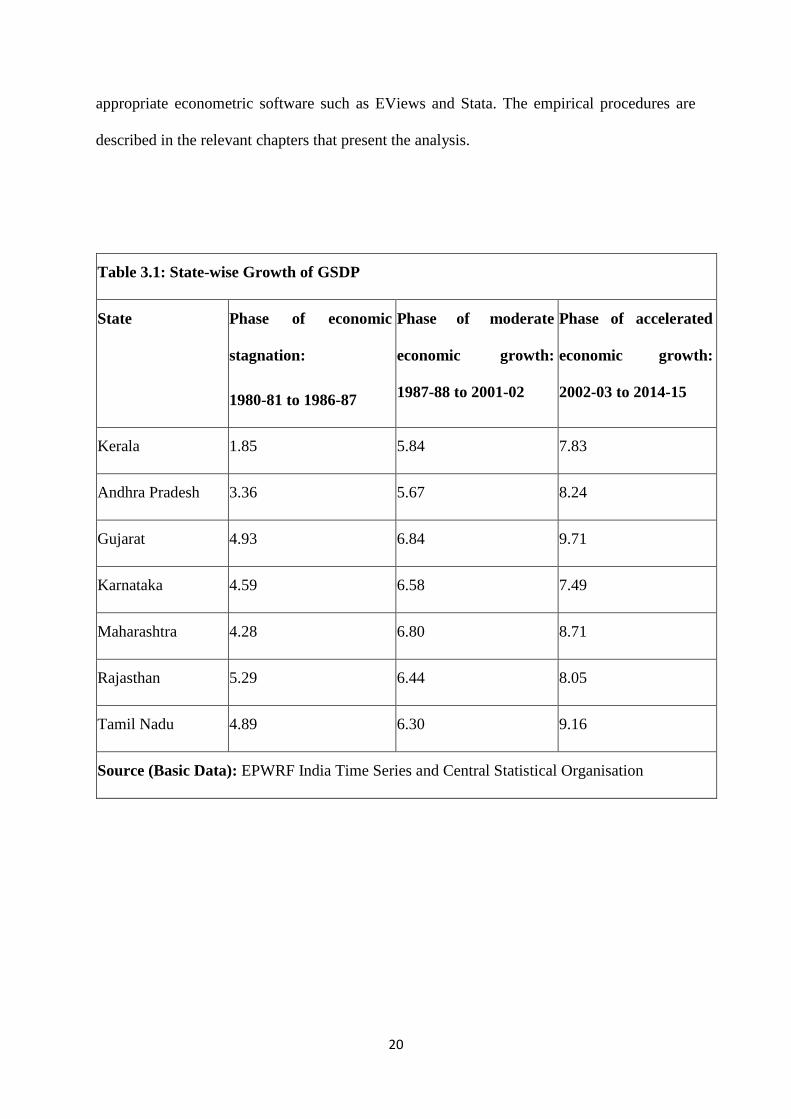
Table 3.1: State-wise Growth of GSDP
State Phase of economic
stagnation:
1980-81 to 1986-87
Phase of moderate
economic growth:
1987-88 to 2001-02
Phase of accelerated
economic growth:
2002-03 to 2014-15
Kerala 1.85 5.84 7.83
Andhra Pradesh 3.36 5.67 8.24
Gujarat 4.93 6.84 9.71
Karnataka 4.59 6.58 7.49
Maharashtra 4.28 6.80 8.71
Rajasthan 5.29 6.44 8.05
Tamil Nadu 4.89 6.30 9.16
Source (Basic Data): EPWRF India Time Series and Central Statistical Organisation
21
4 Analysis of Fiscal Imbalances
The key measure of fiscal imbalance in the case of India, including for the states, is the
fiscal deficit. It is defined as the total expenditure of the government minus all non-borrowed
receipts. It indicates the dependence of the government on borrowings and therefore the
vulnerability of government finances. It is sometimes referred to as the public sector borrowing
requirement (in national accounts). The fiscal deficit of states is financed through market
borrowings, loans from the Centre, special securities issued to NSSF, small savings, loans from
financial institutions, reserve funds, loans from RBI (ways & means advances, overdrafts) and
other deposits and advances.
However it includes interest payments and hence does not truly reflect the current state
of fiscal management. In order to assess the fiscal practices of the current period, it is important
to study the primary deficit which is defined as the fiscal deficit excluding interest payments.
The third key deficit indicator is the revenue deficit that indicates the deficit created by the
government from its current activities. This is akin to government savings. Prudent fiscal
management requires revenue deficit to be zero as the government should not be borrowing
funds to finances its current or revenue expenditure. However a small amount of revenue or
fiscal deficit may be tolerable under the argument that the government is borrowing to finance
asset creation. But in the case of a worrisome debt situation, even the primary or fiscal balance
may be required to show up as surplus. Therefore it becomes pertinent to examine whether the
level of debt is sustainable or not.
We begin our analysis by reviewing the trends in debt and deficits of Kerala state and
do a comparison with the 6 comparable states that experienced a similar growth trajectory as
Kerala. We also compare Kerala’s fiscal imbalances with the average figures for 13 major

22
states of India. Our analysis covers the period from 1980-81 till the latest period for which data
was available.
Debt
Figure 4.1 shows the debt-GDP ratio of Kerala alongside that of the comparison states
for the three phases identified for temporal analysis. While the debt situation has been
worsening for all the comparison states, Kerala’s debt-GDP ratio is the third highest after
Andhra Pradesh and Rajasthan. It is noteworthy that Kerala’s neighbouring states of Tamil
Nadu and Karnataka have been able to control their debt at around 20 per cent of GDP while
Kerala’s debt level at over 32 per cent of GDP is far above the 14th Finance Commission’s
recommended level of 25 per cent.
Figure 4.2 shows the debt-GDP ratio of Kerala in comparison with the average for 13
major states of India (other than Kerala). After peaking at 36.14 per cent at the turn of the
millennium, the debt ratio has been coming down over the years even though it remains high
at 27.36 per cent in the latest year of analysis. This remains above the 14th Finance
Commission’s recommended limit. Indeed the debt ratio was either lower or at par with the 13
major states in the previous decades but is currently (at 27.36 per cent) considerably higher
than that of the other major states (at 23 per cent).
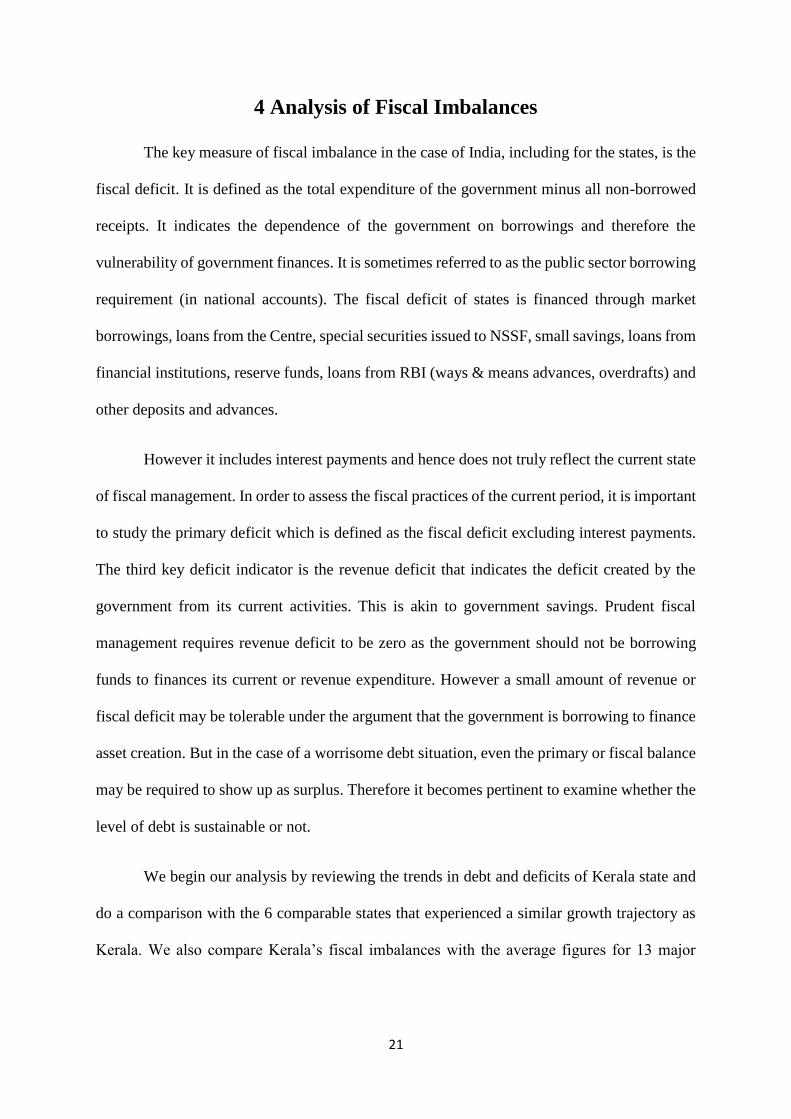
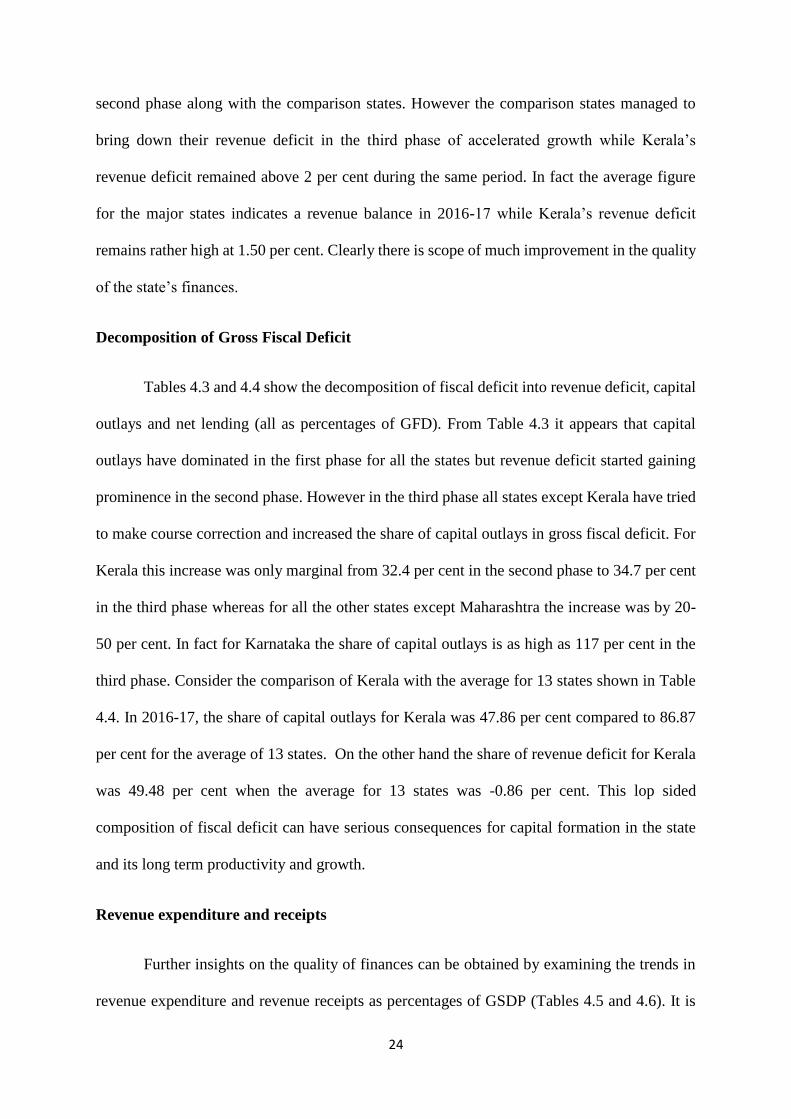
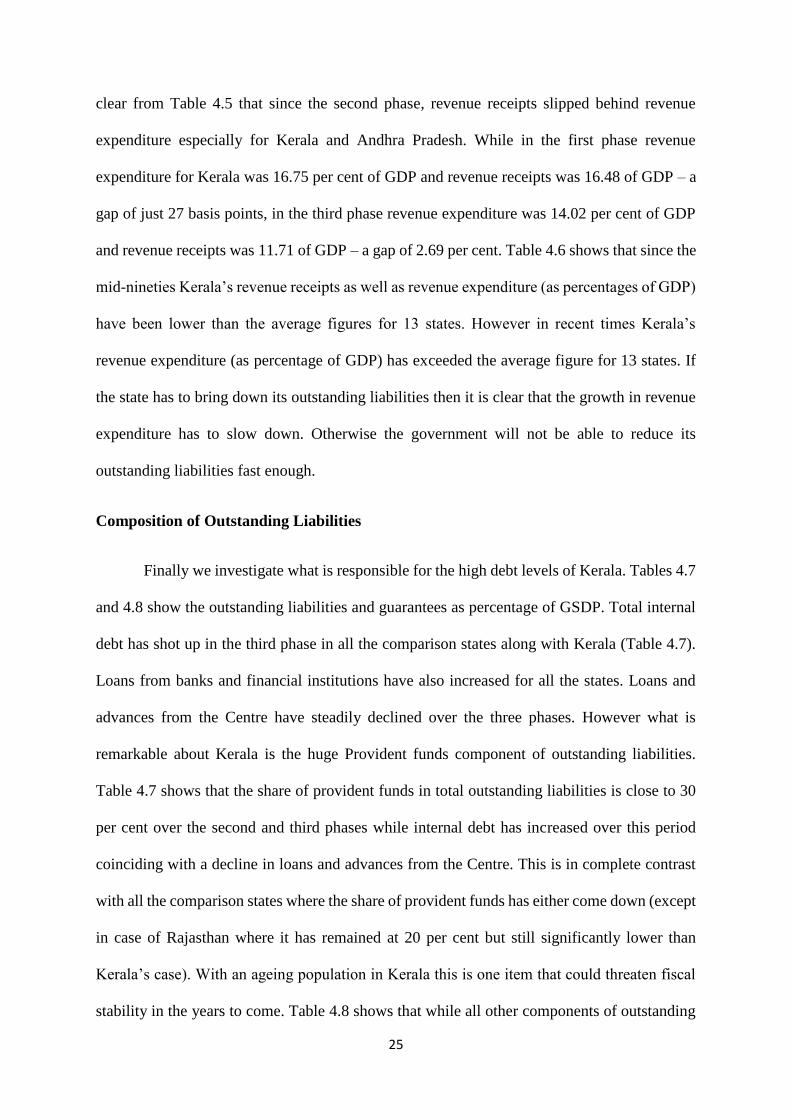
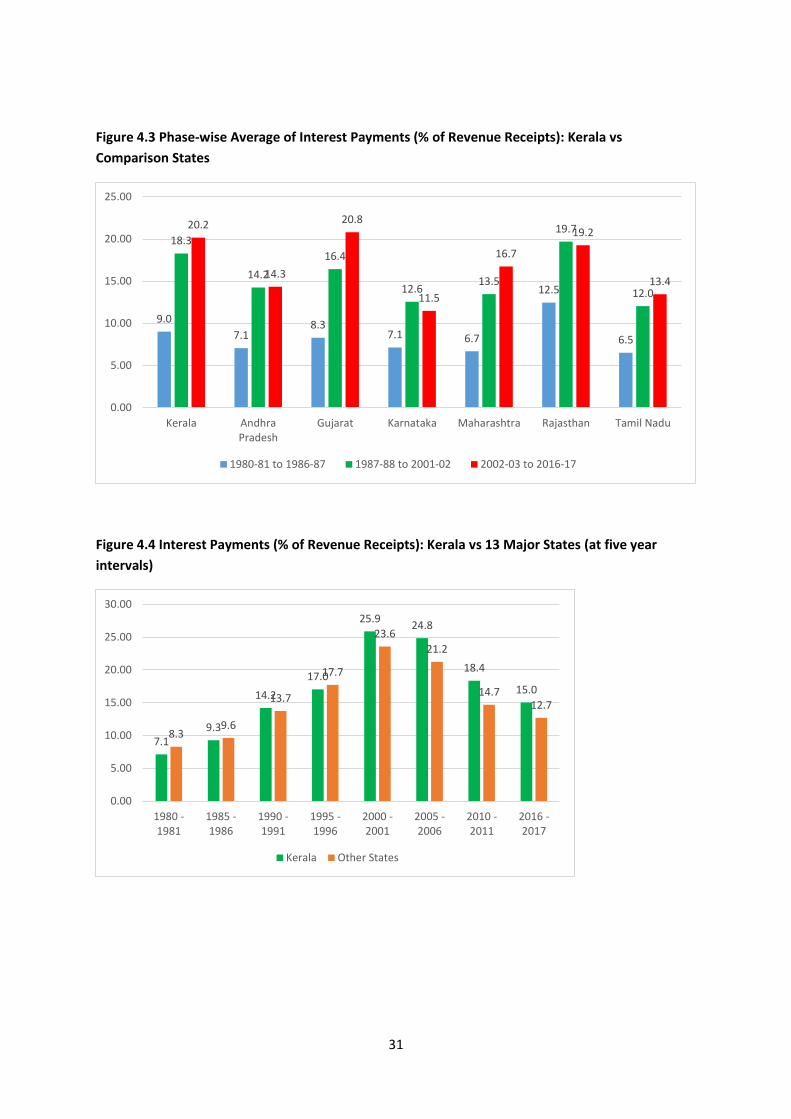
Interest payments
One of the major consequences of having a high debt ratio is the outflow in terms of
interest payments. The 14th Finance Commission recommended that interest payments should
be less than or equal to 10 per cent of the revenue receipts in order to qualify for enhanced
borrowing limit. Figures 4.3 and 4.4 show the interest payments as percentage of revenue
receipts (IP/RR) for Kerala alongside that of the 6 comparison states and the average for 13

23
major states respectively. It is clear that Kerala’s interest payments out of its current income
has been rising across the three phases but so has been the case for most of the comparison
states except for Karnataka. However Kerala’s IP/RR in the third phase of growth (at 20.2 per
cent) is the next highest only to Gujarat (20.8 per cent). Within the third phase, Kerala’s IP/RR
has been coming down (see Figure 4.4) but stands at 15 per cent in 2016-17 which is
considerably higher than the average figure for 13 major states (12.7 per cent).
This phenomenon is of serious concern since Kerala, unlike some other states with high
IP/RR such as Gujarat does not provide enough for capital expenditure to sustain this high level
of interest payments. For instance, Gujarat’s capital outlay as percentage of total expenditure
is over 20 per cent for the last 5 years whereas it is only 7 per cent for Kerala. Therefore while
Gujarat can look forward to generating higher growth and engendering greater revenues, Kerala
may not be able to afford the rising interest burden. Finally, such high outflows on account of
interest payments is bound to squeeze out the space for productive government spending over
the next few years.
Key deficit indicators
Table 4.1 shows the behaviour of gross fiscal deficit and revenue deficit (both expressed
as percentages of GSDP) over the three phases alongside the figures for the comparisons states.
Gross fiscal deficit has been the second highest next only to Rajasthan in the second and third
phases. However, as Table 4.2 shows Kerala’s gross fiscal deficit is not higher than that of 13
major states by a considerable margin. In 2016-17 the figure stands at 3.03 per cent which is
slightly higher than the 3 per cent mandated by the 14th Finance Commission while 2.99 per
cent is the average for the other states. But what is of more serious concern is the quality of the
deficit that can be assessed by the revenue deficit. The revenue deficit for Kerala shot up in the
24
second phase along with the comparison states. However the comparison states managed to
bring down their revenue deficit in the third phase of accelerated growth while Kerala’s
revenue deficit remained above 2 per cent during the same period. In fact the average figure
for the major states indicates a revenue balance in 2016-17 while Kerala’s revenue deficit
remains rather high at 1.50 per cent. Clearly there is scope of much improvement in the quality
of the state’s finances.
Decomposition of Gross Fiscal Deficit
Tables 4.3 and 4.4 show the decomposition of fiscal deficit into revenue deficit, capital
outlays and net lending (all as percentages of GFD). From Table 4.3 it appears that capital
outlays have dominated in the first phase for all the states but revenue deficit started gaining
prominence in the second phase. However in the third phase all states except Kerala have tried
to make course correction and increased the share of capital outlays in gross fiscal deficit. For
Kerala this increase was only marginal from 32.4 per cent in the second phase to 34.7 per cent
in the third phase whereas for all the other states except Maharashtra the increase was by 20-
50 per cent. In fact for Karnataka the share of capital outlays is as high as 117 per cent in the
third phase. Consider the comparison of Kerala with the average for 13 states shown in Table
4.4. In 2016-17, the share of capital outlays for Kerala was 47.86 per cent compared to 86.87
per cent for the average of 13 states. On the other hand the share of revenue deficit for Kerala
was 49.48 per cent when the average for 13 states was -0.86 per cent. This lop sided
composition of fiscal deficit can have serious consequences for capital formation in the state
and its long term productivity and growth.
Revenue expenditure and receipts
Further insights on the quality of finances can be obtained by examining the trends in
revenue expenditure and revenue receipts as percentages of GSDP (Tables 4.5 and 4.6). It is
25
clear from Table 4.5 that since the second phase, revenue receipts slipped behind revenue
expenditure especially for Kerala and Andhra Pradesh. While in the first phase revenue
expenditure for Kerala was 16.75 per cent of GDP and revenue receipts was 16.48 of GDP – a
gap of just 27 basis points, in the third phase revenue expenditure was 14.02 per cent of GDP
and revenue receipts was 11.71 of GDP – a gap of 2.69 per cent. Table 4.6 shows that since the
mid-nineties Kerala’s revenue receipts as well as revenue expenditure (as percentages of GDP)
have been lower than the average figures for 13 states. However in recent times Kerala’s
revenue expenditure (as percentage of GDP) has exceeded the average figure for 13 states. If
the state has to bring down its outstanding liabilities then it is clear that the growth in revenue
expenditure has to slow down. Otherwise the government will not be able to reduce its
outstanding liabilities fast enough.
Composition of Outstanding Liabilities
Finally we investigate what is responsible for the high debt levels of Kerala. Tables 4.7
and 4.8 show the outstanding liabilities and guarantees as percentage of GSDP. Total internal
debt has shot up in the third phase in all the comparison states along with Kerala (Table 4.7).
Loans from banks and financial institutions have also increased for all the states. Loans and
advances from the Centre have steadily declined over the three phases. However what is
remarkable about Kerala is the huge Provident funds component of outstanding liabilities.
Table 4.7 shows that the share of provident funds in total outstanding liabilities is close to 30
per cent over the second and third phases while internal debt has increased over this period
coinciding with a decline in loans and advances from the Centre. This is in complete contrast
with all the comparison states where the share of provident funds has either come down (except
in case of Rajasthan where it has remained at 20 per cent but still significantly lower than
Kerala’s case). With an ageing population in Kerala this is one item that could threaten fiscal
stability in the years to come. Table 4.8 shows that while all other components of outstanding

26
liabilities are lower for Kerala in 2015-16 as compared with the average for the 13 major states,
the share of provident funds (25 per cent) is more than twice that of the average for the 13 states
(11.32 per cent). Another kind of liability, which is however an off-budget item, is contingent
liabilities that takes the form of guarantees extended by the government on loans raised by
PSEs or other government bodies. Table 4.9 shows that contingent liabilities as a percentage
of GSDP have been coming down over the years yet (at 2.12 per cent) is the highest for Kerala
compared to the comparison states.
Sustainability Analysis: Indicator based assessment
Having analysed the trends in fiscal imbalances we now move to studying the
sustainability of Kerala’s state finances. Public debt sustainability refers to sustainability of the
government’s debt without the threat of a default. Typically a default is a last option or in most
cases it is not even an option. Instead the government would drastically change its policies to
delay or avoid the default (Ianchovichina et al, 2007). Therefore public debt sustainability or
fiscal sustainability can be defined more generally as a government’s ability to carry on with
its current fiscal operations without encountering a crisis or drastically changing in policies
(Greene, 2012). Therefore to examine debt sustainability it becomes important to study the
growth in the debt and also assess the fiscal balance (especially primary balance) being
generated which would worsen or improve the debt situation.
Domar (1944) argued that, debt is sustainable as long as the real growth of the economy
remains higher than the real interest rate (the so-called Domar condition). According to Buiter
(1985) and Buiter and Patel (1992), fiscal sustainability requires the rate of growth of debt-
GDP ratio to be no more than the real interest rate. These studies have culminated in the the
widely used Indicator based approach for studying debt sustainability (RBI, 2014). The
analysis covers a number of fiscal indicators starting with the popular Domar condition to credit
worthiness and liquidity indicators of government finances. Table 4.10 presents an analysis of

27
several such indicators across the three phases of analysis. The evidence can be described as
mixed. For instance, the comparison of output growth with debt growth and interest rate
(Domar condition) shows that Kerala’s debt is not unsustainable in view of the high GSDP
growth rate in the third phase. The indicators involving primary balance indicate that while
primary revenue balance has improved but the primary balance has remained negative.
Indicators 5 and 6 show that debt has grown faster than revenue receipts and own tax
revenues. While interest burden appears to be under control (indicator 7) on account of a high
rate of GDP growth, indicators 8 to 10 show a significant worsening of the interest payments
with respect to revenue expenditure and revenue receipts along with falling revenue receipts
(as percentage of GDP).
Sustainability Analysis: Time series approach
The literature has gone beyond the indicator-based approach by employing time series
analysis based on an inter-temporal budget constraint. Blanchard (1990) provided two
conditions for sustainability viz., a) the ratio of debt to output should converge to its initial
level, and b) the present discounted value of the ratio of primary surplus to output should be
equal to the current level of debt to output. In other words, debt level is sustainable if a
country’s debt to GDP ratio remains stable, and if the economy generates debt stabilising
primary balance to cover that debt in future.
Ley (2009) summarizes these ideas in terms of an elegant algebraic framework starting
with the following inter-temporal budget constraint of the government:
Dt = (1+it)Dt-1–PBt – ΔMt
which states that public debt at the end of any year (Dt) is generated by the public debt at the
end of the previous year (Dt-1) along with the interest payment (itDt-1 where i is the average

28
nominal interest rate on debt) but adjusted for the primary balance (PBt) and seignorage
(equivalent to increase in moneys supply ΔMt). This equation implies that the government ex-
post always meets its debt obligations. Also any deficit (PB<0) is financed either by new debt
or printing money (seignorage). In case of state governments who do not have recourse to
seignorage, we can drop the last term and rewrite the above equation as:
Dt = (1+it)Dt-1 – PBt ---- (1)
Normalising by GDP, we can easily arrive at an expression with all terms reported as ratio of
GDP:
dt =1+it
(1+gt)(1+πt)dt−1 − pbt---- (2)
Greene (2012) shows how this equation can be used to arrive at the change in debt-to-
GDP ratio (dt – dt-1):
Δdt =rt−gt
(1+gt)dt−1 − pbt---- (3)
Equations (2) and (3) are used for many types of fiscal sustainability exercises. While
(2) provides the time profile of debt-to-GDP ratio, (3) can identify the primary balance needed
to stabilise the debt-to-GDP ratio.
Ley (2009) shows that inserting Δdt=0 in the above equation can lead us to a debt-
stabilising primary balance:
pbt =rt−gt
(1+gt)dt−1---- (4)
The left hand side of this expression gives us the required primary surplus that will
stabilise the debt and can also be interpreted as a fiscal rule. This expression generated a lot of
time series based empirical work using tests of non-stationarity and cointegration of the debt
and primary balance series. However Bohn (1998, 2008) criticised such tests as flawed as they

29
make assumptions about future states of nature that are difficult to estimate from a single set
of observed time series data. Instead Bohn formalised the above fiscal rule idea in terms of a
simple and intuitive fiscal reaction function that tests whether the primary balance to GDP ratio
is a linear function of the debt to GDP ratio:
pbt = a0 + a1*dt + a2*Zt + et---- (5)
where a1 is the fiscal reaction parameter, Zt is a set of other determinants of primary
balance and et is an error term. This fiscal reaction function shows how a government reacts to
debt accumulation and therefore it is expected that the primary balance should respond
positively to any increase in the debt stock. Therefore a positive and statistically significant
fiscal reaction parameter becomes the test of fiscal sustainability. We carry out this test using
the output gap and lagged primary balance as additional determinants of primary balance as
done in various studies (e.g. Stoica and Leonte, 2011; Burger et al., 2012; Nguyen, 2013). The
output gap is defined as the difference between the actual GSDP and a potential GSDP series
(generated using a Hodrick-Prescott filter).
The unit root tests reveal that while the primary balance to GSDP series is stationary,
the debt-GSDP series is non-stationary. Therefore, we estimate equation (5) using both OLS
as well as VAR in first difference and the results are shown in Table 4.11. The OLS result
shows that the coefficient of debt is positive but is not statistically significant. The only
statistically significant coefficient is that of lagged primary balance whose positive sign
suggests some inertia in fiscal behaviour. The VAR results also do not provide a statistically
significant fiscal reaction coefficient. Therefore the result of this analysis does not point
towards unsustainability of Kerala’s fiscal situation.

30
Figure 4.1: Phase-wise Average of Outstanding Liabilities (% of GSDP): Kerala vs Comparison States
Figure 4.2 Outstanding Liabilities (% of GSDP): Kerala vs 13 Major States (at five year intervals)
25.921.6
17.119.2
15.5
34.3
16.9
31.1
24.026.0
21.519.7
33.8
20.5
32.2
50.4
29.1
22.424.2
35.5
21.8
0.00
10.00
20.00
30.00
40.00
50.00
60.00
Kerala AndhraPradesh
Gujarat Karnataka Maharashtra Rajasthan Tamil Nadu
1980-81 to 1986-87 1987-88 to 2001-02 2002-03 to 2015-16
23.5
29.7
35.3
27.7
36.135.0
31.8
27.4
24.4
27.8
34.2
27.4
36.138.5
27.0
23.0
0.00
5.00
10.00
15.00
20.00
25.00
30.00
35.00
40.00
45.00
1980 - 1981 1985 - 1986 1990 - 1991 1995 - 1996 2000 - 2001 2005 - 2006 2010 - 2011 2015 - 2016
Outstanding Liabilities Kerala Outstanding Liabilities Other States
31
Figure 4.3 Phase-wise Average of Interest Payments (% of Revenue Receipts): Kerala vs
Comparison States
Figure 4.4 Interest Payments (% of Revenue Receipts): Kerala vs 13 Major States (at five year
intervals)
9.0
7.18.3
7.1 6.7
12.5
6.5
18.3
14.2
16.4
12.613.5
19.7
12.0
20.2
14.3
20.8
11.5
16.7
19.2
13.4
0.00
5.00
10.00
15.00
20.00
25.00
Kerala AndhraPradesh
Gujarat Karnataka Maharashtra Rajasthan Tamil Nadu
1980-81 to 1986-87 1987-88 to 2001-02 2002-03 to 2016-17
7.19.3
14.2
17.0
25.924.8
18.4
15.0
8.39.6
13.7
17.7
23.6
21.2
14.712.7
0.00
5.00
10.00
15.00
20.00
25.00
30.00
1980 -1981
1985 -1986
1990 -1991
1995 -1996
2000 -2001
2005 -2006
2010 -2011
2016 -2017
Kerala Other States

32
Table 4.1 Phase-wise Average of Gross Fiscal Deficit & Revenue Deficit (% of GSDP): Kerala vs
Comparison States
States
Gross Fiscal Deficit Revenue Deficit
1980-81 to 1986-87
1987-88 to 2001-02
2002-03 to 2016-17
1980-81 to 1986-87
1987-88 to 2001-02
2002-03 to 2016-17
Kerala 3.63 4.51 3.54 0.28 2.42 2.15
Andhra Pradesh 3.25 3.45 2.68 -0.02 1.01 0.19
Gujarat 3.74 4.29 2.79 -0.40 1.77 0.34
Karnataka 3.66 3.32 2.48 -0.44 0.86 -0.41
Maharashtra 3.27 3.01 2.38 -0.14 0.96 0.55
Rajasthan 4.54 4.99 3.93 -0.27 1.73 0.89
Tamil Nadu 2.72 3.08 2.35 -0.83 1.99 0.30
Table 4.2 Gross Fiscal Deficit & Revenue Deficit (% of GSDP): Kerala vs 13 Major States (at five year
intervals)
Year
Gross Fiscal Deficit Revenue Deficit
Kerala Other States Kerala Other States
1980 - 1981 4.20 3.97 0.65 -1.34
1985 - 1986 4.30 4.09 0.98 -0.32
1990 - 1991 5.67 4.87 2.99 1.38
1995 - 1996 3.36 3.43 1.04 1.25
2000 - 2001 5.34 5.17 4.33 3.12
2005 - 2006 3.06 2.77 2.29 0.22
2010 - 2011 2.93 2.43 1.39 0.13
2016 - 2017 3.03 2.99 1.50 0.00
Table 4.3 Phase-wise Average of Composition of GFD - Revenue Deficit, Capital Outlay & Net
Lending (% of total): Kerala vs Comparison States
States
Revenue Deficit Capital Outlay Net Lending
1980-81 to 1986-87
1987-88 to 2001-02
2002-03 to 2016-17
1980-81 to 1986-87
1987-88 to 2001-02
2002-03 to 2016-17
1980-81 to 1986-87
1987-88 to 2001-02
2002-03 to 2015-16
Kerala -11.19 50.40 54.08 91.49 32.41 34.73 19.76 16.13 10.39
Andhra Pradesh -12.14 27.19 3.00 89.52 52.23 88.70 22.59 20.59 14.82
Gujarat -10.61 31.52 0.60 69.50 55.76 97.33 46.81 12.74 2.46

33
Karnataka -25.68 22.99 -22.74 75.67 65.59 117.01 49.93 11.43 7.83
Maharashtra -8.15 27.61 51.50 67.90 58.98 44.37 40.39 13.42 4.43
Rajasthan -6.08 28.61 9.66 79.48 63.64 85.53 26.54 7.76 -0.85
Tamil Nadu -31.93 60.79 -3.82 46.46 32.21 94.05 85.46 7.00 10.15
Table 4.4 Phase-wise Average of Composition of GFD - Revenue Deficit, Capital Outlay & Net
Lending (% of total): Kerala vs 13 Major States (at five year intervals)
Year
Revenue Deficit Capital Outlay Net Lending
Kerala Other States Kerala Other States Kerala Other States
1980 - 1981 15.56 -34.08 67.78 79.26 16.67 54.84
1985 - 1986 22.91 -13.62 63.78 72.37 13.31 41.24
1990 - 1991 52.82 23.16 32.04 53.61 15.14 23.26
1995 - 1996 30.93 33.03 40.38 53.43 25.79 13.54
2000 - 2001 81.15 58.70 14.88 36.64 3.97 4.66
2005 - 2006 74.82 -44.79 19.54 153.49 5.64 -8.66
2010 - 2011 47.48 -47.92 43.47 134.42 9.31 14.21
2016 - 2017 49.48 -0.86 47.86 86.87 _ _
Table 4.5 Phase-wise Average of Revenue Expenditure & Revenue Receipts (% of GSDP): Kerala vs
Comparison States
States
Revenue Expenditure Revenue Receipts
1980-81 to 1986-87
1987-88 to 2001-02
2002-03 to 2016-17
1980-81 to 1986-87
1987-88 to 2001-02
2002-03 to 2016-17
Kerala 16.75 17.14 14.02 16.48 14.71 11.71
Andhra Pradesh 16.32 15.50 14.17 16.34 14.49 12.97
Gujarat 12.82 15.23 10.75 13.22 13.46 10.47
Karnataka 15.82 15.95 13.14 16.25 15.09 13.55
Maharashtra 13.70 12.89 10.61 13.83 11.93 10.07
Rajasthan 15.92 17.27 15.16 16.19 15.54 14.40
Tamil Nadu 15.44 16.22 12.62 16.27 14.23 12.32

34
Table 4.6 Revenue Expenditure & Revenue Receipts (% of GSDP): Kerala vs 13 Major States (at five
year intervals)
Year
Revenue Receipts Revenue Expenditure
Kerala Other States Kerala Other States
1980 - 1981 14.94 15.73 15.58 14.39
1985 - 1986 18.23 16.98 19.22 16.66
1990 - 1991 17.04 17.19 20.04 18.57
1995 - 1996 13.99 14.00 15.03 15.25
2000 - 2001 12.02 13.38 16.35 16.50
2005 - 2006 11.18 14.21 13.46 14.43
2010 - 2011 11.75 13.86 13.14 13.85
2016 - 2017 12.75 13.33 14.17 13.50
Table 4.7 Phase-wise Average of Composition of Outstanding Liabilities (% Share in total): Kerala
vs Comparison States
States
Total Internal Debt Loans from Banks and
FIs Loans and Advances
from Centre Provident Funds
1980-81 to 1986-87
1987-88 to 2001-02
2002-03 to 2015 - 16
1980-81 to 1986-87
1987-88 to 2001-02
2002-03 to 2015 - 16
1980-81 to 1986-87
1987-88 to 2001-02
2002-03 to 2015 - 16
1980-81 to 1986-87
1987-88 to 2001-02
2002-03 to 2015 - 16
Kerala 21.08 24.77 55.51 0.00 3.24 6.34 59.06 38.98 9.44 19.86 30.72 29.70
Andhra Pradesh 21.05 26.01 64.65 0.00 2.84 5.14 72.11 53.63 15.71 6.84 8.80 6.90
Gujarat 18.14 14.72 68.26 0.00 1.58 3.22 71.01 60.50 11.06 10.85 8.20 4.97
Karnataka 19.92 21.57 54.60 0.00 2.27 2.93 68.19 52.55 15.33 11.89 15.41 13.81
Maharashtra 13.67 11.62 62.57 0.00 1.16 3.50 73.45 57.15 7.01 12.88 9.56 6.60
Rajasthan 19.78 22.89 59.29 0.00 1.90 3.71 69.58 47.64 10.25 10.64 19.85 20.93
Tamil Nadu 23.18 23.78 68.21 0.00 2.69 6.69 69.46 48.96 10.09 7.35 13.12 9.85

35
Table 4.8 Composition of Outstanding Liabilities (% Share in total): Kerala vs 13 Major States (at
five year intervals)
Year
Total Internal Debt Loans from Banks
and FIs Loans and Advances
from Centre Provident Funds
Kerala Other States Kerala
Other States Kerala
Other States Kerala
Other States
1980 - 1981 16.57 20.20 0.00 0.00 65.48 69.34 17.96 10.46
1985 - 1986 16.72 16.23 0.00 0.00 61.78 71.37 21.50 12.40
1990 - 1991 22.88 15.10 2.93 1.73 43.47 56.51 28.32 13.86
1995 - 1996 23.19 17.37 3.49 1.73 39.54 52.46 31.62 16.14
2000 - 2001 28.83 30.33 5.61 4.77 25.41 40.54 38.81 16.36
2005 - 2006 53.50 61.31 7.84 5.45 11.32 14.46 30.99 12.78
2010 - 2011 57.79 64.31 6.46 4.37 7.58 8.75 28.33 12.96
2015 - 2016 65.09 69.14 3.12 4.33 5.36 5.93 25.01 11.32
Table 4.9: Outstanding Liabilities (as percentage of GSDP)
Year Kerala Andhra Pradesh Gujarath Karnataka Maharashtra Rajasthan
Tamil Nadu
1991 - 1992 9.95 8.94 14.74 10.16 10.01 11.85 7.83
1995 - 1996 5.37 5.44 9.07 8.31 5.15 10.06 4.42
2000 - 2001 12.06 9.08 15.57 11.99 17.82 14.50 8.44
2005 - 2006 8.73 6.80 5.75 4.53 12.22 9.21 2.46
2010 - 2011 2.82 1.99 1.69 1.61 1.43 14.98 _
2011 - 2012 2.27 1.36 1.24 1.10 0.89 13.91 2.94
2012 - 2013 2.21 1.86 0.88 0.97 0.65 _ 2.81
2013 - 2014 2.10 3.36 _ 0.95 0.47 _ 5.10
2014 - 2015 2.12 1.31 _ 1.20 _ _ _

36
Table 4.10: Sustainability indicators
Indicators Phase I Phase II Phase III
1981-82
to 1986-87
1987-88
to 2001-02
2002-03
to 2015-16
1 Rate of Growth of GDP (G)
should be greater than Rate of
Growth of Debt (D); G – D > 0
-5.07 -1.11 1.24
2 Real Output Growth (g)
should be higher than Real Rate of
Interest (r); g – r > 0
6.68 7.73 8.81
3 Primary Balance should be
in surplus; PB > 0
-2.14 -1.90 -1.19
4 Primary Revenue Balance
(PRB = RD - IP) should be in
surplus
-1.21 -0.19 0.07
5 Debt to revenue receipts
ratio should decline over time
1.58 2.17 2.77
6 Debt to own tax revenue
ratio should decline over time
3.02 3.53 4.26

37
7 Interest Burden Defined by
Interest Payments (IP) to GDP ratio
should decline over time
0.01 0.03 0.02
8 Interest Payments (IP) as a
per cent of Revenue Expenditure
(RE) should decline over time.
0.09 0.15 0.17
9 Interest Payments (IP) as a
per cent of Revenue Receipts (RR)
should decline over time.
0.09 0.18 0.21
10 Revenue Receipts (RR) as a
percent to GDP should increase
over time.
0.16 0.15 0.12
Table 4.11: Fiscal reaction function for Kerala
Dependent variable: Primary Balance OLS
VAR
(in first difference)
Coefficient t-statistic Coefficient t-statistic
Constant -0.024903 -2.123155 -0.000176 -0.10260
Debt (-1) 0.048074 1.287025 0.053136 0.70330
Output_gap (-1) -1.98E-08 -0.141597 1.02E-07 0.77516
Primary balance (-1) 0.362002 2.148450 -0.192725 -1.23437
Adjusted R-squared 0.134792 0.001043
Log likelihood 116.2906 110.6974

38
5 Expenditure Management
Government expenditure is needed in an economy due to the following main reasons
(Greene 2011).
(a) Provision of public goods: Public goods are the ones which (a) cannot be bundled
out to individual consumers (b) are consumed without reducing the size of the good available
and (c) do not generate profits. They could ideally be supplied only by the government. Some
of the examples of public goods are public health and education, police and fire services, public
museums and national defence.
(b) To tackle economic slowdown: At times of general economic slowdown the private
sector would show a tendency to cut down its investment activity. In such circumstances, the
government could venture into additional spending, called countercyclical fiscal policy, to
enable the economy grow out of tough time.
(c) Regulation: In a market economy government, as a neutral institution, has an
important role to play to regulate the private businesses and to smooth out the inherent conflicts
of interest between private businesses by way of establishing a robust regulatory framework
consisting of regulatory authorities and dispute resolution mechanisms, which could guide the
operation of the private sector.
(d) Income redistribution: In a market economy not all the sections in the society would
benefit from the operation of the private sector as the later functions with profit motivation.
This would cause inequality in income and neglect of vulnerable sections of society from the
economic development process. Government can address this concern by way of spending on
essential public services such as health, education and social welfare and of creating a social
safety net for the poor and vulnerable.

39
Evidence across the globe suggests that the size of government expenditure depends
heavily on the size of the public revenue mobilized through tax and non-tax sources. That is,
higher the willingness of the taxpayers to pay taxes, larger the size of government expenditure.
Suitable examples of such a trend are Denmark, France, and Sweden. Another factor
determining the level of government expenditure is the income level of the country. In general,
it is found that government expenditure in high income countries exceeds that in low income
countries mainly due to higher public revenue in the former.
Types of government expenditure
Government expenditure can be categorized under two headings namely economic and
functional. The economic classification comprises two sub-divisions: Current expenditure and
Capital expenditure. Current expenditure refers to expenditure incurred on day-to-day
functioning of govt. Examples are expenses on wages and salaries of government employees,
purchase of goods and services by government for its use, interest payments, grants to SNGs
and non-profit institutions, subsidies pensions and military outlays (excluding spending on
military bases). Expenditures which are incurred on asset creation are called capital
expenditure. It includes spending on fixed capital formation such as public buildings,
infrastructure and military installations excluding weapons; facilities supporting the expansion
of private businesses; grants for capital formation; investments in shares of government
concerns and loans given by national government to SNGs for the purpose of capital formation.
The purpose of functional classification of government expenditure is to group
government spending under various programme/functional areas such as health, education,
family welfare, housing, agriculture, irrigation, rural development, energy and transportation.
Functional classifications vary from country to country on the basis of the nature of government
programs in each country.

40
Composition and growth of expenditure in Kerala
A significant part of Kerala’s total public expenditure consists of current expenditures.
Its share in total expenditure has increased over the years from 78.13 per cent in 1980-81 to a
peak of 90.33 per cent in 2000-01 and then declined to 86.43 per cent in 2016-17 (Figure 5.1).
Concomitantly, the share of capital expenditure and capital outlay declined over the years.8 The
fact that only a very small portion of state’s overall budgetary resources are allotted for capital
formation (capital outlay) do not augur well for the state economy as it is this expenditure that
really affects the growth process in an economy. These trends on composition of expenditure
were visible in the major states as well, on an average (Figure 5.2 and 5.3). However, one
notable difference is that in Kerala, over the years, the share of current expenditure and capital
outlay was higher and lower respectively than the major states as a whole (Figure 5.4 and 5.5).
The key reason for the higher share of revenue expenditure in Kerala has been the larger
expenditure commitment on two revenue expenditure heads namely salaries and pensions and
interest payments (Table 5.1). Today, they constitute around 56 per cent of state’s revenue
expenditure. More importantly, as percentage of revenue expenditure, Kerala had the highest
salary and pension burden among the comparable states since the beginning of this decade
(Table 5.2). However, the silver lining is that both as percentage of revenue expenditure and
state GDP the expenditure on salaries and pensions in Kerala has declined significantly over
the years. Similar trend was witnessed in all the comparable states except Gujarat (see Table
5.2). Another notable trend has been the fall in the interest payment liabilities in Kerala and all
the comparable states from the beginning of the current decade (Table 5.3). Subsidies constitute
8 However, starting from 2005-06, the share of capital expenditure and capital outlay in Kerala’s total expenditure
has witnessed an upward trend against downward trend earlier. As percentage of GSDP as well, capital outlay has
increased notably from 0.60 per cent in 2005-06 to 1.45 per cent in 2016-17 (Figure 5.2).

41
a negligible portion of Kerala’s revenue expenditure, though it has increased over the years,
particularly in recent times (Figure 5.6).
Table 5.4 presents the trends in total public expenditure and its components in Kerala
and comparable states during the three phases of economic growth trajectory identified in this
study. The total public expenditure of Kerala has declined from 20.38 per cent of GSDP during
the phase of moderate economic growth (1987-88 to 2001-02) to 16.20 per cent during
accelerated economic growth phase (2002-03 to 2016-17). In all the comparable states as well
the total public expenditure has declined between the same periods. The drop in the total
expenditure in Kerala was second largest (4.18 percentage points) among all the comparable
states and was caused by decline in both revenue expenditure and capital expenditure and
outlay. In contrast, in all comparable states except Rajasthan the decline in the total expenditure
was not at the cost of capital outlay. Moreover, the capital expenditure and outlay incurred in
Kerala during accelerated economic growth phase was lowest among the comparable states.
Expenditure on Social and Economic Service in Kerala
Tables 5.5, 5.6 and 5.7 present the expenditure under the two functional heads namely
social and economic services (excluding as well as including loans and advances) as percentage
of state GSDP in Kerala and major states. Over the years Kerala has been spending more on
social services than economic services. The total expenditure on social and economic services
(both excluding and including loans and advances) as percentage of GSDP has declined
significantly in Kerala over the years (Table 5.5). Similar trend was witnessed in the major
states as a whole, particularly in the case of economic services. The expenditure on social
services in Kerala has declined from the peak of 11.20 per cent of GSDP (including loans and
advances) in 1985-86 to 5.10 per cent in 2016-17. In case of economic services the same has
declined from 6.43 per cent in 1980-81 to 3.30 per cent in 2016-17. But, the silver lining is that
starting from the second half of the last decade the expenditure on social services has increased

42
in Kerala and major states put together as percentage of GSDP. In case of economic services
as well, the total expenditure increased both in Kerala and major states between 2010-11 and
2016-17 (see Table 5.5).
An analysis of expenditure incurred on the provision of social and economic services
during the various economic growth regimes reveals that, on an average, expenditure on social
and economic services (both including and excluding loans) has declined as percentage of
GSDP in Kerala and almost all the comparable states during the moderate and high economic
growth phases compared with the stagnation phase (Table 5.6 and 5.7). Also, during the high
growth phase, the expenditure incurred on economic services in Kerala was lowest. Such a
trend is a cause for serious concern since higher economic growth is expected to lead to higher
public spending on essential public services due to improved prospects of public revenue
mobilisation in a fast growing economy.
More importantly, the drop in the expenditure on social and economic services was
larger during the phase of accelerated economic growth in Kerala and majority of the
comparable states compared with the moderate growth phase. And, in case of Kerala the
decline in the expenditure on social services during the accelerated economic growth phase
was the highest among the comparable states and was caused by decline in both revenue
expenditure and expenditure on capital formation (See Tables 5.7 and 5.8). The decline in the
expenditure on economic services in Kerala was also resulted from the decline in revenue
expenditure, capital expenditure and capital outlay (Table 5.9). In the comparable states, the
expenditure allocation is partly better in the sense that the capital expenditure and outlay on
social services has witnessed an increase as a percentage of state GDP during the phase of
accelerated economic growth (Table 5.8).
Tables 5.10 to 5.16 present the expenditure incurred on major individual category of
social and economic services as percentage of GSDP under the three economic growth regimes.
43
Over the years, among the comparable states, Kerala has spent more on health and education
than any other heads of social and economic services.
Alarmingly, except transport and communications (under economic services), the total
expenditure on all the other individual heads namely education, public health, housing (all
under social services), agriculture and allied activities, irrigation, industry and minerals (all
under economic services) has declined in Kerala during the phase of accelerated economic
growth compared with the period of moderate economic growth.9 The decline in the public
expenditure under these heads was caused by the fall in all the components of expenditure
namely revenue expenditure, capital expenditure and capital outlay. A comparison of Kerala’s
performance with the comparable states reveals that, compared with the phase of moderate
economic growth, the total expenditure on education, public health, agriculture and allied
activities, irrigation (except Andhra Pradesh) and industry and minerals (except Maharashtra)
has declined as a percentage of GSDP in all the comparable states during the period of
accelerated economic growth. However, unlike Kerala, the fall in the total expenditure on two
crucial expenditure heads namely education and public health in the comparable states (except
Rajasthan in case of education) was not at the cost of capital expenditure and capital outlay.
Quality of expenditure on social and economic services in Kerala
In addition to the reduced significance of allocation on social and economic services
another distressing feature of expenditure pattern in Kerala and comparable states has been the
disproportionately larger amounts spend on current expenditures like wages and salaries,
subsidies and other transfers within the social and economic services. Consequently, budgetary
resources allotted for maintenance of capital assets and creation of new assets within such
9 Moreover, the expenditure on education, public health, housing, and agriculture and allied activities has declined
during the moderate economic growth phase as well compared with the period of economic stagnation.

44
essential services has declined over time. This fact is brought out clearly in Tables 5.17 and
5.18 showing the revenue expenditure, capital expenditure and capital outlay components of
states' allocation on social and economic services.
Current expenditures constituted over 90 per cent of expenditures on social services in
Kerala since 1980-81 (Table 5.17). On the other hand, the share of capital expenditure and
capital outlay on social services was not only small but also declined consistently till 2000-01.
However, starting from 2000-01 the state witnessed an upward movement in the share of capital
expenditure and capital outlay on social services. For instance, the capital outlay on social
services in Kerala has increased from a mere 1.32 per cent of total expenditure on social
services in 2000-01 to 5.10 per cent in 2016-17. Similar trend was witnessed in case of major
states as a whole. However in their case the increase in the share of capital expenditure and
capital outlay from 2000-01 was much larger compared to Kerala (see Table 5.17).
Compared to social services, the quality of expenditure is better in the case of economic
services in the sense that the capital expenditure and capital outlay on economic services was
much higher than social services both in Kerala and major states put together (Table 5.18).
However, until mid-2000s, the share of capital outlay on economic services was falling
consistently in Kerala. Since mid-2000s, the share of capital outlay on economic services has
increased notably in Kerala from 13.47 per cent of total expenditure on economic services in
2005-06 to 35.24 per cent in 2016-17 (see Table 5.18).
Indeed the above analysis of quality of expenditure focuses only on components of
spending but on the outcomes. While outcomes are not the focus of our report, we made an
attempt to analyse the question whether Kerala is overspending on health and education
compared to other states in achieving the desired outcomes (see Appendix 3). The analysis
examines whether Kerala spends more than necessary to achieve its education and health
outcomes. Such an ‘efficiency of spending’ analysis reveals that Kerala overspends on

45
achieving literacy. In terms of health, Kerala overspends on tackling infant mortality. This
points towards some scope of rationalising social expenditure.
0.00
10.00
20.00
30.00
40.00
50.00
60.00
70.00
80.00
90.00
100.00
1980 - 1981 1985 - 1986 1990 - 1991 1995 - 1996 2000 - 2001 2005 - 2006 2010 - 2011 2016 - 2017
Figure 5.1: Composition of Total Expenditure - Kerala
Revenue Expenditure Capital Expenditure Capital Outlay

46
0.00
0.50
1.00
1.50
2.00
2.50
3.00
3.50
1980 - 1981 1985 - 1986 1990 - 1991 1995 - 1996 2000 - 2001 2005 - 2006 2010 - 2011 2016 - 2017
Figure 5.2: Capital Outlay as percentage of GSDP
Kerala Major States
0.00
10.00
20.00
30.00
40.00
50.00
60.00
70.00
80.00
90.00
1980 - 1981 1985 - 1986 1990 - 1991 1995 - 1996 2000 - 2001 2005 - 2006 2010 - 2011 2016 - 2017
* - Includes 13 major states excluding Kerala
Figure 5.3: Composition of Total Expenditure - Major States*
Revenue Expenditure Capital Expenditure Capital Outlay

47
0.00
10.00
20.00
30.00
40.00
50.00
60.00
70.00
80.00
90.00
100.00
1980 - 1981 1985 - 1986 1990 - 1991 1995 - 1996 2000 - 2001 2005 - 2006 2010 - 2011 2016 - 2017
Figure 5.4: Share of Revenue Expenditure in Total
Expenditure
Kerala Major States
0.00
2.00
4.00
6.00
8.00
10.00
12.00
14.00
16.00
1980 - 1981 1985 - 1986 1990 - 1991 1995 - 1996 2000 - 2001 2005 - 2006 2010 - 2011 2016 - 2017
Figure 5.5: Share of Capital Outlay in Total Expenditure
Kerala Major States

48
Table 5.1: Expenditure on Salaries and Pensions, Interest Payments and Subsidies in Kerala (As percentage of Revenue Expenditure and GSDP)
Year
As percentage of Revenue Expenditure
As percentage of GSDP
Salaries and Pensions
Interest Payments Subsidies
Salaries and Pensions
Interest Payments Subsidies
1990 - 1991 69.98 12.06 - 14.02 2.42 -
1995 - 1996 50.58 15.86 - 7.60 2.38 -
2000 - 2001 54.64 19.01 - 8.93 3.11 -
2005 - 2006 46.36 20.62 0.81 6.24 2.78 0.11
2010 - 2011 48.98 16.41 1.80 6.44 2.16 0.24
2015 - 2016 42.95 12.85 - 6.26 1.87 -
Source: State Finances : A Study of Budgets, RBI (Various Issues) (For Salaries, Pensions and Interest Payments) Kerala Public Expenditure Review Committee (Various Reports) (For Subsidies) Note: ‘-‘ indicates not available
Table 5.2: Expenditure on Salaries and Pensions in Kerala and Comparable States
Year
As percentage of Revenue Expenditure
Kerala Andhra Pradesh Gujarat Karnataka Maharashtra Rajasthan
Tamil Nadu
1990 - 1991 69.98 43.20 20.57 55.15 47.23 _ 47.83
1995 - 1996 50.58 43.96 20.04 52.17 49.52 _ 45.12
0.00
0.50
1.00
1.50
2.00
2.50
2004 -2005
2005 -2006
2006 -2007
2007 -2008
2008 -2009
2009 -2010
2010 -2011
2011 -2012
2012 -2013
2013 -2014
2014 -2015
Source: Kerala Public Expenditure Review Committee (Various Reports)
Figure 5.6: Expenditure on Subsidies in Kerala
As percentage of Revenue Expenditure As percentage of GSDP

49
2000 - 2001 54.64 44.89 16.64 52.31 54.30 45.18 51.39
2005 - 2006 46.36 38.57 18.89 44.16 50.02 39.40 41.99
2010 - 2011 48.98 42.08 37.69 43.73 47.84 43.95 48.82
2011 - 2012 54.27 41.95 39.51 36.87 45.57 40.57 46.99
2012 - 2013 49.41 36.86 37.09 43.57 46.98 38.54 41.99
2015 - 2016 42.95 32.54 - 39.06 43.92 - -
Source: State Finances : A Study of Budgets, RBI (Various Issues) Note: ‘-‘ indicates not available
Table 5.2 (Contd.): Expenditure on Salaries and Pensions in Kerala and Comparable States
Year
As percentage of GSDP
Kerala Andhra Pradesh Gujarat Karnataka Maharashtra Rajasthan
Tamil Nadu
1990 - 1991 14.02 7.13 3.00 6.69 6.42 _ 8.61
1995 - 1996 7.60 5.84 2.44 5.41 5.39 _ 6.30
2000 - 2001 8.93 7.16 3.30 5.73 8.05 8.24 7.61
2005 - 2006 6.24 5.26 1.97 4.15 5.37 5.96 5.21
2010 - 2011 6.44 5.66 4.15 3.69 4.85 5.83 6.09
2011 - 2012 6.86 5.12 3.83 2.81 4.42 4.99 5.24
2012 - 2013 6.41 4.64 3.57 3.37 4.50 4.95 4.76
2015 - 2016 6.26 2.67 _ 3.20 4.42 _ -
Table 5.3: Expenditure on Interest Payments in Kerala and Comparable States
Year
As percentage of Revenue Expenditure
Kerala Andhra Pradesh Gujarat Karnataka Maharashtra Rajasthan
Tamil Nadu
1990 - 1991 12.06 10.71 13.02 15.42 10.06 14.33 8.08
1995 - 1996 15.86 14.41 15.15 17.98 11.97 14.81 11.85
2000 - 2001 19.01 16.44 14.21 20.10 13.97 22.21 14.36
2005 - 2006 20.62 20.07 24.12 20.43 17.88 24.23 14.24
2010 - 2011 16.41 12.32 16.76 16.27 14.70 16.42 10.89
2015 - 2016 12.85 0.52 15.99 12.51 13.70 10.80 11.64
Source: State Finances : A Study of Budgets, RBI (Various Issues)
Table 5.3 (Contd.): Expenditure on Interest Payments in Kerala and Comparable States
Year
As percentage of GSDP
Kerala Andhra Pradesh Gujarat Karnataka Maharashtra Rajasthan
Tamil Nadu
1990 - 1991 2.42 1.77 1.90 1.87 1.37 2.41 1.45
1995 - 1996 2.38 1.91 1.85 1.86 1.30 2.61 1.65
2000 - 2001 3.11 2.62 2.82 2.20 2.07 4.05 2.13
2005 - 2006 2.78 2.74 2.51 1.92 1.92 3.66 1.77
2010 - 2011 2.16 1.66 1.85 1.37 1.49 2.18 1.36
2015 - 2016 1.87 0.04 1.40 1.03 1.38 1.75 1.41

50
Table 5.4: Total Expenditure and its Components (As percentage of GSDP)
States Total Expenditure Revenue Expenditure Capital Expenditure Capital Outlay
1980-81
to 1986-
87
1987-88
to 2001-
02
2002-03
to
2016-
)17
1980-81
to
1986-87
1987-88
to
2001-02
2002-03
to
2016-17
1980-81
to
1986-87
1987-88
to
2001-02
2002-03
to
2016-17
1980-81
to 1986-
87
1987-
88 to
2001-
02
2002-
03 to
2016-
17
Kerala 22.45 20.38 16.20 16.76 17.14 13.97 5.70 3.24 2.23 2.72 1.39 1.06
Andhra
Pradesh 20.92 19.29 16.74 16.32 15.50 12.74 4.60 3.78 3.99 2.61 1.73 2.14
Gujarat 18.72 19.14 14.40 12.82 15.23 10.75 5.90 3.90 3.65 2.46 2.06 2.34
Karnataka 22.20 19.59 17.02 15.82 15.95 13.14 6.39 3.64 3.88 2.46 2.06 2.72
Maharashtra 18.16 15.71 13.29 13.70 12.89 10.61 4.47 2.82 2.68 2.15 1.66 1.66
Rajasthan 23.55 22.30 19.75 15.93 17.27 15.16 7.63 5.02 4.59 3.59 2.87 2.51
Tamil Nadu 21.63 18.80 15.94 15.44 16.22 12.62 6.19 2.58 3.32 1.25 0.90 1.85
Table 5.5: Total Expenditure* on Social and Economic Services as percentage of GSDP
Year Social Services Economic Services
Kerala* Kerala** Major states* Major states** Kerala* Kerala** Major states* Major
states**
1980 - 1981 8.74 8.98 6.00 6.29 5.79 6.43 7.42 9.58
1985 - 1986 10.92 11.20 7.14 7.34 5.58 6.03 7.53 9.16
1990 - 1991 9.31 9.56 7.49 7.67 5.23 5.96 7.47 8.77
1995 - 1996 6.14 6.35 5.77 5.89 4.06 4.79 5.15 5.78
2000 - 2001 5.84 6.00 6.20 6.39 3.66 3.85 4.94 5.41
2005 - 2006 4.41 4.48 5.27 5.36 3.21 3.33 4.91 5.27
2010 - 2011 4.77 4.85 5.85 5.96 2.70 2.91 4.56 4.75
2016 - 2017 5.10 5.10 6.79 6.84 3.19 3.30 5.40 5.73
*Excluding Loans & Advances
** Including Loans and Advances

51
Table 5.6: Total Expenditure on Social and Economic Services as percentage of GSDP
(Excluding Loans and Advances)
States
Social Services
Economic Services
1980-81 to
1986-87
1987-88 to
2001-02
2002-03 to
2016-17
1980-81 to
1986-87
1987-88 to
2001-02
2002-03 to
2016-17
Kerala 9.13 7.18 4.82 5.45 4.51 2.87
Andhra Pradesh 7.48 6.09 5.00 7.27 6.19 5.25
Gujarat 5.79 5.82 4.72 6.32 6.99 4.21
Karnataka 5.98 6.25 6.20 7.16 6.37 5.76
Maharashtra 4.97 4.80 4.51 6.24 5.22 3.50
Rajasthan 7.46 7.66 6.90 7.14 6.12 5.13
Tamil Nadu 6.89 6.55 5.19 5.66 5.32 3.66
Table 5.7: Total Expenditure on Social and Economic Services as percentage of GSDP
(Including Loans and Advances)
States
Social Services Economic Services
1980-81 to
1986-87
1987-88 to
2001-02
2002-03 to
2016-17
1980-81 to
1986-87
1987-88
to 2001-
02
2002-03 to
2016-17
Kerala 9.35 7.42 4.94 6.07 5.07 3.08
Andhra Pradesh 7.66 6.38 5.35 7.88 7.14 5.39
Gujarat 6.06 5.97 4.74 8.01 7.85 4.40
Karnataka 6.24 6.46 6.34 9.03 7.08 5.87
Maharashtra 5.27 4.96 4.56 7.44 5.75 3.70
Rajasthan 7.64 7.73 6.93 8.52 6.90 5.83
Tamil Nadu 7.37 6.91 5.32 8.38 5.99 4.00

52
Table 5.8: Composition of Expenditure* on Social Services (As percentage of GSDP)
States Revenue Expenditure Capital Expenditure Capital Outlay
1980-81
to 1986-
87
1987-88
to 2001-
02
2002-03
to 2016-
17
1980-81
to 1986-
87
1987-88
to 2001-
02
2002-03
to 2016-
17
1980-81
to 1986-
87
1987-88
to 2001-
02
2002-03
to 2016-
17
Kerala 8.39 7.13 4.68 0.96 0.42 0.26 0.74 0.21 0.14
Andhra
Pradesh
7.32 5.96 4.85 0.34 0.42 0.50 0.17 0.13 0.15
Gujarat 5.38 5.45 4.06 0.67 0.53 0.68 0.41 0.37 0.66
Karnataka 5.84 6.07 4.76 0.41 0.38 1.58 0.14 0.17 1.44
Maharashtra 4.82 4.71 4.36 0.45 0.25 0.21 0.15 0.09 0.15
Rajasthan 6.41 6.80 5.89 1.23 0.93 1.04 1.04 0.86 1.01
Tamil Nadu 6.65 6.33 4.62 0.72 0.58 0.69 0.24 0.22 0.56
* Including loans and advances by the state governments
Table 5.9: Composition of Expenditure on Economic Services (As percentage of GSDP)
States Revenue Expenditure Capital Expenditure* Capital Outlay
1980-81 to
1986-87
1987-88
to 2001-
02
2002-03
to 2016-
17
1980-81
to 1986-
87
1987-88
to 2001-
02
2002-03
to 2016-
17
1980-81
to 1986-
87
1987-88
to 2001-
02
2002-03
to 2016-
17
Kerala 3.55 3.36 2.14 2.52 1.76 0.94 1.89 1.15 0.73
Andhra Pradesh 4.89 4.62 3.34 3.00 2.51 2.05 2.38 1.57 1.91
Gujarat 4.30 5.33 2.59 3.71 2.52 1.81 2.02 1.66 1.62
Karnataka 4.92 4.53 3.66 4.12 2.55 2.21 2.25 1.84 2.10
Maharashtra 4.30 3.68 2.04 3.14 2.07 1.67 1.95 1.54 1.47
Rajasthan 4.64 4.18 3.65 3.88 2.72 2.18 2.50 1.94 1.48
Tamil Nadu 4.72 4.70 2.48 3.66 1.29 1.52 0.94 0.62 1.18
* Including loans and advances by the state governments

53
Table 5.10: Expenditure* on Social Services: Education (As percentage of GSDP)
States Total Expenditure Revenue Expenditure Capital Expenditure*
Capital Outlay
1980-
81 to
86-87
1987-
88 to
01-02
2002-
03 to
16-17
1980-
81 to
86-87
1987-
88 to
01-02
2002-
03 to
16-17
1980-
81 to
86-87
1987-
88 to
01-02
2002-
03 to
16-17
1980-
81 to
86-87
1987-
88 to
01-02
2002-
03 to
16-17
Kerala 5.28 4.35 2.71 5.19 4.29 2.69 0.09 0.06 0.03 0.09 0.06 0.03
Andhra
Pradesh
3.25 2.74 1.93 3.24 2.75 1.92 0.01 0.02 0.03 0.01 0.02 0.02
Gujarat 2.71 2.96 1.96 2.70 2.94 1.87 0.01 0.02 0.10 0.01 0.02 0.10
Karnataka 3.02 3.24 2.42 3.00 3.22 2.39 0.01 0.02 0.05 0.01 0.02 0.05
Maharashtra 2.53 2.76 2.39 2.52 2.75 2.37 0.01 0.01 0.01 0.01 0.01 0.01
Rajasthan 3.46 3.82 3.14 3.44 3.78 3.13 0.02 0.04 0.02 0.02 0.04 0.02
Tamil Nadu 3.29 3.29 2.20 3.25 3.26 2.15 0.04 0.03 0.05 0.04 0.03 0.05
* Including loans and advances by the state governments
Table 5.11: Expenditure* on Social Services: Public Health (As percentage of GSDP)
States Total Expenditure Revenue Expenditure Capital Expenditure*
Capital Outlay
1980-
81 to
86-87
1987-
88 to
01-02
2002-
03 to
16-17
1980-
81 to
86-87
1987-
88 to
01-02
2002-
03 to
16-17
1980-
81 to
86-87
1987-
88 to
01-02
2002-
03 to
16-17
1980-
81 to
86-87
1987-
88 to
01-02
2002-
03 to
16-17
Kerala 1.96 1.14 0.72 1.45 1.08 0.69 0.51 0.06 0.04 0.51 0.06 0.03
Andhra
Pradesh
1.44 0.86 0.53 1.36 0.85 0.51 0.07 0.01 0.03 0.0007 0.0001 0.0001
Gujarat 1.16 0.76 0.49 1.01 0.74 0.40 0.15 0.01 0.09 0.15 0.01 0.09
Karnataka 1.28 0.95 0.56 1.22 0.90 0.50 0.06 0.05 0.06 0.06 0.05 0.06
Maharashtra 1.31 0.66 0.434 1.27 0.63 0.41 0.04 0.02 0.03 0.04 0.02 0.03
Rajasthan 2.32 1.11 0.73 1.62 1.06 0.68 0.70 0.05 0.05 0.70 0.05 0.05
Tamil Nadu 1.71 0.95 0.53 1.55 0.92 0.49 0.10 0.03 0.04 0.10 0.03 0.04
* Including loans and advances by the state governments
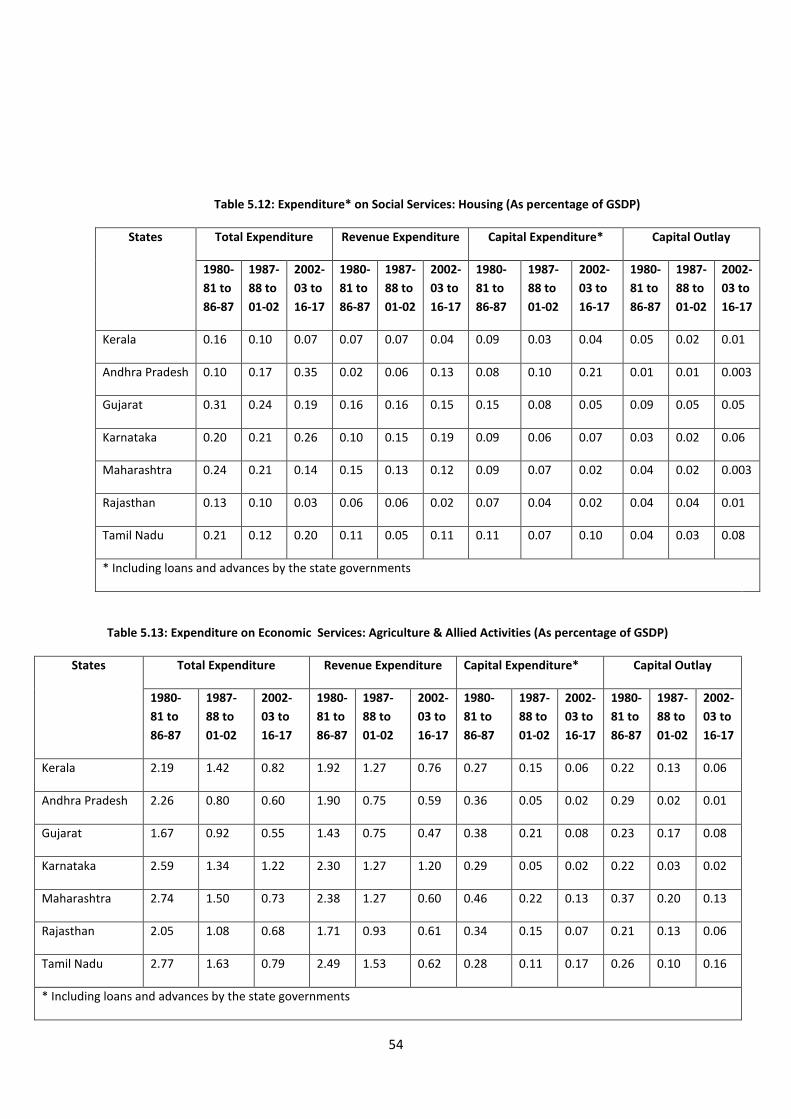
54
Table 5.12: Expenditure* on Social Services: Housing (As percentage of GSDP)
States Total Expenditure Revenue Expenditure Capital Expenditure* Capital Outlay
1980-
81 to
86-87
1987-
88 to
01-02
2002-
03 to
16-17
1980-
81 to
86-87
1987-
88 to
01-02
2002-
03 to
16-17
1980-
81 to
86-87
1987-
88 to
01-02
2002-
03 to
16-17
1980-
81 to
86-87
1987-
88 to
01-02
2002-
03 to
16-17
Kerala 0.16 0.10 0.07 0.07 0.07 0.04 0.09 0.03 0.04 0.05 0.02 0.01
Andhra Pradesh 0.10 0.17 0.35 0.02 0.06 0.13 0.08 0.10 0.21 0.01 0.01 0.003
Gujarat 0.31 0.24 0.19 0.16 0.16 0.15 0.15 0.08 0.05 0.09 0.05 0.05
Karnataka 0.20 0.21 0.26 0.10 0.15 0.19 0.09 0.06 0.07 0.03 0.02 0.06
Maharashtra 0.24 0.21 0.14 0.15 0.13 0.12 0.09 0.07 0.02 0.04 0.02 0.003
Rajasthan 0.13 0.10 0.03 0.06 0.06 0.02 0.07 0.04 0.02 0.04 0.04 0.01
Tamil Nadu 0.21 0.12 0.20 0.11 0.05 0.11 0.11 0.07 0.10 0.04 0.03 0.08
* Including loans and advances by the state governments
Table 5.13: Expenditure on Economic Services: Agriculture & Allied Activities (As percentage of GSDP)
States Total Expenditure Revenue Expenditure Capital Expenditure* Capital Outlay
1980-
81 to
86-87
1987-
88 to
01-02
2002-
03 to
16-17
1980-
81 to
86-87
1987-
88 to
01-02
2002-
03 to
16-17
1980-
81 to
86-87
1987-
88 to
01-02
2002-
03 to
16-17
1980-
81 to
86-87
1987-
88 to
01-02
2002-
03 to
16-17
Kerala 2.19 1.42 0.82 1.92 1.27 0.76 0.27 0.15 0.06 0.22 0.13 0.06
Andhra Pradesh 2.26 0.80 0.60 1.90 0.75 0.59 0.36 0.05 0.02 0.29 0.02 0.01
Gujarat 1.67 0.92 0.55 1.43 0.75 0.47 0.38 0.21 0.08 0.23 0.17 0.08
Karnataka 2.59 1.34 1.22 2.30 1.27 1.20 0.29 0.05 0.02 0.22 0.03 0.02
Maharashtra 2.74 1.50 0.73 2.38 1.27 0.60 0.46 0.22 0.13 0.37 0.20 0.13
Rajasthan 2.05 1.08 0.68 1.71 0.93 0.61 0.34 0.15 0.07 0.21 0.13 0.06
Tamil Nadu 2.77 1.63 0.79 2.49 1.53 0.62 0.28 0.11 0.17 0.26 0.10 0.16
* Including loans and advances by the state governments
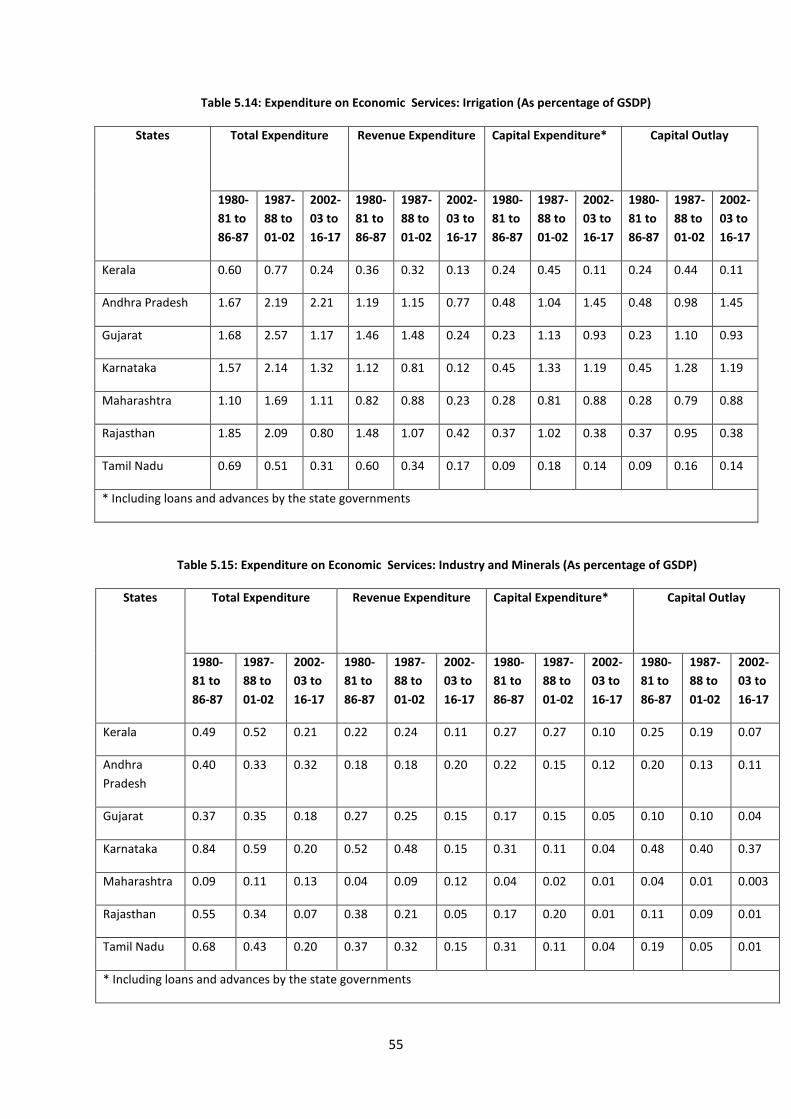
55
Table 5.14: Expenditure on Economic Services: Irrigation (As percentage of GSDP)
States Total Expenditure Revenue Expenditure Capital Expenditure*
Capital Outlay
1980-
81 to
86-87
1987-
88 to
01-02
2002-
03 to
16-17
1980-
81 to
86-87
1987-
88 to
01-02
2002-
03 to
16-17
1980-
81 to
86-87
1987-
88 to
01-02
2002-
03 to
16-17
1980-
81 to
86-87
1987-
88 to
01-02
2002-
03 to
16-17
Kerala 0.60 0.77 0.24 0.36 0.32 0.13 0.24 0.45 0.11 0.24 0.44 0.11
Andhra Pradesh 1.67 2.19 2.21 1.19 1.15 0.77 0.48 1.04 1.45 0.48 0.98 1.45
Gujarat 1.68 2.57 1.17 1.46 1.48 0.24 0.23 1.13 0.93 0.23 1.10 0.93
Karnataka 1.57 2.14 1.32 1.12 0.81 0.12 0.45 1.33 1.19 0.45 1.28 1.19
Maharashtra 1.10 1.69 1.11 0.82 0.88 0.23 0.28 0.81 0.88 0.28 0.79 0.88
Rajasthan 1.85 2.09 0.80 1.48 1.07 0.42 0.37 1.02 0.38 0.37 0.95 0.38
Tamil Nadu 0.69 0.51 0.31 0.60 0.34 0.17 0.09 0.18 0.14 0.09 0.16 0.14
* Including loans and advances by the state governments
Table 5.15: Expenditure on Economic Services: Industry and Minerals (As percentage of GSDP)
States Total Expenditure Revenue Expenditure Capital Expenditure*
Capital Outlay
1980-
81 to
86-87
1987-
88 to
01-02
2002-
03 to
16-17
1980-
81 to
86-87
1987-
88 to
01-02
2002-
03 to
16-17
1980-
81 to
86-87
1987-
88 to
01-02
2002-
03 to
16-17
1980-
81 to
86-87
1987-
88 to
01-02
2002-
03 to
16-17
Kerala 0.49 0.52 0.21 0.22 0.24 0.11 0.27 0.27 0.10 0.25 0.19 0.07
Andhra
Pradesh
0.40 0.33 0.32 0.18 0.18 0.20 0.22 0.15 0.12 0.20 0.13 0.11
Gujarat 0.37 0.35 0.18 0.27 0.25 0.15 0.17 0.15 0.05 0.10 0.10 0.04
Karnataka 0.84 0.59 0.20 0.52 0.48 0.15 0.31 0.11 0.04 0.48 0.40 0.37
Maharashtra 0.09 0.11 0.13 0.04 0.09 0.12 0.04 0.02 0.01 0.04 0.01 0.003
Rajasthan 0.55 0.34 0.07 0.38 0.21 0.05 0.17 0.20 0.01 0.11 0.09 0.01
Tamil Nadu 0.68 0.43 0.20 0.37 0.32 0.15 0.31 0.11 0.04 0.19 0.05 0.01
* Including loans and advances by the state governments

56
Table 5.16: Expenditure on Economic Services: Transport and Communication (As percentage of GSDP)
States Total Expenditure Revenue Expenditure Capital Expenditure*
Capital Outlay
1980-
81 to
86-87
1987-
88 to
01-02
2002-
03 to
16-17
1980-
81 to
86-87
1987-
88 to
01-02
2002-
03 to
16-17
1980-
81 to
86-87
1987-
88 to
01-02
2002-
03 to
16-17
1980-
81 to
86-87
1987-
88 to
01-02
2002-
03 to
16-17
Kerala 0.98 0.78 0.86 0.57 0.41 0.44 0.42 0.37 0.42 0.42 0.37 0.42
Andhra Pradesh 0.67 0.54 0.48 0.45 0.32 0.24 0.22 0.23 0.25 0.22 0.23 0.25
Gujarat 1.13 0.90 0.80 0.76 0.69 0.49 0.37 0.21 0.31 0.37 0.21 0.31
Karnataka 0.80 0.63 0.95 0.48 0.40 0.37 0.32 0.23 0.58 0.32 0.23 0.58
Maharashtra 0.37 0.59 0.49 0.11 0.31 0.25 0.26 0.27 0.24 0.26 0.27 0.24
Rajasthan 1.16 0.75 0.60 0.50 0.45 0.30 0.67 0.30 0.30 0.67 0.30 0.30
Tamil Nadu 0.81 0.59 0.73 0.62 0.37 0.20 0.19 0.23 0.53 0.19 0.23 0.53
* Including loans and advances by the state governments
Table 5.17: Composition of Expenditure on Social Services (%)
Year Revenue Expenditure Capital Expenditure Capital Outlay
Kerala Major states Kerala Major states Kerala Major states
1980 - 1981 91.40 90.66 8.60 9.47 5.96 8.20
1985 - 1986 92.15 92.70 7.85 7.35 5.31 8.52
1990 - 1991 94.81 94.12 5.19 6.05 2.61 7.80
1995 - 1996 93.92 93.96 6.08 6.06 2.81 8.09
2000 - 2001 96.09 92.60 3.91 7.49 1.32 10.33
2005 - 2006 96.10 89.75 3.90 10.36 2.17 14.37
2010 - 2011 94.61 90.48 5.39 9.82 3.74 14.41
2016 - 2017 94.86 78.43 5.14 14.79 5.10 NA

57
Table 5.18: Composition of Expenditure on Economic Services (%)
Year Revenue Expenditure Capital Expenditure Capital Outlay
Kerala Major states Kerala Major states Kerala Major states
1980 - 1981 55.50 48.31 44.50 51.69 34.57 28.89
1985 - 1986 58.75 55.40 41.25 44.60 33.80 26.36
1990 - 1991 62.48 62.58 37.52 37.42 25.37 22.01
1995 - 1996 59.39 64.38 40.61 35.62 25.39 24.72
2000 - 2001 77.84 65.15 22.16 34.85 17.16 26.03
2005 - 2006 82.69 59.17 17.31 40.83 13.47 34.21
2010 - 2011 56.78 64.13 43.22 35.87 36.04 32.49
2016 - 2017 61.44 59.53 38.56 32.78 35.24 31.56

58
6 Analysis of Revenues
Governments require revenue for following reasons/purposes (DFID 2009; Greene
2011; OECD 2016).
a) To finance government activities, in particular the provision of essential public services
for the citizens.
b) To reduce the need for public borrowing to fund government activities.
c) To achieve good governance and public financial management. Lower public revenues
can cause failure of the state to manage the economy and society.10
d) To fund the delivery of the Millennium Development Goals.
e) To reduce the dependency on aid, in case of developing countries.
f) Tax revenue instrument can be used to influence the incentives for work, savings,
investment, entrepreneurship, and innovation, thereby promoting economic growth.
g) Taxes make the governments accountable to their citizens due to the pressure to deliver
public services using the revenue collected.
h) As per the consensus arrived at the United Nations Financing for Development Summit
held in Monterrey in 2002 and reiterated at Doha in 2008, developing countries are
committed to improve their overall public revenue mobilisation in return for higher
flow of international development assistance.
i) For sub-national governments (SNGs) in a federal system sufficient revenue from their
own sources is needed due to following additional reasons (a) fiscal rules often limits
their borrowing capacity.; (b) own revenues reduce the dependence of SNGs on
10Evidence show that a healthy tax system represented by higher tax-GDP ratio causes less incidence of conflict
(Hendrix 2007).

59
transfers from the higher-level governments; (c) as opposed to grants, own revenue
provides greater freedom in deciding the spending priorities of SNGs, particularly on
public services and (d) size of grants from the central government is quite often
determined by political factors such as pressure of special interest groups and prevailing
political alignment.
Sources of government revenue
The major sources of government revenue are taxes, non-tax revenue, transfers and
grants. There are two types of taxes namely direct and indirect. The burden of direct taxesfalls
directly on the income or assets of physical or legal persons such as corporations and
foundations. The best examples of direct taxes are personal income tax, corporate income tax
and payroll tax. On the other hand, indirect taxes are levied indirectly on the use of income or
assets. Some of the popular examples of indirect taxes are general sales tax, value added tax
and excise tax (Greene 2012). Non-tax revenue sources include profits of public sector
enterprises, income from government-owned property, land leases or fees tied to the value of
natural resources such as coal and oil and administrative or user fees (Greene 2012).11
SNGs receive funds from the national government in two forms: (i) a share of own
revenues mobilised by the national government, called transfers and (ii) grant-in-aid (Greene
2012). Grants are financial support made in support of some worthy cause or to carry out
specific programmes or in return for fulfillment of some conditions. They are usually given,
with the aim of making the beneficiaries to provide more of a desired good or service than they
11 User or administrative fees are charges imposed by the government on the use of public services and public
property by the citizens. General examples are fees on higher education services provided by government run
education institutions, tolls for highways and bridges, and entry fees for public parks and museums. User fees are
generally imposed to enable the government to recover the cost of publicly provided goods and services and to
reduce congestion on public infrastructure (e.g. highway tolls).

60
would otherwise.12 The key purpose of the two channels of resource flows namely transfers
and grants is to help the SNGs to overcome the gap between their spending needs and own
revenues – called vertical imbalance, which emerge due to higher spending pressure on SNGs
compared to the national government (OECD 2016).13
Total revenue receipts of the states in India consists of own revenue receipts and
transfers from central government. The former comprises states' own tax and non-tax revenues
and the latter is the combination of states' share in central taxes and grant-in-aid from the centre.
Performance of revenues in Kerala
Figures 6.1 to 6.5 present long-term trends in various sources of revenues of Kerala and
major states put together as a percentage of state GSDP. The total revenue of Kerala as
percentage of GSDP had declined overtime and this was caused by decline in revenues from
both own revenue (both tax and non-tax) sources of the state and central transfers. Kerala has
been receiving lower central transfers compared with the average level of transfers received by
major states. Also, although central transfers as percentage of GSDP has been consistently
rising for major states on an average basis since 1995-96, in case of Kerala it has been
fluctuating.
The major contributor to states’ own revenues is tax revenues (Figures 6.6 and 6.7). For
most part of the period from 1980-81, both own tax revenues and own non-tax revenues of
Kerala witnessed a falling trend. For major states as a whole similar trend was witnessed only
in case of non-tax revenue. However, two remarkable aspects of Kerala’s own revenue
mobilisation are notable. First, Kerala’s own tax revenue to GSDP ratio was always higher than
12Apart from SNGs, the national governments also receive grants from international aid institutions and foreign
governments (Greene 2011). 13 Since the expenditure intensive responsibilities in areas such as education, health, rural development and law
and order usually come under the purview of the SNGs, the resource needs of SNGs are generally larger.

61
the average of major states (Figure 6.4).14 Second, since the second half of the last decade15,
own non-tax revenues of Kerala has increased consistently as percentage of GSDP.
Tables 6.1 and 6.2 present revenue performance of Kerala and comparable states under
the three growth phases. As percentage of GSDP, total revenue of Kerala has declined
significantly during the phases of moderate and accelerated economic growth. And this was
due to the decline in both own revenue and central transfers. Similar trend was witnessed in
the comparable states as well. However, among all the comparable states, Kerala has witnessed
the largest decline in total revenues and own tax revenues to GSDP ratio during the accelerated
phase of economic growth. Whereas total revenues to GSDP ratio fell by 3.15 percentage points
in case of own tax revenues the same figure was 1.43. The decline in own revenue to GSDP
ratio of Kerala and all the comparable states (except Rajasthan) during the accelerated
economic growth phase was contributed by both own tax revenue and own non-tax revenue.
Among comparable states, Kerala has witnessed the largest fall in own tax revenues to GSDP
ratio during the accelerated phase of economic growth.
Composition of own tax revenues in Kerala
States receive their own tax revenues from sales tax/value added tax (VAT), state
excise, stamps and registration fees, motor vehicle tax, and other sundry taxes like agricultural
income tax, land revenue, profession tax, property tax, electricity duty, and entertainment tax.
Over the years, a lion’s share (87.52 to 93.03 percent) of revenue received from Kerala’s own
tax revenue source consisted of taxes on commodities and services (Table 6.3). The remaining
portion was contributed mainly by taxes on property and capital transactions. The contribution
of tax on income (mainly agricultural income tax) was not only minuscule but also declined
14 It was higher to the maximum extent of 2.27 percentage points in 1995-96. 15To be precise, from 2005-06 in case of own tax revenues and from 2007-08 in case of non-tax revenue.

62
over the years. For major states as a whole, similar pattern of own tax revenue mobilisation
was evident.
Among the taxes on commodities and services, the major ones in order of their
contribution to own tax revenue in Kerala are: sales tax/value added tax (VAT), state excise
duties, motor vehicle tax and electricity duty (Table 6.4). Of these, the share of sales tax/VAT,
by and large, moved upward overtime. On the other hand, the contribution of state excise duties
declined consistently and sharply over the years from 19.38 per cent in 1980-81 to 5.10 per
cent in 2016-17. This is in contrast to the trend witnessed in the major states put together.
Notably, the contribution of sales tax/VAT to own tax revenues was larger in Kerala by over
10 percentage points in many years compared to the average of major states.
Within taxes on property and capital transactions, the major contribution has come from
stamps and registration fees (Table 6.5). Though the contribution of this tax revenue source to
Kerala’s own tax revenue was by and large rising since 1980-81, during the first half of the
current decade the contribution has declined significantly. This is a major cause for concern
because in a state which has been witnessing a property/real estate boom this tax source is
expected to contribute meaningfully to state’s own revenue resources. Interestingly, no such
drop in the contribution of stamps and registration fees was reported in major states as a whole
during the same period.
Growth of major own tax revenue sources in Kerala
Table 6.6 presents the growth rate of major own tax revenue sources of Kerala and
comparable states during the three economic growth phases. It is revealed that except stamps
and registration fees, the growth of all major own tax revenue sources namely sales tax/VAT,
state excise duties and motor vehicle tax has declined in Kerala during the period of accelerated
economic growth compared with the period of economic stagnation. In fact, the growth of

63
revenue from these three taxes has fallen consistently overtime in Kerala. The only other states
which witnessed a decline in the growth of revenue from majority of the major own tax handles
during the accelerated economic growth phase are Andhra Pradesh and Rajasthan.
Table 6.7 presents buoyancy of own tax revenue for Kerala and comparable states. With
the exception of Gujarat, in all the comparable states buoyancy estimates are less than unity
during the phase of accelerated economic growth implying that tax revenue performance of
Kerala and majority of the comparable states was not productive or buoyant during the time of
high economic growth. Interestingly, the only occasion in which tax buoyancy estimates were
greater than unity in all the comparable states was the period of economic stagnation. In three
states namely Andhra Pradesh, Karnataka and Tamil Nadu buoyancy estimates declined
consistently over the three phases of economic growth considered in this study.
Composition of own non-tax revenues in Kerala
The principal sources of own non-tax revenues of the states are (i) dividends and profits
on equity investments in state public sector enterprises (PSEs) and statutory corporations, and
interest receipts on loans rendered to the same; (ii) user charges on various social and economic
goods/services provided by the states; (iii) royalty on mines and minerals; (iv) forest revenue
(both under economic services) and (v) general services (mainly state lotteries). Table 6.8
presents the composition of own non-tax revenues of Kerala and major states as a whole. It is
striking that revenue through dividends and profits contribute virtually nothing to state’s
exchequer. Such a trend is unwarranted considering the huge amount of budgetary funds of
states locked in PSEs and statutory corporations. The only manner public sector units help the
states appear to be the payment of interests on loans and advances taken by them from the state
government. But this too has declined in Kerala and major states put together overtime.
However, in the major states as a whole the share of interest receipts in the total non-tax revenue
was far higher than in Kerala (See Table 6.8). Though general services and economic services

64
constituted significant part of own non-tax revenues mobilised in Kerala over the years, a
notable trend has been the consistent fall in the share of economic and social services and rise
in the share of general services. The share of receipts from economic services decelerated
sharply from 60.57 per cent of the non-tax revenue of the state in 1980-81 to 42.46 per cent in
2000-01 to 10.72 per cent in 2016-17 (Table 6.8). In case of social services, the share declined
from 16.45 per cent in 1980-81 to 6.01 per cent in 2016-17. On the other hand, the share of
general services (i.e. revenue from sale of state lotteries) increased from 13.40 per cent in 1980-
81 to 38.39 per cent in 2000-01 to a whopping 80.49 per cent in 2016-17. Interestingly, the
opposite trend was witnessed in major states as a whole, i.e. the share of non-tax revenue from
economic and social services have risen over the years. These findings suggest that, compared
with the major states as a whole, in Kerala user charges on public goods and services are either
fixed at low levels or not revised commensurate with the rising cost of supplying the goods and
services.
0.00
2.00
4.00
6.00
8.00
10.00
12.00
14.00
16.00
18.00
20.00
1980 -1981
1985 -1986
1990 -1991
1995 -1996
2000 -2001
2005 -2006
2010 -2011
2016 -2017
Figure 6.1: Total Revenue as % of GSDP
Kerala Major States

65
0.00
2.00
4.00
6.00
8.00
10.00
12.00
14.00
1980 - 19811985 - 19861990 - 19911995 - 19962000 - 20012005 - 20062010 - 20112016 - 2017
Figure 6.2: Own revenues as % of GSDP
Kerala Major States
0.00
1.00
2.00
3.00
4.00
5.00
6.00
7.00
1980 - 1981 1985 - 1986 1990 - 1991 1995 - 1996 2000 - 2001 2005 - 2006 2010 - 2011 2016 - 2017
Figure 6.3: Central Transfers as % of GSDP
Kerala Major States

66
0.00
2.00
4.00
6.00
8.00
10.00
12.00
1980 - 1981 1985 - 1986 1990 - 1991 1995 - 1996 2000 - 2001 2005 - 2006 2010 - 2011 2016 - 2017
Figure 6.4: Own tax revenue as % of GSDP
Kerala Major States
0.00
0.50
1.00
1.50
2.00
2.50
3.00
3.50
1980 - 1981 1985 - 1986 1990 - 1991 1995 - 1996 2000 - 2001 2005 - 2006 2010 - 2011 2016 - 2017
Figure 6.5: Own non-tax revenue as % of GSDP
Kerala Major States

67
0.00
2.00
4.00
6.00
8.00
10.00
12.00
1980 - 1981 1985 - 1986 1990 - 1991 1995 - 1996 2000 - 2001 2005 - 2006 2010 - 2011 2016 - 2017
Figure 6.6: Own tax and Non-tax revenues of Kerala as percentage of
GSDP
Own tax revenue Own non-tax revenue
0.00
1.00
2.00
3.00
4.00
5.00
6.00
7.00
8.00
9.00
1980 - 1981 1985 - 1986 1990 - 1991 1995 - 1996 2000 - 2001 2005 - 2006 2010 - 2011 2016 - 2017
Figure 6.7: Own tax and Non-tax Revenues of Major States as percentage of
GSDP
Own tax revenue Own non-tax revenue

68
Table 6.1: Total Revenue, Own Revenue and Central Transfers as percentage of GSDP
States Total Revenue Own Revenue Central Transfers
1980-81 to
1986-87
1987-88 to
2001-02
2002-03 to
2016-17
1980-81 to
1986-87
1987-88 to
2001-02
2002-03 to
2016-17
1980-81 to
1986-87
1987-88 to
2001-02
2002-03 to
2016-17
Kerala 16.48 14.71 11.57 11.03 10.19 8.54 5.45 4.53 3.12
Andhra
Pradesh
16.34 14.49 11.57 10.68 9.50 8.71 5.66 4.99 4.11
Gujarat 13.22 13.46 10.41 9.91 10.68 8.04 3.31 2.79 2.44
Karnataka 16.25 15.09 13.55 11.70 11.02 10.13 4.56 4.07 3.73
Maharashtra 13.83 11.93 10.07 10.83 9.68 8.09 3.00 2.25 2.07
Rajasthan 16.19 15.54 14.40 9.46 8.93 8.83 6.73 6.61 5.95
Tamil Nadu 16.27 14.23 12.32 11.16 10.16 9.04 5.10 4.06 3.37
Table 6.2: Own Tax Revenue and Own Non-tax Revenue as percentage of GSDP
States Own Tax Revenue Own Non-Tax Revenue
1980-81 to
1986-87
1987-88 to
2001-02
2002-03 to
2016-17
1980-81 to
1986-87
1987-88 to
2001-02
2002-03 to
2016-17
Kerala 8.58 8.93 7.51 2.45 1.25 0.94
Andhra Pradesh 8.12 7.29 6.74 2.57 2.21 1.62
Gujarat 7.40 8.03 6.62 2.51 2.64 1.35
Karnataka 8.46 9.03 8.67 3.24 1.99 1.14
Maharashtra 7.79 7.47 6.93 3.04 2.21 1.06
Rajasthan 5.96 6.05 6.50 3.51 2.87 1.96
Tamil Nadu 9.42 8.85 7.82 1.75 1.31 0.98

69
Table 6.3: Composition of Own Tax Revenues
Year Taxes on Income
(Agricultural Income Tax)
Taxes on Property and
Capital Transactions
Taxes on Commodities
and Services
Kerala Major States* Kerala Major States* Kerala Major States*
1980 - 1981 3.36 0.95 8.66 9.26 87.89 89.79
1985 - 1986 2.85 0.99 7.29 9.06 89.86 89.96
1990 - 1991 1.79 1.24 10.22 9.84 87.99 88.91
1995 - 1996 0.77 0.86 11.39 11.52 87.84 87.61
2000 - 2001 0.07 1.28 6.91 9.94 93.03 88.78
2005 - 2006 0.06 0.95 12.19 13.07 87.75 85.98
2010 - 2011 0.22 0.72 12.26 12.81 87.52 86.47
2016 - 2017 0.02 0.58 8.13 12.82 91.85 94.64
* Excluding Kerala
Table 6.4: Taxes on Commodities and Services (As percentage of Own-Tax Revenue)
Year Sales tax State Excise Tax on Vehicles Taxes and Duties on
Electricity
Kerala Major
States*
Kerala Major
States*
Kerala Major
States*
Kerala Major
States*
1980 - 1981 60.60 57.69 19.38 12.32 5.95 6.22 1.92 4.17
1985 - 1986 62.75 56.57 14.25 14.45 6.45 6.08 6.33 5.20
1990 - 1991 66.96 56.49 13.09 16.69 5.53 5.48 2.28 4.67
1995 - 1996 67.58 53.87 13.28 14.50 6.59 6.54 0.22 4.50
2000 - 2001 74.01 60.33 11.74 14.00 6.73 6.05 0.25 4.10
2005 - 2006 71.97 59.20 8.60 11.81 6.43 6.01 0.32 4.16
2010 - 2011 72.89 59.98 7.82 13.17 6.13 5.31 0.10 3.85
2016 - 2017 78.55 66.40 5.10 13.46 7.12 5.56 0.48 4.01
* Excluding Kerala

70
Table 6.5: Taxes on Property and Capital Transactions (As percentage of Own Tax-Revenue)
Year Land Revenue Stamps, Registration Fee Urban Immovable
Property
Kerala Major States* Kerala Major States* Kerala Major States*
1980 - 1981 0.95 2.55 7.68 6.61 0.03 0.10
1985 - 1986 0.80 2.81 6.33 6.19 0.15 0.05
1990 - 1991 0.83 2.69 9.10 7.07 0.29 0.08
1995 - 1996 0.70 2.40 10.46 9.04 0.23 0.08
2000 - 2001 0.67 1.46 5.81 8.41 0.43 0.07
2005 - 2006 0.45 1.50 11.26 11.55 0.48 0.02
2010 - 2011 0.26 1.84 11.75 10.82 0.25 0.16
2016 - 2017 0.41 1.69 7.37 10.92 0.35 0.21
* Excluding Kerala
Table 6.6: Growth of Major Own Tax Revenue Sources (%)
Sales tax/VAT State Excise Tax on Vehicles Stamps, Registration Fee
States 1980-81 to
1986-87
1987-
88 to
2001-
02
2002-
03 to
2016-
17
1980-
81 to
1986-
87
1987-
88 to
2001-
02
2002-
03 to
2016-
17
1980-
81 to
1986-
87
1987-
88 to
2001-
02
2002-
03 to
2016-
17
1980-
81 to
1986-
87
1987-
88 to
2001-
02
2002-
03 to
2016-
17
Kerala 16.80 16.74 15.46 12.88 12.35 10.29 19.30 17.67 14.91 12.96 12.22 13.96
Andhra
Pradesh
20.08 16.91 12.42 20.19 3.26 9.42 16.83 15.54 7.60 13.15 16.99 10.48
Gujarat 14.01 13.40 17.25 9.45 11.63 10.10 14.31 18.84 10.62 8.72 16.86 18.81
Karnataka 17.85 15.26 16.31 13.85 14.58 16.80 17.74 11.21 16.33 14.20 17.54 14.83
Maharashtra 14.24 13.86 14.30 17.95 14.27 16.75 13.54 14.48 15.75 19.47 23.25 16.81
Rajasthan 16.28 14.84 18.00 34.16 17.39 15.16 38.04 15.54 13.04 14.21 19.68 15.59
Tamil Nadu 15.57 15.22 15.86 49.31 21.41 10.44 10.25 11.10 15.24 16.88 15.43 17.79

71
Table 6.7: Buoyancy of Own Tax Revenue
States 1980-1981 to
1986-1987
1987-1988 to
2001-2002
2002-2003 to
2015-2016
Kerala 1.30 0.88 0.91
Andhra Pradesh 1.49 0.87 0.72
Gujarat 1.08 0.88 1.00
Karnataka 1.19 0.91 0.87
Maharashtra 1.27 0.91 0.94
Rajasthan 1.29 0.92 0.96
Tamil Nadu 1.24 0.95 0.88
Table 6.8: Composition of Own Non-Tax Revenue (%)
Year Interest Receipts Dividends &
Profits
General Services Social Service Economic Services
Kerala Major
States*
Kerala Major
States*
Kerala Major
States*
Kerala Major
States*
Keral
a
Major
States*
1980 - 1981 8.95 33.26 0.63 1.46 13.40 15.97 16.45 8.70 60.57 44.92
1985 - 1986 17.00 28.94 0.46 1.66 17.63 13.84 18.30 10.14 46.62 48.29
1990 - 1991 10.26 27.19 1.29 1.93 40.15 19.27 14.89 6.86 33.41 47.15
1995 - 1996 18.73 29.70 1.08 1.76 25.11 27.19 11.38 5.64 43.69 39.85
2000 - 2001 5.59 34.08 1.92 5.02 38.39 18.57 11.65 8.02 42.46 40.23
2005 - 2006 4.95 24.47 1.94 4.07 44.47 20.49 13.30 10.76 35.34 45.07
2010 - 2011 8.88 20.84 3.91 2.96 49.32 18.05 11.98 13.58 25.91 49.33
2016 - 2017 1.52 14.90 1.26 2.18 80.49 17.59 6.01 22.18 10.72 78.44
* Excluding Kerala

72
7 Summary and Recommendations
In this chapter we first summarise the key findings from the analysis of fiscal
imbalances, expenditure management and revenue performance. Next we generate some
projections of the future outlook on Kerala’s finances. Finally we make several
recommendations that may help the state to improve its fiscal performance.
Fiscal Imbalances: Summary of findings
Kerala’s Debt-GDP ratio is the third highest among the comparable states (after Andhra
Pradesh and Rajasthan) in the third phase of accelerated growth (2002-03 to 2016-17). It is
noteworthy that Kerala’s neighbouring states of Tamil Nadu and Karnataka have been able to
control their debt at around 20 per cent of GDP while Kerala’s average debt level over this
phase at over 32 per cent of GDP is far above the 14th Finance Commission’s recommended
level of 25 per cent. Although the debt ratio has been coming down over the years, it is currently
at 27.36 per cent that is considerably higher than the 13 other major states of India for whom
the average figure stands at 23 per cent.
One of the major consequences of having a high debt ratio is the outflow in terms of
interest payments. Kerala’s Interest payments to Revenue receipts ratio in the third phase of
growth (at 20.2 per cent) is the next highest only to Gujarat (20.8 per cent). Within the third
phase, Kerala’s IP/RR has been coming down but at 15 per cent in 2016-17 is considerably
higher than the average figure for 13 major states (12.7 per cent).
Kerala’s gross fiscal deficit is not too high compared with other states but what is of
more serious concern is the quality of the deficit. While the comparison states managed to bring
down their revenue deficit in the third phase of accelerated growth, Kerala’s revenue deficit
remained above 2 per cent. In fact the major states on an average show a revenue balance in
2016-17 while Kerala’s revenue deficit remains rather high at 1.50 per cent in the last year.

73
Moving to another measure of the quality of deficit, the share of capital outlays as a percentage
of gross fiscal deficit for Kerala was 47.86 per cent compared to 86.87 per cent for the average
of 13 states. Kerala’s revenue expenditure as percentage of GDP (14.17 per cent in 2016-17)
is higher than the average figure for 13 states (13.50 per cent in 2016-17). Finally with respect
to the composition of outstanding liabilities, the share of provident funds for Kerala is close to
30 per cent over the second and third phases. This is in complete contrast with the comparison
states where the share of provident funds has mostly come down. While all other components
of outstanding liabilities are lower for Kerala in 2015-16 as compared with the average for the
13 major states, the share of provident funds (25 per cent) is more than twice that of the average
for the 13 states (11.32 per cent).
Expenditure Management: Summary of findings
A lion’s share of public expenditure in Kerala consists of current expenditure. The share
of capital expenditure and outlay has declined overtime. Also, over the years, share of capital
outlay was lower in Kerala than major states as a whole. The key reason for the higher share
of revenue expenditure in Kerala has been the larger expenditure commitment on salaries and
pensions and interest payments. Significantly, as percentage of revenue expenditure, at present
Kerala has highest salary and pension burden among the comparable states.
The total public expenditure of Kerala has declined overtime as a percentage of state
GDP due to cut in both revenue expenditure and capital expenditure and outlay. In contrast,
majority of the comparable states curbed total expenditure without compromising on capital
outlay. Kerala spends disproportionally more on social services than economic services. As
percentage of GSDP, the total expenditure on social and economic services has declined
significantly in Kerala overtime, including during the phase of high economic growth from
2002-03. Similar trend was evident among the comparable states and the major states as a

74
whole. However in Kerala, contrary to the trends in the comparable states, the expenditure on
capital formation in the crucial social services has declined both during moderate and
accelerated economic growth phases.
As percentage of GSDP the total expenditure incurred by Kerala on several social and
economic services namely education, public health, housing, agriculture and allied activities,
irrigation, and industry and minerals has declined during the phase of accelerated economic
growth. With the exception of housing, similar trend was witnessed in the case of comparable
states as well. As regards the expenditure on capital formation in these individual heads, it has
declined during the phase of accelerated economic growth in Kerala. In the comparable states
as well this trend was registered with the exception of education and public health. The capital
expenditure and outlay on education and public health has increased in the comparable states,
by and large, during the accelerated economic growth period.
A lion’s share of expenditure on social services in Kerala and major states as a whole
consists of current expenditures. However, in the case of economic services the share of capital
expenditure and capital outlay was much higher both in Kerala and major states put together.
Also, since the second half of the last decade the share of capital outlay on economic services
has increased significantly in Kerala.
Revenue Performance: Summary of findings
Total revenues of Kerala experienced a declining trend as percentage of state GSDP
overtime. All components of revenues of Kerala and comparable states (except own tax
revenues in case of Rajasthan) namely own tax revenues, own non-tax revenues and central
transfers have declined significantly as percentage of GSDP during the accelerated economic
growth phase compared with the phase of moderate economic growth. This result suggests that
relative to states’ economic progress and increase in revenue base namely GSDP, the revenue

75
performance of Kerala and comparable states have not improved. This is a serious cause for
concern. Among comparable states, as percentage of GSDP, Kerala witnessed largest decline
in total revenues and own tax revenues during accelerated economic growth phase.
An analysis of composition of Kerala’s own tax revenue reveals that only a handful
number of tax handles contribute to public revenue mobilisation in the state meaningfully. They
include sales tax/value added tax, state excise duties, motor vehicle tax, and stamps and
registration fees. However, the huge drop in the share of state excise duties and stamps and
registration fees in the own tax revenues over the years and in the recent past respectively is a
serious cause for concern.
All major own tax revenue sources namely sales tax/VAT, state excise duties and motor
vehicle tax grew at a lower rate in Kerala during the phase of accelerated economic growth
compared with the phase of economic stagnation. Moreover, the buoyancy of own tax revenue
was lower than the desired level in Kerala during the phase of economic stagnation as well as
the phase of accelerated economic growth.
Regarding non-tax revenue mobilization, the major concerns facing Kerala are
negligible contribution by way of dividends and profits from state public sector enterprises and
consistently falling contribution from economic and social services.
Future Scenario
Give the current state of affairs we attempted to generate projections of Kerala’s public
finances over the coming years which would give us a glimpse into what lies ahead. For this
purpose we created several scenarios in order to study the possible trajectories of the key
expenditure, receipts and deficit variables in the future. We begin with our baseline projections
which are based on the assumption that all the variables will grow at the same rate that they
have been exhibiting in the third phase of growth i.e. 2002-03 to 2016-17. In other words we

76
computed the CAGR of each variable during this phase and assumed that the variables would
grow at this rate in the future too (except for share in central taxes and grants from centre which
exhibited a surge in 2015-17 and 2016-17 respectively due to a change in the devolution model
– in these cases we computed the CAGR till the year before the change in the devolution
model). The baseline projections of key variables are presented below in Table 7.1. We can see
that the revenue deficit will eventually disappear if things ‘go on as usual’ but will take a long
time i.e. till 2030 before that happens. Fiscal deficit would remain at the current level of 3.1
per cent in 2030 but this is not a scenario that the state would like to see itself in because the
deficit would keep adding to the debt and squeezing the fiscal space for capital spending.
Table 7.1: Baseline projections (business as usual scenario)
Year Revenue
Exp.
Own Tax
Revenue
Share
in
Central
Tax
Own
Non Tax
Revenue
Grants
from
Centre
GSDP Reven
ue
Deficit
(% of
GSDP)
Capital
Outlay
Net
Lending
Fiscal
Deficit
(% of
GSDP)
Assum-
ption
CAGR
14.99%
CAGR
14.76%
CAGR
13.8%
CAGR
23%
CAGR
13%
CAGR
14.4%
As per
defn.*
CAGR
21.2%
CAGR
9%
As per
defn.#
2017-18 108082 53986 17328 13365 12201 758863 1.48 11603 581 3.08
2018-19 124287 61952 19721 16448 13796 868117 1.42 14063 633 3.12
2019-20 142921 71094 22445 20243 15599 993101 1.36 17045 691 3.15
2020-21 164349 81585 25545 24913 17638 1136079 1.29 20660 753 3.18
2021-22 188990 93624 29073 30661 19944 1299642 1.21 25041 821 3.20
2022-23 217325 107439 33089 37734 22552 1486753 1.11 30351 895 3.21
2023-24 249909 123294 37659 46440 25500 1700803 1.00 36787 976 3.22
2024-25 287378 141487 42860 57154 28833 1945671 0.88 44588 1064 3.22
2025-26 330464 162366 48780 70339 32603 2225792 0.74 54043 1160 3.22
2026-27 380011 186325 55517 86567 36865 2546242 0.58 65503 1265 3.20
2027-28 436985 213820 63185 106538 41684 2912828 0.40 79393 1379 3.18
2028-29 502503 245373 71912 131117 47134 3332192 0.21 96229 1504 3.14
2029-30 577843 281581 81844 161367 53295 3811933 -0.01 116635 1640 3.10

77
* Revenue deficit projections are calculated (as per definition) as revenue expenditure minus sum of all revenue
receipts as percentage of GSDP
# Fiscal deficit projections are calculated (as per definition) as the sum of revenue deficit, capital outlays and net
lending as percentage of GSDP
Next we generate projections for a different scenario which is based on the assumption
that the variables will continue to grow at the same rate at which they have grown in the past
five years. This scenario considers the CAGR computed for the last five years to be more
realistic for projecting the future than the last fifteen years as was done in the baseline
projections above. As before, in the case of share in central taxes and grants from centre, we
computed the CAGR till the year before the change in the devolution model. The results are
shown in Table 7.2. The results show that the revenue deficit gallops to over 3 per cent in a
short span of five years while the fiscal deficit crosses 5 per cent in 2022. This scenario would
be extremely damaging to the state’s finances and needs to be avoided. Therefore the state
certainly cannot afford to carry on with the trends of the past five years and needs to urgently
boost revenues and cut down on the growth in expenditure.
Table 7.2: Pessimistic projections (worst case scenario)
Year Revenue
Exp.
Own
Tax
Revenue
Share
in
Central
Tax
Own
Non Tax
Revenue
Grants
from
Centre
GSDP Revenue
Deficit
(% of
GSDP)
Capital
Outlay
Net
Lending
Fiscal
Deficit
(% of
GSDP)
Assum-
ption CAGR
15.4%
CAGR
11.8%
CAGR
7.6%
CAGR
26.7%
CAGR
6.6%
CAGR
12.5%
As per
defn.*
CAGR
20.8%
CAGR
-18.8%
As per
defn.#
2017-18 108435 52593 16389 13763 11503 746541.17 1.90 11501 433 3.50
2018-19 125100 58796 17641 17443 12263 840155.28 2.26 13818 351 3.94
2019-20 144325 65731 18990 22108 13074 945508.32 2.58 16601 285 4.37
2020-21 166506 73484 20441 28019 13938 1064072.32 2.88 19944 232 4.77
2021-22 1251927 82152 22003 35511 14859 1197504 3.14 23961 188 5.15
* Revenue deficit projections are calculated (as per definition) as revenue expenditure minus sum of all revenue
receipts as percentage of GSDP
# Fiscal deficit projections are calculated (as per definition) as the sum of revenue deficit, capital outlays and net
lending as percentage of GSDP

78
Finally we generate projections for a scenario where the revenue deficit gets wiped out
in a year’s time. This is based on a modification of the baseline projections where we assume
that own tax revenue growth and non tax revenue growth can be raised by a modest 2 per cent
while growth in revenue expenditure can be cut by a modest 2 per cent. The results are shown
in Table 7.3. The results show that the revenue deficit will disappear by 2020-21 while the
fiscal deficit will slip below 2 per cent. This is even after leaving scope for capital outlays to
grow by additional 5 per cent compared to the baseline projections.
Table 7.3: Optimistic projections (best case scenario)
Year Revenue
Exp.
Own Tax
Revenue
Share
in
Central
Tax
Own
Non Tax
Revenue
Grants
from
Centre
GSDP Revenue
Deficit
(% of
GSDP)
Capital
Outlay
Net
Lending
Fiscal
Deficit
(% of
GSDP)
Assum-
ption
CAGR
14.99%
reduced
to
12.99%
CAGR
14.76%
increased
to
16.76%
CAGR
13.8%
CAGR
23%
increased
to 25%
CAGR
13%
CAGR
14.4%
As per
defn.*
CAGR
21.2%
increased
to 26.2%
CAGR
9%
As per
defn.#
2017-18 106202 54926 17328 13582 12201 758863 1.08 12082 581 2.74
2018-19 120001 64130 19721 16987 13796 868117 0.62 15248 633 2.45
2019-20 135593 74876 22445 21246 15599 993101 0.14 19243 691 2.15
2020-21 153210 87423 25545 26572 17638 1136079 -0.35 24286 753 1.85
* Revenue deficit projections are calculated (as per definition) as revenue expenditure minus sum of all revenue
receipts as percentage of GSDP
# Fiscal deficit projections are calculated (as per definition) as the sum of revenue deficit, capital outlays and net
lending as percentage of GSDP
But how can the state aspire for this best case scenario or at least come close to it? In
the next section we make several suggestions which can reverse the direction of Kerala’s
finances and bring it close to an optimistic trajectory where revenue account will show a surplus
that can help the fiscal deficit to also come down in spite of a boost in capital spending that is
urgently required for the state to improve its long term productivity and growth.

79
Recommendations for rationalising expenditure
1) Sound public expenditure management requires the governments to devote a major
part of their spending to capital asset creation, called capital expenditure and lesser part to
unproductive current expenditures such as (poorly targeted) subsidies and military
expenditures (Greene 2012). Contrary to this general principle, a substantial portion of public
expenditure in Kerala consists of current expenditure. Also, the expenditure on capital
formation in several social and economic services namely education, public health, housing,
agriculture and allied activities, irrigation, and industry and minerals has declined during the
phase of accelerated economic growth. This is certainly not a healthy trend as sufficient amount
of capital spending is also required to ensure adequate physical and social infrastructure to
support economic activities. It has been estimated that governments in the fast growing
countries including some Asian countries ideally spend around 5 to 8 per cent of GDP on
physical infrastructure and human capital development (CGD 2008). Considering this level,
the amount spend by Kerala on capital asset creation is highly inadequate. Hence there is an
urgent need for increasing the share of capital expenditure and outlay in the total expenditure,
including in the social sector especially in view of the demand-supply mismatch in social
services such as education and health care. Higher capital spending would also be required to
address the host of emerging problems unique to Kerala such as due to urbanization and an
ageing population. These include waste management, environmental conservation, water
management, life style diseases and old age care.
2) To finance meaningful programmes which contribute to capital formation in the
state, the government need to identify “fiscal space” without compromising its fiscal position
(Heller 2005). Fiscal space can be created through a combination of cut in expenditure on
ongoing or low-priority programmes, revenue increases and debt funds. For instance, a part of

80
the funds raised through the KIIFB route comes from 1 per cent cess on petrol and 10 per cent
of the tax collected from the motor vehicles tax.
3) Though higher capital expenditure and outlay is desirable, costly capital investment
projects which have heavy political overtone and benefits only a small section of the population
have to be avoided. Instead, focus must be on projects whose social benefits exceed their
economic costs (Greene 2011).
4) To control current expenditure, efforts have to be taken to rationalise the size of
government workforce thereby reducing the expenditure on salaries and pensions. This is
especially important since we found that salaries, pensions and interest expenses form the
major share of revenue expenditure in Kerala and is the highest among the comparable states.
The government, instead of acting as employer of last resort, has to generate more jobs in the
private sector by way of creating an appropriate environment for the private sector to operate.
Also, the practice of appointing large number of temporary staff (also called contract
employees) that too in a non-transparent manner in various government departments, public
sector enterprises (PSEs), and quasi-government institutions have to be discontinued.
Appointment of large number of temporary staff not only bloats salary payments but also
restricts the size of highly skilled workforce such as economists, budget analysts and lawyers
specialised in taxation needed for analytical, regulatory and policy positions (Greene 2011). A
recent review by Kerala State Finance Department has found that around 30,000 excess posts
have been created in various in various government departments, PSEs, Corporations and

81
Boards, of which majority are temporary employees.16 The government may put a freeze on
recruitment except for essential services and explore outsourcing or contracting or public
private partnership modes of functioning wherever possible. In view of the high share of
pensions in Kerala’s total outstanding liabilities which is going to worsen with an increasingly
ageing population, it may be prudent to raise the retirement age in the state.
5) Adopt performance budgeting, which involves setting goals for each government
scheme, assessing how well particular schemes achieve them and terminating ineffective and
low priority schemes in favour of better ones. Countries such as Chile and the United Kingdom
have achieved significant success in containing the growth of public expenditure using this
tool.
6) Adopt zero-based budgeting in which at the time of preparing annual budget each
government programme would be viewed as new and therefore has to be justified by the
concerned department for their continuity. Thus, unlike the normal budget making exercise,
zero based budgeting does not involve reviewing of requests made by various departments for
additional allocation of budgetary funds for various schemes under them. Outcome budgets can
be included in the annual budgetary exercise to link outlays with quantifiable deliverables or
outcomes.
16 Also, it has been reported that large number of temporary staff are appointed by the heads of departments of
various government arms in gross violation of norms, which require reporting of such appointments to the Public
Service Commission. This has given rise to allegations of corruption and nepotism in the appointment of
temporary staff. For details, see ‘Temporary staff postings come under scanner’, The Hindu, May 30, 2016, cited
at http://www.thehindu.com/todays-paper/tp-national/tp-kerala/temporary-staff-postings-come-under-
scanner/article8665143.ece; and ‘10,000 contract staff may lose their jobs in Kerala’, The Hindu, September 16,
2014, cited at http://www.thehindu.com/news/national/kerala/10000-contract-staff-may-lose-their-jobs-in-
kerala/article6415110.ece

82
7) Programmes, say multiple social welfare programs, with similar nature could be
identified and merged to curb outlays. This would also help in achieving economies of scale in
expenditure.
8) The government can improve the control over expenditure through appropriate
targeting of beneficiaries of various government social welfare programmes. For instance,
Singapore achieved significant reduction in health care expenditure by discouraging
economically well-off patients from using public hospitals (Greene 2011). This was done by
giving more subsidies for those using lower-class rooms and less or no subsidies for those using
higher-class rooms in the public hospitals.
9) Governments quite often incur expenses indirectly mainly through public agencies,
called off-budget or quasi-fiscal spending. Examples are tax expenditures17, losses of state
owned enterprises, lending by public sector banks to specific set of borrowers at below market
interest rates and expenditures due to bank recapitalization. Compared to the regular budget
expenditures, off-budget spending is less transparent and difficult to control and quantify.
To avoid expenditure overruns, off-budget expenditures have to be controlled or
minimized. Recently, the Kerala government has decided to raise funds for infrastructure
development mainly from non-resident Keralites through an off-budget route namely Kerala
Infrastructure Investment Fund Board (KIIFB). In the state budget for the financial year 2017-
18 it was informed that projects worth of Rs.4004 crore was approved under the KIIFB route.
Another set of projects amounting Rs. 11000 crore was proposed to be approved before the end
of the current financial year. The funds raised under KIIFB may turn out to be a liability if the
17Tax expenditures are revenue losses incurred by the government due to special provisions such as exemptions,
tax holidays, and deductions offered in a tax code.

83
projects which are funded through the initiative fail to guarantee sufficient return on
investment. To safeguard the government from KIIFB’s liabilities, the selected projects under
KIIFB should be focused in areas that would generate direct economic returns e.g. tourism, toll
roads or bridges, industry or agro-processing parks.
10) With the goal of controlling overall expenditure, many governments including some
in advanced countries often cut or deter the budgetary allocation on operations and
maintenance. This would not only adversely affect the quality of government services18 but
also reduces the longevity of buildings and physical infrastructure built by the government,
thereby requiring the government to find additional budgetary resources for the replacement of
worn out assets. Therefore, while designing or reviewing expenditure policy adequate emphasis
must be given on operation and maintenance of government facilities created in the past. This
will not only enhance the life of such assets but also reduce the need for incurring additional
spending for the replacement of worn out assets at frequent intervals. For instance, it has been
reported that half of the low floor buses of Kerala Road Transport Corporation (KSRTC) have
been abandoned in the yard as they became inoperative due to the unavailability of spare parts
and lack of maintenance.19
11) Loan/credit guarantees extended by the government on loans raised by PSEs, local
authorities, statutory boards, corporations, and co-operative institutions has to be based on
proper assessment of cost-benefits associated with the projects and ranking of net present value
of the projects. Also, it is desirable to limit loan guarantees only to creditworthy PSEs.
18Shortage of medicines and medical equipment in public hospitals and of amenities and facilities in public parks
are good examples of deteriorating quality public services.
19 As reported in Malayala Manorama, August 19, 2016

84
12) Privatization/corporatization of public sector enterprises which are loss making and
are operating in areas in which government has no comparative advantage can save substantial
amount of public money that could be spend on other productive purposes.
13) A comprehensive review of pay and employment policy with respect to government
employees has to be undertaken. Among others, the review can consider introduction of
incentive pay or bonuses for employees who demonstrate exceptional public service, providing
more functional autonomy to civil servants, reducing political staffing in ministries and
introducing robust anti-corruption measures (Greene 2012).
14) The subsidy burden of Kerala, though low, has been increasing consistently over
the years. This requires rationalisation of subsidies. A good subsidy program is characterized
by the following features
(a) The subsidy amount has to be provided explicitly to the beneficiaries so that they
can purchase the subsidized good or service directly from private firms on the condition that
the private firms sell the good or service at a price fixed by the government. This would make
subsidies more transparent and controllable. On the other hand implicit subsidies, which
involve supply of subsidized goods or services through state-owned enterprises (SOEs), can
result is numerous challenges and inefficiencies associated with the management and
functioning of SOEs.
(b) To a larger extent possible, subsidies have to be paid only to the targeted
beneficiaries so as to avoid the situation of benefits reaching the unintended recipients.
(c) A subsidy scheme has to be designed in such a way that the running of the scheme
is subject to annual renewal and to allocation of funds through the budget process. Such a
scheme is easy to manage and helps to control government expenditures. If possible, a subsidy
program can also include a sunset clause though it may be difficult in practice.

85
(d) The financing pattern of a subsidy scheme has to be transparent in the sense that the
outlays for the scheme has to be channelled through the regular budget process rather than
through indirect ways such as tax expenditures and subsidized sale of goods and services via
SOEs.
(e) The economic distortions generated by subsidy have to be minimum.20 This is
possible to a larger extent if subsidies are provided for broad categories of goods and services,
say for example subsidy for cultivation of food crops rather than for only wheat and rice. Such
a subsidy system would encourage farmers to choose from a range of food crops thereby
enhancing competition in the food market.
Recommendations for improving revenues
1) One of the principles governing a sound government revenue or tax system is that,
during normal times, the revenue system should be able to generate adequate funds for the
government to meet its expenditure obligations and to keep the budget deficits at an acceptable
level (Greene 2012; DFID 2009). In short, revenue systems have to raise revenues in tune with
changes in the economy.
Viewed from this angle, there is a serious need to strengthen own tax revenue
mobilization in Kerala. In a state which has been witnessing faster economic growth and retains
top position in per capita consumer expenditure, the decline in the growth of major own tax
revenue sources namely sales tax/VAT, state excise duties and motor vehicle tax is undesirable.
Also, in the backdrop of the property and real estate boom the state has been witnessing and
the alarming rise in the motor vehicle population in the state, the lacklustre performance of the
20 An example of distortion caused by subsidy is the overexploitation of ground water due to subsidised electricity
supply to the farm sector.
86
two own revenue sources namely stamps and registration fees and motor vehicle tax over the
years has to be examined thoroughly and corrective actions have to be taken accordingly.
For instance, revenue from these sources can be enhanced by way of rationalisation of
tax/duty structure, use of technology, keeping accurate and updated registries of property
values and improving property records by way of proper monitoring of property sales. In fact
recent experiences with rationalisation of stamps and registration fees and motor vehicles tax
in the state support such policy actions (see Box 7.1). Also, the e-stamping facility followed in
many states such as Uttarakhand, Tamil Nadu and Karnataka can be introduced to prevent
malpractices in land registrations. The e-stamping is a web-based, secure, tamper-proof system
involving payment of stamp duty to the government by electronic means. The other advantages
of the e-stamping system are faster and transparent method of stamp duty payment, verification
by the user and the government, easy availability of stamp papers, prevention of corruption,
fake stamp paper circulation and fleecing by vendors.21
21 Though the Kerala government approved an amendment to the Kerala Stamp Act, 1959 in June 2015 to facilitate
introduction of the e-stamping in the state, the policy is yet to be implemented. For details, see ‘e-stamping to be
introduced in State’, The Hindu, June 25, 2015 (Available at http://www.thehindu.com/todays-paper/estamping-
to-be-introduced-in-state/article7352364.ece).

87
Box 7.1: Revenue impact of Rationalisation of Stamp Duties and Motor Vehicle Tax in Kerala
In the state budget announcement in March 2010, the Kerala government viewed the prevailing
stamp duty in the state to be on the higher side and hence reduced the effective rate of stamp duty,
surcharge and registration fee in Corporation areas from 15.5 to 11 per cent; in
Municipality/Township/Cantonment areas from 14.5 to 10 per cent; and in Grama Panchayath from 12
to 9 per cent. The impact of this reform measure on the revenue from stamps and registration fees was
encouraging. As a percentage of state GDP, the revenue from this category has increased in the year
2010-11 i.e. the year of implementation of duty rationalisation (see Table 7.4). Also, in terms of growth
and as a percentage of own tax revenue, the revenue from this source has improved markedly during
2010-11 (see Figure 7.1 and Table 7.4). This suggests that the earlier rates were towards the right of the
optimal point of the Laffer curve and its reduction actually helped to raise revenues. However, the
revenue growth stagnated in the subsequent years till a further rationalisation exercise was carried out
in 2014, as per which the stamp duty for the three local body categories was merged into a single rate
of 6%. This resulted in a sharp increase in the revenues in 2014-15.
0.00
2.00
4.00
6.00
8.00
10.00
12.00
14.00
16.00
200
0 -
200
1
200
1 -
200
2
200
2 -
200
3
200
3 -
200
4
200
4 -
200
5
200
5 -
200
6
200
6 -
200
7
200
7 -
200
8
200
8 -
200
9
200
9 -
201
0
201
0 -
201
1
201
1 -
201
2
201
2 -
201
3
201
3 -
201
4
201
4 -
201
5
201
5 -
201
6
Figure 7.1: Revenue from Stamps and Registrtion Fees in Kerala
(As percentage of own tax revenues)

88
Table 7.4: Revenue from Stamps and Registration Fees in Kerala
As regards motor vehicles tax, the receipt from this source has witnessed a substantial increase
from 2012-13 onwards thanks to rationalization of motor vehicles tax structure (see Figure 7.2 and
Table 7.5). Prior to 2012-13, the road tax in respect of motor vehicles for personal use was based on
combination of the volume and purchase value of the vehicle. From 2012-13 onwards, this was changed
to a road tax based only on the purchase value.
Year Growth rate (%) As percentage of GSDP
2000 - 2001 7.91 0.47
2001 - 2002 14.55 0.51
2002 - 2003 0.09 0.56
2003 - 2004 2.02 0.57
2004 - 2005 27.26 0.65
2005 - 2006 30.22 0.80
2006 - 2007 13.00 0.99
2007 - 2008 16.57 1.16
2008 - 2009 -15.57 0.99
2009 - 2010 -14.10 0.82
2010 - 2011 9.21 0.97
2011 - 2012 -1.18 0.82
2012 - 2013 -15.87 0.71
2013 - 2014 -17.04 0.56
2014 - 2015 32.67 0.72
2015 - 2016 0.53 0.74
0.001.002.003.004.005.006.007.008.009.00
200
0 -
200
1
200
1 -
200
2
200
2 -
200
3
200
3 -
200
4
200
4 -
200
5
200
5 -
200
6
200
6 -
200
7
200
7 -
200
8
200
8 -
200
9
200
9 -
201
0
201
0 -
201
1
201
1 -
201
2
201
2 -
201
3
201
3 -
201
4
201
4 -
201
5
201
5 -
201
6
Figure 7.2: Revenue from Motor Vehicles Tax in Kerala
(As percentage of own tax revenues)

89
Table 7.5: Revenue from Motor Vehicles Tax in Kerala
2) Only few tax sources contribute to public revenue mobilisation in Kerala. Hence,
there is a need to tap all the existing tax sources adequately. Tax sources namely land revenue,
urban immovable property tax, entertainment tax and taxes and duties on electricity have to be
adequately tapped. Also new tax and non-tax sources with good revenue potential can be
identified and taxed. One good example is the “Fat Tax” imposed in the state from the year
2016-17 on junk food items such as burgers, pizza, donuts and sandwiches sold in branded
restaurants. The state must introduce a more prudent liquor policy which taxes premium brands
at higher rates that will generate revenues not only from domestic high income consumers but
also from tourists and business visitors. Mega sporting events can be organised in different
parts of the state (e.g. football or volleyball which are popular sports among locals) leading to
Year Growth rate (%) As percentage of GSDP
2000 - 2001 -8.27 0.54
2001 - 2002 13.49 0.58
2002 - 2003 -7.94 0.59
2003 - 2004 3.05 0.61
2004 - 2005 -5.95 0.51
2005 - 2006 -5.63 0.46
2006 - 2007 -7.79 0.46
2007 - 2008 5.32 0.49
2008 - 2009 -6.07 0.46
2009 - 2010 9.47 0.49
2010 - 2011 -4.49 0.50
2011 - 2012 0.68 0.44
2012 - 2013 3.69 0.47
2013 - 2014 5.55 0.46
2014 - 2015 15.23 0.52
2015 - 2016 -0.54 0.53

90
generation of economic activity and tourist inflow which in turn will generate tax and non-tax
revenues (including collection of license fees from the organisers). Tapping new potential
revenue sources will also enable low rates for each tax thereby improving tax compliance
(Greene 2011).
3) The secular decline in the contribution of excise duties in Kerala’s own tax revenues
demands a detailed analysis of excise revenue system of Kerala. This is all the more important
considering the facts that Kerala is one of the biggest beer, wine and refined/ foreign liquor
drinking states22 in the country and that the decline in excise revenue has started long time
before the introduction of graded prohibition in the state August 2014.
4) Serious efforts have to taken to avoid/reduce tax evasion. Experience across the
globe suggests that, apart from strong policy actions such as investigations, audits, imposition
of penalties and asset seizures, the fight against tax evasion should also involve putting in place
a tax system aimed at reducing the incentives for tax evasion (Greene 2011). This may be
achieved with a tax system characterised by a broad base, low rates23, limited exemptions, easy
compliance and effective use of big data and technology. In this context, it is important to note
that the Economic Intelligence Wing set up by Kerala in the year 2013-14 for detecting and
taking action on tax evasion seems to have produced positive results in the form of improved
own tax revenue mobilisation (see Box 7.2). Also, as a measure to check tax evasion, in the
state budget for the year 2017-18 it was announced that smart surveillance cameras would be
installed at the state border roads and bye-routes to capture the goods vehicles which have not
uploaded their invoices showing payment of integrated GST (IGST) to the GSTN portal. More
use of technology is therefore needed to check tax evasion. For instance, the information
22 Next to Goa and Andhra Pradesh, Kerala is the biggest beer, wine and refined/foreign liquor drinking state with
a consumption figure of 102 ml per capita per week in 2011-12. For details, see ‘India’s biggest drinkers’, The
Hindu, August 23, 2014 (Available at: http://www.thehindu.com/opinion/blogs/blog-
datadelve/article6344654.ece) 23 Lower tax rates will also encourage informal economies to formalise thereby increasing the tax revenues.

91
technology prowess of the state can be effectively utilised to gather and analyse the big data on
commercial (including property) transactions in order to identify potential areas of tax evasion
and take necessary policy action.
5) Avoid granting tax amnesty to the tax payers. Notwithstanding the revenue potential
of such a tool, in the long run it can reduce the incentive to pay taxes due to the anticipation of
amnesty schemes in future. In both 2016-17 and 2017-18 budgets Kerala declared amnesty
schemes for value added tax dealers.24 Offering of tax amnesty within such a short interval is
certainly not a healthy trend. The state should declare an end to granting any such amnesty.
Box 7.2: Impact of formation of Economic Intelligence Wing
In the Commercial Taxes Department of Kerala it was found that the mechanism present in the
Department for collection and analysis of import data and sharing of the same with assessing officers
for cross verification was ineffective. As a result, dealers were indulging in suppression of import
purchase turnover. The Accountant General of Kerala has recommended formation of dedicated teams
to create, maintain and update a Data Ware House using information gathered from both within and
outside the Department. In response, the Government of Kerala has set up an Economic Intelligence
Wing (EIW) in the Commercial Taxes Department in the year 2013-14 for collecting effective market
intelligence to study, identify and detect tax evasion in the state. The efficiency and effectiveness of the
EIW can be traced in the upward movement in the own tax revenue collection in the subsequent years
(see Table 7.6).
24 For details see the Budget Speech 2017-18 available at
http://www.finance.kerala.gov.in/index.php?option=com_content&view=article&id=573:kerala-budget-2017-
18&catid=18:state-budget

92
Table 7.6: Revenue from Own Tax Revenue in Kerala
6) For major tax sources the two effective tax mobilisation instruments namely
withholding of tax at source and estimated tax payments can be introduced. These two
instruments have proved to be valuable for tax resource mobilisation in many countries. For
instance, incentivising advance payments of VAT on the basis of annual turnover of the dealers
can increase tax collection and compliance. Also, the tax liability of assessees during the year
can be estimated in advance and collected periodically from them. This will not only reduce
the pressure on meeting the tax collection targets at the year-end but also preserve the real value
of tax revenue against inflation.
Year Growth rate (%) As percentage of
GSDP
2000 – 2001 13.03 8.08
2001 – 2002 0.91 7.60
2002 – 2003 23.28 8.40
2003 – 2004 10.77 8.36
2004 – 2005 10.82 7.52
2005 – 2006 9.09 7.15
2006 – 2007 22.12 7.77
2007 – 2008 14.46 7.80
2008 – 2009 16.98 7.89
2009 – 2010 10.22 7.60
2010 – 2011 23.24 8.23
2011 – 2012 18.40 7.06
2012 – 2013 16.95 7.29
2013 – 2014 6.38 6.88
2014 – 2015 10.12 6.69
2015 - 2016 13.20 6.81
2016- 2017 17.96 7.14

93
7) Engage the tax administrators to mobilise revenue from sources or lucrative tax
payers that provide substantial revenue. Special administrative units can be established within
the tax department focusing on large tax payers or major revenue earners.
8) One useful way to prevent and reduce tax evasion is to offer cash rewards to citizens
for sharing information on tax evaders with the tax department (Greene 2011). The best
example of the reward system of this kind is the Tax Relief and Health Care Act of 2006 in the
United States, which offers cash rewards amounting 15-30 per cent of the recovered tax amount
totalling $2 million or more. However, such a programme should be backed by strong legal
provisions not only to protect the tax payers from searches and harassment by the tax officials
on the basis of unsubstantiated information provided by the whistle-blowers but also to protect
the whistle-blowers from the targets of tax defaulters.
9) Ensure that the government collects a fair share of the income or profits generated in
the natural resource based industries such as granite mining operations. There have been reports
of widespread evasion of royalty by quarry owners in the state. For instance, recently the
Revenue Department has found that many granite quarries in the Idukki district of Kerala were
indulging in illegal mining causing heavy loss to the exchequer in terms of royalty payment.25
10) Review, strengthen and update current tax administration with the goal of
increasing efficiency, simplifying and improving compliance, thereby raising the additional
revenues. Effective tax administration depends on following elements (Greene 2012). First, the
tax law should be simpler to administer with fewer tax rates, exemptions, allowances and
special provisions. The key benefit from a simpler law is broader base, lesser distortions to
economic incentives and activity and better tax compliance. Complex tax system discourages
25 See ‘Now, quarries in Kerala's Munnar blow rules sky-high’, The New Indian Express (Cited at
http://www.newindianexpress.com/states/kerala/2017/mar/27/now-quarries-in-keralas-munnar-blow-rules-sky-
high-1586270.html).

94
investments by firms or encourages them to run their business informally or illegally. This
would undermine the prospects for economic growth and job creation. Second, the tax
department has to be equipped with skilled, committed and honest staff. Third, the tax system
should be designed in such a way as to promote voluntary tax compliance by the tax payers.
Some of the important ingredients of such a system are: simple and stable tax laws, supply of
sufficient and timely information to tax payers, continuous efforts to education the taxpayers,
productive engagement with tax payers and business associations by tax department26,
establishing systems which automatically detect non-compliance, and provision for impartial
and timely appeals. Fourth, the employees of the tax department have to be provided with
modern equipment and facilities27 and sufficient legal support28 to perform their duties. Fifth,
the tax administration must be capable of raising revenues at minimum administrative and
compliance cost. Sixth, the discretionary authority of the tax administration has to be used in a
fair and transparent manner. For instance, revenue authorities should desist from extracting
bribes from the taxpayers or undermining the due process of the law while pursuing the cases
of tax evasion.
11) There is a serious need to enhance own non-tax revenues in Kerala particularly the
dividends and profits from state PSEs and user charges from economic and social services.
Revenue from user charges can be increased only if the state shows the willingness to
periodically increase user fees, charges, and penalties commensurate with the pace of inflation.
Potential sources of revenue in this sphere are raising tuition fees for public universities,
26 If tax payers are subject to appropriate treatment by tax authorities such as freedom from harassment and no
special tax privilege to a particular section of the taxpayers, it helps to put in place an effective tax system based
on citizens’ consent (Greene 2012; DFID 2009)..
27 It has been reported that in the Excise check-posts in Kerala the only instrument available to the officials to
examine the consignments is iron rod. To check whether spirit is hidden inside a truck, iron rod is used to pierce
the load, usually in sacks, which may not work for all consignments (See ‘No integrated check-post at Aryankavu
now: Babu’, The Hindu, September 19, 2012). 28 Quality legal support is important for tax officials to present a strong case before the judiciary in cases relating
to tax disputes with businesses.

95
penalties for violation of traffic rules, and admission fees for museums and public recreation
facilities. Being a global tourist destination, there is considerable potential of collecting higher
user fees (with premium pricing for foreign tourists) at several tourist destinations across the
state (e.g. beaches, wildlife parks, heritage buildings, museums). Introducing online booking
and digital payments for collecting user fees can reduce leakages and increase revenues. The
charging of appropriate amount of user fees and charges may also incentivise the citizens to
use public amenities more carefully.
Revenue from PSEs can be enhanced by increasing their profitability, which can be
made possible with the following reforms (Greene 2011). First, restructure the PSEs with the
goal of making them operate in a commercial manner to the maximum extent possible and
limiting their losses. Second, reduce political interference in the functioning of PSEs. Third,
impose hard budget constraints on loss-making PSEs by way of reducing government
budgetary transfers and putting in place stricter performance norms for assessing bank
borrowing requests from PSEs. Finally, privatise those enterprises which are not operating in
the domain of public/essential goods. This way the government could not only realise some
money but also reduce spending on non-essential PSEs. As per latest reports 58 of the 117
PSEs in Kerala are loss-making companies among which KSEB and KSRTC incur the major
share of the total losses.29 Such companies need to undergo a process of restructuring which
can include infusion of professional management to stock listing and employee stock options
and in the extreme case, privatisation.
12) Considering that revenue from the sale of state lotteries (general services) constitute
a significant portion of Kerala’s own non-tax revenue, efforts have to be made to consolidate
and expand the gains from this revenue source. For instance, the decision to introduce daily
29 http://newsable.asianetnews.tv/south/ksrtc-biggest-loss-making-psu

96
lotteries in 2011-12 paved the way for huge rise in collection of revenue from lotteries as
evident from Figure 7.3 and Table 7.7. More such innovative steps have to be undertaken. One
possible option could be the introduction of e-lottery system as in the state of Arunachal
Pradesh. The Goa model of setting up offshore casinos in select tourist destinations can be
explored to mobilise revenues from tourists.
Table 7.7: Revenue from General Services in Kerala
Year Growth rate
(%)
As percentage of GSDP
2000 – 2001 20.12 0.35
2001 – 2002 -14.21 0.28
2002 – 2003 20.68 0.30
2003 – 2004 17.21 0.32
2004 – 2005 -0.63 0.26
2005 – 2006 36.55 0.30
2006 – 2007 -5.92 0.25
2007 – 2008 34.22 0.30
2008 – 2009 55.44 0.40
2009 – 2010 22.76 0.43
2010 – 2011 -5.14 0.36
2011 – 2012 70.58 0.45
2012 – 2013 91.19 0.75
2013 – 2014 36.15 0.91
2014 – 2015 47.01 1.18
2015 - 2016 11.98 1.19
0
10
20
30
40
50
60
70
80
90
20
00
- 2
00
1
20
01
- 2
00
2
20
02
- 2
00
3
20
03
- 2
00
4
20
04
- 2
00
5
20
05
- 2
00
6
20
06
- 2
00
7
20
07
- 2
00
8
20
08
- 2
00
9
20
09
- 2
01
0
20
10
- 2
01
1
20
11
- 2
01
2
20
12
- 2
01
3
20
13
- 2
01
4
20
14
- 2
01
5
20
15
- 2
01
6
Figure 7.3: Revenue from General Services in Kerala
(As percentage of own tax revenues)

97
References
Ahluwalia, M. S. (2000): “Economic Performance of States in Post-Reforms Period”,
Economic and Political Weekly, May 6, pp. 1637-48.
Anand, M., Bagchi, A., & Sen, T. (2001, May). Fiscal discipline at the state level: perverse
incentives and paths to reform. In conference on “India: Fiscal Policies to Accelerate
Economic Growth.” New Delhi, May (pp. 21-22).
Bagchi, Amaresh (2006): “India’s Fiscal Management Post-Liberalisation”, Economic and
Political Weekly, 41(39): 4117-21.
Bajpai, N., & Sachs, J. D. (1999): “The State of State Government Finances in India (No. 719)”.
Blanchard, O. J. (1990). Suggestions for a new set of fiscal indicators.
Bohn, Henning. (1999) "Fiscal policy and the Mehra-Prescott puzzle: On the welfare
implications of budget deficits when real interest rates are low." Journal of Money, Credit
and Banking: 1-13.
Bohn, Henning. (2008) “The Sustainability of Fiscal Policy in the United States.” In
Sustainability of Public Debt, ed. R. Neck and Jan-Egbert Sturm, 15–49. Cambridge,
MA: MIT Press.
Buiter, Willem H. "A guide to public sector debt and deficits." Economic policy 1.1 (1985):
13-61.
Buiter, Willem H., and Urjit R. Patel. "Debt, deficits, and inflation: an application to the public
finances of India." Journal of public Economics 47.2 (1992): 171-205.
Burger, P., Stuart, I., Jooste, C., & Cuevas, A. (2012). Fiscal sustainability and the fiscal
reaction function for South Africa: Assessment of the past and future policy applications.
South African Journal of Economics, 80(2), 209-227.
Chakraborty, P., Mukherjee, A. N., & Amarnath, H. K. (2009). Macro policy reform and sub-
National Finance: Why is the Fiscal space of the states shrinking?. Economic and
Political Weekly, 38-44.
Commission on Growth and Development (CGD) (2008), "Highlights of the Growth Report,"
http://www.growthcommission.org/storage/cgdev/documento/''Report/ReportHighlights.
pdf.
Dasgupta, Z. (2012). Development Expenditure of the States in the Post-Liberalisation
Period. Economic and Political Weekly, 25, 64-73.
Department for International Development (DFID) (2009): Why tax matters for international
Development, Practice paper, May.
Domar, Evsey D. "The" burden of the debt" and the national income." The American Economic
Review 34.4 (1944): 798-827.
George K.K. (2011): “Kerala Economy: Growth, Structure, Strength and Weakness”, Centre
for Socio-economic and Environmental Studies (CSES) Working Paper No. 25.
George K.K. and K.K. Krishnakumar (2012): “Trends in Kerala State Finances-1991-92 to
2012-13: A Study in the Backdrop of Economic Reforms in India”, Centre for Socio-
economic and Environmental Studies (CSES) Working Paper No. 28.

98
Gopinath, Shyamala (2009): “Sub-national Fiscal Reforms and Debt Management - Indian
Experience”, available at: http://www.rbi.org.in/scripts/BS_SpeechesView.aspx?id=426
(accessed 25 April 2011).
Government of Kerala (GoK) (2006): Human Development Report 2005, State Planning Board.
Government of Kerala (GoK) (2015): Kerala Perspective Plan 2030, State Planning Board.-
(2006): Human Development Report 2005, State Planning Board.
Greene, Joshua E. (2011): Public Finance – An International Perspective, Singapore: World
Scientific Publishing Co. Pvt. Ltd.
Heller,Peter (2005), "Understanding FiscalSpace,"IMF PolicyDiscussionPaper 05/4
(Washington: International Monetary Fund, March),
http://www.imf.org/external/pubs/ft/pdp/2005/pdp04.pdf.
Hendrix, C. 2007. Leviathan in the Tropics? Environment, State Capacity, and Civil Conflict
in the Developing World.
Howes, S., Murgai, R., & Wes, M. (2005): “Expenditure Implications of India’s State-Level
Fiscal Crisis”, Economic Growth, Economic Performance and Welfare in South Asia (pp.
185-206), Palgrave Macmillan UK.
Ianchovichina, Elena, Lili Liu, and Mohan Nagarajan. "Subnational Fiscal Sustainability
Analysis: What Can We Learn from Tamil Nadu?." Economic and Political Weekly
(2007): 111-119.
Kaur, B., Mukherjee, A., Kumar, N., & Ekka, A. P. (2014). Debt sustainability at the state level
in India. RBI Working Paper Series.
Le, Tuan Minh, Blanca Moreno-Dodson and Nihal Bayraktar (2012): “Tax Capacity and Tax
Effort: Extended Cross-Country Analysis from 1994 to 2009”, World Bank Policy
Research Working Paper No. 6252.
Ley, E. (2009). Fiscal (and external) sustainability. MPRA Workign Paper.
Lotz Jorgen R. and Elliott R. Morss (1967): “Measuring “Tax Effort” in Developing
Countries”, Staff Papers – International Monetary Fund, 14:3, pp.478-99.
McCarten, W. J. (2003). The challenge of fiscal discipline in the Indian states. Fiscal
decentralization and the challenge of hard budget constraints, 249-286.
Misra, B. M., & Khundarkpam, J. K. (2008). Fiscal Consolidation by Central and State
Governments: The Medium-Term Outlook. In Seminar on “Issues Before the Thirteenth
Finance Commission” organized by the National Institute of Public Finance and Policy
at New Delhi on May (Vol. 24).
Mohan, R. (2000). Fiscal correction for economic growth: data analysis and
suggestions. Economic and Political Weekly, 2027-2036.
Mukesh, A., Bagchi, A., & Sen, T. K. (2002): “Fiscal Discipline at the State Level: Perverse
Incentives and Paths to Reform (No. 1)”, Working Paper.
Nguyen, T. (2013). Estimating India’s fiscal reaction function (No. 2013-05). The Australian
National University, Australia South Asia Research Centre.

99
OECD/KIPF (2016), Fiscal Federalism 2016: Making Decentralisation Work, OECD
Publishing, Paris.
Purohit, M. C., & Purohit, V. K. (2009). Mobilising non-tax revenue: An empirical analysis of
trends in states. Economic and Political Weekly, 54-62.
Purohit, Mahesh (2005): “Simple tools for evaluating Revenue performance in a Developing
country” in Anwar Shah (Ed.) Fiscal Management, Washington D.C.: The World Bank.
Rao, M. G. (2002). State finances in India: Issues and challenges. Economic and Political
Weekly, 3261-3271.
Ravishankar, V. J., Zahir, F., & Kaul, N. (2008). Indian States' Fiscal Correction: An
Unfinished Agenda. Economic and Political Weekly, 57-62.
Reddy, Y.V. (2007): “The Reserve Bank and the State Governments: Partners in Progress”,
available at: http://www.rbi.org.in/scripts/BS_SpeechesView.aspx?Id=355 (accessed 11
June, 2011).
Singh, N. (2006): “State Finances in India: A Case for Systemic Reform”, MPRA Paper No. 1281.
Stoica, T., & Leonte, A. (2011). Estimating a Fiscal Reaction Function for Greece. In
International Conference on Financial Management and Economics.
World Bank (1988): World Development Report 1988. New York: Oxford University Press
(Cited at
https://openknowledge.worldbank.org/bitstream/handle/10986/5971/WDR%201988%20-
%20English.pdf?sequence=1&isAllowed=y)
World Bank (2005): State Fiscal Reforms in India: Progress and Prospects, Macmillan, New
Delhi.

100
Appendix 1: Literature Review
Paper Title Author and Year Key Findings
The State of State
Government
Finances in India
Nirupam Bajpai and
Jeffrey D. Sachs (1999)
Fiscal deficits have remained high in the states and large component of these is made up of revenue deficit.
The three different methods of intergovernmental fiscal transfers have resulted in an inefficient transfer mechanism, which has increased bureaucracy at the state level, accommodated numerous interest groups, and delinked plan requirements of states from actual transfers.
Fiscal Correction for
Economic Growth
Data Analysis and
Suggestions
Rakesh Mohan (2000) It is revealed that the main impediment constraining India’s growth in the future is the continuing fall in public investment in infrastructure which has been caused by deteriorating fiscal environment at both the central and state government levels.
It is also found that the key solution to India’s fiscal predicament are bold programmes for imposing user charges on all public services amenable to such charges , and the implementation of a crash programme of privatisation.
Fiscal Discipline at
the State Level:
Perverse Incentives
and Paths to Reform
Mukesh Anand ,
Amaresh Bagchi ,
Tapas K. Sen (2001)
All revenue transfers from the centre to the States would need to be integrated by bringing them under the Finance Commission’s purview. The FCs devolution formulae should be strengthened with normative assessment of needs and capacity of the states.
A new strategy of planning oriented to a liberalized economy focussing on Plans for investment would need to be evolved.
The States should be required to depend on the market for their borrowing needs, with subsidy from the Centre for the additional risk premium on interest on loans given by financial institutions to underdeveloped/poorer States.
“State Finances in
India: Issues &
Challenges
M. Govinda Rao
(2002)
There has been a steady deterioration in states’ own tax revenues, significant drain on states’ resources due to losses from public enterprises and proliferation of implicit and explicit subsidies and transfers.
It is extremely important that effective fiscal reforms programme should be put in place in order to avoid serious problems arising from excessive borrowing.
Increased provision to social sectors and physical infrastructure can be made only when the slide in the revenue-GDP ratio is reversed.

101
ADB INDIA
Economic Bulletin
(2003)
The combination of rising revenue and fiscal deficits in conjunction with rising committed expenditures like interest payments and pensions on the one hand and, fall in capital expenditure relative to their respective GSDPs on the other, indicate the basic weaknesses in the profile of the state finances.
The main reasons for the deterioration in the state finances are considered to be the revision of salaries and pensions of state government employees following the recommendations of the fifth central pay commission and erosion in the buoyancy of central indirect taxes which led to a fall in tax devolution relative to GDP.
The States and Social
Expenditures
Tapas K. Sen
(2003)
The centre has seemingly done better that the states in the post-reform period in the case of social sector expenditure. Thus is however, slightly misleading since the two are not unrelated. The centre has been able to perform better by withholding money from the states. Over the years the number of centrally sponsored schemes has continued to increase , at the expense of the allocation from the overall plan outlay to the states
With regard to health, not much has happened. Neither the centre nor the states increased their health expenditures considerably.
With regard to education the share of education expenditures from all the departments declined from around 4.1 percent is 1990-91 to 3.8 per cent in 1998-99. This is mainly due to the decline in the state level.
Among all the components of public investment in Infrastructure in India, the components handled by the state governments are of particular concern, because they involve areas where private investment is less likely to substitute for any decline in public investment.
The Challenge of
Fiscal Discipline in
the Indian States
W.J. McCarten
J. Rodden, G.
Eskeland, &
J. Litvack (Eds.)
(2003)
While many states have seen rising debt to state GDP ratios, the overall ratio of total state debt to national GDP has been relatively stable at around 20% for the last decade.
The fiscal deterioration at the state level has been reflected primarily in worsening composition of expenditure: with salaries, subsidies and interest payments crowding out non-wage Operations & Maintenance and capital spending.
The Indian case suggests that hierarchical institutions alone are not optimal mechanism for policing sub-national finances.
Expenditure
Implications of
India’s State-level
Fiscal Crisis
Stephen Howes,
RinkuMurugai and
Marina Wes
State governments now face the very difficult task of increasing expenditure in priority areas while reducing deficits to sustainable levels.
Expenditure in poor states though lower on a per capita basis, is often higher as a percentage of state domestic product.

102
(2005)
The State Finances
in India : A Case for
Systemic Reform
Nirvikar Singh
( 2006)
State finances in India have deteriorated substantially in the past decade and require urgent attention.
In some cases the problem is worse than that indicated by budget deficits, since states also have large off-budget liabilities.
They have suggested that the problem lies partially or even substantially in government institutions that have not kept pace with changes in the redesigning India’s market economy. Thus tackling the problems of state finances requires broad systematic reforms.
Kerala State
Development Report
( IIIrdSection of 4th
Chapter)
Report is published by
Planning Commission
(2008)
It is pointed that the fiscal situation of Kerala demands immediate reform and restructuring. And it has to examine its tax and non-tax sources to identify the deficiencies and to explore the avenues for reform and restructuring.
The direction of the financial services sector of the state is towards the overall socio-economic development.
The forecasts and analysis show that the ratio of revenue deficit to revenue expenditure shows a decreasing trend, same as in revenue deficit- fiscal deficit ratio.
The study suggests that unless urgent corrective steps are taken it will be difficult to contain revenue deficits.
Indian States’ Fiscal
Correction : An
Unfinished Agenda
V J Ravishankar,
Farah Zahir,
NehaKaul
(2008)
Substantial increase in a state’s own revenue is possible through reforms in tax policy and administration, which would expand the tax base (by reducing evasion) as well as enhance tax buoyancy; including effective implementation of the VAT.
It is important to note that instilling fiscal discipline among states is still an unfinished agenda: Recent improvements in the incentive framework for fiscally responsible behaviour by the state governments have brought about desired change in the fiscal stance of several, but clearly not all the states.
The study revealed that the most effective way to enforce fiscal discipline among all states is to expose them to credit rating and risk-based lending terms, by phasing out central guarantee or any kind of central support, so as to let states access the financial market on their own strength.
Mobilising Non-Tax
Revenue- An
Mahesh C Purohit,
Vishnu Kanta Purohit
It is found that non-tax sources are not a fiscally significant source of revenue in the states’ budget and their growth is not keeping pace with other components of revenue receipts.
The study also revealed that any increase in user charges for medical services can result in lower recourse to these services and higher rate of self-medication among poor.

103
Empirical Analysis of
Trends in States.
( 2009)
It is suggested that water rate structure should be rationalised for better recovery of cost.
In irrigation projects, the increase in water rates has been rather modest and states have not accepted the Irrigation Commission recommendations of reviewing and adjusting rates every five years.
To improve the maintenance of roads it is recommended that government start a system of electronic toll collection.
Macro Policy Reform
and Sub-National
Finance: Why is the
Fiscal Space of the
States Shrinking?
Pinaki Chakraborty,
Anit Mukherjee,
H K Amarnath
(2009)
In the post economic liberalisation era in India, fiscal reforms at centre and financial sector reforms have adversely affected sub-national finances.
Though there are sharp interstate differences, the analysis revealed that fiscal and macro-policy shocks have reduced the fiscal space across states with varying degrees.
Trends in Kerala
State Finances –
1991-92 to 2012-13 :
A Study in the
Backdrop of
Economic Reforms in
India
K K George
K KKrishnakumar
(2012)
The study reveals that the efforts of Kerala for own revenue mobilisation came down during the present decade through the own revenue-GSDP ratio
The ratio of Central transfers to GSDP over the years was coming down continuously.
Development
Expenditures of the
States in the Post-
Liberalisation Period
ZicoDasgupta
(2012)
It is found that if development expenditure needs to be increased at least to the level of the 1980s, ceteris paribus, this requires the states to get greater access to the exogenous pool of net resources. This requires fiscal deficit and revenue transfers to increase vis-à-vis interest payments and committed expenditures
It is also pointed out that the development expenditure of the states declined in the post-liberalisation period due to the centre’s policies highlights the need for greater autonomy to the fiscal policymaking of the states.
Sub-national Level
Fiscal Health:
Stability &
Sustainability
Nimai Das
(2013)
The study finds that a sharp rise in the revenue account gap caused fiscal deficit to grow steadily and hence a high-flying debt stock in all states during the late 1990s and early 2000s.
The study suggests that a sound adjustment in fiscal position on revenue account is essential for all states and West Bengal needs a special attention to achieve equilibrium in the long run.

104
Implications for
Kerala , Punjab, &
West-Bengal
Debt Sustainability at
the State Level in
India
Balbir Kaur,
Atri Mukharjee, and
Anand Prakash Ekka
(2014)
The indicator based analysis revealed that while most of the debt sustainability indicators showed significant improvement during 2004-05 to 2012-13
There is a co-integrating relationship between government expenditure and revenues in India
Disaggregated level analysis revealed that despite an overall improvement in debt position of the Indian States, some of the states continue to show signs of fiscal stress and increasing debt burden.
Debt sustainability analysis shows that debt position of states at aggregate level is sustainable.
Fiscal Consolidation
by Central and State
Governments; The
Medium Term
Outlook
B.M. Misra and
J.K. Khundrakpam
In terms of the medium-term outlook for 2010-15, the gross and net tax revenue of the Centre would hover around 15 per cent and 11 per cent of GDP, respectively. Both revenue receipts and revenue expenditure would be around 13 per cent of GDP.
The Centre’s revenue account would balance and the fiscal deficit would be 2.5 per cent of GDP , according to the study forecasts.
Report of Fourteenth
Finance Commission
Finance Commission
of India
In 2004-05, only ten States (Bihar, Chhattisgarh, Jammu & Kashmir, Karnataka, Madhya Pradesh, Manipur, Mizoram, Nagaland, Sikkim and Tripura) showed surpluses in their revenue account; all the others had deficits.
In 2004-05, only seven States (Bihar, Chhattisgarh, Haryana, Karnataka, Odisha, Tamil Nadu and Tripura) had gross fiscal deficits of 3 percent of GSDP or less. However, by 2008-09, the number of such States had increased to fourteen.
The aggregate outstanding debt and liabilities, as a percentage of GDP, showed a declining trend decreasing from 31.1 per cent in 2004-05 to about 21.6 per cent in 2012-13.
In most States, the own tax revenue to GSDP ratios indicated a rising trend. The own non-tax revenue to GSDP ratios of most States, on the other hand, showed a fluctuating trend between 2004-05 and 2012-13
It is evident that higher revenue mobilisation contributed significantly to fiscal consolidation during the period 2004-05 to 2012-13.

105
Improvement in the fiscal position of all States taken together, during the period 2004-05 to 2012-13, was reflected in a reduction of the aggregate gross fiscal deficit and revenue deficit,relative to GDP, by 1.4 percentage points each, as well as a reduction in the primary deficit, relative to GDP, by 0.2 percentage points. There is a need to ensure that the momentum gained in improvement in the fiscal position of all States is maintained in the award period also.
Report of the Kerala
Public Expenditure
Review Committee
(3rd Committee, 4th
Report 2013-14)
Govt. Of Kerala (2015) It is revealed that throughout the period, the total expenditure was more than the total receipt, which resulted into growing revenue and fiscal deficit. It is also found that the capital expenditure witnessed a negative growth rate in the short term and implications of this on growth need to be assessed. Also the empirical finding does not show any systematic relationship between deficit financing and economic growth
It is found that better monitoring of target groups can enhance the quality of revenue expenditure such as subsidy payments. The surplus fund thus generated should be utilised for capital expenditure for accelerating growth. The committee therefore recommends that the targeting should be introduced in both subsidies, explicit and implicit.
The committee recommends that a long-term liquor policy may be evolved at the earliest after taking into account the fact that because of the present policy what is lost to the state in the form of liquor revenue will be gained by neighbouring states, with the gain of only minimum anti-liquor effect among the citizens in the state.
The investigation shows that there is no observable /outcome measures in the project records. Of nineteen sectors examined, the expenditure report did not show any outcome measures/observables in a readily available manner. So it recommends that all the project s using plan funds should contain at least one outcome/project objective/deliverable so that the performance of the project assessed and evaluated.
State Finances -A
Study of Budgets
2015-16
Reserve Bank of India
( 2016)
It observes that expenditure quality at the sub-national level has improved under the impetus provided by implementation of fiscal responsibility and budget management (FRBM) rules, but there remains considerable scope for progress
The fiscal health of states deteriorated in 2013-14 with their consolidated revenueaccount turning into a deficit after a gap of three years.
States’ fiscal situation further weakenedin 2014-15 (RE) as GFD and PD increased as proportions to GDP.

106
Economic and
Political Weekly
Study Report
The common causes of fiscal imbalances amongst 15 major states are: (i) A sudden jump in non-development expenditure including the incidence of interest on debt; (ii) Sharp reductions in the growth of own non-tax revenues; and (iii) Similar deceleration in the rate of growth of resource transfers from the central government.
Amongst the southern states, Andhra Pradesh, Karnataka and Kerala enjoy better plan expenditure to GSDP ratios of 5 to 6 per cent too, but Tamil Nadu has a lower ratio of a little above 3 per cent.

107
Appendix 2: Major fiscal reforms in states of India since 2010-11
(Source: RBI’s State Finances: A Study of Budgets, Various issues)
Table A.1 Major fiscal reforms in states of India during 2010-11
STATE REVENUE EXPENDITURE
Andhra Pradesh
Bihar 1. Revised the entry tax rate to
make it consistent with the VAT
2. e-stamping
3. Introduced new schemes for
taxes on trades and e-Payments, e-
Returns are proposed to be made
compulsory
1. Established the Reform
Support Unit and Tax
Research Unit and Training
Centre
Chhattisgarh
Goa 1. Rationalized excise duty
2. Rationalized licence fee for retail
sale of liquor
Gujarat 1. recruitment of talatis as a
separate cadre in the revenue
department to carry out revenue
work such
as collecting land revenue
Haryana 1. Surcharge on VAT 1. Proposed setting up an
Infrastructure Development
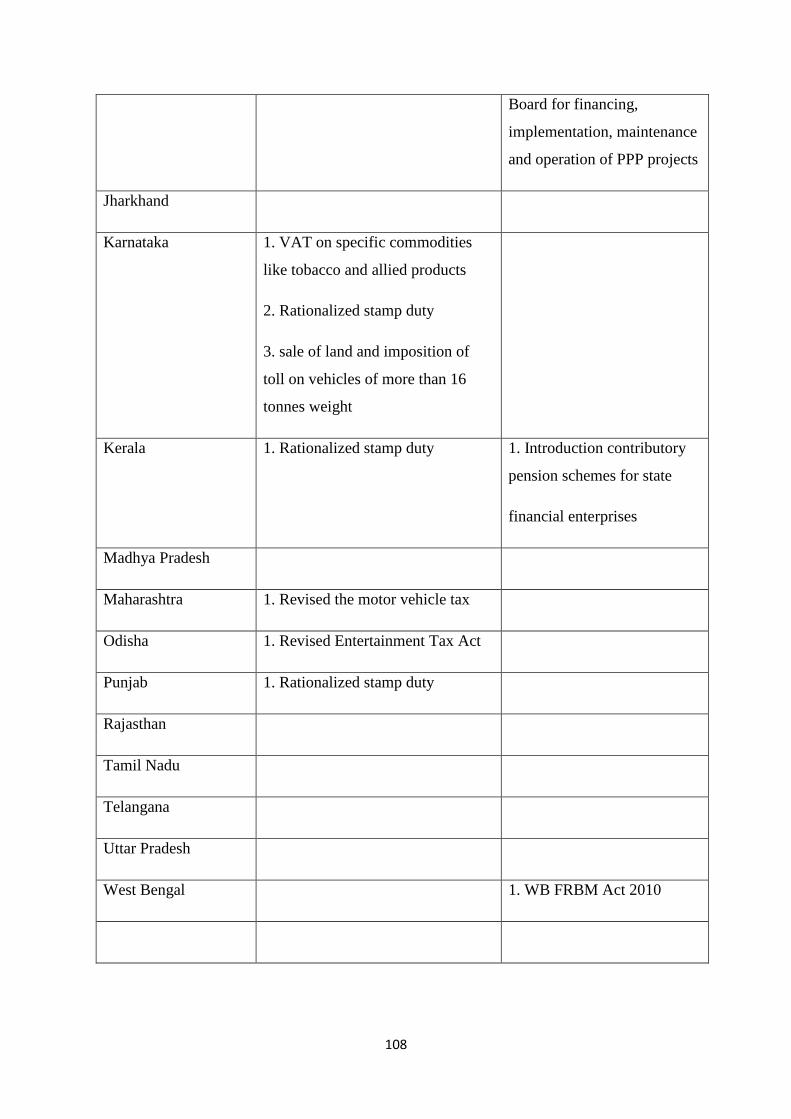
108
Board for financing,
implementation, maintenance
and operation of PPP projects
Jharkhand
Karnataka 1. VAT on specific commodities
like tobacco and allied products
2. Rationalized stamp duty
3. sale of land and imposition of
toll on vehicles of more than 16
tonnes weight
Kerala 1. Rationalized stamp duty 1. Introduction contributory
pension schemes for state
financial enterprises
Madhya Pradesh
Maharashtra 1. Revised the motor vehicle tax
Odisha 1. Revised Entertainment Tax Act
Punjab 1. Rationalized stamp duty
Rajasthan
Tamil Nadu
Telangana
Uttar Pradesh
West Bengal 1. WB FRBM Act 2010

109
Arunachal Pradesh 1. VAT on specific commodities
like tobacco and allied products
Assam 1. Rationalized excise duty
2. Revised Passenger Goods
Taxation Act
3. Revised the motor vehicle tax
Himachal Pradesh
J & K 1. Concession in stamp duty rate
2. Disinvestment of state PSUs
1. Proposed setting up an
empowered committee to
monitor the progress of
expenditure to ensure 100 per
cent utilisation of grants
awarded by the Thirteenth FC
Manipur 1. Revised the motor vehicle tax
2. Rationalized stamp duty
3. rationalisation of power tariffs
and forest royalties
Meghalaya 1. Revised Passenger Goods
Taxation Act
2. Rationalized licence fee for retail
sale of liquor
1. Limited guarantees and
established the Guarantee
Redemption Fund to avoid
the risk of default
Mizoram 1. Revised the motor vehicle tax 1. Augmented the Guarantee
Redemption Fund
Nagaland
Sikkim 1. Sikkim FRBM Act 2010

110
Tripura
Uttarakhand 1. Rationalized stamp duty
NCT Delhi 1. VAT on natural gas for use in the
transport sector, Rassi, Ban &
Newar, bio inputs like fertilisers,
micro-nutrients and plant growth
promoters, kerosene stoves,
lanterns and petromax and their
spares, embroidery and zari items,
motion
picture distribution, and
plastic/glass scrap which were
earlier exempted
2. increase in VAT rate on certain
items, such as diesel, desi ghee,
plastic household items, plastic and
tin containers including barrels,
fertilisers, pesticides, weedicides,
insecticides, herbicides,
rodenticides and plant growth
regulators, wood, timber, plywood
and laminated boards, fittings for
doors and windows, and furniture
Table A.2: Major fiscal reforms in states of India during 2011-12
NON –
SPECIAL
CATEGORY
STATE
REVENUE FRONT INITIATIVES EXPENDITURE FRONT
INITIATIVES

111
Andhra
Pradesh
1. Operation of post-matric
scholarships scheme
through online banking
facility
2. The PPP mode for
Promoting tourism which
would distribute the
expenditure burden
Bihar 1. improving tax compliance through
e-governance
Chhattisgarh
Goa 1. Increasing the VAT rate on certain
commodities such as tobacco and
allied products
2. Increasing the VAT rate on liquor
products
3. Upward revision in stamp duty
rates
4. Rationalisation of the license fee
for retail sale of liquor
Gujarat 1. Increasing the VAT rate on certain
commodities such as tobacco and
allied products
2. Increasing the VAT rate on mobiles
Haryana 1. implementation of e-
governance projects for
public distribution
system, issue of driving
licenses, registration of
vehicles, and Integrated

112
Financial Management
System
2. The PPP mode for four-
laning of roads which
would distribute the
expenditure burden
Jharkhand 1. Rationalisation of the stamp duty
structure through the introduction
of e-stamping
2. Improving tax compliance through
e-governance
Karnataka 1. Luxury tax on the space or the
premises rented for marriage and
convention halls
2. Stamp duty would include
agreements relating to
advertisements for business
development, granting of exclusive
rights for telecasting/broadcasting
programmes and assignment of
intellectual property rights in
Karnataka
Kerala 1. Rationalized Motor Vehicle Tax
2. Increasing penalty fees
3. Introduction of daily lotteries
Madhya
Pradesh
Madhya Pradesh proposes to computerise
VAT administration

113
Rationalized Motor Vehicle Tax
Maharashtra Increasing VAT on carbonated soft drinks
Upward revision in stamp duty rates
Odisha Increasing the VAT rate on consumer
durables
Revision in the entry tax rate to make it
consistent with the VAT rate
Establishing modern check gates
Punjab
Rajasthan Increasing the VAT rate on Aviation
Turbine fuel
introducing new taxes such as environment
and health cess
Tamil Nadu Upward revision in stamp duty rates
improving tax compliance through e-
governance
Telangana
Uttar Pradesh 1. Royalty fee on non-agricultural use
of water
2. License fee for liquor Products
West Bengal 1. Proposed a compensatory entry tax
fund by levying a life-time tax on
registration of vehicles and on entry
of goods into local areas of the state
2. User charges/cost recovery from
social and economic services

114
SPECIAL
CATEGORY
STATES
Arunachal
Pradesh
1. Improving tax compliance through
e-governance
2. Increase in VAT rate from 4 per
cent to 5 per cent
3. Introduction of daily lotteries
4. Introduction of e-lotteries
Assam 1. Increasing the VAT rate on certain
commodities such as tobacco and
allied products
2. Increasing the VAT rate on liquor
products
3. Increasing the VAT rate on crude
oil
4. Revision in the entry tax rate to
make it consistent with the VAT
rate
5. Rationalized Motor Vehicle Tax
6. Increase in VAT rate from 4 per
cent to 5 per cent
7. Rationalisation of the license fee
for retail sale of liquor
Himachal
Pradesh
Rationalisation of the stamp duty structure
through the introduction of e-stamping
J & K 1. Rationalising taxes such as revision
of the Passenger Goods Taxation
Act

115
2. Widening the tax net to include
services like construction of
commercial complexes and
colonies, TV/radio programme
production, architects/ interior
decorators, chartered accountants
and advertisement hoardings
Manipur 1. Rationalized Motor Vehicle Tax
2. increase in VAT rate from 4 per
cent to 5 per cent
3. rationalisation of the license fee for
retail sale of liquor
Meghalaya 1. Amendments in the VAT Act and
e-services for luxury and profession
tax
2. Increase in VAT rate from 4 per
cent to 5 per cent
Mizoram 1. Rationalized Motor Vehicle Tax
2. levy of stamp duty on monthly
payment of salaries to all regular
Government officials including the
Council of Ministers and
Parliamentary Secretaries and on
all bills in respect of payment made
by various Departments and offices
to private parties
3. increase in VAT rate from 4 per
cent to 5 per cent

116
Nagaland Increase in VAT rate from 4 per cent to 5
per cent
Sikkim Increase in VAT rate from 4 per cent to 5
per cent
Tripura
Uttarakhand 1. Amendments/ revisions in the
Entertainment Tax Act
2. Rationalisation of the stamp duty
structure through the introduction
of e-stamping
Union Territories with Legislative Assemblies
Delhi 1. Increasing the VAT rate on
certain commodities such as
tobacco and allied products
2. Increasing the VAT rate on
sweetmeats and savouries
3. improving tax compliance
through e-governance
Puducherry 1. Rationalisation of the stamp
duty structure through the
introduction of e-stamping
2. improving tax compliance
through e-governance
Table A.3: Major fiscal reforms in states of India during 2012-13

117
NON –
SPECIAL
CATEGORY
STATE
REVENUE FRONT INITIATIVES EXPENDITURE FRONT
INITIATIVES
Andhra
Pradesh
Mee Seva project, which
provides a
simpler interface between
the government and
the citizen enabling
improved delivery
mechanism
Bihar 2. Raised their value added tax (VAT)
on certain commodities such as
tobacco and allied products
3. Introduced taxes on the sale price
of the residential and commercial
flats
Chhattisgarh
Goa 1. luxury tax on the space or the
premises rented for commercial
activities
2. Rationalized Motor Vehicle Tax
3. Introduction of an entry toll on all
vehicles registered outside the state
4. Licence fee on both on-shore and
off-shore casinos
e-tendering an e-
procurement systems
Gujarat 1. Rationalized Stamp duty structure
2. User charges/cost recovery from
social and economic services
Abolition of vacant posts
Haryana

118
Jharkhand 1. Luxury tax on the space or the
premises rented for marriage halls
2. Imposed an entry tax on 63
commodities to protect industries in
the state
Karnataka 3. Luxury tax on the space or the
premises rented for marriage and
convention halls
4. Stamp duty would include
agreements relating to
advertisements for business
development, granting of exclusive
rights for telecasting/broadcasting
programmes and assignment of
intellectual property rights in
Karnataka
Kerala 1. Rationalized Motor Vehicle Tax
2. Rationalized Stamp duty structure
3. The government of Kerala proposes
to set up an Economic Intelligence
Wing for detecting and taking
action on technology-aided tax
evasion
4. Registration fee
Madhya
Pradesh
Madhya Pradesh proposes to computerise
VAT administration
Maharashtra 1. LPG for domestic Use has been
brought into the tax net
2. Rationalized Motor Vehicle Tax
3. proposes to levy a late fee on
delayed filing of tax returns

119
Odisha 1. Entertainment tax has been
extended to cover direct-to-home
(DTH) broadcasting service
providers
2. Proposes to introduce progressivity
in profession tax
3. License fee for liquor Products
4. Registration and License fee on
bars in restaurants
A ban on recruitment in all
sectors, excluding essential
sectors3 and recruitment, if
required, to be done
only on contractual basis
Punjab Rationalising
Public expenditure through
policy initiatives,
such as austerity measures
Rajasthan
Tamil Nadu 1. Vegetable oil has been brought into
the tax net
2. Rationalized Motor Vehicle Tax
Telangana
Uttar Pradesh 3. Royalty fee on non-agricultural use
of water
4. License fee for liquor Products
West Bengal 3. Proposed a compensatory entry tax
fund by levying a life-time tax on
registration of vehicles and on entry
of goods into local areas of the state
4. User charges/cost recovery from
social and economic services
SPECIAL
CATEGORY
STATES

120
Arunachal
Pradesh
Introduced property taxes on the sale of
residential and commercial flats
Assam Rationalized luxury tax
License fee for liquor Products
Himachal
Pradesh
J & K 1. Upward revision of the toll rate
2. User charges/cost recovery from
social and economic services
1. Rationalising Public
expenditure through
policy initiatives,
such as austerity
measures
2. Recruitment
through the
stipendiary mode
and outsourcing of
different
government
activities
Manipur Rationalising
Public expenditure through
policy initiatives,
such as austerity measures
Meghalaya User charges/cost recovery from social and
economic services
Abolition of posts
identified as redundant
Mizoram User charges/cost recovery from social and
economic services
Nagaland User charges/cost recovery from social and
economic services

121
Sikkim Rationalising
Public expenditure through
policy initiatives,
such as austerity measures
Tripura
Uttarakhand
Table A.4: Major fiscal reforms in states of India during 2013-14
NON
SPECIAL
CATEGORY
STATES
REVENUE FRONT INITIATIVES EXPENDITURE FRONT
INITIATIVES
Andhra Pradesh 1. Mee Seva project, an e-
governance initiative
Bihar 1. Raised tax rates: VAT on tobacco and
Vehicle tax
2. Introduced tax on the sales price of
residential and commercial flats to tap
into real estate
Chhattisgarh
Goa 1. Raised tax rate: VAT on tobacco,
liquor, carbonated soft drinks, fast food,
junk food, vehicle
2. Introduced luxury tax on
1. e-tendering and e-
procurement systems
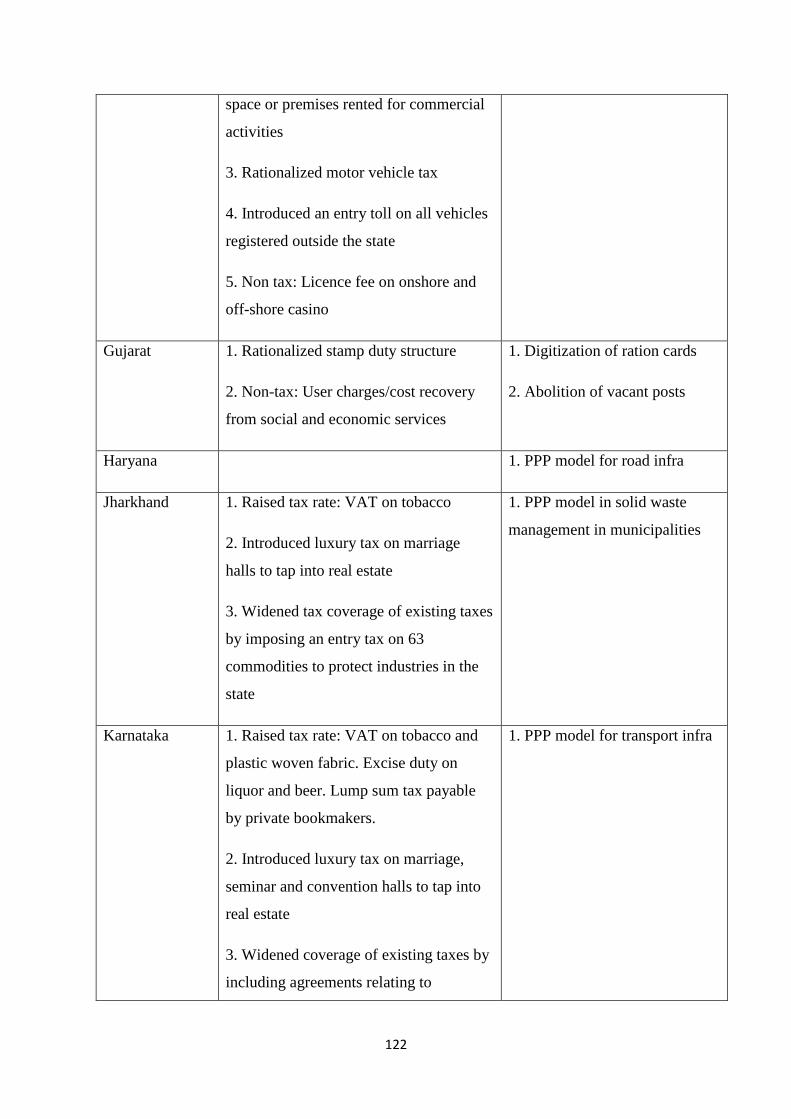
122
space or premises rented for commercial
activities
3. Rationalized motor vehicle tax
4. Introduced an entry toll on all vehicles
registered outside the state
5. Non tax: Licence fee on onshore and
off-shore casino
Gujarat 1. Rationalized stamp duty structure
2. Non-tax: User charges/cost recovery
from social and economic services
1. Digitization of ration cards
2. Abolition of vacant posts
Haryana 1. PPP model for road infra
Jharkhand 1. Raised tax rate: VAT on tobacco
2. Introduced luxury tax on marriage
halls to tap into real estate
3. Widened tax coverage of existing taxes
by imposing an entry tax on 63
commodities to protect industries in the
state
1. PPP model in solid waste
management in municipalities
Karnataka 1. Raised tax rate: VAT on tobacco and
plastic woven fabric. Excise duty on
liquor and beer. Lump sum tax payable
by private bookmakers.
2. Introduced luxury tax on marriage,
seminar and convention halls to tap into
real estate
3. Widened coverage of existing taxes by
including agreements relating to
1. PPP model for transport infra

123
advertisements for business development,
granting of exclusive rights for
telecasting/broadcasting programmes and
assignment of intellectual property rights
into stamp duty
Kerala 1. Raised tax rates: VAT on tobacco,
liquor and plastic woven fabric. Land and
road tax
2. Rationalized motor vehicle tax and
stamp duty structure
3. Proposed to set up an Economic
Intelligence Wing for detecting and
taking action on technology-aided tax
evasion to improve tax compliance and
reduce the costs of tax administration
through the use of information
technology
3. Non-tax: Registration fee on casino
licence
1. Digitization of ration cards
Madhya Pradesh 1. Raised tax rate: VAT on tobacco.
Luxury tax, Entertainment tax and
Advertisement tax
2. Proposed to computerize VAT
administration
Maharashtra 1. Raised tax rate: VAT on tobacco
2. Brought untaxed ‘LPG for domestic
use’ into tax net
3. Rationalized motor vehicle tax
1. PPP model for road infra

124
4. Proposed to levy a late fee on delayed
filing of tax returns
Odisha 1. Raised tax rates: Excise duty on liquor
and beer
2. Widened tax coverage of existing taxes
by extending entertainment tax to cover
direct-to-home (DTH) broadcasting
service providers
3. Rationalized taxes by Introduction of
progressivity in profession tax
4. Licence fee for liquor products
5. Licence fee on bars in restaurents
1. PPP model for road infra
2. Ban on recruitment in all
sectors, excluding essential
sectors and recruitment if
required to be done only on
contract basis
Punjab 1. Austerity measures
Rajasthan 1. Computerization of PDS
2. PPP model for transport infra
Tamil Nadu 1. Raised tax rates: VAT on liquor
2. Brought untaxed vegetable oil into tax
net
3. Rationalized motor vehicle tax
1. PPP model in solid waste
management in municipalities
Telangana
Uttar Pradesh 1. Royalty fee on non-agricultural use of
water
2. Licence fee for liquor products
1. PPP model for road infra
2. PPP model in solid waste
management in municipalities
3. PPP model in sports infra
West Bengal 1. Raised tax rates: VAT on luxury goods 1. Digitization of ration cards

125
2. Widened tax coverage of existing taxes
by introducing a compensatory entry tax
fund by levying a life-time tax on
registration of vehicles and on entry of
goods into local areas of the state
3. Non-tax: User charges/cost recovery
from social and economic services
SPECIAL
CATEGORY
STATES
Arunachal
Pradesh
1. Introduced property tax to tap into real
estate
2. Non tax: Paper lotteries
1. e-PDS software application in
all districts
2. Establishment of food depot
in all districts to bring efficiency
3. PPP model for irrigation infra
4. PPP model in healthcare
5. PPP model in tourism infra
Assam 1. Rationalized luxury tax
2. Licence fee for liquor products
Himachal
Pradesh
1. Raised tax rate: VAT on tobacco 1. Computerization of PDS
J & K 1. Raised tax rate: VAT on tobacco and
liquor
2. Rationalized tax by Upward revision of
the toll rate
1. Austerity measures
2. Recruitment through the
stipendiary mode
3. Outsourcing of different
government activities

126
3. Non-tax: User charges/cost recovery
from social and economic services
Manipur 1. Austerity measures
Meghalaya 1. Raised tax rate: VAT on liquor. Excise
duty on liquor and beer
2. Non-tax: User charges/cost recovery
from social and economic services
1. Posts identified as redundant
Mizoram 1. Non-tax: User charges/cost recovery
from social and economic services
1. Computerization of PDS
Nagaland 1. Non-tax: User charges/cost recovery
from social and economic services
Sikkim 1. Austerity measures
Tripura
Uttarakhand 1. Computerization of PDS
2. PPP model in healthcare
NCT Delhi
Table A.5: Major fiscal reforms in states of India during 2014-15
STATE REVENUE EXPENDITURE
Andhra Pradesh 1. Financial Restructuring
Plan for State Power
Utilities

127
Bihar 1. Financial Restructuring
Plan for State Power
Utilities
Chhattisgarh
Goa
Gujarat
Haryana 1. Financial Restructuring
Plan for State Power
Utilities
2. Started issuing securities
of less than ten years
maturities
Jharkhand 1. Financial Restructuring
Plan for State Power
Utilities
Karnataka
Kerala
Madhya Pradesh
Maharashtra
Odisha 1. Started issuing securities
of less than ten years
maturities
Punjab 1. Started issuing securities
of less than ten years
maturities

128
Rajasthan 1. Financial Restructuring
Plan for State Power
Utilities
Tamil Nadu 1. Financial Restructuring
Plan for State Power
Utilities,
2. Started issuing securities
of less than ten years
maturities
Telangana 1. Financial Restructuring
Plan for State Power
Utilities
Uttar Pradesh 1. Financial Restructuring
Plan for State Power
Utilities
West Bengal
Arunachal Pradesh
Assam
Himachal Pradesh
J & K
Manipur
Meghalaya
Mizoram
Nagaland
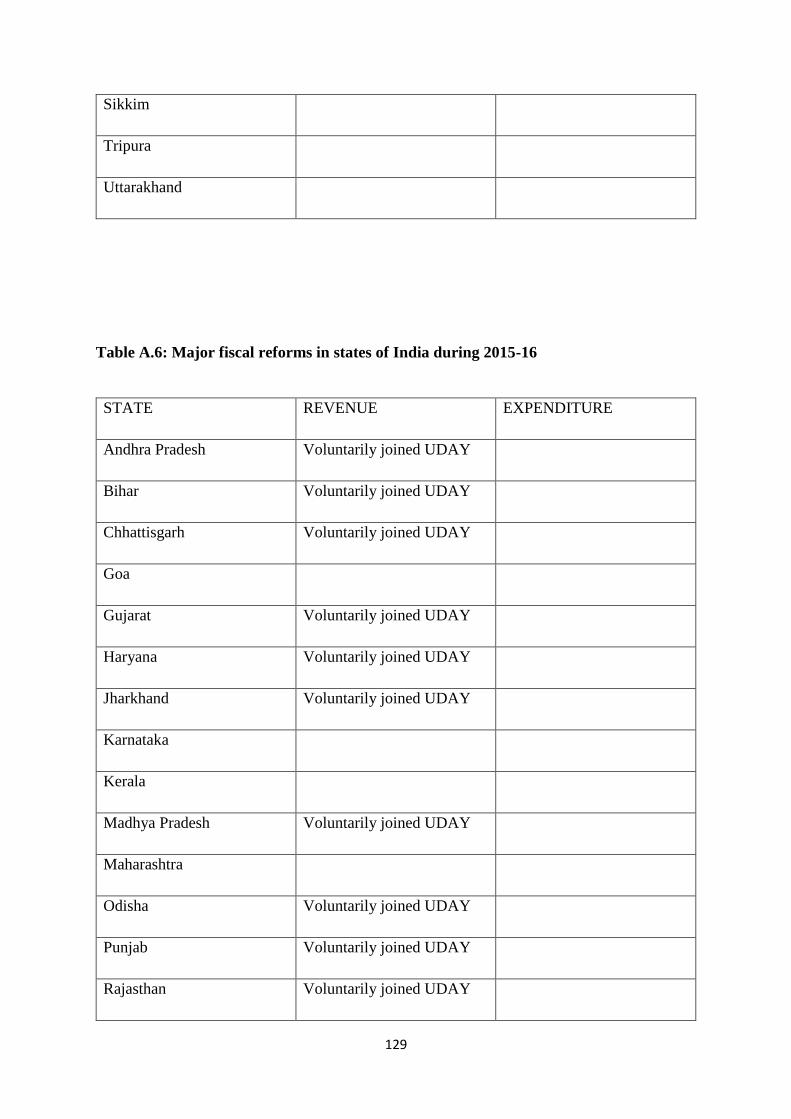
129
Sikkim
Tripura
Uttarakhand
Table A.6: Major fiscal reforms in states of India during 2015-16
STATE REVENUE EXPENDITURE
Andhra Pradesh Voluntarily joined UDAY
Bihar Voluntarily joined UDAY
Chhattisgarh Voluntarily joined UDAY
Goa
Gujarat Voluntarily joined UDAY
Haryana Voluntarily joined UDAY
Jharkhand Voluntarily joined UDAY
Karnataka
Kerala
Madhya Pradesh Voluntarily joined UDAY
Maharashtra
Odisha Voluntarily joined UDAY
Punjab Voluntarily joined UDAY
Rajasthan Voluntarily joined UDAY

130
Tamil Nadu
Telangana
Uttar Pradesh Voluntarily joined UDAY
West Bengal
Arunachal Pradesh
Assam
Himachal Pradesh Voluntarily joined UDAY
J & K Voluntarily joined UDAY
Manipur
Meghalaya
Mizoram
Nagaland
Sikkim
Tripura
Uttarakhand Voluntarily joined UDAY

131
Appendix 3: Does Kerala overspend on the social sector?
Kerala is one of the better doing states in India as far as the social development is concerned. The
state has been doing consistently better than the other Indian states on various social indicators. This
high social development can be attributed to multiple reasons like various social movements aimed at
bringing the underprivileged and marginalized into the mainstream, history of a welfare governments
etc. However, we have done this study from a Public Finance perspective as how much the state
government is having to incur to achieve such social outcomes? Also, is the spending efficient when
compared with similar states? In order to address this, we have chosen a set of comparable states and
have compared spend with that of Kerala to see where exactly does Kerala stand as far as the
efficiency of spend is concerned. The majority of data taken for this study is secondary data accessed
from various government of India websites.
Our Comparative States for Analysis
The seven states chosen for our comparative
analysis have been chosen on different factors like
political profile, better doing Industrial states, better
doing states on public delivery of social services
front etc. Based on these we have chosen the
following seven states for our analysis-
1. Karnataka, Andhra Pradesh, Tamil Nadu
- All other three south Indian states apart from
Kerala
2. Rajasthan – Better doing state on the front
of public delivery of health and education
3. Gujarat and Maharashtra – Better off doing industrial states
4. West Bengal- Mostly welfare state and similar political governance
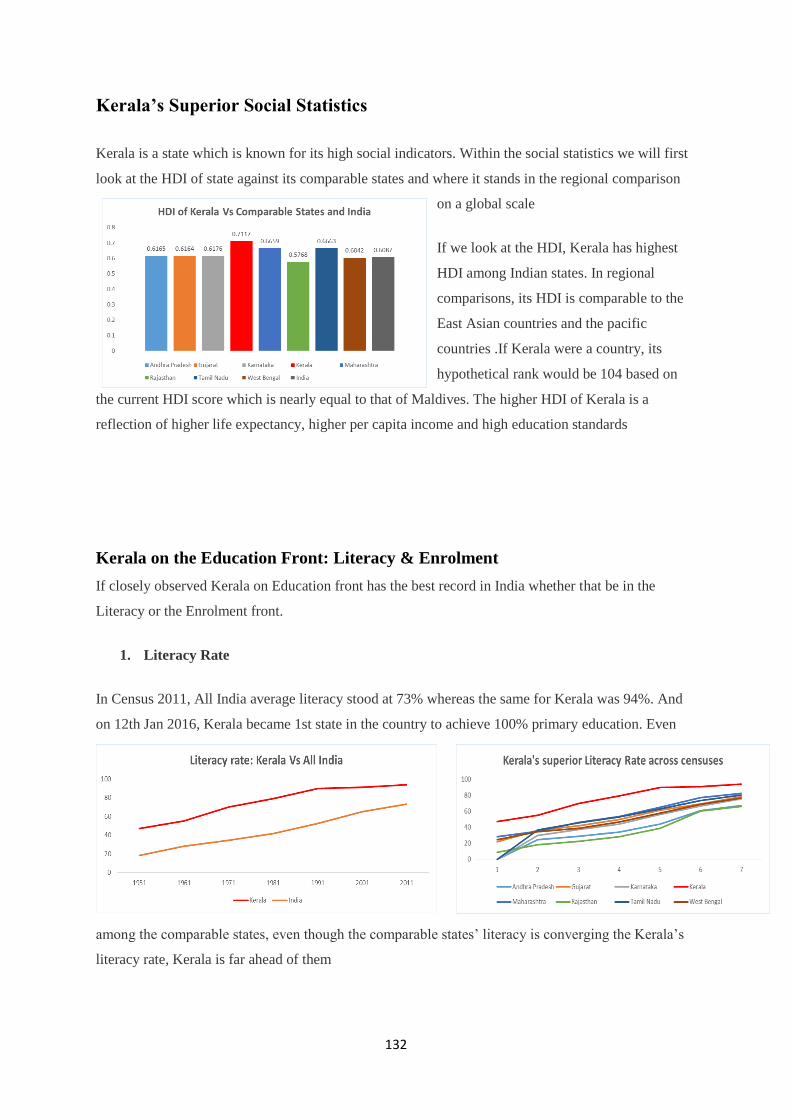
132
Kerala’s Superior Social Statistics
Kerala is a state which is known for its high social indicators. Within the social statistics we will first
look at the HDI of state against its comparable states and where it stands in the regional comparison
on a global scale
If we look at the HDI, Kerala has highest
HDI among Indian states. In regional
comparisons, its HDI is comparable to the
East Asian countries and the pacific
countries .If Kerala were a country, its
hypothetical rank would be 104 based on
the current HDI score which is nearly equal to that of Maldives. The higher HDI of Kerala is a
reflection of higher life expectancy, higher per capita income and high education standards
Kerala on the Education Front: Literacy & Enrolment
If closely observed Kerala on Education front has the best record in India whether that be in the
Literacy or the Enrolment front.
1. Literacy Rate
In Census 2011, All India average literacy stood at 73% whereas the same for Kerala was 94%. And
on 12th Jan 2016, Kerala became 1st state in the country to achieve 100% primary education. Even
among the comparable states, even though the comparable states’ literacy is converging the Kerala’s
literacy rate, Kerala is far ahead of them

133
2. GER
On the GER front, GER of Kerala has improved consistently over the past five years and is now equal
to the national average. Among our comparable states, Kerala does not have the highest GER and is
still catching up with some of the comparable states.
Kerala on the Health Front: Life Expectancy, IMR, MMR, Sex Ratio
1. Life Expectancy
Historically, Kerala has had higher life
expectancy than all India average as can be
seen from the above charts both for males
and females. From the period 2011-16, the Life Expectancy at Birth was 66.9 for males and 68.8 for
females for India whereas the same for Kerala was 72 and 75 respectively.
Even among the comparable states, Kerala has been exhibiting a higher Life Expectancy at Birth
across the time periods as can be observed from the graph. Off late, the comparable states’ Life
expectancy at birth is converging that of Kerala yet Kerala is ahead of them.

134
2. IMR and MMR
On the front of IMR and MMR, Kerala does a lot better than comparable states and all India average.
According to the 2013 data, all India IMR was 40 whereas the same for Kerala was 12. It is
interesting to notice that Kerala’s IMR has remained at 1997 levels of 12 with further improvement
since then.
On the MMR front also, Kerala has been doing much better than the all India average and the
comparable states. MMR during 2011-13 stood at 61 for Kerala whereas the same for all Indian states
was 167.
3. Sex Ratio
Kerala is the only state with positive sex ratio (Puducherry
amongst the UTs has 1037) in the country. According to the
census 2011 data, all India sex ratio was 943 whereas that
for Kerala was 1043. The positive sex ratio is the result of
the effort made in the direction of creating an educated
citizenry and stopping female foeticide.
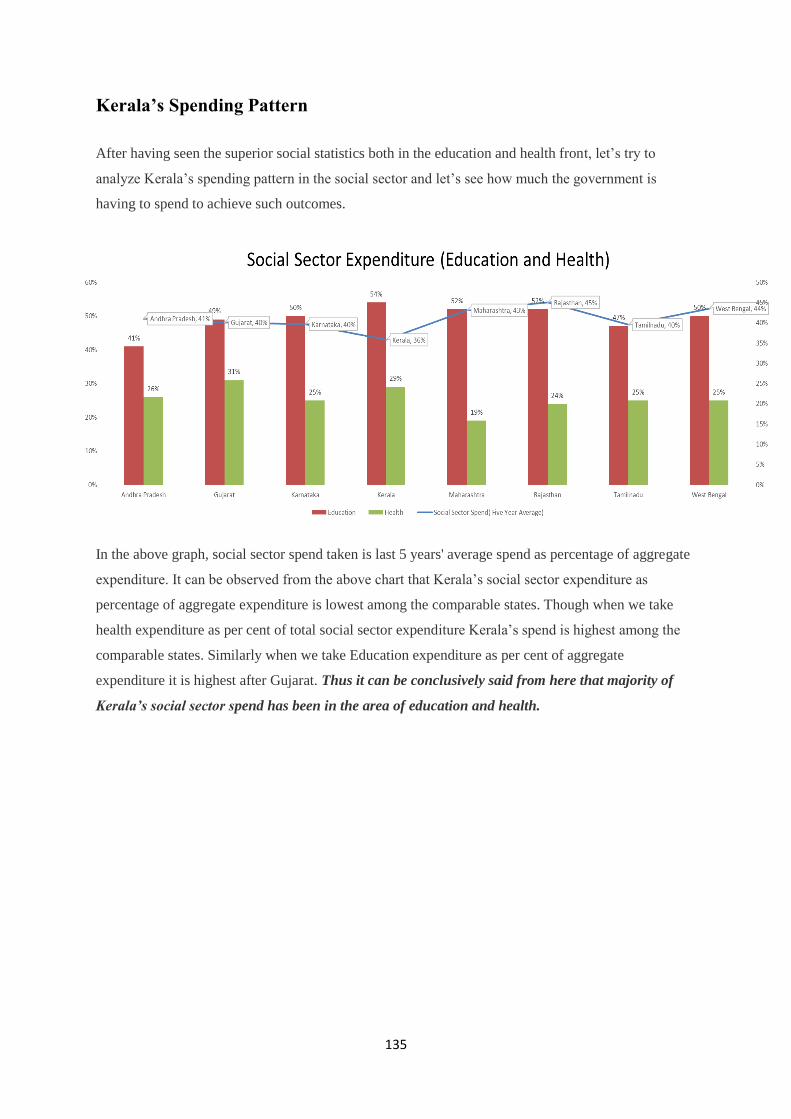
135
Kerala’s Spending Pattern
After having seen the superior social statistics both in the education and health front, let’s try to
analyze Kerala’s spending pattern in the social sector and let’s see how much the government is
having to spend to achieve such outcomes.
In the above graph, social sector spend taken is last 5 years' average spend as percentage of aggregate
expenditure. It can be observed from the above chart that Kerala’s social sector expenditure as
percentage of aggregate expenditure is lowest among the comparable states. Though when we take
health expenditure as per cent of total social sector expenditure Kerala’s spend is highest among the
comparable states. Similarly when we take Education expenditure as per cent of aggregate
expenditure it is highest after Gujarat. Thus it can be conclusively said from here that majority of
Kerala’s social sector spend has been in the area of education and health.

136
Comparative Analysis of Education Expenditure
Education spend of Kerala as % of total expenditure has been high compared to all India average,
however lately they are converging as other states like CG and Bihar are increasing spending on
education. For the comparable states also, line graph shows a converging trend. Per capita education
spend of the selected
states is close to Kerala for FY 15, except WB which shows an increasing larger social commitment
of the states on education which has also been reflecting on their increased literacy rate and increased
GER
Comparative Analysis of Health Expenditure

137
Kerala’s health expenditure as percentage of aggregate expenditure has been consistently higher than
the national average. Also the per capita spend on health has also been higher than the comparable
states.
If we compare with respect to the comparable states, Kerala has been spending a higher proportion on
health than its comparable states. Spend of Gujarat is rising consistently over the years both as % of
total expenditure and per capita whereas for Kerala it has been consistently in the bracket of 5-6 %.
Kerala’s Spending Efficiency
In a welfare country or state, it is imperative for governments to spend on social sector. Therefore, the
significance of measurement of efficiency in social sector spending of a state is questionable as
governments anyway have to spend in this area. Naturally, people would ask why to question
governments on their efficiency if they anyway have to spend. In our opinion, this is precisely the very
reason for which we must have efficiency measurement of public spend. In a democracy, no institution
is unquestionable including government. An efficiency analysis would give government a tool to
compare its performance across years, across central and state governments. It would provide a measure
of credibility for state finances and the improving states could be rewarded with credit at preferential
rates to finance their development.
Methodology:
To calculate any kind of efficiency, the general approach is to divide output by input, which gives us
output per unit input. The higher this number, the higher the efficiency. Since our research is focused
on spending prudence, we have rather used input to output ratio. This approach gives us a number in
monetary units and we are able to answer the question, “Does Kerala Overspend in Social Sector?” Our
input is money spent on education and health and output are improvement in various parameters of
social wellness.
For education, we have selected literacy rate and Gross Enrolment Ratio as outcome parameters. For
health, we have selected Life Expectancy at Birth, Infant Mortality Rate and Maternal Mortality Rate
as outcome measurement parameters. Following diagram summarizes our approach. The output is taken

138
as an improvement in the abovementioned education and health parameters compared to a previous
time period, not the absolute value of them because we assume that whatever has been spent must give
improvement in these parameters. The input is the amount government is having to spend on that
parameter. The efficiency would be measured as how much the government is having to spend to bring
an improvement in output by one unit.
Now we would analyze efficiency one by one on various parameters.
Education (Literacy Rate)
Following graph gives us Per Year Rs. Spend to bring one person into the literacy bracket. The blue
column gives per year average spend to make one person literate from year 1991 to 2001. The orange
column gives the same between 2001 and 2011.
As can be observed from the above graph that Kerala has been overspending over these years compared
to comparable states. Even though Kerala has had the highest literacy level, the spending continues to
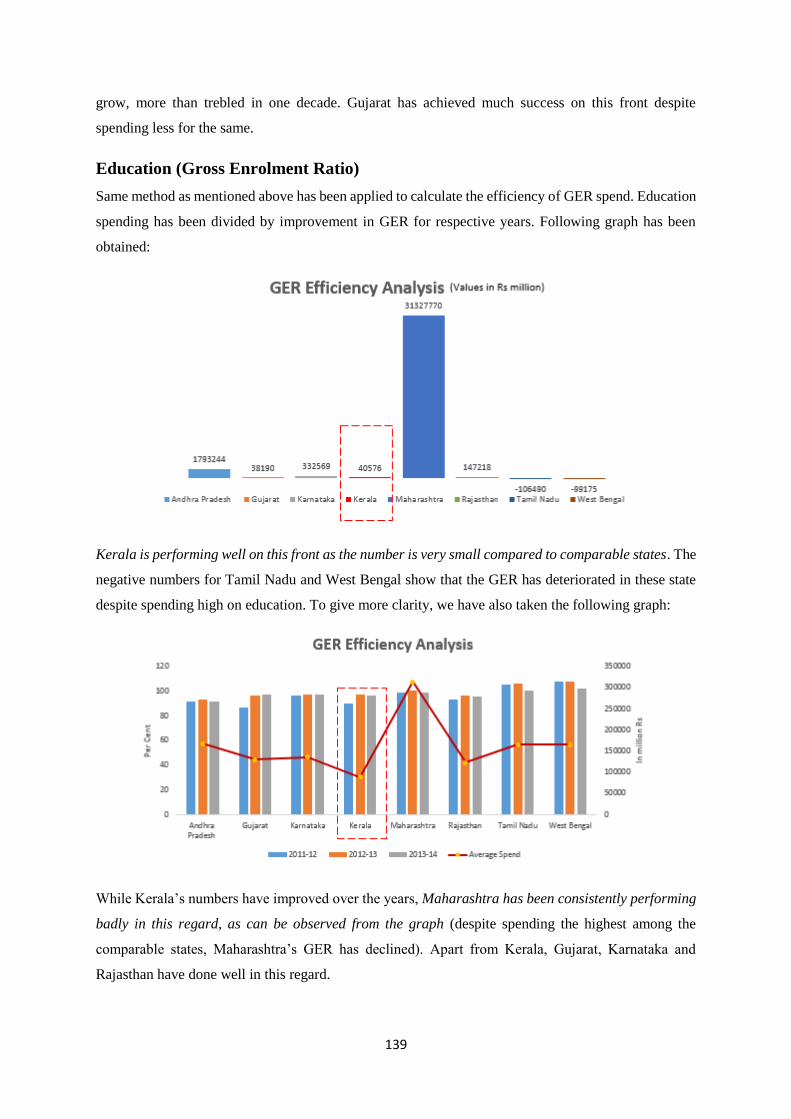
139
grow, more than trebled in one decade. Gujarat has achieved much success on this front despite
spending less for the same.
Education (Gross Enrolment Ratio)
Same method as mentioned above has been applied to calculate the efficiency of GER spend. Education
spending has been divided by improvement in GER for respective years. Following graph has been
obtained:
Kerala is performing well on this front as the number is very small compared to comparable states. The
negative numbers for Tamil Nadu and West Bengal show that the GER has deteriorated in these state
despite spending high on education. To give more clarity, we have also taken the following graph:
While Kerala’s numbers have improved over the years, Maharashtra has been consistently performing
badly in this regard, as can be observed from the graph (despite spending the highest among the
comparable states, Maharashtra’s GER has declined). Apart from Kerala, Gujarat, Karnataka and
Rajasthan have done well in this regard.

140
Health (Life Expectancy at Birth)
Same efficiency method has been applied. Health spends over the years have been divided by
improvement in Life Expectancy at Birth. Following graph has been obtained:
Between the period of 1996-2001 and 2001-2006, Kerala’s efficiency in this regard had deteriorated.
However, since then Kerala has shown improved efficiency in spending against improvement in life
expectancy at Birth. Maharashtra, Tamil Nadu and West Bengal have deteriorated in this regard.
Gujarat, Rajasthan and Karnataka have emerged as efficiently spending state in this parameter.
Health (Maternal Mortality Rate)
Same method has been used and following graph is obtained:
MMR of Kerala is among the lowest compared to other comparable states but the effect of its health
spend is not efficiently reflected on MMR as shown in the graph as health spend to decrease MMR by
one unit is rising sharply from 2007 onwards.
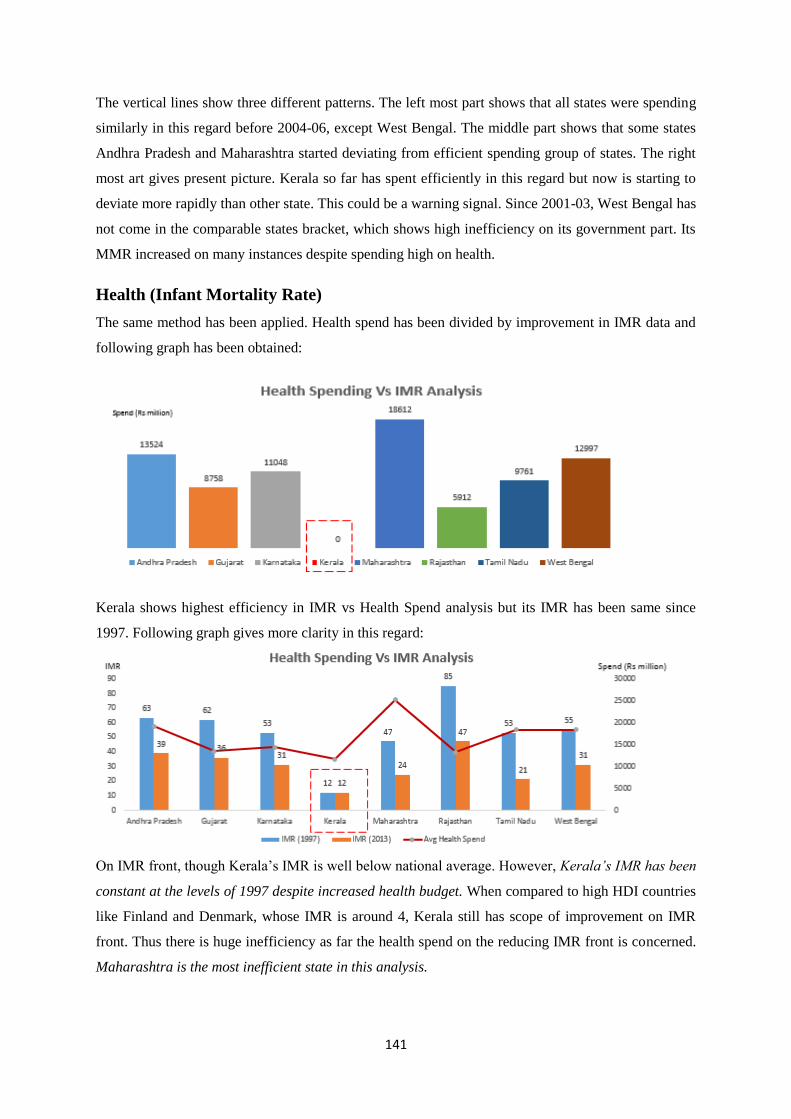
141
The vertical lines show three different patterns. The left most part shows that all states were spending
similarly in this regard before 2004-06, except West Bengal. The middle part shows that some states
Andhra Pradesh and Maharashtra started deviating from efficient spending group of states. The right
most art gives present picture. Kerala so far has spent efficiently in this regard but now is starting to
deviate more rapidly than other state. This could be a warning signal. Since 2001-03, West Bengal has
not come in the comparable states bracket, which shows high inefficiency on its government part. Its
MMR increased on many instances despite spending high on health.
Health (Infant Mortality Rate)
The same method has been applied. Health spend has been divided by improvement in IMR data and
following graph has been obtained:
Kerala shows highest efficiency in IMR vs Health Spend analysis but its IMR has been same since
1997. Following graph gives more clarity in this regard:
On IMR front, though Kerala’s IMR is well below national average. However, Kerala’s IMR has been
constant at the levels of 1997 despite increased health budget. When compared to high HDI countries
like Finland and Denmark, whose IMR is around 4, Kerala still has scope of improvement on IMR
front. Thus there is huge inefficiency as far the health spend on the reducing IMR front is concerned.
Maharashtra is the most inefficient state in this analysis.

142
Summary of Analysis
Based on all the above analysis on education and health parameters, the efficiency of spend results
have been summarized as below-
Recommendations
We have following policy recommendations based on our study and findings
• The lower spend to make one person literate by Gujarat can be attributed to low cost education
delivery models like Gyanshala, where the significant educational costs like teacher’s salary
cost, infrastructure cost etc. has been significantly brought down. Kerala can take inspiration
from this model
• Kerala can take help from consulting firms to create performance matrices (like optimum
student-teacher ratio, student-school ratio, optimum class size in education sector and optimum
doctor-patient, bed to hospital ratio in health sector) and identify where spending leakages are
happening and adopt processes to fill those gaps to increase its ROI on Education
• The government can create a policy regarding use of CSR money into education and health,
which can be used as additional fund for education and health expenses and divert its own funds
towards capex
• Deployment of ICT into education and health sector can help government reach to masses
without incurring significant cost
• Explore Public Private partnership in Child care to reduce IMR further as it has remained at
constant levels post 1997
• Government should start emulating models of countries like Brazil and South Korea and
become the Payer and should not remain provider of healthcare service. This would enable

143
government to free up resources resulting in huge cost saving and would improve the health
indicators like IMR etc.
• As the literacy level of a state rises, it becomes more and more difficult for a government to
further increase literacy because now more interior parts of state geography have to be accesses.
In this regard Kerala can map low literacy areas by districts or blocks and divert its resources
on them for better outcome at low cost. Also urban Kerala has already entered the self-
sustaining mode in education, in which society itself promotes education
References and Data Sources
1. HDI 2015 Data : UNDP 2015 Human Development Report ,livemint article
http://www.livemint.com/Politics/3KhGMVXGxXcGYBRMsmDCFO/Why-Kerala-is-like-
Maldives-and-Uttar-Pradesh-Pakistan.html
2. Office of the Registrar General and Census Commissioner, India & Planning Commission,
Govt. of India. (ON326, ON402)
3. Ministry of Health and Family Welfare, Govt. of India
4. Ministry of Statistics and Programme Implementation, Govt. of India. (ON815)
5. Source : RBI Study of State Finances : A Study Of Budgets & Office of the Registrar General
and Census Commissioner, India & Planning Commission, Govt. of India
6. RBI Study of State Finances : A Study Of Budgets & Office of the Registrar General and
Census Commissioner, India & Planning Commission, Govt. of India
7. LE Calculation Methodology Explained : http://blogs.worldbank.org/opendata/what-does-life-
expectancy-birth-really-mean
8. http://www.tradingeconomics.com/india/health-expenditure-public-percent-of-government-
expenditure-wb-data.html
9. http://www.ey.com/Publication/vwLUAssets/role-of-private-sector-on-K-12-education-in-
India/$FILE/EY-role-of-private-sector-on-K-12-education-in-India.pdf

144
Appendix 4: Proceedings of a seminar on 'Kerala state finances’
held on 18 February 2017, at IIM Kozhikode Campus
Indian Institute of Management, Kozhikode in association with NITI Aayog conducted a one-
day seminar on Kerala State Finances: Problems and Prospects on 18th February 2017, Saturday
from 9.30 am to 4.30 pm which was attended by intellects from various organizations and
institutes, faculty and students from universities and colleges, researchers and other interested
members of the public.
The delegates were welcomed by Prof. Sthanu R Nair, Associate Professor, IIM Kozhikode.
The special invitees of the seminar, Shri Ajay Kumar Nema, Director and Shri S Lakshmanan,
Research Associate from the Financial Resources Division of NITI Aayog graced the occasion
with their presence. They explained why it is significant to study the state finances and the
importance of identifying the ways to improve the fiscal situations of the state economies.
The program was scheduled across three technical sessions. The first technical session was
moderated by Prof. Pulapre Balakrishnan, Senior Fellow – IIM Kozhikode and also Professor
at Ashoka University, Sonepat.
Prof. B A Prakash, Chairman, State Finance Commission, spoke on the acute fiscal crisis facing
Kerala. He mentioned that the state places low priority to raising own resources. He pointed
out that while pay revision happens every five years, the tax and non-tax rates on public
services have not been revised for decades. He felt this would lead to fiscal anarchy in 2017-
18 and by 2021 the state is likely to default on salaries, pensions and loan repayment. Prof.
Pinaki Chakraborty of the National Institute of Public Finance and Policy discussed the
evolution of centre-state financial relations. He said that the extent of untied transfers to states
from the centre has gone up but the states are expected to spend the money judiciously. He
anticipated a fiscal contraction of states in case the recommendations of the FRBM review
committee to limit debt to 20% of GDP get implemented.
In the second technical session, Prof. Soumyatanu Mukherjee, Assistant Professor, IIM
Kozhikode moderated the presentation. Prof Sthanu R Nair, Prof Rudra Sensarma and
Rajalakshmi T of the IIM Kozhikode discussed their research findings on the trends in Kerala
state finances. They argued that while debt appears to be under control but rising revenue deficit
and interest payments at the cost of capital spending is a concern. While expenditure on

145
economic and social services in Kerala have shown an increase, they have not risen in
proportion to the state’s economic growth. On the revenue front, own tax revenues have
declined as a share of GDP and tax revenue collection has not been efficient. The healthy
growth exhibited by non-tax revenues was on account of lottery sales. Prof K Pushpangadan,
former Chairman of the Public Expenditure Review Committee highlighted the importance of
studying the link between decentralization and growth. He emphasized the need to study the
efficiency of government spending by studying outcomes.
The moderator of the third technical session was Prof. Ashok Thomas, Assistant Professor, IIM
Kozhikode. Prof Jose Sebastian of the Gulati Institute of Finance and Taxation demonstrated
that Kerala does not realize its full revenue potential in spite of having the highest per capital
consumption expenditure in India. He criticized the focus of revenue collection being limited
to three commodities – alcohol, petrol and motor vehicles. Even the share of revenues from
gold business is very small compared to the huge growth in consumption of the yellow metal.
He felt that resources are collected from the poor in the form of alcohol and lottery sales but
benefits are enjoyed by the rich such as in the form of subsidies on education. Prof K R
Shanmugam of the Institute of Financial Management Research, Chennai, showed that Kerala
is the only state in Southern India whose debt is not sustainable. He pointed towards the history
of VAT introduction in 2005 which led to higher inflation rates in Indian states and anticipated
a similar outcome from the introduction of GST.
Rakesh Kumar Yadav and Divyanshu Jain, students of IIM Kozhikode presented an analysis
of efficiency of spending of Kerala government in the social sector. They showed that although
the state has achieved high social outcomes, the state government’s spending in the health
sector is not efficient compared to similar states of India. P Brijesh of the Reserve Bank of
India showed that states have crossed the FRBM limit of gross fiscal deficit of 3% of GDP. He
demonstrated that capital expenditure is important for economic growth but unfortunately
Kerala has not spent sufficiently on asset creation and has instead generated high revenue
deficit. Prof Rudra Sensarma offered concluding remarks and thanked the audience. The
audience were able to participate in the discussions by sharing their perspectives and getting
their questions answered.


![INDEX [niti.gov.in]niti.gov.in/writereaddata/files/document_publication...INDEX 1 NITI AAYOG - AN OVERVIEW Organization Structure 2 Objectives & Functions 4 2 COOPERATIVE FEDERALISM](https://img.pdfslide.us/doc/110x75/5e857e6f2179c6609233d8cc/index-nitigovinnitigovinwritereaddatafilesdocumentpublication-index.jpg)