Embed Size (px)
Citation preview

REPORT ON RESERVE AND UNDERWRITING RISK FACTORS
American Academy of Actuaries Property/Casualty Risk-Based Capital Task Force
105
P&C Risk-Based Capital
One of the components of the proposed Property & Casualty Risk-
Based Capital formula is reserve and underwriting risk factors. The
American Academy of Actuaries Property & Casualty Risk-Based Capital
Task Force has prepared the following report on these risk factors and
recommended them to the NAIC P&C Risk-Based Capital Working Group.
The Task Force recognizes that the measurement of risk is an emerging
area of thought and technology. The Task Force views this report as a
good foundation for further study of this critical issue, and not as the
“definitive word” on the subject. Hopefully this report will stimulate
further study of and papers on this subject.
Another component of the formula is covariance. Also included here
is a report on this topic to the Working Group.
American Academy of Actuaries
P&C Risk-Based Capital Task Force
David G. Hartman, Chairman Allan M. Kaufman
Ralph S. Blanchard Ill Frederick 0. Kist
Paul Braithwaite Stephen P. Lowe
Robert P. Butsic Daniel K. Lyons
Sholom Feldblum Michael G. McCarter
Patricia A. Furst Dale A. Nelson
Gayle Haskell William J. Rowland
106
Report on Reserve and Underwriting Risk Factors
From the
American Academy of Actuaries
Property/Casualty Risk-Based Capital
Task Force
Management RepoR
May 20, 1993
107
Table of Contents
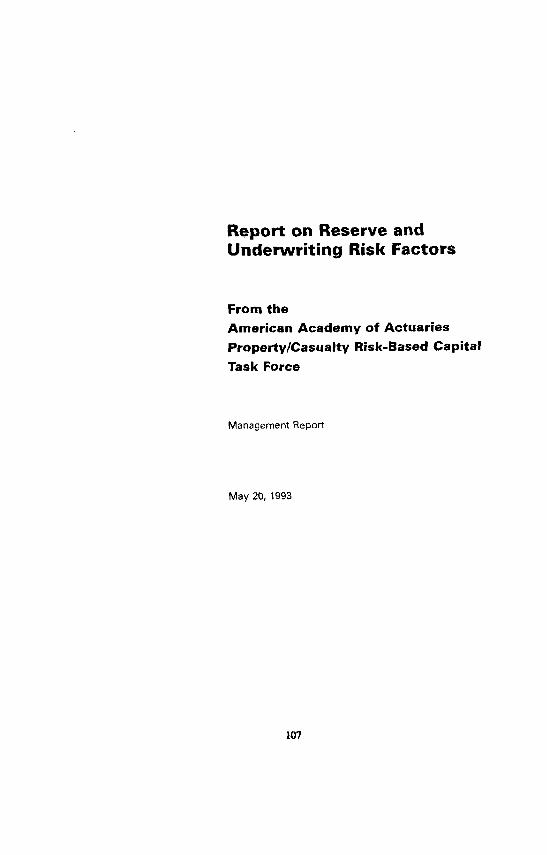
Introduction .I................................,.....,..........,,. 1
Critique of Current Reserve and Underwriting Risk Factors . . , . , . . . . . 2
Recommended Reserve and Underwriting Risk Factors , , , ~ . . . . . . 8
Development of Alternative Measures of Reserve and Underwriting Risk . . 12
Exhibits
1. Analysis of “industry” Risk
2. Analysis of “Company” Risk
3. Total Risk and Funding Requirements
4. Claims-Made vs. Occurrence Risk
5. Calculation of Alternative RBC Factors
6. Premium-to-Surplus Ratios and Recommended Factors
7. Risk-Based Capital by Component
108
May 1993 1
Introduction
Until its abolition in March of 1993, the Actuarial Advisory Ccmmitree to the NAIC
Property/Casualty Risk-Based Capital (RBC) Working Group had been engaged in a
comprehensive study of the factors for reserve and underwriting risk in the risk-based capital
formula. This study included reviewing and testing the current draft factors, and also the
development of reserve and underwriting factors by several alternative means. The
American Academy of Actuaries Property/Casualty Risk-Based Capital Task Force has
continued, and completed that study.
This report summarizes our analysis, conclusions and recommendations. It is supplemented
by a set of Technical Appendices which document our analysis and supporting cakculations
more fully.
This report starts with a critique of the method that was used by the Working Group to
develop the current reserve and underwriting risk factors, Next, these factors are compared
to the alternative factors recommended by the Academy Task Force. The balance of the
report describes the methodolopv thnr rhe Task Force developed to produce the
recommended alternative risk factors.
The reserve and underwriting risk factors in the risk-based capital formula imply a set of
charges by line of business. Ttfe focus of this scu@ is OH the nppropri~terress of the level of these charges and sot o?t the specific fomruln meclmtics thngb which the fitws ma& be applied.
For example, it is not the purpose of this report to discuss whether or how individual
company experience should be reflected in developing the risk charges, or wherher reserve
risk charges should be converted to factors applicable to historical premiums rather than
held reserves. Instead. we are considering the basic issue of the level of the risk charges by
line of business.
109
May 1993 2
Critique of Current Reserve and Underwriting Risk Factors
The current factors are based on industry ‘worst-case” experience.
The current reserve and underwriting risk factors in the drafr risk-based capital formula are
based on the “worst case” experience of the industry over the ten years From 1981-1990, as
reported in 1990 Annual Statements. Specifically:
n The reserve risk factors for each line reflect the average company’s reported reserve
development in the worst year of development For the industry for that Line.
m The written premium risk Factors for each line reflect the average cornpan+ reported
loss ratio in the worst year of experience for the industry for that line.
m In the RBC formula, all of the reserve and undenvriting risk factors are offset by a credit
for the time value of money, using a flat 5% interest rate and loss payout patterns
derived using IRS methodology
For example, the industry’s worst reserve inadequacy for Homeowners occurred in
December, 1983. Through December, 1990 the average company has reported adverse
Homeowners reserve development of 19.3%. Offsetting that development for interest
at 5% (a factor of ,910) produces a net development, and a net RBC charge of S.6% of
Homeowners reserves.
Similarly in 1989, the worst year of the last ten, rhe average company experienced a
Homeowners’ loss ratio of 82.2%. Discounting that loss ratio For interest at 5% (a Factor
OF .919) reduces it to 75.5%. Adding underwriting expenses of 31.S% produces a
combined ratio of 107.3%, and a net RBC charge of 7.3% of written premium.
The chart on the Following page summarizes the current RRC factors for each lint, and the
net charges they imply
110
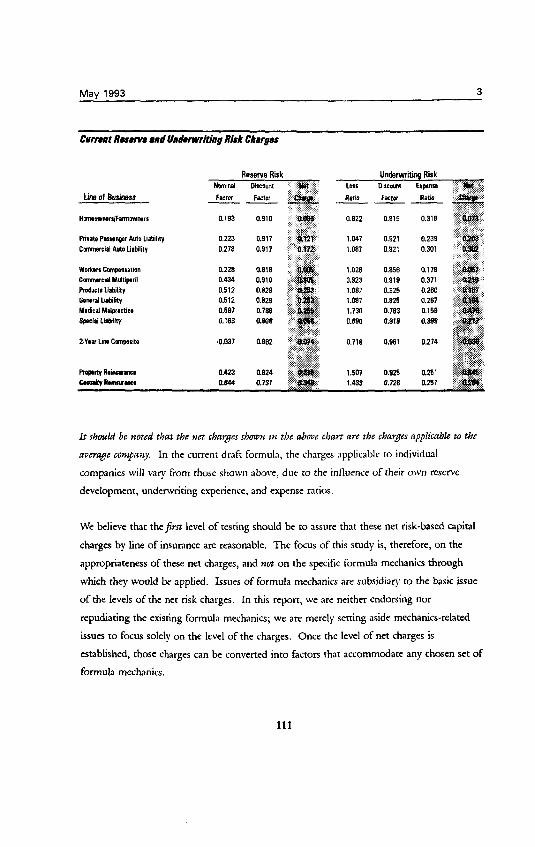
May 1993 3
Cnrmt Ronm rdllndarwriting Rizk Charges
Li of Business
0.193
Rirata Rrmnpar Auto Liability 0.223 CammU Auto Liabilii 0.278
WprkmCmnpnrstion 0.228 Cmrnwcici MJtipril 0.434 Rcductr UaLlilii 0.512 BmtllLitiiiiy 0.512 MuhI Maiprretic* 0.697 &mill Lirbilii 0.163
.0.037
Reserve I Nminal Llircour
0.423
LOSS
Ratio
0.822
1.047 1.087
1.026 0.923 1.087 1.087 1.730 0.990
0.718
1.507
Underwriting Risk Olrcom Factor --
j " 0.919 0.318 ,,omsi
s.. 0.921 0.239 f 0.921 0.301 "iC
,..l! 0.856 0.179 0.919 0.371 'J .t 0.825 0.260 : ,'i 0.825 0.287
0.7Q3 0.159
::G$
<: R 0.919 0.339
ryy9 0.561 0.274 p,g g:pt r
1.433 0.728 0.251
It should be mted that tite vet &ayes sbouw irk the above chart are tl?e clgaavges npplicabk w the
average campay. In the current draft formula, the charges applicable to individual
companies will vary from those shown above, due to the influence of rheir own reserve
development, underwriting experience, and expense ratios.
We believe that the first level of testing should be to assure that these net risk-based capital
charges by tine of insurance are reasonable. The focus of this study is, therefore, on the
appropriateness of these net charges, and not on the specific Formula mechanics through
which they would be applied. Issues of Formula mechanics are subsidiary to the basic issue
of the levels of the net risk charges. In this report, we are neither endorsing nor
repudiating the existing formula mechanics; we are merely setting aside mechanics-related
issues to focus solely on the level of the charges. Once the level of net charges is
established, those charges can be converted into factors that accommodate any chosen set of
Formula mechanics.
Mav 1993 4
The current factors emphasize the specific forces underlying the last
industry down-cycle, rather than the current and future risks to the
industry.
The current factors reflect the historical experience of the industry in the last underwriting
down-cycle. In particular, they reflect the severe adverse reserve development that occurred
in general liability, medical malpractice and reinsurance, and the very severe loss ratios in
malpractice and reinsurance.
The experience during this particular cycle is dominated by several factors:
H The tort Liability explosion, purricularlv in respect to asbestos and environmental
liabilities.
m A great deal of naive capacity, focused especially on general liabilitv and reinsurance lines.
n High interest rates, creating intense pressures to engage in cash flow underwriting
m High inflation rates.
While the next down-cycle could easily be as severe, the specific forces that drive it will
probably be different (as they are in each cycle), such thar the incidence of adverse results
by line will probably also be different. For example, indusrry observers currently see
Workers Compensation as a line in great distress. However, during the last cycle Workers
Compensation loss ratios and reserve developments were not particularly unfavorable. As a
result, the current reserve and underwriting risk factors for Workers Compensation are
relatively modest. A similar observation might apply to Homeowners, given the recent
catastrophe experience.
The methodology underlying the current factors, therefore, seems somewhat overly focused
on the specifics of the recent past. While past experience is useful as a guide, it needs to be
interpreted in terms of the current and future risks faced by the industry.
112
Mav 1993 5
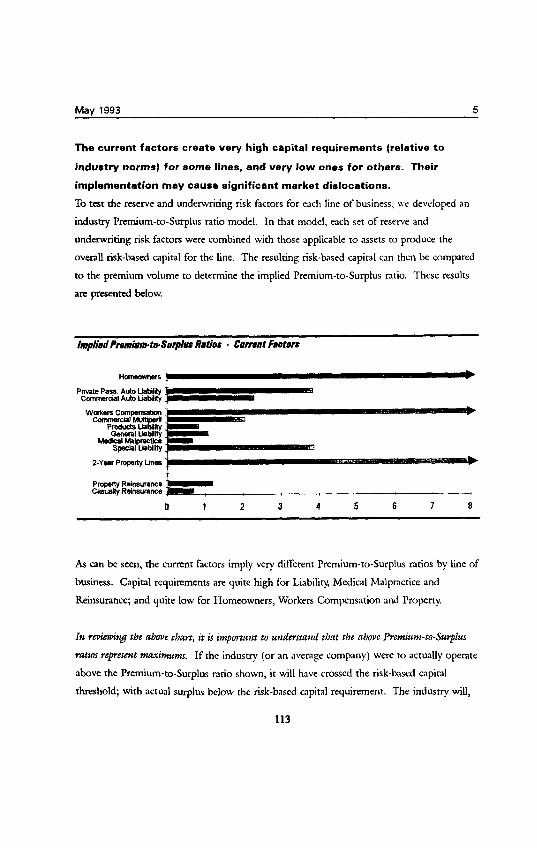
The current factors create very high capital requirements (relative to
industry norms) for some lines, and very low ones for others. Their
implementation may cause significant market dislocations.
To test the reserve and underwriting risk factors for each line of business, we developed an
industry Premium-to-Surplus ratio model In that model, each set of reserve and
underwriting risk factors were combined with those applicable to assets to produce the
overall risk-based capital for the line. The resulting risk-based capital can then be compared
to the premium volume to determine the implied Premium-to-Surplus ratio. These results
are presented below.
implied Pntninm-to&rplw ii&s - Current Factors
BYear Pmpwty Lines
0 1 2 3 4 5 6 7 6
As can be seen, the current factors imply very different Premium-to-Surplus ratios by line of
business. Capital requirements are quite high for Liability, Medical Malpractice and
Reinsurance; and quite low for Homeowners, Workers Compensation and Property
In rtirrg the &we chart, it is impartntrt to zmderrtn~rd that the above Premium-to-Surplus
r&r rcpresnlt mnrim~mr. If the industry (or an average company) were to actually operate
above the Premium-to-Surplus ratio shown, it will have crossed the risk-based capital
threshold; with actual surplus below the risk-based capital requirement. The industry will,
113
May 1993 6
therefore, have to capitalize each line b&w the Premium-to-Surplus ratios shown to prevent
individual companies fmm triggering regulatory attention.
Our use of the Premium-to-Surplus ratio as a test of the formula should not be
misinterpreted as an endorsement of this test as a measure of the capital adequacy of an
individual company. The Premium-to-Surplus ratio has been justifiably criticized for its
shortcomings as a measure of leverage. Here we are only using it to present overall in&stty
capital requirements for each line, using a conventional measure as a matter of convenience.
Premium-to-Surplus ratios do vary among different segments of the industry, reflecting
different risk profiles of the mix of business written by each industry segment (see the
recent study by ISO, for example). Tlge Am&my Sk Forcefully nrppm~s the notion that the
Risk-Bwed Capital requirements by line shld rtflecct discmrnbk dz@retrces in the riskiness of
cacb litrc. However, we are concerned that the swings in capital requirements displayed in
the preceding chart seem greater than most would think reasonable.
Based on current industry norms, the implied capital requirements for products and general
liabiliry, medical malpractice, and reinsunnce seem to be too high. This is a critical issue as
it is likely to affect the available capacity in these lines. Companies will tend to reduce
their future writings in lines where they perceive that capital requirements are too high,
focusing instead on lines where capital requirements are less. If the differences between
current perceptions of capital requirements by line and RBC calculated requirements by line
are large, the significant market implications of the differences require that the assumptions
underlying the RBC factors be analyzed critically.
Finally, we would caution that the Premium-ro-Surplus ratio model was developed as a
heuristic tool to aid in reviewing the implications of the level of the various risk-based
capital charges. The model required a number of simplifying assumptions that are
reasonable at the overall industry level, but are not appropriate for use in evaluating the
impact of the formula on an individual company. For example, in the model we assume an
industry average mix of invested assets for each line, and we do not consider any of the
charges for investments in afliliates. Due to these simplifying assumptions, the model
114

May 1993 7
understates the total risk-based capital generated by the formula, by an estimated 15 to
20%. Despite these limitations, we believe die model is a useful tool for comparing the
relative risk-based capital requirements by line of business.
The assumptions underlying the Premium-to-Surplus rate model are summarized in the last
section of this report. Further details can be found in Appendix C.
115
Mav 1993 8
Recommended Reserve and Underwriting Risk Factors
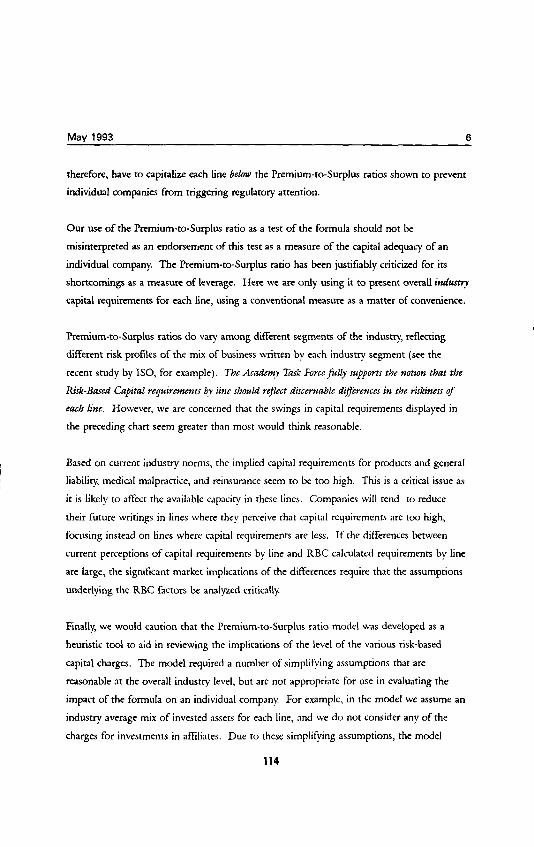
Our recommended factors reflect the inherent riskiness of each line of
insurance.
After testing a variety of approaches, the Academy Task Force has developed a set of
alternative reserve and underwriting risk factors, which it recommends the Working Group
adopt and incorporate into the draft RBC formula.
The methodology rationale and supporting data that underlie our recommended alternative
factors are described in the next section of this report. Additional supporting detail is
provided in a set of Technical Appendices. While the methodology underlying the
recommended factors is somewhat complex, we believe the resulting factors better reflect
the inherent riskiness of each line of insurance.
Our recommended alternative reserve nnd undcnvriting risk Etctors arc summarized in the
chart below.
Prqtmwd Alt8rmtivr Reserve and Underwriting Risk Charges
Reserve Risk Nminal Dircwnt
Factor hctw --
0.304 0.920
0.209 0.918 0.232 O.Sol
0.292 0.850 0.293 0.992 0.269 0.875 0.411 0.815 0.243 0.685 0.370 0.825 0.254 0.045 0.399 0.765 0.293 0.097
0.325 0.966
0.339 0.659
Underwriting Risk
1.012 0.941 0.316
0.099 0.924 0.239 0.967 0.099 0.301
1.101 0.002 0.179 0.973 0.691 0.371 1.133 0.947 0.260 1.407 0.799 0.260 1.090 0.664 0.267 1.320 0.905 0.267 1.326 0.923 0.159 I.666 0.745 0.159 0.845 0.912 0.399
0.941 0.963 0.274
1.154 0.862 0.262
tht a
O.&-O
Lwo D.t3Cl
u.m lw40 mKl ha70 Lkm w3u
m00 w50 5.r30
0.400 0.914 5.280 1.310 0.915 0.251 0.460 0.465 0.751 0.150 1.399 0.740 0.251 iiml
116
May 1993 9
The overa level of risk-based capital is a key judgement that must be made before the
formula can be finalized. Raising the charges increases the level of capital, which increases
the security afforded to policyholders. At the same time, the higher level of capital implies
higher costs for policyholders, to provide the necessary returns on the higher capital.
Ultimately; the formula must strike a balance between the competing objectives of security
and cost.
Oz~r tmmmm.&d factms are mcnrrt to be “mtutval” otz this isf#e. We have calibrated them so
that they produce the same amount of total risk-based capital for the primary insurance
industry as the current factors. This was done largely to permit their comparability to the
current factors, and should not be interpreted as an endorsement of the resulting level of
capital, per se.
Ij aper review arrd test+@, the N6rkitrg Group wishes to n&c m imwr the level of capital, our
ftiors can ear@ be rccalcrhted to reject the desired level. As will be seen in subsequent
sections, the methodology we have developed to calculate the factors makes use of an
explicit capital standard (the Expected Policyholder Deficit) as an input. We calculated
factors at several alternative capital standards before settling on our recommendation.
Note that the recommended risk factors include separate factors for claims-made versus
occurrence business. As part of our analysis, we performed a separate study of the relative
riskiness of the two coverage forms. Based on that study we are recommending lower
factors for claims-made business than for occurrence business.
Our study also updates the discount factors to reflect 1991 Schedule P experience. The
discount factors continue to be based on IRS payout pattern methodology and a 5%
interest rate.
Finally as a simplification to the formula we have constructed underwriting risk factors that
include provision for the risk associated with both written and unearned premium, but are
applicable t&y to written premium. Thus, if our factors were adopted, it would be
appropriate to delete the unearned premium componenr in the formula.
117
May 1993 10
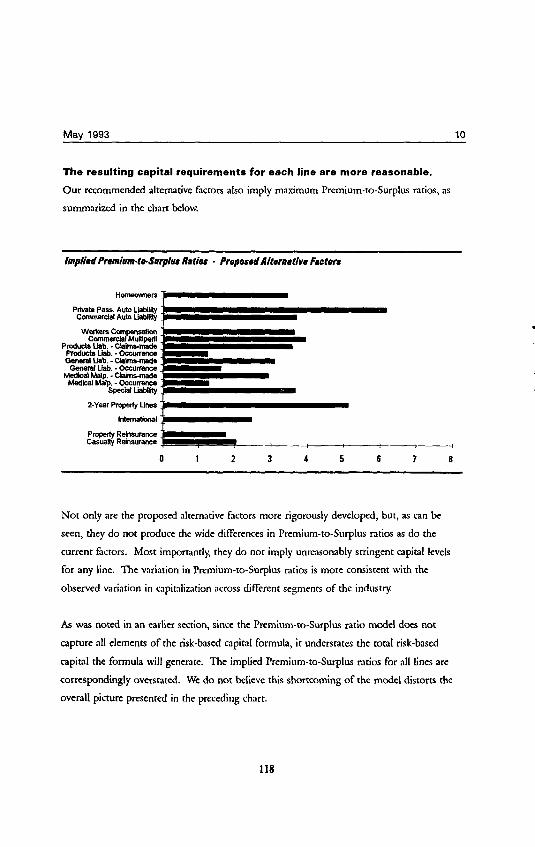
The resulting capital requirements for each line are more reasonable.
Our recommended alternative factors also imply maximum Premium-to-Surplus ratios, as
summarized in the chart below.
Inydivd Premium-t&urplur Ratios - Proposed Altarnativv Factors
Private Pass. Auto Liibilii Commercial AuIo LkabUii
wwkefscanpensatbn Commercial Muitipwll
Products lhb.. Clskns-made Products Uab. - Ocwrrmos General lhb. -Clam
GenemlL~.-occu- Mediil Map.. ck.ims-mada
khdll hklp. - ocwnenc8 Special Liabnky
0 1 2 3 4 5 6 7 6
Not only are the proposed alternative factors more rigorously developed, but, as can be
seen, they do not produce the wide differences in Premium-to-Surplus ratios as do the
current factors. Most importantly, they do not imply unreasonably stringent capital levels
for any line. The variation in Premium-to-Surplus ratios is more consistent with the
observed variation in capitalization across different segments of the industry
As was noted in an earlier section, since the Premium-to-Surplus ratio model does not
capture all elements of the risk-based capital formula, it understates the total risk-based
capiml the formula will generate. The implied Premium-to-Surplus ntios for all lines are
correspondingly oversmted. We do not believe this shortcoming of the model distorts the
overall picture presented in the preceding chart.
118
May 1993 11
It is essential that work continue to improve and refine the measurement
of risk.
The Academy Task Force believes that its recommended alternative factors, and the
approach it has developed to measure risk, are a substantial improvemenr over the currenr
draft factors. However, the Task Force also recognizes that the measurement of risk is an
emerging area of thought and technology. The Task Force views this report as a good
foundation for further study of this critical issue, and not as the “definitive word” on the
subject.
119
Mav 1993 12
Development of Alternative Measures of Reserve and Underwriting Risk
The approach underlying the current factors can be summarized as follows:
Industry-wide bias in reserving and pricing was identified as a major risk factor, and it
was measured from Schedule P information on an undiscounted basis.
It was agreed that investment income on assets corresponding to loss reserves and
premium should be considered before using rhe values from Step 1.
Individual company fluctuation around the indust? bias was considered relevant, but
was not reflected because (a) the factors derived from Steps 1 and 2 above were
already sufficiently conservarive, and (b) there was not readily available a mcchod to
measure individual company variation.
The approach that the Academy Esk Force has rnken improves on the currenr approach in
the following ways:
The method conrinues ro use Schedule P runoff information as a srnrting point.
Rather than using a flat 5% interest rate, the interest rate is based on the prevailing
interest rate during the historical period. Since company earnings actually reflected
these prevailing rates, the variable rates better measure the risk.
Measurements of industry variability over time and individual company variability
around the industry average have been prepared in a form which can bc reflected in
the analysis.
With these improvements, the alternative reserve and underwriring risk factors have been
developed, as described furrher in rhe sccCons below
120
Mav 1993 13
Our reserve and underwriting risk factors are developed using a conGotent
conceptual approach.
The fundamental risk associated with insurance contracts is that the actual cost of claim
liabilities will vary from expecred costs.
This risk obviously exists on all future business, because the insured events may or may not
occur. In addition, the claim costs of the events that do occur are affected by the future
social and economic conditions during which they are settled, adding to the uncertainty of
their cost. A portion of the risk therefore remains on past business, to the ement that not
all claims are settled.
Because claims can take several ymrs or more to settle, their economic cost needs to be
measured on a present value basis, using interest rates prevailing at the time.
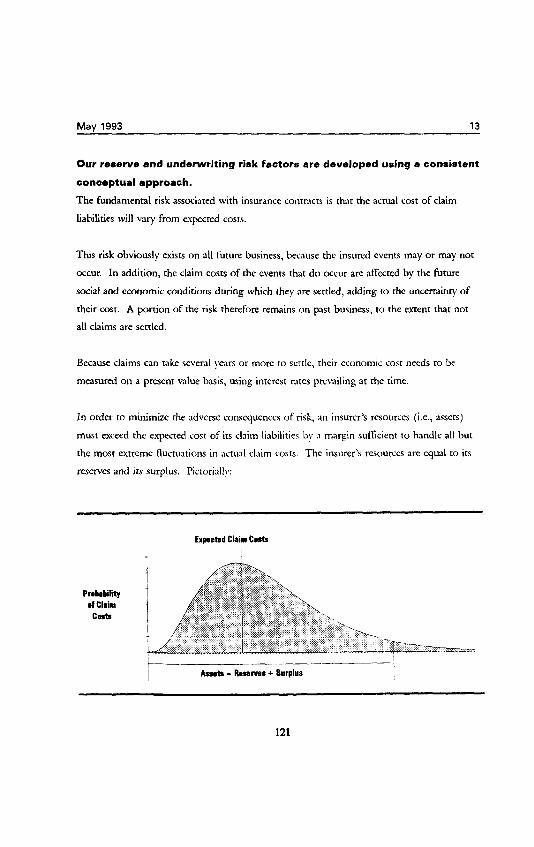
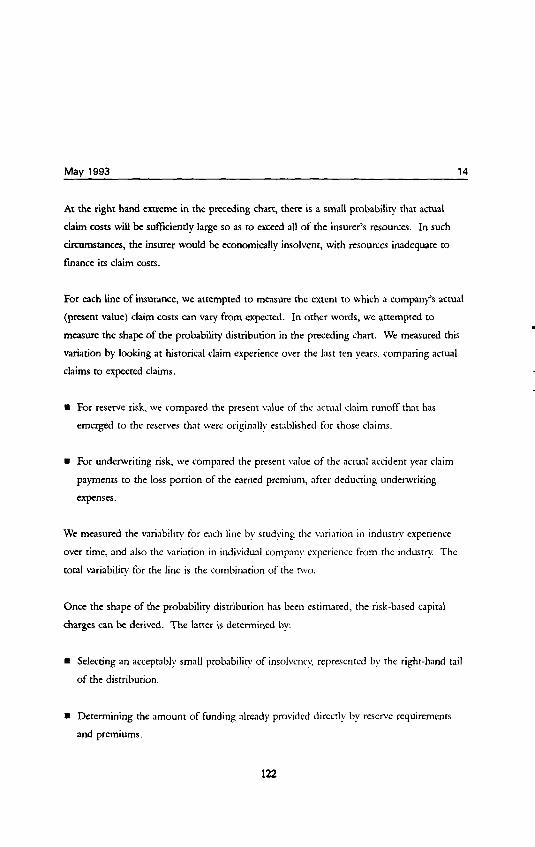
In order to minimize the adverse consequences of risk, an insurer’s resources (i.e., assets)
must exceed the expected cost of its claim liabilities by a margin suflicienr fo handle all but
the most extreme fluctuations in actual cl.lim costs. The insurer’s resources are equal to its
reserves and its surplus. Picrorinll~:
Expacfad Claim Caab
I
Prabability of Claim
Cd3
121
Mav 1993 14
At the tight hand extreme in the preceding chart, there is a small probability that actual
claim costs will be suff%ently large so as to exceed all of the insurer’s resources. In such
cimumstances, the insurer would be economically insolvent, wirh resources inadequate ro
finance its claim costs.
For each line of insurance, we attempted to measure the extent to which a company’s actual
(present value) claim costs can vary from expected. In other words, we attempted to
measure the shape of the probability distribution in the preceding chart. We measured this
variation by looking at historical claim experience over the last ten years, comparing actual
claims to expected claims.
n For reserve risk, we compared the present value of rhc .~cru.~l claim runoff that has
emerged to the reserves that were originallv esrablished for those claims.
n For underwriting risk, we compared the present value of the actual accident year claim
payments to the loss portion of the earned premium, after deducting underwriting
expenses.
We measured the vnrinbiliy for each line by studying the ~.ui.nion in indust~ experience
over time, and also the varinrion in individual company experience from the induq. The
total vatiabilitv for the line is the combination of the nvo.
Once the shape of the probability distribution has been estimated, the risk-based capital
charges can be derived. The latter is determined by:
n Selecting an acceptably small probnbiliy of insolverq represented by the right-hand tail
of the distribution.
m Determining the amount of funding already provided directly by reserve requirements
and premiums.
122
May 1993 15
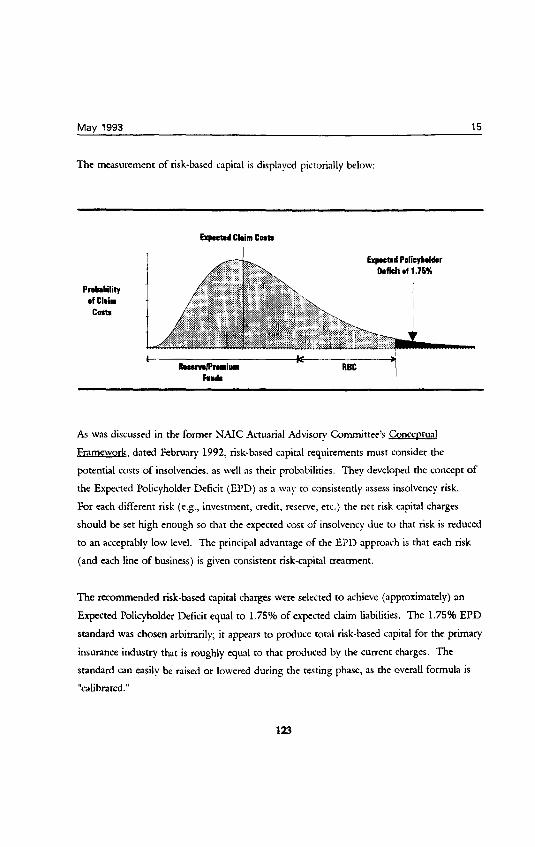
The measurement of risk-based capital is displayed pictorially below:
Expotid Poliiddsr Deficit of 1.76%
Probability of Chin
CWb
As was discussed in the former NAIC Actuarial Advisory Committee’s Conceptual
Framework, dated February 1992, risk-based capital requirements must consider the
potential costs of insolvencies, as well as their probabilities. They developed the concept of
the Expected Policyholder Deficit (EPD) as a way to consistently assess insolvency risk.
For each different risk (e.g., investment, credit, reserve, etc.) the net risk capital charges
should be set high enough so that the expected cost of insolvency due to that risk is reduced
to an acceptably low level. The principal advantage of the EPD approach is that each risk
(and each line of business) is given consistent risk-capital treatment.
The recommended risk-based capital charges were selected to achieve (approximately) an
Expected Policyholder Deficit equal to 1.75% of expected claim liabilities. The 1.75% EPD
standard was chosen arbitrarily; it appears to produce total risk-based capital for the primary
insurance industry that is roughly equal to that produced by the current charges. The
standard can easily be raised or loweted during the testing phase, as the overall formula is
“calibrated.”
123
Mav 1993 16
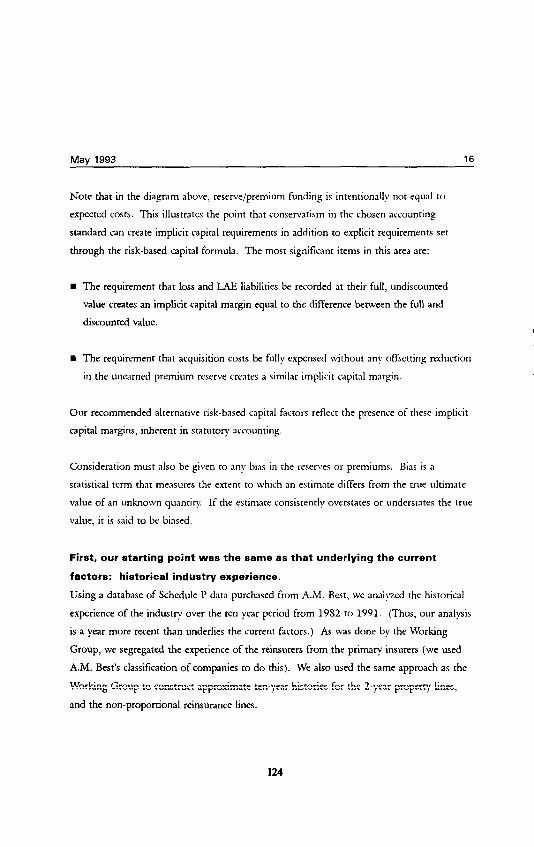
Note that in the diagram above, reserve/premium funding is intentionally not equal to
expected costs. This illusrrates the point thar consewarism in the chosen accounting
standard can create implicit capital requirements in addition to explicit requirements ser
through the risk-based capital formula. The mosr significant items in this area are:
n The requirement thar loss and LAE liabilities be recorded at their full, undiscounted
value creates an implicit capital margin equal to rhe difference between rhe full and
discounted value.
n The requirement that acquisition costs be fully expensed withour any offsetting reduction
in the unearned premium reserve creates a similar implicit capital margin.
Our recommended alternative risk-based capital factors reflect the presence of these implicit
capital margins, inherent in staturory accounring.
Consideration must also be given to any bias in the reserves or premiums. Bias is a
statisrical term that measures the extent to which an estimate differs from rhe true ultimate
value of an unknown qua&y. If the estimate consisrently overstates or understates the rrue
value, it is said to be biased.
First, our starting point was the same as that underlying the current
factors: historical industry experience.
Using a database of Schedule 1’ darn purchased from A.M. Best, we analyzed the historical
experience of the industry over the ten year period from 1982 to 1991. (Thus, our analysis
is a year more recent than underlies the current factors.) As was done by the Working
Group, we segregated the experience of the reinsurers from the primary insurers (we used
A.M. Best’s classifiLxtion of companies to do this). We also used the same approach as the
Working Group to construct approximate ten-year histories for the 2-year property lines,
and the non-proportional reinsurance lines.
124
May 1993 17
Second, rather than using a flat 6% interest rate, we varied the rate based
on prevailing interest rates during the historical period.
The curtent factors are based on nominal reserve development and nominal loss ratios.
Separately, credit for the time value of money is given using a constant 5% interest rate.
This approach overlooks the correlation between the level of inrerest rates and industry
underwriting experience. Intuitively, it makes sense that during periods of high interest
rates loss ratios will bc higher, bccausc market considerations force companies to set their
prices in anticipation of invesrment income. Since high interest rates often occur during
high inflation periods, it also makes sense that reserve development will be worse during
periods of high interest rates. Industry experience over the last ten years generally supports
both of these hypotheses.
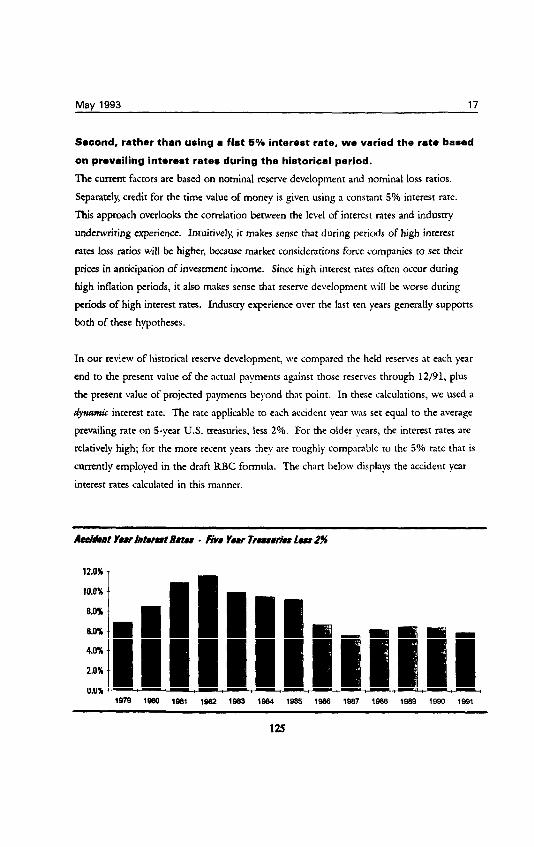
In our review of historical reserve development, we compared the held reserves at each year
end to the present value of the actual payments ag.linst those reserves through 12/91, plus
the present value of projected payments beyond that point. In these calculations, we used a
dytuunic interest rate. The rate applicable to each accident year was set equal to the average
prevailing rate on Ii-year U.S. treasuries, less 2%. For the older years, the interest rates are
relatively high; for the more recent years they are roughly comparable to the 5% rate that is
currently employed in the draft RBC formula. The chart below displays the accident year
interest rates calculated in this manner.
12.0%
10.0%
6.0%
6.0%
4.0x
2.0%
0.0%
May 1993 18
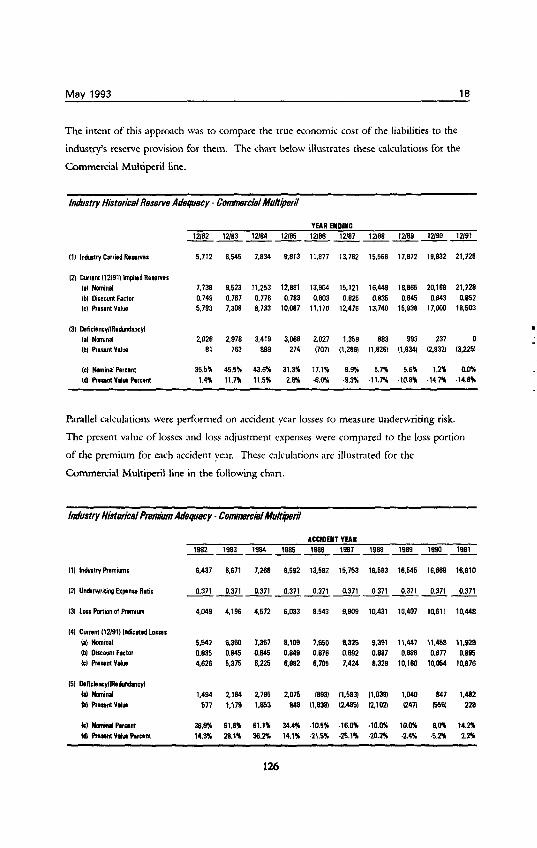
The intent of this approach was to compare the true economic cost of the liabilities to the
industry’s reserve provision for them. The chart below illustrates these calculations for the
Commercial Muhiperil tine.
hdustry Historicat Reserve Adequacy - Comamrcial hftd@er~
YEAREIDINC 12l92 12193 12164 12l65 12196 12197 lzl66 12199 12190 12191 ----P----P
5.712 6,545 7,634 9,913 11,677 13,762 15,599 17,672 19,932 21,726
7.739 9,523 11,253 12661 13,904 15,121 16,449 16,965 20,169 21.726 0.749 0.767 0.776 0.793 0.603 0.625 0.635 0.945 0.943 0.952 5,793 7.363 6,733 10,067 11,170 12,476 13,740 16,939 17,OOS 16,503
2,026 2,979 3,419 3.096 2,027 1,359 693 993 237 0 91 763 699 274 17071 f1,2961 K9261 (1.9341 f2.9321 f3.2261
35.5% 45.51 43.6% 31.3% 17.1% 9.9% 5.7% 5.6% 1.2% 03% 1.4% 11.7% 11.5% 2.6% .6.0% .9.3x .11.7x .lD.SK .14.7x .14.9!4
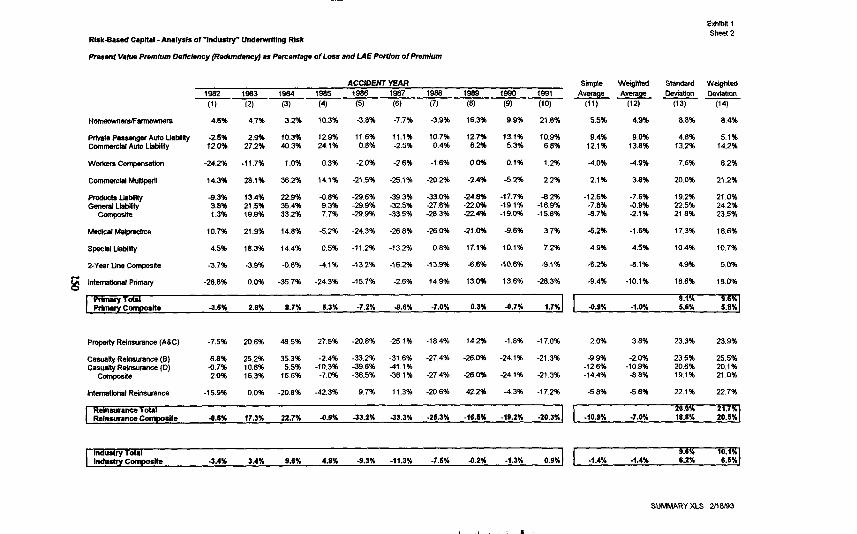
Parallel calculations were performed on accident year losses ro measure underwriting risk.
The present value of losses and loss adjusrment expenses were compared to rhe loss portion
of the premium for each accident year. These calculations are illusrnted for rhe
Commercial Multiperil line in the following chart.
lndustrv Historkal Premium Adeqaacy . Cotmmvciai Muh@eril
ACCIDENTYEAR 1982 1963 1964 MS5 1966 IS87 1966 1996 16s 1981 ----__-----
III lndurfry Romiwoc 6,437 6,671 7,269 9,592 13,562 15,753 19.593 16,545 16.989 16,610
12) Undrmriting Expnu Ratio 0.371 0.371 0.371 0.371 0.371 0.371 0.371 0.371 0.371 0.371 ----------
4,049 4,196 4,572 6.033 9,543 9,909 10.431 10,407 10,611 lo.448
5,542 6.380 7,367 8,lDS 7.650 6.326 8,391 11.447 11.456 ll.S2S 0.935 0.945 0.945 0.646 0.976 0.962 0.967 0.888 0.877 0.985 4,626 5,375 6,225 6,962 9,705 7,424 9,328 10,160 10,054 10,976
1.494 2,164 a795 2,075 1993) fl.5631 11,039) 1,040 647 1.482 577 1,179 1.653 946 11.838) l2.465~ l2.102~ l24A (558) 229
39.9% 51.6% 61.1% 34.4% .10.5* -16.0% .lO.D% lO.D% 6.0% 14.2% 14.3% m.vh 39.x 14.1% -21.5% 25.1~ .m.zn .2.4X .5.2% 22%
126
May 1993 19
The details of borh of these sets of calculations for each line of business are presented in
Appendix A.
Third, we feel the best measure of risk is one that looks at the variability
in results, not at their absolute level.
As has already been noted, the current reserve and underwriting risk factors focus on the
“worst-case” level of industry experience. For Commercial Multiperil, the worst year of
reserve development (as reported through 12/91) was December, 1983 when reserves were
45.5% inadequate on a nominal basis and 11.7% inadequate on a present value basis. The
worst year for underwriting was 1984 when the loss ratio was 101.4%. In that year,
industry premiums were inadequate by 61.1% of losses on n nominal basis and 36.2% of
losses on a present value basis.
We believe thar risk is more appropriately measured bv analyzing the vaarinbility of results
(sratistically, rhe standard deviarion), rather than their ahsolutc level. The latter has been
influenced by the parricular circumsmnces of rhe last underwriting down-cycle. Using
reserve and underwriting variability measures is also consistent with the approaches used to
develop charges for other risk-capital elements. For example, the stock risk factor is based
on a vatiabilitv measure, rather than the worst-case decline in the stock market. Also, it
should be recognized that the historical deficiencies are included in the variability
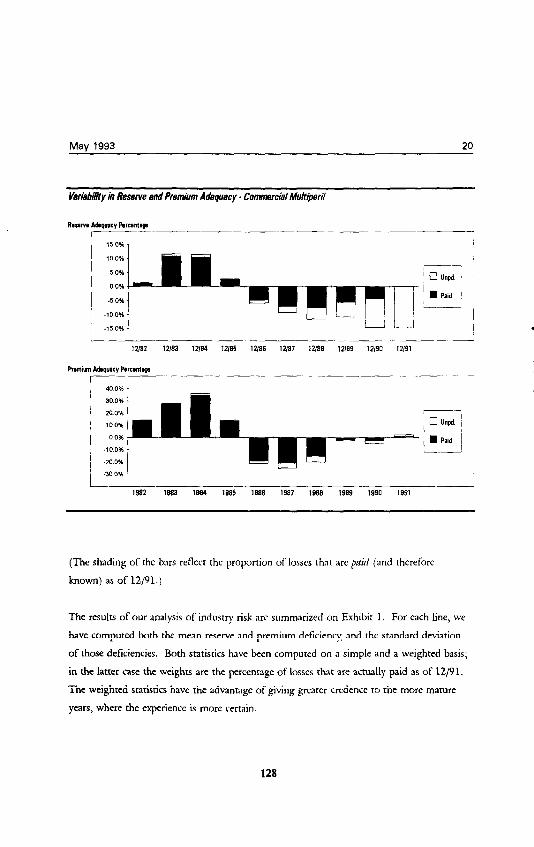
calculations. The variability in Commercial Multiperil results is displnved graphically below.
127
Mav 1993 20
VWWity S Rsser~e and Premtbm Adequecy. Commercial hitdt~erii
0 Unpd.
n Paid
11
/ i
i I
1 1982 lea3 1884 ls85 1896 1887 1988 1999 1980 1891
(The shading of the bars reflect the proportion of losses thar are paid (and therefore
known) as of 12/91.)
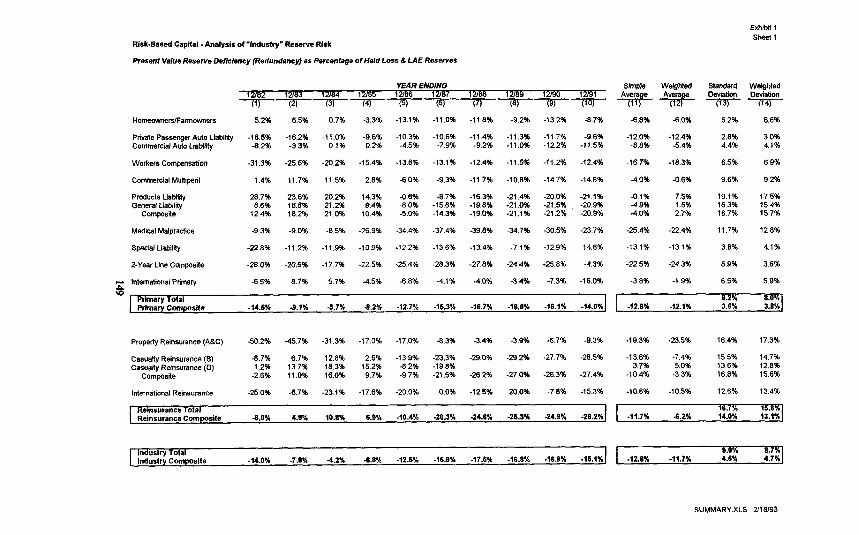
The results of our analysis of indusrry risk are summarized on Exhibir 1. For each line, we
have computed both the mean reserve and premium deficiency, and the standard deviation
of those deficiencies. Both statistics have been computed on a simple and a weighted basis;
in the latter case the weights are the percenuge of losses that are actually paid as of 12/91.
The weighted statistics have the advantage of giving greater credence to the more mature
years, where the experience is more certain.
128
Mav 1993 21
In reviewing Exhibit 1, several observations are noteworthy:
n During the entire ten year period, aggregate industry reserves were.nevvn’ itmdequnre on
an economic basis. Ar their weakest point, December 1984, the economic margin was
only 4.296, bur it was positive.
w During the entire ten year period, aggregate industry rates were inadequate in four of the
ten years. In 1984, premiums were inadequate on an economic basis by roughly 10%.
n Over the ten year period, the average economic margin in the loss reserves uas about
12%, as compared to an expected margin of about 20% based on the payouts and
interest rates thar prevailed. One could tentatively conclude from this that on average
roughly 40% (8% of 20%) of the intended margin is mken up bv an inherent bias
toward optimistic estimates in the reserve setting process.
m Over the ten year period, rhc average margin in the premiums was n profit of about
1.5%, suggesting rhar they eshibir a sm.tll posirivc hi.ls over the long run.
.
n Finally a comparison of the combination of the by line standard dcvintions (labeled
Primary, Reinsunnce and Industry “Total” on the Exhibit) to the standard deviations of
calculations performed on the all-lines composites shows the value of diversifying across
lines of business. The overall industry result is only half as variable as the average of the
by-line variability
129
May 1993 22
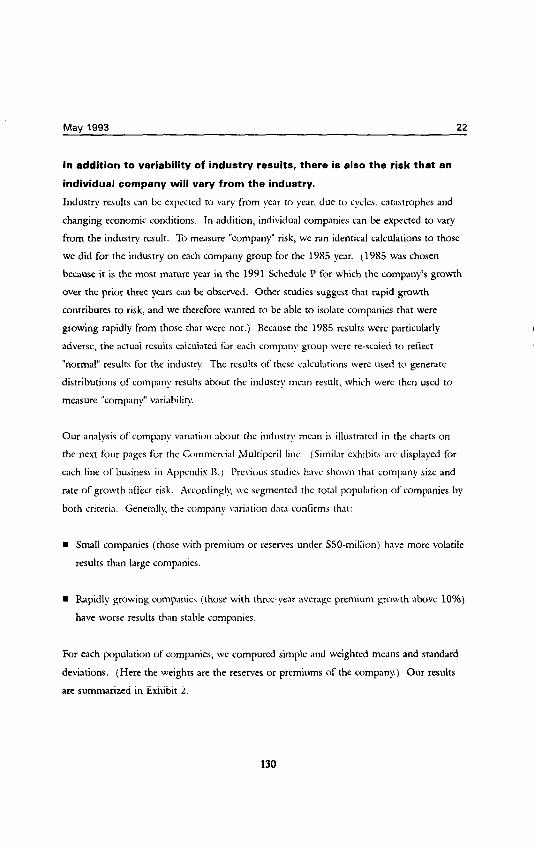
In addition to variability of industry results, there is also the risk that an
individual company will vary from the industry.
Industry results can be expected to vary from year to year. due to cycles, catastrophes and
changing economic conditions. In addition, individual companies can be expected to vary
from the industry result. To measure “company” risk, we ran identical calculations to those
we did for the industry on each company group for the 1985 “ear. (1985 was chosen
because it is the most mature year in the 1991 Schedule P for which the company’s growth
over the prior three years can be observed. Other studies suggest that rapid growth
contributes to risk, and we therefore wanted to be able to isolate companies that were
growing rapidly from those that were not.) Because the 1985 results were particularly
adverse, the actual results cnlcuinrcd for each company group were re-scaled to reflect
“normal” results for the industry. The results of these cakulnrions were used to generate
distributions of company results nbour the industy mean result, which were then used to
measure “company” variability
Our analysis of company variation nbour the industry me.m is illusrrated in the charts on
the next four pages for the Commercial Mulriperil lint. (SimiLlr exhibits arc displayed for
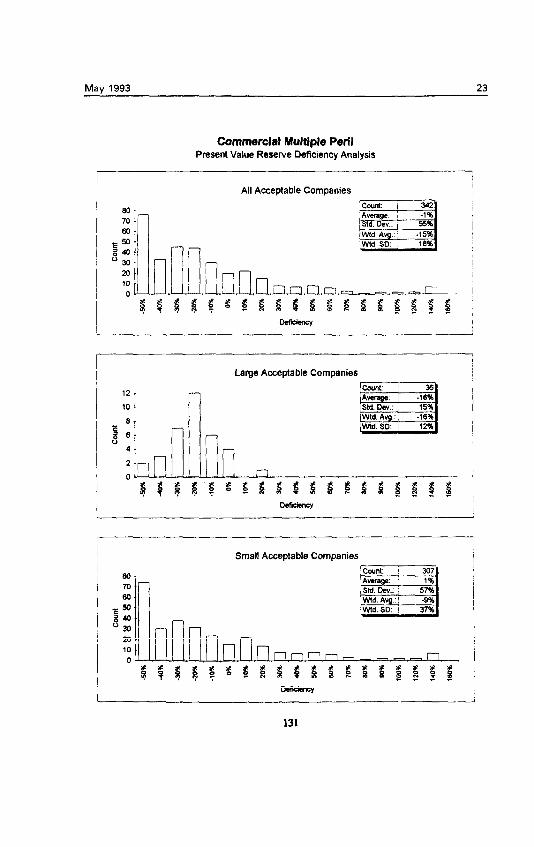
each line of business in Appendix B.) Previous studies h.lve shown that company size and
rate of growth .lffecr risk. AccordingI!; we segmented the total population of companies by
both criteria. GeneralI!: the company variation data confirms that:
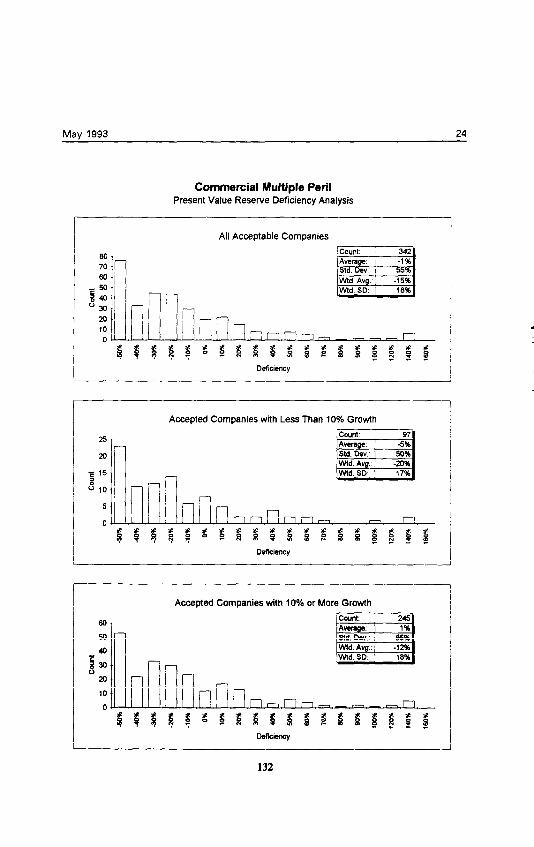
l Small companies (those with premium or reserves under SSO-million) have more volatile
results than large companies.
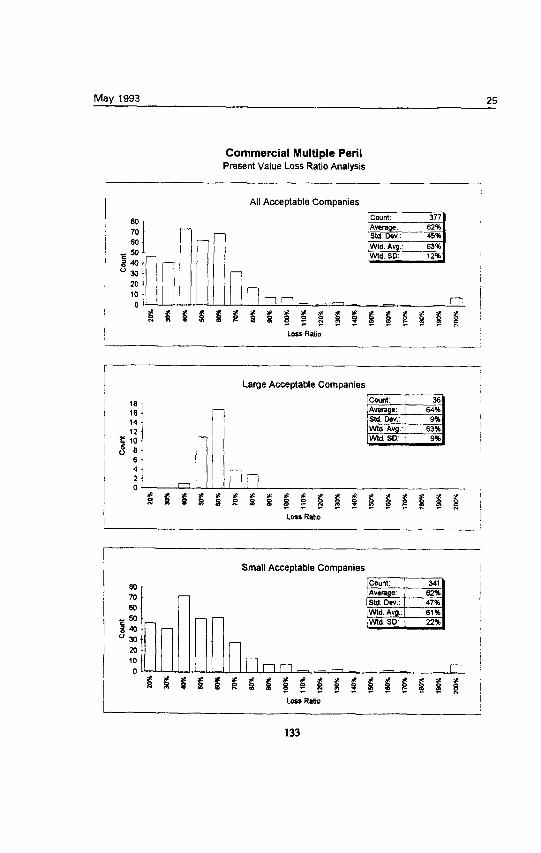
n Rapidly growing companies (those with threeyear average premium growth above 10%)
have worse results than stable companies.
For each population of compmies, we computed simple and weighted means and standard
deviations. (Here the weights are the reserves or premiums of the company.) Our results
are summarized in Exhibit 2.
130
May 1993 23
Commercial Multiple Peril Present Value Reserve Deficiency Analysis
All Acceptable Companies
Large Acceptable Companies
Small Acceptable Companies
May 1993 24
Commercial Multiple Peril Present Value Reserve Deficiency Analysis
All Acceptable Companies
Accepted Companies with Less Than 10% Growth
nl 1
D&&my
’ :
3% m
10
0
Accepted Companies with 10% or More Growth
cmmt: 1 245 Average: i 1% Std. Dev.: 1 56% Wtd. Aw.: j -12% Wtd.SD: 1 18%
n,nr-- - -n
132
May 1993 25
Commercial Multiple Peril Present Value Loss Ratio Analysis
All Acceptable Companies
Loss Ratio
! Loss Ratio
Small Acceptable Companies
L
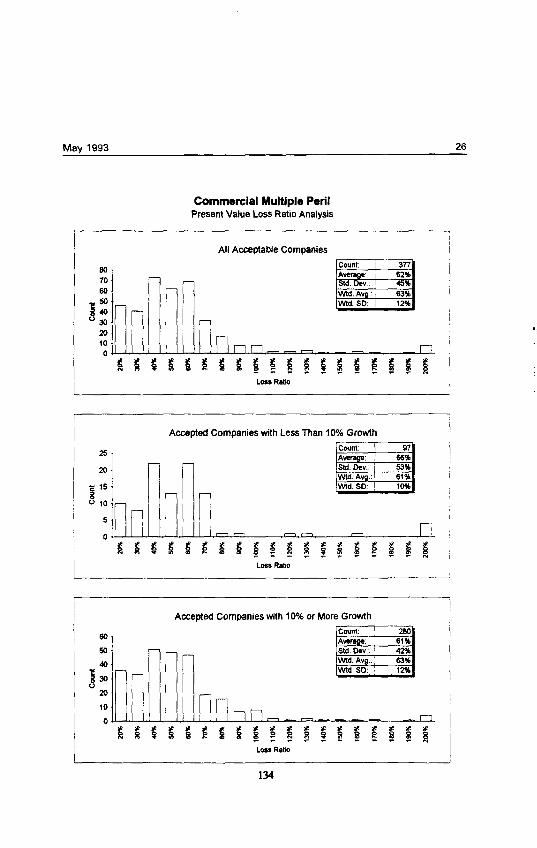
May 1993 26
Commercial Multiple Peril Present Value Loss Ratio Analysis
Accepted Companies with Less Than 10% Growlh
m
E 15 a 0 10
Loss R&o
COWt Avarapt: Std. Dev.: V&d. Avg.: Wtd. SD
97 56% 53% 61% 10%
Accepted Companies with 10% or More Growth
xl 40
B 30 m 10
Lou Ratio
May 1993 27
(Note that the standard deviations on the preceding two pages, and in Appendix B, are the
standard deviations of the loss and ALAE ratios. Ultimately, we chose to measure
underwriting risk as the standard deviation of the adequacy of the loss and LAE portion of
the premium. This necessitated an adjustment IO the Appendix B results, to account for
underwriting and unallocated loss adjustment expenses. This adjustment is reflected in the
standard deviations in Exhibit 2.)
The total risk a company faces is a combination of ‘industry” risk and
‘company” risk.
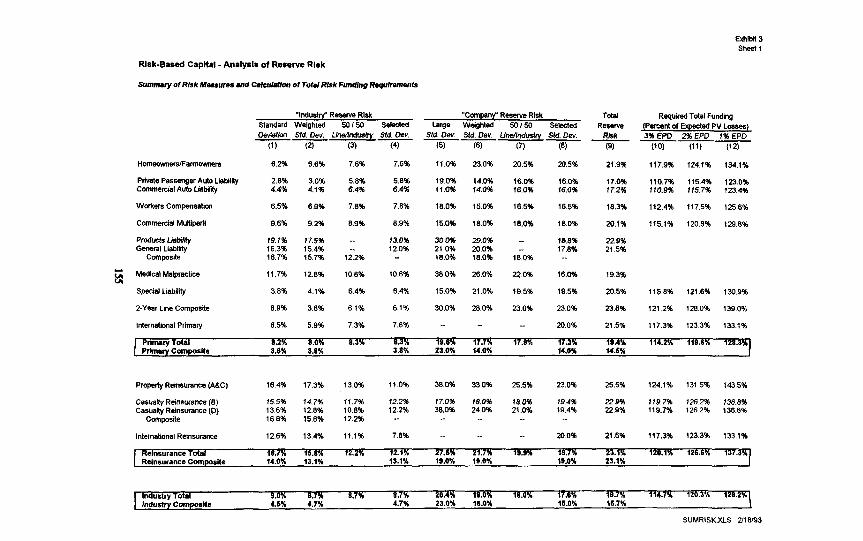
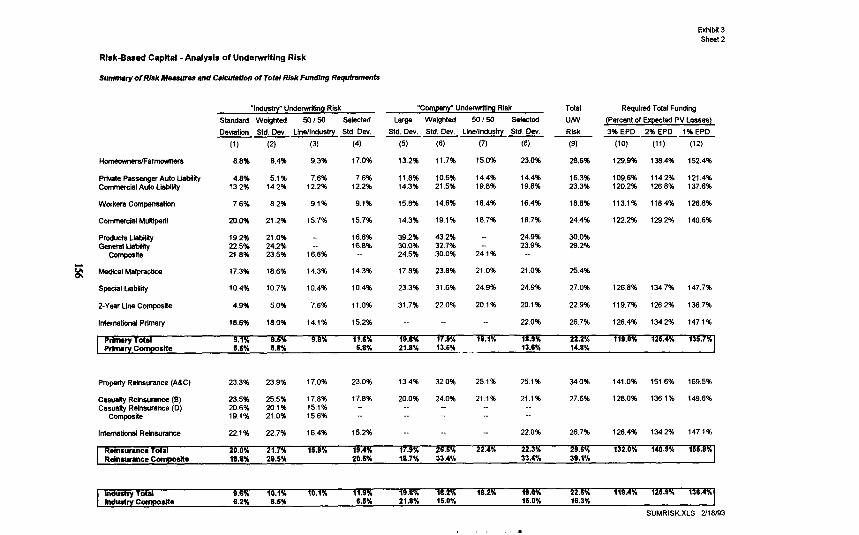
The “industry” risk measures and “company” risk measures calculated for each line in
Appendices A and B are summarized in Exhibit 3. As a next step, the two sources of risk
are combined to produce an indicated total risk for each line. Fin+, from the total risk an
indicated total funding level is calculated at various Expected l’olicvholder Deficit levels.
Working across Exhibit 3 from left to righr:
l The “industry” risk standard devi.lrions reflect the observed variation of industry results
over time. Both simple and weighted standard deviations are shown, along with a
standard deviation char is a 50-50 weighting of the weighted standard deviation for the
line and rhe weighted standard deviation for rhe indusrry total. The larrer reflects the
lack of full credibili~ that should be artached to rhe individwl line dnt.1.
The “selected” industry risk standard deviations are based on the SO-50 weighted
standard deviation, except where a judgmental selection was required by special
circumstances. Those situations are noted below:
- For Products and General LinKlit): the selections retlect rhe composite indications
and a selected 1% differential. These lines were split for the first time with the 1992
Annual Statement. Companies were required to construct the entire ten yesr histories
at that time, requiring allocations of bulk reserves and other adjustments. While the
data suggesrs that Producrs Liability is riskier, we feel thnr the individual line data is
135
May 1993 28
probably distorted by misnlloeations and other data problems. These distortions
would tend to overstate rhe risk of the lines.
- For International, the selected standard deviations are weighted averages of the
primary and reinsurer indications. Since this business is virtually all reinsurance, we
do not believe that the risk factors for this line should v.rry by type of company
- For Property Reinsurance (A&C), we selected the standard deviations judgmentally,
by reference to the other lines. The data for this line is “inferred” by subtracting the
casualty lines from the Schedule P summary We do not believe the resulting data
produces an entirely credible result.
- For Casualty Reinsurance (D), u’e selected the standard deviation of the
Reinsunnce (B) line; since lieinsurance (D) is in runoff, ten years of data does not
exist. Also, by the time the risk-based capital formula is implemented, all that will
realistically be lcfr in Reinsunnce (D) will be cnsual~ reinsurance.
- For Homeowners underwriting risk, we selected n higher standard deviation because
we believe that the ten year period used is not fully indicative of the catastrophe risk
that exists in this line. Preliminary calculations based on estimates for the 1992
accidenr year produce an eleven ye.n standard deviation of 22.7%. which probably
overstates the risk.
m The “company” risk standard deviations reflect the observed variations of company results
from the industry. As was noted earlier, small companies exhibit greater variation than
large companies. This difference is accounted for by the explicit inclusion of a size
charge applicable to small companies in the RBC formula. The basic risk charges need,
therefore, only account for the variation observed among large companies. The exhibir
shows the simple standard deviations for large companies and the weighted standard
deviations for all companies. While the former statistic is technically better, it sometimes
reflects too small a sample of companies to be fully credible. In such circumstance, the
weighted standard deviation is an acceptable alternative.
May 1993 29
As was the case with “industry” risk, we relied on the W-50 weighted standard
deviations, in all but a few instances:
- For Products and General Liability, the selections are based on the Composite results,
for the reason noted earlier.
- For Medical Malpractice reserve risk, the selected standard deviation reflects a
downward adjustment in recognition that the year-end 1985 reserves, on which the
“company” risk is based, reflect a greater proportion of occurrence business than is
currently the case. As will be seen later, occurrence business appears to have greater
reserve risk than claims-made business.
- For International, the “company” risk standard deviations are selected judgmentally as
no credible data was available.
n The total risk for each line is calculated by combining the selected indusrry and company
risk measures, using a “square-root rule.” Such an approach inherently assumes
independence between industrv and company variation.
n Finally, the total measures of risk are used to calculate total funding requirements (a
lognormal statistical distriburion v~as assumed) nr three different confidence levels. The
total funding represents the margin ahove expected (present value) losses that is required
to reduce the expected policvholder deticit cost to an acceptablv low level; For example,
on the selected risk measures, Homeowners loss and loss expense liabilities require a
24.1% margin above their expected present value in order to reduce the EPD cost
to 2%.
We have developed separate reserve and underwriting risk factors for
claims-made and occurrence policies.
The historical database used to develop measures of reserve and underwriting risk reflect a
combination of claims-made and occurrence policy forms for the commercial liability lines.
137
Mav 1993 30
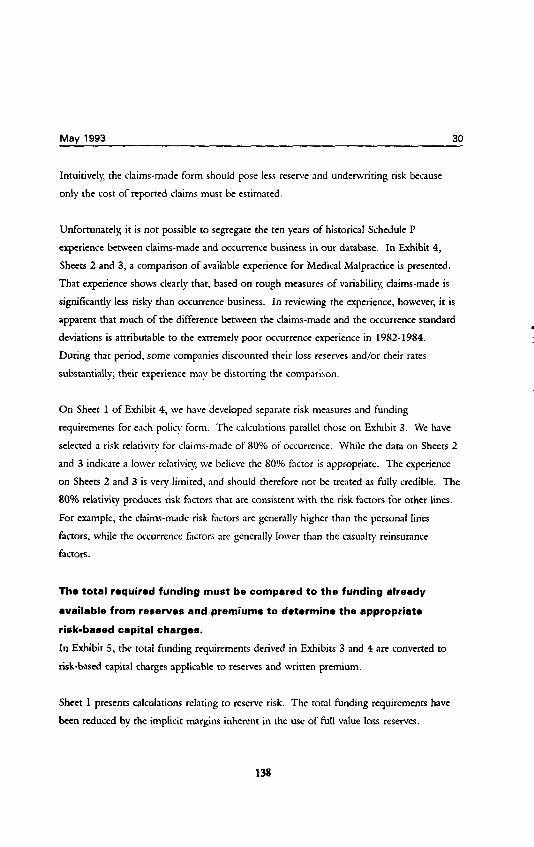
Intuitively, the claims-made form should pose less reserve and underwriting risk kcause
only the cost of reported claims must be esrimared.
Unfortunately, it is not possible to segregate the ten years of historical Schedule P
experience between claims-made and occurrence business in our database. In Exhibit 4,
Sheets 2 and 3, a comparison of available experience for Medical Malpractice is presented.
That experience shows clearly that, based on rough measures of variability, claims-made is
significantly less risky than occurrence business. In reviewing the experience, however, it is
apparent that much of the difference between the claims-made and the occurrence standard
deviations is attributable to the extremely poor occurrence experience in 1982-1984.
During thar period, some companies discounted their loss reserves and/or their rates
substantially; their experience may be distorting rhe comparison.
On Sheet 1 of Exhibit 4, we have developed sepnr.lte risk measures and funding
requirements for each policy form. The calculations parallel those on Exhibit 3. We have
selected a risk relativity for claims-made of 80% of occurrence. While the data on Sheets 2
and 3 indicate a lower relativiv, we believe the 80% factor is appropriate. The experience
on Sheets 2 and 3 is very limited, and should therefore not be treated as fully credible. The
80% relativity produces risk factors that are consistent with the risk factors for other lines.
For example, the claims-made risk factors are generally higher than the personal lines
factors, while the occurrence bctors are generally lower than the casualty reinsurance
factors.
The total required funding must be compared to the funding already
available from reserves and premiums to determine the appropriate
risk-based capital charges.
In Exhibit 5, the total funding requirements derived in Exhibits 3 and 4 are converted to
risk-based capital charges applicable to reserves and written premium.
Sheet 1 presents calculations relating to reserve risk. The toral funding requirements have
been reduced by the implicit margins inherent in the use of full value loss reserves.
138
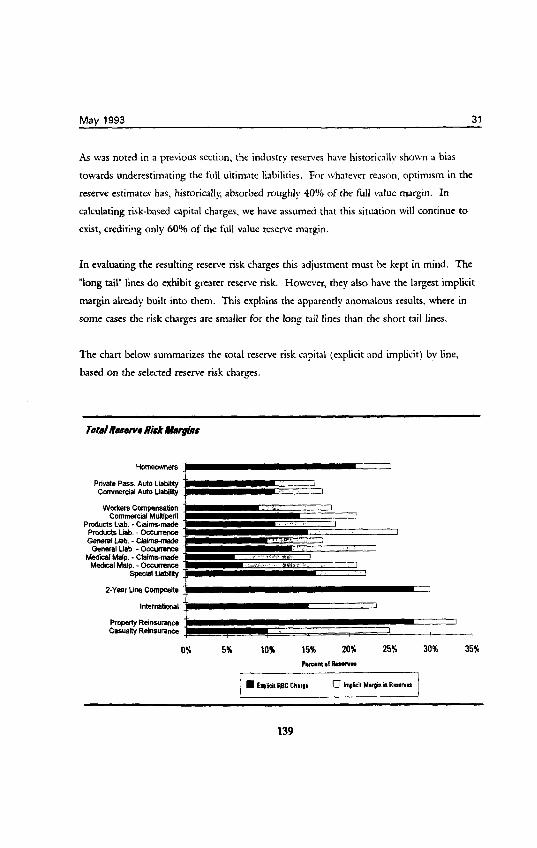
May 1993 31
As was noted in a previous section, the industry reserves have historically shown a bias
towards underestimating the full ultimate liabilities. For whatever reason, optimism in the
reserve estimares has, hisroricnllK absorbed roughly 40% of the full value margin. In
calculating risk-based capital charges, we have assumed that this situation will continue to
exist, crediting only 60% of the full value reserve margin.
In evaluating the resulting reserve risk charges this adjustment must be kept in mind. The
“long tail” tines do exhibit greater reserve risk. However, they also have the largest implicit
margin already built into them. This explains the apparentlv anomalous results, where in
some cases the risk charges are smaller for the long tail lines rhan the short tail lines.
The chart below summarizes the total reserve risk capital (esplicit and implicit) by line,
based on the selecred reserve risk charges.
Private Pass. Auto Liability Commercial Auto LiibHy
wwkels Caponsattml Commrcial Mulipsril
Producls Liab.. Ctairwmacte Prcdwts Lmb. - Occurrerm GMW3lLi2b.-Cleim-
Genwal Lib.. Occunmce Medical Malp. _ c!aims4nade
Mediil wp. _ occurrence Spectal Lkbittt
Z-Ye% tine compc.sile
IntcmahoMl
Prcwriy Reinwnnw Casuaity Reinsunnce
0% 5% 10% 15% 20% 25% 30% 35% Rnmt of llnmvm
139
May 1003 32
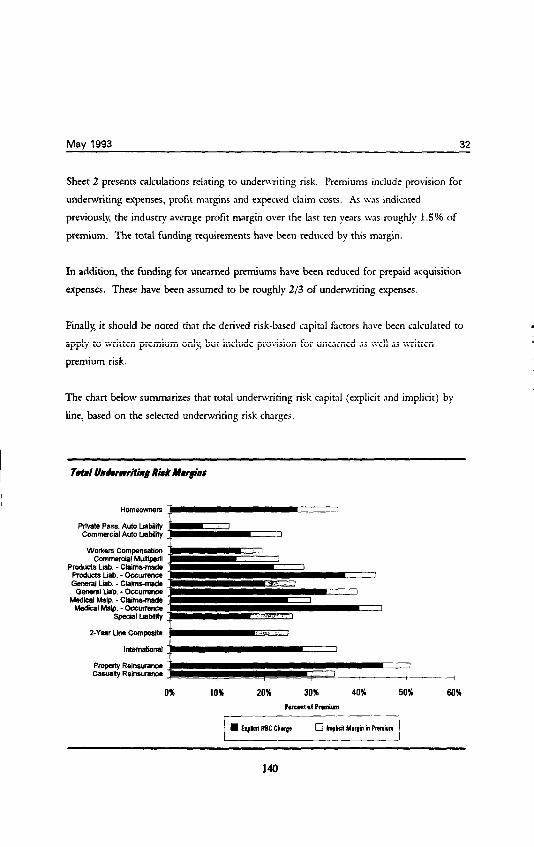
Sheet 2 presents calculations relating to underwriting risk. Premiums include provision for
underwriting expenses, profit mqins and expected claim costs. As was indicated
previously, the industry avenge profit margin over the last ten years was roughly 1.5% of
premium. The total funding requirements have been reduced by this margin.
In addition, the funding for unearned premiums have heen reduced for prepaid acquisition
expenses. These have been assumed to be roughly 2/3 of underwriting expenses.
Finally, it should be noted that the derived risk-based capital factors have been calculated to
apply to wrnten premmm only, but mclude provision for unearned as well as written
premium risk.
The chart below summarizes that total underwriting risk capital (explicit and implicit) by
line, based on the selected underwriting risk charges.
P&‘&e Pass. Auto LkWly Commercial Ado Liibilii
Workem Ccmpensation Commercial MUliip8lll
Pmdtio Llab. -Claims-made PrcdwIs Liab. _ Occum~e General Liab. -Claims-m&a
Gemral Lib. - Occurrm~a Medical Map. - c!aimbmade
hkdlll Mirlp. - occwena Special Ll.sbi!ay
0% 10% 20% 30% 40% 50% 60%
?wmm @I Praniun
140
May 1903 33
The indicated risk-based capital charges were run through the
Premium-to-Surplus ratio model. The results were used to make the final
rrelections.
As a final test of the risk-based capital charges, the indicated charges of all three Expected
Policyholder Deftcit standards were run through the Premium-co-Surplus ratio model.
Based on the results, which are presented in Exhibits 6 and 7, the recommended alternative
factors were finally selected. As was noted earlier, the final selections are designed to
produce roughly the same total risk-based capital for the primary industry as do the current
factors.
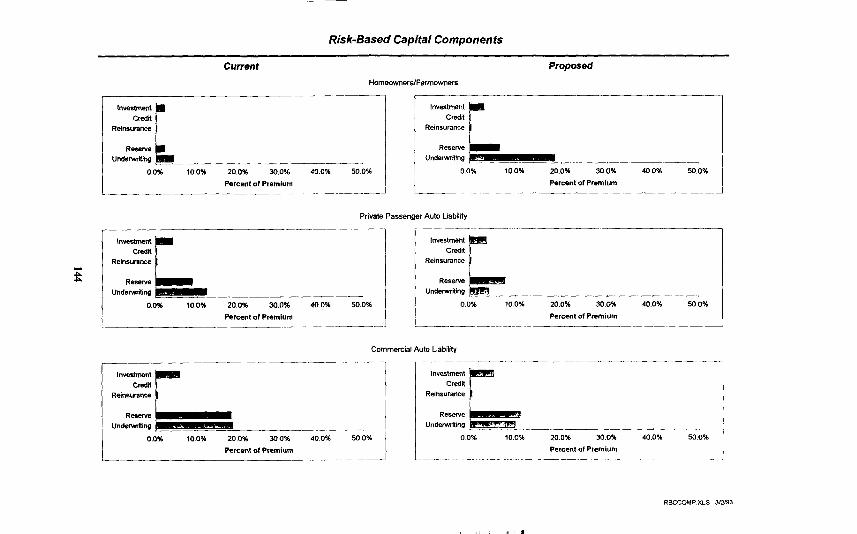
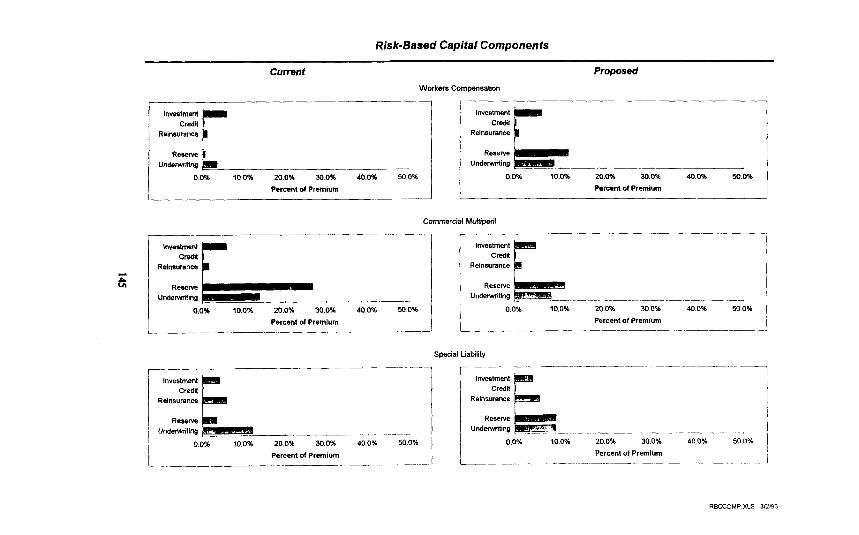
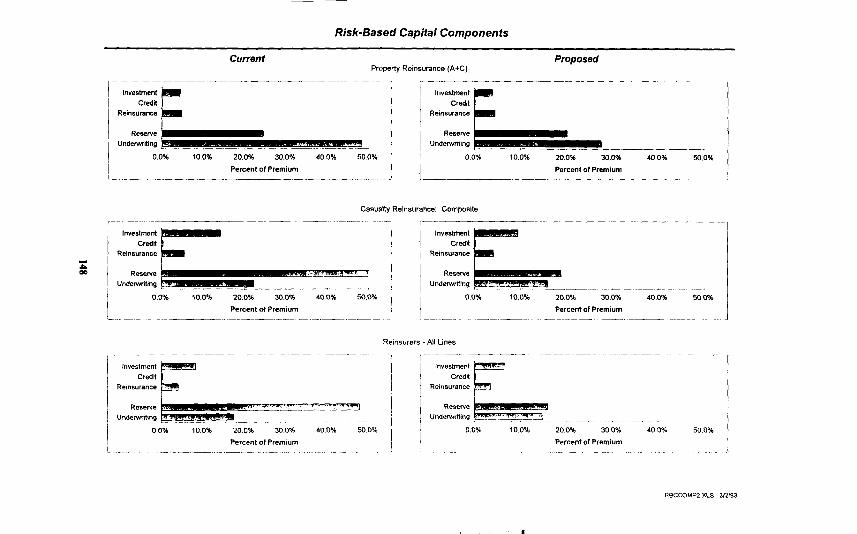
Lastly, the exhibits on the next five pages compare the amounts of risk-based capital
generated by each component of the formula for each line of business. For comparative
purposes, all of the dollar amounts have been expressed as a percentage of earned premium.
For each line, the amounts generated by the recommended factors are compared to the
amounD generated by the current factors.
As we have already noted, the results of our Premium-to-Surplus ratio model depend
heavily on a specific set of assumptions. These fall in rhree major areas:
n The other componem iv the RBC forwrda
We have assumed that the factors for credit risk and investment risk will not change
from those in the current draft formula. We have used the covariance adjustment
recommended in our recent report of Februnrv, 1993.
m The a&cat& of other assets ad Iinhilities to live of busimss
The model requires that assets, other than invested assets, be allocated to line of business.
Other assets include premium balances, reinsumnce recoverables, EDT’ equipment, and
other receivables. Similarly all liabilities must be allocated to line of business.
141
Mav 1993 34
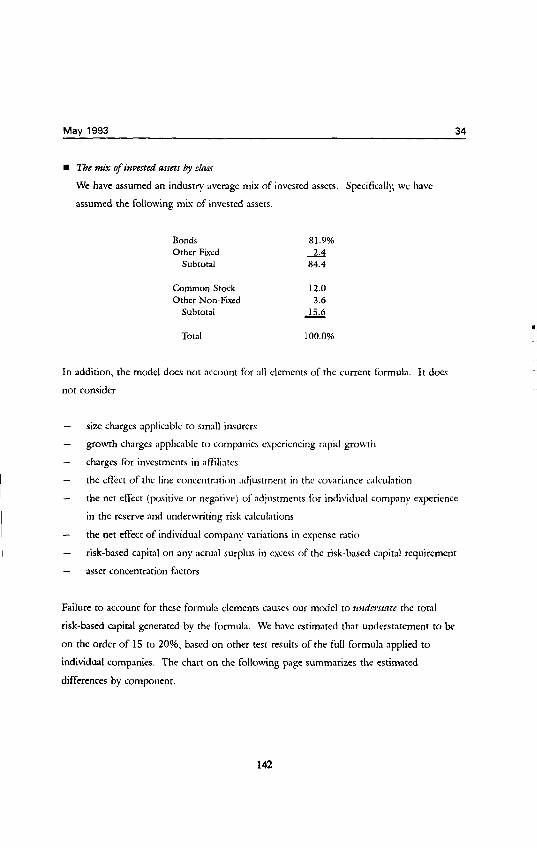
8 Il3.e mix of invested assets &y class
We have assumed an industry average mix of invested assets. Specifically we have
assumed the following mix of invested assets.
Bonds Other Fixed
Subtotal
81.9% 2.4 84.4
Common Stock 12.0 Other Non-F&d 3.6
Subtotal 15.6
Total 100.0%
In addition, the model does not account for all elements of the current formula. It does
not consider
- size charges applicable to small insurers
- growth charges applicable to companies experiencing rapid growth
- charges for investments in affilintcs
- the effect of the line concentration adjustment in the covariance calculation
- the net effect (positive or negative) of adjustments for individual company experience
in the reserve and underwriting risk c.tlculntions
- the net effect of individual company variations in expense ratio
- risk-based capital on any actual surplus in excess of the risk-based capital requirement
- asset concentration factors
Failure to account for these formula elements causes our model to nndermtc the total
risk-based capital generated by the formula. We have estimated that understatement to be
on the order of 15 to 20%, based on other test results of the full formula applied to
individual companies. The chart on the following page summarizes the estimated
differences by component.
142
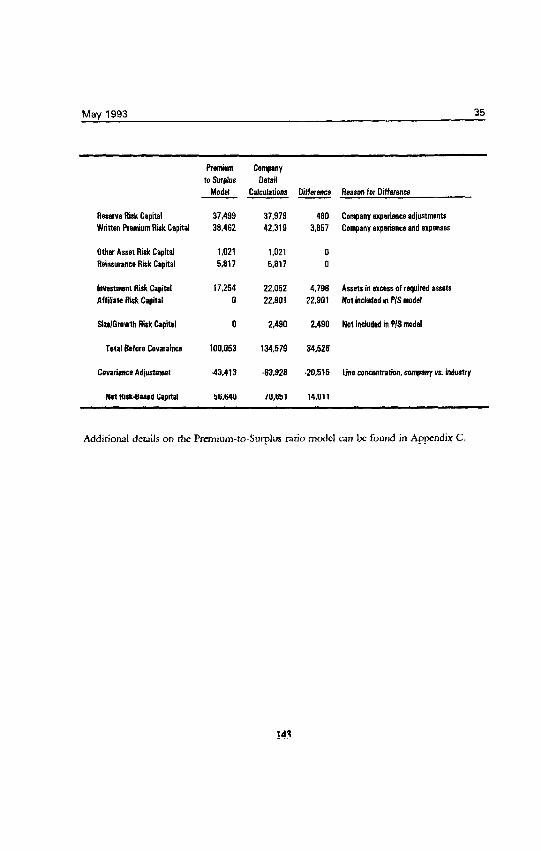
May 1993 35
fleaewe Riik Capital Written Prtn-ium Risk Capital
Other Asset Rii Capital Rebewanca Risk Capital
lnwtment Rii Capital Affiliate Risk Capital
6izelGtewth Rii Capital
Total Before Cevaraince
Ceverianw Adjt
Nat FliskGaed Capitel
Rmium Cenqeny to Surplus Detail
Model Calculations --
31,499 37,979 36,462 42,319
1,021 1.021 5.617 5,617
17,254 22,052 0 22.901
0 2,490
100,053 134,579
43.413 -63,929
56,640 70,651
Difference Reason for Difference
460 Company experimme adjuetnwnte 3,657 Company experience and expanses
0 0
4,798 Assets in excess of required aeeats 22,901 Not ieduded in P/S model
2,490 Not induded in PI.3 model
34,526
.20515 line concwtretion, cotqteny ve. induetry
14,011
Additional details on the Premium-to-Surplus ratio model can be found in Appendix C.
143
Risk-Based Capita/ Components
Current
HomeownerslFarmownen
Proposed
fIlri?L --
0.0% 10.0% 20.0% 30.056 40.0% 50.01
Percent of Premium -__
r
L
ReWlve Underwriting
00%
.___
20.0% 30.0%
Percent of Premium .__-
40.0% 50.0%
Private Passerqer Auto Liability __-
fg L ----- 0.0% 10.0% 20.0% 30.0% 40.0% 50.0%
Percent of Premium ___. -
RESWW Undenwtting
00% _____
20.0% 30.0% 40.0% 50 OX
Percent of Premium ---___
100~1 20 0% 300% 40 OU 500%
Percent of Premium
Commercial Auto Liability
Inv&nlenl CWdii
Reinsurance
ReSBW Underwriting
00% ___- - -
20.0% 30 0% 40.0% 50.0%
Percent of Premium
Risk-Based Capital Components
Current
Workers Compensation
Proposed
R- U?XlWWif~~
0.0% 20.0% 30.0%
Percent of Premium
--- 40.0% 500%
lnvestmenl credit
Reinsunnce
.__- 20.0% 30.0%
Percent 01 Premium
40.0°A M.O%
__- -____
Investment Cdlt
Reinsurance
RWXVfZ Underwriting
0.0% -.-__-
20.0% 30.046 40.0% 500%
Percent of Premium .~ __~. -~-~
Commercial Multiperil
Investment Cfedi(
R&lSUr~llC~
1
- _____. -_-..~ .~-~~.- 20.0% 30.0% 40.0% 50 OoA
Percent of Premium
Investment CEdii
Reinsurance
ReelVe Undemriting
0.0X --.--. ..-. -~._ -.-.-~~-~~ -. ~-
10.0% 20 0% 30.0% 40.0% 50.0%
Percent of Premium ____ ___ --_~ .~. -.------..- .----- __-
Special Liability
L
RWW Undenwitiog
O.OU 100% 2O.OY 30.OK
Percent of Premium ___~. __~. .--~ -.-.-__~
40.0X 50 0%

Risk-Based Capital Components
Current
Products Liabilii: composite
Proposed
m.096 30.0%
Percent of Premium
m.o% 30.0%
Percent of Premium
General Liability: Composite
Percent of Premium Percent 0, Premium
Medical Mabractice: Composite --_-
Investment Credti
Reinsurance
R-W-G Underwiting
00% 20.0% 30.0% 40.0% 500%
Percent of Premium ___~~
Reserve Undermiting
00% 10.0% 20.0% 30.0%
Percent of Premium _ ~~_. - ~...--~~_ - --
40.0% 50.0%
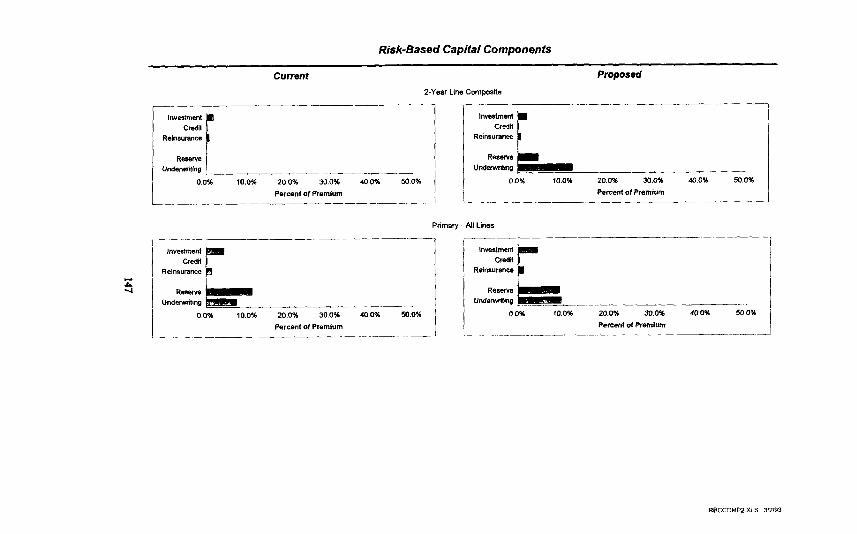
Risk-Based Capital COn?pOnantS
Current
Z-Year Line Cwnpstte
Proposed
Investmenl C&Id
R&SWWlCE
Reserve UnderMing F
0.0% 10.0% 20.0% ---T% ~~.~~--.. 30.0% 40.0%
Percent of Premium __ .--__
Primary _ All Lines
-.-.-. Investment
Cdii Reinaurance
RSWXV4 Underwriting
0.0% 20.0% 300% 40.0% 53.0%
Percent of Premium
.-____-___ -____
Investmenl credit
Reinsuance
RWWG lhlderwriting
0.0% 10.0% 20.0% 30.0% 40.0% -GO%
Percent of Premium __. .._~.__--- --- -~--__--
E
Risk-Based Capital Components
Current Property Reinsurance (AK)
Proposed
Investment credn
Reirwmnce
RWS-Ne Underwriting
0 ox 20.0% 3OOW
Percent of Premium
40.0% 50.0x
Investment Credii
Reinsurance
Reserve Underwriting
0.0% 100X 20.0% 30.0%
Percent of Premium
40.0% 50.0%
Casualty Reinsurance: Composite
Investment Credll
Reinsurance
RBselve under.wntng
0.0% I O.Oab 20.0% 30.0sb
Percent of Premium
50.0°b
Investment zrslnwlrj Credn 1
Reinsuranoe
00% 10.0% 20 0% 30.0°b 40 0-b 50 O”b
Percent of Premium
Investment Credit
Reinsurance
RSXW Underwriting
0.0% 10.046 20 OOb 30.0%
Percent 01 Premium .~~ -~~ -- _.~..
40.0°b 500%
Reinsurers - All Lines
ln”e*tment CMii
Reinsurance
Reserve Underwriting
0.096 IO.046 20 0% 30 OX
Percent of Premium
40 O*b 50.0%
E&&ii 1 Sheet I
Risk-Based Capttel -Analysis of “InUWry” Reserve Risk
Present Value Reserve Oeflcfency (Redundancy) as Percentage &Held Loss 6 LAE Reserves
YE/IR ENDINQ
HomewnerslFarmowners
Private Passenger Auto Liability Commercial Atio Liability
Workers Compensatiw,
Commercial Muitiperil
Products UabMy General Liability
CO”lpOSit~
Medical Malpractice
special Lkallity
Z-Year Line chpdte
g International Primary
-5.2% 6.5% 0.7%
-10.5% -16.2% -11 .O% -8.2% -3.3% 0.1%
-31.3% .256% -20.2%
1.4% 11.7% 11.5%
28.7% 23.6% 20.2% 0.6% 16.8% 21.2%
124% 16.2% 21 .O%
-9.3% -9.0% -0.5%
-22.6% -11.2% -11.9%
-26.0% -20.5% -17.7%
-6.5% 6.7% 5.7%
-1, .O%
-10.6% -7.9%
-13.1%
-9.3%
.I 1 .a%
-11.4% -9.2%
-12.4%
-11.7%
-9.2%
-11.3% -11.0%
-11.5%
-10.8%
-13.2% -6.7%
-1 I .7% -9.6% -12.2% -11.5%
-11.2% -12.4%
-14.7% -146%
-6.0%
-12.0% -6.8%
-16.7%
-4 0%
-6.0% 6.2%
-I 2.4% 2.6% -5.4% 4.4%
-18.3% 6.5%
-0.6% 9.6%
6.6%
3.0% 4.1%
6.9%
9.2%
14.3% 94%
-0.6% -6.0%
-16.3% .19.8%
-21.4% -21.6%
-m.o% -21.1% =2.5% -20.9% -21.2% -20.9%
-0.1% -4.9%
7.5% 19.1% 1.5% 16.3%
175% 15.4%
-5.0%
-34.4%
.12.2%
-25.4%
-6.8%
-19.0%
-39.8%
-13.4%
-27.8%
-4.0%
-21.1%
-34.7%
-7.1%
-24.4%
-3 4%
-4.0%
-25.4%
-13.1%
-22 5%
-3.8%
2.7% 16.7%
-22.4% 11.7%
-131% 36%
-24 3% 6.9%
-I 9% 6.5%
157%
12.6%
41%
-30.5% -23.7%
-12.9% -146%
-25.8% -4.3%
-7.3% -16.0%
-26.3%
4.1%
-22.5%
4.5% 5.9% Y
Pnmary Total 82% 80% Prkrrary compostte -14.8% -9.1% -5.7% -8.2% -12.7% -16.3% -16.7% -16.0% -16.1% -14.0% -12.0% -12.1% 3:6X isa
Property Reinsurance (A&C) -50.2% -45.7% -31.3% -170% -17.0% -6.3% -3.4% -3.9% -6.7% -9.3% -19.3% -23.5% 16.4% 17.3%
Casualty Reinwrance (B) -6.7% 6.7% 12.6% 2.6% -13.9% -23.3% -290% -29.2% -27.7% -26.5% -13.8% -7.4% 155% 14.7% Casualty Reinsurance (Cl) 1.2% 13.7% 18.3% 15.2% 6.2% -19.8% 3.7% 5.0% 13.6% 12.0%
Composite -2.6% 11.0% 16.0% 9.7% -9.7% -21.5% -26.2% -27.0% -26.3% -27.4% -104% -3.3% 16.6% 15.6%
International Reinsurance -25 0% -6.7% -23.1% -17.6% -20 0% 0.0% .12.5% 20.0% -7 8% -15.3% -10.0% -10.5% 12.6% 13.4%
Reinswance Total 1F;1x Reinsuranca Cwnposttc -8.0% 4.9K 10.8% 6.9% -10.4% -20.3% -24.9% -26.3% -24.9% -29.2% -11.7% 4.2% 14.0% 13:1x
Industry Total Industry Canposite -14.O.b
9.0% 87X -7.0% -4.2% -8.9% -12.l’h .16.9% -17.6% -19.8% -16.9% -16.1% -12.8% -11.7% 4.6% 4.7%
SUMMARY.XLS 2116193
ACCIDENTYEAR Simple w*hbd Standard Weighied 1968 1989 1990 1982 1983 1984 1985 1986 1987 1991 nvenae- O&IkJn DeviaHan
(1) (2) (3) (4) (5) (6) (7) (6) (9) d 01 (11) (12) (13)- (14)
4.0%
-2.5% 12.0%
-24.2%
14.3%
-9.3% 3.8% 1.3%
10.7%
4.5%
-3.7%
-28.8%
4.7%
2.9% 27.2%
-11.7%
28.1%
13.4% 21.5% 19.9%
21.9%
18.3%
3.9%
0.0%
3.2%
10.3% 40.3%
1 .O%
36.2%
22.9% 35.4% 33.2%
14.8%
14.4%
-0.6%
-367%
10.3%
12.9% 24.1%
03%
14.1%
-0.8% 9.3% 7.7%
-5.2%
0.5%
-4.1%
24.3%
3.8%
11.6% 0.8%
-2.0%
-21.5%
-29.6% -29.9% -29.9%
-24.3%
-11.2%
-13.2%
-15.7%
-7.7%
11.1% -2.5%
-2.6%
-25.1%
-39.3% -32.5% -33.5%
-268%
-13.2%
-16.2%
-2.6%
-3.9%
10.7% 0.4%
-1.8%
-26.2%
-33.0% -27.8% -28.3%
-26.0%
0.8%
-13.9%
149%
16.3%
12.7% 6.7%
0.0%
-2.4%
-24.8% -22.0%
9.9%
13.1% 5.3%
0.1%
-5.2%
-17.7% -19.1% -19.0%
-9.8%
10.1%
-10.6%
13.6%
21.6%
10.9% 6.6%
1.2%
2.2%
5.2% -16.9% -15.8%
3.7%
72%
-9.1%
-28.3%
5.5% 4.996 8.8% 8.4%
9.4% 9.0% 4.8% 5.1% 12.1% 13.8% 13.2% 14.2%
-4.0% -4.9% 7.6% 8.2%
2.1% 3.8% M.O% 21.2%
-12.6% -7.8% 19.2% 21.0% -7.8% -0.9% 22.5% 242% -8.7% -2.1% 21 8% 23.5%
-6.2% -1.6% 17.3% 18.6%
49% 4.5% 104% 10.7%
-8.2% 5.1% 4.9% 5.0%
-9 4% -10.1% 18.8% 18.0%
PropertyReimumnce(ABC) -7.5% 20.6% 48.5% 27.5% -M.8% -25.1% -184% 14.2% -1.8% -17.0% 2.0% 3.8% 23.3% 23.9%
casuaity Ramwrance (8) 6.8% 25.2% 35.3% -2.4% -33.2% -31.6% -27.4% -26.0% -24.1% -21.3% -9.9% -2.0% 235% 25.5% Cas&lyReimurance(D) -0.7% 10.6% 5.5% -10.3% -39.6% 41.1% -12.6% -10.8% 206% m.i%
COlllpSik 2.0% 18.3% 16.6% -7.0% -36.5% -361% -27.4% -26.0% -24.1% -21 3% -14.4% -8.8% 191% 21 0%
InIemaIbnal Reinsurance -15.9% 0.0% -20.8% -423% 9.7% 11.3% -20.6% 42.2% -43% -172% -5.8% -5.8% 221% 22.7%
ReinsurmceTcM 200% 217% RalntunmeC~rl(e 4.6% 17.3% 22.7% 0.9% 33.2% -33.3% -25.3% -16.6% -19.2% -20.3% -10.9% -7.0% 10:0x 2o:sx
SUMMARYXLS 2118193
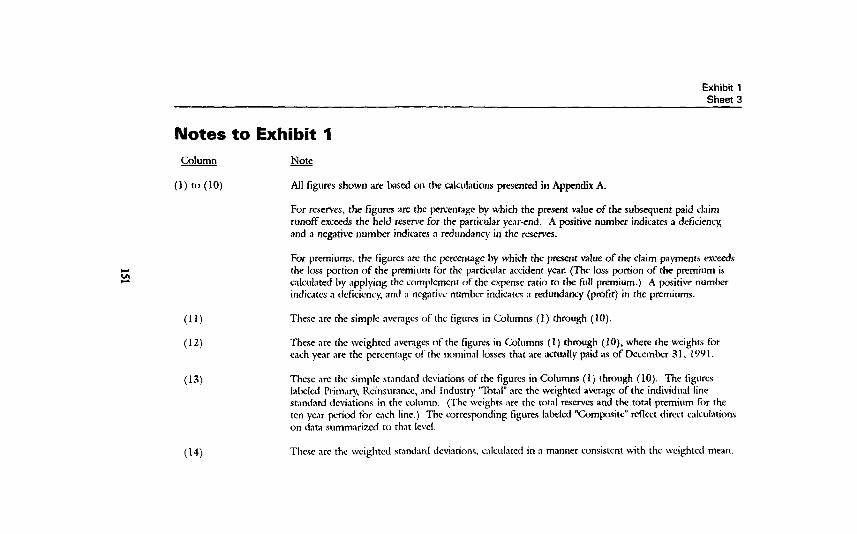
Exhibit 1 Sheet 3
Notes to Exhibit 1 Column &g
(1) to (10) AI1 figures shown are based on the calculations presented in Appendix A.
(11)
(12)
(13)
(14)
FOX reserves, the figures are the percentage by which the present value of the subsequent paid clnim runoff exceeds the held reserve for the particular year-end. A positive number indicates a deficiency, and a negative number indicates n redundancy in the reserves.
For premiums. the figures are the percentage by which the present value of the claim payment eKeeds the loss portion of the premium for chc parricular accident year. (The loss portion of the premium is calculated by applying the complement of the expense ratio to the full premium.) A positive number indic‘ltcs a deficicnc): and n negative number indicates ;1 redundancy (profit) in the premiums.
These zre the simple avenges of the figures in Columns (1) through (10).
These arc the weighted avenges of the figures in Columns (1) through (IO), where the weights for each year ate the percentage of the nominal losses chat are ~tually paid as of December 31, 1991.
These arc the simple stzmd.ud deviations of-the figures in Columns (1) through (IO). The tigures lnkled Primar)! Rcinsurancc, XXI Industry ‘Total” arc the weighted average of the individual line smndard deviations in the column. (The weights :are the total reserves and the total premium for the ten year period for each line.) The corresponding figures labeled “Composite” reflect direct calculations on data summarized to that level.
These arc the weigh& sandnrd dcviltions. c.~lc~~latcti in a manner consistent with the wcightcd mean.
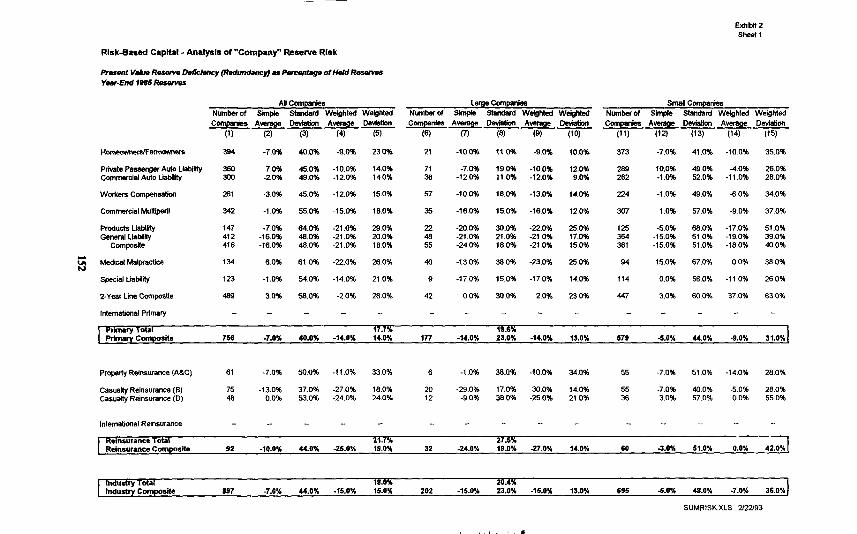
RiskBased Capital - Analysis of “Company” Reserve Risk
Private Pzmen~er Auto UabUiiy Cammefclal Auto LlaMity
workers compensetion
cmml P.wnlpeltl
Products uabuii General Llabnii
cmpodte
f..wkathta~re
special Liability
z-Year Line Composite
lntematlcilal Primary
All Companks Number of Simde Standard Wabhted Wekrhted
394 -7.0% 40.0% -9.0% 230%
260 7.0% 45.0% -10.0% 14.0% 300 -2.0% 49.0% -12.0% 14.0%
261 3.0% 4m?b -12.0% 15.0%
342 -1 .O% 55.0% -15.0% 16.0%
147 -7.0% 64.0% -21 .O% 29.0% 412 -16.0% 48.0% -21.0% 20.0% 416 -16.0% 480% -21 .O% 16.0%
134 6.0% 61 0% -22.0% 26.0%
123 1 .O% 540% -14 0% 21.0%
489 3.0% 58.0% -2 0% 28.0%
Largecxxnpmb Srnzdl Cwnpanles Nunberof Simple Standard We&ted Wei@ted Numberof Smple Standard Weighted Weighted Compenies AVW#E Deviatbn Amrage Devbtbn Companies Avuo#e Dwiatbon Average Dwiatl~n
(6) 0 (8) (9) 110) (11) (12) (13) (14) (15)
21 -10.0%
71 -7.0% 38 -12.0%
57 -10.0%
35 -16.0%
22 -m.o% 48 -21.0% 55 -24.0%
40 -13.0%
9 -17.0%
42 0.0%
11.0%
19.0% 11.6%
16.0%
15.6%
30.0% 21 .O% 16.0%
38.0%
15.0%
30.0%
-10.0% -12.0%
-16.0%
-22.0% -21.0% -21 .O%
-23.0%
-17.0%
2.0%
10.0% 373
12.0% 289 9.0% 262
14.6% 224
12.0% 307
250% 125 17.0% 364 15.0% 361
25.0% 94
14.0% 114
230% 447
-7.0%
10.0% -1.0%
41 .O% -10.0%
49.0% -40% 52.0% -11.0%
49.0% -6.0%
57.0% -9.0%
68.0% -17.0% 51.0% -19.0% 51.0% -18.0%
67.0% 0.0%
56.0% -11 .O%
60.0% 37.0%
35.0%
260% 26.0%
34.0%
37 0%
51.0% 39.0% 40.0%
38.0%
26.0%
63.0%
prinvrt Th’ 17 7K is 6% fwnwy compostte 766 -7.0% 40.0% -14.0% 14:0x g77 -14.0% 23:0x -14.0% 13.0% 679 -0.0% u.ox 4.0% 31.0%
Prapetty Reinsurance (A&C) 61 -7.0% 500% -11 .O% 33.0% 6 -1 .O% 38.0% -10.0% 340% 55 -7.0% 51 .O% -14.0% 26.0%
Casualty Reinsura~e (Et) 75 -13.0% 37.0% -27.0% 18.0% m -290% 17.0% -34.0% 14.0% 55 -7.0% 46.0% -5.0% 26 0% Casualty' Reinsurance (D) 48 0.0% 53.0% -24.0% 24.0% 12 -9 0% 380% -250% 21.0% 36 3.0% 57.0% 0.0% 55 0%
lntemational Reinsurance _. __ __ . . - I . .
Rdnsurance Total 117% 27 6% Rainsurance Composite 92 -10.0% u.ox -25.0% 19:0x 32 -24.0% 19:0x -27.0% 14.0% 60 -3.0% 61.0% 0.0% 42.0%
18 0% 20 4% 697 -7.0% u.ox -16.0% 16:0x 202 -16.0% 23:0% -16.0% 13.0% 696 4.0% 40.0% -7.0% 36.0%
SUMRtSK.XLS Z22/93
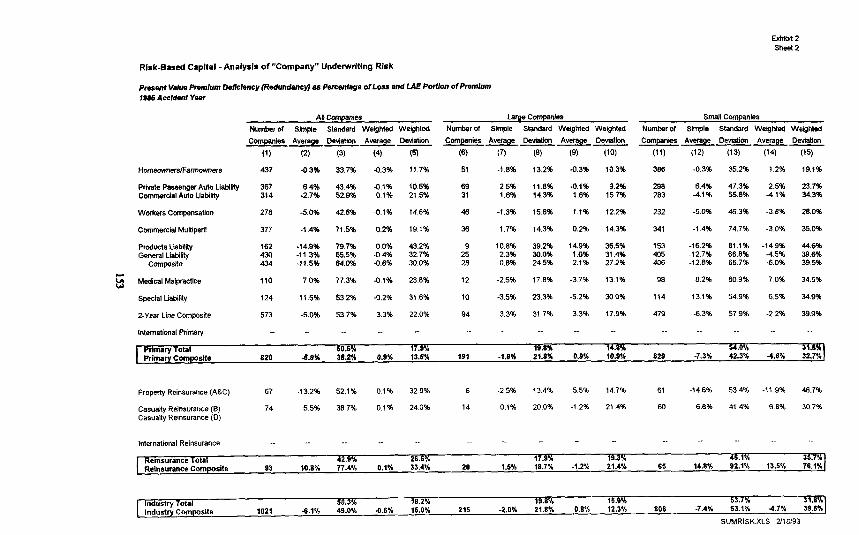
Exhibit 2 sheet2
Risk-Eased Capital - Analysis of “Company” UnderwrIting Risk
Present Value hmlum Defkkncy (Reduftdenc~ as Percentage of Loss and L.4.E Port/on of Premium 1986 AccldoM Year
Privste Passenger Auto Liablltty Commercial Aulo Liability
Workers Compensation
Commercial iwtiperil
Products Lwlii General Liability
c0mpozne
& Medical Malpractice
Special Liibilii
Z-Year Line Ccmposite
international Primaly
All Canpanles Large CcfrQanles Small companies
Number of Slmpie Standard Weighted WeIghted Numb-era? Simple Standard Weighted Weighted Number of Simple Standard Weighted WeJghted
Canpanies Average Dwiatbn Average Deviation Companies Average D&i&ion Average Dwtatlon Ccmpanies Average Deviatian Average DeviatM
(1) (2) (3)
437 -0.3% 33.7%
367 6.4% 43.4% 314 -2.7% 52.9%
278 -5.0% 42.6%
37? -1.4% 71.5%
162 -14.9% 79.7% 430 -113% 65.5% 434 -11.5% 640%
110 7.0% 77.3%
124 11.5% 53.2%
573 -5.0% 53.7%
(4)
-0.3%
-0.1% 0.1%
0.1%
0.2%
0.0% -0.4% 0.6%
-0.1%
-0.2%
3.3%
(5) (6) (7)
11.7% 51 -1.8%
10.5% 69 2.5% 21 5% 31 1.6%
14.6% 46 -1.3%
19.1% 36 1.7%
43.2% 9 10.8% 32 7% 25 2.3% 30.0% 28 0.8%
23.8% 12 -2.5%
31 6% 10 -3.5%
22.0% 94 3.3%
(8)
13.2%
11.8% 14.3%
15.6%
14.3%
39.2% 30.0% 24 5%
17.8%
23.3%
31.7%
19)
-0.3%
-0.1% 1.6%
1.1%
0.2%
14.9% 1 .O% 21%
-3.7%
-5 2%
33%
(10) (11) (12) 10.3% 386 -0 3%
9.2% 298 6.4% 15.7% 283 4.1%
12.2% 232 -5 0%
14.3% 341 -1 4%
36.5% 153 -16.2% 31.4% 405 -12.7% 27 2% 406 -12.8%
13.1% 98 8.2%
300% 114 131%
17.9% 479 -6.3%
._ -
(13) (14)
35.2% 1.2%
47.3% 2.5% 55.8% 4.1%
46.3% 3 8%
74.7% -3.0%
61.1% -14.9% 66.8% 4.5% 66.7% -6.0%
80 9% 70%
54.9% 6.5%
57.9% -2 2%
._ _.
(15)
19.1%
23.7% 34.3%
28.0%
35.0%
44.6% 396% 39 5%
34 5%
349%
39.9%
Properly Reinsurance (A&C) 67 -13.2% 52.1% 01% 32 0% 6 -2 5% 13.4% 55% 147% 61 -14.6% 53 4% -11 9% 46.7%
Casually Reinsurance (8) 74 5.5% 387% 01% 24 0% 14 0.1% 20.0% -1.2% 21.4% 60 68% 41.4% 68% 30.7% Casuany Reinsurance (D)
international Reinsurance . . . . . . ._ ._ . . . . _. _.
Re~nsurance Total 42 9% 77I4K
26.5% 7 9% :8:7x
19.3’. 45.1*0 35.7% Reinaurance Cwnp osite 93 10.8% 0.1% 33.4% 28 14K -1.2% 21.4% 65 14.8% 92.1% 13.5% 76.1%
Industry Total Industry Composite
60 3% 4s:oa
18.2% 19 a”1 15.0% 63.7% 315 1021 4.1% .0.6% 15.0% 215 3.0% . ’ 21.8% 0.8% 12.3% 806 -7.4% 63.1% 4.7% 3s:sn
SUMRISKXLS 2118193
E
Exhibit 2 Sheet 3
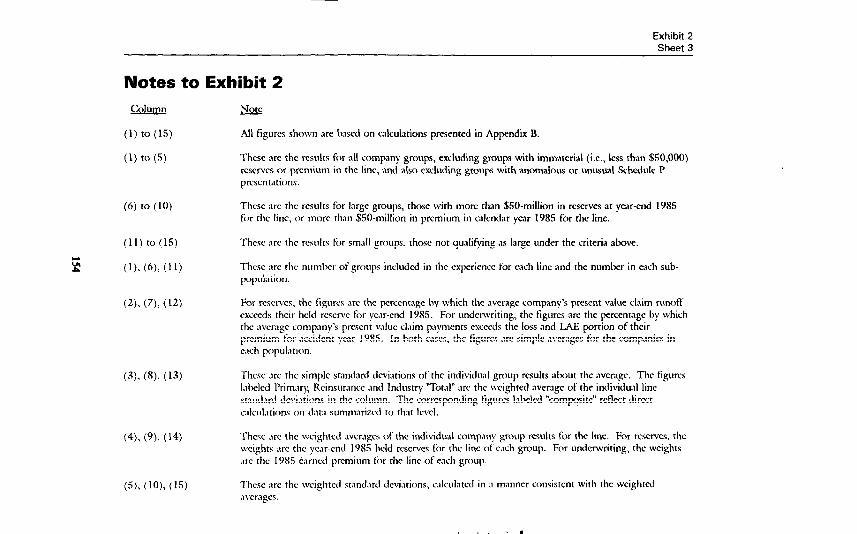
Notes to Exhibit 2
(1) to (15)
(1) f” (5)
All figures shown are hased on calculations presented in Appendix B.
These are the results for all company groups, excluding groups with immaterial (i.e., less than $50,000) reserves or premium in the line, and also excluding groups with anomalous or unusual Schedule P prescntatiom.
(6) to (10) These arc the results for large groups, those with more than $50-million in reserves at year-end 1985 for the lint, or more than $SO-million in premium in calendar year 1985 for the line.
(11) to (IS)
(11, (fJ), (11)
These arc the results k>r small groups. rhose not qualifying ‘1s large under the criteria abve.
Thcsc arc the numlxr of groups included in the cxperirncc for each line and the number in each sub- ppulation.
(2). (7), (12) For rcscrvcs. the tigurcs arc the pcrccntage hy which the average company’s present value claim runoff cxcccds their held rcscrvc for year-end 1985. For underwriting, the figures are the percentage by which the ~vcragc company’s prcscnt v.~lue cl.lim payments cxcccds the loss and LAE portion of their premium for .kdcnt year 1985. In both c~scs. the tigurcs arc simple averages for the companies in c.lch popul.ltion.
c.3). W, (13) Thcsc .jrc the simple standard deviations of the individual group results ahout the average. The figures Llhclcd Primary, Rcinsurancc and Industry “Total” arc the weighted average of the individual lint st.mdard JcvLltions in the column. The corresponding figures Inhelcd “composite” reflect direct wlculations on d.lta summ.lrizcd to that Icvcl.
(4), (9). (14) Thcsc ,trc the wcightcd .wcr.tgcs of the individuJ comp.\ny group results for the line. For rcscrvcs, the weights XC the year-end 1985 held reserves for the lint of wch group. For underwriting, the weights .uc the 1985 C.vncd premium fi)r the lint of each group.
(5). (lo), (15) These .~rc the wcightcd st.md.mt dcvintions, calculated in .I manner consistent with the weighted a\‘cragcs.
Exhitii 3 Sheet1
“htduatry* R- Risk “CompanY R-we Risk T&l Required Totd Funding Standard Weighted 50/50 Seeded Large W@hl& so/50 samed Resewa (Percent of Expe&d PV josses) ueviahbrr std. nev. Ltne/kldusky std. Dev.
-0
Std. 0~. Std. Da’. Me&xi&y Std. Dtv.
15)- Rtalc 3%EPD 2%EPD I%EPD
(1) (3) 14) (61 m (8) (9) flo)- (11) (12)
HomewnerslFamwv.n@n
Privas Passenger Auto Liabilii Cmm~cial Auto LIzaMy
workers Compensa8m
Commercial Muitipril
Pmducts Liability General Liabilii
COlllplle
Medical Malpractice
Special Lb&My
Z-Year Lie Composite
Inlemational Primary
6.2%
2.6% 4.4%
6.5%
9.6%
19.1% 16.3% 16.7%
11.7%
3.8%
8.9%
6.5%
6.6% 7.8%
3.0% 5.8% 4.i% 6.4%
6.9% 7.8%
9.2% 8.9%
lci% - 15.4% -. 15.7% 12.2%
12.8% 10.8% 10.8%
4.1% 8.4% 6.4%
3.6% 8.1% 6.1%
5.9% 7.3% 7.8%
7.6%
5.8% 6.4%
7.8%
8.9%
130% 12.0% . .
11.0%
19.0% fI.o%
18.0%
23.0% 20.5%
14.0% 16.0% 14.0% 16.0%
15.0% 16.5%
18.0% 18.0%
300% 290% - 21 .O% m.o% 18.096 18.0% 1810%
380%
150%
30.0%
26.0% 22.0%
21.0% 19.5%
28.0% 23.0%
20.596
18.0% 16.0%
16.5%
18.0%
18.6% 17.8%
16.0%
lSS%
23.0%
m.os
21.9%
17.0% 17.2%
18.3%
20.7%
229% 21.5%
19.3%
20.5%
23.8%
21.5%
117.9% 124.1% 134.1%
110.7% 115.4% 123.0% 110.9% 115.7% 123.4%
112.4% 117.5% 125.6%
115.1% 120.8% 129.8%
115.8% 121.6% 130.9%
121.2% 128.0% 139.0%
117.3% 123.3% 1331%
Prope!ty Relnswanca (A8C)
Casuatiy Reinsurance (8) CastMy Relnsuame (0)
COmpaSik
International Reinstrance
Relnsurancc Total Reinswarns Composite
18.4% 17.3% 13.0% 11.0% 38.0% 33.0% 25.5% 23.0% 25.5% 124.1% 131.5% 1435%
15.5% 14.7% 11.7% 122% 17.0% 78.0% 18.0% $941 220% 118.7% 1.262% 736.8% 13.6% 12.8% 10.8% 12.2% 360% 24.0% 21.0% 19.4% 22.9% 119.7% t262% 136.8% 18.8% 15.8% 12.2% _- _.
12.8% 13.4% 11.1% 7.8% -- - .- 20.0% 21.5% 117.3% 12?.3% 133.1%
107K 118% 122% 12ltA 275% 217% iSO% 197% 23.l% 120.1% 126.6% 137. 14:0x 13:1-h * i3:w 19:0x 19:0x . 19:0x 23.1%
SUMRISK.XLS 2/18/93
Mill 3 Sheet 2
Risk-Eased Capital -Analysis of Undewtting Risk
Prk-dte Pasomgcr Atio Liibllii Commercial Auto Liability
wmtmscmpensatkn
Cwnmmkl MUltipertl
PnxhJck Liability Germat Liawity
CWlpC5iie
Medical MalpreGtke
Special LIabHi
P-Year Line Composite
lntcmatknal Primary
‘Industry- Undenwtting Risk ‘“Comparf Undwniting Risk Total Required Total Funding
Standard Weighted 50150 Selected Large Welghted 50/50 S&&d UNV (Percent Of Eqected PV Losses)
Owtdtkm Std. Dw. Line/lndus(ry Std. Dev. Std. Dev. Std. Dev. Lln&xlustry Std. Dw. Risk 3%EPD Z%EPD l%EPD -- -- ----- (1)
8.8%
4.8% 13.2%
7.6%
20.0%
19.2% 225% 21 8%
17.3%
10.4%
49%
18.6%
(2) (3) (4) (5)
6.4% 9.3% 17.0% 13.2%
51% 7.6% 7.6% 11.8% 142% 12.2% 12.2% 14.3%
62% 9.1% 9.1% 15.8%
21.2% 15.7% 15.7% 14.3%
21.0% -- 16.8% 39.2% 24.2% -- 16.8% 30.0% 23.5% 16.8% -- 24.5%
18.6% 14.3% 14.3% 178%
10.7% 10.4% 104% 233%
50% 7.6% 11.0% 31.7%
18.0% 14.1% 15.2% --
(‘5) (7) (8) (9) (10) (11) (12) 11.7%
10.5% 21.5%
14.6%
19.1%
432% 32.7% 30.0%
238%
31.6%
220%
15.0%
14.4% 19.8%
16.4%
187%
_. 24.1%
21 0%
24.9%
20.1%
230% 28.6%
14.4% 16.3% 19.8% 23.3%
16.4% 16.8%
18.7% 24.4%
21.0% 25.4%
24.9% 270%
201% 22.9%
22.0% 26.7%
129.9% 138.4% 152.4%
109.6% 114.2% 121.4% 120.2% 126l3% 1376%
113.1% 118.4% 126.8%
122.2% 1292% 140.6%
126.8% 1347% 1477%
119.7% 1262% 1367%
126.4% 1342% 1471%
91% 96% 6:9%
99% iO% .
116% S.s%
19au 179% 19.1% 21:9s( 13:6X __
I9 9% li%%
22 2% 1419%
119.0% 126.4% 136.7
Propertv Reimurance (AELC)
Casually Ret- (8) Cssmkj Retnsurame (D)
Composite
233% 25.9% 17.0% 230% 13.4% 320% 25.1% 25.1% 340% 141.0% 1516% 1695%
23.5% 25.5% 17.8% 17.8% 200% 24.0% 21 1% 21.1% 27.6% 128.0% 1361% 1496% M.6% 20.1% 15.1% -- _. - ._ 19.1% 21.0% 15.6% - _. . . ._
Intematbnal Relnsummx 22.1% 22.7% 16.4% 15.2% -- - ._ 22.0% 26 7% 126.4% 134.2% 147 1%
Rein~mnea Total 200% 217% 169% 194% 179% 26 6% 224% 22 3% 29 6% 1320% 1409% 1668% Re+nsunnce Canposi(s lo:o% 20:6% ’ 28:6% 18:7x 3314% 33.4% 39:1x . .
96% 10 1% 10.1% 6:2X 9:6%
119% s:sn
19 9% 192% 182% 2Idx rs:ox .
19 ox 226% 1191% 126.9% 136.4 16:OH 1s:31(
SUMRISK XLS 2118i93
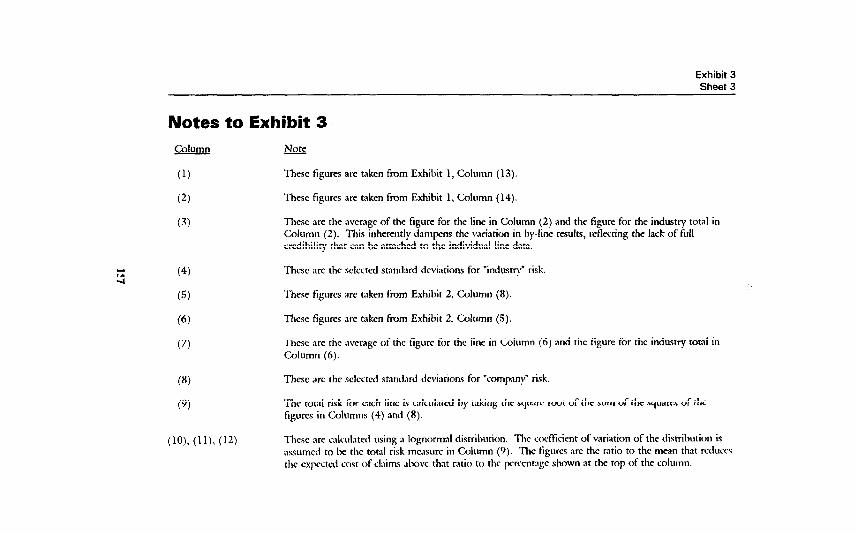
Exhibit 3 Sheet 3
Notes to Exhibit 3 Column &&
(1) These figures are taken from Exhibit
(4 These figures are taken from Exhibit
1, Column (13)
I, Column (14)
(3)
3 (4)
(5)
(6) (7)
@I
(9)
(lo), (11)x (12)
These are the average of the figure for the line in Column (2) and the figure for the industry total in Column (2). This inherently damps the variation in by-line results, reflecting the lack of full credibility that can he attached to the individual line data.
These arc the selected standard deviations for “industry” risk.
These figures are taken from Exhibit 2, Column (8).
Thcsc figures are taken fmm Exhibit 2, Column (5).
These are the average of the figure for the line in Column (6) and the figure for the industry total in Column (6).
Thcsc are the sclccted standard dcviatiom for “company” risk.
The total risk for each lint is calculated by taking rhe qnrc root of the sum of the squares of the figures in Columns (4) and (8).
Thcsc are calculated using J lognormal distrihution. The cncfflicient of variation of the distribution is assumed to he the total risk mcasurc in Column (9). The tigures XC the ratio to the mean that rcduccs the cxpcctcd cost of claims .~hovc that ratio to the perccntagc shown at the top of the column.
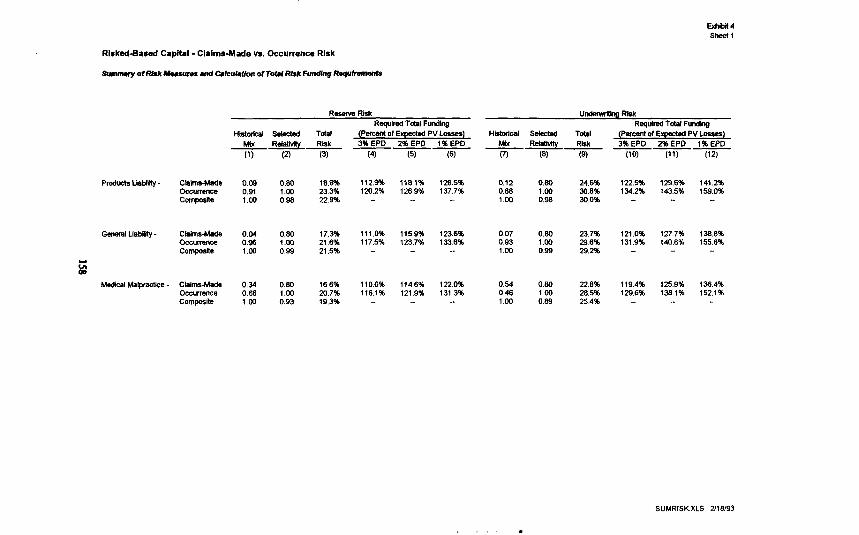
Eabit4 sh&1
Risked-Bared Capital - Claims-Made vs. Occurrence Risk
R- Risk IJ- Rbk Required Tdal FundIng Required Total Fundbg
HktuW Selected T&d (Percart of Eqmhd PV L-1 Hktorlcal Sbcled Total (PSI-cell of Eqmcted PV Logyg) 3%EPD 2?&EPD l%EPO 3%EPD 2?&EPD 1XEPD
o- (5) (6) -0 WI (121
Products Liwily - Claims-Made 0.09 0.80 18.6% 112.9% 116.1% 126.5% 0.12 0.60 24.6% 122.5% 129.6% occurmnce 0.91 1.00 233% 120.2% 126.9% 137.7% 0.68 1.00 308% 134.2% 143.5% CompmitO 1.W 0.98 229% - 1.00 0.98 30.0% -
Gmeml LiebiNy _ Cbims-Made 0.04 0.80 17.3% 111.0% 115.9% 123.6% 0.07 0.80 237% 121 .O% 127.7% OaUlTsnOe 0.96 1.00 21.6% 117.5% 123.7% 133.6% 0.93 l.w 29.6% 131.%% 140.8% 0-e 1.00 0.99 21.5% - 1.00 0.99 292% -
Medical hhlp3r3clll- Cbims-Made 0.34 0.60 16.6% 110.0% 114.6% 1220% 0.54 O.&l 22.8% 119.4% 125.9% OcCUn.Y@Z 0.66 1.6) 20.7% 1161% 121.9% 1313% 0.46 1.00 28.5% 129.6% 138.1% COfllDD5ll~ 1.00 0.93 19.3% - 1.00 0.89 25.4% - _.
141.2% 159.0%
136.8% 155.6%
136.4% 152.1%
.SUMRI.SK.XLS 2/16/93
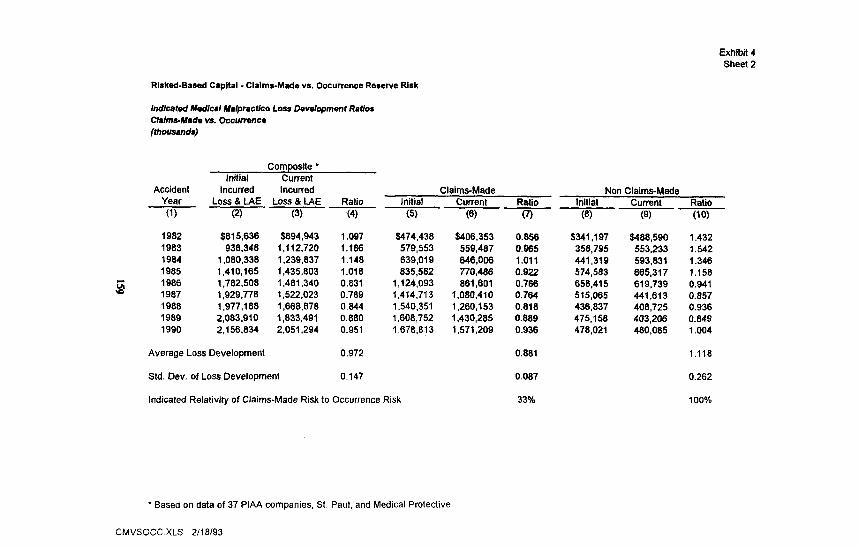
Exhibit 4 Sheet 2
Risked-Based Capital - Claims-Msds vs. Occurrence ReseNe Risk
Indicated Medicel Malpmctke Loss Development Ratios Claims-Made vs. Occununce (thousands)
Initial Composite *
Current Accident
Year (1)
Incurred Incurred Claims-Made Non Claims-Made Loss & tAE Loss 8 LAE Ratio Initial Current Ratio Initial Current Ratio
(2) (3) (4) (5) (61 0 (8) (9) (10)
1982 $815,636 1983 938,348 1984 1,080,338 1985 1,410,165 1986 1.782508 1987 1,929,778 1988 1,977,188 1989 2,083,910 1990 2,156,834
3894,943 1,112,720 1,239,837 1,435.803 1,481,340 1,522,023 1.668.878 1,833.491 2,051,294
1.097 1.186 1.148 1.018 0.831 0.789 0.844 0.880 0.951
$474,438 $406.353 0.856 $341,197 $488,590 1.432 579.553 559,487 0.965 358,795 553,233 1.542 639.019 846,006 1.011 441,319 593,831 1.346 835,562 770,486 0.922 574,583 665,317 1.158
1,124,093 861,601 0.766 658,415 619,739 0.941 1,414,713 1,080,410 0.764 515,085 441,613 0.857 1540,351 1,260,X3 0.818 436,837 408,725 0.936 1608,752 1,430,285 0.889 475.158 403,206 0.849 1 F678.813 1,571,209 0.936 478.021 480,085 1.004
Average Loss Development 0.972
Std. Dev. of Loss Development 0.147
Indicated Relativity of Claims-Made Risk to Occurrence Risk
0.881 1.118
0.087 0.262
33% 100%
* Based on data of 37 PIAA companies, St. Paul, and Medical Protective.
CMVSOCCXLS 2/10/93

Exhibit 4 Sheet 3
Risked-Based Capital -Claims-Made vs. Occurrence Underwriting Risk
Indicated Madical Malpradica Loss Ratios Claims-Made vs. Occurrence (thousands)
Accident Year
(1)
Composite l
lncuned Earmed Loss Claims-Made Non Claims-Made Loss 6 LAE Premium Ratio Incurred Premium Ratio Incurred Premium Ratio
(2) (3) (4) (5) (6) (7) (‘3) (9) (10)
1982 $940.231 $715,556 1.314 3429,219 3420,385 1983 1,169,362 805,734 1.451 589,324 482,708 1984 18312.779 959,131 1.369 681,586 597,609 1985 1,529,401 1,309.571 1.168 815,290 774.688 1986 1,565,620 1,836.875 0.852 918.954 I ,t49,284 1987 1.636.043 2,1Q6,021 0.745 1,170,418 1,635.345 1988 1,802,596 2,363,521 0.763 1,371,846 I ,833.al I 1989 1,967,383 2,304.225 0.854 I ,538.983 1,769.lOO 1990 2.194585 2,124,5ia 1.033 1.688.609 1.654,433
1.021 1.221 1.141 1.052 0.800 0.716 0.748
$511,012 580,038 631,193 714,111 646,666 465,625 430.750
0.870 428.400 1.021 505.976
$295,171 323.026 361,522 534.883 687,591 560,676 529,710 535,125 470,085
1.731 1.796 1.746 1.335 0.940 0.830 0.813 0.801 1.076
Average Loss Development 1.061
Std. Oev. of Loss Development 0.274
indicated Relativity of Claims-Made Risk to Occurrent :e Risk 41% 100%
0.954
0.178 0.429
1.230
l Based on data of 37 PIAA companies, St. Paul, and Medical Protective.
CMVSOCC.XLS 2/18/93
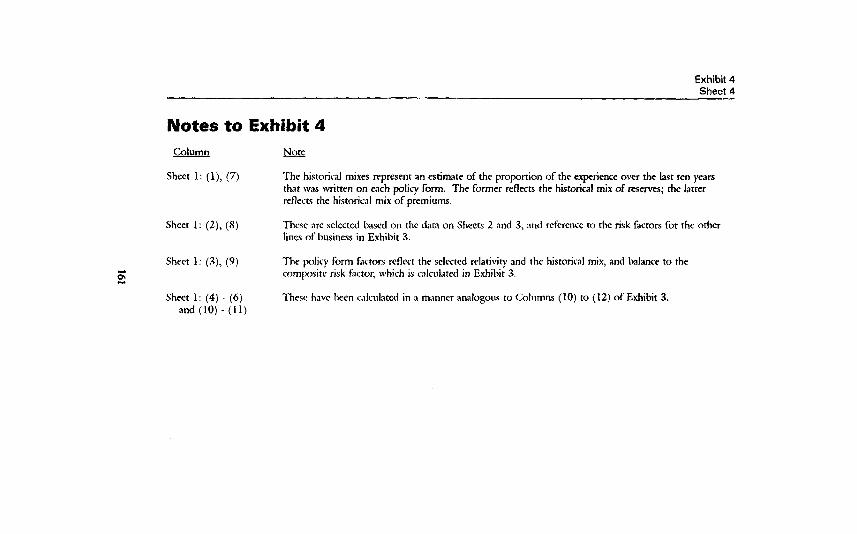
Exhibit 4 Sheet 4 -
Notes to Exhibit 4
Sheet 1: (l), (7)
Sheet 1: (2), (8)
The historical mixes represent an estimate of the proportion of the experience over the last ten years that was written on each policy form. The former reflects the historical mix of reserves; the latter reflects the historical mix of premiums.
These are selected based on the data on Sheets 2 and 3, and reference to the risk factors for the other lines of business in Exhibit 3.
Sheet 1: (3), (9)
E
Sheet 1: (4) - (6) and (10) - (11)
The policy form f&ton: reflect the selected relativity and the historical mix, and balance to the composite risk fictor, which is calculated in Exhibit 3.
These have heen c~~lculnted in a manner analogous to Columns (10) to (12) of Exhibit 3.
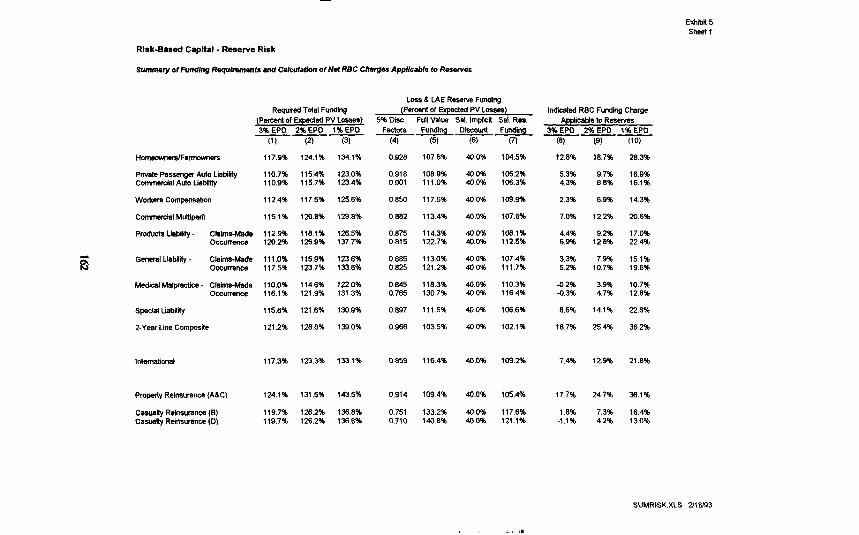
Exhibtt 5 Sheet t
Risk-Based Capital - Reserve Risk
Reaulred T&l Funding (Percmi’ol Epzded PV L&es) 3%EPD 2%EPD l%EPO
-0 (1) (3)
Private P-g~r Auto Liibittt Commcn$l Auto LiaMlii
117.9% 124.1% 1341%
110.7% 115.4% 1230% t 10.9% 115.7% 1234%
112.4% 1175% 1256%
115.1% lrn.6% 129.8%
112.9% 116.1% 126.5% 1202% 126.9% 137.7%
111.0% 115.9% 1236% 117.5% 123.7% 1x$.6%
kMidMalpfactice- claims-Made 110.0% 114.6% t 22.0% OCCllFMlCe 116.1% 121.9% 1313%
special Ltabuily
Z-Year Line Composite
tntwns(ional
Propertv Reinsurance (A&C)
Casuafly Retnsurance (Et) casualty Reimurance (0)
t 15.6% 121.6% 130.9%
121.2% 126.0% 139.0%
1173% 123.3% 1331%
124.1% 131.5% 143.5%
119.7% 1262% 136.8% 119.7% 126.2% 133.6%
LGW 8 tAE Reserve Funding (Percent of Expected PV Losses)
5% Disc. Full Value Sel. lmpktt SRI. RIB. Fsctors Funding Oiscwnt Fuw&g
(4) (5) (6) (71
0.926 107.8%
0.916 1069% 0901 1110%
0650 117.6%
0.862 113.4%
0.675 114.3% 0.615 122.7%
0.685 113.0% 0.825 121.2%
0.645 1183% 0.765 1307%
0 697 111.5%
0.966 1035%
0.659 116.4%
0.914 1094%
0.751 (33 2% 0.710 1406%
40.0% t 04.5%
40.0% 105.2% 40.0% 106.3%
400% 109.9%
40.0% 107.6%
400% 106.1% 40.0% 112.5%
40.0% 107.4% 400% 111.7%
40.0% 110.3% 40.0% 116.4%
400% 106.6%
40.0% 102.1%
40.0% 109.2%
40.0% 105.4%
400% 117.6% 400% 121 1%
Indicated RBC Funding Charge Appticabts to Resewas
3%EPD 2%EPCl l%EPD
(a)- (9) (to)
12.8% 18.7%
5.3% 9.7% 4.3% 6.6%
2.3% 6.9%
7.0% 12.2%
4.4% 9.2% 6.9% 12.6%
3.3% 7.9% 5.2% 10.7%
4.2% 39% -0.3% 4.7%
8.6% 14.1%
16.7% 25.4%
7.4%
177%
1.8% -1.1%
12.9%
24 7%
7.3% 4.2%
28.3%
(6.9% 16.1%
14.3%
20.6%
17.0% 22.4%
15.1% 19.6%
10.7% 12.8%
22.6%
362%
21.6%
36.1%
16.4% 13.0%
SUMRISK.XLS 2/18193
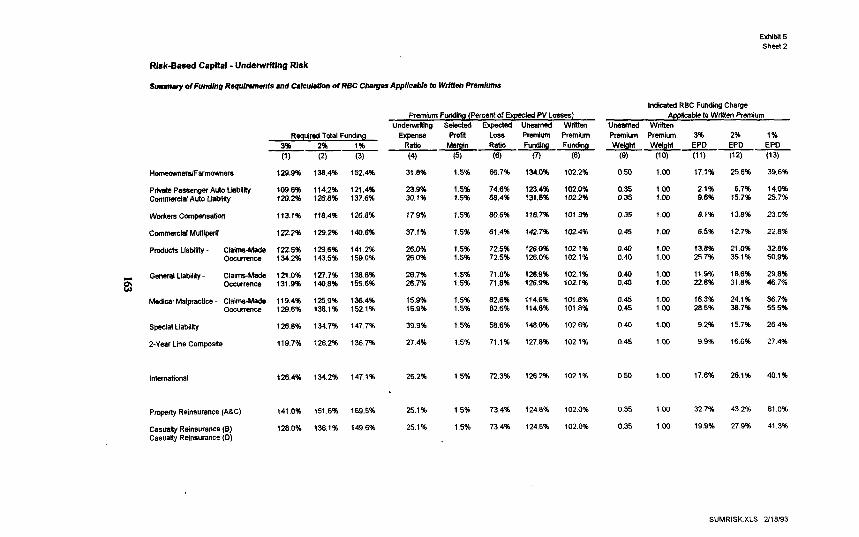
Exhibit5 Sheet2
Rtsk43a6ed Capital - UnderwritIng Risk
RequiredTotal Funding
A- 2% 1% (1) (2) (3)
HomownerslFarmwnefs
PrhndePas~mgerAutoLiabllity Commercial Auto LidMy
w.xhws compensaNon
Commercial MuKiperH
129.9% 138.4% 152.4%
109.6% 114.2% 121.4% 120.2% 128.8% 137.6%
113.1% 118.4% 1268%
122.2% 129.2% 146.6%
Products Lklbiiii- cla!ms-hlade 122.5% 129.6% 141.2% OCCUW3l~ 134.2% 143.5% 159.0%
GsnerslLiabtlity- Claims-Made 121.0% 127.7% 1366% OCCWKWI~ 131.9% 140.8% 155.6%
Medical Malpractice - Claims-Made 119.4% 125.9% 136.4% OCCUWeMe 129.6% 138.1% 152.1%
spcclal Liibwy 126.8% 1347% 147.7%
2-YearUnaCompnsile 119.7% 128.2% 135.7%
lntemenal
PropwIyReinsurance(ALC)
CasualtyReimurance(B) CaswHyReimurance(D)
1264% 134.2% 147.1%
141.0% 151.6% 169.5%
128.0% 138.1% 149.6%
31.8%
23.9% 30.1%
17.9%
37.1%
26.0% 26.0%
26.7% 26.7%
15.9% 15.9%
39.9%
27.4%
26.2%
251%
25.1%
1.5%
1.5% 1.5%
1.5%
1.5%
1.5% 1.5%
1.5% 1.5%
1.5% 1.5%
1.5%
1.5%
1.5%
1.5%
1.5%
66.7% 134.096
74.6% 123.4% 88.4% 131.5%
80.6% 118.7%
61.4% 142.7%
72.5% 126.0% 725% 126.0%
71 .a% 1269% 71.6% 126.9%
82.6% 114.6% 82.6% 114.6%
58.8% 1480%
71.1% 127.8%
72.3% 1262%
75.4% 124.6%
734% 124.6%
PremiumFunding(PercentolE~~PVLosM) Underm#lng Selected Ewected Uneamed Written
Expsllse ProM LOSS Pfemhtm Premium R8tb ?&gin Ratto Funding Funding
(4) (5) (8) 0 (8) 102.2%
102.0% 1022%
101.9%
102.4%
102.1% 102.1%
102.1% 102.1%
101.8% 101.8%
1026%
1021%
1021%
1020%
102.0%
Ap~kabktoWrittenPremium umed WrKten Premium Premium 3% 2% 1%
0.50
0.35 0.35
0.35
0.48
0.40 0.40
0.40 0.40
0.45 0.45
0.40
0.45
0.50
0.35
0.35
1.00
1.00 I.00
I.00
1.00
100 I.00
1.00 1.00
1.00 I.00
1.W
1.00
l.w
100
IW
17.1% 258%
2.1% 6.7% 9.6% 15.7%
8.1% 138%
8.5% 12.7%
13.8% 21.0% 257% 35.1%
11.9% 18.6% 228% 316%
16.3% 24.1% 28.5% 38.7%
9.2% 157%
99% 166%
17.8% 261%
32.7% 43.2%
19.9% 27.9%
39.6%
14.0% 25.7%
23.0%
22.8%
32.8% 509%
29.8% 46.7%
36.7% 555%
26.4%
27.4%
40.1%
61.0%
41.3%
SUMRISKXLS 2118193
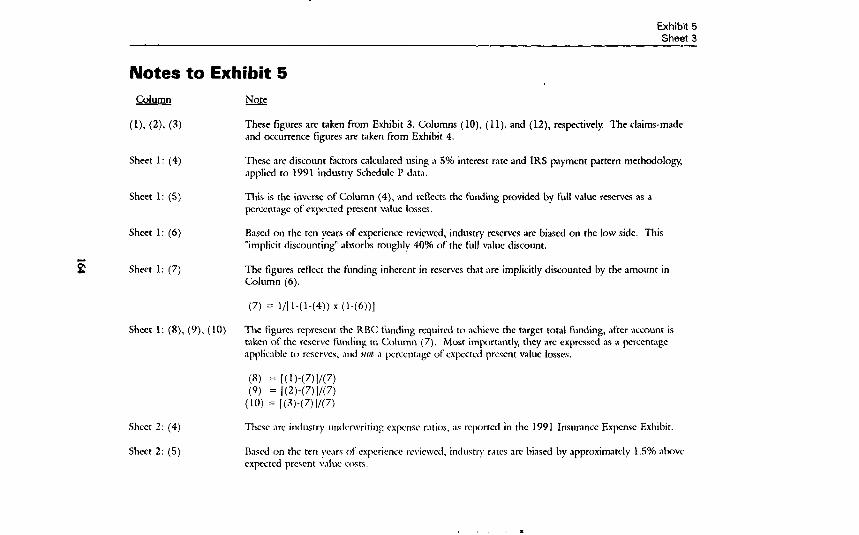
Exhibit 5 Sheet 3
Notes to Exhibit 5 Column
(11, (a, (3)
Sheet 1: (4)
sheet 1: (5)
Sheet 1: (6)
Sheet 1: (7)
Sheet I: (8). (9), (10)
Sheet 2: (4)
Sheet 2: (5)
These figures are taken from Exhibit 3, Columns (lo), (1 l), and (12), respectively. The claims-made and occurrence figures are taken from Exhibit 4.
These are discount factors calculated using a 5% interest rate and IRS payment pattern methodology, applied to 1991 industry Schedule I’ data.
This is the inverse of Column (4), and reflects the funding provided by full value reserves as a pewntage of expected present value losses.
Based on the ten years of experience reviewed, industry reserves are biased on the low side. This “implicit discounting” absorbs roughlv 40% of the full value discount.
The figures reflect the ftmding inherent in reserves that are implicitly discounted by the amount in Column (6).
(7) = I/11-(1-(4)) x (1.(6))l
The figures reprcscnt the RRC funding required to achieve the target total funding, after account is taken of the rcscrvc funding in Column (7). Most import.mtly, they are expressed as a percentage apphcnblc to rcscrvcs, .md *wz .I pcrccnt~~gc of expected present value losses.
(8) = i(l)-(7)1/(7) (9) = l(2)-(7)1/(7)
(10) = l(3)-(7)1/(7)
These .wc industry untlcrwriting expense r.>tios. as rcportcd in the 1991 Insurance Expense Exhibit.
Rascd on the ten yc.m of expcriencc rcvicwcd, industry rates arc biased by approximately 1.5% .~bovc cxpctcd present wluc costs.
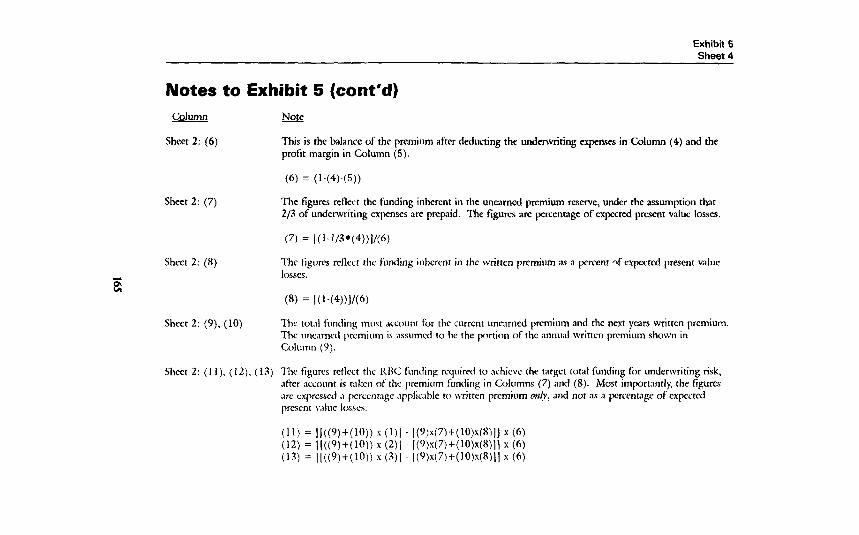
Exhibit 5 Sheet 4
Notes to Exhibit 5 (cont’d) Column
Sheet 2: (6)
p&g
This is the balance of the premium after deducting the underwriting expenses in Column (4) and the profit margin in Column (5).
Sheet 2: (7)
Sheet 2: (8)
Sheet 2: (9), (10)
16) = (1-(4)-P))
The figures reflect the funding inherent in the unearned premium reserve, under the assumption that 2/3 of underwriting expenses are prepaid. The figures are percentage of expected present value losses.
(7) = l(~-~/.?Y4))J/W
The figures reflect the funding inherent in the written premium as a percenr -f expected present value IOSSCS.
(8) = 1(1-(4))1/(6)
The tot.11 funding must account for the current unearned premium and the next years written premium. The uncCvncti premium is C>sstlmcd to IX the portion of the annual written premium shown in Column (9).
Sheet 2: (1 l), (12). (13) The figures rcflcct the 1iIlC funding required to nchicvc the target toral funding for underwriting risk, after account is taken of the premium funding in Columns (7) and (8). Most importantlp the figures :ve cxprcsscd .I pcrccnr.lgc applicable to written premium O&Y, and not as a percentage of cxpcctcd prctscnt v.lluc Iosscs.
(11) = 1]((9)+(10)) x (I,] 1(9)x(7)+(10)x(8)1] x (6) (12) = 11((9)+(lw) x (211 - i(9)~(7)+(1w%ll x (6) (13) = ]l((Y)+(lo)) s (X)1 ](Y)x(7)+(1O)x(8)]] s (6)
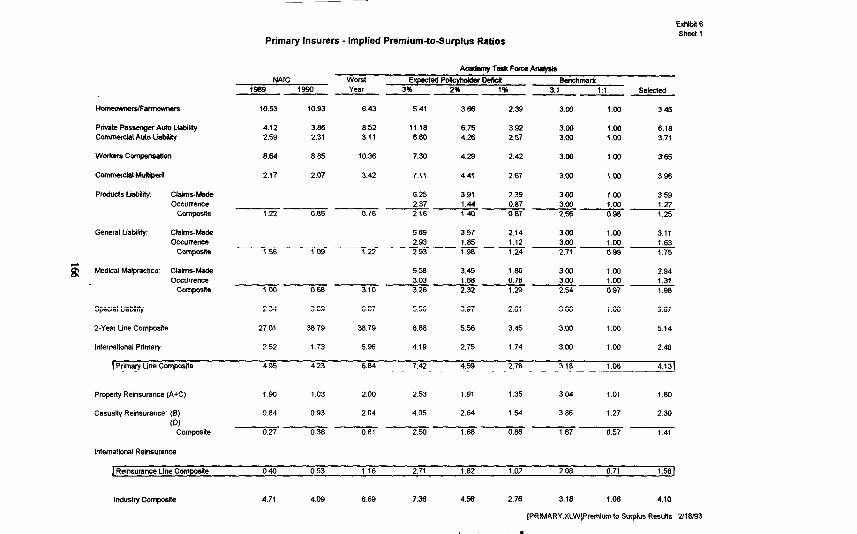
Private Passenger A&a LtatMy C-ciul Au& Liability
worlws cmpensation
ProducIs Liabittty:
General Liability: claims-wde occurrence
COmpQSite
Medical Malpractice: Claims-Made OCCUlRnCe
composite
Special Liabttt
221ear Line Compostte
International Primary
Edail 6 Sheet 1
Primary Insurers - Implied Premium-taSurplus Ratios
NAIC 1989 1990
10.53 10.93
4.12 386 2.59 2.31
8.64 0.85
2.17 2.07
1.22 0.85
1.56 1.09
1w 0.68
2 34 3 89
27.01 38 79
2.52 1 73
Academy Task Force Anatysk
WWSI Qxcled Po(loyhdQr DMctt Benchmark YWX 2% 3% A--- 3:1 1:t Selected
6.43 5.41 3.66 2.39 3.00 1.00 3.45
852 11.18 6.75 3.92 3.00 l.W 6.18 3.11 6.80 4.26 2.57 3.00 1.00 3.71
10.36 7.30 4.29 2.42 3.00 1.00 3.65
3.42 7.11 4.41 2.67 3.00 1.00 3.96
6.25 3.91 2.39 3.00 l.W 3.59 2.37 1.44 0.87 3.00 1.00 1.27
0.76 2.16 140 0.87 2.56 0.98 1.25
569 3.57 2.14 3.00 1.00 311 2.93 1.85 1.12 3.w 1.00 1.63
1.22 2.93 1.98 1.24 2.71 0.99 1.75
5.58 3.45 1.85 3.00 100 2.94 3.03 1.63 0.78 3.00 1.00 1.31
3.10 3.26 2.32 1.29 2.54 0.97 1.98
607 556 3 97 2.61 300 1.00 367
38.79 888 556 3.45 3.M) 1.W 5.14
5.96 4.19 2.75 1.74 3.00 1.00 2.48
Primary Line Composite 495 4.23 6.84 7.42 4.59 2.78 3.16 1.06 4.131
Property Reinsurance (A*C) 1.90 1.03 2.w 253 1 91 1.35 304 1 .Ol 1.80
Casually Reinstrance (6) 084 0.93 204 405 2.64 1.54 3.86 1.27 2.30 CD)
cwllposite 0.27 0.38 --Tzi 250 1.68 0.86 1.67 0.57 1.41
International Reinsurancc
LRa~nsurance Line Ccmposite 0.40 053 1.16 2.71 1.82 1.02 2.08 0.71 1.58]
lndustty Gxllposiie 4.71 4.09 6.69 7.36 4.56 2.76 3.18 1.06 4.10
(PRIMARY.XLW]Premium to Surptus Resutts 211&93
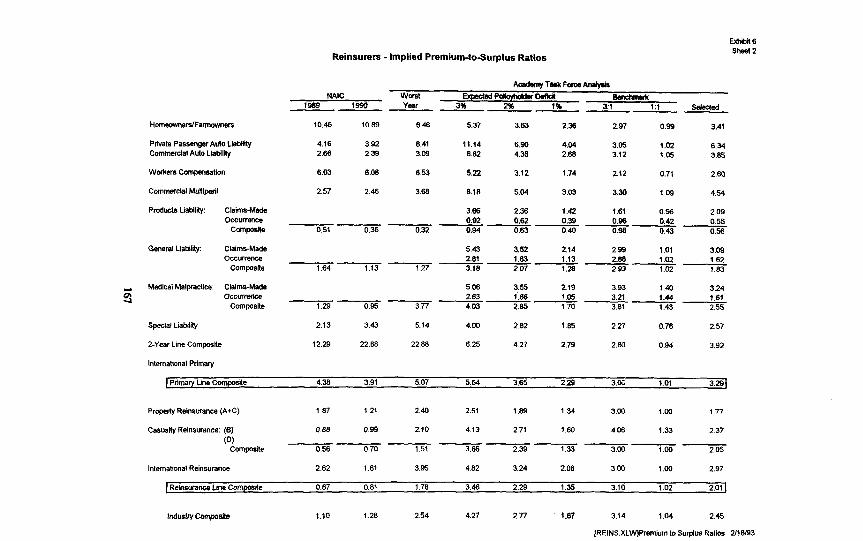
Reinsurers - implied Premium4oSurplus Ratios
Exilibas Sheet2
H-WFamumnwt
Private Passe&w Auto Liablllty Commercial Auto LlaMlVy
Workerr c0mpeMatk.n
Commefclal Munlperil
Products Liability: Claims-Made OCCunena,
C~pos#a
Medical Malpractice: Claims-Made occwrence
COmpC&~
Special Liabilii
Z-Year Line Compite
International Primary
AcadamyTaskForwA&&
NAV.2
A1990
10.46 la.89 6.46 5.37 3.63 2.36 2.97 0.99 3.41
4.16 3.92 8.41 11.14 6.90 4.04 3.05 1.02 6.34 2.66 2.39 3.09 6.82 4.38 2.68 3.12 1.0s 3.85
6.03 6.oB 6.53 5.22 3.12 1.74 2.12 0.71 2.60
2.57 2.46 3.68 8.18 5.04 3.03 3.30 1.03 4.54
3.06 2.36 1.42 1.61 0.56 2.09 0.92
0.51 0.62 0.39
0.36 0.32 D.M 0.96
0.65 0.42 0.55
0.40 0.98 0.43 0.56
5.43 3.52 2.14 2.99 1.01 3.09 2.81 1.83 1.13 2.88
1.64 1.13 1.27 J.18 207 1.28 1.02 1.62
2.93 1.02 1.83
5.06 3.55 2.19 3.93 1.40 3.24 2.63 1.86 1.05 3.21
1.29 0.95 3.77 4.03 1.44
2.85 1.70 1.61
3.81 1.45 2.55
2.13 3.43 5.14 4.00 282 1.65 2.27 0.76 2.57
12.29 22.88 22.88 625 4.27 2.79 2.80 0.94 3.92
~Prlmaly line compmne
Property Retnswance (A+C)
CasuaMy Reinswawe: (6) (0)
COmposite
lntematiinal Reinswance
[ Reinswance Line Com@te
Indus!ry~~slt9
4.38 3.91 5.07 5.64 3.65 2.29 3.x I .Ol 3.291
1 a7 1.21 2.40 2.51 1.63 1.34 3.00 I.00 1.77
0.88 0.99 2.10 413 2.71 1.60 4.06 1.33 237
0.56 0.70 1.51 3.66 2.39 1.33 3.M) 1.00 205
2.62 1.81 3.95 4.82 3.24 2.Oa 300 1.00 2.97
0.67 0.81 1.78 3.46 2.29 1.35 3.10 1.02 2.011
1.10 1.28 2.54 4.27 2.77 1.67 3.14 1.04 2.45
[REINS.XLWJPremium to Surplus Ratios 2/l&93
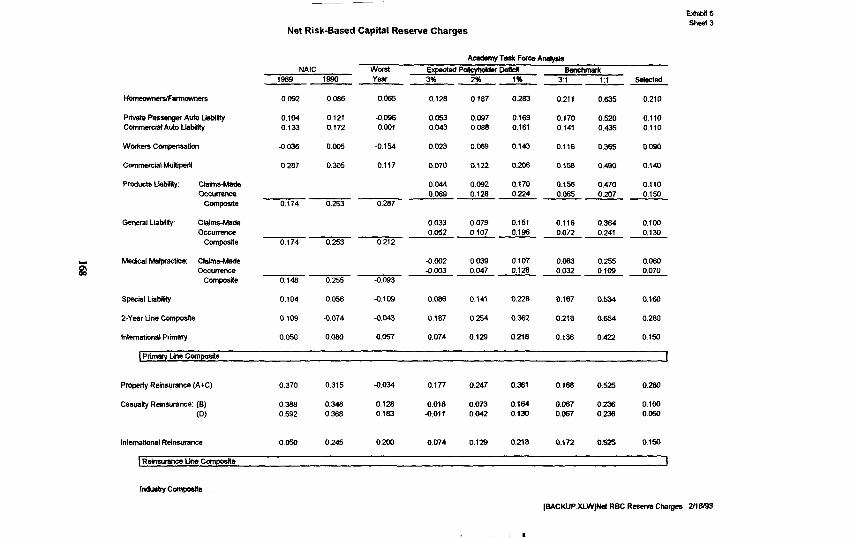
Net Risk-Based Capital Reserve Charges
NAIC 1989 19% --
0.092 0.086
0.104 0.121 0.133 0.172
-0.036 0.005
0.287 0.305
0.174 0.253
0.174 0.253
0.148 0255
0.104 0.056
0.109 -0.074
0.050 0.W
AcademyTeakFmeAmtys&
WUSt EXpCiedP&+llddMDdkN @erIchmark Year 3% rx(Jb--- 3:1 I:1 sekcted --
0.065 0.128 0.187 0.263 0.211 0.635 0.210
-0.096 0.053 0.097 0.169 0.170 0.52u 0.110 0.001 0.043 0088 0.161 0.141 0.435 0.110
-0.154 0.023 0.089 0.143 0.116 0.365 0.090
0.117 0.070 0.122 0.206 0.158 0.493 0.140
0.044 0.092 0.170 0.156 0.470 0.110 0.039 0.128 0.224 0.065 0.207 0.150
0.287------
0.033 0.079 0.151 0.116 0.364 O.lW 0.052 0.107 0.196 0.072 0.241 0.134
0.212------
-0.Lm2 0.039 0.107 0.033 0.255 0.060 -0.063 0.047 0.128 0.032 0.109 0.070
-0093------
-0.109 0.086 0.141 0.228 0.167 0.534 0160
-0.043 0.187 0.254 0.362 0.218 0.65-I 0.260
0.057 0.074 0.129 0.218 0.136 0.422 0.150
PmperhlRehswance(A*C) 0.370 0.315 -0.034 0.177 0.247 0.361 0.16s 0.525 0.280
CasuakyReinwrmce:(B) 0.384 0.348 0.128 0.018 0.073 0.164 0.067 0.236 0.106 CD) 0.592 0366 0.183 -0.011 0.042 0.130 0.067 0.236 0.060
International Reinsmmce 0.0% 0.245 0200 0.074 0.129 0.2l8 0.172 0.525 0.150
ReinwnnceUneCom~s I
[BACKUPXWJNdRECR-Charges 2/l&93
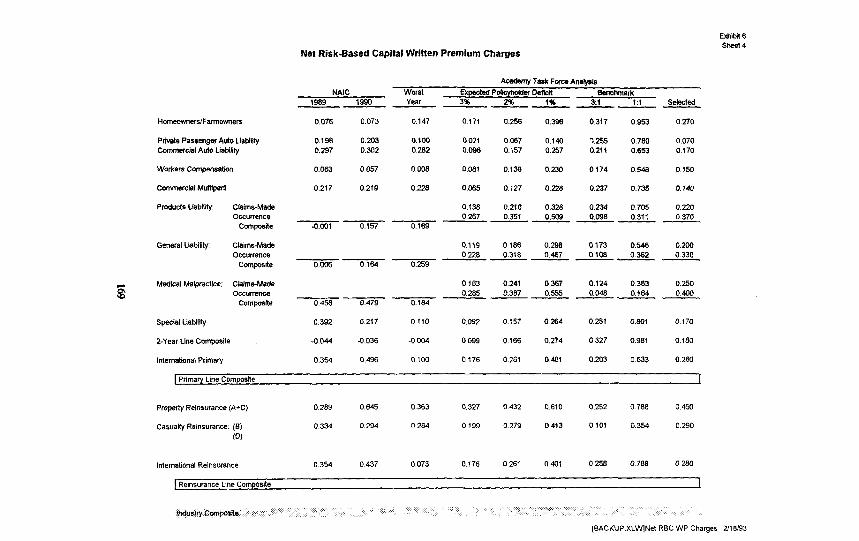
Exhibii 6 Sheet 4
Net Risk-Based Capital Written Premium Charges
HomeovmwsJFamwmers
P&ale Passenger Auto Uabilii Commercial Ado Liability
workers compensation
Products Liabilii: Claims-Made OCCUirWlCe
COOlpOSlt~
General Liabiiii: Claims-Made OCClW~llc~
Composite
0.076 0.073 0.147 0.171 0.253 0.396 0.317 0.953 0.270
0.198 0.203 0.100 0.021 0.067 0.140 ‘).255 0.780 0.070 0.297 0.302 0 282 0.096 0.157 0.257 0.211 0.653 0.170
0.063 0.057 0038 0.081 0.138 0.230 0.174 0.548 0.150
0.217 0.219 0.228 0.065 0.127 0.228 0.237 0.735 O.WU
0.138 0.210 0.328 0.234 0.705 0.223 0.257 0.351 0.509 0.098 0.311 0.370
T 0.157 -xTF------
0.119 0.166 0.296 0.173 0.546 O.xK) 0228 0.318 0.487 0.108 0.362 0.330
--GT 01M 0.259------
Medical Malpractice: Claims-Made occwrenc@
ComposRe
0.163 0.241 0.367 0.124 0.383 0.250 0.285 0.387 0.555 0.048 0.400
0.458 0.479 7---- 0.164
Speckal Liability 0.392 0.217 0110 0.092 0.157 0264 0.251 0.801 0 170
2-Year Line Composite -0.044 -0.036 -0co4 0 099 0 166 0.274 Cl 327 0.961 0.180
lntemationzd Primary 0.354 0.496 0.100 0176 0 261 0.401 0.203 0.633 0.280
Academy Task Fe An.ety& NAIC worst ExLw&Jd Pcikyhcar Dencii BendMlarlc
1989 1990 YW 3:l 1.1 selected --- 3p6 296 A---
Primary Lene CornPaRe 1 Property Reinsurance (A+C) 0289 0645 0.363 0.327 0432 0.610 0.252 0 780 04%
Casually Reinsurance: (6) 0.334 0 294 0.264 0.199 0 279 0.413 0.101 0354 0.290 (0)
International Reinsumnce 0.354 0 437 0 073 0.176 0 261 0401 0.258 0 768 0.280
Reinsurance Line Composite 1
[BACKUP.XLWW]Net RBC WP Charges 2118193

Net Risk-Based Capital Unearned Premium Charges
AcadmnyTnkFww Anatph
NAIC Wors( Ecq?EctedPoncyheMoa~ Eanchmarlc
19891990- Year 3% 2% 1% 1:i c&leded 3:1
0.242 -0.245 -0.065 0.000 O.Mx) 0.000 0.000 O.COO OSCQ
.o.odi -0.033 -0.059 O.OCG 0.000 O.ooO 0.W 0.000 OWJ -0.004 0.001 0.081 O.ooO O.ooO O.OiXl O.ooO O.OW O.Doo
-0.116 -0.122 -0.111 0.000 0.030 O.ooO O.OLW O.wO 0.000
4.154 -0.152 -0.019 0.m 0.000 O.OOG O.wO OS03 0.030
0.000 0.000 O.KlO 0.003 0.000 0.000 O.OQO O.OiJO O.ooO O.OOJ 0.000 O.OLM
4.261 -0103 -o.o04------
O.COO O.CQO O.Mx) 0.000 O.OW O.Mw) O.CQO 0.000 O.oM) 0.004 O.OCG -0.2bl -0.103 0.081-- a---
0.000 0.000 0.000 O.OlH 0.000 O.OOQ 0.004 0.000 0.000 O.OQO 0.000 0.000
0299 0520 0.078------
-0.007 -0182 -0.156 0.000 0000 O.COO 0.000 O.ooO 0.000
-0.318 -0.310 -0.107 O.ooO 0000 0.003 O.ooO 0.000 OCCCI
0.092 0.234 -0.075 O.oW 0.000 0004 O.Xil 0.000 O.OO+l
1 Plimwy um? ccmposite 1
Prcpetty Reinsurance (A+C) 0.038 0394 0.196 O.OOG O.OQO 0000 O.ooO O.OCO 0.003
Casualty Reinsurance: (B) 0.083 0.043 0.097 O.WJO O.OOG 0093 O.OQO OSXX O.wO W
International Rdnsurance 0.092 0.175 -0.167 OOOO O.Mx) 0.000 0000 0.030 0.000
Rcfnsurame Lii Composlle 1
[BACKUP XLWjNel RBC UPR Charges 2r18193
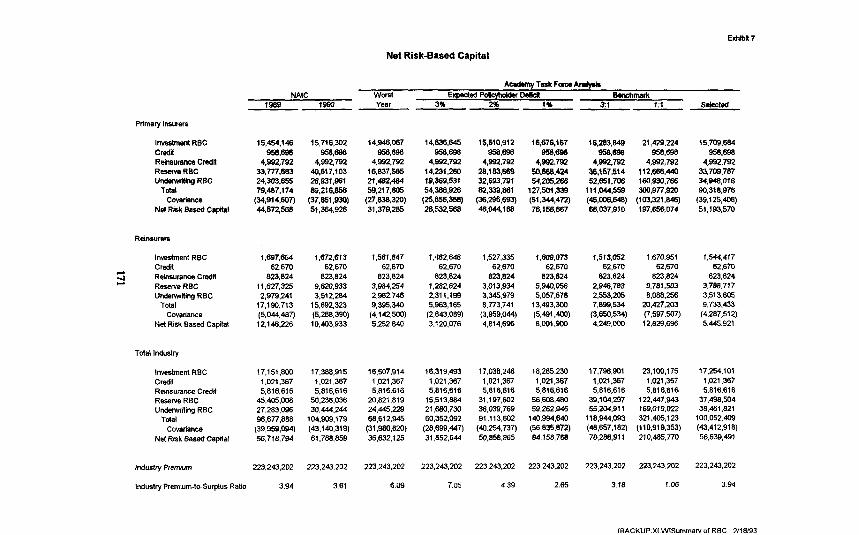
NAIC 1989 1990
Prlmalyhsurers
l!rdmentRBC creda Reinsuran~8Crtii R-RBC UndawrgingRBC
Total CovsrlaW
Ne)RkkBWdCapital
InwslmentRBC C&l ReinsurancaCredfi ReserveRBC UndemritingRBC
Total COVZ!!WlCe
NctRiskBasedCapital
InvestmentRBC 17,151,800 17.388.915 16507,914 16,319.493 17.038.246 18,285,25(1 17,7Q6,901 23.100,175 17,254,IOI CWdll 1.021.367 1.021,367 1.021367 1.021.367 1,021.367 1.021367 1.021.367 1,021,367 1.021.367 RehsuranceCredX 5.816.616 5.816.616 5.816.616 5,816.616 5.816.616 5s816.816 $816,616 5.816.616 5.816.616 Reser~eRBC 45405.008 50.238.036 20,821,819 15,513,884 31.197.6w 56.M)8.480 3%104.297 122.447943 37.498,504 UndewitingRi3C 27.283.096 3J3.444.244 24.445229 Zf.660.730 36.039.769 59262.946 55.204,911 169.Of9.022 38.461.821
Total 96.677.888 104.989.179 68,612.945 60352.092 91 .113,602 14O,S94.640 118.944.093 321,405,123 100.052.4@8 COWMilCe (39959,094) (43.140,319) (31.980,820) (28,699,447) (40254.7371 (56.635872) (48,657.182) (110,919.353) (43.412.918)
NetRiskBasedCspital 56,718,794 61.758.859 36,632,125 31,852.644 50,858.865 84.158,768 70,286.911 210,485.770 56.839,491
Industry Premium 223.243,202 223.243.202 223.243202 223.243.202 223.243.202 223.243.202
IndustryPremium-to-SurplusRatio 3.94 3.61 6.09 7.05 4.39 2.65
15,454,146 15,716.302 14946,987 14,836,645 15,510,912 16,676.157 16.283.849 21,429.224 15.709.664 %wQe 958,- 358.698 Q=,w 958,698 Q58m =.=a 958.6% Q=*-
4.992.792 4,992,7%2 4992,792 4,Q92,792 4,992.792 4*992.782 4992.792 4,992,792 4.992.792 33.m.883 40,617.103 16,837,585 14,231+2wJ 28.183,EsQ 50.683.424 36.\57514 112666.440 33JD9.787 24.3W.855 26.931,981 21.482,484 19,359,531 32.es3.79f %?05288 52,651,708 i69,930,766 34,948,016 79.487.174 69,216.M 59.217.605 54388.926 8239,861 127,501.339 Ifl,OW59 3cQ977.9m 90,318.976
(34.914,607) (37.851.9xa) (fl,BJB.Jx)) vwww w.=ww (51344,472) w5m.w Pw21,~) (39.125406) 44,572,553 51,364.92% 31379,285 28,532,568 46,04%,168 76,156,867 ss,037.910 197.658,074 51.193,570
1,697.654 1.672.613 62,670 62,670
823.824 823.824 11.627:325 9.620:933
2,979.241 3.512.284 17.190,713 15.692,323 (5.044487) WW390) 12.146.226 10.403.933
Net Risk-Based Capital
1.561.847 1.482.848 62,670 62.670
823,824 823,624 3.984.254 7,282,624 2962,746 2,311.199 9,395.340 5983,165 (4142.500) (2a843.089) 5.252.840 3.120.076
1.527335 1.6u9.073 1,513,052 1,67O.Q51 62.670 62,670 82.670 62.670
823,824 823.824 823,824 823,824 3.013.934 w40.056 2.946.783 9,781,503 3.345.979 5057,678 2,553*M5 8,088.256 8.77X741 13.493.303 7.899.534 20.427203
(3:959:044) (5:491:400) (3bG34) (7:597.507) 4,814.696 8.001.900 4.249.0@3 12.829.696
223.243.202 223,243,202
316 1.06
1544,417 62,670
823,824 3,78?3.717 3.513.806 9,733,433
(4,287,512) 5.445.921
223.243202
3.94