Embed Size (px)
Citation preview

Report on Nutrient and Biological Synoptic Surveys in the Upper Patuxent Watershed, Anne Arundel and Prince George’s Counties, Maryland, April
2002 as part of the Watershed Restoration Action Strategy.
Maryland Department of Natural Resources Chesapeake and Coastal Watershed Service
Watershed Restoration Program Watershed Evaluation Section
November, 2002

Acknowledgements This work was supported by the 2002 319(h) grant from U.S. Environmental Protection Agency
# C9-00-3497-02-0. This work supports Department of Natural Resources Outcomes – #2 Healthy Maryland watershed lands, streams, and non-tidal rivers. #3 A natural resources stewardship ethic for Marylanders. #4 Vibrant local communities in balance with natural systems. Significant field collection assistance was provided by Beth Habic, Jennifer Jaber, Kevin R.
Coyne, and John McCoy of MD Dept of Natural Resources, Chesapeake and Coastal Watershed Services, Watershed Restoration Division, Watershed Evaluation Section.
Comments or questions about this report can be directed to : Niles L. Primrose MD Dept of Natural Resources Chesapeake and Coastal Watershed Services Watershed Restoration Division Watershed Evaluation Section. [email protected] 410-260-8804
i
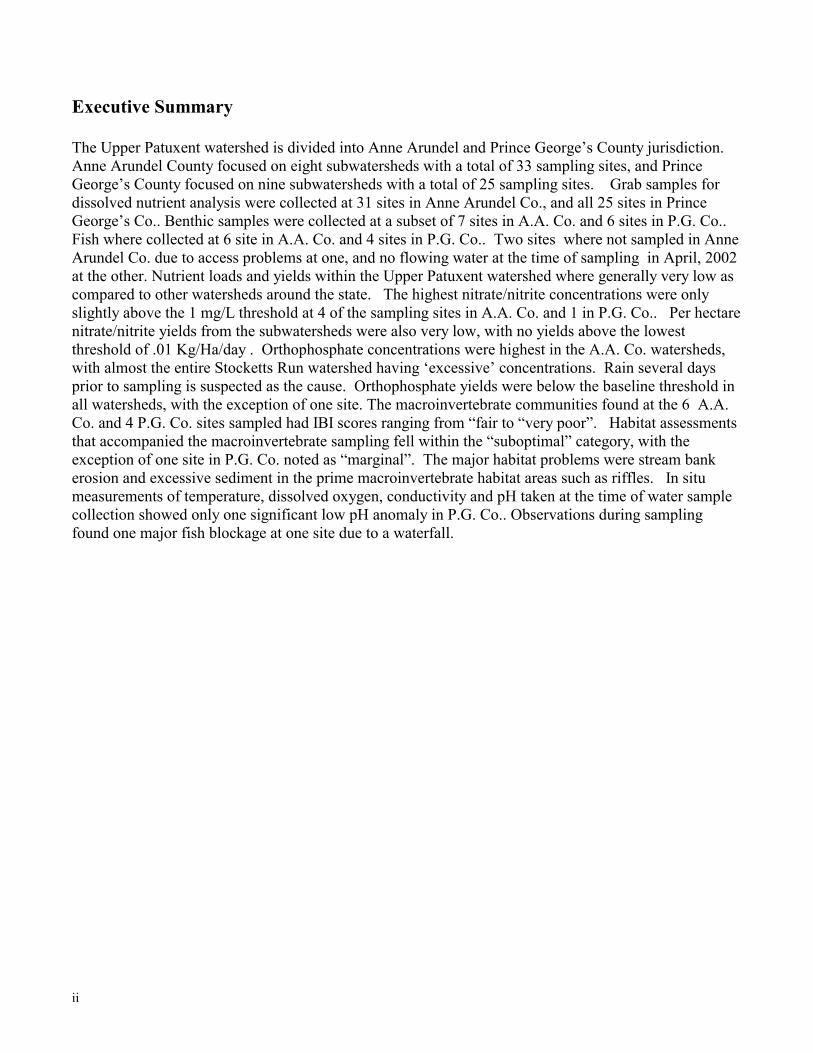
Executive Summary The Upper Patuxent watershed is divided into Anne Arundel and Prince George’s County jurisdiction. Anne Arundel County focused on eight subwatersheds with a total of 33 sampling sites, and Prince George’s County focused on nine subwatersheds with a total of 25 sampling sites. Grab samples for dissolved nutrient analysis were collected at 31 sites in Anne Arundel Co., and all 25 sites in Prince George’s Co.. Benthic samples were collected at a subset of 7 sites in A.A. Co. and 6 sites in P.G. Co.. Fish where collected at 6 site in A.A. Co. and 4 sites in P.G. Co.. Two sites where not sampled in Anne Arundel Co. due to access problems at one, and no flowing water at the time of sampling in April, 2002 at the other. Nutrient loads and yields within the Upper Patuxent watershed where generally very low as compared to other watersheds around the state. The highest nitrate/nitrite concentrations were only slightly above the 1 mg/L threshold at 4 of the sampling sites in A.A. Co. and 1 in P.G. Co.. Per hectare nitrate/nitrite yields from the subwatersheds were also very low, with no yields above the lowest threshold of .01 Kg/Ha/day . Orthophosphate concentrations were highest in the A.A. Co. watersheds, with almost the entire Stocketts Run watershed having ‘excessive’ concentrations. Rain several days prior to sampling is suspected as the cause. Orthophosphate yields were below the baseline threshold in all watersheds, with the exception of one site. The macroinvertebrate communities found at the 6 A.A. Co. and 4 P.G. Co. sites sampled had IBI scores ranging from “fair to “very poor”. Habitat assessments that accompanied the macroinvertebrate sampling fell within the “suboptimal” category, with the exception of one site in P.G. Co. noted as “marginal”. The major habitat problems were stream bank erosion and excessive sediment in the prime macroinvertebrate habitat areas such as riffles. In situ measurements of temperature, dissolved oxygen, conductivity and pH taken at the time of water sample collection showed only one significant low pH anomaly in P.G. Co.. Observations during sampling found one major fish blockage at one site due to a waterfall.
ii

Table of Contents Page Acknowledgements i Executive Summary ii List of Tables iv List of Figures iv Introduction 1 Methods 2 Results/ Discussion 3 Literature Cited 20 Appendix A 21
iii

List of Tables Page Table 1. Nutrient Ranges and Rating 1 Table 2. Upper Patuxent WRAS, Anne Arundel County Synoptic Sampling Station Locations 4 Table 3. Upper Patuxent WRAS, Prince George's County Synoptic Sampling Station Locations 6 Table 4. Anne Arundel County Upper Patuxent Watershed Nutrient Synoptic Survey Results, March/April 2002 8 Table 5. Prince George's County Upper Patuxent Watershed Nutrient Synoptic Survey Results, April 2002. 9 Table 6. Annual & Spring Nutrient Concentration (mg/L) Averages from Other Nutrient Synoptic Surveys 9 Table 7. Anne Arundel County Upper Patuxent Watershed, InSitu Water Quality, March/April 2002 18 Table 8. Prince George's County Upper Patuxent Watershed, InSitu Water Quality, April 2002 19 Table 9. Fish Communities at AA and PG Co. Sites List of Figures Figure 1. Upper Patuxent WRAS Anne Arundel County Nutrient Synoptic
Sampling Sites 5 Figure 2. WRAS Sampling Sites April 2002, Upper Patuxent Prince George’s Co. Watersheds 7 Figure 3. WRAS Nutrient Synoptic Survey, April 2002 Upper Patuxent Anne Arundel Co. Watersheds Nitrate/Nitrite (NO2+NO3) Concentrations (mg/L) 10 Figure 4.WRAS Nutrient Synoptic Survey, April 2002 Upper Patuxent
Prince George’s Co. Watershed Nitrate/Nitrite (NO2+NO3) Concentrations (mg/L) 11 Figure 5. WRAS Nutrient Synoptic Survey, April 2002 Upper Patuxent Anne Arundel Co. Watersheds Nitrate/Nitrite (NO2+NO3) Yield (Kg/ha/day) 12 Figure 6.WRAS Nutrient Synoptic Survey, April 2002 Upper Patuxent
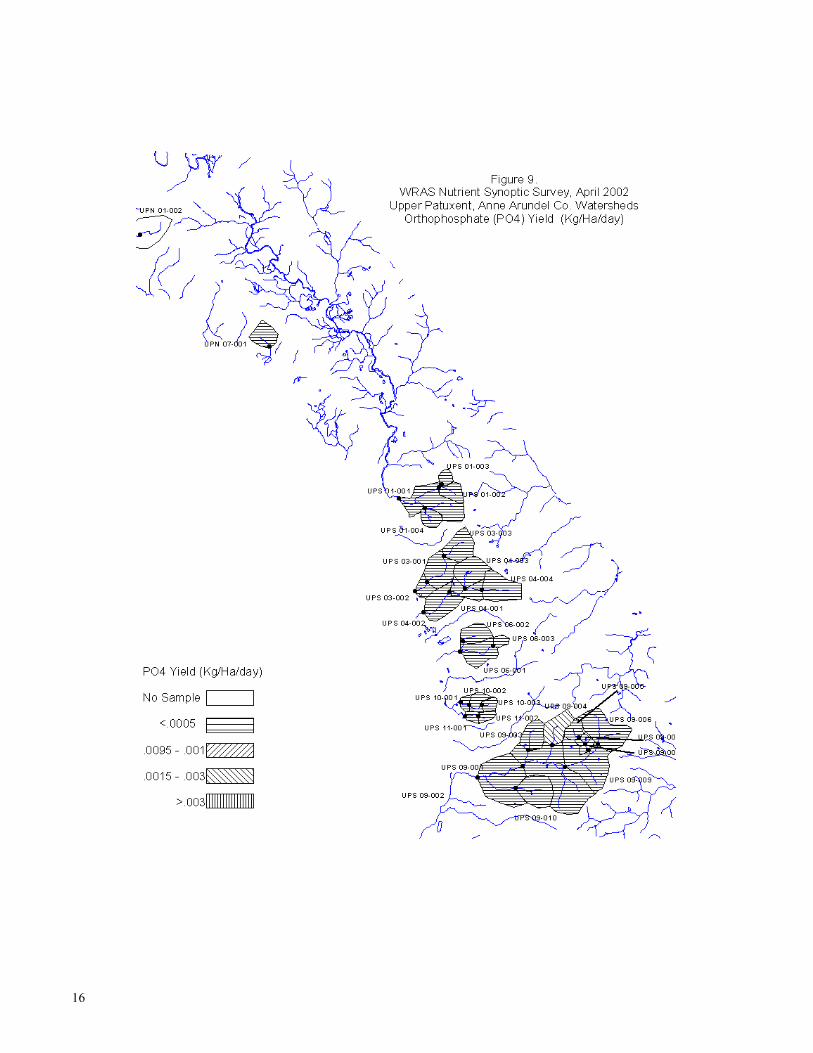
Prince George’s Co. Watershed Nitrate/Nitrite (NO2+NO3) Yield (Kg/ha/day) 13 Figure 7.WRAS Nutrient Synoptic Survey, April 2002 Upper Patuxent Anne Arundel Co. Watershed Orthophosphate (PO4) Concentrations (mg/L) 14 Figure 8.WRAS Nutrient Synoptic Survey, April 2002 Upper Patuxent Prince George’s Co.. Watershed Orthophosphate (PO4) Concentrations (mg/L) 15 Figure 9.WRAS Nutrient Synoptic Survey, April 2002 Upper Patuxent Anne ArundelCo. Watershed Orthophosphate (PO4) Yield (Kg/ha/day) 16 Figure 10.WRAS Nutrient Synoptic Survey, April 2002 Upper Patuxent Prince George’s Co. Watershed Yield Orthophosphate (PO4) (Kg/ha/day) 17
iv

Introduction Nutrient synoptic sampling was scheduled for early spring to coincide with the period of maximum nitrogen concentrations in the free flowing fresh water streams. The major proportion of the nitrogen compounds are carried dissolved in the ground water rather than in surface runoff. The higher nitrogen concentrations in the late winter and early spring reflect the higher proportion of nitrogen rich shallow ground water present in the base flow at this time of year. Nitrogen concentrations are reduced in summer as the proportion of shallow ground water is reduced through plant uptake, and replaced by deeper ground water that may have lower nitrate concentrations, or has been denitrified through interaction with anoxic conditions in the soils below the streambed. Point sources can also contribute to in stream nitrate concentrations.
Orthophosphate is generally transported bound to suspended sediments in the water column. In stream orthophosphate concentrations can also be produced through mobilization of sediment bound phosphorus in anoxic water column and/or sediment conditions, sediment in surface runoff from areas having had surface applied phosphorus, ground water from phosphorus saturated soils, and point source discharges.
Ranges used for nutrient concentrations and yields were derived from work done by Frink (1991). The low end values are based on estimated nutrient exports from forested watersheds, and the high end values are based on estimated nutrient exports from intensively agricultural watersheds. As an additional bench mark, the Chesapeake Bay Program uses 1 mg/L total nitrogen as a threshold for indicating anthropogenic impact. The dissolved nitrogen fraction looked at in these synoptic surveys constitutes approximately 50% to 70% of the total nitrogen. For ease of discussion, the four divisions within the concentration and yield ranges will be considered background, moderate, high, and excessive (Table 1.).
Table 1. Nutrient Ranges and Rating NO2+NO3 NO2+NO3 PO4 PO4 Concentration Yield Concentration Yield Rating mg/L Kg/ha/day mg/L Kg/ha/day Baseline <1 <.01 <.005 <.0005 Moderate 1 to 3 .01 to .02 .005 to .01 .0005 to .001 High 3 to 5 .02 to .03 .01 to .015 .001 to .002 Excessive >5 >.03 >.015 >.002
A Note of Caution
Estimates of annual dissolved nitrogen loads/yields from spring samples will result in inflated load estimates, but the relative contributions of subwatersheds should remain reasonably stable. More accurate nitrate/nitrite load/yield estimates need to include sampling during the growing season to account for potential lower concentrations and discharges. Storm flows can also significantly impact loads delivered to a watershed outlet.
The tendency of orthophosphate to be transported bound to sediments makes any estimates of annual orthophosphate loads/yields derived from base flow conditions very conservative. More accurate estimates of orthophosphate loads/yields in a watershed must include samples from storm flows that carry the vast majority of the sediment load of a watershed. Residual suspended sediments from recent rains, or instream activities of livestock or construction can produce apparently elevated orthophosphate concentrations and yields at base flow.
1

Biological (macroinvertebrates and fish) sampling and habitat condition information are collected on a limited basis within the WRAS watersheds. Analysis of the biological data in conjunction with the nutrient and Stream Corridor Assessment information can provide good insight into the location, severity, and causes of water quality problems within a watershed.
Additional analysis that draws in existing and planned land use, and tax map information, can be a useful watershed planning tool to determine what areas might be targeted for protection or remediation. METHODS Water Chemistry Sampling Synoptic water chemistry samples were collected in early spring throughout the watershed. Grab samples of whole water (500 ml) were collected just below the water surface at mid-stream and filtered using a 0.45 micron pore size (Gelman GF/C) filter. The samples were stored on ice and frozen on the day of collection. Filtered samples were analyzed by the Nutrient Analytical Services Laboratory at the University of Maryland's Chesapeake Biological Laboratory (CBL) for dissolved inorganic nitrogen (NO3, NO2), and dissolved inorganic phosphorus (PO4). All analyses were conducted in accordance with U.S. Environmental Protection Agency (EPA) protocols. Stream discharge measurements were taken at the time of all water chemistry samples. Water temperature, dissolved oxygen, pH, and conductivity were measured in the field with a Hydrolab Surveyor II at the time of all water quality collections. Watershed areas used to calculate nutrient yields per unit area were determined from a digitized watershed map using Arcview software.
Where sites are nested in a watershed the mapped concentration data for the downstream site is shown only for the area between the sites. Yield calculations for a downstream site are based on the entire area upstream of the site, but are mapped showing just the area between sites. The downstream sites therefore illustrate the cumulative impact from all upstream activities. Benthic Macroinvertebrate Sampling Aquatic macroinvertebrates were collected at the time of water chemistry samples during the spring to be within the MBSS spring index period. Macroinvertebrate collections were made over a 2m2 area of the best available habitat using a 0.3m wide dip net with a mesh size of 500 microns. The best available habitats include: gravel riffles, snags, submerged vegetation and root mats. Habitats were sampled in the proportion to their occurrence at the station. Samples were composited in a sieve bucket, fine sediments washed out, and large debris rinsed and discarded. The remaining sample was preserved in 70% ethanol and returned to the laboratory for subsampling. Subsampling was done using a gridded tray. Grids were chosen at random until the grid with the 100th organism had been completed. Organisms were identified to genus, recorded on a bench sheet, and archived future reference. Insitu water quality data (dissolved oxygen, pH, conductivity, temperature) were collected during each sampling episode with a Hydrolab Surveyor II. A macroinvertebrate index of biotic integrity (IBI)(MD DNR, 1998) was calculated to facilitate ranking of site quality. Macroinvertebrate Habitat Assessment A habitat assessment was completed at the time of the macroinvertebrate collections to provide a qualitative measure of the in stream and riparian habitat quality. The assessment, modified from Plafkin et al. (1989) to focus on macroinvertebrate habitat, rates the in stream structure, channel and lower bank morphology, and the upper bank and riparian zone using a series of metrics. The metrics are weighted to provide more scoring potential to the parameters more directly influencing the in stream
2

macroinvertebrate community. The macroinvertebrate habitat score is weighted by the number of equally scored metrics in each category. The primary metrics rate in stream habitat quality and quantity available for use by the macroinvertebrate community. This includes the amount and type of woody debris, prevalence of undercut banks, degree of embeddedness (siltation) in riffles, pool depth, and water velocity and flow. These metrics are given the most weight because of their direct importance to the health and diversity of the in stream macroinvertebrate communities. Secondary metrics assess channel morphology, rating the quality of the lower stream bank and the structure of the channel. These metrics include relative measures of riffle extent, channel sinuosity, and extent of channel alterations caused by high flow events. These metrics are weighted less than the primary because of their less direct impact on the in stream macroinvertebrate communities. The tertiary metrics rate the quality of the upper banks and adjacent riparian areas. These metrics include scoring of the type and amount of bank vegetation, amount and frequency of bank erosion, and land use in the riparian area. These characteristics of the watershed are given the least weight because they are less important to the in stream macroinvertebrate community. Fish Sampling Fish were sampled during the summer to coincide with the MBSS index period for fish sampling. Backpack electroshockers were used for two passes through a 75 meter reach of stream with block nets at each end of the reach. All species were enumerated and weighed to obtain taxa richness and biomass estimates. Results Anne Arundel and Prince George;s Counties identified a total of 58 sites in the upper Patuxent watershed for nutrient sampling. The 33 Anne Arundel site locations are described in Table 2 and mapped in Figure 1. The 25 Prince George’s sites locations are described in Table 3 and mapped in Figure 2, .
Nutrient loads and yields within the upper Patuxent watershed where generally very low as shown in Tables 4 and 5, and as compared to other watersheds around the state (Table 6). The highest nitrate/nitrite concentrations were only slightly above the 1 mg/L threshold at 4 A.A. Co. sites (UPS 1-001, 6-003, 9-002, 10-003) (Figure 3) and at 3 P.G. Co. sites (02-034A, 02-032, 39-079B) (Figure 4). Per hectare nitrate/nitrite yields from the subwatersheds were also very low, with only one A.A. Co. site (UPS 9-004) with a moderate yield (Figures 5 & 6)). Orthophosphate concentrations were excessive in the Stocketts Run (A.A. Co.) watershed, and elevated in several other small subwatersheds (Figures 7 & 8). The high orthophosphate concentrations did not translate to elevated yields, with the exception of one site in A.A. Co. (Figures 9 & 10). Moderate rains several days prior to sampling produced sediment that probably persisted in the water column of the streams to create the elevated PO4 concentrations.
3
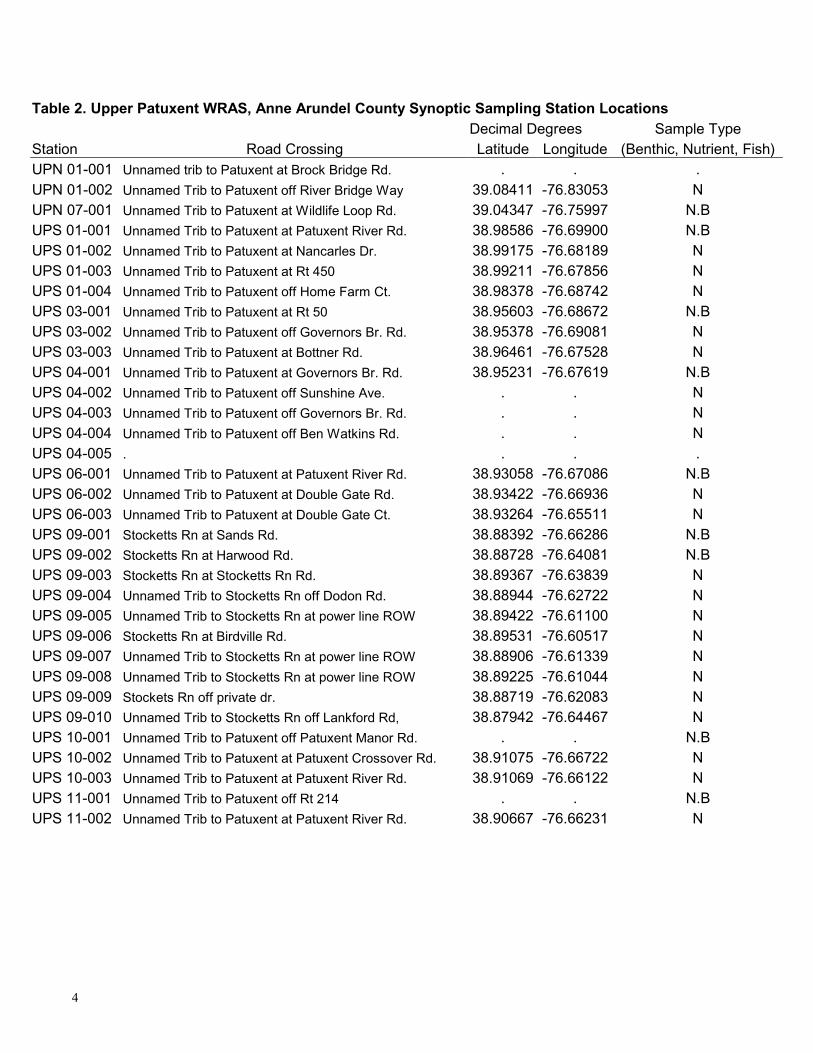
Table 2. Upper Patuxent WRAS, Anne Arundel County Synoptic Sampling Station Locations Decimal Degrees Sample Type Station Road Crossing Latitude Longitude (Benthic, Nutrient, Fish)UPN 01-001 Unnamed trib to Patuxent at Brock Bridge Rd. . . . UPN 01-002 Unnamed Trib to Patuxent off River Bridge Way 39.08411 -76.83053 N UPN 07-001 Unnamed Trib to Patuxent at Wildlife Loop Rd. 39.04347 -76.75997 N.B UPS 01-001 Unnamed Trib to Patuxent at Patuxent River Rd. 38.98586 -76.69900 N.B UPS 01-002 Unnamed Trib to Patuxent at Nancarles Dr. 38.99175 -76.68189 N UPS 01-003 Unnamed Trib to Patuxent at Rt 450 38.99211 -76.67856 N UPS 01-004 Unnamed Trib to Patuxent off Home Farm Ct. 38.98378 -76.68742 N UPS 03-001 Unnamed Trib to Patuxent at Rt 50 38.95603 -76.68672 N.B UPS 03-002 Unnamed Trib to Patuxent off Governors Br. Rd. 38.95378 -76.69081 N UPS 03-003 Unnamed Trib to Patuxent at Bottner Rd. 38.96461 -76.67528 N UPS 04-001 Unnamed Trib to Patuxent at Governors Br. Rd. 38.95231 -76.67619 N.B UPS 04-002 Unnamed Trib to Patuxent off Sunshine Ave. . . N UPS 04-003 Unnamed Trib to Patuxent off Governors Br. Rd. . . N UPS 04-004 Unnamed Trib to Patuxent off Ben Watkins Rd. . . N UPS 04-005 . . . . UPS 06-001 Unnamed Trib to Patuxent at Patuxent River Rd. 38.93058 -76.67086 N.B UPS 06-002 Unnamed Trib to Patuxent at Double Gate Rd. 38.93422 -76.66936 N UPS 06-003 Unnamed Trib to Patuxent at Double Gate Ct. 38.93264 -76.65511 N UPS 09-001 Stocketts Rn at Sands Rd. 38.88392 -76.66286 N.B UPS 09-002 Stocketts Rn at Harwood Rd. 38.88728 -76.64081 N.B UPS 09-003 Stocketts Rn at Stocketts Rn Rd. 38.89367 -76.63839 N UPS 09-004 Unnamed Trib to Stocketts Rn off Dodon Rd. 38.88944 -76.62722 N UPS 09-005 Unnamed Trib to Stocketts Rn at power line ROW 38.89422 -76.61100 N UPS 09-006 Stocketts Rn at Birdville Rd. 38.89531 -76.60517 N UPS 09-007 Unnamed Trib to Stocketts Rn at power line ROW 38.88906 -76.61339 N UPS 09-008 Unnamed Trib to Stocketts Rn at power line ROW 38.89225 -76.61044 N UPS 09-009 Stockets Rn off private dr. 38.88719 -76.62083 N UPS 09-010 Unnamed Trib to Stocketts Rn off Lankford Rd, 38.87942 -76.64467 N UPS 10-001 Unnamed Trib to Patuxent off Patuxent Manor Rd. . . N.B UPS 10-002 Unnamed Trib to Patuxent at Patuxent Crossover Rd. 38.91075 -76.66722 N UPS 10-003 Unnamed Trib to Patuxent at Patuxent River Rd. 38.91069 -76.66122 N UPS 11-001 Unnamed Trib to Patuxent off Rt 214 . . N.B UPS 11-002 Unnamed Trib to Patuxent at Patuxent River Rd. 38.90667 -76.66231 N
4

5

Table 3. Upper Patuxent WRAS, Prince George's County Synoptic Sampling Station Locations Sample Type Station Road Crossing Latitude Longitude (Benthic, Nutrient, Fish)PG 02-002 Green Br at stadium 38.94647 -76.71133 N PG 02-019 Unnamed Trib to Pax. off Scarlet Tanager Way 39.03794 -76.81314 N.B PG 02-029 Unnamed Trib Tto Pax. off Canadian Way 39.05811 -76.83103 N PG 02-032 Unnamed Trib to Pax. off Montpelier Dr. 39.09036 -76.88522 N PG 02-034A Pax. off bottom of Main St. 39.10183 -76.83992 N PG 02-034B Pax. off Post Office Rd 39.10919 -76.84997 N.B PG 03-001 Unnamed Trib to Pax. at Brooklyn Br. Rd. 39.10903 -76.86608 N PG 03-005 Unnamed Trib to Pax. at Bond Mill Rd. 39.11150 -76.89042 N PG 04-005 Unnamed Trib to Pax. off Bowie Rd. 39.09394 -76.84631 N PG 04-005B Unnamed Trib to Putuxent at Pax. Greens G.C. 39.08967 -76.83783 N PG 04-009 Horsepen Br off Fletchertown Rd. 39.09878 -76.85467 N PG 06-008 Bear Br. At Contee Rd. 39.09036 -76.88522 N PG 10-001 Horsepen Br off Fletchertown Rd. 38.99008 -76.78133 N PG 10-009 Horsepen Br off Fletchertown Rd. 38.99108 -76.77933 N.B PG 10-015A Unnamed Trib to Horsepen Br. at Hillmeade Rd. 38.99078 -76.79881 N PG 10-017A Newstop Br. off Quill Pt. Dr. 38.99797 -76.78556 N.B PG 10-017B Newstop Br. off Quill Pt. Dr. 38.99942 -76.79067 N PG 10-017C Newstop Br. off Hillmeade Rd. . . N PG 39-072A Unnamed Trib to Pax. off King James Ct. 38.88383 -76.70825 N PG 39-072B Unnamed Trib to Pax. off King James Ct. 38.88322 -76.70997 N PG 39-072C Unnamed Trib to Pax. off King James Ct. 38.88169 -76.71006 N PG 39-077A Honey Br. Off Rt. 214 38.95611 -76.68797 N.B PG 39-079A Honey Br. Off Rt. 214 38.90653 -76.69236 N PG 39-079B Honey Br. Off Federal Hill Ct. 38.90522 -76.71119 N PG 39-102A Unnamed Trib to Pax. off Morningside La. 38.98422 -76.73547 N.B
6

7

Table 4. Anne Arundel County Upper Patuxent Watershed Nutrient Synoptic Survey Results, March/April 2002. Concentration Daily Loads Area Nutrient Yields/Hectare DATE STATION PO4 NO23 Discharge PO4 NO23 Hectares PO4 NO23 (mg P/L) (mg N/L) (L/s) (kg/day) (kg/day) (kg/day/ha) (kg/day/ha) Notes 04/17/02 UPN 01-001 . . 0.00 . . 187 . . dry 04/17/02 UPN 01-002 0.004 0.01 0.10 0.000035 0.000086 254 0.000000 0.000000 03/12/02 UPN 07-001 0.001 0.01 3.06 0.000264 0.002643 85 0.000003 0.000031 03/12/02 UPS 01-001 0.002 1.07 14.94 0.002581 1.380806 377 0.000007 0.003665 03/12/02 UPS 01-002 0.002 2.26 3.12 0.000539 0.608598 92 0.000006 0.006625 03/12/02 UPS 01-003 0.004 0.92 0.28 0.000096 0.022167 30 0.000003 0.000730 04/17/02 UPS 01-004 0.008 0.29 7.35 0.005077 0.184056 53 0.000095 0.003446 03/12/02 UPS 03-001 0.001 0.29 22.39 0.001935 0.561047 262 0.000007 0.002139 03/12/02 UPS 03-002 0.001 0.42 13.78 0.001191 0.500031 308 0.000004 0.001626 03/12/02 UPS 03-003 0.005 0.01 0.34 0.000149 0.000298 120 0.000001 0.000002 03/12/02 UPS 04-001 0.003 0.56 11.21 0.002906 0.542494 381 0.000008 0.001425 04/12/02 UPS 04-002 0.006 0.15 29.39 0.015233 0.380836 538 0.000028 0.000708 04/12/02 UPS 04-003 0.010 0.01 1.71 0.001476 0.001476 127 0.000012 0.000012 04/12/02 UPS 04-004 0.011 0.06 5.09 0.004834 0.026366 172 0.000028 0.000153 04/12/02 UPS 04-005 . . . . . 76 . . no access03/13/02 UPS 06-001 0.004 0.88 12.74 0.004404 0.968859 233 0.000019 0.004164 03/13/02 UPS 06-002 0.014 0.77 0.72 0.000865 0.047582 83 0.000010 0.000571 04/17/02 UPS 06-003 0.005 1.44 0.25 0.000106 0.030614 25 0.000004 0.001220 03/13/02 UPS 09-001 0.022 0.49 124.50 0.236652 5.270888 1681 0.000141 0.003135 03/13/02 UPS 09-002 0.027 1.00 99.84 0.232897 8.625827 1259 0.000185 0.006849 03/13/02 UPS 09-003 0.018 0.71 6.26 0.009734 0.383953 95 0.000103 0.004055 04/18/02 UPS 09-004 0.053 0.58 28.32 0.129673 1.419059 109 0.001187 0.012987 04/18/02 UPS 09-005 0.008 0.06 1.32 0.000912 0.006837 48 0.000019 0.000143 03/13/02 UPS 09-006 0.030 0.27 10.68 0.027680 0.249123 212 0.000131 0.001177 04/18/02 UPS 09-007 0.062 0.39 3.03 0.016239 0.102149 68 0.000239 0.001502 04/17/02 UPS 09-008 0.032 0.08 2.32 0.006422 0.016055 90 0.000071 0.000178 04/17/02 UPS 09-009 0.077 0.09 18.44 0.122666 0.143376 585 0.000210 0.000245 04/17/02 UPS 09-010 0.157 0.08 1.59 0.021584 0.010998 153 0.000141 0.000072 04/12/02 UPS 10-001 0.009 0.74 2.19 0.001701 0.139877 98 0.000017 0.001428 03/13/02 UPS 10-002 0.003 0.68 5.14 0.001332 0.301904 76 0.000018 0.003968 03/13/02 UPS 10-003 0.010 1.07 2.30 0.001984 0.212315 30 0.000067 0.007187 04/12/02 UPS 11-001 0.005 0.29 2.91 0.001256 0.072819 50 0.000025 0.001451 03/13/02 UPS 11-002 0.004 0.24 0.36 0.000124 0.007415 27 0.000005 0.000273
8

Table 5. Prince George's County Upper Patuxent Watershed Nutrient Synoptic Survey Results, April 2002. Concentration Daily Loads Area Nutrient Yields/Hectare DATE STATION PO4 NO23 Discharge PO4 NO23 Hectares PO4 NO23 (mg P/L) (mg N/L) (L/s) (kg/day) (kg/day) (kg/day/ha) (kg/day/ha)04/12/02 PG 02-002 0.003 0.01 11.55 0.002993 0.009977 151 0.000020 0.000066 04/16/02 PG 02-019 0.004 0.02 0.08 0.000027 0.000136 111 0.000000 0.000001 04/16/02 PG 02-029 0.002 0.01 0.10 0.000016 0.000082 45 0.000000 0.000002 04/16/02 PG 02-032 0.002 1.15 0.52 0.000090 0.051506 92 0.000001 0.000558 04/16/02 PG 02-034A 0.001 1.19 623.03 0.053830 64.057606 683643 0.000000 0.000094 04/16/02 PG 02-034B 0.002 0.27 573.18 0.099045 13.371123 684800 0.000000 0.000020 04/16/02 PG 03-001 0.002 0.04 17.24 0.002980 0.059596 251 0.000012 0.000238 04/16/02 PG 03-005 0.003 0.56 3.14 0.000813 0.151835 173 0.000005 0.000877 04/16/02 PG 04-005 0.002 0.83 35.33 0.006106 2.533918 524 0.000012 0.004835 04/16/02 PG 04-005B 0.001 0.92 36.36 0.003141 2.890046 600 0.000005 0.004819 04/16/02 PG 04-009 0.001 0.20 9.03 0.000780 0.156047 80 0.000010 0.001947 04/16/02 PG 06-008 0.001 0.12 9.16 0.000791 0.094955 265 0.000003 0.000359 04/12/02 PG 10-009 0.002 0.02 24.92 0.004306 0.043058 215 0.000020 0.000200 04/12/02 PG 10-011 0.004 0.10 18.98 0.006561 0.164020 412 0.000016 0.000399 04/16/02 PG 10-015A 0.002 0.10 1.33 0.000230 0.011480 42 0.000006 0.000275 04/16/02 PG 10-017A 0.004 0.50 4.41 0.001524 0.190453 274 0.000006 0.000694 04/16/02 PG 10-017B 0.003 0.21 2.92 0.000757 0.052980 210 0.000004 0.000252 04/16/02 PG 10-017C 0.003 0.24 0.26 0.000068 0.005443 40 0.000002 0.000137 04/12/02 PG 39-072A 0.006 0.14 2.24 0.001163 0.027145 118 0.000010 0.000231 04/12/02 PG 39-072B 0.006 0.15 1.48 0.000765 0.019134 102 0.000008 0.000188 04/12/02 PG 39-072C 0.003 0.18 0.86 0.000222 0.013317 87 0.000003 0.000154 04/12/02 PG 39-077A 0.012 0.06 4.52 0.004681 0.023407 379 0.000012 0.000062 04/12/02 PG 39-079A 0.007 0.06 3.69 0.002234 0.019151 177 0.000013 0.000108 04/12/02 PG 39-079B 0.003 1.47 0.26 0.000068 0.033335 54 0.000001 0.000619 04/12/02 PG 39-102A 0.002 0.14 7.71 0.001332 0.093260 310 0.000004 0.000301
Table 6. Annual & Spring Nutrient Concentration (mg/L) Averages from Other Nutrient Synoptic Surveys Piney German Br. Pocomoke Bush Breton Bay Patuxent Choptank LibertyNO2+NO3 Spring 3.742 3.832 3.734 1.944 0.223 0.439 2.892 3.410 NO2+NO3 Annual 4.823 4.704 2.384 PO4 Spring 0.800 0.043 0.028 0.006 0.004 0.012 0.023 0.004 PO4 Annual 1.177 0.067 0.022
9

10

11

12

13

14

15
16

17

Insitu water quality readings in the Anne Arundel County watersheds are noted in Table 7. No significant anomalies were noted at the time of sampling. The low dissolved oxygen reading at station UPN 01-002 came from the only water in the reach, a residual (almost no flow) pool. Table 8 provides the insitu water quality found at the Prince George’s County sites. One site, 02- 019 on the Patuxent Wildlife Refuge, had very low pH and dissolved oxygen due to the extremely low flow originating in a boggy seep and traveling several hundred meters through extensive leaf litter to the sampling site. While the substrate and flow at this site were conducive to poor to very poor macroinvertebrate and fish communities, the low pH values could also be detrimental to the biological communities in the system. This stream dried up later in the season.
Table 7. Anne Arundel County Upper Patuxent Watershed, InSitu Water Quality, March/April 2002 InSitu Hydrolab Readings DATE STATION TIME Temp. pH Cond. DO 03/12/02 UPN 01-001 915 . . . . 04/17/02 UPN 01-002 925 18.81 6.78 0.392 0.53 03/12/02 UPN 07-001 1000 6.94 5.82 0.044 9.87 03/12/02 UPS 01-001 1320 6.14 6.92 0.200 11.41 03/12/02 UPS 01-002 1200 7.37 5.93 0.259 9.99 03/12/02 UPS 01-003 1220 6.04 6.48 0.273 10.27 04/17/02 UPS 01-004 1045 19.81 7.42 0.114 8.07 03/12/02 UPS 03-001 1300 6.46 6.63 0.094 11.11 03/12/02 UPS 03-002 1420 6.75 6.86 0.117 11.04 03/12/02 UPS 03-003 1230 7.04 6.70 0.135 10.18 03/12/02 UPS 04-001 1450 7.12 6.90 0.246 10.60 04/12/02 UPS 04-002 1150 12.16 6.91 0.219 12.25 04/12/02 UPS 04-003 1050 11.69 6.64 0.359 5.26 04/12/02 UPS 04-004 940 11.08 6.94 0.255 9.75 04/12/02 UPS 04-005 . . . . . 03/13/02 UPS 06-001 940 8.16 7.57 0.238 9.25 03/13/02 UPS 06-002 920 8.49 6.68 0.171 8.27 04/17/02 UPS 06-003 1225 20.24 5.47 0.402 6.84 03/13/02 UPS 09-001 1230 6.80 6.06 0.185 10.55 03/13/02 UPS 09-002 1150 6.90 6.02 0.188 10.74 03/13/02 UPS 09-003 1300 7.86 5.58 0.205 9.81 04/18/02 UPS 09-004 800 19.15 7.40 0.203 7.19 04/18/02 UPS 09-005 845 17.35 6.31 0.176 7.30 03/13/02 UPS 09-006 1330 7.87 5.76 0.242 10.19 04/18/02 UPS 09-007 800 18.54 6.49 0.179 8.03 04/17/02 UPS 09-008 1445 22.87 7.23 0.162 9.14 04/17/02 UPS 09-009 1400 22.35 7.76 0.194 10.24 04/17/02 UPS 09-010 1310 23.96 6.75 0.164 7.08 04/12/02 UPS 10-001 1315 12.77 6.85 0.542 13.45 03/13/02 UPS 10-002 1045 7.54 6.23 0.639 9.09 03/13/02 UPS 10-003 1025 7.06 5.95 0.169 8.62 04/12/02 UPS 11-001 1400 13.86 7.19 0.305 10.30 03/13/02 UPS 11-002 1100 7.26 5.47 0.322 8.13
18

Table 8. Prince George's County Upper Patuxent Watershed, InSitu Water Quality, April 2002 InSitu Hydrolab Readings DATE STATION TIME Temp. pH Cond. DO 04/12/02 PG 02-002 755 12.27 6.65 0.281 9.39 04/16/02 PG 02-019 1345 22.25 3.64 0.104 2.95 04/16/02 PG 02-029 1250 23.00 7.32 0.447 9.66 04/16/02 PG 02-032 1130 20.70 6.98 0.250 5.70 04/16/02 PG 02-034A 930 12.16 6.79 0.173 10.10 04/16/02 PG 02-034B 950 12.15 6.90 0.169 12.21 04/16/02 PG 03-001 1020 18.87 7.09 0.374 10.57 04/16/02 PG 03-005 1040 19.15 7.19 0.259 11.19 04/16/02 PG 04-005 905 10.80 6.93 0.388 9.69 04/16/02 PG 04-005B 1220 21.06 7.35 0.414 10.48 04/16/02 PG 04-009 835 17.24 7.19 0.326 12.57 04/16/02 PG 06-008 1105 19.19 7.04 0.510 10.40 04/12/02 PG 10-001 1335 13.55 6.71 0.242 8.78 04/12/02 PG 10-009 1355 13.56 7.08 0.230 9.84 04/16/02 PG 10-015A 1450 22.35 6.01 0.277 7.70 04/16/02 PG 10-017A 1535 23.59 7.24 0.315 10.58 04/16/02 PG 10-017B 1505 23.95 6.81 0.336 11.27 04/16/02 PG 10-017C 1430 22.65 6.06 0.448 5.87 04/12/02 PG 39-072A 1120 12.23 6.82 0.221 10.67 04/12/02 PG 39-072B 1135 12.35 6.89 0.215 11.16 04/12/02 PG 39-072C 1145 12.16 6.25 0.224 9.45 04/12/02 PG 39-077A 900 11.14 7.11 0.151 9.30 04/12/02 PG 39-079A 1020 11.36 6.47 0.149 9.61 04/12/02 PG 39-079B 945 12.12 5.30 0.271 8.56 04/12/02 PG 39-102A 1235 13.00 5.58 0.259 7.70
Macroinvertebrate and habitat data from 9 sites in Anne Arundel and 6 sites in Prince George’s
County was turned over to the respective county subcontractors for inclusion in their reports. Historic macroinvertebrate sampling of Stocketts Run at Sands Rd. found good macroinvertebrate communities. Historic sampling of Horsepen Branch at Racetrack Rd. found very poor macroinvertebrate communities (Primrose, pers.com.). Site descriptions of the Anne Arundel County sites are attached in Appendix A.
Fish were collected at 6 sites in Anne Arundel County and 4 sites in Prince George’s County. The results are provided in Table 9.. The paucity of fish at all of the Anne Arundel sites is indicative of at least partial blockages down stream. Site 6-001 has a major blockage approximately 75 meters downstream of the road crossing. Watersheds of less than 125 hectares with very limited amounts of water have naturally limited fish communities. The PG site 39-102A is in a very urbanized area with many possibilities for limiting fish passage. Limited or no fish passage combined with high potential for lethal conditions from anoxia, contaminated storm water, etc. could account for no fish being present at this site.
19
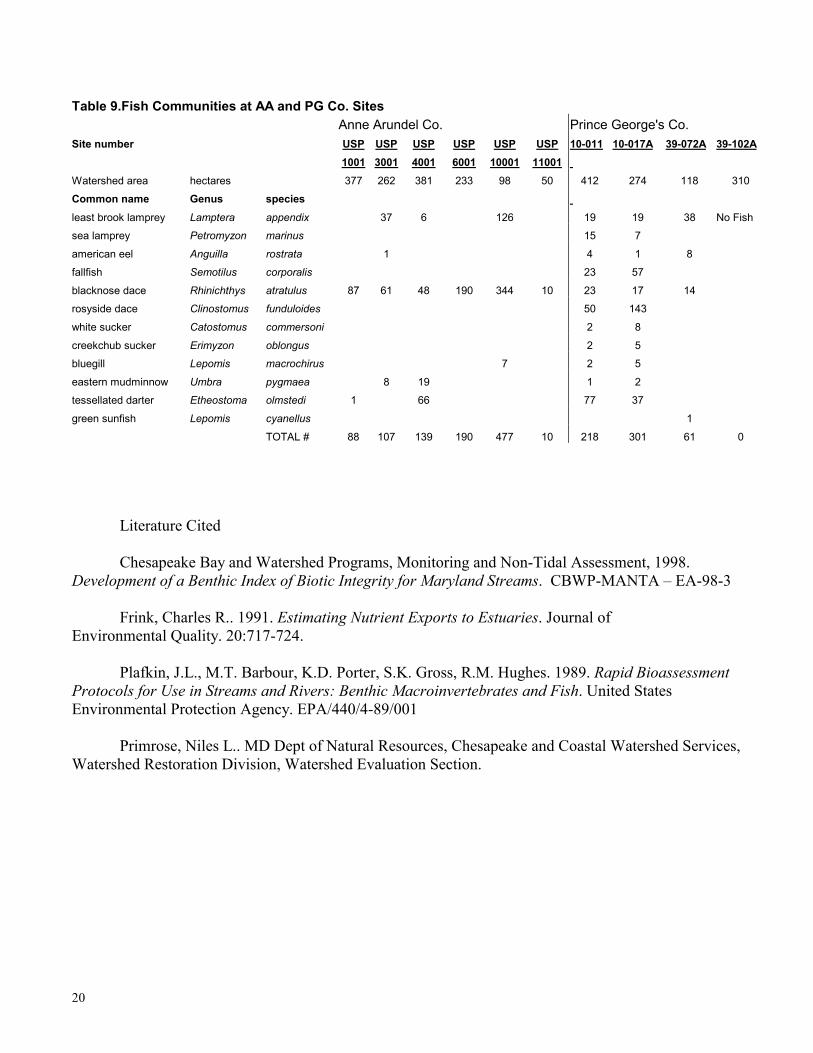
Table 9.Fish Communities at AA and PG Co. Sites Anne Arundel Co. Prince George's Co. Site number USP USP USP USP USP USP 10-011 10-017A 39-072A 39-102A 1001 3001 4001 6001 10001 11001 Watershed area hectares 377 262 381 233 98 50 412 274 118 310 Common name Genus species least brook lamprey Lamptera appendix 37 6 126 19 19 38 No Fish sea lamprey Petromyzon marinus 15 7
american eel Anguilla rostrata 1 4 1 8 fallfish Semotilus corporalis 23 57
blacknose dace Rhinichthys atratulus 87 61 48 190 344 10 23 17 14 rosyside dace Clinostomus funduloides 50 143
white sucker Catostomus commersoni 2 8
creekchub sucker Erimyzon oblongus 2 5 bluegill Lepomis macrochirus 7 2 5
eastern mudminnow Umbra pygmaea 8 19 1 2 tessellated darter Etheostoma olmstedi 1 66 77 37
green sunfish Lepomis cyanellus 1
TOTAL # 88 107 139 190 477 10 218 301 61 0 Literature Cited Chesapeake Bay and Watershed Programs, Monitoring and Non-Tidal Assessment, 1998.
Development of a Benthic Index of Biotic Integrity for Maryland Streams. CBWP-MANTA – EA-98-3 Frink, Charles R.. 1991. Estimating Nutrient Exports to Estuaries. Journal of
Environmental Quality. 20:717-724. Plafkin, J.L., M.T. Barbour, K.D. Porter, S.K. Gross, R.M. Hughes. 1989. Rapid Bioassessment
Protocols for Use in Streams and Rivers: Benthic Macroinvertebrates and Fish. United States Environmental Protection Agency. EPA/440/4-89/001
Primrose, Niles L.. MD Dept of Natural Resources, Chesapeake and Coastal Watershed Services,
Watershed Restoration Division, Watershed Evaluation Section.
20

APPENDIX A Anne Arundel County Benthic Collection Site Descriptions UPN1-001 Site was immediately upstream of Brock Bridge Rd. in a mature floodplain forest with moderate to heavy understory. The stream was dry on the date of the site visit (3/12/02), therefore no macroinvertebrate sample was collected. Significant sand and gravel deposits both in and out of the stream channel and up to 60% eroded banks indicate this stream is subject to flashy heavy storm flows during rain events. UPS1-001 Site was immediately upstream of Patuxent River Rd. in a mature flood plain forest with moderate shrubby understory. Commercial structures were visible approximately 200 meters away at the top of the 25 to 30 meter high hills to the north of the stream. No structures were visible on the south side. The majority of the stream banks were cut banks up to one meter high, and instream substrate was dominated by soft sand with minimal gravel riffles and woody debris. All indicative of heavy storm water flows through the reach. The macroinvertebrate community had good representation in the EPT. This, coupled with the rather poor habitat, indicates there must be areas of good refugia upstream of the sampling site. Insitu water quality parameters (temp, D.O., pH, conductivity) indicated no unusual conditions. UPS3-001 Site was immediately upstream of Rt 50 in an area of mature poplar/beech/oak forest with little understory. No structures, other than a simple foot bridge, where visible upstream of the site. Sediment deposition in the channel was heavy. Stream banks were eroded along 40 to 50% of the reach, with cut banks up to one meter high. Instream substrate was dominated by sand with scattered shallow small diameter (<15mm) gravel riffles and woody debris. ATV traffic along stream bank and in the stream channel contributes heavily to habitat degradation. The IBI for the macroinvertebrate sample was in the “fair” range due to a high percentage of EPT (>50%) in the subsample. The IBI score is misleading in this case because of the overwhelming dominance of the relatively tolerant Baetis sp. mayflies within the EPT and the total sample. The short life cycles of the majority of the macroinvertebrate community is indicative of unstable and frequently disturbed habitat. Insitu water quality parameters (temp, D.O., pH, conductivity) indicated no unusual conditions. UPS4-001 Site was immediately upstream of Governors Bridge Rd.. Over the sample reach, and for several hundred meters upstream, the entire west side was active horse pasture with access to the stream. Residential lawn came to the top of the 3 to 4 meter high east bank. Mature trees along the stream bank shaded the stream, but there was very little understory or herbaceous stream side cover. In stream substrate and characteristics where adequate for macroinvertebrates and fish. There was some evidence of sand movement and scour at obstructions. Tolerant Chironomidae (Diptera) larvae were the dominant macroinvertebrate, and tolerant Baetis sp. and Hydropsyche sp. were the dominant EPT taxa, both typical of this type of impact. Insitu water quality parameters (temp, D.O., pH, conductivity) indicated no unusual conditions.
21

UPS6-001 Site was immediately upstream of Patuxent River Rd. in mature woodland with thick shrubby understory. The area was large lot residential, but none impacted the immediate riparian area. The instream substrate was relatively good with mixed gravel size riffles and moderate amounts of woody debris. The macroinvertebrtate community was consistent with the available habitat. The most significant feature of this area was a 2+ meter high waterfall down stream of the sample site. Insitu water quality parameters (temp, D.O., pH, conductivity) indicated no unusual conditions. UPS7-001 Site was within the Patuxent Wildlife Refuge upstream of Wildlife Loop Rd. in mature hardwood forest with little understory. Beaver activity had severely impacted this site, although dam had been removed. Stream channel was 100% leaf litter, with no exposed mineral substrate, and very little water. Insitu water quality parameters (temp, D.O., pH, conductivity) indicated no unusual conditions. The macroinvertebrtate community was dominated by Chironomidae which is consistent with the available habitat. UPS9-001 Site was immediately upstream of Sands Rd.. The channel was deeply incised with one to two meter high cut banks on both sides. Residential development was visible on the north side of the stream but was not within the 18 meter buffer. There were several good gravel riffles within the reach, but woody debris was at a minimum, and unstable sand dominated the remainder of the stream bed. Insitu water quality parameters (temp, D.O., pH, conductivity) indicated no unusual conditions. The macroinvertebrtate community was consistent with the available habitat. UPS9-002
Site was immediately upstream of Harwood road in mature poplar/beech/oak forest with very sparse understory, and large lot residential development. Stream was very incised with one to one and a half meter high cut banks on both sides. Substrate was dominated by sand with scattered woody debris and shallow riffles of small gravel. Prevalence of sand and gravel bars, and cut banks, indicated considerable storm flows through the area. Insitu water quality parameters (temp, D.O., pH, conductivity) indicated no unusual conditions. The macroinvertebrtate community was consistent with the available habitat. Prince George’s County Benthic Site Descriptions PG 02-019 Site was a forested headwater stream on the Patuxent Wildlife Refuge. At the time of sampling in March, there was minimal flow and the sand/mud substrate was entirely covered with leaves. The stream banks where stable, but showed indication of past erosion.
22
PG 02-034B Site was on the mainstem of the Patuxent in Laurel. Riffle quality was good, and there was minor bank erosion. PG 10-009 Site was in a large lot area of Bowie. Benthic substrate was limited to occasional riffles and minor woody debris. Channel was deeply incised (up to 1.5 meters) and subject to heavy storm flows from adjacent and upstream roads. Riparian area within reach was wooded, but with little understory. PG 10-017A Site was in a forested flood plain area with moderately heavy shrub understory in riparian area of reach. Benthic substrate was limited to occasional riffles and minor woody debris. Channel was moderately incised due to storm flows from adjacent parking lots and upstream roads. PG 39-077A Site was in suburban/small agriculture area with minimal forested riparian zone. Benthic substrate was poor, being dominated by soft sediment and with no riffles and moderate amounts of woody debris. Although channel was not deeply incised due to functional flood plain, there was evidence of storm flow erosion. PG 39-102A Site was in an urbanized portion of Bowie. Benthic substrate was minimal, being restricted to coarse sand or riprap and scattered woody debris. Substrate scouring from storm flows was extensive. Banks were stable only because of extensive armoring.
23