Embed Size (px)
Citation preview

1
Government of India Earth System Science Organisation
Ministry of Earth Sciences India Meteorological Department
Report on Northeast Monsoon – 2017
(Prepared by: S.Balachandran, B.Geetha, D.Maragathavel and S.B.Thampi)
Regional Weather Forecasting Centre Office of the Deputy Director General of Meteorology
Regional Meteorological Centre, Chennai

2
1. Background
The Indian southwest monsoon (SWM) season of June to September is the chief rainy
season for India and 75% of the country’s annual rainfall is realised during this season. However,
for the extreme southeastern state of Tamil Nadu and the Union Territory of Puducherry (PDC)
which together are considered as the meteorological subdivision of Tamil Nadu (TN), the
normal SWM seasonal rainfall realised is only about 35% (317.2 mm) of its annual rainfall
(914.4 mm) as this subdivision comes under the rain-shadow region during the SWM. The
northeast monsoon (NEM) season of October to December (OND) is the chief rainy season for
this subdivision with 48% (438.2 mm) of its annual rainfall realised during this season and hence
its performance is a key factor for this regional agricultural activities. Further, the NEM season is
also the primary cyclone season for the North Indian Ocean (NIO) basin comprising of the Bay
of Bengal (BOB) and the Arabian Sea (AS) and cyclonic disturbances (CDs; low pressure
systems (LPS) with maximum sustained surface wind speed (MSW) of 17 knots or more)
forming over BOB and moving west/northwest-wards affect the coastal areas of the TN
subdivision and also contribute significantly to NEM rainfall. As such, the NEM season assumes
importance from the agricultural as well as cyclone disaster management perspectives. Inland
flooding associated with heavy rainfall episodes during the season is also a cause for concern.
Further, the NEM seasonal rainfall shows a high degree of variability with 27% co-efficient of
variation. The recent NEM seasons of 2015 and 2016 saw two extreme seasonal rainfall scenario.
Whereas the NEM 2015 was +52% excess over the TN sub division with some extremely heavy
rainfall activity and unprecedented floods over the north coastal districts of Chennai,
Kanchipuram and Thiruvallur, the NEM 2016 was largely deficient at -62% and was the worst
deficient scenario in the last 140 years. The excess NEM 2015 occurred under strong El Nino
and positive-normal Indian Ocean Dipole (IOD) conditions which are generally associated with
good NEM performance. But, the largely deficient OND 2016 occurred under weak La Nina
over the equatorial Pacific and negative to near normal IOD over the Indian Ocean region.
However, during OND 2017, the ENSO and IOD were not expected to modulate the NEM
performance as neutral ENSO and IOD conditions prevailed. This report presents the salient
features of NEM over the meteorological subdivisions of TN, Coastal Andhra Pradesh (CAP),
Rayalaseema (RYS), South Interior Karnataka (SIK), and Kerala (KER) during October-
December 2017.
2. Onset phase
Normally, the onset of NEM takes place over coastal Tamil Nadu (CTN) by 20th
October
after the withdrawal of SWM up to about 15°N latitude. Prior to the onset of NEM over CTN,
the low level winds reverse from southwesterlies (during the SWM) to northeasterlies along
CTN and south coastal Andhra Pradesh (SCAP). During the year 2017, due to extended SWM
activity over the peninsular India, withdrawal of SWM up to 15°N latitude took place only
around 25th
October when it withdrew from the entire country. Simultaneously, setting in of
easterlies in the lower tropospheric levels over the southern peninsula took place and with the

3
prevalence of an upper air cyclonic circulation over southeast Tamilnadu and neighbourhood and
another cyclonic circulation over Lakshadweep area and neighbourhood on 25th
October,
conditions became favourable for commencement of northeast monsoon rains during the
subsequent 48 hrs. Low level wind flow pattern, mean sea level pressure and clouding associated
with the onset of NEM 2017 are presented in Fig.1(a-d). Westerly wind in the lower levels over
the BOB and southern peninsular India during 01st-25
th October 2017 became easterly
subsequently during 26th
to 31st October 2017. 850 hPa streamline analysis as on 23
rd and 27
th
October 2017 indicate the wind reversal from the westerly to easterly regime during the onset
phase of NEM 2017. A low pressure area (LOPAR) at the mean sea level formed over the
Comorin area and neighbourhood on 27th
October which was seen as two separate LOPARs, one
over the southwest BOB and adjoining Sri Lanka and the other over the Lakshadweep area on
28th
(Fig.1d). On 27th
October, the NEM rains commenced over TN, KER and adjoining areas
with widespread (WS) rainfall activity over Kerala and scattered (SCT) rainfall activity over TN
and SIK. The cloudiness associated with the LOPARs are indicated in the INSAT-3D infra-red
cloud imageries (Fig.1d). Even though the onset of NEM 2017 was delayed by a week, rainfall
activity during the onset phase of NEM 2017 was quite significant as detailed in Table-1.
Table-1 Rainfall activity over Tamil Nadu during 27 Oct to 06 Nov 2017
Date
Spatial
distribution
NEM
Activity Heavy rainfall occurrence
27-Oct-2017 SCT Normal Isolated heavy
28-Oct-2017 FWS Normal Isolated heavy
29-Oct-2017 SCT Weak --
30-Oct-2017 ISOL Normal Isolated heavy
31-Oct-2017 FWS Vigorous
Scattered heavy with isolated very heavy to
extremely heavy rainfall activity over CTN
01-Nov-2017 FWS Active Isolated heavy
02-Nov-2017 SCT Normal Isolated heavy to very heavy
03-Nov-2017 FWS Active
Scattered heavy with isolated very heavy to
extremely heavy rainfall activity over CTN
04-Nov-2017 SCT Normal Isolated heavy to very heavy
05-Nov-2017 WS Active Isolated heavy to very heavy
06-Nov-2017 WS Active Isolated heavy to very heavy
WD: Widespread; FWD: Fairly Widespread; SCT: Scattered; ISOL: Isolated;
(Note:Kindly refer Appendix(i) for explanations on terminologies used for categorization of
spatial rainfall distribution and Appendix (ii) & (iii) for description of heavy rainfall and NEM
activity)

4
Fig.1a NCEP reanalysis 850 hPa pentad mean wind (kt) during 01-25 Oct 2017 and mean
wind (kt) during 26-31 October 2017

5
Fig.1b NCEP reanalysis 850 hPa streamline analysis indicating reversal wind over
peninsular India during the onset phase of NEM 2017 (23rd
& 27th
October)

6
Fig.1c Mean sea level pressure analysis charts as on 27-28 October 2017, 0830 IST
During the period from 27th
October to 06th
November, there were 6 days of fairly widespread
(FWS) to WS rainfall over TN with 5 days of active to vigorous NEM conditions. There were 6
days of very heavy rainfall occurrences with extremely heavy rainfall events on two days. Sirkali
(Nagapattinam district) recorded 31 cm of rain as on 24 hours ending 0830 IST of 31st October
and Chennai (Mylapore-DGP office) recorded 30 cm of rain as on 24 hours ending 0830 IST of
03rd
Nov 2017. GPM satellite-Gauge merged rainfall depicting rainfall amount ≥ 1 cm/day
during the onset period (27 & 28 October 2017) and the subsequent wet spell during 31 October
to 05 November is presented in Fig.1e. INSAT-3D and Doppler Weather Radar (DWR) Chennai

7
reflectivity associated the extremely heavy rainfall events on 31st October and 03 November are
presented in fig.1f.
Fig.1d INSAT-3D infra-red imageries during 26-28 October 2017

8
Fig.1e GPM satellite+Gauge merged 24-hr rainfall (in cm) as on 27-28, 31 Oct, 01-05 Nov
2017, 0830 IST.

9
Fig.1e contd…

10
Fig.1f INSAT-3D IR imageries as on 30 Oct / 1300 UTC and 02 Nov 1500 UTC and DWR
Chennai PPI and Max-Z products based on 1500 UTC of 02-11-2017
The extremely heavy rainfall event over Sirkazhi (31 cm as on 24-hr ending 0830 IST of 31st
October) and that over Chennai (30 cm as on 24-hr ending 0830 IST of 03rd
November) were
associated with upper air cyclonic circulation over the southwest BOB and adjoining Sri Lanka
coast which developed into a low pressure area on 02nd
November over the same region. Active-
vigorous NEM conditions and FWS rainfall occurred over TN on both the days.
The extremely heavy rainfall event over Chennai on 02nd
November was associated with meso-
scale activity embedded within the synoptic scale LOPAR during its development stage.
Whereas the rainfall recorded at Chennai-Marina (DGP’s office complex) was 30 cm/day, the

11
rainfall recorded at Chennai-Nungambakkam was 18 cm/day. The chief rainfall period of this
extremely heavy rainfall event was just about 6-7 hours between 1900 IST of 02nd
to 0200 IST of
3rd
November 2017 (Fig.1g).
Fig.1g Rainfall recorded by the self-recording rain gauge at Chennai-Nungambakkam
during the period 0815 IST of 02nd
to 0815 IST of 03rd
Nov 2017
3. Synoptic scale weather systems during Oct-Dec 2017
During Oct-Dec 2017, five synoptic scale systems formed over the BOB (2-Depressions
(D), 2-Deep Depressions (DD), 1-Very Severe Cyclonic Storm (VSCS) ‘Ockhi’). Of these, 1-D
and 1-DD formed in the westerly flow regime prior to the onset of NEM. Tracks of these systems
are presented in Fig.2. Brief life history of these systems is as follows:
(i) Deep depression over land (09-10 Oct): A LOPAR formed over North BOB and
adjoining south Bangladesh on 8th
Octmorning. It lay as a well marked low pressure area (WML)
over north BOB and adjoining coastal areas of Bangladesh & West Bengal in the same evening.
It concentrated into a D in the early morning of 9th
Oct over the Gangetic West Bengal (GWB)
and adjoining north BOB. Moving northwestwards, it intensified into a DD over GWB in the
morning of 9th
. It moved nearly north-northwestwards and weakened into a D around noon of
10th
and into a well marked low pressure area over northeast Jharkhand and adjoining West
Bengal in the evening of the same day. It became less marked on 11th
Oct.
(ii) Depression over BOB (19-22 Oct): A LOPAR formed over central BOB in the morning
of 15th Oct. It lay as a WML over central and adjoining south BOB in the morning of 17th. It
concentrated into D in the early hours of 19th over westcentral BOB. Moving nearly
northwards, it crossed Odisha coast close to Paradip in the late evening of 19th. Subsequently, it
recurved and moved northeastwards across Gangetic West Bengal and Bangladesh. It weakened

12
into a WML over northeast Bangladesh and adjoining Meghalaya & South Assam in the early
morning of 22nd
Oct.
Fig.2 Observed tracks of (i) Deep depression over land (09-10 Oct) , (ii) Depression over BOB
(19-22 Oct), (iii) Depression over BOB (15-17 Nov), (iv) VSCS Ockhi (29 Nov-06Dec), (v) Deep
depression over BOB (06-09 Dec) (Source: IMD-Preliminary reports on these systems,
www.rsmcnewdelhi.imd.gov.in)

13
(iii) Depression over BOB (15-17 Nov): A LOPAR formed over southwest BOB and
neighbourhood in the morning of 10th
Nov. It lay as a WML over the southwest BOB and
neighborhood in the morning of 13th
. It further concentrated into a D over westcentral BOB off
Andhra Pradesh on 15th
. Moving nearly north-northeastwards, it weakened into a WML over
northwest BOB off Odisha Coast on 17th
Nov.
(iv) VSCS Ockhi (29 Nov - 06Dec): A LOPAR formed over southwest BOB and adjoining
areas of south Sri Lanka & equatorial Indian Ocean in the forenoon of 28th
Nov. It became a
WML in the early morning of 29th
over the same region. Under favourable environmental
conditions, it concentrated into a D over southwest BOB off southeast Sri Lanka coast in the
forenoon of 29th
Nov. Moving westwards across Srilanka, it emerged into Comorin area in the
evening of 29th
and intensified into a DD in the early hours of 30th
Nov. It further moved
northwestwards and intensified into a Cyclonic Storm (CS) ‘Ockhi’ in the forenoon of 30th
Nov
over the Comorin area. At about 0830 IST of 30th
Nov, it was centred at about 60 km south of
Kanyakumari. It caused extensive damages over Kanyakumari and adjoining areas of south
coastal Tamilnadu as well as Thiruvananthapuram and adjoining areas of south Kerala. Very to
extremely heavy rainfall occurred over Tamilnadu and Kerala on 30th
Nov and 01st Dec. Moving
westwards, Ockhi further intensified into a Severe Cyclonic Storm (SCS) over Lakshadweep
area in the early morning of 01stDec and into VSCS over southeast Arabian Sea to the west of
Lakshadweep (LAK) in the afternoon of 01st
Dec. Moving northwestwards, it attained its peak
intensity of 150-160 kmph gusting to 180 kmph in the afternoon of 2nd
Dec with lowest central
pressure of 976 hPa. It moved north-northwestwards for some time and then recurved north-
northeastwards and maintained its intensity till early morning of 03rd
Dec. It then continued to
move north-northeastwards and weakened gradually. It crossed south Gujarat coast between
Surat and Dahanu as a WML around early morning of 6th
Dec. INSAT-3D infra-red imagery and
U.S Naval Research Laboratory, microwave imagery (Windsat 37 GHz), ISRO,
Thiruvananthapuram, Doppler Weather Radar (DWR) reflectivity product in association with the
cyclone Ockhi when it was closest to the extreme south Tamil Nadu and Kerala coasts on the
morning of 30th
Nov 2017 are presented in Fig.3a.
Adverse weather associated with the system:
Heavy rainfall occurred over Tamil Nadu, Kerala and Lakshadweep in association with the
passage of cyclone Ockhi. Several areas of south coastal Tamil Nadu experienced inland
flooding and inundation due to heavy (≥ 7 cm/day) to very heavy (≥ 12 cm/day) rainfall on 30th
Nov and 01st Dec 2017. Extremely heavy rainfall (≥ 21 cm/day) has been recorded at Papanasam
(45 cm) and Manimutharu (38 cm) in Tirunelveli district of south Tamil Nadu and at Aryankavu
(26 cm) in Kollam district of Kerala as on 24-hr ending 0830 IST of 01st Dec 2017; at Sathanur
dam (23 cm) in Thiruvannamalai district of north interior Tamil Nadu on 2nd
Dec 2017. The
subdivisional rainfall figures of TN improved from -17% as on 29th
November to +5% as on 02
December 2017.

14
Gale wind of the order of 65-75 kmph gusting to 85 kmph over KYK and TRV during 30th
Nov-
01stDec 2017 and gale winds of the order of 100-160 kmph gusting to 180 kmph over LAK
islands during 01st-02
ndDec caused extensive damages to electrical poles, transformers,
agricultural plantation, mechanized and country boats of fishermen, houses and roads aside from
uprooting of thousands of trees. Heavy rainfall occurrences over Tamil Nadu, Kerala and
Lakshadweep associated with the passage of the cyclone are presented in Table-2 and a few
photographs and media reports depicting the damages due to the cyclone are presented in Fig.3b.
Fig.3a INSAT-3D infra-red imagery and U.S Naval Research Laboratory, microwave
imagery (Source: www.nrlmry.navy.mil/), ISRO, Thiruvananthapuram, Doppler Weather
Radar (DWR) reflectivity product as on the morning of 30th
November 2017.
30 NOV 2017
06:01 UTC
30 NOV 2017
02:55 UTC
02:55 UTC 06:01 UTC
30 NOV / 08:25 IST
30 NOV / 06:17 IST

15
Table-2: Heavy rainfall occurrences (≥ 7cm/day) over Tamil Nadu, Puducherry, Kerala
and Lakshadweep during 30 Nov-03 Dec 2017
Date Rainfall amount (in cm) as on 24-hr ending 0830 IST of date
30.11.2017 TAMIL NADU& PUDUCHERRY: Vallam (Thanjavur), Thuckalay (Kanyakumari),
Pondicherry (Puducherry UT) - 7each
KERALA: Aryankavu (Kollam) - 15
01.12.2017 TAMIL NADU: Papanasam (Tirunelveli)- 45,
Manimutharu (Tirunelveli)- 38,
Mylaudy (Kanyakumari)- 19,
Thenkasi (Tirunelveli)- 17,
Thuckalay (Kanyakumari), Pechiparai (Kanyakumari), Gudalur (Theni), Bhoothapandy
(Kanyakumari)- 16 each,
Watrap (Virudhunagar)- 15,
Maniyachi (Toothukudi), Eraniel (Kanyakumari), Colachel (Kanyakumari)- 14 each,
Nagercoil (Kanyakumari), Kodaikanal (Dindigul), CoonoorPTO (Nilgiris)-13 each,
Kuzhithurai (Kanyakumari), Srivilliputhur (Virudhunagar), Satankulam (Toothukudi),
Shencottah (Tirunelveli), Ayikudi (Tirunelveli), Coonoor (Nilgiris), Srivaikuntam
(Toothukudi), Samayapuram (Trichy)-12 each,
Ottapadiram (Toothukudi), Tiruchendur (Toothukudi), Kovilpatti AWS (Toothukudi)-11 each,
Tuticorin (Toothukudi), Uttamapalayam (Theni), Ambasamudram (Tirunelveli), Kanyakumari
(Kanyakumari)-10 each,
Radhapuram (Tirunelveli), Polur (Tiruvannamalai), Kovilpatti (Toothukudi), Madavaram AWS
(Tiruvallur), Sankarankoil (Tirunelveli), Sattur (Virudhunagar)-9 each,
Arani (Tiruvannamalai), Sivaganga (Sivaganga), Sivagiri (Tirunelveli), Uthiramerur
(Kancheepuram), Rajapalayam (Virudhunagar), Anna University (Chennai), Uthagamandalam
(Nilgiris), Grand anaicut (Thanjavur), Chembarabakkam (Tiruvallur), DGP office (Chennai)-8
each,
Musiri (Trichy), Vadipatti (Madurai), K.paramathi (Karur), Karur (Karur), Anna
UniversityARG (Chennai), Vilathikulam (Toothukudi), Lalgudi (Trichy), Ambur (Vellore),
Mayanur (Karur), Panchapatti (Karur), Padalur (Perambalur), K bridge (Nilgiris),
Thamaraipakkam (Tiruvallur), Cholavaram (Tiruvallur), Periyakulam (Theni), Nanguneri
(Tirunelveli), Kalugumalai (Toothukudi), Chennai(N) (Chennai)-7 each
KERALA: Aryankavu (Kollam)-26,
Myladumpara_ AGRI (Idukki)-12,
Punalur (Kollam)-9,
Thiruvananthapuram AP &Neyyattinkara (Thiruvananthapuram)-8 each.
LAKSHADWEEP: Minicoy-19
02.12.2017 TAMIL NADU& PUDUCHERRY: Sathanur Dam (Tiruvannamalai)-23,
Sirkali (Nagapattinam)-19,
Chidambaram (Cuddalore), Anaikaranchatram (Nagapattinam)-18 each,
Chidambaram AWS (Cuddalore)-17,
Virudachalam (Cuddalore), Chengam (Tiruvannamalai)-15 each,
Gingee (Villupuram), Mylam AWS (Villupuram), K.m.koil (Cuddalore)-14 each,
Tirukoilur (Villupuram), Vilupuram (Villupuram), CoonoorPTO (Nilgiris), Karaikal
(Puducherry UT)-13 each,
Cuddalore (CuddaloreDist), Sethiathope (CuddaloreDist), Tiruvannamalai
(TiruvannamalaiDist)-12 each,
Pondicherry (PuducherryUT)-11,
Mayanur (Karur), Paramathivelur (Namakkal), Polur (Tiruvannamalai)-10 each,
Parangipettai (Cuddalore), Kallakurichi (Villupuram), Kodavasal (Tiruvarur), Nagapattinam

16
(Nagapattinam), Vanur (Villupuram), Mayiladuthurai (Nagapattinam), Sankarapuram
(Villupuram), Jayamkondam (Ariyalur), Eraniel (Kanyakumari), Neyveli AWS (Cuddalore),
Rayakottah (Krishnagiri), Kuzhithurai (Kanyakumari), Ariyalur (Ariyalur), Tindivanam
(Villupuram)-9 each,
Tozhudur (Cuddalore), Srimushnam (Cuddalore), Tiruvaiyaru (Thanjavur), Tiruvarur
(Tiruvarur), Valangaiman (Tiruvarur), Papanasam (Thanjavur), Ulundurpet (Villupuram),
Kothagiri (Nilgiris)-8 each,
Harur (Dharmapuri), Panruti (Cuddalore), Needamangalam (Tiruvarur), Thuckalay
(Kanyakumari), Uthangarai (Krishnagiri), Nagercoil (Kanyakumari), Arani (Tiruvannamalai),
Attur (Salem)- 7 each
KERALA: Thiruvananthapuram AP-8,
Angadippuram(Malappuram) &Perinthalmanna (Malappuram)-7 each.
LAKSHADWEEP: Minicoy-14
03.12.2017 TAMIL NADU& PUDUCHERRY:.Tiruvarur (Tiruvarur)-14,
Pandavaiyar head (Tiruvarur), Kodavasal (Tiruvarur)-13 each,
Valangaiman (Tiruvarur), Nannilam (Tiruvarur)-12 each,
Nagapattinam (Nagapattinam)-11,
Needamangalam (Tiruvarur), Kumbakonam (Thanjavur, Karaikal (Puducherry UT)-9 each,
Thiruthuraipoondi (Tiruvarur), Aduthurai AWS (Thanjavur), Tiruvadanai (Ramanathapuram)-8
each,
Thiruvidaimaruthur (Thanjavur)-7.
KERALA: ---
LAKSHADWEEP: ---
Note: Names of districts to which the stations belong is given in brackets.

17
A woman wades through a flooded street in Kanyakumari district’s Suchindram. (Photo: PTI)- Source: The Asian Age dated 02nd Dec 2017
A washed-away road in Suchindram at flood-hit Kanyakumari. (PTI Photo) – Source: rediff.com, news
dated 1st Dec 2017
Fig.3b(i) Flooding due to heavy rainfall associated with cyclone Ockhi

18
Source: IndiaToday.in, New Delhi, 30th Nov 2017
Fig.3b(ii) Damages due to gale winds associated with the passage of cyclone Ockhi over
Kanya kumari / Thiruvananthapuram

19
Source: The Hindu dated 17th Dec 2017
Source: The Hindu dated 17 Dec 2017
Fig.3b(iii) Media reports on the damages due cyclone Ockhi

20
(v) Deep depression over BOB (06-09 Dec): A LOPAR formed over Malay Peninsula and
adjoining Andaman Sea in the morning of 30th
Nov, 2017. It lay as a WML over south Andaman
Sea on 1stDec, over Sumatra coast and adjoining south Andaman Sea on 2
ndDec, over southeast
BOB & adjoining south Andaman Sea and equatorial Indian Ocean on 3rd
and 4th
and over
southeast BOB & neighbourhood on 5th
. It concentrated into a D over southeast BOB &
neighbourhood in the morning of 6th
Dec. It moved northwards till early hours of 8th
Dec.
Thereafter, it moved north-northwestwards and intensified into a DD in the early morning of 8th
over central BOB. Moving nearly northwards, it weakened into D during the night of same day
over westcentral BOB. It started moving north-northeastwards from morning of 9th
and weakened
into a WML over northwest BOB in the evening of 9th
Dec and into a LOPAR over north BOB &
neighbourhood in the evening of 10th
Dec.
4. Seasonal rainfall performance during NEM 2017
The northeast monsoon performance during 2017 was normal (-19% to +19%) over 4
subdivisions benefitted by the NEM (TN, KER, RYS and SIK) and deficient (-20% to -59%)
over the other subdivision, CAP (-48%). Fig.4 and Table-3 presents the season ending (01st Oct-
31st Dec) rainfall figures over these subdivisions. Even though four subdivisions recorded
normal seasonal rainfall, three (TN: -9%, KER: -8% & SIK: -5%) were on the negative side of
the normal range. RYS was the lone subdivision that recorded positive rainfall departure of
+19% during the season.
.
Fig.4 Seasonal rainfall performance of NEM 2017 over the five meteorological subdivisions
benefitted by the NEM

21
Table-3: Sub divisional seasonal rainfall during October-December 2017
Subdivision 01st October – 31st December 2017
Actual (mm) Normal (mm) PDN (%)
TN 401.0 442.0 -9
KER 441.8 480.7 -8
CAP 171.6 327.4 -48
RYS 261.8 219.2 19
SIK 199.9 209.6 -5
PDN: Percentage Departure from Normal
TN: Tamil Nadu &Puducherry; KER: Kerala;
CAP: Coastal Andhra Pradesh; RYS: Rayalaseema; SIK: South Interior Karnataka
Legend:
Month-wise rainfall statistics are presented in Table-4. Tables-5a&b depict the week by week
performance (weekly & cumulative), Table-6a&b present the daily rainfall scenario in terms of
spatial rainfall distribution (Widespread:WD, Fairly widespread: FWD, Scattered:SCT, Isolated:
ISOL and DRY), frequency of active and vigorous monsoon days and frequency of heavy
rainfall days (Heavy rainfall ≥ 7cm/day; Very Heavy rainfall ≥ 12cm/day; Extremely Heavy
rainfall ≥ 21 cm/day).
Table-4: Subdivisional monthly rainfall during NEM 2017
Subdivision
OCT NOV DEC
Actual
(mm)
Normal
(mm)
PDN
(%)
Actual
(mm)
Normal
(mm)
PDN
(%)
Actual
(mm)
Normal
(mm)
PDN
(%)
TN 157.4 181.1 -13 144.8 171.7 -16 98.8 89.2 11
KER 228.0 292.4 -22 152.3 150.9 1 61.4 37.4 64
CAP 123.8 193.2 -36 46.6 106.6 -56 1.2 27.6 -96
RYS 221.1 129.4 71 33.3 66.1 -50 7.4 23.7 -69
SIK 178.6 147.7 21 13.9 49.2 -72 7.8 12.7 -39
.(TN, KER, CAP, RYS, SIK and Legend: same as Table-3)

22
Table-5a: Week by week rainfall departures (%) during NEM 2017
Subdivision 04/1
0/2
017
11/1
0/2
017
18/1
0/2
017
25/1
0/2
017
01/1
1/2
017
08/1
1/2
017
15/1
1/2
017
22/1
1/2
017
29/1
1/2
017
06/1
2/2
017
13/1
2/2
017
20/1
2/2
017
27/1
2/2
017
TN -6 64 -31 -77 18 27 -63 -66 -14 231 -81 -81 -84
KER -34 -30 33 -71 -11 15 -15 2 -5 265 -44 34 -99
CAP -18 15 -40 -75 -70 -39 -70 -49 -98 -79 -99 -99 -100
RYS 142 179 144 -96 -51 12 -89 -88 -99 -6 -99 -100 -99
SIK 85 84 111 -95 -86 -29 -99 -72 -99 84 -94 -85 -100
Table-5b: Weekly cumulative rainfall departures (%) during NEM 2017
Subdivision
04/1
0/2
017
11/1
0/2
017
18/1
0/2
017
25/1
0/2
017
01/1
1/2
017
08/1
1/2
017
15/1
1/2
017
22/1
1/2
017
29/1
1/2
017
06/1
2/2
017
13/1
2/2
017
20/1
2/2
017
27/1
2/2
017
TN -6 39 10 -19 -11 -2 -11 -17 -17 3 -3 -6 -8
KER -34 -31 -6 -24 -22 -16 -16 -15 -15 -7 -8 -8 -8
CAP -18 5 -11 -28 -36 -36 -39 -40 -43 -44 -46 -47 -47
RYS 142 165 159 96 59 61 46 37 30 28 23 21 20
SIK 85 73 83 42 19 14 14 2 2 0 -2 -3 -4
TN, KER, CAP, RYS, SIK: same as Table-3
Legend:

23
Table-6a: Spatial rainfall distribution
Subdivision No. of days
WD FWD SCT ISOL DRY
TN 4 12 24 44 8
KER 11 17 12 33 19
CAP 0 5 12 43 32
RYS 3 8 9 30 42
SIK 6 11 7 26 42
WD: Widespread (76-100% of stations reporting rainfall)
FWD : Fairly widespread (51-75% of stations reporting rainfall)
SCT: Scattered (26-50% of stations reporting rainfall)
ISOL: Isolated (≤25% of stations reporting rainfall)
DRY: No rain
Table-6b: Frequencies of active and vigorous monsoon days and
heavy rainfall days
Subdivision
No. of days
Activity Heavy Rainfall
Vigorous Active
Extremely
Heavy
Very
Heavy Heavy
TN 3 8 4 14 46
KER 3 11 1 9 22
CAP 0 2 0 5 19
RYS 4 7 0 6 16
SIK 1 8 0 4 12
Active: Fairly widespread to widespread subdivisional rainfall with rainfall more than 1½ to 4 times the normal with
at least two stations reporting more than or equal to 5 cm in coastal Tamil Nadu, south coastal Andhra Pradesh and 3
cm elsewhere in the NEM region.
Vigorous: Fairly widespread to widespread subdivisional rainfall with rainfall more 4 times the normal with at least
two stations reporting more than or equal to 5 cm in coastal Tamil Nadu, south coastal Andhra Pradesh and 3 cm
elsewhere in the NEM region.
Heavy: rainfall ≥ 7cm/day; Very Heavy: rainfall ≥ 12cm/day; Extremely Heavy: rainfall ≥ 21 cm/day
The monthly and weekly rainfall figures indicate that rainfall during the extended
southwest monsoon regime prior to the onset of NEM on 27th
October has been significant over
RYS, SIK and CAP. Major portion of the total seasonal rainfall realized over these three
subdivisions was during the first 2-3 weeks of October. SIK and RYS recorded excess to large

24
excess rainfall in the month of October with SIK receiving 18 cm of rainfall in October out of its
seasonal total of 20 cm. Even TN, which normally does not benefit much from the southwest
monsoon, came under normal category at the end of October despite the late onset of NEM.
However, CAP and KER ended up deficient in October. In November and December, TN and
KER received normal – large excess rainfall, but the other three subdivisions came under
deficient- largely deficient category.
Subsequent to the onset of NEM on 27th
October, rainfall during the first two weeks,
(week ending 01.11.2017 & 08.11.2017) and the week ending 06.12.2017 were the major
contributions to the seasonal total. Whereas the rainfall during the last week of October and the
first week of November was associated with upper air cyclonic circulations off TN and KER
coasts and formation of low pressure areas close the TN coast, rainfall during week ending 06th
Dec (30th
Nov- 06th
Dec) was associated with the passage of cyclone Ockhi over the Comorin
area and Arabian sea during the period 29th
Nov – 03rd
Dec.
In the daily scale, there have been 40 days (each) of SCT-WD rainfall activity over TN
and KER with 11 days and 14 days respectively of active to vigorous monsoon conditions. RYS
and SIK experienced 20-24 days of SCT-WD rainfall activity of which 16-18 days were in
October. There were only 17 days of SCT-FWD rainfall activity over CAP and during the rest of
the 75 days, only isolated rain – dry conditions prevailed over the subdivision. Regarding
frequency of heavy rainfall days, TN reported maximum of 46 days of heavy rainfall activity
with 14 days of very heavy rain and 4 days of extremely heavy rain and Kerala reported 22, 9 and
1 days of heavy, very heavy and extremely heavy rainfall.
5. Performance of NEM 2017 over Tamil Nadu and Puducherry
Spatial and temporal rainfall distributions over the TN subdivision during Oct-Dec 2017
are depicted by means of district-wise rainfall distribution and area averaged daily rainfall
distribution over TN. Fig.5 presents the daily rainfall distribution over the TN subdivision
(including the state of Tamil Nadu and UT of Puducherry) during Oct-Dec 2017. The daily
subdivisional rainfall was above normal on 8 days before the NEM onset and on 15 days after
the onset.

25
a
Fig.5 Area averaged daily rainfall over TN subdivision during Oct-Dec 2017
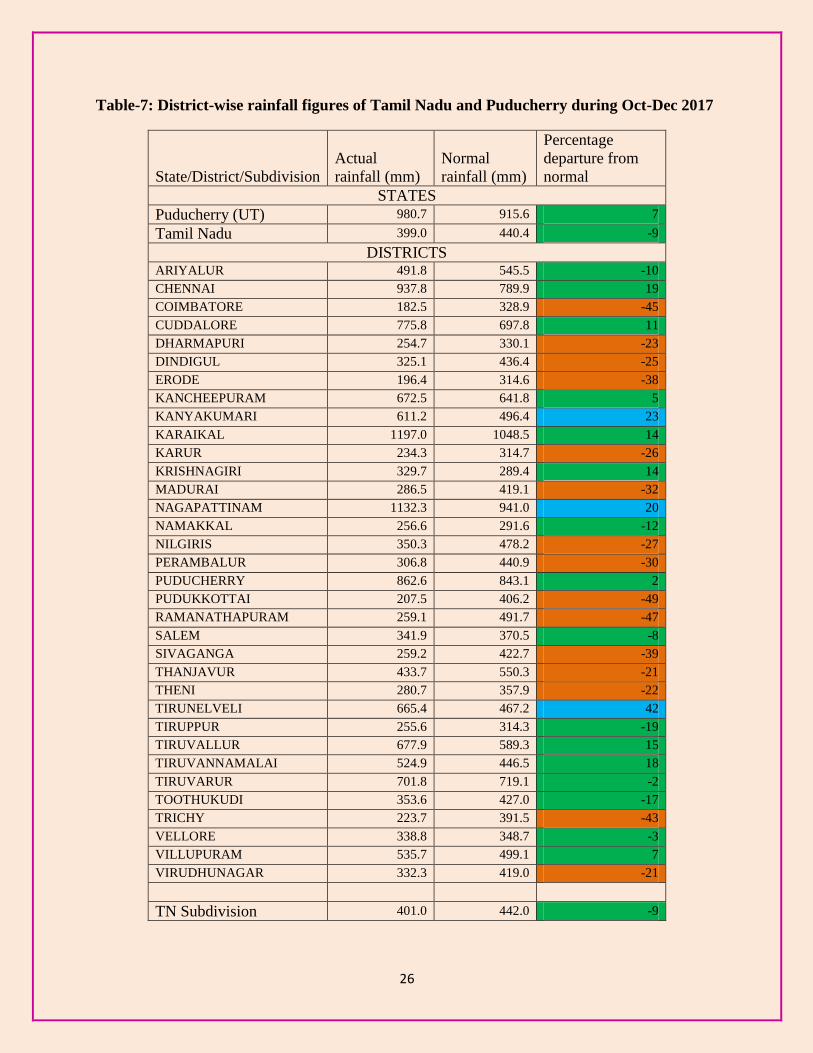
District-wise rainfall realised is presented in Table-7 and Fig.6. As seen, 3 districts –
Kanyakumari, Tirunelveli and Nagapattinam received excess rainfall during the season. 16
districts came under normal category and 15 districts ended up deficient at the end of the season.
Tirunelveli was the most benefitted district with 42% excess rainfall and Pudukottai was the
worst affected district with 49% deficient rainfall.
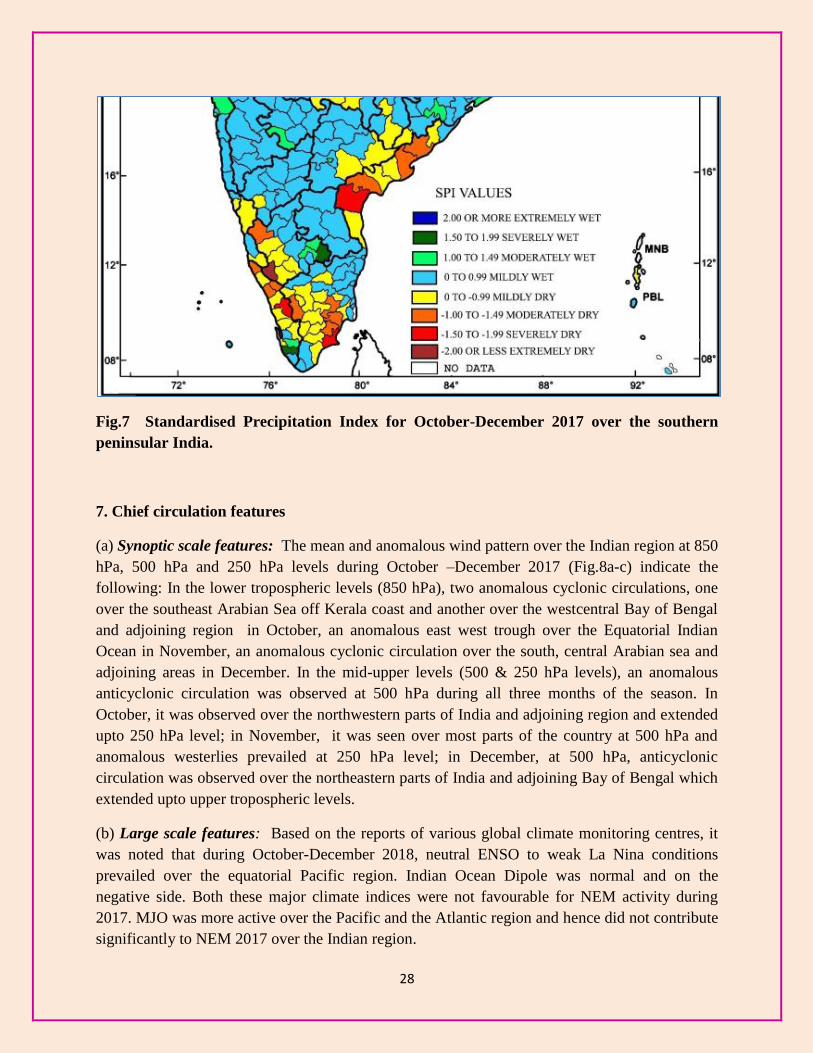
6. Standardised Precipitation Index
The Standardized Precipitation Index (SPI) is an index used for monitoring drought and is based
on precipitation. This index is negative for dry and positive for wet conditions. As the dry or wet
conditions become more severe, the index becomes more negative or positive. For October-
December 2017, SPI indicated dry conditions over most parts of northwest TN and south TN and
mildly wet conditions over the northeastern districts of TN and the extreme south coastal districts
of Kanyakumari and Tirunelveli (Fig.7). Regarding the other subdivisions of the region, most
parts of CAP, north Kerala and western districts of SIK came under dry categories and the rest of
the subdivisions ended up mildly wet at the end of the season.
26
Table-7: District-wise rainfall figures of Tamil Nadu and Puducherry during Oct-Dec 2017
State/District/Subdivision
Actual
rainfall (mm)
Normal
rainfall (mm)
Percentage
departure from
normal
STATES
Puducherry (UT) 980.7 915.6 7
Tamil Nadu 399.0 440.4 -9
DISTRICTS ARIYALUR 491.8 545.5 -10
CHENNAI 937.8 789.9 19
COIMBATORE 182.5 328.9 -45
CUDDALORE 775.8 697.8 11
DHARMAPURI 254.7 330.1 -23
DINDIGUL 325.1 436.4 -25
ERODE 196.4 314.6 -38
KANCHEEPURAM 672.5 641.8 5
KANYAKUMARI 611.2 496.4 23
KARAIKAL 1197.0 1048.5 14
KARUR 234.3 314.7 -26
KRISHNAGIRI 329.7 289.4 14
MADURAI 286.5 419.1 -32
NAGAPATTINAM 1132.3 941.0 20
NAMAKKAL 256.6 291.6 -12
NILGIRIS 350.3 478.2 -27
PERAMBALUR 306.8 440.9 -30
PUDUCHERRY 862.6 843.1 2
PUDUKKOTTAI 207.5 406.2 -49
RAMANATHAPURAM 259.1 491.7 -47
SALEM 341.9 370.5 -8
SIVAGANGA 259.2 422.7 -39
THANJAVUR 433.7 550.3 -21
THENI 280.7 357.9 -22
TIRUNELVELI 665.4 467.2 42
TIRUPPUR 255.6 314.3 -19
TIRUVALLUR 677.9 589.3 15
TIRUVANNAMALAI 524.9 446.5 18
TIRUVARUR 701.8 719.1 -2
TOOTHUKUDI 353.6 427.0 -17
TRICHY 223.7 391.5 -43
VELLORE 338.8 348.7 -3
VILLUPURAM 535.7 499.1 7
VIRUDHUNAGAR 332.3 419.0 -21
TN Subdivision 401.0 442.0 -9

27
Fig.6 District-wise rainfall distribution over the TN subdivision during Oct-Dec 2017
28
Fig.7 Standardised Precipitation Index for October-December 2017 over the southern
peninsular India.
7. Chief circulation features
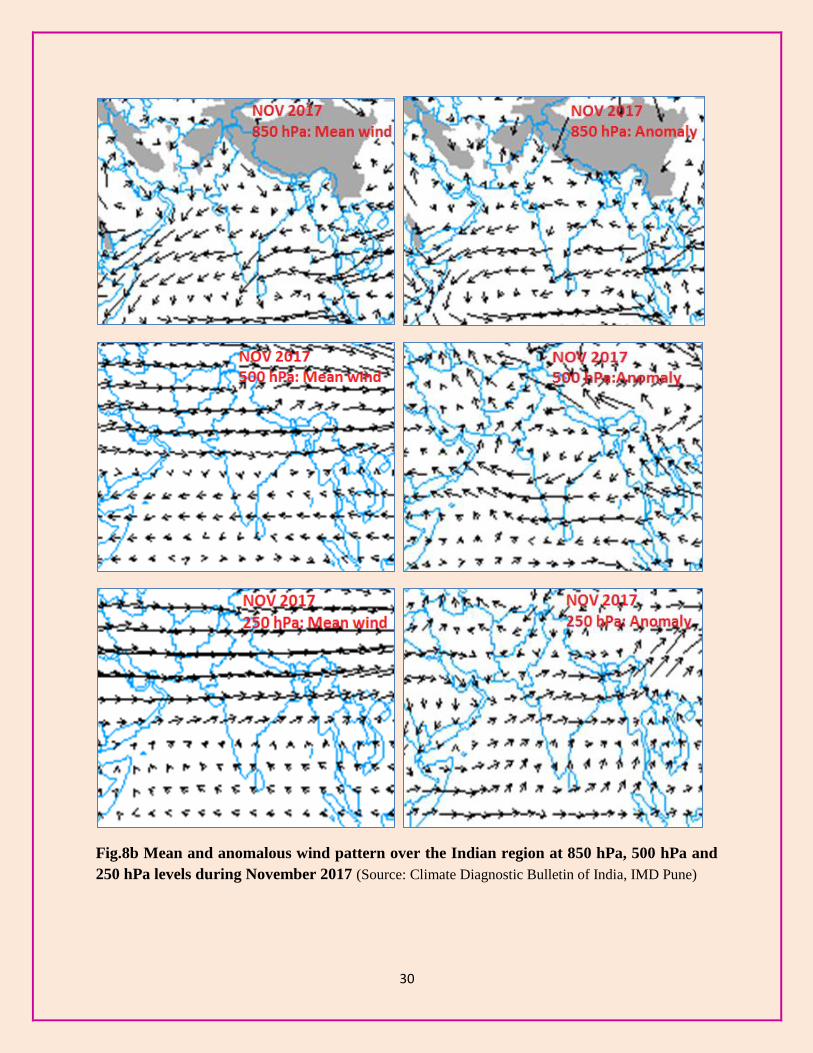
(a) Synoptic scale features: The mean and anomalous wind pattern over the Indian region at 850
hPa, 500 hPa and 250 hPa levels during October –December 2017 (Fig.8a-c) indicate the
following: In the lower tropospheric levels (850 hPa), two anomalous cyclonic circulations, one
over the southeast Arabian Sea off Kerala coast and another over the westcentral Bay of Bengal
and adjoining region in October, an anomalous east west trough over the Equatorial Indian
Ocean in November, an anomalous cyclonic circulation over the south, central Arabian sea and
adjoining areas in December. In the mid-upper levels (500 & 250 hPa levels), an anomalous
anticyclonic circulation was observed at 500 hPa during all three months of the season. In
October, it was observed over the northwestern parts of India and adjoining region and extended
upto 250 hPa level; in November, it was seen over most parts of the country at 500 hPa and
anomalous westerlies prevailed at 250 hPa level; in December, at 500 hPa, anticyclonic
circulation was observed over the northeastern parts of India and adjoining Bay of Bengal which
extended upto upper tropospheric levels.
(b) Large scale features: Based on the reports of various global climate monitoring centres, it
was noted that during October-December 2018, neutral ENSO to weak La Nina conditions
prevailed over the equatorial Pacific region. Indian Ocean Dipole was normal and on the
negative side. Both these major climate indices were not favourable for NEM activity during
2017. MJO was more active over the Pacific and the Atlantic region and hence did not contribute
significantly to NEM 2017 over the Indian region.

29
Fig.8a Mean and anomalous wind pattern over the Indian region at 850 hPa, 500 hPa and
250 hPa levels during October 2017 (Source: Climate Diagnostic Bulletin of India, IMD Pune)
30
Fig.8b Mean and anomalous wind pattern over the Indian region at 850 hPa, 500 hPa and
250 hPa levels during November 2017 (Source: Climate Diagnostic Bulletin of India, IMD Pune)

31
Fig.8c Mean and anomalous wind pattern over the Indian region at 850 hPa, 500 hPa and
250 hPa levels during December 2017 (Source: Climate Diagnostic Bulletin of India, IMD Pune)

32
8. Summary
The onset of NEM 2017 over the southeastern parts of peninsular India took place on 27th
October. Four subdivisions (Tamilnadu, Kerala, Rayalaseema and South Interior Karnataka)
received normal rainfall during the season. Coastal Andhra Pradesh ended up deficient at the end
of the season. Whereas TN and KER received normal to excess rainfall in November and
December, the other three subdivisions benefitted mainly from the extended southwest monsoon
rainfall in October prior to the onset of NEM. Tropical cyclone Ockhi during 29 Nov to 06 Dec
caused extensive rainfall activity and severe damages over south Tamil Nadu, Kerala and
Lakshadweep.
Acknowledgements
This report is a compilation of real-time observational data and analytical products
generated by various IMD offices including IMD New Delhi, Pune, Hyderabad, Bangalore and
Thirvananthapuram as well as raingauge networks of state government departments.
Contribution from all officials involved in generation of data and analytical products used for
preparation of this report is duly acknowledged.

33
APPENDIX-(i): Terminologies for Spatial rainfall distribution
WD - Widespread (Most places): 75 % or more number of stations of a region (sub-division)
reporting at least 2.5 mm rainfall.
FWD- Fairly widespread (Many places): 51% to 74 % number of stations of a region (sub-
division) reporting at least 2.5 mm rainfall.
SCT- Scattered (at a few places): 26 % to 50% number of stations of a region (sub-division)
reporting at least 2.5 mm rainfall.
ISOL- Isolated (At isolated places): 25% or less number of stations of a region (sub-division)
reporting at least 2.5 mm rainfall.
DRY: No station of a region reported rainfall
APPENDIX-(ii): Terminologies for description of intensity of rainfall
APPENDIX-(iii): Description of NEM rainfall activity
Active: Fairly widespread to widespread subdivisional rainfall with rainfall more than 1½ to 4
times the normal with at least two stations reporting more than or equal to 5 cm in coastal Tamil
Nadu, south coastal Andhra Pradesh and 3 cm elsewhere in the NEM region.
Vigorous: Fairly widespread to widespread subdivisional rainfall with rainfall more 4 times
the normal with at least two stations reporting more than or equal to 5 cm in coastal Tamil Nadu,
south coastal Andhra Pradesh and 3 cm elsewhere in the NEM region.