Embed Size (px)
Citation preview

Lacertus Verum Overhead Allocation Report 1
Author: Paul Bugler
Date: 14 August 2015
REPORT ON METHODS FOR ALLOCATION OF OVERHEADS
1 EXECUTIVE SUMMARY
In relation to the drafting of the next Hunter Valley Access Undertaking (2016 HVAU), ARTC is considering how best to allocate shared costs such as corporate overheads so that the Hunter Valley coal traffic is charged a commensurate share of these costs that is both defensible to Access Holders and the ACCC while adequately compensating ARTC.
This paper considers a number of examples of cost allocation in both the rail and electricity distribution industries in Australia, both industries being subject to economic regulation. The focus is on considering two issues:
What cost allocation methods are most appropriate?
How best to communicate the allocation methods to Access Holders and other stakeholders in light of the demand for increased transparency?
1.1 ALLOCATION METHOD
Most of the examples reviewed in this paper adopt a similar hierarchical approach to the allocation of shared costs:
1) Attribute costs directly to a business segment where they can be directly identified with that business segment.
2) Where a causal relationship can be identified between a shared cost and business segments, use an appropriate allocation method to allocate the cost to the business segments.
3) For the remaining costs use one or more non-causal allocation methods that at least reflect to some extent the scale of resources required by the elements of the business to which the shared costs are being applied, notwithstanding that this is likely to be a very approximate measure.
ARTC’s adoption of an internal charging mechanism based on a similar approach has demonstrated that it yields a more accurate allocation of costs than the use of a broad allocator such as gross tonne kilometres (GTK) or train kilometres (Train Km) which are included in the current 2011 HVAU. The regulatory precedents canvassed in this paper support the adoption of the hierarchy set out above with a generalised allocator such as a mark-up on direct costs or the use of a combination of generalised allocators.
Of particular note, the September 2014 draft decision by the Queensland Competition Authority (QCA) on the Aurizon Network draft access undertaking rejected the use of a combination of allocators in favour of allocating shared costs (after making allocations using specific allocators where practicable) in proportion to direct costs. The QCA’s proposed method is close to that which was approved by ARTC’s executive in April 2015 for internal reporting. This is also the method adopted by a number of electricity distribution networks and approved by the Australian Energy Regulator (AER).

Lacertus Verum Overhead Allocation Report 2
It is recommended that for 2016 HVAU, ARTC adopt the allocation methods approved by ARTC’s executive for internal charging, amended to the extent necessary to accommodate the requirements of the regulatory structure.
1.2 COMMUNICATION OF POLICY
Most of the examples in this paper have some form of policy document approved by the relevant regulator to demonstrate the cost allocation policy applied. There is a continuum with regard to the level of detail provided and this affords the opportunity for ARTC to choose, to some extent, the level of disclosure provided to stakeholders. However, they mostly share the following characteristics:
They provide a context within which the allocation policy is required to operate and the purposes for which the policy will be used.
They set out the policy and in some cases define the various types of cost.
They provide a (varying) level of detail as to how costs are allocated.
The use of a costing manual will require ARTC to ensure compliance with a more detailed document than is currently the case for shared costs. However, in practice, ARTC already accounts rigorously for all shared costs, so this is not envisaged to be onerous.
Given the strong demand from stakeholders for greater transparency and the relatively modest risks to ARTC, it is recommended that ARTC include a costing manual in the 2016 HVAU along the lines of those adopted by other rail networks and the electricity distribution industry.
2 BACKGROUND
As part of the process of drafting the 2016 HVAU, ARTC is considering how best to allocate shared costs such as corporate overheads so that the Hunter Valley coal traffic is charged a share that is reflective of the level of resources applied while being acceptable to stakeholders and the regulator and fairly compensates ARTC. In determining the most appropriate method of allocation, ARTC needs to take into account three areas of concern:
1) The allocation methods need to be defensible and stand up to regulatory and Access Holder scrutiny;
2) The methods need to be routinely applicable without introducing onerous requirements on ARTC; and
3) ARTC needs to address a strong interest by Access Holders in increased transparency in the way in which costs for the Hunter Valley coal network are derived.
This paper provides several examples of cost allocation methods used in Australia for regulated utilities and the way in which these are articulated to stakeholders with a view to providing ARTC with a path towards achieving its desired outcomes with regard to the issues noted above.

Lacertus Verum Overhead Allocation Report 3
3 RAILWAYS
3.1 AURIZON COSTING MANUAL
3.1.1 BACKGROUND
The Aurizon Access Undertaking (the 2014 version is currently under review by the Queensland Competition Authority (QCA)) provides for Aurizon to publish a Costing Manual. The purpose of the manual is to:
“… provide a framework for the Identification, Attribution and Allocation of assets, costs, revenues and investments relating to Queensland based Below Rail Services provided by Aurizon Network and the development of Financial Statements required in accordance with the Undertaking.”
1
The focus of the Costing Manual is to allow for the production of financial statements for the regulated Aurizon Network business and is not directly applicable to the calculation of prices or regulatory compliance with revenue limits.
2
In the context of ARTC’s 2016 HVAU, there are important differences between the Aurizon Network business and ARTC’s circumstances that should be considered when looking to the Costing Manual approach for the allocation of overheads. These include:
a) Aurizon is a vertically integrated railway and a significant part of the costing manual is devoted to addressing the identification and separation of assets, costs and revenues into network and non-network (i.e. above rail) categories rather than between different parts of the network business.
b) The manual is not used for compliance purposes in the same sense that ARTC is considering, i.e. the purpose of developing financial statements is expressly separated from the purpose of developing pricing and determining revenue limits. While Aurizon has proposed to use the same allocation methods for pricing process as set out in the Costing Manual for its 2014 Draft Access Undertaking, the QCA has rejected this.
3
Nevertheless, the Costing Manual provides some useful components that could be adapted by ARTC into its own form of document.
3.1.2 ALLOCATION MECHANISMS
The Aurizon Costing Manual adopts a similar approach to the 2011 HVAU in that the first mechanism is to assign those costs directly associated with a functional activity to that function. Where this is related to a geographic region (e.g. a section of track), the assignment is to that location.
Next, where a function is shared and the costs are identifiable to a particular business, then the relevant proportion is attributed to that business or function. Where it is not practical to identify a cost (or asset or revenue) in this way, some form of allocation technique is used.
In particular, the Aurizon Costing Manual sets out the following allocators for dealing with Corporate Overheads:
a) % of revenue
1 Aurizon Network Pty Ltd Costing Manual Effective date: 30 June 2014 (Draft) Part 1 section 1.3(a)
2 Op cit., section 1.3(f)
3 QCA, Draft Decision Aurizon Network 2014 Draft Access Undertaking – Maximum Allowable Revenue, September
2014 pp 75

Lacertus Verum Overhead Allocation Report 4
b) % of full time equivalent employees (FTEs) which consists of both the Network FTEs and an allocation (unstated as to how determined) of corporate employees compare to the total FTEs.
c) % of written down asset value
d) An average of (a) – (c) (termed “blended” in Table 1 below)
e) Below rail related FTEs as a % of total Network FTEs (reflecting that Network provides services to other parts of Aurizon).
The use of these allocators is set out in Table 1 below.
TABLE 1: USE OF CORPORATE OVERHEAD ALLOCATORS IN AURIZON COSTING MANUAL
Corporate Non-operating function Allocator Applied
Board & CEO Blended
Finance (excluding Network Finance)
- Mergers & Acquisitions Nil
- Procurement and Accounts Payable
- Payroll
Direct costs
FTEs
- All other sub- functions Blended
Enterprise Services
- Enterprise Procurement Direct costs
- Real Estate Generally identifiable by occupancy, with FTEs used for unidentifiable costs
- Branding Network Revenue
- Network legal counsel 100% to Network
- All other sub functions Blended
Human Resources
- EVP, bonuses, External Relations & Communications
Blended
- Network function HR management Network FTEs
- All other sub-functions (excluding VERS costs) FTEs
Operations
- Safety Identifiable Below Rail costs -100%
Allocable costs – FTEs for labour and Blended for all other costs
Strategy (Enterprise strategy) Blended
Source: Aurizon Network Costing Manual, 30 June 2013
A notable absence from this list (and from the Costing Manual) is the separate identification of information technology, though there is reference to computers and software more generally as part of the functional costs. However, this does not readily assist with identifying how shared Information Technology resources would be allocated.

Lacertus Verum Overhead Allocation Report 5
The application of the “blended” rate is unclear and this is an area where additional explanation would significantly enhance transparency. However, notwithstanding this, the use of some form of averaged outcome is consistent with practice elsewhere.
Some of these allocation mechanisms may not be appropriate for the 2016 HVAU. However, the general principle remains applicable, i.e. that allocations should be undertaken using the best practically available method with the residual being allocated on some default basis.
In particular, the Costing Manual provides a useful precedent to move away from a broad brush approach such as Train Km. It also provides a useful mechanism for presenting cost allocation information at a high level without requiring too much prescription and may be an acceptable way for ARTC to proceed that meets, at least to some extent, stakeholder calls for greater transparency.
3.2 VICTRACK
VicTrack publishes a cost allocation policy as part of its access undertaking. The policy is a relatively brief section but sets out that:
1) costs that can be directly attributable to a business unit will be so attributed; and
2) costs for shared services such as corporate costs will be allocated on a pro-rata basis of total direct cost amongst the departments within VicTrack.
4
3.3 V/LINE
V/Line has a multi-level cost allocation policy but, for the purposes of this paper, it essentially provides for the direct attribution of costs where practicable. Shared costs, where there is no applicable causal factor, are allocated on the basis of direct costs.
5
3.4 GENESEE WYOMING AUSTRALIA (GWA)
KPMG provided a report to the Essential Services Commission of South Australia regarding, inter alia, GWA’s cost allocation methodology.
6 A copy of the report may be found at:
http://www.escosa.sa.gov.au/library/20150714-SARail_TarcoolaDarwinRailReview-GWAFinancialAllocations-KPMGReport.pdf
The report identifies that GWA allocates the majority of costs through direct attribution or through the use of causal allocators (details not provided). The remaining indirect costs (16% for interstate and 7% for intrastate SA business) are allocated on the basis of judgement.
3.5 BROOKFIELD RAIL
Brookfield Rail, operator of the Western Australian rail network (excluding west of Kalgoorlie and the Pilbara railways), is required to comply with the Railways (Access) Code 2000, subsidiary legislation to the Railways (Access) Act 1998 (WA). The Railways (Access) Code 2000 s.46 provides for the infrastructure operator to submit a statement of costing principles to the regulator for approval. These principles are then used in the calculation of costs for the floor and ceiling tests, i.e. unlike for the Aurizon Costing Manual, the principles are directly related to the price setting and regulatory compliance activities.
4 VicTrack Access Arrangement No: 5, June 2012, p 21
5 V/Line Access Arrangement, April 2012, Appendix 7
6 KPMG, Essential Services Commission of South Australia Review Of GWA financial allocation, July 2015
Lacertus Verum Overhead Allocation Report 6
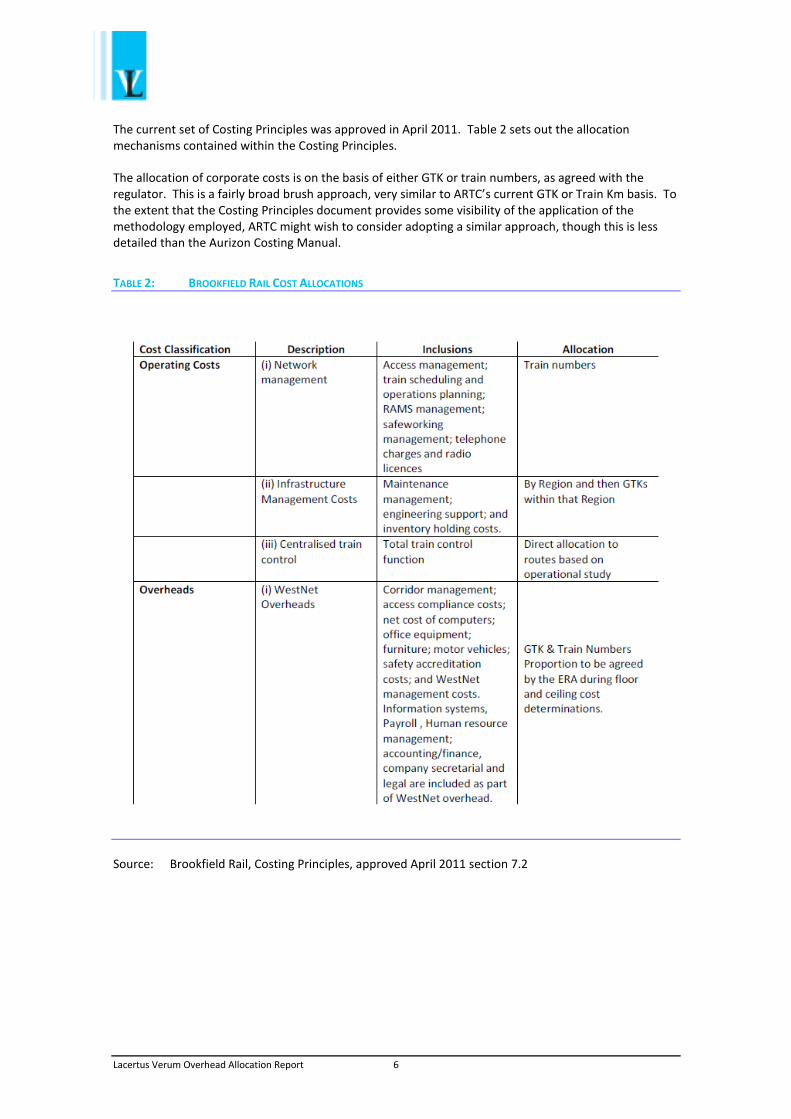
The current set of Costing Principles was approved in April 2011. Table 2 sets out the allocation mechanisms contained within the Costing Principles.
The allocation of corporate costs is on the basis of either GTK or train numbers, as agreed with the regulator. This is a fairly broad brush approach, very similar to ARTC’s current GTK or Train Km basis. To the extent that the Costing Principles document provides some visibility of the application of the methodology employed, ARTC might wish to consider adopting a similar approach, though this is less detailed than the Aurizon Costing Manual.
TABLE 2: BROOKFIELD RAIL COST ALLOCATIONS
Source: Brookfield Rail, Costing Principles, approved April 2011 section 7.2

Lacertus Verum Overhead Allocation Report 7
4 ELECTRICITY DISTRIBUTION NETWORKS
4.1 BACKGROUND
The electricity distribution networks provide a useful example of the application of a more detailed approach to the allocation of shared costs between different parts of a regulated business. The National Electricity Rules (NER) clause 6.15.4 requires each Distribution Network Service Provider to submit a Cost Allocation Method document (CAM) to the Australian Electricity Regulator (AER) for approval. Once approved, the CAM is used for a number of regulatory compliance purposes, including price setting and compliance assessment.
Among other requirements, NER 6.15.2(3) requires costs allocated to a particular category of distribution service to be either:
costs which are directly attributable to the provision of those services; or
costs not directly attributable are allocated using an appropriate allocator.
From this requirement, the CAM’s address the methodologies used to for the allocation of indirect costs. While not directly comparable to the requirements of a rail network owner, the network nature of the electricity distribution industry provides useful parallels for ARTC’s consideration. The following sections set out three examples of CAMs that have been approved by the AER. While there are differences between them, they share a common approach and have a much more detailed identification of corporate cost areas and the cost allocation method applied to each one.
4.2 SA POWER
The SA Power CAM (last updated September 2012) adopts an approach not dissimilar to the Aurizon Network methodology:
1) Costs that can be directly identified to a part of the business are attributed to that business.
2) Overhead/indirect support costs are allocated:
a) Where a causal cost driver can be identified, by that driver; or
b) Where no practical driver can be found, then a weighted average of allocated costs is used to distribute the cost.
The SA Power CAM differs from the Aurizon Costing Manual in the level of detail it provides regarding the allocation of corporate overheads, but the approach is largely the same, i.e. firstly identify any directly attributable costs, then allocate on the basis of a reasonable causal measure and lastly, use some form of averaging of direct allocations where no causal mechanism can be identified.
The types of allocation method adopted includes, as examples:
Division revenue as a % of total revenue
Division revenue as a % of regulated revenue
Identification of costs as part of a regulated or unregulated service
Creditor transaction volume for each element of the business
Divisional FTEs as a proportion of total FTEs
Materials and service contract costs are identified to different parts of the business
IT systems and FTE usage by division

Lacertus Verum Overhead Allocation Report 8
The allocations go to some level of detail. For example, the treatment of insurance costs is different for the different types of cover:
fidelity guarantee, employment practices, depots/offices and combined liability are allocated on basis of FTEs;
contract works are allocated on basis of revenue;
computer coverage is allocated on IT allocations;
marine transit is based on stock materials.
Appendix A sets out the detailed table of allocation for the various areas of shared cost, along with an explanation for the choice of allocator. The appendix also provides a worked example of how the weighted average of allocated costs is used in the absence of an appropriate causal factor.
4.3 ESSENTIAL ENERGY
Essential Energy also has a CAMS (the most recent version is dated April 2014). There is substantial similarity between the approaches adopted for the other electricity distribution networks. For indirect cost allocation where no clear causal relationship exists, Essential Energy uses three allocators:
a) Direct labour;
b) FTE numbers; and
c) Motor vehicle fleet usage.
As such, the range of allocation methods is somewhat more generalised than the range used by SA Power. The Essential Energy CAM sets out which of these indirect allocators is used for each area of indirect cost in a similar manner to the SA Power example in Appendix A. The most recent version of the Essential Energy CAMS can be downloaded at:
http://www.aer.gov.au/sites/default/files/Essential%20Energy%20-%20Cost%20allocation%20method%20-%20April%202014.pdf
4.4 JEMENA ELECTRICITY NETWORKS (JEMENA)
Jemena’s CAM is similar to those discussed above. Again the emphasis is on identifying direct costs where practicable. The allocation of shared costs is by one of three methods, in the following descending hierarchy:
1) Jemena has a system called “Work Breakdown Structure” (WBS), that is a detailed recording system for the allocation of people’s time. Costs are allocated on a percentage based on the WBS data. Initially the WBS was applied only to direct cost areas, but in recent years this has been extended to cover shared cost areas as well and has become increasingly accurate. Therefore, it is the first choice for allocating indirect costs as well as direct costs.
2) Direct allocations based on FTE surveys conducted. Where WBS data is not available or not relevant, shared costs (net of directly attributable costs already allocated) are allocated to activities based on employee surveys. Employee surveys are gradually being phased out as the accuracy and spread of the WBS improves.
3) Where WBS and survey data are not available or not relevant, shared costs are allocated based on the proportion of direct costs for each service classification to total direct costs.
Therefore, in some ways, the Jemena approach is more detailed and able to extract a greater proportion of costs using a direct allocation approach, but if this is not available e.g. for allocation of the CEO costs or insurance premiums, then a fairly simple “% mark-up” approach is taken. It is also the case that the WBS only captures people’s time and does not directly apply to the allocation of non-people related

Lacertus Verum Overhead Allocation Report 9
costs. Again, the CAMS sets out the allocation method for corporate costs in some detail, similar to the SA Power example provided.
The most recent Jemena CAMS can downloaded from http://www.aer.gov.au/sites/default/files/Jemena%20-%20Revised%20cost%20allocation%20method%202015.pdf
4.5 ENERGEX
The Energex CAM is similar to other electricity generator CAMs. The key principles are:
a) Direct costs are attributed on the basis of causation.
b) On-costs for labour, materials storage and logistics and fleet, other than those directly attributable are allocated by:
i) for indirect labour on-costs: in proportion to total wages and salaries;
ii) for materials storage and logistics: in proportion to direct materials expenditure; and
iii) for fleet expenditure: in proportion to direct labour expenditure.
c) Regulated overheads (i.e. corporate and other shared costs) are allocated on the basis of total direct spend (i.e. opex and capex).
d) Indirect (or “non-system) capex is allocated based on causal drivers representing the most appropriate utilisation of the underlying assets. Predominantly, non-system capital expenditure is allocated based on the proportion of labour incurred in delivering services within each classification.
The Energex CAM is less detailed in the allocation of corporate overheads than SA Power or Essential Energy, but the use of a simple percentage mark-up on direct costs where there is no other identifiable causal relationship is not unusual.
The application of cost allocators to corporate costs is set out in Appendix B.
4.6 ERGON ENERGY
The Ergon Energy CAM has two distinct sets of allocations:
1) Allocate opex and capex between regulated and unregulated business areas; then
2) Allocate the identified regulated opex and capex between the various regulated areas of the business.
The Stage 1 allocation is similar to the other methods described earlier. For corporate costs, a variety of causal allocators are used but in the absence of an identifiable driver, an estimate is made of time spent on providing services to the regulated and unregulated businesses. The use of cost allocators at this level is set out in Appendix C.
The Stage 2 allocation of costs identified as part of the regulated activity pool, is on the basis of:
a) For opex: direct operating costs in each area
b) For capex: capex in each area.
Lacertus Verum Overhead Allocation Report 10
5 ARTC INTERNAL CHARGING
In April 2015, ARTC’s executive management team reviewed and approved the adoption of an internal charging mechanism designed to more fairly allocate costs between the Interstate and Hunter Valley Business Units for the purposes of internal reporting. The supporting paper identified an approach in many ways similar to methods adopted in the examples cited elsewhere in this paper, i.e.:
1) Identify, as far as practicable, costs that can be directly attributed to a business unit.
2) For the remaining costs, where a clear cost driver is available, allocate costs on the basis of that driver.
3) For the remaining costs, allocate using the most applicable generalised allocation method.
The work undertaken by ARTC to identify, as much as practicable, those costs which could reliably be attributed to one of the business units resulted in approximately 63% of corporate costs being removed from the general allocation pool.
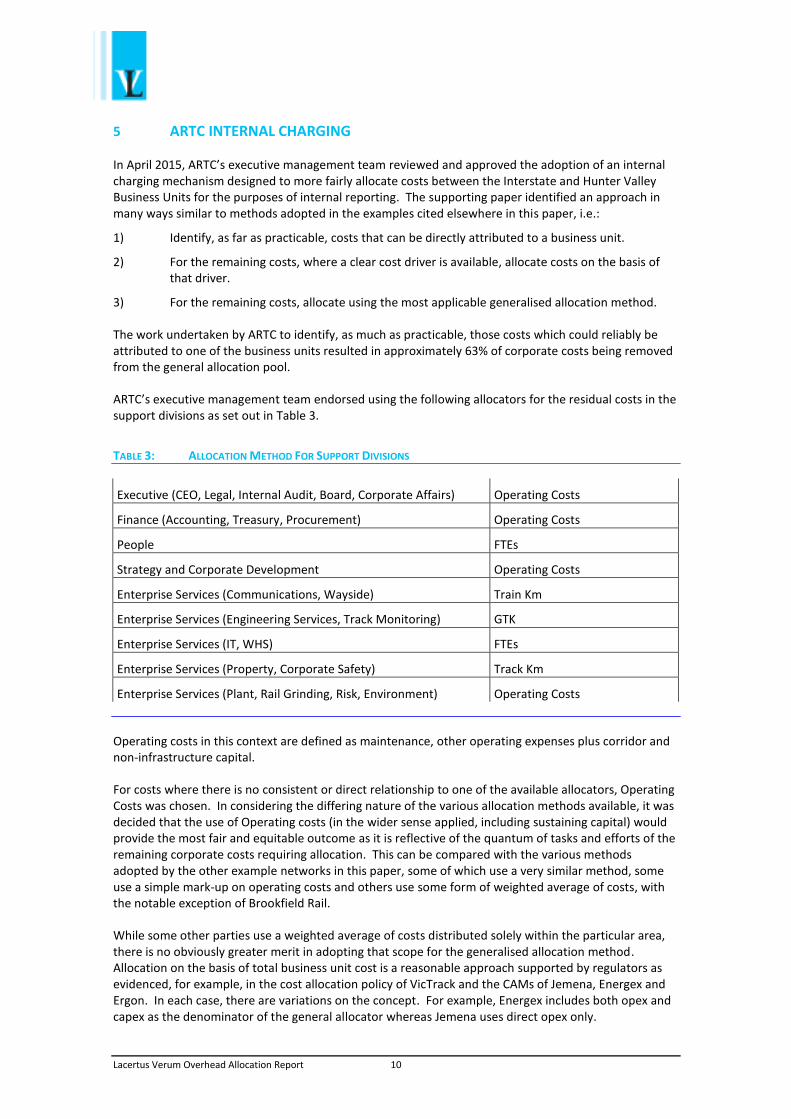
ARTC’s executive management team endorsed using the following allocators for the residual costs in the support divisions as set out in Table 3.
TABLE 3: ALLOCATION METHOD FOR SUPPORT DIVISIONS
Executive (CEO, Legal, Internal Audit, Board, Corporate Affairs) Operating Costs
Finance (Accounting, Treasury, Procurement) Operating Costs
People FTEs
Strategy and Corporate Development Operating Costs
Enterprise Services (Communications, Wayside) Train Km
Enterprise Services (Engineering Services, Track Monitoring) GTK
Enterprise Services (IT, WHS) FTEs
Enterprise Services (Property, Corporate Safety) Track Km
Enterprise Services (Plant, Rail Grinding, Risk, Environment) Operating Costs
Operating costs in this context are defined as maintenance, other operating expenses plus corridor and non-infrastructure capital.
For costs where there is no consistent or direct relationship to one of the available allocators, Operating Costs was chosen. In considering the differing nature of the various allocation methods available, it was decided that the use of Operating costs (in the wider sense applied, including sustaining capital) would provide the most fair and equitable outcome as it is reflective of the quantum of tasks and efforts of the remaining corporate costs requiring allocation. This can be compared with the various methods adopted by the other example networks in this paper, some of which use a very similar method, some use a simple mark-up on operating costs and others use some form of weighted average of costs, with the notable exception of Brookfield Rail.
While some other parties use a weighted average of costs distributed solely within the particular area, there is no obviously greater merit in adopting that scope for the generalised allocation method. Allocation on the basis of total business unit cost is a reasonable approach supported by regulators as evidenced, for example, in the cost allocation policy of VicTrack and the CAMs of Jemena, Energex and Ergon. In each case, there are variations on the concept. For example, Energex includes both opex and capex as the denominator of the general allocator whereas Jemena uses direct opex only.

Lacertus Verum Overhead Allocation Report 11
It is of note that what became known as “NFG2”, the second and final version of the National Freight Group Costing Convention published in 1990,
7 provided for divisional and corporate overheads to be
allocated on a percentage mark-up of attributable costs, where those costs included both operating and capital costs – a position consistent with the approach selected by ARTC’s executive management team for internal charging.
6 COMMENTARY & CONCLUSION
6.1 COSTING MANUAL
The concept of incorporating a document into a regulatory undertaking explaining the cost allocation policy and methodology is widely accepted by regulators in Australia, including in the rail infrastructure area, as the examples included in this paper demonstrate. The examples also show that there is a continuum with regard to the level of detail provided and this affords the opportunity for ARTC to choose, to some extent, the level of disclosure provided to stakeholders.
The use of a costing manual will lock in some aspects of ARTC’s allocation process. This is nothing new as ARTC is currently committed to allocating corporate and divisional indirect costs through the broad mechanisms described in the 2011 HVAU. To that extent, whatever method is adopted for allocating and reporting costs will impose some restrictions on ARTC in the future. The adoption of a methodology for 2016 HVAU using greater detail than currently contained in 2011 HVAU potentially has both positive and negative outcomes:
As a positive, it will allow ARTC to adopt a greater range of mechanisms for the allocation of indirect costs that is likely to deliver a more appropriate outcome for ARTC, while at the same time meeting stakeholder requirements for greater transparency.
As a negative, it will lock ARTC into mechanisms that may be difficult to change in the future (at least during the life of the undertaking) should the mechanism no longer prove appropriate. To the extent that greater detail increases the likelihood of a method becoming inappropriate, this may make it less palatable. However, there are means of amending the manual either by itself, or as part of a wider mechanism within the undertaking and this may be sufficient to overcome the problem of inflexibility.
Given the strong demand from stakeholders for greater transparency and the relatively modest risks to ARTC, it is recommended that ARTC uses a Costing Manual approach along the lines adopted by Aurizon Network and the electricity distribution industry.
6.2 USE OF A TIME/MATERIALS ALLOCATION SYSTEM
As discussed above, Jemena has put in place a detailed time/materials allocation system with the expectation that this will significantly reduce the need for a generalised allocation method. From a conceptual perspective, the adoption of such a system has much to commend it. However, at a practical level, there are significant issues that would need to be dealt with for such a system to be successful. These include:
Introducing a culture that values such a system and the accurate recording of activity;
Identification of the end internal customer sufficiently to enable the accurate attribution of time/materials;
7 NFG2 was prepared by a working party operating under the auspices of the National Freight Group, which operated
under the aegis of the former Railways Of Australia.

Lacertus Verum Overhead Allocation Report 12
Devoting sufficient resources to maintaining the correct relationships (e.g. where there are allocations of allocations) and cleaning the data.
A system of this nature is inevitably expensive and resource hungry. It is very easy for such a system to degrade in the quality of information produced unless a great deal of effort is expended at all levels of management to ensure that information is accurately recorded and reported. Because of this, it is likely that such a system will only be successful where it understood as being crucial to the operation of the business, i.e. that it is used for much broader purposes than just regulatory compliance.
It is not recommended that ARTC contemplate adopting such a system purely for the sake of the 2016 HVAU.
6.3 USE OF OPERATING COST AS A NON-CAUSAL ALLOCATION MECHANISM
As noted above, several of the examples provided use direct costs, in one form or another, as the general non-causal allocation method. ARTC’s approved internal charging methodology uses this approach.
It is noted that RSM Bird Cameron (RSMBC) in its report on Aurizon Network operating costs, including corporate cost allocations, stated that the use of direct costs as an allocator was used by the following regulated entities:
Energex
Aurora Energy
Jemena
VicTrack
Dalrymple Bay Coal Terminal8
It is of particular relevance that the QCA, in its draft decision on the Aurizon Network 2014 Draft Access Undertaking, rejected the use of a blended generalised cost allocator as proposed by Aurizon Network, even though it had approved its use in the current Costing Manual.
9 This demonstrates the rather
unusual aspect of the Aurizon Network Costing Manual in that the QCA is comfortable with it to expressly diverge from the method by which prices will be determined. However, in the draft decision, the QCA has also flagged a need for the Costing Manual to be reviewed.
In part that rejection related to the fact that the revenue base included the cost of electric traction power (a relatively large component of Aurizon Network’s costs passed directly on to above rail users) and thus distorted the outcomes. The QCA has indicated a preference for the use of operating costs (exclusive of any capital expenditure) as the generalised allocation method. This provides support for the method currently supported by ARTC’s executive management team notwithstanding that ARTC uses corridor capital costs as part of its allocator.
6.4 RETENTION OF CURRENT MECHANISMS
The examples reviewed in this paper show a continuum of methods for allocating costs from the very simple (e.g. ARTC 2011 HVAU, Brookfield) to a much more detailed approach based on the use of causal factors to allocate shared costs, leaving as little as possible to be allocated using a general, non-causal method. The examples reviewed suggest that this latter approach is the most common.
8 RSM Bird Cameron, Aurizon Network 2013 Draft Access Undertaking Financial Assessment of Operating
Expenditure, Response to Aurizon Network’s Submission, 7 March 2014, Addendum Report April 2014 p 4 9 QCA, op. cit. p 75

Lacertus Verum Overhead Allocation Report 13
It remains open to ARTC to continue to use a broad generalised allocative method but the work undertaken for the internal charge review suggests that this would not be in ARTC’s interest as the current mechanism appears to significantly underestimate the quantum of shared costs that genuinely apply to the Hunter Valley.
It also likely that the continued use of a general allocator such as in 2011 HVAU will not be well received by stakeholders who are seeking greater visibility as to how costs are derived.
It is not recommended that the current mechanism be retained.

Lacertus Verum Overhead Allocation Report A1
APPENDIX A SA POWER NETWORK CORPORATE COST ALLOCATORS
Table A 1 sets out the corporate cost allocation methods as described in SA Power Network’s Cost Allocation Method September 2012 document. Some minor amendments have been made to the table to aid readability. The original document may be downloaded from http://www.sapowernetworks.com.au/public/download.jsp?id=9982
TABLE A 1: ETSA CORPORATE COST ALLOCATION METHODS
Cost C/NC#1
Description Basis of allocation
CEO’s Office
CEO NC The office of the Chief Executive Officer No ideal causal allocator: costs allocated on the basis of the weighted average of all allocators.
Strategic Planning NC Management of annual strategic planning process No ideal causal allocator: costs allocated on the basis of the total revenue for each service class.
Communications C Corporate communications (including advertising and marketing) and stakeholder management
Services provided support the regulated business only. Any advertising or marketing for the unregulated business is borne directly by the CaMS group. Communication costs are allocated between standard control, alternative control and negotiated distribution costs based on regulated revenue.
Audit Services C Independent review of business strategies, systems and processes
Allocated between distribution and unregulated services based on audit days proposed in the annual Audit Plan. Distribution services costs are further allocated between standard control, alternative control and negotiated distribution costs based on total regulated costs.
Risk & Insurance – Shared Insurance Premiums
C Insurance premiums to cover general risks including:
Fidelity guarantee
Employment practices
Depots/Offices
Combined Liability (eg products, professional indemnity)
Contract works
Computer
Marine transit
Total risk and insurance costs (excluding support costs) are allocated between network insurance and shared insurance premiums based on the type of insurance.
Network insurance costs (eg bushfire risk liability) are directly attributed to standard control services as a cost of operating the electricity distribution network.
Shared insurance premiums are allocated dependent on type of insurance eg fidelity guarantee, employment practices, depots/offices, combined liability allocated on basis of FTEs; contract works allocated on basis of revenue; computer based on IT allocations, marine transit based on stock materials.
Risk & Insurance – Support Costs NC Risk and Insurance support costs including:
Self-insurance costs
Brokers fees
Management and administration costs
No ideal causal allocator: costs allocated on the basis of the weighted average of total policy allocations.
Company Secretary
Company Secretary NC Services to the ETSA Utilities’ Board, governance and compliance
No ideal causal allocator: costs allocated on the basis of the weighted average of all allocators.

Lacertus Verum Overhead Allocation Report A2
Finance
CFO NC Office of the Chief Financial Officer Weighted average of all allocators for the Finance group.
Corporate Finance NC Taxation, excluding consulting costs directly attributed to standard control services and activities and treasury services, reporting to key internal and external stakeholders, budget process management and accounts receivable, excluding that associated with the identification, invoicing and collection of third party damage to ETSA Utilities’ assets (which is directly attributed to standard control services as a cost of operating the electricity distribution network).
Total revenue for each service class.
Operational Finance C Management reporting, budgeting, financial control of operational groups
Costs are allocated for services provided. Network Management and Field Services costs are allocated to standard control, alternative control and negotiated distribution services based on regulated revenue splits. CaMS costs are allocated to unregulated services.
Regulatory Finance C Financial regulatory matters, including preparation of the Regulatory Accounts
Services provided support the regulated business only. Costs are allocated between standard control, alternative control and negotiated distribution costs based on total regulated revenue.
Accounts Payable C Payment of vendor invoices Allocated on basis of Accounts Payable source data for creditor transaction volumes.
Payroll C Costs associated with payment of salaries and wages to employees, including system updating
Allocated between distribution and unregulated services on basis of FTE splits. Distribution services costs are further allocated between standard control, alternative control and negotiated distribution services on basis of regulated labour hours.
Purchasing and Contracts C Procurement contract establishment and contract management
Allocated on the basis of stock material and service contract costs.
Information Technology C Provision, maintenance and support of IT systems and services, and development of new IT systems and services
Allocated between distribution and unregulated services on basis of IT systems and FTE usage data. Distribution services costs are further allocated between standard control, alternative control and negotiated distribution services on basis on regulated labour hours.
Corporate Services
General Manager Corporate Services, including Business Improvement
NC Management of the Corporate Services group, including identification of opportunities for improvement across the business
No ideal causal allocator: costs allocated on the basis of the weighted average of all allocators for the Corporate Services’ group.
Regulation (Excluding Licence Fee) C Compliance with Regulatory codes and guidelines (excluding the licence fee, which is directly attributed to standard control services)
Services provided support the regulated business only. Costs are allocated between standard control, alternative control and negotiated distribution costs based on total regulated costs.
Real Estate – Offices and Depots C Real estate management services, including rates and taxes, property acquisition and disposal, property lease and easement management.
Distribution Lessor Corporation (DLC) land tax relates to distribution assets acquired (by lease) on privatisation. These costs are directly attributed to standard control services as a cost of operating the electricity distribution network. The remainder of Real Estate costs are allocated between substations and depots based on property rates. Substation costs are directly attributed to standard control services as a cost of operating the electricity distribution network. Office and depot costs are allocated between distribution and unregulated services on

Lacertus Verum Overhead Allocation Report A3
basis of FTE splits. Distribution services costs are further allocated between standard control, alternative control and negotiated distribution services on basis of regulated labour hours.
Legal Services C Legal counsel, legal compliance Labour costs associated with an officer dedicated to the CaMS business are allocated to unregulated services. Remainder of costs are allocated to standard control, alternative control and negotiated distribution services based on total regulated costs.
People and Culture
General Manager People and Culture NC Management of the People and Culture group No ideal causal allocator: costs allocated on the basis of the weighted average of all allocators for the People and Culture group.
Human Resources C Employee relations, including personnel issues and industrial relations, and workforce learning and development (excluding training)
Costs allocated between distribution and unregulated services on basis of FTE splits. Distribution services costs are further allocated between standard control, alternative control and negotiated distribution services on basis on regulated labour hours.
Training Centre C Costs associated with the operation of the in-house centre for distribution network training, including curriculum, training materials etc, excluding apprentice training costs which are directly attributed to standard control services as a cost of operating the electricity distribution network. Apprentices are not used anywhere else in the business.
Costs, excluding apprenticeship costs and training centre management (see below), are allocated to the regulated business only between standard control, alternative control and negotiated distribution services on basis on regulated labour hours. Any specific training for the CaMS group will be charged direct to the group.
Training Centre Management NC Costs associated with management of the in-house training centre
No ideal causal allocator: costs allocated on the basis of the weighted average of all allocators for the training centre.
OHS C Health and safety management Services provided support the regulated business only. CaMS have dedicated OHS personnel as part of their group structure to support the unregulated business. Costs are allocated between standard control, alternative control and negotiated distribution costs based on regulated labour hours.
Environment C Environment management Services provided support the regulated business only. CaMS have a dedicated environmental officer as part of their group structure to support the unregulated business. Costs are allocated between standard control, alternative control and negotiated distribution costs based on regulated labour hours.
Property – Offices and Depots C Property management, including maintenance and alterations and additions associated with offices and depots
Total property costs are allocated between substations and depots based on property rates. Substation property costs are directly attributed to standard control services as a cost of operating the electricity distribution network. Office and depot costs are allocated between distribution and unregulated services on basis of FTE splits. Distribution services costs are further allocated between standard control, alternative control and negotiated distribution services on basis of regulated labour hours.
Printing C Printing services costs not directly attributed to a business function.
Most costs are transfer priced to a business function. Remainder of costs are allocated between distribution and unregulated services on basis of FTE splits. Distribution services costs are further allocated between standard control, alternative control and negotiated distribution services on basis of regulated labour hours.

Lacertus Verum Overhead Allocation Report A4
Customer Relations
General Manager Customer Relations NC Management of the Customer Relations’ group Services provided support the regulated business only. Costs are allocated between standard control, alternative control and negotiated distribution on the basis of the weighted average of all allocators for the Customer Relations group.
Customer Response, excluding Call Centre
C Costs related to customer enquiries (excluding the call centre, which is directly attributed to standard control services including: · Investigations · Ombudsman enquiries · Reliability payments
Services provided support the regulated business only. Costs are allocated between standard control, alternative control and negotiated distribution on the basis of regulated revenue.
Service Improvement C Relates to customer billing system and process improvements to deliver better service to customers
Services provided support the regulated business only. Costs are allocated between standard control, alternative control and negotiated distribution on the basis of regulated revenue.
Connection Services C Management of retailer generated work requests and coordinating customer requests for new or upgraded connections
Services provided support the regulated business only. Costs are allocated between standard control, alternative control and negotiated distribution on the basis of regulated revenue.
Other
Employee Bonuses C Bonus payments made to employees for surpassing specified targets, including financial, safety and customer service
Allocated between distribution and unregulated services on basis of FTE splits. Distribution services costs are further allocated between standard control, alternative control and negotiated distribution services on basis of regulated labour hours.
Voluntary Separation Packages (VSP’s)
C Incentive payments to employees to leave the organisation Actual costs will be assigned to group that employee is based. Costs will be further allocated based on the relevant services or allocator for that group.
Self-Insurance Adjustment C Self-insurance costs are allocated on a cash, rather than accrual, accounting basis, consistent with the manner in which submissions were made and allowances were determined in the price determination. This adjustment reflects the difference between the cash paid and the amount expensed in the Financial Accounts.
Costs allocated across each business segment on the basis of total policy allocations.
Superannuation Adjustment C Superannuation costs are allocated on a cash, rather than accrual, accounting basis, consistent with the manner in which submissions were made and allowances were determined in the price determination. This adjustment reflects the difference between the cash paid and the amount expensed in the Financial Accounts.
Costs allocated across each capital and operating business segment on the basis of labour hours for each division of employee entitlements.

Lacertus Verum Overhead Allocation Report A5
Table A 2 provides a worked example of the use of a weighted average of other allocators. This method is used when there is no practically identifiable causal method. The example shows the allocation of the CFO’s costs by using a weighted average of the allocation of all other Finance Department costs.
TABLE A 2: EXAMPLE OF USE OF WEIGHTED AVERAGE OF OTHER ALLOCATORS#1
Standard Control Alternative Control Negotiated Distribution Unregulated Total
Finance Department (excl. CFO) Causal Allocator $,000 % $,000 % $,000 % $,000 % $,000
Corporate Finance Total Revenue 1,227 69% 18 1% 322 18% 210 12% 1,777
Operational Finance: - Network Management - Field Services
Regulated Revenue 863 78% 13 1% 227 21% 0 0% 1,103
Operational Finance: CaMS Unregulated Services 0 0% 0 0% 0 0% 625 100% 625
Regulatory Finance Regulated Revenue 477 78% 7 1% 125 21% 0 0% 609
Accounts Payable Creditor Transaction Volume 287 78% 4 1% 22 6% 55 15% 368
Payroll FTE Splits 288 85% 0 0% 17 5% 33 10% 338
Purchasing & Contracts Stock Material & Service Contract Costs 2,060 66% 157 5% 362 12% 563 18% 3,142
Taxation & Treasury Total Revenue 327 69% 5 1% 86 18% 56 12% 474
Directly Attributed #2
Standard Control only 650 100% 0 0% 0 0% 0 0% 650
Information Technology IT Systems & FTE Usage 9,960 85% 117 1% 597 5% 1,056 9% 11,730
Total Finance (excl CFO)
16,139 78% 321 2% 1,758 8% 2,598 12% 20,816
CFO Costs Weighted average 366 78% 7 2% 40 8% 59 12% 472
Total Finance (incl CFO)
16,505 78% 328 2% 1,798 8% 2,657 12% #3
21,288
#1 Some % in the table vary slightly to the published numbers due to rounding.
#2 Includes accounts receivable for asset damage and taxation consulting costs, directly attributed to standard control services as a cost of operating the electricity distribution network
#3 What appears to have been an error in the addition of total costs in the source document has been corrected. This also impacts the final allocation % to each division slightly.

Lacertus Verum Overhead Allocation Report B1
APPENDIX B ENERGEX COST ALLOCATORS
Table B 1 is taken from the Energex July 2015 CAM Appendix 2 and summarises the cost allocation methods used.
TABLE B 1: ENERGEX COST ALLOCATORS
Nature of cost Description Attributed/Allocated to Basis of costing
Direct expenditure Expenditure that is directly attributable to the provision of distribution services
Standard control services
Alternative control services
Unregulated services
Attributed via source document
Labour on-cost Expenditure associated with payroll tax, superannuation and other employee costs
Standard control services
Alternative control services
Unregulated services
Allocated based on total direct wages and salary expenditure
Materials storage and logistics on-costs
Expenditure associated with materials handling and storage costs
Standard control services
Alternative control services
Unregulated services
Allocated based on total direct materials expenditure
Fleet on-costs Expenditure associated with operating and maintaining motor vehicles (owned and leased)
Standard control services
Alternative control services
Unregulated services
Allocated based on direct labour
Indirect cost allocation to unregulated (unregulated cost allocation)
Corporate support expenditure incurred in supporting the provision of unregulated services but not directly attributed to specific unregulated activity or service
Unregulated services Allocated based on the three factor method which includes:
- assets;
- head count and
- revenue
Indirect cost allocation (incl. regulated overhead)
Expenditure incurred in the provision of services but not directly attributed to specific activity or service
Standard control services
Alternative control services
Regulated overhead allocated based on total direct expenditure (OPEX and CAPEX)
Non System CAPEX Allocation of CAPEX used to deliver ACS & unregulated services
Standard control services
Alternative control services
Unregulated services
Allocated based on causal relationship (e.g. labour)

Lacertus Verum Overhead Allocation Report C1
APPENDIX C ERGON ENERGY COST ALLOCATORS
Table C 1sets out the Ergon Energy cost allocators for the allocation of directly attributable costs.
TABLE C 1: ERGON ENERGY COST ALLOCATORS, DIRECTLY ATTRIBUTED COST
Nature of Cost Description Attributed to Basis of Costing
Labour and related costs Labour cost and other payroll related costs (such as payroll tax, superannuation, workers compensation, annual and long service).
Standard Control Services,
Alternative Control Services,
Unregulated Services
Directly attributed based on the labour costing process which provides for entry of labour hours based on timesheet data.
The related costs are charged as a percentage of the labour cost attributed to an Activity.
Inventory & Materials Inventory and materials costs, including an associated charge (oncost) representing the administration costs of the Logistics Group, which manages inventory and materials.
Standard Control Services,
Alternative Control Services,
Unregulated Services
Attributed via Chart of Accounts based on Activity.
Inventory items are issued via requisition to the job based on average cost of the item.
The administration cost is charged as a percentage of the cost of inventory attributed to an Activity.
Fleet Charges Motor vehicle leasing and internal operating costs, including management and administration costs, fleet internal, inspection costs, registration and depreciation.
Standard Control Services,
Alternative Control Services,
Unregulated Services
Directly attributed via the equipment hire process which charges fleet costs based on a unit charge associated with the particular class of vehicle used.
Other Contracted services and other costs that can be directly attributed to activities/projects.
Standard Control Services,
Alternative Control Services,
Unregulated Services
Attributed via Chart of Accounts based on Account Code.
Source: Ergon Energy CAM (Version 4.0 July 2014) p 9.

Lacertus Verum Overhead Allocation Report C2
Table C 2 sets out the Ergon Energy cost allocators for the Stage 1 allocation between regulated and unregulated areas of its business.
TABLE C 2: ERGON ENERGY STAGE 1 COST ALLOCATORS (BETWEEN REGULATED & UNREGULATED BUSINESSES)
Corporate Business Unit Nature of Cost Item Allocators
Chief Executive Costs of the Chief Executive Based on work allocation
Strategy Revenue & Transformation This includes the costs of the Board of Directors, Company Secretary, Regulatory affairs, and Strategy
Based on work allocation
Finance & Corporate Services This includes the costs of the Commercial and Financial Management, Billings & Collections, Risk & Assurance, Legal and Procurement
Allocation bases used include: Work allocation, number of invoices, number of purchase orders and number of credit card transactions.
SPARQ Solutions (Virtual Business Unit in EECL) Various cost items relating to the ICT Portfolio Headcount excluding SPARQ
Based on work allocation
People & Shared Services This includes the costs of Human Resources, Health Safety and Environment, Shared Services (includes Payroll Services, Travel Services, Records, Property and Service Capability) and Customer & Stakeholder Engagement.
These costs are generally allocated on the basis of the commercial agreement to SPARQ, with the remainder on work allocation or headcount.
The costs of travel services is allocated on the basis of travel requests.
Retail This includes the costs of Retail support functions such as Retail Service Channels (including National Contact Centre), Innovation and Quality, Retail Strategy & Market Solutions, and Risk and Revenue Assurance
Based on work allocation
Other Corporate Includes other corporate costs such as automated accruals, Organisational Change Program, and centralised costings (eg Fringe Benefits Tax, Bonus Payments, Audit fees)
Various allocators based on the nature of the costs and the underlying cost drivers.
Allocation bases used include: work allocation, direct to legal entity and headcount excluding SPARQ.
Network Optimisation Support activities including Asset Governance, Major Projects, Standards & Technology, Network Development, Maintenance and Performance.
Based on work allocation
Customer Service Support costs relating to and including Service Delivery, Fleet & Logistics, Works Enablement and Energy Solutions
Allocation bases used include: head count and work allocation, commercial agreement to SPARQ & remainder on headcount as well as direct to legal entity.
Source: Ergon Energy CAM (Version 4.0 July 2014) Appendix B.