Embed Size (px)
Citation preview

REPORTON
MARITIME AFFAIRS(SUMMARY)
July 2007
Edited by Maritime Bureau,
Ministry of Land, Infrastructure and Transport
Published by Japan Maritime Center
RE
PO
RT
ON
MA
RIT
IME
AF
FA
IRS (SU
MM
AR
Y) July 2007
Published by Japan M
aritime C
enter

Report on Maritime Affairs (Summary)Contents
Part I: Important Tasks for Maritime Administration .................................. 1Chapter 1: Ideal Means of Stable Marine Transport in Future ........................................ 1
1. On the Assurance of Stable International Marine Transport .................................... 1
2. Efforts to Secure and Nurture Human Resources for the Sound Development
of the Maritime Industry .......................................................................................... 1
Chapter 2: Assurance of Safe, Secure and Environmentally-Friendly Marine Transport ............................................................................................ 2
1. Reinforcement of Safety Assurance Measures.......................................................... 2
2. Reinforcement of Maritime Security Measures.......................................................... 4
3. Tackling Environmental Problems.............................................................................. 5
Chapter 3: Tackling Other Main Policy Tasks .................................................................... 71. Efforts to Revitalize the Motor Boat Race Business .................................................. 7
2. Tackling Maritime Policy and Regional Revitalization and so
Forth in the Area of Maritime Affairs ...................................................................... 7
3. Efforts Exploiting the Advantage of Marine Transport .............................................. 8
4. Efforts to Promote the Construction of New Coastal Vessels to Replace Old Ones 9
Part II Current State of Maritime Affairs and the Tasks Involved ............ 10Chapter 1: Area of Maritime Transport ............................................................................ 10
1. Oceangoing Shipping .............................................................................................. 10
2. Domestic Passenger Ships .................................................................................... 17
3. Coastal Shipping .................................................................................................... 19
4. Port Transport .......................................................................................................... 22
Chapter 2: Shipbuilding and Ship Machinery Industries .............................................. 231. Shipbuilding Industry .............................................................................................. 23
2. Ship Machinery Industries ...................................................................................... 25
3. Development and Practical Application of New Technologies ................................ 26
Chapter 3: Section of Seafarers ...................................................................................... 281. Current State of Seafarers and the Tasks Involved ................................................ 28
2. Education / Employment of Seafarers .................................................................... 28
3. Improvement in the Working Environment .............................................................. 29
4. International Cooperation in the Area of Seafarers ................................................ 29
Chapter 4: Assurance of Maritime Safety / Security and Conservation of the Environment ................................................................ 30
1. Measures to Secure Maritime Safety ...................................................................... 30
2. Measures to Ensure Security .................................................................................. 30
3. Measures Toward Environmental Conservation ...................................................... 30
4. Countermeasures Against Asbestos ...................................................................... 31
5. Port State Control (PSC) ........................................................................................ 31
Chapter 5: Measures to Increase the Utilization of Small Boats and Promote Maritime Activities ........................................................................ 32

–1–
Part I: Important Tasks for Maritime Administration
Chapter 1: Ideal Means of Stable Marine Transport in future
1. On the Assurance of Stable International Marine Transport
• Efforts to assure the global competitiveness of Japanese ocean-going shippingservice operators and a planned increase of Japanese-flag ships and Japaneseseafarers [ study of tonnage-geared standard tax system and so forth ]
Consultation in search for the “Ideal Means of Stable Marine Transport in future” wasconducted by the Minister of Land, Infrastructure and Transport to the Council of TransportPolicy on February 8, in order to ask the Council to discuss the means of assuring stable marinetransport indispensable for Japan to accomplish continued sustainable growth as a maritime andtrading nation in a global international economic community. Following the consultation, an“International Marine Transport Task Force” was established, composed of members with wideknowledge, representing various circles, such as individuals of experience and academic standingin the areas of trade of resources and energy, finance, traffic economy and so forth.
In the interim summary report of June 28 that was made following discussion in fivemeetings of this task force, the policy aims were drastically condensed into “Assurance of theglobal competitiveness of Japanese ocean-going shipping service operators” and “SecuringJapanese-flag ships and Japanese seafarers”, while as for measures to achieve the policy aimsconcerned, the introduction of the laws for, among others, ① the introduction of a tonnage-gearedstandard tax system, ② securing of Japanese-flag ships and Japanese seafarers and so forth wereenumerated.
Hereafter, the decision was taken to work on constructing an institutional framework totarget stable international maritime transport based on the interim summary report.
2. Efforts to Secure and Nurture Human Resources for the Sound Developmentof the Maritime Industry
• Efforts to gather, nurture seafarers and target their career development tosupport them in transforming themselves into land-based ocean engineers
Marine transport, which is indispensable for the society and economy of Japan as amaritime state, is supported by seafarers engaged in ship navigation and ocean engineers whomanage and support it on land. In securing the safety and stability of marine transport, the roleplayed by seafarers (ocean engineers) as the human infrastructure is considerable. Since thevaluation related to the navigational safety of Japanese-flag ships and ships served by Japaneseseafarers on board is extremely high in these days, the government should positively promoteefforts to secure and nurture excellent Japanese seafarers (ocean engineers). With this in mind,the Human Infrastructure Task Force was established within the Maritime AffairsSubcommittee of the Traffic Policy Council, which investigated and discussed an ideal maritimepolicy to secure and nurture human resources in the field of maritime affairs, focusing onsecuring and nurturing excellent Japanese seafarers (ocean engineers) in February 2007.Subsequently, an interim summary report to the effect that efforts were required mainly for fourmeasures, namely nurturing seafarers, gathering them, targeting their career development andsupporting their transformation into ocean engineers on land was made in June, 2007, with thenecessary institutional revision and so forth scheduled to be carried out in future. Moreover, witha view to nurturing young seafarers, who will play a key role in the Japanese marine transport of
the next generation, the Promotion Council for Securing and Nurturing Ocean-going JapaneseSeafarers (Ocean Engineers) is to be established in April, 2007 under an agreement among theJapanese Shipowners’ Association, All Japan Seamen’s Union, and the Ministry of Land,Infrastructure and Transport, with a plan to start the “Scheme for Securing and NurturingJapanese Ocean-going Seafarers (Ocean Engineers)” to promote their career development intoseafarers (ocean engineers), letting them have actual operational experiences so that they canreadily serve on board ships as experts from October 2007.
• Support program to develop next-generation human resources in theshipbuilding industry
Since nearly half the skilled technical experts for shipbuilding in the Japanese shippingindustry are over 50 years old, an unprecedented rapid and large-scale alternation of generationwill take place in the coming decade. If effective countermeasures are not taken under suchcircumstances, the level of technique at manufacturing sites, which has underpinned theinternational competitiveness of the Japanese shipbuilding industry to date, will be abruptlydegraded, which might lead to the loss of such competitiveness. With such conditions in mind, anintensive training project commenced from fiscal 2004 to ensure “expert workman (takumi)”techniques related to shipbuilding, could be smoothly passed on to the younger generation. TheMaritime Bureau is providing assistance for this project through The Cooperative Association ofJapan Shipbuilders. In 2006, the “Nagasaki Area Shipbuilding and Ship Machinery IndustriesTechnological Training Center” was established, and a human resources development project hasbeen underway since April, 2007. The Maritime Bureau took the decision to continue activelyproviding support in this field.
Chapter 2: Assurance of Safe, Secure and Environmentally-FriendlyMarine Transport
1. Reinforcement of Safety Assurance Measures
• Reinforcement of the audit of safety management and seafarers labor / guidancesystem
In recent years, there have been intense efforts to ensure navigational safety in the form ofthe appropriate navigational control of ships and improved working environment of seafarers,since accidents involving ships, including coastal freighters or ultrahigh-speed vessels, have beenoccurring.
The safety assurance of vessel navigation is the responsibility of the Inspector for SafetyManagement and Seafarers Labor, who is appointed in each regional transport bureau and soforth, after the unification of the Inspector of Navigation in charge of inspection on safetymanagement of passenger boats as well as the freighters and the Inspector of Seafarer’s Labor incharge of the working conditions of seafarers. Therefore, an efficient and agile audit can beperformed by the executive officer, who has a wide supervisory authority related to the businesslaws (Maritime Transportation Law, Coastal Shipping Business Law) and seafarers-related laws(Seafarers Law, Seafarers Employment Security Law, Law For Ships’ Officers And Boats’Operators).
Moreover, the training system has been reinforced, and a new audit system has beenconstructed, capable of checking the past audit status, record of contraventions and so forthanytime on the spot during the audit, in order to enhance accuracy when the Inspector for SafetyManagement and Seafarers Labor is executing duties over a wide area. At the same time, Safety
–2–

Management Seafarers Labor Division was created in July 2006 in the Maritime Bureau of theMinistry of Land, Infrastructure and Transport, in order to conduct unified planning / gestationand guidance for the services to be provided by the Inspector for Safety Management andSeafarer’s Labor.
• Measures to prevent recurrence when a serious accident occursWhen a serious ship accident occurs, measures are taken, with the cooperation of the Japan
Coast Guard and so forth, such as prompt inspection, an examination to find out the cause,reprimand or guidance of the party concerned, in accordance with the laws for reconstructing thesafety management system, and the implementation of thorough safety management in order toprevent the recurrence of similar accidents on a nationwide basis and so forth. In fiscal 2006,measures were taken for the large-scale car ferry accident in the offing of the Oarai port, theoceangoing vessel grounding accident in the offing of the Kashima port and so forth.
• Measures to ensure the safety of ultrahigh-speed vesselsIn recent years, accidents caused by the collision of hydrofoil type ultrahigh-speed vessels,
navigating at a high velocity of about 40 knots, and whales and the like have occurred one afterthe other in the seas around Japan. In consideration of such circumstances, the Ministry of Land,Infrastructure and Transport established the “Safety Measures Advisory Committee forUltrahigh-Speed Vessels” in April, 2006 to study how to ensure the safety of hydrofoil typeultrahigh-speed vessels and finalized an interim summary report in August the same year.Moreover, it was decided that unified guidelines for the content of training and the trainingperiod for the navigation personnel of hydrofoil type ultrahigh-speed ships should be provided,and it has also been decided that the “Guidelines for the Training of Navigation Personnel ofHydrofoil Type Ultrahigh-Speed Vessels” are to be formulated to improve the training level bythe end of fiscal 2007.
• Introduction of transport safety management system“Law Revising a Part of the Railway Business Law etc. for the Improvement of the Safety of
Transportation” (Law No. 19 of 2006) was approved in the Diet and put into effect in October,2006, to deal with circumstances whereby the trust in the safety of public transportation facilitiesfor the nation was seriously eroded and seek to enhance the safety management system. Thereby,the transport safety management system was applied to the marine transportation field inaddition to traffic fields, such as rail and air transport.
• Implementation of The Voluntary IMO Member State Audit SchemeIn the wake of large-scale accidents involving oil spillages from tankers, there has been an
increasingly urgent need to eliminate substandard vessels. The background involves the presentsituation having been illustrated, in which the government of the flag state has failed tosatisfactorily meet obligations to supervise and oversee ships of its own flag, to ensure theyobserve the international standard.
With such a situation, a “Ministerial Conference on Transport” was held in Tokyo inJanuary, 2002, in which Japan advocated the establishment of an audit scheme by InternationalMaritime Organization (IMO) on the enforcement of the conventions by the flag states, and afterconsiderations under IMO to seek a means to have the government of the flag state meet itsobligations under the conventions and subsequently to introduce the audit scheme, theimplementation of the audit scheme was adopted at the 24th Session of the IMO Assembly inDecember, 2005, and has started since September, 2006.
Japan accepted the audit in February, 2007, and the maritime affairs administration of
–3–

Japan received a high overall assessment, in recognition of the fact that the operation isconducted comprehensively and efficiently to meet obligations under the internationalconventions, from all the viewpoints of flag, port and coastal state, including the construction ofthe “Maritime Affairs Quality Management System”, the nurturing of inspectors, and theestablishment of the system of Port State Control (PSC) implementation and so forth. However itwas pointed out that it is necessary to strengthen the audit of overseas offices of the shipclassification association and the on-the-spot inspection of Japanese ships, which theclassification society is checking periodically at once.
It is recognized as vital for developing countries to participate in the audit scheme, owing tothe exclusion of substandard ships. Therefore, it has been decided to positively contribute to thedevelopment and improve the effectiveness of the audit scheme by utilizing the experience inaccepting the audit, in order to promote the establishment of the scheme, which is implementedon a voluntary basis, as early as possible among Member States.
• Drastic reform of the pilotage systemAs Japanese seafarers have become increasingly scarce in recent years, a shortage of pilots
with sea captain experience is anticipated in the near future, raising apprehension of a potentialinability to maintain smooth shipping traffic operations. Furthermore, in view of the increasingdemand for improved operational efficiency / accuracy of the piloting service forming part of theport service, and based on the perspective of strengthening the international competitiveness ofJapanese ports, the “Council for the Reform of Japan’s Pilotage Service System” was established,within which discussions concerning the desirable nature of the pilotage system took place, and abill partially amending the Marine Pilot Law (”Bill for the Partial Amendment of the Port Lawand Others for Strengthening the Basis of Maritime Distribution”) was promulgated on May 17,2006.
While securing excellent pilots through nurturing pilots and the adequate supervision oflicense renewal courses for the registered pilots, and aiming to ensure the safety of the shippingtraffic, implementing proper guidance and supervision of the Pilots’ Association and the JapanFederation of Pilots’ Associations is intended to ensure the adequacy of the pilotage operation, aswell as operating the new pilotage system in such a way as to improve the efficiency of thepilotage operation through appropriate screening when the upper limit of the pilotage dues areauthorized to establish a rate level reflecting the cost properly and so forth.
2. Reinforcement of Maritime Security Measures
• Reinforcement of safety and security measures in the Straits of Malacca andSingapore
In order to promote the measures against piracy and armed robbery against ships, theguideline was compiled in March 2006. Based on this guideline, Ministry of Land, Infrastructureand Transport has decided to promote various measures even more strongly in order to reducethe number of the incidents by pirates and armed robbers, through efforts for cooperation withrelated agencies and shipping industries, and through enhancement of maritime security ininternational society.
As part of efforts for international cooperation in the Straits of Malacca and Singapore, asurvey of traffic volume was conducted to gage how many ships were actually navigating in theStraits. The results of a survey made clear that beside Japan, many other countries were thebeneficiaries in various ways from the passage through the Straits. And the number of shipsnavigating in the Straits is projected to increase by 50% from 2004 to 2020 by our survey. At the“Kuala Lumpur Meeting”, held in September 2006, the Projects and the Cooperative Mechanism
–4–

for enhancing safety of navigation and environmental protection were proposed by the littoralstates, and the “Kuala Lumpur Statement” was adopted, outlining cooperation and so forth,toward establishing mechanism to provide funding for the projects such as replacement andmaintenance of Aids to Navigation. In order to establish a new framework for internationalcooperation including foundation of Aids to Navigation Fund, Japan, as one of the major userstates of the Straits, contribute proactively to the future progress of discussions at internationalconferences and so forth.
3. Tackling Environmental Problems
• Countermeasures against global warmingIn order to attain the targets for reduction in the Kyoto Protocol through the promotion of a
modal shift from transportation by truck to coastal shipping and so forth, the targeted goal in themaritime transportation-related sector is a reduction of around 1.4 million tons in the CO2
emission volume by fiscal 2010, and the Maritime Bureau is implementing “ComprehensiveMeasures for the Greening of Maritime Transportation” in order to attain the said reductiontarget.
In addition, in order to prevent any increase in the CO2 emission volume from thetransportation sector, such as from automobiles and ships, using petroleum and similar fuels, theEnergy Saving Law was revised in fiscal 2005 (put in force on April 1, 2006), which obligesshipping service operators with a transport capacity exceeding a certain scale (holding ships withgross tonnage of 20,000 tons or more) in the maritime transportation-related sector.
• Tackling ship recycling system at an international levelSince the poor conditions of the related labor environment, sea pollution originating from
recycling yards and so forth are viewed as problems related to ship recycling (the dismantlementof ships) conducted in developing countries, such as India, in recent years, a study is underway ininternational organizations, such as the United Nations Environmental Programme (UNEP),International Maritime Organization (IMO), International Labour Organization (ILO) and soforth to try and solve such problems.
In particular, the IMO has decided to formulate a new convention concerning ship recyclingin 2008-2009, and discussion of the convention draft is progressing, in which Japan activelyparticipates from the standpoint of a country with significant maritime transport andshipbuilding.
The Maritime Bureau, having established the Ship Recycling Study Committee, comprisingintellectuals knowledgeable in shipbuilding, maritime transport and the environment, isconducting comprehensive studies on ship recycling, including that of strategic measures to betaken in various international organizations, in order to establish an effective convention.
• Construction of an advanced recycling system for abandoned Fiber ReinforcedPlastics (FRP) boats
Based on the achievements of the technology of recycling of FRP boats, which wasestablished through research and development, as well as demonstration tests, under the“Project for the Construction of an Advanced Recycling System for Abandoned FRP Boats”, and inorder to meet the social requirements of securing an appropriate process method for FRP boatsand establishing a recycling-based society and so forth, the recycling of FRP boats commenced inthe Western Setouchi and Northern Kyushu regions in fiscal 2005, with the support of theMinistry of Land, Infrastructure and Transport and with the Japan Boating Industry Associationas main promoter. Its nationwide deployment is projected for fiscal 2007.
–5–

• Efforts to ratify the ILO Maritime Labour ConventionAt the 94th(Maritime) Session of the International Labour Organization (ILO) Conference
held in February, 2006, the Maritime Labour Convention 2006 was adopted, which consolidatesall the 60 or so conventions and similar bodies that have been adopted to date since the 1919establishment of ILO, to ensure they reflect the present era, and simultaneously improve theireffectiveness.
It has been decided that future efforts for the preparation and study required to ratify thisconvention, such as the arrangement of domestic laws, an enforcement system and so forth forgoverning inspections of flags state or PSC, etc. will be advanced, and, at the same time,coordination and cooperation with the countries in the Asia Pacific region will also be promotedin order to expedite ratification by the same.
–6–

Chapter 3: Tackling Other Main Policy Tasks
1. Efforts to Revitalize the Motor Boat Race Business
The Motor-Boat Racing business, since 1991 fiscal year, has continued to suffer from a long-term decline in the race business sales, which fell to about 970 billion yen in fiscal 2005 fromabout 2,200 billion yen in fiscal 1991. Consequently, the deterioration, not only in the promoters’earnings but also the financial position of the Motorboat Association of each local municipality,which are the actual promoters of Motor-Boat Racing, has become evident.
In the meanwhile, an “Important Policy of Administrative Reform”, which was decided atthe cabinet meeting in December, 2005, required, as part of a review of public tournament-related corporations, an overall review of matters such as the desirable ideal nature of theorganization as well as that of the subsidizing system and transparency with respect to theintended purpose of the subsidy.
In order to deal with such changes in the social environment surrounding Motor-BoatRacing appropriately and achieve the aim of the Motor-Boat Racing Law to promote publicbusiness and contribute to local government finance, it has become necessary to improve thebusiness operation of the promoters and conduct comprehensive restructuring of the framework,to facilitate the flexible implementation of the business in appropriate response to the changes inthe social environment. With this in mind, the Motor-Boat Racing Low was revised accordingly(proclaimed on March 31, 2007).
2. Tackling Maritime Policy and Regional Revitalization and so Forth in theArea of Maritime Affairs
• Dealing with Basic Act on Ocean PolicyBasic Act on Ocean Policy, which contains the basic concepts of ocean policy, government
responsibility, local public bodies and so forth, as well as basic measures etc., was passed andenacted on April 20 of this year (put in force on July 20, 2007).
While the Maritime Bureau has been promoting such various measures to date, includingimprovement in the environment of international competitiveness, assurance of stabletransportation, promotion of the marine business and support for various kinds of research anddevelopment as well as nurturing and securing human resources, it has been recognized, in viewof the enforcement of the “Marine Basic Law”, that various measures toward the realization of asea-oriented state shall be promoted concentrically and comprehensively in future, as in the pastand the decision has also been taken to diligently strive for the further development of themarine industry as a whole and reinforcement of its international competitiveness.
• Efforts for regional revitalizationIn view of the severely worsening circumstances surrounding public transport in local areas,
the “Act for Revitalizing and Reviving Local Public Transport” was enacted in May, 2007 for thepurpose of implementing measures for the smooth introduction of a new form of passengertransport service suited to local needs, as well as comprehensive government support for the jointefforts of related local parties led by the municipality, so that they may create attractive regionsthrough the revitalization and revival of local public transport. Therefore, the Maritime Bureauhas determined to work on revitalization of local public transport.
• Responding to the Asia Gateway ConceptBy the Prime Minister’s policy speech at the extraordinary diet session, which opened in the
–7–

autumn of 2006, the “Asia Gateway Concept” was presented, in which Japan is to play the role ofa bridge between Asia and the world in terms of the flow of human resources, goods, money,culture and information. With this in mind, the Maritime Bureau decided to actively contributein international conferences and so forth, to improve passage supporting facilities in order topromote safety measures in the Malacca-Singapore strait and elsewhere as well as to constructnew frameworks of international cooperation. In addition, with a view to improving the safetyand stability as well as international competitiveness of maritime transportation, not only ofJapan but also of the entire Asian region, it has been decided that the “International JointProgram for Nurturing Asian Seafarers” will be formulated in future under the initiative ofJapan for promotion in cooperation with Asian countries. In formulating the same program, thereare plans to incorporate the “Expansion of the Training for Boarding the Ship in the JapaneseWay” in the same, including practical training of boarding a ship financed by ODA, using atraining ship of the National Institute for Sea Training and so forth as well as “Support for theReform of the Seafarer Education System”, under which Japan supports the reform of the entireseafarer education system in each of the Asian countries and so forth.
3. Efforts Exploiting the Advantage of Marine Transport
• Enhancing the appeal of voyages by sea and the promotion of coastal passengerships, including encouragement of sightseeing tours to and from remote islands
In view of the interim proposal compiled at the “Roundtable Conference for Reviving theAttractiveness of Voyage by Sea” in June, 2006, the topics of “Enhancing the appeal of Voyagesby Sea” and “Promotion of Sightseeing Tours to Remote Islands” have been positioned as themost important measures of fiscal 2006. With a view to enhancing the appeal of “Voyages by Seain Casual Wear”, the government, passenger ship industry, travel industry, and local relatedparties have combined their efforts to develop joint work for the strategic transmission ofinformation to improve the perception of ships as well as the development and sales promotion ofarticles on voyages suited to users’ needs.
The Committee for Promoting the Exchange of Sightseeing Tours to and from RemoteIslands was established through the collaboration of 4 relevant bureaus (Comprehensive PolicyBureau, City and Regional Development Bureau, Maritime Bureau and Ports and HarborsBureau) in March, 2007, in order to materialize the exchange of sightseeing tours to and fromremote islands. This committee intends to support regions that are prepared to take the initiativein devising promotions for the exchange of sightseeing tours and made an interim proposal inJuly this year.
• Promotion of a future business model for coastal shippingThe coastal shipping industry has faced various problems, such as securing seafarers,
building ships for replacement and safety assurance. However, under present circumstances, it isdifficult for coastal shipping operators, who are mostly medium, small and micro enterprises, towork on these problems individually. Under such circumstances, a movement for the loosegrouping of coastal shipping operators, utilizing ship administration companies, is attractingattention. It is important to promote these grouping movements as a new business model ofcoastal shipping for the future, in order to ensure stable marine transport and revitalize coastalshipping. For this purpose, the national government has positively started striving for itspropagation and promotion.
• Promotion of a modal shift through a positive approach to shippersIn April 2006, the revised Rationalization in Energy Use Law, which obliges the transport
–8–

sector to take energy saving measures, was enacted in order to unfailingly implement measuresfor energy saving in the area of transportation and to further control CO2 emissions originatingfrom energy consumption. Under this law, shippers of cargo exceeding a specified scale in termsof transport quantity were also obligated to take such energy saving measures as part of themodal shift.
In October, 2006, the Maritime Bureau established the “Study Meeting for Promoting aModal Shift to Marine Transport”, comprising members of shipping service operators with ROROvessels and container vessels, further striving to promote a greater modal shift to marinetransport.
4. Efforts to Promote the Construction of New Coastal Vessels to Replace OldOnes
Coastal shipping is one of the trunk distribution industries in Japan which supports itseconomy and national life, accounting for about 40% of domestic distribution, and in particular,about 80% of transport of fundamental goods for industry (steel, petroleum, cement and so forth).In recent years, the tendency toward an “aging population combined with diminishing birthrate”has advanced rapidly in the coastal shipping sector, which supports the above-mentionedactivities. Given the importance of revitalizing coastal shipping in order to realize theconstruction of new coastal vessels replacing old ones on a stable and adequate scale, an “ActionPlan for Promoting the Construction of New Coastal Vessels to Substitute Old Ones” wasformulated in March, 2006 to solve those problems. Thanks to efforts by the parties concerned,including the Maritime Bureau, the number of vessels for which applications for constructionwere filed in fiscal 2006 reached 126 (up about 60% from the preceding fiscal year), showing adistinctly favorable recovery trend. Efforts will continue to be made in accordance with thisAction Plan.
–9–

Part II Current State of Maritime Affairs and the TasksInvolved
Chapter 1: Area of Maritime Transport
1. Oceangoing Shipping
The volume of global cargo movement on the ocean in 2006, in terms of tonnage, was 6.98billion tons (an increase of 4.8% from the previous year) and, in terms of ton-miles, was 30,668billion ton-miles (an increase of 5.5% ), recording an all-time high in both tonnage and ton-milesin succession from the previous year.
With respect to the breakdown of the volume of world cargo movement on the ocean,petroleum (crude oil and petroleum products) accounted for 33%, which was the highestpercentage among all items, followed by coal, iron ore and grain, for which the percentage wascollectively 24.7 %.
For 2006 the annual volume of ocean cargo movement again established a historical recordhigh on account of continued favorable business activities in U.S.
The volume of east bound ocean cargo movement (Asia → North America) increased to13,480 thousand TEUs (an increase of 10% from the previous year). By country, the largestvolume in terms of east bound cargo movement was shipped from China (an increase of 5%),accounting for about 70% of the total volume.
–10–
Petroleum Dry Cargo
Crudeoil
Ironore Coal
Table 1:Volume of the world ocean cargo movement by major commodities
Petroleumproducts Total Grain Other
GrandTotalTotal
(1) Tonnage (Unit: one million Tons)
1999 1,550 411 482
Rate ofincrease 1.0 –1.4 1.9
415 1,965
3.2 1.4
220 2,218
12.2 3.2
3,331 5,296
3.0 2.4
2000 1,608 454 523
Rate ofincrease 3.7 10.5 8.5
419 2,027
1.0 3.2
230 2,361
4.5 6.4
3,568 5,595
7.1 5.6
2001 1,592 452 565
Rate ofincrease –1.0 –0.4 8.0
425 2,017
1.4 –0.5
234 2,385
1.7 1.0
3,636 5,653
1.9 1.0
2002 1,588 484 570
Rate ofincrease –0.3 7.1 0.9
414 2,002
–2.6 –0.7
245 2,519
4.7 5.6
3,818 5,820
5.0 3.0
2003 1,673 524 619
Rate ofincrease 5.4 8.3 8.6
440 2,113
6.3 5.5
240 2,637
–2.0 4.7
4,020 6,133
5.3 5.4
2004 1,754 589 664
Rate ofincrease 4.8 12.4 7.3
461 2,215
4.8 4.8
236 2,789
–1.7 5.8
4,278 6,493
6.4 5.9
2005 1,784 652 710
Rate ofincrease 1.7 10.7 6.9
495 2,279
7.4 2.9
251 2,770
6.4 –0.7
4,383 6,662
2.5 2.6
2006 1,814 711 755
Rate ofincrease 1.7 9.0 6.3
517 2,331
4.4 2.3
262 2,924
4.4 5.6
4,652 6,982
6.1 4.8

Also for the west bound cargo movement (North America → Asia), the volume increased to4,540 thousand TEUs (an increase of 5% from the previous year). The volume bound for Chinawas still continuing to increase (an increase of 10%), marking an outstanding movement in termsof east bound cargo.
–11–
Source: Fearnley’s “REVIEW 2006”Note: Values for 2006 are estimates.
(2) Ton-miles (Unit: one billion ton-miles)
Petroleum Dry Cargo
Crudeoil
Ironore Coal
2005 9,239 3,711 3,124
Rate ofincrease 5.0 7.8 5.5
Petroleumproducts Total
2,510 11,749
8.9 5.8
Grain Other
1,385 9,125
2.6 4.6
GrandTotalTotal
17,345 29,094
5.3 5.5
1999 7,980 2,317 2,363
Rate ofincrease 1.2 0.5 –2.3
2,055 10,035
4.3 1.8
1,186 6,632
11.5 4.1
12,498 22,533
2.8 2.3
2000 8,180 2,545 2,509
Rate ofincrease 2.5 9.8 6.2
2,085 10,265
1.5 2.3
1,244 7,130
4.9 7.5
13,428 23,693
7.4 5.1
2001 8,074 2,575 2,552
Rate ofincrease –1.3 1.2 1.7
2,105 10,179
1.0 –0.8
1,322 7,263
6.3 1.9
13,712 23,891
2.1 0.8
2002 7,848 2,731 2,549
Rate ofincrease –2.8 6.1 –0.1
2,050 9,898
–2.6 –2.8
1,241 7,753
–6.1 6.7
14,274 24,172
4.1 1.2
2003 8,390 3,035 2,810
Rate ofincrease 6.9 11.1 10.2
2,190 10,580
6.8 6.9
1,273 8,156
2.6 5.2
15,274 25,854
7.0 7.0
2004 8,795 3,444 2,960
Rate ofincrease 4.8 13.5 5.3
2,305 11,100
5.3 4.9
1,350 8,720
6.0 6.9
16,474 27,574
7.9 6.7
2006 9,516 4,120 3,372
Rate ofincrease 3.0 11.0 7.9
2,635 12,151
5.0 3.4
1,436 9,608
3.7 5.3
18,536 30,686
6.9 5.5

–12–
14,000
12,000
10,000
8,000
6,000
4,000
2,000
01997 1998 1999 2000 2001 2002 2003 2004 2005 2006
1997 1998 1999 2000 2001 2002 2003 2004 2005 2006
6,000
5,000
4,000
3,000
2,000
1,000
0
16% 14% 13% 12% 10% 9% 8% 8% 7% 6%
32% 35% 33% 30% 29% 27% 24% 21% 19% 18%
11%
13%
11%
15%
13%
12%11%
15%
15%
11%
12%
20%
9%11%
25%
9%
27%
9%
33%
8%
36%
9%
39%
9%
40%
10%
33%
13%
34%
12%
35%
11%
42%
9%
45%
8%
48%
7%
51%
7%
58%
6%
63%
5%
67%
5%
14%
6%15%
7%
17%
7%14%
7%
14%
6%15%
6%
14%
5% 11%
5% 7%
5% 6%
4%
13%13% 12%
10%
13%
10%12%
9%
12%
8%
8%8%
11%11%
Figure 1: Transition in container cargo movement on the North American route by country
East bound (Asia North America)(thousand TEUs)
JapanSouth KoreaVietnam
ChinaThailandPhilippines
Hong KongIndonesiaSingapore
TaiwanMalaysiaMacau
West bound (North America Asia)(thousand TEUs)
JapanHong KongPhilippines
ChinaIndonesiaMalaysia
South KoreaThailandVietnam
TaiwanSingaporeMacau
Source: Compiled by the Japan Maritime Center, based on the data of PIERS
→
→
–13–
Import
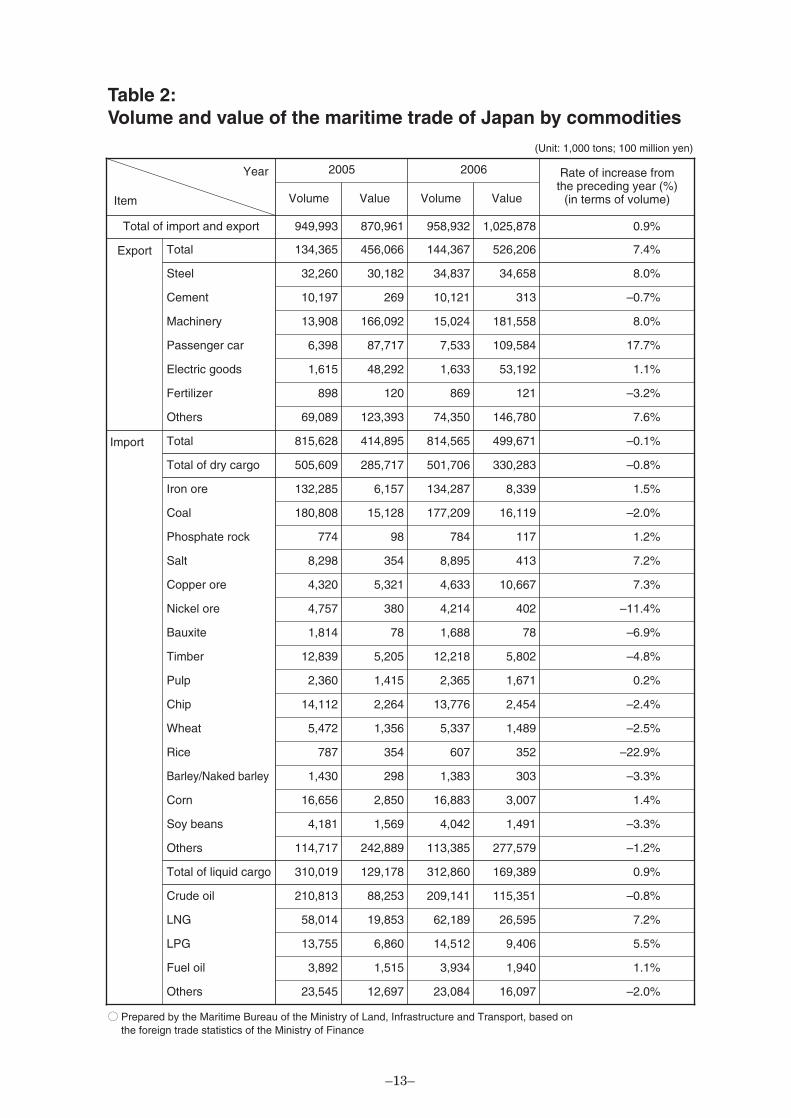
Table 2:Volume and value of the maritime trade of Japan by commodities
Year
Item
2006
Volume Value
Total of import and export 958,932 1,025,878
2005
Volume Value
949,993 870,961
Rate of increase fromthe preceding year (%)
(in terms of volume)
0.9%
Export Total 144,367 526,206134,365 456,066 7.4%
Steel 34,837 34,658
Cement 10,121 313
32,260 30,182
10,197 269
8.0%
–0.7%
Machinery 15,024 181,558
Passenger car 7,533 109,584
13,908 166,092
6,398 87,717
8.0%
17.7%
Electric goods 1,633 53,1921,615 48,292 1.1%
Fertilizer 869 121
Others 74,350 146,780
898 120
69,089 123,393
–3.2%
7.6%
Import Total 814,565 499,671
Total of dry cargo 501,706 330,283
815,628 414,895
505,609 285,717
–0.1%
–0.8%
Iron ore 134,287 8,339
Coal 177,209 16,119
132,285 6,157
180,808 15,128
1.5%
–2.0%
Phosphate rock 784 117
Salt 8,895 413
774 98
8,298 354
1.2%
7.2%
Copper ore 4,633 10,667
Nickel ore 4,214 402
4,320 5,321
4,757 380
7.3%
–11.4%
Bauxite 1,688 78
Timber 12,218 5,802
1,814 78
12,839 5,205
–6.9%
–4.8%
Pulp 2,365 1,6712,360 1,415 0.2%
Chip 13,776 2,454
Wheat 5,337 1,489
14,112 2,264
5,472 1,356
–2.4%
–2.5%
Rice 607 352
Barley/Naked barley 1,383 303
787 354
1,430 298
–22.9%
–3.3%
Corn 16,883 3,007
Soy beans 4,042 1,491
16,656 2,850
4,181 1,569
1.4%
–3.3%
Others 113,385 277,579114,717 242,889 –1.2%
Total of liquid cargo 312,860 169,389
Crude oil 209,141 115,351
310,019 129,178
210,813 88,253
0.9%
–0.8%
LNG 62,189 26,595
LPG 14,512 9,406
58,014 19,853
13,755 6,860
7.2%
5.5%
Fuel oil 3,934 1,940
Others 23,084 16,097
3,892 1,515
23,545 12,697
1.1%
–2.0%
(Unit: 1,000 tons; 100 million yen)
○ Prepared by the Maritime Bureau of the Ministry of Land, Infrastructure and Transport, based on the foreign trade statistics of the Ministry of Finance

–14–
Category
Export
Liners
Table 3:Volume transported and freight earned by Japanesemerchant fleet
Total
15,393
Japanese-flag ship
Charteredforeignships
499 14,894
Total
–3.7
Japanese-flag ship
Charteredforeignships
2.7 –3.9
45,303 1,803 43,500 Total
16.118.5 16.0
1,413 43 1,370 13.425.4 13.0(Container ships of theabove)
8,660 162 8,498 –0.4–6.4 –0.3
1,150 29 1,121 17.235.2 16.7
Trampers22,547 632 21,914 40.882.3 39.6
3,312 158 3,154 30.35.8 31.6
Tankers7,364 671 6,693 –18.3–29.9 –17.1
229 21 208 –9.62.7 –10.9
23.624.38.94,954 4,732 222
Import
Liners16,259
1.53.3–15.97,826 7,071 755
1,325 14,934 12.5–18.4 15.3
529,705 53,463 476,242 Total
–6.7–16.0 –5.7
(Container ships of theabove)
1,038 62 976 11.6–19.7 13.6
13,060 282 12,778 14.9–2.5 15.3
901 26 875 9.5–2.0 9.9
Trampers339,699 20,786 318,913 –4.3–14.1 –3.6
4,449 179 4,271 –0.6–17.2 0.1
Tankers173,747 31,352 142,395 –13.3–17.1 –12.5
2,339 514 1,825 0.9–15.2 5.4
Offshoretrade
Liners55,881
27.727.062.39,323 9,145 178
863 55,019
Total
Liners87,533
17.5
43.1
18.40.922,104 20,948 1,155
2,687 84,846
48.2 43.0
29.26.9 29.9
779,108 61,083 718,025 Total
204,100 5,817 198,282 Total
19.960.6 18.7
(Container ships of theabove)
5,828 97 5,731 31.060.7 30.5
55,697 863 54,834 43.148.2 43.0
5,807 97 5,710 30.360.7 29.8
Trampers94,660 1,858 92,802 14.2173.7 11.0
2,344 40 2,304 22.3113.9 20.7
1.6
Tankers53,558 3,096 50,462 5.9–3.9 6.5
1,151 41 1,111 22.015.2 22.3
–7.7 2.4
(Container ships of theabove)
8,280 202 8,077 25.628.5 25.5
77,417 1,307 76,110 33.530.5 33.5
7,858 151 7,707 26.544.6 26.2
Trampers456,906 23,276 433,629 1.83.5 1.7
10,105 377 9,728 14.86.5 15.2
Tankers234,669 35,120 199,549 –9.1–16.2 –7.8
3,719 576 3,143 6.8–12.4 10.3
(Unit: 1,000 tons; 100 million yen; %)
Source: Surveyed by the Maritime Bureau of the Ministry of Land, Infrastructure and Transport.Note: 1. The numerical value on the upper and lower column of each item indicates the volume transported and freight
earned respectively.2. The number of container vessels is included in that of liners.3. The numerical values for 2006 are provisional.
Rate of increase fromthe preceding year
Total
14,831
6,1255,883242
Japanese-flag ship
Charteredforeignships
513 14,318
18,298
7,9427,307635
1,081 17,217
494,06844,928 449,140
52,6012,136 50,466
1,60354 1,549
8,625152 8,473
1,34839 1,309
31,7561,153 30,603
4,316167 4,149
6,015470 5,545
20722 185
1,15950 1,109
15,011275 14,736
98725 962
325,14717,859 307,288
4,422148 4,274
150,62325,988 124,635
2,360436 1,924
79,948
11,90611,617289
1,278 78,670
113,078
25,97324,8071,166
2,873 110,205
791,44456,405 735,039
244,7749,341 235,433
7,634156 7,478
79,6891,278 78,411
7,567156 7,411
108,1075,087 103,020
2,86786 2,781
56,7172,975 53,742
1,40547 1,358
10,396260 10,136
103,3261,706 101,620
9,943219 9,724
465,01024,099 440,911
11,604401 11,203
213,35629,434 183,922
3,972505 3,467
2005 2006
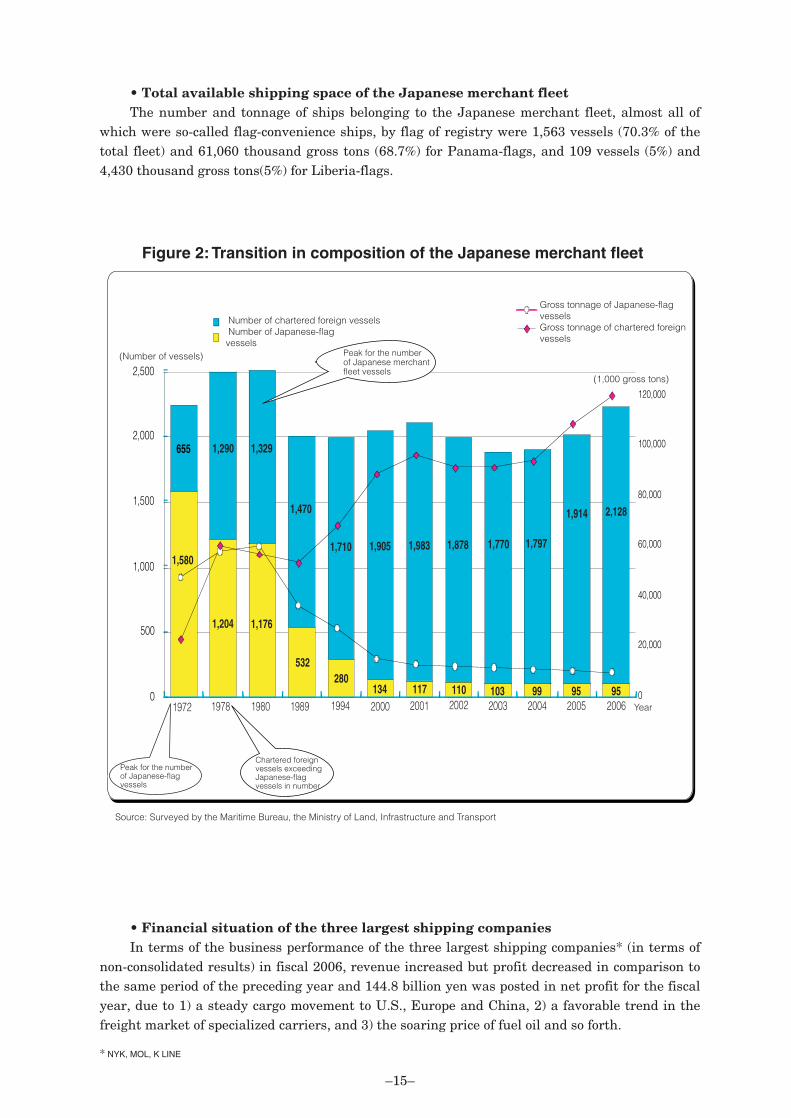
• Total available shipping space of the Japanese merchant fleetThe number and tonnage of ships belonging to the Japanese merchant fleet, almost all of
which were so-called flag-convenience ships, by flag of registry were 1,563 vessels (70.3% of thetotal fleet) and 61,060 thousand gross tons (68.7%) for Panama-flags, and 109 vessels (5%) and4,430 thousand gross tons(5%) for Liberia-flags.
• Financial situation of the three largest shipping companiesIn terms of the business performance of the three largest shipping companies* (in terms of
non-consolidated results) in fiscal 2006, revenue increased but profit decreased in comparison tothe same period of the preceding year and 144.8 billion yen was posted in net profit for the fiscalyear, due to 1) a steady cargo movement to U.S., Europe and China, 2) a favorable trend in thefreight market of specialized carriers, and 3) the soaring price of fuel oil and so forth.
–15–
0
500
1,000
1,500
2,000
2,500
0
20,000
40,000
60,000
80,000
100,000
120,000
655
1,580
1972 1978 1980 1989 1994 2000 2001 2002 2003 2004 2005 2006
1,204 1,176
532280
134 117 110 103 99 95 95
1,290 1,329
1,470
1,710 1,905 1,983 1,878 1,770 1,797
1,914 2,128
Figure 2: Transition in composition of the Japanese merchant fleet
(Number of vessels)
Number of chartered foreign vessels Number of Japanese-flagvessels
Gross tonnage of Japanese-flag vesselsGross tonnage of chartered foreign vessels
Peak for the number of Japanese-flag vessels
Chartered foreign vessels exceeding Japanese-flag vessels in number
Source: Surveyed by the Maritime Bureau, the Ministry of Land, Infrastructure and Transport
Year
(1,000 gross tons)
Peak for the number of Japanese merchant fleet vessels
Peak for the number of Japanese merchant fleet vessels
* NYK, MOL, K LINE

• Current standing of oceangoing cruisingThe cruising population in Japan accounts for only about 1% of the world total of about 16
million. In particular, when compared with the U.S., an advanced country in cruising, thepopulation remained at an extremely low level. The global cruising population, meanwhile, hasalmost more than doubled in number over the past decade.
–16–
Table 4:State of profit and loss of three largest shipping companies
○ Prepared by the Maritime Bureau, based on the financial data of each company(Note) Total figures may not tally with the totals of each figure due to rounding.
(Unit: 100 million yen)
Fiscal
200527,985 14.6 25,412 20.2 2,573 –21.8 2,717 –19.9 1,709 –4.5
Fiscal
200631,714 13.3 29,852 17.5 1,862 –27.6 2,133 –21.5 1,448 –15.3
Rate of increase ordecreasefrom theprecedingfiscal year(%)
Operating revenue
Rate of increase ordecreasefrom theprecedingfiscal year(%)
Rate of increase ordecreasefrom theprecedingfiscal year(%)
Rate of increase ordecreasefrom theprecedingfiscal year(%)
Rate of increase ordecreasefrom theprecedingfiscal year(%)
Operating profitor loss
Ordinary profitor loss
Net profit after taxfor the term
Operating expenses
Name of Country (or area) 1990
U.S. 3,500
Canada 150
U.K. 180
Table 5:Transition in the population of passengers on global cruise ships
(Note) 1. Quoted from Douglas Ward’s “Ocean Cruising & Cruise Ships, 2007” 2. Figures for Japan are surveyed by the Maritime Bureau, the Ministry of Land, Infrastructure and Transport.
1995 2004
4,600 9,500
250 300
400 1,027
2000 2001
6,900 6,900
300 300
800 776
2002 2003
8,650 9,000
300 300
823 960
(Unit: thousand persons)
Germany 190
Italy –
France 75
Other countries in Europe 180
309 583
250 353
200 250
250 250
283 392
250 250
223 225
250 250
428 429
250 250
225 250
250 250
Australia 100 150 500200 200 200 250
Cyprus –
Asia (except Japan) 75
Japan 175
Total 4,625
75 75
450 600
225 160
7,239 13,598
75 75
800 849
216 200
10,297 10,417
75 75
800 600
169 140
12,170 12,504
2005
11,200
300
1,069
639
514
233
250
500
75
600
156
15,536

• World Trade Organization (WTO)With respect to the maritime transportation services sector, agreement on liberalization has
not been reached, even with past negotiations on such occasions as the Uruguay Round, and theprincipal provisions of the WTO’s General Agreement on Trade in Services (GATS), includingMost-Favored Nation Treatment, do not currently apply to this sector.
Japan, who sets the “principle of free circulation of shipping” as the foundation of its policyon international shipping, gathering members highly interested in maritime transport services totarget agreement in this round, held and presided over the Maritime Friends Meeting (14Maritime Friends countries (regions): namely Australia, Canada, China, the EuropeanCommunities and its Member States, Hong Kong china, Iceland, Japan, Republic of Korea,Mexico, New Zealand, Norway, Panama, Switzerland and the Separate Customs Territory ofTaiwan, Penghu, Kinmen, Matsu), among which lively discussion ensued.
In the 6th ministerial conference held in Hong Kong in December, 2005, a declarationaiming to complete negotiations by the end of 2006 was adopted. Since then, multilateralnegotiations have been conducted in the service area in addition to bilateral consultation basedon the request-offer formula.
Because no compromise could be found, however, in the areas of agriculture and NAMA,negotiations were suspended in July 2006. Coordination has since been carried out to resumenegotiations, which have recommenced since January, 2007 to target agreement at the end of theyear.
2. Domestic Passenger ShipsAs of April 1, 2007, 964 business operators (a decrease of 21 operators from the preceding
year) managed 1,659 routes (a decrease of 37 routes from the preceding year), with 2,385 vessels(a decrease of 10 vessels from the preceding year) commissioned in service.
With respect to the actual transportation records for fiscal 2005, the number of transportedpassengers was 103,200 thousand (up 2.3% from the preceding fiscal year), and the transportedpassenger-kilometer total was 4,025 million (up 4.0% from the preceding fiscal year).
On the other hand, with regard to the actual transportation records for automobiles, thenumber of units was 5,367 thousand for trucks (up 2.7% from the preceding fiscal year) and11,190 thousand for passenger cars / other vehicles transported (up 7.4% from the preceding
–17–
140,000
120,000
100,000
80,000
60,000
40,000
20,000
01989 1990 1991 1992 1993 1994 1995 1996 1997 1998 1999 2000 2001 2002 2003 2004 2005 2006
36,200
21,900
38,100
28,600 25,600
38,300
30,400
46,400
32,800
47,300
31,400
42,500
34,400
45,100
39,400
34,400
49,000
33,300
46,100
26,700
48,100
22,700
109,400
21,100 18,400
96,900
74,800
18,600
48,700
10,100
57,700
15,600
61,200
16,700
65,200
20,000
Figure 3: Transition in the number of Japanese passengers on oceangoing cruise ships
Ships operated by foreign shipping companies
Ships operated by Japanese shipping companies
(Source) Surveyed by the Maritime Bureau, Ministry of Land, Infrastructure and Transport.

–18–
2006
Type of service Fiscal YearNumber of
vessels
General passenger liner service
2003 1,321
Special passenger liner service
2003 14
Passenger tramper service
2003 1,065
Table 6:Approximate numbers for routes and services by type of service
Number ofbusinessoperators
Number ofroutes
457 620
10 14
484 949
Total
2003 2,400
(Total ferry routes of the above)
2003 387
951 1,583
163 208
444456461454
609637641626
1,2981,3321,3071,327
899
10
11121213
11121215
512520497489
1,0391,047
997977
1,0761,1011,0851,052
964985967953
1,6591,6961,6501,616
2,3852,4452,4042,394
158162163161
187203202207
366388384392
2007200620052004
2007200620052004
2007200620052004
2007200620052004
2007200620052004
Type of service FiscalYear
General passenger liner service
2001
Special passenger liner service
2001
Passenger tramper service
2001
Table 7:Actual recorded number of passengers transported
(Note) Total figures may not tally with the totals of each figure due to rounding.
Number of passengerstransported
99.6 9.5
0.4 –3.1
10.8 –42.2
(Unit: million passengers; million man / kilometer; %)
Total
2001 110.8 0.6
Rate of increasefrom the preced-
ing year
Man / kilometertransported
3,836 –6.2
2 –11.5
168 –20.3
Rate of increasefrom the preced-
ing year
4,006 –6.9
94.092.097.3
100.0
2.2–5.4–2.70.4
3,8703,7083,864 3,747
4.4–4.03.1
–2.3
2005200420032002
2005200420032002
2005200420032002
2005200420032002
0.20.20.30.3
–9.1–12.0–16.7–25.0
1 123
–53.8–18.8–46.725.0
9.08.79.78.5
3.4–10.314.1
–21.3
154160158143
–3.81.3
10.5–14.9
103.2100.9107.3108.8
2.3–5.9–1.4–1.8
4,0253,8694,0243,893
4.0–3.83.4
–2.8

fiscal year), while in terms of vehicle-kilometers, 1,119 million for trucks (up 3.0% from thepreceding fiscal year) and 809 million for passenger cars / other vehicles (up 4.9% from thepreceding fiscal year).
• Public subsidy for the maintenance / improvement of shipping linesJapan has more than 6,800 islands, including Honshu, Hokkaido, Shikoku, Kyushu and
Okinawa’s main island, more than 400 of which are inhabited. Although remote island routes connecting islands to islands and islands to the mainland
play an important role as a means of transporting inhabitants of remote islands and their dailycommodities, the number of passengers continues to decline year after year, due to the rapiddecrease in population in rural areas and so forth, intensifying severe conditions for themanagement of ship operators providing services to remote islands.
For this reason, efforts are being made to maintain / improve these shipping services bygranting such ship operators subsidies to cover losses suffered from their management of theroute operation, based on the Act for Improvement of Sea Routes at Remote Islands. During fiscal2006, about 4,690 million yen was paid to 97 operators and 107 shipping services to cover suchlosses.
Moreover, from fiscal 2004 onward, in order to promote the installation of barrier-freefacilities on boats in services for remote islands, where societies are more rapidly aging than onthe mainland, it has been decided to subsidize 50% of the construction cost incurred for theinstallation of barrier-free facilities and in building ships for renewal, which will be in service onnavigation routes designated as eligible for subsidies or the cost of reforming vessels to installbarrier-free facilities on the same.
• Promotion of effort to install barrier-free facilities on passenger boatsIt has been decided to obligate all ships to secure an effective width of 80 cm or more for the
corridors, install hand-rails as well as elevators (for routes for boarding and leaving the shipranging to other deck boards) and so forth along one route or more for boarding and leaving theship to the barrier-free seats for passengers or space provided for wheelchairs, assuming thataged or physically disabled passengers are assisted by a helper or crew on the way. In addition, ithas been decided to obligate all vessels to secure an effective width of 120 cm and more forcorridors, install hand-rails, elevators (for inboard migration pathways ranging to other deckboards), space for the rotation of wheelchairs on the way and so forth along one route or more formoving inside ships from barrier-free seats for passengers or space for wheelchairs to inboardfacilities for passengers (rest rooms, restaurants, commissary depots and promenade decks),based on the assumption of unaided movement for aged or physically handicapped passengers asa general rule.
While the target represents about 500 passenger boats (an estimation based on an annualaverage of 50 boats built), about 50% of the total of 1,000, to be barrier-free by 2010, only 108passenger boats (11.5%) of 939 in total were actually barrier-free as of the end of March, 2007 onaccount of stagnant conditions in the construction of vessels for use, in turn resulting from theunfavorable performance of the passenger boat business in recent years, the increased costburden based on the impact of a sharp rise in the price of crude oil or otherwise and so forth .
3. Coastal ShippingCoastal shipping services accounted for 37.1% (in terms of ton-kilometers for the fiscal year
2005) of domestic cargo transport, transporting about 80% of steel, petroleum, cement and soforth, which are important basic industrial materials to support the national economy / nationallife of Japan.
–19–

As of April 1, 2006, the numbers of registered business operators and reported operatorswere 3,183 and 1,465, respectively, of which medium and small enterprises (those with capital of300 million yen or less or 300 employees or less) accounted for 99.6%.
The volume of cargo transported via coastal shipping in fiscal 2005 decreased by 3.3% fromthe preceding fiscal year in terms of ton-kilometers. Among major cargo commodities (in terms oftons), petroleum products continued to decrease for the third successive year, declining by 1.3%from the preceding fiscal year because they were affected by the energy conversion policy forpromoting energy saving, while cement increased by 1.8% from the preceding fiscal year due toan increase in the number of newly started housing construction projects.
Meanwhile, the shipping rates for coastal transport have been declining in recent years dueto the stagnant domestic economic climate, excess shipping space supply and so forth, althoughthey have shifted to an upward tendency for coastal cargo carriers since the second half of 2005.
–20–
Fiscalyear
197037,665
Table 8:Movements in cargo transport volume by transport facilities
○ Prepared, based on the “Land Transport Statistics Handbook” issued by the Ministry of Land, Infrastructure andTransport.
(Note) 1. The share (%) of each transport facility is indicated in parentheses.2. Excess baggage and mail are included in the air transport volume indicated.3. The figures for vehicles include those for mini-cars beginning in fiscal 1990.4. Fractions of 0.5 and over are counted as one unit, and smaller figures are disregarded.
For this reason, there may be cases where sub-totals do not add up to the grand total.
462,607 25,036
Coastalshipping
Vehicles Rail Air
12 525,319
Total Rail
63,031 74
Coastalshipping
151,243 135,916
Vehicles Air Total Rail
350,264252402 61729
Vehicles AirCoastalshipping
197545,205 19 47,058502,572439,286 18,062 152183,579 129,701 360,490
261406 80030
(7.17) (0.00) (18.00)(100.00)(88.06) (4.77) (0.02)(43.18) (38.80) (100.00)
(9.00) (0.00) (13.05)(100.00)(87.41) (3.59) (0.04)(50.92) (35.98) (100.00)
198050,026 33 37,428598,136531,795 16,282 290222,173 178,901 438,792
230444 87934
198545,239 54 21,919559,727504,805 9,628 482205,818 205,941 434,160
228455 89341
(8.36) (0.01) (8.53)(100.00)(88.91) (2.72) (0.07)(50.63) (40.77) (100.00)
(8.08) (0.01) (5.05)(100.00)(90.19) (1.72) (0.11)(47.41) (47.43) (100.00)
199057,520
200444,025 107
87
22,449
27,196677,626
556,939507,588
611,357 8,662 799
5,219
244,546 274,244
1,058218,833
546,785
327,632
314425 918
569,972430497 989
45
65
199554,854 96 25,101664,301601,657 7,693 924238,330 294,648 558,079
326435 963
(7.91)
49
(0.02) (3.94)(100.00)(91.14) (0.94) (0.19)(38.39) (57.48) (100.00)
(8.49) (0.01) (4.97)(100.00)(90.22) (1.28) (0.15)(44.72) (50.16) (100.00)
(8.26) (0.01) (4.50)(100.00)(90.57) (1.16) (0.17)(42.71) (52.80) (100.00)
200152,007
200344,554 103
102
22,794
22,193615,798
573,426523,407
557,823 5,867 994
5,360
244,451 313,072
1,027218,190
580,710
321,862
378470 975
563,873425490 997
56
62
200249,725 100 22,131589,433533,949 5,659 991235,582 312,028 570,732
391474 991
(7.77)
58
(0.02) (4.04)(100.00)(91.28) (0.93) (0.18)(38.69) (57.08) (100.00)
(8.45) (0.02) (3.82)(100.00)(90.59) (0.95) (0.17)(42.10) (53.91) (100.00)
(8.44) (0.02) (3.88)(100.00)(90.59) (0.96) (0.17)(41.28) (54.67) (100.00)
Tons of cargo transported(ten thousand tons)
Ton-kilometers transported(million ton-kilometers)
Average transported distance(kilometers)
200542,615 108 22,813544,558496,588 5,247 1,075211,576 334,979 570,443
435497 99668(7.83) (0.02) (4.00)(100.00)(91.19) (0.96) (0.19)(37.09) (58.72) (100.00)

For coastal tankers, however, they still remain unchanged.
• Revision of the Coastal Shipping Business LawIn fiscal 2005, the Coastal Shipping Business Law was partially revised, with a view to
enhancing coastal transportation security by strengthening the organizational control withinshipping operators, in respect of points such as obligations for the business operator a) to preparesafety control rules and make related notifications, b) to nominate an officer responsible forsafety control and make related notifications, c) as well as the government, to discloseinformation on safety, and d) to strive for improved transport safety (scheduled to beimplemented in October, 2006).
• Smooth and steady implementation of provisional coastal shipping measuresAfter discontinuing the project involving adjusting the available tonnage by the scrap-and-
–21–
Fiscal year
Tons transported (thousand tons)
197019751980198519901995199719981999200020012002200320042005
376,647452,054500,258452,385575,199548,542541,437516,648522,602537,021520,067497,251445,544440,252426,145
Table 9:Transition in the volume of cargo transported by coastal shipping
○ Compiled from the “Yearly Statistical Report of Coastal Shipping Transport” issued by the Ministry of Land, Infrastructureand Transport and others.
(Note) (1) Since the survey method was changed in fiscal 1974, the actual recorded figures for fiscal 1970 were estimated usingcalculations striving for consistency with the survey method.
(2) The comparison to the preceding year for the years before 1997 is that to the preceding year shown
100.0120.0132.8120.1152.7145.6143.8137.2138.8142.6138.1132.0118.3116.9113.1
–112.697.290.4
127.195.498.795.4
101.2102.896.895.689.698.896.8
Comparison to1970
Comparison tothe preceding
year
Ton-kilometers transported (hundred millionton-kilometers)
1,5121,8362,2222,0582,4452,3832,3702,2702,2942,4172,4452,3562,1822,1882,116
Comparison to1970
100.0121.4147.0136.1161.7157.6156.7150.1151.7159.9161.7155.8144.3144.7139.9
–95.498.492.6
118.897.599.595.8
101.1105.4101.296.492.6
100.396.7
Comparison tothe preceding
year
4

build formula, implemented since 1966 as a measure to counter excessive tonnage, a project ofprovisional measures for coastal shipping was introduced in May 1998 with a view to revitalizingthe coastal shipping business.
With regard to the state of implementation, subsidies were granted for 1,630 vessels witheligible tonnage of 1,860 thousand tons, amounting to 122.7 billion yen, while 52.1 billion yenwas contributed to the government from the owners of 668 vessels with eligible tonnage of 1,580thousand tons (in terms of the approved amount as of March, 2007).
4. Port Transport
• Current state surrounding Japanese portsThe transition in cargo movement, in relation to the ocean transportation of containers
among Asia / North America / Europe, was about 35.0 million TEUs for 2004, against a total ofabout 11.0 million TEUs for 1990. This picture reveals a noteworthy increase in the volume ofcontainers transported involving Asia, as the increase in North America–Asia, Europe–Asia andwithin the Asia region represents about 11, 10 and 9 million TEUs respectively, while that inNorth America–Europe is by about 3 million TEUs.
• Current state of the port transport businessThe number of licenses, permits and operators of the port transport business at the 93 ports,
designated by the Port Transport Business Law nationwide as of the end of March, 2006, is asfollows. In addition, medium and small enterprises account for about 89 %, representing a veryhigh percentage.
• Trends of port transport volumePort transport volume (the volume of cargo loaded and unloaded onto and from ships) was
–22–
1990 1991 1992 1993 1994 1995 1996 1997 1998 1999 2000 2001 2002 2003 2004 2005
1600
1400
1200
1000
800
600
400
200
0
100
90
80
70
60
50
40
30
20
0
1015 1513
10 9 8 8 75 5 4 3 3 2 2 2
26 2522 22
20 19 18 1714 13 13
11 11 11 12 12
755
787
768
759
783
785
802
812
767
803
831
807847
845889
9131,047
1,077
1,055
1,0551,106
1,122
1,148
1,160
1,088
1,1361,195
1,1671,232
1,2801,326
1,353
Figure 5: Transition in port transport volume
Volume of cargo loaded onto and unloaded from ships; Volume of cargo handled along the shore;(million tons)
Volume of cargo transported on barges / rafts;(million tons)
Volume of cargo loaded onto and unloaded from shipsVolume of cargo handled along the shoreVolume of cargo transported on bargesVolume of cargo transported on rafts
(Fiscal year)

about 1,353 million tons, up about 1% from the preceding fiscal year, on a nationwide basis infiscal 2005.
• Efforts for deregulation in the port transportDeregulation was implemented in May, 2006, replacing the license system for port transport
business in local ports other than the nine main ports (Ports of Chiba, Keihin, Shimizu, Nagoya,Yokkaichi, Osaka, Kobe, Kanmon and Hakata) with the permission system (abolition of supplyand demand adjustment regulations) and the transport charges / fee approval system with theadvance filing system and so on.
Chapter 2: Shipbuilding and Ship Machinery Industries
1. Shipbuilding IndustryIn the world shipbuilding market, the demand for ships to be newly built, mainly tankers
and bulk carriers, is following a steady upward trend with the increase in maritime transport,due to the recent expansion of imports by China of bulk cargo, including iron ore as well as crudeoil and so on in the background. The total global tonnage of newly built vessels in 2006 wasrecorded at 52.09 million gross tons, once again reaching a historical record high, just like lastyear. Due to this high demand for shipbuilding and so forth, ship prices are rocketing and thepeak is being maintained.
On the other hand, international competition is expected to further intensify in future,because China is capitalizing on its low labor cost to expand its shipbuilding capacity and makeaggressive capital investment, currently accounting for about 10% of the tonnage of ships built inthe world.
–23–
1980 1981 1982 1983 1984 1985 1986 1987 1988 1989 2000 2001 2002 2003 2004 2005 20061990 1991 1992 1993 1994 1995 1996 1997 1998 1999
5,500
5,000
4,500
4,000
3,500
3,000
2,500
2,000
1,500
1,000
500
0
46.6
4.022.6
23.9
49.6
5.5
22.40.2
22.3
48.5
8.3
21.30.8
21.01,310
1,693 1,682
41.9
9.7
25.11.2
22.1
53.0
8.0
18.3
18.9
1.8
52.3
14.4
15.10.9
17.2
48.5
21.6
12.21.5
16.1
46.6
17.016.22.4
17.9
37.0
29.1
15.72.515.9
40.6
23.4
14.82.5
18.7
43.0
21.8
17.9
2.315.0
45.3
21.7
18.0
1.913.1
40.7
25.6
18.3
1.913.5
43.5
22.7
18.2
3.612.0
44.0
21.5
16.3
5.512.7
41.1
27.5
16.8
4.210.4
39.3
28.6
19.2
4.38.7
38.7
32.2
15.7
5.87.5
40.3
28.5
17.5
5.88.0
39.7
32.5
14.9
5.76.8
37.9
38.6
12.7
5.25.6
38.4
37.1
13.2
5.85.5
35.8
38.8
12.1
6.6
6.6
35.1
37.9
10.2
10.4
6.4
36.1
36.8
8.3
11.6
7.2
35.0
37.7
8.7
34.8
36.2
9.4
13.8
4.9 14.8
4.9
1,591
1,833 1,8161,685
1,2261,091
1,324
1,589 1,610
1,8632,054 1,967
2,265
2,584 2,554 2,546
2,782
3,170 3,1293,338
3,613
4,017
4,697
5,209
Figure 6: Transition in the tonnage of newly built ships in the world
10,000 gross tons
OthersChinaEuropeSouth KoreaJapan
(at the peak time)Calendar year
(Note) 1. Compiled from the materials of Lloyd’s (covering ships of 100 gross tons or more). 2. In terms of ships completed 3. Numbers indicated in the bar graph represent the composition ratio.

• Trends in the Japanese shipbuilding marketThe Japanese shipbuilding industry, like that of Korea, accounts for just under 40% of the
world production of newly built ships. The profitability of ships built before the middle of fiscal2006 had been low, since related orders were accepted during a period of low prices, and becauseof the increased prices of materials such as steel products also affecting operations; however,since the level of unfilled orders remains at a high level due to increased global demand for newships and the fact that orders for ships now under construction are those for which orders wereaccepted at higher ship prices, business conditions can be said to have changed for the better. .
The serious situation had continued for a long time for medium and small shipbuilders, whosupport coastal shipping and fishing boats, following stagnation in coastal vessel demand, causedby the persistently low level of freights / charter fees and so on, and the decreasing number offishing boats, due to the international reinforcement of fishing regulations. However, the demandfor shipbuilding is expected to climb in future, since the tonnage of newly built ships (in terms ofthe number of ships) in fiscal 2006 has increased in comparison to that of fiscal 2005 and thewillingness of coastal shipping operators to construct new coastal vessels to replace old ones isrecently recovering, following an increase in the volume of marine transport.
• Promotion of international cooperationSince the international shipbuilding market, mainly for large-sized oceangoing ships, is the
only global market, competition among business operators from each country is fierce and thepolicy of a country and order acceptance practice of shipbuilders and so on directly affects thecompetitive environment in the international shipbuilding market. However, since competitiveconditions are not necessarily identical, due to the existence of government subsidies and so on indifferent countries, multilateral policy coordination is both necessary and vital for the sound
–24–
160,000
140,000
120,000
100,000
80,000
60,000
40,000
20,000
0
300
250
200
150
100
50
0’89 ’90 ’91 ’92 ’93 ’94 ’95 ’96 ’97’98 ’99 ’00 ’01 ’02 ’03 ’04 ’05 ’06 ’89 ’90 ’91 ’92 ’93 ’94 ’95 ’96 ’97’98 ’99 ’00 ’01 ’02 ’03 ’04 ’05 ’06
Figure 7: State of production of medium- and small-sized shipsNumber of Ships
In terms of the number of ships In terms of gross tons
Number of ships completed
Number of ships ordered
Order backlog
Number of ships completed
Number of ships ordered
Order backlog
Calendar year Calendar year
(Note) 1. Source: “Survey of the State of Construction of Small-Sized Ships” issued by the Ministry of Land, Infrastructure and Transport. 2. Gross tons: Those of ships of 100 GT – less than 2,500 GT 3. Figures from 47 companies with actual record of construction 4. Order backlogs: As of the end of December
GT

development of the shipbuilding industry. Since it is foreseen that, in future, the competitiveenvironment in the international shipbuilding market will intensify due to expansion of facilitiesin the newly developing shipbuilding countries and so forth, the importance of internationalpolicy coordination is further increasing. Consequently, Japan has decided to strive for thedevelopment of a common market perception and coordination of measures through bilateral andmultilateral discussions and so on at a government level.
2. Ship Machinery Industries
The value of products produced by the Japanese ship machinery industries in 2005 recordeda large increase, amounting to 975.7 billion yen (up 11.1% from the preceding year). With respectto diesel engines for ships, both the total value and engine output of diesel engines produced ineach category increased; those of large-sized diesel engines (with engine outputs of 10,000horsepower or more) to 114.5 billion yen (up 23.5% from the preceding year) and 7.11 millionhorsepower (up 20.5% ), those of medium-sized diesel engines (between 1,000 and 10,000horsepower) to 47.5 billion yen (up 7.5%) and 2.62 million horsepower (up 9.6%), and those ofsmall-sized diesel engines (with engine outputs of less than 1,000 horsepower) to 37.3 billion yen(up 3.9%) and to 3.84 million horsepower (up 5.8%).
The export amount of ship machinery products in 2005 was 296.1 billion yen, up 9.3% fromthe preceding year, because export sales to Asia and the European region remained very strong.On the other hand, the import amount decreased to 28.1 billion yen, down 26.2% from thepreceding year.
–25–
0
200,000
400,000
600,000
800,000
1,000,000
1,200,000
1995 1996 1997 1998 1999 2000 2001 2002 2003 2004 20050
5,000
10,000
15,000
20,000
25,000
30,000
35,000
40,000
45,000
50,000
Figure 8: Transition in the amounts of products of Japanese ship machinery industries produced / exported and imported
Million yen Thousand GT
Amount of products producedTonnage of newly completed ships in Japan (thousand GT)
Amount of products exportedTonnage of newly completed ships in the world (thousand GT)
Amount of products imported (by shipbuilders)
Source: From: “Yearly Statistical Report of the Ship Machinery Industries”; “Statistics of Lloyd’s” (for ships of 100 GT and larger).Note: Imported amounts show the amount of products imported by shipbuilders.

3. Development and Practical Application of New Technologies
At present, the targeted trajectory for Japan’s marine industrial technology, which has facedup to the major challenge of strengthening its international competitiveness, is the reinforcementof explicit efforts to develop the technology for constructing a physical distribution system neededin the 21st century, dealing with the problems of environment / energy, contributing to the highlyadvanced use of the ocean, and opening up new undeveloped areas with creative technology, andso on, in which shipbuilding technology should play a pivotal role. To achieve such goals, thedevelopment / spread / practical use of ships and other items exploiting new technologies areunderway and promoted.
• Development of Natural Gas Hydrate (NGH) CarrierSince Natural Gas Hydrate (NGH = a solid material in which molecules of natural gas are
surrounded by those of water in a basket-like state) transforms itself into the stable solidmaterial at minus 20˚C, it can help limit the initial investment required in manufacturing plantsand transporting ships and so forth, in comparison to liquefied natural gas (LNG), thattransforms at minus 162˚C, meaning NGH can enable the development of many medium- andsmall-sized gas fields that are left undeveloped in Oceania and the South East Asian region.Consequently, NGH is considered to be a promising technology to cope with future expandeddemand.
This development targets optimization of the system required for the marine transport ofNGH and so forth, to complete the NGH transportation chain, consisting of “manufacture”,“marine transport” and “regasification”, and to contribute to securing the stable future supply ofnatural gas.
It is decided to conduct, in fiscal 2007, studies to develop cargo hold systems, cargo handling
–26–
450,000
400,000
350,000
300,000
250,000
200,000
150,000
100,000
50,000
01995 1996 1997 1998 1999 2000 2001 2002 2003 2004 2005
Figure 9: Transition in the amount of ship machinery industry products produced by item
Unit: Thousand yen
Marine TurbinesPropeller shafts / propellers
Marine internal combustion enginesNavigation apparatuses
Marine boilers
Outfittings
Marine auxiliary machineriesOthers
Mooring / Cargo handling machinesSpare parts / Accessories

systems and so forth.
• Development of technology to reduce the environmental burden originatingfrom ships
The Annex VI to the International Convention for the Prevention of Pollution from Ships,which regulates the discharge of nitrogen oxides (NOX) and sulfur oxides (SOX) contained in gasemitted from ships, was implemented in May, 2005. Subsequently, the International MaritimeOrganization (IMO) commenced the study of secondary regulations to prevent air pollution;hence substantial regulatory reinforcement is anticipated.
The Maritime Bureau is working, as part of a 5-year plan, from fiscal 2007 onwards, on theresearch and development of a new technology to reduce the environmental burden as part of the“Comprehensive Measures to Reduce the Burden on the Environment Originating from Ships”.
Specifically, the Bureau is conducting, while also giving consideration to energy saving,research and development into ‘environmentally-friendly’ diesel engines for ships. They includethe development of technology for the after-treatment systems of emitted gas for ships, in orderto significantly reduce the NOX contained in gas emissions from the same, a combustion analysisof existing ships, and the development of methods to improve the volume and timing of fuelinjections and so on for reducing NOx and so forth.
• Research and study of a coordinated navigation support systemSince 2007, research and study has got underway to construct a coordinated navigation
support system that enables ships to coordinate with others by conveying messages to thempromptly and unfailingly, concerning their own steering intention.
• Practical use of megafloatsResearch and development were conducted from fiscal 1995 to 2000 into megafloat, a
product featuring the latest in cutting-edge technology from Japan, and including features suchas earthquake-resistance and environmental-friendliness, to promote the smooth construction ofsocial capital and capitalize on the use of ocean space.
With regard to megafloats, in fiscal 2001-2002, the Study Meeting for Researching the Useof Megafloat Airports and the Conference for the Assessment and Selection of ConstructionMethods for the Haneda Airport Re-Expansion Project concluded that a floating airport could beconstructed. At the same time, the “Demonstration Test of the Function of the MegafloatInformation Base” demonstrated that it could be used as an economical and highly reliableinformation base.
The Ministry of Land, Infrastructure and Transport promotes the practical use and spreadof megafloats, for which various uses are conceived, such as port facilities, including a containerterminal, energy base and leisure facilities, in addition to an airport and information backupbase.
• Practical use of advanced ship safety control systemsFrom the viewpoint of enhanced national sentiment toward safety and the environment as
well as reinforcement of Japan’s industrial competitiveness, improvements of safety andefficiency in the distribution of goods are also strongly demanded in coastal shipping.
For this purpose, for four years from fiscal 2001, the Maritime Bureau had conductedresearch and development into an “Advanced Ship Safety Control System” to conduct a diagnosisinto the state of marine engines, as well as prognosis of accidents and so on, with land-basedsupport. Since fiscal 2005, it has been working on environmental improvements relating to thespread of this system.
–27–

Chapter 3: Section of Seafarers
1. Current State of Seafarers and the Tasks Involved
• Status of the number of seafarers, etc.The number of seafarers (including reserve seafarers), having peaked at about 278 thousand
in the year of 1974, has continued to decline ever since, in both categories of oceangoing shipsand fishing boats. The factors behind this decline in both categories include the increasinglysevere international competition in the area of ocean transport, and a falling number of fishingboats, due to more stringent international reinforcement of fishing regulations and so on.
With respect to the age-related composition of seafarers, the middle-aged and elder middle-aged (over 45 years old) accounted for 55% in 2006, as compared to 49.1% in 1995, showing acontinued tendency toward aging.
2. Education / Employment of Seafarers
• Education / development of seafarersThe Marine Technical Education Agency was inaugurated on April 1, 2006, unifying the
Marine Technical College and the School for Seafarers Training, because it was necessary toproceed with a review of the organization / operation of seafarer training institutes in order torespond more accurately to the needs of the maritime industry as a whole, while targeting moreefficient and effective operation.
–28–
1974 1980 1985 1990 1995 2001 2002 2003 2004 2005
Number of seafarers onoceangoing vessels
56,833 38,425 30,013 10,084 8,438 4,233 3,880 3,336 3,008 2,625 2,650
Number of seafarers oncoastal vessels 71,269 63,208 59,834 56,100 48,333 35,606 32,860 31,886 30,708 30,762 30,277
Number of seafarers onfishing boats
128,831 113,630 93,278 69,486 44,342 34,267 32,897 31,185 29,099 28,444 27,347
Others 20,711 18,507 17,542 16,973 20,925 21,541 20,765 19,801 20,077 19,926 16,907
Total 277,644 233,770 200,667 152,643 122,038 97,648 92,404 88,211 84,896 83,762 79,187
Surveyed by the Maritime Bureau (Up to 2005, figures are based on Seafarer Statistics.)
The number of seafarers is the total of that of crew and reserve seafarers employed by Japanese ship-owners.
The number of others is that of seafarers manned on tugboats, barges and government and other public office ships.
The number of seafarers excludes that of foreign seafarers. (Numbers were modified accordingly, tracing them back into the past.)
(Unit: person)
0
30,000
60,000
90,000
120,000
150,000
1974 1980 1985 1990 1995 2001 2002 2003 2004 2005 2006
Persons
Number of seafarers on oceangoing vesselsNumber of seafarers on coastal vesselsNumber of seafarers on fishing boatsOthers
○
○
○
○
Table 10: Transition in the number of Japanese seafarers

• Measures for the employment of seafarersGiven the increasing need for the smooth transfer of the seafaring workforce among
business operators, measures are taken to promote the same; reducing the mismatch between theneeds of jobseekers and employers by ensuring the former have a workplace suited to theirability, where they can make the best use of their skills.
3. Improvement in the Working Environment
• Efforts to secure adequate labor conditions and manning standardsIn order to secure adequate labor conditions and working environment for seafarers, taking
into consideration the particularity of labor on the sea, the necessary standards for the laborconditions such as working hours, holidays and wages as well as the manning standards areestablished under the Seafarers Law and so forth, while a review is conducted to comply with theupdated needs.
With a view to securing systems required for safe navigation, such as the number of ratingforming part of a navigational watch, an obligation has been imposed as from April, 2006 to insistthat at least one seafarer in possession of a certification of at least 6th-glade maritime officer(navigation), be posted as the officer on navigational watch on board sea-going ships, excludingthose of less than 20 gross tons and fishing vessels, which usually navigate in inland water or inwaters within, or closely adjacent to, sheltered waters or area where port regulations apply . Inaddition to this obligation, to promote the acquisition of the 6th-glade maritime officercertification, measures are taken to facilitate increased opportunities for acquisition, such as theunified implementation of training program and certification course, an expansion of the limit onthe number of those taking such program courses, flexible implementation of extra tests and soon.
• Safety and health at work as well as disaster prevention activities for seafarersIn the 2007 implementation plan concerning disaster prevention for seafarers, it was
decided to strive to promote this cause, prioritizing the detailed publicity of measures intended toreduce fatal disasters, such as those preventing “falls into the sea” and so on, prevention offrequent incidents of “falling” and “getting pinched”, prevention of disasters involving death andinjury in handling an increase in the number of aged seafarers, improvement in guidance for thesafety and health of young seafarers, prevention of lifestyle-related diseases and prevention ofhealth hazards caused by asbestos.
4. International Cooperation in the Area of Seafarers
Japan is contributing significantly toward establishing policies and training / educationsystems for seafarers in developing countries as well as international progress in maritimeeducation, making wide use of its knowledge on seafarer administration and training / educationfor international cooperation. In addition, Japan is promoting coordination with respect topolicies for seafarers through the exchange of information and opinions with ASEAN countries.
–29–

Chapter 4: Assurance of Maritime Safety / Security and Conservation ofthe Environment
1. Measures to Secure Maritime Safety
• Securing safety for shipsThe Maritime Quality Management System (QMS), a quality control system governing
operational execution in individual departments for ship inspection, the registration andmeasurement of tonnage and that for executing the supervision of foreign ships was constructed,with system operation having commenced in December, 2005, and ISO9001 certification obtainedin June, 2006.
• Securing safe navigation via a licensing system and so onShip-owners and so on must have ship officers on board, complying with shipping crew
staffing standards based on the size of the ship, navigation area etc. As of the end of March,2007, the total of those holding maritime technical officer’s licenses numbered about 370,000.
The piloting system is a system that pinpoints spots where shipping traffic is congested,while dangerous paths of marine traffic are designated as pilotage zones (35 zones nationwide)and a pilot licensed by the Minister of Land, Infrastructure and Transport (There were 643 pilotsnationwide as of the end of March, 2007. In fiscal 2006, 38 people obtained the pilot’s license.)must be on board any ship traversing any of such pilotage zones and guide the ship safely andsmoothly. By securing such a system to constantly provide the user with a piloting service, inwhich the efficiency / adequacy of the piloting operation is enhanced, the education for nurturingpilots is improved / reinforced and so forth, which is intended to further improve the safety ofship navigation.
2. Measures to Ensure Security
• Law for the Security of Ships in International Navigation and Port FacilitiesThe owners of ships engaged in international navigation are obligated to prepare ship
security rules, containing the items necessary to ensure security, and obtain the relevantapproval from the Minister of Land, Infrastructure and Transport. Once obtained, the shipsecurity certificate issued by the Minister of Land, Infrastructure and Transport shall be keptwithin the ship. As of April 1, 2007, ship security certificates had been granted to 185 Japanese-flag vessels.
With regard to port facilities, the managers of international port facilities have beenobligated to prepare pier security rules, containing the items needed to ensure security. As ofJuly 1, 2006, pier security rules had been prepared for 127 ports nationwide.
3. Measures Toward Environmental Conservation
• Efforts aiming for international regulation with respect to the prevention ofpollution from ships
In 1983, Japan joined the “International Convention for the Prevention of Pollution fromShips, 1973, as modified by the Protocol of 1978 relating thereto” (MARPOL Convention), andestablished a domestic law, “Law Relating to the Prevention of Marine Pollution and MaritimeDisaster” to comply with the same.
–30–
• Efforts targeting international regulation with respect to the control of ballastwater
As the “International Convention for the Control and Management of Ships’ Ballast Waterand Sediments, 2004” (Ballast Water Management Convention) was adopted at the IMO inFebruary 2004, ballast water processing equipment has actively been developed in manycountries worldwide, including Japan.
In addition, over three years from fiscal 2003, Japan supported the research anddevelopment of a new type of vessel (non-ballast water ship) capable of navigating safely withoutcarrying ballast water as a drastic measure to combat environmental problems resulting fromballast water in transit. As the results, the inclined bottom hull form was developed. Moreover,as it has been confirmed that the non-ballast ship performs satisfactorily in comparison with atraditional ship, efforts to ensure the practical use and spread of the new hull form willhenceforth be made.
• Efforts to solve the problem of oil pollution caused by shipsDue to the partial revision of the “Law on Liability for Oil Pollution Damage,” an obligation
was introduced to confirm the state of insurance coverage for incoming ships, whereby thecertificate issued by the Ministry of Land, Infrastructure and Transport would have to be keptwithin the relevant ship in principle. Moreover, the state of insurance coverage would have to bereported in advance when entering a port. In addition, in cases where damage involving fuel oilpollution occurs, the ship-owner etc. will now be liable without fault in principle.
4. Countermeasures Against Asbestos
As the “Act on Asbestos Health Damage Relief” came into effect on March 27, 2006, thedecision was made to work for a prompt and stable achievement of relief at the expense ofbusiness operators, the government and local authorities as a whole, to avoid any gap emergingamong those who suffer from asbestos-related health hazards.
At present, in Japan, the new use of material containing asbestos on ships is totallyprohibited. In addition, from the standpoint of preventing such health hazards caused byasbestos, efforts are made to provide seafarers working on board with thorough guidance in theshape of warnings and preventive measures when handling asbestos. At the same time, healthconsultations and so on are provided to those who were previously engaged in such work.
5. Port State Control (PSC)
In Japan, the PSC is implemented by 43 local offices and 125 PSC officers (as of fiscal 2007).In addition, Japan is implementing PSC within the framework under the Memorandum ofUnderstanding on Port State Control in the Asia-Pacific Region (Tokyo MOU), in cooperationwith neighboring countries, and is also actively contributing to its technical cooperation program.
–31–

Chapter 5: Measures to Increase the Utilization of Small Boats andPromote Maritime Activities
• Comprehensive measures for promoting the appropriate use of small boatsSince marine leisure has now become one of the leisure activities for citizens, and, in
addition, increased opportunities to enjoy rental boats or the nationwide deployment of “seastations” and so on, has increased the familiarity of all people with water, the demand for marineleisure is expected to further increase. In order to promote the further use of small boats, effortsmust be made to further improve the usage environment and thus deal with related problemssuch as a shortage of mooring sites, spread of the recycling system of FRP boats and an increasein the insurance coverage ratio for pleasure boats. In view of the importance of efforts, whichtake the actual circumstances of each region into consideration for attaining such goals, each ofthe district transport bureaus shall reinforce the coordination, information exchange and so onamong related organizations, including local authorities, by holding a “Boat Use PromotionMeasures Liaison Conference”, and, at the same time, create a “Pleasure Boat ConsultationDesk” to widely provide general users with related information and so on. In addition, byobligating everyone on board a personal water craft to wear life jackets and so on, and thoroughpublicity / enlightenment on the licensing system for small boats, it is intended to promote thesafe and sound use of small boats.
–32–