Embed Size (px)
Citation preview
Impact of COVID-19 in Mumbai 1
SURVEY REPORT
Report on Impact of COVID-19 in Mumbai Citizen Survey on Livelihood, Health, Education, Housing and Transport
January 2021
Impact of COVID-19 in Mumbai 2
Table of Contents I. Foreword ..................................................................................................................................................................4
II. Acknowledgment ....................................................................................................................................................6
III. Survey Methodology ..............................................................................................................................................7
IV. Highlights ................................................................................................................................................................8
V. Detailed Tables ..................................................................................................................................................... 15
A. Impact of COVID-19 on Livelihoods in Mumbai .................................................................................................. 15
Table 1: Gender wise Impact of COVID-19 Lockdown on Jobs ............................................................................... 15
Table 2: SEC wise Impact of COVID-19 Lockdown on Jobs ...................................................................................... 15
Table 3: Age wise Impact of COVID-19 Lockdown on Jobs ..................................................................................... 16
Table 4: Occupation wise Impact of COVID-19 Lockdown on Jobs ......................................................................... 16
Table 5: Occupation wise Type of Impact of COVID-19 Lockdown on Jobs ........................................................... 17
Table 6: Impact of COVID-19 Lockdown on Businesses .......................................................................................... 18
Table 7: Impact on Daily Incomes due to COVID-19 Lockdown .............................................................................. 18
Table 8: Expenditure and Savings in the Lockdown ................................................................................................ 19
Table 9: Families who had Unemployed Members Looking for Job by Occupation .............................................. 19
Table 10: Respondent’s perception on Likelihood to find a job in the Future ....................................................... 20
Table 11: Respondent’s Reasons to Migrate Out from Mumbai ............................................................................ 20
B. Impact of COVID-19 on Housing and Transport in Mumbai ............................................................................... 21
Table 12: Perception of Physical Distancing ............................................................................................................ 21
Table 13: Impact of COVID-19 on Housing Rent Payments..................................................................................... 21
Table 14: Gender wise Work from Home Preferences of Respondents ................................................................. 22
Table 15: SEC wise Work from Home Preferences of Respondents ....................................................................... 22
Table 16: Preferred Mode of Transport to Workplace Before and After Pandemic .............................................. 22
C. Impact of COVID-19 on Health in Mumbai .......................................................................................................... 23
Table 17: Type of Health Facility Availed in case of COVID-19 ............................................................................... 23
Table 18: Satisfaction with Health Facility Availed in case of COVID-19 Treatment ............................................. 23
Table 19: Whether Admitted in Hospital in case of COVID-19 ............................................................................... 24
Table 20: Amount Spent on Treatment of COVID-19 .............................................................................................. 24
Table 21: Source of Treatment Cost in case of COVID-19 ....................................................................................... 24
Table 22: Difficulty faced in Accessing Health Care for Non-COVID Health Services during Lockdown ............... 25
Table 23: Difficulty faced in Accessing Diagnostic Services for Non-COVID Patients during Lockdown ............... 25
Impact of COVID-19 in Mumbai 3
Table 24: Public vs Private Health Facilities used During the Pandemic ................................................................ 26
Table 25: SEC wise Public vs Private Health Facilities During the Pandemic.......................................................... 26
Table 26: Mental Health of Respondents during COVID-19 Lockdown .................................................................. 27
Table 27: Discussing about ones’ Mental Health with Others ................................................................................ 27
Figure 1: Reasons for not going to Psychiatrist ....................................................................................................... 28
D. Impact of COVID-19 on Education in Mumbai .................................................................................................... 29
Table 28: Satisfaction and Preference for Online Education .................................................................................. 29
Table 29: Internet Connectivity for Online Education ............................................................................................ 29
Figure 2: Response in Case of One Device and More than One Student At Home ................................................ 30
Table 30: Internet Related Disruptions Faced in Online Education During Lockdown .......................................... 30
Figure 3: Ability of Children to Concentrate in Online Classes ............................................................................... 31
Figure 4: Impact of Online Classes on Health of Children ....................................................................................... 31
Table 31: Number of Hours Spent in Online Education During Lockdown ............................................................. 32
Table 32: Schools Performance in Online Education during Lockdown ................................................................. 33
Figure 5: Perception of Learning Capabilities of Students in Online Education ..................................................... 34
Table 33: Tuitions during Lockdown ........................................................................................................................ 34
Table 34: Online Evaluation during Lockdown ........................................................................................................ 35
Table 35: Preference for Reopening of School ........................................................................................................ 35
VI. Annexure ............................................................................................................................................................. 36
Impact of COVID-19 in Mumbai 4
I. Foreword
Mumbai city has always been known for the resilience of its people, in the fighting spirit of the residents on the
face of adversity. The COVID-19 pandemic and the lockdown that followed is an apt example. The drastic changes
in the socio-political and economic milieu of Mumbai caused by the pandemic drove the intent for conducting a
household survey to better analyse its impacts. This report, presents the findings of the household survey
commissioned by Praja to Hansa Research, in some of the key areas of livelihood, health, education, housing and
transport.
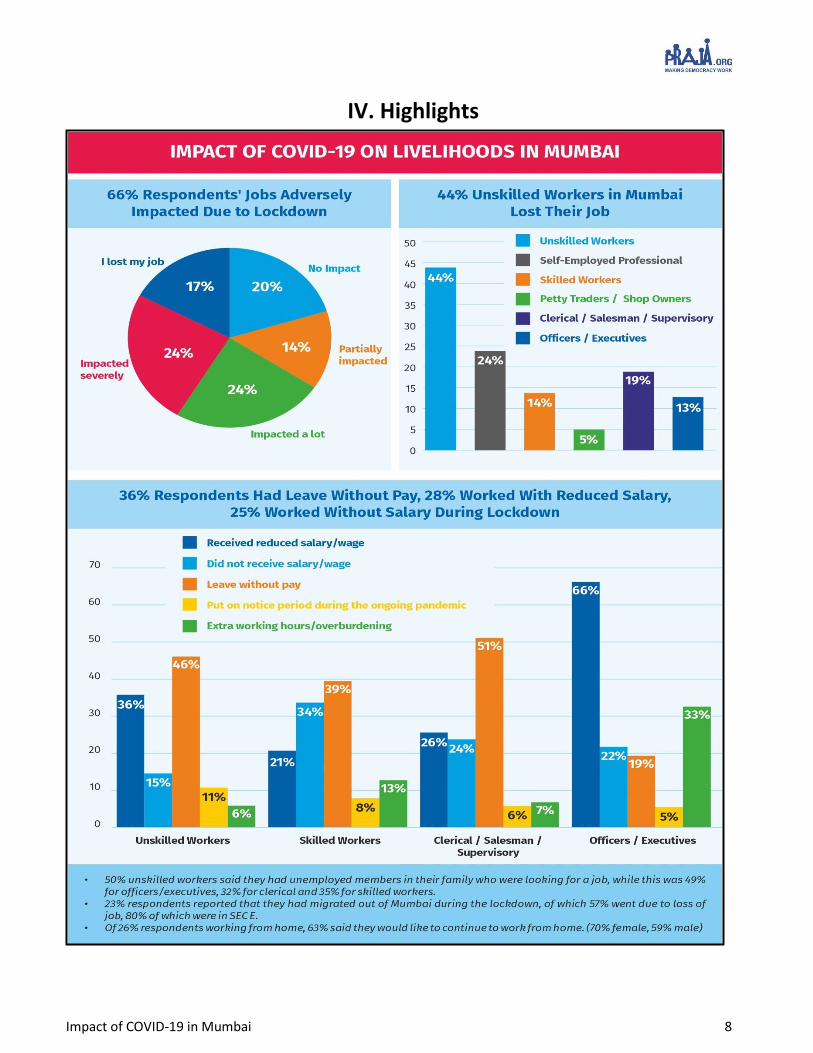
Although life in the maximum city is slowly drawing back to normalcy, it will be long before the adverse impacts
of the lockdown on its millions are eased. Livelihood and employment across sectors has been worst hit. Two of
three respondents of Praja’s survey said that their livelihood was adversely impacted. A breakup of those
adversely impacted shows that 36% had leave without pay, 28% worked with reduced salary, 25% worked
without salary and 13% had extra working hours or were otherwise overburdened.
9% of respondents from socio-economic class A (higher SEC) lost their job, while this was a much higher 47% for
the lowest SEC E. 80% unskilled workers in the city had a major impact on their job due to the ongoing COVID-19
pandemic, of which 44% lost their jobs. Further, Mumbai which is known for its in-migration from across the
country mainly for livelihood saw a huge outmigration during the pandemic. Of the 23% respondents who
reported that they had migrated out of Mumbai during the lockdown, 57% went due to loss of job (80% of which
were in SEC E.) It is therefore evident that while the pandemic has impacted livelihoods across sectors, the lower
socio-economic sections engaged in informal employment have been the worst affected.
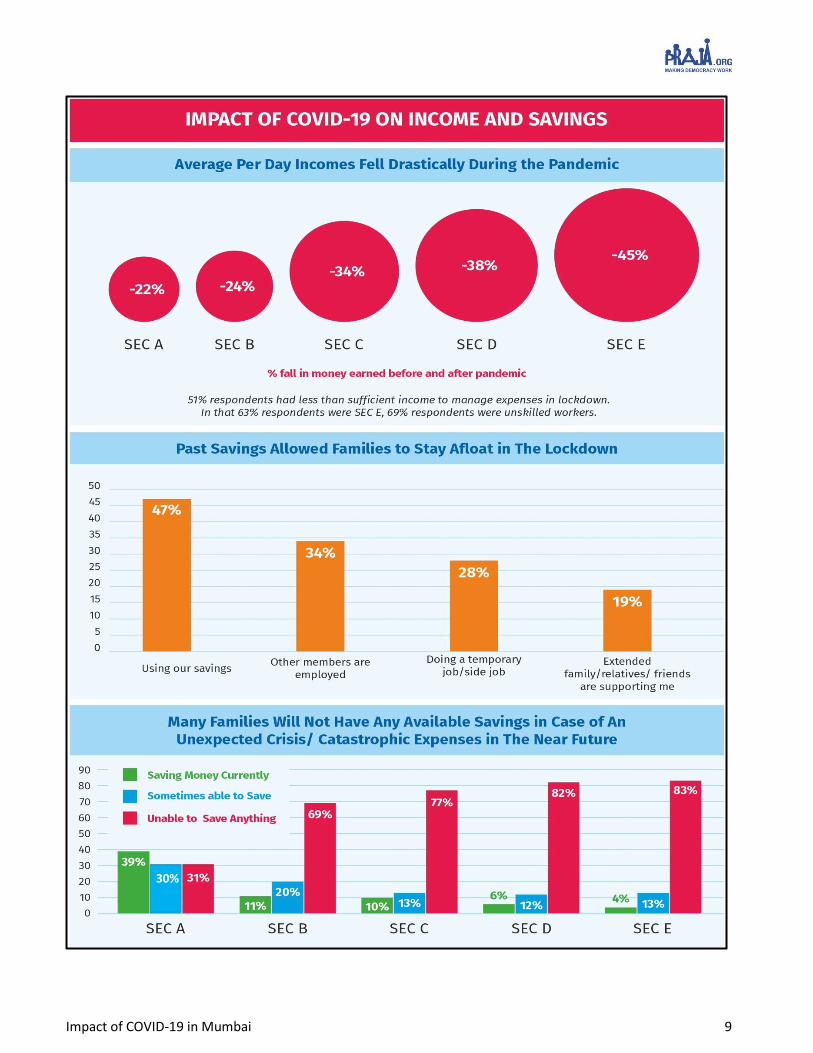
The adverse impact on employment has led to a steep fall in incomes and the ability to save financial resources.
Here again, people in the lowest socio-economic classes are the most affected- daily income of respondents fell
by 22% in SEC A and 45% in SEC E. While 47% respondents said they used savings to meet family needs during the
lockdown 71% said that they were not able to save any money in the current lockdown period. This shows that
while past savings allowed families to stay afloat in the lockdown, many families will not have any available
savings in case of an unexpected crisis/ catastrophic expenses in the near future.
This is especially important in the case of healthcare services, where data shows that during the pandemic, the
burden for COVID-19 was largely borne by the public sector, highlighting the need for strengthening of public
health infrastructure in the city. In the case of non-COVID healthcare services, more people (58% respondents)
accessed private care than public (40%), likely spending much more than in a public facility. Further, as
highlighted in Praja’s State of Health report, 2020 many more people had died of non-COVID causes during the
lockdown- that is reflected in the current survey data where majority respondents who faced difficulty in
accessing healthcare cited reasons of unavailability of staff/doctor to provide treatment for other diseases (70%)
or closure of the health facility (58%).
The lockdown resulting in financial duress, physical and mental stress caused from quarantining, loss of jobs, loss
of salary, self-isolation and so on also was a major cause of concern in terms of mental wellbeing. This brought
the issue of mental health to the spotlight. The survey showed that 60% respondents felt stressed during the
Impact of COVID-19 in Mumbai 5
lockdown, still 84% did not speak to anyone about their mental health- highlighting the need for greater
awareness and improvement of health services in this field.
The survey also highlighted some lifestyle changes and preferences. 61% respondents from SEC A and 32%
respondents from SEC B reported to have been working from home during the pandemic. Of those working from
home, almost two of three (63%) said they would like to continue to work from home (70% female, 59% male). In
terms of travel to work, preference for walking and buses has increased as compared to before the pandemic. In
the education sector, survey data shows that both public and private schools, albeit with challenges, have shifted
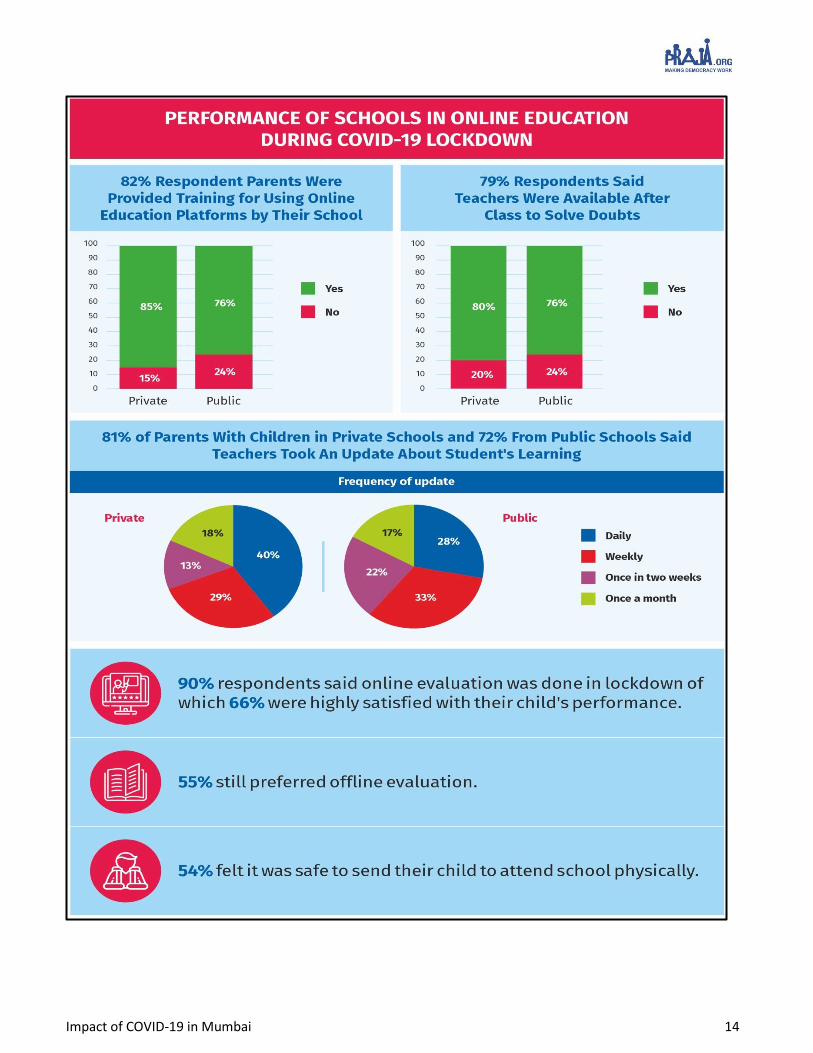
to providing education through online platforms, with adequate training (85% private, 76% public) and regular
teacher-parent updates (81% private, 72% public). Online learning however did have its adverse aspects,
especially on the health of children - 63% said online classes made children physically inactive and irritable (65%)
while 43% said their child faced eyesight problems. This is also reflected in the preference of majority of parents
(62%) towards offline education- 54% felt it was now safe to send their children to school.
The survey has highlighted the urgency for better policy making and planning for the future. The focus, in the
immediate term, needs to be on creating avenues and securing livelihoods of the lowest socio-economic sections
of the city, most affected by the pandemic. For the future, this experience provides cues for better planning of
the city- promotion of work from home or workspaces near to homes and developing more pedestrian spaces for
improved mobility. In education and health sectors, the findings resonate Praja’s annual reports which have over
the years stressed on developing stronger public institutions for providing adequate and improved social services.
NITAI MEHTA
Founder Trustee, Praja Foundation

Impact of COVID-19 in Mumbai 6
II. Acknowledgment
Praja would like to acknowledge Hansa Research to whom the household survey was commissioned. We are also
grateful to – our Elected Representatives, the Civil Society Organisations (CSOs) and journalists who utilise and
publicise our data and by doing so, ensure that awareness regarding various issues we discuss is distributed to a
wide ranging population. We would also like to extend our gratitude to government officials for their constant
cooperation and support.
This Report has been made possible by the support provided to us by our supporters and we would like to take
this opportunity to express our sincere gratitude to them. Praja Foundation appreciates the support given by
Friedrich Naumann Foundation, Narotam Sekhsaria Foundation, Madhu Mehta Foundation and numerous other
individual supporters.
We would also like to thank our group of Advisors & Trustees and lastly but not the least, we would like to
acknowledge the contributions of all members of Praja’s team, who worked to make this report a reality.
Impact of COVID-19 in Mumbai 7
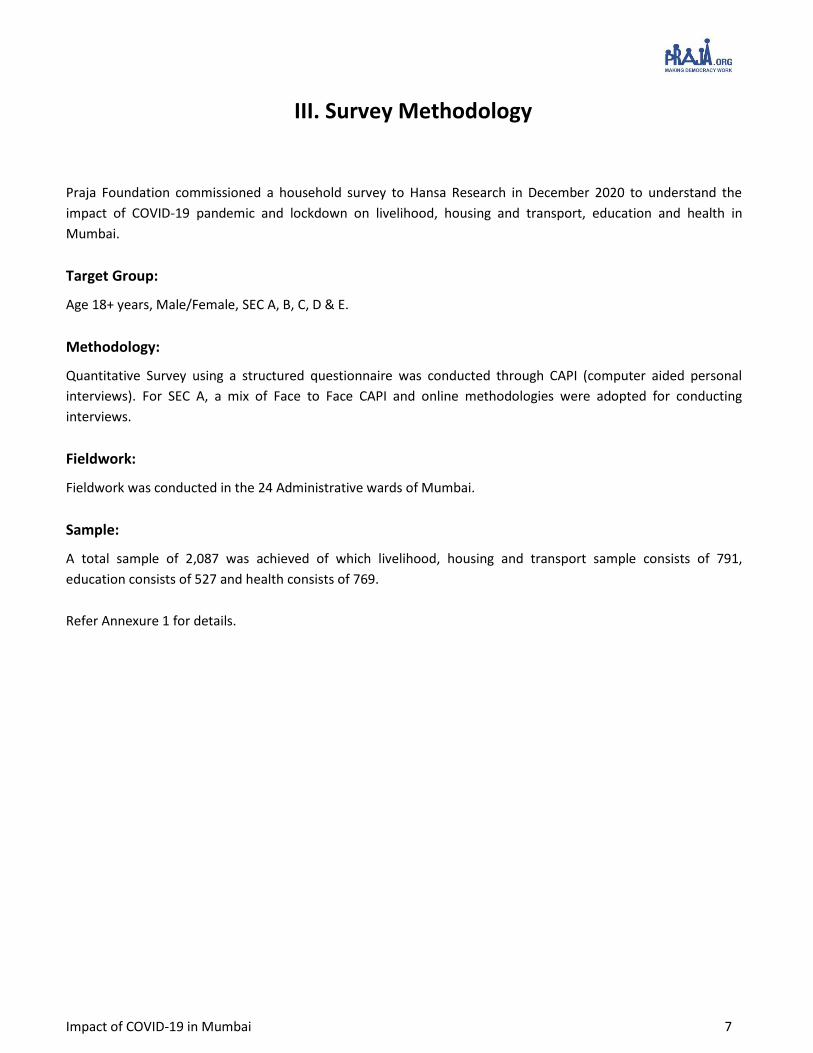
III. Survey Methodology
Praja Foundation commissioned a household survey to Hansa Research in December 2020 to understand the
impact of COVID-19 pandemic and lockdown on livelihood, housing and transport, education and health in
Mumbai.
Target Group:
Age 18+ years, Male/Female, SEC A, B, C, D & E.
Methodology:
Quantitative Survey using a structured questionnaire was conducted through CAPI (computer aided personal
interviews). For SEC A, a mix of Face to Face CAPI and online methodologies were adopted for conducting
interviews.
Fieldwork:
Fieldwork was conducted in the 24 Administrative wards of Mumbai.
Sample:
A total sample of 2,087 was achieved of which livelihood, housing and transport sample consists of 791,
education consists of 527 and health consists of 769.
Refer Annexure 1 for details.
Impact of COVID-19 in Mumbai 8
IV. Highlights
Impact of COVID-19 in Mumbai 9
30%
Impact of COVID-19 in Mumbai 10
Impact of COVID-19 in Mumbai 11
Impact of COVID-19 in Mumbai 12
Impact of COVID-19 in Mumbai 13
Impact of COVID-19 in Mumbai 14
Impact of COVID-19 in Mumbai 15
V. Detailed Tables
A. Impact of COVID-19 on Livelihoods in Mumbai
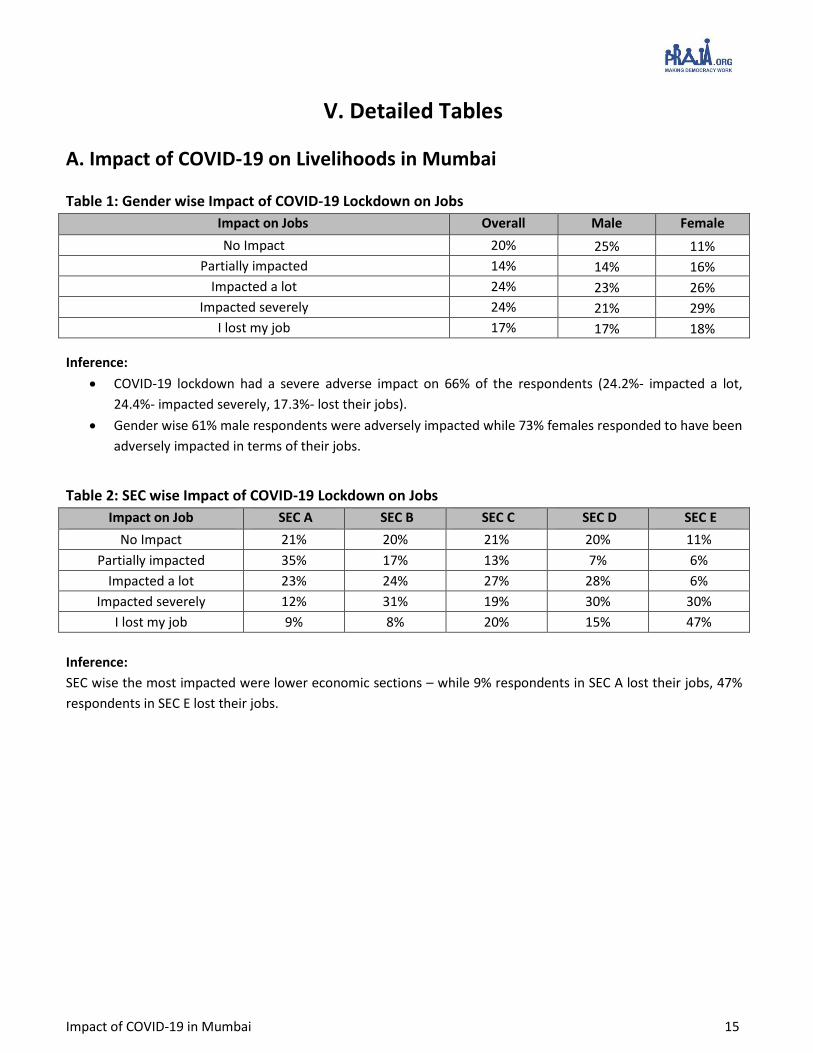
Table 1: Gender wise Impact of COVID-19 Lockdown on Jobs
Impact on Jobs Overall Male Female
No Impact 20% 25% 11%
Partially impacted 14% 14% 16%
Impacted a lot 24% 23% 26%
Impacted severely 24% 21% 29%
I lost my job 17% 17% 18%
Inference:
COVID-19 lockdown had a severe adverse impact on 66% of the respondents (24.2%- impacted a lot,
24.4%- impacted severely, 17.3%- lost their jobs).
Gender wise 61% male respondents were adversely impacted while 73% females responded to have been
adversely impacted in terms of their jobs.
Table 2: SEC wise Impact of COVID-19 Lockdown on Jobs
Impact on Job SEC A SEC B SEC C SEC D SEC E
No Impact 21% 20% 21% 20% 11%
Partially impacted 35% 17% 13% 7% 6%
Impacted a lot 23% 24% 27% 28% 6%
Impacted severely 12% 31% 19% 30% 30%
I lost my job 9% 8% 20% 15% 47%
Inference:
SEC wise the most impacted were lower economic sections – while 9% respondents in SEC A lost their jobs, 47%
respondents in SEC E lost their jobs.
Impact of COVID-19 in Mumbai 16
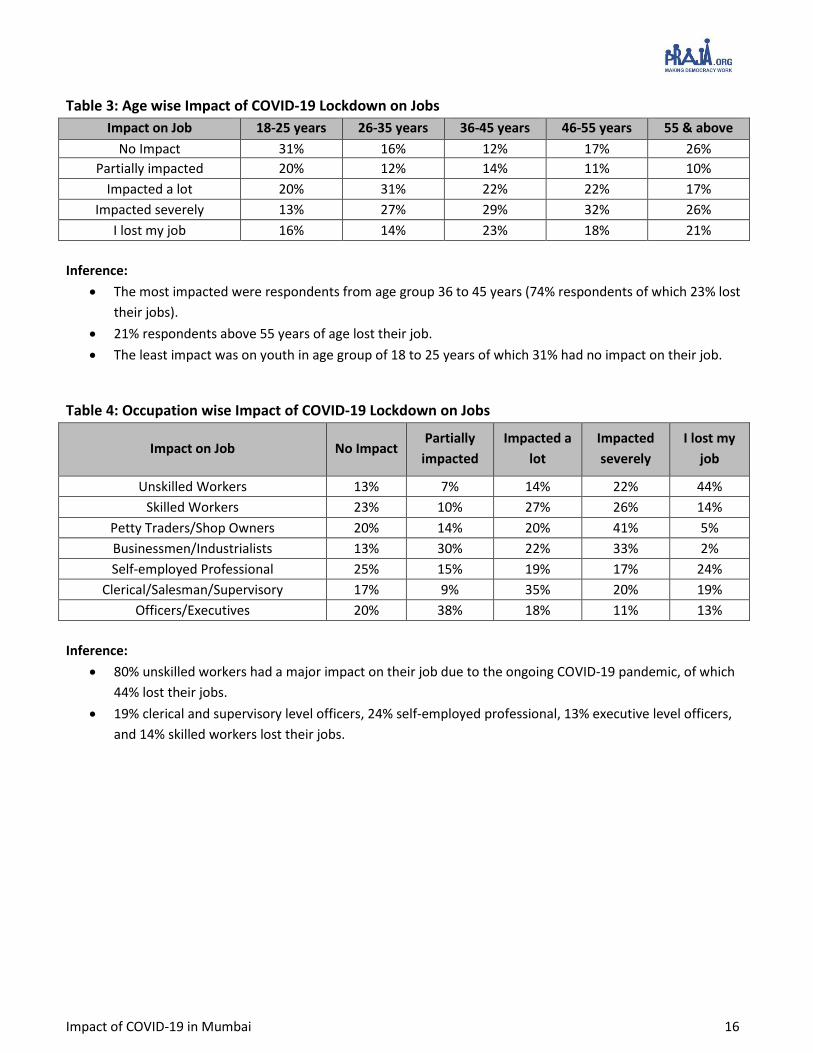
Table 3: Age wise Impact of COVID-19 Lockdown on Jobs
Impact on Job 18-25 years 26-35 years 36-45 years 46-55 years 55 & above
No Impact 31% 16% 12% 17% 26%
Partially impacted 20% 12% 14% 11% 10%
Impacted a lot 20% 31% 22% 22% 17%
Impacted severely 13% 27% 29% 32% 26%
I lost my job 16% 14% 23% 18% 21%
Inference:
The most impacted were respondents from age group 36 to 45 years (74% respondents of which 23% lost
their jobs).
21% respondents above 55 years of age lost their job.
The least impact was on youth in age group of 18 to 25 years of which 31% had no impact on their job.
Table 4: Occupation wise Impact of COVID-19 Lockdown on Jobs
Impact on Job No Impact Partially
impacted
Impacted a
lot
Impacted
severely
I lost my
job
Unskilled Workers 13% 7% 14% 22% 44%
Skilled Workers 23% 10% 27% 26% 14%
Petty Traders/Shop Owners 20% 14% 20% 41% 5%
Businessmen/Industrialists 13% 30% 22% 33% 2%
Self-employed Professional 25% 15% 19% 17% 24%
Clerical/Salesman/Supervisory 17% 9% 35% 20% 19%
Officers/Executives 20% 38% 18% 11% 13%
Inference:
80% unskilled workers had a major impact on their job due to the ongoing COVID-19 pandemic, of which
44% lost their jobs.
19% clerical and supervisory level officers, 24% self-employed professional, 13% executive level officers,
and 14% skilled workers lost their jobs.
Impact of COVID-19 in Mumbai 17
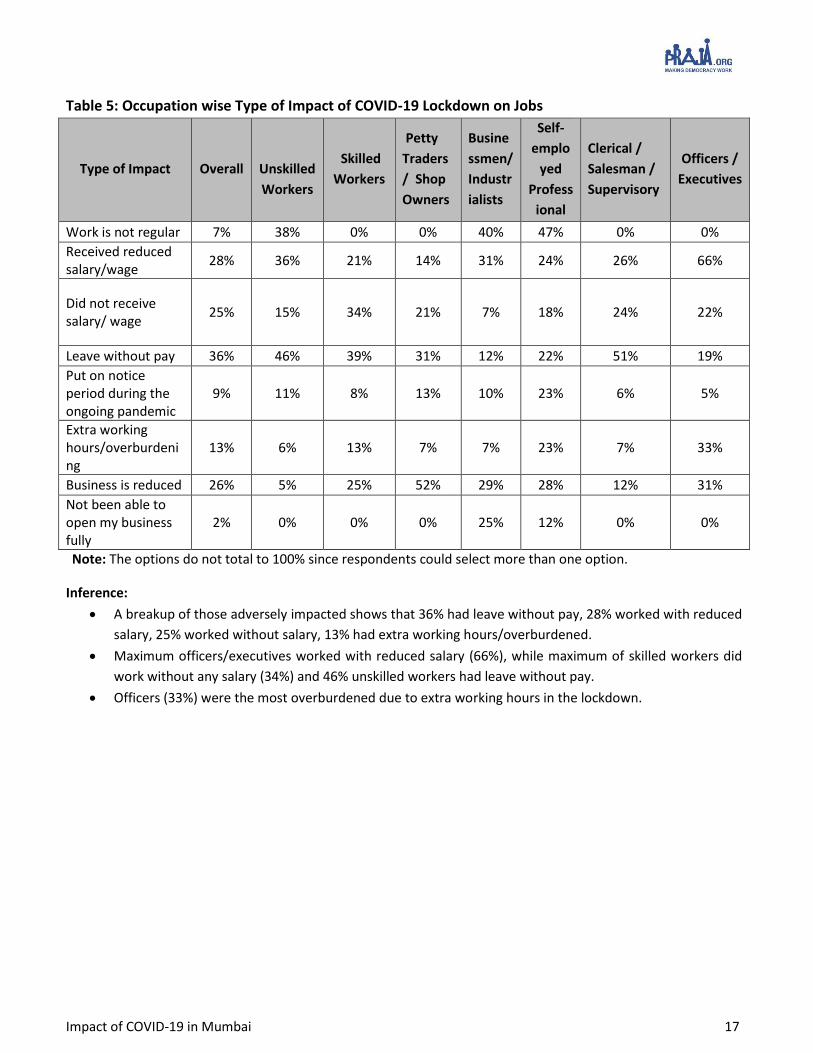
Table 5: Occupation wise Type of Impact of COVID-19 Lockdown on Jobs
Type of Impact Overall
Unskilled
Workers
Skilled
Workers
Petty
Traders
/ Shop
Owners
Busine
ssmen/
Industr
ialists
Self-
emplo
yed
Profess
ional
Clerical /
Salesman /
Supervisory
Officers /
Executives
Work is not regular 7% 38% 0% 0% 40% 47% 0% 0%
Received reduced salary/wage
28% 36% 21% 14% 31% 24% 26% 66%
Did not receive salary/ wage
25% 15% 34% 21% 7% 18% 24% 22%
Leave without pay 36% 46% 39% 31% 12% 22% 51% 19%
Put on notice period during the ongoing pandemic
9% 11% 8% 13% 10% 23% 6% 5%
Extra working hours/overburdening
13% 6% 13% 7% 7% 23% 7% 33%
Business is reduced 26% 5% 25% 52% 29% 28% 12% 31%
Not been able to open my business fully
2% 0% 0% 0% 25% 12% 0% 0%
Note: The options do not total to 100% since respondents could select more than one option.
Inference:
A breakup of those adversely impacted shows that 36% had leave without pay, 28% worked with reduced
salary, 25% worked without salary, 13% had extra working hours/overburdened.
Maximum officers/executives worked with reduced salary (66%), while maximum of skilled workers did
work without any salary (34%) and 46% unskilled workers had leave without pay.
Officers (33%) were the most overburdened due to extra working hours in the lockdown.
Impact of COVID-19 in Mumbai 18
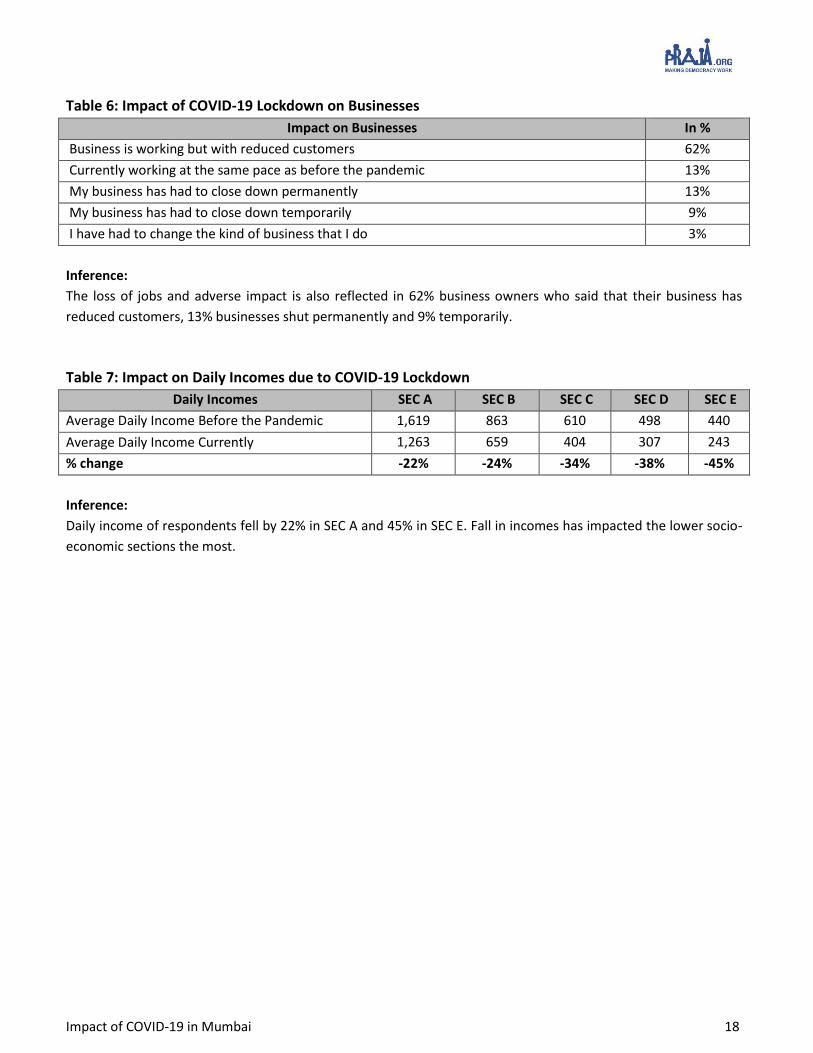
Table 6: Impact of COVID-19 Lockdown on Businesses
Impact on Businesses In %
Business is working but with reduced customers 62%
Currently working at the same pace as before the pandemic 13%
My business has had to close down permanently 13%
My business has had to close down temporarily 9%
I have had to change the kind of business that I do 3%
Inference:
The loss of jobs and adverse impact is also reflected in 62% business owners who said that their business has
reduced customers, 13% businesses shut permanently and 9% temporarily.
Table 7: Impact on Daily Incomes due to COVID-19 Lockdown
Daily Incomes SEC A SEC B SEC C SEC D SEC E
Average Daily Income Before the Pandemic 1,619 863 610 498 440
Average Daily Income Currently 1,263 659 404 307 243
% change -22% -24% -34% -38% -45%
Inference:
Daily income of respondents fell by 22% in SEC A and 45% in SEC E. Fall in incomes has impacted the lower socio-
economic sections the most.
Impact of COVID-19 in Mumbai 19
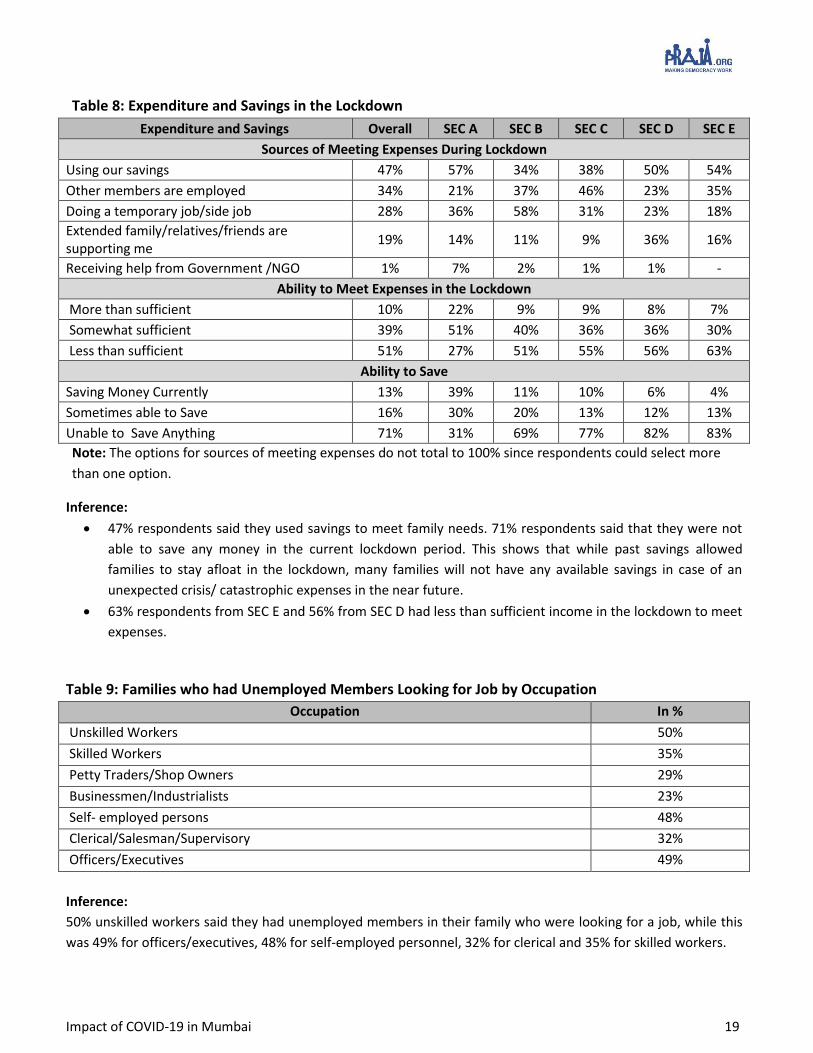
Table 8: Expenditure and Savings in the Lockdown
Expenditure and Savings Overall SEC A SEC B SEC C SEC D SEC E
Sources of Meeting Expenses During Lockdown
Using our savings 47% 57% 34% 38% 50% 54%
Other members are employed 34% 21% 37% 46% 23% 35%
Doing a temporary job/side job 28% 36% 58% 31% 23% 18%
Extended family/relatives/friends are supporting me
19% 14% 11% 9% 36% 16%
Receiving help from Government /NGO 1% 7% 2% 1% 1% -
Ability to Meet Expenses in the Lockdown
More than sufficient 10% 22% 9% 9% 8% 7%
Somewhat sufficient 39% 51% 40% 36% 36% 30%
Less than sufficient 51% 27% 51% 55% 56% 63%
Ability to Save
Saving Money Currently 13% 39% 11% 10% 6% 4%
Sometimes able to Save 16% 30% 20% 13% 12% 13%
Unable to Save Anything 71% 31% 69% 77% 82% 83%
Note: The options for sources of meeting expenses do not total to 100% since respondents could select more
than one option.
Inference:
47% respondents said they used savings to meet family needs. 71% respondents said that they were not
able to save any money in the current lockdown period. This shows that while past savings allowed
families to stay afloat in the lockdown, many families will not have any available savings in case of an
unexpected crisis/ catastrophic expenses in the near future.
63% respondents from SEC E and 56% from SEC D had less than sufficient income in the lockdown to meet
expenses.
Table 9: Families who had Unemployed Members Looking for Job by Occupation
Occupation In %
Unskilled Workers 50%
Skilled Workers 35%
Petty Traders/Shop Owners 29%
Businessmen/Industrialists 23%
Self- employed persons 48%
Clerical/Salesman/Supervisory 32%
Officers/Executives 49%
Inference:
50% unskilled workers said they had unemployed members in their family who were looking for a job, while this
was 49% for officers/executives, 48% for self-employed personnel, 32% for clerical and 35% for skilled workers.
Impact of COVID-19 in Mumbai 20
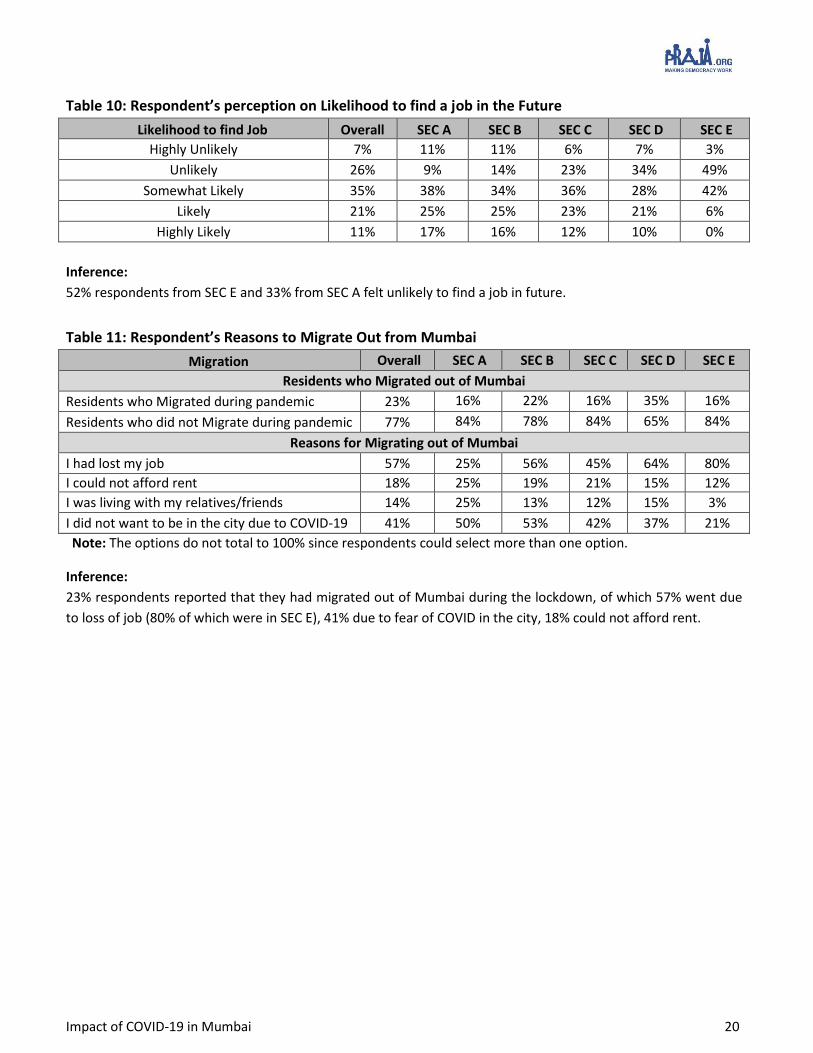
Table 10: Respondent’s perception on Likelihood to find a job in the Future
Likelihood to find Job Overall SEC A SEC B SEC C SEC D SEC E
Highly Unlikely 7% 11% 11% 6% 7% 3%
Unlikely 26% 9% 14% 23% 34% 49%
Somewhat Likely 35% 38% 34% 36% 28% 42%
Likely 21% 25% 25% 23% 21% 6%
Highly Likely 11% 17% 16% 12% 10% 0%
Inference:
52% respondents from SEC E and 33% from SEC A felt unlikely to find a job in future.
Table 11: Respondent’s Reasons to Migrate Out from Mumbai
Migration Overall SEC A SEC B SEC C SEC D SEC E
Residents who Migrated out of Mumbai
Residents who Migrated during pandemic 23% 16% 22% 16% 35% 16%
Residents who did not Migrate during pandemic 77% 84% 78% 84% 65% 84%
Reasons for Migrating out of Mumbai
I had lost my job 57% 25% 56% 45% 64% 80%
I could not afford rent 18% 25% 19% 21% 15% 12%
I was living with my relatives/friends 14% 25% 13% 12% 15% 3%
I did not want to be in the city due to COVID-19 41% 50% 53% 42% 37% 21%
Note: The options do not total to 100% since respondents could select more than one option.
Inference:
23% respondents reported that they had migrated out of Mumbai during the lockdown, of which 57% went due
to loss of job (80% of which were in SEC E), 41% due to fear of COVID in the city, 18% could not afford rent.
Impact of COVID-19 in Mumbai 21
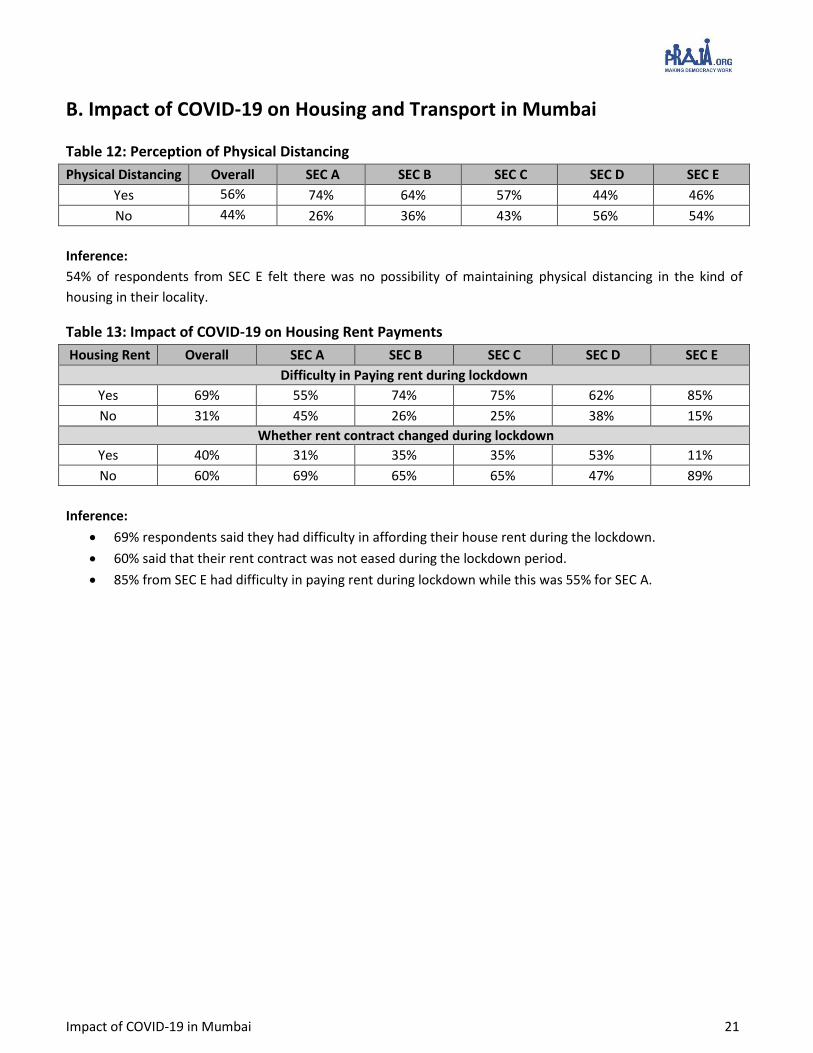
B. Impact of COVID-19 on Housing and Transport in Mumbai
Table 12: Perception of Physical Distancing
Physical Distancing Overall SEC A SEC B SEC C SEC D SEC E
Yes 56% 74% 64% 57% 44% 46%
No 44% 26% 36% 43% 56% 54%
Inference:
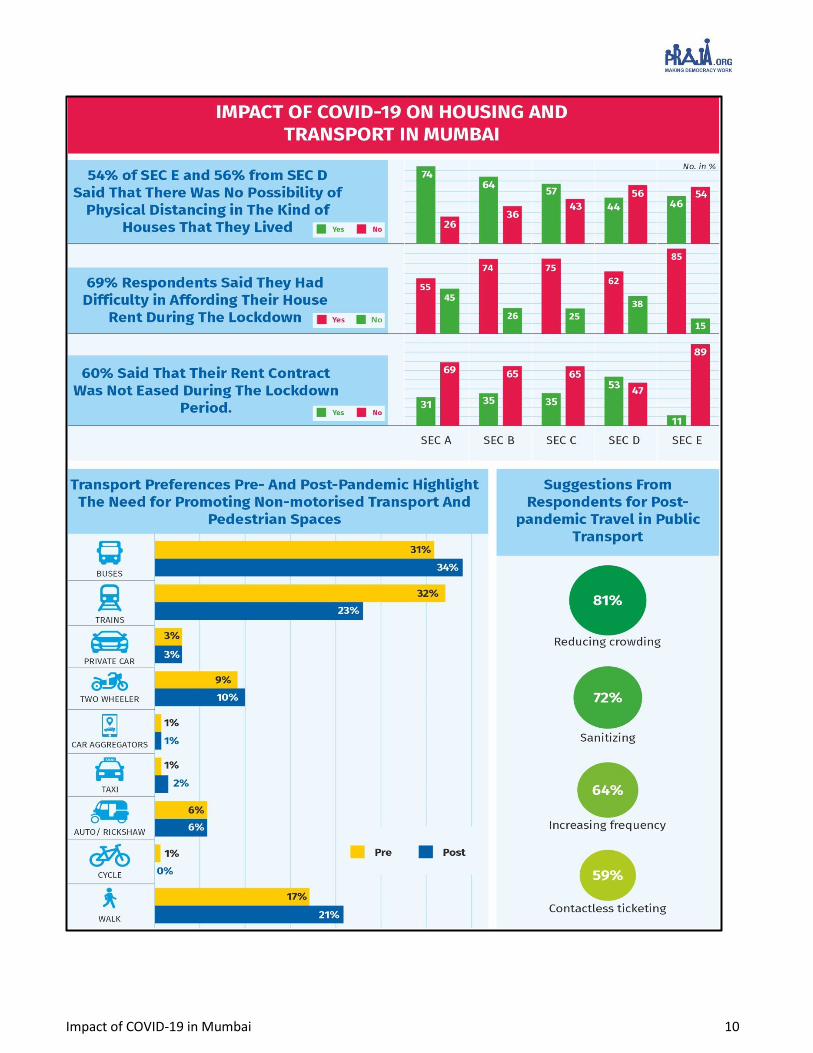
54% of respondents from SEC E felt there was no possibility of maintaining physical distancing in the kind of
housing in their locality.
Table 13: Impact of COVID-19 on Housing Rent Payments
Housing Rent Overall SEC A SEC B SEC C SEC D SEC E
Difficulty in Paying rent during lockdown
Yes 69% 55% 74% 75% 62% 85%
No 31% 45% 26% 25% 38% 15%
Whether rent contract changed during lockdown
Yes 40% 31% 35% 35% 53% 11%
No 60% 69% 65% 65% 47% 89%
Inference:
69% respondents said they had difficulty in affording their house rent during the lockdown.
60% said that their rent contract was not eased during the lockdown period.
85% from SEC E had difficulty in paying rent during lockdown while this was 55% for SEC A.
Impact of COVID-19 in Mumbai 22
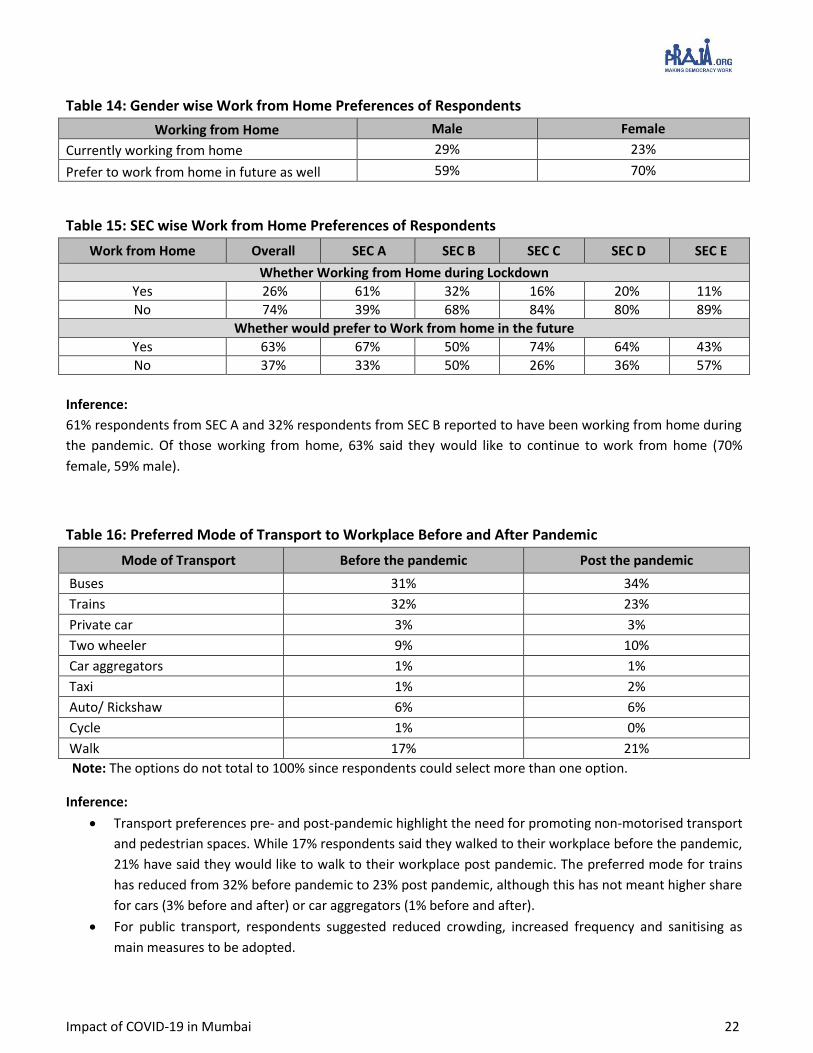
Table 14: Gender wise Work from Home Preferences of Respondents
Working from Home Male Female
Currently working from home 29% 23%
Prefer to work from home in future as well 59% 70%
Table 15: SEC wise Work from Home Preferences of Respondents
Work from Home Overall SEC A SEC B SEC C SEC D SEC E
Whether Working from Home during Lockdown
Yes 26% 61% 32% 16% 20% 11%
No 74% 39% 68% 84% 80% 89%
Whether would prefer to Work from home in the future
Yes 63% 67% 50% 74% 64% 43%
No 37% 33% 50% 26% 36% 57%
Inference:
61% respondents from SEC A and 32% respondents from SEC B reported to have been working from home during
the pandemic. Of those working from home, 63% said they would like to continue to work from home (70%
female, 59% male).
Table 16: Preferred Mode of Transport to Workplace Before and After Pandemic
Mode of Transport Before the pandemic Post the pandemic
Buses 31% 34%
Trains 32% 23%
Private car 3% 3%
Two wheeler 9% 10%
Car aggregators 1% 1%
Taxi 1% 2%
Auto/ Rickshaw 6% 6%
Cycle 1% 0%
Walk 17% 21%
Note: The options do not total to 100% since respondents could select more than one option.
Inference:
Transport preferences pre- and post-pandemic highlight the need for promoting non-motorised transport
and pedestrian spaces. While 17% respondents said they walked to their workplace before the pandemic,
21% have said they would like to walk to their workplace post pandemic. The preferred mode for trains
has reduced from 32% before pandemic to 23% post pandemic, although this has not meant higher share
for cars (3% before and after) or car aggregators (1% before and after).
For public transport, respondents suggested reduced crowding, increased frequency and sanitising as
main measures to be adopted.
Impact of COVID-19 in Mumbai 23
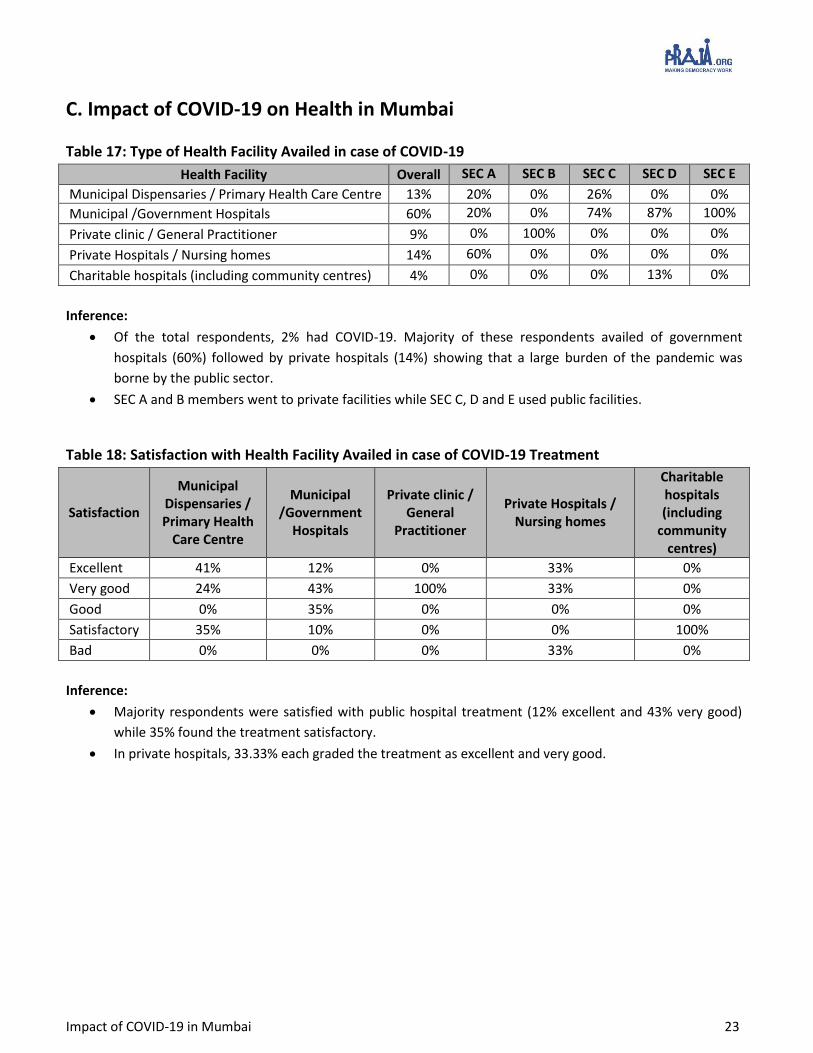
C. Impact of COVID-19 on Health in Mumbai
Table 17: Type of Health Facility Availed in case of COVID-19
Health Facility Overall SEC A SEC B SEC C SEC D SEC E
Municipal Dispensaries / Primary Health Care Centre 13% 20% 0% 26% 0% 0%
Municipal /Government Hospitals 60% 20% 0% 74% 87% 100%
Private clinic / General Practitioner 9% 0% 100% 0% 0% 0%
Private Hospitals / Nursing homes 14% 60% 0% 0% 0% 0%
Charitable hospitals (including community centres) 4% 0% 0% 0% 13% 0%
Inference:
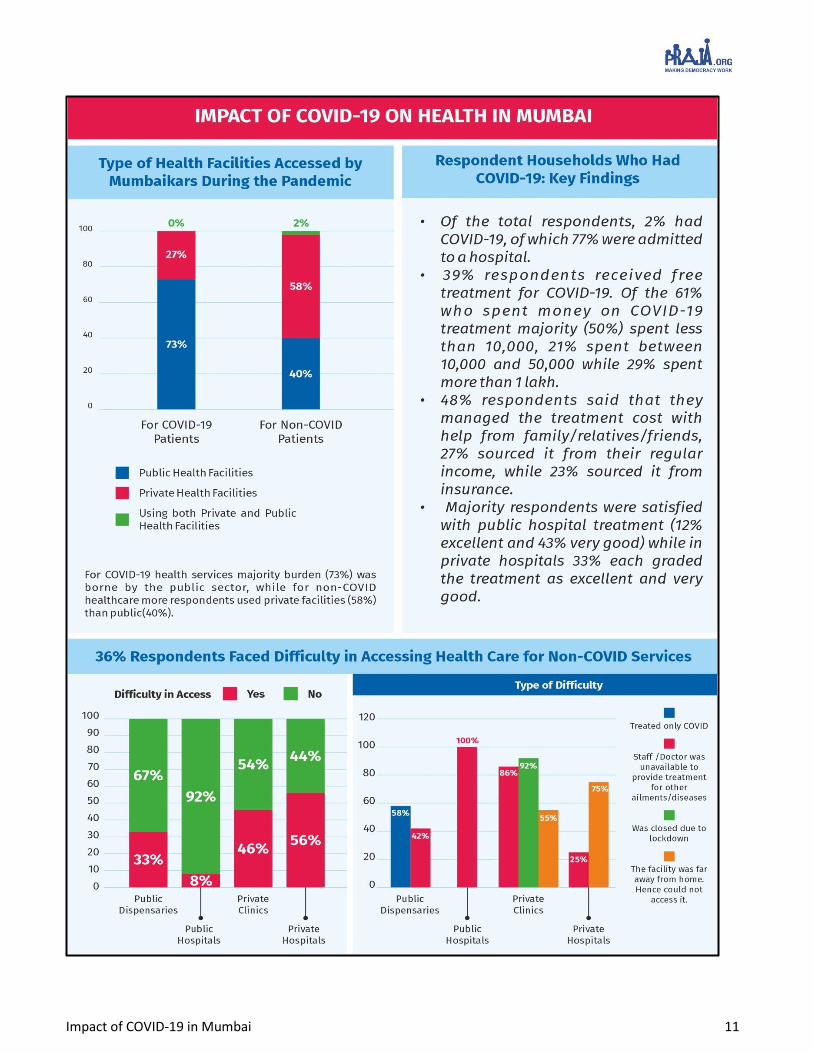
Of the total respondents, 2% had COVID-19. Majority of these respondents availed of government
hospitals (60%) followed by private hospitals (14%) showing that a large burden of the pandemic was
borne by the public sector.
SEC A and B members went to private facilities while SEC C, D and E used public facilities.
Table 18: Satisfaction with Health Facility Availed in case of COVID-19 Treatment
Satisfaction
Municipal Dispensaries / Primary Health
Care Centre
Municipal /Government
Hospitals
Private clinic / General
Practitioner
Private Hospitals / Nursing homes
Charitable hospitals (including
community centres)
Excellent 41% 12% 0% 33% 0%
Very good 24% 43% 100% 33% 0%
Good 0% 35% 0% 0% 0%
Satisfactory 35% 10% 0% 0% 100%
Bad 0% 0% 0% 33% 0%
Inference:
Majority respondents were satisfied with public hospital treatment (12% excellent and 43% very good)
while 35% found the treatment satisfactory.
In private hospitals, 33.33% each graded the treatment as excellent and very good.
Impact of COVID-19 in Mumbai 24
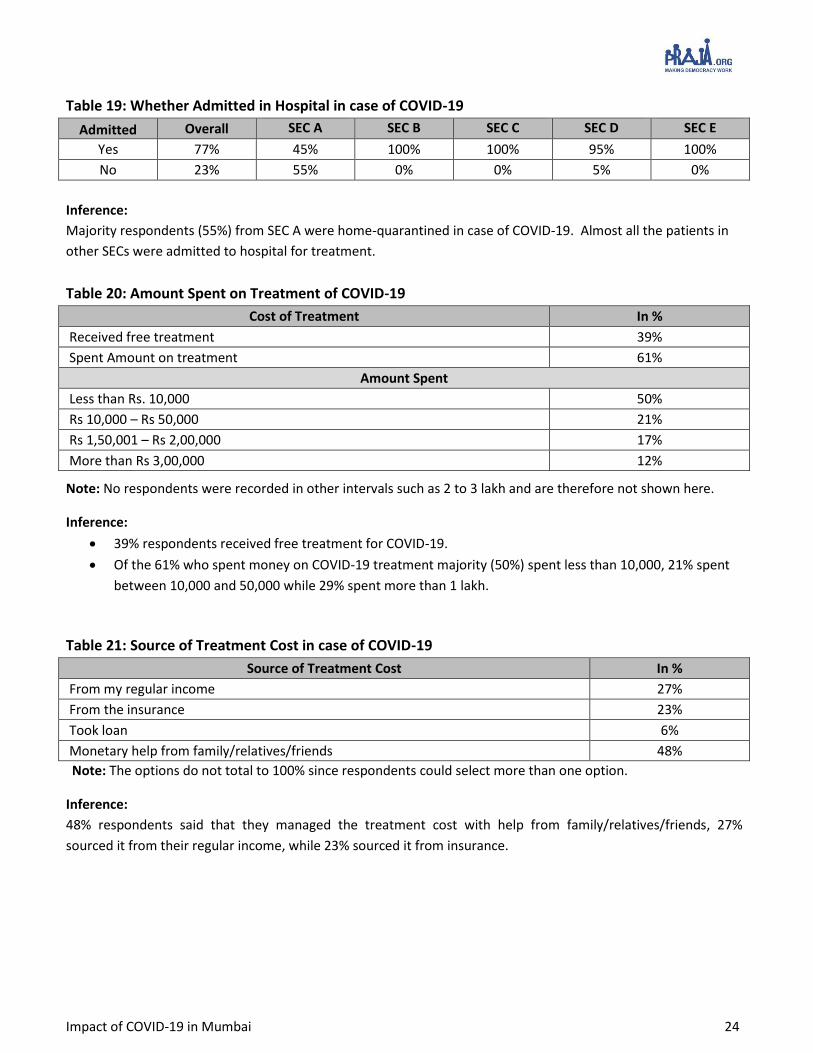
Table 19: Whether Admitted in Hospital in case of COVID-19
Admitted Overall SEC A SEC B SEC C SEC D SEC E
Yes 77% 45% 100% 100% 95% 100%
No 23% 55% 0% 0% 5% 0%
Inference:
Majority respondents (55%) from SEC A were home-quarantined in case of COVID-19. Almost all the patients in
other SECs were admitted to hospital for treatment.
Table 20: Amount Spent on Treatment of COVID-19
Cost of Treatment In %
Received free treatment 39%
Spent Amount on treatment 61%
Amount Spent
Less than Rs. 10,000 50%
Rs 10,000 – Rs 50,000 21%
Rs 1,50,001 – Rs 2,00,000 17%
More than Rs 3,00,000 12%
Note: No respondents were recorded in other intervals such as 2 to 3 lakh and are therefore not shown here.
Inference:
39% respondents received free treatment for COVID-19.
Of the 61% who spent money on COVID-19 treatment majority (50%) spent less than 10,000, 21% spent
between 10,000 and 50,000 while 29% spent more than 1 lakh.
Table 21: Source of Treatment Cost in case of COVID-19
Source of Treatment Cost In %
From my regular income 27%
From the insurance 23%
Took loan 6%
Monetary help from family/relatives/friends 48%
Note: The options do not total to 100% since respondents could select more than one option.
Inference:
48% respondents said that they managed the treatment cost with help from family/relatives/friends, 27%
sourced it from their regular income, while 23% sourced it from insurance.
Impact of COVID-19 in Mumbai 25
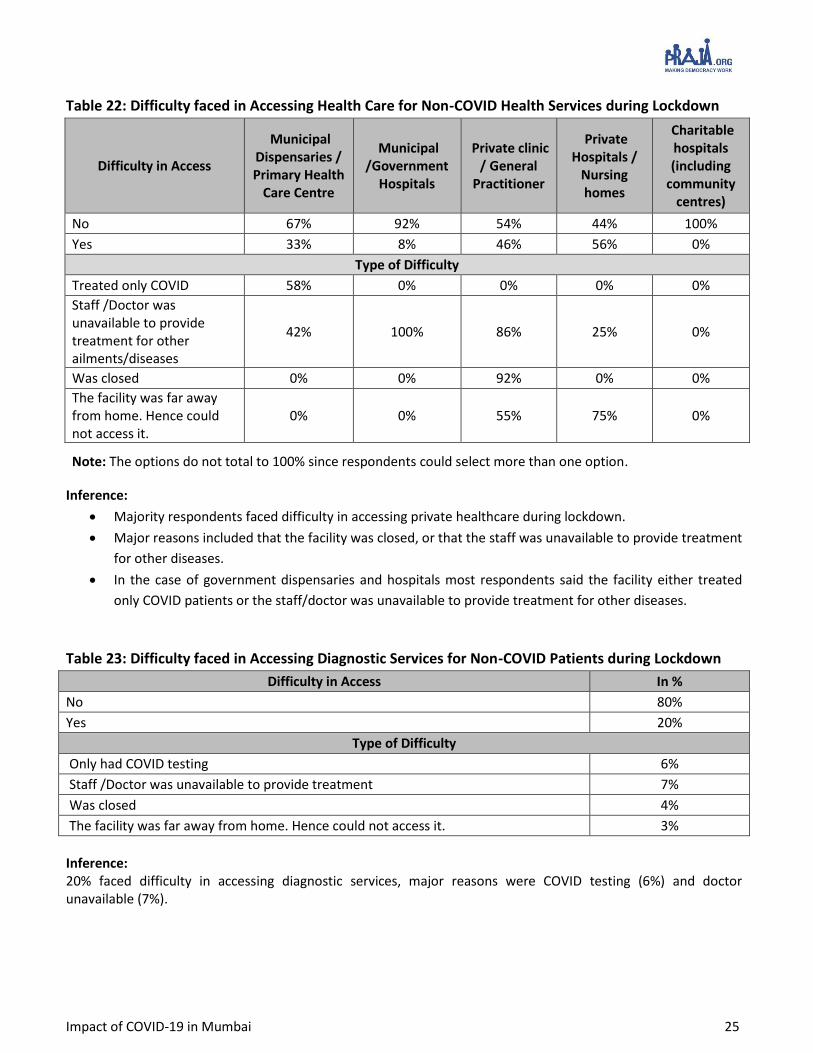
Table 22: Difficulty faced in Accessing Health Care for Non-COVID Health Services during Lockdown
Difficulty in Access
Municipal Dispensaries / Primary Health
Care Centre
Municipal /Government
Hospitals
Private clinic / General
Practitioner
Private Hospitals /
Nursing homes
Charitable hospitals (including
community centres)
No 67% 92% 54% 44% 100%
Yes 33% 8% 46% 56% 0%
Type of Difficulty
Treated only COVID 58% 0% 0% 0% 0%
Staff /Doctor was unavailable to provide treatment for other ailments/diseases
42% 100% 86% 25% 0%
Was closed 0% 0% 92% 0% 0%
The facility was far away from home. Hence could not access it.
0% 0% 55% 75% 0%
Note: The options do not total to 100% since respondents could select more than one option.
Inference:
Majority respondents faced difficulty in accessing private healthcare during lockdown.
Major reasons included that the facility was closed, or that the staff was unavailable to provide treatment
for other diseases.
In the case of government dispensaries and hospitals most respondents said the facility either treated
only COVID patients or the staff/doctor was unavailable to provide treatment for other diseases.
Table 23: Difficulty faced in Accessing Diagnostic Services for Non-COVID Patients during Lockdown
Difficulty in Access In %
No 80%
Yes 20%
Type of Difficulty
Only had COVID testing 6%
Staff /Doctor was unavailable to provide treatment 7%
Was closed 4%
The facility was far away from home. Hence could not access it. 3%
Inference: 20% faced difficulty in accessing diagnostic services, major reasons were COVID testing (6%) and doctor unavailable (7%).
Impact of COVID-19 in Mumbai 26
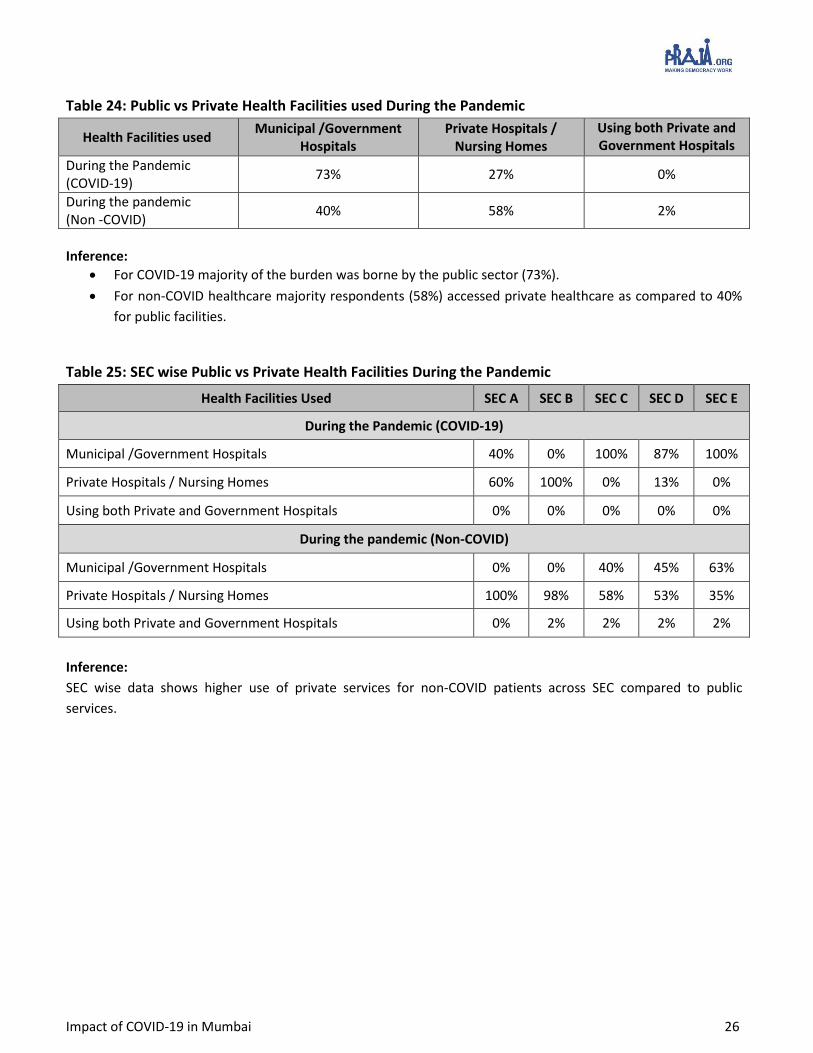
Table 24: Public vs Private Health Facilities used During the Pandemic
Health Facilities used Municipal /Government
Hospitals Private Hospitals /
Nursing Homes
Using both Private and Government Hospitals
During the Pandemic (COVID-19)
73% 27% 0%
During the pandemic (Non -COVID)
40% 58% 2%
Inference:
For COVID-19 majority of the burden was borne by the public sector (73%).
For non-COVID healthcare majority respondents (58%) accessed private healthcare as compared to 40%
for public facilities.
Table 25: SEC wise Public vs Private Health Facilities During the Pandemic
Health Facilities Used SEC A SEC B SEC C SEC D SEC E
During the Pandemic (COVID-19)
Municipal /Government Hospitals 40% 0% 100% 87% 100%
Private Hospitals / Nursing Homes 60% 100% 0% 13% 0%
Using both Private and Government Hospitals 0% 0% 0% 0% 0%
During the pandemic (Non-COVID)
Municipal /Government Hospitals 0% 0% 40% 45% 63%
Private Hospitals / Nursing Homes 100% 98% 58% 53% 35%
Using both Private and Government Hospitals 0% 2% 2% 2% 2%
Inference:
SEC wise data shows higher use of private services for non-COVID patients across SEC compared to public
services.
Impact of COVID-19 in Mumbai 27
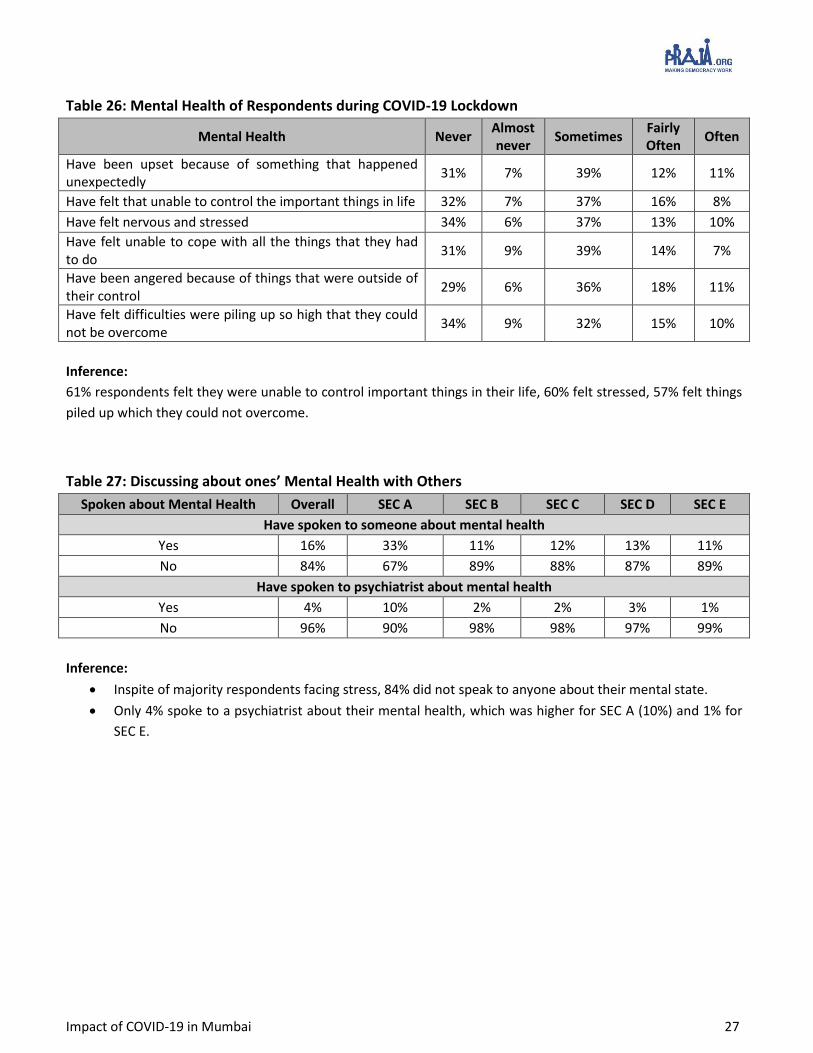
Table 26: Mental Health of Respondents during COVID-19 Lockdown
Mental Health Never Almost never
Sometimes Fairly Often
Often
Have been upset because of something that happened unexpectedly
31% 7% 39% 12% 11%
Have felt that unable to control the important things in life 32% 7% 37% 16% 8%
Have felt nervous and stressed 34% 6% 37% 13% 10%
Have felt unable to cope with all the things that they had to do
31% 9% 39% 14% 7%
Have been angered because of things that were outside of their control
29% 6% 36% 18% 11%
Have felt difficulties were piling up so high that they could not be overcome
34% 9% 32% 15% 10%
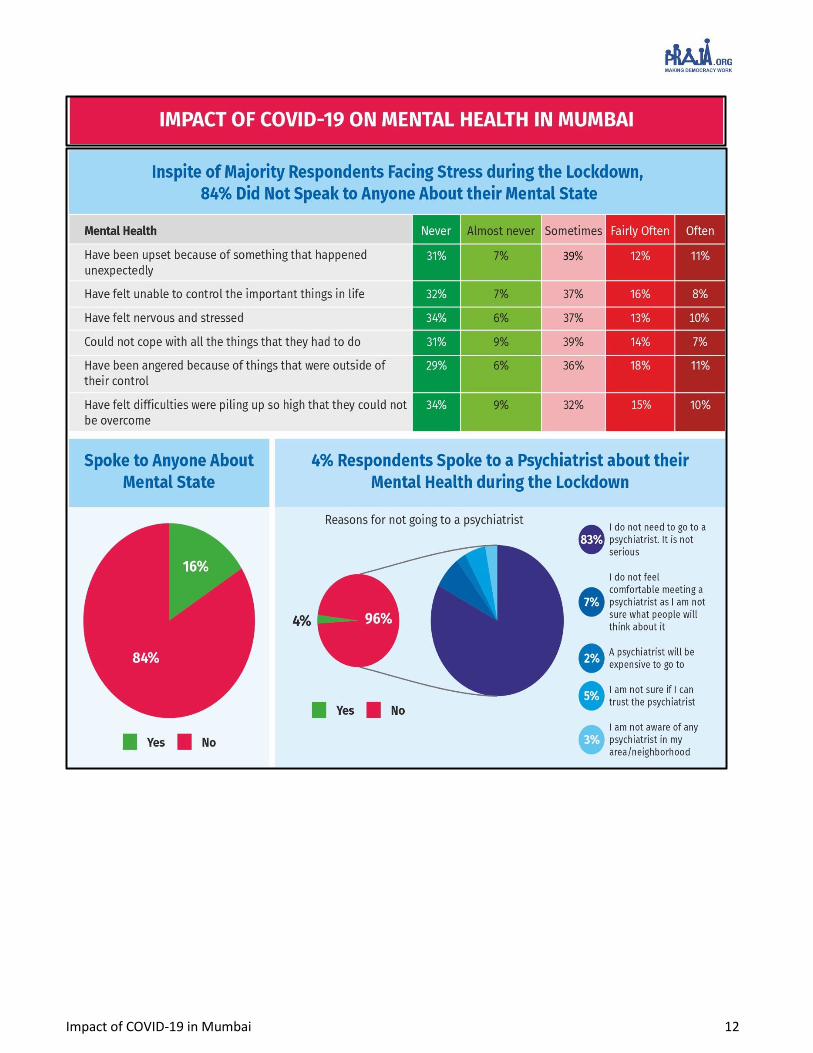
Inference:
61% respondents felt they were unable to control important things in their life, 60% felt stressed, 57% felt things
piled up which they could not overcome.
Table 27: Discussing about ones’ Mental Health with Others
Spoken about Mental Health Overall SEC A SEC B SEC C SEC D SEC E
Have spoken to someone about mental health
Yes 16% 33% 11% 12% 13% 11%
No 84% 67% 89% 88% 87% 89%
Have spoken to psychiatrist about mental health
Yes 4% 10% 2% 2% 3% 1%
No 96% 90% 98% 98% 97% 99%
Inference:
Inspite of majority respondents facing stress, 84% did not speak to anyone about their mental state.
Only 4% spoke to a psychiatrist about their mental health, which was higher for SEC A (10%) and 1% for
SEC E.
Impact of COVID-19 in Mumbai 28
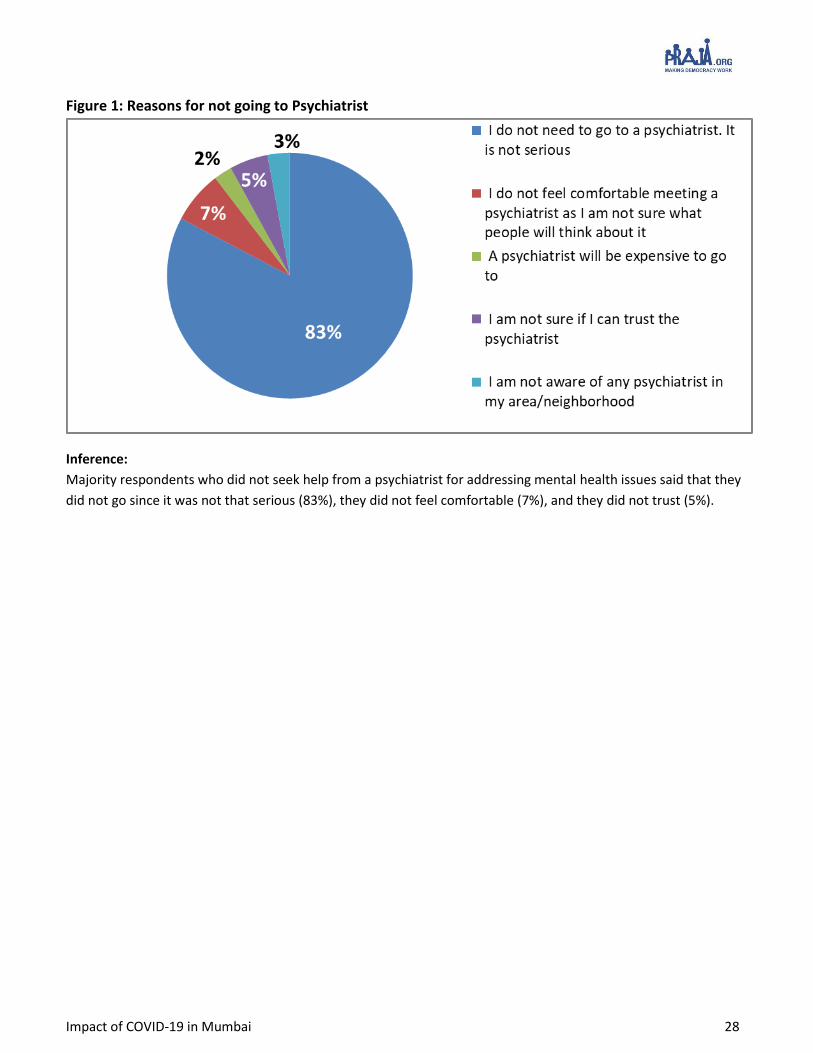
Figure 1: Reasons for not going to Psychiatrist
Inference:
Majority respondents who did not seek help from a psychiatrist for addressing mental health issues said that they
did not go since it was not that serious (83%), they did not feel comfortable (7%), and they did not trust (5%).
Impact of COVID-19 in Mumbai 29
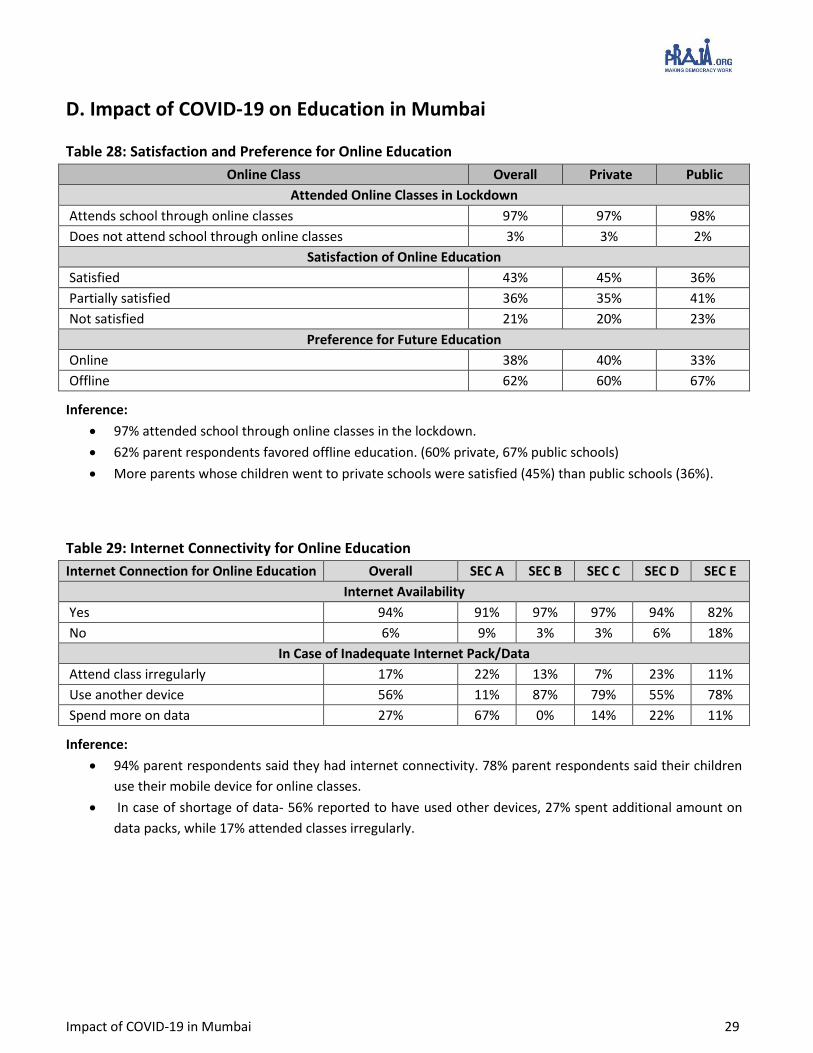
D. Impact of COVID-19 on Education in Mumbai
Table 28: Satisfaction and Preference for Online Education
Online Class Overall Private Public
Attended Online Classes in Lockdown
Attends school through online classes 97% 97% 98%
Does not attend school through online classes 3% 3% 2%
Satisfaction of Online Education
Satisfied 43% 45% 36%
Partially satisfied 36% 35% 41%
Not satisfied 21% 20% 23%
Preference for Future Education
Online 38% 40% 33%
Offline 62% 60% 67%
Inference:
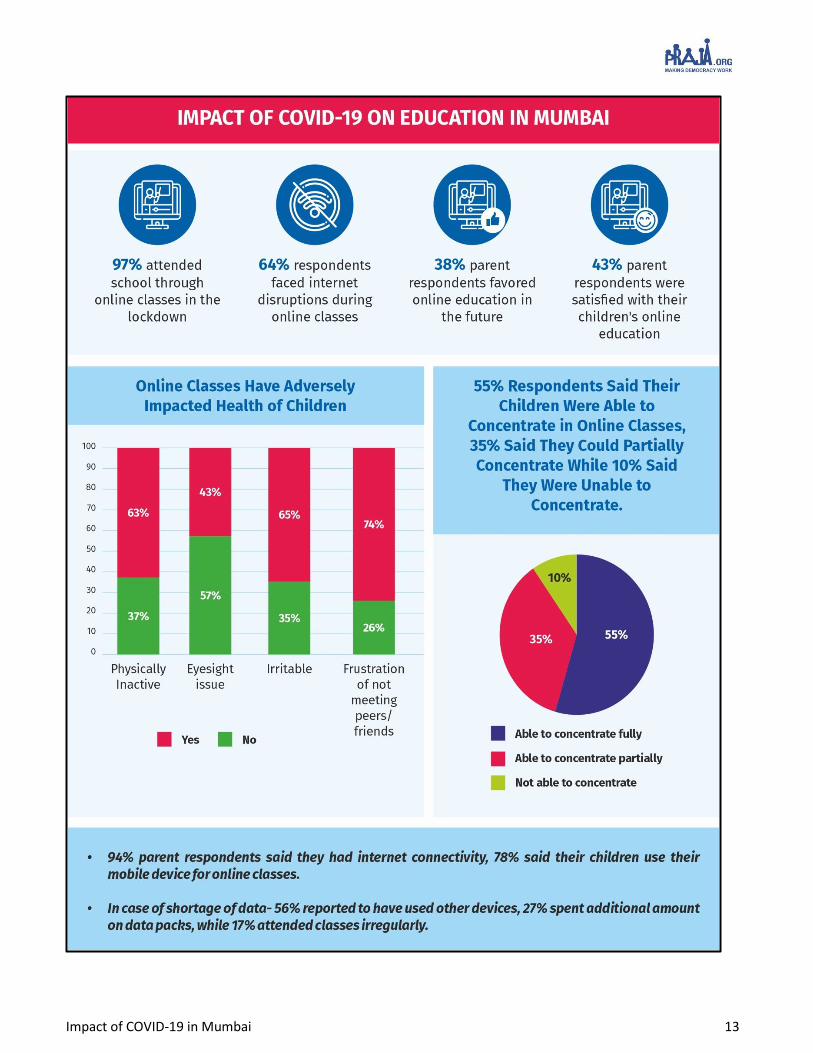
97% attended school through online classes in the lockdown.
62% parent respondents favored offline education. (60% private, 67% public schools)
More parents whose children went to private schools were satisfied (45%) than public schools (36%).
Table 29: Internet Connectivity for Online Education
Internet Connection for Online Education Overall SEC A SEC B SEC C SEC D SEC E
Internet Availability
Yes 94% 91% 97% 97% 94% 82%
No 6% 9% 3% 3% 6% 18%
In Case of Inadequate Internet Pack/Data
Attend class irregularly 17% 22% 13% 7% 23% 11%
Use another device 56% 11% 87% 79% 55% 78%
Spend more on data 27% 67% 0% 14% 22% 11%
Inference:
94% parent respondents said they had internet connectivity. 78% parent respondents said their children
use their mobile device for online classes.
In case of shortage of data- 56% reported to have used other devices, 27% spent additional amount on
data packs, while 17% attended classes irregularly.
Impact of COVID-19 in Mumbai 30
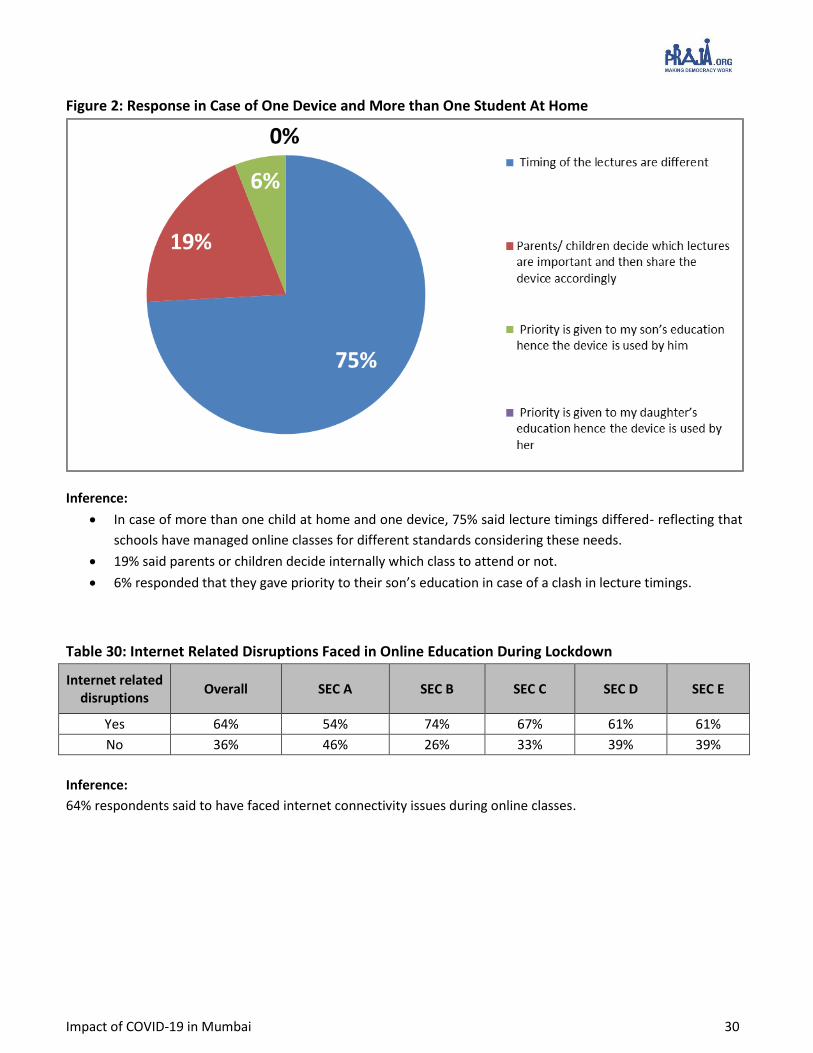
Figure 2: Response in Case of One Device and More than One Student At Home
Inference:
In case of more than one child at home and one device, 75% said lecture timings differed- reflecting that
schools have managed online classes for different standards considering these needs.
19% said parents or children decide internally which class to attend or not.
6% responded that they gave priority to their son’s education in case of a clash in lecture timings.
Table 30: Internet Related Disruptions Faced in Online Education During Lockdown
Internet related disruptions
Overall SEC A SEC B SEC C SEC D SEC E
Yes 64% 54% 74% 67% 61% 61%
No 36% 46% 26% 33% 39% 39%
Inference:
64% respondents said to have faced internet connectivity issues during online classes.
Impact of COVID-19 in Mumbai 31
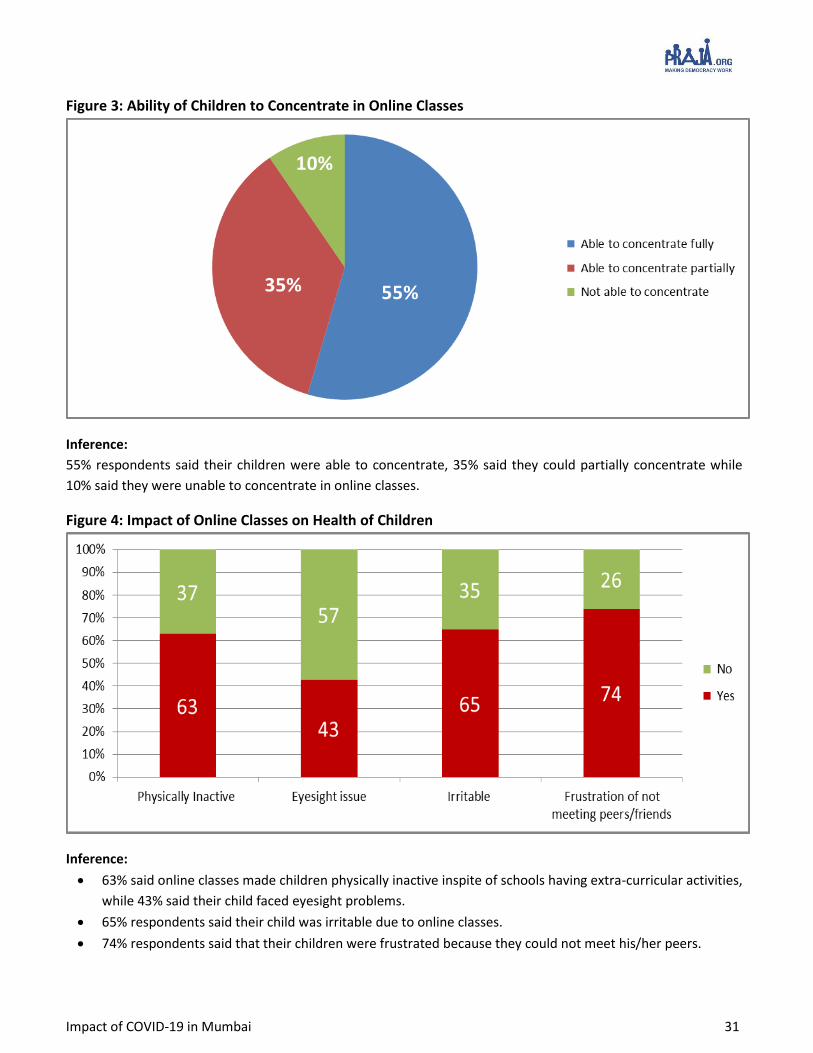
Figure 3: Ability of Children to Concentrate in Online Classes
Inference:
55% respondents said their children were able to concentrate, 35% said they could partially concentrate while
10% said they were unable to concentrate in online classes.
Figure 4: Impact of Online Classes on Health of Children
Inference:
63% said online classes made children physically inactive inspite of schools having extra-curricular activities,
while 43% said their child faced eyesight problems.
65% respondents said their child was irritable due to online classes.
74% respondents said that their children were frustrated because they could not meet his/her peers.
Impact of COVID-19 in Mumbai 32
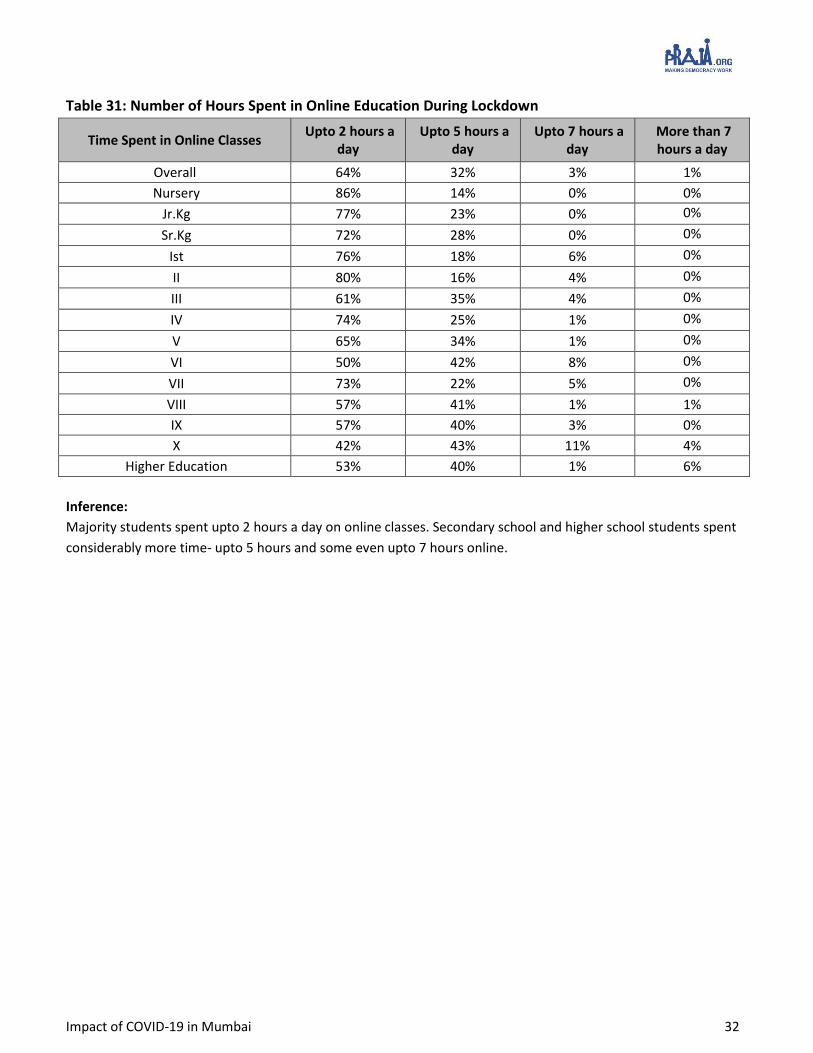
Table 31: Number of Hours Spent in Online Education During Lockdown
Time Spent in Online Classes Upto 2 hours a
day Upto 5 hours a
day Upto 7 hours a
day More than 7 hours a day
Overall 64% 32% 3% 1%
Nursery 86% 14% 0% 0%
Jr.Kg 77% 23% 0% 0%
Sr.Kg 72% 28% 0% 0%
Ist 76% 18% 6% 0%
II 80% 16% 4% 0%
III 61% 35% 4% 0%
IV 74% 25% 1% 0%
V 65% 34% 1% 0%
VI 50% 42% 8% 0%
VII 73% 22% 5% 0%
VIII 57% 41% 1% 1%
IX 57% 40% 3% 0%
X 42% 43% 11% 4%
Higher Education 53% 40% 1% 6%
Inference:
Majority students spent upto 2 hours a day on online classes. Secondary school and higher school students spent
considerably more time- upto 5 hours and some even upto 7 hours online.
Impact of COVID-19 in Mumbai 33
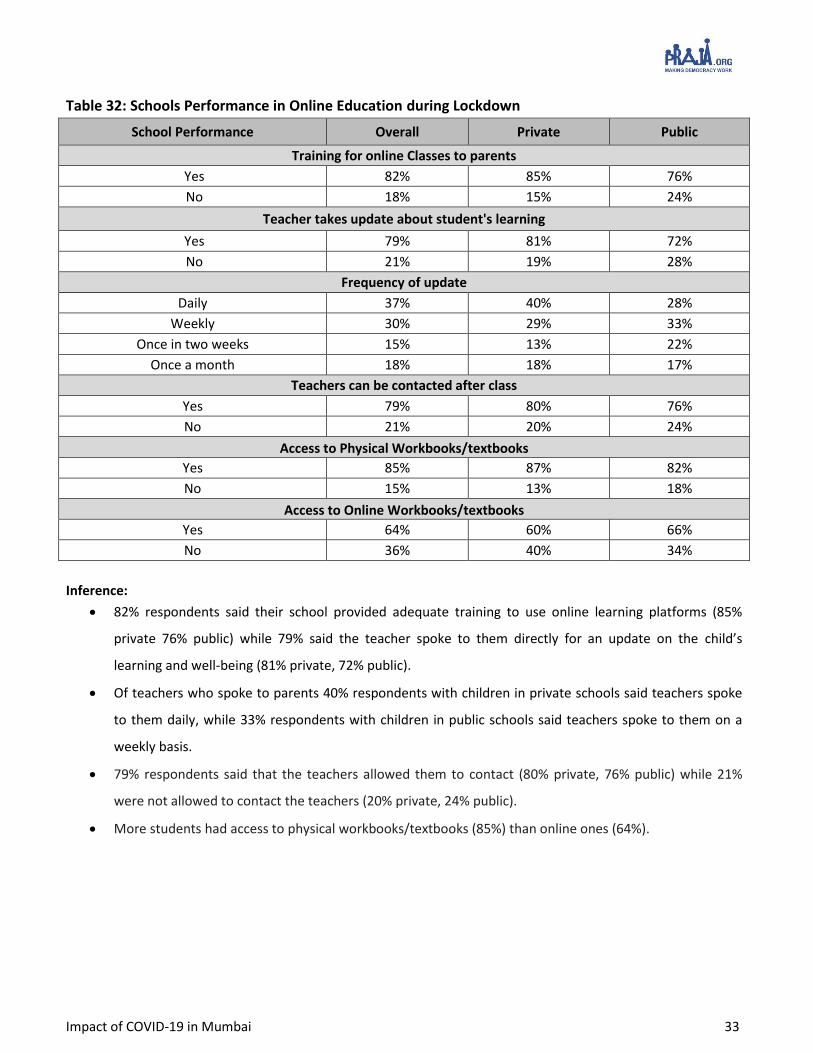
Table 32: Schools Performance in Online Education during Lockdown
School Performance Overall Private Public
Training for online Classes to parents
Yes 82% 85% 76%
No 18% 15% 24%
Teacher takes update about student's learning
Yes 79% 81% 72%
No 21% 19% 28%
Frequency of update
Daily 37% 40% 28%
Weekly 30% 29% 33%
Once in two weeks 15% 13% 22%
Once a month 18% 18% 17%
Teachers can be contacted after class
Yes 79% 80% 76%
No 21% 20% 24%
Access to Physical Workbooks/textbooks
Yes 85% 87% 82%
No 15% 13% 18%
Access to Online Workbooks/textbooks
Yes 64% 60% 66%
No 36% 40% 34%
Inference:
82% respondents said their school provided adequate training to use online learning platforms (85%
private 76% public) while 79% said the teacher spoke to them directly for an update on the child’s
learning and well-being (81% private, 72% public).
Of teachers who spoke to parents 40% respondents with children in private schools said teachers spoke
to them daily, while 33% respondents with children in public schools said teachers spoke to them on a
weekly basis.
79% respondents said that the teachers allowed them to contact (80% private, 76% public) while 21%
were not allowed to contact the teachers (20% private, 24% public).
More students had access to physical workbooks/textbooks (85%) than online ones (64%).
Impact of COVID-19 in Mumbai 34
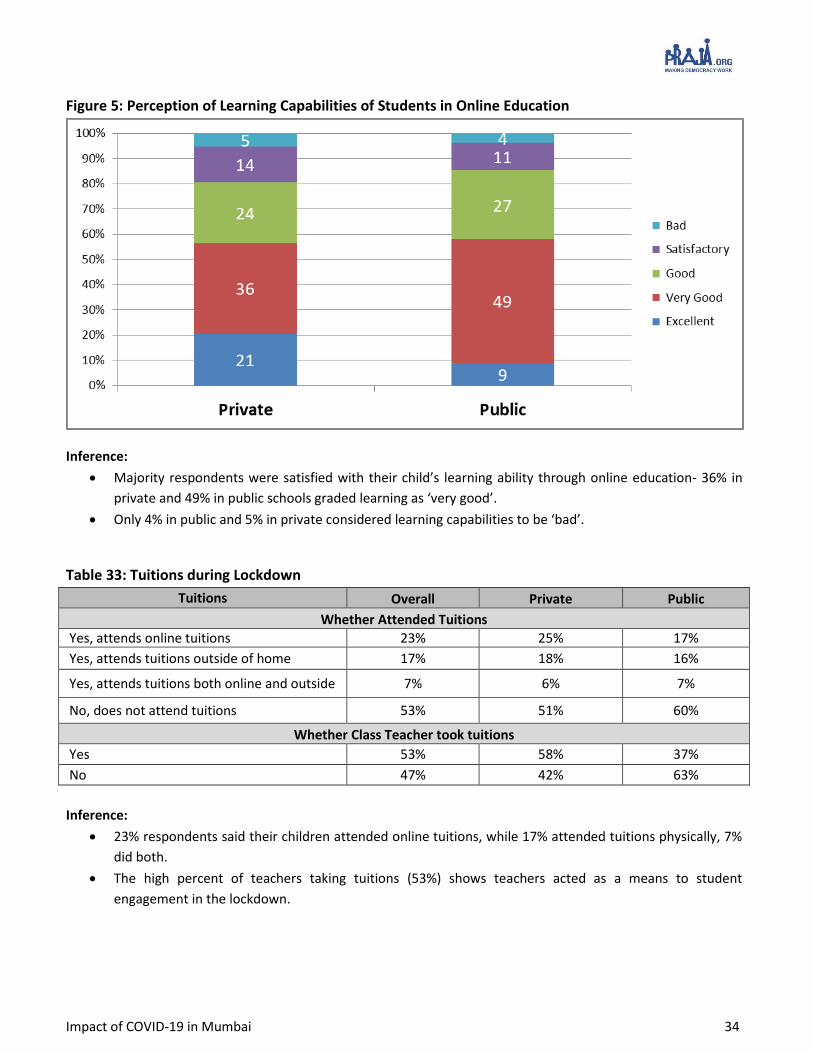
Figure 5: Perception of Learning Capabilities of Students in Online Education
Inference:
Majority respondents were satisfied with their child’s learning ability through online education- 36% in
private and 49% in public schools graded learning as ‘very good’.
Only 4% in public and 5% in private considered learning capabilities to be ‘bad’.
Table 33: Tuitions during Lockdown
Tuitions Overall Private Public
Whether Attended Tuitions
Yes, attends online tuitions 23% 25% 17%
Yes, attends tuitions outside of home 17% 18% 16%
Yes, attends tuitions both online and outside 7% 6% 7%
No, does not attend tuitions 53% 51% 60%
Whether Class Teacher took tuitions
Yes 53% 58% 37%
No 47% 42% 63%
Inference:
23% respondents said their children attended online tuitions, while 17% attended tuitions physically, 7%
did both.
The high percent of teachers taking tuitions (53%) shows teachers acted as a means to student
engagement in the lockdown.
Impact of COVID-19 in Mumbai 35
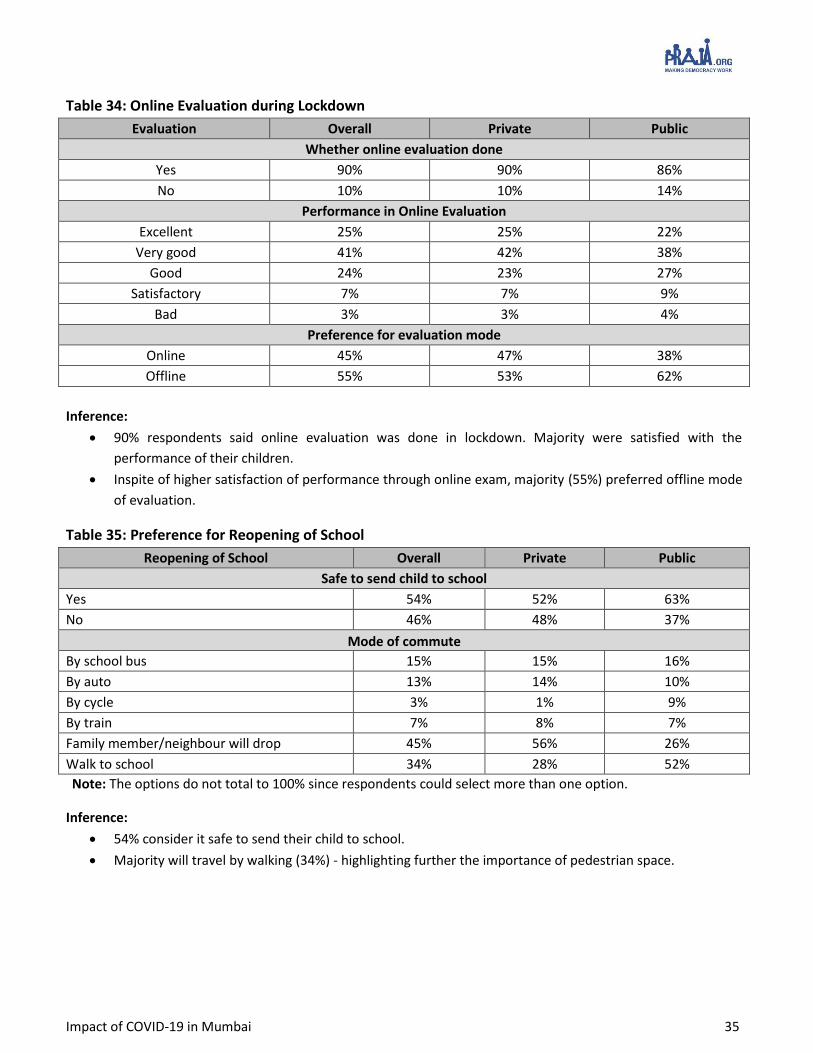
Table 34: Online Evaluation during Lockdown
Evaluation Overall Private Public
Whether online evaluation done
Yes 90% 90% 86%
No 10% 10% 14%
Performance in Online Evaluation
Excellent 25% 25% 22%
Very good 41% 42% 38%
Good 24% 23% 27%
Satisfactory 7% 7% 9%
Bad 3% 3% 4%
Preference for evaluation mode
Online 45% 47% 38%
Offline 55% 53% 62%
Inference:
90% respondents said online evaluation was done in lockdown. Majority were satisfied with the
performance of their children.
Inspite of higher satisfaction of performance through online exam, majority (55%) preferred offline mode
of evaluation.
Table 35: Preference for Reopening of School
Reopening of School Overall Private Public
Safe to send child to school
Yes 54% 52% 63%
No 46% 48% 37%
Mode of commute
By school bus 15% 15% 16%
By auto 13% 14% 10%
By cycle 3% 1% 9%
By train 7% 8% 7%
Family member/neighbour will drop 45% 56% 26%
Walk to school 34% 28% 52%
Note: The options do not total to 100% since respondents could select more than one option.
Inference:
54% consider it safe to send their child to school.
Majority will travel by walking (34%) - highlighting further the importance of pedestrian space.
Impact of COVID-19 in Mumbai 36
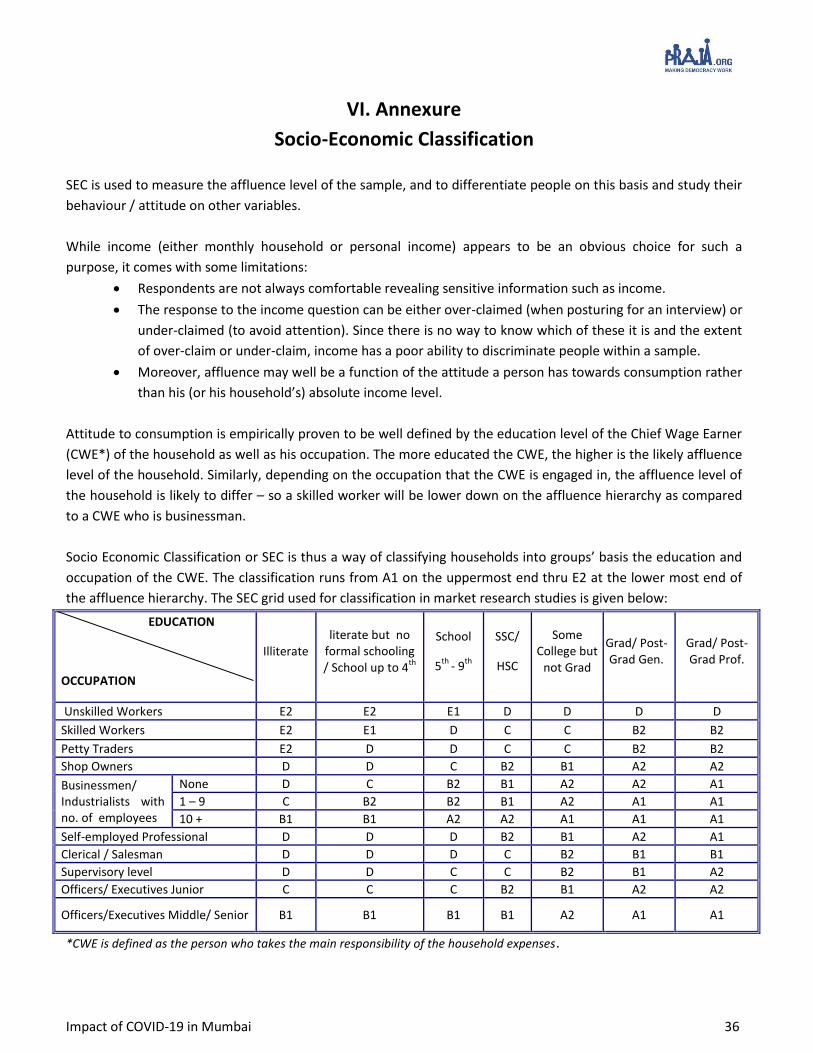
VI. Annexure
Socio-Economic Classification
SEC is used to measure the affluence level of the sample, and to differentiate people on this basis and study their
behaviour / attitude on other variables.
While income (either monthly household or personal income) appears to be an obvious choice for such a
purpose, it comes with some limitations:
Respondents are not always comfortable revealing sensitive information such as income.
The response to the income question can be either over-claimed (when posturing for an interview) or
under-claimed (to avoid attention). Since there is no way to know which of these it is and the extent
of over-claim or under-claim, income has a poor ability to discriminate people within a sample.
Moreover, affluence may well be a function of the attitude a person has towards consumption rather
than his (or his household’s) absolute income level.
Attitude to consumption is empirically proven to be well defined by the education level of the Chief Wage Earner
(CWE*) of the household as well as his occupation. The more educated the CWE, the higher is the likely affluence
level of the household. Similarly, depending on the occupation that the CWE is engaged in, the affluence level of
the household is likely to differ – so a skilled worker will be lower down on the affluence hierarchy as compared
to a CWE who is businessman.
Socio Economic Classification or SEC is thus a way of classifying households into groups’ basis the education and
occupation of the CWE. The classification runs from A1 on the uppermost end thru E2 at the lower most end of
the affluence hierarchy. The SEC grid used for classification in market research studies is given below:
EDUCATION
OCCUPATION
Illiterate literate but no
formal schooling / School up to 4
th
School
5th
- 9th
SSC/
HSC
Some College but
not Grad
Grad/ Post-Grad Gen.
Grad/ Post-Grad Prof.
Unskilled Workers E2 E2 E1 D D D D
Skilled Workers E2 E1 D C C B2 B2
Petty Traders E2 D D C C B2 B2
Shop Owners D D C B2 B1 A2 A2
Businessmen/ Industrialists with no. of employees
None D C B2 B1 A2 A2 A1
1 – 9 C B2 B2 B1 A2 A1 A1
10 + B1 B1 A2 A2 A1 A1 A1
Self-employed Professional D D D B2 B1 A2 A1
Clerical / Salesman D D D C B2 B1 B1
Supervisory level D D C C B2 B1 A2
Officers/ Executives Junior C C C B2 B1 A2 A2
Officers/Executives Middle/ Senior B1 B1 B1 B1 A2 A1 A1
*CWE is defined as the person who takes the main responsibility of the household expenses.