Embed Size (px)
Citation preview

European and world demand for biomass for the purpose of biofuelproduction in relation to supply in the food and feedstuff markets.
REPORT ON GLOBAL MARKET SUPPLY 2020/2021
UNION ZUR FÖRDERUNG VON OEL- UND PROTEINPFLANZEN E. V.
2 Introduction
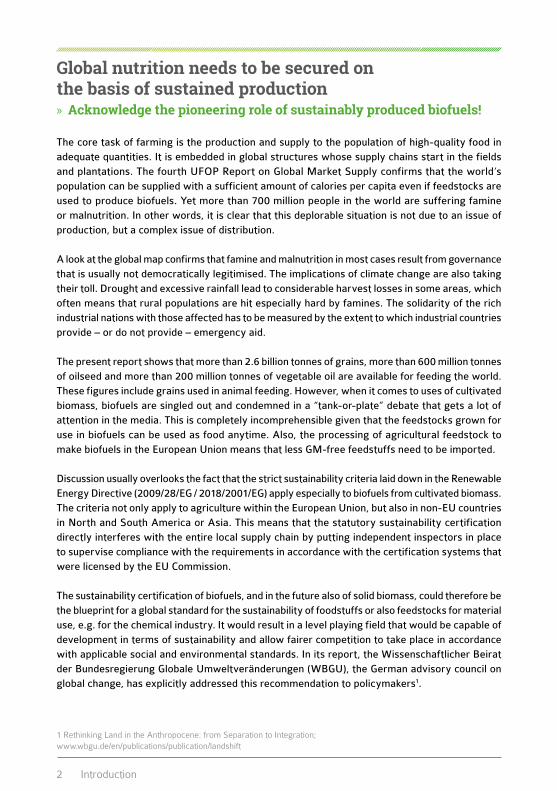
Global nutrition needs to be secured on the basis of sustained production » Acknowledge the pioneering role of sustainably produced biofuels!
The core task of farming is the production and supply to the population of high-quality food in adequate quantities. It is embedded in global structures whose supply chains start in the fields and plantations. The fourth UFOP Report on Global Market Supply confirms that the world‘s population can be supplied with a sufficient amount of calories per capita even if feedstocks are used to produce biofuels. Yet more than 700 million people in the world are suffering famine or malnutrition. In other words, it is clear that this deplorable situation is not due to an issue of production, but a complex issue of distribution.
A look at the global map confirms that famine and malnutrition in most cases result from governance that is usually not democratically legitimised. The implications of climate change are also taking their toll. Drought and excessive rainfall lead to considerable harvest losses in some areas, which often means that rural populations are hit especially hard by famines. The solidarity of the rich industrial nations with those affected has to be measured by the extent to which industrial countries provide – or do not provide – emergency aid.
The present report shows that more than 2.6 billion tonnes of grains, more than 600 million tonnes of oilseed and more than 200 million tonnes of vegetable oil are available for feeding the world. These figures include grains used in animal feeding. However, when it comes to uses of cultivated biomass, biofuels are singled out and condemned in a “tank-or-plate” debate that gets a lot of attention in the media. This is completely incomprehensible given that the feedstocks grown for use in biofuels can be used as food anytime. Also, the processing of agricultural feedstock to make biofuels in the European Union means that less GM-free feedstuffs need to be imported.
Discussion usually overlooks the fact that the strict sustainability criteria laid down in the Renewable Energy Directive (2009/28/EG / 2018/2001/EG) apply especially to biofuels from cultivated biomass. The criteria not only apply to agriculture within the European Union, but also in non-EU countries in North and South America or Asia. This means that the statutory sustainability certification directly interferes with the entire local supply chain by putting independent inspectors in place to supervise compliance with the requirements in accordance with the certification systems that were licensed by the EU Commission.
The sustainability certification of biofuels, and in the future also of solid biomass, could therefore be the blueprint for a global standard for the sustainability of foodstuffs or also feedstocks for material use, e.g. for the chemical industry. It would result in a level playing field that would be capable of development in terms of sustainability and allow fairer competition to take place in accordance with applicable social and environmental standards. In its report, the Wissenschaftlicher Beirat der Bundesregierung Globale Umweltveränderungen (WBGU), the German advisory council on global change, has explicitly addressed this recommendation to policymakers1.
1 Rethinking Land in the Anthropocene: from Separation to Integration; www.wbgu.de/en/publications/publication/landshift

3Introduction
However, the framework of actions the EU Commission announced as part of the European Green Deal gives rise to fears that Europe will unilaterally stipulate extensification measures that will counteract the necessary acceleration of the sustainable intensification of conventional arable farming. European farmers are denied advanced options that are available to non-EU countries and urgently needed to win the race against climate change, such as key technologies in plant breeding (e.g. CRISPR/Cas).
It must be feared that the competition-distorting differences between the EU and the large overseas agricultural producers will become even larger and the increasingly strict EU environmental standards will be undermined by imports. Trade agreements alone are not a sufficient instrument to prevent such development. In fact, major agricultural exporters are already preparing for another boost in their shipments to the EU in the wake of the Green Deal.
The complexity of this challenge is reflected in the EU Commission‘s announcement to provide a code of conduct for a sustainable food supply chain. Since these measures are voluntary, they are not as binding as the statutory regulations of the Renewable Energy Directive and do not solve the issue of the reductions in productivity that can be expected. This makes dialogue with farmers all the more urgently needed to develop steps to create a sustained and technologically optimised perspective, above all, for young farmers to safeguard their future. What use are actions and concepts if there is nobody left to implement them?
Detlef Kurreck Detlef Kurreck, Chairman of the Union zur Förderung von Oel- und Proteinpflanzen e. V.
Quick information on UFOP e. V.:
The Union for the Promotion of Oil and Protein Plants e. V. (UFOP) represents the political interests of companies,
associations and institutions involved in the production, processing and marketing of domestic oil and protein plants in
national and international bodies. UFOP supports research to optimise agricultural production and for the development
of new recycling opportunities in the food, non-food and feed sectors. UFOP public relations aim to promote the
marketing of domestic oil and protein plant end products. (https://www.ufop.de/english/news)

4 Content
Table of Contents
» 1 Feedstock supply1.1 How much grain is produced on a global scale?
1.1.1. Global grain production1.1.2. Global stocks of grain1.1.3. Global grain supply
1.2. How much oilseed and vegetable oil is produced on a global scale? 1.2.1. Global oilseed production
� 1.2.1.1. Composition of oilseed crops1.2.2. Global vegetable oil production
� 1.2.2.1 Price developpement of vegetable oils1.2.3 Global oilseed supply
� 1.2.3.1 Global vegetable oil supply1.3. How much oilseed and grain including rice does each continent produce?
1.3.1 Production of grain1.3.2 Production of oilseeds
1.4 What products are made from grain? 1.4.1 Global use of grain
1.5 What products are made from oilseeds? 1.5.1 Global use of oilseeds
� 1.5.1.1 Global production of oils and meals1.6 Production of pulses
1.6.1. Production in the EU-27 � 1.6.1.1. Production in Germany
» 2 Production of biofuels2.1 Which countries promote biofuels?
2.1.1 Global output of bioethanol � 2.1.1.1 Key EU-28 bioethanol producers
2.1.2 Global output of biodiesel � 2.1.2.1 Key EU-28 biodiesel producers
2.2 What feedstocks are used in world biofuels production?2.2.1 Global resource bases for biodiesel
2.3 What feedstocks are used in European biodiesel fuel production?2.3.1 Resource bases for biodiesel in the EU-28
2.4. What feedstocks are used in the production of biodiesel used in Germany?2.4.1 Feedstocks of biofuels, consumed in Germany2.4.2 Greenhouse gas savings
2.5 Where do the feedstocks for biodiesel at German petrol stations come from?2.5.1 Origins of feedstocks for biodiesel used in Germany

5Content
» 3 Food security3.1 IstheresufficientrapeseedinGermany?
3.1.1. German rapeseed production and level of self-sufficiency � 3.1.1.1 Output of rapeseed meal with and without biodiesel fuel production
3.2 Why is demand for oilseeds increasing? 3.2.1 Global meat consumption3.2.2. Quota requirements to promote biofuels
3.3 What is the amount of grain and vegetable oil per person?3.3.1 Per capita supply of grain and vegetable oil
3.4 Why do people starve?3.4.1 The issue of distribution 3.4.2 Food availability and climate change
» 4 Use of land4.1 Does growing energy crops create a lack of land for food crops?
4.1.1 Shares of land used for global biofuels production4.1.2 Development of cropland
4.2 Is there a limit to the use of palm oil? 4.2.1 Global use of palm oil
4.3. What if there was no biodiesel? 4.3.1. Land required for soybeans if German biodiesel production did not exist
» 5 Development of prices5.1 Do biofuels push food prices up?
5.1.1 Comparison of prices of bread, bioethanol and grain5.1.2 Comparison of prices of biodiesel and vegetable oil
» 6 Statistics6.1 Note on handling statistics
6.1.1 Troubles with statistics
Editorial department, charts and descriptions:Agricultural Market Information Company (AMI)Department plant productionEditor in charge: Wienke von SchenckEditors: Steffen Kemper, Inger Mertenswww.ami.informiert.deCopyright for all charts: AMI GmbH

6 Feedstock supply
1 | F
eeds
tock
sup
ply

7Feedstock supply
1.1 How much grain is produced on a global scale? » 1.1.1 Global grain production
Even though optimal vegetation conditions did not prevail in all regions of the northern and southern hemispheres in 2020, global cereal production increased. This especially applies to maize (+2 per cent) and rice (+1,5 per cent). The global barley harvest was slightly lower at 0.6 percent, and the wheat harvest was barely larger than in the previous year (+0.1 percent). The previous year‘s result is exceeded by 1.6 per cent. Worldwide, a record production of just under 2.8 billion tonnes is expected in the 2020/21 marketing year. In general, as a result of progress in plant breeding, expansions in overall area and improvement of agricultural production practices (fertiliser applications, pest and disease control, reduced losses at harvest and in storage), world grain production has continuously increased over the past decades. Since 1971/72, the harvest volume of maize has almost quadrupled and that of wheat and rice has more than doubled. Record harvests in many growing regions led to a supply surplus on the markets. Maize is in first place, which underlines its growing global importance for supplying the animal feed sector and for bioethanol production (USA). Barley, like maize, is mainly used to feed livestock, while rice and wheat are primarily used for human consumption.
Global grain production exceeds 2.7 billion tonnes© AMI 2021 | Source: FAO

8 Feedstock supply
1.1 How much grain is produced on a global scale? » 1.1.2 Global stocks of grain
Due to significant harvest increases in grain cultivation, world grain stocks have grown. In the marketing years 2019/20 and 2020/21 production of wheat exceeded consumption. These stocks that are left at the end of a marketing year are the ending stocks that, as beginning stocks, ensure supply at the beginning of the following marketing year. In 2020/21, they are expected to reach 281 million tons, exceeding the previous year‘s level by 5 million tons.
In contrast, consumption of coarse grains, which are corn, barley, rye, oats, sorghum and meslin, will exceed harvest volumes, leading to a slight reduction in stocks, which could reach 413 million tons at the end of the marketing year.
Large harvests cause wheat stocks to grow© AMI 2021 | Source: FAO

9Feedstock supply
1.1 How much grain is produced on a global scale? » 1.1.3 Global grain supply
The ratio of supplies to consumption (also called the stock-to-use ratio) is a key figure in estimating supply and, consequently, potential price trends. Larger wheat production in 2020/21 is set to increase global stocks, although consumption is also expected to see a slight rise. Because global stocks are anticipated to rise more than consumption, the stock-to-use ratio will also increase. The expected 2020/21 ending stocks would, purely theoretically, cover 36.4 per cent of demand, which would be an exceptionally comfortable situation.
By contrast, 2020/21 consumption of coarse grains will probably rise more than stocks, reducing the stock-to-use ratio to 27 per cent. Although this decline seems to be relatively small, it falls short of the long-standing average of 28.1 per cent. This could lead to firming prices for coarse grains in the current crop year.
Supply and demand estimate based on the stock-to-use-ratio© AMI 2021 | Source: FAO

10 Feedstock supply
1.2 How much oilseed and vegetable oil is produced on a global scale?
» 1.2.1 Global oilseed production
In the marketing year 2020/21, production of oilseeds is likely to hit 597 million tonnes, up 4 per cent from the previous year. Global rise in demand for high-quality feed protein has been a key driver of North and South American soybean production for years now and is the main reason for the expansion in cultivation area. On a global scale, soybean is the number one oilseed crop, accounting for more than 61 per cent of world oilseed production.
Oilseed crops differ in oil and protein content as well as fatty acid composition and protein quality, along with their climate and soil requirements. These factors have a determining influence on the price of the oilseed crop in question. This especially applies to protein quality, because soybean is also the most valuable source of protein in terms of quality. For this reason, rapeseed breeders are working intensively on improving the protein quality of rapeseed.
Soybeans are the world‘s no. 1 oilseed crop
© AMI 2021 | Source: FAO, USDA

11Feedstock supply
1.2 How much oilseed and vegetable oil is produced on a global scale?
» 1.2.1 Global oilseed production � 1.2.1.1 Composition of oilseed crops
Sunflowershavethehighestoilcontent
© AMI 2021 | Source: Handbuch der Lebensmitteltechnologie

12 Feedstock supply
1.2 How much oilseed and vegetable oil is produced on a global scale?
» 1.2.2 Global vegetable oil production
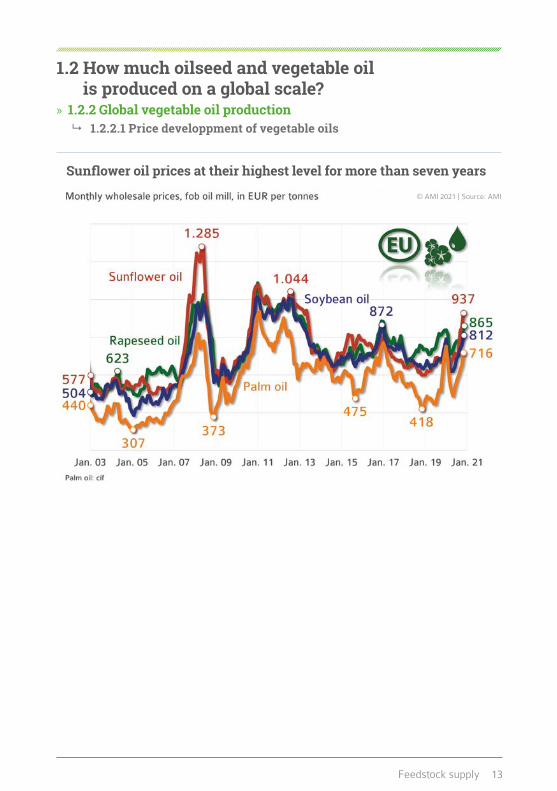
Output of vegetable oil increased rapidly over the past decades. Production of vegetable oil from the eight key oil-yielding crops amounted to approximately 209 million tonnes in the 2020/21 marketing year. This was more than twice the amount at the turn of the millennium. Together, palm and soybean oil, the world‘s most important oilseed crops, account for 65 per cent of global production. Rapeseed oil occupies third place, accounting for 13 per cent, followed by sunflower oil with almost 10 per cent of world output. Vegetable oils are not only used in human diets, but also as a feedstock for transport fuel production and other industrial purposes, such as soaps, surfactants for use in detergent production, operating supplies such as lubricating and hydraulic oils, release agents for industrial uses or base substance for cosmetic products. However, the oils are interchangeable, so that the lower-priced palm oil in particular has displaced or already displaced rapeseed oil from many areas of application. This price development is an expression of the supply surplus for vegetable oils and leads to quota adjustments for biofuel use (Brazil, Argentina and Indonesia see 3.2.2).
Palm oil strengthens its top position© AMI 2021 | Source: USDA
13Feedstock supply
1.2 How much oilseed and vegetable oil is produced on a global scale?
» 1.2.2 Global vegetable oil production � 1.2.2.1 Price developpment of vegetable oils
Sunfloweroilpricesattheirhighestlevelformorethansevenyears
© AMI 2021 | Source: AMI

14 Feedstock supply
1.2 How much oilseed and vegetable oil is produced on a global scale?
» 1.2.3 Global oilseed supply
The ratio of supplies to consumption (also called the stock-to-use ratio) is a key figure in estimating supply and, consequently, potential price trends. The stock-to-use ratio for sunflowerseed has been in decline for years now. It has also been falling for two years in the case of soybeans and rapeseed. Although record soybean harvests are steadily increasing supply, demand for soybean protein for animal feed, particularly in China, is also rising sharply. Due to the positive development of the economy and income in the world‘s most populous country, purchasing power is increasing and so is demand for meat and, consequently, oilseed meals to feed the growing numbers of livestock. While global soybean production has grown by 0.4 per cent over the past two years, global demand has increased by 7 per cent. This has been at the expense of stocks, causing the stock-to-use ratio of soybeans to fall sharply.
Largesupplyofsunflowerseed
© AMI 2021 | Source: USDA

15Feedstock supply
1.2 How much oilseed and vegetable oil is produced on a global scale?
» 1.2.3 Global oilseed supply � 1.2.3.1 Global vegetable oil supply
Rapeseed oil supply continues to decline
© AMI 2021 | Source: USDA
16 Feedstock supply
1.3 How much oilseed and grain (including rice) does each continent produce?
» 1.3.1 Production of grain
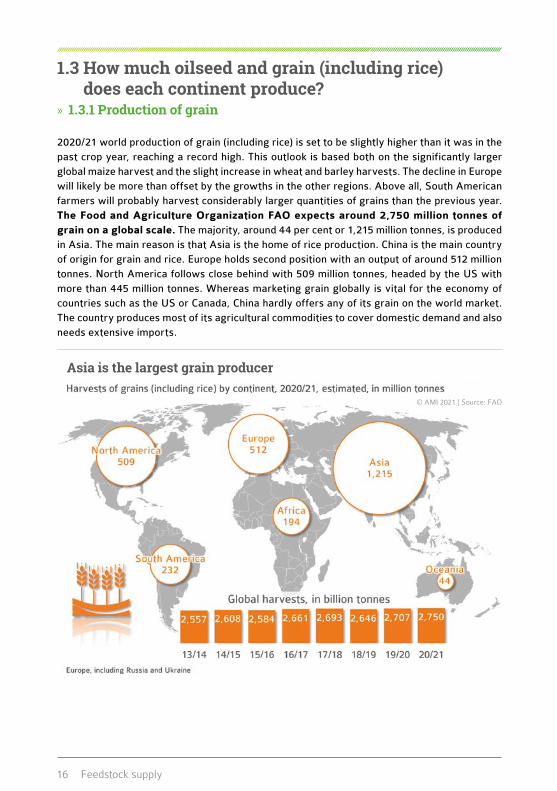
2020/21 world production of grain (including rice) is set to be slightly higher than it was in the past crop year, reaching a record high. This outlook is based both on the significantly larger global maize harvest and the slight increase in wheat and barley harvests. The decline in Europe will likely be more than offset by the growths in the other regions. Above all, South American farmers will probably harvest considerably larger quantities of grains than the previous year. The Food and Agriculture Organization FAO expects around 2,750 million tonnes of grain on a global scale. The majority, around 44 per cent or 1,215 million tonnes, is produced in Asia. The main reason is that Asia is the home of rice production. China is the main country of origin for grain and rice. Europe holds second position with an output of around 512 million tonnes. North America follows close behind with 509 million tonnes, headed by the US with more than 445 million tonnes. Whereas marketing grain globally is vital for the economy of countries such as the US or Canada, China hardly offers any of its grain on the world market. The country produces most of its agricultural commodities to cover domestic demand and also needs extensive imports.
Asia is the largest grain producer
© AMI 2021 | Source: FAO
17Feedstock supply
1.3 How much oilseed and grain (including rice) does each continent produce?
» 1.3.2 Production of oilseeds
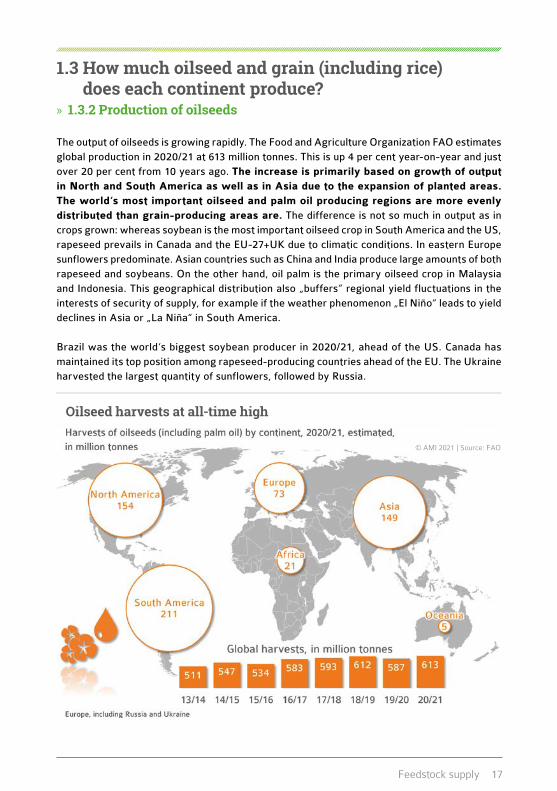
The output of oilseeds is growing rapidly. The Food and Agriculture Organization FAO estimates global production in 2020/21 at 613 million tonnes. This is up 4 per cent year-on-year and just over 20 per cent from 10 years ago. The increase is primarily based on growth of output in North and South America as well as in Asia due to the expansion of planted areas. The world‘s most important oilseed and palm oil producing regions are more evenly distributed than grain-producing areas are. The difference is not so much in output as in crops grown: whereas soybean is the most important oilseed crop in South America and the US, rapeseed prevails in Canada and the EU-27+UK due to climatic conditions. In eastern Europe sunflowers predominate. Asian countries such as China and India produce large amounts of both rapeseed and soybeans. On the other hand, oil palm is the primary oilseed crop in Malaysia and Indonesia. This geographical distribution also „buffers“ regional yield fluctuations in the interests of security of supply, for example if the weather phenomenon „El Niño“ leads to yield declines in Asia or „La Niña“ in South America.
Brazil was the world‘s biggest soybean producer in 2020/21, ahead of the US. Canada has maintained its top position among rapeseed-producing countries ahead of the EU. The Ukraine harvested the largest quantity of sunflowers, followed by Russia.
Oilseed harvests at all-time high
© AMI 2021 | Source: FAO

18 Feedstock supply
Grain is mainly used for feed production
1.4 What products are made from grain? » 1.4.1 Global use of grain
Global production of grains (excluding rice) in the 2020/21 marketing year amounted to an estimated 2.2 billion tonnes. The produce is intended for human consumption, but also used as a livestock feed and feedstock in bioethanol production. At 48 per cent, the largest part of the grain harvest goes into feeding troughs. Compared to the previous year, the trend is stable, in 2020/21, the share is likely to be slightly larger than in 2018/19. Although demand for grain for use in transport fuel production is expected to increase slightly, it accounts for less than one tenth of total consumption, the International Grain Council (IGC) has reported. This means that there is enough grain to meet the growing demand for food and feed.
In the US, bioethanol is mostly made from maize. The process generates Dried Distillers Grains with Solubles (DDGS), which is used as a protein feed. One tonne of wheat that is processed into bioethanol produces on average 295 kg of DDGS with a moisture content of 10 per cent. One tonne of maize yields 309 kg of DDGS. When grain prices are high, processing is the first activity to go down, before farmers begin to save on feed. The high added-value potential in the food markets ensures that grain mostly goes into the production of food when grain prices are high. The biofuels market serves as a “supply buffer” that ensures grain is constantly available for human consumption and feed.
© AMI 2021 | Source: IGC
19Feedstock supply
1.5 What products are made from oilseeds? » 1.5.1 Global use of oilseeds
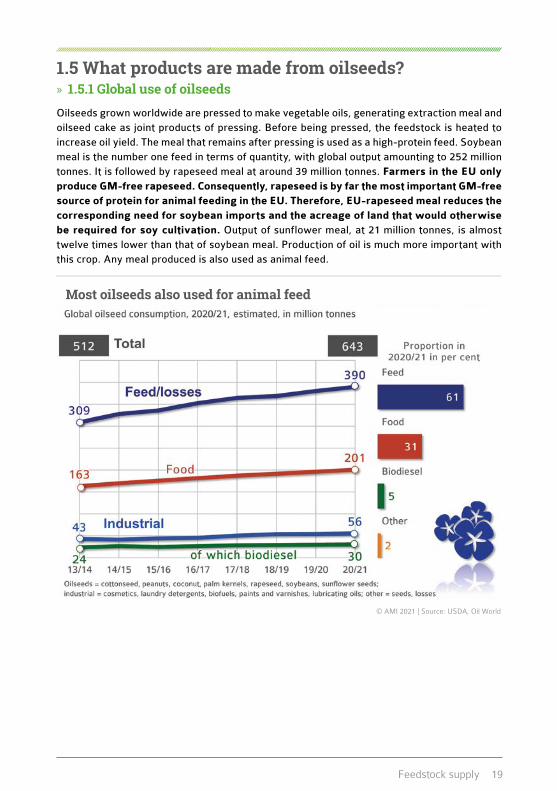
Oilseeds grown worldwide are pressed to make vegetable oils, generating extraction meal and oilseed cake as joint products of pressing. Before being pressed, the feedstock is heated to increase oil yield. The meal that remains after pressing is used as a high-protein feed. Soybean meal is the number one feed in terms of quantity, with global output amounting to 252 million tonnes. It is followed by rapeseed meal at around 39 million tonnes. Farmers in the EU only produce GM-free rapeseed. Consequently, rapeseed is by far the most important GM-free source of protein for animal feeding in the EU. Therefore, EU-rapeseed meal reduces the corresponding need for soybean imports and the acreage of land that would otherwise be required for soy cultivation. Output of sunflower meal, at 21 million tonnes, is almost twelve times lower than that of soybean meal. Production of oil is much more important with this crop. Any meal produced is also used as animal feed.
Most oilseeds also used for animal feed
© AMI 2021 | Source: USDA, Oil World

20 Feedstock supply
1.5 What products are made from oilseeds? » 1.5.1 Global use of oilseeds
� 1.5.1.1 Global production of oils and meals
Practical dual use of oilseeds© AMI 2021 | Source: Oil World

21Feedstock supply
1.6 Production of pulses » 1.6.1 Production in the EU-27
The production of legumes is gaining importance in the EU-27. In 2020 the total output amounted to 6.1 million tonnes. Two years ago, dry weather conditions had caused legume production to collapse. It has grown four per cent since then. The primary legume crop in the EU-27 is soybean, which accounts for 43 per cent. The 2020 soybean harvest was down around 200,000 tonnes to 2.6 million tonnes from the previous record year. The area planted with soybeans was larger than a year earlier, but yields declined around seven per cent compared to 2019. Feed pea was the second most important legume crop, accounting for just over one third of the total output. In 2020, feed pea production rose back up to 2.1 million tonnes. The increase is mainly due to an expansion in area, while yields were slightly lower than in 2019. Accounting for just less than 20 per cent, field bean ranked third most important legume crop. Its production has grown almost continuously since 1993, to 1.2 million tonnes in 2020. The volume of sweet lupins harvested across the EU came to approximately 200,000 tonnes.
Protein crops for livestock feeding purposes are in strong competition with imported soybeans and soybean meal. The latter are often lower priced, which makes them attractive for production of compound feeds.
Soybean remains main legume crop in the EU© AMI 2021 | Source: EU-Commission
22 Feedstock supply
1.6 Production of pulses » 1.6.1 Production in the EU-27
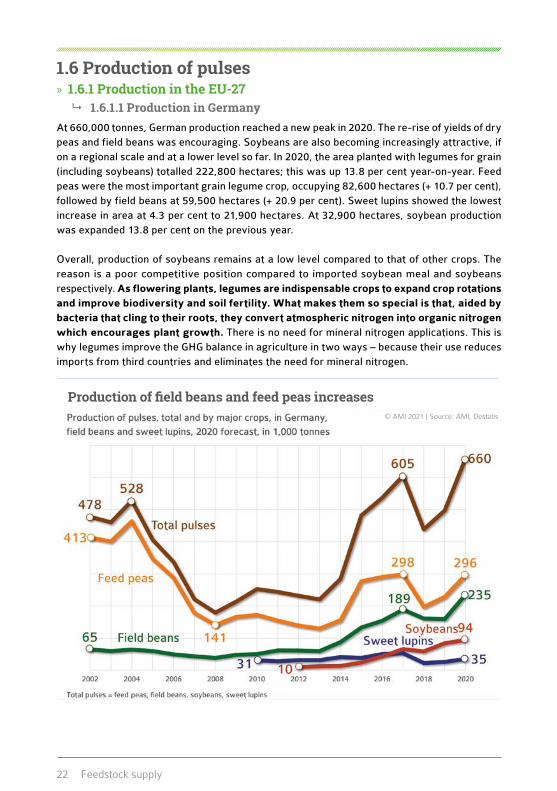
� 1.6.1.1 Production in GermanyAt 660,000 tonnes, German production reached a new peak in 2020. The re-rise of yields of dry peas and field beans was encouraging. Soybeans are also becoming increasingly attractive, if on a regional scale and at a lower level so far. In 2020, the area planted with legumes for grain (including soybeans) totalled 222,800 hectares; this was up 13.8 per cent year-on-year. Feed peas were the most important grain legume crop, occupying 82,600 hectares (+ 10.7 per cent), followed by field beans at 59,500 hectares (+ 20.9 per cent). Sweet lupins showed the lowest increase in area at 4.3 per cent to 21,900 hectares. At 32,900 hectares, soybean production was expanded 13.8 per cent on the previous year.
Overall, production of soybeans remains at a low level compared to that of other crops. The reason is a poor competitive position compared to imported soybean meal and soybeans respectively. As flowering plants, legumes are indispensable crops to expand crop rotations and improve biodiversity and soil fertility. What makes them so special is that, aided by bacteria that cling to their roots, they convert atmospheric nitrogen into organic nitrogen which encourages plant growth. There is no need for mineral nitrogen applications. This is why legumes improve the GHG balance in agriculture in two ways – because their use reduces imports from third countries and eliminates the need for mineral nitrogen.
Productionoffieldbeansandfeedpeasincreases© AMI 2021 | Source: AMI, Destatis

23Feedstock supply

24 Production of biofuels
2 | P
rodu
ctio
n of
bio
fuel
s

25 Production of biofuels
2.1 Which countries promote biofuels? » 2.1.1 Global output of bioethanol
Worldwide almost 110 million m3 of bioethanol were produced in 2019. This saves fossil-energy sources and cut down on greenhouse gas emissions. Politics is a key factor in this by defining blending quota requirements, which exercises a direct influence on the amount of bioethanol produced. For example, in the US the blending rate was raised from 10 per cent to 15 per cent after the rate of 10 per cent was actually reached. In China, official steps taken to boost grain processing as a means of curbing local surpluses contributed to an increase in bioethanol production. The consumption of grain and sugar for the global production of bioethanol continues to grow, especially outside the US in China and South America. The use of grain (especially maize) as a feedstock is expected to rise by 6.3 per cent to 167.8 million tonnes in 2020/21. According to the FAO, global cereal production (including rice) will hit a new high of 2.75 billion tonnes.
Worldwide almost 110 (2018: 108) million m3 of bioethanol were produced in 2019. The main producers are by far the US. About 59.7 million m3 were produced there in 2019 which was 2 per cent less than in the previous year. Bioethanol in the US was produced of 98 per cent corn and 2 per cent on other kinds of biomass. The second largest bioethanol-producing country is Brazil with 32.4 million m3 based on sugar from sugar cane. In EU-28, about 5.2 million m3 of bioethanol were produced from cereals and sugar beet in 2019.
BioethanolproductioninChinadecreasedsignificantly© AMI 2021
Source: RAF, OECD

26 Production of biofuels
2.1 Which countries promote biofuels? » 2.1.1 Global output of bioethanol
� 2.1.1.1 Key EU-28 bioethanol producers
Great Britan reduces production of biothanol by almost half
© AMI 2021 Source: FAS, nationale statistics

27 Production of biofuels
2.1 Which countries promote biofuels? » 2.1.2 Global output of biodiesel
The single most important biodiesel producer is the European Union, which accounted for 33 per cent of global output of nearly 46 million tonnes in 2019. The term “biodiesel” is used in the statistics to refer to biodiesel (FAME = fatty acid methyl ester), hydrogenated vegetable oil (HVO) and biofuels made by co-processing vegetable oils in petroleum refineries. Whereas in Europe the primary feedstock is rapeseed oil, soybean oil is the primary source on the American continent and palm oil in Asia. Soybean oil is a “by-product“ of soybean processing. Globally rising demand for soybean meal for animal feeding is the true driver of the expansion in area planted with soy in Brazil and Argentina. Global biodiesel production is concentrated in the EU-28, the US, Indonesia and Brazil.
The top producers of palm oil, Indonesia and Malaysia, have become increasingly important in the biodiesel market. As a result of the strong expansion in production capacities in the period between 2017 and 2019, Indonesia today is the second largest biodiesel producer worldwide. In the same period, Malaysia virtually doubled its output. These increases in production came in response to growing glut in the vegetable oil markets and the pressure on prices associated with it. Contrary to the EU, these countries have been raising their national blending quota requirements steadily (Indonesia: B20 / B30) to stabilise producer prices and cut foreign exchange spending on mineral oil imports. Global output of vegetable oil is set to reach just about 210 million tonnes in the crop year 2020/2021, exceeding the level of 200 million tonnes for the third year running.
EU-28 accounts for about one third of global biodiesel production© AMI 2021 | Source: FAS, Oil World

28 Production of biofuels
2.1 Which countries promote biofuels? » 2.1.2 Global output of biodiesel
� 2.1.2.1 Key EU-28 biodiesel producers
Germany remains largest biodiesel producer in the EU-28
© AMI 2021 Source: FAS

29 Production of biofuels
2.2 What feedstocks are used in world biofuels production?
» 2.2.1 Global resource bases for biodiesel
Production of biodiesel and, consequently, demand for feedstock have increased all over the world. 2019 overall feedstock use climbed more than 11 per cent over 2018 to approximately 46 million tonnes. Palm oil accounts for 39 per cent of the global resource basis, soybean oil for 25 per cent and rapeseed oil for 14 per cent, whereas used cooking fats make up 11 per cent and so do animal fats and other fats. Palm oil recorded an increase of 4 per cent over 2018, whereas soybeans and rapeseed oil saw slight declines at 1 percentage point and 2 percentage points respectively. One can expect that soybean-based and palm oil-based biofuel production will continue to grow in the Americas and Southeast Asia as a consequence of the national quota and biofuels policies. In the EU-27, the proportion of biodiesel from rapeseed oil and waste oils and fats is expected to climb at the expense of palm oil. The reason is the national implementation of the Renewable Energy Directive (2018/2001/EG) – RED II. The directive phases out inclusion of biofuels based on high iLUC risk feedstocks. Regulations in Germany, France and other member states stipulate that, by the end of 2026 or earlier, credits towards achieving national quota obligations will no longer be given for palm oil. The UFOP therefore expects an increase in demand for sustainable certified rapeseed oil from European production.
Shares of palm oil and the total amount increased© AMI 2021 | Source: Oil World

30 Production of biofuels
2.3 What feedstocks are used in European biodiesel fuel production?
» 2.3.1 Resource bases for biodiesel in the EU-28
Availability and selling prices of vegetable and animal oils and fats have a determining influence on the use of these commodities, including in biodiesel fuel production. Rapeseed oil is the primary feedstock source for biodiesel production in the European Union, but its share dwindles. In 2019 it fell to 38 per cent, from 46 per cent in 2016. On the other hand, the use of used cooking oil has increased dramatically as policy continues to promote its use. In the EU, with the exception of Germany, biofuels from waste and residues count double towards national quota obligations to meet the mandatory share of renewable energy in the transport sector for all member states (10 percent in 2020, 14 percent in 2030). By contrast, competition from low-price feedstocks from overseas hardly increased in 2019. The share of palm oil increased by only 1 per cent to 30 per cent. In countries such as Italy, Spain and the Netherlands, imported palm oil is the number one feedstock in biodiesel fuel production, whereas in Germany and France, the prime feedstock is rapeseed oil.
However, it must be noted that the statistical basis for the share of feedstock is very different depending on the “source” and cannot be adopted uncritically. In the new version of the RED II the reporting and documentation requirements are tightened and specified. There is no absolute or official data on the share of feedstock of biofuels consumed in the EU.
Rapeseed oil reduced and replaced by used cooking oil© AMI 2021 | Source: Oil World

31 Production of biofuels
2.4 What feedstocks go into the production of biodiesel used in Germany?
» 2.4.1 Shares of feedstock in biodiesel consumed
In Germany in 2019, just about 2.35 million tonnes of biodiesel (including HVO) were used as a blending component in diesel fuel. This was up just over 1 per cent on 2018. In other words, the rise in January 2017 of the cap on greenhouse gas (GHG) emissions from 3.5 to 4 per cent had hardly any noticeable effect. The reason is improved GHG efficiency of biofuels used (2.4.2). Relative to the raise in quota obligations, less biofuel was needed to achieve compliance. Palm oil methyl ester increased remarkably in 2019 (+ 27 per cent), as did rapeseed oil (+ 18 per cent). Biofuels from used cooking oils and rapeseed oil are the most important sources of feedstock for biodiesel in Germany.
A distinction has to be made between domestic use for credits towards the cap on greenhouse gas emissions and production. According to the Verband der Deutschen Biokraftstoffindustrie (VDB), the German biofuels industry association, in 2019 about 3.4 million tonnes of biodiesel were produced in Germany. The primary feedstock was rapeseed oil – as it had been in previous years –, which accounted for 57 per cent. The use of used cooking oil and fats declined just less than 2 percentage points to 25 per cent year-on-year. The role of soybean oil, accounting for 11 per cent, grew somewhat compared to 2018 (approximately 8 per cent). The percentage of palm oil remained unchanged from the previous year at a relatively low 2 per cent. Animal fats, fatty acids and other feedstocks together accounted for no more than 5 per cent.
Share of rapeseed oil in biodiesel increased
© AMI 2021 | Source: BAFA, BLE

32 Production of biofuels
2.4 What feedstocks go into the production of biodiesel used in Germany?
» 2.4.2 Greenhouse gas savings
Greenhouse gas savings decrease by one percentage point
© AMI 2021 | Source: BLE

33 Production of biofuels
2.5 Where do the feedstocks for biodiesel at German petrol stations come from?
» 2.5.1 Origins of feedstocks for biodiesel used in Germany
In 2019, a total of 2.4 million tonnes of feedstocks were used to produce the biodiesel/HVO/vegetable oil that was placed on the market. More than a half of it (around 54 per cent) came from Europe, mostly from Germany. The use of rapeseed oil amounted to 790,000 tonnes, most of which was sourced in Europe, except for a small amount that came from Australia. The amount of biodiesel from waste oils (used cooking fats, used deep-frying oils, etc.) has decreased by 19 per cent compared to the previous year, but is still higher than the amount of biodiesel made from rapeseed oil. Most of the steadily increasing volume of imported used cooking oils comes from Asia, as does about a quarter of the palm oil imports for biofuels to count towards the quota obligation in 2019 (Indonesia and Malaysia, see 2.4.1).
In Germany, the biomass used in biofuel production is systematically recorded in high-quality in the „Nabisy“ database and published in the annual Experience and Evaluation Report of the Federal Office for Agriculture and Food (BLE). The unique traceability system exclusively centers on biofuels marketed as transport fuels and heating fuels (CHP plants). These sustainable biofuels can then be counted towards the quota of greenhouse gas (GHG) emission reduction. Exports are excluded, but analog evidence of conformity must be provided, if they are to be counted towards renewable quota obligations in any other EU country. The chart below shows only the part of the feedstock origins for which biodiesel or HVO production was imported to Germany and counted towards the GHG reduction obligation.
Most feedstock sourced in Europe
© AMI 2021 | Source: BLE

34 Food security
3 | F
ood
secu
rity

35Food security
3.1IstheresufficientrapeseedinGermany? » 3.1.1Germanrapeseedproductionandlevelofself-sufficiency
Supply of rapeseed depends foremost on the domestic harvest volume and consumption. As one of the world‘s largest oilseed-processing countries, Germany needs imported oilseeds, mostly rapeseed (approximately 54 per cent), in addition to oilseeds from its domestic crop. In 2019/20, Germany processed 11.7 million tonnes of oilseeds, of which 75 per cent (approximately 8.8 million tonnes) were rapeseed. More than 50 per cent of this demand was covered by rapeseed from abroad, with the majority coming from EU countries. But Ukraine also contributed considerable quantities with 992,000 tonnes. This was a third more than in the previous year.
In 2014/15, domestic rapeseed still accounted for two-thirds of processing in German oil mills; in 2019/20, it was only a good 40 per cent. In the past six years, the share of domestic rapeseed has steadily declined as a result of lower cultivation areas and yields per hectare. In 2020, the German rapeseed harvest was again significantly larger than in the previous year at more than 3.5 million tonnes. The expectation of a rapeseed area of about 1 million ha for the 2021 harvest also leads us to expect higher production and thus a higher share of domestic rapeseed in processing.
In 2019/20, The total amount of rapeseed processed in Germany yielded 3.7 million tonnes of rapeseed oil. This was more than needed for the production of food and transport fuels and for uses in the oleochemical industry. About 1,2 million tonnes of rapeseed oil went to the German food industry, another 1,5 million tonnes to the engineering sector (biodiesel). 0.2 million t were used for feed purposes. More than 640,000 tonnes (net) of rapeseed oil were exported.
Smaller rapeseed harvest reduces share of processing
© AMI 2021 Sources: Stat. Bundesamt, BLE

36 Food security
3.13.1IstheresufficientrapeseedinGermany? » 3.1.1Germanrapeseedproductionandlevelofself-sufficiency
� 3.1.1.1 Output of rapeseed meal with and without biodiesel fuel productionThe feed market is one of the main beneficiaries of biodiesel production, because rapeseed meal is generated as a by-product of rapeseed oil production. And rapeseed meal is a key feedstuff. German rapeseed processing in 2019 amounted to 9.0 million tonnes, yielding 3.8 million tonnes of rapeseed oil and 5.2 million tonnes of rapeseed meal. Since rapeseed is produced in Europe without using genetic manipulation (GM), its by-product, rapeseed meal, is also classified as GMO-free. This classification promotes the use of rapeseed meal mainly in dairy feeding, where it can fully replace soybean meal and the corresponding imports from overseas. The key factor is demand for dairy products that qualify as “without GM”. The corresponding consumer demand thus also supports the regional production and processing of rapeseed. At the same time, the dependence on imports of GMO soy or GMO soy meal and thus the demand for crop land in third countries, especially Brazil, is reduced to a considerable extent.
Only about one third of the 3.8 million tonnes of rapeseed oil were used for human consumption, whereas 66 per cent were used for technical applications or energy production. If demand for rapeseed oil for use in biodiesel production were to shrink in the future, if biodiesel is no longer seen as a contribution towards decarbonising the transport sector, two thirds of today‘s rapeseed meal production would no longer be available. More soybean imports would be required to fill this gap, which in turn would have to be produced more in other regions. Last year, this would have corresponded to an additional demand of 1 million ha of soybean cultivation. Consequently, the situation would reverse the trend of promoting domestic GM-free protein sources. Since 2012, rapeseed meal accounts for half of the meal fed to animals in Germany.
No rapeseed methyl ester – less rapeseed meal© AMI 2021 | Source: BLE, AMI

37Food security
3.2 Why is demand for oilseeds increasing? » 3.2.1 Global consumption of meat by continent
World meat consumption multiplied in the past 60 years to around 320 million tonnes and is set to increase further in the years to come. The rise is not only a result of the growth in the world’s population. Meat consumption strongly depends on standard of living, eating habits, and on consumer price levels and macro-economic uncertainties. Compared to other raw materials, meat involves high production costs and is relatively expensive compared to other staple foods. As a result, demand for meat is related to higher incomes and the associated changes in diets that give preference to eating more protein from animal sources.
The growing demand for livestock provokes the need to produce more feed. Alongside grains, soybeans and rapeseed are the main crops used in feeds. Both soybeans and rapeseed are used to make protein feed meal. On a global scale, most soybeans are grown from genetically modified (GM) seed, as is rapeseed in Canada. The European Union exclusively grows GM-free oilseeds like rapeseed, sunflowers and soybeans. Since demand for produce declared as “without GM” is growing, production of GM-free products is increasingly based on national or European oilseeds. This aspect will gain more and more importance as a result of climate protection policy of the EU 27 (Green-Deal / Farm-to-Fork-Strategie) that gears the cultivation of raw materials increasingly to sustainability and greenhouse gas reduction.
Meat consumption on a steady rise© AMI 2021
Source: FAO, UNO

38 Food security
3.2 Why is demand for oilseeds increasing? » 3.2.2 Blending quotas for biodiesel
On a global scale, the largest driving force promoting biofuels are statutory blending requirements. The motivation of the various countries differs greatly. Whereas US and Brazilian interests focus on security of supply in the energy sector and reduction of fuel imports, the EU places great importance on climate protection and an increase in the overall proportion of renewable energy generated. The goals in Asian countries, such as Malaysia, Indonesia and China, but also in Argentina, are different again. In these countries, the main objective is to reduce vegetable oil surplus in an effort to stabilise market prices. These countries‘ national mandates for shares of volume or energy in fossil-energy diesel fuel range from 1 to 30 per cent.
The obligation to reduce GHG emissions, which was introduced in Germany in 2015, is truly unique in the world. Distributors (i.e. the petroleum companies) must provide evidence of compliance. Bioethanol plays the most important role in the majority of countries that have quota requirements. Again, its use is driven by oversupply in the grain and sugar markets. The biofuel funding policy‘s aim is not only to contribute to protecting the climate and natural resources, but also to reduce pressure on the market and, consequently, stabilise prices for farmers.
The major exporters of agricultural produce in particular can be expected to continue to pursue their previous biofuels policies in the national action plans for decarbonising the transport sector they are required to provide by 2020 (Paris climate protection agreement).
Blending quotas promote use of biofuels
© AMI 2021 Source: Biofuels Digest, FAS, national reports

39Food security
Africa continues to lose out
3.3 What is the amount of grain/vegetable oil per person? » 3.3.1 Supply per capita
Over the past 50 years the average per capita supply of the world‘s growing population of grain and vegetable oils was subject to fluctuations, but trended upward. In the 2020/21 marketing year, 349 kg of grain and 27 kg of vegetable oil per capita are expected to be available for all uses, which is a total of 5 kg per capita more than in the previous year. This figure includes all consumption, i.e. also use in animal feed, in fuel blends and other industrial uses.
In purely arithmetic terms, food supply is sufficient to feed the world‘s population. However, there are huge differences between regions. The difference in availability of agricultural feedstocks is primarily a result of distribution issues, rather than a result of global undersupply due to competing fuel and feed uses. Moreover, there are substantial differences in purchasing power in the different countries. This calculation takes into account both the cost of living and rate of inflation in the countries included. However, we still need a comparison between specific shopping baskets and habits of consumption (e.g. cassava, millet in Africa) that would allow us to draw conclusions on per capita purchasing power.
© AMI 2021 Source: FAO, USDA

40 Food security
3.4 Why do people starve? » 3.4.1 The issue of distribution
People in many parts of the world starve or are malnourished although in terms of figures there is adequate supply of the most important staple foods. Along with climate change and natural disasters, wars and forced migration are the main factors stoking hunger in the world. On top of this, international terrorism has become an increasing risk to people‘s lives and safety in a growing number of countries.
There are also other multiple and complex reasons for the shortage of food, such as climate change, dry spells, unjust distribution and a lack of democratic structures. All these factors prevent economies from booming, farmers from farming in a cost-efficient manner and countries from establishing democratic structures without maladministration or corruption. It is a striking fact that in past famines, it was almost always a combination of war and economic hardship with natural disasters such as dry spells that led to humanitarian emergencies. Countries having no structures for a functioning social system run a much higher risk of famine and malnutrition. Where an appropriate framework is in place, it could be used as a base on which to intensify locally adapted cultivation systems in a sustained manner and, by so doing, create the foundation for supply with food that is equally sustained.
The currency used to measure purchasing power is the international dollar, which is based on the US dollar. For example, the World Bank publishes a per capita purchasing power of around 57,690 international dollars in Germany for 2019, but only 780 international dollars in Burundi. Thus, despite an adequate supply of agricultural products, the available resources in countries with low purchasing power are not sufficient to buy the necessary amount of food.
Distribution issue just one of multiple reasons
© AMI 2021, Source: World Bank, USDA

41Food security
3.4 Why do people starve? » 3.4.2 Food availability and climate change
The implications of climate change, which vary locally, will have an impact on agricultural output.
In many regions, the adverse impact of climate change on crop yields and agricultural production could be partially offset by intensifying agricultural land management or expanding agricultural land. At the same time, small family farms have little access to innovative technologies and plant production methods, which makes it harder for them to adapt to a changing climate.
In comparison with the status quo, model calculations project that climate change will cause a falloff in agricultural output in many parts of Africa, the Middle East and India and South and Southeast Asia. In contrast, for countries at more northern latitudes, higher temperatures are expected to lead to a potential increase in agricultural production, such as in Canada and the countries of the Russian Federation.
Differences in access to markets and technologies (especially plant breeding methods) within and between countries will exacerbate the effects of climate change and potentially lead to a growing gap between developed and developing countries.
Changes in production due to climate change
© AMI 2021 Source: FAO

42 Land use
4 | L
and
use

43Land use
4.1 Does growing energy crops create a lack of land for food crops?
» 4.1.1 Shares of land used for biofuels production
In 2019, 1.11 billion ha of crops such as grain, oilseeds, protein, sugar and fibre plants, fruits, vegetables, nuts and others were grown worldwide. Most of this produce is used as food. Only around 7 per cent go into biofuels production.
Biofuel production is mostly located in countries where there is already a surplus of feedstock (especially maize, soy and palm oil) and legally prescribed blending obligations. If the surplus were not used to produce biofuels, it would have to be placed on the global market, where it would weigh heavily on already low feedstock prices.
The use in biofuel production reduces the production overhang, generates extra value added and reduces the need for foreign currency for imports of crude or fossil fuels. The latter is primarily a problem in poorer countries. Another advantage is the amount of high-quality protein feed that is generated in biofuel production, demand for which is steadily increasing. The amount and quality of these protein feeds have a strong influence on feedstock prices. Consequently, they also determine the amount of land dedicated to growing the feedstocks. In other words, biofuels are by no means the price drivers in the commodities markets. If necessary, the feedstocks grown for biofuel production are primarily available for food supply. In the case of politically subsidized extensification, this option for „buffering“ food demand is omitted.
Biofuels take up little space
© AMI 2021 Source: OECD, USDA, Oil World

44 Land use
4.1 Does growing energy crops create a lack of land for food crops?
» 4.1.2 Development of cropland
The primary purpose of agriculture has always been to feed people. The continuous growth in population and changes in eating habits due to higher incomes call for sustained intensification and increases in agricultural production. In the northern hemisphere, particularly in the EU 27, yields are declining as a result of extensification requirements, stricter regulations and the prevention of the use of innovative breeding methods. At the same time, climate change is reducing yields due to a lack of rainfall.
In the southern hemisphere, increases in yields are based not only on the use of progress in production technology (plant breeding, seeds, fertilisers, plant protection, agricultural technology), but above all on the increase in arable land as a result of changes in use, in the worst case of clearing primeval forest. The conversion of primeval forest and other land necessary for environmental and climate protection is increasingly meeting with public and political resistance. Therefore, binding sustainability requirements must be created for all cultivation regions. On the basis of these, biomass production must be certified and its origin made concretely traceable. In the revision of the European Renewable Energy Directive (RED II), the EU‘s biofuels policy defines more stringent documentation requirements and greenhouse gas reduction requirements, for the first time also for solid biomass. At the same time, in light of the changes in land use in South America and Asia (clearing primeval forest), there are growing calls to develop these system requirements further and lay them down in legislation. The aim should be to create a level playing field for global fair competition without any environmental or social dumping.
Less land in agricultural use in the northern, increasingly more in the southern hemisphere
© AMI 2021 | Source: FAO

45Land use
4.2 Is there a limit to the use of palm oil? » 4.2.1 Global use of palm oil
Oil palm is the single most important oleaginous fruit crop in Southeast Asia, but is also grown to a considerable extent in Colombia and Nigeria. Like all vegetable oils, palm oil has many uses: be it in food, products such as detergents and cosmetics, or as a biofuel feedstock. Globally, almost 75 million tonnes of palm oil were consumed in 2020. The majority is used as edible oil in Southeast Asia. Food uses account for 68 per cent, energy uses for 22 per cent (e.g. biodiesel) and oleochemical uses for 9 per cent of overall consumption. Global palm oil production is increasing due to the expansion in area by clearing primeval forest legally and illegally and replanting with high-yielding hybrid varieties.
However, the growth in global demand is lagging behind. This has the result that more and more palm oil surplus is processed into biodiesel in the main palm oil producing countries and governments are raising blending quota requirements step by step. In Indonesia, the quota for non-public transport is already at 30 per cent. The EU wants to curb the use of palm oil in biodiesel by no longer allowing biofuels made from this raw material to count towards blending obligations from 2030 at the latest. Member states like Germany prefer this exclusion - palm oil can no longer be counted towards climate protection targets from 2026. Nevertheless, palm oil consumption is likely to continue to increase in the coming years, especially in the food sector and in regions where sustainability standards play a subordinate role despite the Paris climate protection agreement.
Palm oil is primarily food
© AMI 2021 | Source: Oil World, USDA

46 Land use
4.3 What if there was no biodiesel? » 4.3.1 Land required for soybeans if German biodiesel
production did not existDemand for vegetable protein for animal feed and the human diet is rising all round the world. Consequently, self-sufficiency in feed protein from rapeseed meal takes on special importance. What makes this kind of feed protein so special is that it is GM-free. It is also lower priced than adequate alternatives, such as GM-free soybean meal, and it generally has short distances for transport and processing. In Germany, there are 13 locations that process rapeseed into oil and meal. The by far most important market for rapeseed oil is processing into biodiesel, which is blended with fossil diesel at up to 7 per cent (vol). If demand for rapeseed oil for this purpose were to decline as a consequence of political decisions, supply of domestic GM-free rapeseed meal would dwindle at the same time. However, the latter is urgently needed. Germany‘s annual demand is at around 7.5-8 million tonnes. The “without GM” label known from many milk and dairy products is possible because the animals are fed with rapeseed meal. Without sales of rapeseed oil-based biodiesel, supply of rapeseed meal would decrease approximately 2.9 million tonnes and have to be offset by more expensive soybean imports. Taking into account that soybeans have a better feed value, imports would have to amount to just about 2.3 million tonnes. Their production would require just less than 1 million hectares of land, an area larger than the island of Cyprus. Production of rapeseed meal is tightly linked with biodiesel production and, accordingly, reduces the pressure on land, for example by 1 million hectares in Brazil. In view of the deforestation of primeval forest in South America, policymakers are pursuing the strategy of “deforestation-free” feedstuff procurement – this includes rapeseed meal from biodiesel production.
Biodiesel or deforestation
© AMI 2021 | Source: AMI

47Land use

48 Development of prices
5 | D
evel
opm
ent o
f pri
ces

49Development of prices
5.1 Do biofuels push food prices up? » 5.1.1 Comparison of prices of bread, bioethanol and grain
Wheat is used for both food production and bioethanol production. Many people argue that production of biofuels causes a shortage in this feedstock for food production and drives wheat prices. This cannot be confirmed, as the following example of wheat-rye bread prices shows. Feedstock supply and price trends at the producer level barely have an impact on the development of prices for bread. In the 2020/21 crop year, this was especially evident: despite wheat harvest declines in Germany and price increases for soft wheat in September/October 2020, consumer prices for wheat and rye bread dropped and are currently at a more than three-year low. One reason is that in Germany raw material only accounts for approximately 15 cents of the costs in a one-kilo loaf of wheat and rye bread. The explosion of prices for agricultural commodities all over the world in 2007 and 2008 and the accompanying volatility of prices for staple foods have moved the issue of global food and biofuels policies to the fore. Continuing famine and poverty since then have also been associated with changes in international prices for agricultural feedstock as a result of biofuels production. However, 2020/21 global grain production will once again be abundant, as it was in previous years. The level of self-sufficiency in grains within the EU is at 106 per cent. In recent years, the EU consistently produced more grains than it consumed, which enabled the EU to export and build up stocks. In terms of global output, there can, therefore, be no question of shortage. As the chart shows, demand for agricultural feedstocks for use in biofuels production only has a minor inflationary impact on prices. Although both wheat and bioethanol prices went up, there is no direct correlation between the two. If anything, demand for biofuels stabilises producer prices, in fact also to the benefit of agriculture in developing countries.
Price comparison of bread, bioethanol and grain
© AMI 2021 | Source: AMI/LK/MIO, AMI Consumer Price Panel

50 Development of prices
5.1 Do biofuels push food prices up? » 5.1.2 Comparison of prices of biodiesel and vegetable oil
The corona crisis led to a decline in fuel consumption in the spring of 2020. Prices for biodiesel and vegetable oil also followed this trend, reaching a multi-year low in May 2020. The subsequent recovery phase revved up demand, with an appreciable recovery of prices in the month that followed. The blended amounts of biodiesel increased even faster than the consumption of mineral diesel. Consequently, biodiesel use for blending in Germany reached a record high at 9.7 per cent in September 2020. The reason was that greenhouse gas reduction obligations were raised from 4 per cent to 6 per cent for 2020.
Vegetable oil prices showed a similar pattern in 2020. Prices dropped in the first coronavirus wave until the end of May and rebounded in the months that followed. In other words, there is nothing to confirm the assumption that biofuels make food, such as vegetable oil, more expensive. Looking back at earlier years, especially the second half of 2018, it is evident that price increases for biodiesel did not have any impact on the vegetable oil market. The reason is that vegetable oil prices do not depend on demand for biofuels alone. A much stronger impact usually comes from changes in international forward prices for palm oil and soybean oil, the most important vegetable oils on the world market in terms of volume. These oils determine the global development of vegetable oil prices due to their increasing supply. In summary, however, it must be pointed out that the interaction effects are generally very complex.
Corona clearly shows effect
© AMI 2021 | Source: AMI

51Development of prices

52 Statistics
6 | S
tati
stic
s

53Statistics
6.1 General notes on handling statistics » 6.1.1 Pitfalls of statistics
Every argument, especially in the discussion about trend-setting decisions regarding the medium and long-term supply of food, must be based on reliable figures. But this is not so easy. How trustworthy is the data source? What is the intention behind it? And even if the data are objective: Is the glass half full or half empty? And finally - how accurate is it exactly?
This problem can be seen especially in statements of quantity. Nobody has ever counted the quantities. They are based on assumptions and derivations. This method can be very precise, e.g. when the statement of quantity is linked to a government subsidy. However, it is mostly based on empirical information that is validated by reportable movements of volumes. Accurate statistics are quite costly and impossible to carry out across the board, and, unfortunately, each gap makes the picture blurrier. Temporal shifts have an additional effect. Volumes are also not entirely static: whilst the documentation and reports for goods received are being prepared, those same stocks have sometimes already been shipped out again.
Exact time periods help, but there are interpretative risks here too. The best example is the crop years: Whereas a calendar year lasts from 01 January up to 31 December, the crop year depends on the produce and time of harvest. This is straightforward for Germany – the crop year for grain/oilseeds lasts from 01 July to 30 June. In the US, there are different crop years for soybeans (starting 01 September) and rapeseed (starting 01 June). And when the southern hemisphere comes into the picture, things get complicated. The crop year is defined as beginning with the harvest, which is then traded and consumed over a period of 12 months. In the northern hemisphere, with just a few exceptions, this would be September for soybeans for example. In contrast, in South America it would be March. If for a global view, the market is standardised to a single crop year, as it is in USDA outlooks, the position “soybeans 2020/21” would include the US harvest 2020 and the South American harvest 2021. In South American statistics, the information can only be found under 2021/22.
Crop years are not equal
© AMI 2021 | Source: FAS/IPAD; FAO/GIEWS/AMIS

QuellenAMI Consumer Price Index Agricultural Market Information Company (AMI), Bonn www.ami-informiert.de/ami-maerkte/maerkte/ami-maerkte-verbraucher/meldungen.html
AMI/LK/MIO AMI producer price survey in cooperation with the Chambers of Agriculture, Bayeri-schem Bauernverband, Badischer Landwirtschaftlicher Hauptverband e.V., Landes-bauernverband in Baden-Württemberg e.V., Landesbetrieb Landwirtschaft Hessen, Marktinformationsstelle Ost
www.ami-informiert.de
AMI Current market: oilseeds and bioenergy (in German), AMI, Bonn www.ami-informiert.de/ami-shop/shop/detail?ai%5Bd_name%5D=Markt_aktuell_%C3%96lsaaten_und_Bioenergie&ai%5Bd_pro-did%5D=110&ai%5Bd_pos%5D=11&ai%5Bcontroller%5D=Catalog&ai%5Baction%5D=detail
BAFA Federal Offive for Economic Affairs and Export Control Bundesamtes für Wirtschaft und Ausfuhrkontrolle, Eschbor (Amtliche Daten Mineralöl)
www.bafa.de/SiteGlobals/Forms/Suche/Expertensuche/Servicesuche_Formular.html?nn=8061894&timerange=lastmonth&template-QueryString=Mineraloel+amtliche+daten
Biofules digest Online publication www.biofuelsdigest.com www.biofuelsdigest.com/bdigest/2020/09/11/from-americas-to-eu-asia-africa-whos-got-what-the-digests-2020-multi-slide-guide-to-biofuel-mandates-around-the-world-2020/
BLE Federal Office for Agriculture and FoodBundesanstalt für Ernährung und LandwirtschaftEvaluationsbericht 2019
Statistics oil and fats
www.ble.de/SharedDocs/Downloads/DE/Klima-Energie/Nachhaltige-Biomasseherstellung/Evaluationsbericht_2019.pdf?__blob=publica-tionFile&v=4
www.ble.de/DE/BZL/Daten-Berichte/Oele-Fette/oele-fette_node.html
European Commission GD AGRI, Brussels; (The development of plant proteins in the European Union)
JRC, Ispra, Italy
Oilseeds and protein crops statistics
Fossil CO2 emissions of all world countries - 2020 Report
ec.europa.eu/agriculture/cereals/development-of-plant-proteins-in-europe_en
www.sciencedirect.com/science/article/pii/S095937801830253X?via%3Dihub#fig0005http://www.scinexx.de/wissen-aktu-ell-23269-2018-10-17.html?fbclid=IwAR27URT2ufrdkO0DH2YN4K1pdIXHOXIj29qPHVJ-XsiBo3X7K6okck50vEkfileec.europa.eu/info/food-farming-fisheries/farming/facts-and-figures/markets/overviews/market-observatories/crops/oilseeds-and-pro-tein-crops_en
ec.europa.eu/jrc/en/publication/eur-scientific-and-technical-research-reports/fossil-co2-emissions-all-world-countries-2020-report
FAO Food and Agriculture Organization of the United Nations, Rom Food OutlookAMIS Market DatabaseFAO Cereal Supply and Demand BriefThesttate of agricultural commodity marketsFAOSTAT Corporate statistical database
www.fao.org/3/cb1993en/CB1993EN.pdfwww.amis-outlook.org/amis-about/calendars/soybeancal/en/www.fao.org/worldfoodsituation/csdb/en/www.fao.org/3/cb0665en/CB0665EN.pdfwww.fao.org/faostat/en/#data
FAS EU Biofuels annual 2020; USDA Foreign Agricultural Service, Washington
FAS/IPAD International Production Assessment
apps.fas.usda.gov/newgainapi/api/Report/DownloadReportByFileName?fileName=Biofuels Annual_The Hague_European Uni-on_06-29-2020https://ipad.fas.usda.gov/ogamaps/cropcalendar.aspx
Handbuch der Lebensmitteltechnologie Nahrungsfette und -öle
Michael Bockisch, Verlag Eugen Ulmer, ISBN 3-8001-5817-5 (Kapitel 4 Pflanzliche Fette)
IGC Grain Market Report, 11/2018; International Grain Council, London www.igc.int/en/default.aspx
OECD Agricultural Outlook; Organisation for Economic Cooperation and Development, Paris stats.oecd.org/index.aspx?queryid=76858
Oil World OIL WORLD statistics update; ISTA Mielke GmbH, Hamburg www.oilworld.biz
RFA Markets & Statistics; Renewable fuels association, Ellisville ethanolrfa.org/resources/industry/statistics/
Statistisches Bundesamt Federal Statistical Office Agriculture and forestry, fisheries; Field crops and grass-land; Field Crops; Field Crops and Grassland, Wiesbaden
www.destatis.de/DE/Themen/Branchen-Unternehmen/Landwirtschaft-Forstwirtschaft-Fischerei/Feldfruechte-Gruenland/_inhalt.html;j-sessionid=718BFEE226402C40A8D9DF8005A0A3A1.internet8732#sprg239470www.destatis.de/DE/Themen/Branchen-Unternehmen/Landwirtschaft-Forstwirtschaft-Fischerei/Publikationen/Bodennutzung/an-bau-ackerland-vorbericht-2030312208004.html
UN United Nations Statistics Devision, UNdata, New York data.un.org/Data.aspx?q=world+population&d=PopDiv&f=variableID:12;crID:900
USDA United States Department of Agriculture, Washington; Marktet and trade data, PSD online
Data & Analysis Reports
apps.fas.usda.gov/psdonline/app/index.html#/app/advQuery
www.fas.usda.gov/data
Weltbank The World Bank, DataBank, Washington data.worldbank.org/indicator/NY.GNP.PCAP.PP.CD
Credit title: map of the world: Vecteezy.com; photolinc/Shutterstock.com; Eky Studio/Shutterstock.com; I love photo/Shutterstock.com; Subbotina Anna/Shutterstock.com; Isarapic/Shutterstock.com; oticki/Shutterstock.com

AMI Consumer Price Index Agricultural Market Information Company (AMI), Bonn www.ami-informiert.de/ami-maerkte/maerkte/ami-maerkte-verbraucher/meldungen.html
AMI/LK/MIO AMI producer price survey in cooperation with the Chambers of Agriculture, Bayeri-schem Bauernverband, Badischer Landwirtschaftlicher Hauptverband e.V., Landes-bauernverband in Baden-Württemberg e.V., Landesbetrieb Landwirtschaft Hessen, Marktinformationsstelle Ost
www.ami-informiert.de
AMI Current market: oilseeds and bioenergy (in German), AMI, Bonn www.ami-informiert.de/ami-shop/shop/detail?ai%5Bd_name%5D=Markt_aktuell_%C3%96lsaaten_und_Bioenergie&ai%5Bd_pro-did%5D=110&ai%5Bd_pos%5D=11&ai%5Bcontroller%5D=Catalog&ai%5Baction%5D=detail
BAFA Federal Offive for Economic Affairs and Export Control Bundesamtes für Wirtschaft und Ausfuhrkontrolle, Eschbor (Amtliche Daten Mineralöl)
www.bafa.de/SiteGlobals/Forms/Suche/Expertensuche/Servicesuche_Formular.html?nn=8061894&timerange=lastmonth&template-QueryString=Mineraloel+amtliche+daten
Biofules digest Online publication www.biofuelsdigest.com www.biofuelsdigest.com/bdigest/2020/09/11/from-americas-to-eu-asia-africa-whos-got-what-the-digests-2020-multi-slide-guide-to-biofuel-mandates-around-the-world-2020/
BLE Federal Office for Agriculture and FoodBundesanstalt für Ernährung und LandwirtschaftEvaluationsbericht 2019
Statistics oil and fats
www.ble.de/SharedDocs/Downloads/DE/Klima-Energie/Nachhaltige-Biomasseherstellung/Evaluationsbericht_2019.pdf?__blob=publica-tionFile&v=4
www.ble.de/DE/BZL/Daten-Berichte/Oele-Fette/oele-fette_node.html
European Commission GD AGRI, Brussels; (The development of plant proteins in the European Union)
JRC, Ispra, Italy
Oilseeds and protein crops statistics
Fossil CO2 emissions of all world countries - 2020 Report
ec.europa.eu/agriculture/cereals/development-of-plant-proteins-in-europe_en
www.sciencedirect.com/science/article/pii/S095937801830253X?via%3Dihub#fig0005http://www.scinexx.de/wissen-aktu-ell-23269-2018-10-17.html?fbclid=IwAR27URT2ufrdkO0DH2YN4K1pdIXHOXIj29qPHVJ-XsiBo3X7K6okck50vEkfileec.europa.eu/info/food-farming-fisheries/farming/facts-and-figures/markets/overviews/market-observatories/crops/oilseeds-and-pro-tein-crops_en
ec.europa.eu/jrc/en/publication/eur-scientific-and-technical-research-reports/fossil-co2-emissions-all-world-countries-2020-report
FAO Food and Agriculture Organization of the United Nations, Rom Food OutlookAMIS Market DatabaseFAO Cereal Supply and Demand BriefThesttate of agricultural commodity marketsFAOSTAT Corporate statistical database
www.fao.org/3/cb1993en/CB1993EN.pdfwww.amis-outlook.org/amis-about/calendars/soybeancal/en/www.fao.org/worldfoodsituation/csdb/en/www.fao.org/3/cb0665en/CB0665EN.pdfwww.fao.org/faostat/en/#data
FAS EU Biofuels annual 2020; USDA Foreign Agricultural Service, Washington
FAS/IPAD International Production Assessment
apps.fas.usda.gov/newgainapi/api/Report/DownloadReportByFileName?fileName=Biofuels Annual_The Hague_European Uni-on_06-29-2020https://ipad.fas.usda.gov/ogamaps/cropcalendar.aspx
Handbuch der Lebensmitteltechnologie Nahrungsfette und -öle
Michael Bockisch, Verlag Eugen Ulmer, ISBN 3-8001-5817-5 (Kapitel 4 Pflanzliche Fette)
IGC Grain Market Report, 11/2018; International Grain Council, London www.igc.int/en/default.aspx
OECD Agricultural Outlook; Organisation for Economic Cooperation and Development, Paris stats.oecd.org/index.aspx?queryid=76858
Oil World OIL WORLD statistics update; ISTA Mielke GmbH, Hamburg www.oilworld.biz
RFA Markets & Statistics; Renewable fuels association, Ellisville ethanolrfa.org/resources/industry/statistics/
Statistisches Bundesamt Federal Statistical Office Agriculture and forestry, fisheries; Field crops and grass-land; Field Crops; Field Crops and Grassland, Wiesbaden
www.destatis.de/DE/Themen/Branchen-Unternehmen/Landwirtschaft-Forstwirtschaft-Fischerei/Feldfruechte-Gruenland/_inhalt.html;j-sessionid=718BFEE226402C40A8D9DF8005A0A3A1.internet8732#sprg239470www.destatis.de/DE/Themen/Branchen-Unternehmen/Landwirtschaft-Forstwirtschaft-Fischerei/Publikationen/Bodennutzung/an-bau-ackerland-vorbericht-2030312208004.html
UN United Nations Statistics Devision, UNdata, New York data.un.org/Data.aspx?q=world+population&d=PopDiv&f=variableID:12;crID:900
USDA United States Department of Agriculture, Washington; Marktet and trade data, PSD online
Data & Analysis Reports
apps.fas.usda.gov/psdonline/app/index.html#/app/advQuery
www.fas.usda.gov/data
Weltbank The World Bank, DataBank, Washington data.worldbank.org/indicator/NY.GNP.PCAP.PP.CD

Union zur Förderung von Oel- und Proteinpflanzen e. V. Claire-Waldoff-Straße 7 · 10117 Berlin [email protected] www.ufop.de twitter.com/ufop_de