Embed Size (px)
Citation preview
FLEXMETER 646568 D6.2 Report on evaluation scenario and metrics H2020-LCE-2014-3
Public
H2020-LCE-2014-3 FLEXMETER
Flexible smart metering for multiple energy vectors with active prosumers
Project Duration 2015-01-01 – 2017-12-31 Type CP
WP no. Deliverable no. Lead participant
WP6 D6.2 POLITO
Report on evaluation scenario and metrics
Prepared by POLITO
Issued by FLEXMETER Project Office
Document Number/Rev. FLEXMETER/D6.2/V1.0
Classification Public
Submission Date 2017-04-09
Due Date 2017-02-28 This project has received funding from the European Union’s Horizon 2020 research and innovation programme under grant agreement no. 646568
©Copyright 2015 POLITECNICO DI TORINO, IREN ENERGIA SPA, STMICROELECTRONICS SRL, TELECOM ITALIA, RHEINISCH-WESTFAELISCHE TECHNISCHE HOCHSCHULE AACHEN, INSTITUT POLYTECHNIQUE DE GRENOBLE, UNIVERSITATEA POLITEHNICA DIN BUCURESTI, SIVECO ROMANIA SA, ALMA MATER STUDIORUM – UNIVERSITA’ DI BOLOGNA, E-ON SVERIGE AB. This document and the information contained herein may not be copied, used or disclosed in whole or in part outside of the consortium except with prior written permission of the partners listed above.

FLEXMETER 646568 D6.2 Report on evaluation scenario and metrics H2020-LCE-2014-3 Document Title Press Release
Type Deliverable
Ref D6.2
Target version V1.0
Current issue V1.0
Status ToC
File D6.2_flexmeter_v1.0.doc
Author(s) Marco Pau (RWTH), Andrea Acquaviva (POLITO), Lorenzo Bottaccioli (POLITO), Carmen Oana (SIVECO), Davide Brunelli (UNIBO), Federico BoniCastagnetti (IREN), Luca Barbierato (TIM), Ana-Maria Dumistrescu (UPB)
Reviewer(s) Andrea Acquaviva (POLITO)
Approver(s) Andrea Acquaviva (POLITO)
Approval date 2017-04-09
Release date 2017-04-09
Distribution of the release Dissemination level PU
Distribution list All Consortium
History of Changes Date Version Comment
07/02/2017 V0.1 Table of Content
28/02/2017 V1.0 First version
15/03/2017 V1.5 Revised contributions from TIM, IREN, SIVECO, UNIBO
30/03/2017 V1.9 Added contribution from UPB
04/09/2017 V2.0 Final revised version
FLEXMETER 646568 D6.2 Report on evaluation scenario and metrics H2020-LCE-2014-3 Contents
Document ................................................................................................................................................ 2
Distribution of the release ........................................................................................................................ 2
History of Changes .................................................................................................................................. 2
Contents .................................................................................................................................................. 3
Executive Summary ..................................................................................................................... 5
Introduction .................................................................................................................................. 6
User awareness (IREN) ............................................................................................................... 7
3.1 Description ................................................................................................................................... 7
3.2 Validation scenario ...................................................................................................................... 7
3.3 Metrics for the evaluation ............................................................................................................ 8
Non-Intrusive Appliance Load Monitoring (IREN/MIDORI - UNIBO) ........................................... 9
4.1 Description ................................................................................................................................... 9
4.2 Validation scenario ...................................................................................................................... 9
4.3 Metrics for the evaluation .......................................................................................................... 10
Bill prediction (INPG) ................................................................................................................... 7
5.1 Description ................................................................................................................................. 35
5.2 Validation scenario .................................................................................................................... 35
5.3 Metrics for the evaluation .......................................................................................................... 35
State Estimation (RWTH) .......................................................................................................... 12
6.1 Description ................................................................................................................................. 12
6.2 Validation scenario .................................................................................................................... 12
6.3 Metrics for the evaluation .......................................................................................................... 13
Network topology reconfiguration (POLITO - RWTH) ............................................................... 15
7.1 Description ................................................................................................................................. 15
7.2 Validation scenario .................................................................................................................... 15
7.3 Metrics for the evaluation .......................................................................................................... 16
Fault location (POLITO) ............................................................................................................. 18
8.1 Description ................................................................................................................................. 18
8.2 Validation scenario .................................................................................................................... 19
8.3 Metrics for the evaluation .......................................................................................................... 20
Storage integration (UPB) ......................................................................................................... 23
9.1 Description ................................................................................................................................. 23
9.2 Validation scenario .................................................................................................................... 23
9.3 Metrics for the evaluation .......................................................................................................... 23
Dynamic storage management (POLITO - RWTH) ................................................................... 25
10.1 Description ................................................................................................................................. 25
10.2 Validation scenario .................................................................................................................... 25
FLEXMETER 646568 D6.2 Report on evaluation scenario and metrics H2020-LCE-2014-3 10.3 Metrics for the evaluation .......................................................................................................... 25
Load balancing & Demand Response (TI – POLITO – RWTH) ................................................ 26
11.1 Description ................................................................................................................................. 26
11.2 Validation scenario .................................................................................................................... 27
11.3 Metrics for the evaluation .......................................................................................................... 29
Heat pumps management (RWTH) ........................................................................................... 26
12.1 Description ................................................................................................................................. 32
12.2 Validation scenario .................................................................................................................... 32
12.3 Metrics for the evaluation .......................................................................................................... 34
Conclusions ............................................................................................................................... 36

D6.2 Report on evaluation scenario and metrics
– 5 – FLEXMETER is a project co-funded by the European Union
Executive Summary
This deliverable aims at defining the scenarios and metrics that will be used as reference for the testing and evaluation of the different FLEXMETER use cases. For each use case, this document briefly recalls the purposes of the use case, pointing to the related Deliverable for more details on the technical aspects. The scenario in which each use case will be tested is then described. When feasible, use cases are tested directly on the pilots, and the details of their implementation on the field are reported. For some of the use cases, a direct validation on the field is not possible, due to regulatory barriers, unavailability of specific components on the system (e.g. storage devices), or because of other constraints. In this case, use cases are tested and evaluated through real-time simulations specifically designed to reproduce the needed scenario and to emulate the real behaviour of the electric distribution grid. For this set of use cases, the particular requirements or peculiarities of the simulated scenario that can be relevant for the testing and assessment of the use case are highlighted. When describing the use case scenarios, an outlook on the integration of the use case with the FLEXMETER cloud platform is also provided. Finally, the metrics chosen to evaluate each use case and to estimate the benefits (potential, in case of testing in simulation environment) for the final customers or the DSO are presented.

D6.2 Report on evaluation scenario and metrics
– 6 – FLEXMETER is a project co-funded by the European Union
Introduction
During the project, several use cases were selected by the Consortium, aimed at providing specific services to both final customers and DSOs. The selected use cases can be divided in three main categories:
- Services for the end-users: these use cases include those applications that are conceived mainly to provide a service to the final customer. FLEXMETER use cases belonging to this group are the User Awareness service, the Non-Intrusive Load Appliance Monitoring (NIALM) tool, and the Bill Prediction service. These use cases are directly implemented on the field and/or tested using real data coming from the pilots.
- Services for the DSO with short term applicability: are included in this category those applications aimed at providing a service to the DSO (in general, for the management of the distribution grid) which can be theoretically applied and deployed on the field in a short time range. Use cases belonging to this group are the State Estimation and Network Topology Reconfiguration algorithms, the Fault Location service and the Storage Integration tool. All these services will be tested and evaluated in the real-time simulation environment, but for some of them it is possible to use the real data from the field for an additional evaluation step.
- Services for the DSO with medium-long term applicability: this category includes all those services designed for the DSO in a smart grid perspective, which, while being theoretically applicable from a technical point of view, are not deployable in a short term time range due to possible regulatory barriers, high costs of the associated technologies, or other possible constraints. The FLEXMETER use cases belonging to this class are the Dynamic Storage Management, the Load Balancing & Demand Response and the Heat Pumps Management services. Given the impossibility to test these applications on the pilots, all these services will be implemented and evaluated in the real-time simulation environment.
Table I shows the summary of all the considered use cases, with the indication of the recipient of the service, the theoretical applicability to the FLEXMETER pilots and the scenario where they will be tested and assessed (A complete description of pilot is provided in D1.4, while a description of the real-time simulator will be provided in D6.1 due on M33).
Table I. List of the use cases
Item FLEXMETER Use Case Owner Service to Validation on
1 User Awareness IREN Final customer Pilot
2 NIALM IREN / UNIBO Final customer Pilot
3 State Estimation RWTH DSO Real-time simulation
4 Network Topology Reconfiguration POLITO / RWTH DSO Real-time simulation
5 Fault Location POLITO DSO Real-time simulation
6 Storage Integration UPB DSO Real data from the pilots
7 Dynamic Storage Management POLITO / RWTH DSO Real-time simulation
8 Load Balancing & Demand Response TI / POLITO / RWTH DSO Real-time simulation
9 Heat Pumps Management RWTH DSO Real-time simulation
10 Bill Prediction INPG Final customer Real data from the pilots

D6.2 Report on evaluation scenario and metrics
– 7 – FLEXMETER is a project co-funded by the European Union
User awareness
3.1 Description
As widely known, energy efficiency is a key target for Europe and, to this, it is the focus of EU policies aiming at reducing energy consumption and fostering renewable energy production. In this scenario buildings account for 40% of EU final energy demand and, besides renovation actions, consumer behaviour can reduce energy consumption by 20% (cfr. http://www.eea.europa.eu/publications/achieving-energy-efficiency-through-behaviour. “Smart metering and other consumption feedback systems, building design and capacity building activities that encourage and enable energy conscious behaviour can help to fulfil this potential.”
If compared to just a decade ago, impressive and powerful ICT tools have been developed in such a way to reach people everywhere and affect their everyday lives. Such influential tools should enable a better understanding of their energy habits and spreading energy efficient mentality.
FLEXMETER user awareness tools will provide to the users a clear understanding of their current energy profiles, possible actions to save energy and strategies to achieve the best energy performance for their community and building environment. The same tools will be the basis for future demand-response and demand side management politics.
Taking into account the multi-utility approach of the project, tools will be available not only for electric energy consumptions but also for district heating and water consumption.
These tools will be tested in several user scenarios (final residential customers, building owners, energy manager of private micro grids) taking into account the peculiarities of each pilot and the marketing aspects related to a direct involvement of final customers.
That is why, for example, the partner IREN uses a prototype release of its current client app (ClickIREN) to display electric energy empowerment and user awareness tools, based both on existing billing data and new data and elaboration (i.e. NIALM) coming from the installed prototype devices used to gather high frequency consumption data.
Similar tools have been developed in other common FLEXMETER tools that will be used in all the other pilot environments where commercial and marketing constraints are not relevant.
3.2 Validation scenario
Between 30 and 50 residential users in Turin (Turin residential pilot) have been provided with different devices able to detect energy consumptions at higher sample rates than the current monthly data coming from the fiscal, DSO-owned smart meters. These devices, taking into account the Italian Regulatory constraints (Unbundling), have been installed as Retailer devices providing only raw and not certified data (i.e. not suitable for billing purposes).
User awareness data will be displayed to clients through a prototype development of the official IREN app (ClickIREN) designed and tested thanks to EU funding under FLEXMETER projects.
The app is featuring 4 different levels, based on the granularity and availability of electric consumptions data:
• Level 1: yearly consumption data based on the 6 official bi-monthly bills each client receive from the Retailer. User awareness services, thanks to an online interview (through the app) on the client energy habits and its appliances, will display a general overview of its consumption and total spending and a clustering service showing a comparison with similar customers (high-level client profiling).

D6.2 Report on evaluation scenario and metrics
– 8 – FLEXMETER is a project co-funded by the European Union
• Level 2: monthly consumption data coming form the current DSO smart meters installed in each Italian dwelling. Taking into account the current data availability for the final customers of monthly data only each 2 months for billing purposes, the user empowerment services developed in this level intrinsically have an added value providing an intermediate overview of the client consumptions (and estimation of spending) with no need for additional hardware installed at his premise.
• Level 3: daily data that, at least in Italy, will be available for all customers once second generation fiscal smart metering roll out will be completed (in more than 5 year-time) and that in this pilot testing will be based on blink detector device able to measure the blink of the existing smart meter, corresponding to a Wh. The services developed in this level are similar to level 2 but with a higher granularity.
• Level 4: NIALM disaggregation of electric energy data of major appliances based on 1-second overall consumption of the dwelling (active and reactive power). The current visualizations, based on almost-real time data, are aggregated at daily level but real time alerts (i.e. high consumptions) are feasible and will be studied.
3.3 Metrics for the evaluation
The evaluation of results regarding user awareness services will be based on several parameters and tools. Usability will be assessed thanks to target interviews and focus groups with the pilot users: parameters like simplicity, clarity, user-friendliness will be investigated. It will be also very important to understand how much such services are really used and consulted by customers. Taking into account the limited period of time in which the services will be tested, energy savings targets based on previous consumptions will not have such an important roles: It is widely known that such services need trial and learning periods to really express their potentials. Nevertheless some indicative metrics and KPIs will be identified:
• % of saved energy related to user empowerment services;
• Usage of the app (number of visualizations, most useful services...);
• Change in habits (when to run and what kind of programs used for the main appliances);
• Appliance upgrades due to information received by the app of the project;
Taking into account the prototype nature of the pilot, users will be asked to propose updated and improvements of the services.

D6.2 Report on evaluation scenario and metrics
– 9 – FLEXMETER is a project co-funded by the European Union
Non-Intrusive Appliance Load Monitoring
4.1 Description
Non-Intrusive Load Monitoring is the capability to measure and to detect the consumption of each single appliance used in the buildings, using only one point for the aggregated measurement, namely the meter.
Such a technique is called Non Intrusive (Appliance) Load Monitoring (NILM or NIALM). These algorithms are capable to detect the numbers and the type of the loads, using algorithms that can execute on the cloud services, or even on the single meter.
NIALM gives important feedback for both the residential consumer and the electric utility.
Figure 1. Event-based NILM algorithm
Figure 2. Non-Event-Based NILM algorithm
For more details please refer to deliverable D4.2 ”Report on algorithms for enhanced features in smart measuring devices”.
4.2 Validation scenario
In Turin Pilot for residential users NIALM algorithms and analysis will be provided through Click IREN app – level 4 to around 20 of the total pilot users.
NIALM will be also tested in EnviPark premises (private smart grid pilot site): The differences in this scenario, if compared to the other residential users, are mainly related to the type of appliances that will be detected,

D6.2 Report on evaluation scenario and metrics
– 10 – FLEXMETER is a project co-funded by the European Union
given the fact that EnviPark is made up of office buildings, scientific labs and other similar premises. Analysis in this scenario will be provided by the webportal and the mobile application developed by SIVECO and POLITO, respectively.
NIALM at DSO substation level will be also tested thanks to LV smart meters installed on each BT line of 5 to 6 MV/LV substation in Turin. The algorithms will be mainly tested to detect different energy patterns with the aims automatically detect faults and over loads. Load analysis and load forecasting will be also carried out thanks to NIALM.
4.3 Metrics for the evaluation
Regarding NIALM disaggregation, the services will be tested both on ”user” side taking into consideration both efficiency and appliance detection (and specific energy consumptions) efficacy.
More in details, the following aspects will be investigated:
• Usability and accessibility of data coming from NIALM disaggregation (on the user side);
• Appliance detection accuracy in terms of percentage of recognition;
• Response time in terms of delivery of new information from the activation of an appliance;
• Scalability analysis of NILM solution by comparing on-cloud (MIDORI) vs on-board (UNIBO) implementations.
The different NIALM solutions in terms of architecture (”cloud” and ”on-board” solutions, please refers to deliverable D4.2) will be compared taking into account the future industrialization of the solution and services.
Scalability analysis of NILM solutions is actually the most important metric, even more than the accuracy of the detection, because more sophisticated and precise NILM procedures can be developed in future (even with the new generation of deep-brain learning technologies which is gaining momentum in the scientific community nowadays), whereas the scalability is typical depending on the infrastructure determined at the beginning of the project and on the communication/processing capability of the platforms, as well as on the cost of such resources.
Thus actually, scalability of the project to thousands and thousands of end-users is the main driver for the final cost.
The analysis of the data for specifying the electrical devices used, can be done at a central point (cloud) or by the smart meter itself. For the latter occasion, updates are sent by the smart meter to the cloud with respect to the changes in the appliances status of the house. The whole procedure of data collection, processing and analysis is done by the Flexmeter platform. For the moment, a limited number of smart meters use this algorithm. However, it is of crucial importance to examine the system's limits when a large number of smart meters would have been applied, which is likely to take place in the future.
Parameters like the packet size and its variability, the frequency at which these packets are sent, are crucial to determine the communication bandwidth required to the network infrastructure, and the computation complexity for executing the algorithm is fundamental to determine the cost and the numbers of the Virtual Machines if the NILM is executed to a Cloud service like Amazon, or Google or whatever datacenter service. This cost is zeroed in case of the execution of the NILM locally on the meter itself. On the other side, also the response time depends heavily on the scalability, because processing on low-resource platforms might take more time than a high-performance CPU on a server. In reality, the values we use for the KPI concerns mainly the frequency with which the messages are transmitted and the packet size of the transmitted messages. And even in this case, they can differ a lot more depending on the time of the day and the usage of the electrical devices by consumers, resulting in

D6.2 Report on evaluation scenario and metrics
– 11 – FLEXMETER is a project co-funded by the European Union
random values. For these reason also a fair and normalized usage of the appliance in a household will be take into account, and we propose a benchmark, where all the NILM algorithm could be compared and a simulation tool of the scalability issues will be provided.

D6.2 Report on evaluation scenario and metrics
– 12 – FLEXMETER is a project co-funded by the European Union
State Estimation
5.1 Description
State Estimation is an application commonly used in power systems to estimate the operating conditions of a grid at a given instant of time, starting from the measurements collected from the field. State estimation algorithms operate by processing the set of measurements provided by the instruments available in the network and consider the accuracy characteristics of such measurements to deliver the most likely state of the grid. While state estimation is widely used to monitor the operation of transmission systems, its application in distribution systems is rare, mainly due to the scarcity of measurements present in these grids. However, with the evolution of the distribution grids towards more active and complex networks, the need for advanced tools for their real-time monitoring is commonly recognized and large research efforts have been done in last years to design state estimation algorithms tailored to the distribution system scenario. In this use case, a state estimator aimed at using the smart meter measurements to obtain the state of the distribution grid has been designed. In particular, the developed state estimation tool is a hierarchical algorithm that exploits the smart metering infrastructure to achieve, sequentially, the monitoring of both the Low Voltage (LV) and the Medium Voltage (MV) grid. Since the goal of state estimation is to provide detailed information about the operating conditions of the grid, this application is naturally configured as a service to DSOs. The state of the art of the research in this field indicates that distribution system state estimation is an essential tool of the Distribution Management Systems (DMS) that will be used for the management and control of the future distribution systems.
Coherently with this vision, even in the Flexmeter platform, the state estimation service can be adopted as enabler of possible other services aimed at the control/management of the distribution network. Among the Flexmeter use cases presented in this Deliverable, an example is given by the Network Topology Reconfiguration service, which is fully integrated and coordinated with the State Estimation service to provide a smart reconfiguration of the grid. It is worth underlining that, since the Network Reconfiguration service needs the knowledge of the operating conditions of the grid to correctly operate, this kind of service would not be possible without the deployment of a suitable State Estimation service. More details about the theory and the implementation details associated to the Flexmeter State Estimation module will be presented in Deliverable D6.1, which is due to M33.
5.2 Validation scenario
The proposed State Estimation service relies on the use of smart meter measurements at the different consumption and generation nodes of the grid. Additional measurements available in the network, e.g. at the substation nodes, can also be integrated in the estimation algorithm. This kind of service can be reasonably put in place in a short time range, provided that a complete rollout of the smart meters has been accomplished in the network under test. However, for the purposes of the project, the state estimation tool will be tested off-line by means of dedicated real-time simulations. In this way, the evaluation of the algorithm can be done referring to reference values generated through the simulation, and a full characterization of the capabilities and performance of the tool, also taking into account different test conditions for the grid, can be performed. Figure 3 shows the integration of the state estimation service with the Flexmeter cloud platform and provides an overview of the communication flows. As aforementioned, the state estimation service is based on a hierarchical architecture. The lowest level of the architecture is the building unit level, where a first state

D6.2 Report on evaluation scenario and metrics
– 13 – FLEXMETER is a project co-funded by the European Union
estimation algorithm runs to process the smart meter measurements related to each household. Through this step, the resulting voltage and power consumption estimation at the building connection point can be obtained. As shown in Figure , building results are then sent to the cloud and gathered by the LV grid estimators for the following hierarchical level of the SE process. It is worth noting that, since more building units are connected to the same LV grid, each LV grid estimator has to retrieve the results for all the subtended building units. Similarly to the previous step, a new state estimation process runs at the LV level, which allows obtaining the operating conditions of the LV grid. Again, these results are then sent to the cloud where they are made available for other possible applications, like simple monitoring services or more sophisticated management/control functions for the LV network. Simultaneously, the estimation results at the LV substation node (voltage and power demand) of the different LV grid estimators are used to enable the MV level state estimation, which allows obtaining the operating conditions also for the MV system. In this way the full picture of the state of the distribution system can be obtained starting from the smart meter measurements collected at household level (if present, additional measurements available in the LV or MV grid are directly included in the associated state estimators). Given this framework, a whole distribution network will be emulated, down to the household level, in order to test the complete state estimation tool and to characterize each level of the state estimation architecture. Realistic measurements of the household consumptions will be generated through the Flexmeter generator of residential load profiles and will be integrated in the real-time simulation platform, in order to make the emulation of the distribution grid as realistic as possible.
Figure 3. Integration of the State Estimation service with the Flexmeter cloud platform
5.3 Metrics for the evaluation
Thanks to the possibility to emulate the distribution grid in a real-time simulation environment, a full characterization of the different levels of the state estimation architecture will be performed, in order to assess the performance achievable through the use of this service. The goals of a state estimation

D6.2 Report on evaluation scenario and metrics
– 14 – FLEXMETER is a project co-funded by the European Union
algorithms are generally two: the first one is to provide an estimation as accurate as possible of the electrical quantities of the grid at the considered instant of time; the second is to detect (and in case remove) possible bad data appearing in the stream of real-time measurements. To this purpose, Monte Carlo simulations are usually adopted to assess the state estimator performance via statistical methods. This approach will be used here for a preliminary evaluation of the proposed state estimation service. Off-line results obtained by means of Monte Carlo tests will be then tested and re-evaluated through online simulations performed in real-time. The metrics used to assess the accuracy and the bad data detection capabilities will be:
- Root Mean Squared Error (RMSE): it provides an indication of the deviation of the estimated values (state estimation results) with respect to the true values (which are available when testing the algorithm in simulation environment). It is defined as:
RMSE(y) = )* (𝑦- − 𝑦-)/*
-0)
where 𝑦- is the true value of the considered quantity, 𝑦- is the corresponding estimation and 𝑛 is the total number of samples used for the statistical evaluation. When running the online simulation in real-time, the number of samples used to assess the accuracy of a certain electrical quantity can be given by the different time steps of the simulation. In this case, the considered electrical quantities have to be normalized in order to be consistent regardless of the dynamic evolution due to the test conditions.
- Number of correct/false bad data detections: such indexes allow evaluating the proper detection of possible bad data in the streaming measurements and the possible erroneous interpretation of a correct data as a bad one. The number of correct bad data detections can be measured as a percentage with respect to the total number of bad data injected into the real-time simulation, while the number of false bad data detections will be evaluated as the total number obtained in the different test scenarios.

D6.2 Report on evaluation scenario and metrics
– 15 – FLEXMETER is a project co-funded by the European Union
Network topology reconfiguration
6.1 Description
In the last decades the distribution networks (DN) operation has dramatically changed: the wide diffusion of distributed generation (DG), can in fact reverse the direction of power flows in the MV lines and even in HV/MV transformers. In addition to this, DG and consumption can be unevenly allocated, making it possible to have certain network portions with prevailing generation and other ones with prevailing consumption. The DNs are weakly meshed but are operated in a radial configuration in order to guarantee a reliable and safe operation under fault conditions. It is however possible, for the DSO, to change the network topology by operating the available remotely controllable circuit breakers, closing normally open and opening normally closed lines. Normally open lines are usually called tie-lines, and are equipped with tie switches, while nor- mally closed lines are equipped with sectionalising switches. Network reconfiguration can be performed during normal operation of the system, in order to reduce network losses, improve the voltage profiles, or improve other DN performances, or for service restoration after a fault.
In FLEXMETER we focused on the use of the results of the State Estimation for on-line real-time automatic MV grid reconfiguration, for losses minimization. The Flexmeter infrastructure enables in fact the possibility of performing grid reconfiguration based on real-time data coming from the grid. For this purpose a fast reconfiguration algorithm should be used, which also minimizes the switching operations that need to be performed to change the grid topology. For the above mentioned reasons, a Greedy algorithm has been chosen, which not necessarily leads to the global optimum of the objective function, but usually provides a good solution in a small amount of time.
The grid reconfiguration algorithm is subscribed to the Message Broker and receives from the cloud the results of the MV grid level SE; it retrieves also the actual network topology from the Network Topology Web Service, where the switches status is represented by a boolean vector. It generates the new optimized MV network configuration, by changing the switches status in the boolean vector.
6.2 Validation scenario
As previously mentioned, for the purposes of the project, the state estimation tool will be tested off-line by means of dedicated real-time simulations. For this reason, also the network reconfiguration tool will be tested resorting to real-time simulations. In the validation phase the two tools, State Estimation and Network reconfiguration, will be tested and validated together, in a coordinated environment. The structure of the validation framework, integrated in the Flexmeter Cloud System, is depicted in Figure .

D6.2 Report on evaluation scenario and metrics
– 16 – FLEXMETER is a project co-funded by the European Union
Figure 4. Structure of the validation framework.
As previously mentioned, a distribution network will be emulated, down to the household level, in order to test the complete state estimation tool and to characterize each level of the state estimation architecture. The results of the state estimation will be provided through the Flexmeter Cloud to the Network Topology Reconfiguration tool, and the simulated network topology will be changed in real-time in order to test the performances of the algorithm and of the system as a whole.
6.3 Metrics for the evaluation
Thanks to the possibility to emulate the distribution grid in a real-time simulation environment, a full evaluation of the Network Topology Reconfiguration tool will be performed, in order to assess the performance achievable through the use of this service. The goal of the Network Topology Reconfiguration are, in our case, a reduction of the power losses, an improvement of the voltage profile, and the maximization of local consumption of renewable energy.
For different load and generation scenarios, the network performances will be evaluated with and without the Network reconfiguration tool, and the results will be compared.
In particular for the reduction of power losses, the total energy losses in the simulation timeframe will be evaluated:
𝐸3455 = 𝑃3455𝑑𝑡9:
9;
where:
D6.2 Report on evaluation scenario and metrics
– 17 – FLEXMETER is a project co-funded by the European Union
𝑃3455 = 𝑅= ∙ 𝐼=/@A
=0)
where:
[t0 tf] is the simulation time window;
Nb is the number of MV lines in the distribution network;
Rj is the series resistasnce of line j;
Ij is the current flowing in line j in a certain network configuration.
For what concerns the improvement of the voltage profile, instead,voltage deviations from the nominal value should be minimized. For our purposes, we will evaluate the maximum voltage deviation in the network:
max 𝑉*4F − 𝑉G , 𝑘 = 1 ÷ 𝑁
where:
Vnom is the nominal voltage;
Vk is the voltage at bus k;
Finally, for what concerns the maximization of local consumption of renewable energy, the maximum inverted power flow and the total reversed energy, during the simulation time window, in the MV distribution network will be evaluated. For this evaluation a power flow is considered inverted when it flows from the peripheral buses to the root node.

D6.2 Report on evaluation scenario and metrics
– 18 – FLEXMETER is a project co-funded by the European Union
Fault location
7.1 Description
Continuity of service in general depends on our system and its equipment for protection, switching, etc., and the number and duration of faults. To improve the continuity of service, we should either install more advanced equipment or to better manage the faults. Advanced outage management system is one of the important functions of an advanced Distribution Management System (DMS). At the moment, most DSOs use customer calls to detect and locate the LV network outages. After detection and identification of the outage area, fault location in MV and LV is normally performed by inspection by the operators. This process has the following disadvantages:
- During the nights there would be a little number of customer calls which makes the outage detection process difficult or impossible.
- False or fake reports are hard to realize.
- The whole process is time consuming and inefficient.
In the FLEXMETER project new meters are being installed at the user level and in MV/LV substation at the beginning of LV feeders. By measuring and reporting data from these devices it would be possible to enhance the outage detection and location and perform it with no or little human intervention.
Different levels of service can be implemented, depending on the capabilities of the meters and on the communication network performances:
LV outage detection and outage location which can be done if the LV meters send “last gasp” signals to the cloud system as soon as they have detected the absence of voltage in order to be mapped into the available network topography.
LV and MV network fault location can follow similar procedure as long as the pre- and during fault voltage and current measurements could be collected from the main root transformer (i.e. MV/LV transformer at the secondary substation for LV grid fault location, and HV/MV transformer at the primary substation for MV network fault location). These values should be reported in such a way that the voltage and current phasors pre- and during fault could be obtained (i.e. either by directly reporting the phasors or by recording discrete samples of the instantaneous waveforms). The amount of data to be sent is quite small. Moreover, there are no stringent latency requirements; even if the data arrive to the cloud some seconds after the event it would be much faster than traditional fault location methods.
The fault location algorithm is subscribed to the Message Broker and receives fault data (pre- and during fault voltage and current measurements) and publishes a message including the information about the location of fault (e.g. feeder name and the fault distance from the closest upstream secondary substation in MV network or cabin street in LV grid).
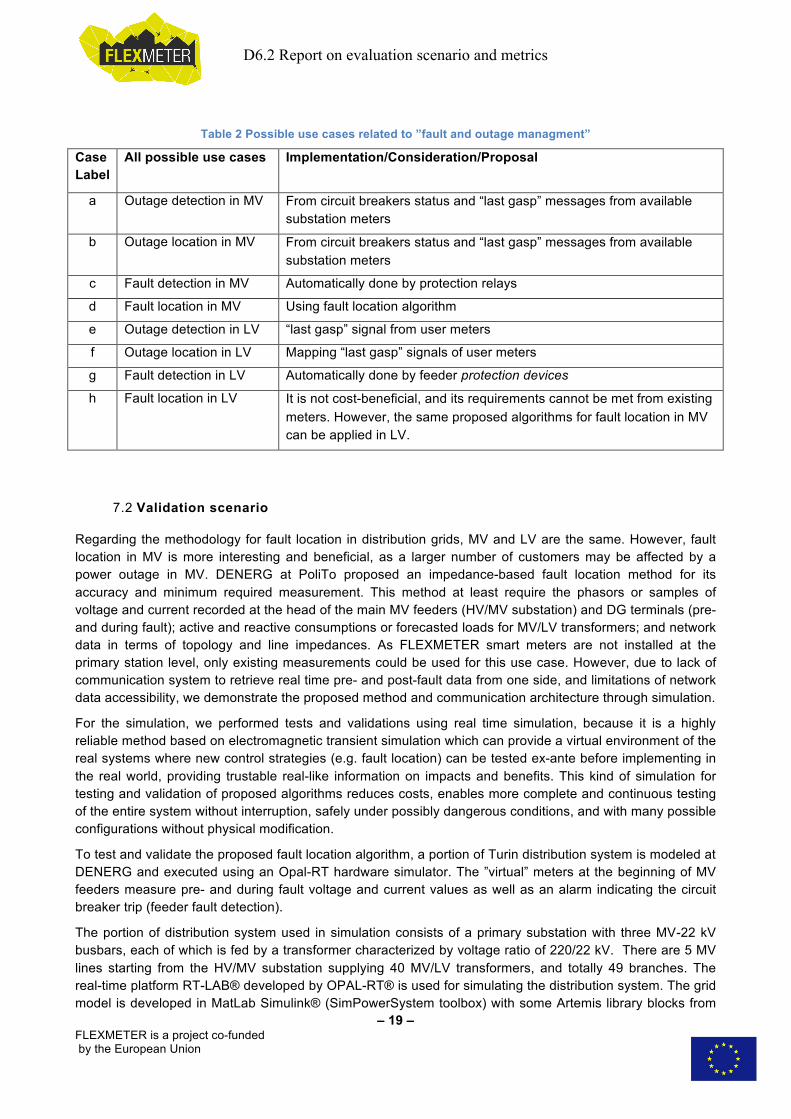
Table 2 summarizes all possible use cases related to fault and outage management; considering 2 conceptual events as “fault” and “outage”, 2 conceptual actions as “detection” and “location”, and 2 voltage level of grids as “MV” (Medium Voltage) and “LV” (Low Voltage) there are 8 possible use cases:
D6.2 Report on evaluation scenario and metrics
– 19 – FLEXMETER is a project co-funded by the European Union
Table 2 Possible use cases related to ”fault and outage managment”
Case Label
All possible use cases Implementation/Consideration/Proposal
a Outage detection in MV From circuit breakers status and “last gasp” messages from available substation meters
b Outage location in MV From circuit breakers status and “last gasp” messages from available substation meters
c Fault detection in MV Automatically done by protection relays
d Fault location in MV Using fault location algorithm
e Outage detection in LV “last gasp” signal from user meters
f Outage location in LV Mapping “last gasp” signals of user meters
g Fault detection in LV Automatically done by feeder protection devices
h Fault location in LV It is not cost-beneficial, and its requirements cannot be met from existing meters. However, the same proposed algorithms for fault location in MV can be applied in LV.
7.2 Validation scenario
Regarding the methodology for fault location in distribution grids, MV and LV are the same. However, fault location in MV is more interesting and beneficial, as a larger number of customers may be affected by a power outage in MV. DENERG at PoliTo proposed an impedance-based fault location method for its accuracy and minimum required measurement. This method at least require the phasors or samples of voltage and current recorded at the head of the main MV feeders (HV/MV substation) and DG terminals (pre- and during fault); active and reactive consumptions or forecasted loads for MV/LV transformers; and network data in terms of topology and line impedances. As FLEXMETER smart meters are not installed at the primary station level, only existing measurements could be used for this use case. However, due to lack of communication system to retrieve real time pre- and post-fault data from one side, and limitations of network data accessibility, we demonstrate the proposed method and communication architecture through simulation.
For the simulation, we performed tests and validations using real time simulation, because it is a highly reliable method based on electromagnetic transient simulation which can provide a virtual environment of the real systems where new control strategies (e.g. fault location) can be tested ex-ante before implementing in the real world, providing trustable real-like information on impacts and benefits. This kind of simulation for testing and validation of proposed algorithms reduces costs, enables more complete and continuous testing of the entire system without interruption, safely under possibly dangerous conditions, and with many possible configurations without physical modification.
To test and validate the proposed fault location algorithm, a portion of Turin distribution system is modeled at DENERG and executed using an Opal-RT hardware simulator. The ”virtual” meters at the beginning of MV feeders measure pre- and during fault voltage and current values as well as an alarm indicating the circuit breaker trip (feeder fault detection).
The portion of distribution system used in simulation consists of a primary substation with three MV-22 kV busbars, each of which is fed by a transformer characterized by voltage ratio of 220/22 kV. There are 5 MV lines starting from the HV/MV substation supplying 40 MV/LV transformers, and totally 49 branches. The real-time platform RT-LAB® developed by OPAL-RT® is used for simulating the distribution system. The grid model is developed in MatLab Simulink® (SimPowerSystem toolbox) with some Artemis library blocks from

D6.2 Report on evaluation scenario and metrics
– 20 – FLEXMETER is a project co-funded by the European Union
OPAL-RT. To execute the model on the real-time simulator, a fixed step time of 50 µs is selected for electromagnetic transient studies. The sampling time step to get snapshots of system status and measurements (reporting rate) is set as 250 µs. Based on the applied fault location algorithm, 32 samples per one cycle are required before fault occurrence and 32 samples of one cycle after fault occurrence and before protection reaction. The selected cycles should not be more than a few cycles far from the fault, however if a wide observation window (e.g. 1 second) around fault is retrieved, the abnormal/faulty values can be easily recognized. Therefore, we set the communication rate of the meter 1 second.
The visualization application is aimed to constantly analyze and prepare the demanded measurements for the supervisor. The supervisor monitors the network and the interoperability of multiple applications and algorithms. The visualization is through aggregator interface; the main output of the fault location algorithm including the location of fault occurrence (i.e. the distance from closest upstream secondary substation) and the fault impedance are displayed considering the topology of the network, and measured voltages and currents which are recorded pre- and during fault are scoped out.
Impedance-based methods have accurate fault location results, but they may report multiple locations for a single fault. On the other hand, the methods based on sparse voltage measurements do not have the multiple estimation problems, but they are sensitive to measurement errors and their accuracy is limited to the nearest node to fault location. We proposed a combined method which firstly performs an impedance-based algorithm to find the possible locations for fault and the related fault impedance values. Then, it applies the fault at each point reported by the impedance-based method with the calculated fault resistance and investigates the similarity between the calculated voltage sags and measured voltage sags to find the correct solution. To get this latter additional measurement, one or more meters installed at MV/LV (secondary) substations should send the during-fault current and voltage waveforms or phasors immediately after the outage detection. Based on the current scenarios, additional meters which may support fault location process would be installed at substations, but installing these meters at the prosumer side will improve the accuracy of the results.
Although the functionality and accuracy of the proposed fault location algorithms are validated through real time simulations, but the performance of the method could be also tested in the real field. To validate the efficiency of the method, an offline test can be carried out using some past recorded fault data. Online live tests can be also considered if the installed meters provide the required data: at least pre- and during fault voltage and current phasors from primary substations for MV fault location, or the same data from secondary substation for LV grid fault location. Additional measurements in any of these cases would improve the accuracy of the function. Outage detection/location can be also tested if the meters could send last gasp messages. Malmö case may meet such requirement.
7.3 Metrics for the evaluation
Distribution systems are evolving towards fault self-healing systems which can quickly identify and isolate faulted components and restore supply to the affected customers with little human intervention. A self-healing mechanism can significantly reduce the outage times and improve the continuity of supply. Figure 5 shows the process of a conventional outage management system. As it is indicated, restoration of customers on healthy (no faulty) sections of feeder takes at least 40-80 minutes. This means a large number of customers (all LV grids supplied by the disconnected MV feeder) are interrupted for a considerable duration of time, which eventually impacts on customer satisfaction and distribution system reliability.

D6.2 Report on evaluation scenario and metrics
– 21 – FLEXMETER is a project co-funded by the European Union
Figure 5 Process of a conventional outage management system
Reliability is defined as the ability of the power network to deliver uninterrupted power to its customers at a prescribed level of quality and security. Outages within a distribution system are one of the main factors threatening distribution system reliability. We evaluate distribution system reliability using reliability indices:
SAIDI (System Average Interruption Duration Index) shows the average intruption duraion per customer:
where Ni is the number of customers and Ui is the annual outage time for location i. In other words, SAIDI is calculated by dividing “sum of all customer interruption durations” by “total number of customers served”.
SAIFI (System Average Interruption Frequency Index) shows the average number of intruptions per customer:
where λi is the failure rate, Ni is the number of customers for location i. In other words, SAIDI is calculated by dividing “total number of customer interruptions” by “total number of customers served”.
Any improvments in the techniques and methodologies of conventional outage management system depicted in Figure can be evaluated by using the above-mentioned metrics. Applying a fault location algorithm instead of patrolling in the field would reduce crew dispatching time as well as initial decision making process. This can eventually reduce restoration time of the customers located in the healthy sections of the feeder (at least 40 minutes). It should be noted that isolation process acceleration would also limit number of interrupted customers within the faulty area.
In advanced distribution system where RTUs are widely dispersed and automatic reclosers are intensively exploited, applying a “fast” fault location method and also a communication and measurement infrastructure,
Restoration of customers on healthy
sections of feeder (40-80 min.)
Patrolling (15-30 min.)
Outage mapping and decision making
(10-15 min.)
Repair or replacement
(1-4 hrs.)
Repair crew dispatching and
travelling (15-30 min.)
Fault isolation (1-5 min.)
Normal operation
Protection system operation
and fault notification
ii R
i R
SAIDI=
i
i
U N
NÎ
Î
åå
ii R
i R
SAIFI=
i
i
N
N
lÎ
Î
åå

D6.2 Report on evaluation scenario and metrics
– 22 – FLEXMETER is a project co-funded by the European Union
not only patrolling phase of the conventional process to locate the fault is eliminated, but also there would be no need to dispatch crew to isolate the faulty section of the network. This significantly reduce isolation and restoration time.

D6.2 Report on evaluation scenario and metrics
– 23 – FLEXMETER is a project co-funded by the European Union
Storage integration
8.1 Description
The Storage Integration use case aims at providing the main steps required for the integration of Energy Storage Systems in the existing electrical energy distribution network while highlighting the required data flow and main costs for the implementation of new storage modules. The electric storage database created for this together with the selection procedure and Cost Benefit Analysis (CBA) considerations are envisioned as a possible service to the DSO. As such the only considered solutions are based on storage technologies fit to be integrated at substation level. For further details please refer to deliverable D3.2 “Report on electric storage, fault and outage detection integration”.
8.2 Validation scenario
Since at the moment the project is at a stage in which the meters, mainly in the Italian test site, have not yet been fully installed and not all data are available and even more since no storage addition at substation level is envisioned as part of this project, the validation for this use case will be done in simulation envoirement as part of WP6. This will involve simulations with specific scenario at the beginning (assuming DG presence, additional from the one currently existing in the field) and further validation with real data from the pilots when it will be available for this purpose.
The validation scenarios will use input data from substation for characterization of the test cases and will involve visualization through aggregator interface.
The envisioned validation is based on a scenario where a replica of the PV installation in Envi Park in the simulation environment is created and data from the pilot meters is used.
The validation already done as part of WP3 is based on the Hillie network and was done in a static simulation environment while using the network data, the premise of an additional PV generation point. This additional generation disturbs the voltage level at the PCC and this disturbance is mitigated using additional storage (at substation level). The additional storage is chosen using the Electric Storage Database created for this purpose and a cost-benefit analysis.
The output of this use case will not be integrated as part of the Flexmeter “cloud” solution and is intended as service provided only to the DSO and only on demand.
8.3 Metrics for the evaluation
As part of the metrics used to evaluate this use case the most important one is the economical cost. This cost is based mainly on the cost of the additional storage but also on the effort used when determining the most appropriate solution to mitigate the problem, the installation cost.
On the other hand, also as part of the metrics that can be used to evaluate the solution we find a couple of economical ones like the “lack of cost” involved in additional maintenance and the avoided cost with other solutions used to mitigate the problem.
As non-economical metrics that can be used to evaluate the solution there are the improvements in PQ parameters (voltage level – that might be quantified as the number of PQ related events that are avoided), available energy during load balancing etc.

D6.2 Report on evaluation scenario and metrics
– 24 – FLEXMETER is a project co-funded by the European Union
Also as a metric it is worth mentioning that while the Database is fully-reusable (with minimal periodical updates) the solution provided by the Storage Selection Procedure is dedicated and necessitates topological data of the studied grid-area and also generation and load curves. It also involves a dedicated simulation for each case, simulation that generates the afore mentioned effort.
Information on all of these metrics will be provided to the DSO (that is the only beneficiary of this use case) in order for them to determine if installing additional storage is appropriate at that time.

D6.2 Report on evaluation scenario and metrics
– 25 – FLEXMETER is a project co-funded by the European Union
Dynamic storage management
9.1 Description
The Dynamic storage management aims to decrease the energy demand peaks. It implements an Evolutionary strategies in order to minimize the loss of life of the batteries while minimizing the differences between the energy produced and the planned production curve.
9.2 Validation scenario
The validation will be performed by using the Energy Network Simulator by RWTH. During the validation, the batteries will be place according to the solution of the UPB computation. Data from UPB can be used as input even if the purpose of UPB storage planning is voltage regulation, while the purpose of this service is production-consumption balancing.
9.3 Metrics for the evaluation
Evaluation of the improvements achievable in terms of load unbalancing by means of the proposed dynamic storage management.
In order to evaluate the improvements due to the introduction of the dynamic storage management we use two metrics. The first one is the integral with respect ot the time of the difference between the real power consumption and the predicted production curve.
The second metric is
(RLDSM – RLSM) / RLDSM,
where RLDSM is the Residual Life by using Dynamic Storage Management and RLSM is the Residual Life by using Standard Methods.

D6.2 Report on evaluation scenario and metrics
– 26 – FLEXMETER is a project co-funded by the European Union
Load balancing & Demand Response
10.1 Description
In Europe, the growing variability of energy produced, self-produced and consumed leads to the need of flexibility in the electricity system. Flexibility on the demand side could be used by the Energy Aggregators to optimize their portfolio as well as by system operators for balancing and constraints management purposes.
An Energy Aggregator acts as an intermediary between customers who provide energy flexibility and procurers of this flexibility. The Energy Aggregator would not only identify and gather customer flexibilities and intermediate their joint market participation but also implement in-home cost saving program for residential customer, control their loads or renewable energy sources and perform services for the utilities such as power and overload management of primary and secondary station of the power grid. Energy Aggregators can join residential consumers in cluster to open the doors to these new services.
Load Balancing, also known as Demand Side Management, and Demand Response are services commonly used by the Energy Aggregator to prevent the grid unbalancing between generation and consumption.
DR service react to DSO request to drop the consumption to a percentage of the overall power demand of a Substation Geographical area in a time interval to manage consumption peak that can try the reliability of the power grid. Current approaches for Demand Response problems aims at curtailing/activating a set of customer loads in order to achieve the demand supply balance for the benefits of the utility provider that in turn may apply discounts or rewarding to the users.
DR service is expected to react to events inducing an excess/lack of energy consumption and has to provide a list of appliances to be switched off in order to restore a feasible energy consumption at a Substation Unit level and minimize the discomfort of the customers participating to the DR event.
The algorithm is a two stage optimization procedure: firstly, an initial set of appliances to be shut down is identified with the goal of minimizing the Building Units affected by the related appliances shut down; secondly an additional layer of optimization is applied with the goal of reducing the number of appliances to be shut down among the ones selected in the first stage while respecting the feasible energy consumption. Finally, a curtailment/activation command is sent to the selected appliances that stop/starts automatically their cycles.
DSM change customer power demand in order to better follow the power supply pattern, both offering an ancillary service to the DSOs to foster grid management. Current approaches for the Demand Side Management problem aim at optimizing the schedule of loads in order to minimize peak demand for the benefit of the utility provider that in turn may apply cheaper tariffs to the users. However, they typically do not take into account the homeowner’s preferences in their optimization.
DSM service exploits customer behavioural changes in energy usage to profile the power consumption pattern of a Substation Unit. This service aims at organize the activations of the entire set of shiftable appliance in the Substation Geographical Area, suggesting to people the best time to run their appliances in order to fulfill the DSO request for the daily consumption pattern, to minimize the impact on the users’ lifestyle and to respect the comfort of consumers.
A crucial aspect to respect the homeowners’ preferences and to gain customers’ acceptance of the activation suggestion is forecasting their energy consumption activities. DSM module will predict the energy consumption of shiftable appliances that takes into account the human routine interaction, like washing machine and dish washer. A fundamental assumption is that human behaviour follows time based cyclic
D6.2 Report on evaluation scenario and metrics
– 27 – FLEXMETER is a project co-funded by the European Union
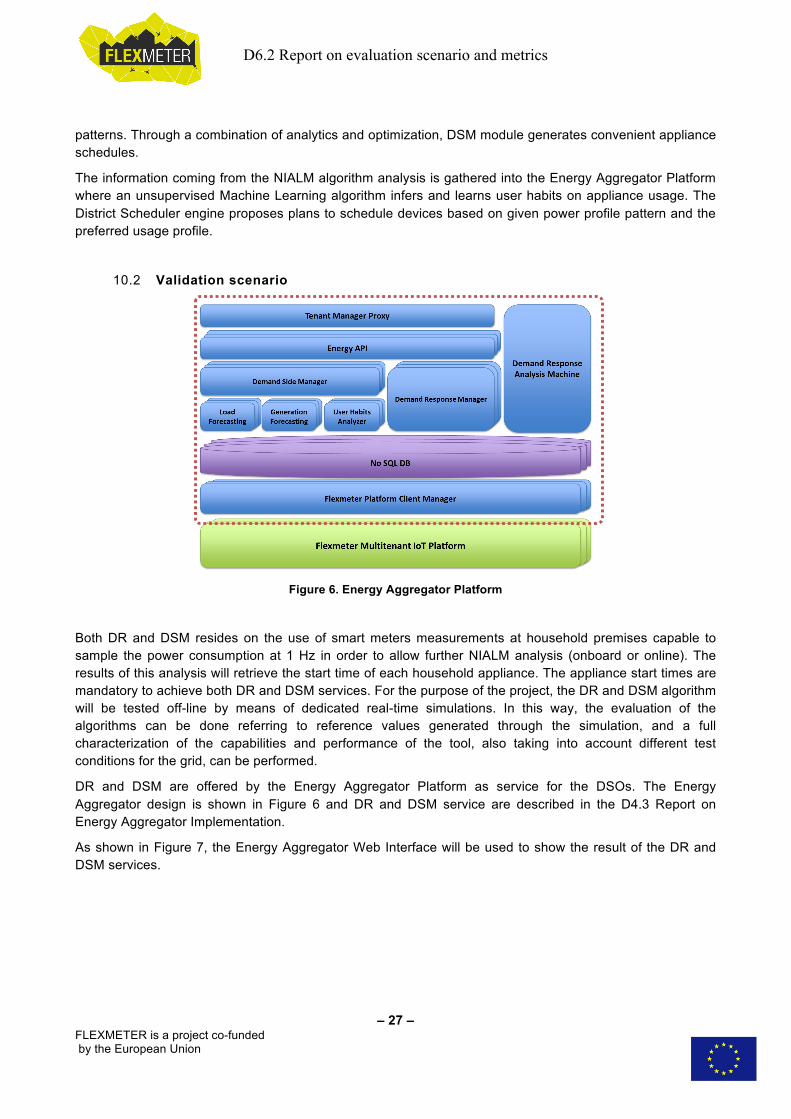
patterns. Through a combination of analytics and optimization, DSM module generates convenient appliance schedules.
The information coming from the NIALM algorithm analysis is gathered into the Energy Aggregator Platform where an unsupervised Machine Learning algorithm infers and learns user habits on appliance usage. The District Scheduler engine proposes plans to schedule devices based on given power profile pattern and the preferred usage profile.
10.2 Validation scenario
Figure 6. Energy Aggregator Platform
Both DR and DSM resides on the use of smart meters measurements at household premises capable to sample the power consumption at 1 Hz in order to allow further NIALM analysis (onboard or online). The results of this analysis will retrieve the start time of each household appliance. The appliance start times are mandatory to achieve both DR and DSM services. For the purpose of the project, the DR and DSM algorithm will be tested off-line by means of dedicated real-time simulations. In this way, the evaluation of the algorithms can be done referring to reference values generated through the simulation, and a full characterization of the capabilities and performance of the tool, also taking into account different test conditions for the grid, can be performed.
DR and DSM are offered by the Energy Aggregator Platform as service for the DSOs. The Energy Aggregator design is shown in Figure 6 and DR and DSM service are described in the D4.3 Report on Energy Aggregator Implementation.
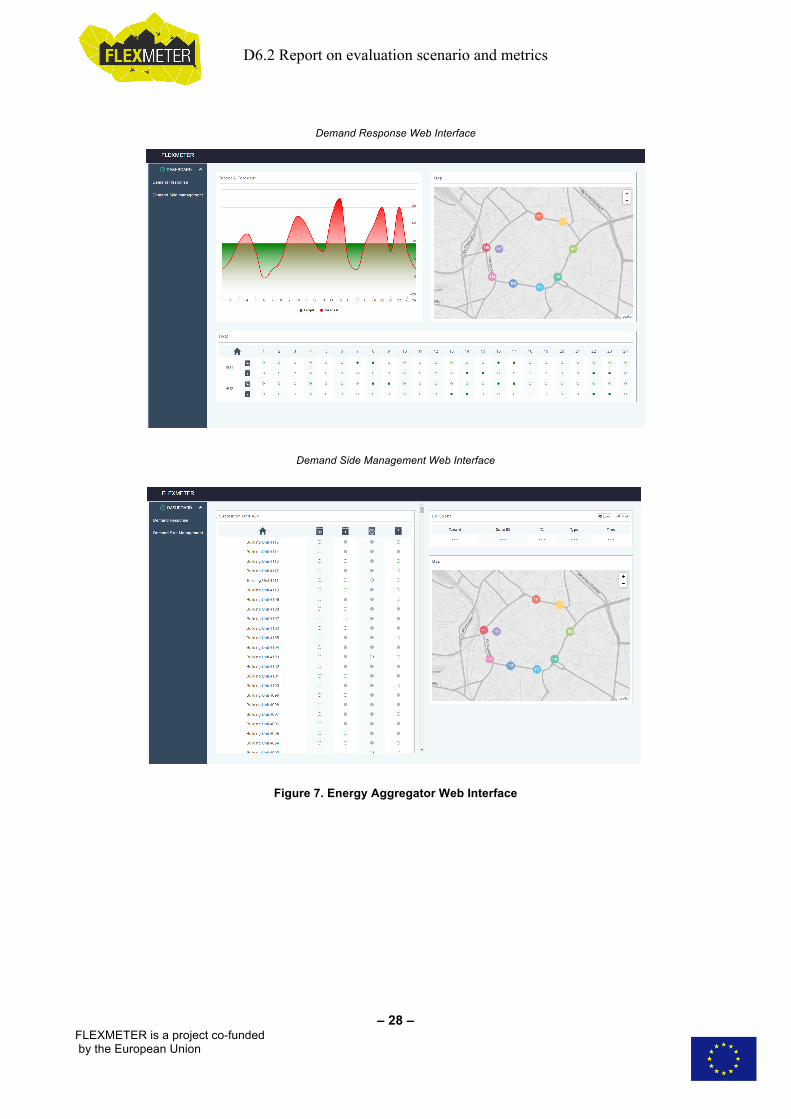
As shown in Figure 7, the Energy Aggregator Web Interface will be used to show the result of the DR and DSM services.
D6.2 Report on evaluation scenario and metrics
– 28 – FLEXMETER is a project co-funded by the European Union
Demand Response Web Interface
Demand Side Management Web Interface
Figure 7. Energy Aggregator Web Interface

D6.2 Report on evaluation scenario and metrics
– 29 – FLEXMETER is a project co-funded by the European Union
10.3 Metrics for the evaluation
10.3.1 Demand Response
The goal of the Demand Response service is to drop the consumption to reach a percentage of the overall power demand of a Substation Unit in a time interval. When running the online simulation in real-time, a DR event will be required to the Energy Aggregator Platform. The Energy Aggregator Platform will run the DR algorithm and the curtailment commands will be send to the RTS obtaining a reduction in a time interval of the Substation Unit power consumption. Different metrics will be measured to assess the correctness of the curtailment result. The metrics used to assess the DR events will be:
• Power Reduction Percentage:
𝑃𝑅𝑃 = 𝑃𝑚𝑎𝑥PQ9-RSTU 𝑡∗
𝑃𝑚𝑎𝑥PQ9-RS(𝑡59PW9)𝑡∗Î 𝑡59PW9, 𝑡S*X
• Mean Power Reduction:
𝑀𝑃𝑅 =𝑃PQ9-RS 𝑡 − 𝑃PQ9-RSTU 𝑡 𝑑𝑡9Z[\
9]^_`^𝑡S*X − 𝑡59PW9
𝑘𝑊
• Energy Curtailed:
𝐸𝐶 = 𝑃PQ9-RS 𝑡 − 𝑃PQ9-RSTU 𝑡 𝑑𝑡9Z[\
9]^_`^ 𝑘𝑊ℎ
Two metrics can be used to assess the quality of the Demand Response algorithm. On one side, it is important to consider the scalability of the approach, on the other side it is fundamental to theoretically set the largest error the algorithm can take, being it a heuristic method.
𝑃PQ9-RSTU (𝑡) 𝑃PQ9-RS(𝑡)
𝑡59PW9 𝑡S*X
𝑃𝑚𝑎𝑥PQ9-RS(𝑡59PW9)
𝑃𝑚𝑎𝑥PQ9-RSTU (𝑡)

D6.2 Report on evaluation scenario and metrics
– 30 – FLEXMETER is a project co-funded by the European Union
The solution approach is based on two phases each of with strongly rely on ordering appliances and building units basically over the energy consumption they provide. The ordering part of the algorithm has a standard computational complexity for sorting, namely O(n * log n) where n is the total number of appliances involved in the demand response procedure. The remaining parts of each phase rely on a few operations repeated at maximum for all appliances, thus with a computational complexity O(n). Thus, being the ordering aspect of the algorithm dominant in terms of complexity with respect to the other calculations, the total complexity of the procedure is O(n * log n). This means that given the number of appliances of a scenario a bound on the order of magnitude of the time needed to execute the algorithm could be calculated. As an illustrative example, refer to figure below where different orders of complexity are plotted with respect to the size of input data.
The O(n*log n) complexity means in practice in our case that even a problem with 10000000 (ten millions) appliances could be solved in few seconds. This assesses the scalability of the proposed algorithm.
The second metric refers to the maximum error the proposed procedure may produce. The requested cutoff from a Demand Response event is represented by a percentage of the total consumption provided by all active appliances. Due to the fact that appliances cannot be dimmed, the real shutdown quantity is calculated as the sum of consumptions of the selected subset of appliances to be switched off. A maximum error between the real shutdown quantity and the problem optimal solution can be calculated as the ratio between the value of the largest consuming appliance and the cutoff request. The proposed algorithm will never cut more than this quantity because the least possible subset of appliances is selected for the shutdown. Thus, the most consuming appliance represents a worst case.
Note that, as the size of the input increases (i.e. the number of appliances involved), the error ratio decreases because the relative contribution of the most consuming appliance with respect to the requested cutoff quantity becomes less influential.
Thus, for each scenario a worst case error could be calculated in advance and it decreases as the scenario increases in size.
10.3.2 Demand Side Management
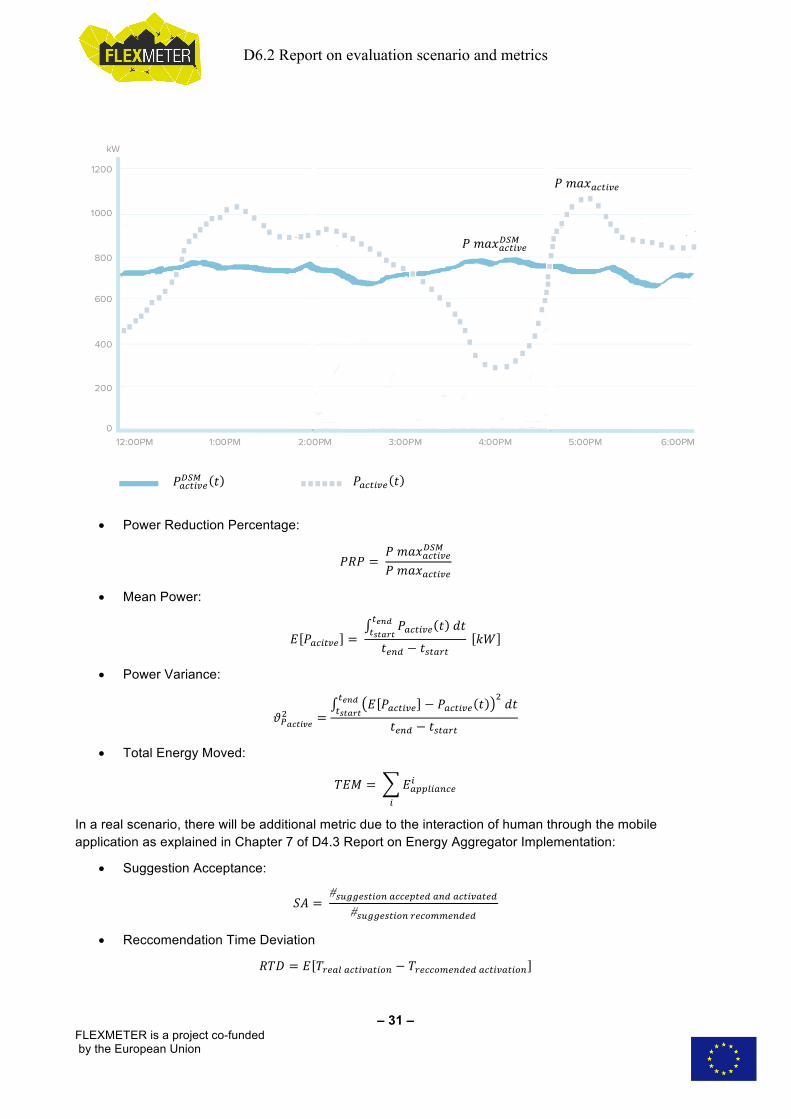
The goal of the Demand Side Management service is to profile the power consumption pattern of a Substation Unit through suggestion sent to the household to activate in a certain time their shiftable appliances. When running the online simulation in real-time, a DSM event will be required to the Energy Aggregator Platform for the day ahead profiling of the Substation Unit power consumption. The Energy Aggregator Platform will update the user behaviour with the last appliance activation to update the user habits model and will run the DSM algorithm. Since we are going to simulate the interaction with the user, we are going to suppose that all the resulting suggestion will be accepted by the user to see the pattern result. Activation commands will be send to the RTS obtaining the target profile of the Substation Unit power consumption. Different metrics will be measured to assess the correctness of the profile result. The metrics used to asses the DSM events will be:
D6.2 Report on evaluation scenario and metrics
– 31 – FLEXMETER is a project co-funded by the European Union
• Power Reduction Percentage:
𝑃𝑅𝑃 = 𝑃𝑚𝑎𝑥PQ9-RSTde
𝑃𝑚𝑎𝑥PQ9-RS
• Mean Power:
𝐸 𝑃PQ-9RS = 𝑃PQ9-RS 𝑡 𝑑𝑡
9Z[\9]^_`^𝑡S*X − 𝑡59PW9
𝑘𝑊
• Power Variance:
𝜗g_h^ijZ/ =
𝐸 𝑃PQ9-RS − 𝑃PQ9-RS 𝑡/𝑑𝑡9Z[\
9]^_`^𝑡S*X − 𝑡59PW9
• Total Energy Moved:
𝑇𝐸𝑀 = 𝐸Pll3-P*QS-
-
In a real scenario, there will be additional metric due to the interaction of human through the mobile application as explained in Chapter 7 of D4.3 Report on Energy Aggregator Implementation:
• Suggestion Acceptance:
𝑆𝐴 = #5oppS59-4*PQQSl9SXP*XPQ9-RP9SX
#5oppS59-4*WSQ4FFS*XSX
• Reccomendation Time Deviation
𝑅𝑇𝐷 = 𝐸 𝑇WSP3PQ9-RP9-4* − 𝑇WSQQ4FS*XSXPQ9-RP9-4*
𝑃PQ9-RSTde (𝑡) 𝑃PQ9-RS(𝑡)
𝑃𝑚𝑎𝑥PQ9-RSTde
𝑃𝑚𝑎𝑥PQ9-RS

D6.2 Report on evaluation scenario and metrics
– 32 – FLEXMETER is a project co-funded by the European Union
Heat pumps management
11.1 Description
The ”heat pumps management” is a service conceived to define the day-ahead scheduling of electric heat pumps used for space heating in residential or commercial buildings. The main goal of this application is to provide a service to DSOs, by optimizing the operation of the heat pumps connected to a specific low voltage grid in order to achieve the reduction of the power peaks and the flattening of the daily power consumption profile. For its nature, the heat pump management service is intrinsically belonging to the category of the Demand Side Management services. However, a dedicated use case has been considered here because of the peculiarities of this application. First, it is worth highlighting that where space heating is obtained by means of electro-thermal devices, this load represents one of the most relevant components of electric power consumption. This holds in particular for the case of residential buildings, where the energy consumption due to electric heat pumps can be significantly higher than the rest of all the other home appliances during cold months. This provides a first motivation to consider the management of the heat pumps separately from the other appliances and to design a service tailored to this type of load. A second aspect concerns the physics behind this use case. Since heat pumps are used for the space heating, both electrical and thermal models need to be developed in order to correctly design this service and to guarantee that customers can obtain minimum comfort requirements while supporting the efficient operation of the electric grid. Pursuing thermal comfort requirements is an essential factor to convince end-users to accept this kind of programs, which are, directly or indirectly, invasive with respect to customers’ habits. Based on these preliminary considerations, a centralized optimization algorithm has been designed for the smart scheduling of the heat pumps. The algorithm takes into account the forecast loading conditions for the following day at the point of interest, for example at the MV/LV substation, and schedules the operation of the subtended heat pumps so to avoid operation during peak hours and to foster valley filling at off-peak hours. This objective is a common requirement for many DSOs, since a flatter demand profile allows an easier operation and management of the grid, and cutting power peaks leads to a more efficient operation of the grid through the reduction of the power losses. In addition, when grids are operated close to their limits, a reduction of the power peaks can also allow postponing network reinforcement investments. From a business perspective, this service can be interesting also for energy aggregators or retailers, since limiting the power consumption at peak hours would automatically lead to a reduction of the price of the energy bought in the energy market. As anticipated, while the primary goal is to provide a technical service to DSOs, the optimization process also considers thermal comfort requirements defined by the end-users. Such requirements are defined in the algorithm as constraints that are included in the formulation by considering the thermal model of heat pumps and buildings. Thanks to these thermal constraints, the heat pump management can be considered as a service also oriented to final customers. Indeed, the heat pumps scheduler provides to each user the desired thermal comfort and guarantees at the same time also the minimization of the daily energy consumption. More information and details about the implementation of the optimization algorithm are available in Deliverable D4.4 “Report on Demand Response Algorithms”.
11.2 Validation scenario
Testing and validation of the heat pumps management service in the field would require the availability of different resources. First, a scenario, like a district or a neighbourhood, where electric heat pumps are used to provide space heating is required. Second, the infrastructure to remotely control the heat pumps, the interfaces to actuate the control commands on the heat pump, and additional sensors for validation purposes

D6.2 Report on evaluation scenario and metrics
– 33 – FLEXMETER is a project co-funded by the European Union
(like outdoor and indoor temperature sensors) would be needed. Even when all these things are available, customers involvement is necessary and their availability to allow third parties to control their electro-thermal devices is required. All these aspects prevent an easy deployment of testing procedures on the real grid for this use case. For these reasons, the heat pumps management service will be tested by means of ad hoc simulations in laboratory environment. To this purpose, a residential low voltage grid will be used as a reference for the electric scenario, while different characteristics of buildings and heat pumps will be taken into account to model the thermal aspects. A co-simulation platform will be used to run the simulations, in order to obtain the thermal profile of each customer over the day and to get an insight about the resulting electric power consumption at both customer and grid level. Different test scenarios will be created considering a varying penetration of the electric heat pumps among the residential customers, in order to assess the potential benefits when having a different diffusion of these appliances in the grid. In this way, the impact of the proposed service can be mapped both to current scenarios, characterized by a still limited penetration of electro-thermal devices, and to a more futuristic context, having a larger diffusion of such devices. Moreover, since weather conditions play a key role in the definition of the heat pumps scheduling, different periods of the year will be considered in the simulation scenarios in order to analyse the impact of this factor on the achievable results. For the simulation purposes, the co-simulation engine used to test the heat pumps management service will be fully integrated with the Flexmeter cloud platform. Fig. 8 shows a schematic view of heat pumps management service integration with the Flexmeter platform, together with the main data required for such application. To correctly operate, the service needs the knowledge of the thermal models of the customers, here including both building and heat pump characteristics. These data are static information that can be supposed to be retrieved by the service provider and to be stored in an internal database of the service application. For the daily scheduling of the heat pumps, the additional information required includes: - Forecast of the weather conditions, namely the expected outdoor temperature profile for the following
day; this information can be sent every day into the Flexmeter cloud by a weather forecast service so that it is also shared with other possible services that need this kind of information.
- Forecast of the daily profile of aggregated power consumption at grid level: this information can be obtained through the processing of the smart meter measurements; since this information could be required by many different DSO services, it is likely to assume that a dedicated service exists, aimed at collecting and processing the smart meter measurements and at clustering the results in different categories for providing different detail levels and classes of statistic data.
- Customer comfort requirements: these are necessary to deliver to the customer the desired reference temperature; since customers can have different requirements every day (e.g. depending on their presence at home, etc.), this information in stored in the Flexmeter cloud databases and the end users can update it when needed.
Relying on these input data, the heat pumps management service defines the optimal scheduling of the controlled heat pumps and forwards the associated information to each customer. In the use case scenarios, this information will be acquired by the simulation controller and implemented in the simulation engine in order to test the service and to evaluate the related benefits from the DSO and the end-user perspective.

D6.2 Report on evaluation scenario and metrics
– 34 – FLEXMETER is a project co-funded by the European Union
Figure 8. Integration of the heat pump management service with the Flexmeter cloud
11.3 Metrics for the evaluation
The main goal of this use case is to define a smart scheduling of the heat pumps aimed at supporting the efficient operation of the distribution network. Since the primary objective is to reduce the peaks of power in the grid, the achievable power peak reduction will be also considered as first metric to assess the potential benefits provided by the conceived service. To this purpose, performed simulations will consider a scenario where no optimal scheduling of the heat pumps is available as term of comparison. Given the power profile Pbase resulting in the base scenario (without any heat pump scheduling) and the one achieved following the provided heat pumps scheduling (PHPS), the percentage power peak reduction can be naturally defined as:
𝑃𝑒𝑎𝑘𝑟𝑒𝑑𝑢𝑐𝑡𝑖𝑜𝑛% = 100 ∗max(𝑃zgd) − max(𝑃{P5S)
max(𝑃{P5S)
In order to cut the power peaks, the heat pump management service tries to push the heat pumps operation to the off-peak hours. As a result, the day ahead scheduling leads to a flatter daily profile, which in general is helpful for the DSOs to operate more efficiently and more easily their grid. A second index used to evaluate the impact of the proposed service is thus the so-called load factor, which is defined as the ratio between the average demand during the day and the maximum demand:
𝐿𝑜𝑎𝑑𝑓𝑎𝑐𝑡𝑜𝑟 = mean(𝑃zgd)max(𝑃zgd)
From the above equation, it is immediate to evaluate that the load factor has a value always included between 0 and 1, and it gets closer to 1 for an increasing flatness of the power profile over the day. Even in this case, the evaluation of this metric in the simulations will be done by comparing the results to those achieved in a base scenario where no heat pump scheduling is applied. While the previous two metrics aim at indicating the possible technical benefits achievable on the grid, other metrics can be used to assess the goodness of the optimization algorithm and to evaluate its effects on the customers. For the first purpose, a meaningful index could be the percentage of flexible energy cut from

D6.2 Report on evaluation scenario and metrics
– 35 – FLEXMETER is a project co-funded by the European Union
peak hours. In fact, since the potential of the proposed optimization algorithm is only to schedule the flexile energy associated to the electro-thermal devices, the level of flexible energy that the optimization algorithm is able to move away from the peak hours can be considered as a possible indicator of the performance of the scheduling service. Calling with 𝑃zg(𝑡FP�) the power consumption related to the heat pumps during the peak time 𝑡FP�, the flexible energy cut can be defined as:
𝐹𝑙𝑒𝑥𝑖𝑏𝑙𝑒𝑒𝑛𝑒𝑟𝑔𝑦𝑐𝑢𝑡% = 100 ∗ 𝑃zgdzg 𝑡FP� − 𝑃{P5Szg 𝑡FP�
𝑃{P5Szg 𝑡FP�
where the subscripts "HPS" and "base" refer again to the two scenarios with and without optimal heat pump scheduling, respectively. As a measurement of the effects of this service on the customers, a thermal discomfort index is defined. Given the desired temperature indicated by the end-users, and the boundaries around this temperature, the thermal discomfort index is defined as the number of minutes for which the actual temperature of the house is out of the allowed boundaries. To this purpose, it is worth underlining that the designed service should define the heat pumps scheduling in order to always provide the required thermal comfort to the customers. However, possible discomfort can potentially arise because of different factors, like the discretization time step used for the heat pumps scheduling, or the possible presence of uncertainties in the knowledge of the thermal models or of any other of the input data to the algorithm. The thermal discomfort index can be thus helpful to assess the goodness of the designed service in realistic scenarios that take into account a non-ideal knowledge of all the parameters. As final metric, the impact of this service on the single customers will be also assessed by monitoring the daily energy consumption resulting in both the base scenario (no heat pumps scheduling is applied) and in the optimization scenario (the heat pumps scheduling is applied).
11.1 Bill prediction
11.2 Description
This use case relies on the estimation of loads done by the load forecasting algorithms, where the tariff information is added. The tariff information will be applied for the Italian and the Swedish markets. However, because of the absence of a true retailed in the consortium, only basic tariff plans can be considered for evaluation. As such, this use case has been proposed in FLEXMETER mainly to show a possible usage of the platform rather to perform a deep and complete exploration of bill prediction potentiality.
11.3 Validation scenario
For the evaluation of this use case, the data involved will be the information about consumption and about the prices. In particular, concerning the price models, the day ahead price for the Swedish case and the flat rate for the Italian case will be considered. The data to which this prediction will be applied are both from pilot users and from the simulation environment.
11.4 Metrics for the evaluation
The considered metric will be the price deviation in terms of price between prediction and real consumption.

D6.2 Report on evaluation scenario and metrics
– 36 – FLEXMETER is a project co-funded by the European Union
Conclusion
In this deliverable the use case evaluation plan and metrics have been presented. For each use case, a description is provided as well as evaluation scenarios and metrics. A complete description of use cases is provided in D1.4. All use cases will use data from pilots for evaluation, while only some of them will be tested by users in the pilot. This applies mainly to the user awareness use cases, for which residential users are involved. For some of the use cases, the real-time simulator will be adopted. The simulator exploits pilot networks and data from installed meters other than of simulated consumers.
The considered metrics are reported. These metrics will be evaluated using feedback from users, measurements on the field from installed devices and data from the real-time simulator. The results about evaluation will be reported in D6.3 and D6.4