Embed Size (px)
Citation preview
report on energy market in poland in 2012 1
REPORT on energy market in poland
RWE polska

report on energy market in poland in 2012 3
TABLE OF CONTENTS
introdUCtion – HoW to read tHe report
energy reSoUrCeS market in poland..............……………………….............………..……......6
day-aHead market at tHe poliSH poWer eXCHange and gaS day-aHead market...........8
Commodity deriVatiVeS market at tHe poliSH poWer eXCHange and gaS market.......12
property rigHtS market, So-Called “ColoUrS market”………………...………..….....…14
raW material marketS and emiSSion alloWanCe marketS……………………..........….17
energy market in poland
day-aHead market..…………………………………………………………………………….…......…20
Commodity deriVatiVeS market..….....…………………………………………………..….…......23
property rigHtS market, So-Called “ColoUrS market”………………………..……......…26
energy market: a perSpeCtiVe.....................…..............................................................31
Commodity marketS and Co2 emiSSion alloWanCe marketS......….......………..….....…33
politiCS and eConomy VS. energy priCeS........…….......………………......…..……..38
rWe polSka prodUCt range........................................................................…46
diSClaimer.................…………………...................………………………....………………….....50
Sylwia Piekut Strategic Portfolio Management
Analyst, RWE Polska S.A.
Łukasz Musiałkiewicz Strategic Portfolio Management
Senior Manager, RWE Polska S.A.
Anna Kunicka Business Development Senior
Specialist, RWE Polska S.A.
Sławomir Skoczek Chief Strategic Portfolio
Management Analyst,
RWE Polska S.A.
Łukasz Dąbrowski Strategic Portfolio Management
Analyst, RWE Polska S.A.
Cooperation
introdUCtion – HoW to read tHe report
4 RWE polska report on energy market in poland in 2012 5
6 RWE polska report on energy market in poland in 2012 7
Power, like other goods, is first generated, then purchased by agents and finally sold to customers. Energy trade companies purchase power from power generators and sell it to end customers. The prices and terms of transactions are individually agreed between the power vendor and purchaser or result from the terms of its purchase (purchase at a power exchange or using Internet power trade platforms). The main power exchange market is the Polish Power Exchange – Towarowa Giełda Energii (TGE). Trade at all TGE markets dedicated to power reached 132 TWh in 2012. This is more than 106% of power sold to end custom-ers throughout the year. Compared to the previous year, trade grew by 4.20%.
ENERGY RESOURCES MARKET IN POLAND
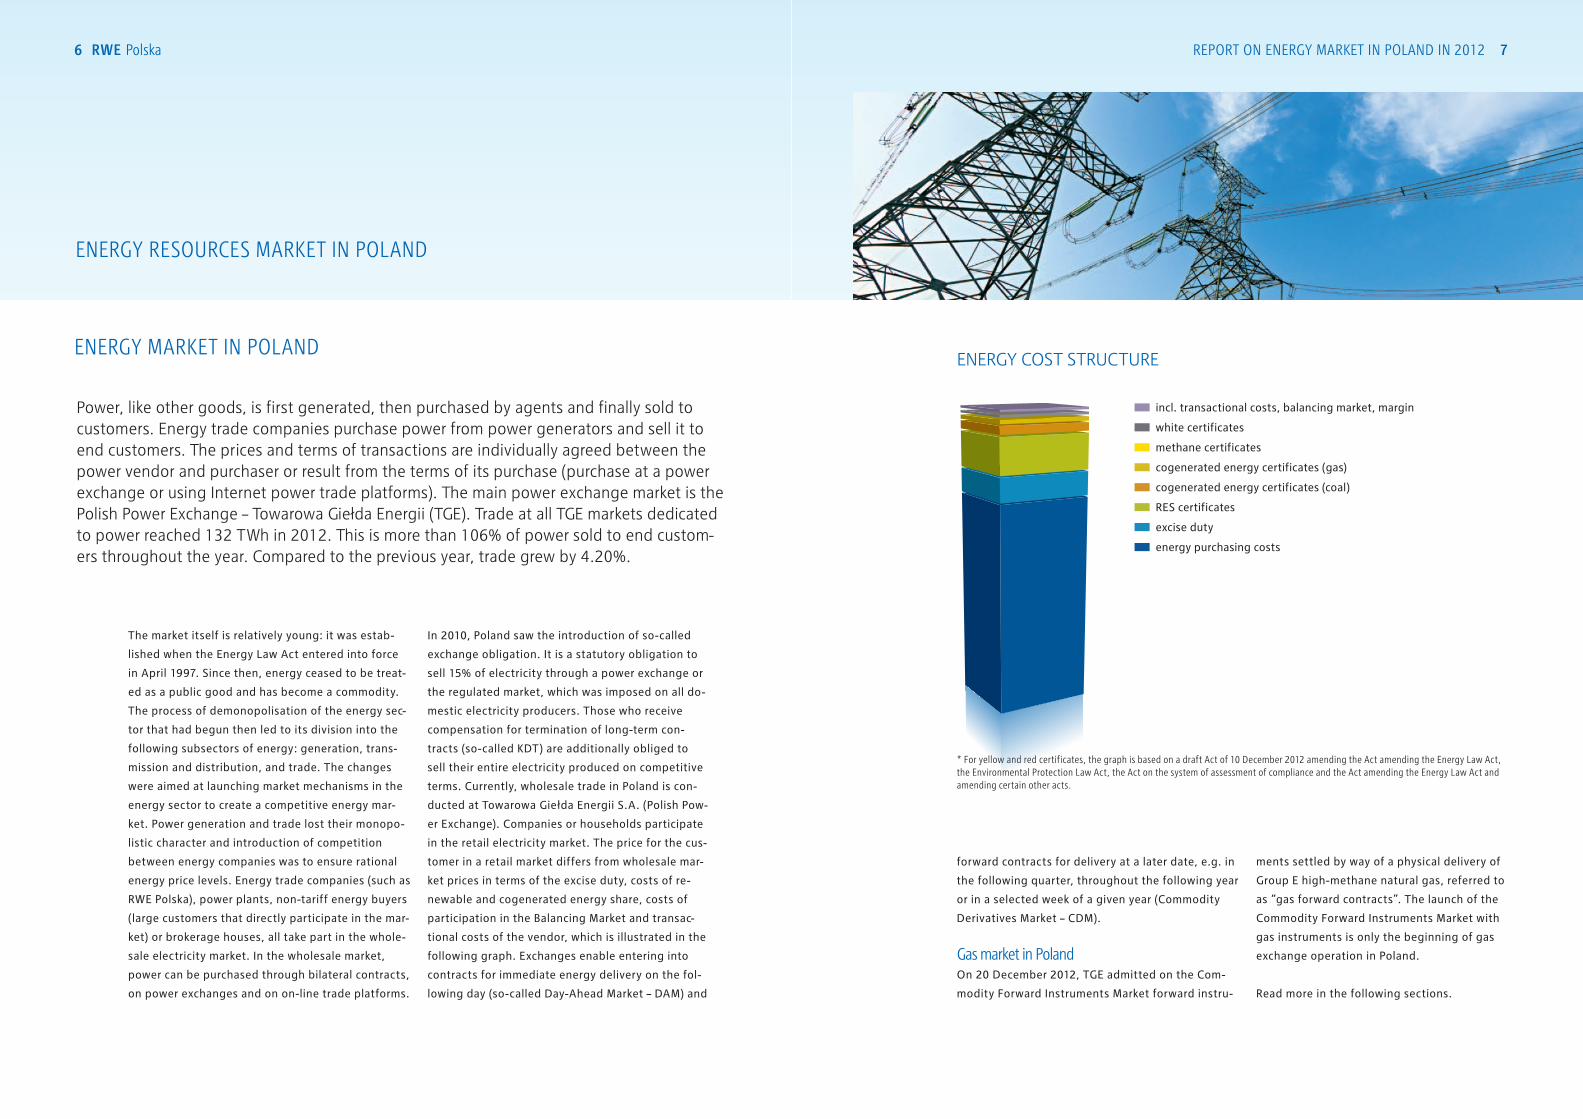
ENERGY COST STRUCTURE
* For yellow and red certificates, the graph is based on a draft act of 10 december 2012 amending the act amending the energy law act, the environmental protection law act, the act on the system of assessment of compliance and the act amending the energy law act and amending certain other acts.
The market itself is relatively young: it was estab-
lished when the Energy Law Act entered into force
in April 1997. Since then, energy ceased to be treat-
ed as a public good and has become a commodity.
The process of demonopolisation of the energy sec-
tor that had begun then led to its division into the
following subsectors of energy: generation, trans-
mission and distribution, and trade. The changes
were aimed at launching market mechanisms in the
energy sector to create a competitive energy mar-
ket. Power generation and trade lost their monopo-
listic character and introduction of competition
between energy companies was to ensure rational
energy price levels. Energy trade companies (such as
RWE Polska), power plants, non-tariff energy buyers
(large customers that directly participate in the mar-
ket) or brokerage houses, all take part in the whole-
sale electricity market. In the wholesale market,
power can be purchased through bilateral contracts,
on power exchanges and on on-line trade platforms.
In 2010, Poland saw the introduction of so-called
exchange obligation. It is a statutory obligation to
sell 15% of electricity through a power exchange or
the regulated market, which was imposed on all do-
mestic electricity producers. Those who receive
compensation for termination of long-term con-
tracts (so-called KDT) are additionally obliged to
sell their entire electricity produced on competitive
terms. Currently, wholesale trade in Poland is con-
ducted at Towarowa Giełda Energii S.A. (Polish Pow-
er Exchange). Companies or households participate
in the retail electricity market. The price for the cus-
tomer in a retail market differs from wholesale mar-
ket prices in terms of the excise duty, costs of re-
newable and cogenerated energy share, costs of
participation in the Balancing Market and transac-
tional costs of the vendor, which is illustrated in the
following graph. Exchanges enable entering into
contracts for immediate energy delivery on the fol-
lowing day (so-called Day-Ahead Market – DAM) and
forward contracts for delivery at a later date, e.g. in
the following quarter, throughout the following year
or in a selected week of a given year (Commodity
Derivatives Market – CDM).
gas market in polandOn 20 December 2012, TGE admitted on the Com-
modity Forward Instruments Market forward instru-
ments settled by way of a physical delivery of
Group E high-methane natural gas, referred to
as “gas forward contracts”. The launch of the
Commodity Forward Instruments Market with
gas instruments is only the beginning of gas
exchange operation in Poland.
Read more in the following sections.
incl. transactional costs, balancing market, margin
white certificates
methane certificates
cogenerated energy certificates (gas)
cogenerated energy certificates (coal)
RES certificates
excise duty
energy purchasing costs
ENERGY MARKET IN POLAND
8 RWE polska report on energy market in poland in 2012 9
NUMBER OF WORKING DAYS AND HOLIDAYS IN 2011–2012
DAY-AHEAD MARKET (DAM) AT THE POLISH POWER EXCHANGE AND GAS
DAY-AHEAD MARKET
The Day-Ahead Market (DAM) enables trade in electricity for delivery at specific times of the following day. One of the main aims of the DAM is to enable initial balancing of contract positions, which consists in adjusting the electricity volume to evolving demand from wholesale market entities. This is where energy volumes resulting from the difference between the dynamically changing demand (which depends on weather conditions, for instance) and previously concluded contracts are sold and purchased. The DAM also plays an important role in creating reference energy prices for other contracts entered into on the wholesale energy market in Poland.
In addition to prices for specific hours, TGE also announces daily indices for a specific day, which are
average prices for the entire day or its part (block contracts) and facilitate tracking mid-term trends on
the electricity market.
Electricity prices are different for specific days (e.g. working days, Saturdays, Sundays, public holidays),
which is one of the factors influencing the price curve fluctuation.
Calendar Data Temperature (Warsaw)
2011 2012working
daysnon-
working days
incl. holidays
working days
non-working
days
incl. holidays
2011 in C
2012 in C
January 20 11 2 21 10 2 -0.6 -1.1February 20 8 - 21 8 - -3.8 -6.2March 23 8 - 22 9 - 3.3 4.6
April 20 10 2 20 10 2 11.1 9.2
May 21 10 2 21 10 3 14.4 15.5
June 21 9 1 20 10 1 18.9 17.2
July 21 10 - 22 9 - 17.9 21.0
August 22 9 1 22 9 1 18.7 19.0
September 22 8 - 20 10 - 15.0 14.6
October 20 10 - 23 8 - 8.3 8.1
November 20 10 2 21 9 2 2.9 5.7
December 21 10 2 21 10 2 2.5 -3.1
Source: own compilation
explanation:Calendar days and temperature levels have a significant impact on power demand: the number of holidays in a given month (the fewer, the higher demand), temperature (in winter months: the lower, the higher the consumption; in warmer months: the higher the temperature, the higher the consumption).
in the dam, in addition to contracts for energy delivery at a specific time of the following day, players may enter into block contracts:
• BASE – a contract for
delivery of the same volume
of energy at any hour during
the day;
• PEAK – a contract for
delivery of the same volume
of energy at any peak hour:
7.00 a.m. – 10.00 p.m.
(15 hours);
• OFFPEAK – a contract for
delivery of the same volume
of energy at any off-peak
hour (10.00 p.m. – 7.00
a.m.);
• MORNING – a contract for
delivery of the same volume
of energy at any morning
hour (0.00 a.m. – 6.00 a.m.).
The level of electricity prices
on the spot market depends on
a number of correlated factors.
They include:
• combination of days, e.g.
working days, weekends,
holidays, holidays combined
with weekends, holiday seasons,
• weather conditions, e.g.
temperature, cloudiness,
precipitation,
• power availability in the National
Power System (NPS) – grid
constraints, generation capacity,
• demand levels in the NPS,
• Cross-Border Electricity
Exchange – import, export of
electricity,
• non-standard events (e.g. EURO
2012),
• energy carrier prices: oil, coal,
gas,
• electricity forward market prices,
• contract position of market
players, e.g. whether most
players buy or sell electricity.
The Report also presents the demand levels of the NPS. It is worth to remember that the factors that
impact demand levels are primarily weather conditions and economic growth rate.
10 RWE polska report on energy market in poland in 2012 11
gas day-ahead marketOn 31 December 2012, a Day-Ahead Market for gas
was launched. The good traded on the market is
Group E high-methane natural gas, further referred
to as “gas”, for delivery on the following day.
The launch of a gas exchange marks the first of
a number of events on the way to full liberalisation
of the market. At present, it is hard to expect any
active interest of companies in trading the blue
fuel on the gas exchange. In order to change that
situation, it is necessary to introduce a statutory
exchange obligation on the sale of at least some
of the resource. It is also planned to enable entities
to operate directly on the gas exchange, and thus
to act as a market animator.
It is important for modelling of the demand for the
exchange gas to abandon the “take-or-pay” princi-
ple and enable companies to further resell the gas
purchased from the previous supplier. It is equally
important as well to provide market players with
free access to transmission infrastructure and to
extend it.
Achievement of a satisfactory trade efficiency at
the Polish Power Exchange enabling for a reference
price to be established, depends on whether the
above assumptions are met.
12 RWE polska report on energy market in poland in 2012 13
Commodity deriVatiVeS market at tHe poliSH poWer eXCHange and gaS market
The Commodity Derivatives Market (CDM) enables entering into contracts for delivery of electricity at a specified future date. The prices of the derivatives market reflect price projections. The CDM market serves for trading in forward contracts for electricity delivery, which assume that the seller (contract issuer) shall deliver energy at a specific future date and at a specific price while the buyer (contract buyer) shall purchase the energy at the specific future date and at the specific price.
Forward contracts enable to set energy prices in
a longer time horizon (up to three years forward at
TGE), which creates significant price drivers for inves-
tors who are planning to build new generation capac-
ity. Customers, on the other hand, can forecast prices,
streamline their electricity purchase costs and hedge
against price increase risk. Currently, the following
three types of contracts are traded on the CDM:
BASE and BASE5 forward contracts
(base) with a 24-hour delivery time, for BASE
irrespective of the weekday or season, for BASE5
only on working days;
PEAK5 and PEAK7 forward contracts
(peak) with delivery at 7.00 a.m. – 10.00 p.m.
(15 hours during a day), for PEAK7 irrespective
of the weekday or season, for PEAK5 only on
working days;
OFFPEAK forward contracts (off-peak hours)
with delivery at 00.00 a.m. – 07.00 a.m. and 10.00
p.m. – 12.00 p.m. on working days and 00.00 a.m.
– 12.00 p.m. on non-working days.
there are four types of contracts in relation to their date of delivery:
weekly (BASE_W), (PEAK5_W) and (OFFPEAK_W);
monthly (BASE_M), (PEAK5_M) and
(OFFPEAK_M);
quarterly (BASE_Q), (PEAK5_Q) and
(OFFPEAK_Q);
annual (BASE_Y), (PEAK5_Y) and (OFFPEAK_Y).
The abbreviated name of each contract indicates
its type and delivery date. For instance,
PEAK5_Q-4-12 means a forward contract for
electricity delivery on working days in the fourth
quarter of 2012 between 7.00 a.m. and 10.00 p.m.
The above delivery dates also refer to BASE5 and
PEAK7 contracts.
The level of electricity prices on the forward
market, like on the spot market, depends on
a number of correlated factors. They include:
energy carrier prices (oil, coal, gas);
CO2 emission allowance prices;
surpluses or deficits in the National Power
System (NPS);
legislation (e.g. excise duty on energy or coal);
behaviour of market players (i.e. the supply and
demand game);
electricity price levels in forward contracts on
neighbouring markets.
Trading of the contracts is carried out in the con-
tinuous trading mode only, from Monday to Friday
8.00 a.m. to 2.00 p.m.
The detailed rules of fixing daily settlement prices
are available at TGE S.A. website.
gas Commodity derivatives marketOn 20 December 2012, Towarowa Giełda Energii
launched trade in forward contracts with physi-
cal delivery of natural gas within its existing Com-
modity Derivatives Market. The market provides
an opportunity to trade in standard forward prod-
ucts for physical delivery of natural gas at a fixed
volume for monthly, quarterly and annual periods.
The traded good is delivery of gas at a fixed vol-
ume in all hours of the delivery period. Trading in
the continuous trading mode is held from Mon-
day to Friday 8.00 a.m. to 2.00 p.m. Listing of eve-
ry series of contracts is conducted in line with the
contract listing and delivery calendar. Given the
current regulatory situation, conclusion and set-
tlement of gas exchange contracts is possible ex-
clusively through brokerage houses and commod-
ity brokerage houses that are members of TGE and
members of the Exchange Clearing House man-
aged by the Warsaw Commodity Clearing House
(WCCH). The first brokerage houses that signed
agreements enabling them to trade on the gas
market include Dom Maklerski BOŚ SA, Noble Se-
curities SA and Trigon Dom Maklerski SA. Clearing
and settlement of gas market transactions are held
by the Warsaw Commodity Clearing House. The risk
management system used by WCCH ensures clear-
ing security to every House member in the case of
insolvency of any of the market players. Transaction
settlement through WCCH ensures payment for the
gas sold. Pursuant to an agreement concluded be-
tween TGE and Gaz-System, transactions conclud-
ed on the gas exchange are valid and effective be-
tween parties and are performed by Gaz-System.
14 RWE polska report on energy market in poland in 2012 15
PROPERTY RIGHTS MARKET, SO-CALLED “COLOURS MARKET”
An exception to the rule are white certificates that
are governed by the Energy Efficiency Act. White
certificates confirm the saving of a specific energy
volume as a result of implementation of energy
efficiency increasing investments. White certifi-
cates have property rights attached to them and
are traded at the power exchange.
The statutory system of supporting renewable
energy sources and co-generation (combined heat
and power generation) allows electrical power
generators from the renewable sources and co-
-generation segments to sell their property rights,
and obliges the power companies selling energy
to the end user to acquire those rights. The prop-
erty rights to electricity from renewable sources
and co-generation, i.e. gas, coal and methane
combined with heat are redeemable. An alterna-
tive solution for power companies is to pay a sub-
stitution fee.
The table below indicates percentage shares
of obligations in 2010−2021. Some of them are
defined for shorter periods.
The level of substitution fees combined with the
percentage share of obligations enables to deter-
mine the impact of the obligations on the end user
price.
The table below illustrates unit substitution fees for
specific “colours” in 2010–2012 and demonstrates
their impact on the price, indicating how much
every end user pays for the performance of all the
“colour” obligations by a power trade company.
The following formula was used for calculation:
substitution fee x percentage obligation to buy
“colours”, which are the maximum charge that
can be added to the price of power.
Obligations to buy ”colours” 2010 2011 2012 2013 2014 2015 2016 2017 2018 2019 2020 2021
RES* 10.40% 10.40% 10.40% 12.00% 13.00% 14.00% 15.00% 16.00% 16.00% 16.00% 16.00% 16.00%Co-generated (coal) 21.30% 22.20% 23.20% *23.20%Co-generated (gas) 3.10% 3.30% 3.50% *3.70%
Co-generated (mining methane) 0.40% 0.60% 0.90% 1.10% 1.30% 1.50% 1.80% 2.30%
White certificates x x x
X – year for which the obligation is charged
* draft act of 10 december 2012 amending the act amending the energy law act, the environmental protection law act, the act on the system of assessment of compliance and the act amending the energy law act and amending certain other acts, regulation of the minister of economy of 14 august 2008 (Journal of laws no. 156, item 969); regulation of the minister of economy of 26 July 2011 (Journal of laws no. 176, item 1052), regulation of the minister of economy of 18 october 2012 (Journal of laws no. 211, item 1229); act of 15 april 2011 on energy efficiency (Journal of laws no. 94, item 551, as amended).
Cost of ”colours” for the end user (example based on the substitution payment) Unit. 2010 2011 2012
RES PLN/MWh 27.87 28.59 29.82Co-generated (coal) PLN/MWh 4.97 6.57 6.80Co-generated (gas) PLN/MWh 3.99 4.20 4.51
Co-generated (mining methane)
PLN/MWh 0.00 0.24 0.36
TOTAL PLN/MWh 36.83 39.59 41.49
Source: www.ure.gov.pl, own compilation
The property rights market, commonly referred to as the “colours market”, is regulated by the provisions of the Energy Law Act and related regulations.
The Property Rights Market for all “colours” is
managed at Towarowa Giełda Energii S.A. The
labels below mean property rights for specific
“colours”. For the sake of clarity, we may call
them green, red, yellow and violet certificates.
PMOZE_A, i.e. Property Rights to Certificates
of Origin for electricity generated with renewable
energy sources, the generation period of which
(as indicated in the Certificate of Origin) began
on 1 March 2009 (inclusive) – so-called “green
certificates”.
PMEC, i.e. Property Rights to the Certificates
of Origin for electricity generated in high-effi-
ciency combined heat and power (CHP) units
referred to in Article 9l(1) item 2 of the Energy
Law (coal) – so-called “red certificates”.
PMGM, i.e. Property Rights to the Certificates
of Origin for electricity generated in high-effi-
ciency combined heat and power (CHP) units
referred to in Article 9l(1) item 1 of the Energy
Law (gas) – so-called “yellow certificates”.
Substitution fee
Unit. 2010 2011 2012
RES PLN/MWh 267.95 274.92 286.74
Co-generated (coal) PLN/MWh 23.32 29.58 29.30
Co-generated (gas) PLN/MWh 128.80 127.15 128.80
Co-generated (mining methane)
PLN/MWh 59.16 59.16 60.00
Source: www.ure.gov.pl, own compilation
16 RWE polska report on energy market in poland in 2012 17
Energy source Short name of property rights
Certificate colour
Index name
Renewable energy sources (RES)
PMOZE_A Green OZEX_A
Coal PMEC Red KECX
Gas PMGM Yellow KGMX
Mining Methane PMMET Violet KMETX
Other
White certificates Not yet listed at TGE White Not yet listed at TGE
The Report presents indexes for specific energy sources.
RAW MATERIAL MARKETS AND EMISSION ALLOWANCE MARKETS
All the prices are expressed in Polish zlotys and
converted at EUR and USD exchange rates
applicable on a given date. The European market
is much more liquid than the Polish market and our
market sentiments generally follow the global and
European market trends.
the graphs featured in the report have been made based on the following selected price indexes:
• ICE Brent Crude Futures – weighted average
price of one-year futures contracts for oil (Brent,
Forties, Oseberg or Ekofisk, so-called BFOE) to
be delivered in the following year;
• ICE Rotterdam Coal Futures – weighted average
price of one-year futures contracts for coal to be
delivered in the following year;
• EEX Cal – futures contracts for electricity at the
German EEX, for a base to be delivered
throughout the entire following year;
• ECX EUA Futures Contract Emissions Index
– a daily index of average weighted price of
futures contracts for CO2 emission allowances in
the European Union Emission Trading Scheme.
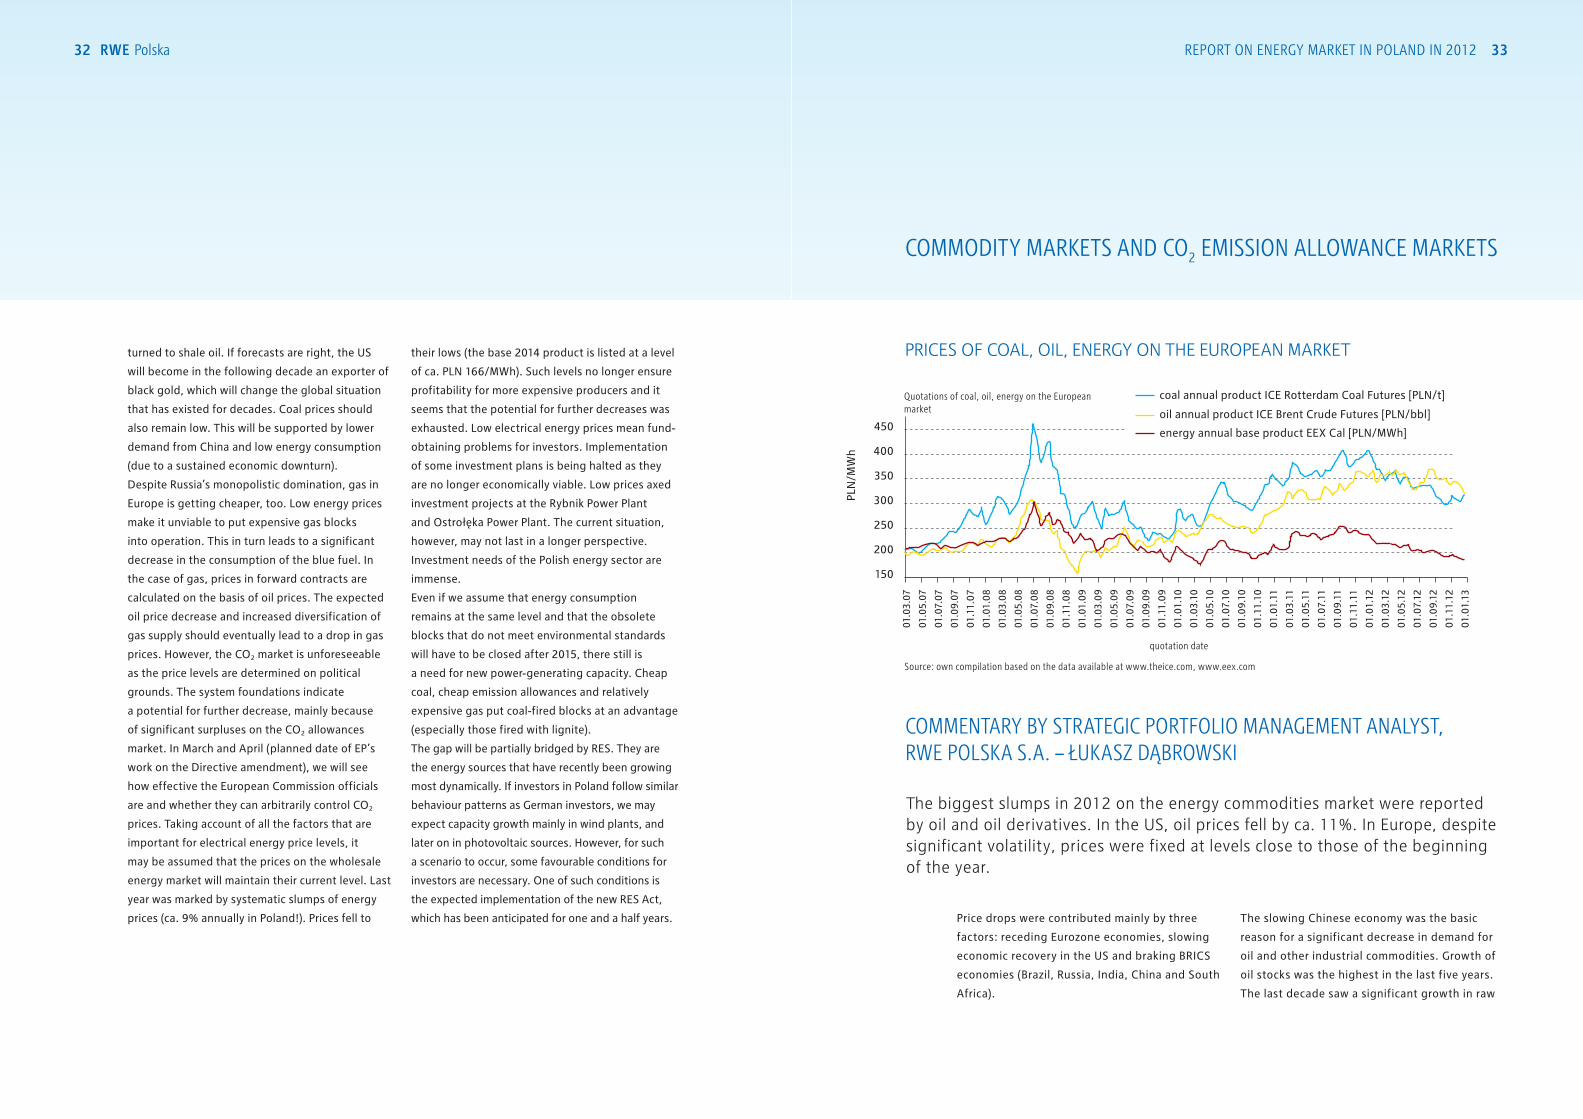
In order to better illustrate the correlation between electricity price and the prices of its carriers, the graphs on page 33 show listings of energy coal, oil and electricity. Given high volatility of prices, the data included in the graph have been presented since 2007.
PMMET, i.e. Property Rights to the Certificates
of Origin for electricity generated in high-efficien-
cy combined heat and power (CHP) units referred
to in Article 9l(1) item 1(a) of the Energy Law (min-
ing methane) – so-called “violet certificates”.
Energy efficiency certificates, so-called
white certificates − certificates confirming the
saving of a specific energy volume as a result of
implementation of energy efficiency increasing
investments. White certificates have property
rights attached to them, are traded at the power
exchange and governed by the Energy Efficiency
Act. White certificates enable to estimate energy
savings and period in which such savings were
achieved. The system is in force in years
2013−2015.
TGE announces indexes for each
type of Property Rights, constituting an average price
weighted with the volume of all transactions in a
given contract, e.g. PMOZE_A, in a trading session.
The table below presents a list of property rights
labels and their respective indexes for specific
sources of energy generation.

energy market in poland
18 RWE polska report on energy market in poland in 2012 19
20 RWE polska report on energy market in poland in 2012 21
ENERGY MARKET IN POLAND – DAY-AHEAD MARKET
COMMENTARY BY STRATEGIC PORTFOLIO MANAGEMENT ANALYST, RWE POLSKA S.A. – SYLWIA PIEKUT
2012 SPOT PRICES VS. TRADE VOLUME
4.0
3.5
3.0
2.5
2.0
1.5
1.0
0.5
0.0
240
220
200
180
160
140
120
100
TW
h
PLN
/MW
h
1.6
179.2
221.1
166.3 165.1
178.5 179.8178.2
185.7 185.6177.0 174.4
163.4
1.8 1.6 1.6 1.6 1.6 1.4 1.4 1.3 1.7 1.6 1.8
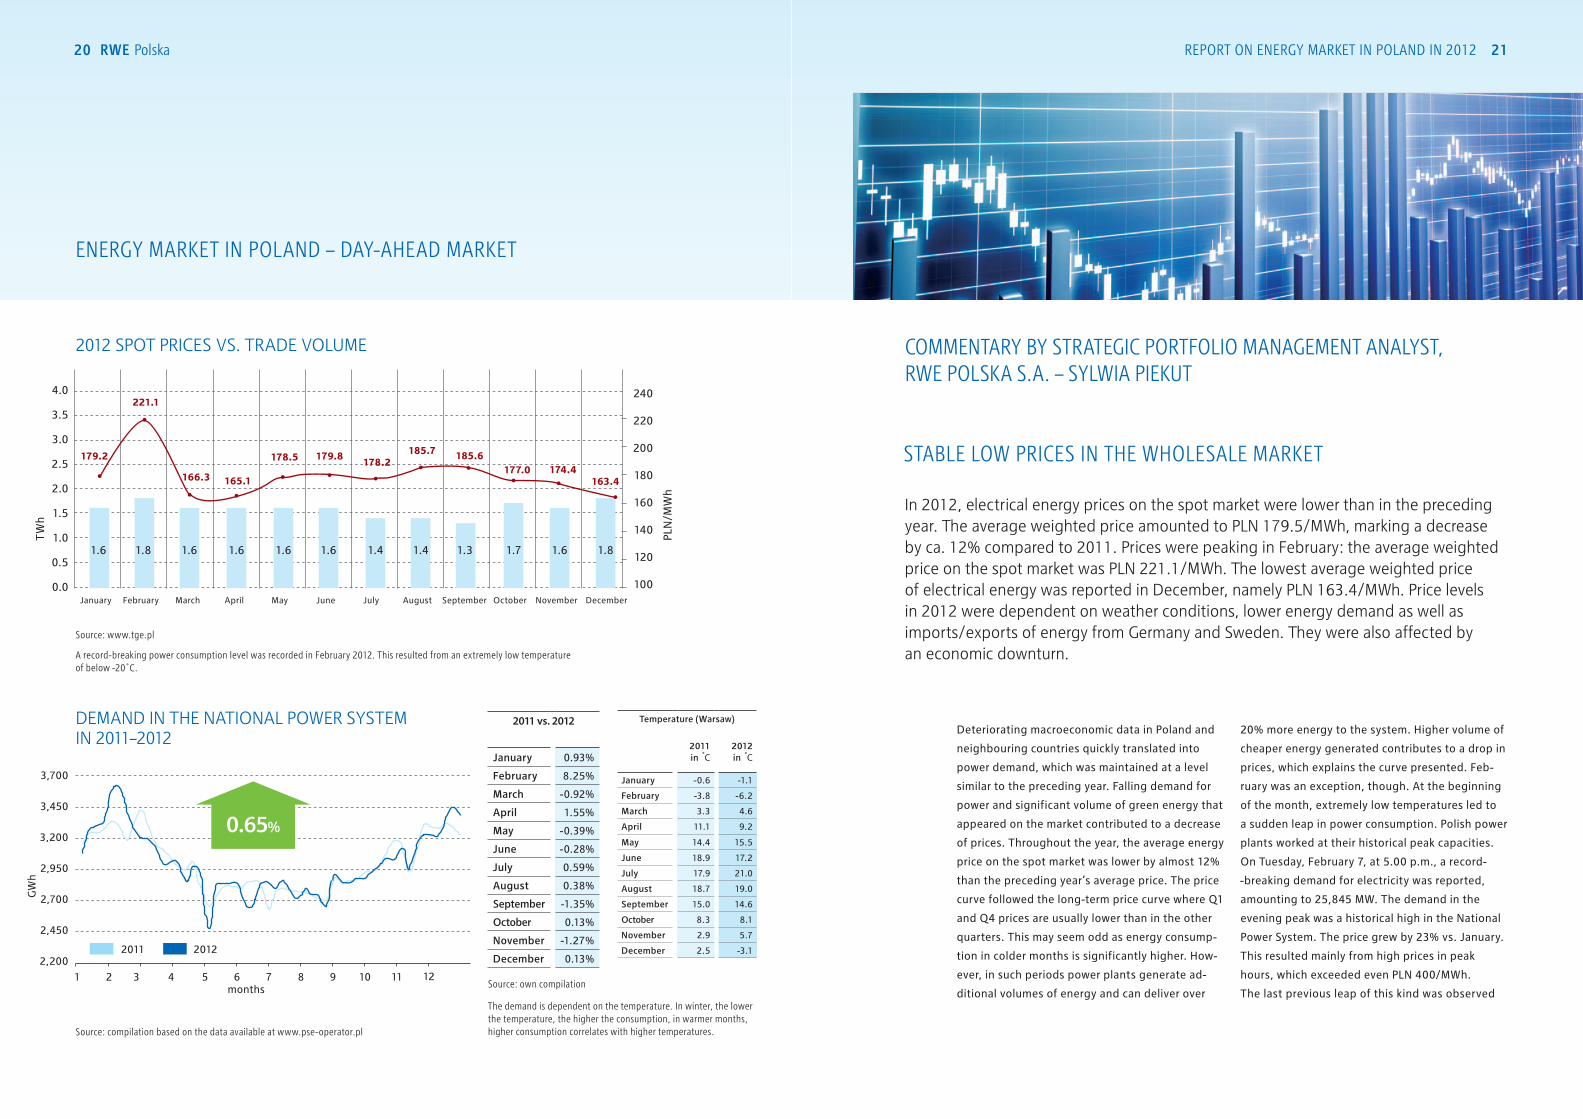
a record-breaking power consumption level was recorded in February 2012. this resulted from an extremely low temperature of below -20˚C.
Source: www.tge.pl
STABLE LOW PRICES IN THE WHOLESALE MARKET
In 2012, electrical energy prices on the spot market were lower than in the preceding year. The average weighted price amounted to PLN 179.5/MWh, marking a decrease by ca. 12% compared to 2011. Prices were peaking in February: the average weighted price on the spot market was PLN 221.1/MWh. The lowest average weighted price of electrical energy was reported in December, namely PLN 163.4/MWh. Price levels in 2012 were dependent on weather conditions, lower energy demand as well as imports/exports of energy from Germany and Sweden. They were also affected by an economic downturn.
Deteriorating macroeconomic data in Poland and
neighbouring countries quickly translated into
power demand, which was maintained at a level
similar to the preceding year. Falling demand for
power and significant volume of green energy that
appeared on the market contributed to a decrease
of prices. Throughout the year, the average energy
price on the spot market was lower by almost 12%
than the preceding year’s average price. The price
curve followed the long-term price curve where Q1
and Q4 prices are usually lower than in the other
quarters. This may seem odd as energy consump-
tion in colder months is significantly higher. How-
ever, in such periods power plants generate ad-
ditional volumes of energy and can deliver over
20% more energy to the system. Higher volume of
cheaper energy generated contributes to a drop in
prices, which explains the curve presented. Feb-
ruary was an exception, though. At the beginning
of the month, extremely low temperatures led to
a sudden leap in power consumption. Polish power
plants worked at their historical peak capacities.
On Tuesday, February 7, at 5.00 p.m., a record-
-breaking demand for electricity was reported,
amounting to 25,845 MW. The demand in the
evening peak was a historical high in the National
Power System. The price grew by 23% vs. January.
This resulted mainly from high prices in peak
hours, which exceeded even PLN 400/MWh.
The last previous leap of this kind was observed
Source: compilation based on the data available at www.pse-operator.pl
2011 vs. 2012
January 0.93%
February 8.25%
March -0.92%
April 1.55%
May -0.39%
June -0.28%
July 0.59%
August 0.38%
September -1.35%
October 0.13%
November -1.27%
December 0.13%
DEMAND IN THE NATIONAL POWER SYSTEM IN 2011–2012
3,700
3,450
3,200
2,950
2,700
2,450
2,200
GW
h
months1 1162 1273 84 95 10
2011 2012
0.65%
Temperature (Warsaw)
2011 in C
2012 in C
January -0.6 -1.1
February -3.8 -6.2
March 3.3 4.6
April 11.1 9.2
May 14.4 15.5
June 18.9 17.2
July 17.9 21.0
August 18.7 19.0
September 15.0 14.6
October 8.3 8.1
November 2.9 5.7
December 2.5 -3.1
the demand is dependent on the temperature. in winter, the lower the temperature, the higher the consumption, in warmer months, higher consumption correlates with higher temperatures.
Source: own compilation
January February March May June July August September October November DecemberApril
22 RWE polska report on energy market in poland in 2012 23
in November 2011. It was related to a failure of
a new block in Bełchatów and a number of blocks
in Połaniec. The trend on the energy market was
reversed by increasing temperature and falling de-
mand for energy. Electricity prices in March were
at the annual low. In Q2 and Q3, gradual decrease
of power supply by power plants and growing de-
mand for energy due to record-breaking high tem-
peratures contributed to a temporary growth in
energy prices. August saw a record in energy prices
on the balancing market. Such a sudden price
increase on the balancing market up to the level
of PLN 1,455/MWh provided an impulse to higher
prices on the Day-Ahead Market at the Polish
Power Exchange. The remaining time of the
year did not bring any significant fluctuations
in energy prices on the daily-hourly market.
Throughout 2012, energy prices remained at
a stable low level. This must have come as a sur-
prise to all market players as 2012 forecasts had
not projected such a strong slump.
TW
h
PLN
/MW
h
6.8 2.1 2.0 5.8 5.4 7.7 6.4 7.8 11.0 12.4 9.7 16.0 15.8
turnover until the end of 2011
January February March May June July August September October November DecemberApril
215.9 213.7 214.0 212.2 211.0 206.2201.6 199.5 195.5
190.2
180.4 174.1 168.9
240
220
200
180
160
140
120
100
ENERGY MARKET IN POLAND – COMMODITY DERIVATIVES MARKET
Y2013 FORWARD PRICES VS. TRADE VOLUME
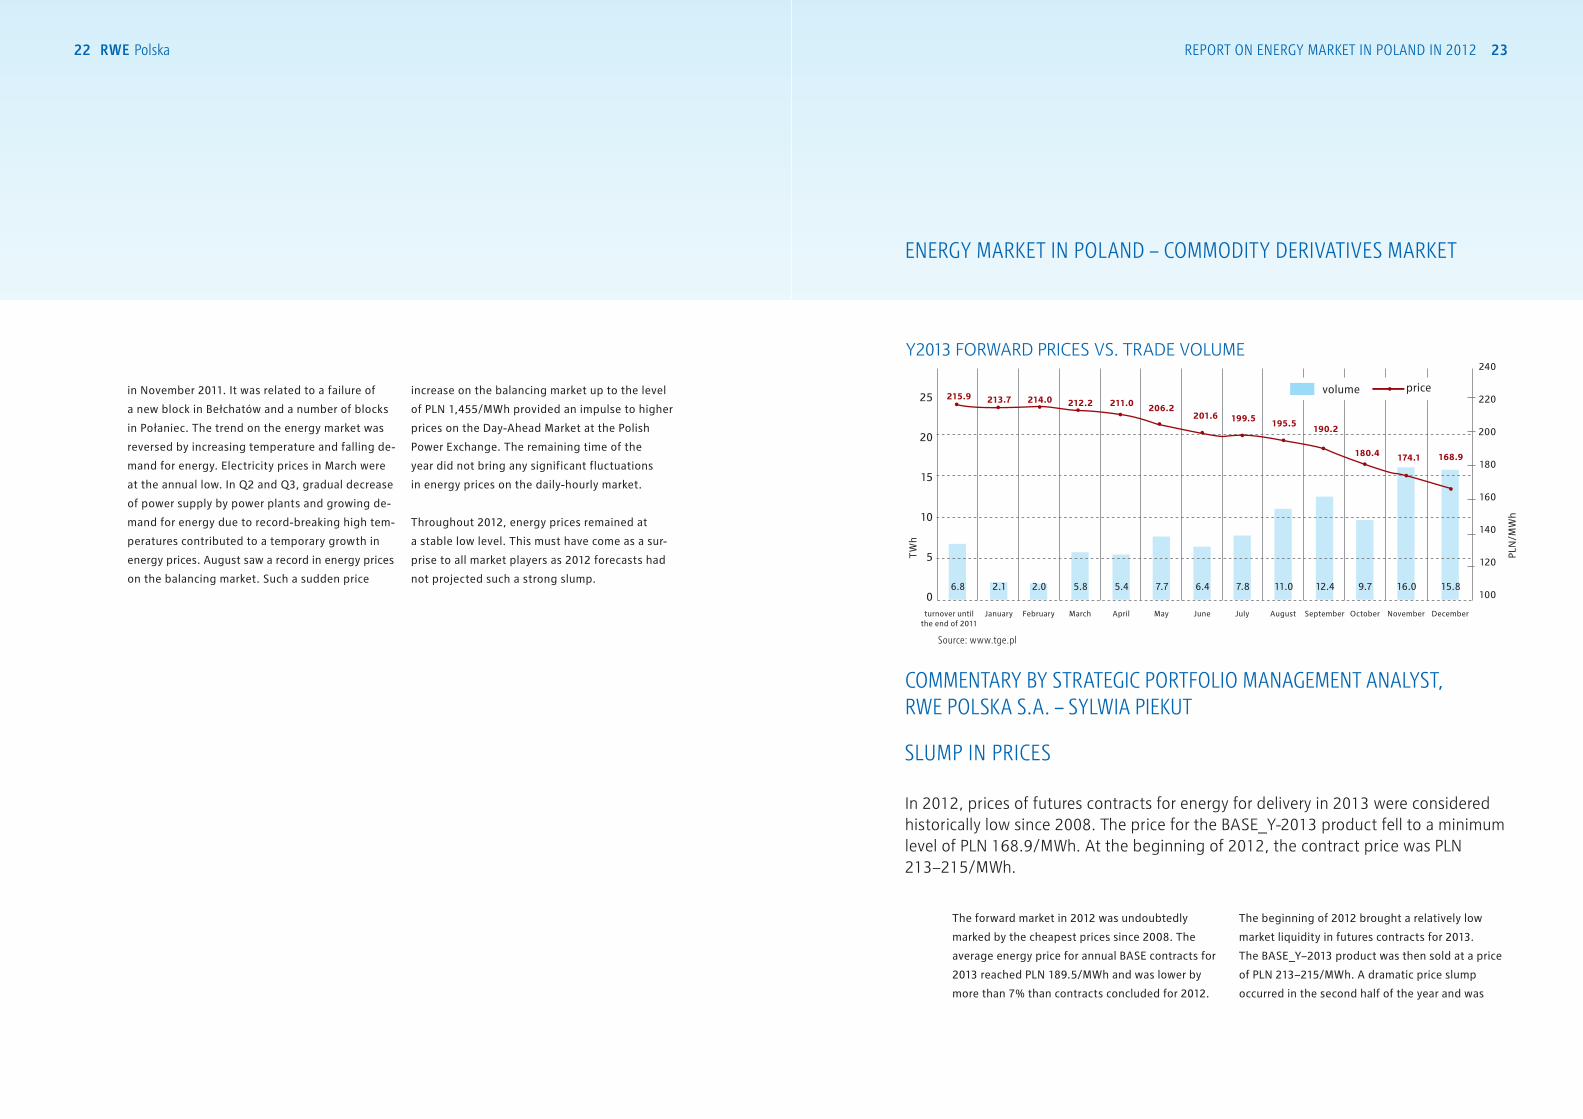
The forward market in 2012 was undoubtedly
marked by the cheapest prices since 2008. The
average energy price for annual BASE contracts for
2013 reached PLN 189.5/MWh and was lower by
more than 7% than contracts concluded for 2012.
The beginning of 2012 brought a relatively low
market liquidity in futures contracts for 2013.
The BASE_Y−2013 product was then sold at a price
of PLN 213−215/MWh. A dramatic price slump
occurred in the second half of the year and was
SLUMP IN PRICES
In 2012, prices of futures contracts for energy for delivery in 2013 were considered historically low since 2008. The price for the BASE_Y-2013 product fell to a minimum level of PLN 168.9/MWh. At the beginning of 2012, the contract price was PLN 213−215/MWh.
COMMENTARY BY STRATEGIC PORTFOLIO MANAGEMENT ANALYST, RWE POLSKA S.A. – SYLWIA PIEKUT
volume price
Source: www.tge.pl
25
20
15
10
5
0
24 RWE polska report on energy market in poland in 2012 25
maintained virtually until the end of December,
which market players had never expected. Deterio-
rating macroeconomic indices, worsening investor
sentiments measured by the PMIO index, lower
than expected energy consumption, mainly in the
industry, introduced much uncertainty on the mar-
kets. In 2011, higher market liquidity in futures
contracts was observed already in March. In 2012,
March was still marked by anticipation. Market
players who followed price developments in neigh-
bouring markets (e.g. price falls on the German EEX
market) probably delayed their contracts for 2013
hoping for further price drops on the forward mar-
ket. When in May and June the price started to fall
by another PLN 5/MWh, the market decided it was
high time to start contracting. The trade volume
was similar to that of 2011. July and August
brought further declines by PLN 2−3/MWh. The
prices in August dropped to the level of PLN
195/MWh. But the biggest surprise was yet to
come. The price started to fall month by month by
further PLN 5 or 10/MWh. In December, the settle-
ment rate for the BASE_Y−2013 contract amounted
to PLN 168.90/MWh. 2012 was also a year of in-
creasing liquidity and transparency of the power
exchange market. The most liquid contract in 2012
was an annual contract for block delivery in 2013.
The trade volume on BASE_Y−2013 contract in
all markets (TGE and trading platforms) reached
108 TWh and was lower by 10% than trade in the
BASE_Y−2012 contract. Between January and July,
the trade volume was lower by 25% than in the
comparable period of the preceding year, however,
between August and December, the volume grew
by 50% compared to the corresponding period of
2011. Given such low prices, market players could
assume that the price was as low as possible and
that it would be better to contract at a two-year
old level than miss a chance. This drove the trans-
action volume. Prices lower than PLN 180/MWh on
the futures market were not seen even in 2009.
In October, when statistical data for 2011 were
published, and where the average cost of energy
generation for professional power plants was at
a level of PLN 174/MWh, the selling price below
such cost was a bargain that couldn’t be missed.
Such prices could force generators of the most
expensive energy, whose generation costs were
much above PLN 175/MWh, to buy cheap energy
on the market instead of generating their own
energy. The situation, however, may not last long.
Such low wholesale market prices may make it
impossible for power plants to offer energy at
or below the production cost (in particular in
the case of the least efficient production plants).
Therefore, pressure may be exerted by less effi-
cient energy producers on increasing such low
price levels.
26 RWE polska report on energy market in poland in 2012 27
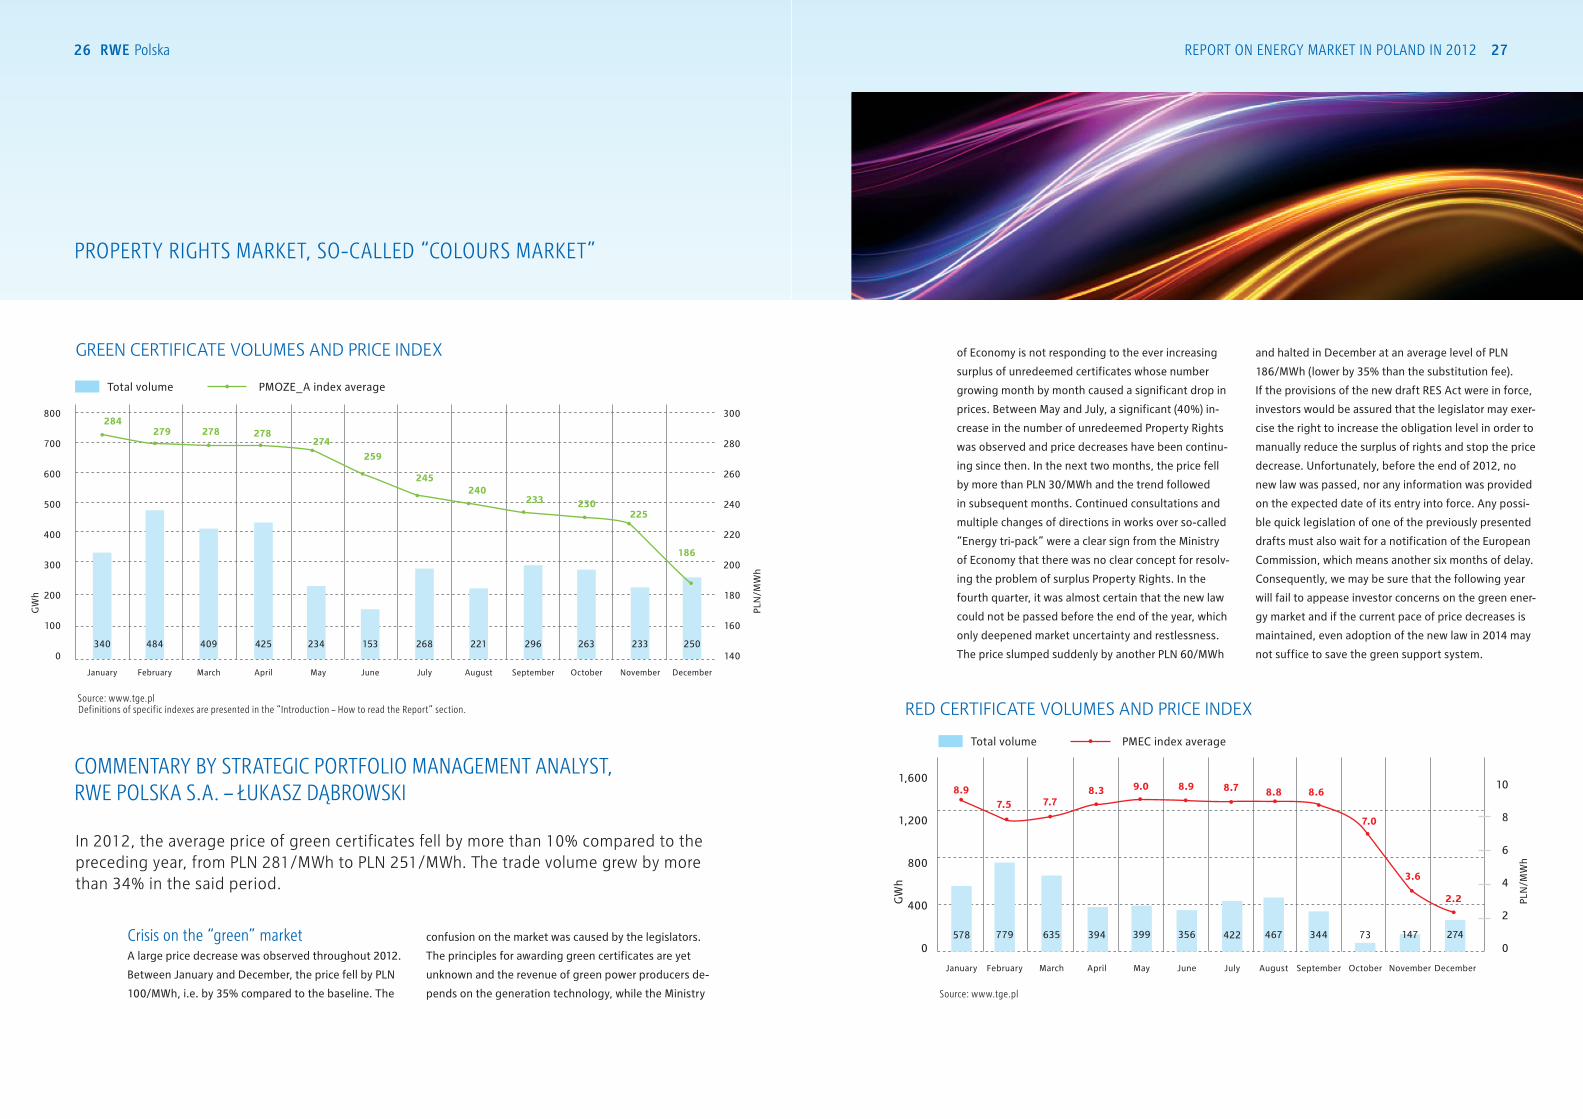
GREEN CERTIFICATE VOLUMES AND PRICE INDEX
Crisis on the “green” marketA large price decrease was observed throughout 2012.
Between January and December, the price fell by PLN
100/MWh, i.e. by 35% compared to the baseline. The
confusion on the market was caused by the legislators.
The principles for awarding green certificates are yet
unknown and the revenue of green power producers de-
pends on the generation technology, while the Ministry
of Economy is not responding to the ever increasing
surplus of unredeemed certificates whose number
growing month by month caused a significant drop in
prices. Between May and July, a significant (40%) in-
crease in the number of unredeemed Property Rights
was observed and price decreases have been continu-
ing since then. In the next two months, the price fell
by more than PLN 30/MWh and the trend followed
in subsequent months. Continued consultations and
multiple changes of directions in works over so-called
“Energy tri-pack” were a clear sign from the Ministry
of Economy that there was no clear concept for resolv-
ing the problem of surplus Property Rights. In the
fourth quarter, it was almost certain that the new law
could not be passed before the end of the year, which
only deepened market uncertainty and restlessness.
The price slumped suddenly by another PLN 60/MWh
and halted in December at an average level of PLN
186/MWh (lower by 35% than the substitution fee).
If the provisions of the new draft RES Act were in force,
investors would be assured that the legislator may exer-
cise the right to increase the obligation level in order to
manually reduce the surplus of rights and stop the price
decrease. Unfortunately, before the end of 2012, no
new law was passed, nor any information was provided
on the expected date of its entry into force. Any possi-
ble quick legislation of one of the previously presented
drafts must also wait for a notification of the European
Commission, which means another six months of delay.
Consequently, we may be sure that the following year
will fail to appease investor concerns on the green ener-
gy market and if the current pace of price decreases is
maintained, even adoption of the new law in 2014 may
not suffice to save the green support system.
PROPERTY RIGHTS MARKET, SO-CALLED “COLOURS MARKET”
COMMENTARY BY STRATEGIC PORTFOLIO MANAGEMENT ANALYST, RWE POLSKA S.A. – ŁUKASZ DĄBROWSKI
In 2012, the average price of green certificates fell by more than 10% compared to the preceding year, from PLN 281/MWh to PLN 251/MWh. The trade volume grew by more than 34% in the said period.
RED CERTIFICATE VOLUMES AND PRICE INDEX
Total volume PMOZE_A index average
10
8
6
4
2
0
PLN
/MW
h
1,600
1,200
800
400
0
G
Wh
January February March May June July August September October November DecemberApril
8.97.5 7.7
8.3 9.0 8.9 8.7 8.8 8.6
7.0
3.6
2.2
578 422394 73779 467399 147635 344356 274
Source: www.tge.pl
Total volume PMEC index averagePL
N/M
Wh
340 268 263234 221 233153 296 250
January February March May June July August September October November DecemberApril
800
700
600
500
400
300
200
100
0
300
280
260
240
220
200
180
160
140
284279 278 278
274259
245240
233 230225
186
425484 409
definitions of specific indexes are presented in the “introduction – How to read the report” section. Source: www.tge.pl
GW
h
28 RWE polska report on energy market in poland in 2012 29
Collapse of the “reds”The average annual price fell by more than 60%:
from PLN 18.8/MWh in 2011 to PLN 7.5/MWh in
2012. The trade volume grew by more than 66% in
the said period.
For most part of the year, the price was maintained
at a stable but low level of PLN 8−9/MWh. However,
October brought a continued fall to the level of PLN
2/MWh, equal to 6% of the substitution fee (!),
meaning that the rights have lost any value for in-
vestors. An increase in turnover between October
and December was only a game of speculators who
still expected that the support system would be
prolonged, bringing exorbitant gains on their junk
securities. What led to the collapse of the cogenera-
tion support system? Certainly, one of the reasons
was the cogeneration obligation expiring at the end
of 2012, but it was also contributed by the lack of
any information on the future of the support sys-
tem. In the case of green certificates (whose obliga-
tion will expire at the end of 2017), we already saw
a number of concepts prepared by the Ministry of
Economy, some initiatives by Polish MPs or opposi-
tion parliamentary clubs that provoke much debate
among market players. As far as red and yellow cer-
tificates are concerned, however, we were not pro-
vided with any information whatsoever, not even
whether the system will be upheld or not. The mar-
ket was full of speculation while the price fell to the
level of 30% of the substitution fee and remained at
this level for most of the year. When it turned out at
the beginning of the fourth quarter that the Minis-
try of Economy did not even have a single concept
for the system, it became clear that the system will
not be prolonged with undisrupted continuity
(amendment of the law requires notification to the
European Commission, and the entire procedure
until the act enters into force lasts up to six months)
as the system was to expire on 31 March 2013 and
not much was being done about it in October last
year. Some investors started to redeem their rights
as the surplus of unredeemed rights fell since the
beginning of the year by 15%, however, the level of
unredeemed rights still remained high, i.e. at a level
of 120% of annual production.
The end of the year was marked by increased activ-
ity of the Ministry of Economy, which – realising it
was unable to introduce any innovations in the co-
generation support system – tried to find a way to
prolong the existing rules until 2015. This, however,
required amendment of the Energy Law and intro-
duction of a new regulation establishing a percent-
age share of the obligation. In order to accelerate
the process, the Ministry of Economy combined
amendment of the act with the regulation and in-
tended – upon approval of the Prime Minister – to
put the bill to vote in the Sejm to extend the validity
of the existing principles. However, as it turned out,
even such activity required notification to the Euro-
pean Commission, which delays the approval proce-
dure by subsequent months. From 1 January 2013,
market entities are no longer obliged to buy red and
yellow certificates. Whether and on what terms the
fees will be charges in 2013 (whether for part or for
the entire period) will depend on the interpretation
of the President of the Energy Regulatory Office
(Urząd Regulacji Energetyki – URE). Therefore, any
forecasts of the nearest future for these Property
Rights must be considered more as guesswork and
speculation than a reliable analysis.
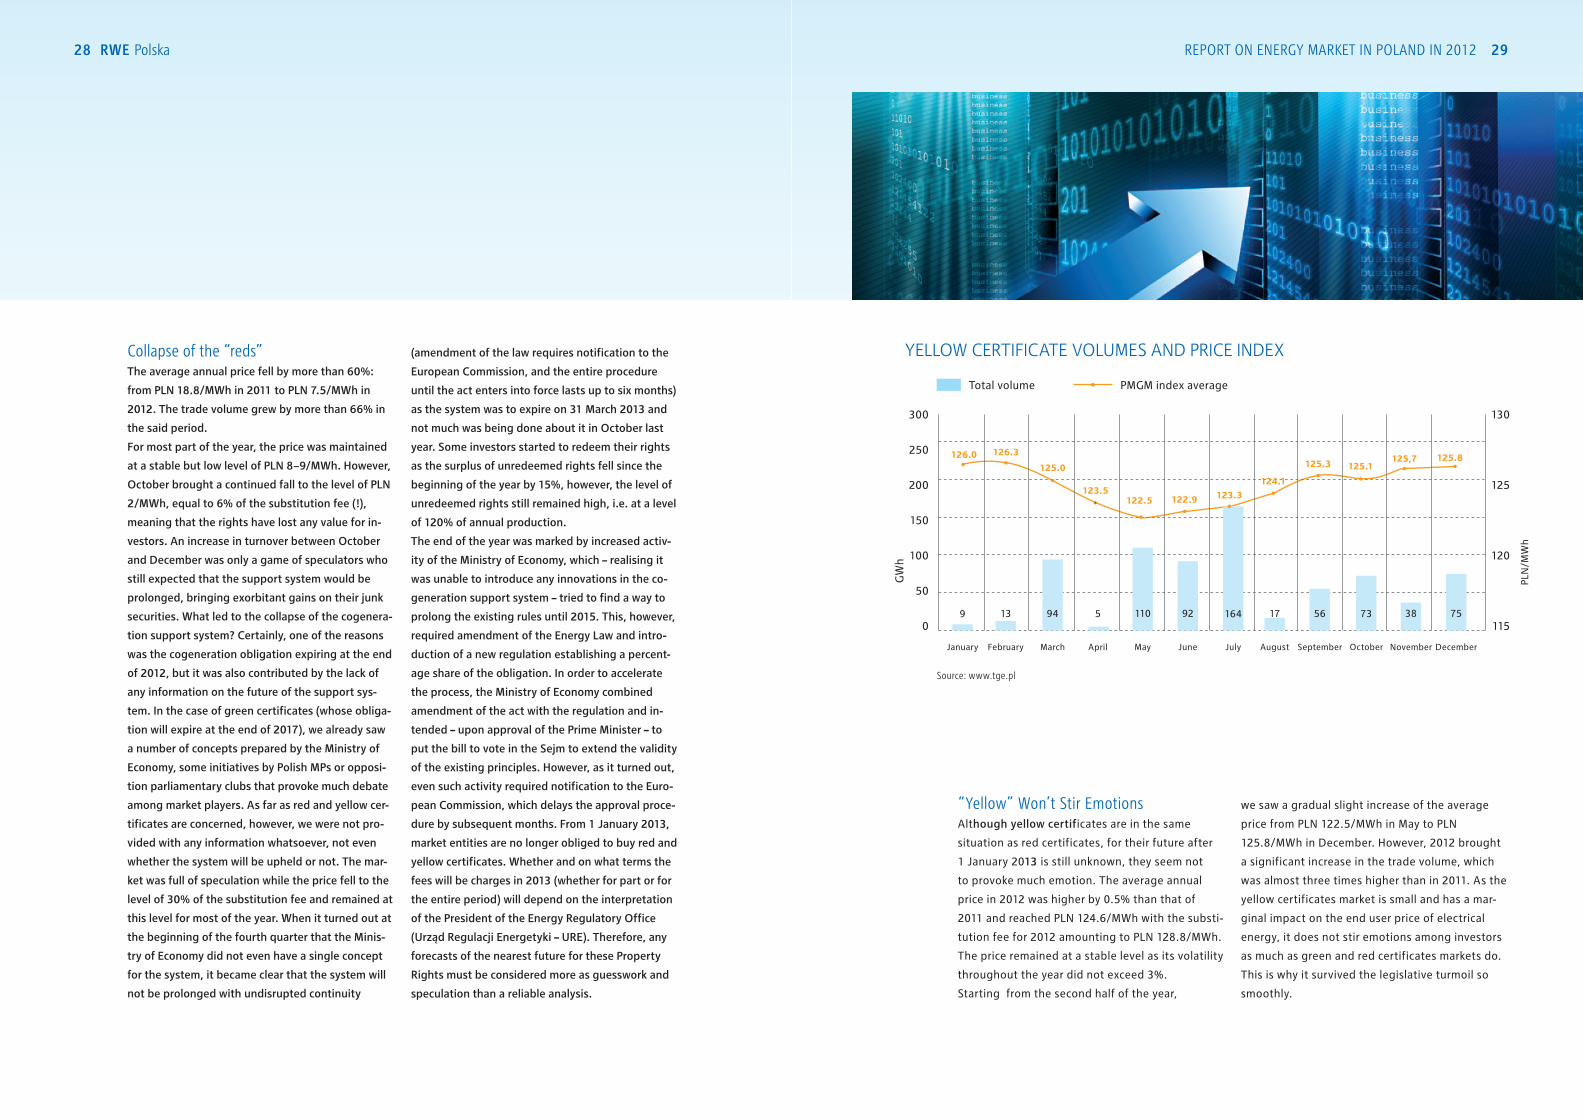
“yellow” Won’t Stir emotionsAlthough yellow certificates are in the same
situation as red certificates, for their future after
1 January 2013 is still unknown, they seem not
to provoke much emotion. The average annual
price in 2012 was higher by 0.5% than that of
2011 and reached PLN 124.6/MWh with the substi-
tution fee for 2012 amounting to PLN 128.8/MWh.
The price remained at a stable level as its volatility
throughout the year did not exceed 3%.
Starting from the second half of the year,
we saw a gradual slight increase of the average
price from PLN 122.5/MWh in May to PLN
125.8/MWh in December. However, 2012 brought
a significant increase in the trade volume, which
was almost three times higher than in 2011. As the
yellow certificates market is small and has a mar-
ginal impact on the end user price of electrical
energy, it does not stir emotions among investors
as much as green and red certificates markets do.
This is why it survived the legislative turmoil so
smoothly.
YELLOW CERTIFICATE VOLUMES AND PRICE INDEX
Total volume PMGM index average
PLN
/MW
h
300
250
200
150
100
50
0
130
125
120
115
GW
h
January February March May June July August September October November DecemberApril
9 1645 7313 17110 3894 5692 75
126.0 126.3
122.9 123.3124.1
125.3 125.1125,7 125.8
122.5123.5
125.0
Source: www.tge.pl
30 RWE polska report on energy market in poland in 2012 31
COMMENTARY BY CHIEF STRATEGIC PORTFOLIO MANAGEMENT ANALYST, RWE POLSKA S.A. – SŁAWOMIR SKOCZEK
The initial attempts at resolving the situation by the
governments of the strongest EU member states
boiled down to injecting more funds into the Southern
European countries in deep economic agony.
However, the method could not be used endlessly and
finally time came to start implementing some serious
austerity measures.
Consequences soon followed. Social turmoil, strikes,
unemployment increase reaching even 25% in Spain
and 26% in Greece were the outcome of the savings
introduced. 2012 was another year of poor economic
performance of EU member states and large global
economies. The situation in the US is stabilising slowly
while its GDP growth at a level of ca. 1.8% in 2012
seems a rather good result given the situation. China’s
GDP at a level of 7.6%, only a dream for EU member
states, seems quite poor for the Middle Kingdom (GDP
for 2011 was 9.2%). We should remember that China
consumes 50% of the global coal production, which
means that the condition of the Chinese economy has
a significant impact on commodity prices on global
markets.
The Polish economy has been following global trends.
There is one exception, however. As Poland is still
a country that makes products of a relatively low
level of technical advancement whose main asset is
cheap workforce, we have been observing a reverse
correlation between China’s GDP and Poland’s GDP.
Therefore, poor condition of the Chinese economy at
risk of a downturn (depleting stimulation potential,
decrease of prices on the real estate market) may
positively impact the growth of Polish GDP. Weaker
China means cheaper commodities and poorer
exports of Chinese products, which offers an
opportunity for Polish exporters.
For markets important for the energy sector, i.e. coal,
gas, CO2, 2012 was marked by dropping prices. Oil
was the only commodity that sustained the falling
trend. However, it was helped by the Iranian crisis
and activity of the Saudi Arabia, which reduced its
production (OPEC policy aimed at maintaining price
levels).
Perspectives for energy sources are not comforting.
Oil, now quite expensive, confronted with growing
supply, high stocks and moderate demand, should
get cheaper. An interesting phenomenon is regular
growth of oil production in the US, which is estimated
at a level of ca. 0.4 million of barrels per day. In the
case of the US, we are witnessing a fuel revolution.
After a spectacular success of shale gas, Americans
Can prices get even lower? Greece, Italy, Spain, euro, crisis: these words dominated the news in 2012. This was another year of Europe’s struggle with the problems of Greece, Spain, Italy and its efforts to maintain the Eurozone.
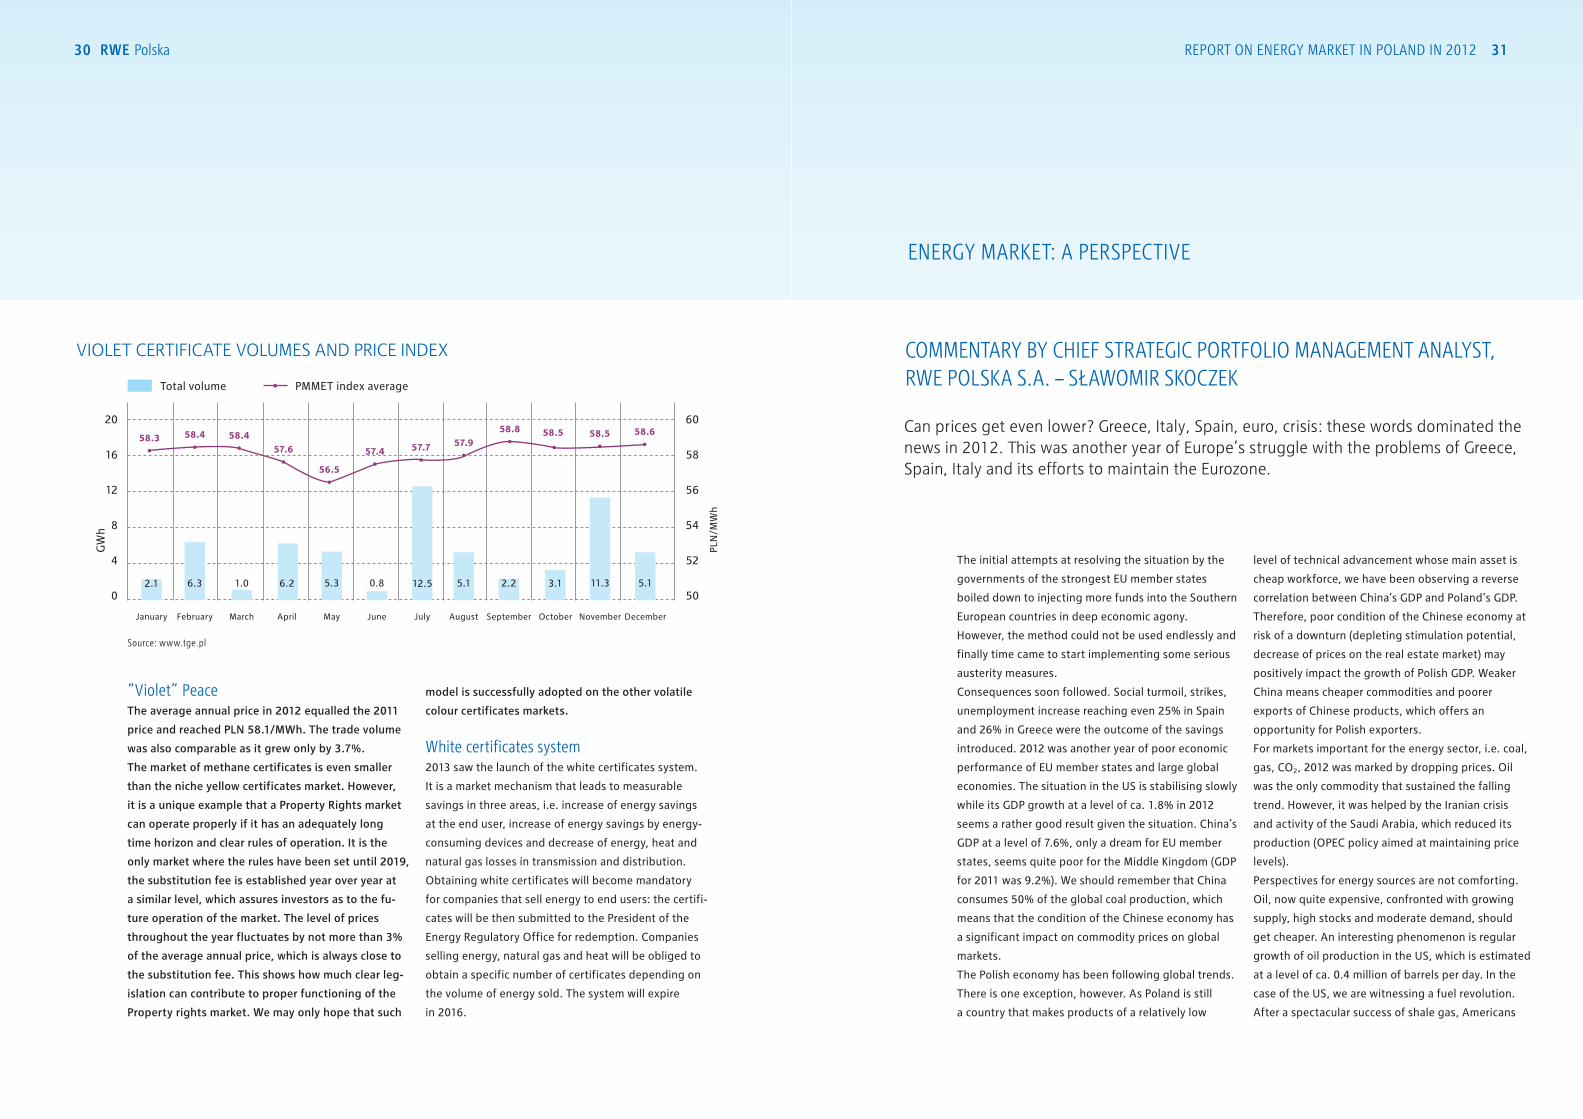
VIOLET CERTIFICATE VOLUMES AND PRICE INDEX
“Violet” peaceThe average annual price in 2012 equalled the 2011
price and reached PLN 58.1/MWh. The trade volume
was also comparable as it grew only by 3.7%.
The market of methane certificates is even smaller
than the niche yellow certificates market. However,
it is a unique example that a Property Rights market
can operate properly if it has an adequately long
time horizon and clear rules of operation. It is the
only market where the rules have been set until 2019,
the substitution fee is established year over year at
a similar level, which assures investors as to the fu-
ture operation of the market. The level of prices
throughout the year fluctuates by not more than 3%
of the average annual price, which is always close to
the substitution fee. This shows how much clear leg-
islation can contribute to proper functioning of the
Property rights market. We may only hope that such
model is successfully adopted on the other volatile
colour certificates markets.
White certificates system2013 saw the launch of the white certificates system.
It is a market mechanism that leads to measurable
savings in three areas, i.e. increase of energy savings
at the end user, increase of energy savings by energy-
consuming devices and decrease of energy, heat and
natural gas losses in transmission and distribution.
Obtaining white certificates will become mandatory
for companies that sell energy to end users: the certifi-
cates will be then submitted to the President of the
Energy Regulatory Office for redemption. Companies
selling energy, natural gas and heat will be obliged to
obtain a specific number of certificates depending on
the volume of energy sold. The system will expire
in 2016.
ENERGY MARKET: A PERSPECTIVE
Total volume PMMET index average
PLN
/MW
h
20
16
12
8
4
0
60
58
56
54
52
50
GW
h
January February March May June July August September October November DecemberApril
2.1 12.56.2 3.16.3 5.15.3 11.31.0 2.20.8 5.1
58.3 58.4 58.457.6
56.5
57.4 57.7 57.958.8 58.5 58.5 58.6
Source: www.tge.pl
32 RWE polska report on energy market in poland in 2012 33
turned to shale oil. If forecasts are right, the US
will become in the following decade an exporter of
black gold, which will change the global situation
that has existed for decades. Coal prices should
also remain low. This will be supported by lower
demand from China and low energy consumption
(due to a sustained economic downturn).
Despite Russia’s monopolistic domination, gas in
Europe is getting cheaper, too. Low energy prices
make it unviable to put expensive gas blocks
into operation. This in turn leads to a significant
decrease in the consumption of the blue fuel. In
the case of gas, prices in forward contracts are
calculated on the basis of oil prices. The expected
oil price decrease and increased diversification of
gas supply should eventually lead to a drop in gas
prices. However, the CO2 market is unforeseeable
as the price levels are determined on political
grounds. The system foundations indicate
a potential for further decrease, mainly because
of significant surpluses on the CO2 allowances
market. In March and April (planned date of EP’s
work on the Directive amendment), we will see
how effective the European Commission officials
are and whether they can arbitrarily control CO2
prices. Taking account of all the factors that are
important for electrical energy price levels, it
may be assumed that the prices on the wholesale
energy market will maintain their current level. Last
year was marked by systematic slumps of energy
prices (ca. 9% annually in Poland!). Prices fell to
their lows (the base 2014 product is listed at a level
of ca. PLN 166/MWh). Such levels no longer ensure
profitability for more expensive producers and it
seems that the potential for further decreases was
exhausted. Low electrical energy prices mean fund-
obtaining problems for investors. Implementation
of some investment plans is being halted as they
are no longer economically viable. Low prices axed
investment projects at the Rybnik Power Plant
and Ostrołęka Power Plant. The current situation,
however, may not last in a longer perspective.
Investment needs of the Polish energy sector are
immense.
Even if we assume that energy consumption
remains at the same level and that the obsolete
blocks that do not meet environmental standards
will have to be closed after 2015, there still is
a need for new power-generating capacity. Cheap
coal, cheap emission allowances and relatively
expensive gas put coal-fired blocks at an advantage
(especially those fired with lignite).
The gap will be partially bridged by RES. They are
the energy sources that have recently been growing
most dynamically. If investors in Poland follow similar
behaviour patterns as German investors, we may
expect capacity growth mainly in wind plants, and
later on in photovoltaic sources. However, for such
a scenario to occur, some favourable conditions for
investors are necessary. One of such conditions is
the expected implementation of the new RES Act,
which has been anticipated for one and a half years.
Commodity marketS and Co2 emiSSion alloWanCe marketS
COMMENTARY BY STRATEGIC PORTFOLIO MANAGEMENT ANALYST, RWE POLSKA S.A. – ŁUKASZ DĄBROWSKI
The biggest slumps in 2012 on the energy commodities market were reported by oil and oil derivatives. In the US, oil prices fell by ca. 11%. In Europe, despite significant volatility, prices were fixed at levels close to those of the beginning of the year.
quotation date
01.0
3.07
01.0
5.07
01.0
7.07
01.0
9.07
01.1
1.07
01.0
1.08
01.0
3.08
01.0
5.08
01.0
7.08
01.0
9.08
01.1
1.0
8
01.0
1.09
01.0
3.09
01.0
5.09
01.0
7.09
01.0
9.09
01.1
1.0
9
01.0
1.10
01.0
3.10
01.0
5.10
01.0
7.10
01.0
9.10
01.1
1.10
01.0
1.11
01.0
3.11
01.0
5.11
01.0
7.11
01.0
9.11
01.1
1.11
01.0
1.12
01.0
3.12
01.0
5.12
01.0
7.12
01.0
9.12
01.1
1.12
01.0
1.13
450
400
350
300
250
200
150
PLN
/MW
h
Quotations of coal, oil, energy on the european market
Source: own compilation based on the data available at www.theice.com, www.eex.com
coal annual product ICE Rotterdam Coal Futures [PLN/t]
oil annual product ICE Brent Crude Futures [PLN/bbl]
energy annual base product EEX Cal [PLN/MWh]
Price drops were contributed mainly by three
factors: receding Eurozone economies, slowing
economic recovery in the US and braking BRICS
economies (Brazil, Russia, India, China and South
Africa).
The slowing Chinese economy was the basic
reason for a significant decrease in demand for
oil and other industrial commodities. Growth of
oil stocks was the highest in the last five years.
The last decade saw a significant growth in raw
PRICES OF COAL, OIL, ENERGY ON THE EUROPEAN MARKET
34 RWE polska report on energy market in poland in 2012 35
quotation day
01.0
1.12
11.0
1.12
21.0
1.12
31.0
1.12
10.0
2.12
20.0
2.12
01.0
3.12
11.0
3.12
21.0
3.12
31.0
3.12
10.0
4.12
20.0
4.12
30.0
4.12
10.0
5.12
20.0
5.12
30.0
5.12
09.0
6.12
19.0
6.12
29.0
6.12
09.0
7.12
19.0
7.12
29.0
7.12
08.0
8.12
18.0
8.12
28.0
8.12
07.0
9.12
17.0
9.12
27.0
9.12
07.1
0.12
17.1
0.12
27.1
0.12
06.1
1.12
16.1
1.12
26.1
1.12
06.1
2.12
16.1
2.12
26.1
2.12
11
10
9
8
7
6
5EU
R/t
December 2013
December 2012
Source: own compilation based on www.theice.com
CO2 IS SUFFOCATING
CO2 EMISSION ALLOWANCE PRICES ON THE EU MARKET(FORWARD CONTRACT DECEMBER 2012 AND 2013)
performance) and the sentiments among investors
are gloomy, with the PMI index at a level of 48
points, lower by more than 1 point vs. last
year, it is hard to assume that such signifi-
cant price decreases can be maintained in the
months to come. Currently, the prices below PLN
170/MWh are at a level of medium costs of energy
generation by power plants in Poland. More
expensive producers could buy cheaper energy on
the market. The situation thus may not last long.
Given the investment requirements of the Polish
energy sector, the price should be fixed at a low
level for some time and then slowly start to grow
to an average level of PLN 190–200/MWh.
material demand, mainly because of the dynamic
growth of Asian economies. This translated
into an increase of prices and then into record-
breaking levels of investment in raw material
exploration and production. In North America,
high profitability of the fuel sector fostered
important advancement in new technologies of
extracting energy raw materials, a consequence
of which was a significant drop in gas prices and
growth of oil production in the last three years.
The Persian Gulf countries could not remain idle
in such a situation. The most recent OPEC report
provides very interesting information with regard
to the current situation. At the end of 2012, for
the first time in several quarters, oil production
fell in Saudi Arabia, which brought a decrease of
production in the entire oil cartel. OPEC’s policy,
which assumes controlling production levels, will
impact further price fluctuations.
If the prices start to fall because of increasing
production of the US and Iraq that is slowly
returning to global markets, the cartel will
certainly respond in order to prevent price
drops. It is much easier to justify coal or energy
quotations where prices are shaped by more free-
market factors. The level of prices is a result of
the supply and demand game where there are
no such strong players on the production side
as OPEC is in the case of oil. The production
policy of Persian Gulf countries and geopolitical
situation in the world are not as important here.
Decreasing coal prices demonstrate how much
the global economic situation has deteriorated,
mainly in China, as its appetite for raw materials
was driving the economic situation in recent
years. Coal quotations for 2013 traded in 2012
fell in comparison to those traded in 2011 for
2012 by more than 16% on average. The trend
continues as the highest prices were reported in
January last year and until December 2012, they
dropped by almost 20%.
Coal prices were generally followed by energy
prices. However, decreasing raw material prices
and deteriorating economic situation, followed
by low energy consumption, are not the only
reasons for falling energy prices on European
markets. A significant growth in the share of
green energy (that is produced in peak daily
demand where the price is the highest) led to
reduction in the output of the least efficient
(an thus most expensive) conventional energy
sources. In Germany, the average listing at the
EEX exchange of the CAL13 product traded
in 2012 fell compared to CAL12 traded in 2011
by as much as 12% (which was significantly
contributed by solar energy panels that
generated cheap energy at peak hours). A similar
trend was observed in Poland where the average
price of CAL13 in relation to CAL12 was lower
by more than 9%. However, the scale of the
crisis becomes clear when we look at the slump
between January (average PLN 213.5/MWh) and
December (average PLN 168.9/MWh), which
reached almost 21%.
Despite the fact that macroeconomic forecasts for
Poland are not optimistic (much worse than 2012
36 RWE polska report on energy market in poland in 2012 37
On 7 September, the prices reached their local top
at a level of EUR 8.38/t, and then started to fall
until the last week of the month. The adjustment
was also contributed by an announcement by
the Dutch Ministry of the Environment of their
objection to the EC’s intent to postpone some
allowances to a later date and a statement
by Russia in which it said that it would not be
implementing reduction targets arising under
the Kyoto Protocol following 2012. Between
the beginning of October and the first days of
November, the prices followed a side trend,
oscillating at a level of EUR 7.7–8.3/t. Slight price
fluctuations were a response to rumours on the
future model of the ETS and the sale of reserve
units from NER300.
After 25 October, i.e. following the meeting of EU
Ministers of the Environment and announcement
of the common EU position for the UN climate
conference in Doha, the prices rose again until
12 November and attained the February level
of above EUR 9/t. However, a sudden change
came. Within just a few days, the prices slumped
to EUR 6.7/t. The reason was announcement
by the EC of its report on the CO2 market, in
which it said that the surplus of allowances on
the market was significant and that it exceeded
previous estimates. In the last week of November,
the prices stabilised for a short time, and then
started to fall to their annual low of EUR 5.72
/t on 4 December. At that moment, the market
was aided by the UN climate conference in Doha.
Moderate optimism surrounding the agreement of
members of the climate summit was reflected in
a price increase. The market was strong enough to
continue the trend until 10 December. Information
on the planned volumes of EEX and ICE auctions
in 2013 were published (almost 820 million of new
allowances) and continuing allowances surplus
on the market brought the prices down again
until the end of the „December 2012” contract
listing on 17 December. If we take a look at the
CO2 allowances market in 2012, we might say the
market would be predictable and dull, but for
political decisions. The EC was effective in scaring
the market until mid-November. Then it turned out
that the market has some serious faults which may
not be remedied in a simple way. EC’s attempts
at transferring some of the allowances to a later
period proved ineffective because of significant
surpluses and the need to introduce legislative
changes beforehand.
What should the emissions trading market expect
for the future? If the EC pushes the legal changes
through, it will certainly temporarily attain its
goal, namely an increase in emission prices.
However, this may not be the target solution
as the mechanisms that are currently in force in
Europe have a negative impact on each other.
On one hand, the EU supports energy efficiency
and RES technologies that lead to emission
reduction but on the other – it is trying to manage
the emissions by maintaining their high prices.
An interesting solution seems to be a system of
referencing the best technologies available (i.e.
benchmarking). Also, solutions promoting “bio”
materials (biomass, biofuel) should be reviewed
again. It turns out that when we take account of
the carbon footprint when they are processed into
energy, the use of some of them is unreasonable.
At the end of January 2012, prices grew
significantly as a result of a strong cold weather
wave and increase in electrical energy prices.
Increases were reported until the end of the first
decade of February. News on another sale of
allowances from the NER300 reserve caused
a market adjustment that lasted until 13 Febru-
ary. From then on, the price of CO2 emission
allowances went up as the European Parliament
Commission announced it would support
withdrawal of some of the allowances from the
market. It was rumoured that even 1.4 billion tons
would be withdrawn. The prices went up to reach
their high on 27 February at a level of EUR 9.51/t.
The beginning of March 2012 was a period of
award of free allowances for installations and their
entry in the market. Combined with decreasing oil
prices, also emission allowance prices dropped.
Polish objection to the EU plan on combating
climatic change only deepened the market
adjustment. At the beginning of April, prices
reached their lows of ca. EUR 6.2/t. The market
saw data from reports concerning emissions
from specific EU instances, which confirmed
a significant decrease of actual emissions as
compared to forecasts. At the beginning of
May, as a result of – among others – announced
negotiation on the energy efficiency directive
and possible EC intervention, the prices bounced
back temporarily to a level of EUR 7.57/t.
June brought a change of trend: the price
went up to reach the long unseen level of EUR
8.36/t at the beginning of July. The price was
influenced by information on planned reduction
of allowances in the following years. The second
half of July brought a significant drop in CO2
emission allowance prices. It was contributed by
information from the EC on possible deadlines
for introducing changes aimed at improving the
situation (i.e. increasing prices) in the emission
allowance trading system. Postponement of
concrete actions translated into decreasing prices,
which reached the level of EUR 6.59/t on 30 July.
Then we could see the impact of politics on the
energy market as the EC proposed to amend the
EU Directive on allowance trading in order to
provide it with a possibility to control the supply in
view of ensuring proper functioning of the market.
EC’s statements caused an increase of prices, which
was observable until the beginning of September.
COMMENTARY BY CHIEF STRATEGIC PORTFOLIO MANAGEMENT ANALYST, RWE POLSKA S.A. – SŁAWOMIR SKOCZEK
When we compare the “December 2012” CO2 emission contract price at the begin-
ning of 2012 and the price on the last day of quotation for this type of contract, we can see that the price remained virtually unchanged at a level of EUR 6.5/t. However, 2012 on the emission allowances market was far from stable, which is visible in the price volatility between EUR 5.7–9.5/t.

politiCS and eConomy VS. energy priCeS
38 RWE polska report on energy market in poland in 2012 39
40 RWE polska report on energy market in poland in 2012 41
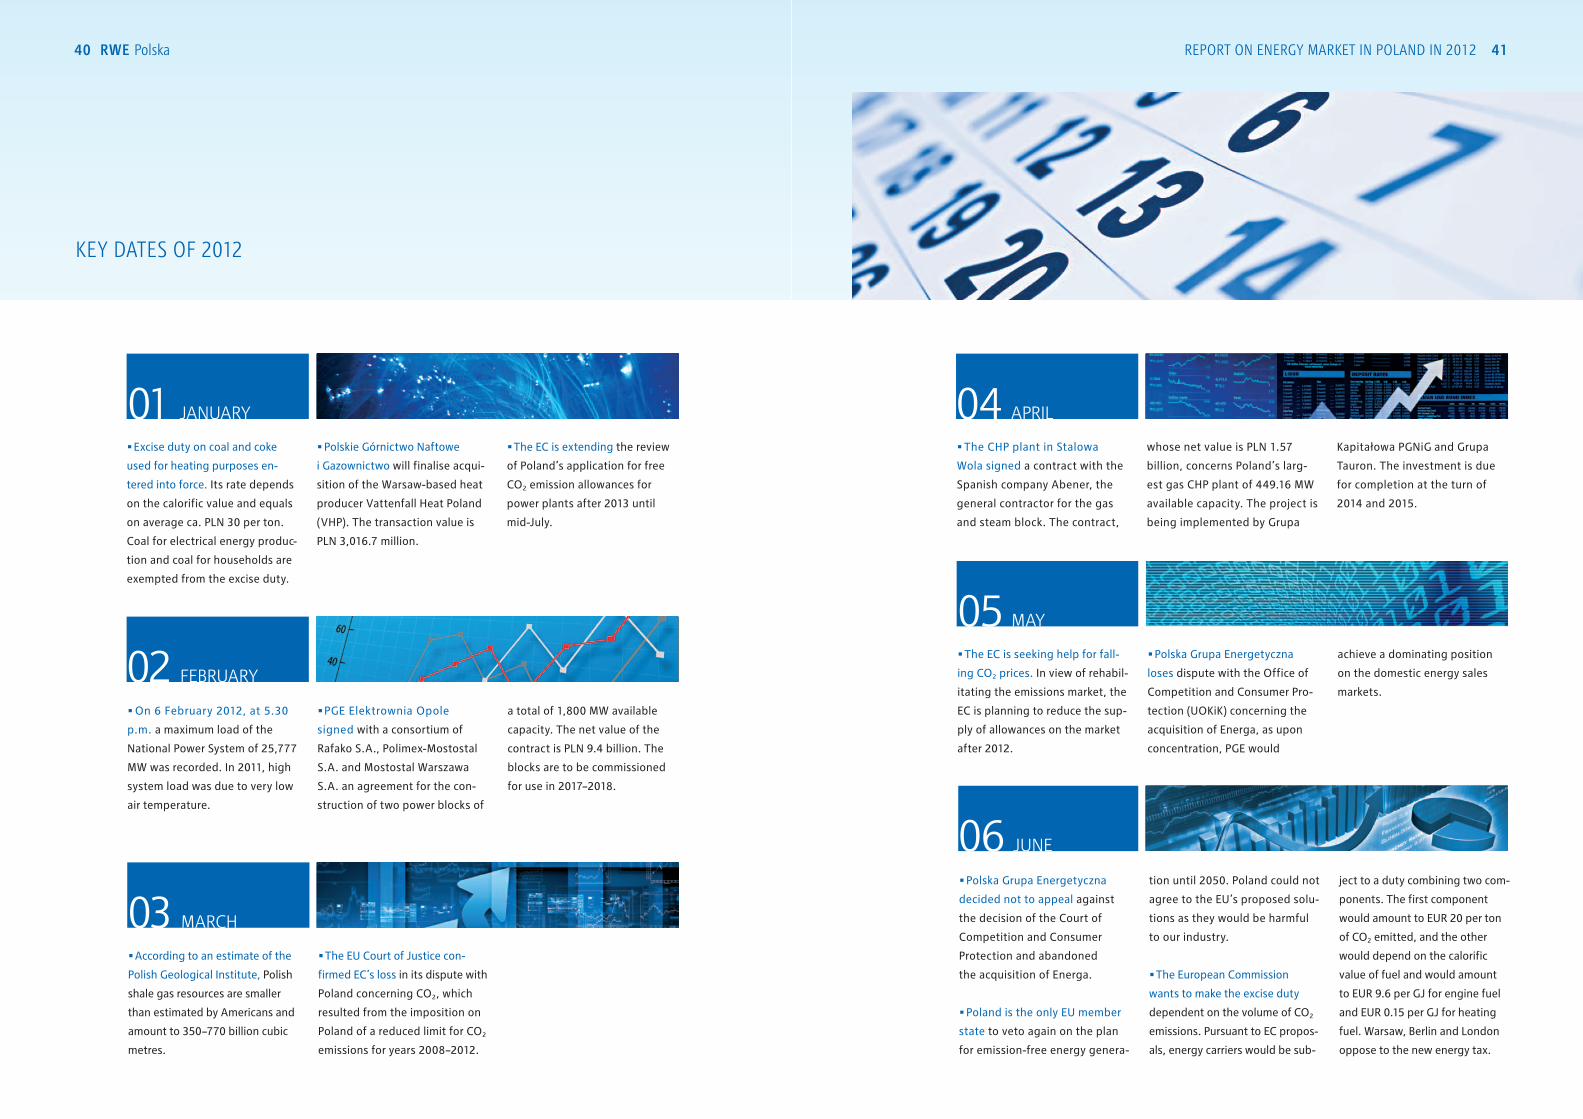
Excise duty on coal and coke
used for heating purposes en-
tered into force. Its rate depends
on the calorific value and equals
on average ca. PLN 30 per ton.
Coal for electrical energy produc-
tion and coal for households are
exempted from the excise duty.
Polskie Górnictwo Naftowe
i Gazownictwo will finalise acqui-
sition of the Warsaw-based heat
producer Vattenfall Heat Poland
(VHP). The transaction value is
PLN 3,016.7 million.
The EC is extending the review
of Poland’s application for free
CO2 emission allowances for
power plants after 2013 until
mid-July.
On 6 February 2012, at 5.30
p.m. a maximum load of the
National Power System of 25,777
MW was recorded. In 2011, high
system load was due to very low
air temperature.
PGE Elektrownia Opole
signed with a consortium of
Rafako S.A., Polimex-Mostostal
S.A. and Mostostal Warszawa
S.A. an agreement for the con-
struction of two power blocks of
a total of 1,800 MW available
capacity. The net value of the
contract is PLN 9.4 billion. The
blocks are to be commissioned
for use in 2017–2018.
According to an estimate of the
Polish Geological Institute, Polish
shale gas resources are smaller
than estimated by Americans and
amount to 350–770 billion cubic
metres.
The EU Court of Justice con-
firmed EC’s loss in its dispute with
Poland concerning CO2, which
resulted from the imposition on
Poland of a reduced limit for CO2
emissions for years 2008–2012.
The CHP plant in Stalowa
Wola signed a contract with the
Spanish company Abener, the
general contractor for the gas
and steam block. The contract,
whose net value is PLN 1.57
billion, concerns Poland’s larg-
est gas CHP plant of 449.16 MW
available capacity. The project is
being implemented by Grupa
Kapitałowa PGNiG and Grupa
Tauron. The investment is due
for completion at the turn of
2014 and 2015.
01 jANUARY
02 FEBRUARY
04 APRIL
03 MARCH
KEY DATES OF 2012
The EC is seeking help for fall-
ing CO2 prices. In view of rehabil-
itating the emissions market, the
EC is planning to reduce the sup-
ply of allowances on the market
after 2012.
Polska Grupa Energetyczna
loses dispute with the Office of
Competition and Consumer Pro-
tection (UOKiK) concerning the
acquisition of Energa, as upon
concentration, PGE would
achieve a dominating position
on the domestic energy sales
markets.
05 MAY
Polska Grupa Energetyczna
decided not to appeal against
the decision of the Court of
Competition and Consumer
Protection and abandoned
the acquisition of Energa.
Poland is the only EU member
state to veto again on the plan
for emission-free energy genera-
tion until 2050. Poland could not
agree to the EU’s proposed solu-
tions as they would be harmful
to our industry.
The European Commission
wants to make the excise duty
dependent on the volume of CO2
emissions. Pursuant to EC propos-
als, energy carriers would be sub-
ject to a duty combining two com-
ponents. The first component
would amount to EUR 20 per ton
of CO2 emitted, and the other
would depend on the calorific
value of fuel and would amount
to EUR 9.6 per GJ for engine fuel
and EUR 0.15 per GJ for heating
fuel. Warsaw, Berlin and London
oppose to the new energy tax.
06 jUNE
42 RWE polska report on energy market in poland in 2012 43
RWE opened a wind farm of
14 WM available capacity in
Krzęcin (Zachodnipomorskie
Voivodeship). The farm made
up of 7 wind turbines will gener-
ate ca. 30,000 MWh of electrical
energy annually, and supply ca.
15,000 households.
The Ministry of Economy pub-
lished its draft act on RES.
The Ministry’s plans assume that
green energy generation will be
supported only for 15 years, ex-
cept for co-combustion, which
will be supported for 5 years.
The new legislation will can-
cel support for old hydropower
plants. In addition, the draft as-
sumes that the rights to obtain
green certificates will be taken
away from producers who sell
their energy above the official
guaranteed price.
07 jULY
RWE Renewables Polska ac-
quired the wind farm in Taciewo.
The farm is made up of 15 wind
turbines of the total installed ca-
pacity of 30 MW. The annual ener-
gy output exceeds 65,000 MWh.
08 AUGUST
09 SEPTEMBER
The common energy market
of the Czech Republic, Hungary
and Slovakia based on the
market coupling mechanism
was launched.
KEY DATES OF 2012
44 RWE polska report on energy market in poland in 2012 45
KEY DATES OF 2012
An agreement was reached
at the US Climate Conference in
Doha concerning the extensions
of the Kyoto Protocol until 2020,
i.e. until a new agreement enters
into force. The agreement must be
concluded until the end of 2015.
The Energy Regulatory Office
approved reduced gas tariff for
PGNiG. The new tariff entered
into force on 1 January 2013. Gas
prices will be reduced by 2–4%
for the industry and ca. 10% for
individual users.
On 12 December, the Polish
Energy Exchange (TGE) launched
a gas trading platform – it is
a historical event for the Polish
energy industry.
12 DECEMBER
The Ministry of Economy devel-
oped a draft implementing act
containing proposals regarding
the so-called Energy Tri-Pack.
ZE PAK is first listed on the War-
saw Stock Exchange. The ZE PAK
stock price for individual and
institutional investors was set
at PLN 26.2.
There is a new version of the
Gas Law. The Ministry of Econo-
my’s proposal for the exchange
obligation assumes selling 70%
of the gas from PGNiG through
the exchange.
The Ministry of Economy com-
pleted work on the draft act on
renewable energy sources.
Another version of the draft
Energy Law was published.
On 19 October, a parliamentary
bill amending the Energy Law,
so-called “small tri-pack”, was
put forward.
10 OCTOBER
PGNiG signed an agreement
with Gazprom concerning
a change in gas prices. The
agreement assumes a decrease
of the gas price by more than ten
per cent.
The European Union and Aus-
tralia undertook efforts aimed at
establishing world’s largest emis-
sion trading system. With an
intercontinental platform for
exchanging emission allowances,
entrepreneurs will be able to use
Australian and European units on
equal terms in both systems.
The European Commission pro-
posed to delay the auction of
900 million CO2 emission allow-
ances. The EC is thus aiming to
remedy the surplus and the re-
sulting low price of allowances in
the European Emissions Trading
Scheme (ETS). The EC announced
further action, including removal
of some allowances from the
market.
The Ministry of Economy pre-
sented a new version of the reg-
ulation governing the minimum
required share of energy from
renewable sources. The obliga-
tion will be higher and amount
to 12% in 2013. The Ministry of
Economy decided to extend the
support horizon until 2021.
11 NOVEMBER
rWe polSka prodUCt range BaSed on market meCHaniSmS
46 RWE polska report on energy market in poland in 2012 47

48 RWE polska report on energy market in poland in 2012 49
RWE POLSKA PRODUCT RANGE
target priceThe client enters into an agreement where they define satis-
factory electrical energy price levels and indicate the volume
they want to buy. RWE Polska undertakes to purchase energy
at the price that is satisfactory for the client and that will be
guaranteed throughout the agreement term. If the market
situation does not allow to purchase energy within the set
timeframe and at the agreed price, then the agreement be-
tween RWE Polska and the client will be terminated without
consequences for any of the parties.
Spot energy purchasePurchase at the Day-Ahead Market prices. The sales agree-
ment and base energy purchase are signed for a specific
agreement term, e.g. a year. The client may decide to pur-
chase energy on the spot market at any time, according to
their need and at the most favourable moment. The price
per MWh on the invoice received is the average from trans-
actions performed.
for companies consuming more than 50 GWh annually
that forecast their daily-hourly energy consumption
purchasing in batchesIn this model, energy purchases are spread out over
several batches, so as to take opportunity of favourable
market conditions. This allows clients to diversify ener-
gy purchasing costs and minimise the risk of price vola-
tility on the wholesale market.
for companies consuming more than 10 GWh annually
Full supplyFull supply protects clients against price fluctuations on the
wholesale market, allowing long-term corporate budget plan-
ning. The product enables to control the expenses and en-
sures stability of next year’s energy supply, at the same time
protecting the client against possible price increases.
for companies consuming more than 1 GWh annually
rWe polska provides every client with a dedicated account manager who will provide professional advice when using any of the above products.
ContaCt US:
RWE Polska S.A.
T (22) 821 39 39
www.rwe.pl
Download a free iPhone or iPad application now
and check the current products of RWE Polska!

50 RWE polska
DISCLAIMER
RWE Polska S.A. informs and reserves that the
data provided in this report may not be con-
strued to constitute a binding offer for the supply
of electricity or any other services. The data are
provided for information purposes only.
This report expresses the knowledge and views
of its authors as at the date of its preparation.
The report was made with due diligence and with
respect to the principles of methodological accu-
racy based on generally available information
deemed reliable by RWE Polska S.A. RWE Polska,
however, grants no warranty regarding their com-
pleteness and accuracy.
When using the Report, you should still perform
an independent assessment and take account of
other factors than included herein, which impact
the prices of electricity, CO2 emission allowances,
property rights, raw materials and derivative
instruments.
The prices of electricity, CO2 emission allowanc-
es, property rights, raw materials and derivative
instruments entail a number of risk factors related
to, among others, the domestic and international
macroeconomic situation, specific legislation in
force and its possible amendment as well as
trends occurring in other commodity and finan-
cial market segments (including currency
markets, interest rates).
RWE Polska S.A. shall not be held liable for
any decisions made on the basis of the Report
or any losses incurred as a result of such deci-
sions to buy and investment decisions. The entire
risk of using the information provided shall be
borne by the user of the “Report on energy
market in Poland”.
All rights to the entire content of the “Report on
energy market in Poland” reserved. The website
user may download and print pages of the docu-
ment in full or in part provided that they do not
violate copyrights or the right to register trade-
marks of RWE Polska S.A. No part of this Report
may be used for commercial purposes by copying,
in full or in part, electronic transmission, or modi-
fied, linked in any other way or used without
prior written consent of RWE Polska S.A. Photos: Shutterstock, RWE. Typesetting, graphic layout, print: Mediapolis Sp. z o.o., www.mediapolis.com.pl
Information provided in this “Report on energy market in Poland” prepared by RWE Polska S.A. is not a recommendation in the meaning of the Regulation of the Minister of Finance of 19 October 2005 regarding information that constitutes recommenda-tions on financial instruments, their issuers or drawers.
50 RWE polska