Embed Size (px)
Citation preview
RRREEEPPPOOORRRTTT
OOONNN
AAARRREEEAAA,,, PPPRRROOODDDUUUCCCTTTIIIOOONNN,,, PPPRRROOODDDUUUCCCTTTIIIVVVIIITTTYYY
AAANNNDDD
PPPRRRIIICCCEEESSS OOOFFF AAAGGGRRRIIICCCUUULLLTTTUUURRREEE CCCRRROOOPPPSSS
IIINNN
KKKAAARRRNNNAAATTTAAAKKKAAA
222000000888---000999
DDRREECCTTOORRAATTEE OOFF EECCOONNOOMMIICCSS AANNDD SSTTAATTIISSTTIICCSS
BBAANNGGAALLOORREE

P R E F A C E
Agricultural statistics, particularly those relating to area, production and productivity
have a very important role to play in the overall statistical system of the State. One of the key
statistical publications being brought out by the Directorate of Economics and Statistics is
“Area, Production, Productivity and Prices of Agricultural Crops in Karnataka” for 2008-09.
This report, with Annual Season and Crop Statistics Report as the base for which the
Record of Rights, Tenancy and Crop Inspection (Pahani) written by the Village Accountant is
the principal source, depicts districtwise land use and further, seasonwise, cropping pattern,
agricultural conditions and sourcewise and cropwise area irrigated. This report contains data
on production and productivity of agriculture crops. Additionally it contains data on prices of
agricultural produce.
I have no doubt that, this will be a valuable data base to Planners, Administrators,
Researchers and Academicians, particularly to those focusing on agriculture and allied areas.
The Publication is prepared in the Agricultural Statistics Division of the Directorate of
Economics and Statistics.
Constructive suggestions for enhancing quality of the report are most welcome.
Place :Bangalore (H.E.RAJASHEKARAPPA)
Date: 17.11.2011 Director

C O N T E N T S
Sl.No. Particulars Page No.
1. Introduction 1
2. Seasonal Conditions 1
3. Land Utilisation 2
4. Sources of Irrigation 4
5. Details of Sourcewise Area Irrigated 5
6. Details of Cropwise Area Irrigated 7
7. Cropping Pattern 9
8. Area, Production and Productivity of Crops 11
9. Index Numbers of Area, Production and Productivity of Crops 17
10. Price Trend 18
11. Farm Harvest Prices 20
12. Index Numbers of Farm Harvest Prices 21
13. Index Numbers of Consumer Prices for Agriculture Labourers 21
14. Agriculture Wages 22
15. Livestock Census 22
16. ANNEXURES : 1 TO 10 23
AREA, PRODUCTION, PRODUCTIVITY AND PRICES OF AGRICULTURE CROPS IN KARNATAKA, 2008-09
1. Introduction: Agriculture is still one of the priority sectors of the State’s economy, particularly rural
economy, not withstanding its diminishing share in the State domestic product. Several
policies and programmes are being planned and implemented by government from time to
time to improve productivity. Besides improved techniques for the development of
agriculture and higher agriculture production, timely and sufficient rainfall and weather
conditions are also crucial factors. During the year under report, the total cropped area has
decreased by about 5.2 lakh hectares due to untimely rainfall.
2. Seasonal Conditions:
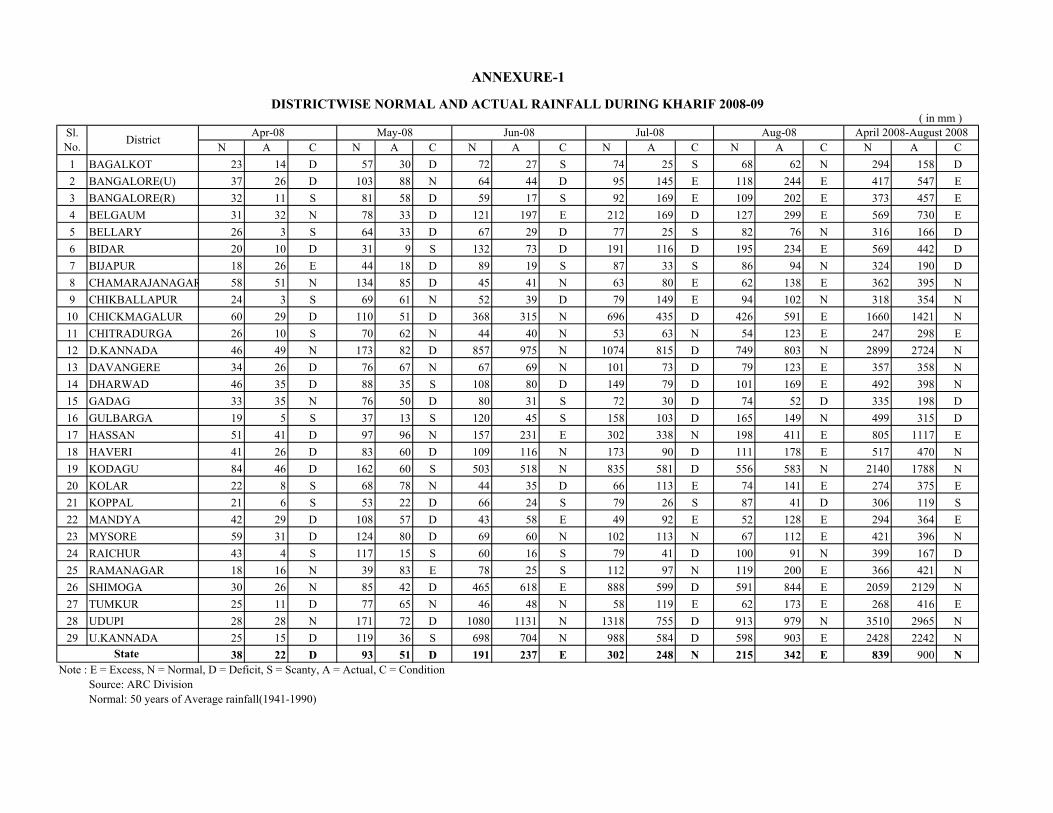
2.1 During the agriculture year 2008-09, the actual rainfall in the State was 1232 mm as against the normal of 1198 mm, an increase of 2.8%. Rainfall was excess in Bijapur and Hassan, normal in Bangalore(urban), Bangalore(rural), Belgaum,Bidar, Chamarajanagar, Chikkaballapur, Chickmagalur, Chitradurga, Dakshina Kannada, Davangere, Haveri, Kodagu, Kolar, Mandya, Mysore, Ramanagar, Shimoga, Tumkur, Udupi and Uttara Kannada districts and deficit in Bagalkot, Bellary, Dharwad, Gadag, Gulbarga, Koppal and Raichur.
During the year 2008-09 there was excess rainfall during Summer and normal in Kharif and Rabi seasons.
The seasonwise actual and normal rainfall are given in Table – 1 and districtwise and seasonwise details in Annexure – 1.
Table - 1 Seasonwise rainfall condition in the State, 2008-09
Rain fall(in mm) Season
Normal Actual
Departure from normal
rainfall(%) Rainfall pattern
Kharif 839 900 7.3 Normal
Rabi 346 308 -11.0 Normal
Summer 13 24 84.6 Excess
State 1198 1232 2 .8 Normal
Source : Rainfall section, DES

2
3. Land Utilisation:
3.1 The total geographical area of the State is classified into; (1) forest (2) land put to
non-agricultural use (3) barren and uncultivable land (4) permanent pastures and other grazing
land (5) cultivable waste (6) miscellaneous trees and groves etc., not included in net area
sown (7) current fallows (8) other fallow land and (9) net area sown. Details of land use
during 2008-09 compared with 2007-08 are in Table - 2.
Table - 2
Classification of geographical area according to land use during 2008-09 and 2007-08
Area(in hectares) % to total geographical
area Sl.
No. Category
2008-09 2007-08 2008-09 2007-08
1. Forest 3071833 3071833 16.1 16.1
2. Land put to non-
agricultural use 1375047 1369281 7.3 7.2
3. Barren &
uncultivable land 787628 787776 4.1 4.1
4. Cultivable waste 412913 415051 2.2 2.2
5. Permanent pastures & other graz. land
923383 929642 4.8 4.9
6. Land under miscellaneous tree, groves etc.,
289715 289966 1.5 1.5
7. Current fallow(*) 1481706 1262420 7.8 6.6
8. Other fallow land(*) 512523 505075 2.7 2.7
9. Net area sown (*) 10195088 10418792 53.5 54.7
Total Geographical Area 19049836 19049836 100.0 100.0
*:Figures vary with that of DAG and KAG of 2008-09 as corrections are effected in these
categories consequent upon the observations made by the Principle Secretary, Planning,
Programme monitoring and Statistics Department, GOK, Bangalore

3
3.2 The net area sown in the State decreased by 223704 hectares during 2008-09 over 2007-
08. Net area under cultivation during 2008-09 was 53.5% as against 54.7% during 2007-08.
The percentage of area covered under different uses of land to the total geographical area
remains the same in the categories of Forest, Barren and uncultivable land, Cultivable waste,
Land under miscellaneous tree crops groves etc., not included under net area sown and Other
fallow land, but varies in respect of, Land put to non agriculture use, Permanent pastures and
other grazing land, Current fallow and Net area sown, during the year under review.
Districtwise land use area for the year 2008-09 is given in Annexure – 2. The Pie chart of the
same is given in Annexure –2.1.
3.3 Categorywise Land Use Area:
(a) Forest: Out of the total geographical area,30,71,833 hectares i.e., 16.1%, is covered
by forests. During the year 2008-09, the forest area remains same compared to 2007-2008.
The largest forest area was in Uttara Kannada district (26.5%) followed by Shimoga and
Chamarajnagar (9.0% each) and the lowest was in Bijapur (0.06%).
(b) Land put to non-agricultural use: Area covered under this category of land was
13,75,047 hectares in 2008-09 accounting for 7.3% of the total geographical area. Among the
districts, the percentage of area covered under this category was highest in Bangalore(U)
(8.4%) followed by Shimoga (6.4%) and then by Tumkur (6.1%) and the lowest area was in
Gadag (0.8%).
(c) Barren and uncultivable land: Total area covered under this category of land was
7,87,628 hectares during 2008-09, which constitutes 4.1% of the total geographical area in the
State. The largest area under this category was in Tumkur(8.6%) followed by Gulbarga
(8.0%) and Dakshina kannada (7.5%) and lowest in Dharwad (0.5%).
(d) Cultivable waste: During 2008-09, the total area under this category of land was
4,12,913 hectares, which accounts for 2.2% of the total geographical area in the State.
Tumkur district had the highest area (15.2%) followed by Mandya (10.2%) and lowest in
Gadag (0.2%)
(e) Permanent pastures and other grazing land: In the State, total area under this
category of land was 9,23,383 hectares or 4.8% of the total geographical area during
2008-09. The largest area was in Shimoga (17.7%) followed by Chickmagalur (9.8%) and
Chitradurga (9.6%) and Lowest in Gadag (0.3%).

4
(f) Land covered under miscellaneous trees, crops, groves etc., not included in net
area sown: During the year 2008-09, the total area under this category of land was 2,89,715
hectares which works out to 1.5% of the total geographical area in the State. The largest area
was in Udupi(16.4%) followed by Dakshina kannada(11.0%) and Shimoga(9.3%) and lowest
in Dharwad (0.06%).
(g) Current fallows: Total area covered under the category “current fallows” increased
to 14,81,706 hectares during 2008-09 from 12,62,420 hectares during 2007-08. Percentage of
area under current fallows during 2008-09 was 7.8%. The largest area was in Bijapur(14.6%)
followed by Belgaum (13.0%) and Raichur (10.2%) and lowest in Udupi(0.1%).
(h) Other fallow land: In the State, total area under the category “other fallow land”
was 5,12,523 hectares during 2008-09, which works out to 2.7% of the total geographical area
as against 5,05,075 hectares during 2007-08. The largest area was in Mandya (13.3%)
followed by Bidar (8.0%) and lowest in Gadag (0.7%)
(i) Net area sown: The net area sown in the State was 1,01,95,088 hectares during
2008-09 which accounts for 53.5% of the total geographical area. It was 1,04,18,792
hectares(54.7%) during 2007-08. The largest net area sown was in Gulbarga district (11.7%)
followed by Belgaum (7.8%) and Bijapur (7.3%) and lowest in Bangalore(U) (0.5%).
4. Sources of Irrigation:
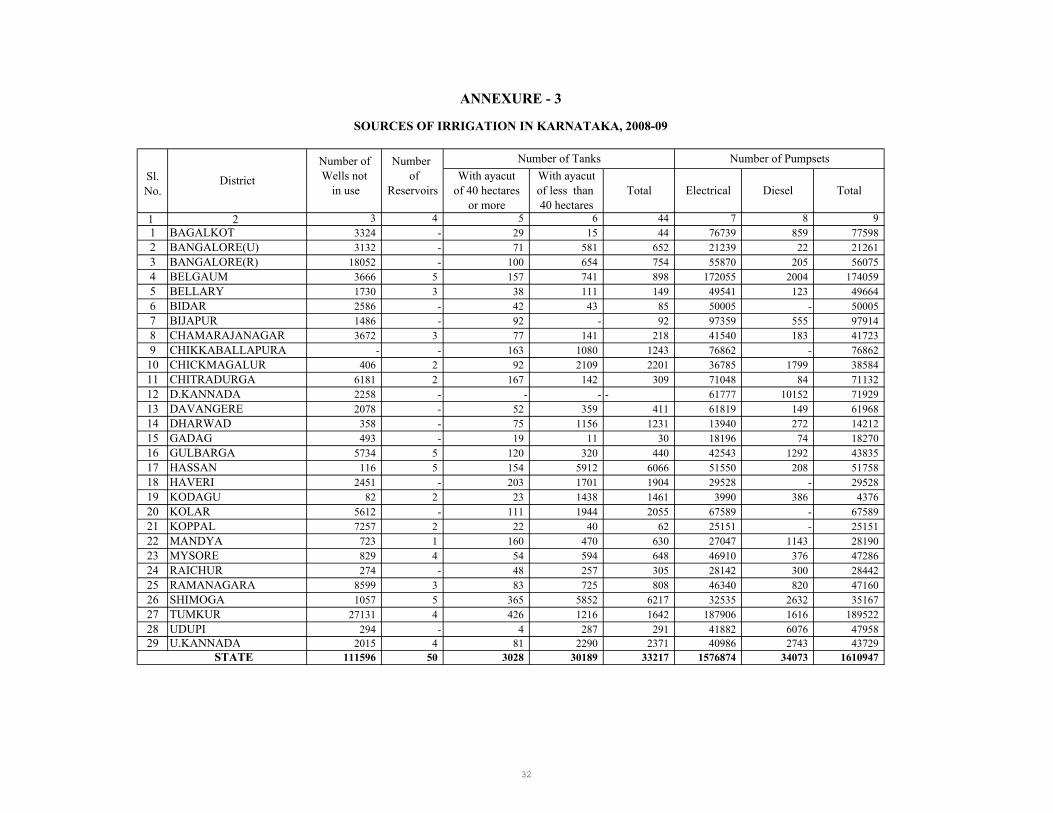
4.1 The main sources of irrigation in the State were wells, tanks, tube/bore wells and
reservoirs. The State had 6112 kms length of canals spread over 23 districts. There were
4,54,416 open wells, 6,59,674 tube/bore wells, 33,217 tanks, and 50 reservoirs during the year
under report. Maximum number of open wells were located in Belgaum (62,464) followed by
Bijapur (42,064) and Tumkur districts (39,922). Tube/bore wells were maximum in Tumkur
(1,18,107) followed by Kolar (68,881,). Shimoga had the highest number of 6,217 tanks and
the lowest is in Gadag, 30 tanks. Districtwise number of canals, wells, tube/bore wells, tanks
and other details are given in Annexure – 3.

5
5. Details of Sourcewise Area Irrigated:
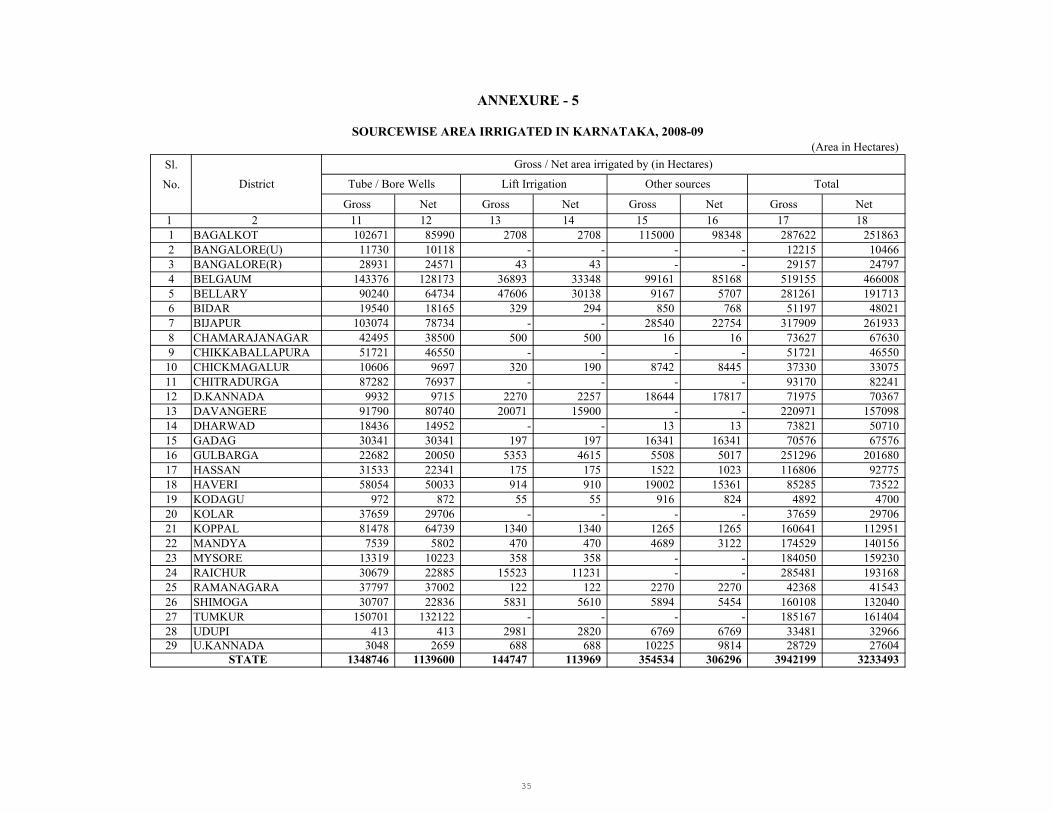
5.1 Out of the 1,23,68,443 hectares of gross cropped area during 2008-09, 39,42,199 hectares of area was irrigated. The percentage of gross area irrigated was 31.9% during 2008-09 as against 29.4% during 2007-08. Out of 1,01,95,088 hectares of net area sown during 2008-09, the net area irrigated was 32,33,493 hectares. The percentage of net area irrigated to net area sown works out to 31.7 as against 29.6 during 2006-07. The percentage of gross cropped area irrigated to gross cropped area sown was largest in Shimoga(62.58%) followed by Mandya(57.49%) and lowest in Kodagu(2.74%). Similarly, the percentage of net area irrigated to net area sown was largest in Shimoga (60.55%) followed by Belgaum (58.38%) and lowest in Kodagu(2.85%). Districtwise details are shown in Annexure - 4.
5.2 In the State, out of 39,42,199 hectares of gross cropped area irrigated, out of this 34.2%, 35.6%, 11.6%, 5.9%, 3.7% and 9.0% of area was irrigated by tube/bore wells, canals, wells, tanks, lift irrigation and other sources respectively. The net area irrigated was 32.8%, 35.2%, 12.5%, 6.4%, 3.5% and 9.5% through canals, tube/borewells, wells, tanks, lift irrigation and other sources respectively. Sourcewise area irrigated during 2008-09 is presented in Table - 3 and districtwise details in Annexure – 5. The Bar chart depicting the same is given in Annexure-5.1.1 and 5.1.2.
Table – 3 Sourcewise area Irrigated during 2008-09
Sl.
No.
Source of
Irrigation
Net area
irrigated
(in hect)
% to State
total
Gross area
irrigated
(in hect)
% to State
total
1. Canals 1061338 32.8(31.6) 1402376 35.6(34.1)
2. Tanks 206047 6.4(6.6) 234006 5.9(6.2)
3. Wells 406243 12.5(13.9) 457790 11.6(12.8)
4. Tube/Borewells(*) 1139600 35.2(34.5) 1348746 34.2(34.0)
5. Lift irrigation(*) 113969 3.5(4.1) 144747 3.7(4.2)
6. Other sources(*) 306296 9.5(9.3) 354534 9.0(8.7)
State 3233493 100.0(100.0) 3942199 100.0(100.0)
(figures in the bracket is for the year 2007-08)
*:Figures vary with that of DAG and KAG of 2008-09 as corrections are effected in these categories consequent upon the observations made by the Principle Secretary, Planning, Programme monitoring and Statistics Department, GOK, Bangalore

6
5.3 (a) Area irrigated by Canals: About 14.02 lakh hectares of gross cropped area was
irrigated by canals during 2008-09 as against 12.9 lakh hectares during 2007-08. The gross
cropped area irrigated by canal was the highest in Raichur(2.2 lakh hectares) followed by
Gulbarga(1.8) lakh hectares) and Mandya (1.3 lakh hectares). The net area irrigated by canals
was 10.4lakh hectares as against 9.9lakh hectares during 2007-08.Raichur and Gulbarga had
the largest net area irrigated (1.4 lakh hectares each) followed by Mysore (1.1 lakh hectares).
(b) Area irrigated by Tanks: Before the formation of major irrigation projects, tank
irrigation was popular in the State. During 2008-09, the gross cropped area irrigated by tanks
was 2.3 lakh hectares with a decrease of 270 hectares compared to 2007-08. The largest gross
cropped area irrigated by tanks was in Shimoga (0.6 lakh hectares) followed by Hassan(0.4
lakh hectares) and least in Ramanagar (32 hectares). Net area irrigated by tanks in the State
was 2.1 lakh hectares decreasing of 2083 hectares compared during 2007-08. The largest net
area irrigated by tanks was in Shimoga (0.6 lakh hectares) followed by Hassan(0.3 lakh
hectares) and least in Ramanagar (32 hectares).
(c) Area irrigated by Wells: Gross cropped area irrigated by wells was 4.6 lakh
hectares during 2008-09 as against 4.8 lakh hectares during 2007-08. The largest gross area
irrigated was in Belgaum(1.3 lakh hectares) and Bijapur (1.0 lakh hectares). Net area irrigated
by wells was 4.1 lakh hectares as against 4.3 lakh hectares during 2007-08. The largest net
area irrigated by wells was in Belgaum (1.2 lakh hectares) followed by Bijapur is 0.9 lakh
hectares.
(d) Area irrigated by Tube/Bore Wells: Gross area irrigated through tube/bore wells
was 13.5 lakh hectares during 2008-09 as against 12.9 lakh hectares during 2007-08. The
largest gross area irrigated by tube/bore wells was in Tumkur(1.5 lakh hectares) followed by
Belgaum(1.4 lakh hectares). The net area irrigated through the source tube/bore wells was
11.4 lakh hectares in 2008-09 as against 10.8 lakh hectares during 2007-08. The largest net
area irrigated was in Tumkur district (1.3 lakh hectares) followed by Belgaum (1.28 lakh
hectares).

7
(e) Area irrigated by Lift Irrigation: Gross area irrigated under lift irrigation was 1.4
lakh hectares during 2008-09 as against 1.6 lakh hectares during 2007-08.The largest gross
area irrigated was in Bellary(0.5 lakh hectares) followed by Belgaum district(0.4 lakh
hectares). Net area irrigated under lift irrigation scheme in the state was 1.1 lakh hectares
during 2008-09. The largest net area irrigated was in Belgaum (0.33 lakh hectares) followed
by Bellary (0.30 lakh hectares).
(f) Area irrigated by Other sources of Irrigation: In the State, 3.5 lakh hectares of
gross area and 3.1 lakh hectares of net area was irrigated by other sources of water like
seepage, streams, ponds etc.
[ 5.4 Districtwise percentage of area irrigated through different sources of irrigation is
given in Annexure - 6. Gross cropped area irrigated was 39.4 lakh hectares and net area
irrigated was 32.3 lakh hectares in the State. Thus, the area irrigated more than once was
7.1lakh hectares during 2008-09 as against 6.6 lakh hectares during 2007-08. The area
irrigated more than once was largest in Raichur (0.9 lakh hectares) and Bellary (0.8 lakh
hectares) and least in Kodagu(192 hectares) during 2008-09.
6. Details of Cropwise Gross Area Irrigated:
6.1 Totally, 3942199 hectares or 31.9 % of gross cropped area was irrigated in the State
during 2008-09 as against 29.4 % during 2007-08. Paddy crop alone occupied 28.4 % of the
Gross irrigated area. The other major crops irrigated (Gross) were Maize (10.9 %) and
Sugarcane(11.6 %).Totally 78.7% of the gross irrigated area was under food crops and 48.9 %
of the area was under cereals and minor millet crops. 11.1% and 4.4% of the Gross irrigated
area was under oilseeds and pulses crops respectively. Cropwise gross area irrigated during
2008-09 is given in Table - 4.

8
Table – 4
Cropwise Gross Area Irrigated(GAI) during 2008-09 & 2007-08
2008-09 2007-08
% of crop area irrigated to
% of crop area irrigated to
Sl.No. Name of the Crop
Gross area irrigated
(in hectares)
GAI of all crops
Gross area
under crop
Gross area irrigated
(in hectares)
GAI of all
crops
Gross Area under crop
I Food crops 1. Paddy 1120524 28.4 74.7 1032902 27.3 73.72. Jowar 155055 3.9 11.2 148906 3.9 10.83. Bajra 40072 1.0 15.1 49521 1.3 11.54. Maize 431429 10.9 41.3 447042 11.8 41.25. Ragi 37589 0.9 4.6 38539 1.0 4.86. Wheat 144086 3.6 53.6 142900 3.8 51.87. M Millets 9 Neg Neg 12 Neg Neg Total (1 to 7) 1928764 48.9 36.4 1859822 49.0 34.38. Bengalgram 125221 3.1 17.2 100456 2.7 16.69. Tur 29402 0.7 5.0 29178 0.8 4.310. Other Pulses 20524 0.5 2.7 22322 0.6 2.0
Total ( 8 to 10) 175147 4.4 8.5 151956 4.0 6.4 Total food grains ( 1 to 10) 2103911 53.3 28.5 2011778 53.1 25.8
11. Sugarcane 459267 11.6 99.9 479063 12.6 99.912. Palm 105 Neg 30.5 130 Neg 32.613. Con.& spice 253580 6.4 61.7 231604 6.1 57.514. Fruits & vegetables 285736 7.2 46.5 257583 6.8 41.2
Total food crops 3102599 78.7 35.0 2980158 78.6 32.0II Non food crops 15. Groundnut 186345 4.7 22.4 206820 5.5 23.316. Castor 189 Neg 1.0 333 Neg 1.517. Sesamum 835 Neg 1.5 1155 Neg 1.418. Mustard 353 Neg 8.0 243 Neg 6.3
19. Linseed 27 Neg 0.2 202 Neg 1.520. Safflower 791 Neg 1.1 1291 Neg 1.821. Sunflower 226090 5.7 22.6 215624 5.7 21.122. Soyabean 22588 0.6 16.8 12556 0.3 11.123. Nigerseed 310 Neg 1.2 74 Neg 0.2
Total(15 to 23) 437528 11.1 20.3 438298 11.7 19.424. Coconut 230244 5.8 55.1 219506 5.8 54.225. Cotton 81809 2.1 20.1 55920 1.5 14.026. Tobacco 13674 0.3 12.8 16543 0.4 14.927. Mulberry 44800 1.1 92.8 47180 1.2 92.228. Other non food crops 31545 0.8 8.5 31534 0.8 8.4
Total non food crops 839600 21.3 23.9 808981 21.3 22.5All crops (Total)* 3942199 100.0 31.9 3789139 100.0 29.4
(Neg: Negligible as it is less than 0.1%)

9
7. Cropping Pattern:
7.1 During 2008-09 the net area cultivated in the State was 1,01,95,088 hectares and
area sown more than once was 21,73,357 totaling to 1,23,68,443 as gross cropped area
compared to 1,28,92,671hectares during 2007-08. Gross cropped area was the largest in
Gulbarga district (14.3%) followed by Belgaum (10.1%).
7.2 The gross cropped area under food crops was 88,57,851 hectares (71.6%) and that of
non-food crops was 35,10,592 hectares (28.4%). It is observed that there is a decrease in
area of about 4,40,524 hectares under food crops and decrease of about 83,704 hectares under
non food crops. Details of area under different crops and their percentage shares for the years
2008-09 and 2007-08 are given below in Table - 5.
Table – 5
Gross cropped area under different crops during the year 2008-09 and 2007-08
2008-09 2007-08 Sl.
No. Name of the Crop Area
(hect) %to Total
Area (hect)
%to Total
I Food crops
1 Paddy 1500195 12.1 1401180 10.92 Jowar 1379495 11.2 1379459 10.73 Bajra 265594 2.1 431820 3.34 Maize 1045378 8.5 1084350 8.45 Ragi 811345 6.6 808839 6.36 Wheat 268599 2.2 275583 2.17 Navane 15296 0.1 15830 0.18 Save 14686 0.1 17835 0.19 Haraka 4 Neg 17 Neg10 Other MMs 391 Neg 802 Neg
Total (1 to 10) 5300983 42.9 5415715 42.011 Bengal gram 726178 5.9 604941 4.712 Tur 592010 4.8 679548 5.313 Horse gram 210878 1.7 221578 1.714 Black gram 111278 0.9 162139 1.315 Green gram 273373 2.2 529102 4.116 Avare 77806 0.6 78394 0.617 Cowpea 73107 0.6 78651 0.618 Other pulses 6158 Neg 17803 0.1
Total (11to 18) 2070788 16.7 2372156 18.4 Total food grains 7371771 59.6 7787871 60.419 Sugarcane 459465 3.7 479458 3.7

10
20 Palm 344 Neg 399 Neg21 Chillies 122313 1.0 136661 1.122 Cardamum 19838 0.2 21187 0.223 Arecanut 184326 1.5 174404 1.424 Fruits 313094 2.5 295157 2.325 Vegetables 301956 2.4 330735 2.626 Other food crops 84744 0.7 72503 0.6
Total food crops(1 to 26) 8857851 71.6 9298375 72.1II Non-food crops
27 Ground nut 832714 6.7 888662 6.928 Sesamum 55589 0.4 84987 0.729 Safflower 73364 0.6 70206 0.530 Sunflower 999301 8.1 1023840 7.931 Mustard 4400 Neg 3876 Neg32 Linseed 13549 0.1 13766 0.133 Nigerseed 24830 0.2 31023 0.234 Soyabean 134161 1.1 113088 0.935 Castor 19269 0.2 22680 0.236 Other oilseeds 2320 Neg 1721 Neg
Total(27 to 36) 2159497 17.4 2253849 17.537 Coconut 417781 3.4 405328 3.138 Cotton 406798 3.3 399121 3.139 Mulberry 48252 0.4 51171 0.4
40 Tobacco 106639 0.9 111020 0.9
41 Other non food crops 371625 3.0 373807 2.9
Total non food crops(27 to40) 3510592 28.4 3594296 27.9
Total (1 to 40) 12368443 100.0 12892671 100.0
( Neg =Negligible as it is less than 0.1%)
7.3 The area under cereals and minor millet crops increased in Paddy, Jowar and Ragi
crops and decreased in other cereals and millets and among pulses, area increased only in
Bengalgram and decreased in other pluses in 2008-09 compared to 2007-08. The area under
all food crops decreased except Arecanut and Fruits and area under all oilseeds decreased
except under Safflower, Mustard, Soyabean and other oilseeds. Area under Coconut, Cotton,
increased. Mulberry, Tobacco and other non food crops decreased during 2008-09 compared
to 2007-08.Area under food and nonfood crops decreasd due to untimely rain and change of
crops and the area under food and nonfoodcrops increased due to good demand and price in
market and profitability. Districtwise area covered under food and non-food crops with their
percentage to State’s total are presented in Annexure–7.
11
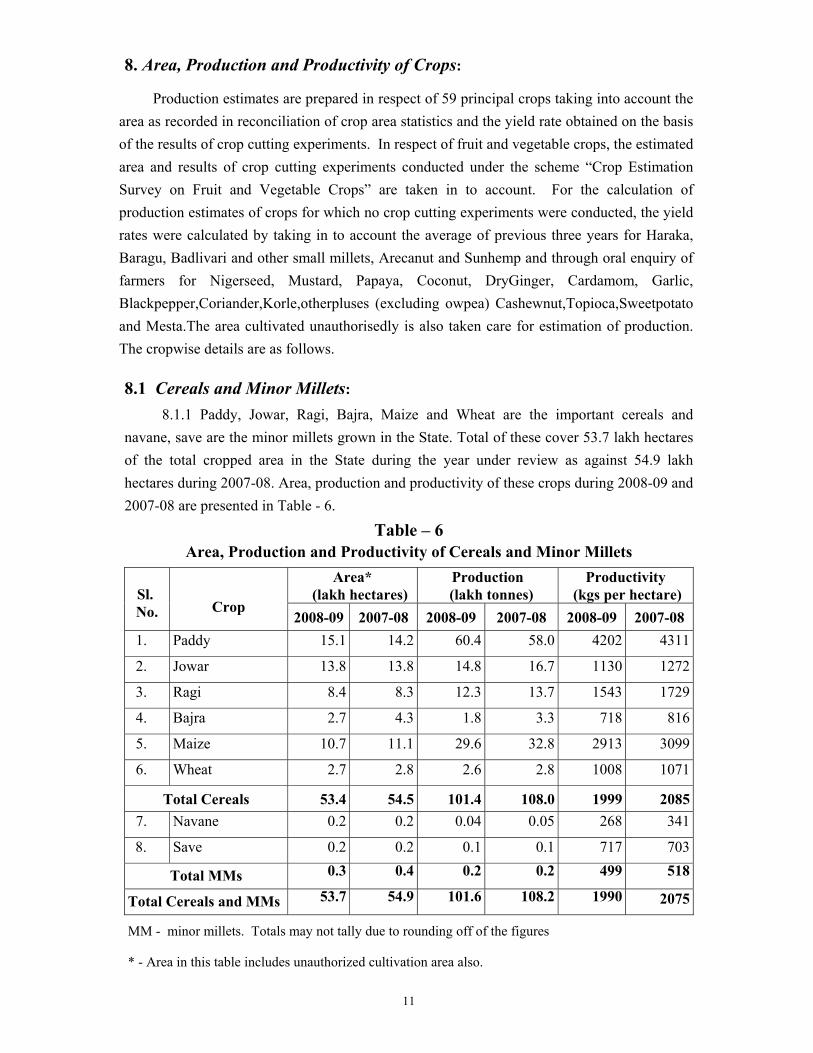
8. Area, Production and Productivity of Crops:
Production estimates are prepared in respect of 59 principal crops taking into account the area as recorded in reconciliation of crop area statistics and the yield rate obtained on the basis of the results of crop cutting experiments. In respect of fruit and vegetable crops, the estimated area and results of crop cutting experiments conducted under the scheme “Crop Estimation Survey on Fruit and Vegetable Crops” are taken in to account. For the calculation of production estimates of crops for which no crop cutting experiments were conducted, the yield rates were calculated by taking in to account the average of previous three years for Haraka, Baragu, Badlivari and other small millets, Arecanut and Sunhemp and through oral enquiry of farmers for Nigerseed, Mustard, Papaya, Coconut, DryGinger, Cardamom, Garlic, Blackpepper,Coriander,Korle,otherpluses (excluding owpea) Cashewnut,Topioca,Sweetpotato and Mesta.The area cultivated unauthorisedly is also taken care for estimation of production. The cropwise details are as follows.
8.1 Cereals and Minor Millets:
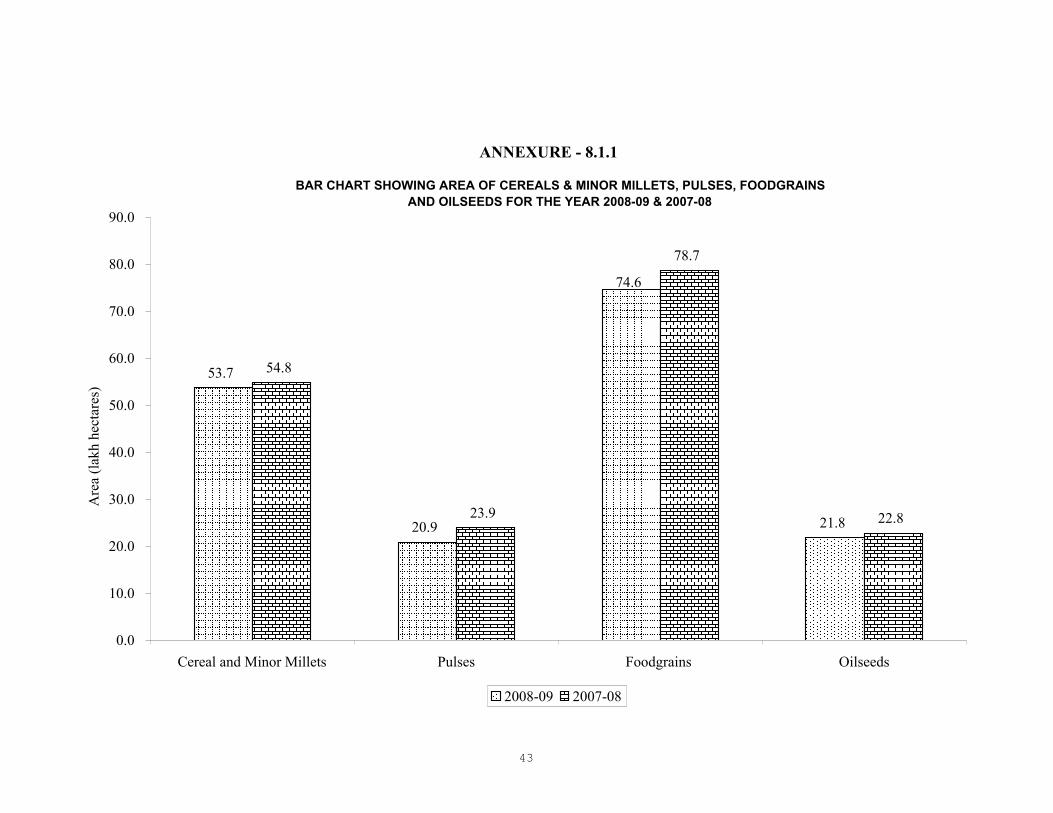
8.1.1 Paddy, Jowar, Ragi, Bajra, Maize and Wheat are the important cereals and navane, save are the minor millets grown in the State. Total of these cover 53.7 lakh hectares of the total cropped area in the State during the year under review as against 54.9 lakh hectares during 2007-08. Area, production and productivity of these crops during 2008-09 and 2007-08 are presented in Table - 6.
Table – 6 Area, Production and Productivity of Cereals and Minor Millets
Area* (lakh hectares)
Production (lakh tonnes)
Productivity (kgs per hectare) Sl.
No. Crop 2008-09 2007-08 2008-09 2007-08 2008-09 2007-08
1. Paddy 15.1 14.2 60.4 58.0 4202 4311
2. Jowar 13.8 13.8 14.8 16.7 1130 1272
3. Ragi 8.4 8.3 12.3 13.7 1543 1729
4. Bajra 2.7 4.3 1.8 3.3 718 816
5. Maize 10.7 11.1 29.6 32.8 2913 3099
6. Wheat 2.7 2.8 2.6 2.8 1008 1071
Total Cereals 53.4 54.5 101.4 108.0 1999 20857. Navane 0.2 0.2 0.04 0.05 268 341
8. Save 0.2 0.2 0.1 0.1 717 703
Total MMs 0.3 0.4 0.2 0.2 499 518
Total Cereals and MMs 53.7 54.9 101.6 108.2 1990 2075
MM - minor millets. Totals may not tally due to rounding off of the figures
* - Area in this table includes unauthorized cultivation area also.
12
8.1.2 Total area covered under cereal crops decreased from 54.5 lakh hectares to 53.4
lakh hectares whereas area under minor millets slightly decreased compared to previous year.
Among cereals, Paddy crop alone covered 15.1 lakh hectares followed by Jowar 13.8 lakh
hectares. The area of Cereals and Minor millets was largest in Gulbarga (4.8 lakh hectares)
followed by Belgaum(4.6 lakh hectares).
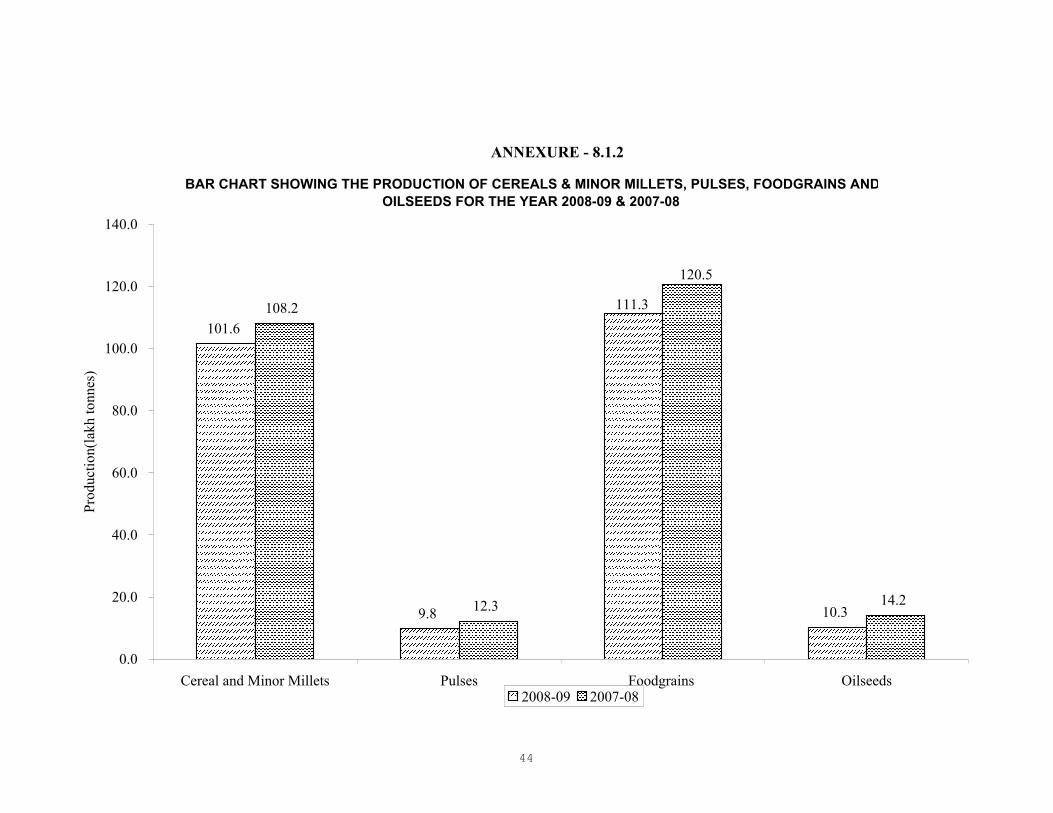
8.1.3 During 2008-09, the total production of cereals and minor millets was 101.4 lakh
tonnes as against 108.2 lakh tonnes during 2007-08. The yield rate decreased from 2075 to
1990 kgs per hectare compared to previous year. Production of Cereals and Minor millets
was highest in Davangere (9.5 lakh tonnes) followed by Belgaum (7.7 lakh tonnes). The yield
of cereals and minor millets was highest in Shimoga (2976 kgs per hect) followed by
Bangalore (Rural) (2964 kgs per hectare) and lowest in Chitradurga(1158 kgs per hectare).
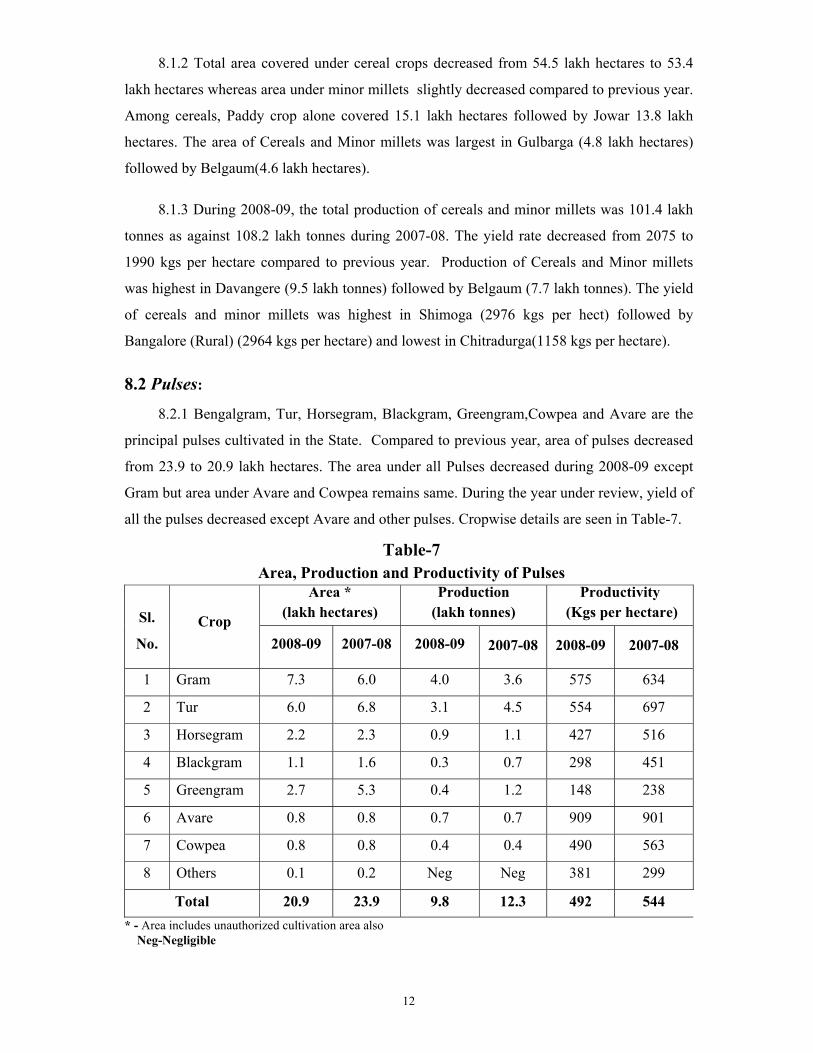
8.2 Pulses:
8.2.1 Bengalgram, Tur, Horsegram, Blackgram, Greengram,Cowpea and Avare are the
principal pulses cultivated in the State. Compared to previous year, area of pulses decreased
from 23.9 to 20.9 lakh hectares. The area under all Pulses decreased during 2008-09 except
Gram but area under Avare and Cowpea remains same. During the year under review, yield of
all the pulses decreased except Avare and other pulses. Cropwise details are seen in Table-7.
Table-7 Area, Production and Productivity of Pulses
Area * (lakh hectares)
Production (lakh tonnes)
Productivity (Kgs per hectare) Sl.
No. Crop
2008-09 2007-08 2008-09 2007-08 2008-09 2007-08
1 Gram 7.3 6.0 4.0 3.6 575 634
2 Tur 6.0 6.8 3.1 4.5 554 697
3 Horsegram 2.2 2.3 0.9 1.1 427 516
4 Blackgram 1.1 1.6 0.3 0.7 298 451
5 Greengram 2.7 5.3 0.4 1.2 148 238
6 Avare 0.8 0.8 0.7 0.7 909 901
7 Cowpea 0.8 0.8 0.4 0.4 490 563
8 Others 0.1 0.2 Neg Neg 381 299
Total 20.9 23.9 9.8 12.3 492 544 * - Area includes unauthorized cultivation area also Neg-Negligible

8.2.2 Area under pulses was the largest in Gulbarga (6.7 lakh hectares) followed by Bidar
(2.0 lakh hectares).
8.2.3 As yield was less under pulses during 2008-09, production naturally decreased
from 12.3 lakh tonnes to 9.8 lakh tonnes compared to 2007-08. This decrease was mainly
due to the decrease in productivity from 544 kgs per hectare to 492 kgs per hectare. The
production of all pulse crops decreased except Gram and the production of Avare and
Cowpea remains same during the year 2008-09. The production recorded highest under
pulses in Gulbarga(3.4 lakh tonnes) followed by Bijapur(1.0 lakh tonnes). Yield of pulses
was highest in Bangalore(Rural)(906 kgs per hect) followed by Bangalore (Urban)(763 kgs
per hect) and lowest in Gadag(244 kgs per hect).
8.3 Total Foodgrains:
8.3.1 The total area under foodgrains in the State was 74.6 lakh hectares during 2008-
09 as against 78.7 during 2007-08. This area was largest in Gulbarga (11.5 lakh hectares)
followed by Belgaum (5.6 lakh hectares) and least in Bangalore (Urban)(0.3 lakh hectares).
8.3.2 Total foodgrains production in the State was 111.3 lakh tonnes during 2008-09 as
against 120.5 lakh tonnes during 2007-08. The highest production was in Davanagere (9.6
lakh tonnes) followed by Gulbarga(9.4lakh tonnes) and the lowest in Bangalore (Urban)(0.7
lakh tonnes). Districtwise details are in Annexure - 8.
8.3.3 The yield rate of foodgrains of Karnataka State was 1571 kgs per hectares and it
was the highest in Shimoga (2937 kgs per hect) followed by Davanagere(2801 kgs per hect)
and lowest in Bidar(718 kgs per hect).
8.4 Oilseeds:
8.4.1 The important oilseed crops grown in the State are Groundnut, Sunflower,
Safflower, Sesamum, Castor, Linseed, Soyabean and Nigerseed. Total area under them in
the State was 21.8 lakh hectares during 2008-09 as against 22.8 during 2007-08. Cropwise
area, production and productivity of oilseed crops are given in Table- 8.

14
Table- 8
Area, Production and Productivity of Oil Seeds
Area *
(lakh hectares)
Production
(lakh tonnes)
Productivity
(Kgs per hectares) Sl.
No. Crop
2008-09 2007-08 2008-09 2007-08 2008-09 2007-08
1 Groundnut 8.5 9.1 4.0 6.9 493 802
2 Sunflower 10.0 10.3 4.1 4.9 435 506
3 Safflower 0.7 0.7 0.6 0.6 860 888
4 Sesamum 0.6 0.9 0.3 0.5 538 587
5 Castor 0.2 0.2 0.2 0.2 998 706
6 Linseed 0.1 0.1 Neg Neg 397 416
7 Soyabean 1.3 1.1 0.9 0.9 726 858
8 Rape & mustard
Neg Neg Neg Neg 405 367
9 Nigerseed 0.3 0.3 0.1 0.1 346 380
Total 21.8 22.8 10.3 14.2 497 656
Neg – negligible
* - Area includes unauthorized cultivation area also
8.4.2 Compared to 2007-08, the area under total Oilseeds has decreased. The area under
Groundnut Sunflower, Sesamum decreased and Soyabean increased and that of area under
Safflower, Castor, Linseed and Nigerseed remains the same. Raichur(2.1 lakh hectares)
registered the largest area followed by Gulbarga(2.0 lakh hectares).
8.4.3 Total production of oilseeds decreased during the year 2008-09 compared to
2007-08, from 14.2to 10.3 lakh tonnes. The total production of oilseeds was the highest in
Chitradurga(1.12 lakh tonnes) followed by Raichur(0.94 lakh tonnes). The average yield was
highest in Udupi(1992 kgs per hectare) district. Districtwise details are given in
Annexure – 8. The Bar chart showing the Area, Production and Productivity of Cereals &
Minor Millets, Pulses foodgrains, Sugarcane, Cotton, Tobacco and Oilseeds for the year
2008-09 and 2007-08 are given in Annexure 8.1.1, 8.1.2, and 8.1.3.

15
8.5 Commercial Crops:
8.5.1 Cotton, Sugarcane and Tobacco are the important commercial crops grown in the
State. Table – 9,gives the three dimensional details.
Table - 9
Area, Production and Productivity of Commercial Crops Area #
(Lakh hectares)
Production
(lakh tonnes)
Productivity
(Kgs per hectares) Sl. No. Crop
2008-09 2007-08 2008-09 2007-08 2008-09 2007-08
1 Cotton 4.1
4.0 8.3 7.0 361 313
2 Sugarcane (Harvested)
2.8 3.1 242.7 260.3 91 89
3 Tobacco 1.1 1.1 0.5 0.5 535 446
Note: *Production of Cotton in lakh bales of 170 kgs in lint form,
**Productivity of Sugarcane in tonnes per hectare
# - Area includes unauthorized cultivation area also
8.5.2 The area of Sugarcane(H), decreased, Cotton increased and Tobacco remains
same compared to last year. Production of Cotton increased, Sugarcane decreased but
remained same in Tobacco. Productivity increased in Sugarcane Tobacco and Cotton.
8.6 Horticulture Crops:
8.6.1 The important horticulture crops of the State are Mango, Banana, Grapes, Guava,
Sapota, Papaya, Lemon, Cashewnut, Coconut, Topioca, Sweetpotato, Onion, Potato,
Chillies, Tomato, Brinjal, Beans, Turmeric etc. Table-10 contains data on Area, production
and yield of horticulture crops.

16
Table – 10
Area, Production and Productivity of Horticulture Crops Area
(000 hectares) Production
(000 tonnes) Productivity
(Kgs per hectares)Sl. No. Crop
2008-09 2007-08 2008-09 2007-08 2008-09 2007-081 Mango 115.0 108.8 485.4 358.6 4222 3296
2 Banana 61.0 52.2 1059.3 923.0 17366 17685
3 Grapes 12.2 12.1 317.2 338.4 25941 27956
4 Guava 4.1 4.4 20.6 30.7 4964 6959
5 Sapota 15.7 14.0 63.5 55.1 4045 3923
6 Papaya 2.9 2.5 110.3 85.5 38043 34305
7 Cashewnut-Raw
62.3 61.0 38.3 34.1 621 565
Processed 62.3 61.0 9.7 8.6 158 142
8 Pomogranate 17.7 17.5 191.2 123.7 10798 7065
9 Lemon 8.5 8.4 49.6 27.5 5825 3291
10 Coconut 419 405.3 2868 2063.9 6920 5143
11 Topioca 0.9 0.7 8.5 6.4 9804 8341
12 Sweet Potato 2.6 2.9 26.2 24.1 10222 8447
13 Onion 135.0 182.1 721.3 1126.0 5624 6509
14 Potato 75.7 60.1 246.2 252.2 3424 4417
15 Tomato 34.5 34.7 347.8 321.9 10069 9272
16 Brinjal 12.1 12.8 128.9 112.6 10648 8797
17 Beans 5.8 6.0 41.3 42.7 7170 7133
18 Turmeric 14.2 13.5 67.4 105.0 4760 7776
19 Cabbage 4.7 4.5 77.7 69.8 16481 15377
8.6.2 Area under all crops increased except Guava, Onion, Tomato, Brinjal, Beans
during 2008-09 compared to 2007-08. Production of all crops increased except Grapes,
Guava, Onion, Potato, Beans and Turmeric. Yield of all crops increased except Banana,
Grapes, Guava, Onion, Potato, and Turmeric during 2008-09.
17
.
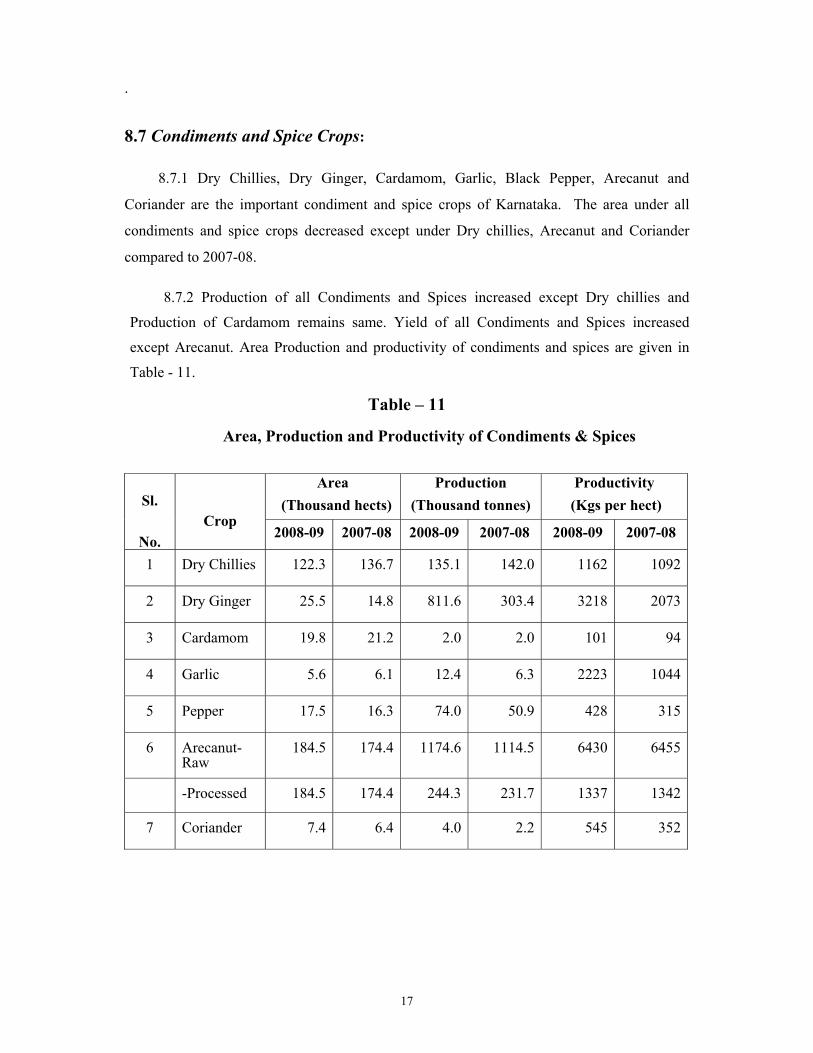
8.7 Condiments and Spice Crops:
8.7.1 Dry Chillies, Dry Ginger, Cardamom, Garlic, Black Pepper, Arecanut and
Coriander are the important condiment and spice crops of Karnataka. The area under all
condiments and spice crops decreased except under Dry chillies, Arecanut and Coriander
compared to 2007-08.
8.7.2 Production of all Condiments and Spices increased except Dry chillies and
Production of Cardamom remains same. Yield of all Condiments and Spices increased
except Arecanut. Area Production and productivity of condiments and spices are given in
Table - 11.
Table – 11
Area, Production and Productivity of Condiments & Spices
Area (Thousand hects)
Production (Thousand tonnes)
Productivity (Kgs per hect) Sl.
No. Crop
2008-09 2007-08 2008-09 2007-08 2008-09 2007-08
1 Dry Chillies 122.3 136.7 135.1 142.0 1162 1092
2 Dry Ginger 25.5 14.8 811.6 303.4 3218 2073
3 Cardamom 19.8 21.2 2.0 2.0 101 94
4 Garlic 5.6 6.1 12.4 6.3 2223 1044
5 Pepper 17.5 16.3 74.0 50.9 428 315
6 Arecanut-Raw
184.5 174.4 1174.6 1114.5 6430 6455
-Processed 184.5 174.4 244.3 231.7 1337 1342
7 Coriander 7.4 6.4 4.0 2.2 545 352

18
9. Index Number of Area, Production and Productivity of Crops:
9.1 The index numbers of area, production and productivity (with 1981-82 as base year) for the year 2008-09 and 2007-08 were compiled for 37 crops. Sub groupwise details are given in Table - 12.
Table – 12 Index Numbers of Area, Production and Productivity
(Base year :1981-82)
Area Production Productivity Sl.
No. Crop
2008-09 2007-08 2008-09 2007-08 2008-09 2007-08
1 Cereals 90.5 92.4 167.6 172.8 123.6 130.1
2 Pulses 134.3 153.3 320.6 332.1 113.3 128.6
3 Foodgrains 99.5 105.0 187.1 193.1 122.4 129.9
4 Oilseeds 100.7 106.2 133.1 124.3 104.1 104.5
5 Fibres 38.3 37.8 111.4 95.3 292.2 253.8
6 Plantation crops 123.0 123.0 152.0 152.0 144.3 144.3
7 Condiments and spices
157.5 154.7 480.9 401.8 131.6 123.9
8 Fruits & vegetables
306.4 325.5 418.4 406.0 157.4 148.8
9 Misc.crops 172.9 186.7 180.9 189.7 82.5 69.0
10 Non – Food crops
97.1 100.8 202.1 192.8 128.0 121.9
All Crops 98.8 103.8 192.4 193.0 124.8 126.5

19
10. Price Trend:
10.1 The wholesale and retail prices of important crops were collected fortnightly by
the District Statistical Officer from the office of the District Marketing Officer,based on
which annual wholesale and retail prices of selected commodities are worked out as
presented in Table - 13.
Table – 13
Annual Wholesale & Retail Prices of important commodities for 2008-09 & 2007-08
Wholesale Prices (Rs. per Quintal)
Retail Prices (Rs. per Kg) Sl.
No. Commodities 2008-09 2007-08 % 2008-09 2007-08 %
1. Rice(coarse) 1662 1177 41.21 17.60 13.23 33.03
2. Jowar(white) 1184 1148 3.14 14.61 15.33 -4.70
3. Bajra 899 737 22.0 11.28 8.92 26.46
4. Ragi 900 757 18.9 10.75 9.63 11.63
5. Maize 842 694 21.33 9.58 8.43 13.64
6. Wheat(white) 1521 1436 5.92 17.10 15.94 7.28
7. Gram 2670 2547 4.83 30.35 29.86 1.64
8. Turdhal 4495 3500 28.43 48.49 38.81 24.94
9. Horsegram 1598 1271 25.73 19.11 16.48 15.96
10. Blackgram 3117 2783 12.0 34.83 33.77 3.14
11. Greengram 3588 3002 19.5 40.04 34.27 16.84
12. Potato 986 919 7.29 12.52 11.58 8.12
13. Onion 1109 769 44.2 13.37 9.98 33.96
14. Dry Chillies
(Byadagi) 7746 6799 13.93 93.24 79.06 17.94
Source : SIP Division, DES
10.2 The annual average wholesale prices of all the commodities have shown increasing
trend during 2008-09. The wholesale prices varied from 3.14% for Jowar(White) to 44.2%
for Onion.

20
10.3 The prices of different commodities were collected weekly from the selected
centres. During 2008-09 the annual average retail prices, of all the commodities mentioned
in Table - 13 showed increasing trend except under Jowar(White).The retail prices ranged
between –4.70% for Jowar(White) to 33.96% for Onion.
11. Farm Harvest Prices:
11.1 The farm harvest prices of agriculture produce were collected in order to gauge the
price levels which prevailed during the peak harvesting period at the village level. These
prices for important crops for the year 2008-09 and 2007-08 are seen in Table - 14.
Table – 14
Farm Harvest Prices * of important agriculture crops for 2008-09 & 2007-08
State’s average farm harvest prices(Rs. per quintal) Sl. No. Commodities
2008-09 2007-08 % variation
1 Paddy (Kharif, Local) 835 695 20.14
2 Jowar (Kharif,Local) 660 592 11.49
Jowar(Rabi,Local) 838 1227 -31.70
3 Ragi(Kharif,Hyv) 821 668 22.90
4 Maize(Kharif,HB) 806 635 26.93
5 Bajra(Khari,HB) 739 574 28.75
6 Wheat(Rabi,Local) 1310 1248 4.97
7 Bengalgram 2081 2202 -5.50
8 Tur 2979 2219 34.25
9 Horsegram(Kharif,Local)
1305 877 48.80
10 Greengram(Kharif,Local)
2784 1991 39.83
11 Blackgram(Kharif,Local) 2577 1905 35.28
12 Drychillies(Kharif,Local)
5463 4834 13.01
13 Groundnut(Kharif,Local) 2172 2094 3.73
14 Sesamum (Kharif,Local) 4753 2939 61.72
15 Castor(Kharif,Local) 2508 1865 34.48
16 Linseed(Rabi,Local) 3016 - -

21
17 Sugarcane(Kharif) 131 103 27.18
18 Tobacco 10633 5923 79.52
19 Coconut * * 4956 4751 4.31
20 Potato(Kharif,Local) 727 796 -8.67
21 Onion(Kharif,Local) 835 633 31.91
22 Cotton 2515 2587 -2.78
ource: SIP Division, DES ** = 1000 nuts * = based on seasonwise reports
11.22 The prices of all commodities except Jowar(Rabi,Local) Bengalgram, Potato
(Kharif,Local) and Cotton showed an increasing trend during 2008-09 over 2007-08.
12. Index Number of Farm Harvest Prices:
12.1 The index number of farm harvest prices were calculated for 19 crops under the
sub-groups viz., cereals, pulses, food crops, oilseeds, fibres and miscellaneous crops in the
State with triennium ending 1961-62 as base year. The details for 2008-09 and 2007-08 are
presented in Table - 15.
Table-15
Index Number of Farm Harvest Prices for 2008-09 and 2007-08
(Base year : 1961-62)
Index Number Sl.No. Sub-groups
2008-09 2007-08 Percentage
variation
1 Cereals 2220 2005 10.7
2 Pulses 6307 5179 21.8
3 Food Crops 2363 2116 11.7
4 Oilseeds 4066 3871 5.0
5 Fibres 2725 2803 -2.8
6 Miscellaneous Crops 3050 2412 26.5
7 Non food crops 3113 2559 21.6
All commodities 2806 2378 18.0
22
Source : SIP Division, DES
12.2 The index numbers of all sub groups increased during 2008-09 except Fibres.
During 2008-09 it was highest in respect of pulses followed by oilseeds and the lowest for
cereals.
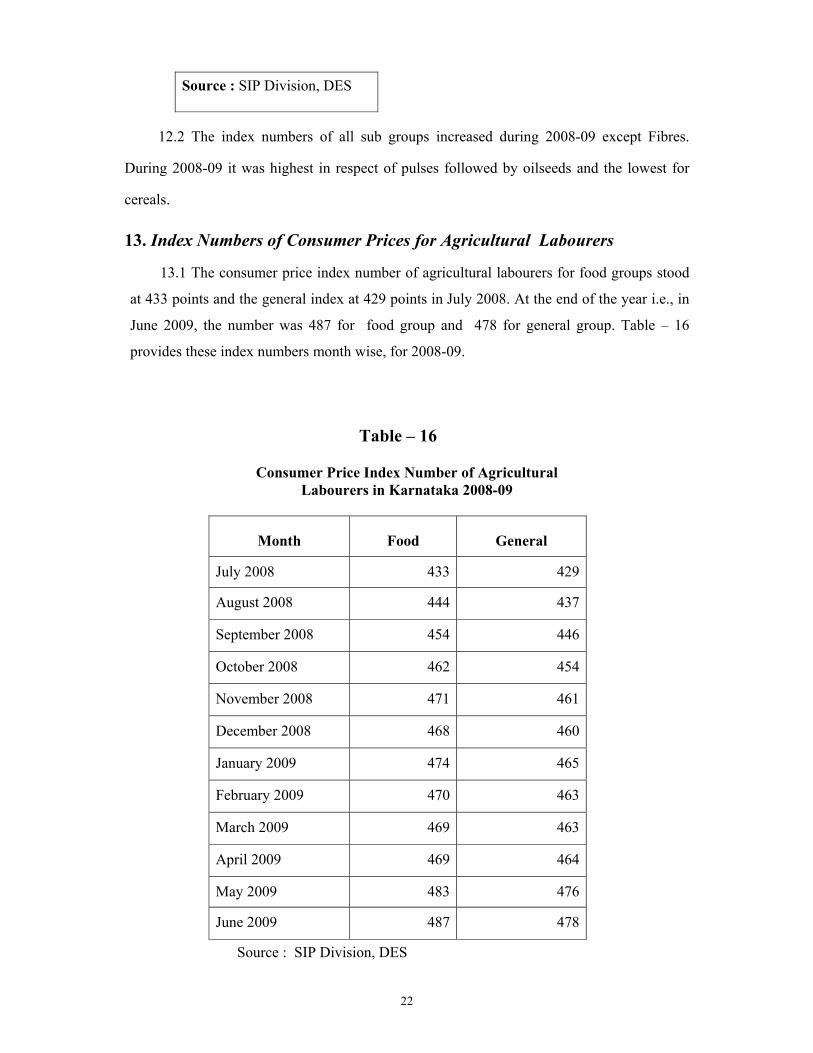
13. Index Numbers of Consumer Prices for Agricultural Labourers
13.1 The consumer price index number of agricultural labourers for food groups stood
at 433 points and the general index at 429 points in July 2008. At the end of the year i.e., in
June 2009, the number was 487 for food group and 478 for general group. Table – 16
provides these index numbers month wise, for 2008-09.
Table – 16
Consumer Price Index Number of Agricultural Labourers in Karnataka 2008-09
Month Food General
July 2008 433 429
August 2008 444 437
September 2008 454 446
October 2008 462 454
November 2008 471 461
December 2008 468 460
January 2009 474 465
February 2009 470 463
March 2009 469 463
April 2009 469 464
May 2009 483 476
June 2009 487 478
Source : SIP Division, DES
23
14. Agriculture Wages:
14.1 The districtwise, class wise, details of agricultural wages for the year 2008-2009
are given in Annexure - 9. There was an increase in the wages of carpenter, blacksmith and
mochis during the year 2008-09 compared to 2007-08.The wages of skilled labourers and
agricultural labourers in dry land,wet land and garden land has increased in 2008-09
compared to that of 2007-08 in varying degrees. The state average wage of
Carpenters,Blacksmiths and Mochis has increased by 10%,9.7% and 11.7% respectively
during 2008-09.The increase in wages during2008-09 compared to 2007-08 is 38%(male)
and 41%(female) in dryland,29%(male) and 24%(female) in wetland,39%(male)
and21%(female) in gardenland under A category. During the same period, wages increased
by 30%(male) and 24%(female) in dryland,23%(male),22%(female) in wet and gardenland
under B category.The figures under C category are 12%(male) and17%(female) in
dryland,7%(male),27%(female) in wetland and 3%(male) and 23%(female) in gardenland.
Under D category,the figures are 24%(male) and 10%(female) in dryland,9%(male)
and23%(female) in wetland and 21%(male) and 28%(female) in gardenland. It may be
observed that the increase in wages of men is higher than that of their counterparts in A
category(except in Dryland) and B category.In category C,increase in wages of females is
higher than that of males.Under D category,increase in wages is higher for women in wetland
and garden land but lesser in dryland.
15. Livestock Census: 15.1 The data collected on quinquennial census during 2007(provisional) on livestock,
agricultural machinery and implements are given in Appendix - 10.During livestock census
2007(P),compared to livestock census 2003,population of Bovines has increased by 9.6%,out
of which cattle’s share was 10% and that buffaloes was 8.42%.During the same
period,number of sheeps,goats,mules,donkeys,camels and poultry registered an increase of
31.7%,30%,107%,5.2%,429% and 64% respectively but showed a decline to the extent of
18.18% in the number of horses and ponies and 10% in pigs.Among the animal operated
implements,there is a decrease in the number of wooden ploughs by 9% and discharrow by
0.86% but showed an increase by 35% in seed cum fertilizer drill by 6.94% in triphalli and
18% in levelling karash earth.
*** *** ***

ANNEXURE
( in mm )
N A C N A C N A C N A C N A C N A C1 BAGALKOT 23 14 D 57 30 D 72 27 S 74 25 S 68 62 N 294 158 D2 BANGALORE(U) 37 26 D 103 88 N 64 44 D 95 145 E 118 244 E 417 547 E3 BANGALORE(R) 32 11 S 81 58 D 59 17 S 92 169 E 109 202 E 373 457 E4 BELGAUM 31 32 N 78 33 D 121 197 E 212 169 D 127 299 E 569 730 E5 BELLARY 26 3 S 64 33 D 67 29 D 77 25 S 82 76 N 316 166 D6 BIDAR 20 10 D 31 9 S 132 73 D 191 116 D 195 234 E 569 442 D7 BIJAPUR 18 26 E 44 18 D 89 19 S 87 33 S 86 94 N 324 190 D8 CHAMARAJANAGAR 58 51 N 134 85 D 45 41 N 63 80 E 62 138 E 362 395 N9 CHIKBALLAPUR 24 3 S 69 61 N 52 39 D 79 149 E 94 102 N 318 354 N10 CHICKMAGALUR 60 29 D 110 51 D 368 315 N 696 435 D 426 591 E 1660 1421 N11 CHITRADURGA 26 10 S 70 62 N 44 40 N 53 63 N 54 123 E 247 298 E12 D.KANNADA 46 49 N 173 82 D 857 975 N 1074 815 D 749 803 N 2899 2724 N13 DAVANGERE 34 26 D 76 67 N 67 69 N 101 73 D 79 123 E 357 358 N14 DHARWAD 46 35 D 88 35 S 108 80 D 149 79 D 101 169 E 492 398 N15 GADAG 33 35 N 76 50 D 80 31 S 72 30 D 74 52 D 335 198 D16 GULBARGA 19 5 S 37 13 S 120 45 S 158 103 D 165 149 N 499 315 D17 HASSAN 51 41 D 97 96 N 157 231 E 302 338 N 198 411 E 805 1117 E18 HAVERI 41 26 D 83 60 D 109 116 N 173 90 D 111 178 E 517 470 N19 KODAGU 84 46 D 162 60 S 503 518 N 835 581 D 556 583 N 2140 1788 N20 KOLAR 22 8 S 68 78 N 44 35 D 66 113 E 74 141 E 274 375 E21 KOPPAL 21 6 S 53 22 D 66 24 S 79 26 S 87 41 D 306 119 S22 MANDYA 42 29 D 108 57 D 43 58 E 49 92 E 52 128 E 294 364 E23 MYSORE 59 31 D 124 80 D 69 60 N 102 113 N 67 112 E 421 396 N24 RAICHUR 43 4 S 117 15 S 60 16 S 79 41 D 100 91 N 399 167 D25 RAMANAGAR 18 16 N 39 83 E 78 25 S 112 97 N 119 200 E 366 421 N26 SHIMOGA 30 26 N 85 42 D 465 618 E 888 599 D 591 844 E 2059 2129 N27 TUMKUR 25 11 D 77 65 N 46 48 N 58 119 E 62 173 E 268 416 E28 UDUPI 28 28 N 171 72 D 1080 1131 N 1318 755 D 913 979 N 3510 2965 N29 U.KANNADA 25 15 D 119 36 S 698 704 N 988 584 D 598 903 E 2428 2242 N
38 22 D 93 51 D 191 237 E 302 248 N 215 342 E 839 900 NNote : E = Excess, N = Normal, D = Deficit, S = Scanty, A = Actual, C = Condition
Source: ARC DivisionNormal: 50 years of Average rainfall(1941-1990)
Jul-08 Aug-08 April 2008-August 2008
State
ANNEXURE-1
DISTRICTWISE NORMAL AND ACTUAL RAINFALL DURING KHARIF 2008-09
Sl. No. District Apr-08 May-08 Jun-08

( in mm )
N A C N A C N A C N A C N A C1 BAGALKOT 144 144 N 102 51 D 28 30 N 7 0 NR 281 225 N2 BANGALORE(U) 177 106 D 156 169 N 52 35 D 16 0 NR 401 310 D3 BANGALORE(R) 154 115 D 148 142 N 44 29 D 11 5 D 357 291 N4 BELGAUM 114 178 E 109 45 D 35 32 N 6 1 S 264 256 N5 BELLARY 138 138 N 106 51 D 30 42 E 10 0 NR 284 231 N6 BIDAR 187 278 E 81 55 D 19 1 S 7 3 D 294 337 N7 BIJAPUR 167 148 N 100 51 D 24 14 D 7 0 NR 298 213 D8 CHAMARAJANAGAR 107 53 D 150 200 E 62 47 D 28 0 NR 347 300 N9 CHIKBALLAPUR 146 213 E 142 155 N 46 42 N 14 3 S 348 413 N10 CHICKMAGALUR 169 205 E 163 117 D 53 19 S 11 1 S 396 342 N11 CHITRADURGA 107 128 E 107 98 N 31 21 D 9 0 NR 254 247 N12 D.KANNADA 295 367 E 214 190 N 80 31 S 18 9 D 607 597 N13 DAVANGERE 108 102 N 109 80 D 37 52 E 6 0 NR 260 234 N14 DHARWAD 121 95 D 112 38 S 41 68 E 7 0 NR 281 201 D15 GADAG 140 82 D 111 68 D 32 84 E 7 1 S 290 235 N16 GULBARGA 197 161 N 103 62 D 21 13 D 5 2 D 326 238 D17 HASSAN 122 152 E 148 167 N 50 26 D 10 0 NR 330 345 N18 HAVERI 98 78 D 110 67 D 43 43 N 7 0 NR 258 188 D19 KODAGU 223 218 N 205 200 N 77 11 S 18 2 S 523 431 N20 KOLAR 130 135 N 126 139 N 52 66 E 17 3 S 325 343 N21 KOPPAL 145 186 E 106 49 D 22 43 E 6 0 NR 279 278 N22 MANDYA 121 56 D 154 135 N 50 22 D 16 1 S 341 214 D23 MYSORE 91 49 D 142 130 N 46 10 S 13 0 NR 292 189 D24 RAICHUR 164 133 N 166 48 S 51 17 S 14 1 S 395 199 D25 RAMANAGAR 155 85 D 102 112 N 20 35 E 5 2 S 282 234 N26 SHIMOGA 180 302 E 131 49 S 38 10 S 5 0 NR 354 361 N27 TUMKUR 135 108 D 124 123 N 39 24 D 9 1 S 307 256 N28 UDUPI 435 570 E 208 146 D 77 21 S 15 1 S 735 738 N29 U.KANNADA 253 331 E 140 35 S 50 13 S 10 3 S 453 382 N
153 183 N 137 96 D 45 27 D 11 2 S 346 308 NNote : E = Excess, N = Normal, D = Deficit, S = Scanty, A = Actual, C = Condition, NR = No RainSource: ARC DivisionNormal: 50 years of Average rainfall(1941-1990)
State
ANNEXURE - 1
DISTRICTWISE NORMAL AND ACTUAL RAINFALL DURING RABI 2008-09
Sl. No. District Sep-08 Oct-08 Nov-08 Dec-08 September 2008-December 2008

(in mm)
N A C N A C N A C N A C N A C1 BAGALKOT 1 0 NR 2 0 NR 6 4 D 9 4 D 584 387 D2 BANGALORE(U) 2 0 NR 7 1 S 8 7 N 17 8 D 835 865 N3 BANGALORE(R) 1 0 NR 3 0 NR 5 11 E 9 11 E 739 759 N4 BELGAUM 2 0 NR 1 0 NR 7 10 E 10 10 N 843 996 N5 BELLARY 1 0 NR 2 0 NR 3 3 N 6 3 D 606 400 D6 BIDAR 5 0 NR 8 0 NR 11 7 D 24 7 S 887 786 N7 BIJAPUR 2 0 NR 3 0 NR 6 3 D 11 3 S 633 406 E8 CHAMARAJANAGAR 3 0 NR 6 0 NR 12 14 N 21 14 D 730 709 N9 CHIKBALLAPUR 2 0 NR 3 0 NR 6 12 E 11 12 N 677 779 N
10 CHICKMAGALUR 2 0 NR 2 0 NR 12 80 E 16 80 E 2072 1843 N11 CHITRADURGA 1 0 NR 1 0 NR 5 23 E 7 23 E 508 568 N12 D.KANNADA 3 1 S 2 0 NR 9 55 E 14 56 E 3520 3377 N13 DAVANGERE 1 0 NR 1 0 NR 4 26 E 6 26 E 623 618 N14 DHARWAD 3 0 NR 4 0 NR 8 19 E 15 19 E 788 618 D15 GADAG 1 0 NR 1 0 NR 4 11 E 6 11 E 631 444 D16 GULBARGA 3 0 NR 4 0 NR 7 6 N 14 6 D 839 559 D17 HASSAN 2 0 NR 2 0 NR 8 40 E 12 40 E 1147 1502 E18 HAVERI 1 0 NR 1 0 NR 5 32 E 7 32 E 782 690 N19 KODAGU 4 0 NR 5 0 NR 19 87 E 28 87 E 2691 2306 N20 KOLAR 2 0 NR 4 0 NR 8 14 E 14 14 N 613 732 N21 KOPPAL 1 0 NR 1 1 E 2 12 E 4 13 E 589 410 D22 MANDYA 2 0 NR 4 0 NR 9 16 E 15 16 N 650 594 N23 MYSORE 2 0 NR 4 0 NR 11 26 E 17 26 E 730 611 N24 RAICHUR 1 0 NR 5 0 NR 10 1 S 16 1 S 810 367 D25 RAMANAGAR 1 0 NR 2 0 NR 4 31 E 7 31 E 655 686 N26 SHIMOGA 1 0 NR 1 0 NR 5 27 E 7 27 E 2420 2517 N27 TUMKUR 1 0 NR 2 0 NR 6 21 E 9 21 E 584 693 N28 UDUPI 3 0 NR 1 0 NR 5 30 E 9 30 E 4254 3733 N29 U.KANNADA 1 0 NR 0 0 NR 3 28 E 4 28 E 2885 2652 N
2 0 NR 3 0 NR 8 24 E 13 24 E 1198 1232 NNote : E = Excess, N = Normal, D = Deficit, S = Scanty, A = Actual, C = Condition, NR = No RainSource: ARC DivisionNormal: 50 years of Average rainfall(1941-1990)
State
ANNEXURE - 1
DISTRICTWISE NORMAL AND ACTUAL RAINFALL DURING SUMMER 2008-09
Sl. No. District
Jan-09 Feb-09 Mar-09 January2009-March2009 Annual(April 2008 to March 2009)

(Area in Hectares)
Sl.No. Professional Village Land put Barren & Cultivable
Survey Papers to Non- Uncultivable Wasteagricultural uses Land
1 2 3 4 5 6 7 81 BAGALKOT 658877 658877 81126 28832 24810 20352 BANGALORE(U) 217410 217410 5055 114880 4911 37933 BANGALORE(R) 229519 229519 11322 39978 11124 38984 BELGAUM 1344382 1344382 190424 69511 44342 114655 BELLARY 813196 813196 97017 68623 53477 248396 BIDAR 541765 541765 27707 22006 19127 193827 BIJAPUR 1053471 1053471 1977 35847 29059 55028 CHAMARAJANAGAR 569901 569901 275610 24606 21434 76379 CHIKKABALLAPURA 404501 404501 49704 31933 34302 614310 CHICKMAGALUR 722075 722075 200485 42639 28322 1940411 CHITRADURGA 770702 770702 73719 51243 25403 2161512 D.KANNADA 477149 477149 128476 64466 58917 3096313 DAVANGERE 597597 597597 89918 38963 20533 852514 DHARWAD 427329 427329 35235 21817 3985 266915 GADAG 465715 465715 32614 10481 11628 101016 GULBARGA 1610208 1610208 69089 67952 63155 1180217 HASSAN 662602 662602 58775 78754 30365 1414218 HAVERI 485156 485156 47454 32679 5793 298919 KODAGU 410775 410775 134597 23961 31010 912820 KOLAR 374966 374966 20620 45677 28870 639721 KOPPAL 552495 552495 29451 38870 16627 256822 MANDYA 498244 498244 24765 60906 21519 4195523 MYSORE 676382 676382 62851 67028 45812 2146024 RAICHUR 835843 835843 18167 20563 20084 1071225 RAMANAGARA 355912 355912 69946 26225 24339 117826 SHIMOGA 847784 847784 276855 88453 13312 1630727 TUMKUR 1064755 1064755 45177 84276 67539 6264228 UDUPI 356446 356446 100102 39418 11595 3630329 U.KANNADA 1024679 1024679 813595 34460 16234 6450
19049836 19049836 3071833 1375047 787628 412913 (Continued)
STATE
ANNEXURE - 2CLASSIFICATION OF TOTAL GEOGRAPHICAL AREA IN KARNATAKA, 2008-09
District
Geographical Area Classification of Area
Forest
Not Available for Cultivation
27

(Area in Hectar
Net Total Area sown Sl. Area Cropped more thanNo. Permanent Miscellaneous Current Other Sown Area once(14)-(13)
Pastures & Tree Crops, Fallows Fallow Landother grazing land Groves(*)
1 2 9 10 11 12 13 14 151 BAGALKOT 3429 274 53059 9971 455341 567257 1119162 BANGALORE(U) 5674 7426 16180 5141 54350 56399 20493 BANGALORE(R) 3879 12227 11593 11745 123753 129522 57694 BELGAUM 24807 3085 195462 6997 798289 1009297 2110085 BELLARY 5472 3606 97439 27805 434918 575787 1408696 BIDAR 13964 10939 47028 41519 340093 400182 600897 BIJAPUR 9575 1316 218520 5685 745990 849500 1035108 CHAMARAJANAGAR 22750 4782 7743 13501 191838 230544 387069 CHIKKABALLAPURA 59510 6482 22760 9059 184608 189854 5246
10 CHICKMAGALUR 90186 21249 19073 4797 295920 329269 3334911 CHITRADURGA 88740 11317 43851 24834 429980 481430 5145012 D.KANNADA 19118 31833 6918 5381 131077 157926 2684913 DAVANGERE 19538 4955 17775 5211 392179 460772 6859314 DHARWAD 3571 202 40376 9407 310067 498892 18882515 GADAG 2592 264 43710 3712 359704 458269 9856516 GULBARGA 37610 1851 144994 19086 1194669 1427097 23242817 HASSAN 32943 6963 40155 34813 365692 448168 8247618 HAVERI 12209 2267 11866 5274 364625 423526 5890119 KODAGU 14774 23343 4928 3999 165035 178479 1344420 KOLAR 39418 7009 34574 12813 179588 187541 795321 KOPPAL 14675 210 91128 - 358966 469041 11007522 MANDYA 32049 3382 22424 37923 253321 303574 5025323 MYSORE 55256 6871 37054 41864 338186 523515 18532924 RAICHUR 19816 13684 153042 68701 511074 651483 14040925 RAMANAGARA 24662 3950 17258 21302 167052 172380 532826 SHIMOGA 163463 26868 12731 31712 218083 255854 3777127 TUMKUR 76453 21033 63698 28863 615074 684415 6934128 UDUPI 10625 47521 888 8676 101318 123474 2215629 U.KANNADA 16625 4806 5479 12732 114298 124996 10698
923383 289715 1481706 512523 10195088 12368443 2173355 STATE
District
ANNEXURE -2 CLASSIFICATION OF TOTAL GEOGRAPHICAL AREA IN KARNATAKA, 2008-09
Uncultivated land excluding fallow land Fallow Land
Classification of Area
28

29
PIE CHART SHOWING THE LAND USE CLASSIFICATION FOR THE YEAR 2008-09
16%
7%
4%
2%
5%
2%
8%3%
53%
Forest Land put to non-agriculture useBarren & uncultivable land Cultivable wastePermanent pastures & other graz. Land Land under miscellaneous tree, crops, groves etc.,.Current fallow Other fallow landNet area sown
ANNEXURE - 2.1
(1)
(6)
(7)
(2)
(3)
(8)
(4)(9)
(5)

Sl.No. Length
(Kms.)1 2 3 4 5 6 71 BAGALKOT 3 189 4 24455 244592 BANGALORE(U) - - - 24057 240573 BANGALORE(R) - - 76 27885 279614 BELGAUM 12 416 11 25410 254215 BELLARY 13 456 12 17876 178886 BIDAR 4 180 8 8852 88607 BIJAPUR 4 218 - 29270 292708 CHAMARAJANAGAR 8 187 25 23462 234879 CHIKKABALLAPURA - - 12 67680 6769210 CHICKMAGALUR 2 50 2 2578 258011 CHITRADURGA 3 142 156 24951 2510712 D.KANNADA - - 3 6587 659013 DAVANGERE 4 203 84 25480 2556414 DHARWAD - 48 9 3990 399915 GADAG 1 84 11 4762 477316 GULBARGA 13 298 7 2350 235717 HASSAN 11 514 - 40913 4091318 HAVERI 1 47 44 23739 2378319 KODAGU 9 92 16 201 21720 KOLAR - - - 68881 6888121 KOPPAL 6 112 21 6496 651722 MANDYA 20 780 5 6528 653323 MYSORE 33 1308 - 14040 1404024 RAICHUR 1 125 30 4657 468725 RAMANAGARA 7 178 57 35594 3565126 SHIMOGA 16 378 11 19156 1916727 TUMKUR 5 87 71 118036 11810728 UDUPI - - - 598 59829 U.KANNADA 4 20 10 505 515
180 6112 685 658989 659674 (Continued)
ANNEXURE - 3SOURCES OF IRRIGATION IN KARNATAKA, 2008-09
Number Government Private Total
Canals WellsGovernment Number of Tube/BorewellsDistrict
STATE
30
Number of Number Sl. Wells not of With ayacut With ayacutNo. in use Reservoirs of 40 hectares of less than
or more 40 hectares1 2 3 4 5 6 44 7 8 91 BAGALKOT 3324 - 29 15 44 76739 859 775982 BANGALORE(U) 3132 - 71 581 652 21239 22 212613 BANGALORE(R) 18052 - 100 654 754 55870 205 560754 BELGAUM 3666 5 157 741 898 172055 2004 1740595 BELLARY 1730 3 38 111 149 49541 123 496646 BIDAR 2586 - 42 43 85 50005 - 500057 BIJAPUR 1486 - 92 - 92 97359 555 979148 CHAMARAJANAGAR 3672 3 77 141 218 41540 183 417239 CHIKKABALLAPURA - - 163 1080 1243 76862 - 76862
10 CHICKMAGALUR 406 2 92 2109 2201 36785 1799 3858411 CHITRADURGA 6181 2 167 142 309 71048 84 7113212 D.KANNADA 2258 - - - - 61777 10152 7192913 DAVANGERE 2078 - 52 359 411 61819 149 6196814 DHARWAD 358 - 75 1156 1231 13940 272 1421215 GADAG 493 - 19 11 30 18196 74 1827016 GULBARGA 5734 5 120 320 440 42543 1292 4383517 HASSAN 116 5 154 5912 6066 51550 208 5175818 HAVERI 2451 - 203 1701 1904 29528 - 2952819 KODAGU 82 2 23 1438 1461 3990 386 437620 KOLAR 5612 - 111 1944 2055 67589 - 6758921 KOPPAL 7257 2 22 40 62 25151 - 2515122 MANDYA 723 1 160 470 630 27047 1143 2819023 MYSORE 829 4 54 594 648 46910 376 4728624 RAICHUR 274 - 48 257 305 28142 300 2844225 RAMANAGARA 8599 3 83 725 808 46340 820 4716026 SHIMOGA 1057 5 365 5852 6217 32535 2632 3516727 TUMKUR 27131 4 426 1216 1642 187906 1616 18952228 UDUPI 294 - 4 287 291 41882 6076 4795829 U.KANNADA 2015 4 81 2290 2371 40986 2743 43729
111596 50 3028 30189 33217 1576874 34073 1610947 STATE
ANNEXURE - 3
SOURCES OF IRRIGATION IN KARNATAKA, 2008-09
District
Number of Tanks
Total Electrical Diesel Total
Number of Pumpsets
32

Sl.No.
Masonry Non-masonry Masonry Non-masonry1 2 8 9 10 11 12 13 14 151 BAGALKOT - - 2357 9390 11747 19 - 192 BANGALORE(U) - - 2553 96 2649 - - -3 BANGALORE(R) - - 7370 3136 10506 1 - 14 BELGAUM - - 14693 47771 62464 45 6419 64645 BELLARY - - 4957 2702 7659 37 3534 35716 BIDAR 8 - 6198 10854 17060 7 - 77 BIJAPUR - - 1683 40381 42064 1 - 18 CHAMARAJANAGAR 3 - 9913 2479 12395 4 - 49 CHIKKABALLAPURA - - 18121 13612 31733 - - -
10 CHICKMAGALUR - - 652 1613 2265 22 - 2211 CHITRADURGA 21 13 3958 8039 12031 55 52 10712 D.KANNADA 1 - 17017 22854 39872 6 1567 157313 DAVANGERE - - 2780 2974 5754 21 1337 135814 DHARWAD 1 - 681 431 1113 - - -15 GADAG - - 1997 1775 3772 9 1 1016 GULBARGA 1 3 4503 23705 28212 38 340 37817 HASSAN 5 - 2549 192 2746 20 - 2018 HAVERI - - 506 1599 2105 22 319 34119 KODAGU - - 137 - 137 11 - 1120 KOLAR - - 16963 10912 27875 - - -21 KOPPAL - 619 2439 1919 4977 10 - 1022 MANDYA 4 9 5385 6452 11850 16 73 8923 MYSORE - - 4428 568 4996 15 - 1524 RAICHUR - - 3680 6269 9949 24 4446 447025 RAMANAGARA - - 9994 2644 12638 2 - 226 SHIMOGA - - 6895 1346 8241 6 3835 384127 TUMKUR 13 - 33658 6251 39922 9 - 928 UDUPI - - 21497 7683 29180 4 2078 208229 U.KANNADA 19 - 5132 3353 8504 13 3 16
76 644 212696 241000 454416 417 24004 24421 (Continued)
ANNEXURE - 3
SOURCES OF IRRIGATION IN KARNATAKA, 2008-09
Total Government Private TotalGovernment Private
Number of other wells used for Irrigation purpose only
STATE
Wells Lift irrigation
District
31

(Area in Hectares)Sl Gross Area Net AreaNo. % GAI % NAI
to GAS to NAS1 2 3 4 5 6 7 81 BAGALKOT 567257 287622 50.70 455341 251863 55.312 BANGALORE(U) 56399 12215 21.66 54350 10466 19.263 BANGALORE(R) 129522 29157 22.51 123753 24797 20.044 BELGAUM 1009297 519155 51.44 798289 466008 58.385 BELLARY 575787 281261 48.85 434918 191713 44.086 BIDAR 400182 51197 12.79 340093 48021 14.127 BIJAPUR 849500 317909 37.42 745990 261933 35.118 CHAMARAJANAGAR 230544 73627 31.94 191838 67630 35.259 CHIKKABALLAPURA 189854 51721 27.24 184608 46550 25.2210 CHICKMAGALUR 329269 37330 11.34 295920 33075 11.1811 CHITRADURGA 481430 93170 19.35 429980 82241 19.1312 D.KANNADA 157926 71975 45.58 131077 70367 53.6813 DAVANGERE 460772 220971 47.96 392179 157098 40.0614 DHARWAD 498892 73821 14.80 310067 50710 16.3515 GADAG 458269 70576 15.40 359704 67576 18.7916 GULBARGA 1427097 251296 17.61 1194669 201680 16.8817 HASSAN 448168 116806 26.06 365692 92775 25.3718 HAVERI 423526 85285 20.14 364625 73522 20.1619 KODAGU 178479 4892 2.74 165035 4700 2.8520 KOLAR 187541 37659 20.08 179588 29706 16.5421 KOPPAL 469041 160641 34.25 358966 112951 31.4722 MANDYA 303574 174529 57.49 253321 140156 55.3323 MYSORE 523515 184050 35.16 338186 159230 47.0824 RAICHUR 651483 285481 43.82 511074 193168 37.8025 RAMANAGARA 172380 42368 24.58 167052 41543 24.8726 SHIMOGA 255854 160108 62.58 218083 132040 60.5527 TUMKUR 684415 185167 27.05 615074 161404 26.2428 UDUPI 123474 33481 27.12 101318 32966 32.5429 U.KANNADA 124996 28729 22.98 114298 27604 24.15
12368443 3942199 31.87 10195088 3233493 31.72 STATE
ANNEXURE - 4
DISTRICTWISE PERCENTAGE OF AREA SOWN TO AREA IRRIGATED, 2008-09
District Sown Irrigated Sown Irrigated
33

(Area in Hectares)Sl.No.
Gross Net Gross Net Gross Net1 2 3 4 7 8 9 101 BAGALKOT 52242 52242 811 811 14190 117642 BANGALORE(U) - - 485 348 - -3 BANGALORE(R) - - 128 128 55 554 BELGAUM 105165 98364 2095 2095 132465 1188605 BELLARY 122860 83692 2996 2343 8392 50996 BIDAR 1973 1973 973 923 27532 258987 BIJAPUR 81290 69978 2020 2020 102985 884478 CHAMARAJANAGAR 13700 12940 9705 9112 7211 65629 CHIKKABALLAPURA - - - - - -
10 CHICKMAGALUR 7044 4194 10001 9972 617 57711 CHITRADURGA 5292 4708 596 596 - -12 D.KANNADA - - - - 41129 4057813 DAVANGERE 106860 58458 1821 1571 429 42914 DHARWAD 54971 35362 401 383 - -15 GADAG 21987 18987 823 823 887 88716 GULBARGA 185104 140510 3209 3209 29440 2827917 HASSAN 39820 35725 42252 32501 1504 101018 HAVERI 5155 5155 2160 2063 - -19 KODAGU 2481 2481 352 352 116 11620 KOLAR - - - - - -21 KOPPAL 75441 44490 1117 1117 - -22 MANDYA 130376 102806 23018 20799 8437 715723 MYSORE 121150 108702 25969 20780 23254 1916724 RAICHUR 216590 142073 2354 2324 20335 1465525 RAMANAGARA 2147 2117 32 32 - -26 SHIMOGA 46860 33733 64737 59955 6079 445227 TUMKUR 3868 2648 29524 25578 1074 105628 UDUPI - - 1252 1252 22066 2171229 U.KANNADA - - 5175 4960 9593 9483
1402376 1061338 234006 206047 457790 406243 (Continued)
STATE
District
ANNEXURE - 5
SOURCEWISE AREA IRRIGATED IN KARNATAKA, 2008-09
Gross / Net area irrigated by (in Hectares)Government Canals Tanks Wells
34
(Area in Hectares)Sl.
No.
Gross Net Gross Net Gross Net Gross Net1 2 11 12 13 14 15 16 17 181 BAGALKOT 102671 85990 2708 2708 115000 98348 287622 2518632 BANGALORE(U) 11730 10118 - - - - 12215 104663 BANGALORE(R) 28931 24571 43 43 - - 29157 247974 BELGAUM 143376 128173 36893 33348 99161 85168 519155 4660085 BELLARY 90240 64734 47606 30138 9167 5707 281261 1917136 BIDAR 19540 18165 329 294 850 768 51197 480217 BIJAPUR 103074 78734 - - 28540 22754 317909 2619338 CHAMARAJANAGAR 42495 38500 500 500 16 16 73627 676309 CHIKKABALLAPURA 51721 46550 - - - - 51721 46550
10 CHICKMAGALUR 10606 9697 320 190 8742 8445 37330 3307511 CHITRADURGA 87282 76937 - - - - 93170 8224112 D.KANNADA 9932 9715 2270 2257 18644 17817 71975 7036713 DAVANGERE 91790 80740 20071 15900 - - 220971 15709814 DHARWAD 18436 14952 - - 13 13 73821 5071015 GADAG 30341 30341 197 197 16341 16341 70576 6757616 GULBARGA 22682 20050 5353 4615 5508 5017 251296 20168017 HASSAN 31533 22341 175 175 1522 1023 116806 9277518 HAVERI 58054 50033 914 910 19002 15361 85285 7352219 KODAGU 972 872 55 55 916 824 4892 470020 KOLAR 37659 29706 - - - - 37659 2970621 KOPPAL 81478 64739 1340 1340 1265 1265 160641 11295122 MANDYA 7539 5802 470 470 4689 3122 174529 14015623 MYSORE 13319 10223 358 358 - - 184050 15923024 RAICHUR 30679 22885 15523 11231 - - 285481 19316825 RAMANAGARA 37797 37002 122 122 2270 2270 42368 4154326 SHIMOGA 30707 22836 5831 5610 5894 5454 160108 13204027 TUMKUR 150701 132122 - - - - 185167 16140428 UDUPI 413 413 2981 2820 6769 6769 33481 3296629 U.KANNADA 3048 2659 688 688 10225 9814 28729 27604
1348746 1139600 144747 113969 354534 306296 3942199 3233493 STATE
ANNEXURE - 5
SOURCEWISE AREA IRRIGATED IN KARNATAKA, 2008-09
District
Gross / Net area irrigated by (in Hectares)
Tube / Bore Wells Lift Irrigation Other sources Total
35

36
10.60
9.91
2.06 2.08
4.064.34
11.40 10.79
1.14 1.28
3.06 2.91
0.00
2.00
4.00
6.00
8.00
10.00
12.00
Canals Tanks Wells Tube/Borewells Lift irrigation Other sources
BAR CHART SHOWING SOURCEWISE NET AREA IRRIGATED FOR THE YEAR
2008-09 & 2007-08
2008-09 2007-08
ANNEXURE -5.1.1
Are
a (la
kh h
ecta
res)

37
14.02
12.92
2.34 2.34
4.58
4.83
13.4912.89
1.45 1.60
3.55 3.31
0.00
2.00
4.00
6.00
8.00
10.00
12.00
14.00
16.00
Canals Tanks Wells Tube/Borewells Lift irrigation Other sources
BAR CHART SHOWING SOURCEWISE GROSS AREA IRRIGATED FOR THE YEAR 2008-09 & 2007-08
2008-09 2007-08
ANNEXURE - 5.1.2 A
rea
(lakh
hec
tare
s)

ANNEXURE - 6
PERCENTAGE OF AREA IRRIGATED BY DIFFERENT SOURCES, 2008-09 Sl Net Area Irrigated Gross Area IrrigatedNo. Canals Tanks Wells Borewells Lift Irrigation Others Canals Tanks Wells Borewells Lift Irrigation Others1 2 3 4 5 6 7 8 9 10 11 12 13 141 BAGALKOT 20.74 0.32 4.67 34.14 1.08 5.92 18.16 0.28 4.93 35.70 0.94 39.982 BANGALORE(U) 0.00 3.33 0.00 96.67 0.00 0.00 0.00 3.97 0.00 96.03 0.00 0.003 BANGALORE(R) 0.00 0.52 0.00 99.09 0.17 0.00 0.00 0.44 0.19 99.22 0.15 0.004 BELGAUM 21.11 0.45 25.51 27.50 7.16 18.28 20.26 0.40 25.52 27.62 7.11 19.105 BELLARY 43.65 1.22 2.66 33.77 15.72 35.99 43.68 1.07 2.98 32.08 16.93 3.266 BIDAR 4.11 1.92 53.93 37.83 0.61 15.89 3.85 1.90 53.78 38.17 0.64 1.667 BIJAPUR 26.72 0.77 33.77 30.06 0.00 0.00 25.57 0.64 32.39 32.42 0.00 8.988 CHAMARAJANAGAR 19.13 13.47 9.70 56.93 0.74 0.00 18.61 13.18 9.79 57.72 0.68 0.009 CHIKKABALLAPURA 0.00 0.00 0.00 100.00 0.00 0.00 0.00 0.00 0.00 100.00 0.00 0.00
10 CHICKMAGALUR 12.68 30.15 0.00 29.32 0.00 0.00 18.87 26.79 0.00 28.41 0.00 0.0011 CHITRADURGA 0.00 0.00 0.00 93.55 0.00 0.00 5.68 0.00 0.00 93.68 0.00 0.0012 D.KANNADA 0.00 0.00 57.67 13.81 3.21 25.32 0.00 0.00 57.14 13.80 3.15 25.9013 DAVANGERE 37.21 1.00 0.00 51.39 0.00 0.00 48.36 0.00 0.00 41.54 0.00 0.0014 DHARWAD 69.73 0.76 0.00 29.49 0.00 0.00 74.47 0.54 0.00 24.97 0.00 0.0215 GADAG 28.10 1.22 1.31 44.90 0.29 0.94 31.15 1.17 1.26 42.99 0.28 23.1516 GULBARGA 69.67 1.59 14.02 9.94 2.29 3.11 73.66 1.28 11.72 9.03 2.13 2.1917 HASSAN 38.51 35.03 0.00 24.08 0.19 0.55 34.09 36.17 0.00 27.00 0.15 1.3018 HAVERI 7.01 2.81 0.00 68.05 1.24 20.48 6.04 2.53 0.00 68.07 1.07 22.2819 KODAGU 0.00 7.49 0.00 18.55 0.00 0.00 50.72 7.20 0.00 19.87 0.00 0.0020 KOLAR 0.00 0.00 0.00 100.00 0.00 0.00 0.00 0.00 0.00 100.00 0.00 0.0021 KOPPAL 39.39 0.99 0.00 57.32 1.19 2.53 46.96 0.70 0.00 50.72 0.83 0.7922 MANDYA 73.35 14.84 5.11 4.14 0.34 0.00 74.70 13.19 4.83 4.32 0.27 0.0023 MYSORE 68.27 13.05 12.04 6.42 0.22 0.00 65.82 14.11 12.63 7.24 0.19 0.0024 RAICHUR 73.55 1.20 7.59 11.85 5.81 7.66 75.87 0.82 7.12 10.75 5.44 0.0025 RAMANAGARA 5.10 0.08 0.00 89.07 0.00 0.00 5.07 0.08 0.00 89.21 0.00 0.0026 SHIMOGA 0.00 45.41 3.37 17.29 4.25 14.52 29.27 40.43 3.80 19.18 3.64 3.6827 TUMKUR 1.64 15.85 0.65 81.86 0.00 0.00 2.09 15.94 0.58 81.39 0.00 0.0028 UDUPI 0.00 3.80 65.86 1.25 8.55 20.53 0.00 3.74 65.91 1.23 8.90 20.2229 U.KANNADA 0.00 17.97 34.35 9.63 2.49 35.60 0.00 18.01 33.39 10.61 2.39 35.59
32.78 6.36 12.55 35.21 3.52 9.90 35.57 5.94 11.61 34.21 3.67 8.99
District
STATE
38

ANNEXURE - 7
Sl Food Crops Non-Food Crops Total CroppedNo. Area % to Total % to State Area % to Total % to State Area
(in hects) Cropped Area Total (in hects) Cropped Area Total (in hects)1 2 3 4 5 6 7 8 91 BAGALKOT 447944 78.97 5.06 119313 21.03 3.40 5672572 BANGALORE(U) 39002 69.15 0.44 17397 30.85 0.50 563993 BANGALORE(R) 84023 64.87 0.95 45499 35.13 1.30 1295224 BELGAUM 788473 78.12 8.90 220824 21.88 6.29 10092975 BELLARY 382162 66.37 4.31 193625 33.63 5.52 5757876 BIDAR 337726 84.39 3.81 62456 15.61 1.78 4001827 BIJAPUR 634090 74.64 7.16 215410 25.36 6.14 8495008 CHAMARAJANAGAR 174652 75.76 1.97 55892 24.24 1.59 2305449 CHIKKABALLAPURA 125796 66.26 1.42 64058 33.74 1.82 189854
10 CHICKMAGALUR 187704 57.01 2.12 141565 42.99 4.03 32926911 CHITRADURGA 233767 48.56 2.64 247663 51.44 7.05 48143012 D.KANNADA 128775 81.54 1.45 29151 18.46 0.83 15792613 DAVANGERE 401137 87.06 4.53 59635 12.94 1.70 46077214 DHARWAD 332629 66.67 3.76 166263 33.33 4.74 49889215 GADAG 279823 61.06 3.16 178446 38.94 5.08 45826916 GULBARGA 1173848 82.25 13.25 253249 17.75 7.21 142709717 HASSAN 309723 69.11 3.50 138445 30.89 3.94 44816818 HAVERI 281026 66.35 3.17 142500 33.65 4.06 42352619 KODAGU 70096 39.27 0.79 108383 60.73 3.09 17847920 KOLAR 143568 76.55 1.62 43973 23.45 1.25 18754121 KOPPAL 312193 66.56 3.52 156848 33.44 4.47 46904122 MANDYA 260435 85.79 2.94 43139 14.21 1.23 30357423 MYSORE 364240 69.58 4.11 159275 30.42 4.54 52351524 RAICHUR 414396 63.61 4.68 237087 36.39 6.75 65148325 RAMANAGARA 132483 76.86 1.50 39897 23.14 1.14 17238026 SHIMOGA 238678 93.29 2.69 17176 6.71 0.49 25585427 TUMKUR 366706 53.58 4.14 317709 46.42 9.05 68441528 UDUPI 102372 82.91 1.16 21102 17.09 0.60 12347429 U.KANNADA 110384 88.31 1.25 14612 11.69 0.42 124996
8857851 71.62 100.00 3510592 28.38 100.00 12368443
District
DISTRICTWISE FOOD AND NON-FOOD CROPS DURING 2008-09
STATE
39

ANNEXURE - 8
Sl. Cereals and Minor Millets Pulses FoodgrainsNo. Area Production Yield Area Production Yield Area Production Yield
(in hects) (Tonnes) (Kgs/Hect) (in hects) (Tonnes) (Kgs/Hect) (in hects) (Tonnes) (Kgs/Hect)1 2 3 4 5 6 7 8 9 10 111 BAGALKOT 255465 477168 1966 86635 28590 347 342100 505758 15562 BANGALORE(U) 28114 70937 2656 4383 3179 763 32497 74116 24013 BANGALORE(R) 56813 159950 2964 8348 7186 906 65161 167136 27004 BELGAUM 464273 772542 1752 97100 34889 378 561373 807431 15145 BELLARY 291090 758288 2742 58039 34698 629 349129 792986 23916 BIDAR 101533 122920 1274 200488 83182 437 302021 206102 7187 BIJAPUR 370404 421525 1198 187466 100921 567 557870 522446 9868 CHAMARAJANAGAR 99441 203519 2154 38323 16354 449 137764 219873 16809 CHIKKABALLAPURA 83257 218655 2764 16872 10694 667 100129 229349 2411
10 CHICKMAGALUR 118103 224843 2004 25365 14058 583 143468 238901 175311 CHITRADURGA 178009 195908 1158 36784 19333 553 214793 215241 105512 D.KANNADA 55382 133870 2544 3390 1302 404 58772 135172 242113 DAVANGERE 349114 949657 2863 9893 5727 609 359007 955384 280114 DHARWAD 162866 200204 1294 74144 44227 628 237010 244431 108615 GADAG 136327 162302 1253 98979 22924 244 235306 185226 82916 GULBARGA 478131 607594 1338 667839 337109 531 1145970 944703 86817 HASSAN 172303 373752 2283 29758 11206 396 202061 384958 200518 HAVERI 227103 447063 2072 18215 5412 313 245318 452475 194219 KODAGU 39563 102130 2717 532 193 382 40095 102323 268620 KOLAR 68790 112357 1719 14674 10546 757 83464 122903 155021 KOPPAL 235714 418388 1868 63777 20683 341 299491 439071 154322 MANDYA 174965 403950 2430 36319 16027 465 211284 419977 209223 MYSORE 225774 592675 2763 115311 45913 419 341085 638588 197124 RAICHUR 313274 688260 2313 92873 31678 359 406147 719938 186625 RAMANAGARA 86864 161871 1962 19840 14247 756 106704 176118 173726 SHIMOGA 189675 536180 2976 2946 1305 466 192621 537485 293727 TUMKUR 264317 363982 1450 69992 49400 743 334309 413382 130228 UDUPI 61557 140683 2406 8081 3816 497 69638 144499 218429 U.KANNADA 83911 136791 1716 2105 671 336 86016 137462 1682
5372132 10157964 1990 2088471 975470 492 7460603 11133434 1571
District
STATE
AREA, PRODUCTION AND PRODUCTIVITY DURING 2008-09
40

ANNEXURE - 8
Area Production Yield Area Production Yield
1 2 12 13 14 15 16 171 BAGALKOT 117522 70342 630 2466 5901 4282 BANGALORE(U) 1364 684 528 0 0 03 BANGALORE(R) 2766 1872 712 0 0 04 BELGAUM 172925 111784 680 20041 38609 3455 BELLARY 169194 62303 388 19627 36344 3316 BIDAR 59666 39303 693 1384 1270 1647 BIJAPUR 208821 75797 382 5553 12932 4178 CHAMARAJANAGAR 37762 24689 688 443 423 1719 CHIKKABALLAPURA 50275 34346 719 0 0 010 CHICKMAGALUR 25475 14678 606 1202 1364 20311 CHITRADURGA 200005 56424 297 4372 7054 28912 D.KANNADA 615 314 537 0 0 013 DAVANGERE 37623 25751 720 8051 15797 35114 DHARWAD 93053 56632 641 71221 118158 29715 GADAG 134988 53831 420 41834 95198 40716 GULBARGA 200716 91634 481 50976 185757 65217 HASSAN 24368 13162 569 815 1303 28618 HAVERI 46489 29549 669 91934 163838 31919 KODAGU 121 102 887 0 0 020 KOLAR 13924 8228 622 0 0 021 KOPPAL 145041 60239 437 10878 15302 25222 MANDYA 9220 6864 784 0 0 023 MYSORE 17928 10353 608 43629 34863 14324 RAICHUR 209250 94439 475 26561 73442 49525 RAMANAGARA 13927 9106 688 0 0 026 SHIMOGA 3701 5358 1524 3924 8596 39227 TUMKUR 175990 61208 366 668 2529 67828 UDUPI 2229 4219 1992 0 0 029 U.KANNADA 3220 4343 1420 3445 6391 332
2178178 1027554 497 409024 825071 361
AREA, PRODUCTION AND PRODUCTIVITY DURING 2008-09
(Kgs/Hect)DistrictSl. No.
Oilseeds Cotton
(Tonnes) (Kgs/Hect) (in hects)(in hects)
STATE
(Bales of 170 Kgs in lint form)
41

ANNEXURE - 8
Sl.No. Area(H) Production Yield Area Production Yield
(in hects) (Tonnes) (Tonnes/Hect) (in hects) (Tonnes) (Kgs/Hect)1 2 18 19 20 21 22 231 BAGALKOT 56598 5860723 109 0 0 02 BANGALORE(U) 0 0 0 0 0 03 BANGALORE(R) 93 8040 91 0 0 04 BELGAUM 114181 9654004 89 22366 24902 11725 BELLARY 1932 249614 136 215 109 5356 BIDAR 24616 1426497 61 0 0 07 BIJAPUR 20604 1096133 56 0 0 08 CHAMARAJANAGAR 8665 716162 87 161 82 5359 CHIKKABALLAPURA 0 0 0 0 0 0
10 CHICKMAGALUR 688 39216 60 38 19 53511 CHITRADURGA 0 0 0 356 181 53512 D.KANNADA 19 1643 91 0 0 013 DAVANGERE 2679 285046 112 389 198 53514 DHARWAD 2869 177161 65 55 28 53515 GADAG 178 15388 91 1 1 53516 GULBARGA 7944 407527 54 0 0 017 HASSAN 2659 267761 106 9180 7483 85818 HAVERI 2237 110508 52 65 33 53519 KODAGU 0 0 0 277 141 53520 KOLAR 0 0 0 0 0 021 KOPPAL 417 36050 91 0 0 022 MANDYA 22257 2643019 125 0 0 023 MYSORE 5588 637032 120 73995 21229 30224 RAICHUR 0 0 0 922 469 53525 RAMANAGARA 936 86252 97 0 0 026 SHIMOGA 2625 261844 105 35 18 53527 TUMKUR 2063 178346 91 19 10 53528 UDUPI 10 864 91 0 0 029 U.KANNADA 1242 107371 91 65 33 535
281100 24266201 91 108139 54936 535
AREA, PRODUCTION AND PRODUCTIVITY DURING 2008-09
STATE
DistrictSugarcane Tobacco
42
43
BAR CHART SHOWING AREA OF CEREALS & MINOR MILLETS, PULSES, FOODGRAINS AND OILSEEDS FOR THE YEAR 2008-09 & 2007-08
53.7
20.9 21.8
54.8
23.9
78.7
22.8
74.6
0.0
10.0
20.0
30.0
40.0
50.0
60.0
70.0
80.0
90.0
Cereal and Minor Millets Pulses Foodgrains Oilseeds
Are
a (la
kh h
ecta
res)
2008-09 2007-08
ANNEXURE - 8.1.1
44
BAR CHART SHOWING THE PRODUCTION OF CEREALS & MINOR MILLETS, PULSES, FOODGRAINS ANDOILSEEDS FOR THE YEAR 2008-09 & 2007-08
101.6
9.8 10.3
108.2
12.3 14.2
111.3
120.5
0.0
20.0
40.0
60.0
80.0
100.0
120.0
140.0
Cereal and Minor Millets Pulses Foodgrains Oilseeds
Prod
uctio
n(la
kh to
nnes
)
2008-09 2007-08
ANNEXURE - 8.1.2

45
BAR CHART SHOWING PRODUCTIVITY OF CEREALS & MINOR MILLETS, PULSES, FOODGRAINS AND OILSEEDS FOR THE YEAR 2008-09 & 2007-08
1990
492
1571
497
2075
544
1611
656
0
500
1000
1500
2000
2500
Cereal and Minor Millets Pulses Foodgrains Oilseeds
Prod
uctiv
ity(K
gs p
er h
ecta
res)
2008-09 2007-08
ANNEXURE - 8.1.3

(Rupees & Paise)Sl. DRYLAND WETLAND GARDENLANDNo. CAR- BLACK A B C D A B C D A B C D
PENTER SMITH M F M F M F M F M F M F M F M F M F M F M F M F1 2 3 4 5 6 7 8 9 10 11 12 13 14 15 16 17 18 19 20 21 22 23 24 25 26 27 28 29
1 BAGALKOT 115.01 120.19 110.00 224.93 61.25 88.85 52.93 78.94 49.60 63.82 40.69 61.11 38.17 221.29 55.62 92.95 53.90 70.00 50.00 100.00 67.50
2 BANGALORE(U) 200.00 143.33 126.67 120.70 77.96 97.83 78.07 114.42 73.89 94.64 74.55 116.65 78.49 94.75 75.17 87.25 76.55
3 BANGALORE(R) 150.00 100.00 125.00 131.00 95.00 130.42 88.75 125.87 98.29 121.88 89.64 133.33 127.16 100.53 134.18 97.36 144.55 98.99
4 BELGAUM 95.00 80.00 90.00 64.43 32.00 61.02 38.90 50.00 30.00 55.00 30.00 70.43 31.67 55.76 38.85 50.00 30.00 66.15 31.42 59.52 37.14 50.00 30.00 55.00 30.00
5 BELLARY 120.00 100.00 75.00 83.33 52.00 57.97 40.40 62.50 52.50 96.62 55.58 49.65 40.74 64.17 50.83 100.00 96.14 52.43 50.46 45.25 46.67 36.00 100.006 BIDAR 100.00 100.00 100.00 179.31 30.63 69.40 34.20 60.00 30.00 125.21 30.45 68.83 33.50 60.00 30.00 125.21 30.45 68.83 33.50 60.00 30.007 BIJAPUR 104.17 96.00 84.08 170.58 77.63 100.37 60.96 94.25 92.00 153.89 74.73 97.58 58.67 112.84 75.89 97.51 59.018 CHAMARAJANAGAR 79.23 60.17 41.00 113.44 64.55 86.17 63.72 66.67 77.92 56.81 101.94 57.29 86.17 63.40 77.92 56.81 99.31 56.46 91.49 67.88 77.71 55.429 CHIKKABALLAPURA 121.67 83.33 71.67 192.33 113.00 127.50 102.50 93.64 75.45 90.00 80.00 192.20 112.44 119.27 97.45 76.67 63.33 180.81 109.33 117.45 95.64 76.67 63.33 80.00
10 CHICKMAGALUR 102.08 100.00 74.58 86.18 73.00 60.42 59.17 49.17 87.50 77.50 62.86 86.18 72.87 60.45 86.67 60.0011 CHITRADURGA 151.96 122.28 100.53 109.05 60.20 85.20 58.43 89.77 64.36 111.94 45.91 81.00 50.34 79.44 68.75 131.25 100.00 104.65 43.50 72.51 44.11 93.50 62.50 143.02 91.21
12 D.KANNADA 220.83 172.92 125.42 175.00 133.33 76.67 168.75 135.42 77.08 250.00 162.08 84.5813 DAVANGERE 132.42 111.92 96.17 87.69 49.57 73.11 57.33 79.25 60.50 92.98 54.47 86.03 49.60 74.72 58.30 78.57 63.71 90.88 52.85 93.43 52.64 71.88 51.86 89.00 50.00 92.27 58.01
14 DHARWAD 85.00 85.00 85.00 116.36 51.43 60.31 50.42 85.00 85.00 109.47 53.89 62.98 51.38 60.00
15 GADAG 106.36 123.18 76.36 142.80 46.67 60.76 47.08 50.00 40.00 142.86 46.67 60.30 47.08 50.00 40.0016 GULBARGA 82.92 78.08 72.50 105.24 40.76 77.11 41.05 62.58 39.55 57.00 35.00 105.24 40.76 77.11 41.05 62.58 39.55 57.00 35.00 105.24 40.78 77.11 41.05 62.58 39.55 57.00 35.0017 HASSAN 150.00 116.67 83.33 90.76 60.00 70.00 60.00 50.00 40.00 60.00 81.23 60.28 70.00 60.00 70.00 70.00 60.00 72.50
18 HAVERI 83.33 72.50 46.67 130.39 84.93 81.67 75.42 73.75 68.75 129.42 87.33 80.13 74.22 131.04 87.33 80.22 74.39 78.33 73.3319 KODAGU 212.50 181.25 112.50 148.61 120.00 106.94 106.94 50.00 148.61 120.00 115.00 112.00 200.00 112.14 112.14 152.92 145.56
20 KOLAR 95.00 82.00 76.36 187.50 60.00 85.00 70.00 52.78 52.78 152.01 73.13 94.31 75.15 52.78 52.78 124.69 63.33 81.67 62.00 52.78 52.78
21 KOPPAL 94.58 70.42 68.33 210.46 43.81 54.44 37.00 50.42 35.83 60.00 182.29 42.50 58.33 36.94 50.00 35.71 186.88 43.89 58.33 36.67 50.00 35.71
22 MANDYA 138.64 116.82 60.00 159.55 120.75 86.97 53.03 115.56 50.00 100.00 50.00 88.33 53.06 117.14 100.00 50.00 117.14 120.00
23 MYSORE 131.25 125.00 81.25 136.94 81.25 121.67 77.08 64.58 150.00 125.56 61.00 121.53 79.17 120.83 68.75 124.31 50.0024 RAICHUR 131.91 80.71 67.86 90.91 68.38 100.32 71.61 66.80 48.40 95.55 72.55 97.99 72.24 69.50 51.50 90.84 66.60 98.02 73.22 69.50 51.50 102.89 65.18
25 RAMANAGARA 70.17 61.83 56.50 108.99 63.30 57.32 49.43 42.50 36.70 98.45 65.44 63.56 57.28 46.67 41.17 95.35 67.43 66.29 59.53 48.67 42.8326 SHIMOGA 105.83 91.84 82.98 58.04 43.03 54.44 43.12 54.58 47.37 37.22 65.90 46.85 67.30 50.11 56.82 45.00 99.17 77.08 73.98 48.35 67.63 47.17 38.67 24.00 97.02 56.38
27 TUMKUR 100.00 100.00 75.00 100.42 80.00 96.25 76.25 92.50 73.33 96.25 76.25 100.00 79.17 92.50 73.61 96.25 76.25 69.17 59.17 100.00 79.1728 UDUPI 153.75 120.75 125.00 113.33 110.00 70.00 45.00 35.00 113.33 116.36 77.36 100.00 126.77 66.3929 U.KANNADA 157.95 116.14 116.00 139.42 86.25 87.92 83.56 60.00 60.00 139.17 86.25 87.92 83.56 60.00 60.00 100.00 80.00 103.33 72.70
123.85 103.87 86.41 130.27 67.86 86.04 62.94 64.26 52.05 79.57 51.05 116.56 63.48 85.55 63.12 61.23 48.02 100.74 66.82 114.66 61.75 84.00 62.77 75.15 44.81 102.76 72.94Note: A = Labourers at the time of ploughing, digging, sowing, interculturing, watering &uprooting. B = Labourers at the time of manuring, transplanting, weeding, reaping &picking. C = Activities like cattle, sheep & goat grazing. D = Harvesting in areca & coconuts, peeling the coconuts, arecanuts, trimming & spraying in areca & coconut gardens and any other operations relating to arecanut & coconut gardens M = Male, F = Female
STATE
District
ANNEXURE - 9AGRICULTURE LABOURERS WAGES - STATE AVERAGE FOR THE YEAR 2008-09
SKILLED LABOURMOCHI
46
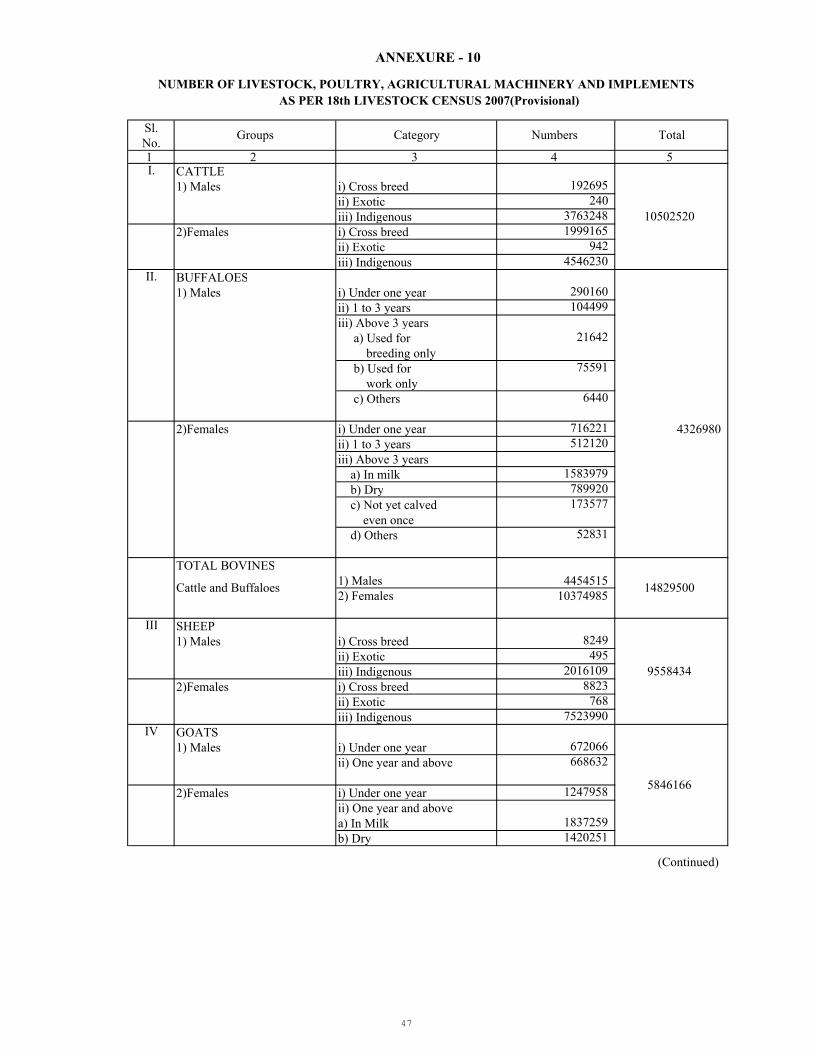
Sl.No.1 2 3 4 5I. CATTLE
1) Males i) Cross breed 192695ii) Exotic 240iii) Indigenous 3763248
2)Females i) Cross breed 1999165ii) Exotic 942iii) Indigenous 4546230
II. BUFFALOES1) Males i) Under one year 290160
ii) 1 to 3 years 104499iii) Above 3 years a) Used for 21642 breeding only b) Used for 75591 work only c) Others 6440
2)Females i) Under one year 716221 4326980ii) 1 to 3 years 512120iii) Above 3 years a) In milk 1583979 b) Dry 789920 c) Not yet calved 173577 even once d) Others 52831
TOTAL BOVINES1) Males 44545152) Females 10374985
III SHEEP1) Males i) Cross breed 8249
ii) Exotic 495iii) Indigenous 2016109
2)Females i) Cross breed 8823ii) Exotic 768iii) Indigenous 7523990
IV GOATS1) Males i) Under one year 672066
ii) One year and above 668632
2)Females i) Under one year 1247958ii) One year and abovea) In Milk 1837259b) Dry 1420251
(Continued)
10502520
ANNEXURE - 10
NUMBER OF LIVESTOCK, POULTRY, AGRICULTURAL MACHINERY AND IMPLEMENTS AS PER 18th LIVESTOCK CENSUS 2007(Provisional)
Groups Category Numbers Total
14829500
9558434
5846166
Cattle and Buffaloes
47

Sl.No.1 2 6 7 8V HORSES AND PONIES
1) Males i) Under three years 1867ii) 3 years and above 4420
2) Females i) Under three year 1517ii) 3 years and above 3298
VI MULES i) Under three year 75ii) 3 years and above 66
VII DONKEYS i) Male 12205ii) Female 13879
VII CAMELS i) Male 167ii) Female 34
XI PIGS i) Cross breed 3680ii) Exotic 23236iii) Indigenous 253774
X POULTRY i) Desi poultry 10327160ii) Improved poultry 31737582iii) Others 3080
XI AGRICULTURALIMPLEMENTS &MACHINERY1) Hand operated i) Seed-cum-fertiliser drill N.A implements ii) Chaff cutters 571932
iii) Sprayers and dusteers N.Aiv) Rice transplanter N.A
2) Animal operated i) Wooden plougs 1320088 implements ii) Triphalli(cultivator) 1081989
iii) Discharrow 951389iv) Seed-cum-fertiliser drill 1019162v) Levelling karah earth (Leveller) 628961
Source: Animal Husbandary and Veternary Sciences Department.
280690
42067822
11102
141
26084
201
571932
5001589
ANNEXURE - 10
Groups Category Numbers Total
NUMBER OF LIVESTOCK, POULTRY, AGRICULTURAL MACHINERY AND IMPLEMENTS AS PER LIVESTOCK CENSUS 2007(Provisional)
48