Embed Size (px)
Citation preview
Public Service Commission
February 2007
Report on an Audit of Government’s
Poverty Reduction Programmes and Projects
Vision
The Public Service Commission is an independent and impartial body created by the Constitution, 1996, to enhance excellence in governance within the Public Service by promoting a professional and ethical environment and adding value to a public administration that is accountable, equitable, effi cient, effective, corruption-free and responsive to the needs of the people of South Africa.
Mission
The Public Service Commission aims to promote the constitutionally enshrined democratic principles and values of the Public Service by investigating, monitoring, evaluating, communicating and reporting on public administration. Through research processes, it will ensure the promotion of excellence in governance and the delivery of affordable and sustainable quality services.
Published in the Republic of South Africa by:
THE PUBLIC SERVICE COMMISSIONCommission House
Cnr. Hamilton & Ziervogel StreetsArcadia, 0083
Private Bag x121Pretoria, 0001
Tel. (012) 352-1000Fax (012) 325-8382
Website. www.psc.gov.za
National Anti-Corruption Hotline Number for the Public Service:0800 701 701 (Toll-Free)
Compiled by Branch: Monitoring and Evaluation
Distribution by: Directorate: Communication and Information Services
ISBN: 0-621-37006-1RP: 11/2007
Report on an Audit of Government’s Poverty Reduction Programmes and Projects
i
ii
FOREWORDWith the advent of a democratic South Africa in 1994, one of the key priorities was to eradicate poverty. The White Paper on Reconstruction and Development, 1994, focused mainly on improving the standard of living and quality of life for all South Africans and to create a sustainable democracy. The White Paper prioritised poverty eradication, access to land and the provision of basic services to people within a peaceful and stable society characterised by equitable economic growth. Now, twelve years later, Government is still challenged by poverty and the need to reduce it by half by 2014 in line with its commitments to the Millennium Development Goals (MDGs).
Apart from the social security programmes which are currently major instruments for redressing poverty, both national and provincial departments have been implementing a broad range of interventions to address poverty. Although these programmes have largely been allocating funds to the neediest areas in the country, the impact of some of them has still been limited, especially amongst the ultra poor. Concerns that have been raised about these programmes include poor coordination, poor integration of service delivery, lack of proper processes, exclusionary practices and a lack of monitoring and evaluation.
Evidence from “Towards a Ten Year Review” further stressed the need to coordinate all Government’s divergent developmental initiatives under one framework or “Social Compact” (PCAS, 2003).
The PSC therefore decided to undertake a series of evaluations of the success of these poverty reduction programmes. In preparation for such evaluations the PSC fi rst undertook an audit of poverty reduction programmes and projects (as a fi rst phase of the project). The aim of the audit was to gain a better understanding of the defi nitions and criteria used to describe poverty and the interventions implemented to address it. The audit also aimed at developing an integrated database of key poverty reduction programmes and projects implemented at national and provincial levels of government.
iii
The database that has consequently been developed is by no means encompassing of all Government’s poverty reductions programmes. A lack of capacity, systems, and norms and standards for the implementation of these programmes, has inhibited this objective to be accomplished. Despite this, the database will suffi ce for purposes of identifying a realistic and representative sample of programmes and projects to evaluate in the second phase of this study. If further developed and maintained it would, apart from providing a complete list of Government’s initiatives aimed at poverty reduction, also facilitate better reporting on these programmes.
This fi rst phase report now puts the PSC in a position to commence with a series of evaluations of the success of these programmes and projects.
I trust that this Audit of Government’s Poverty Reduction Programmes and Projects will contribute to further discussion amongst stakeholders about the need for a national strategy as well as norms and standards for the implementation of poverty reduction programmes that has been identifi ed. Only when these programmes are conducted in a comprehensive, coherent and co-ordinated framework will Government succeed in achieving its development goals.
PROF. SS SANGWENICHAIRPERSON: PUBLIC SERVICE COMMISSION
Contents FOREWORD iiGLOSSARY OF TERMS viiEXECUTIVE SUMMARY viii
1. INTRODUCTION 1 1.1 Background 2 1.2 Purpose and objectives 3 1.3 Mandate of the Public Service Commission 3 1.4 Scope 3 1.5 Methodology 4 1.5.1 Defi nition of poverty relief programmes and projects and
criteria for the classifi cation of poverty relief projects 4 1.5.2 Developing a database on poverty reduction programmes and projects 4 1.5.2.1 Design of the database 4 1.5.2.2 Populating the database on government’s poverty reduction related programmes and projects 5 1.6 Resources available to the project team 6 1.7 Limitations 6
2. FINDINGS FROM THE WORKSHOPS HELD WITH NATIONAL AND PROVINCIAL DEPARTMENTS 9
3. DEFINITION OF POVERTY REDUCTION PROGRAMMES AND PROJECTS AND THE CRITERIA FOR THE CLASSIFICATION OF THESE PROGRAMMES AND PROJECTS 13 3.1 A defi nition of poverty 14 3.2 Defi nitions of activities aimed at addressing poverty 15 3.3 Brief overview of South Africa’s anti-poverty ‘strategy’ 16 3.4 Proposed defi nition of ‘poverty reduction’ 17 3.5 Proposed systems of categorization 17 3.6 Thinking ahead to evaluation 19
4. DEVELOPING THE DATABASE ON POVERTY REDUCTION PROGRAMMES AND PROJECTS 21 4.1 Design of the programme and project database 22 4.2 Populating the programme and project database 29
iv
4.2.1 Accessing information on programmes and projects 29 4.2.2 Capturing of programme and project data received into the database 30 4.2.3 Mapping the programmes and projects captured in the database 37 4.3 Matching the programmes and projects to the poverty reduction categories 39
5. CONCLUSIONS AND RECOMMENDATIONS 43 5.1 Conclusions 44 5.2 Recommendations 45 5.2.1 Defi nitions and categories 45 5.2.2 Development of a database 45SOURCES CONSULTED 47
LIST OF FIGURES AND TABLESFigures:Figure 1: Data Flow diagram 23Figure 2: Distribution of poverty relief projects of the Department of Environmental Affairs and Tourism 38Figure 3: Distribution of the projects of the Comprehensive Agricultural Support Programme
(CASP) of the Department of Agriculture 39Tables:Table 1: Categories of anti-poverty measures based on types of activities 18Table 2: Description of fi elds in programme database 24Table 3: Description of the fi elds in the project database 25Table 4: Description of fi elds in programme funder database 28Table 5: Description of fi elds in programme fi nancial database 28Table 6: Description of fi elds in programme document database 29Table 7: Projects integrated into database by province and source 32 Table 8: Analysis of projects by programme 35Table 9: Breakdown of projects in the database according to programme category 40Table 10: Summary of Budgets for poverty reduction projects, by programme type 40Table 11: Summary of the number of benefi ciaries of poverty reduction projects, by programme type 41Table 12: Project numbers by fi nancial year, in aggregate and by programme category 42
v
LIST OF ADDENDUMS:Addendum 1: Summary of Literature Review 51Addendum 2: Workshop Discussion Document 71Addendum 3: List of Departments that Attended the Workshop 74Addendum 4: Description of Fields in Database Design 81Addendum 5: Coding Table for Values in Database 87
vi
Glossary of TermsAGIS Agricultural Geographic Information SystemsAU African UnionCASP Comprehensive Agricultural Support ProgrammeCMIP Consolidated Municipal Infrastructure ProgrammeDBSA Development Bank of Southern AfricaDPLG Department of Provincial and Local GovernmentEPWP Expanded Public Works ProgrammeFAO Food and Agricultural OrganisationFSDP Free State Development ProgrammeFSGDS Free State Growth and Development StrategyGCIS Government Communications and Information SystemGIS Geographic Information SystemsGPS Global Positioning SystemsHSRC Human Sciences Research CouncilIDP Integrated Development PlanIDT Independent Development Trust IFAD International Fund for Agricultural DevelopmentIFSNP Integrated Food Security and Nutrition ProgrammeILO International Labour OrganizationISRDP Integrated Sustainable Rural Development ProgrammeLED Local Economic Development LEDF Local Economic Development FrameworkLRAD Land Redistribution for Agricultural DevelopmentMDG Millennium Development GoalsM&E Monitoring and evaluationMIG Municipal Infrastructure GrantMOS Measure of SizeNDA National Development AgencyNSDP National Spatial Development PerspectiveNSS National Statistical SystemOPSC Offi ce of the Public Service CommissionPCAS Policy Co-ordination and Advisory ServicesPDF Portable Document FormatPGS Provincial Growth StrategiesPoA Programme of ActionPPS Probability Proportional to SizeSLAG Settlement and Land Acquisition GrantUNDP United Nations Development ProgrammeUNFPA United Nations Population FundURP Urban Renewal Programme
vii
EXECUTIVE SUMMARY1. Background
The South African democratic government inherited a huge legacy of inequalities in 1994. Since then, it has been doing everything within its means to address these. It has for instance dramatically increased the proportion of funds being allocated to social related initiatives. This was in line with the thinking laid out in the White Paper on Reconstruction and Development in 1994 that proposed the need to address poverty, democratise and expand access to land and improve the imbalances in access to services and infrastructure as a means of improving the quality of life of all people. Now twelve years into our democracy, the reduction of poverty still remains one of the most serious challenges.
President Mbeki’s “three pillar formulation” is Government’s most recent portrayal of how it is to address the multi-dimensional nature of poverty and under-development in South Africa (Mbeki, 2004). This involves encouraging growth and development in the First Economy, increasing its potential to create jobs, implementing programmes and projects to address the challenges in the Second Economy and building a social security net to bring about poverty alleviation. To achieve the goals within this framework requires an improvement in the way the State operates. Poverty reduction programmes will have to be implemented more effectively to ensure that targeted communities, especially the poorest members, benefi t.
The Synthesis Report on the Implementation of Government Programmes, Towards a Ten Year Review (PCAS, 2003, p. 103), has further stressed the importance for Government to use an appropriate institutional framework in assessing the achievement of its developmental objectives. Evidence from the Review indicated that there is a defi nite need for a “framework of encompassing interest” or “Social Compact” that will coordinate and unite the divergent developmental activities and interests of both Government and its social partners around some common developmental objectives of the overarching “development project of the nation”. This framework will ensure that the State not only plays the role of an actor in providing services and helping create an appropriate environment for development, but also asserts its leadership role beyond the areas under its direct control. Such a framework will therefore contribute to improving the performance of both the formal and informal institutions of the State in realising the national development objectives.
Two of the Constitutional values governing public administration that the PSC must promote in terms of its mandate in sections 195 and 196 of the Constitution also relate directly to this primary government objective of reducing poverty, namely “Public administration must be development-oriented” and “People’s needs must be responded to …”.
viii
The PSC therefore decided to undertake a series of evaluations of the success of Government’s Poverty Reduction Programme. In preparation for such evaluations the PSC undertook an Audit of Government’s Poverty Reduction Programmes and Projects, as a fi rst phase of the project, towards the end of the 2004/2005 fi nancial year.
The aim of the Audit was to defi ne what are being regarded as poverty reduction programmes and projects and to categorise them, so that the universe of what programmes and projects to later include in the evaluation, could be defi ned. The purpose was to bring conceptual clarity and to categorise poverty programmes and projects because Government’s programme is comprehensive and covers a broad range of interventions. The second aim of the Audit was to design and populate a database containing basic information on key poverty reduction programmes and projects.
The conceptual work of the Audit and the database that is now available, will form the basis for the series of evaluations of these programmes and projects in the second phase of the project.
2. Methodology
A review of international and South African literature was done to get an understanding of the defi nitions used to describe the different types of poverty relief programmes and the criteria used to categorize them. Key informant interviews were also conducted with selected national government departments. The intention of the interviews was to get a perspective on how government offi cials defi ned poverty and what criteria they used to categorize the different programmes and projects into the different poverty types.
Before any information on the programmes and projects was collected, a database was designed to house the data collected and to create a potential framework for future reporting on these programmes and projects. A relational database was designed that could in future be used to collect information on programmes and projects. This was done through consultation with national government departments and by reviewing programme databases already in existence. Four main approaches were then used to collect information on programmes and projects. Firstly, the annual reports of every national and provincial department were collected and examined to identify all programmes and projects that were developmental, poverty relief related or of a conditional grant nature.
Secondly, searches of the literature and the web were done to identify programmes and projects and to access any information on these. Thirdly, government offi cials responsible for programmes related to poverty relief were contacted and information on the programmes and projects solicited. Fourthly, workshops were held with national and provincial departments to obtain inputs on defi nitions, criteria and data on programmes and projects. Information received on projects belonging to programmes was then captured into databases before being integrated into one overall project database.
ix
3. Conclusions
In selecting criteria for a categorization of programmes and projects, two issues were considered. In the fi rst instance, that the categorization should lend itself to future monitoring and evaluation and in the second instance, that it should resonate with the way that decision makers see their various endeavours. Taking these two considerations into account, the one approach to categorisation focuses on poverty types and the second on programme or project activity types. The fi rst approach defi nes programmes by the type of poverty that they address (i. e. income, capability, asset, special needs and social insurance). The second approach simply defi nes programmes based on the existing programme interventions (i. e. social security, free basic services, subsidized services, housing, land reform, income generating and public works). Ideally, the poverty type and activity type categorizations should be hybridised into one single system, as is presented in Table 1. This categorisation in Table 1 should be used as the basis for scoping the series of evaluations envisaged for phase 2 of the project.
An integrated database of more than 40 programmes that contains more than 29 900 projects was produced. These projects have been captured into a database developed during the study. With the incorporation of some of the largest programmes such as the Expanded Public Works Programme (EPWP), the programme database of the Free State Growth and Development Strategy (FSGDS), the Poverty Management Information System of the Limpopo Growth and Development Strategy, the Integrated Sustainable Rural Development Programme (ISRDP), the Land Redistribution for Agricultural Development (LRAD) Programme, the Settlement and Land Acquisition Grant (SLAG) and the Comprehensive Agricultural Support Programme (CASP), a solid foundation has been developed. However, many more important national and provincial programmes could have been incorporated if the support was forthcoming from the different departments. More specifi cally, data from the Department of Housing’s Housing Subsidy Programme and the Department of Provincial and Local Government’s Municipal Infrastructure Grant (MIG) was not provided. Nevertheless, it is believed that this database, for purposes of doing a series of evaluations of government’s efforts in addressing poverty in the second phase of the project, will suffi ce.
A major challenge for this project was that no central national database of poverty reduction programmes and projects exists. This meant that information had to be sourced from the national and provincial departments themselves. Furthermore, both programmes and projects did not have sets of unique numbers to distinguish them from one another, which means that it was diffi cult to pick up duplicate projects in the data sets and to do comparative analyses of programmes and projects from one year to another. A future requirement of any central database would be to identify both a core set of variables for which information on programmes and projects needs to be collected and a set of indicators for measuring the impact of programmes. Norms and standards should also be developed on the collection of information on programmes and projects and its storage in a database.
x
xi
There is a need for a system that allows the capture of information on programmes and projects and this should take into consideration the points that have been presented in the previous paragraph.
The project has accomplished the three main objectives that it set out to achieve. In the fi rst instance, a defi nition was provided for Government to use when describing programmes and projects that focus on poverty reduction. Secondly, an approach to categorizing poverty programmes and projects was described and the criteria for the inclusion of programmes into the different categories provided. Finally, an integrated database of programmes and projects was developed that can be used for the selection of a sample to conduct an evaluation of Government’s poverty reduction programme. However, much more could have been done in terms of the development of an integrated database of programmes and projects if government processes and systems were in place and the capacity was available in national and provincial departments to make the necessary information available.
Government policy recognizes the multi-dimensional nature of poverty, as evidenced by its attempts to address poverty in a number of different ways. The PSC has adopted and also recommends a working defi nition of poverty that is as broad and encompassing as possible. The term ‘Poverty’ can then be defi ned as, ‘an individual or household is said to be in a state of poverty when they have no income or have an income below the standard of living or are unable to meet their basic human needs’.
4. Recommendations
It is with this context in mind that the following recommendations are made.
4.1 Definition of poverty reduction
After consultation with relevant stakeholders on the defi nition of poverty, the PSC recommends that the term ‘poverty reduction’ be used to describe programmes and projects that have a focus on ‘improving the livelihoods or quality of life of individuals and households with no income, with an income below the standard of living or who are unable to meet their basic human needs.
In terms of the defi nitions and categorizations suggested in this report it is recommended that they be communicated to relevant stakeholders for their consideration and further input.
4.2 Development of a database
The Presidency has been identifi ed in the Programme of Action to take forward the development of a government-wide monitoring and evaluation system. It is recommended that The Presidency also take responsibility, in
xii
consultation with National Treasury, Statistics South Africa and the PSC, for the development and maintenance of the database of Government’s poverty reduction programmes and projects. The database should be updated on an annual basis.
A standardised set of variables and indicators for each programme and project need to be developed and adapted for department specifi c circumstances. In addition appropriate business processes to ensure the proper recording of information on programmes and projects need to be developed. In this regard, there is a need for Government to develop a system that allows programmes and projects to be provided with unique identifi er codes or numbers. It is also critical that geographic information on the projects is provided and that the sub-place names database of Stats SA becomes the offi cial source to be used for geo-locating projects.
Introduction
Cha
pter
One
1
1.1 Background
Since the new government came into power in 1994, it has shown great commitment in addressing the many inequalities inherited from the previous apartheid government. Over the last twelve years, Government has dramatically increased the proportion of public resources allocated to social spending. Income support to vulnerable households through social security and social assistance grants increased from R10b in 1994 to R70b in 2006 (PCAS, 2003; Manuel, 2006).
In addition, Government has embarked on a number of initiatives to expand healthcare, provide public infrastructure, build houses and provide free basic services such as water and electricity (Manuel, 2006). All these are guided by an overall commitment to combat under-development and create a better life for all.
In his 2004 Address to the First Joint Sitting of the Third Democratic Parliament, the President outlined the following three pillars as the basis of Government’s strategy of fi ghting under- development and poverty in the country. These are: “• encouraging growth and development in the First Economy; • increasing the opportunity for jobs and addressing the challenges of the Second Economy; and• building a social security net to bring about poverty alleviation.” (Mbeki, 2004).
Analysts have pointed out that the elements of this approach are largely the same as those laid out in the White Paper on Reconstruction and Development (RDP) of 1994 (Aliber and Nhlapo-Hlope, 2005). The primary objectives of the RDP were to improve the standards of living and quality of life for all South Africans and to create a sustainable democracy by prioritizing poverty eradication, access to land and providing basic services to people within a peaceful and stable society characterized by equitable economic growth.
In studies on service delivery improvement and monitoring and evaluation, the PSC has identifi ed several factors that remain challenges in the achievement of the above RDP objectives. One of these factors is the inappropriate processes and practices adopted in the governance and implementation of government programmes. Research conducted by the Public Service Commission (PSC) into the national housing subsidy scheme showed that it was constrained by factors such as poor coordination and the poor integration of service delivery systems and processes (PSC, 2003). Other problems that have been identifi ed by the PSC are that project management systems are often not introduced, criteria for support are not clearly defi ned and results are not monitored or evaluated. This has resulted in Government concluding as part of the Ten Year Review that more direct interventions are needed.
To achieve the objective of halving poverty by 2014 as stipulated in the Ten Year Review, released in October 2003, and in accordance with the Millenium Development Goals (MDGs), it is essential to improve the performance of Government. The PSC’s State of the Public Service Report of 2004 highlights the need for Government to accelerate social development and address poverty more effectively to ensure that the above objective is achieved. Research undertaken by the HSRC has pointed out that poverty cannot be reduced by improving performance of Government per se. The prevailing pro-poor conditions need to be identifi ed and the available natural, human and economic resources utilised to bring about the kind of economic growth where the poor share equally in the proceeds (Aliber and Nhlapo-Hlope, 2005). Improving road access to economic centres where people can fi nd employment, raising the standard of education and improving access to health facilities are all factors that need to be considered when implementing programmes and projects aimed at improving the standard of living of people in South Africa.
It is against this background that the PSC identifi ed the need to evaluate Government’s poverty relief programme to see to what extent it has impacted on under-development, poverty and inequality in the country, especially in relation to the three pillars highlighted by President Mbeki. Of great importance to any evaluation of this nature
2
is to determine the extent to which an integrated approach to development is being achieved and whether this is happening within a “comprehensive, coherent and co-ordinated framework” that will co-ordinate all the different and divergent development initiatives into one focused development intervention. (PCAS, 2003).
To undertake such an evaluation requires as thorough an understanding as possible of all government’s programmes and projects aimed at reducing poverty at both national and provincial level.
Since Government’s Poverty Reduction Programme is comprehensive and includes a broad range of initiatives, the PSC fi rst had to conduct an audit of all such programmes and projects and categorise them, so that the universe of what programmes and projects to include in the evaluation, could be defi ned. Basic information on all the programmes and projects also had to be collected. This effectively constituted the fi rst phase in a process that the PSC has embarked on to assess Government’s Poverty Reduction Programme. Since valuable insights have already been gained through this phase, and since the database that has been developed is extremely valuable in itself, the PSC decided to publish the fi rst phase report.
1.2 Purpose and objectives of the Audit
The purpose of the Audit was to provide all the necessary defi nitions, criteria and data on government programmes aimed at poverty reduction. The idea is that, once a universe of projects within the programmes being implemented by the national and provincial departments has been developed, a realistic and representative sample could be drawn to evaluate during the second phase of this project. This will enable the PSC to implement Phase 2 of the project which will entail a series of evaluations of the performance of selected programmes and projects.
To achieve the purpose of evaluating Government’s poverty reduction programmes and projects, the following three objectives were set for the Audit:
• To defi ne what is meant by poverty relief (and related terms) programmes and projects.• To develop criteria for the classifi cation of poverty relief programmes and projects. • To develop and populate a database on poverty relief programmes and projects in all government departments
at national and provincial level.
1.3 Mandate of the Public Service Commission
The PSC is an independent and impartial institution established in terms of Section 196 of the Constitution of South Africa (1996). Its Constitutional mandate empowers it to investigate, monitor and evaluate the organisation and administration of the Public Service. This mandate also entails the evaluation of achievements, or the lack thereof, of government programmes at all levels.
Furthermore, the PSC is also mandated to promote, throughout the Public Service, measures that ensure effective and effi cient performance, as well as promoting the values and principles of public administration as set out in the Constitution, especially the principle on “public administration should be development oriented”.
1.4 Scope
The scope of the Audit was to include all programmes and projects aimed at poverty reduction that are implemented at the national and provincial spheres of Government. To carry out the scope, it was necessary to identify all programmes and projects that in some way have a poverty reduction or developmental focus.
The setting of the above objectives and scope are in line with the mandate of the Public Service Commission, which was outlined in the previous section.
3
1.5 Methodology
The methodological approach adopted by the project team to fulfi l the objectives of the project, was the following:
1.5.1 Definition of poverty relief programmes and projects and criteria for the classification of poverty relief projects
The defi nition and categorization of ‘poverty relief ’ and associated concepts was examined through a review of the South African and international literature. South African literature included recent academic theory, government documents, white papers, the State of the Nation address and budget reviews by National Treasury. International literature included that of the International Labour Organization (ILO), the World Bank and the Overseas Development Institute, amongst others. A summary of the relevant points extracted from the literature is provided in Addendum 1.
It is important to note that the approach had to be somewhat refl exive, in the sense that one can establish working defi nitions at the beginning of the project that might change on completion of the project or even after the project has ended.
In addition, interviews were conducted with government offi cials in key stakeholder departments as to their understanding of ‘poverty relief ’ and their respective views on what constitutes a ‘project’ and a ‘programme’. The interviews were targeted at the Departments of Social Development, Health, Agriculture, Provincial and Local Government, Public Works, Land Affairs and Science and Technology. The Policy Co-ordination and Advisory Services Unit in the Offi ce of the President and National Treasury were also approached for their views on the defi nition.
Interviews focused on questions around the respective department’s contribution to resolving South Africa’s poverty problem, whether their efforts are effective and the reasons for their success or failure with respect to poverty relief/reduction. Questions were also asked as to the department’s reliance on a formal monitoring and evaluation (M&E) system to measure achievements in terms of poverty reduction. Views on the above issues were also obtained from offi cials attending the national and provincial workshops organised as part of this project.
1.5.2 Developing a database on poverty reduction programmes and projects
1.5.2.1 Design of the database
Since no centralized national database on all poverty relief programmes and projects in South Africa could be identifi ed (and it was established that apart from the programme and project inventories of the Free State, Limpopo and North West, no such database existed at a provincial level either), it had to be designed and created by the project team. The structure of the database had to allow for the collection of all the relevant information on poverty reduction related programmes and projects and, thereby, enable the scope of the project to be achieved. Furthermore, the database was also designed with the future requirements of Government in mind.
In developing the database design, the project team studied databases from various national government departments. The database design drew from available project databases of the Department of Agriculture (Land Care Programme), Department of Housing (Housing Subsidy Scheme), the Department of Public Works (Expanded Public Works Programme) and the Department of Science and Technology (database on technologically-oriented poverty reduction projects). The database was designed to contain fi elds and capture aspects of the most important information needed to populate an extensive database of poverty reduction related programmes and projects. These aspects included the programme and project name, main activities, contact details, budget information, location of projects (by municipality), outputs, benefi ciaries, etc.
4
In order to test the utility of such a database design for capturing relevant and useful data elements, a workshop with the main national government stakeholders was held. Representatives of the Department of Public Works, the Department of Provincial and Local Government and the Department of Social Development, attended. The workshop provided participants with the context of the project and the database design. A preliminary database design was also presented to provide some framework for discussion. This included a description of the tables to be incorporated in the database design, their attributes/fi elds and the relational links between them. Examples of code tables and values that need to be categorized were also presented.
The workshop focused on the following:• Programmes and projects to be captured in the database;• Description of fi elds and the type of data to be stored in each (e.g. numeric or text);• Defi ning values of programme and project types, categories or classifi cations;• Fields that should be added (e.g. what data is required to aid classifi cation later);• Hierarchical relationships between programmes and projects and what data should be stored at each level;• Identifi cation of critical versus nice-to-have fi elds; and• A discussion on what data is readily available for all fi elds.
Following the workshop, amendments were made to the database design before a fi nal report was produced.
1.5.2.2 Populating the database on Government’s poverty reduction related programmes and projects
This phase of the project involved several different activities including conducting searches of the web and relevant literature in identifying national and provincial programmes and getting contact details of individuals that were responsible for such programmes. It also entailed accessing and capturing data on programmes and projects to enable the population of the database. The geographic coordinates or place names associated with projects were also used to map them.
The main approach followed by the project team in identifying national and provincial programmes was to obtain the annual reports from all national and provincial government departments.
Having received the annual reports, researchers then scanned through them to identify any poverty or developmental related programmes and projects.
The criteria used to identify relevant programmes and projects in the annual reports are listed below:• All poverty reduction programmes;• all conditional grant allocations;• programmes that provided some form of service and/or infrastructure to communities or the people; and• programmes/projects of a developmental nature.
The annual reports were also used to obtain information on programme and project objectives. Follow-ups were made by contacting departments directly. The reasons for the direct contact were:
i) To verify information that was already available in existing databases; ii) to collect more information about programmes and projects for which only partial information was
available; iii) to identify ‘new’ poverty reduction initiatives; andiv) to collect the necessary information about them in the format set out in the database design.
Written material describing these poverty reduction related government programmes and projects was also accessed by undertaking internet-based searches for literature and accessing departmental web sites. Information
5
obtained from the web and from government departments was used to populate the database with information on programmes and projects.
At national government level, the Directors-General offi ces, the relevant Chief Director, the Chief Financial Offi cer or the person directly responsible for the management of the programme or project were contacted to get access to information on the specifi c programme and or project and to request access to existing databases of all programmes and projects undertaken in 2004/05. The approach of the project team at the provincial level was to contact relevant Heads of Department.
Consultative workshops were also held with both national and provincial departments. At these workshops the project team provided a brief overview of the project rationale and objectives. The main focus of the workshops was the discussion of the types (e.g. income, capability, asset, special needs or social insurance) and categories of poverty relief or reduction programmes/projects (e.g. social security, free/subsidised basic household services, subsidised individual services, housing, land reform, income generating projects and SMMEs, public works), and the defi nitions being used to describe poverty relief, alleviation, reduction or eradication in the various departments. The monitoring and evaluation (M&E) systems and/or activities taking place to assess the impact of these programmes and projects were also discussed. The document used as a basis for discussion in the workshops is attached as Addendum 2.
Electronic databases and hard copy lists of programmes and or projects have been received from a number of departments. The databases received were integrated into the database structure developed at the onset of the project. The project data was stored in Microsoft Excel because it is the easiest to use in manipulating and analysing the data. It also provides much functionality including the ability to transpose data. It also allows for quick entering of the project data into the database.
To enable projects to be geo-located to the smallest geographic place possible, the spelling of place names where projects were implemented had to be corrected and stored in a separate variable. Unfortunately, the geographic level that was provided for projects in the database varied from village to district municipality level. Consequently, a variable was included in the database that indicated to what geographic level each project in the database was geo-located.
1.6 Resources available to the project team
A team of more than fourteen researchers participated in the project. The team members were skilled in the collection of information on programmes and projects as well as capturing this information into databases. Researchers with a background in poverty analysis, monitoring and evaluation, programme performance evaluation, database design and implementation and Geographic Information Systems (GIS) formed part of the team.
1.7 Limitations
The project was hampered by the lack of a central database on programmes and projects. Furthermore, the seemingly limited capacity and lack of resources at national and provincial departments to deal with requests for information on programmes and projects also prevented the project team from compiling a comprehensive list of poverty reduction programmes and projects.
Similar diffi culties experienced during a national survey undertaken by the HSRC in collaboration with the CSIR and University of Fort Hare on ‘Technology transfer for poverty reduction’ (HSRC, 2004), were also encountered during this Audit. The main diffi culty was that to assemble a list of programmes and/or projects required an enormous number of person-hours just to make contact and follow-up with government staff. During the Audit it was concluded that this was mainly because of a lack of systems and standards when it comes to information management and reporting. Digital formats ranged from documents supplied in Microsoft Word format to
6
7
Microsoft Excel workbooks or just one Excel sheet. Many programmes provided a list of projects in hardcopy format.
The variation in the variables incorporated into programme databases and documentation, made it diffi cult to integrate into a single database.
Mapping of the programmes and projects was quite problematic because of the absence in most cases of the spatial detail like the exact geographic coordinates of projects in the fi eld. The erratic spelling of programme and project names and variables containing geographic information (e. g. place name, local and district municipality), further hampered the mapping process.
The absence of unique programme or project identifi cation codes limited the ability to identify duplicate records. A system that will allow departments to access information on other departments’ programmes and projects will also make it easier to identify these duplicate records. It will also ease the monitoring and evaluation processes.

8
Cha
pter
Tw
o
Findings from the Workshops Held with National and Provincial
Departments
9

Findings of the workshops largely confi rm what has been stated in the previous section. A clear understanding of the complexity within which departments operate was however gained. This understanding will be expanded upon in this section.
One of the main fi ndings is that many of the line department programmes being implemented have an outreach to poor communities and, therefore, can be considered to be poverty reduction programmes. According to offi cials from various departments attending the workshops, most of these programmes either have a direct (e.g. job creation) or indirect (e.g. skills development) impact on poverty. This is because national and provincial policies and strategies guide departments to ensure that the needs of the people are being addressed in their programmes. What was also highlighted was that the focus of government is moving away from direct poverty relief programmes (or so-called “handouts”) towards what is termed “investment” programmes.
It was acknowledged that outside of the line departments there are distinct poverty relief or reduction programmes such as those that receive conditional grant funds. Furthermore, there are large poverty reduction programmes which are not implemented by a single department but by a number of national and provincial departments with functional responsibility allocated to each of these departments. The programmes that were consistently identifi ed were the Expanded Public Works programme (EPWP), Integrated Sustainable Rural Development Programme (ISRDP), Urban Renewal Programme (URP), Local Economic Development Programme (LED), Municipal Infrastructure Grant (MIG) and the Consolidated Municipal Infrastructure Programme (CMIP). The importance of these different programmes changes from province to province as the emphasis shifts from the building of schools to the building of clinics as an example.
Other programmes that were identifi ed to form part of the poverty reduction programme of the country are those that provide free basic services or subsidies. Another important programme that has had dramatic impact on poverty in South Africa over the years and should be incorporated in an evaluation of poverty reduction programmes and projects is the social grants provided by the national Department of Social Development. A database of 8 000 pay points throughout the country exists and this database can be used to evaluate the impact of this programme on benefi ciaries.
Outside the line departments and large poverty reduction programmes of the national and provincial departments are agencies that are implementing other poverty relief programmes. One of these is the National Development Agency (NDA) that receives its funding mainly from the Department of Social Development and another is the National Lottery Board of the Department of Trade and Industry. Within some of the provinces development agencies have been established and if they are allocating funds independently of provincial governments for poverty relief programmes then these programmes too should be monitored. Agencies like the Independent Development Trust (IDT) and the Development Bank of Southern Africa (DBSA) who assist departments in the implementation of the projects and also provide their own funding for the implementation of programmes should also avail their information for monitoring and evaluation purposes. This is to ensure that the evaluation of poverty relief programmes and or projects provides a holistic understanding of the impact.
What became clear in the workshops is the extent to which the national Department of Public Works, through the EPWP, play a role in poverty relief initiatives in the country. This Department and programme have provided guidelines and defi nitions of poverty that are extensively being used at both national and provincial level. They are not only keeping detailed information on all the EPWP projects being implemented across the country but are also undertaking the monitoring and evaluation of these projects.
Many provincial departments indicated that they did not keep a database of their poverty relief projects or established M&E units because this was already being undertaken by the EPWP, as indicated in the previous paragraph. Within the national departments M&E is much more established than in most of the provincial departments. Some of the provinces, especially the better off ones like Gauteng and the Western Cape, are beginning to establish their own M&E units. It was also mentioned that because national line function departments,
10
National Treasury, provincial treasuries and The Presidency (Programme of Action) are doing reporting and M&E, the need for individual provincial departments to also do it, did not really exist. In fact these departments raised a concern about the amount of reporting they are doing and that it affects their ability to implement their programmes.
The workshops clearly pointed out that no integrated central database of poverty relief programmes and projects exists at either a national or provincial level. Databases are mainly available within the larger programmes and Premiers’ Offi ces in some of the provinces are starting to develop registers or lists on these projects or programmes. There has also been some indication that individual departments have developed databases on poverty relief programmes. Given that the state of project/programme databases is seemingly not advanced enough, there is a possibility that projects are either being duplicated or they are being left out when integrating the databases from the myriad of sources.
To enable the effective monitoring and evaluation of these programmes and projects and to address the above problems an integrated system for monitoring these programmes and projects should be developed. National and provincial departments have stressed that such an integrated database should be developed within the framework of a national poverty reduction strategy. The purpose of the system would be to ensure that information on the performance of these programmes and projects feeds into a broader nationally co-ordinated monitoring and evaluation process.
A standardised set of variables and indicators for each programme and project need to be developed and adapted for department specifi c circumstances. In addition appropriate business processes to ensure the proper recording of information on programmes and projects need to be developed. In this regard, there is a need for Government to develop a system that allows programmes and projects to be provided with unique identifi er codes or numbers. It is also critical that geographic information on the projects is provided and that the sub-place names database of StatsSA becomes the offi cial source to be used for geo-locating projects.
Furthermore, a department will have to be identifi ed that will drive the entire process of implementing and maintaining such a system. There are several potential role players that have been identifi ed. These are The Presidency, National Treasury, the Public Service Commission and Statistics South Africa. Parastatals like the CSIR and HSRC could also contribute in this regard because of their research capacity. Offi ces of the Premier have been identifi ed as having an important responsibility in coordinating the collection of information on poverty relief programmes from the different provincial departments and ensuring that the information feeds into the national monitoring and evaluation process. It is recommended that The Presidency takes responsibility, in consultation with National Treasury, Statistics South Africa and the PSC, for the development and maintenance of the database of Government’s poverty reduction programmes and projects. This database should be updated on an annual basis.
11

12
Cha
pter
Thr
ee
Definition of Poverty Reduction Programmes and Projects and the
Criteria for the Classification of these Programmes and Projects
13
3.1 A definition of poverty
Over the past two decades, there has been increasing attention to the fact that poor people’s experience of poverty involves a great deal more than inadequate income or consumption (Chambers, 1994; Kanbur and Squire, 1999). This has been forcefully illustrated in South Africa by means of a number of qualitative research initiatives, of which perhaps the most ambitious is the South African Participatory Poverty Assessment, or “SA-PPA” (1998). All of these lead to ways of describing poverty which seek to refl ect poverty’s multi-dimensional nature. A good example is South Africa’s draft Comprehensive Social Security Framework, which seeks to ensure a social safety net that addresses “income poverty, “service poverty,” and “asset poverty,” among others (HSRC, 2004).
In addition to these increasingly comprehensive and elaborate ways of describing poverty, there also exist many theoretical and methodological perspectives on poverty that purport to explain what poverty is, what is at its root, and/or how best to really understand it. These would include for example the ‘capabilities approach,’ the ‘multiple livelihoods framework,’ and the ‘entitlements approach,’ (Kaplan, 2004).
In the Report of the Commission for Africa, 2005, the reality of poverty is projected as follows: ‘Poverty means hunger, thirst, and living without decent shelter. It means not being able to read. It means
chronic sickness. Poverty means not fi nding any opportunities for you or your children. It is about being pushed around by those who are more powerful. It is about having little control over your own life. And it can mean living with the constant threat of personal violence.’ (Commission for Africa, 2005, p 101)
The above report further describes the consequences that arise when governments fail to provide effective public services that meet the basic needs of its people: ‘Poor people in urban slums, forced to live with mountains of uncollected, disease-infested rubbish, open sewers
and dirty and expensive water. Farmers that cannot sell their produce because the road to the market is impassable in the rainy season.
Clinics that have no drugs and schools that have no teachers … Monies that disappear from hard-pressed national budgets…’ (Commission for Africa, 2005, p 133)
In its State of the World Population Report, 2002, the United Nations Population Fund (UNFPA) provides the following perspective on poverty: “Income is the common way of measuring poverty, but poverty has many dimensions. The poor are deprived of
services, resources and opportunities as well as money. Their limited resources are ineffi ciently deployed. Energy, water, and food all cost more per unit consumed-paradoxically, poverty is expensive for the poor.
People’s health, education, gender relations and degree of social inclusion all promote or diminish their well-being and help to determine the prevalence of poverty. Escaping poverty depends on improving personal capacities and increasing access to a variety of resources, institutions and support mechanisms.
Economic growth will not by itself end poverty. The assumptions that wealth will “trickle down” to the poor, or that “a rising tide lifts all boats” are convenient, but do not always correspond to experience, especially in the poorest countries and among the poorest people. Ending extreme poverty calls for commitment to the task, and specifi c action directed to it”. (UNFPA, 2002)
A further dimension of poverty highlighted in this report is “the distinction between lack of income and lack of capacity. Poor people acutely feel their powerlessness and insecurity, their vulnerability and lack of dignity. Rather than taking decisions for themselves, they are subject to the decisions of others in nearly all aspects of their lives. Their lack of education or technical skills holds them back. Poor health may mean that employment is erratic and low-paid. Their very poverty excludes them from the means of escaping it. Their attempts even to supply basic needs meet persistent obstacles, economic or social, obdurate or whimsical, legal or customary. Violence is an ever-present threat, especially to women.
14
The poorest use what resources they have, and considerable resourcefulness, in their struggle to survive. For the poor, innovation means risk, and risk can be fatal. Helping them improve their capacities calls for imagination as well as compassion”. (UNFPA, 2002)
Because government policy does in fact recognize the multi-dimensional nature of poverty, as evidenced by its attempts to address poverty in a number of different ways, the PSC is adopting a working defi nition of poverty that is as broad and encompassing as possible. That is, an individual or household is said to be in a state of poverty when they have no income or have an income below the standard of living or are unable to meet their basic human needs.
3.2 Definitions of activities aimed at addressing poverty
There is no fi rm, internationally accepted typology of anti-poverty activities. However, there is a tendency to distinguish interventions according to the extent to which they are designed to meet immediate needs of those who otherwise cannot fend for themselves (i.e. ‘welfarist’), or empower poor people to better their own circumstance (i.e. ‘developmental’), or reconfi gure the economy so that the structural aspects of poverty are minimised or removed.
The following defi nitions from Henriot (2002, p.6) are typical examples:
• “Poverty Alleviation: this is the work of lessening the suffering of the poor, meeting their immediate pressing needs with welfare handouts and social security, providing safety nets, dealing with widows, orphans, the elderly and the handicapped. This is basically charitable assistance.”
• “Poverty Reduction: this is the task of lowering the numbers of those living below the poverty line and eliminating them from the rolls of the deprived. This involves providing people with jobs which pay wages above the poverty line, providing health and education services, providing credit for small business enterprises and other opportunities to rise above the poverty line. This is, basically, commitment to development.”
• “Poverty Eradication: this is the challenge of restructuring society so that there is no longer growing poverty and absolute numbers of the impoverished decrease to minimal exceptional cases. This calls for planning – for setting priorities, for shifts in power, for restructuring society, for radical social and economic changes. This is basically the transformation of society through policies based on justice, compassion and inclusiveness. However, this article will use the term ‘addressing poverty’ to cover all of the above. Specifi c distinctions will emerge in the discussion of each approach. One can identify fi ve approaches currently used for addressing poverty. They are not mutually exclusive but rather are interlinked.”
Mafeje (2002) attempts to provide some historical explanation for the use of different terminology. He contends that “poverty alleviation” as a distinct concept arose among international development institutions (especially FAO, IFAD, and UNDP) in the late 1970s as they became increasingly disillusioned with the failure of conventional development policies to ‘trickle down’ to the poor. In other words, the emergence of the use of the term “poverty alleviation” was an acknowledgement of the need for more active measures to combat poverty in developing countries. Mafeje further contends that “poverty eradication” was a later coinage, this time as a reaction to the failure or limitations of structural adjustment policies; the distinction was more or less the same as that refl ected in Henriot’s defi nitions above, i.e. in contrast to “poverty alleviation,” “poverty eradication” implied more attention to (developing) the self-reliance of the poor, and/or to addressing the social and economic conditions that perpetuate poverty.
However, it is fair to say that there is only modest consistency in the use of these and related terms in the international literature, notwithstanding the near-universal acknowledgement that it is important, inter alia, to distinguish safety-net type measures from those that are more developmental.
15
Turning now to the case of South Africa, it is evident that the situation is much the same. There is little or no consistency in the manner in which different terms are used (i.e. “poverty alleviation,” “poverty relief,” “poverty eradication,” etc.), but there is, broadly speaking, an understanding that there are in fact different types of interventions aimed at addressing poverty. This is confi rmed by both the scan of the literature and the interviews with government offi cials. The central distinction, as with the case of “poverty alleviation” versus “poverty eradication” cited above, is that between ‘welfare’ and ‘development,’ as most visibly illustrated by the shift in thinking that was refl ected in the name change from Department of Welfare to Department of Social Development. However, it is also important to point out that in South Africa the meaning of “poverty eradication” is somewhat different than described above vis-à-vis some of the international literature - it is not a function of the type of intervention, but is rather taken to mean the ultimate, longer-term goal of eliminating poverty, regardless of how it is achieved.
At one level, the distinction between welfare interventions and developmental interventions is very real. Clearly the activity of disbursing grants is entirely different from supporting an income generating project or fi nancing the transfer of land to poor people. However, at another level – that of impact – it is important to be cautious: it appears that it is not correct to assume that grants only assist poor people in terms of short-term relief from income poverty, while developmental interventions, by contrast, ‘teach them to fi sh’ (or whatever they do). There is credible research to the effect that South Africa’s social grants are in fact quite developmental, while a lot of would-be developmental initiatives are not.
Since the anti-poverty activities are referred to as “programmes” and “projects” in this report, working defi nitions of both are provided:
A poverty reduction project is a systematic process of activities aimed at achieving a decrease in the number of individuals or households that are unable to meet his/her/its basic human needs. It has a cost parameter and a time defi ned for its development. A poverty reduction programme is a portfolio of projects related to the common objective of reducing poverty in a specifi c functional area (e g the Comprehensive Agricultural Support Programme (CASP) of the Department of Agriculture) or a combination of functional areas (e.g. the Expanded Public Works Programme combining inter alia infrastructure, environmental and culture, economic and social related projects). The projects combined under one programme benefi t from the consolidated approach.
3.3 Brief overview of South Africa’s anti-poverty ‘strategy’
Before proceeding to the proposed categorizations, a very brief summary of the prevalent view in Government as to what their anti-poverty strategy consists of, is provided. This is needed to address the possibility that an offi cial typology of government’s anti-poverty measures exists that may already suit the needs of this project.
In fact, there is really only one recent, offi cial statement as to Government’s anti-poverty policy that can be considered a candidate. In particular, it is important to take note of the ‘three pillar formulation’ offered by President Mbeki in a speech to Parliament on 21 May 2004:
“At the core of our response to all these challenges is the struggle against poverty and underdevelopment, which rests on three pillars. These are: encouraging the growth and development of the First Economy, increasing its possibility to create jobs; implementing our programme to address the challenges of the Second Economy; and, building a social security net to meet the objective of poverty alleviation” (Mbeki, 2004).
This formulation is important in at least three respects. First, it accurately refl ects the view of many in government and elsewhere that a central key to resolving poverty does not relate to targeted poverty alleviation initiatives at all, but rather to fostering a stronger and, hopefully, more inclusive, economy. Second, it confi rms the distinction
16
drawn above between the welfare-type interventions associated with the third pillar, and the developmental interventions covered in the second-economy third pillar. And third, the two-economy language is now fi rmly ensconced in Government’s lexicon, for example serving as an organizing principle for the economic cluster in Government’s Programme of Action (POA).
3.4 Proposed definition of ‘poverty reduction’
Through the research done during this project, the PSC has determined that a useful general term to be used is ‘poverty reduction,’ which can be defi ned as ‘an initiative, project, or programme which seeks to improve the livelihood or quality of life of individuals or households with no income, with an income below the standard of living or those people living in poverty’. The reason for using ‘poverty reduction’ rather than ‘poverty alleviation’ or ‘poverty relief ’ is that the latter are frequently understood to mean short-term palliatives. The advantage of ‘poverty reduction’ over ‘poverty eradication’ is that the latter is often interpreted to imply a long-term, large-scale effort or process with near-complete results.
The downside of ‘poverty reduction’ is that it is sometimes also construed with a specifi c meaning, as illustrated with the example above. However, the general observation is that, of all of the terms generally used in South Africa, ‘poverty reduction’ is the broadest and most generic, which is suitable for the project purposes. The proposed defi nition itself aims to be quite inclusive, and indeed very clearly includes welfare, improved services, and developmental interventions. However, it does stress deliberate interventions, that is, it would not include indirect or passive lessening of poverty due to job growth in the formal sector.
3.5 Proposed systems of categorization
An important component of the present exercise is to propose one or more ways of categorizing anti-poverty initiatives to serve the purposes of the project. This means fi rst and foremost that whatever way of categorizing that is proposed lends itself conveniently to any future evaluation the PSC may wish to do. An additional consideration is that it would be desirable if whatever is proposed was to resonate with the way in which South African policy makers tend to see their various endeavours.
Two main approaches to categorizing were explored, one by the type of poverty the initiative is meant to address, and the second by the nature of the activities the initiatives consist of.
The “poverty type” option (e.g.”income poverty” versus “service poverty” versus “asset poverty” versus “capability poverty” versus “social insurance”) is very attractive on the face of it, since it would seem desirable to categorize poverty reduction initiatives according to the functional manner in which they address poverty. However, in practice there would be some challenges to this approach. The main challenge is that it is quite diffi cult to categorize a number of actual poverty reduction initiatives, because one can rationalize that they address two or more types of poverty. A case in point is the example given above about the under-recognised developmental impact of social grants. A second is the public works programmes, which in some countries are considered a type of welfare, and in others a form of capacity building (see e.g. Appendix 1 in the evaluation of the “RAP-85” programme). A third example is Government’s Land Distribution Programme, which explicitly seeks to address both income and asset poverty.
The second proposed way of categorizing poverty reduction measures is by the type of activity, where this is defi ned more or less intuitively in line with major types of existing programme interventions. For purposes of this study, categories based on ‘programme type’ are the most preferred. This is due to the fact that it becomes easier to choose specifi c activities to evaluate. The table below illustrates:
17
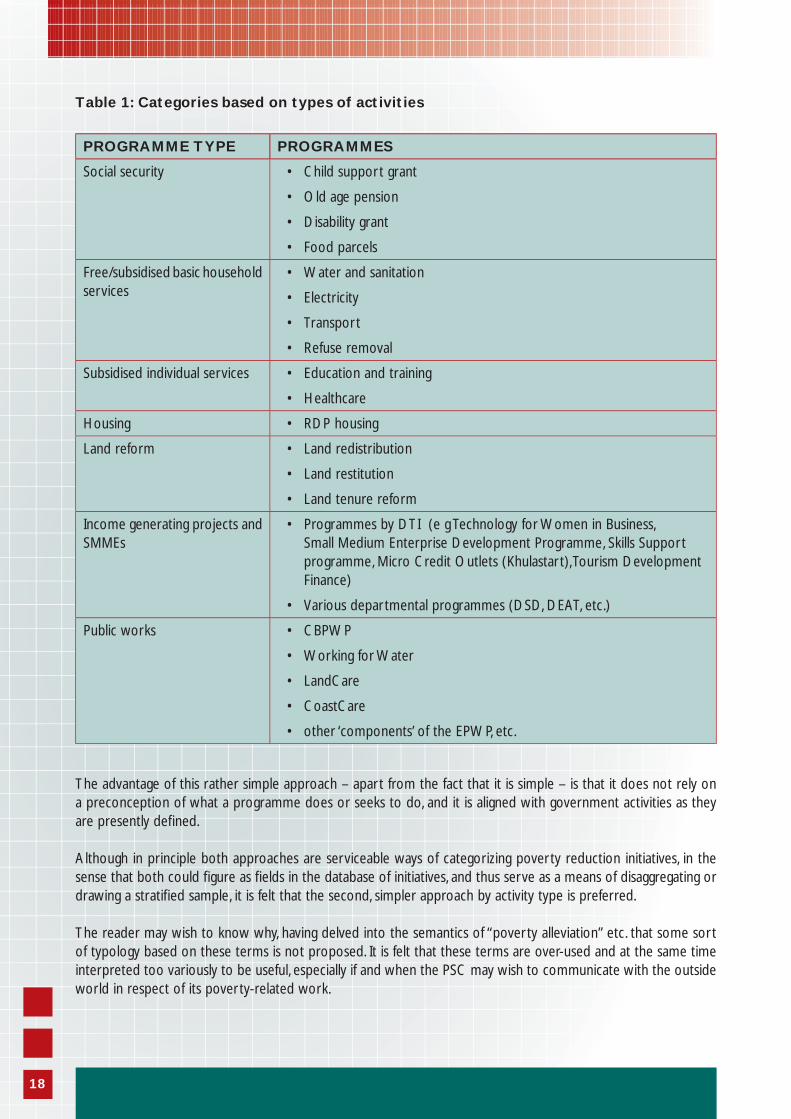
Table 1: Categories based on types of activities
PROGRAMME TYPE PROGRAMMES
Social security • Child support grant
• Old age pension
• Disability grant
• Food parcels
Free/subsidised basic household services
• Water and sanitation
• Electricity
• Transport
• Refuse removal
Subsidised individual services • Education and training
• Healthcare
Housing • RDP housing
Land reform • Land redistribution
• Land restitution
• Land tenure reform
Income generating projects and SMMEs
• Programmes by DTI (e g Technology for Women in Business, Small Medium Enterprise Development Programme, Skills Support programme, Micro Credit Outlets (Khulastart), Tourism Development Finance)
• Various departmental programmes (DSD, DEAT, etc.)
Public works • CBPWP
• Working for Water
• LandCare
• CoastCare
• other ‘components’ of the EPWP, etc.
The advantage of this rather simple approach – apart from the fact that it is simple – is that it does not rely on a preconception of what a programme does or seeks to do, and it is aligned with government activities as they are presently defi ned.
Although in principle both approaches are serviceable ways of categorizing poverty reduction initiatives, in the sense that both could fi gure as fi elds in the database of initiatives, and thus serve as a means of disaggregating or drawing a stratifi ed sample, it is felt that the second, simpler approach by activity type is preferred.
The reader may wish to know why, having delved into the semantics of “poverty alleviation” etc. that some sort of typology based on these terms is not proposed. It is felt that these terms are over-used and at the same time interpreted too variously to be useful, especially if and when the PSC may wish to communicate with the outside world in respect of its poverty-related work.
18
3.6 Thinking ahead to evaluation
The recent trend in Monitoring and Evaluation (M&E) is to focus on outcomes rather than primarily on inputs. ‘Results-Based M&E’ has been developed to support governments in designing and adjusting their projects, programmes and policies. Essentially, Results-Based M&E comprises the following activities (Kusek and Rist, 2004):
• Formulate outcomes and goals• Select outcome indicators to monitor• Gather baseline information on the current condition• Set specifi c targets to reach and dates for reaching them• Regularly collect data to assess whether the targets are being met• Analyze and report the results.
Key questions behind selecting and designing an M&E approach or system for South Africa’s Poverty Reduction Programme are: What are the strategic goals? and What outcomes are or could be attached to these goals? In the absence of a national poverty reduction strategy, goals could be deduced from current types of programmes and/or projects aimed at poverty reduction as these are listed in Table 1. However, an alternative approach is to use poverty reduction categories based on a typology of poverty and to base the goals of poverty reduction on these poverty types.
The advantages of M&E based on the poverty type categorization include the following:
• The types cover various aspects or dimensions of poverty, whereas programmes and programme goals might be too specifi c and fail to impact on important poverty components.
• They provide a theoretical base against which dimensional assessments can be made and are thus less vulnerable to ad hoc and short evaluations. Programme goals are being defi ned once a programme comes into existence. Evaluation of the impact of a programme is therefore often limited to programme activities and duration per se and fails to incorporate developments which are not necessarily directly related or synchronous to the programme.
• They allow for intergovernmental (integrated) assessments, whereas with regard to programmes, intergovernmental activities are defi ned by programme design. This might result in one or few government departments involved and assessed. The poverty typology on the other hand allows for evaluation of departments on the poverty dimensions irrespective of government programmes per se.
Disadvantages include:
• Interventions might relate to more than one typology; the typologies are not exclusive. Overall assessments of interventions/programmes might therefore become complicated.
• There is no certain level of importance and relevance or weight attached to each type and the interdependency among types of poverty might be contextual. This undermines the possibility to evaluate a programme which touches on various types of poverty.
Having said this, one should also consider current efforts to develop an integrated anti-poverty strategy, which is not necessarily based on either a poverty typology or existing programmes. According to Kusek and Rist (2004), the creation of a results-based M&E system often works best when linked to other public sector reform programmes and initiatives, such as creating a medium-term public expenditure framework, restructuring public administration, or constructing a National Poverty Reduction Strategy. Linking the creation of M&E systems to
19
20
such initiatives creates interdependencies and reinforcements that are crucial to the overall sustainability of these systems. Developing an anti-poverty strategy and an M&E system thus goes hand in hand.
Cha
pter
Fou
r
Developing the Database on Poverty Reduction Programmes
and Projects
21
4.1 Design of the programme and project database
The database designed during the initial stages of the project uses a relational database confi guration. A relational database design allows information on distinct entities to be stored separately but can be joined together using a key column or primary key (e.g. ProgrammeId) and, therefore, provides access to only the relevant data at any particular time. In the relational database design of this project, individual databases provide information on six main entities (Figure 3), namely: the programmes, projects, implementing agent, responsible department/organization, funder and benefi ciaries. Another reason for developing this design is that it provides government with a format that can in future be used at national and provincial level for recording information on programmes and projects.
In terms of the relational database design, each programme may have several projects within it but a project belongs to one specifi c programme only. The individual databases and the information that they contain on the different entities and how they link to one another are schematically represented in Figure 1. What Figure 1 also shows is that each programme may have one or more funder(s), documents, fi nancial data or projects. The primary key (e g ProgrammeId) is used to link the programme to its corresponding funders, documents, fi nancial data or projects. The database design has been integrated in Microsoft Access and is available on CD.
Project information is provided by fi nancial year because the budgets and expenditure are allocated according to a fi nancial year as required by National Treasury. The database design caters for this by providing data on projects by department and for data to be captured on an annual basis (per fi nancial year). In developing the database design it was assumed that programmes and projects would not necessarily have unique programme or project numbers. Therefore, the matching of projects from year to year would be a tedious and time-consuming process with a high potential for error. However, by sorting in terms of various project fi elds, trends associated with projects can be examined from year to year.
22
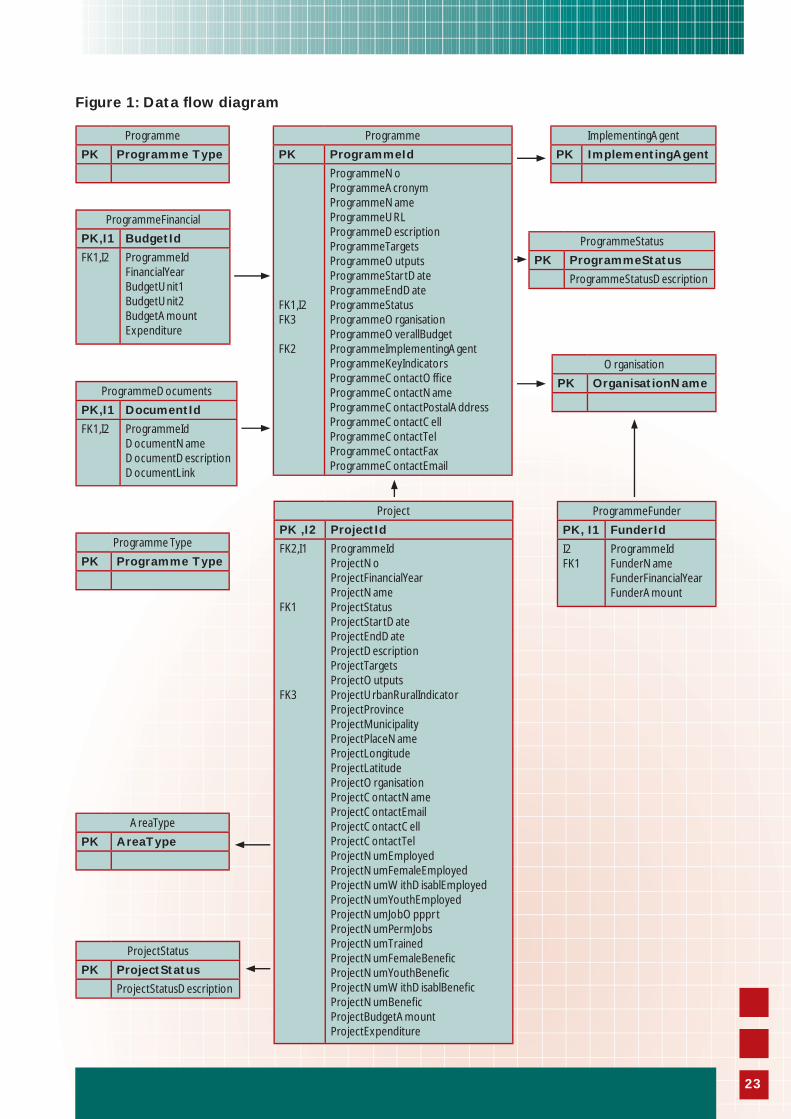
Figure 1: Data fl ow diagram
23
Programme
PK Programme Type
Programme
PK ProgrammeId
FK1,I2FK3
FK2
ProgrammeNoProgrammeAcronymProgrammeNameProgrammeURLProgrammeDescriptionProgrammeTargetsProgrammeOutputsProgrammeStartDateProgrammeEndDateProgrammeStatusProgrammeOrganisationProgrammeOverallBudgetProgrammeImplementingAgentProgrammeKeyIndicatorsProgrammeContactOffi ceProgrammeContactNameProgrammeContactPostalAddressProgrammeContactCellProgrammeContactTelProgrammeContactFaxProgrammeContactEmail
Project
PK ,I2 ProjectId
FK2,I1
FK1
FK3
ProgrammeIdProjectNoProjectFinancialYearProjectNameProjectStatus ProjectStartDateProjectEndDate ProjectDescriptionProjectTargetsProjectOutputsProjectUrbanRuralIndicatorProjectProvinceProjectMunicipalityProjectPlaceNameProjectLongitudeProjectLatitudeProjectOrganisationProjectContactNameProjectContactEmailProjectContactCellProjectContactTelProjectNumEmployedProjectNumFemaleEmployedProjectNumWithDisablEmployedProjectNumYouthEmployedProjectNumJobOppprtProjectNumPermJobsProjectNumTrainedProjectNumFemaleBenefi cProjectNumYouthBenefi cProjectNumWithDisablBenefi cProjectNumBenefi cProjectBudgetAmountProjectExpenditure
ProgrammeFinancial
PK,I1 BudgetId
FK1,I2 ProgrammeIdFinancialYearBudgetUnit1BudgetUnit2BudgetAmountExpenditure
ProgrammeDocuments
PK,I1 DocumentId
FK1,I2 ProgrammeIdDocumentNameDocumentDescriptionDocumentLink
Programme Type
PK Programme Type
AreaType
PK AreaType
ProjectStatus
PK ProjectStatus
ProjectStatusDescription
ImplementingAgent
PK ImplementingAgent
ProgrammeStatus
PK ProgrammeStatus
ProgrammeStatusDescription
Organisation
PK OrganisationName
ProgrammeFunder
PK, I1 FunderId
I2FK1
ProgrammeIdFunderNameFunderFinancialYearFunderAmount
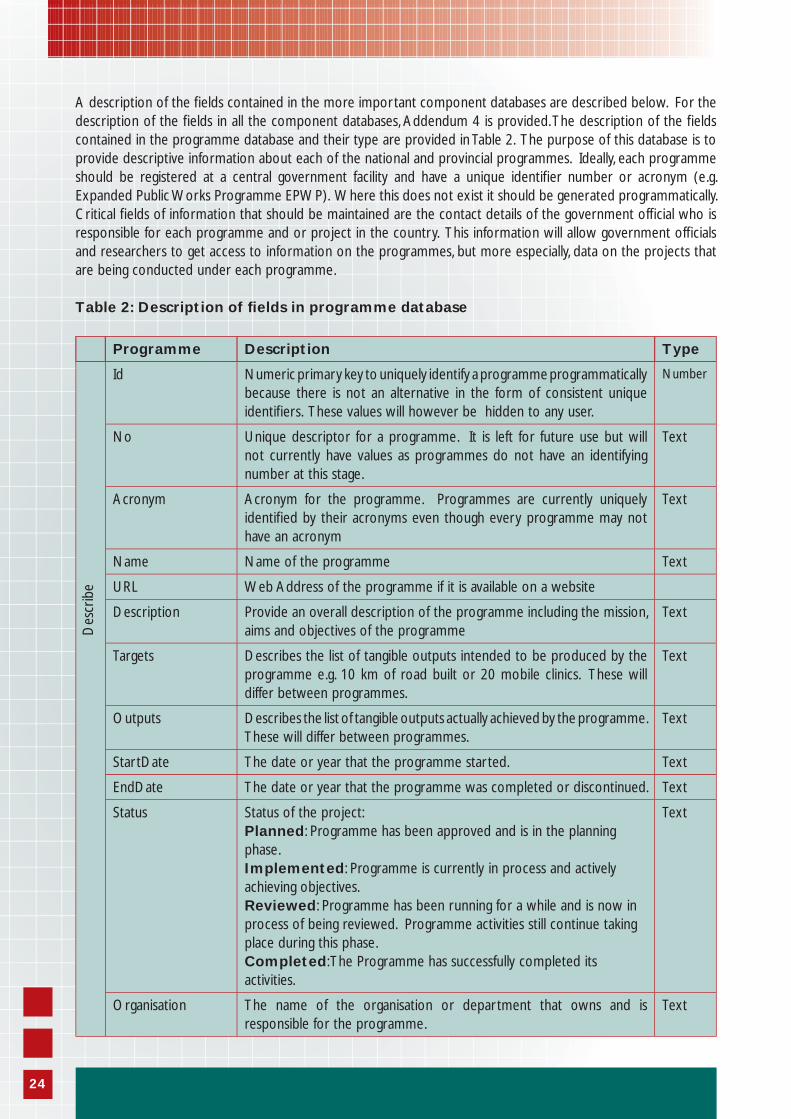
A description of the fi elds contained in the more important component databases are described below. For the description of the fi elds in all the component databases, Addendum 4 is provided. The description of the fi elds contained in the programme database and their type are provided in Table 2. The purpose of this database is to provide descriptive information about each of the national and provincial programmes. Ideally, each programme should be registered at a central government facility and have a unique identifi er number or acronym (e.g. Expanded Public Works Programme EPWP). Where this does not exist it should be generated programmatically. Critical fi elds of information that should be maintained are the contact details of the government offi cial who is responsible for each programme and or project in the country. This information will allow government offi cials and researchers to get access to information on the programmes, but more especially, data on the projects that are being conducted under each programme.
Table 2: Description of fi elds in programme database
Programme Description Type
Id Numeric primary key to uniquely identify a programme programmatically because there is not an alternative in the form of consistent unique identifi ers. These values will however be hidden to any user.
Number
No Unique descriptor for a programme. It is left for future use but will not currently have values as programmes do not have an identifying number at this stage.
Text
Acronym Acronym for the programme. Programmes are currently uniquely identifi ed by their acronyms even though every programme may not have an acronym
Text
Name Name of the programme Text
URL Web Address of the programme if it is available on a website
Description Provide an overall description of the programme including the mission, aims and objectives of the programme
Text
Targets Describes the list of tangible outputs intended to be produced by the programme e.g. 10 km of road built or 20 mobile clinics. These will differ between programmes.
Text
Outputs Describes the list of tangible outputs actually achieved by the programme. These will differ between programmes.
Text
StartDate The date or year that the programme started. Text
EndDate The date or year that the programme was completed or discontinued. Text
Status Status of the project: Planned: Programme has been approved and is in the planning phase.Implemented: Programme is currently in process and actively achieving objectives.Reviewed: Programme has been running for a while and is now in process of being reviewed. Programme activities still continue taking place during this phase. Completed: The Programme has successfully completed its activities.
Text
Organisation The name of the organisation or department that owns and is responsible for the programme.
Text
Des
crib
e
24
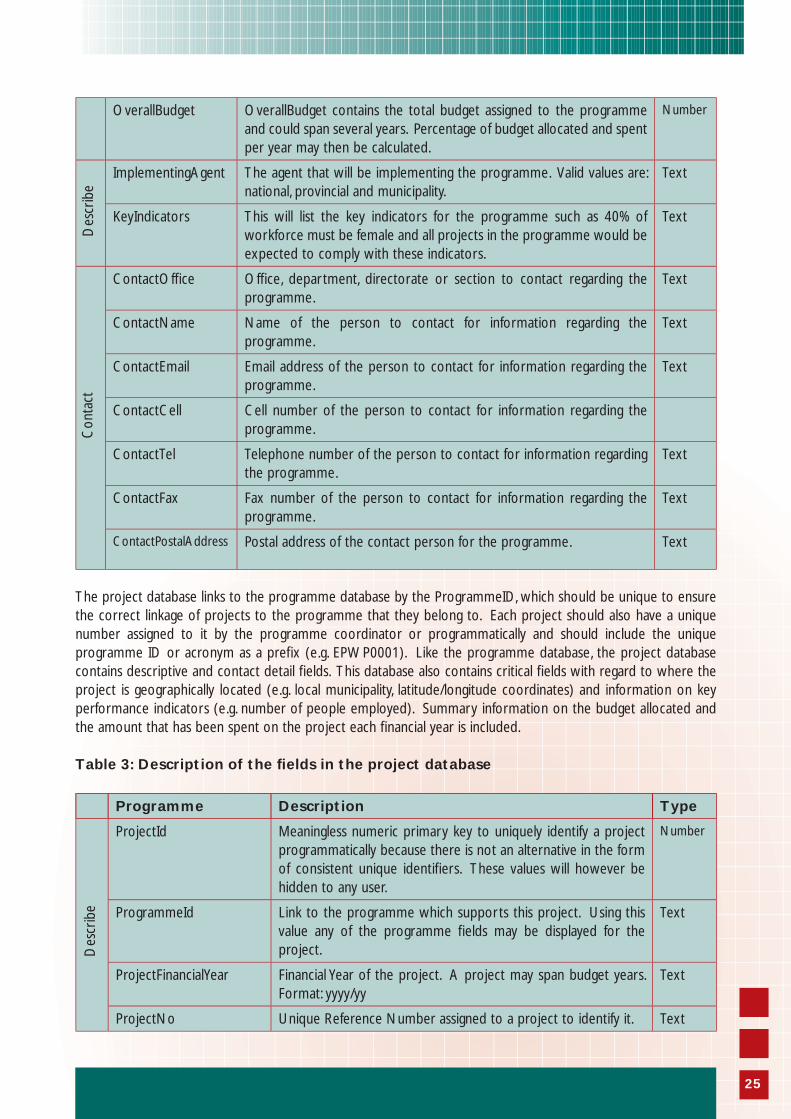
OverallBudget OverallBudget contains the total budget assigned to the programme and could span several years. Percentage of budget allocated and spent per year may then be calculated.
Number
ImplementingAgent The agent that will be implementing the programme. Valid values are: national, provincial and municipality.
Text
KeyIndicators This will list the key indicators for the programme such as 40% of workforce must be female and all projects in the programme would be expected to comply with these indicators.
Text
ContactOffi ce Offi ce, department, directorate or section to contact regarding the programme.
Text
ContactName Name of the person to contact for information regarding the programme.
Text
ContactEmail Email address of the person to contact for information regarding the programme.
Text
ContactCell Cell number of the person to contact for information regarding the programme.
ContactTel Telephone number of the person to contact for information regarding the programme.
Text
ContactFax Fax number of the person to contact for information regarding the programme.
Text
ContactPostalAddress Postal address of the contact person for the programme. Text
The project database links to the programme database by the ProgrammeID, which should be unique to ensure the correct linkage of projects to the programme that they belong to. Each project should also have a unique number assigned to it by the programme coordinator or programmatically and should include the unique programme ID or acronym as a prefi x (e.g. EPWP0001). Like the programme database, the project database contains descriptive and contact detail fi elds. This database also contains critical fi elds with regard to where the project is geographically located (e.g. local municipality, latitude/longitude coordinates) and information on key performance indicators (e.g. number of people employed). Summary information on the budget allocated and the amount that has been spent on the project each fi nancial year is included.
Table 3: Description of the fi elds in the project database
Programme Description Type
ProjectId Meaningless numeric primary key to uniquely identify a project programmatically because there is not an alternative in the form of consistent unique identifi ers. These values will however be hidden to any user.
Number
ProgrammeId Link to the programme which supports this project. Using this value any of the programme fi elds may be displayed for the project.
Text
ProjectFinancialYear Financial Year of the project. A project may span budget years. Format: yyyy/yy
Text
ProjectNo Unique Reference Number assigned to a project to identify it. Text
Des
crib
eC
onta
ctD
escr
ibe
25
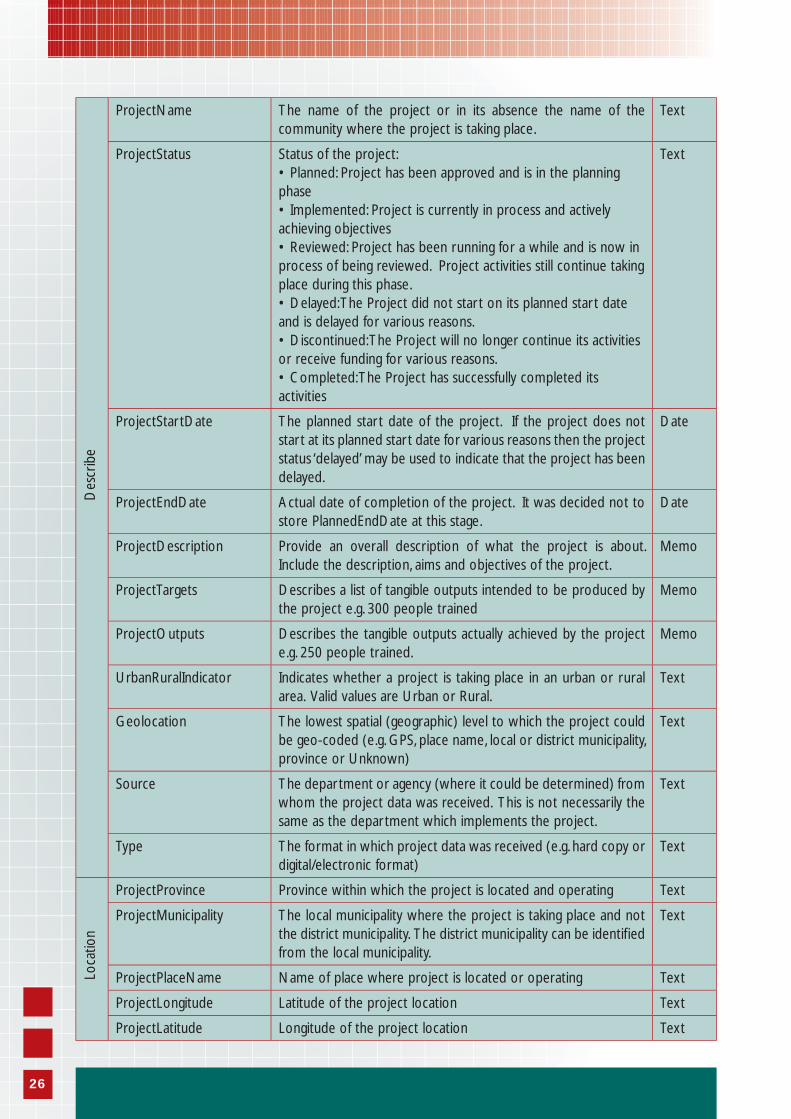
ProjectName The name of the project or in its absence the name of the community where the project is taking place.
Text
ProjectStatus Status of the project: • Planned: Project has been approved and is in the planning phase• Implemented: Project is currently in process and actively achieving objectives• Reviewed: Project has been running for a while and is now in process of being reviewed. Project activities still continue taking place during this phase. • Delayed: The Project did not start on its planned start date and is delayed for various reasons.• Discontinued: The Project will no longer continue its activities or receive funding for various reasons.• Completed: The Project has successfully completed its activities
Text
ProjectStartDate The planned start date of the project. If the project does not start at its planned start date for various reasons then the project status ‘delayed’ may be used to indicate that the project has been delayed.
Date
ProjectEndDate Actual date of completion of the project. It was decided not to store PlannedEndDate at this stage.
Date
ProjectDescription Provide an overall description of what the project is about. Include the description, aims and objectives of the project.
Memo
ProjectTargets Describes a list of tangible outputs intended to be produced by the project e.g. 300 people trained
Memo
ProjectOutputs Describes the tangible outputs actually achieved by the project e.g. 250 people trained.
Memo
UrbanRuralIndicator Indicates whether a project is taking place in an urban or rural area. Valid values are Urban or Rural.
Text
Geolocation The lowest spatial (geographic) level to which the project could be geo-coded (e.g. GPS, place name, local or district municipality, province or Unknown)
Text
Source The department or agency (where it could be determined) from whom the project data was received. This is not necessarily the same as the department which implements the project.
Text
Type The format in which project data was received (e.g. hard copy or digital/electronic format)
Text
ProjectProvince Province within which the project is located and operating Text
ProjectMunicipality The local municipality where the project is taking place and not the district municipality. The district municipality can be identifi ed from the local municipality.
Text
ProjectPlaceName Name of place where project is located or operating Text
ProjectLongitude Latitude of the project location Text
ProjectLatitude Longitude of the project location Text
Des
crib
eLo
catio
n
26
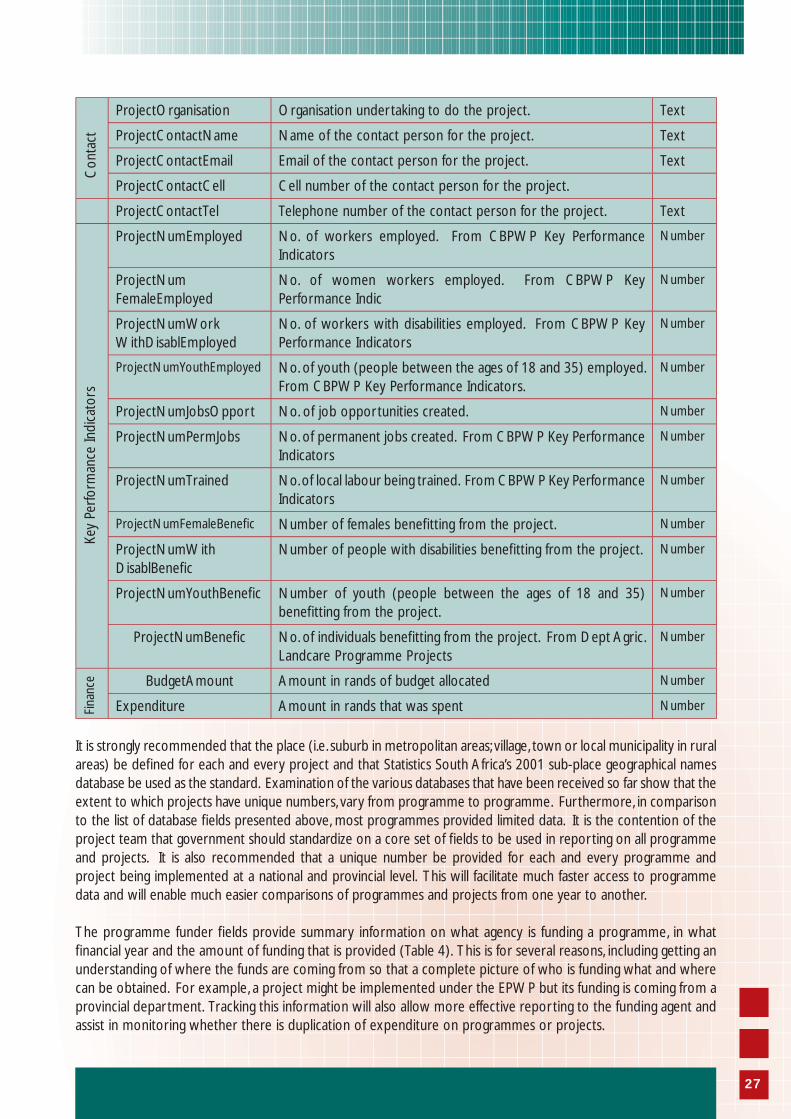
ProjectOrganisation Organisation undertaking to do the project. Text
ProjectContactName Name of the contact person for the project. Text
ProjectContactEmail Email of the contact person for the project. Text
ProjectContactCell Cell number of the contact person for the project.
ProjectContactTel Telephone number of the contact person for the project. Text
ProjectNumEmployed No. of workers employed. From CBPWP Key Performance Indicators
Number
ProjectNumFemaleEmployed
No. of women workers employed. From CBPWP Key Performance Indic
Number
ProjectNumWorkWithDisablEmployed
No. of workers with disabilities employed. From CBPWP Key Performance Indicators
Number
ProjectNumYouthEmployed No. of youth (people between the ages of 18 and 35) employed. From CBPWP Key Performance Indicators.
Number
ProjectNumJobsOpport No. of job opportunities created. Number
ProjectNumPermJobs No. of permanent jobs created. From CBPWP Key Performance Indicators
Number
ProjectNumTrained No. of local labour being trained. From CBPWP Key Performance Indicators
Number
ProjectNumFemaleBenefi c Number of females benefi tting from the project. Number
ProjectNumWithDisablBenefi c
Number of people with disabilities benefi tting from the project. Number
ProjectNumYouthBenefi c Number of youth (people between the ages of 18 and 35) benefi tting from the project.
Number
ProjectNumBenefi c No. of individuals benefi tting from the project. From Dept Agric. Landcare Programme Projects
Number
BudgetAmount Amount in rands of budget allocated Number
Expenditure Amount in rands that was spent Number
It is strongly recommended that the place (i.e. suburb in metropolitan areas; village, town or local municipality in rural areas) be defi ned for each and every project and that Statistics South Africa’s 2001 sub-place geographical names database be used as the standard. Examination of the various databases that have been received so far show that the extent to which projects have unique numbers, vary from programme to programme. Furthermore, in comparison to the list of database fi elds presented above, most programmes provided limited data. It is the contention of the project team that government should standardize on a core set of fi elds to be used in reporting on all programme and projects. It is also recommended that a unique number be provided for each and every programme and project being implemented at a national and provincial level. This will facilitate much faster access to programme data and will enable much easier comparisons of programmes and projects from one year to another.
The programme funder fi elds provide summary information on what agency is funding a programme, in what fi nancial year and the amount of funding that is provided (Table 4). This is for several reasons, including getting an understanding of where the funds are coming from so that a complete picture of who is funding what and where can be obtained. For example, a project might be implemented under the EPWP but its funding is coming from a provincial department. Tracking this information will also allow more effective reporting to the funding agent and assist in monitoring whether there is duplication of expenditure on programmes or projects.
Con
tact
Key
Perfo
rman
ce In
dica
tors
27
Fina
nce
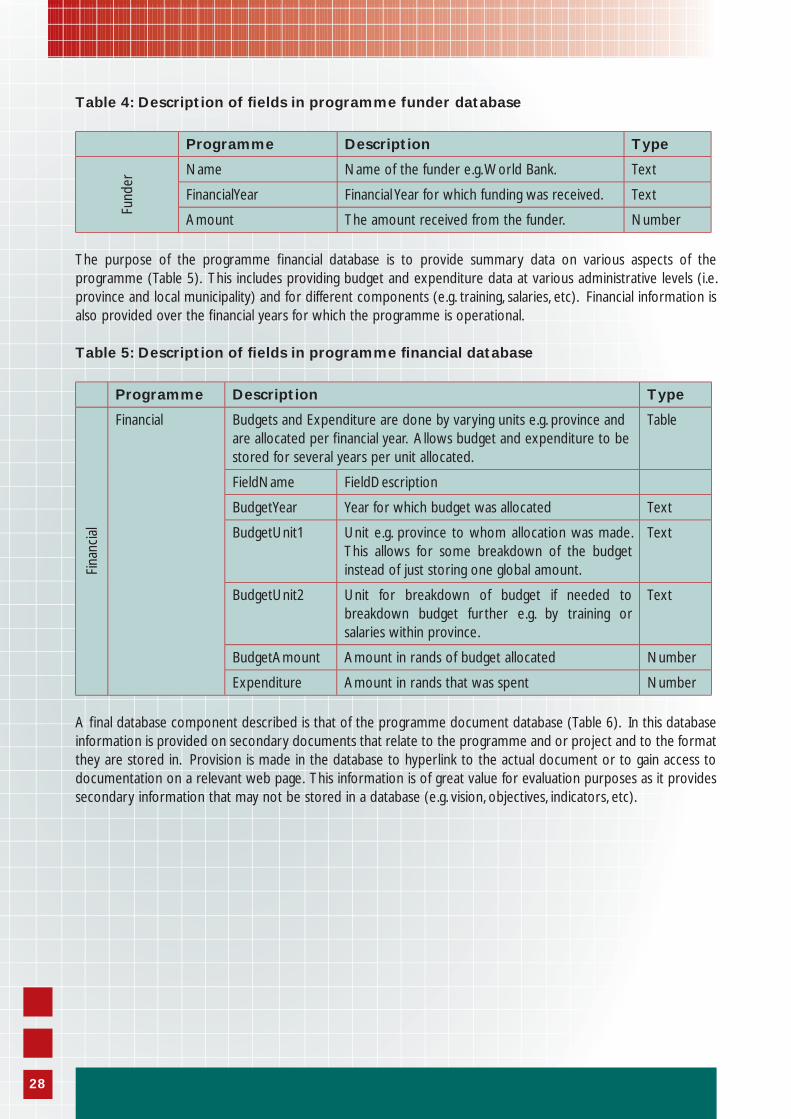
Table 4: Description of fi elds in programme funder database
Programme Description TypeFu
nder
Name Name of the funder e.g. World Bank. Text
FinancialYear Financial Year for which funding was received. Text
Amount The amount received from the funder. Number
The purpose of the programme fi nancial database is to provide summary data on various aspects of the programme (Table 5). This includes providing budget and expenditure data at various administrative levels (i.e. province and local municipality) and for different components (e.g. training, salaries, etc). Financial information is also provided over the fi nancial years for which the programme is operational.
Table 5: Description of fi elds in programme fi nancial database
Programme Description Type
Fina
ncia
l
Financial Budgets and Expenditure are done by varying units e.g. province and are allocated per fi nancial year. Allows budget and expenditure to be stored for several years per unit allocated.
Table
FieldName FieldDescription
BudgetYear Year for which budget was allocated Text
BudgetUnit1 Unit e.g. province to whom allocation was made. This allows for some breakdown of the budget instead of just storing one global amount.
Text
BudgetUnit2 Unit for breakdown of budget if needed to breakdown budget further e.g. by training or salaries within province.
Text
BudgetAmount Amount in rands of budget allocated Number
Expenditure Amount in rands that was spent Number
A fi nal database component described is that of the programme document database (Table 6). In this database information is provided on secondary documents that relate to the programme and or project and to the format they are stored in. Provision is made in the database to hyperlink to the actual document or to gain access to documentation on a relevant web page. This information is of great value for evaluation purposes as it provides secondary information that may not be stored in a database (e.g. vision, objectives, indicators, etc).
28
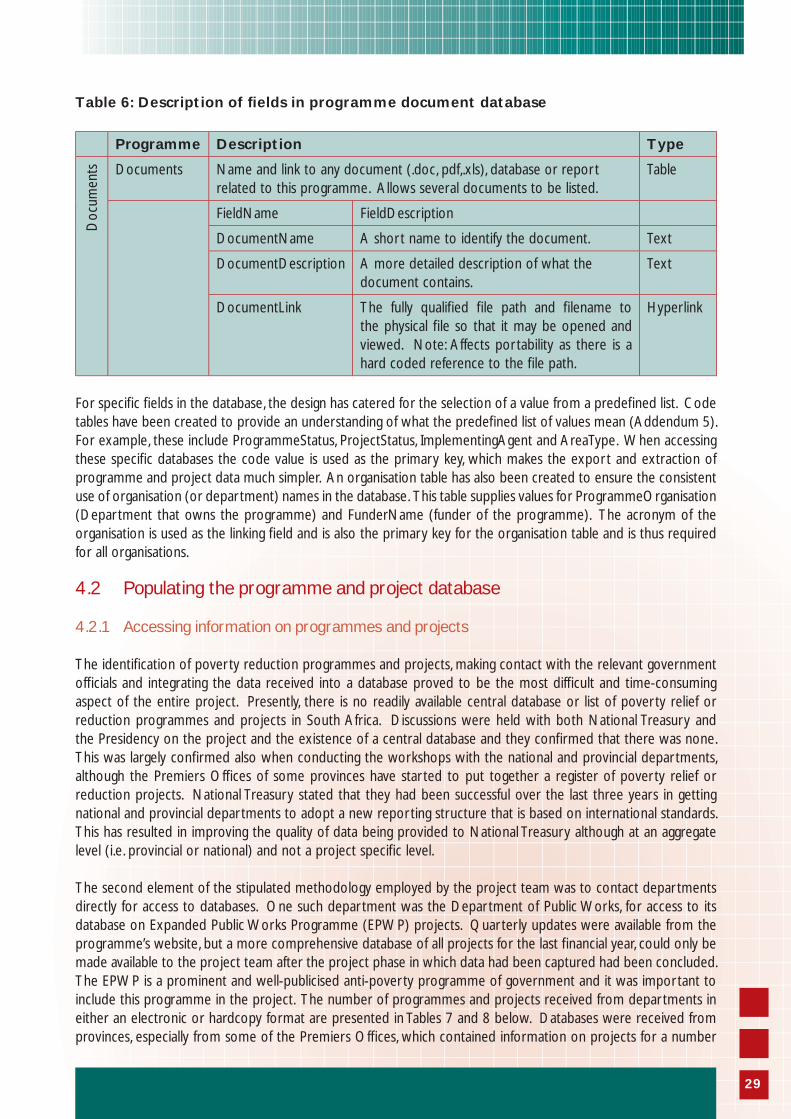
Table 6: Description of fi elds in programme document database
Programme Description Type
Doc
umen
ts Documents Name and link to any document (.doc, pdf,.xls), database or report related to this programme. Allows several documents to be listed.
Table
FieldName FieldDescription
DocumentName A short name to identify the document. Text
DocumentDescription A more detailed description of what the document contains.
Text
DocumentLink The fully qualifi ed fi le path and fi lename to the physical fi le so that it may be opened and viewed. Note: Affects portability as there is a hard coded reference to the fi le path.
Hyperlink
For specifi c fi elds in the database, the design has catered for the selection of a value from a predefi ned list. Code tables have been created to provide an understanding of what the predefi ned list of values mean (Addendum 5). For example, these include ProgrammeStatus, ProjectStatus, ImplementingAgent and AreaType. When accessing these specifi c databases the code value is used as the primary key, which makes the export and extraction of programme and project data much simpler. An organisation table has also been created to ensure the consistent use of organisation (or department) names in the database. This table supplies values for ProgrammeOrganisation (Department that owns the programme) and FunderName (funder of the programme). The acronym of the organisation is used as the linking fi eld and is also the primary key for the organisation table and is thus required for all organisations.
4.2 Populating the programme and project database
4.2.1 Accessing information on programmes and projects
The identifi cation of poverty reduction programmes and projects, making contact with the relevant government offi cials and integrating the data received into a database proved to be the most diffi cult and time-consuming aspect of the entire project. Presently, there is no readily available central database or list of poverty relief or reduction programmes and projects in South Africa. Discussions were held with both National Treasury and the Presidency on the project and the existence of a central database and they confi rmed that there was none. This was largely confi rmed also when conducting the workshops with the national and provincial departments, although the Premiers Offi ces of some provinces have started to put together a register of poverty relief or reduction projects. National Treasury stated that they had been successful over the last three years in getting national and provincial departments to adopt a new reporting structure that is based on international standards. This has resulted in improving the quality of data being provided to National Treasury although at an aggregate level (i.e. provincial or national) and not a project specifi c level.
The second element of the stipulated methodology employed by the project team was to contact departments directly for access to databases. One such department was the Department of Public Works, for access to its database on Expanded Public Works Programme (EPWP) projects. Quarterly updates were available from the programme’s website, but a more comprehensive database of all projects for the last fi nancial year, could only be made available to the project team after the project phase in which data had been captured had been concluded. The EPWP is a prominent and well-publicised anti-poverty programme of government and it was important to include this programme in the project. The number of programmes and projects received from departments in either an electronic or hardcopy format are presented in Tables 7 and 8 below. Databases were received from provinces, especially from some of the Premiers Offi ces, which contained information on projects for a number
29

of different departments and programmes (e.g. the Free State and Mpumalanga).
Although certain programmes, such as the EPWP of the national Department of Public Works and the Integrated Sustainable Rural Development (ISRD), Urban Renewal Programme (URP), Local Economic Development, Consolidated Municipal Infrastructure Programme (CMIP) and Municipal Infrastructure Grant (MIG) of the Department of Provincial and Local Government (DPLG) contain the majority of the poverty reduction projects being implemented for national and provincial departments, some national and provincial departments are implementing smaller programmes on their own, such as the Department of Social Development’s Food and Emergency Relief Programme and the HIV and AIDS Programme. Furthermore, provinces are implementing poverty relief projects using their own funds that are not registered in the databases of the larger programmes and, therefore, the necessity for the Premiers’ Offi ces to collate information on their poverty relief programmes at a provincial level.
A complexity of these project databases is that they may be incorporated into both national and provincial databases resulting in records possibly being duplicated. Without a unique programme or project identifi cation code, the ability to identify these duplicate records is limited and can only be done through a comparison of project names, which is extremely diffi cult to do and very time consuming. There would clearly be a need for departments to fi nd ways on sharing information on their individual databases to avoid such duplication.
What became apparent is that there is little or no standards for information provided on poverty reduction programmes and their projects. This confi rms the necessity for a system to report on a standardized set of poverty relief programme indicators.
Clearly, this points to the need for departments to adopt better approaches (e.g. norms and standards and indicators), as suggested by National Treasury. There is also the need for a system that will allow the information from national and provincial departments to be easily accessed for monitoring and evaluation purposes.
Twenty-nine thousand, nine hundred and sixty-six (29 966) projects are presented in the integrated database. In future, consideration should be given to how information on poverty relief programmes become “offi cial” statistics that can be incorporated into the National Statistical System (NSS) and contain the necessary endorsement from departments that the data provided is accurate and complete.
Statistics South Africa as custodian of the National Statistics System could provide advice on indicators to use in the reporting on poverty reduction programmes. The Presidency could play a facilitation role to get the necessary systems in place that would allow the data on poverty reduction programmes and projects to be recorded into a central database as is suggested in the PoA. At this stage it is recommended that the Presidency be the custodian of the central database.
Having such a system and comprehensive central database will allow departments to get access to the information they require to inform their planning systems and to undertake evaluations of government programmes.
4.2.2 Capturing of programme and project data received into the database
Throughout the project, programme managers were requested to provide the data in a digital format. Digital formats ranged from documents supplied in Microsoft Word format and as Microsoft Excel workbooks with either one or multiple sheets. They were also requested to provide specifi c data that could be used to populate the database.
Many of the programmes provided a list of poverty relief projects in hardcopy format. Documents that appeared on websites were usually in a PDF format and these were printed and treated as hard copies, since extracting text from PDF documents was regarded as too time-consuming. Project team members were responsible for
30
compiling the integrated database from the digital and hard copies, respectively. Regular quality checks were performed to ensure that data capturing errors were kept to a minimum.
Although care was taken during the integration of both hard copy and digital sources of data, no guarantee can be given on quality of the data. The reasons for this are twofold. In the fi rst instance, the signifi cant variation in the variables incorporated into the programme databases and documentation made it extremely diffi cult to integrate. In the second instance, the erratic spelling of programme and project names and especially variables containing geographic information (e.g. place name, local and district municipality) has made it diffi cult to map the projects within the time frame of this project. Having integrated the data into the database considerable editing had to be done. However, this too was an enormous task that will require more person hours than are available to complete this project.
The population of core data fi elds was also highly dependent on the entries supplied in digital and hardcopy format by the various government departments. Signifi cant errors were discovered with data in fi elds not matching the variable names. One example is that the project owner may be a local municipality or a provincial government department. However, in the project owner fi eld the record provided does not refer to who is the source/custodian of the data. Thus the fi eld, ProjectMunicipality, had records that mainly contained municipality names, while another contained ‘Agriculture’. These obviously inaccurate entries were edited in the database and the record of the project was retained.
In many cases, the spelling of geographical place names was not the same. Furthermore, there were mismatches between the data provided and the names of the variables. For example, a village name would be entered into the ProjectMunicipality fi eld and in other instances; there was a mixture of district and local municipalities in the same fi eld. Variations in spelling, the truncation of names and the complete omission of data from fi elds, but especially geographical place name, has made it largely impossible to develop an integrated database of suffi cient quality. All of the above talks to the necessity of standards in capturing programme information and the core set of variables that all programmes should collect for M&E purposes.
It must also be noted that some programme databases could not be captured and integrated into the database because they were received too late in the project. Furthermore, it is anticipated that reports on programmes will continue to be received even after the completion of this phase of the project. Therefore, consideration must be given as to how the electronic, hardcopy and late submissions of programme projects can be used for sampling in the evaluation phase of the project. One such example is the ‘Project Analysis Report’, made available by the DPLG on the Integrated Sustainable Rural Development Programme (ISRDP). The report lists project linkages, stakeholders, objectives and several projects specifi c details are provided in a Microsoft Word document. Even if this report were received in a digital format, it would have taken several days to integrate the data into the standardised format of the database designed by the project team.
What has been received and been integrated into the database is summarized in the tables below. A total of 29 966 projects spread across the nine provinces and from several different programmes that are implemented at a national and provincial level have been integrated into the database. The provinces with the highest number of projects are Eastern Cape (6 781), Free State (4 606), KwaZulu-Natal (4 179) and Limpopo (3 568). The main reason for the Free State having such a high number of projects is because of the work that the Offi ce of the Premier has done in establishing their project register. In the Eastern Cape there is quite an even spread of projects amongst several programmes with the highest number coming from the national Department of Land Affair’s Land Reform Programme. In most of the provinces the majority of projects captured into the database were from the Department of Education’s National School Nutrition Programme (NSNP).
31
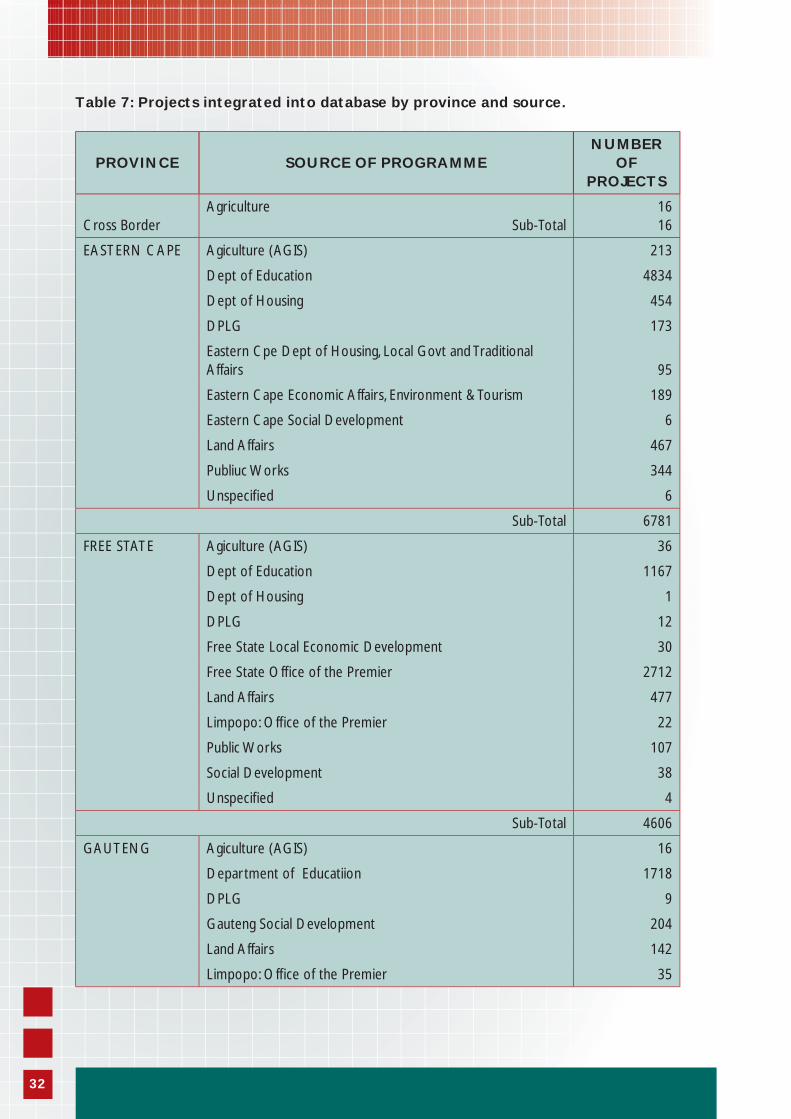
Table 7: Projects integrated into database by province and source.
PROVINCE SOURCE OF PROGRAMMENUMBER
OF PROJECTS
Cross BorderAgriculture Sub-Total
1616
EASTERN CAPE Agiculture (AGIS) 213
Dept of Education 4834
Dept of Housing 454
DPLG 173
Eastern Cpe Dept of Housing, Local Govt and Traditional Affairs 95
Eastern Cape Economic Affairs, Environment & Tourism 189
Eastern Cape Social Development 6
Land Affairs 467
Publiuc Works 344
Unspecifi ed 6
Sub-Total 6781
FREE STATE Agiculture (AGIS) 36
Dept of Education 1167
Dept of Housing 1
DPLG 12
Free State Local Economic Development 30
Free State Offi ce of the Premier 2712
Land Affairs 477
Limpopo: Offi ce of the Premier 22
Public Works 107
Social Development 38
Unspecifi ed 4
Sub-Total 4606
GAUTENG Agiculture (AGIS) 16
Department of Educatiion 1718
DPLG 9
Gauteng Social Development 204
Land Affairs 142
Limpopo: Offi ce of the Premier 35
32
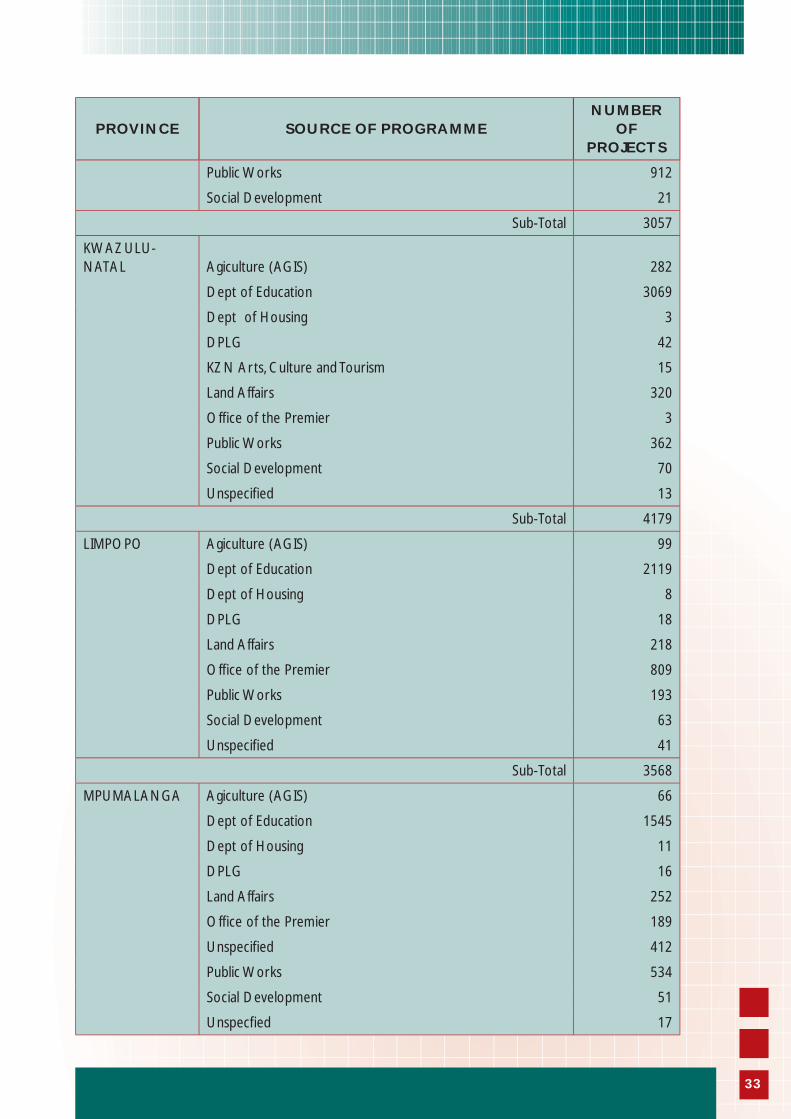
PROVINCE SOURCE OF PROGRAMMENUMBER
OF PROJECTS
Public Works 912
Social Development 21
Sub-Total 3057
KWAZULU-NATAL Agiculture (AGIS) 282
Dept of Education 3069
Dept of Housing 3
DPLG 42
KZN Arts, Culture and Tourism 15
Land Affairs 320
Offi ce of the Premier 3
Public Works 362
Social Development 70
Unspecifi ed 13
Sub-Total 4179
LIMPOPO Agiculture (AGIS) 99
Dept of Education 2119
Dept of Housing 8
DPLG 18
Land Affairs 218
Offi ce of the Premier 809
Public Works 193
Social Development 63
Unspecifi ed 41
Sub-Total 3568
MPUMALANGA Agiculture (AGIS) 66
Dept of Education 1545
Dept of Housing 11
DPLG 16
Land Affairs 252
Offi ce of the Premier 189
Unspecifi ed 412
Public Works 534
Social Development 51
Unspecfi ed 17
33
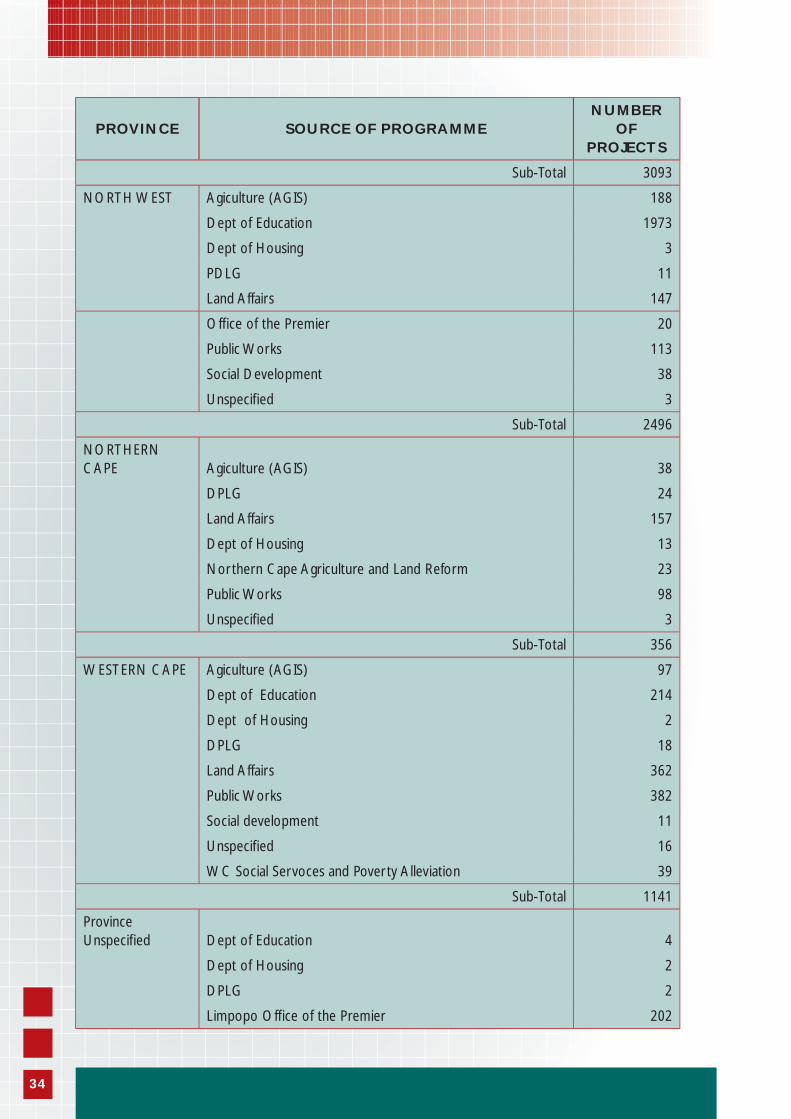
PROVINCE SOURCE OF PROGRAMMENUMBER
OF PROJECTS
Sub-Total 3093
NORTH WEST Agiculture (AGIS) 188
Dept of Education 1973
Dept of Housing 3
PDLG 11
Land Affairs 147
Offi ce of the Premier 20
Public Works 113
Social Development 38
Unspecifi ed 3
Sub-Total 2496
NORTHERN CAPE Agiculture (AGIS) 38
DPLG 24
Land Affairs 157
Dept of Housing 13
Northern Cape Agriculture and Land Reform 23
Public Works 98
Unspecifi ed 3
Sub-Total 356
WESTERN CAPE Agiculture (AGIS) 97
Dept of Education 214
Dept of Housing 2
DPLG 18
Land Affairs 362
Public Works 382
Social development 11
Unspecifi ed 16
WC Social Servoces and Poverty Alleviation 39
Sub-Total 1141
Province Unspecifi ed Dept of Education 4
Dept of Housing 2
DPLG 2
Limpopo Offi ce of the Premier 202
34
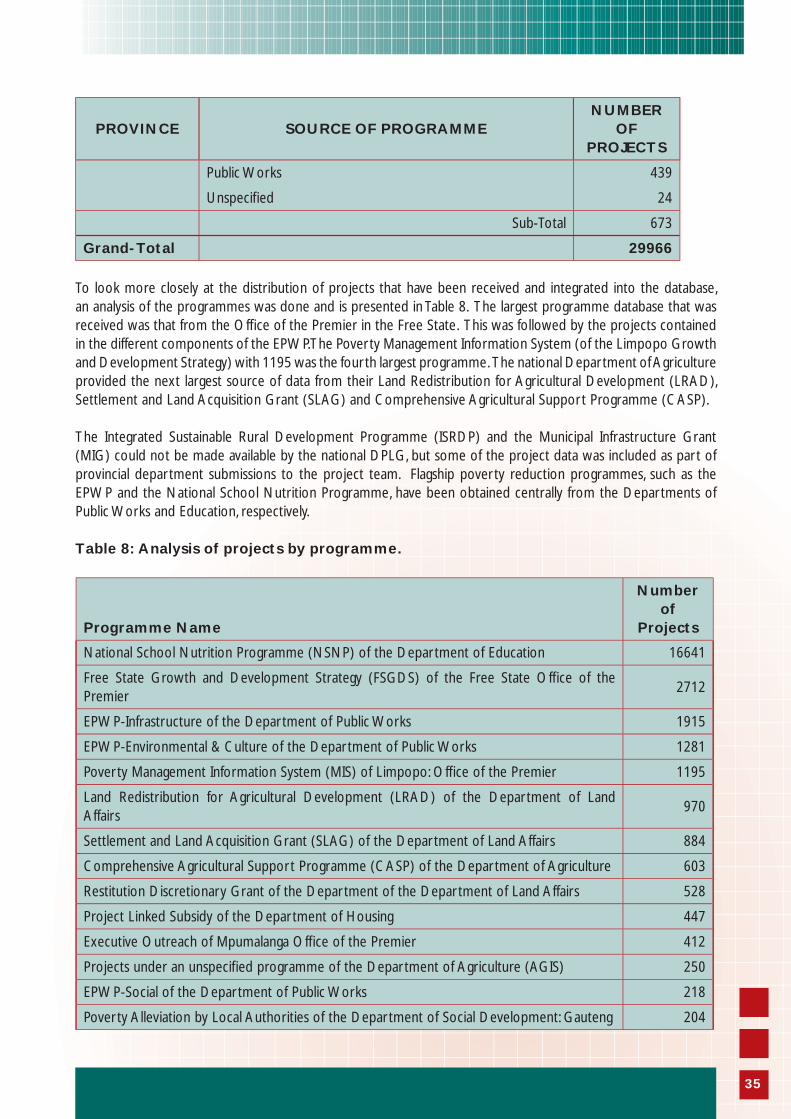
PROVINCE SOURCE OF PROGRAMMENUMBER
OF PROJECTS
Public Works 439
Unspecifi ed 24
Sub-Total 673
Grand-Total 29966
To look more closely at the distribution of projects that have been received and integrated into the database, an analysis of the programmes was done and is presented in Table 8. The largest programme database that was received was that from the Offi ce of the Premier in the Free State. This was followed by the projects contained in the different components of the EPWP. The Poverty Management Information System (of the Limpopo Growth and Development Strategy) with 1195 was the fourth largest programme. The national Department of Agriculture provided the next largest source of data from their Land Redistribution for Agricultural Development (LRAD), Settlement and Land Acquisition Grant (SLAG) and Comprehensive Agricultural Support Programme (CASP).
The Integrated Sustainable Rural Development Programme (ISRDP) and the Municipal Infrastructure Grant (MIG) could not be made available by the national DPLG, but some of the project data was included as part of provincial department submissions to the project team. Flagship poverty reduction programmes, such as the EPWP and the National School Nutrition Programme, have been obtained centrally from the Departments of Public Works and Education, respectively.
Table 8: Analysis of projects by programme.
Programme Name
Number of
Projects
National School Nutrition Programme (NSNP) of the Department of Education 16641
Free State Growth and Development Strategy (FSGDS) of the Free State Offi ce of the Premier
2712
EPWP-Infrastructure of the Department of Public Works 1915
EPWP-Environmental & Culture of the Department of Public Works 1281
Poverty Management Information System (MIS) of Limpopo: Offi ce of the Premier 1195
Land Redistribution for Agricultural Development (LRAD) of the Department of Land Affairs
970
Settlement and Land Acquisition Grant (SLAG) of the Department of Land Affairs 884
Comprehensive Agricultural Support Programme (CASP) of the Department of Agriculture 603
Restitution Discretionary Grant of the Department of the Department of Land Affairs 528
Project Linked Subsidy of the Department of Housing 447
Executive Outreach of Mpumalanga Offi ce of the Premier 412
Projects under an unspecifi ed programme of the Department of Agriculture (AGIS) 250
EPWP-Social of the Department of Public Works 218
Poverty Alleviation by Local Authorities of the Department of Social Development: Gauteng 204
35
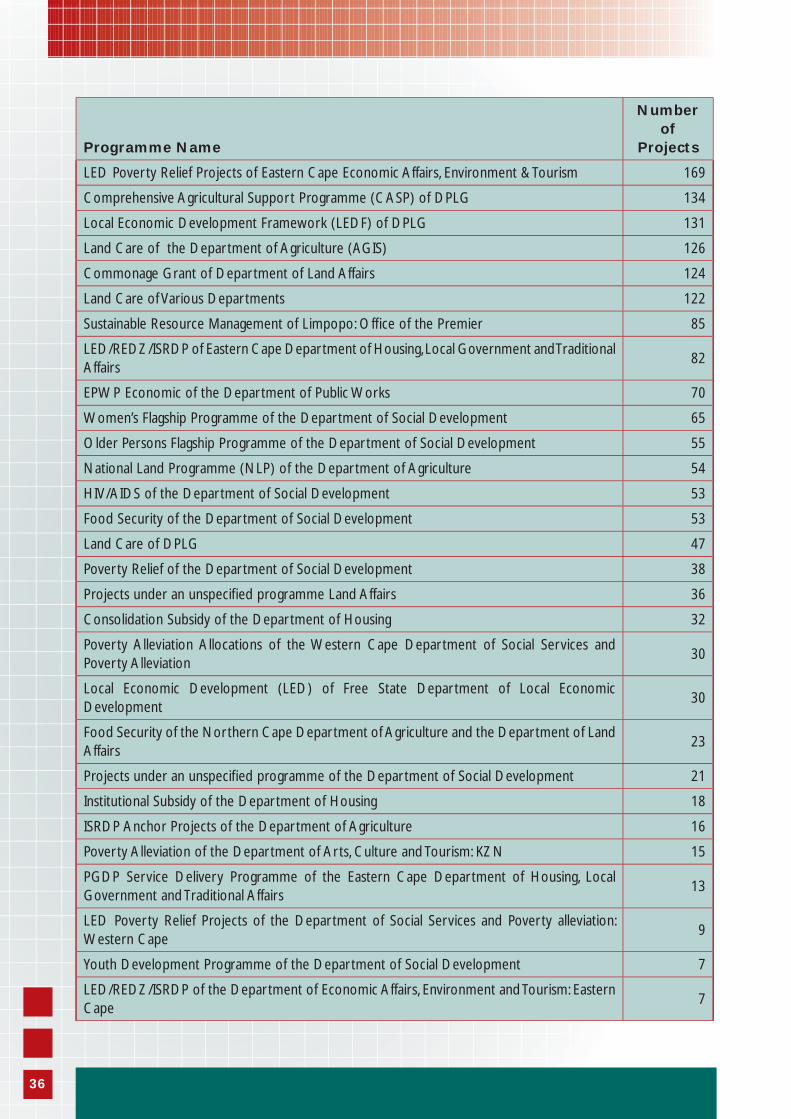
Programme Name
Number of
Projects
LED Poverty Relief Projects of Eastern Cape Economic Affairs, Environment & Tourism 169
Comprehensive Agricultural Support Programme (CASP) of DPLG 134
Local Economic Development Framework (LEDF) of DPLG 131
Land Care of the Department of Agriculture (AGIS) 126
Commonage Grant of Department of Land Affairs 124
Land Care of Various Departments 122
Sustainable Resource Management of Limpopo: Offi ce of the Premier 85
LED/REDZ/ISRDP of Eastern Cape Department of Housing, Local Government and Traditional Affairs
82
EPWP Economic of the Department of Public Works 70
Women’s Flagship Programme of the Department of Social Development 65
Older Persons Flagship Programme of the Department of Social Development 55
National Land Programme (NLP) of the Department of Agriculture 54
HIV/AIDS of the Department of Social Development 53
Food Security of the Department of Social Development 53
Land Care of DPLG 47
Poverty Relief of the Department of Social Development 38
Projects under an unspecifi ed programme Land Affairs 36
Consolidation Subsidy of the Department of Housing 32
Poverty Alleviation Allocations of the Western Cape Department of Social Services and Poverty Alleviation
30
Local Economic Development (LED) of Free State Department of Local Economic Development
30
Food Security of the Northern Cape Department of Agriculture and the Department of Land Affairs
23
Projects under an unspecifi ed programme of the Department of Social Development 21
Institutional Subsidy of the Department of Housing 18
ISRDP Anchor Projects of the Department of Agriculture 16
Poverty Alleviation of the Department of Arts, Culture and Tourism: KZN 15
PGDP Service Delivery Programme of the Eastern Cape Department of Housing, Local Government and Traditional Affairs
13
LED Poverty Relief Projects of the Department of Social Services and Poverty alleviation: Western Cape
9
Youth Development Programme of the Department of Social Development 7
LED/REDZ/ISRDP of the Department of Economic Affairs, Environment and Tourism: Eastern Cape
7
36
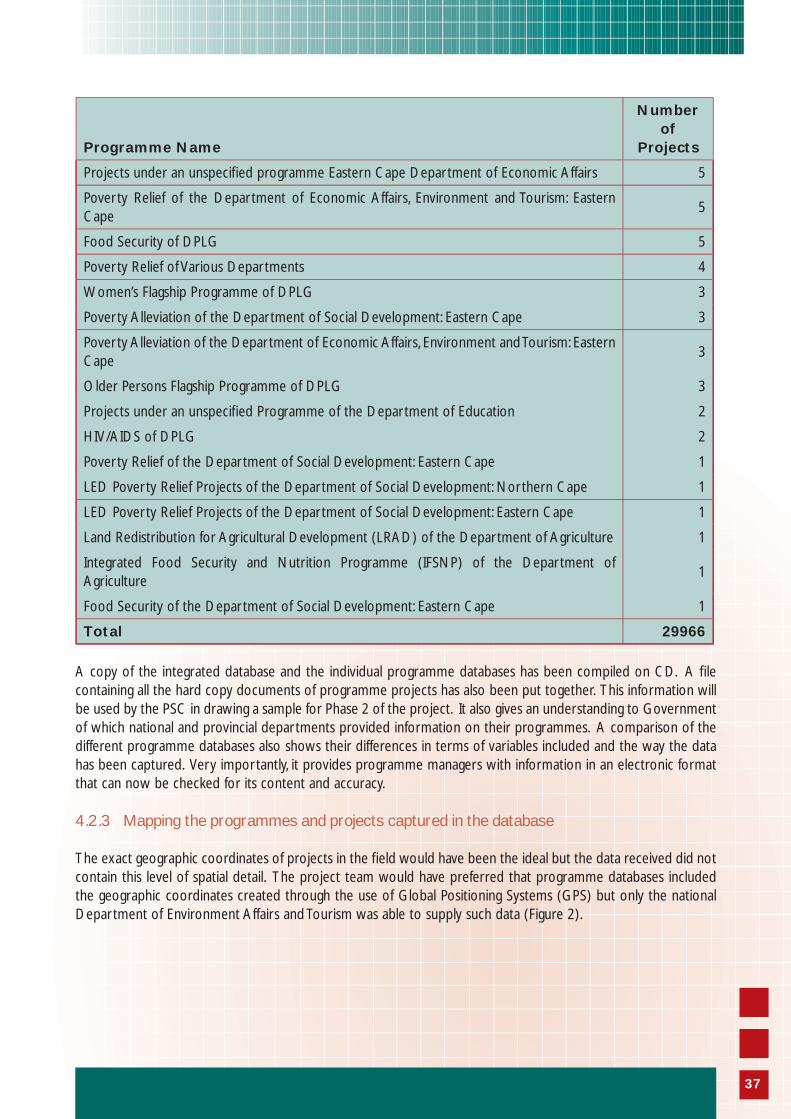
Programme Name
Number of
Projects
Projects under an unspecifi ed programme Eastern Cape Department of Economic Affairs 5
Poverty Relief of the Department of Economic Affairs, Environment and Tourism: Eastern Cape
5
Food Security of DPLG 5
Poverty Relief of Various Departments 4
Women’s Flagship Programme of DPLG 3
Poverty Alleviation of the Department of Social Development: Eastern Cape 3
Poverty Alleviation of the Department of Economic Affairs, Environment and Tourism: Eastern Cape
3
Older Persons Flagship Programme of DPLG 3
Projects under an unspecifi ed Programme of the Department of Education 2
HIV/AIDS of DPLG 2
Poverty Relief of the Department of Social Development: Eastern Cape 1
LED Poverty Relief Projects of the Department of Social Development: Northern Cape 1
LED Poverty Relief Projects of the Department of Social Development: Eastern Cape 1
Land Redistribution for Agricultural Development (LRAD) of the Department of Agriculture 1
Integrated Food Security and Nutrition Programme (IFSNP) of the Department of Agriculture
1
Food Security of the Department of Social Development: Eastern Cape 1
Total 29966 A copy of the integrated database and the individual programme databases has been compiled on CD. A fi le containing all the hard copy documents of programme projects has also been put together. This information will be used by the PSC in drawing a sample for Phase 2 of the project. It also gives an understanding to Government of which national and provincial departments provided information on their programmes. A comparison of the different programme databases also shows their differences in terms of variables included and the way the data has been captured. Very importantly, it provides programme managers with information in an electronic format that can now be checked for its content and accuracy.
4.2.3 Mapping the programmes and projects captured in the database
The exact geographic coordinates of projects in the fi eld would have been the ideal but the data received did not contain this level of spatial detail. The project team would have preferred that programme databases included the geographic coordinates created through the use of Global Positioning Systems (GPS) but only the national Department of Environment Affairs and Tourism was able to supply such data (Figure 2).
37
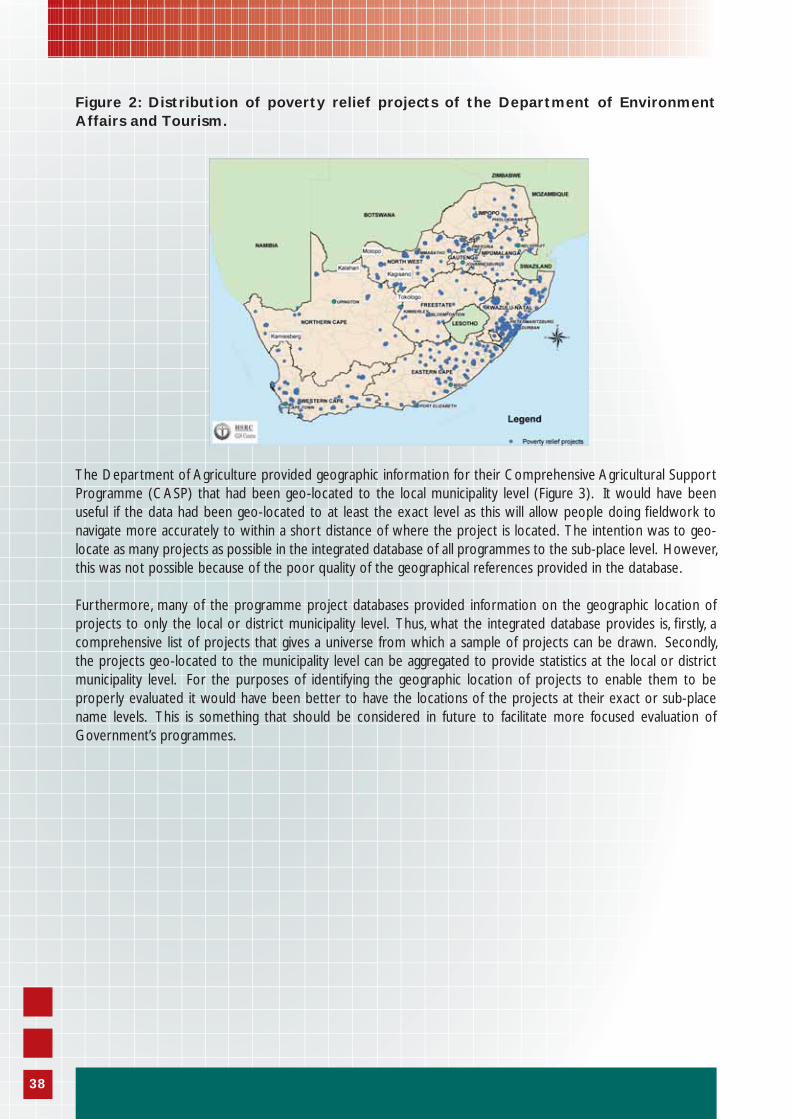
Figure 2: Distribution of poverty relief projects of the Department of Environment Affairs and Tourism.
The Department of Agriculture provided geographic information for their Comprehensive Agricultural Support Programme (CASP) that had been geo-located to the local municipality level (Figure 3). It would have been useful if the data had been geo-located to at least the exact level as this will allow people doing fi eldwork to navigate more accurately to within a short distance of where the project is located. The intention was to geo-locate as many projects as possible in the integrated database of all programmes to the sub-place level. However, this was not possible because of the poor quality of the geographical references provided in the database.
Furthermore, many of the programme project databases provided information on the geographic location of projects to only the local or district municipality level. Thus, what the integrated database provides is, fi rstly, a comprehensive list of projects that gives a universe from which a sample of projects can be drawn. Secondly, the projects geo-located to the municipality level can be aggregated to provide statistics at the local or district municipality level. For the purposes of identifying the geographic location of projects to enable them to be properly evaluated it would have been better to have the locations of the projects at their exact or sub-place name levels. This is something that should be considered in future to facilitate more focused evaluation of Government’s programmes.
38
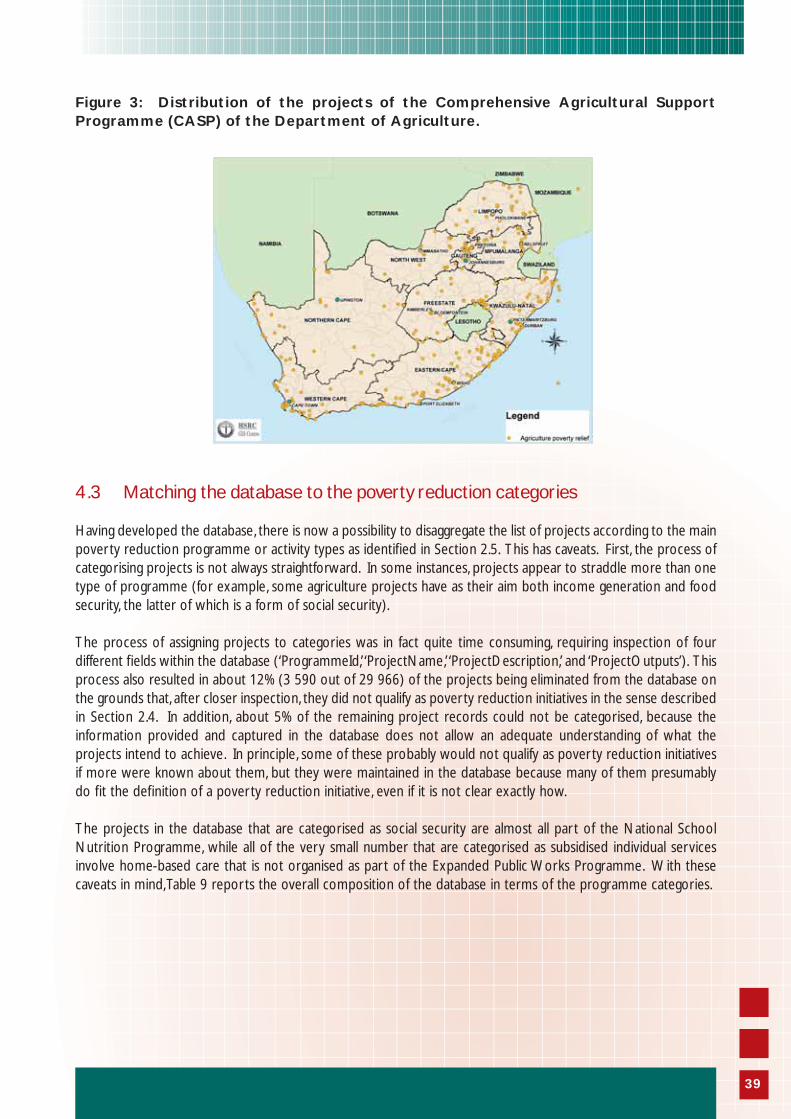
Figure 3: Distribution of the projects of the Comprehensive Agricultural Support Programme (CASP) of the Department of Agriculture.
4.3 Matching the database to the poverty reduction categories
Having developed the database, there is now a possibility to disaggregate the list of projects according to the main poverty reduction programme or activity types as identifi ed in Section 2.5. This has caveats. First, the process of categorising projects is not always straightforward. In some instances, projects appear to straddle more than one type of programme (for example, some agriculture projects have as their aim both income generation and food security, the latter of which is a form of social security).
The process of assigning projects to categories was in fact quite time consuming, requiring inspection of four different fi elds within the database (‘ProgrammeId,’ ‘ProjectName,’ ‘ProjectDescription,’ and ‘ProjectOutputs’). This process also resulted in about 12% (3 590 out of 29 966) of the projects being eliminated from the database on the grounds that, after closer inspection, they did not qualify as poverty reduction initiatives in the sense described in Section 2.4. In addition, about 5% of the remaining project records could not be categorised, because the information provided and captured in the database does not allow an adequate understanding of what the projects intend to achieve. In principle, some of these probably would not qualify as poverty reduction initiatives if more were known about them, but they were maintained in the database because many of them presumably do fi t the defi nition of a poverty reduction initiative, even if it is not clear exactly how.
The projects in the database that are categorised as social security are almost all part of the National School Nutrition Programme, while all of the very small number that are categorised as subsidised individual services involve home-based care that is not organised as part of the Expanded Public Works Programme. With these caveats in mind, Table 9 reports the overall composition of the database in terms of the programme categories.
39
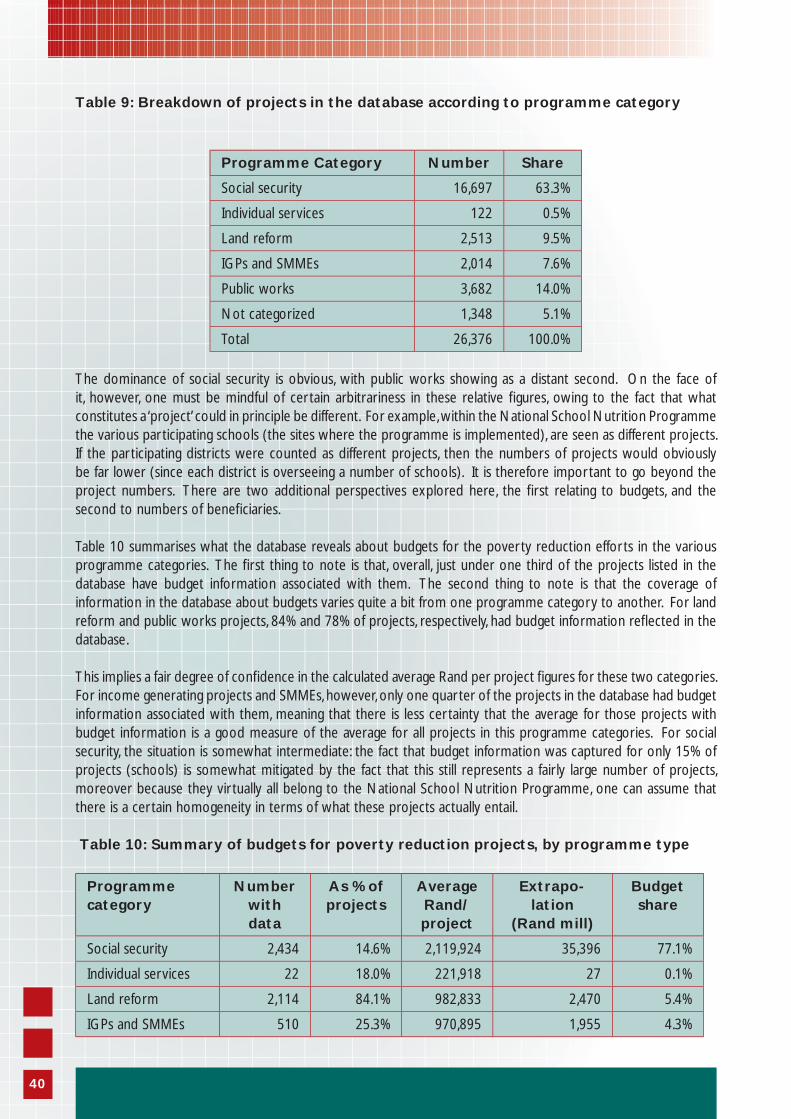
Table 9: Breakdown of projects in the database according to programme category
Programme Category Number Share
Social security 16,697 63.3%
Individual services 122 0.5%
Land reform 2,513 9.5%
IGPs and SMMEs 2,014 7.6%
Public works 3,682 14.0%
Not categorized 1,348 5.1%
Total 26,376 100.0%
The dominance of social security is obvious, with public works showing as a distant second. On the face of it, however, one must be mindful of certain arbitrariness in these relative fi gures, owing to the fact that what constitutes a ‘project’ could in principle be different. For example, within the National School Nutrition Programme the various participating schools (the sites where the programme is implemented), are seen as different projects. If the participating districts were counted as different projects, then the numbers of projects would obviously be far lower (since each district is overseeing a number of schools). It is therefore important to go beyond the project numbers. There are two additional perspectives explored here, the fi rst relating to budgets, and the second to numbers of benefi ciaries.
Table 10 summarises what the database reveals about budgets for the poverty reduction efforts in the various programme categories. The fi rst thing to note is that, overall, just under one third of the projects listed in the database have budget information associated with them. The second thing to note is that the coverage of information in the database about budgets varies quite a bit from one programme category to another. For land reform and public works projects, 84% and 78% of projects, respectively, had budget information refl ected in the database.
This implies a fair degree of confi dence in the calculated average Rand per project fi gures for these two categories. For income generating projects and SMMEs, however, only one quarter of the projects in the database had budget information associated with them, meaning that there is less certainty that the average for those projects with budget information is a good measure of the average for all projects in this programme categories. For social security, the situation is somewhat intermediate: the fact that budget information was captured for only 15% of projects (schools) is somewhat mitigated by the fact that this still represents a fairly large number of projects, moreover because they virtually all belong to the National School Nutrition Programme, one can assume that there is a certain homogeneity in terms of what these projects actually entail.
Table 10: Summary of budgets for poverty reduction projects, by programme type
Programme category
Number with data
As % of projects
Average Rand/project
Extrapo-lation
(Rand mill)
Budget share
Social security 2,434 14.6% 2,119,924 35,396 77.1%
Individual services 22 18.0% 221,918 27 0.1%
Land reform 2,114 84.1% 982,833 2,470 5.4%
IGPs and SMMEs 510 25.3% 970,895 1,955 4.3%
40
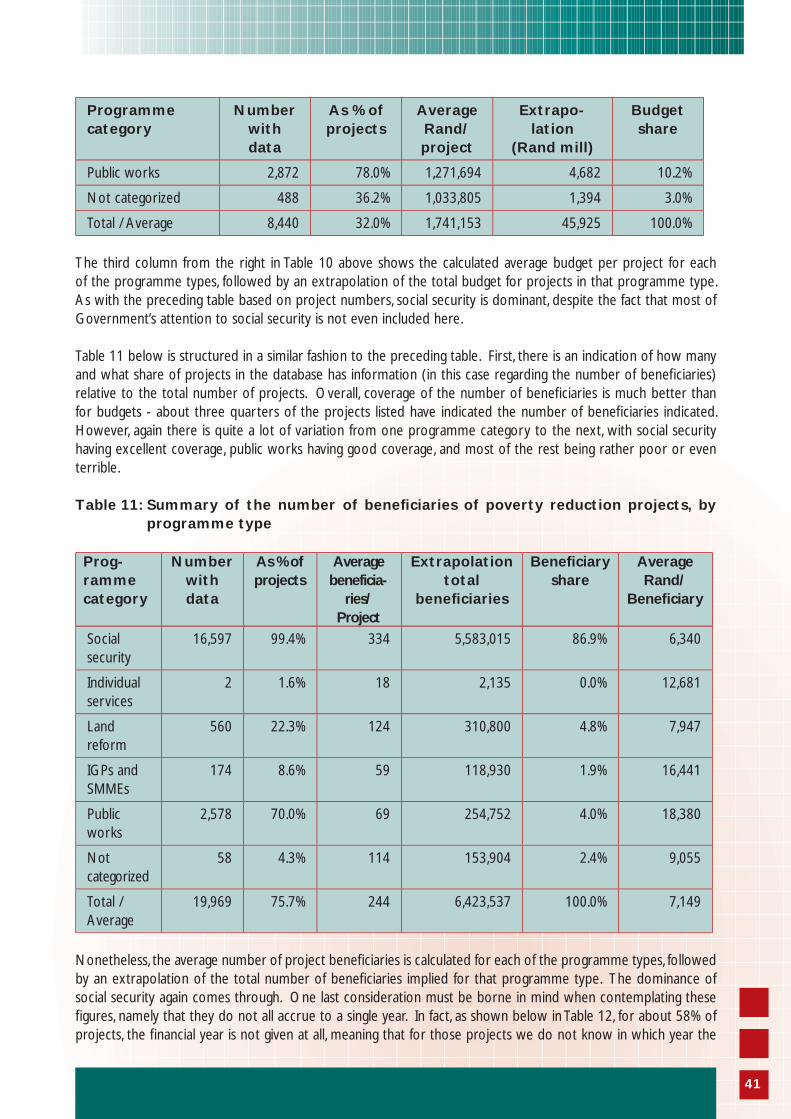
Programme category
Number with data
As % of projects
Average Rand/project
Extrapo-lation
(Rand mill)
Budget share
Public works 2,872 78.0% 1,271,694 4,682 10.2%
Not categorized 488 36.2% 1,033,805 1,394 3.0%
Total / Average 8,440 32.0% 1,741,153 45,925 100.0%
The third column from the right in Table 10 above shows the calculated average budget per project for each of the programme types, followed by an extrapolation of the total budget for projects in that programme type. As with the preceding table based on project numbers, social security is dominant, despite the fact that most of Government’s attention to social security is not even included here.
Table 11 below is structured in a similar fashion to the preceding table. First, there is an indication of how many and what share of projects in the database has information (in this case regarding the number of benefi ciaries) relative to the total number of projects. Overall, coverage of the number of benefi ciaries is much better than for budgets - about three quarters of the projects listed have indicated the number of benefi ciaries indicated. However, again there is quite a lot of variation from one programme category to the next, with social security having excellent coverage, public works having good coverage, and most of the rest being rather poor or even terrible.
Table 11: Summary of the number of benefi ciaries of poverty reduction projects, by programme type
Prog-ramme category
Number with data
As % of projects
Average beneficia-
ries/Project
Extrapolation total
benefi ciaries
Benefi ciary share
Average Rand/
Benefi ciary
Social security
16,597 99.4% 334 5,583,015 86.9% 6,340
Individual services
2 1.6% 18 2,135 0.0% 12,681
Land reform
560 22.3% 124 310,800 4.8% 7,947
IGPs and SMMEs
174 8.6% 59 118,930 1.9% 16,441
Public works
2,578 70.0% 69 254,752 4.0% 18,380
Not categorized
58 4.3% 114 153,904 2.4% 9,055
Total / Average
19,969 75.7% 244 6,423,537 100.0% 7,149
Nonetheless, the average number of project benefi ciaries is calculated for each of the programme types, followed by an extrapolation of the total number of benefi ciaries implied for that programme type. The dominance of social security again comes through. One last consideration must be borne in mind when contemplating these fi gures, namely that they do not all accrue to a single year. In fact, as shown below in Table 12, for about 58% of projects, the fi nancial year is not given at all, meaning that for those projects we do not know in which year the
41
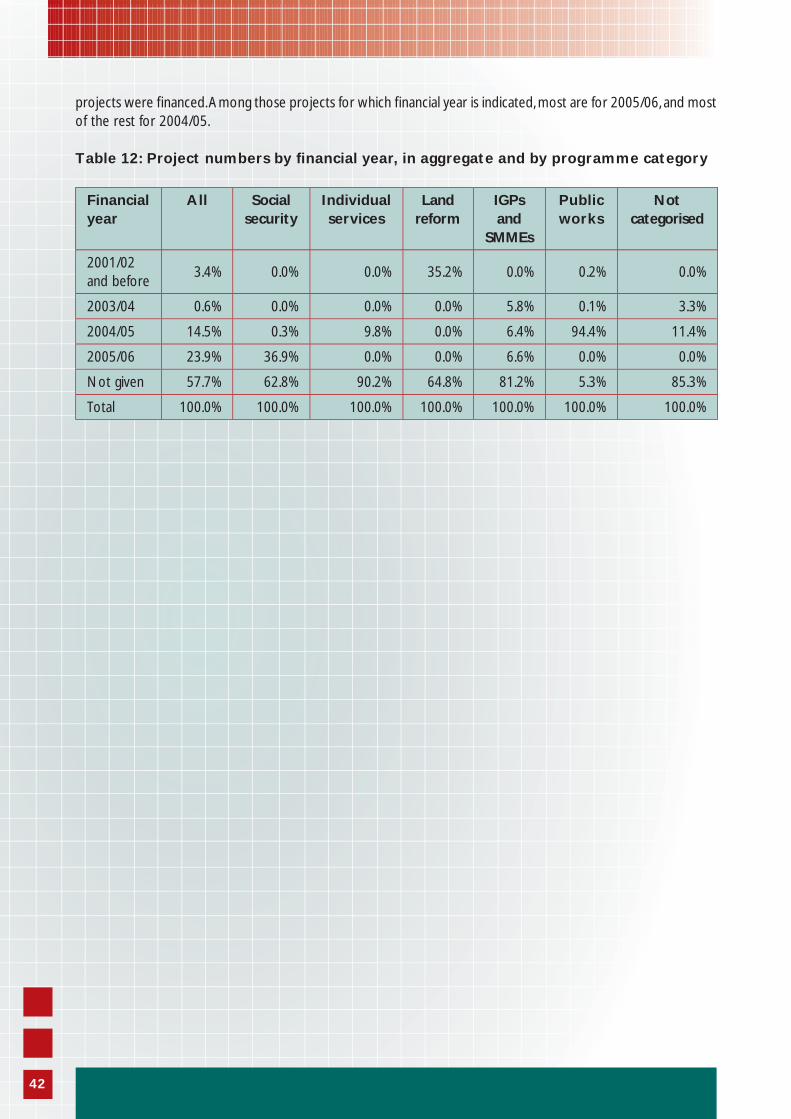
42
projects were fi nanced. Among those projects for which fi nancial year is indicated, most are for 2005/06, and most of the rest for 2004/05.
Table 12: Project numbers by fi nancial year, in aggregate and by programme category
Financial year
All Social security
Individual services
Land reform
IGPs and
SMMEs
Public works
Not categorised
2001/02 and before
3.4% 0.0% 0.0% 35.2% 0.0% 0.2% 0.0%
2003/04 0.6% 0.0% 0.0% 0.0% 5.8% 0.1% 3.3%
2004/05 14.5% 0.3% 9.8% 0.0% 6.4% 94.4% 11.4%
2005/06 23.9% 36.9% 0.0% 0.0% 6.6% 0.0% 0.0%
Not given 57.7% 62.8% 90.2% 64.8% 81.2% 5.3% 85.3%
Total 100.0% 100.0% 100.0% 100.0% 100.0% 100.0% 100.0%
Cha
pter
Fiv
e
Conclusions and Recommendations
43
5.1 Conclusions
Through the extensive literature review and key informant interviews that were done by the project team, a set of defi nitions for the various terms used to describe poverty, both internationally and locally, could be provided. Considering the multi-dimensional nature of poverty, government policy and the recent trend to move towards “investment” type programmes, it was recommended that a broad and encompassing defi nition be used. Inputs from national and provincial departments consistently emphasized this point and they requested that all programmes that have an outreach to poor communities, whether they have a direct or indirect impact, be incorporated. It was also emphasized that programmes within line departments, poverty relief programmes, conditional grant programmes, free access to services and subsidies, large developmental programmes and work being done by public entities (e.g. NDA, IDT, DBSA) be considered.
To facilitate having such a broad defi nition, the PSC has recommended that the term ‘poverty reduction’ be used to describe programmes and projects that have a focus on ‘improving the livelihoods or quality of life of individuals and households with no income, with an income below the standard of living or those people living in poverty. Furthermore, the use of this terminology implies a long term and large-scale effort in addressing the different forms of poverty in South Africa. Linked to this thinking in defi ning poverty programmes in South Africa, is the need for a set of criteria to categorize programmes and projects and this was provided in the project.
A categorization of programmes and projects would be most useful if it lends itself to undertaking monitoring and evaluation and if it echo the thinking of policy makers in terms of their approaches to addressing poverty in South Africa. In this regard, it is suggested that poverty programmes and projects can be categorized by poverty type and activity type . Government offi cials attending the workshops were in agreement with this approach but suggested that there were additional components that could be added to the categories and that ideally, the poverty type and activity type categorizations should be hybridised into one single system, as is presented in Table 1. The message received from government offi cials was - the simpler the better, and therefore the defi nitions and categories that have been presented by the project team provide a solid start.
Another component of the project was to develop a database of all poverty reduction programmes and projects at both national and provincial level. To accomplish this, the project team had to identify what programmes were being implemented by the different national and provincial departments. Information on these programmes was accessed from annual reports, undertaking internet searches and accessing information from departmental web pages. Contact was also made with these departments by telephone, fax and E-mail to access information on programmes and project databases and to solicit information on what other poverty reduction programmes were being implemented. Workshops with national and provincial departments were conducted to communicate the project to government departments, to solicit input on defi nitions and categories and to gain a fi rst hand understanding of what programme and project databases existed.
An integrated database of over 29 966-programme projects was developed that covers the entire country and encompasses many of the key poverty reduction programmes in the country. It is believed that this database for purposes of doing a series of evaluations of government’s efforts in addressing poverty in further phases of the project, will suffi ce. By no means is the integrated database and supporting documents totally encompassing of all government’s poverty reduction programmes. The ideal would have been for this to be accomplished in the project. Unfortunately, both at a national and a provincial level there is no readily available central source of this information and the lack of capacity, systems and standards has inhibited this objective of the project being fully accomplished.
The integrated database that has been developed, even with its limitations, has gone some way towards the establishment of a centralized database of poverty relief projects in South Africa. Hardcopy and electronic databases of programmes continue to be received, which will form part of the overall universe of programme and project information. The project has also developed a database design that could well form the foundation
44
of government’s future efforts in establishing a central standardized database and system for monitoring and evaluation in South Africa.
Since the project (phase 1 and 2) was initially identifi ed with the view to contributing to Government’s evaluation, by 2014, in its second decade review, of the performance of the poverty reduction programme in total, a sample of projects will be identifi ed from the database to be evaluated. Once these evaluations have been completed, the PSC will be able to conclude on the performance of the programme as well as on whether Government is achieving an integrated approach to development and whether this is happening within a comprehensive, coherent and co-ordinated framework.
5.2 Recommendations
5.2.1 Definitions and categories
After consultation with relevant stakeholders on the defi nition of poverty, PSC recommends that the term ‘poverty reduction’ be used to describe programmes and projects that have a focus on ‘improving the livelihoods or quality of life of individuals and households with no income, with an income below the standard of living or those people living in poverty.
In terms of the defi nitions and categorizations suggested in this report it is recommended that they be communicated to relevant stakeholders for their consideration and further input.
5.2.2 Development of a database
The integrated database that has been developed needs to be improved and as many poverty reduction programmes as possible added. This is not necessarily for the evaluation phase but it is to provide the country with a more comprehensive list of poverty relief projects for reporting and monitoring and evaluation purposes. Clearly there is the need for a national strategy and norms and standards for the implementation of poverty reduction programmes. There is also the need for a standardized set of variables to be collected for each programme and for systems to be put in place, whether manual or electronic, that ensure consistent and accurate access to information on poverty reduction programmes and projects.
With The Presidency being identifi ed within the Programme of Action to mobilize the Public Service and align planning and implementation of government programmes, including the National Spatial Development Perspective (NSDP), Provincial Growth Strategies (PGS) and the Integrated Development Plans (IDPs) of local governments, it makes sense to recommend that they champion this process. Furthermore, The Presidency has been identifi ed to take overall responsibility for the design, improvement and roll-out of government’s monitoring and evaluation frameworks and systems.
A web-enabled system should possibly be considered for the capture, transfer and dissemination of information on these programmes and their projects. The use of such web based systems is cost effective as people in remote centres can access the system and it will further ensure that standardized variables and formats are used by national and provincial programmes alike. As has been pointed out by National Treasury, business processes will still have to be developed to ensure that proper recording of information on programmes and projects happens so that the data can eventually be captured into the web based monitoring and evaluation system. The web-enabled data capture system will need to be developed with all the appropriate security checks built in. It is strongly recommended that the present integrated database be updated on an annual basis up until such time as the government has been able to implement an appropriate system.
To be able to effectively assess the impact of projects on communities it is a necessity for geographic information on the projects to be provided. In this regard, it is recommended that the sub-place names database of StatsSA
45
become the offi cial source of names to be used for indicating where projects are being implemented. If this is not possible, then the name of the local municipality in which the project is located should be a minimum. The need for projects and place names to have unique numbers associated with them cannot be over emphasized. It is also important that government investigate the mechanisms by which this information at the project or aggregated levels can be made available to government offi cials and the broader public of South Africa.
Other programmes that were identifi ed to form part of the poverty reduction programme of the country are those that provide free basic services or subsidies. An important programme that has over the years had a dramatic impact on poverty in South Africa and should be incorporated in an evaluation of poverty reduction programmes and projects is the social grants provided by the national Department of Social Development. A database of over 8 000 pay points across the country exists in the department and can be used to evaluate the impact of this programme on the benefi ciaries. Presently, the M&E division of the Department of Social Development is conducting an evaluation of the social grant programme in South Africa. Lessons learnt from the implementation and management of this programme can also be made available to programme managers in other departments.
46
SOURCES CONSULTED
Aliber, M. and Nhlapo-Hlope, J., 2005. Why do underdevelopment and poverty persist? An overview of current debates. DBSA Development Report.
Aliber, M. and O’ Donovan, M., 2003. Synthesis report on social and economic impacts of government programmes since 1994: based on papers 6.2 and 6.7 of the ten year review research programme. Policy Coordination and Advisory Services, Offi ce of the President.
ANC (African National Congress), 1992. Ready to Govern: ANC policy guidelines for a democratic South Africa adopted at the National Conference, 28-31 May 1992.
ANC (African National Congress), 1994. The Reconstruction and Development Programme: A Policy Framework.
ANC (African National Congress), 2004. “Approaches to Poverty Eradication and Economic Development VII: Transform the Second Economy,” ANC Today, 4(47) 26 November.
Birdsall, N. and J. L. London, 1997. “Asset Inequality Matters: An Assessment of the World Bank’s Approach to Poverty Reduction,” American Economic Review, 87(2):32-37.
Birdsall, N. T. C. Pinckney, and R. H. Sabot, 1999. Equity, Savings, and Growth, CSED Working Paper No. 8, October, Washington DC: Brookings Institute.
Central Statistical Service, 1985. “Agricultural Survey 1985,” Pretoria: Central Statistical Services.Chambers, R., 1994, “The Origins and Practice of Participatory Rural Appraisal”, World Development, 22(8).
Commission for Africa, 2005. Our Common Interest: Report of the Commission for Africa. London.
Committee of Inquiry into a Comprehensive System of Social Security for South Africa, 2002. Transforming the Present – Protecting the Future: Consolidated Report. Pretoria.
COSATU, 2000. “Informal Jobs or Disguised Unemployment?”, letter to the editor in Business Day, 1 June.
Department of Finance (National Treasury), 1996. Budget Review, Republic of South Africa.
Department of Finance (National Treasury), 2000. Budget Review, Republic of South Africa.
Department of Finance, 1996, Growth, Employment and Redistribution – A Macro-Economic Strategy, Pretoria: Gov-ernment Printers.
Dollar D., and A. Kraay, 2001. “Growth Is Good for the Poor,” Policy Research Working Paper 2587, Washington DC: World Bank Development Research Group.
Düvel, G. H., 2002. “Towards an Effective Extension Approach for South Africa,” report commissioned for the National Department of Agriculture.
EPRI (Economic Policy Research Institute), 2004. “The Social and Economic Impact of South Africa’s Social Secu-rity System,” study commissioned by the Department of Social Development.
EPWP (Expanded Public Works Programme), 2005, webpage at http://www.epwp.gov.za.
47
Henriot, P., 2002. “Church’s Social Teaching and Poverty Eradication,” JCTR Bulletin, No. 54.
Hirsch, A., 2004. “South Africa’s Development Path and the Government’ Programme of Action,” paper delivered at the DBSA/HSRC/UNDP conference on ‘Overcoming Underdevelopment in South Africa’s Second Economy,’ 29-30 October.
HSRC (Human Sciences Research Council), 2004. “The Social Wage in South Africa: Phase 2 Report,” study com-missioned by the Department of Water Affairs and Forestry on behalf of the Social Cluster Task Team.
IDASA (Institute for Democracy in South Africa), 2000. “Unspent Poverty Alleviation Funds: Reasons and Rem-edies,” Budget Brief No. 43, Cape Town.
ILO (International Labour Organization), 2002. “ILO Compendium of Offi cial Statistics on Employment in the Informal Sector,” STAT Working Paper No. 1-2002.
Kanbur, R., and L. Squire, 1999, “The Evolution of Thinking About Poverty: Exploring the Interactions”, Staff Paper 145, Department of Economics, Cornell University, Ithaca.
Kaplan, D., 2004. “A Concept Note on the Relationship Between Technological Change in South African Industry, Employment Livelihoods and Government Policy,” paper commissioned by the HSRC.
Krugman, P., 2002. “Digital Robber Barons?” New York Times, 6 December.
Kusek, J.Z. and Rist, R.C., 2004. Ten steps to a results-based monitoring and evaluation system : a handbook for development practitioners. Vol. 1, Report No: 29672, The World Bank.
Lopez, J. H., 2004. “Pro-poor growth: a review of what we know (and of what we don’t),” unpublished paper, Washington DC: World Bank.
Mafeje, A., 2002. “Sustainable Development and Poverty Eradication,” paper contributed to the World Summit on Sustainable Development.
Makgetla, N., 2004. “Why Poverty and Inequality Persist,” presentation made at the DBSA/HSRC/UNDP confer-ence on ‘Overcoming Underdevelopment in South Africa’s Second Economy,’ 29-30 October.
Manuel, T., 2000. ‘Budget Speech,’ Cape Town, 23 February 2000.
Manuel, T., 2004a. ‘Address to the National Assembly by Minister of National Treasury, T Manuel, on the Tabling of the Medium Term Policy Statement, the Adjustments Appropriation Bill and the Revenue Laws Amendment Bill,’ 26 October.
Manuel, T., 2006. ‘Budget Speech,’ Cape Town, 2006.
May, J., H. Attwood, P. Ewang, F. Lund, A. Norton, W. Wentzal, 1997, Experience and Perceptions of Poverty in South Africa (synthesis report for the SA-PPA), Durban: Praxis.
Mbeki, T., 2003. ‘Address to the National Council of Provinces,’ Cape Town, 11 November.
Mbeki, T., 2003. Address by President Thabo Mbeki to the National Council of Provinces, 11 November. Pretoria, Offi ce of the President.
48
Mbeki, T., 2004. ‘Address of the President of South Africa, Thabo Mbeki, to the First Joint Sitting of the Third Demo-cratic Parliament,’ Cape Town, 21 May.
Mbeki, T., 2005. State of the Nation address (‘Address of the President of South Africa, Thabo Mbeki at the Second Joint Sitting of the Third Democratic Parliament’), Cape Town, 11 February.
MERG (Macro-Economic Research Group), 1993. Making Democracy Work: A Framework for Macroeconomic Policy in South Africa, Bellville: Centre for Development Studies, University of the Western Cape.
Mosley, P., 2004. “Severe Poverty and Growth: A Macro-Micro Analysis,” CPRC Working Paper 51, Chronic Poverty Research Centre, University of Manchester.
Mthethwa, T., A. du Toit, C. de Swardt, T. Mbhele, and M. Aliber, 2005. Trends and Policy Challenges in the Rural Economy: Four Provincial Case Studies, Pretoria: HSRC Publishers.
National Treasury, 2004. Budget Review, Pretoria: Republic of South Africa.
National Treasury, 2005a. Budget Review, Pretoria: Republic of South Africa.
National Treasury, 2005b. 2005 Estimates of National Expenditure, Republic of South Africa.
Nattrass, N., 1994. “Economic Restructuring in South Africa: The Debate Continues,” Journal of Southern African Studies, 20(4): 517-531.
PCAS (Policy Co-ordination and Advisory Services, The Presidency), 2003. Towards a Ten Year Review: Synthesis Report on Implementation of Government Programmes. Pretoria: Republic of South Africa.
Pillay, P., 2004. “Overcoming Underdevelopment in South Africa: Why Are Poverty and Inequality Persisting and What Can Be Done About it?” paper delivered at the DBSA/HSRC/UNDP conference on ‘Overcoming Under-development in South Africa’s Second Economy,’ 29-30 October.
PSC (Public Service Commission), 2002. State of the Public Service Report. PSC, Pretoria.
PSC (Public Service Commission), 2003. Report on the evaluation of the national housing subsidy scheme. PSC, Pretoria.
PSC (Public Service Commission), 2004. State of the Public Service Report. PSC, Pretoria.
Statistics South Africa, 2003. Census 2001: Census in Brief, Pretoria: Statistics South Africa.
Statistics South Africa, 2004. “Census of Commercial Agriculture 2002,” Pretoria: Statistics South Africa.
Steinberg, M., S. Johnson, G. Schierhout, D. Ndegwa, K. Hall, B. Russell, and J. Morgan, 2002. Hitting Home: How Households Cope with the Impact of the HIV/AIDS Epidemic, Henry J. Kaiser Foundation and Health Systems Trust.
Sumner, A., 2003. “From Lewis to Dollar and Kraay and Beyond: A Review and Stocktake of Fifty Years of Pov-erty, Inequality and Economic Growth,” Paper prepared for Development Studies Association (DSA), Economics, Finance and Development (EFD) Study Group meeting, ‘50 Years of Development Economics: Taking Stock of Controversies’, Overseas Development Institute, London, July 3, 2003.
49
Surty, E., 2004. ‘Address by the Deputy Minister of Education at the National Inter-Institutional Conference on Mergers,’ Pretoria, 29 November.
UNFPA, 2002. State of World Population Report, 2002.
van den Berg, S., 2005. “Fiscal Expenditure Incidence in South Africa, 1995 and 2000,” study commissioned by the National Treasury.
50

Summary of Literature Review
Add
endu
m 1
51
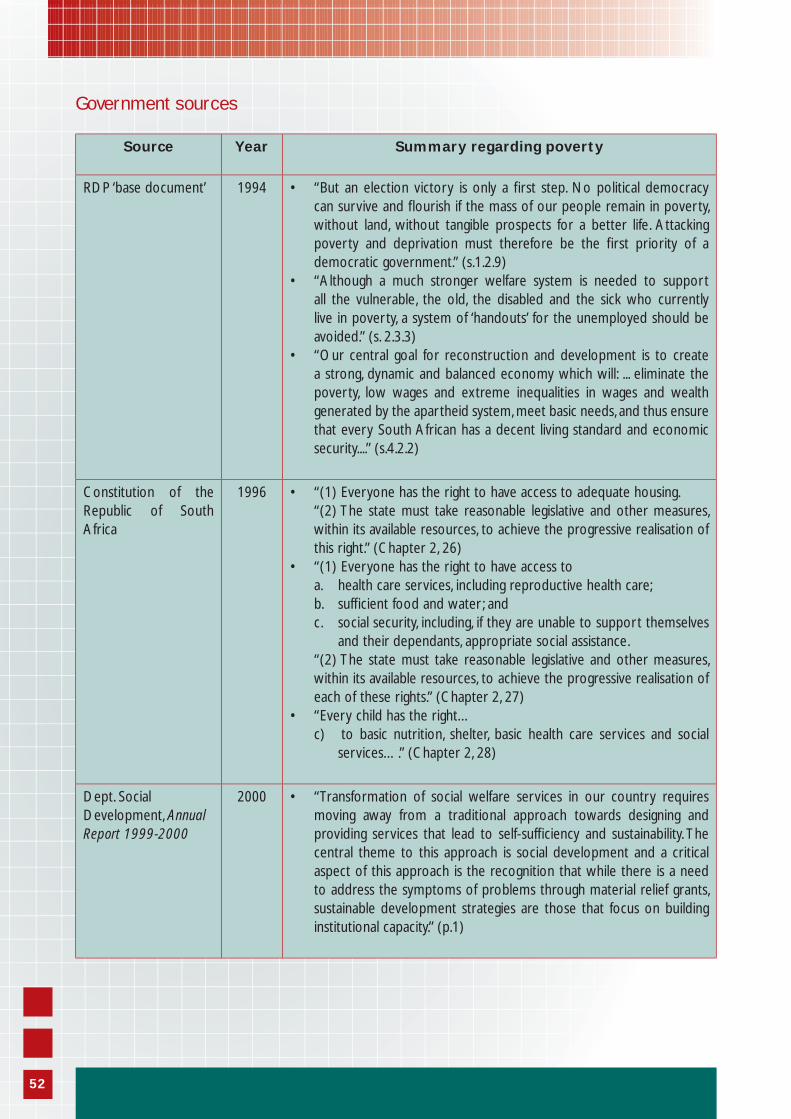
Government sources
Source Year Summary regarding poverty
RDP ‘base document’ 1994 • “But an election victory is only a fi rst step. No political democracy can survive and fl ourish if the mass of our people remain in poverty, without land, without tangible prospects for a better life. Attacking poverty and deprivation must therefore be the fi rst priority of a democratic government.” (s.1.2.9)
• “Although a much stronger welfare system is needed to support all the vulnerable, the old, the disabled and the sick who currently live in poverty, a system of ‘handouts’ for the unemployed should be avoided.” (s. 2.3.3)
• “Our central goal for reconstruction and development is to create a strong, dynamic and balanced economy which will: ... eliminate the poverty, low wages and extreme inequalities in wages and wealth generated by the apartheid system, meet basic needs, and thus ensure that every South African has a decent living standard and economic security....” (s.4.2.2)
Constitution of the Republic of South Africa
1996 • “(1) Everyone has the right to have access to adequate housing. “(2) The state must take reasonable legislative and other measures, within its available resources, to achieve the progressive realisation of this right.” (Chapter 2, 26)
• “(1) Everyone has the right to have access to a. health care services, including reproductive health care; b. suffi cient food and water ; and c. social security, including, if they are unable to support themselves
and their dependants, appropriate social assistance. “(2) The state must take reasonable legislative and other measures, within its available resources, to achieve the progressive realisation of each of these rights.” (Chapter 2, 27)
• “Every child has the right… c) to basic nutrition, shelter, basic health care services and social
services….” (Chapter 2, 28)
Dept. Social Development, Annual Report 1999-2000
2000 • “Transformation of social welfare services in our country requires moving away from a traditional approach towards designing and providing services that lead to self-suffi ciency and sustainability. The central theme to this approach is social development and a critical aspect of this approach is the recognition that while there is a need to address the symptoms of problems through material relief grants, sustainable development strategies are those that focus on building institutional capacity.” (p.1)
52
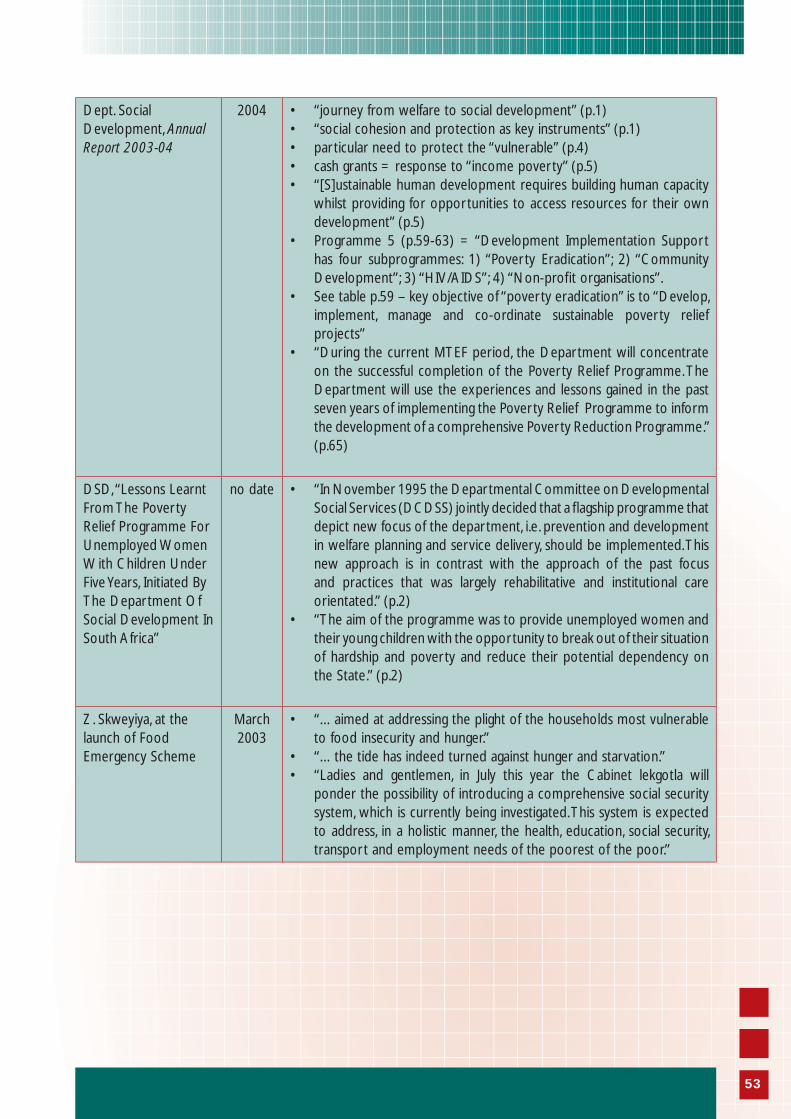
Dept. Social Development, Annual Report 2003-04
2004 • “journey from welfare to social development” (p.1)• “social cohesion and protection as key instruments” (p.1)• particular need to protect the “vulnerable” (p.4)• cash grants = response to “income poverty” (p.5)• “[S]ustainable human development requires building human capacity
whilst providing for opportunities to access resources for their own development” (p.5)
• Programme 5 (p.59-63) = “Development Implementation Support has four subprogrammes: 1) “Poverty Eradication”; 2) “Community Development”; 3) “HIV/AIDS”; 4) “Non-profi t organisations”.
• See table p.59 – key objective of “poverty eradication” is to “Develop, implement, manage and co-ordinate sustainable poverty relief projects”
• “During the current MTEF period, the Department will concentrate on the successful completion of the Poverty Relief Programme. The Department will use the experiences and lessons gained in the past seven years of implementing the Poverty Relief Programme to inform the development of a comprehensive Poverty Reduction Programme.” (p.65)
DSD, “Lessons Learnt From The Poverty Relief Programme For Unemployed Women With Children Under Five Years, Initiated By The Department Of Social Development In South Africa”
no date • “In November 1995 the Departmental Committee on Developmental Social Services (DCDSS) jointly decided that a fl agship programme that depict new focus of the department, i.e. prevention and development in welfare planning and service delivery, should be implemented. This new approach is in contrast with the approach of the past focus and practices that was largely rehabilitative and institutional care orientated.” (p.2)
• “The aim of the programme was to provide unemployed women and their young children with the opportunity to break out of their situation of hardship and poverty and reduce their potential dependency on the State.” (p.2)
Z. Skweyiya, at the launch of Food Emergency Scheme
March 2003
• “…aimed at addressing the plight of the households most vulnerable to food insecurity and hunger.”
• “…the tide has indeed turned against hunger and starvation.”• “Ladies and gentlemen, in July this year the Cabinet lekgotla will
ponder the possibility of introducing a comprehensive social security system, which is currently being investigated. This system is expected to address, in a holistic manner, the health, education, social security, transport and employment needs of the poorest of the poor.”
53
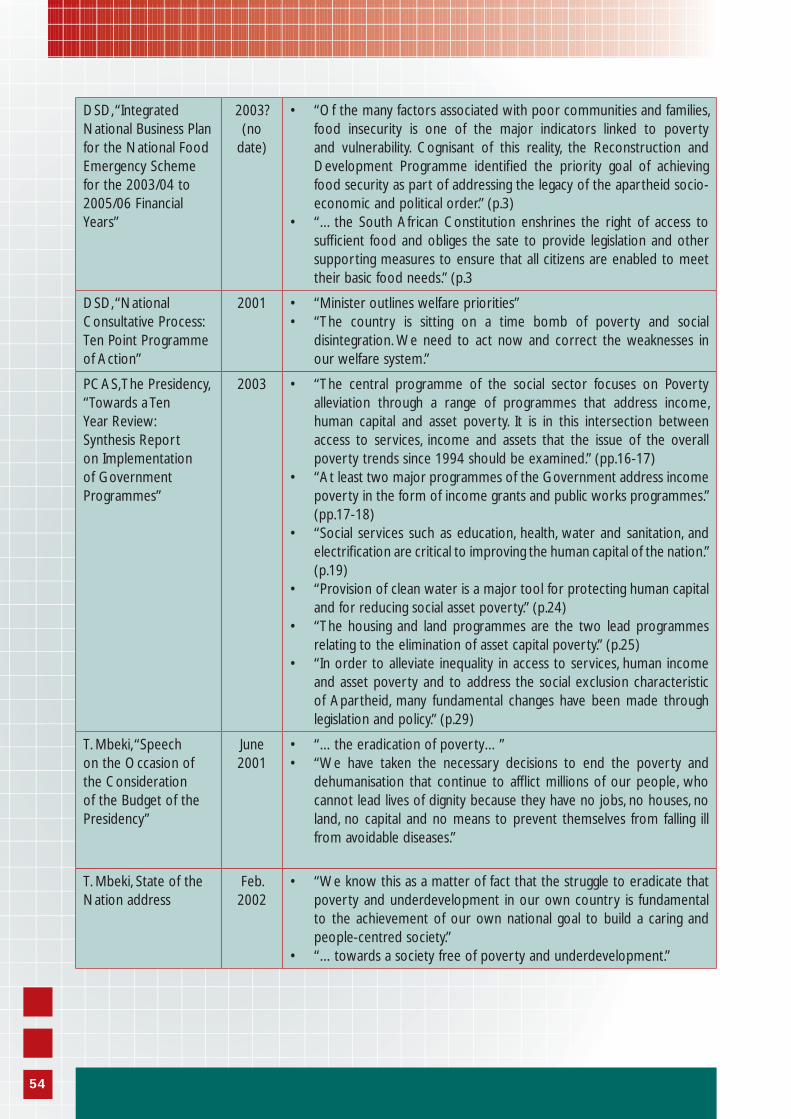
DSD, “Integrated National Business Plan for the National Food Emergency Scheme for the 2003/04 to 2005/06 Financial Years”
2003?(no
date)
• “Of the many factors associated with poor communities and families, food insecurity is one of the major indicators linked to poverty and vulnerability. Cognisant of this reality, the Reconstruction and Development Programme identifi ed the priority goal of achieving food security as part of addressing the legacy of the apartheid socio-economic and political order.” (p.3)
• “…the South African Constitution enshrines the right of access to suffi cient food and obliges the sate to provide legislation and other supporting measures to ensure that all citizens are enabled to meet their basic food needs.” (p.3
DSD, “National Consultative Process: Ten Point Programme of Action”
2001 • “Minister outlines welfare priorities”• “The country is sitting on a time bomb of poverty and social
disintegration. We need to act now and correct the weaknesses in our welfare system.”
PCAS, The Presidency, “Towards a Ten Year Review: Synthesis Report on Implementation of Government Programmes”
2003 • “The central programme of the social sector focuses on Poverty alleviation through a range of programmes that address income, human capital and asset poverty. It is in this intersection between access to services, income and assets that the issue of the overall poverty trends since 1994 should be examined.” (pp.16-17)
• “At least two major programmes of the Government address income poverty in the form of income grants and public works programmes.” (pp.17-18)
• “Social services such as education, health, water and sanitation, and electrifi cation are critical to improving the human capital of the nation.” (p.19)
• “Provision of clean water is a major tool for protecting human capital and for reducing social asset poverty.” (p.24)
• “The housing and land programmes are the two lead programmes relating to the elimination of asset capital poverty.” (p.25)
• “In order to alleviate inequality in access to services, human income and asset poverty and to address the social exclusion characteristic of Apartheid, many fundamental changes have been made through legislation and policy.” (p.29)
T. Mbeki, “Speech on the Occasion of the Consideration of the Budget of the Presidency”
June 2001
• “…the eradication of poverty…”• “We have taken the necessary decisions to end the poverty and
dehumanisation that continue to affl ict millions of our people, who cannot lead lives of dignity because they have no jobs, no houses, no land, no capital and no means to prevent themselves from falling ill from avoidable diseases.”
T. Mbeki, State of the Nation address
Feb. 2002
• “We know this as a matter of fact that the struggle to eradicate that poverty and underdevelopment in our own country is fundamental to the achievement of our own national goal to build a caring and people-centred society.”
• “…towards a society free of poverty and underdevelopment.”
54
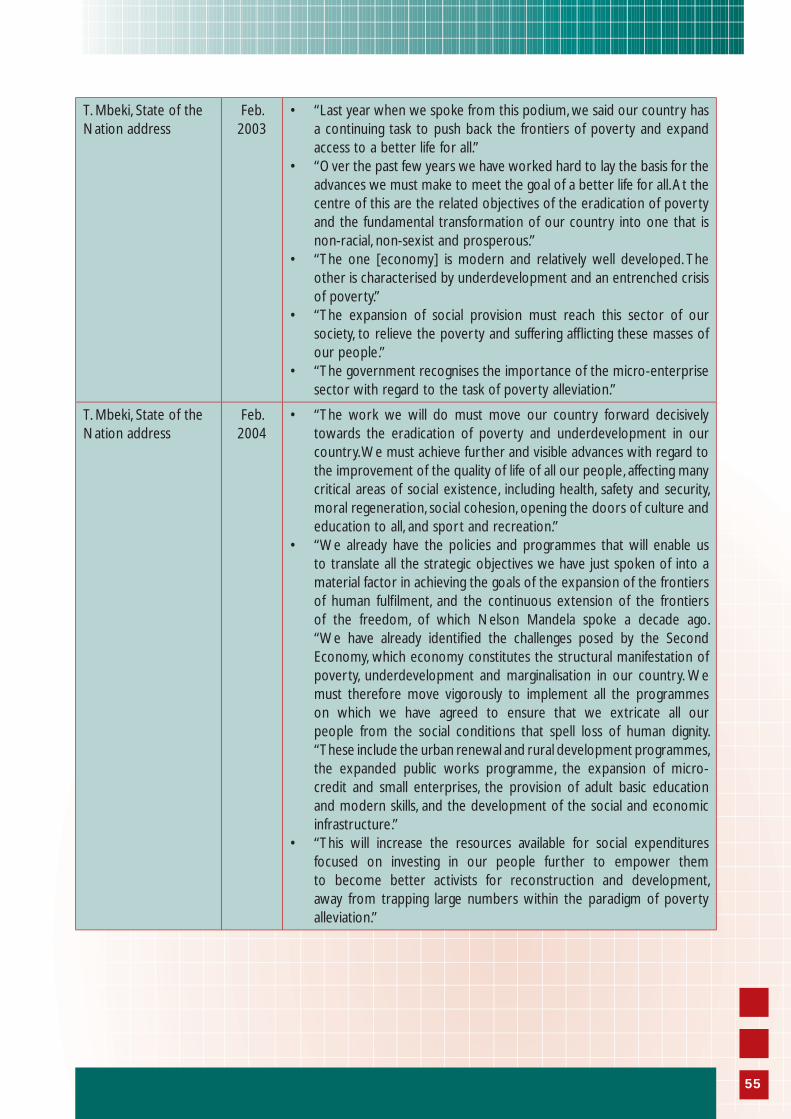
T. Mbeki, State of the Nation address
Feb. 2003
• “Last year when we spoke from this podium, we said our country has a continuing task to push back the frontiers of poverty and expand access to a better life for all.”
• “Over the past few years we have worked hard to lay the basis for the advances we must make to meet the goal of a better life for all. At the centre of this are the related objectives of the eradication of poverty and the fundamental transformation of our country into one that is non-racial, non-sexist and prosperous.”
• “The one [economy] is modern and relatively well developed. The other is characterised by underdevelopment and an entrenched crisis of poverty.”
• “The expansion of social provision must reach this sector of our society, to relieve the poverty and suffering affl icting these masses of our people.”
• “The government recognises the importance of the micro-enterprise sector with regard to the task of poverty alleviation.”
T. Mbeki, State of the Nation address
Feb. 2004
• “The work we will do must move our country forward decisively towards the eradication of poverty and underdevelopment in our country. We must achieve further and visible advances with regard to the improvement of the quality of life of all our people, affecting many critical areas of social existence, including health, safety and security, moral regeneration, social cohesion, opening the doors of culture and education to all, and sport and recreation.”
• “We already have the policies and programmes that will enable us to translate all the strategic objectives we have just spoken of into a material factor in achieving the goals of the expansion of the frontiers of human fulfi lment, and the continuous extension of the frontiers of the freedom, of which Nelson Mandela spoke a decade ago.“We have already identifi ed the challenges posed by the Second Economy, which economy constitutes the structural manifestation of poverty, underdevelopment and marginalisation in our country. We must therefore move vigorously to implement all the programmes on which we have agreed to ensure that we extricate all our people from the social conditions that spell loss of human dignity. “These include the urban renewal and rural development programmes, the expanded public works programme, the expansion of micro-credit and small enterprises, the provision of adult basic education and modern skills, and the development of the social and economic infrastructure.”
• “This will increase the resources available for social expenditures focused on investing in our people further to empower them to become better activists for reconstruction and development, away from trapping large numbers within the paradigm of poverty alleviation.”
55
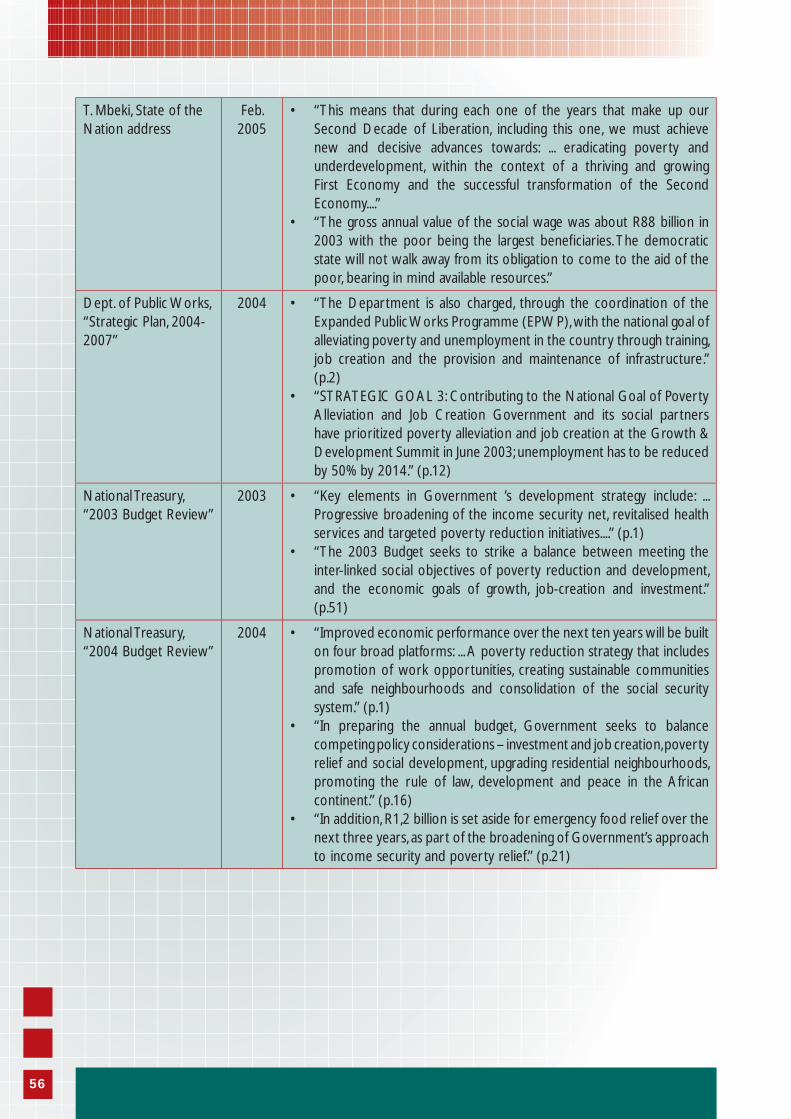
T. Mbeki, State of the Nation address
Feb. 2005
• “This means that during each one of the years that make up our Second Decade of Liberation, including this one, we must achieve new and decisive advances towards: ... eradicating poverty and underdevelopment, within the context of a thriving and growing First Economy and the successful transformation of the Second Economy....”
• “The gross annual value of the social wage was about R88 billion in 2003 with the poor being the largest benefi ciaries. The democratic state will not walk away from its obligation to come to the aid of the poor, bearing in mind available resources.”
Dept. of Public Works, “Strategic Plan, 2004-2007”
2004 • “The Department is also charged, through the coordination of the Expanded Public Works Programme (EPWP), with the national goal of alleviating poverty and unemployment in the country through training, job creation and the provision and maintenance of infrastructure.” (p.2)
• “STRATEGIC GOAL 3: Contributing to the National Goal of Poverty Alleviation and Job Creation Government and its social partners have prioritized poverty alleviation and job creation at the Growth & Development Summit in June 2003; unemployment has to be reduced by 50% by 2014.” (p.12)
National Treasury, “2003 Budget Review”
2003 • “Key elements in Government ’s development strategy include: ... Progressive broadening of the income security net, revitalised health services and targeted poverty reduction initiatives....” (p.1)
• “The 2003 Budget seeks to strike a balance between meeting the inter-linked social objectives of poverty reduction and development, and the economic goals of growth, job-creation and investment.” (p.51)
National Treasury, “2004 Budget Review”
2004 • “Improved economic performance over the next ten years will be built on four broad platforms: ... A poverty reduction strategy that includes promotion of work opportunities, creating sustainable communities and safe neighbourhoods and consolidation of the social security system.” (p.1)
• “In preparing the annual budget, Government seeks to balance competing policy considerations – investment and job creation, poverty relief and social development, upgrading residential neighbourhoods, promoting the rule of law, development and peace in the African continent.” (p.16)
• “In addition, R1,2 billion is set aside for emergency food relief over the next three years, as part of the broadening of Government’s approach to income security and poverty relief.” (p.21)
56
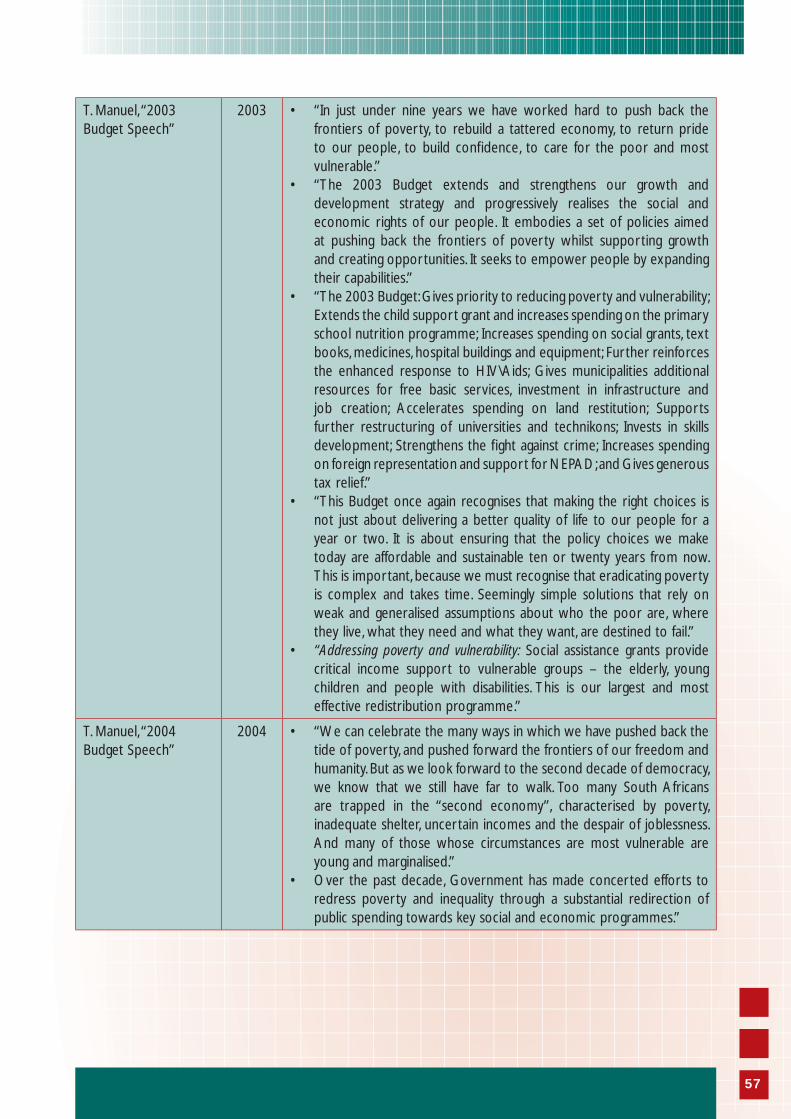
T. Manuel, “2003 Budget Speech”
2003 • “In just under nine years we have worked hard to push back the frontiers of poverty, to rebuild a tattered economy, to return pride to our people, to build confi dence, to care for the poor and most vulnerable.”
• “The 2003 Budget extends and strengthens our growth and development strategy and progressively realises the social and economic rights of our people. It embodies a set of policies aimed at pushing back the frontiers of poverty whilst supporting growth and creating opportunities. It seeks to empower people by expanding their capabilities.”
• “The 2003 Budget: Gives priority to reducing poverty and vulnerability; Extends the child support grant and increases spending on the primary school nutrition programme; Increases spending on social grants, text books, medicines, hospital buildings and equipment; Further reinforces the enhanced response to HIV\Aids; Gives municipalities additional resources for free basic services, investment in infrastructure and job creation; Accelerates spending on land restitution; Supports further restructuring of universities and technikons; Invests in skills development; Strengthens the fi ght against crime; Increases spending on foreign representation and support for NEPAD; and Gives generous tax relief.”
• “This Budget once again recognises that making the right choices is not just about delivering a better quality of life to our people for a year or two. It is about ensuring that the policy choices we make today are affordable and sustainable ten or twenty years from now. This is important, because we must recognise that eradicating poverty is complex and takes time. Seemingly simple solutions that rely on weak and generalised assumptions about who the poor are, where they live, what they need and what they want, are destined to fail.”
• “Addressing poverty and vulnerability: Social assistance grants provide critical income support to vulnerable groups – the elderly, young children and people with disabilities. This is our largest and most effective redistribution programme.”
T. Manuel, “2004 Budget Speech”
2004 • “We can celebrate the many ways in which we have pushed back the tide of poverty, and pushed forward the frontiers of our freedom and humanity. But as we look forward to the second decade of democracy, we know that we still have far to walk. Too many South Africans are trapped in the “second economy”, characterised by poverty, inadequate shelter, uncertain incomes and the despair of joblessness. And many of those whose circumstances are most vulnerable are young and marginalised.”
• Over the past decade, Government has made concerted efforts to redress poverty and inequality through a substantial redirection of public spending towards key social and economic programmes.”
57
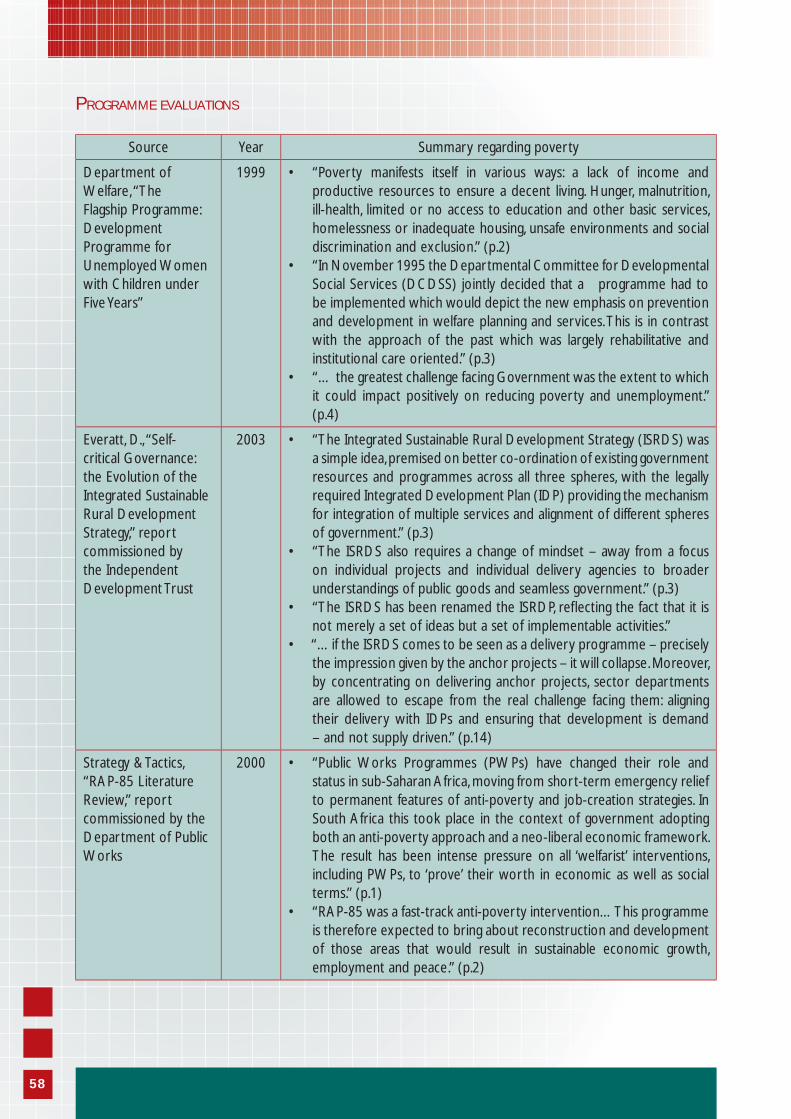
PROGRAMME EVALUATIONS
Source Year Summary regarding poverty
Department of Welfare, “The Flagship Programme: Development Programme for Unemployed Women with Children under Five Years”
1999 • “Poverty manifests itself in various ways: a lack of income and productive resources to ensure a decent living. Hunger, malnutrition, ill-health, limited or no access to education and other basic services, homelessness or inadequate housing, unsafe environments and social discrimination and exclusion.” (p.2)
• “In November 1995 the Departmental Committee for Developmental Social Services (DCDSS) jointly decided that a programme had to be implemented which would depict the new emphasis on prevention and development in welfare planning and services. This is in contrast with the approach of the past which was largely rehabilitative and institutional care oriented.” (p.3)
• “… the greatest challenge facing Government was the extent to which it could impact positively on reducing poverty and unemployment.” (p.4)
Everatt, D., “Self-critical Governance: the Evolution of the Integrated Sustainable Rural Development Strategy,” report commissioned by the Independent Development Trust
2003 • “The Integrated Sustainable Rural Development Strategy (ISRDS) was a simple idea, premised on better co-ordination of existing government resources and programmes across all three spheres, with the legally required Integrated Development Plan (IDP) providing the mechanism for integration of multiple services and alignment of different spheres of government.” (p.3)
• “The ISRDS also requires a change of mindset – away from a focus on individual projects and individual delivery agencies to broader understandings of public goods and seamless government.” (p.3)
• “The ISRDS has been renamed the ISRDP, refl ecting the fact that it is not merely a set of ideas but a set of implementable activities.”
• “…if the ISRDS comes to be seen as a delivery programme – precisely the impression given by the anchor projects – it will collapse. Moreover, by concentrating on delivering anchor projects, sector departments are allowed to escape from the real challenge facing them: aligning their delivery with IDPs and ensuring that development is demand – and not supply driven.” (p.14)
Strategy & Tactics, “RAP-85 Literature Review,” report commissioned by the Department of Public Works
2000 • “Public Works Programmes (PWPs) have changed their role and status in sub-Saharan Africa, moving from short-term emergency relief to permanent features of anti-poverty and job-creation strategies. In South Africa this took place in the context of government adopting both an anti-poverty approach and a neo-liberal economic framework. The result has been intense pressure on all ‘welfarist’ interventions, including PWPs, to ‘prove’ their worth in economic as well as social terms.” (p.1)
• “RAP-85 was a fast-track anti-poverty intervention…This programme is therefore expected to bring about reconstruction and development of those areas that would result in sustainable economic growth, employment and peace.” (p.2)
58
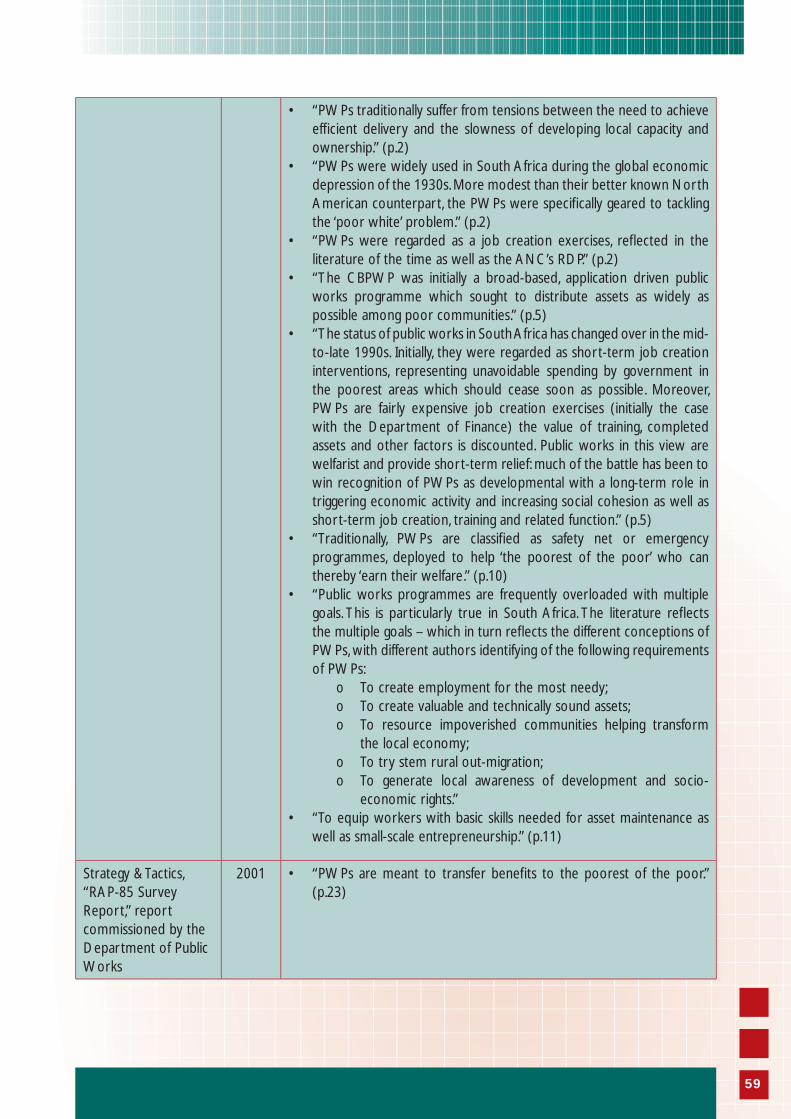
• “PWPs traditionally suffer from tensions between the need to achieve effi cient delivery and the slowness of developing local capacity and ownership.” (p.2)
• “PWPs were widely used in South Africa during the global economic depression of the 1930s. More modest than their better known North American counterpart, the PWPs were specifi cally geared to tackling the ‘poor white’ problem.” (p.2)
• “PWPs were regarded as a job creation exercises, refl ected in the literature of the time as well as the ANC’s RDP.” (p.2)
• “The CBPWP was initially a broad-based, application driven public works programme which sought to distribute assets as widely as possible among poor communities.” (p.5)
• “The status of public works in South Africa has changed over in the mid-to-late 1990s. Initially, they were regarded as short-term job creation interventions, representing unavoidable spending by government in the poorest areas which should cease soon as possible. Moreover, PWPs are fairly expensive job creation exercises (initially the case with the Department of Finance) the value of training, completed assets and other factors is discounted. Public works in this view are welfarist and provide short-term relief: much of the battle has been to win recognition of PWPs as developmental with a long-term role in triggering economic activity and increasing social cohesion as well as short-term job creation, training and related function.” (p.5)
• “Traditionally, PWPs are classifi ed as safety net or emergency programmes, deployed to help ‘the poorest of the poor’ who can thereby ‘earn their welfare.” (p.10)
• “Public works programmes are frequently overloaded with multiple goals. This is particularly true in South Africa. The literature refl ects the multiple goals – which in turn refl ects the different conceptions of PWPs, with different authors identifying of the following requirements of PWPs:
o To create employment for the most needy;o To create valuable and technically sound assets;o To resource impoverished communities helping transform
the local economy; o To try stem rural out-migration;o To generate local awareness of development and socio-
economic rights.”• “To equip workers with basic skills needed for asset maintenance as
well as small-scale entrepreneurship.” (p.11)
Strategy & Tactics, “RAP-85 Survey Report,” report commissioned by the Department of Public Works
2001 • “PWPs are meant to transfer benefi ts to the poorest of the poor.” (p.23)
59
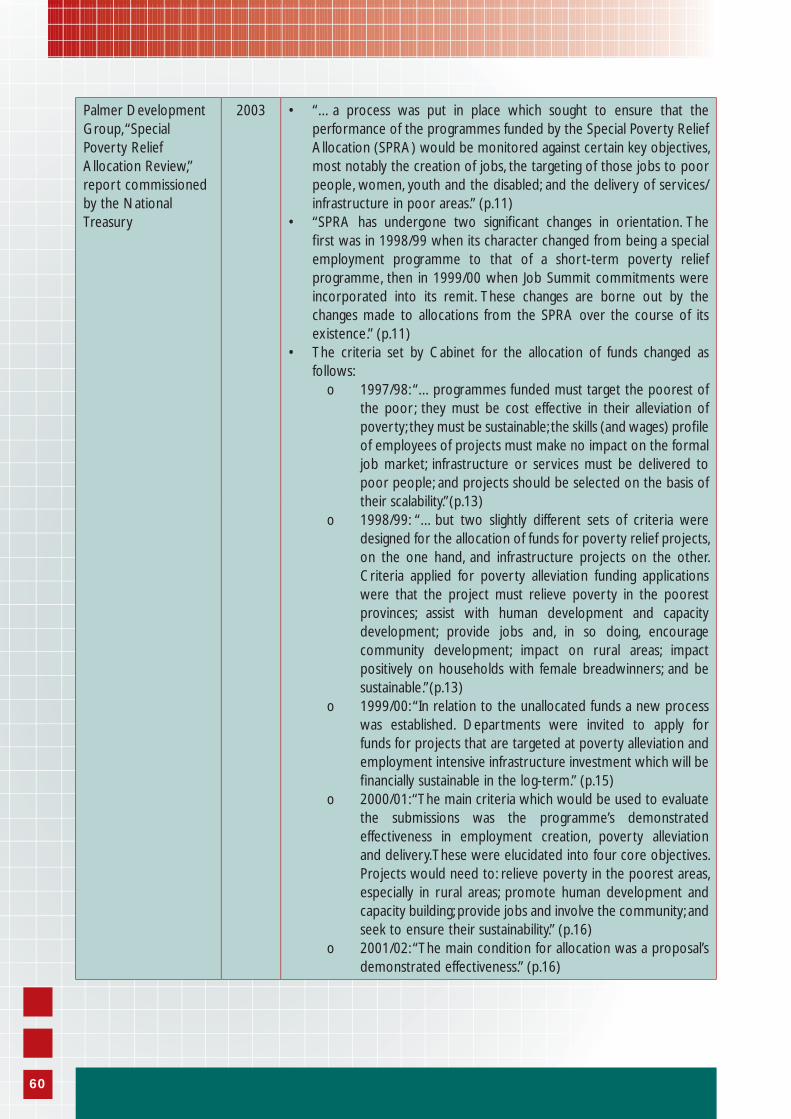
Palmer Development Group, “Special Poverty Relief Allocation Review,” report commissioned by the National Treasury
2003 • “…a process was put in place which sought to ensure that the performance of the programmes funded by the Special Poverty Relief Allocation (SPRA) would be monitored against certain key objectives, most notably the creation of jobs, the targeting of those jobs to poor people, women, youth and the disabled; and the delivery of services/infrastructure in poor areas.” (p.11)
• “SPRA has undergone two signifi cant changes in orientation. The fi rst was in 1998/99 when its character changed from being a special employment programme to that of a short-term poverty relief programme, then in 1999/00 when Job Summit commitments were incorporated into its remit. These changes are borne out by the changes made to allocations from the SPRA over the course of its existence.” (p.11)
• The criteria set by Cabinet for the allocation of funds changed as follows:
o 1997/98: “…programmes funded must target the poorest of the poor; they must be cost effective in their alleviation of poverty; they must be sustainable; the skills (and wages) profi le of employees of projects must make no impact on the formal job market; infrastructure or services must be delivered to poor people; and projects should be selected on the basis of their scalability.”(p.13)
o 1998/99: “…but two slightly different sets of criteria were designed for the allocation of funds for poverty relief projects, on the one hand, and infrastructure projects on the other. Criteria applied for poverty alleviation funding applications were that the project must relieve poverty in the poorest provinces; assist with human development and capacity development; provide jobs and, in so doing, encourage community development; impact on rural areas; impact positively on households with female breadwinners; and be sustainable.”(p.13)
o 1999/00: “In relation to the unallocated funds a new process was established. Departments were invited to apply for funds for projects that are targeted at poverty alleviation and employment intensive infrastructure investment which will be fi nancially sustainable in the log-term.” (p.15)
o 2000/01: “The main criteria which would be used to evaluate the submissions was the programme’s demonstrated effectiveness in employment creation, poverty alleviation and delivery. These were elucidated into four core objectives. Projects would need to: relieve poverty in the poorest areas, especially in rural areas; promote human development and capacity building; provide jobs and involve the community; and seek to ensure their sustainability.” (p.16)
o 2001/02: “The main condition for allocation was a proposal’s demonstrated effectiveness.” (p.16)
60
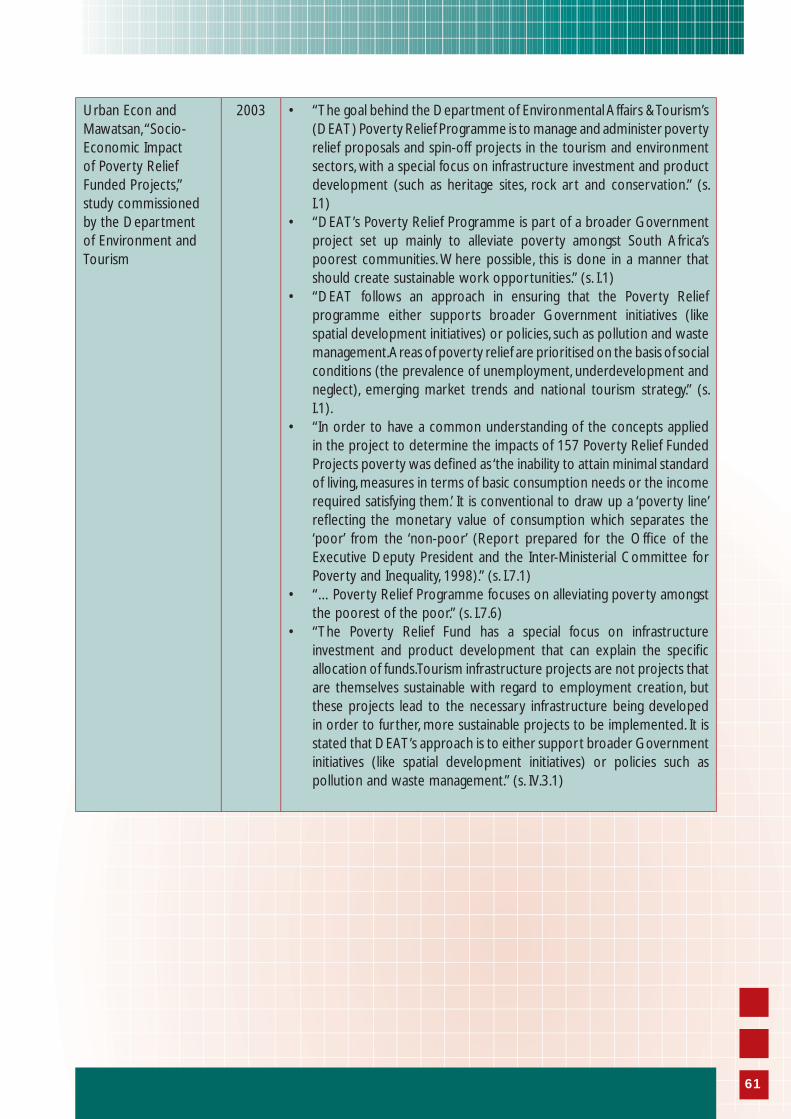
Urban Econ and Mawatsan, “Socio-Economic Impact of Poverty Relief Funded Projects,” study commissioned by the Department of Environment and Tourism
2003 • “The goal behind the Department of Environmental Affairs & Tourism’s (DEAT) Poverty Relief Programme is to manage and administer poverty relief proposals and spin-off projects in the tourism and environment sectors, with a special focus on infrastructure investment and product development (such as heritage sites, rock art and conservation.” (s. I.1)
• “DEAT’s Poverty Relief Programme is part of a broader Government project set up mainly to alleviate poverty amongst South Africa’s poorest communities. Where possible, this is done in a manner that should create sustainable work opportunities.” (s. I.1)
• “DEAT follows an approach in ensuring that the Poverty Relief programme either supports broader Government initiatives (like spatial development initiatives) or policies, such as pollution and waste management. Areas of poverty relief are prioritised on the basis of social conditions (the prevalence of unemployment, underdevelopment and neglect), emerging market trends and national tourism strategy.” (s. I.1).
• “In order to have a common understanding of the concepts applied in the project to determine the impacts of 157 Poverty Relief Funded Projects poverty was defi ned as ‘the inability to attain minimal standard of living, measures in terms of basic consumption needs or the income required satisfying them.’ It is conventional to draw up a ‘poverty line’ refl ecting the monetary value of consumption which separates the ‘poor’ from the ‘non-poor’ (Report prepared for the Offi ce of the Executive Deputy President and the Inter-Ministerial Committee for Poverty and Inequality, 1998).” (s. I.7.1)
• “…Poverty Relief Programme focuses on alleviating poverty amongst the poorest of the poor.” (s. I.7.6)
• “The Poverty Relief Fund has a special focus on infrastructure investment and product development that can explain the specifi c allocation of funds. Tourism infrastructure projects are not projects that are themselves sustainable with regard to employment creation, but these projects lead to the necessary infrastructure being developed in order to further, more sustainable projects to be implemented. It is stated that DEAT’s approach is to either support broader Government initiatives (like spatial development initiatives) or policies such as pollution and waste management.” (s. IV.3.1)
61
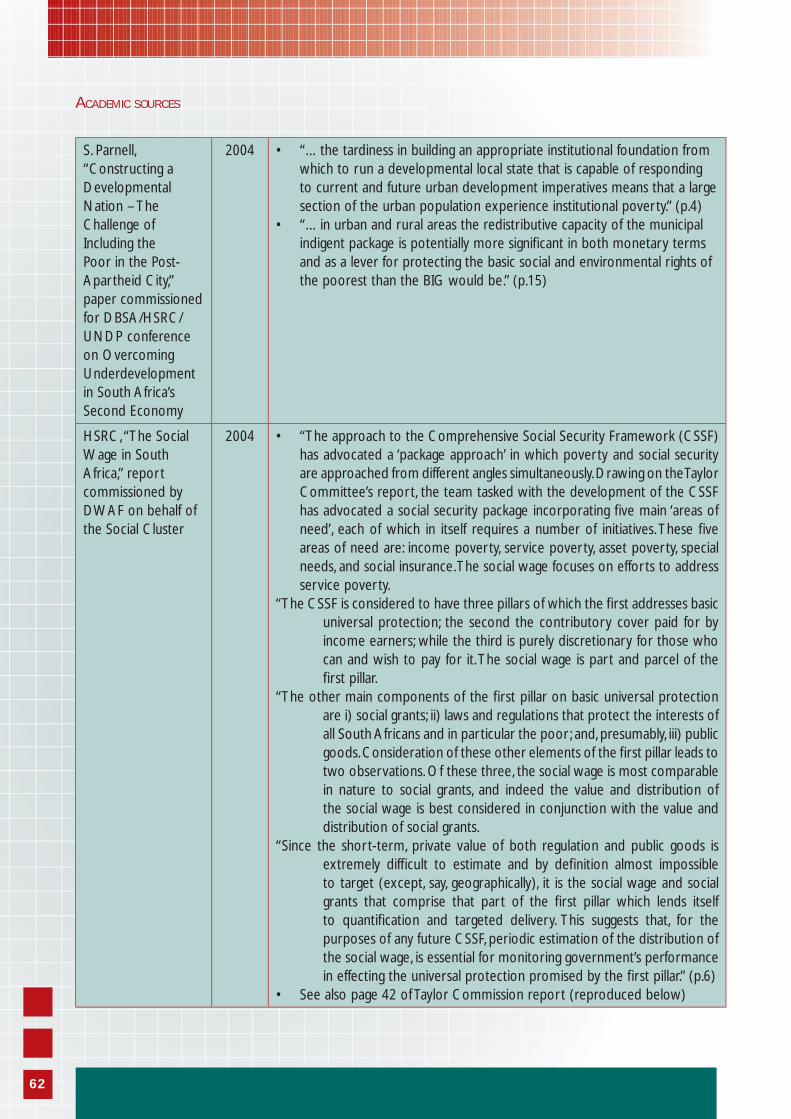
ACADEMIC SOURCES
S. Parnell, “Constructing a Developmental Nation – The Challenge of Including the Poor in the Post-Apartheid City,” paper commissioned for DBSA/HSRC/UNDP conference on Overcoming Underdevelopment in South Africa’s Second Economy
2004 • “…the tardiness in building an appropriate institutional foundation from which to run a developmental local state that is capable of responding to current and future urban development imperatives means that a large section of the urban population experience institutional poverty.” (p.4)
• “…in urban and rural areas the redistributive capacity of the municipal indigent package is potentially more signifi cant in both monetary terms and as a lever for protecting the basic social and environmental rights of the poorest than the BIG would be.” (p.15)
HSRC, “The Social Wage in South Africa,” report commissioned by DWAF on behalf of the Social Cluster
2004 • “The approach to the Comprehensive Social Security Framework (CSSF) has advocated a ‘package approach’ in which poverty and social security are approached from different angles simultaneously. Drawing on the Taylor Committee’s report, the team tasked with the development of the CSSF has advocated a social security package incorporating fi ve main ‘areas of need’, each of which in itself requires a number of initiatives. These fi ve areas of need are: income poverty, service poverty, asset poverty, special needs, and social insurance. The social wage focuses on efforts to address service poverty.
“The CSSF is considered to have three pillars of which the fi rst addresses basic universal protection; the second the contributory cover paid for by income earners; while the third is purely discretionary for those who can and wish to pay for it. The social wage is part and parcel of the fi rst pillar.
“The other main components of the fi rst pillar on basic universal protection are i) social grants; ii) laws and regulations that protect the interests of all South Africans and in particular the poor; and, presumably, iii) public goods. Consideration of these other elements of the fi rst pillar leads to two observations. Of these three, the social wage is most comparable in nature to social grants, and indeed the value and distribution of the social wage is best considered in conjunction with the value and distribution of social grants.
“Since the short-term, private value of both regulation and public goods is extremely diffi cult to estimate and by defi nition almost impossible to target (except, say, geographically), it is the social wage and social grants that comprise that part of the fi rst pillar which lends itself to quantifi cation and targeted delivery. This suggests that, for the purposes of any future CSSF, periodic estimation of the distribution of the social wage, is essential for monitoring government’s performance in effecting the universal protection promised by the fi rst pillar.” (p.6)
• See also page 42 of Taylor Commission report (reproduced below)
62
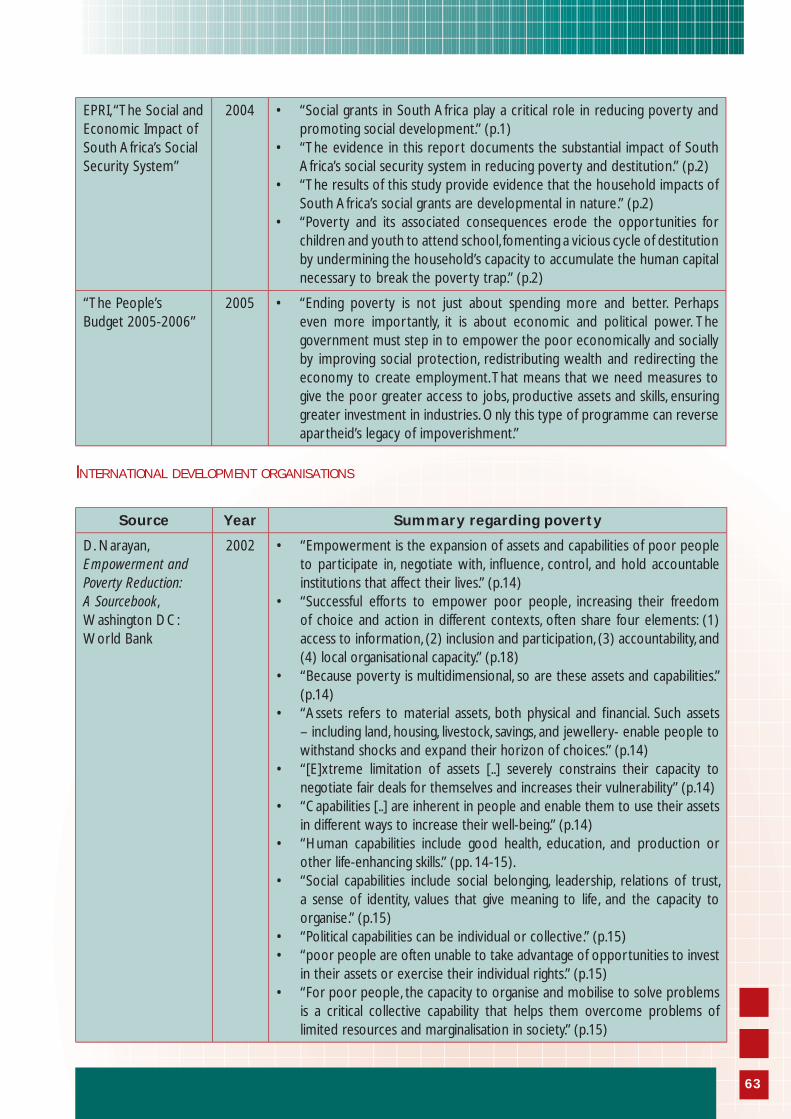
EPRI, “The Social and Economic Impact of South Africa’s Social Security System”
2004 • “Social grants in South Africa play a critical role in reducing poverty and promoting social development.” (p.1)
• “The evidence in this report documents the substantial impact of South Africa’s social security system in reducing poverty and destitution.” (p.2)
• “The results of this study provide evidence that the household impacts of South Africa’s social grants are developmental in nature.” (p.2)
• “Poverty and its associated consequences erode the opportunities for children and youth to attend school, fomenting a vicious cycle of destitution by undermining the household’s capacity to accumulate the human capital necessary to break the poverty trap.” (p.2)
“The People’s Budget 2005-2006”
2005 • “Ending poverty is not just about spending more and better. Perhaps even more importantly, it is about economic and political power. The government must step in to empower the poor economically and socially by improving social protection, redistributing wealth and redirecting the economy to create employment. That means that we need measures to give the poor greater access to jobs, productive assets and skills, ensuring greater investment in industries. Only this type of programme can reverse apartheid’s legacy of impoverishment.”
INTERNATIONAL DEVELOPMENT ORGANISATIONS
Source Year Summary regarding poverty
D. Narayan, Empowerment and Poverty Reduction: A Sourcebook, Washington DC: World Bank
2002 • “Empowerment is the expansion of assets and capabilities of poor people to participate in, negotiate with, infl uence, control, and hold accountable institutions that affect their lives.” (p.14)
• “Successful efforts to empower poor people, increasing their freedom of choice and action in different contexts, often share four elements: (1) access to information, (2) inclusion and participation, (3) accountability, and (4) local organisational capacity.” (p.18)
• “Because poverty is multidimensional, so are these assets and capabilities.” (p.14)
• “Assets refers to material assets, both physical and fi nancial. Such assets – including land, housing, livestock, savings, and jewellery- enable people to withstand shocks and expand their horizon of choices.” (p.14)
• “[E]xtreme limitation of assets [..] severely constrains their capacity to negotiate fair deals for themselves and increases their vulnerability” (p.14)
• “Capabilities [..] are inherent in people and enable them to use their assets in different ways to increase their well-being.” (p.14)
• “Human capabilities include good health, education, and production or other life-enhancing skills.” (pp. 14-15).
• “Social capabilities include social belonging, leadership, relations of trust, a sense of identity, values that give meaning to life, and the capacity to organise.” (p.15)
• “Political capabilities can be individual or collective.” (p.15)• “poor people are often unable to take advantage of opportunities to invest
in their assets or exercise their individual rights.” (p.15)• “For poor people, the capacity to organise and mobilise to solve problems
is a critical collective capability that helps them overcome problems of limited resources and marginalisation in society.” (p.15)
63
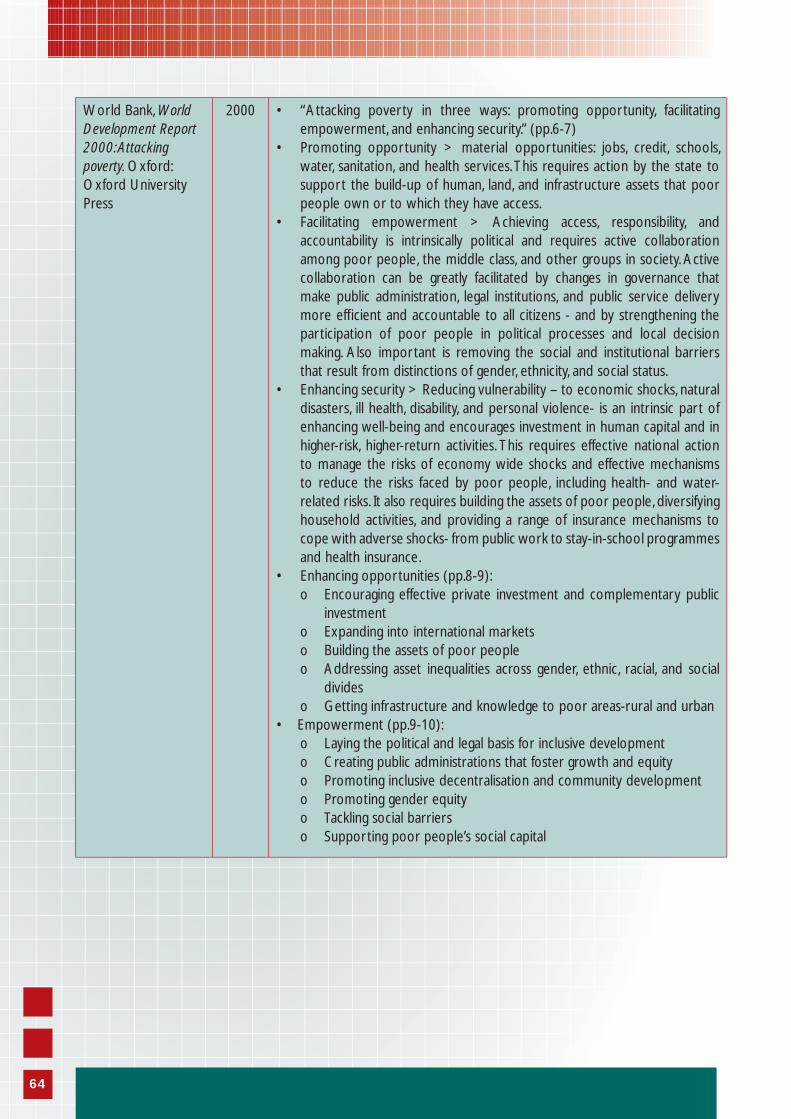
World Bank, World Development Report 2000: Attacking poverty. Oxford: Oxford University Press
2000 • “Attacking poverty in three ways: promoting opportunity, facilitating empowerment, and enhancing security.” (pp.6-7)
• Promoting opportunity > material opportunities: jobs, credit, schools, water, sanitation, and health services. This requires action by the state to support the build-up of human, land, and infrastructure assets that poor people own or to which they have access.
• Facilitating empowerment > Achieving access, responsibility, and accountability is intrinsically political and requires active collaboration among poor people, the middle class, and other groups in society. Active collaboration can be greatly facilitated by changes in governance that make public administration, legal institutions, and public service delivery more effi cient and accountable to all citizens - and by strengthening the participation of poor people in political processes and local decision making. Also important is removing the social and institutional barriers that result from distinctions of gender, ethnicity, and social status.
• Enhancing security > Reducing vulnerability – to economic shocks, natural disasters, ill health, disability, and personal violence- is an intrinsic part of enhancing well-being and encourages investment in human capital and in higher-risk, higher-return activities. This requires effective national action to manage the risks of economy wide shocks and effective mechanisms to reduce the risks faced by poor people, including health- and water-related risks. It also requires building the assets of poor people, diversifying household activities, and providing a range of insurance mechanisms to cope with adverse shocks- from public work to stay-in-school programmes and health insurance.
• Enhancing opportunities (pp.8-9):o Encouraging effective private investment and complementary public
investmento Expanding into international marketso Building the assets of poor peopleo Addressing asset inequalities across gender, ethnic, racial, and social
divideso Getting infrastructure and knowledge to poor areas-rural and urban
• Empowerment (pp.9-10):o Laying the political and legal basis for inclusive developmento Creating public administrations that foster growth and equityo Promoting inclusive decentralisation and community developmento Promoting gender equityo Tackling social barrierso Supporting poor people’s social capital
64
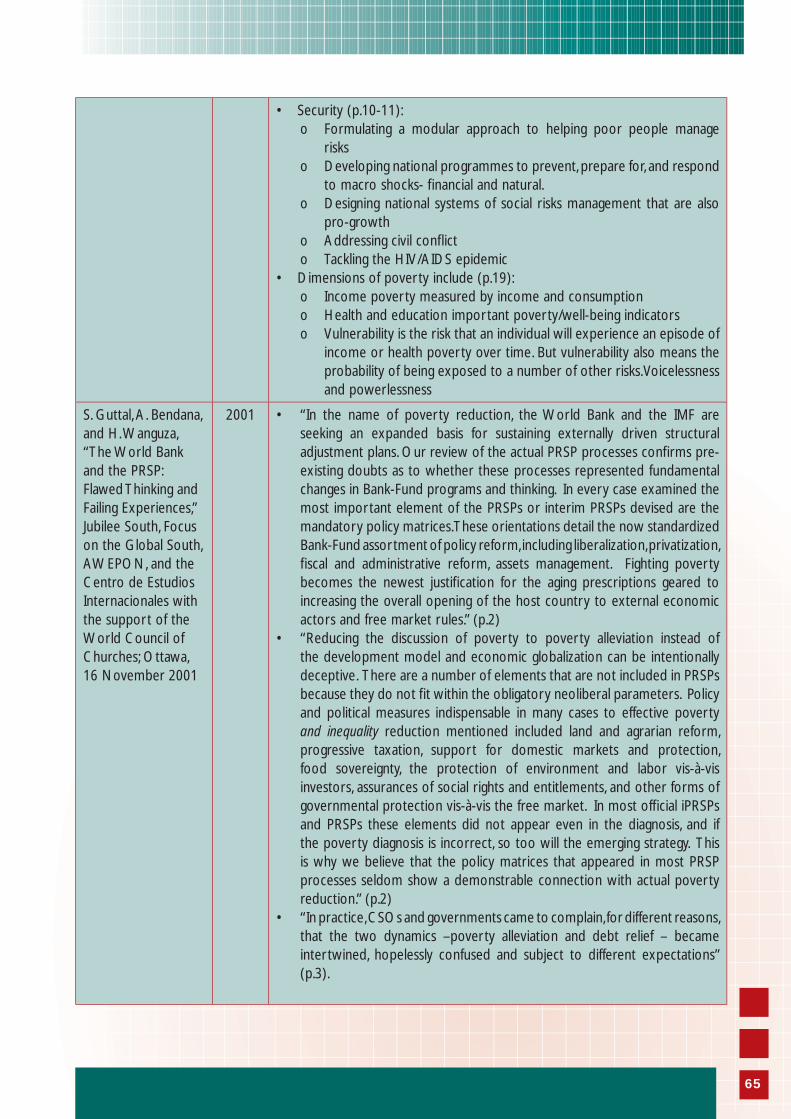
• Security (p.10-11):o Formulating a modular approach to helping poor people manage
riskso Developing national programmes to prevent, prepare for, and respond
to macro shocks- fi nancial and natural.o Designing national systems of social risks management that are also
pro-growtho Addressing civil confl icto Tackling the HIV/AIDS epidemic
• Dimensions of poverty include (p.19):o Income poverty measured by income and consumptiono Health and education important poverty/well-being indicatorso Vulnerability is the risk that an individual will experience an episode of
income or health poverty over time. But vulnerability also means the probability of being exposed to a number of other risks. Voicelessness and powerlessness
S. Guttal, A. Bendana, and H. Wanguza, “The World Bank and the PRSP: Flawed Thinking and Failing Experiences,” Jubilee South, Focus on the Global South, AWEPON, and the Centro de Estudios Internacionales with the support of the World Council of Churches; Ottawa, 16 November 2001
2001 • “In the name of poverty reduction, the World Bank and the IMF are seeking an expanded basis for sustaining externally driven structural adjustment plans. Our review of the actual PRSP processes confi rms pre-existing doubts as to whether these processes represented fundamental changes in Bank-Fund programs and thinking. In every case examined the most important element of the PRSPs or interim PRSPs devised are the mandatory policy matrices. These orientations detail the now standardized Bank-Fund assortment of policy reform, including liberalization, privatization, fi scal and administrative reform, assets management. Fighting poverty becomes the newest justifi cation for the aging prescriptions geared to increasing the overall opening of the host country to external economic actors and free market rules.” (p.2)
• “Reducing the discussion of poverty to poverty alleviation instead of the development model and economic globalization can be intentionally deceptive. There are a number of elements that are not included in PRSPs because they do not fi t within the obligatory neoliberal parameters. Policy and political measures indispensable in many cases to effective poverty and inequality reduction mentioned included land and agrarian reform, progressive taxation, support for domestic markets and protection, food sovereignty, the protection of environment and labor vis-à-vis investors, assurances of social rights and entitlements, and other forms of governmental protection vis-à-vis the free market. In most offi cial iPRSPs and PRSPs these elements did not appear even in the diagnosis, and if the poverty diagnosis is incorrect, so too will the emerging strategy. This is why we believe that the policy matrices that appeared in most PRSP processes seldom show a demonstrable connection with actual poverty reduction.” (p.2)
• “In practice, CSOs and governments came to complain, for different reasons, that the two dynamics –poverty alleviation and debt relief – became intertwined, hopelessly confused and subject to different expectations” (p.3).
65
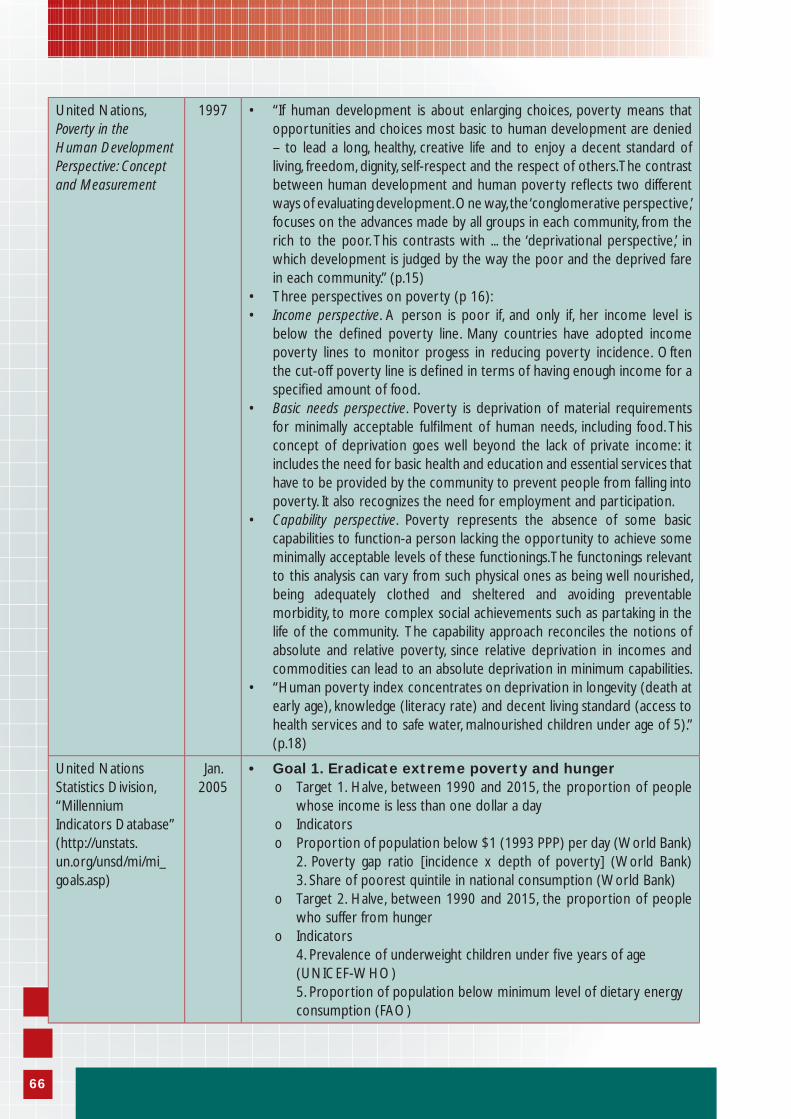
United Nations, Poverty in the Human Development Perspective: Concept and Measurement
1997 • “If human development is about enlarging choices, poverty means that opportunities and choices most basic to human development are denied – to lead a long, healthy, creative life and to enjoy a decent standard of living, freedom, dignity, self-respect and the respect of others. The contrast between human development and human poverty refl ects two different ways of evaluating development. One way, the ‘conglomerative perspective,’ focuses on the advances made by all groups in each community, from the rich to the poor. This contrasts with ... the ‘deprivational perspective,’ in which development is judged by the way the poor and the deprived fare in each community.” (p.15)
• Three perspectives on poverty (p 16):• Income perspective. A person is poor if, and only if, her income level is
below the defi ned poverty line. Many countries have adopted income poverty lines to monitor progess in reducing poverty incidence. Often the cut-off poverty line is defi ned in terms of having enough income for a specifi ed amount of food.
• Basic needs perspective. Poverty is deprivation of material requirements for minimally acceptable fulfi lment of human needs, including food. This concept of deprivation goes well beyond the lack of private income: it includes the need for basic health and education and essential services that have to be provided by the community to prevent people from falling into poverty. It also recognizes the need for employment and participation.
• Capability perspective. Poverty represents the absence of some basic capabilities to function-a person lacking the opportunity to achieve some minimally acceptable levels of these functionings. The functonings relevant to this analysis can vary from such physical ones as being well nourished, being adequately clothed and sheltered and avoiding preventable morbidity, to more complex social achievements such as partaking in the life of the community. The capability approach reconciles the notions of absolute and relative poverty, since relative deprivation in incomes and commodities can lead to an absolute deprivation in minimum capabilities.
• “Human poverty index concentrates on deprivation in longevity (death at early age), knowledge (literacy rate) and decent living standard (access to health services and to safe water, malnourished children under age of 5).” (p.18)
United Nations Statistics Division, “Millennium Indicators Database”(http://unstats.un.org/unsd/mi/mi_goals.asp)
Jan. 2005
• Goal 1. Eradicate extreme poverty and hungero Target 1. Halve, between 1990 and 2015, the proportion of people
whose income is less than one dollar a day o Indicatorso Proportion of population below $1 (1993 PPP) per day (World Bank)
2. Poverty gap ratio [incidence x depth of poverty] (World Bank)3. Share of poorest quintile in national consumption (World Bank)
o Target 2. Halve, between 1990 and 2015, the proportion of people who suffer from hunger
o Indicators4. Prevalence of underweight children under fi ve years of age (UNICEF-WHO)5. Proportion of population below minimum level of dietary energy consumption (FAO)
66
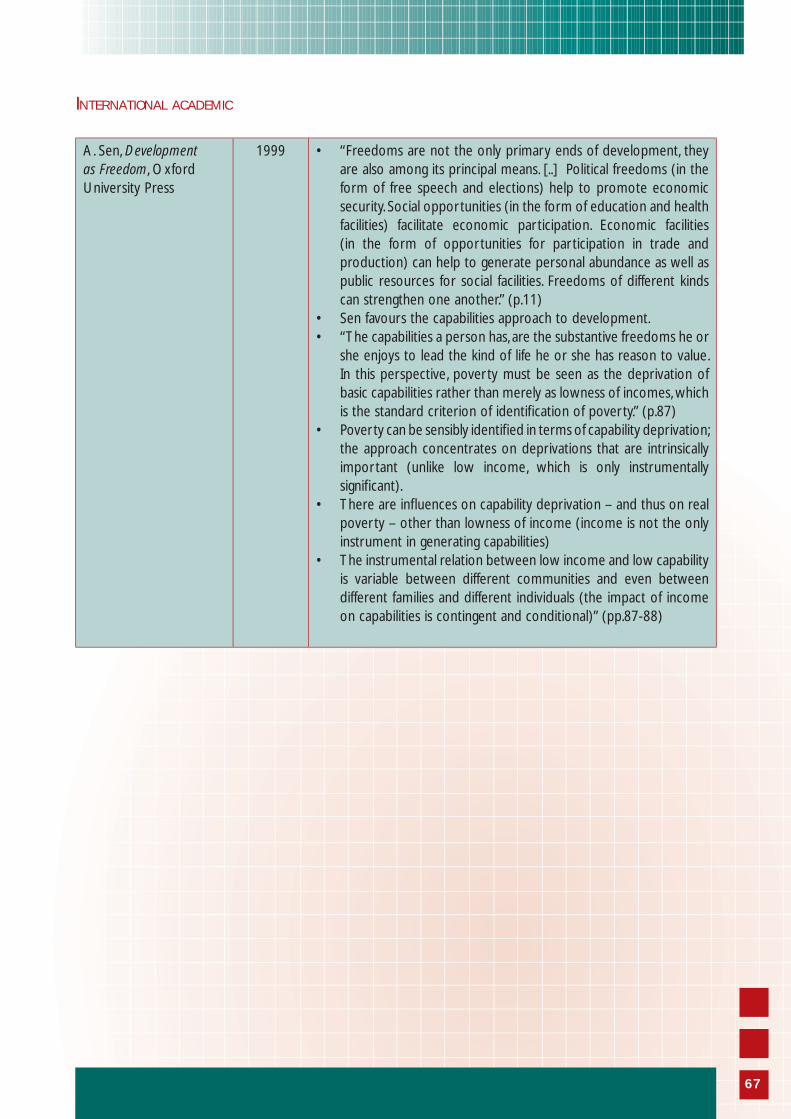
INTERNATIONAL ACADEMIC
A. Sen, Development as Freedom, Oxford University Press
1999 • “Freedoms are not the only primary ends of development, they are also among its principal means. [..] Political freedoms (in the form of free speech and elections) help to promote economic security. Social opportunities (in the form of education and health facilities) facilitate economic participation. Economic facilities (in the form of opportunities for participation in trade and production) can help to generate personal abundance as well as public resources for social facilities. Freedoms of different kinds can strengthen one another.” (p.11)
• Sen favours the capabilities approach to development. • “The capabilities a person has, are the substantive freedoms he or
she enjoys to lead the kind of life he or she has reason to value. In this perspective, poverty must be seen as the deprivation of basic capabilities rather than merely as lowness of incomes, which is the standard criterion of identifi cation of poverty.” (p.87)
• Poverty can be sensibly identifi ed in terms of capability deprivation; the approach concentrates on deprivations that are intrinsically important (unlike low income, which is only instrumentally signifi cant).
• There are infl uences on capability deprivation – and thus on real poverty – other than lowness of income (income is not the only instrument in generating capabilities)
• The instrumental relation between low income and low capability is variable between different communities and even between different families and different individuals (the impact of income on capabilities is contingent and conditional)” (pp.87-88)
67
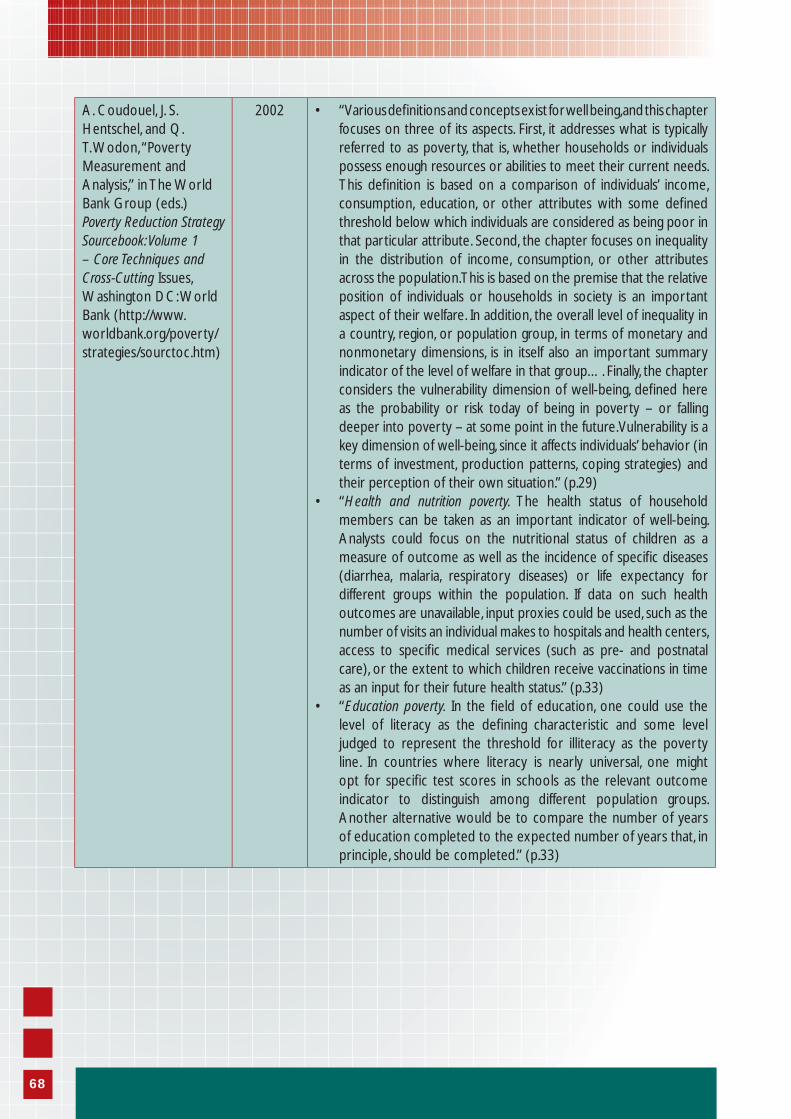
A. Coudouel, J. S. Hentschel, and Q. T. Wodon, “Poverty Measurement and Analysis,” in The World Bank Group (eds.) Poverty Reduction Strategy Sourcebook: Volume 1 – Core Techniques and Cross-Cutting Issues, Washington DC: World Bank (http://www.worldbank.org/poverty/strategies/sourctoc.htm)
2002 • “Various defi nitions and concepts exist for well being, and this chapter focuses on three of its aspects. First, it addresses what is typically referred to as poverty, that is, whether households or individuals possess enough resources or abilities to meet their current needs. This defi nition is based on a comparison of individuals’ income, consumption, education, or other attributes with some defi ned threshold below which individuals are considered as being poor in that particular attribute. Second, the chapter focuses on inequality in the distribution of income, consumption, or other attributes across the population. This is based on the premise that the relative position of individuals or households in society is an important aspect of their welfare. In addition, the overall level of inequality in a country, region, or population group, in terms of monetary and nonmonetary dimensions, is in itself also an important summary indicator of the level of welfare in that group…. Finally, the chapter considers the vulnerability dimension of well-being, defi ned here as the probability or risk today of being in poverty – or falling deeper into poverty – at some point in the future. Vulnerability is a key dimension of well-being, since it affects individuals’ behavior (in terms of investment, production patterns, coping strategies) and their perception of their own situation.” (p.29)
• “Health and nutrition poverty. The health status of household members can be taken as an important indicator of well-being. Analysts could focus on the nutritional status of children as a measure of outcome as well as the incidence of specifi c diseases (diarrhea, malaria, respiratory diseases) or life expectancy for different groups within the population. If data on such health outcomes are unavailable, input proxies could be used, such as the number of visits an individual makes to hospitals and health centers, access to specifi c medical services (such as pre- and postnatal care), or the extent to which children receive vaccinations in time as an input for their future health status.” (p.33)
• “Education poverty. In the fi eld of education, one could use the level of literacy as the defi ning characteristic and some level judged to represent the threshold for illiteracy as the poverty line. In countries where literacy is nearly universal, one might opt for specifi c test scores in schools as the relevant outcome indicator to distinguish among different population groups. Another alternative would be to compare the number of years of education completed to the expected number of years that, in principle, should be completed.” (p.33)
68
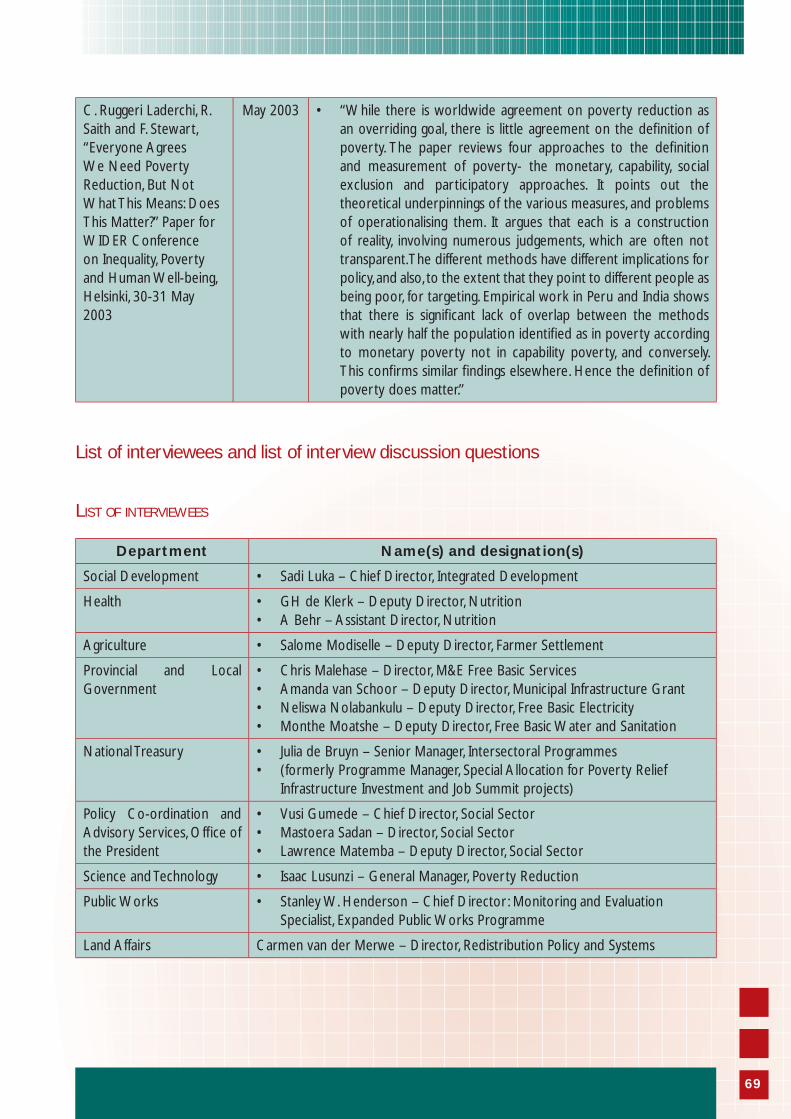
C. Ruggeri Laderchi, R. Saith and F. Stewart, “Everyone Agrees We Need Poverty Reduction, But Not What This Means: Does This Matter?” Paper for WIDER Conference on Inequality, Poverty and Human Well-being, Helsinki, 30-31 May 2003
May 2003 • “While there is worldwide agreement on poverty reduction as an overriding goal, there is little agreement on the defi nition of poverty. The paper reviews four approaches to the defi nition and measurement of poverty- the monetary, capability, social exclusion and participatory approaches. It points out the theoretical underpinnings of the various measures, and problems of operationalising them. It argues that each is a construction of reality, involving numerous judgements, which are often not transparent. The different methods have different implications for policy, and also, to the extent that they point to different people as being poor, for targeting. Empirical work in Peru and India shows that there is signifi cant lack of overlap between the methods with nearly half the population identifi ed as in poverty according to monetary poverty not in capability poverty, and conversely. This confi rms similar fi ndings elsewhere. Hence the defi nition of poverty does matter.”
List of interviewees and list of interview discussion questions
LIST OF INTERVIEWEES
Department Name(s) and designation(s)
Social Development • Sadi Luka – Chief Director, Integrated Development
Health • GH de Klerk – Deputy Director, Nutrition• A Behr – Assistant Director, Nutrition
Agriculture • Salome Modiselle – Deputy Director, Farmer Settlement
Provincial and Local Government
• Chris Malehase – Director, M&E Free Basic Services• Amanda van Schoor – Deputy Director, Municipal Infrastructure Grant• Neliswa Nolabankulu – Deputy Director, Free Basic Electricity• Monthe Moatshe – Deputy Director, Free Basic Water and Sanitation
National Treasury • Julia de Bruyn – Senior Manager, Intersectoral Programmes• (formerly Programme Manager, Special Allocation for Poverty Relief
Infrastructure Investment and Job Summit projects)
Policy Co-ordination and Advisory Services, Offi ce of the President
• Vusi Gumede – Chief Director, Social Sector• Mastoera Sadan – Director, Social Sector• Lawrence Matemba – Deputy Director, Social Sector
Science and Technology • Isaac Lusunzi – General Manager, Poverty Reduction
Public Works • Stanley W. Henderson – Chief Director: Monitoring and Evaluation Specialist, Expanded Public Works Programme
Land Affairs Carmen van der Merwe – Director, Redistribution Policy and Systems
69
LIST OF INTERVIEW DISCUSSION QUESTIONS
• In what way does your department contribute to resolving South Africa’s poverty problem?
• Are these efforts working? Why are they working, or why not?
• How do you know whether or not they are working? Does the department rely upon a formal M&E system in order to ascertain what is working?
• Would you describe these measures as “poverty relief ”? “Poverty alleviation?” Poverty reduction?” “Poverty eradication?”
• Does your department subscribe to any particular defi nitions for these terms? Or are they used loosely and interchangeably? Has there been any change over time in the terminology that is used? From where does your department get its terminology? Are any particular criteria applied that justify categorising different interventions according to these different labels?
• Do you think that your department’s role in addressing poverty fi ts within a comprehensive, government-wide anti-poverty strategy? Please explain.
• What do you see as a ‘project’, versus what do you see as a ‘programme’?
70

Workshop Discussion Document
Add
endu
m 2
71
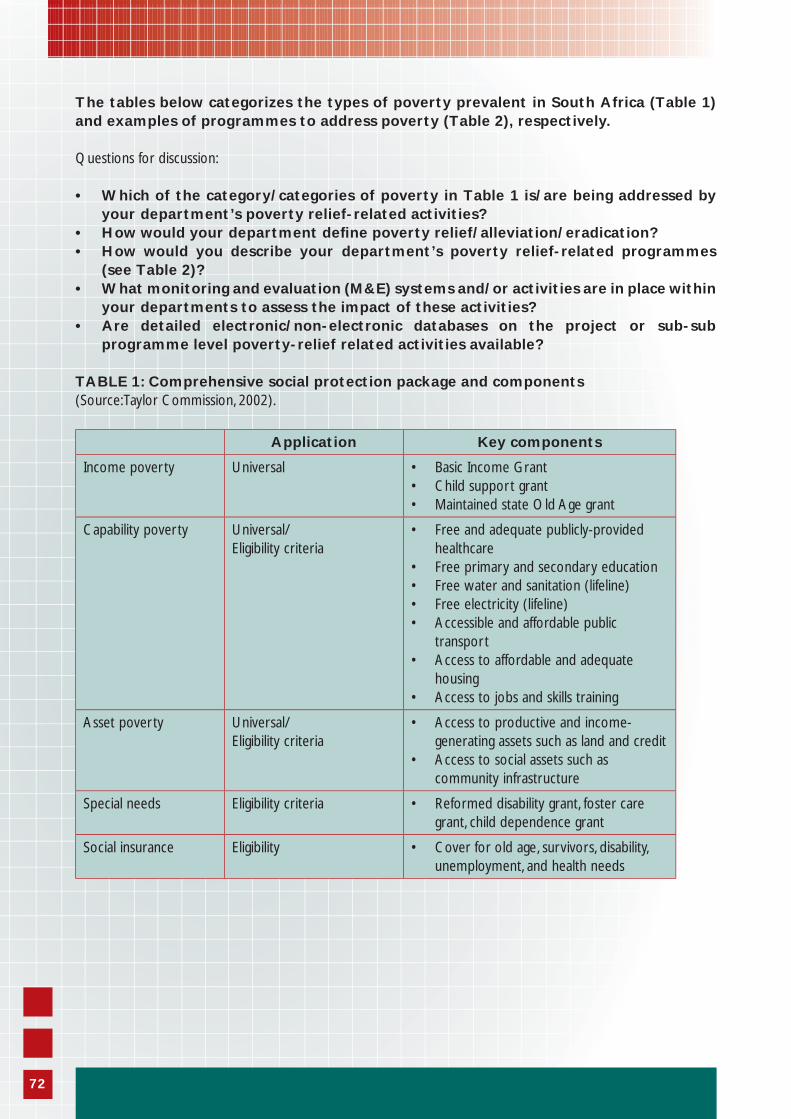
The tables below categorizes the types of poverty prevalent in South Africa (Table 1) and examples of programmes to address poverty (Table 2), respectively.
Questions for discussion:
• Which of the category/categories of poverty in Table 1 is/are being addressed by your department’s poverty relief-related activities?
• How would your department defi ne poverty relief/alleviation/eradication?• How would you describe your department’s poverty relief-related programmes
(see Table 2)? • What monitoring and evaluation (M&E) systems and/or activities are in place within
your departments to assess the impact of these activities?• Are detailed electronic/non-electronic databases on the project or sub-sub
programme level poverty-relief related activities available?
TABLE 1: Comprehensive social protection package and components (Source: Taylor Commission, 2002).
Application Key components
Income poverty Universal • Basic Income Grant• Child support grant• Maintained state Old Age grant
Capability poverty Universal/ Eligibility criteria
• Free and adequate publicly-provided healthcare
• Free primary and secondary education• Free water and sanitation (lifeline)• Free electricity (lifeline)• Accessible and affordable public
transport• Access to affordable and adequate
housing• Access to jobs and skills training
Asset poverty Universal/ Eligibility criteria
• Access to productive and income-generating assets such as land and credit
• Access to social assets such as community infrastructure
Special needs Eligibility criteria • Reformed disability grant, foster care grant, child dependence grant
Social insurance Eligibility • Cover for old age, survivors, disability, unemployment, and health needs
6772
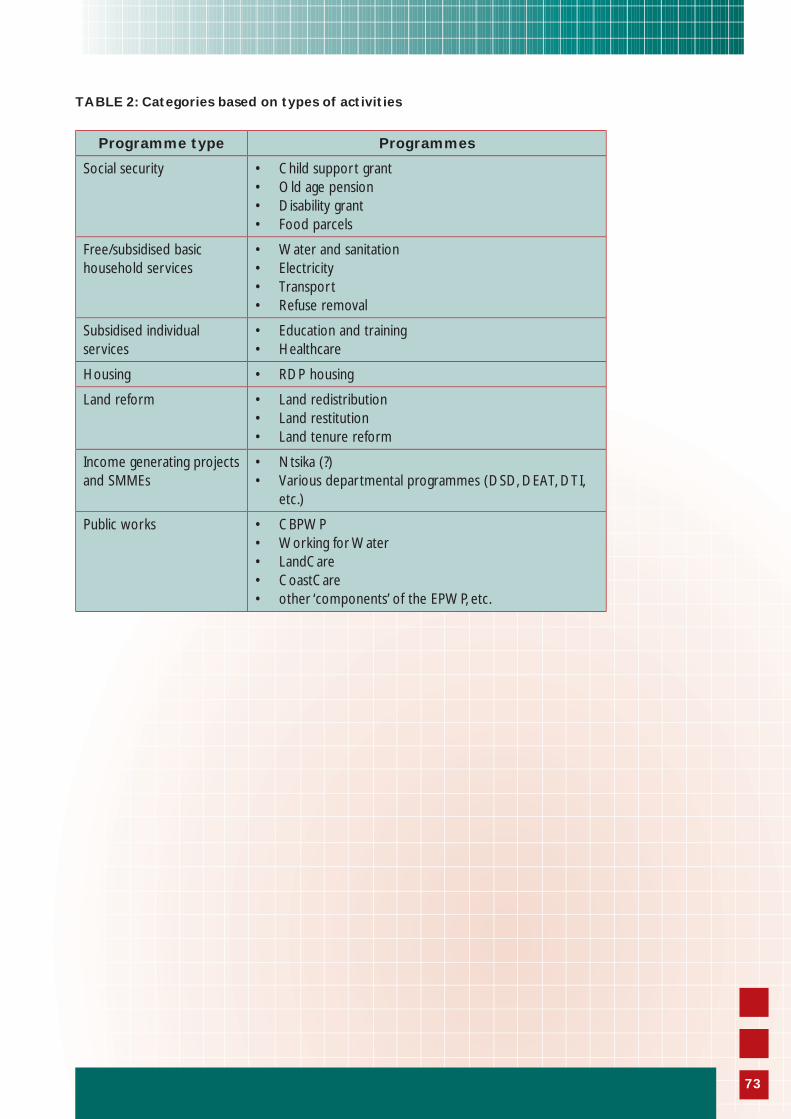
TABLE 2: Categories based on types of activities
Programme type Programmes
Social security • Child support grant• Old age pension• Disability grant• Food parcels
Free/subsidised basic household services
• Water and sanitation• Electricity• Transport• Refuse removal
Subsidised individual services
• Education and training• Healthcare
Housing • RDP housing
Land reform • Land redistribution• Land restitution• Land tenure reform
Income generating projects and SMMEs
• Ntsika (?)• Various departmental programmes (DSD, DEAT, DTI,
etc.)
Public works • CBPWP• Working for Water• LandCare• CoastCare• other ‘components’ of the EPWP, etc.
68 73
List of Departments that Attended the Workshop
Add
endu
m 3
74
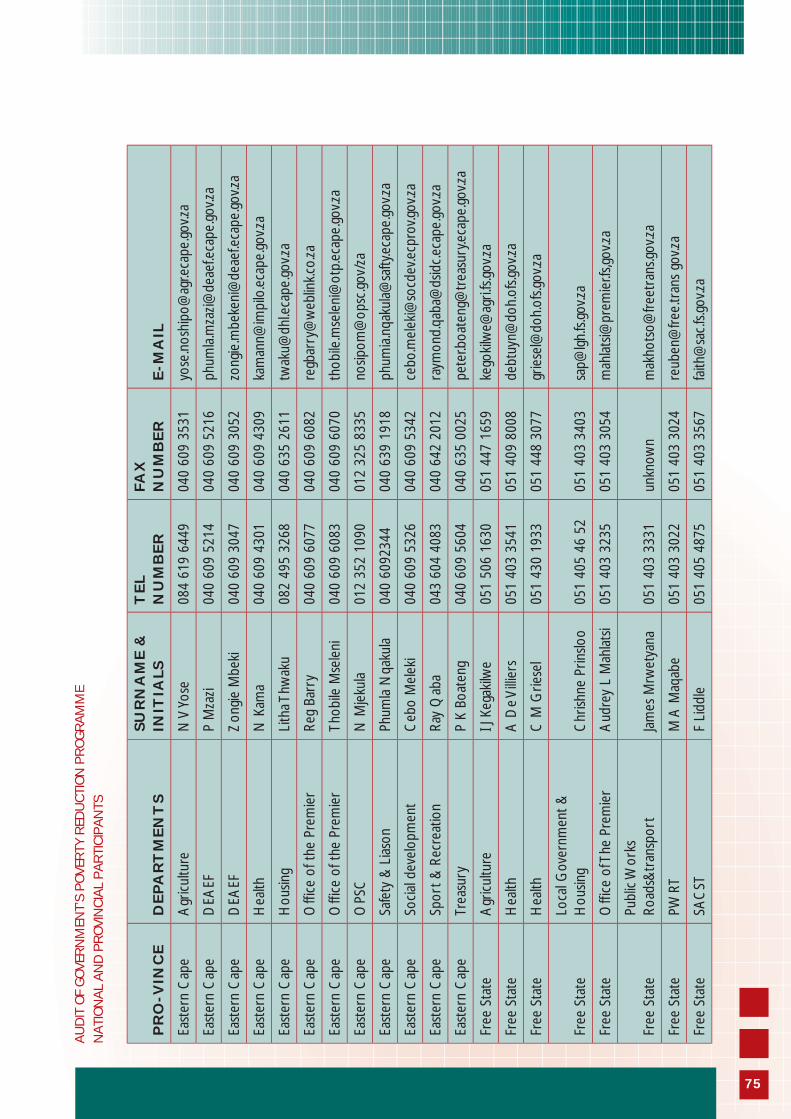
AU
DIT
OF
GO
VER
NM
ENT’
S P
OV
ERTY
RED
UC
TIO
N P
RO
GR
AM
ME
NA
TIO
NA
L A
ND
PR
OV
INC
IAL
PA
RTI
CIP
AN
TS
PR
O-V
INC
ED
EP
AR
TM
EN
TS
SU
RN
AM
E &
IN
ITIA
LST
EL
N
UM
BE
RFA
X
NU
MB
ER
E-M
AIL
East
ern
Cap
eA
gric
ultu
reN
V Yo
se08
4 61
9 64
49
040
609
3531
yose
.nos
hipo
@ag
r.eca
pe.g
ov.za
East
ern
Cap
eD
EAEF
P M
zazi
040
609
5214
040
609
5216
phum
la.m
zazi
@de
aef.e
cape
.gov
.za
East
ern
Cap
eD
EAEF
Zon
gie
Mbe
ki04
0 60
9 30
4704
0 60
9 30
52zo
ngie
.mbe
keni
@de
aef.e
cape
.gov
.za
East
ern
Cap
eH
ealth
N K
ama
040
609
4301
040
609
4309
kam
ann@
impi
lo.e
cape
.gov
.za
East
ern
Cap
eH
ousin
gLi
tha T
hwak
u08
2 49
5 32
6804
0 63
5 26
11tw
aku@
dhl.e
cape
.gov
.za
East
ern
Cap
eO
ffi ce
of t
he P
rem
ier
Reg
Barr
y04
0 60
9 60
7704
0 60
9 60
82re
gbar
ry@
web
link.
co.za
East
ern
Cap
eO
ffi ce
of t
he P
rem
ier
Thob
ile M
sele
ni04
0 60
9 60
8304
0 60
9 60
70th
obile
.mse
leni
@ot
p.ec
ape.
gov.z
a
East
ern
Cap
eO
PSC
N M
jeku
la01
2 35
2 10
9001
2 32
5 83
35no
sipom
@op
sc.g
ov/z
a
East
ern
Cap
eSa
fety
& L
iaso
nPh
umla
Nqa
kula
040
6092
344
040
639
1918
phum
ia.n
qaku
la@
safty
.eca
pe.g
ov.za
East
ern
Cap
eSo
cial
dev
elop
men
tC
ebo
Mel
eki
040
609
5326
040
609
5342
cebo
.mel
eki@
socd
ev.e
cpro
v.gov
.za
East
ern
Cap
eSp
ort
& R
ecre
atio
nRa
y Q
aba
043
604
4083
040
642
2012
raym
ond.
qaba
@ds
idc.
ecap
e.go
v.za
East
ern
Cap
eTr
easu
ryP
K Bo
aten
g04
0 60
9 56
0404
0 63
5 00
25pe
ter.b
oate
ng@
trea
sury
.eca
pe.g
ov.za
Free
Sta
teA
gric
ultu
reI J
Keg
akilw
e05
1 50
6 16
30
051
447
1659
kego
kilw
e@ag
ri.fs
.gov
.za
Free
Sta
teH
ealth
A D
e V
illier
s05
1 40
3 35
4105
1 40
9 80
08de
btuy
n@do
h.of
s.gov
.za
Free
Sta
teH
ealth
C M
Grie
sel
051
430
1933
051
448
3077
grie
sel@
doh.
ofs.g
ov.za
Free
Sta
teLo
cal G
over
nmen
t &
H
ousin
gC
hrish
ne P
rinslo
o05
1 40
5 46
52
051
403
3403
sap@
lgh.
fs.g
ov.za
Free
Sta
teO
ffi ce
of T
he P
rem
ier
Aud
rey
L M
ahla
tsi
051
403
3235
051
403
3054
mah
lats
i@pr
emie
r.fs,g
ov.za
Free
Sta
tePu
blic
Wor
ks
Road
s&tr
ansp
ort
Jam
es M
rwet
yana
051
403
3331
unkn
own
mak
hots
o@fre
etra
ns.g
ov.za
Free
Sta
tePW
RTM
A M
aqab
e05
1 40
3 30
2205
1 40
3 30
24re
uben
@fre
e.tr
ans
gov.z
a
Free
Sta
teSA
CST
F Li
ddle
051
405
4875
05
1 40
3 35
67fa
ith@
sac.
fs.g
ov.za
75
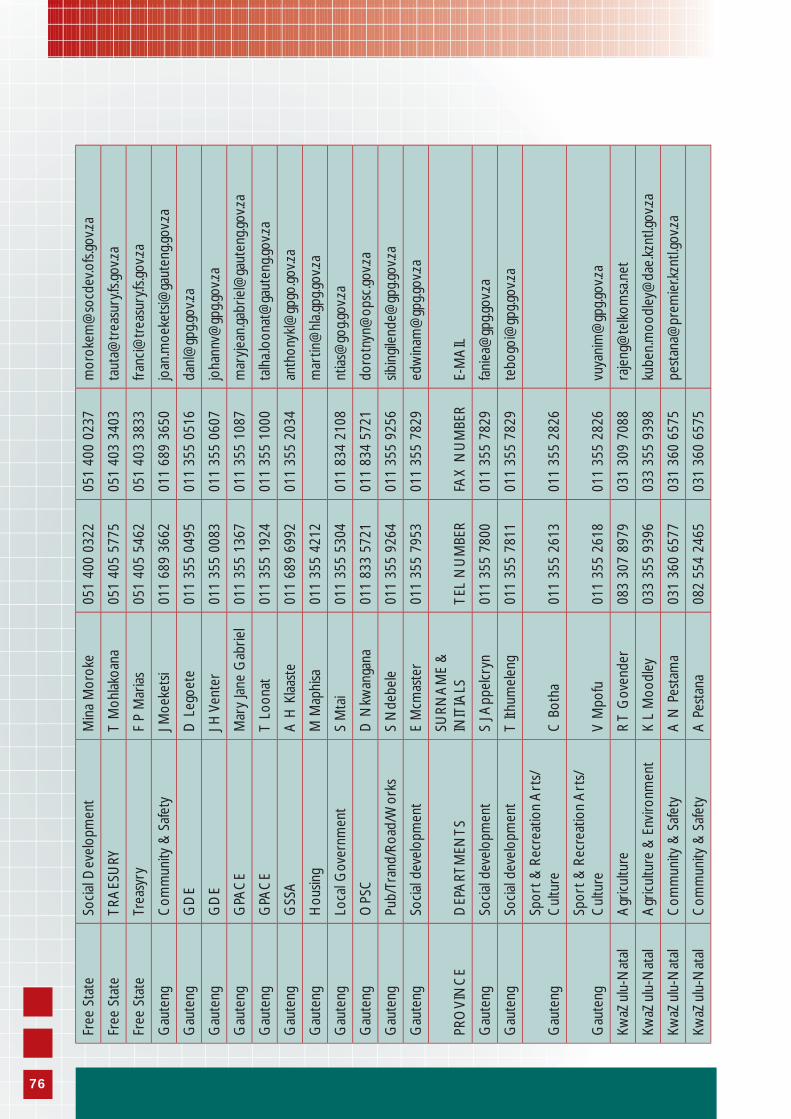
Free
Sta
teSo
cial
Dev
elop
men
tM
ina
Mor
oke
051
400
0322
051
400
0237
mor
okem
@so
cdev
.ofs
.gov
.za
Free
Sta
teTR
AES
URY
T M
ohla
koan
a05
1 40
5 57
75
051
403
3403
taut
a@tr
easu
ry.fs
.gov
.za
Free
Sta
teTr
easy
ryF
P M
aria
s05
1 40
5 54
6205
1 40
3 38
33fr
anci
@tr
easu
ry.fs
.gov
.za
Gau
teng
Com
mun
ity &
Saf
ety
J Moe
kets
i01
1 68
9 36
6201
1 68
9 36
50jo
an.m
oeke
tsi@
gaut
eng.
gov.z
a
Gau
teng
GD
ED
Leg
oete
011
355
0495
011
355
0516
danl
@gp
g.go
v.za
Gau
teng
GD
EJ H
Ven
ter
011
355
0083
011
355
0607
joha
nnv@
gpg.
gov.z
a
Gau
teng
GPA
CE
Mar
y Ja
ne G
abrie
l01
1 35
5 13
6701
1 35
5 10
87m
aryj
ean.
gabr
iel@
gaut
eng.
gov.z
a
Gau
teng
GPA
CE
T Lo
onat
011
355
1924
011
355
1000
talh
a.lo
onat
@ga
uten
g.go
v.za
Gau
teng
GSS
AA
H K
laas
te01
1 68
9 69
9201
1 35
5 20
34an
thon
ykl@
gpgo
.gov
.za
Gau
teng
Hou
sing
M M
aphi
sa01
1 35
5 42
12
mar
tin@
hla.
gpg.
gov.z
a
Gau
teng
Loca
l Gov
ernm
ent
S M
tai
011
355
5304
011
834
2108
ntia
s@go
g.go
v.za
Gau
teng
OPS
CD
Nkw
anga
na01
1 83
3 57
2101
1 83
4 57
21do
rotn
yn@
opsc
.gov
.za
Gau
teng
Pub/
Tran
d/Ro
ad/W
orks
S N
debe
le01
1 35
5 92
6401
1 35
5 92
56sib
ingi
lend
e@gp
g.go
v.za
Gau
teng
Soci
al d
evel
opm
ent
E M
cmas
ter
011
355
7953
011
355
7829
ed
win
am@
gpg.
gov.z
a
PRO
VIN
CE
DEP
ART
MEN
TSSU
RNA
ME
&
INIT
IALS
TEL
NU
MBE
RFA
X N
UM
BER
E-M
AIL
Gau
teng
Soci
al d
evel
opm
ent
S J A
ppel
cryn
011
355
7800
011
355
7829
fani
ea@
gpg.
gov.z
a
Gau
teng
Soci
al d
evel
opm
ent
T Ith
umel
eng
011
355
7811
011
355
7829
tebo
goi@
gpg.
gov.z
a
Gau
teng
Spor
t &
Rec
reat
ion
Art
s/C
ultu
reC
Bot
ha01
1 35
5 26
1301
1 35
5 28
26
Gau
teng
Spor
t &
Rec
reat
ion
Art
s/C
ultu
reV
Mpo
fu01
1 35
5 26
1801
1 35
5 28
26vu
yani
m@
gpg.
gov.z
a
KwaZ
ulu-
Nat
alA
gric
ultu
reR
T G
oven
der
083
307
8979
031
309
7088
raje
ng@
telk
omsa
.net
KwaZ
ulu-
Nat
alA
gric
ultu
re &
Env
ironm
ent
K L
Moo
dley
033
355
9396
033
355
9398
kube
n.m
oodl
ey@
dae.
kznt
l.gov
.za
KwaZ
ulu-
Nat
alC
omm
unity
& S
afet
yA
N P
esta
ma
031
360
6577
031
360
6575
pest
ana@
prem
ier.k
zntl.
gov.z
a
KwaZ
ulu-
Nat
alC
omm
unity
& S
afet
yA
Pes
tana
082
554
2465
031
360
6575
76
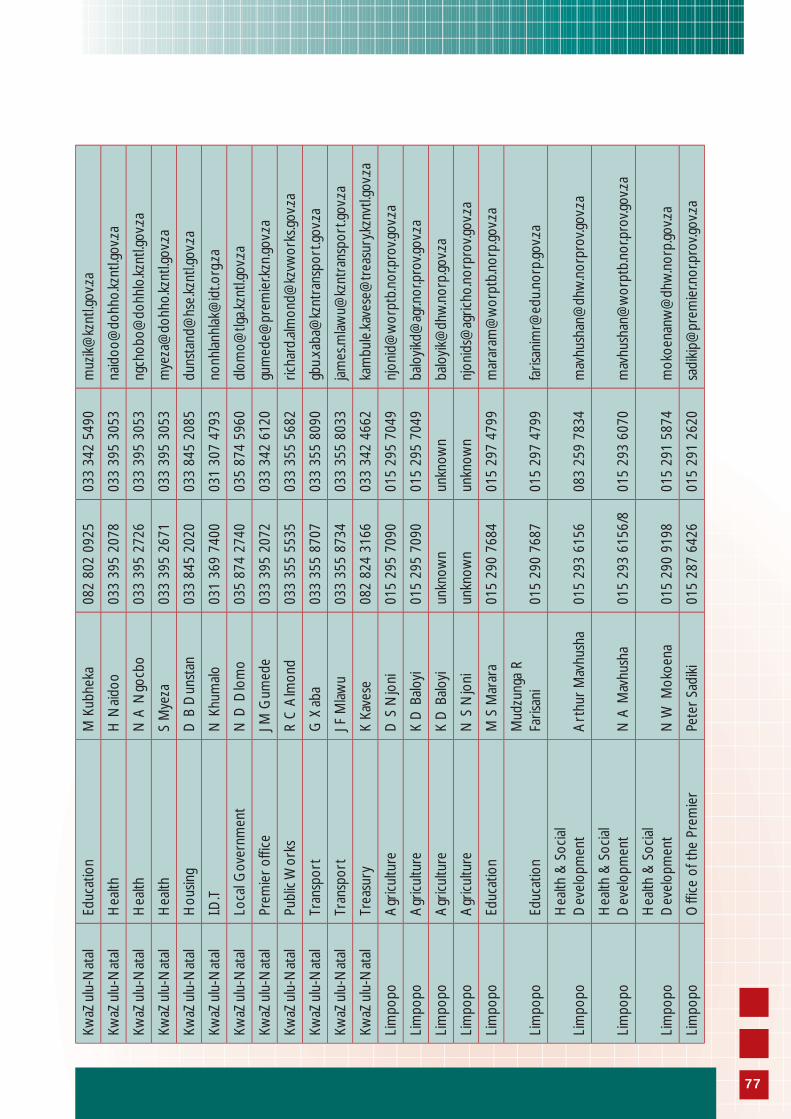
KwaZ
ulu-
Nat
alEd
ucat
ion
M K
ubhe
ka08
2 80
2 09
2503
3 34
2 54
90m
uzik
@kz
ntl.g
ov.za
KwaZ
ulu-
Nat
alH
ealth
H N
aido
o03
3 39
5 20
7803
3 39
5 30
53na
idoo
@do
hho.
kznt
l.gov
.za
KwaZ
ulu-
Nat
alH
ealth
N A
Ngo
cbo
033
395
2726
033
395
3053
ngch
obo@
dohh
lo.k
zntl.
gov.z
a
KwaZ
ulu-
Nat
alH
ealth
S M
yeza
033
395
2671
033
395
3053
mye
za@
dohh
o.kz
ntl.g
ov.za
KwaZ
ulu-
Nat
alH
ousin
gD
B D
unst
an03
3 84
5 20
2003
3 84
5 20
85du
nsta
nd@
hse.
kznt
l.gov
.za
KwaZ
ulu-
Nat
alI.D
.TN
Khu
mal
o03
1 36
9 74
0003
1 30
7 47
93no
nhla
nhla
k@id
t.org
.za
KwaZ
ulu-
Nat
alLo
cal G
over
nmen
tN
D D
lom
o03
5 87
4 27
4003
5 87
4 59
60dl
omo@
tlga.
kznt
l.gov
.za
KwaZ
ulu-
Nat
alPr
emie
r of
fi ce
J M G
umed
e03
3 39
5 20
7203
3 34
2 61
20gu
med
e@pr
emie
r.kzn
.gov
.za
KwaZ
ulu-
Nat
alPu
blic
Wor
ksR
C A
lmon
d03
3 35
5 55
3503
3 35
5 56
82ric
hard
.alm
ond@
kzvw
orks
.gov
.za
KwaZ
ulu-
Nat
alTr
ansp
ort
G X
aba
033
355
8707
033
355
8090
gbu.
xaba
@kz
ntra
nspo
rt.g
ov.za
KwaZ
ulu-
Nat
alTr
ansp
ort
J F M
law
u03
3 35
5 87
3403
3 35
5 80
33ja
mes
.mla
wu@
kznt
rans
port
.gov
.za
KwaZ
ulu-
Nat
alTr
easu
ryK
Kave
se08
2 82
4 31
6603
3 34
2 46
62ka
mbu
le.k
aves
e@tr
easu
ry.k
znvt
l.gov
.za
Lim
popo
Agr
icul
ture
D S
Njo
ni01
5 29
5 70
9001
5 29
5 70
49nj
onid
@w
orpt
b.no
r.pro
v.gov
.za
Lim
popo
Agr
icul
ture
K D
Bal
oyi
015
295
7090
015
295
7049
balo
yikd
@ag
r.nor
.pro
v.gov
.za
Lim
popo
Agr
icul
ture
K D
Bal
oyi
unkn
own
unkn
own
balo
yik@
dhw
.nor
p.go
v.za
Lim
popo
Agr
icul
ture
N S
Njo
niun
know
nun
know
nnj
onid
s@ag
richo
.nor
prov
.gov
.za
Lim
popo
Educ
atio
nM
S M
arar
a01
5 29
0 76
8401
5 29
7 47
99m
arar
am@
wor
ptb.
norp
.gov
.za
Lim
popo
Educ
atio
nM
udzu
nga
R Fa
risan
i 01
5 29
0 76
8701
5 29
7 47
99fa
risan
imr@
edu.
norp
.gov
.za
Lim
popo
Hea
lth &
Soc
ial
Dev
elop
men
tA
rthu
r M
avhu
sha
015
293
6156
083
259
7834
mav
hush
an@
dhw
.nor
prov
.gov
.za
Lim
popo
Hea
lth &
Soc
ial
Dev
elop
men
tN
A M
avhu
sha
015
293
6156
/801
5 29
3 60
70m
avhu
shan
@w
orpt
b.no
r.pro
v.gov
.za
Lim
popo
Hea
lth &
Soc
ial
Dev
elop
men
tN
W M
okoe
na01
5 29
0 91
9801
5 29
1 58
74m
okoe
nanw
@dh
w.n
orp.
gov.z
a
Lim
popo
Offi
ce o
f the
Pre
mie
rPe
ter
Sadi
ki01
5 28
7 64
2601
5 29
1 26
20sa
diki
p@pr
emie
r.nor
.pro
v.gov
.za
77
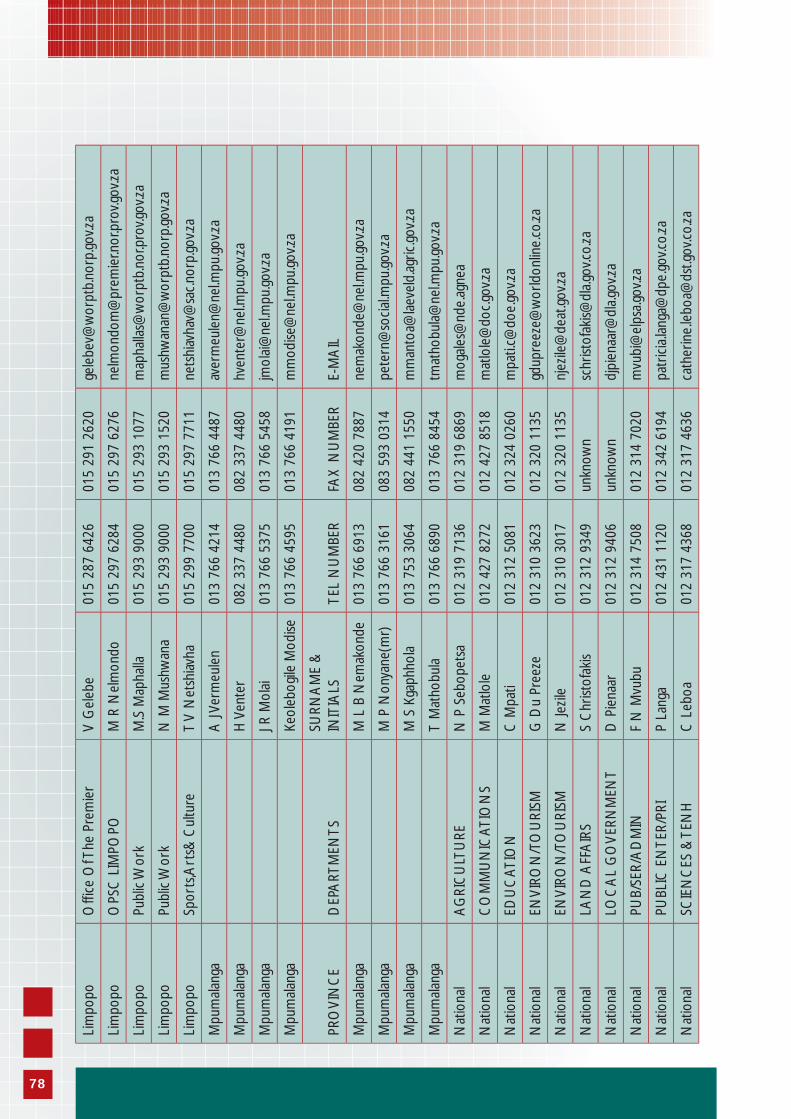
Lim
popo
Offi
ce O
f The
Pre
mie
rV
Gel
ebe
015
287
6426
015
291
2620
gele
bev@
wor
ptb.
norp
.gov
.za
Lim
popo
OPS
C L
IMPO
POM
R N
elm
ondo
015
297
6284
015
297
6276
nelm
ondo
m@
prem
ier.n
or.p
rov.g
ov.za
Lim
popo
Publ
ic W
ork
M.S
Map
halla
015
293
9000
015
293
1077
map
halla
s@w
orpt
b.no
r.pro
v.gov
.za
Lim
popo
Publ
ic W
ork
N M
Mus
hwan
a01
5 29
3 90
0001
5 29
3 15
20m
ushw
anan
@w
orpt
b.no
rp.g
ov.za
Lim
popo
Spor
ts,A
rts&
Cul
ture
T V
Net
shia
vha
015
299
7700
015
297
7711
nets
hiav
hav@
sac.
norp
.gov
.za
Mpu
mal
anga
A
J Ve
rmeu
len
013
766
4214
013
766
4487
aver
meu
len@
nel.m
pu.g
ov.za
Mpu
mal
anga
H
Ven
ter
082
337
4480
082
337
4480
hven
ter@
nel.m
pu.g
ov.za
Mpu
mal
anga
J R
Mol
ai01
3 76
6 53
7501
3 76
6 54
58jm
olai
@ne
l.mpu
.gov
.za
Mpu
mal
anga
Ke
oleb
ogile
Mod
ise01
3 76
6 45
9501
3 76
6 41
91m
mod
ise@
nel.m
pu.g
ov.za
PRO
VIN
CE
DEP
ART
MEN
TSSU
RNA
ME
&
INIT
IALS
TEL
NU
MBE
RFA
X N
UM
BER
E-M
AIL
Mpu
mal
anga
M
L B
Nem
akon
de01
3 76
6 69
1308
2 42
0 78
87ne
mak
onde
@ne
l.mpu
.gov
.za
Mpu
mal
anga
M
P N
onya
ne(m
r)01
3 76
6 31
6108
3 59
3 03
14
pete
rn@
soci
al.m
pu.g
ov.za
Mpu
mal
anga
M
S K
gaph
hola
013
753
3064
082
441
1550
mm
anto
a@la
evel
d.ag
ric.g
ov.za
Mpu
mal
anga
T
Mat
hobu
la01
3 76
6 68
9001
3 76
6 84
54tm
atho
bula
@ne
l.mpu
.gov
.za
Nat
iona
lA
GRI
CU
LTU
REN
P S
ebop
etsa
012
319
7136
012
319
6869
mog
ales
@nd
e.ag
nea
Nat
iona
lC
OM
MU
NIC
ATIO
NS
M M
atlo
le01
2 42
7 82
7201
2 42
7 85
18m
atlo
le@
doc.
gov.z
a
Nat
iona
lED
UC
ATIO
NC
Mpa
ti01
2 31
2 50
8101
2 32
4 02
60m
pati.
c@do
e.go
v.za
Nat
iona
lEN
VIR
ON
/TO
URI
SMG
Du
Pree
ze
012
310
3623
012
320
1135
gdup
reez
e@w
orld
onlin
e.co
.za
Nat
iona
lEN
VIR
ON
/TO
URI
SMN
Jezi
le01
2 31
0 30
1701
2 32
0 11
35nj
ezile
@de
at.g
ov.za
Nat
iona
lLA
ND
AFF
AIR
SS
Chr
istof
akis
012
312
9349
unkn
own
schr
istof
akis@
dla.
gov.c
o.za
Nat
iona
lLO
CA
L G
OV
ERN
MEN
TD
Pie
naar
012
312
9406
unkn
own
djpi
enaa
r@dl
a.go
v.za
Nat
iona
lPU
B/SE
R/A
DM
INF
N M
vubu
012
314
7508
012
314
7020
mvu
bi@
elps
a.go
v.za
Nat
iona
lPU
BLIC
EN
TER/
PRI
P La
nga
012
431
1120
012
342
6194
patr
icia
.lang
a@dp
e.go
v.co.
za
Nat
iona
lSC
IEN
CES
& T
ENH
C L
eboa
012
317
4368
012
317
4636
cath
erin
e.le
boa@
dst.g
ov.c
o.za
78
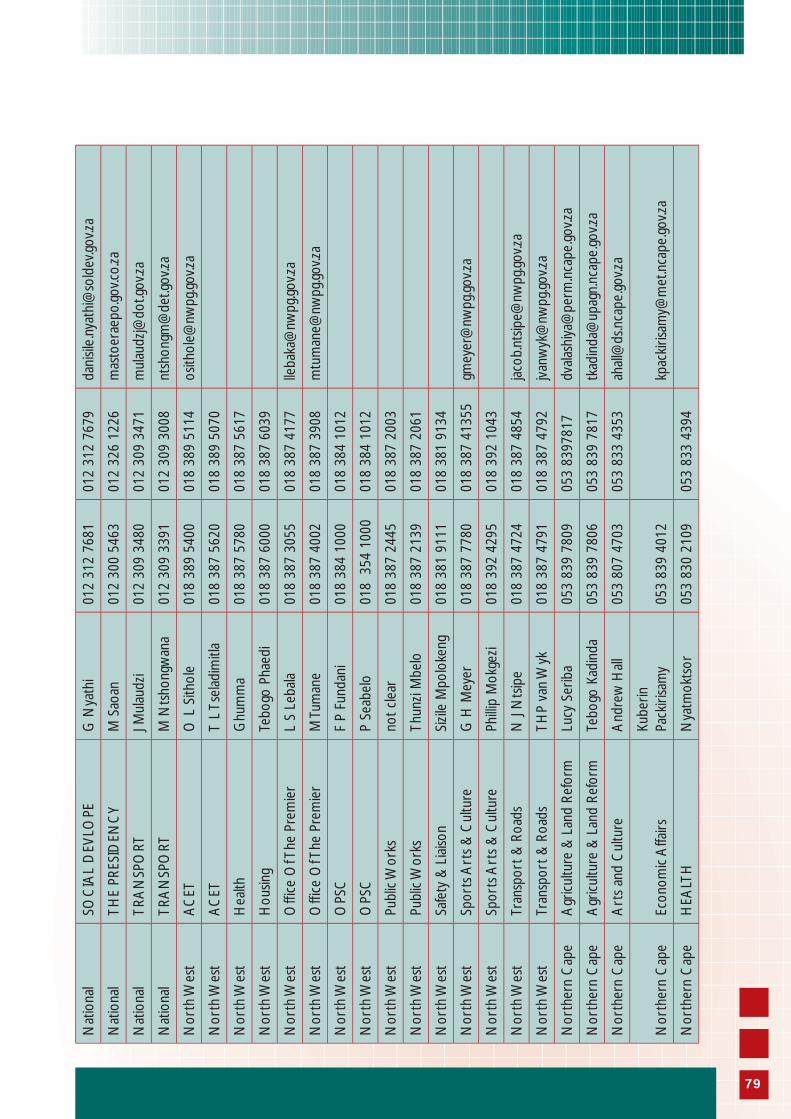
Nat
iona
lSO
CIA
L D
EVLO
PEG
Nya
thi
012
312
7681
01
2 31
2 76
79da
nisil
e.ny
athi
@so
ldev
.gov
.za
Nat
iona
lTH
E PR
ESID
ENC
Y
M S
aoan
012
300
5463
01
2 32
6 12
26m
asto
erae
po.g
ov.c
o.za
Nat
iona
lTR
AN
SPO
RTJ M
ulau
dzi
012
309
3480
012
309
3471
mul
audz
j@do
t.gov
.za
Nat
iona
lTR
AN
SPO
RTM
Nts
hong
wan
a01
2 30
9 33
9101
2 30
9 30
08nt
shon
gm@
det.g
ov.za
Nor
th W
est
AC
ETO
L S
ithol
e01
8 38
9 54
0001
8 38
9 51
14os
ithol
e@nw
pg.g
ov.za
Nor
th W
est
AC
ETT
L Ts
elad
imitl
a01
8 38
7 56
2001
8 38
9 50
70
Nor
th W
est
Hea
lthG
hum
ma
018
387
5780
018
387
5617
Nor
th W
est
Hou
sing
Tebo
go P
haed
i01
8 38
7 60
0001
8 38
7 60
39
Nor
th W
est
Offi
ce O
f The
Pre
mie
rL
S Le
bala
018
387
3055
018
387
4177
lleba
ka@
nwpg
.gov
.za
Nor
th W
est
Offi
ce O
f The
Pre
mie
rM
Tum
ane
018
387
4002
018
387
3908
mtu
man
e@nw
pg.g
ov.za
Nor
th W
est
OPS
CF
P Fu
ndan
i01
8 38
4 10
0001
8 38
4 10
12
Nor
th W
est
OPS
CP
Seab
elo
018
354
100
001
8 38
4 10
12
Nor
th W
est
Publ
ic W
orks
not
clea
r01
8 38
7 24
4501
8 38
7 20
03
Nor
th W
est
Publ
ic W
orks
Thun
zi M
belo
018
387
2139
018
387
2061
Nor
th W
est
Safe
ty &
Lia
ison
Sizi
le M
polo
keng
018
381
9111
018
381
9134
Nor
th W
est
Spor
ts A
rts
& C
ultu
reG
H M
eyer
018
387
7780
018
387
4135
5gm
eyer
@nw
pg.g
ov.za
Nor
th W
est
Spor
ts A
rts
& C
ultu
rePh
illip
Mok
gezi
018
392
4295
018
392
1043
Nor
th W
est
Tran
spor
t &
Roa
ds
N J
Nts
ipe
018
387
4724
018
387
4854
jaco
b.nt
sipe@
nwpg
.gov
.za
Nor
th W
est
Tran
spor
t &
Roa
ds
THP
van
Wyk
018
387
4791
018
387
4792
jvan
wyk
@nw
pg.g
ov.za
Nor
ther
n C
ape
Agr
icul
ture
& L
and
Refo
rmLu
cy S
erib
a05
3 83
9 78
0905
3 83
9781
7dv
alas
hiya
@pe
rm.n
cape
.gov
.za
Nor
ther
n C
ape
Agr
icul
ture
& L
and
Refo
rmTe
bogo
Kad
inda
053
839
7806
053
839
7817
tkad
inda
@up
agn.
ncap
e.go
v.za
Nor
ther
n C
ape
Art
s an
d C
ultu
reA
ndre
w H
all
053
807
4703
053
833
4353
ahal
l@ds
.nca
pe.g
ov.za
Nor
ther
n C
ape
Econ
omic
Affa
irsKu
berin
Pa
ckiri
sam
y05
3 83
9 40
12
kpac
kiris
amy@
met
.nca
pe.g
ov.za
Nor
ther
n C
ape
HEA
LTH
Nya
tmok
tsor
053
830
2109
053
833
4394
79
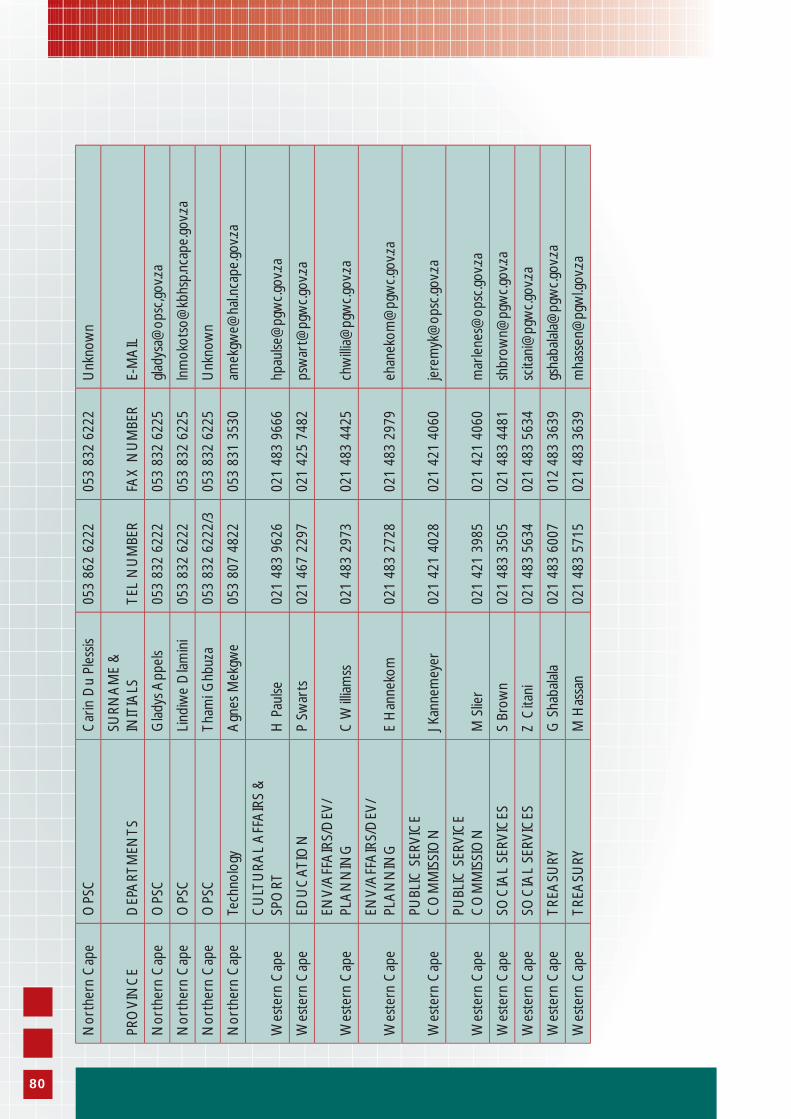
Nor
ther
n C
ape
OPS
CC
arin
Du
Ples
sis05
3 86
2 62
2205
3 83
2 62
22U
nkno
wn
PRO
VIN
CE
DEP
ART
MEN
TSSU
RNA
ME
&
INIT
IALS
TEL
NU
MBE
RFA
X N
UM
BER
E-M
AIL
Nor
ther
n C
ape
OPS
CG
lady
s App
els
053
832
6222
05
3 83
2 62
25gl
adys
a@op
sc,g
ov.za
Nor
ther
n C
ape
OPS
CLi
ndiw
e D
lam
ini
053
832
6222
053
832
6225
lnm
okot
so@
kbhs
p.nc
ape.
gov.z
a
Nor
ther
n C
ape
OPS
CTh
ami G
hbuz
a05
3 83
2 62
22/3
053
832
6225
Unk
now
n
Nor
ther
n C
ape
Tech
nolo
gyA
gnes
Mek
gwe
053
807
4822
053
831
3530
amek
gwe@
hal.n
cape
.gov
.za
Wes
tern
Cap
eC
ULT
URA
L A
FFA
IRS
&
SPO
RTH
Pau
lse02
1 48
3 96
2602
1 48
3 96
66hp
aulse
@pg
wc.
gov.z
a
Wes
tern
Cap
eED
UC
ATIO
NP
Swar
ts02
1 46
7 22
9702
1 42
5 74
82ps
war
t@pg
wc.
gov.z
a
Wes
tern
Cap
eEN
V/A
FFA
IRS/
DEV
/PL
AN
NIN
GC
Willi
amss
021
483
2973
021
483
4425
chw
illia@
pgw
c.go
v.za
Wes
tern
Cap
eEN
V/A
FFA
IRS/
DEV
/PL
AN
NIN
GE
Han
neko
m02
1 48
3 27
2802
1 48
3 29
79eh
anek
om@
pgw
c.go
v.za
Wes
tern
Cap
ePU
BLIC
SER
VIC
E C
OM
MIS
SIO
NJ K
anne
mey
er02
1 42
1 40
2802
1 42
1 40
60je
rem
yk@
opsc
.gov
.za
Wes
tern
Cap
ePU
BLIC
SER
VIC
E C
OM
MIS
SIO
NM
Slie
r02
1 42
1 39
8502
1 42
1 40
60m
arle
nes@
opsc
.gov
.za
Wes
tern
Cap
eSO
CIA
L SE
RVIC
ESS
Brow
n02
1 48
3 35
0502
1 48
3 44
81sh
brow
n@pg
wc.
gov.z
a
Wes
tern
Cap
eSO
CIA
L SE
RVIC
ESZ
Cita
ni02
1 48
3 56
3402
1 48
3 56
34sc
itani
@pg
wc.
gov.z
a
Wes
tern
Cap
eTR
EASU
RYG
Sha
bala
la02
1 48
3 60
0701
2 48
3 36
39gs
haba
lala
@pg
wc.
gov.z
a
Wes
tern
Cap
eTR
EASU
RYM
Has
san
021
483
5715
021
483
3639
mha
ssen
@pg
wl.g
ov.za
80
Description of Fields in Database Design
Add
endu
m 4
81
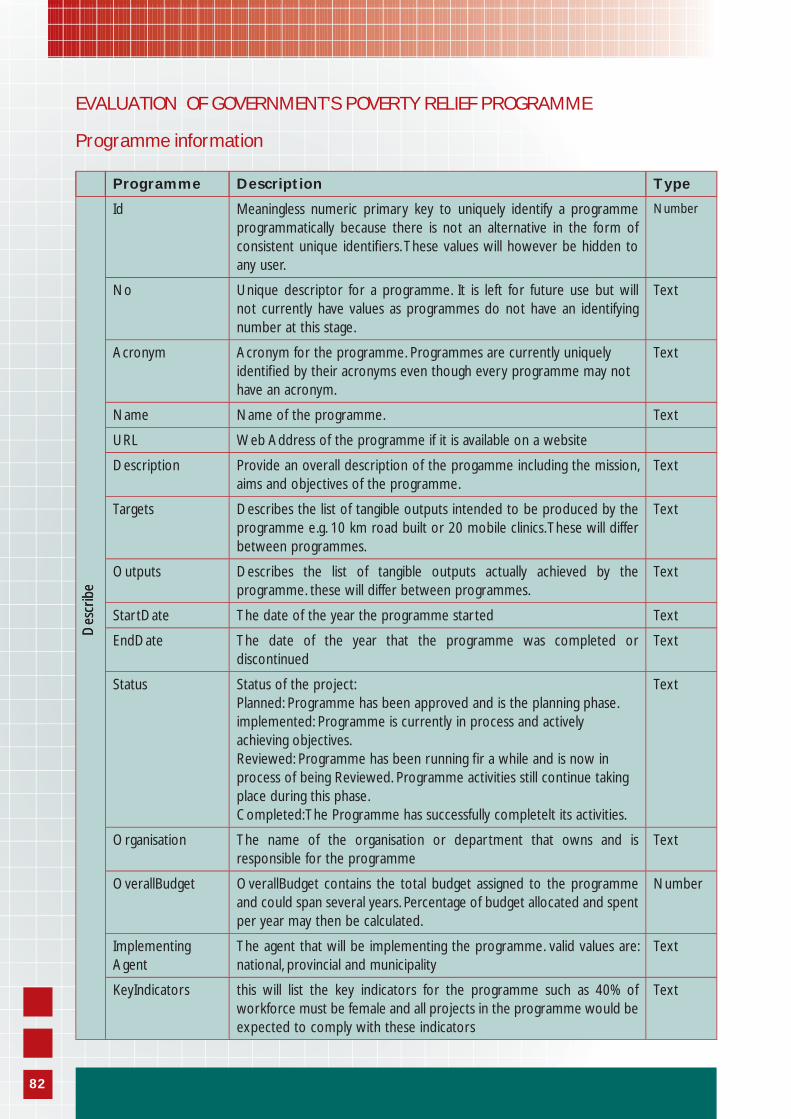
75
EVALUATION OF GOVERNMENT’S POVERTY RELIEF PROGRAMME
Programme information
Programme Description Type
Id Meaningless numeric primary key to uniquely identify a programme programmatically because there is not an alternative in the form of consistent unique identifi ers. These values will however be hidden to any user.
Number
No Unique descriptor for a programme. It is left for future use but will not currently have values as programmes do not have an identifying number at this stage.
Text
Acronym Acronym for the programme. Programmes are currently uniquely identifi ed by their acronyms even though every programme may not have an acronym.
Text
Name Name of the programme. Text
URL Web Address of the programme if it is available on a website
Description Provide an overall description of the progamme including the mission, aims and objectives of the programme.
Text
Targets Describes the list of tangible outputs intended to be produced by the programme e.g. 10 km road built or 20 mobile clinics. These will differ between programmes.
Text
Outputs Describes the list of tangible outputs actually achieved by the programme. these will differ between programmes.
Text
StartDate The date of the year the programme started Text
EndDate The date of the year that the programme was completed or discontinued
Text
Status Status of the project:Planned: Programme has been approved and is the planning phase.implemented: Programme is currently in process and actively achieving objectives.Reviewed: Programme has been running fi r a while and is now in process of being Reviewed. Programme activities still continue taking place during this phase.Completed: The Programme has successfully completelt its activities.
Text
Organisation The name of the organisation or department that owns and is responsible for the programme
Text
OverallBudget OverallBudget contains the total budget assigned to the programme and could span several years. Percentage of budget allocated and spent per year may then be calculated.
Number
Implementing Agent
The agent that will be implementing the programme. valid values are: national, provincial and municipality
Text
KeyIndicators this will list the key indicators for the programme such as 40% of workforce must be female and all projects in the programme would be expected to comply with these indicators
Text
Des
crib
eD
escr
ibe
82
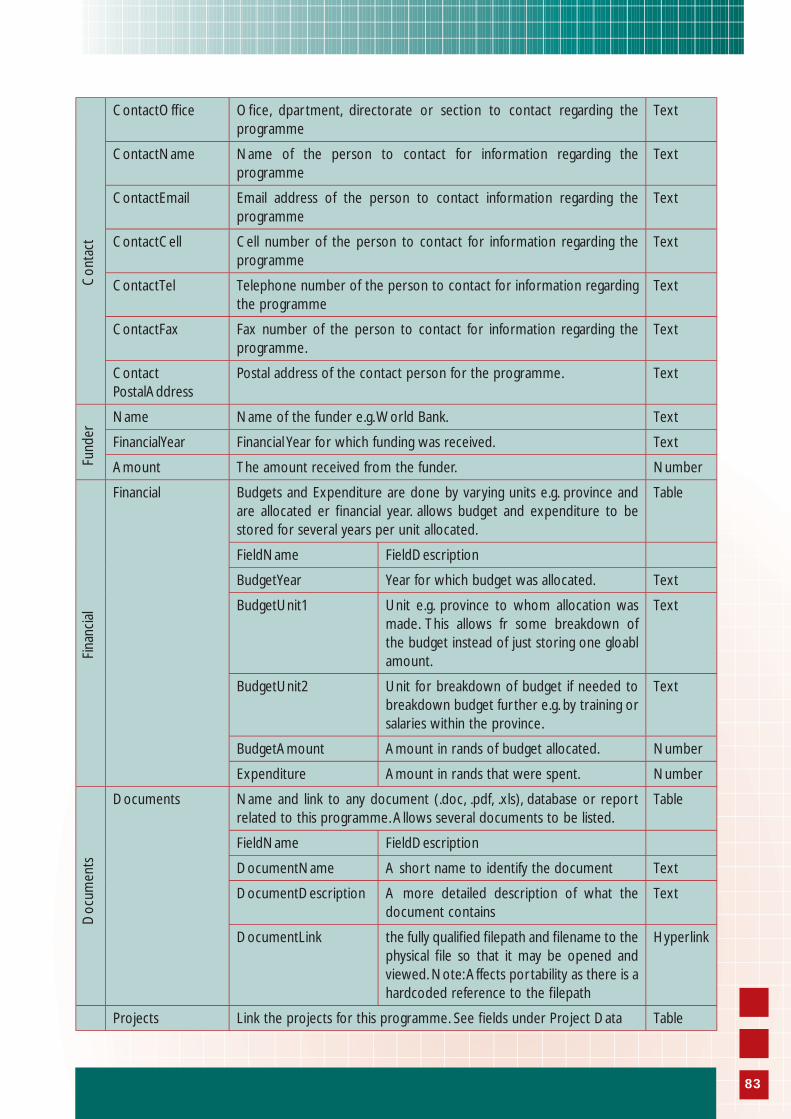
ContactOffi ce Ofi ce, dpartment, directorate or section to contact regarding the programme
Text
ContactName Name of the person to contact for information regarding the programme
Text
ContactEmail Email address of the person to contact information regarding the programme
Text
ContactCell Cell number of the person to contact for information regarding the programme
Text
ContactTel Telephone number of the person to contact for information regarding the programme
Text
ContactFax Fax number of the person to contact for information regarding the programme.
Text
Contact PostalAddress
Postal address of the contact person for the programme. Text
Name Name of the funder e.g. World Bank. Text
FinancialYear Financial Year for which funding was received. Text
Amount The amount received from the funder. Number
Financial Budgets and Expenditure are done by varying units e.g. province and are allocated er fi nancial year. allows budget and expenditure to be stored for several years per unit allocated.
Table
FieldName FieldDescription
BudgetYear Year for which budget was allocated. Text
BudgetUnit1 Unit e.g. province to whom allocation was made. This allows fr some breakdown of the budget instead of just storing one gloabl amount.
Text
BudgetUnit2 Unit for breakdown of budget if needed to breakdown budget further e.g. by training or salaries within the province.
Text
BudgetAmount Amount in rands of budget allocated. Number
Expenditure Amount in rands that were spent. Number
Documents Name and link to any document (.doc, .pdf, .xls), database or report related to this programme. Allows several documents to be listed.
Table
FieldName FieldDescription
DocumentName A short name to identify the document Text
DocumentDescription A more detailed description of what the document contains
Text
DocumentLink the fully qualifi ed fi lepath and fi lename to the physical fi le so that it may be opened and viewed. Note: Affects portability as there is a hardcoded reference to the fi lepath
Hyperlink
Projects Link the projects for this programme. See fi elds under Project Data Table
Con
tact
Fund
erFi
nanc
ial
Doc
umen
ts
83
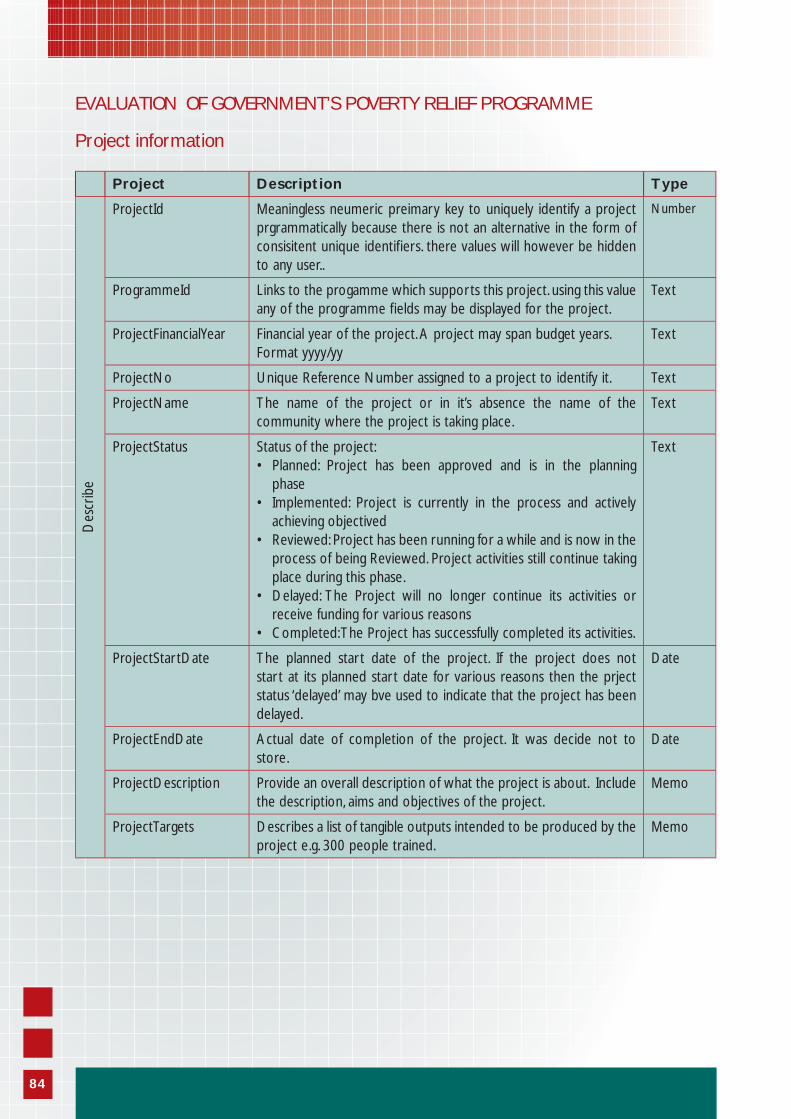
EVALUATION OF GOVERNMENT’S POVERTY RELIEF PROGRAMME
Project information
Project Description Type
ProjectId Meaningless neumeric preimary key to uniquely identify a project prgrammatically because there is not an alternative in the form of consisitent unique identifi ers. there values will however be hidden to any user..
Number
ProgrammeId Links to the progamme which supports this project. using this value any of the programme fi elds may be displayed for the project.
Text
ProjectFinancialYear Financial year of the project. A project may span budget years. Format yyyy/yy
Text
ProjectNo Unique Reference Number assigned to a project to identify it. Text
ProjectName The name of the project or in it’s absence the name of the community where the project is taking place.
Text
ProjectStatus Status of the project:• Planned: Project has been approved and is in the planning
phase• Implemented: Project is currently in the process and actively
achieving objectived• Reviewed: Project has been running for a while and is now in the
process of being Reviewed. Project activities still continue taking place during this phase.
• Delayed: The Project will no longer continue its activities or receive funding for various reasons
• Completed: The Project has successfully completed its activities.
Text
ProjectStartDate The planned start date of the project. If the project does not start at its planned start date for various reasons then the prject status ‘delayed’ may bve used to indicate that the project has been delayed.
Date
ProjectEndDate Actual date of completion of the project. It was decide not to store.
Date
ProjectDescription Provide an overall description of what the project is about. Include the description, aims and objectives of the project.
Memo
ProjectTargets Describes a list of tangible outputs intended to be produced by the project e.g. 300 people trained.
Memo
Des
crib
e
84
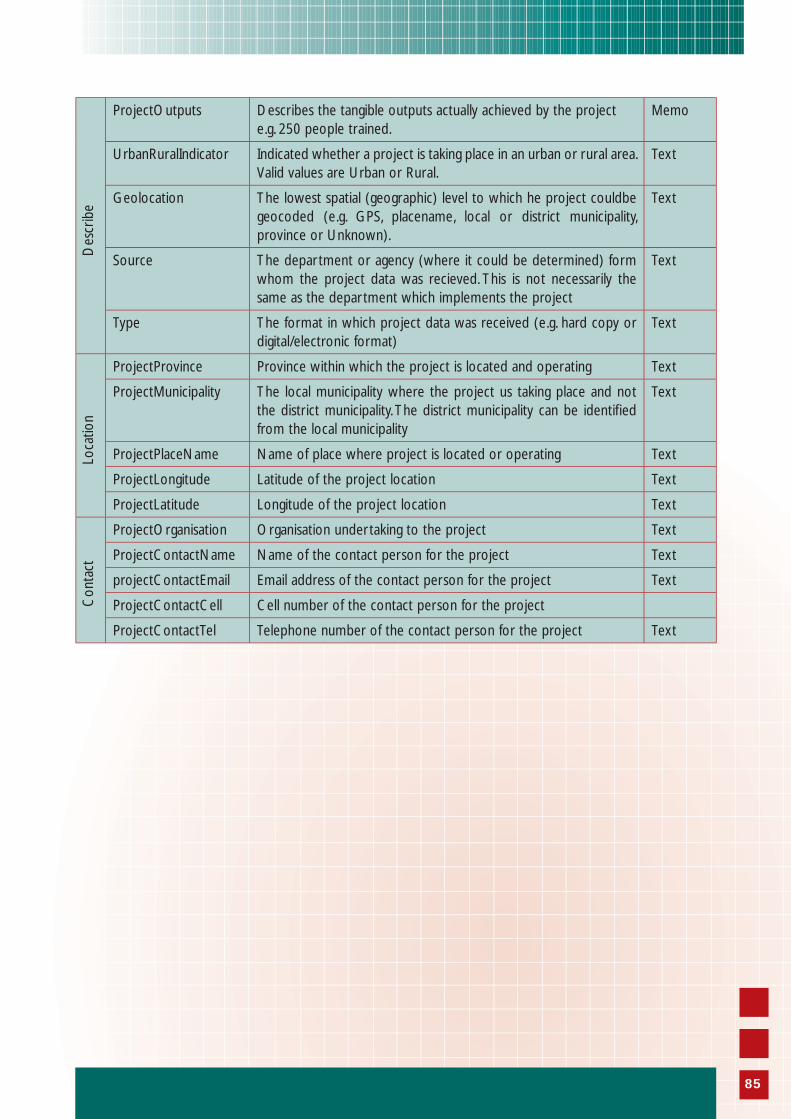
ProjectOutputs Describes the tangible outputs actually achieved by the project e.g. 250 people trained.
Memo
UrbanRuralIndicator Indicated whether a project is taking place in an urban or rural area. Valid values are Urban or Rural.
Text
Geolocation The lowest spatial (geographic) level to which he project couldbe geocoded (e.g. GPS, placename, local or district municipality, province or Unknown).
Text
Source The department or agency (where it could be determined) form whom the project data was recieved. This is not necessarily the same as the department which implements the project
Text
Type The format in which project data was received (e.g. hard copy or digital/electronic format)
Text
ProjectProvince Province within which the project is located and operating Text
ProjectMunicipality The local municipality where the project us taking place and not the district municipality. The district municipality can be identifi ed from the local municipality
Text
ProjectPlaceName Name of place where project is located or operating Text
ProjectLongitude Latitude of the project location Text
ProjectLatitude Longitude of the project location Text
ProjectOrganisation Organisation undertaking to the project Text
ProjectContactName Name of the contact person for the project Text
projectContactEmail Email address of the contact person for the project Text
ProjectContactCell Cell number of the contact person for the project
ProjectContactTel Telephone number of the contact person for the project Text
Con
tact
Loca
tion
Des
crib
e
85
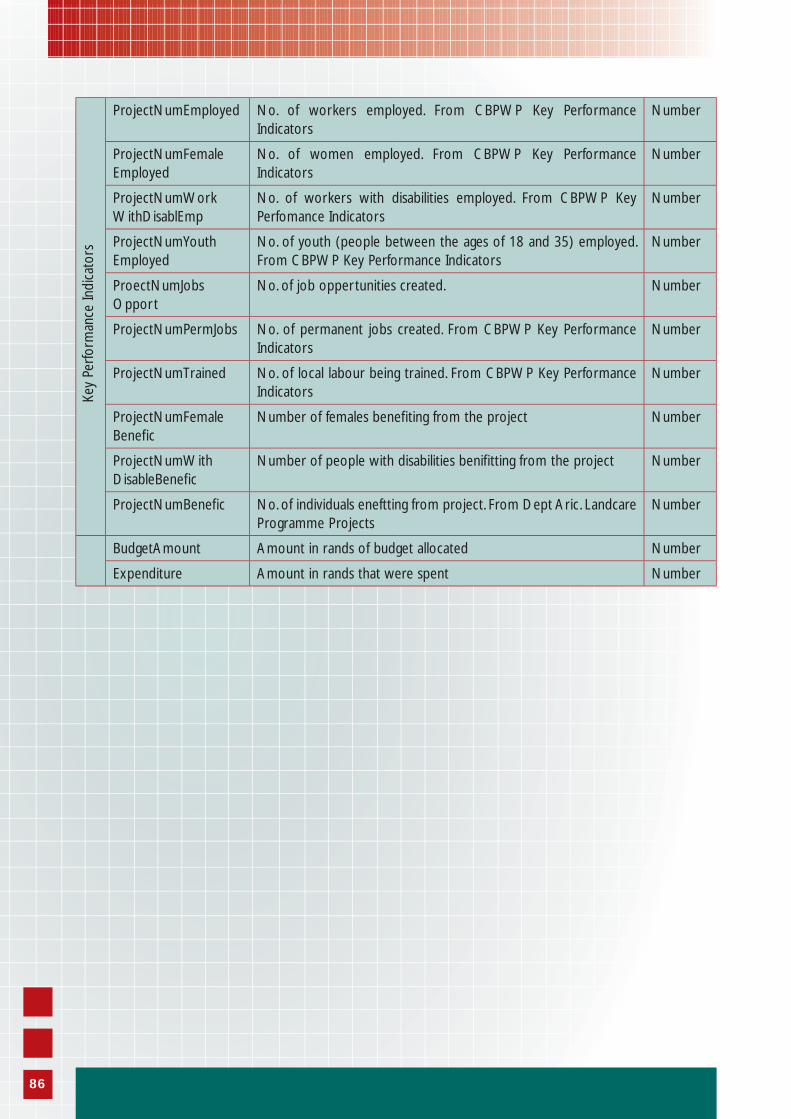
ProjectNumEmployed No. of workers employed. From CBPWP Key Performance Indicators
Number
ProjectNumFemale Employed
No. of women employed. From CBPWP Key Performance Indicators
Number
ProjectNumWork WithDisablEmp
No. of workers with disabilities employed. From CBPWP Key Perfomance Indicators
Number
ProjectNumYouth Employed
No. of youth (people between the ages of 18 and 35) employed. From CBPWP Key Performance Indicators
Number
ProectNumJobs Opport
No. of job oppertunities created. Number
ProjectNumPermJobs No. of permanent jobs created. From CBPWP Key Performance Indicators
Number
ProjectNumTrained No. of local labour being trained. From CBPWP Key Performance Indicators
Number
ProjectNumFemale Benefi c
Number of females benefi ting from the project Number
ProjectNumWith DisableBenefi c
Number of people with disabilities benifi tting from the project Number
ProjectNumBenefi c No. of individuals eneftting from project. From Dept Aric. Landcare Programme Projects
Number
BudgetAmount Amount in rands of budget allocated Number
Expenditure Amount in rands that were spent Number
Key
Perfo
rman
ce In
dica
tors
86

Coding Table for Valuesin Database
Add
endu
m 5
87
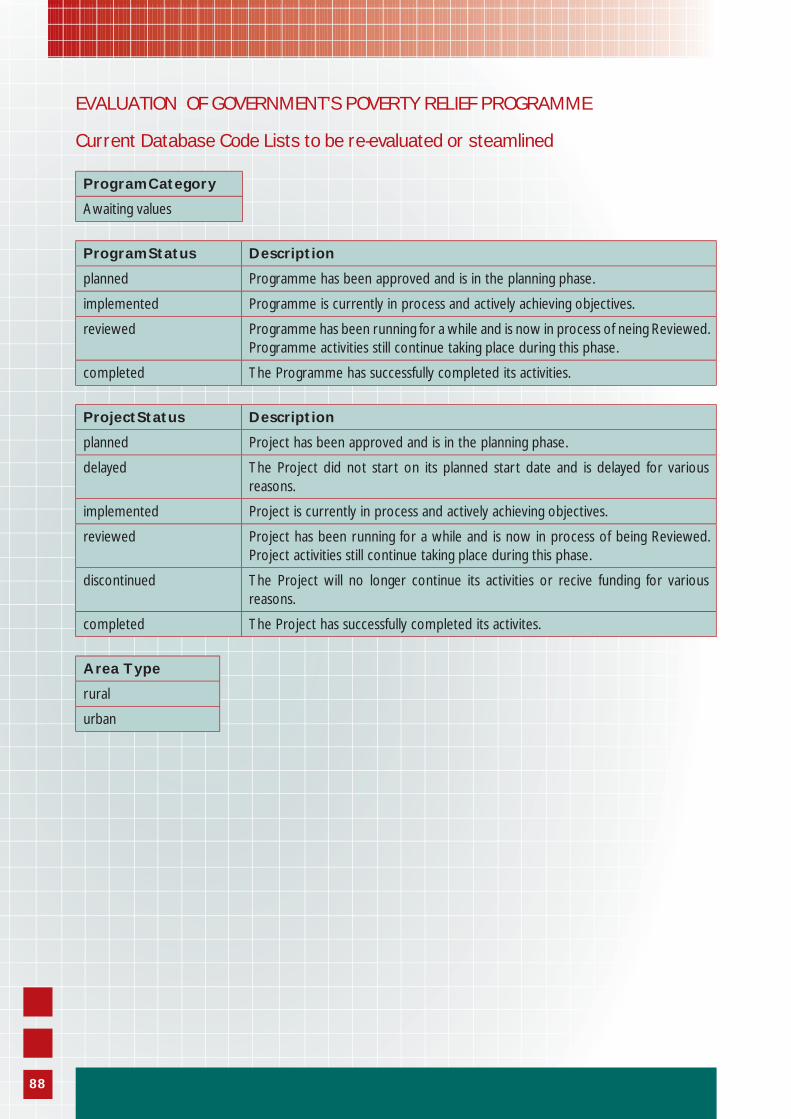
88
EVALUATION OF GOVERNMENT’S POVERTY RELIEF PROGRAMME
Current Database Code Lists to be re-evaluated or steamlined
ProgramCategory
Awaiting values
ProgramStatus Description
planned Programme has been approved and is in the planning phase.
implemented Programme is currently in process and actively achieving objectives.
reviewed Programme has been running for a while and is now in process of neing Reviewed. Programme activities still continue taking place during this phase.
completed The Programme has successfully completed its activities.
ProjectStatus Description
planned Project has been approved and is in the planning phase.
delayed The Project did not start on its planned start date and is delayed for various reasons.
implemented Project is currently in process and actively achieving objectives.
reviewed Project has been running for a while and is now in process of being Reviewed. Project activities still continue taking place during this phase.
discontinued The Project will no longer continue its activities or recive funding for various reasons.
completed The Project has successfully completed its activites.
Area Type
rural
urban
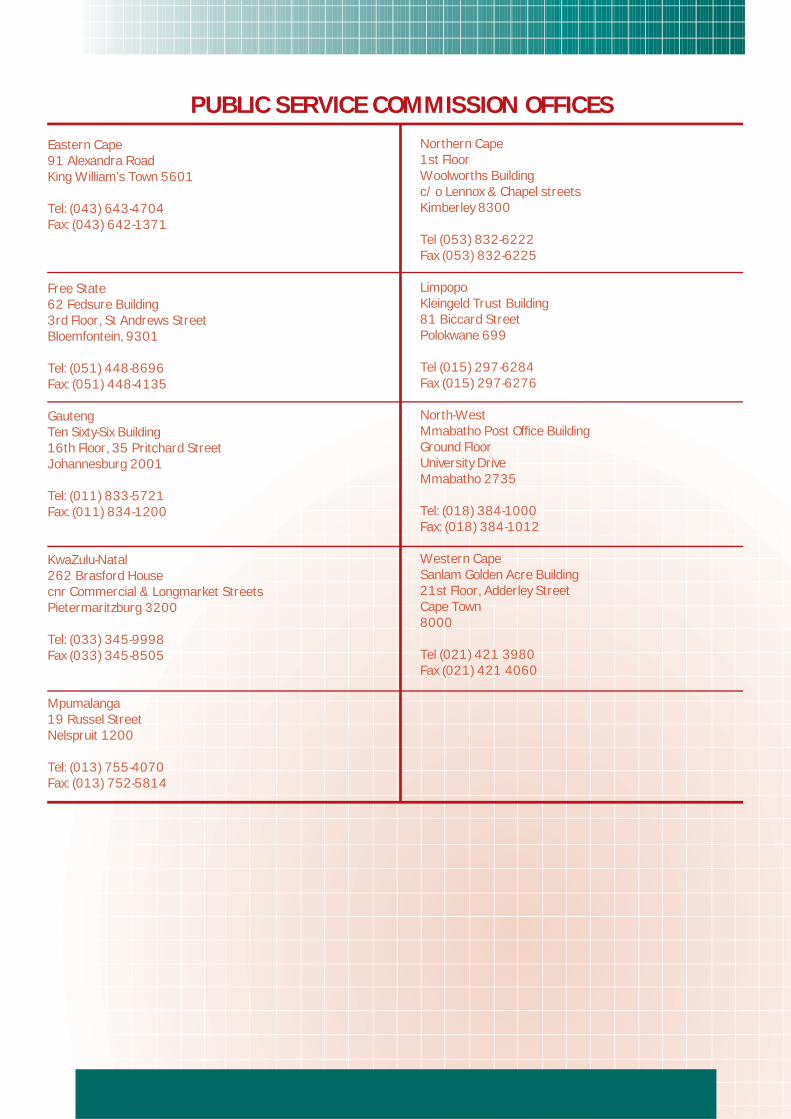
Eastern Cape91 Alexandra RoadKing William’s Town 5601
Tel: (043) 643-4704Fax: (043) 642-1371
Free State62 Fedsure Building3rd Floor, St Andrews StreetBloemfontein, 9301
Tel: (051) 448-8696Fax: (051) 448-4135
GautengTen Sixty-Six Building16th Floor, 35 Pritchard StreetJohannesburg 2001
Tel: (011) 833-5721Fax: (011) 834-1200
KwaZulu-Natal262 Brasford Housecnr Commercial & Longmarket StreetsPietermaritzburg 3200
Tel: (033) 345-9998Fax (033) 345-8505
Mpumalanga19 Russel StreetNelspruit 1200
Tel: (013) 755-4070Fax: (013) 752-5814
PUBLIC SERVICE COMMISSION OFFICES
Northern Cape1st FloorWoolworths Buildingc/o Lennox & Chapel streetsKimberley 8300
Tel (053) 832-6222Fax (053) 832-6225 LimpopoKleingeld Trust Building81 Biccard StreetPolokwane 699
Tel (015) 297-6284Fax (015) 297-6276
North-WestMmabatho Post Office BuildingGround FloorUniversity DriveMmabatho 2735
Tel: (018) 384-1000Fax: (018) 384-1012
Western CapeSanlam Golden Acre Building21st Floor, Adderley StreetCape Town8000
Tel (021) 421 3980Fax (021) 421 4060
Public Service Commission
Tel: +27 12 352-1000Fax: +27 12 325-8382Website: www.psc.gov.za
National Anti-Corruption Hotline for the Public Service: 0800 701 701
Republic of South Africa